BEIGENE, LTD.
10-Ks and 10-Qs
|
|
|
|
|
|
|
|
|
|
|
|
|
|
|
|
|
|
|
|
|
|
|
|
|
|
|
|
|
|
|
|
|
|
|
|
|
|
|
|
|
|
|
|
|
|
|
|
|
|
|
|
|
|
|
|
|
|
|
|
|
|
|
|
|
|
|
|
|
|
|
|
|
|
|
|
|
|
|
|
|
|
|
|
|
|
|
|
|
|
|
|
|
|
|
|
|
|
|
|
|
|
|
|
|
|
|
|
|
|
|
|
|
|
|
|
|
|
|
|
|
|
|
|
|
|
|
|
|
|
|
|
|
|
|
|
|
|
|
|
|
|
|
|
|
|
|
|
|
|
|
|
|
|
|
|
|
|
|
|
|
|
|
UNITED STATES
SECURITIES AND EXCHANGE COMMISSION
Washington, D.C. 20549
FORM 10‑K
|
(Mark One)
|
|
|
T
|
ANNUAL REPORT PURSUANT TO SECTION 13 OR 15(d) OF THE SECURITIES EXCHANGE ACT OF 1934
|
|
For the fiscal year ended December 31, 2018
|
|
|
OR
|
|
|
£
|
TRANSITION REPORT PURSUANT TO SECTION 13 OR 15(d) OF THE SECURITIES EXCHANGE ACT OF 1934
|
|
For the transition period from to
|
|
Commission file number: 001‑37686
BEIGENE, LTD.
(Exact Name of Registrant as Specified in its Charter)
|
Cayman Islands
(State or Other Jurisdiction of
Incorporation or Organization)
|
98‑1209416
(I.R.S. Employer
Identification No.)
|
|
|
|
|
c/o Mourant Governance Services (Cayman) Limited
94 Solaris Avenue, Camana Bay
Grand Cayman
Cayman Islands
(Address of Principal Executive Offices)
|
KY1‑1108
(Zip Code)
|
+1 (345) 949 4123
(Registrant’s Telephone Number, Including Area Code)
Securities registered pursuant to Section 12(b) of the Act:
|
Title of each class
|
|
Name of each exchange on which registered
|
|
American Depositary Shares, each representing 13 Ordinary Shares, par
value $0.0001 per share
|
|
The NASDAQ Global Select Market
|
|
Ordinary Shares, par value $0.0001 per share*
|
|
The Stock Exchange of Hong Kong Limited
|
Securities registered pursuant to Section 12(g) of the Act:
None
Indicate by check mark if the registrant is a well‑known seasoned issuer, as defined in Rule 405 of the Securities Act. Yes
T
No
£
Indicate by check mark if the registrant is not required to file reports pursuant to Section 13 or Section 15(d) of the Exchange Act. Yes
£
No
T
Indicate by check mark whether the registrant: (1) has filed all reports required to be filed by Section 13 or 15(d) of the Securities Exchange Act of 1934 during the preceding 12 months (or for such shorter period that the registrant was required to file such reports), and (2) has been subject to such filing requirements for the past 90 days. Yes
T
No
£
Indicate by check mark whether the registrant has submitted electronically every Interactive Data File required to be submitted pursuant to Rule 405 of Regulation S‑T during the preceding 12 months (or for such shorter period that the registrant was required to submit such files). Yes
T
No
£
Indicate by check mark if disclosure of delinquent filers pursuant to Item 405 of Regulation S‑K is not contained herein, and will not be contained, to the best of registrant’s knowledge, in definitive proxy or information statements incorporated by reference in Part III of this Form 10‑K or any amendment to this Form 10‑K.
T
Indicate by check mark whether the registrant is a large accelerated filer, an accelerated filer, a non‑accelerated filer, or a smaller reporting company. See the definitions of “large accelerated filer,” “accelerated filer” and “smaller reporting company” in Rule 12b‑2 of the Exchange Act. (Check one):
|
Large accelerated filer
T
|
Accelerated filer
£
|
Non‑accelerated filer
£
|
Smaller reporting company
£
Emerging growth company
£
|
If an emerging growth company, indicate by check mark if the registrant has elected not to use the extended transition period for complying with any new or revised financial accounting standards provided pursuant to Section 13(a) of the Exchange Act.
Indicate by check mark whether the registrant is a shell company (as defined in Rule 12b‑2 of the Exchange Act). Yes ☐ No X
As of June 29, 2018, the last business day of the registrant’s most recently completed second fiscal quarter, the aggregate market value of the ordinary shares, including in the form of American Depositary Shares, or ADSs, each representing 13 ordinary shares, held by non‑affiliates of the registrant was approximately
$4.6 billion
, based upon the closing price of the registrant’s ADSs on the NASDAQ Global Select Market on June 29, 2018.
As of February 15, 2019,
776,113,184
ordinary shares, par value $0.0001 per share, were outstanding, of which 599,894,893 ordinary shares were held in the form of 46,145,761 ADSs.
DOCUMENTS INCORPORATED BY REFERENCE
The registrant intends to file a definitive proxy statement pursuant to Regulation 14A within 120 days of the end of the fiscal year ended December 31, 2018. Portions of such definitive proxy statement are incorporated by reference into Part III of this Annual Report on Form 10‑K.
*Included in connection with the registration of the American Depositary Shares with the Securities and Exchange Commission. The ordinary shares are not registered or listed for trading in the United States but are listed for trading on The Stock Exchange of Hong Kong Limited
.
BeiGene, Ltd.
Annual Report on Form 10‑K
TABLE OF CONTENTS
|
|
|
Page
|
|
|
|
|
|
|
||
|
|
|
|
|
|
|
|
|
|
|
|
Forward‑Looking Statements and Market Data
This Annual Report on Form 10‑K, or Annual Report, contains forward‑looking statements that involve substantial risks and uncertainties. All statements other than statements of historical facts contained in this Annual Report, including statements regarding our strategy, future operations, future financial position, future revenue, projected costs, prospects, plans, objectives of management and expected growth, are forward‑looking statements. These statements involve known and unknown risks, uncertainties and other important factors that may cause our actual results, performance or achievements to be materially different from any future results, performance or achievements expressed or implied by the forward‑looking statements.
Forward looking statements are often identified by the use of words such as, but not limited to, “anticipate,” “believe,” “can,” “continue,” “could,” “estimate,” “expect,” “intend,” “may,” “plan,” “project,” “seek,” “should,” “target,” “will,” “would” and similar expressions or variations intended to identify forward-looking statements, although not all forward-looking statements contain those identifying words. These forward‑looking statements include, among other things, statements about:
|
•
|
the initiation, timing, progress and results of our preclinical studies and clinical trials and our research and development programs;
|
|
•
|
our ability to advance our drug candidates into, and successfully complete, clinical trials;
|
|
•
|
our reliance on the success of our clinical‑stage drug candidates;
|
|
•
|
our plans, expected milestones and the timing or likelihood of regulatory filings and approvals;
|
|
•
|
the commercialization of our drugs and drug candidates, if approved;
|
|
•
|
our ability to further develop sales and marketing capabilities and launch new drugs, if approved;
|
|
•
|
the pricing and reimbursement of our drugs and drug candidates, if approved;
|
|
•
|
the implementation of our business model, strategic plans for our business, drugs, drug candidates and technology;
|
|
•
|
the scope of protection we (or our licensors) are able to establish and maintain for intellectual property rights covering our drugs, drug candidates and technology;
|
|
•
|
our ability to operate our business without infringing, misappropriating or otherwise violating the intellectual property rights and proprietary technology of third parties;
|
|
•
|
costs associated with enforcing or defending against intellectual property infringement, misappropriation or violation, product liability and other claims;
|
|
•
|
regulatory developments in the United States, China, the United Kingdom, the European Union and other jurisdictions;
|
|
•
|
the accuracy of our estimates regarding expenses, revenues, capital requirements and our need for additional financing;
|
|
•
|
the potential benefits of strategic collaboration and licensing agreements and our ability to enter into strategic arrangements;
|
|
•
|
our ability to maintain and establish collaborations or licensing agreements;
|
|
•
|
our reliance on third parties to conduct drug development, manufacturing and other services;
|
|
•
|
our ability to manufacture and supply, or have manufactured and supplied, drug candidates for clinical development and drugs for commercial sale;
|
|
•
|
the rate and degree of market access and acceptance and reimbursement of our drugs and drug candidates, if approved;
|
1
|
•
|
developments relating to our competitors and our industry, including competing therapies;
|
|
•
|
the size of the potential markets for our drugs and drug candidates and our ability to serve those markets;
|
|
•
|
our ability to effectively manage our growth;
|
|
•
|
our ability to attract and retain qualified employees and key personnel;
|
|
•
|
statements regarding future revenue, hiring plans, expenses, capital expenditures, capital requirements and share performance;
|
|
•
|
the future trading price of our American Depositary Shares, or ADSs, and ordinary shares, and impact of securities analysts’ reports on these prices; and
|
|
•
|
other risks and uncertainties, including those listed under “Part I-Item 1A-Risk Factors.”
|
These forward‑looking statements are only predictions and we may not actually achieve the plans, intentions or expectations disclosed in such statements, so you should not place undue reliance on them. Actual results or events could differ materially from the plans, intentions and expectations disclosed in the forward‑looking statements we make. We have based these forward‑looking statements largely on our current expectations and projections about future events and trends that we believe may affect our business, financial condition and operating results. We have included important factors in the cautionary statements included in this Annual Report, particularly in “Part I-Item 1A-Risk Factors,” that could cause actual future results or events to differ materially from the forward‑looking statements that we make. Our forward‑looking statements do not reflect the potential impact of any future acquisitions, mergers, dispositions, joint ventures or investments we may make.
You should read this Annual Report and the documents that we have filed as exhibits to the Annual Report with the understanding that our actual future results may be materially different from what we expect. We do not assume any obligation to update any forward‑looking statements whether as a result of new information, future events or otherwise, except as required by applicable law.
This Annual Report includes statistical and other industry and market data that we obtained from industry publications and research, surveys and studies conducted by third parties. Industry publications and third‑party research, surveys and studies generally indicate that their information has been obtained from sources believed to be reliable, although they do not guarantee the accuracy or completeness of such information. While we believe these industry publications and third-party research, surveys and studies are reliable, you are cautioned not to give undue weight to this information.
2
PART I
Unless the context requires otherwise, references in this report to “BeiGene,” the “Company,” “we,” “us,” and “our” refer to BeiGene, Ltd. and its subsidiaries, on a consolidated basis.
Item 1. Business
Overview
We are a commercial-stage biotechnology company focused on developing and commercializing innovative molecularly-targeted and immuno-oncology drugs for the treatment of cancer. Our internally-developed lead drug candidates are currently in late-stage clinical trials, including 21 registration or registration-enabling trials in 14 discrete cancer indications. We have submitted three new drug applications for regulatory approval in China and are planning for new drug launches and additional submissions in China and the United States in 2019 and 2020. In addition, we are marketing three in-licensed cancer drugs in China from which we have been generating product revenue since September 2017.
We started as a research and development company in Beijing in 2010, focusing on developing best-in-class oncology drugs. Over the last nine years, we have developed into a fully-integrated global biotechnology company with operations in China, the United States, Europe and Australia, including a more than 800-person global clinical development team running over 50 ongoing or planned clinical trials as of January 24, 2019. We also have a growing commercial team that is selling our existing in-licensed drugs in China and preparing for launches of our internally-developed drug candidates in China and the United States, as well as internal manufacturing capabilities in China that are operational or under construction for the clinical and commercial supply of our small molecule and biologic drug candidates.
Our lead internally-developed drug candidates include the following:
|
•
|
Zanubrutinib (BGB-3111)
- a potentially best-in-class investigational small molecule inhibitor of Bruton’s tyrosine kinase, or BTK, designed to maximize BTK occupancy and minimize off-target effects, that is currently being evaluated in a broad pivotal clinical program in China and in other markets, including the United States, Europe and Australia, which we refer to as globally, for which we submitted for approval in China in 2018 initially for the treatment of patients with relapsed or refractory (R/R) mantle cell lymphoma, or MCL, and chronic lymphocytic leukemia or small lymphocytic lymphoma, or CLL/SLL. We subsequently received priority review in China for both R/R MCL and R/R CLL/SLL. We also plan to submit in 2019 or early 2020 a new drug application, or NDA, to the U.S. Food and Drug Administration, or the FDA, and an NDA in China for Waldenström’s Macroglobulinemia, or WM. In the United States, the FDA has granted zanubrutinib Fast Track status in WM and Breakthrough Therapy designation for the treatment of adult patients with MCL who have received at least one prior therapy. We plan to launch zanubrutinib in China and the United States if we receive approval from the relevant regulatory authorities;
|
|
•
|
Tislelizumab (BGB-A317)
- an investigational humanized IgG4 monoclonal antibody against the immune checkpoint receptor programmed cell death protein 1, or PD-1, specifically designed to minimize binding to FcγR on macrophages, that is currently being evaluated in a broad pivotal clinical program for both solid tumor and hematological indications, both globally and in China, for which we submitted for approval in China in 2018 initially for the treatment of R/R classical Hodgkin’s lymphoma, or cHL. We subsequently received priority review in China, and we plan to launch tislelizumab in China if we receive approval. We also plan to file an NDA in China for the treatment of urothelial bladder cancer, or UBC; and
|
|
•
|
Pamiparib (BGB-290)
- an investigational small molecule inhibitor of poly ADP-ribose polymerase 1, or PARP1, and PARP2 enzymes that is being evaluated in two pivotal clinical trials in China, a global Phase 3 trial, and earlier-stage trials in solid tumor cancers.
|
In addition to our three late-stage clinical drug candidates, our pipeline also includes three internally-developed drug candidates in early stage clinical development: lifirafenib (BGB-283), an investigational RAF dimer inhibitor; BGB-A333, an investigational humanized monoclonal antibody against the immune checkpoint receptor ligand PD-L1; and BGB-A425, an investigational humanized monoclonal antibody against TIM-3. We also pursue in-licensing opportunities that, among other things, allow us to help our collaborators by leveraging our capabilities in clinical development and commercialization in China and other Asia-Pacific countries. Our business development efforts have led to a development-stage portfolio that includes sitravatinib, an investigational, spectrum-selective kinase inhibitor in clinical development by Mirati Therapeutics, Inc., or Mirati, for which we have in-licensed development and commercial rights in Asia (excluding Japan), Australia and New Zealand; and ZW25 and ZW49, two bispecific antibody-based biologic drug candidates targeting HER2, in clinical
3
development by Zymeworks Inc., or Zymeworks, for which we have in-licensed development and commercial rights in Asia (excluding Japan), Australia and New Zealand.
We entered into a strategic collaboration with Celgene Corporation in August 2017, in which we obtained an exclusive license to market in China Celgene’s approved cancer therapies ABRAXANE
®
, REVLIMID
®
and VIDAZA
®
, as well as rights in China to develop and commercialize avadomide (CC-122), an investigational next-generation Cereblon modulator currently in clinical development by Celgene outside of China for lymphoma and hepatocellular carcinomas, or HCC. As part of the collaboration, we also granted Celgene an exclusive right to develop and commercialize tislelizumab for solid tumors in the United States, Europe, Japan and the rest of the world other than Asia.
We believe that we are well-positioned to capture significant market opportunities in China for innovative cancer therapies, including those created by recent regulatory reforms and new reimbursement policies. China is the second largest pharmaceutical market in the world based on revenue. We believe that there is a large and growing opportunity for novel cancer therapeutics in China based on significant unmet medical need, a large target patient population, expanding reimbursement coverage, and increasing treatment affordability and willingness to pay. In addition, China’s chief drug regulator, the National Medical Products Administration, or NMPA, has undertaken significant regulatory reforms that are designed to accelerate the development of new innovative drugs and allow China to be an integral part of global drug development. In addition, innovative oncology drugs have been included in the most recent National Reimbursement Drug List, or NRDL, reducing out-of-pocket expenses for patients. We believe that access to the large number of patients in China during clinical development as well as commercialization creates new opportunities for us. Leveraging our strong China presence and experience, as well as our commitment to global standards of innovation and quality, we believe that we have a unique ability to effectively take advantage of these opportunities.
Our Strategy
Our mission is to become a global leader in the discovery, development and commercialization of innovative therapies. In the near term, we plan to focus on pursuing what we believe are the following significant opportunities:
|
•
|
Globally Develop and Commercialize Zanubrutinib, a Potentially Best-in-Class BTK Inhibitor.
Zanubrutinib is an investigational small molecule inhibitor of BTK that is currently being evaluated both as a monotherapy and in combination with other therapies to treat various lymphomas. Our clinical experience to date suggests a potentially best-in-class profile. To pursue this opportunity, we are conducting a broad pivotal clinical program globally and in China. We have submitted for approval in China for two indications based on single-arm Phase 2 clinical trials in patients with R/R CLL/SLL and R/R MCL. Both applications have been accepted and are being reviewed under priority review status. In addition, we are conducting three global Phase 3 trials: head-to-head against ibrutinib, an approved BTK inhibitor, for patients with WM; against bendamustine plus rituximab for patients with treatment naïve, or TN, CLL/SLL; and head-to-head against ibrutinib for patients with R/R CLL/SLL. Further, we are conducting a global pivotal Phase 2 trial in combination with obinutuzumab in follicular lymphoma, or FL, a pivotal Phase 2 trial in China in WM, and we have recently begun a global study in R/R marginal zone lymphoma, or MZL. Subject to the successful completion and satisfactory results of these trials, we expect to submit for approval of zanubrutinib in the United States in 2019 or early 2020, where it has been granted Fast Track status for patients with WM and Breakthrough Therapy designation for patients with R/R MCL. We also plan to file an NDA in China for patients with WM.
|
|
•
|
Develop and Commercialize Our Investigational Checkpoint Inhibitor, Tislelizumab, in a Rapidly and Favorably Evolving China Market and Other Markets.
We believe that there is a large and growing opportunity for novel cancer therapeutics in China and that the market opportunity for PD-1/PD-L1 antibody therapies may be especially attractive, as this class of agents has demonstrated anti-tumor activity in all four of the most common tumors in China: lung cancer, gastric cancer (GC), liver cancer and esophageal cancer (EC). We believe that we are uniquely positioned to capture this opportunity with our strong presence and experience in China and our integrated global clinical development capabilities in China and other Asia-Pacific countries, the United States, Europe and Australia. We have submitted an NDA in China to market tislelizumab for the treatment of patients with R/R cHL, and the application has been accepted and is being reviewed under priority review status. We are currently running 11 registration or potentially registration-enabling trials in six tumor types and expect to commence additional global pivotal trials in 2019 and 2020. We also plan to submit an NDA in China for patients with UBC. We have additional earlier stage exploratory studies ongoing, and we plan to initiate other studies.
|
|
•
|
Establish a Leadership Position by Further Expanding Our Capabilities.
Although we believe that we have significant integrated capabilities in research and clinical development, manufacturing and commercialization, we plan
|
4
to continue to strengthen and expand our operations. In particular, we plan to significantly expand our commercial capabilities in China in preparation for the potential launch of our drug candidates and to support our existing marketed drugs. We have an established commercial team in China, which provides coverage of large hospitals and physician clients. As a result of the improving reimbursement environment in China, which is expected to provide access to innovative medicines for a significantly larger number of patients, we believe that the scale of our commercial organization and the breadth of our market coverage will become even more important. We plan to invest in expanding our teams of sales and marketing, market access, medical affairs, compliance, manufacturing, and other supporting functions. We aim to become a leading organization in the commercialization of oncology drugs in China. Outside of China, we are currently building commercial capabilities in the hematology-oncology area in the United States. In addition, we plan to continue to invest in building our global clinical development capabilities, which we believe will provide a competitive advantage in allowing us to conduct pivotal trials to support approvals globally and in China.
|
•
|
Take Advantage of Significant Regulatory Reforms in China to Accelerate Global Drug Development.
Historically, the regulatory environment in China has been considered highly challenging, with clinical development significantly delayed and regulatory approvals taking much longer than in the United States and Europe. To address these challenges, the NMPA has issued a series of reform policies and opinions, which, among many things, are expected to expand access to clinical patients and expedite development and approval by removing delays and creating an environment with international quality standards for drug development, manufacturing and commercialization in China. We expect that these regulatory reforms will allow clinical trials in China to play a major role in global drug development programs. We also believe that the ability to effectively operate in China and integrate trials conducted in China with those in the rest of the world will be of increasing strategic importance. We are already taking advantage of these opportunities by conducting and leading dual-purpose global / China registration trials.
|
|
•
|
Expand Our Product Portfolio and Pipeline Through Collaborations with Other Biopharmaceutical Companies to Complement Our Internal Research.
We expect to further expand our portfolio of drugs and drug candidates, in oncology as well as potentially in other therapeutic areas, through internal research and external collaborations, such as our collaborations with Celgene, Mirati and Zymeworks. We intend to pursue collaborations with other biopharmaceutical companies both in China and globally by leveraging our strong clinical development capabilities globally and our commercial capabilities in China. We have pursued and plan to continue to pursue business development opportunities in which development in China is expected to contribute to, and potentially accelerate, the global development program. We believe that there will be increasing interest by international biopharmaceutical companies in seeking collaborations in Asia, particularly in oncology, because clinical recruitment is a major bottleneck in new drug development.
|
5
Our Pipeline and Commercial Products
The following table summarizes the status of our pipeline and commercial products as of February 20, 2019:
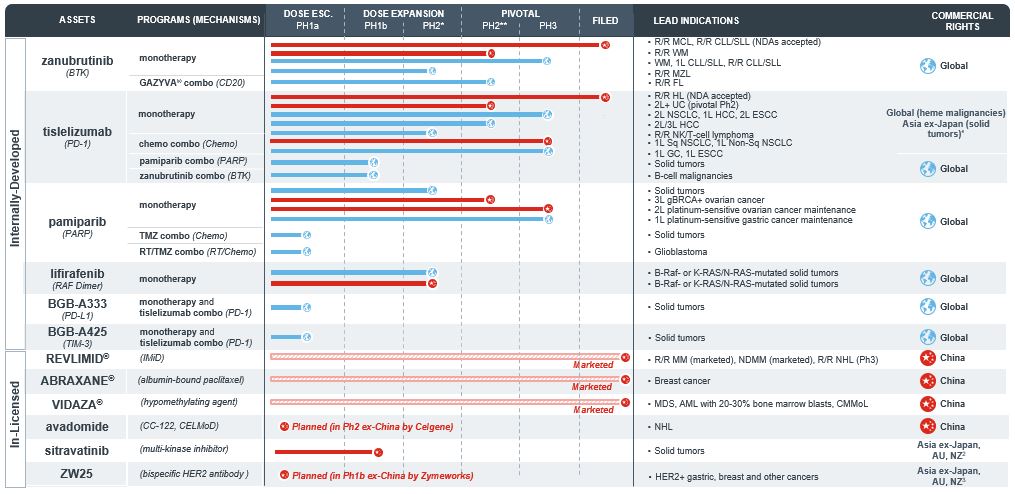
*Some indications will not require a non-pivotal Phase 2 clinical trial prior to beginning pivotal Phase 2 or Phase 3 clinical trials. **Confirmatory clinical trials post approval are required for accelerated approvals. ***REVLIMID
®
approved as a combination therapy with dexamethasone. 1. Celgene has the right to develop and commercialize tislelizumab in solid tumors in the U.S., EU, Japan and the rest-of-world outside of Asia. 2. Collaboration with Mirati Therapeutics, Inc.; APAC study. 3. Collaboration with Zymeworks.
Abbreviations: 1L = first line; 2L = second line; 3L = third line; AML = acute myeloid leukemia; CLL = chronic lymphocytic leukemia; CMMoL = chronic myelomonocytic leukemia; DLBCL = diffuse large B-cell lymphoma; Dose Esc = dose escalation; ESCC = esophageal squamous cell carcinoma; FL = follicular lymphoma; gBRCA = germline BRCA (Breast Cancer); GC = gastric cancer; HCC = hepatocellular carcinoma; HL = Hodgkin’s lymphoma; IMiD = immunomodulatory drugs; MCL = mantle cell lymphoma; MDS = myelodysplastic syndrome; MM = multiple myeloma; MZL = marginal zone lymphoma; NSCLC = non-small cell lung cancer; ND = newly diagnosed; NDA = new drug application; NHL = non-Hodgkin’s lymphoma; NK = natural killer; OC = ovarian cancer; PH = Phase; R/R = relapsed / refractory; RT = radiotherapy; SLL = small lymphocytic lymphoma; Sq = squamous; TMZ = temozolomide; UC = urothelial carcinoma; WM = Waldenström’s macroglobulinemia
Our Clinical-Stage Drug Candidates
A description of our clinical-stage drug candidates, together with a summary of the most recently available publicly reported clinical data from key clinical trials as of the date of this Annual Report, is set forth below. We plan to make available subsequent clinical data from time to time in our press releases and/or filings with the U.S. Securities and Exchange Commission and Hong Kong Stock Exchange, copies of which are available on the Investors section of our website.
Zanubrutinib (BGB-3111), a BTK Inhibitor
Zanubrutinib is an investigational small molecule inhibitor of BTK that is currently being evaluated in a broad pivotal clinical program globally and in China as a monotherapy and in combination with other therapies to treat various lymphomas. Zanubrutinib has demonstrated higher selectivity against BTK than IMBRUVICA
®
(ibrutinib), an approved BTK inhibitor, based on our biochemical assays; higher exposure than ibrutinib based on their respective Phase 1 experience in separate studies; and sustained 24-hour BTK occupancy in both the peripheral blood and lymph node compartments.
Mechanism of Action
BTK is a key component of the B-cell receptor, or BCR, signaling pathway and is an important regulator of cell proliferation and cell survival in various lymphomas. BTK inhibitors block BCR-induced BTK activation and its downstream signaling, leading to growth inhibition and cell death in certain malignant white blood cells called B-cells. Zanubrutinib is an orally active inhibitor that covalently binds to BTK, resulting in irreversible inactivation of the enzyme.
6
Market Opportunity and Competition
Lymphomas are blood-borne cancers involving lymphatic cells of the immune system. They can be broadly categorized into non-Hodgkin’s lymphoma, or NHL, and Hodgkin’s lymphoma, or HL. Depending on the origin of the cancer cells, lymphomas can also be characterized as B-cell or T-cell lymphomas. B-cell lymphomas make up approximately 85% of NHLs and comprise a variety of specific diseases involving B-cells at differing stages of maturation or differentiation. According to statistics from the Surveillance, Epidemiology and End Results, or SEER, program of the U.S. National Cancer Institute, there were 72,240 new NHL cases and 20,140 deaths, and 20,110 new CLL cases and 4,660 deaths in 2017 in the United States. Similar SEER analyses calculate U.S. incidence rates for MCL of 3,000 and 1,350 for WM. According to a published study (Chen et al., Cancer Statistics in China, 2015, CA Cancer J. Clin. 2016; 66(2):115-32), which we refer to as Chen et al. 2016, and GLOBOCAN’s online Global Cancer Observatory analyses on cancer statistics in China, there are an estimated 88,200 to 93,097 new lymphoma cases and 52,100 to 50,865 deaths in China each year, and of the lymphoma cases, approximately 90% are NHL and approximately 4.5% of the NHL cases are CLL/SLL.
Conventional methods of treating lymphomas vary according to the specific disease or histology, but generally include chemotherapy, antibodies directed at CD20, a molecular marker found on the surface of B-cells, and, less frequently, radiation. Recently, significant progress has been made in the development of new therapies for lymphomas, including BTK inhibitors, the PI3K inhibitors, idelalisib, copanlisib and duvelisib, and the Bcl-2 inhibitor, venetoclax. Most recently, a cell-based therapy, YESCARTA
®
(axicabtagene ciloleucel) was approved for the treatment of adult patients with diffuse large B-cell lymphoma, or DLBCL, who have failed at least two other kinds of treatment. YESCARTA
®
is a genetically modified autologous T-cell immuno-oncology therapy directed at CD19.
The BTK inhibitor IMBRUVICA
®
(ibrutinib) was first approved by the FDA in 2013 for the treatment of patients with MCL who have received at least one prior therapy. Since that time, ibrutinib has received supplemental FDA approvals for the treatment of patients with CLL, CLL patients with 17p deletion, patients with WM, patients with MZL who have received at least one prior anti-CD20-based therapy, patients with chronic graft versus host disease after failure of one or more lines of systemic therapy, for use in combination with obinutuzumab in CLL, and in combination with rituximab in WM. Ibrutinib is also approved by the European Medicines Agency for the treatment of patients with MCL, CLL and WM. Ibrutinib has been approved in over 90 countries and regions, and it was approved and launched in China at the end of 2017. In 2018, global revenues for BTK inhibitors were approximately US$4.5 billion according to published reports. Another BTK inhibitor, CALQUENCE
®
(acalabrutinib) was approved by the FDA in 2017 under accelerated approval for the treatment of patients with MCL who have received at least one prior therapy. In late 2017, ibrutinib was the first BTK inhibitor approved and launched in China, for the treatment of patients with R/R CLL/SLL and R/R MCL. Subsequently, in July 2018, ibrutinib was also approved for first-line CLL.
Summary of Clinical Results
As of January 25, 2019, we had enrolled more than 1,300 patients in clinical trials of zanubrutinib, including trials of zanubrutinib in combination with other therapies, which we refer to as combination trials. A multi-center, open-label Phase 1 trial is being conducted in Australia, New Zealand, the United States, South Korea and European countries to assess the safety, tolerability, pharmacokinetic properties and preliminary activity of zanubrutinib as a monotherapy in patients with different subtypes of B-cell malignancies, such as WM, CLL/SLL, FL, and MCL. The initial results of the dose-escalation phase and dose-expansion phase of this trial demonstrated that, consistent with zanubrutinib’s pharmacokinetic profile, complete and sustained 24-hour BTK occupancy in the blood was observed in all tested patients, starting at the lowest dose of 40 mg once daily. In addition, sustained full BTK occupancy was observed in the lymph nodes especially for the 160 mg twice daily dosing regimen. There is no guarantee that these results will be reproduced in pivotal trials.
Waldenström’s Macroglobulinemia
On October 12, 2018, data from our Phase 1 trial in patients with WM were presented at the 10th International Workshop on Waldenström's Macroglobulinemia (IWWM). As of the data cutoff of July 24, 2018, 77 patients with WM were enrolled in the study, and 62 patients remained on study treatment. Responses were determined according to the modified Sixth International Workshop on WM Criteria.
Seventy-three patients were evaluable for efficacy in this analysis and the median follow-up time was 22.5 months (4.1-43.9). The median time to response (>PR, or partial response) was 85 days (55-749). At the time of the data cutoff, 62 patients remained on study treatment. The overall response rate, or ORR, was 92% (67/73), the major response rate, or MRR, was 82%, and 41% of patients achieved a very good partial response, or VGPR, defined as a >90% reduction in baseline IgM levels and improvement of extramedullary disease by CT scan. The 12-month progression-free survival, or PFS, was estimated
7
at 89%. The median PFS had not yet been reached. The median IgM decreased from 32.7 g/L (5.3-91.9) at baseline to 8.2 g/L (0.3-57.8). The median hemoglobin increased from 8.85 g/dL (6.3-9.8) to 13.4 g/dL (7.7-17.0) among 32 patients with hemoglobin <10 g/dL at baseline.
MYD88 genotype was known in 63 patients. In the subset known to have the MYD88L265P mutation (n=54), the objective response rate was 94%, the major response rate was 89%, and the VGPR rate was 46%. In the nine patients known to be MYD88WT, a less common genotype that historically has had sub-optimal response to BTK inhibition, the ORR was 89%, the MRR was 67%, and the VGPR rate was 22%.
Zanubrutinib was observed to be generally well-tolerated with no discontinuation for zanubrutinib-related toxicity. The majority of adverse events, or AEs, were grade 1 or 2 in severity. The most frequent AEs of any attribution were petechia/purpura/contusion (43%), upper respiratory tract infection (42%), cough (17%), diarrhea (17%), constipation (16%), back pain (16%), and headache (16%). Grade 3-4 AEs of any attribution reported in three or more patients included neutropenia (9%), anemia (7%), hypertension (5%), basal cell carcinoma (5%), renal and urinary disorders (4%), and pneumonia (4%). Serious adverse events, or SAEs, were seen in 32 patients (42%), with events in five patients (7%) considered possibly related to zanubrutinib treatment: febrile neutropenia, colitis, atrial fibrillation, hemothorax, and pneumonia (n=1 each). Nine patients (12%) discontinued due to AEs: abdominal sepsis (fatal), septic shoulder, worsening bronchiectasis, scedosporium infection, gastric adenocarcinoma (fatal), prostate adenocarcinoma, metastatic neuroendocrine carcinoma, acute myeloid leukemia, or breast cancer (n=1 each, all considered by the investigator to be unrelated to treatment). Atrial fibrillation/flutter occurred in four patients (5%). Major hemorrhage was observed in two patients (3%). Four patients (5%) discontinued study treatment due to disease progression as assessed by investigator and one patient remains on treatment post-disease progression.
Chronic Lymphocytic Leukemia/Small Lymphocytic Lymphoma
On October 24, 2018, we announced the acceptance by the NMPA of our NDA for zanubrutinib for the treatment of patients with R/R CLL/SLL, together with the top line clinical data that supported the filing. The trial was a 91-patient single-arm pivotal Phase 2 study in Chinese patients with R/R CLL/SLL treated with zanubrutinib, dosed at 160 mg orally twice daily, or BID. An independent review of response data from this study, with a data cut-off of June 15, 2018 and a median follow-up of 9.1 months, showed an ORR of 80%, inclusive of complete response, or CR, of 2%, PR of 39%, and partial response with lymphocytosis, or PR-L, of 40%. The median duration of response had not been reached, as a majority of the responders remained in a response. The safety profile results were consistent with previously reported clinical data for zanubrutinib, which are described below. We plan to submit updated data with additional follow-up of the patients in this trial in support of the NDA.
On June 14, 2017, at the 14th International Conference on Malignant Lymphoma in Lugano, Switzerland, data were presented from patients with CLL/SLL from the same Phase 1 trial that included WM patients described above. As of the data cutoff of March 31, 2017, 69 patients with CLL or SLL (18 TN, 51 R/R) were enrolled in the trial.
At the time of the data cutoff, 66 patients (16 TN and 50 R/R) had more than 12 weeks of follow-up and were evaluable for efficacy, and three other patients had less than 12 weeks of follow-up. After a median follow-up of 10.5 months (2.2-26.8 months), the ORR was 94% (62/66) with CRs in 3% (2/66), PRs in 82% (54/66), and PR-Ls in 9% (6/66) of patients. Stable disease, or SD, was observed in 5% (3/66) of patients. A patient with pleural effusion discontinued treatment prior to week 12 and was not evaluable for response. There was one instance of Hodgkin’s transformation. In TN CLL/SLL, at a median follow-up time of 7.6 months (3.7-11.6 months), the ORR was 100% (16/16) with CRs in 6% (1/16), PRs in 81% (13/16) and PR-Ls in 13% (2/16) of patients. In R/R CLL/SLL, at a median follow-up time of 14.0 months (2.2-26.8 months), the ORR was 92% (46/50) with CRs in 2% (1/50), PRs in 82% (41/50) and PR-Ls in 8% (4/50) of patients. SD was observed in 6% (3/50) patients.
Zanubrutinib was shown to be generally well-tolerated in CLL/SLL. The most frequent AEs (≥10%) of any attribution were petechiae/purpura/contusion (46%), fatigue (29%), upper respiratory tract infection (28%), cough (23%), diarrhea (22%), headache (19%), hematuria (15%), nausea (13%), rash (13%), arthralgia (12%), muscle spasms (12%) and urinary tract infection (12%). All of these events were grade 1 or 2 except for one case of grade 3 purpura (subcutaneous hemorrhage), which was the only major bleeding event. Additional AEs of interest included one case of each grade 2 diarrhea and grade 2 atrial fibrillation. A total of 18 SAEs occurred in 13 patients, with no SAE occurring in more than one patient. Only one patient discontinued treatment due to an AE, a grade 2 pleural effusion.
8
Mantle Cell Lymphoma
On December 1, 2018, at the 60
th
American Society of Hematology, or ASH, Annual Meeting, in San Diego, CA, two data sets were presented on zanubrutinib in MCL patients from our Phase 2 and Phase 1 studies.
The Phase 2 study was a single arm, open-label, multi-center, pivotal trial of zanubrutinib as a monotherapy in Chinese patients with R/R MCL that enrolled 86 patients who had received a median of two prior lines of therapy (range of 1-4). Patients were treated with zanubrutinib, dosed at 160 mg orally BID. The primary endpoint of the trial was ORR assessed by independent review committee, or IRC, using PET-based imaging according to the Lugano Classification 2014.
As of March 27, 2018, 85 patients with R/R MCL were evaluable for efficacy and 65 patients (75.6%) remained on study treatment. The median follow-up time for patients enrolled in the trial was 35.9 weeks (1.1-55.9). The IRC-assessed ORR was 83.5% (71/85); the CR rate was 58.8% (50/85); and the PR rate was 24.7% (21/85). The 24-week PFS was estimated at 82%. The median PFS had not yet been reached. With 24.1 weeks median follow-up (0.1-41.1), the median duration of response, or DOR, had not yet been reached and 90% of responders were still in response at 24 weeks.
Zanubrutinib tolerability was generally consistent with previous reports in patients with various B-cell malignancies and the majority of AEs were grade 1 or 2 in severity. The most frequent AEs of any attribution were neutrophil count decreased (31.4%), rash (29.1%), upper respiratory tract infection (29.1%), and platelet count decreased (22.1%). The most frequently reported (in >5% of patients) grade 3 or higher AEs were neutrophil count decreased (11.6%) and lung infection (5.8%). Four patients (4.7%) had treatment-emergent adverse events, or TEAEs, leading to death (one case each of traffic accident, cerebral hemorrhage, pneumonia, and unknown cause in the setting of infection). Among events of special interest for BTK inhibitors, diarrhea was observed in nine patients (10.5%), all grade 1-2. Major hemorrhage was observed in one patient (1.2%) with a blastoid variant of MCL who had intra-parenchymal CNS bleeding. No cases of atrial fibrillation/flutter were reported in this trial.
The Phase 1 study is an open-label trial of zanubrutinib as a monotherapy in patients with different subtypes of B-cell malignancies, including MCL, and is being conducted in Australia, New Zealand, the United States, Italy, and South Korea. As of July 24, 2018, 48 patients with TN (n=9) or R/R (n=39) MCL had been enrolled in the trial and the median follow-up time was 12.7 months (0.7-38.0). Forty-five patients including six with TN and 39 with R/R MCL, were evaluable for efficacy in this analysis, per the Lugano 2014 classification. At the time of the data cutoff, 26 patients remained on study treatment.
The investigator-assessed ORR was 88.9% (40/45); the CR rate was 26.7% (12/45); and the PR rate was 62.2% (28/45). The majority of patients were assessed via CT-scan; PET scans were optional per trial protocol. The median DOR was 16.2 months and the median PFS for R/R patients was 18.0 months (0.7-30.7).
Zanubrutinib tolerability was generally consistent with previous reports in patients with various B-cell malignancies and the majority of AEs were grade 1 or 2 in severity. The most frequent AEs of any attribution were petechia/purpura/contusion (33.3%), diarrhea (33.3%), upper respiratory tract infection (29.2%), fatigue (25.0%), and constipation (18.8%). Grade 3-5 AEs occurred in 56.3% of patients. Grade 3-5 AEs of any attribution reported in > three patients included anemia (8.3%), major hemorrhage (6.3%), cellulitis (6.3%), myalgia (6.3%), neutropenia (6.3%), pneumonia (6.3%); and thrombocytopenia (6.3%). Discontinuation due to AEs occurred in 18.8% of patients with all but one event (peripheral edema) determined to be unrelated to study drug. There were four deaths due to AEs, which were all determined by the investigators to be unrelated to zanubrutinib treatment.
9
Other Lymphomas
We have a broad clinical program investigating zanubrutinib for the treatment of patients with several other lymphomas outside of the work detailed above. Efficacy results of those clinical trials reported to date are summarized in the table below.
|
Indication
|
MZL
|
FL
|
FL
|
DLBCL
|
|
Source
|
ASH 2017
1
|
ASH 2017
1
|
CSCO 2018
2
|
ASH 2017
1
|
|
n
|
9
|
17
|
26
|
26
|
|
Follow-up
|
7.0 mo
|
7.8 mo
|
9.5 mo
|
4.2 mo
|
|
Prior Lines
|
2 (1-8)
|
2 (1-8)
|
3 (1-9)
|
2 (1-10)
|
|
ORR
|
78%
|
41%
|
42%
|
31%
|
|
CR
|
—%
|
18%
|
8%
|
15%
|
|
VGPR
|
—
|
—
|
—
|
—
|
|
PR/PR-L
|
78%
|
24%
|
35%
|
15%
|
|
MR
|
—
|
—
|
—
|
—
|
Source: 1. Tam et al., ASH 2018 (poster 1592); 2. Press Release dated September 21, 2018
Pooled Analysis of Safety Data from Monotherapy Trials
At the 23rd Congress of the European Hematology Association, or EHA 2018, the pooled safety data were presented from patients with various B-cell lymphomas in four ongoing zanubrutinib monotherapy studies, totaling 476 patients with a median exposure of seven months. Overall, the data suggested that exposure levels of zanubrutinib resulting in complete and sustained BTK inhibition can be achieved and that zanubrutinib was generally well-tolerated. There were infrequent AEs of interest with BTK inhibitor therapy, such as atrial fibrillation/flutter (2%), major hemorrhage (2%), and grade 3 and above diarrhea (1%). Treatment discontinuation due to zanubrutinib-related AEs was uncommon (3%). The majority of patients (94%) experienced one or more AEs of any attribution, primarily grades 1 or 2. The most common grade 3 or higher AEs of any attribution were neutropenia/neutrophil count decreased/febrile neutropenia (14%), anemia (7%) and thrombocytopenia/platelet count decreased (7%). SAEs were reported in 116 patients (24%), with 38 patients (8%) assessed by the investigator as related to zanubrutinib. The most common SAEs were pneumonia/lung infection (6%), pleural effusion (1%), and febrile neutropenia (1%). The only treatment-related SAE reported in greater than 1% of patients was pneumonia/lung infection (2%). No cases of pneumocystis jiroveci pneumonia, or PJP, or cytomegalovirus, or CMV, reactivation were reported. The most common bleeding events observed included petechiae/purpura/contusion (26%) and hematuria (11%). Major hemorrhage (2%) included gastrointestinal hemorrhage/melena (n=3), intraparenchymal CNS hemorrhage grade 5, hematuria, purpura, hemorrhagic cystitis, renal hematoma, and hemothorax (one each). The median time to first major hemorrhage was 1.2 months. Among patients with emergent atrial fibrillation/flutter (n=8), a majority had known risk factors including hypertension (n=2), pre-existing cardiovascular disease (n=2), and concurrent infection (n=1). The cumulative rates of grade 3 or higher infections were 14% at six months, 19% at 12 months and 21% at 18 months. The exposure-adjusted incidence rate was 1.82 per 100 person-months. The most common second primary malignancies included basal cell carcinoma (3%) and squamous cell carcinoma of the skin (1%).
Clinical Development Plan
Based on the clinical data to date, we believe that zanubrutinib has a potentially best-in-class profile, and we are running a broad global pivotal program in multiple indications including seven registration or registration-enabling clinical trials.
Globally, we have an ongoing monotherapy head-to-head Phase 3 trial versus ibrutinib in WM, which has closed to new patient screening and completed enrollment having met the enrollment target. We are also conducting an ongoing Phase 3 trial compared to bendamustine and rituximab in patients with TN CLL/SLL and a head-to-head Phase 3 trial in R/R CLL/SLL versus ibrutinib. Additionally, we have an ongoing pivotal Phase 2 trial in combination with GAZYVA
®
(obinutuzumab) in patients with R/R FL, which is designed as a pivotal trial for accelerated or conditional approval and will require a confirmatory study, as well as a Phase 2 trial in patients with R/R MZL.
Zanubrutinib was granted, by the FDA, Fast Track designation for the treatment of patients with WM in July 2018, and was granted Breakthrough Therapy designation in January 2019 for the treatment of adult patients with MCL who have
10
received at least one prior therapy. We plan to submit in 2019 or early 2020 an NDA to pursue an approval of zanubrutinib in the United States.
In China, we are conducting three separate pivotal Phase 2 trials of zanubrutinib as monotherapy in patients with R/R MCL, R/R CLL/SLL, and WM. We have announced the acceptance of our filings for approval in MCL and CLL/SLL on August 26, 2018 and October 24, 2018, respectively.
If we receive conditional approval instead of full approval, we will be required to conduct one or more confirmatory studies after such conditional approvals. If approved, we plan to commercialize zanubrutinib shortly after approval. In addition, we are conducting a Phase 2 trial in China of zanubrutinib in patients with R/R DLBCL.
Tislelizumab (BGB-A317), an anti-PD-1 Antibody
Tislelizumab is an investigational humanized monoclonal antibody against the immune checkpoint receptor PD-1 that is currently being evaluated in pivotal clinical trials globally and in China and for which we plan to commence additional pivotal trials as a monotherapy and in combination with standard of care to treat various solid and hematological cancers. We have a global strategic collaboration with Celgene for tislelizumab for solid tumors outside of Asia (other than Japan) as further described in “--Celgene Collaboration.”
Mechanism of Action
Cells called cytotoxic T-lymphocytes, or CTLs, provide an important self-defense mechanism against cancer, patrolling the body, recognizing cancer cells due to immunogenic features that differ from normal cells, and killing cancer cells by injecting deleterious proteins into them. T-lymphocytes have various mechanisms that prevent them from damaging normal cells, among which is a protein called PD-1 receptor, that is expressed on the surface of T-lymphocytes. PD-L1 is an important signaling protein that can engage PD-1. PD-L1 binding to PD-1 sends an inhibitory signal inside the T-lymphocyte and suppresses its cytotoxic effects. Many types of cancer cells have hijacked the PD-L1 expression system that normally exists in healthy cells. By expressing PD-L1, cancer cells protect themselves from being killed by CTLs. Anti-PD-1 therapies are designed to bind to and block downstream activity of PD-1, allowing the immune system to combat cancer cells.
Tislelizumab is a monoclonal antibody designed to specifically bind to PD-1, without activating the receptor, thereby blocking engagement of PD-1 by its ligands PD-L1 and PD-L2. Tislelizumab has demonstrated high affinity and specificity for PD-1 in preclinical studies. It is differentiated mechanistically from the currently approved PD-1 antibodies by an engineered Fc region designed to minimize binding to FcγR on macrophages, thereby abrogating antibody-dependent phagocytosis, a potential mechanism of T-cell clearance, which we believe may minimize potentially negative interactions with other immune cells based on preclinical data.
Market Opportunity and Competition
A number of PD-1 or PD-L1 antibody drugs have been approved by the FDA. These include Merck’s KEYTRUDA
®
(pembrolizumab), Bristol-Myers Squibb’s OPDIVO
®
(nivolumab), Roche’s TECENTRIQ
®
(atezolizumab), AstraZeneca’s IMFINZI
®
(durvalumab), Pfizer and Merck Sereno’s BAVENCIO
®
(avelumab), and Regeneron and Sanofi’s LIBTAYO
®
(cemiplimab). In the global setting, several PD-1 or PD-L1 antibody agents are in clinical development in addition to tislelizumab, such as Novartis’ PDR-001, GlaxoSmithKline / Tesaro’s TSR042, Pfizer’s PF-06801591, and AstraZeneca’s MEDI0680. In China, as of February 20, 2019, there are four approved PD-1 antibodies, OPDIVO
®
(nivolumab) and KEYTRUDA
®
(pembrolizumab), as well as Junshi’s TUOYI (toripalimab) and Innovent’s TYVYT (sintilimab), and there are no approved PD-L1 antibody agents yet. There are approximately six more PD-1 and PD-L1 agents in late stage development in China, of which one has filed for approval as of February 20, 2019.
Globally, the top four PD-1/PD-L1 antibody drugs had sales of approximately $15 billion in 2018 based on public reports. We believe that there is a large commercial opportunity in China for PD-1 and PD-L1 antibody drugs. Currently available clinical data suggest that some of the most prevalent cancers in China, such as lung cancer, GC, liver cancer and EC, are responsive to this class of agents. According to the World Health Organization's Globocan online database, China suffered 37%, 44%, 47%, and 54% of all deaths from lung cancer, GC, liver cancer and EC, respectively, in the world. Collectively, these four tumor types comprised over 2.3 million new cases in 2016 in China alone, according to Chen et al. 2016. In addition, China has a higher proportion of PD-1 responsive tumors in its total annual cancer incidence in comparison to other geographies like the United States and the European Union, or EU. According to Chen et al. 2016, the annual incidence of the top ten PD-1 responsive tumors in China is estimated to be 3.0 million out of 4.3 million in total annual cancer incidence. In comparison, the estimated annual incidence of the top ten PD-1 responsive tumors is 0.9 million out of 1.7 million in total annual cancer
11
incidence in the United States, and 0.9 million out of the 1.8 million total in the EU5 countries (United Kingdom, France, Germany, Spain and Italy) according to SEER program of the U.S. National Cancer Institute and the World Health Organization.
Summary of Clinical Results
As of December 8, 2018, we have enrolled over 2,200 patients in clinical trials of tislelizumab, including combination trials. Preliminary data from our monotherapy Phase 1 trials suggested that tislelizumab was generally well-tolerated and exhibited anti-tumor activity in a variety of tumor types. There is no guarantee that these results will be reproduced in pivotal trials.
Hodgkin’s Lymphoma
On December 3, 2018, data from a pivotal Phase 2 clinical trial of tislelizumab in R/R cHL were presented at the ASH meeting. This single arm, open-label, multi-center, pivotal Phase 2 trial of tislelizumab as a monotherapy in Chinese patients with R/R cHL enrolled 70 patients who failed to achieve a response or progressed after autologous stem cell transplant, or ASCT, or received at least two prior lines of systemic therapy for cHL and were not an ASCT candidate. Patients were treated with tislelizumab, dosed at 200 mg intravenously every three weeks. The primary endpoint of the trial is ORR-assessed by IRC using PET-based imaging according to the Lugano Classification 2014.
As of May 25, 2018, 70 patients with R/R cHL were evaluable for efficacy and 53 patients (75.7%) remained on study treatment. Thirteen patients received prior ASCT, and the remaining 57 patients were ineligible for prior ASCT, including 53 for failure to achieve an objective response to salvage chemotherapy, two for inadequate stem cell collection or unable to collect stem cells, and two for co-morbidities. The patients had a median of three prior lines of systemic therapy with a range of two to eleven. The median study follow-up was 7.85 months (3.4-12.7).
The ORR assessed by IRC was 85.7% (60/70); the CR rate was 61.4% (43/70); and the PR rate was 24.4% (17/70). Among patients who had received prior ASCT, 92.3% (12/13) achieved an objective response, with nine patients (69.2%) achieving a CR. The DOR had not yet been reached. The estimated event-free rates at nine months were 84%. PFS data were preliminary and six-month PFS was estimated at 80%. The median PFS had not yet been reached.
The majority of AEs were grade 1 or 2 in severity. The most frequently reported TEAEs of any grade were pyrexia (52.9%), hypothyroidism (30.0%), weight increased (28.6%), upper respiratory tract infection (27.1%), cough (17.1%), white blood cell count decreased (14.3%), and pruritus (14.3%). Grade ≥3 TEAEs occurred in 21.4% of patients. The most frequently reported grade 3 or higher TEAEs were upper respiratory tract infection (2.9%) and pneumonitis (2.9%). Four patients (5.7%) discontinued study drug due to TEAEs, including pneumonitis (n=2), focal segmental glomerulosclerosis (n=1), and organizing pneumonia (n=1); there were no cases of TEAE leading to death. Immune-related AEs reported in more than five percent of patients included thyroid disorder (18.6%), pneumonitis (5.7%), and skin adverse reactions (5.7%).
12
Other Tumor Types
In addition to cHL, we are evaluating tislelizumab for the treatment of patients with a broad array of tumor types. Efficacy results from those clinical trials reported to date are summarized in the table below.
|
Tumor Type
|
Gastric Cancer
|
Esophageal Cancer
|
Head & Neck SCC
|
Ovarian Cancer
|
Hepato-cellular Carcinoma
|
Urothelial Cancer
|
NSCLC
|
MSI-H / dMMR
|
|
Source
|
ESMO-IO 2018
1
|
ESMO-IO 2018
1
|
ESMO 2017
2
|
ESMO 2017
3
|
ESMO-IO 2018
1
|
ESMO-IO 2018
4
|
ESMO-IO 2018
1
|
CSCO 2018
5
|
|
Median Treatment Duration
|
—
|
—
|
104 days (30-339)
|
71 days (29-540)
|
—
|
4.1 mo (0.7-26.3)
|
—
|
2.2 mo (0.69-11.1)
|
|
Median Follow-up Time
|
4.9 mo (0.9-25.4)
|
5.2 mo (0.2-22.7)
|
—
|
—
|
10.8 mo (0.7-31.6)
|
—
|
11.2 mo (0.5-25.9)
|
4.4 mo (0.1-10.7)
|
|
Median Duration of Response
|
8.5 mo
|
NR
|
—
|
—
|
15.7 mo
|
18.7 mo (6.2-18.7)
|
NR
|
—
|
|
Evaluable Patients
|
N=54
|
N=54
|
N=17
|
N=50
|
N=49
|
N=17
|
N=46
|
N=14
|
|
CR (Confirmed)
|
—
|
1
|
—
|
—
|
—
|
1
|
—
|
—
|
|
PR
|
7
|
5
|
3
|
2
|
6
|
4
|
6
|
4
|
|
SD
|
9
|
14
|
6
|
20
|
19
|
3
|
23
|
4
|
|
Patients Remaining on Treatment *
|
3
|
3
|
3
|
6
|
5
|
2
|
7
|
9
|
* At the time of data cutoff.
Notes
: 1. Phase 1A/1B data as of August 31, 2018, presented at the ESMO Immuno-Oncology 2018 Congress (Sanjeev et al); 2. Phase 1 data as of June 8, 2017, presented at the ESMO 2017 Congress (Horvath et al, Abstract 389P); 3. Phase 1 data as of June 8, 2017, presented at the ESMO 2017 Congress (Meniawy et al, Abstract 388P); 4. Phase 1/2 data as of August 31, 2018, presented at the ESMO Immuno-Oncology 2018 Congress (Shahneen et al); 5. Phase 1 data as of May 11, 2018, presented at CSCO 2018.
Safety Results
The safety results of tislelizumab in clinical trials to date are consistent with its therapeutic class, having a relatively low rate of drug-related grade 3 or above toxicity. Across the monotherapy studies, the safety results were consistent with our two Phase 1 studies, and our first-in-human Phase 1 study TEAE are indicated in the table below. Over half of the patients in our two Phase 1 studies experienced a tislelizumab-related TEAE, though ≥ grade 3 events were less frequent (8% to 10%).
|
System Organ Class
Preferred Term
|
Phase 1a
|
Phase 1b
|
Total
|
|
N=116
n (%)
|
N=335
n (%)
|
N=451
n (%)
|
|
|
Patients with at least one TEAE
|
114 (25.3)
|
322 (71.4)
|
436 (96.7)
|
|
Fatigue
|
47 (10.4)
|
78 (17.3)
|
125 (27.7)
|
|
Nausea
|
41 (9.1)
|
68 (15.1)
|
109 (24.2)
|
|
Decreased appetite
|
19 (4.2)
|
71 (15.7)
|
90 (20.0)
|
|
Diarrhea
|
32 (7.1)
|
49 (10.9)
|
81 (18.0)
|
|
Constipation
|
26 (5.8)
|
50 (11.1)
|
76 (16.9)
|
|
Abdominal pain
|
26 (5.8)
|
38 (8.4)
|
64 (14.2)
|
|
Vomiting
|
20 (4.4)
|
43 (9.5)
|
63 (14.0)
|
|
Back pain
|
22 (4.9)
|
40 (8.9)
|
62 (13.7)
|
|
Cough
|
15 (3.3)
|
45 (10.0)
|
60 (13.3)
|
|
Rash
|
23 (5.1)
|
37 (8.2)
|
60 (13.3)
|
|
Dyspnea
|
12 (2.7)
|
33 (7.3)
|
45 (10.0)
|
All grades, regardless of causality; Data cut-off April 27, 2018; 6 months after Last Patient Enrolled; Source: BGB-A317 IB v6.0. Of the 451 total patients in the Safety Population for Study BGB A317_001, 203 (45.0%) experienced at least 1 grade 3 or higher TEAE. The most commonly occurring grade 3 or higher TEAEs (≥ 2%; 9 or more patients overall incidence) were pneumonia (22 patients, 4.9%), anemia (18 patients, 3.2%), and hypokalemia (9 patients, 2.0%).
13
Immune-Related Treatment-Emergent Adverse Events and Deaths
Immune-related TEAEs, or irTEAEs, of any grade were reported in approximately 25% of patients but were primarily low grade (3% to 5% ≥ grade 3). These irTEAEs, however, have well-established algorithms for treatment and are considered manageable.
Across the monotherapy studies, the rate of treatment emergent SAEs, or TESAEs, ranged from 16% to 37% in patients with a variety of different disease characteristics. TESAEs considered to be related to treatment with tislelizumab were notably lower, ranging from 6% to 13%.
There have been some deaths reported across the active studies with clinical data available (as of the cut-off dates ranging from April 25, 2018 to August 29, 2018), of which less than 0.5% of the total patient population were deemed to be related to treatment with tislelizumab.
Clinical Development Plan
We are running a broad development program for tislelizumab, including 11 registration or registration-enabling clinical trials. These include global pivotal trials in Asia-prevalent cancers, such as non-small cell lung cancer, or NSCLC, EC, GC and HCC, which are intended to support regulatory submissions globally and in China. We have initiated pivotal or Phase 3 trials to evaluate tislelizumab as a potential second- or third-line treatment compared to docetaxel in patients with NSCLC; as a potential first-line treatment compared to sorafenib in patients with HCC and in second or third line HCC used as a monotherapy; as a potential first-line treatment in GC in combination with platinum and fluoropyrimidine-based chemotherapy; and as a potential second-line treatment compared to investigator-chosen chemotherapy in patients with esophageal squamous cell carcinoma, or ESCC, and as a potential first-line treatment in advanced ESCC patients in combination with platinum and fluoropyrimidine-based chemotherapy. Under our collaboration with Celgene, Celgene has opened enrollment in its first Phase 3 trial in Stage 3 NSCLC examining tislelizumab in combination with chemoradiation. We have also recently initiated a global Phase 2 trial in patients with relapsed or refractory mature T- and NK-cell lymphomas.
We have four China pivotal trials ongoing, including two Phase 2 trials in patients with R/R cHL and in patients with PD-L1 positive second/third-line urothelial cancer, or UC, and two Phase 3 trials in combination with chemotherapy -- one in patients with non-squamous NSCLC and the second in patients with squamous NSCLC. We submitted for approval for tislelizumab in China to treat R/R cHL and announced that this submission had been accepted on August 31, 2018, and received priority review on November 15, 2018. We expect to submit for approval in China for the treatment of patients with UC based on the results of the pivotal Phase 2 trial. If we receive conditional approval instead of full approval, we will be required to conduct one or more confirmatory studies after such conditional approvals. We also expect to submit for approval in China for tislelizumab for the treatment of patients with NSCLC, ESCC, GC and HCC based on our China trials and, where appropriate, our global studies.
Pamiparib (BGB-290), a PARP Inhibitor
Pamiparib is an investigational small molecule inhibitor of PARP1 and PARP2 that is being evaluated as a potential monotherapy and in combinations for the treatment of various solid tumors. We believe that pamiparib has the potential to be differentiated from other PARP inhibitors because of its brain penetration, greater selectivity, strong DNA-trapping activity, and good oral bioavailability demonstrated in preclinical models.
Mechanism of Action
PARP family members PARP1 and PARP2 play essential roles in cell survival in response to DNA damage. PARP1 and PARP2 are key base-excision-repair proteins that function as DNA damage sensors by binding rapidly to the site of damaged DNA and modulating a variety of proteins in DNA repair processes. Inhibition of PARPs prevents the repair of common single-strand DNA breaks, which leads to formation of double-strand breaks during DNA replication. Double-strand DNA breaks in normal cells are repaired by homologous recombination, and normal cells are relatively tolerant of PARP inhibition. On the other hand, cancer cells with mutations in breast cancer susceptibility gene, or BRCA1/2 genes, which are key players in homologous recombination, are highly sensitive to PARP inhibition. This phenomenon is called “synthetic lethality” and is the foundation of the therapeutic utility of PARP inhibitors as a monotherapy for BRCA mutant cancers. In addition to hereditary BRCA1/2 mutations, the synthetic lethality concept has been broadened to include sporadic tumors that display homologous recombination deficiency, or HRD, a gene expression profile that resembles that of a BRCA deficient tumor. HRD can stem from somatic mutation of BRCA1/2, epigenetic silencing of BRCA genes or genetic or epigenetic loss of function of other genes in homologous recombination DNA damage repair pathways. Third-party clinical studies have published results
14
demonstrating that sensitivity to platinum-based chemotherapies confers sensitivity to PARP inhibitors in OC as well. Thus, the application of PARP inhibitors is likely broader than BRCA or HRD mutations, and there is additional possibility to identify and enrich patient populations for PARP inhibition.
Another potential therapeutic utility of PARP inhibitors is in combination therapy, which has strong scientific rational. PARP proteins are key factors in base-excision-repair, which is critical for the repair of DNA lesions caused by some chemotherapeutic agents and by radiation. PARP inhibitors are hypothesized to potentiate cytotoxicity of DNA-alkylating agents such as platinum compounds, temozolomide and ionizing radiation, and may be used in combination with these agents in treating various cancers.
PARP inhibitors are also considered good potential combination partners with checkpoint inhibitors in part due to increased mutations in tumor cells as a result of the blockade of DNA repair by PARP inhibitors as a higher mutational load in cancers has been shown in clinical studies to correlate with improved response to checkpoint inhibitors. In addition, preclinical data suggest that BRCA mutant tumors which are sensitive to PARP inhibition are likely to be immunogenic and responsive to PD-1 or PD-L1 antibodies.
Market Opportunity and Competition
We believe that the market opportunity for PARP inhibitors is large and expanding in various patient segments. Many tumor types have been shown to be responsive to PARP inhibitors, including OC, breast cancer, prostate cancer and GC. PARP inhibitors have demonstrated encouraging activity both in relapsed and refractory patients as well as in the maintenance setting. In the United States, in 2018 there were approximately 22,240 new cases of OC, 266,120 new cases of breast cancer, 164,690 new cases of prostate cancer, and 26,240 new cases of GC, according to the U.S. National Cancer Institute's SEER online database. In China, each year there are approximately 52,000 new cases of OC, 272,000 new cases of breast cancer, 60,000 new cases of prostate cancer, and 680,000 new cases of GC according to Chen et al. 2016.
A number of PARP inhibitors have been approved by the FDA. These include AstraZeneca’s LYNPARZA
®
(olaparib), Clovis Oncology’s RUBRACA
®
(rucaparib), GlaxoSmithKline / Tesaro’s ZEJULA
®
(niraparib), and Pfizer’s TALZENNA
®
(talazoparib). AbbVie’s veliparib is in late-stage development. In 2017, global sales of the PARP class exceeded US$461 million according to company reports. In China, AstraZeneca received approval for olaparib in August 2018 under priority review that utilized international multi-center data. Zai Labs obtained the development and commercial rights for niraparib in China, and its NDA to the NMPA was accepted in December 2018 for use as maintenance therapy in OC. There are some other PARP inhibitors being developed by domestic Chinese companies, including fluzoparib from Hengrui and Hansoh, but none have been submitted to the NMPA as of February 6, 2019.
Summary of Clinical Data
As of November 6, 2018, we have enrolled over 360 patients in clinical trials of pamiparib, including three registration or registration-enabling clinical trials.
A multi-center, open-label Phase 1/2 trial of pamiparib is being conducted in Australia in patients with advanced solid tumors. On September 8, 2017, preliminary clinical data from the ongoing Phase 1/2 trial of pamiparib in patients with advanced solid tumors were presented at ESMO. As of June 1, 2017, 68 patients were enrolled in the trial. The median duration of therapy for all patients was 79 days (range 1 to 926 days). At the time of the data cutoff, 20 patients remained on treatment.
At the time of the data cutoff, 39 patients with epithelial ovarian cancer, or EOC, or associated tumors such as fallopian tube or primary peritoneal cancers, were evaluable for efficacy. Among this group, there were three confirmed CRs, 10 confirmed PRs, and 21 cases of SD. Of the 23 evaluable patients with EOC or other associated tumors known to be BRCA-mutated, there were three CRs, seven PRs, and 10 cases of SD. Of the 13 evaluable patients whose BRCA gene types are wild type, there were two PRs. Of the three evaluable patients whose BRCA gene types were unknown, there was one PR. Complete and partial responses were observed in patients known to be platinum-resistant as well as patients with platinum-sensitive disease. There is no guarantee that these results will be reproduced in pivotal trials.
The safety analysis suggested that pamiparib was generally well-tolerated in patients with advanced solid tumors. AEs assessed to be treatment-related occurred in 78% of patients and were all grade 3 or lower in severity. The most common treatment-related AEs (≥10% of patients) were nausea (56%), fatigue (40%), anemia (25%), vomiting (21%), diarrhea (21%), decreased appetite (15%), and neutropenia or neutrophil count decrease (12%). SAEs occurred in 46% of patients, and SAEs considered to be treatment-related and occurring in more than one patient included two cases each of nausea and anemia. Four
15
patients reported dose-limiting toxicity, or DLT. Four patients had a TEAE with a fatal outcome; none were assessed as being treatment-related and all of which were associated with disease progression.
Ovarian Cancer
On April 16, 2018, preliminary clinical data from the open-label, multi-center Phase 1 dose-escalation trial of pamiparib in Chinese patients with locally advanced or metastatic high-grade non-mucinous ovarian cancer, or HGOC, including fallopian cancer, or triple-negative breast cancer, or TNBC, who had disease progression following at least one line of chemotherapy were presented at the 2018 American Association for Cancer Research Annual Meeting in Chicago, IL.
Patients were dosed at 20 mg, 40 mg, or 60 mg BID. As of September 25, 2017, 15 female patients were enrolled, nine with HGOC and six with TNBC. Nine patients had received four or more prior lines of therapies. All nine patients with HGOC were platinum-resistant (n=8) or refractory (n=1). Seven patients had a confirmed BRCA1/2 mutation (BRCAm), including five patients with HGOC and two patients with TNBC and the remaining patients had BRCA 1/2 wildtype (BRCA-WT). The median duration of treatment was 2.5 months (range: 8-260 days).
As of September 25, 2017, 13 of the 15 patients were evaluable for antitumor activity; five patients remained on treatment. Two of the nine HGOC patients achieved a confirmed PR including one platinum-refractory patient with BRCA wildtype status and one platinum-resistant patient with BRCA1/2 mutation, six HGOC patients had SD (BRCAm, n=4 and BRCA-WT, n=2) and one patient discontinued before the first radiographic assessment. Of the six treated TNBC patients, five (BRCAm, n=1, BRCA-WT, n=4) experienced disease progression and one patient (BRCAm) discontinued before the first radiographic assessment. Four of these evaluable TNBC patients were BRCA-WT and all experienced disease progression during the previous platinum-based chemotherapy.
The safety analysis suggested that pamiparib was generally well-tolerated. No dose-limiting toxicities were reported across the dose range, with the recommended Phase 2 dose, or RP2D, confirmed as 60 mg BID. Asthenia (n=12) and nausea (n=12) were the most commonly reported TEAE. Severity of all AEs was grade 3 or less. Overall, three patients experienced a serious AE (grade 2 abdominal infection, n=1; grade 3 pleural effusion, n=1; grade 3 ileus, n=1), none of which were considered related to treatment. Two of the SAEs led to treatment withdrawal (abdominal infection, n=1; pleural effusion, n=1).
Glioblastoma Multiforme
On November 16, 2018, we announced data from an open-label, multi-center global Phase 1b/2 multiple-dose and dose-escalation trial of pamiparib plus radiation therapy, or RT, and/or temozolomide, or TMZ, in patients with newly diagnosed or R/R glioblastoma multiforme, or GBM, at the 23rd Annual Scientific Meeting and Education Day of the Society for Neuro-Oncology (SNO). This study was designed to evaluate the safety, efficacy and clinical activity of the combination. Patients with newly diagnosed GBM with unmethylated MGMT (O6-methylguanine-DNA methyltransferase) promoter status (Arm A) received pamiparib (60 mg BID) over escalating time periods (two, four, or six weeks) in combination with RT over six to seven weeks. Patients with R/R GBM (Arm C) received pamiparib (60 mg BID) continuously plus TMZ administered on Days 1 to 21 of each 28-day cycle. After evaluation of safety and tolerability from Arm A and C, Arm B will enroll patients with newly diagnosed GBM and treat them with the triple combination of RT, pamiparib, and TMZ.
As of September 14, 2018, a total of 18 patients with newly diagnosed GBM were enrolled in Arm A (n=3, 6 and 9 in the two-, four-, and six-week cohorts respectively). The median study follow-up duration was 19 weeks (2-54). As of the data cutoff date, 15 of the 18 patients were evaluable for response per modified response assessment in neuro-oncology (mRANO) criteria. Two of 15 patients achieved a PR (one was confirmed) and six patients achieved stable disease (SD); the disease control rate was 53.3% (95% CI: 26.6-78.7). Five grade >3 AE (chills, diarrhea, fatigue, nausea, vertigo, one each, or 5.6%) were considered related to pamiparib or RT. Dose-limiting toxicities of fatigue, vertigo, and chills (one each) were reported. In Arm C, eight patients received TMZ at a fixed dose of 40 mg for 21 of 28 days and seven patients received 20 mg TMZ. The median study follow-up duration was 12.9 weeks (0.3-31.4). Ten of the 15 patients were evaluable per mRANO criteria and there were two PRs (one unconfirmed and one confirmed after data cutoff) and three SD. Grade >3 AEs included anemia (20%), fatigue (13.3%), and decreased lymphocyte count (13.3%), which were considered related to pamiparib or TMZ. Dose-limiting toxicities of nausea and neutropenia were reported. The combination of 21 days of 40 mg TMZ with pamiparib was not tolerable; a lower 20 mg TMZ dose evaluation in combination with pamiparib is ongoing.
16
Clinical Development Plan
In addition to the above trials, our global program includes a Phase 3 maintenance trial in patients with platinum-sensitive GC. In China, we are conducting a Phase 3 trial as a maintenance therapy in patients with platinum-sensitive recurrent OC in addition to an ongoing pivotal Phase 2 study in OC.
Lifirafenib (BGB-283), a RAF Dimer Inhibitor
Lifirafenib is an investigational novel small molecule inhibitor with RAF monomer and dimer inhibition activities. Lifirafenib has shown antitumor activities in preclinical models and in cancer patients with tumors harboring BRAF V600E mutations, non-V600E BRAF mutations or KRAS/NRAS mutations. We have been developing lifirafenib for the treatment of cancers with aberrations in the mitogen-activated protein kinase, or MAPK, pathway, including BRAF gene mutations and KRAS/NRAS gene mutations where first generation BRAF inhibitors are not effective. The MAPK pathway consists of proteins in the cell that transmit a signal from a receptor on the surface of the cell to the DNA in the nucleus of the cell. This pathway plays an essential role in regulating cell proliferation and survival. We believe that lifirafenib as monotherapy or in combination with other agents may have potential for treating various malignancies, such as melanoma, NSCLC and endometrial cancer. In October 2018, we formed a collaboration with SpringWorks Therapeutics to investigate the combination of lifirafenib and their MEK inhibitor, PD-0325901, in patients with advanced solid tumors that harbor RAS, RAF mutations and other MAPK pathway aberrations. This study is planned to commence in the first quarter of 2019.
Currently approved BRAF inhibitors include Roche’s ZELBORAF
®
(vemurafenib), Novartis’ TAFINLAR
®
(dabrafenib) and Array BioPharma's BRAFTOVI
®
(encorafenib). The combination of BRAF and MEK inhibitors is approved in patients with BRAF V600E/K mutation-positive metastatic melanoma, such as Novartis’ dabrafenib and MEKINIST
®
(trametinib), Genentech’s vemurafenib and COTELLIC
®
(cobimetinib), and Array Biopharma’s encorafenib and MEKTOVI
®
(binimetinib). We are aware of several other BRAF inhibitors in clinical development, such as Roche’s belvarafenib and Novartis’ LXH254.
Lifirafenib was evaluated in a multi-center, open-label Phase 1 trial conducted in Australia and New Zealand comprised of two parts - dose escalation and dose expansion - in patients with BRAF or KRAS/NRAS mutated solid tumors or patients with pancreatic cancer. Lifirafenib demonstrated antitumor activity in both BRAF and KRAS-mutated tumors in preclinical studies and in the dose-escalation portion of this Phase 1 trial.
Data from the dose-expansion portion of the trial were presented at the 2017 American Association for Cancer Research, or AACR, Annual Meeting. The dose-expansion portion of the trial was designed to evaluate the safety and efficacy of lifirafenib at the recommended Phase 2 dose of 30 mg once daily established in the dose-escalation part of the trial. In the dose-expansion portion, lifirafenib was generally well-tolerated at a dose of 30 mg once daily and continued to show antitumor activity in patients with BRAF V600-mutated solid tumors and patients with KRAS-mutated solid tumors. The safety analysis, which included 96 patients as of the September 12, 2016 cutoff, suggested that lifirafenib was generally well-tolerated at 30 mg once daily, with most drug-related AEs being grades 1 or 2 in severity. The most frequent drug-related AEs (≥10%) of any grade were fatigue (38.5%), dysphonia (26.0%), decreased appetite (21.9%), palmar-plantar erythrodysesthesia syndrome (21.9%), thrombocytopenia (19.8%), dermatitis acneiform (17.7%), diarrhea (16.7%), rash (16.7%), nausea (15.6%), hypertension (11.5%) and glossodynia (10.4%). The most frequent drug-related grade 3 and 4 AEs (≥ 2%, two patients or more) included fatigue (7.3%), hypertension (6.3%), thrombocytopenia (6.3%), pyrexia (3.1%), hyponatremia (2.1%), anemia (2.1%), neutropenia (2.1%), febrile neutropenia (2.1%), decreased platelet count (2.1%), increased alanine aminotransferase (2.1%), increased GGT (2.1%) and sepsis (2.1%).
The cutoff for the efficacy analysis was September 17, 2016. In seven patients with BRAF V600-mutated melanoma (including one V600K and one V600R) who were naïve to BRAF or MEK inhibitors, there were three PRs and three cases of SD. In three patients with BRAF V600-mutated PTC, there was one PR and two cases of SD. In six patients with KRAS-mutated NSCLC, there was one PR and two cases of SD. In ten patients with solid tumors with BRAF non-V600 mutations or solid tumors with BRAF V600 mutations that are not included in other cohorts, there were two PRs, in one patient with BRAF V600E-mutated melanoma and one with BRAF V600E-mutated OC, and three cases of SD. In two patients with BRAF V600-mutated NSCLC, there was one unconfirmed PR and one case of SD. Additional cases of SD were observed in four of six melanoma patients with BRAF V600-mutated melanoma who had responses to, but developed resistance against, BRAF or MEK inhibitors, nine of 13 patients with BRAF V600-mutated CRC, five of five patients with KRAS-mutated endometrial cancer, 12 of 20 patients with KRAS/NRAS-mutated CRC, and 10 of 21 patients with other KRAS/NRAS-mutated solid tumors or pancreatic cancer. In the Phase 1a portion of the trial, confirmed objective responses included a CR in a patient with BRAF V600E-mutated melanoma and two PRs, one in a patient with BRAF V600E-mutated thyroid cancer and one in a patient with KRAS-mutated endometrial cancer.
17
BGB-A333, a PD-L1 Inhibitor
BGB-A333 is an investigational humanized IgG1-variant monoclonal antibody against PD-L1, the ligand of PD-1. We intend to develop BGB-A333 either as a monotherapy or in combination with other cancer therapies, such as tislelizumab, to treat various cancers and potentially other areas of unmet need. BGB-A333 is currently being evaluated in a Phase 1 clinical trial in Australia to assess the safety and antitumor effect of BGB-A333 alone and in combination with tislelizumab in patients with advanced solid tumors.
BGB-A425, a TIM-3 Inhibitor
BGB-A425 is an investigational humanized IgG1-variant monoclonal antibody against T-cell immunoglobulin and mucin-domain containing-3, or TIM-3. We began a Phase 1/2 trial of BGB-A433 in combination with tislelizumab in various solid tumors in the fourth quarter of 2018.
Sitravatinib (MGCD-0516), a Multi-Kinase Inhibitor
In January 2018, we entered into an exclusive license agreement with Mirati for the development, manufacturing and commercialization of Mirati’s sitravatinib in Asia (excluding Japan and certain other countries), Australia and New Zealand. Sitravatinib is an investigational spectrum-selective kinase inhibitor which potently inhibits receptor tyrosine kinases, including RET, TAM family receptors (TYRO3, Axl, MER), and split family receptors (VEGFR2, KIT). Sitravatinib is being evaluated by Mirati in multiple clinical trials to treat patients who are refractory to prior immune checkpoint inhibitor therapy, including a potentially registration-enabling Phase 3 trial of sitravatinib in non-small cell lung cancer projected to initiate in the first half of 2019. Sitravatinib is also being evaluated as a single agent in patients with NSCLC, melanoma and other solid tumor types whose tumors harbor specific genetic alterations in CBL. In recent data readouts by Mirati, sitravatinib has demonstrated durable responses in lung cancer patients who progressed after treatment with checkpoint inhibitors. We began a Phase 1 study of sitravatinib in combination with tislelizumab in various solid tumors in Australia and China in the third quarter of 2018.
Avadomide (CC-122), a Cereblon Modulator
Avadomide (CC-122) is an investigational next-generation Cereblon modulator currently in clinical development by Celgene. It is in multiple Phase 1 and Phase 1/2 clinical trials, both as a single agent and in combination, for hematological and solid tumor cancers outside of China. Avadomide (CC-122) has been differentiated from previous compounds (such as thalidomide, lenalidomide and pomalidomide) and has been developed based on the scientific understanding of Cereblon-mediated protein homeostasis. We have rights to develop and commercialize avadomide (CC-122) in China under our exclusive license agreement with Celgene. See “-Celgene Collaboration.”
Our Commercial Products
We commercialize the following cancer drugs in China under an exclusive license from Celgene. Historically, the fourth quarter sales of many oncology drug sales in China are lower than sales levels in the third quarter. Our product ABRAXANE
®
's fourth quarter sales were lower than the third quarter in 2018.
ABRAXANE
®
ABRAXANE
®
(paclitaxel albumin-bound particles for injectable suspension) is a solvent-free chemotherapy product which was developed using Celgene’s proprietary nab
®
technology platform. This protein-bound chemotherapy agent combines paclitaxel with albumin. Globally, ABRAXANE
®
is approved for uses in breast cancer, NSCLC, pancreatic cancer and GC with geographic differences in labeling. In China, ABRAXANE
®
is approved for metastatic breast cancer after failure of combination chemotherapy for metastatic disease or relapse within six months of adjuvant chemotherapy. Prior therapy should have included an anthracycline unless clinically contraindicated.
According to Chen et al. 2016, there were approximately 4.3 million new cancer cases and 2.8 million cancer deaths in China in 2015, with breast cancer as the most common tumor type in Chinese women. It is estimated that in 2015 breast cancer affected 268,600 women and resulted in 69,500 deaths. Targeted therapy, hormone therapy and chemotherapy are three main strategies to treat different types of breast cancer.
Taxanes are the backbone chemotherapy to treat triple negative breast cancer, Her2+ or aggressive estrogen-receptor-positive and/or progesterone-receptor-positive breast cancer patients. ABRAXANE
®
is the only currently approved taxane that does not need pre-medication with dexamethasone to prevent hypersensitivity reactions, and several Phase 3 trials have
18
demonstrated its efficacy and safety compared to solvent-based taxanes in both metastatic breast cancer and neo-adjuvant settings. Unlike other taxanes, ABRAXANE
®
has demonstrated unique and strong efficacy in pancreatic cancer and has become the backbone of first line standard of care for metastatic pancreatic cancer globally.
The taxanes marketed in China include two branded solvent-based paclitaxel (TAXOL
®
and ANZATAX) formulations, one branded docetaxel (TAXOTERE
®
) formulation, one paclitaxel liposome (LIPUSU
®
), one albumin-bound paclitaxel (ABRAXANE
®
) and dozens of generic taxanes. LIPUSU
®
is currently the market leader with approximately one-third of the market share.
In February 2018, an albumin-bound paclitaxel from CSPC Pharmaceutical Group was approved by the NMPA. Another form of albumin-bound paclitaxel from Hengrui was approved by the NMPA in September 2018.
In 2019, we plan to seek to differentiate and defend ABRAXANE
®
against growing generic competition in China, expand our sales force footprint and hospital coverage, and improve patient access through critical illness insurance negotiations and provincial reimbursement listings. As of September 1, 2018, ABRAXANE
®
is listed on provincial reimbursement drug lists of Fujian, Hubei, Ningxia, Jiangsu and Hunan, as well as in critical illness insurance program in Zhejiang and Shandong.
REVLIMID
®
REVLIMID
®
(lenalidomide) is an oral immunomodulatory drug that was approved by the NMPA in China in 2013 for the treatment of multiple myeloma, or MM, in combination with dexamethasone in adult patients who have received at least one prior therapy. On February 2, 2018, REVLIMID® received NMPA approval of a new indication for the treatment of MM in combination with dexamethasone in adult patients with previously untreated MM who are not eligible for transplant.
MM is a malignant disease whose tumor cells originate in plasma cells in the bone marrow, which are cells in which B-lymphocytes develop to the final functional phase. The World Health Organization currently classifies it as a B-cell lymphoma, also known as plasma cell myeloma/plasmacytoma. MM is characterized by abnormal proliferation of bone marrow plasma cells accompanied by overproduction of monoclonal immunoglobulin. MM is often accompanied by multiple osteolytic lesions, hypercalcemia, anemia, and kidney damage. Due to the inhibition of normal immunoglobulin production, patients are prone to a variety of bacterial infections.
At present, MM is one of the most common malignant tumors in the blood system and occurs frequently in the elderly. The actual incidence increases with age, peaking from 60 to 70 years of age. Men suffer slightly more than women. Globally, the incidence was estimated at two to three per 100,000, with a male-to-female ratio of 1.6:1, and most patients are over 40 years old, according to Siegel et al., 2011 and IMS analysis. It is estimated that the incidence rate of MM is approximately one to two per 100,000 people in China, or approximately 18,000 new patients in 2017, out of which 10,000 are in urban populations, according to Lu et al., 2014, IMS analysis, and local market research. With a growing aging population and improving diagnosis, China has seen a steady increase in MM incidence.
Although MM cannot be cured, the progression of the disease can be controlled. The purpose of treatment is to extend patients’ survival and improve quality of life. The main treatments for MM in China include VELCADE
®
, which is a proteasome inhibitor marketed by Johnson & Johnson in China since 2006, generic thalidomide and REVLIMID
®
. VELCADE
®
currently dominates the market in first-line MM treatment in China, while VELCADE
®
and REVLIMID
®
share the market in the second line. Chinese guidelines recommend lenalidomide as a standard of care for the treatment of R/R and newly diagnosed MM as well as in the maintenance setting. The first lenalidomide generic and first bortezomib generic in China were approved in November 2017. Another new agent for R/R MM, NINLARO
®
(ixazomib), an oral proteasome inhibitor developed by Takeda, received marketing approval from the NMPA on April 12, 2018. In February 2018, generic lenalidomide from ShuangLu Pharmaceutical Company was approved by the NMPA, and a third generic from Yangtze River is under review.
REVLIMID
®
was listed on the NRDL in June 2017.
VIDAZA
®
VIDAZA
®
(azacitidine for injection) is a pyrimidine nucleoside analog that has been shown to reverse the effects of DNA hypermethylation and promote subsequent gene re-expression. VIDAZA
®
was approved in China in April 2017 for the treatment of intermediate-2 and high-risk myelodysplastic syndromes, or MDS, chronic myelomonocyte leukemia, or CMML, and acute myeloid leukemia, or AML, with 20% to 30% blasts and multi-lineage dysplasia. In January 2018, VIDAZA® became commercially available in China.
19
MDS are a group of cancers in which immature blood cells in the bone marrow do not mature and therefore do not become healthy blood cells. Approximately seven per 100,000 people are affected with approximately four per 100,000 people newly acquiring the condition each year globally according to Germing et al., 2013. The typical age of onset is 70 years. The higher-risk MDS (intermediate-2 and high-risk MDS) is considered fatal because the median overall survival rate is only 0.4-1.1 years and nearly 30% of these patients progress to AML, according to the U.S. National Comprehensive Cancer Network, or NCCN, MDS guideline 2013 and MDS Foundation. DNA methylation is an important mechanism of epigenetic gene regulation, but aberrant DNA hypermethylation can result in gene silencing. Silencing of tumor suppressor genes promotes cancer development and progression. MDS patients display aberrant DNA methylation of thousands of genes, which increases with advanced disease and is a poor prognostic factor.
In China, the main treatments for intermediate-2 and high-risk MDS are conventional care regimen, or CCR (best supportive care, low-dose cytarabine and intensive chemotherapy), and hypomethylating agents, or HMAs. DACOGEN
®
(decitabine) marketed by Johnson & Johnson was the first HMA agent approved in China in 2009. In the past several years, at least six decitabine generics have become available. In 2017, decitabine was listed in the NRDL. Nevertheless, there are still over 50% of higher-risk MDS patients treated by CCR and the unmet need remains large.
VIDAZA
®
is the only approved HMA shown to prolong survival for patients with MDS. Besides reversing the effects of DNA hypermethylation, VIDAZA
®
inhibits protein synthesis via RNA incorporation. VIDAZA
®
is a Category 1 recommended treatment for patients with intermediate-2 and high-risk MDS, according to the U.S. NCCN guideline. It is also a first-line recommended treatment for patients with intermediate-2 and high-risk MDS, according to the Chinese MDS treatment guidelines, and was listed on the NRDL in October 2018.
Our Preclinical Programs
We have a proprietary cancer biology platform that has also allowed us to develop our clinical-stage drug candidates and several additional preclinical-stage drug candidates in potentially important areas. These currently consist of targeted therapies and immuno-oncology agents. We anticipate advancing one or more of our preclinical assets into the clinic in the next 12 months. We believe we have the opportunity to combine tislelizumab with our preclinical candidates to target multiple points in the cancer immunity cycle. We also may seek to develop companion diagnostics that will help identify patients who are most likely to benefit from the use of our drug candidates.
Manufacturing and Supply
We currently
have manufacturing capabilities at our research and development center in Beijing and at our manufacturing site in Suzhou, China that may be used for process development and clinical-scale small molecule drugs and biologics, as well as commercial scale production of small molecule drugs at our Suzhou facility. We are also constructing a commercial-scale biologics facility in Guangzhou, China. However, we have not yet begun to manufacture or process, either on our own or through a third-party, our drug candidates on a commercial scale. We currently rely on, and expect to continue to rely on, third-party contract research organization, or CROs, and contract manufacturing organizations, or CMOs, for the supply of raw materials and production of our drug candidates, as described below.
Raw Materials
We obtain raw materials for our manufacturing activities from multiple suppliers who we believe have sufficient capacity to meet our demands. Raw materials and starting materials used at our facilities in Beijing and Suzhou include active pharmaceutical ingredients custom-made by our CROs and excipients, which are commercially available from well-known vendors that meet the requirements of the relevant regulatory agencies. The core raw material to be used in manufacturing at our Guangzhou facility under construction is expected to be a genetically modified cell line that we co-developed and licensed from Boehringer Ingelheim.
We typically order raw materials on a purchase order basis and do not enter into long-term dedicated capacity or minimum supply arrangements. We pay for our purchases of raw materials on credit. Credit periods granted to us by our suppliers generally range from 30 to 60 days. Our suppliers are generally not responsible for the defects of our finished products.
Production
We have an approximately 11,000 square meter manufacturing facility in Suzhou, China, where we produce small molecule and biologics drug candidates for clinical supply and which we plan to use for commercial supply of our small molecule drug candidates, if approved. This facility consists of one oral-solid-dosage production line for small molecule drug
20
products and one pilot plant for monoclonal antibody drug substances. In January 2018, the facility received a manufacturing license from the Jiangsu Food and Drug Administration, which is required for the commercial manufacture of zanubrutinib in China following NDA approval.
In addition, we have formed a joint venture with Guangzhou GET Technology Development Co., Ltd., an affiliate of Guangzhou Development District, to build a 24,000-liter commercial-scale biologics manufacturing facility in Guangzhou, China. Approximately US$300 million in funding has been committed for the construction of the 100,000 square meter manufacturing site. We contracted with General Electric to acquire its state-of-the-art KUBio™ prefabricated biomanufacturing equipment and commenced construction in 2017. We expect the first phase of the facility to be completed in 2019, and, following regulatory inspection and approval, to be used for commercial-scale production of tislelizumab, if approved.
We also have an approximately 140-square meter manufacturing facility at our research and development facilities in Beijing, China, which produces preclinical and clinical trial materials for some of our small molecule drug candidates.
Manufacturing is subject to extensive regulations that impose various procedural and documentation requirements governing recordkeeping, manufacturing processes and controls, personnel, quality control and quality assurance, among others. Our manufacturing facilities and the CMOs we use to manufacture our drugs and drug candidates operate under current good manufacturing practice regulations, or cGMP conditions. cGMP are regulatory requirements for the production of pharmaceuticals that will be used in humans.
Contract Manufacturing Organizations
We outsource to a limited number of external contract manufacturers the production of some drug substances and drug products, and we expect to continue to do so to meet the preclinical, clinical and potential commercial requirements of our drugs and drug candidates. We have adopted procedures to ensure that the production qualifications, facilities and processes of our third-party outsourced suppliers comply with the relevant regulatory requirements and our internal guidelines. We select our third-party suppliers carefully by considering a number of factors, including their qualifications, relevant expertise, production capacity, geographic proximity, reputation, track record, product quality, reliability in meeting delivery schedules, and terms offered by such third-party outsourced suppliers.
We have framework agreements with most of our external service providers, under which they generally provide services to us on a short-term and project-by-project basis. For example, we have an agreement with a contract manufacturer for clinical supply of zanubrutinib and expect to enter into a commercial supply agreement for zanubrutinib in the future. We have entered into a commercial supply agreement with Boehringer Ingelheim Biopharmaceuticals (China) Ltd., or Boehringer Ingelheim, for our investigational anti-PD-1 antibody therapy, tislelizumab, which will be manufactured at Boehringer Ingelheim’s facility in Shanghai, China as part of a marketing authorization holder, or MAH, trial project pioneered by us and Boehringer Ingelheim. We believe the MAH status will be maintained after the expiration of the MAH pilot program in November 2019, based on confirmation from the relevant governmental authority, and therefore we believe that the expiration of the MAH pilot program will not impact our drug candidates. Under the terms of the commercial supply agreement, Boehringer Ingelheim will manufacture tislelizumab in China under an exclusive multi-year arrangement, with contract extension possible. In addition, we obtained certain preferred rights for future capacity expansion by Boehringer Ingelheim in China. For our commercial products licensed from Celgene, we rely on Celgene and its contract manufacturers outside of China for the supply of those drugs.
Agreements with outsourced suppliers generally set out terms, including product quality or service details, technical standards or methods, delivery terms, agreed price and payment, and product inspection and acceptance criteria. We are generally allowed to return any products that fail to meet our quality standards. Our outsourced suppliers procure raw materials themselves. Typically, outsourced suppliers request settlement of payment within 30 days from the date of invoice. Either party may terminate the agreements by serving notice to the other party under certain circumstances.
Celgene Collaboration
Exclusive License and Collaboration Agreement
On July 5, 2017, we entered into an Exclusive License and Collaboration Agreement, as amended and restated, with Celgene and its wholly-owned subsidiary, Celgene Switzerland LLC, or Celgene Switzerland, which became effective on August 31, 2017, pursuant to which we granted the Celgene parties an exclusive right to develop and commercialize tislelizumab in all fields of treatment, other than hematology, in the United States, Europe, Japan and the rest of world other than Asia, which we refer to as the PD-1 License Agreement.
21
Pursuant to the terms of the PD-1 License Agreement, the Celgene parties made upfront payments of US$263 million to us. In addition, pursuant to a share subscription agreement with Celgene Switzerland dated July 5, 2017, or the Share Subscription Agreement, we issued approximately 32.7 million of our ordinary shares on August 31, 2017 for an aggregate purchase price of US$150 million at $4.58 per ordinary share, or $59.55 per ADS, representing a 35% premium to an 11-day volume-weighted average price of our ADSs. The agreement also provides for up to US$980 million in potential development, regulatory and sales milestone payments and tiered royalties based on percentages of annual net sales, depending on specified terms, in the low double digit to mid-twenties, with customary reductions in specified circumstances. Royalties are payable on a licensed product-by-product and country-by-country basis until the latest of the expiration of the last valid patent claim, the expiration of regulatory exclusivity, or 12 years after the first commercial sale of such licensed product in the country of sale.
Each party has the right to develop and commercialize tislelizumab in its respective field and territory, and has also agreed to collaborate through a joint steering committee comprised of an equal number of representatives from each party on, among other things, the conduct of up to eight global pivotal clinical trials, or the Basket Studies. Each Basket Study will be conducted and funded by either us or Celgene in accordance with a mutually agreed development plan and study design. For any Basket Studies conducted and funded by us, Celgene has the right to opt into such program, at which time it will reimburse us for agreed upon development costs based on a multiple of such costs that varies according to the stage of development at which Celgene opts into the program. Celgene has committed to use commercially reasonable efforts to develop at least one licensed product, to seek specified regulatory approvals and to spend at least US$100 million on development for the Basket Studies led by Celgene, subject to specified conditions. In addition, we retain the right to develop tislelizumab in combination therapies with our portfolio compounds, and Celgene has a right of first negotiation for tislelizumab in the hematology field and in our territory, subject to specified conditions.
The PD-1 License Agreement contains customary representations, warranties and covenants by us and Celgene. Unless earlier terminated, the agreement will expire on a licensed product-by-product and country-by-country basis upon the expiration of the royalty term in such country for such licensed product. The agreement may be terminated by Celgene upon 30 days’ prior written notice, or by either party upon the other party’s bankruptcy or uncured material breach. In addition, the agreement includes standard exclusivity obligations and provisions that are triggered in the event that Celgene acquires or is acquired by a third party with a competing product.
In January 2019, Celgene and Bristol-Myers Squibb, or BMS, announced the proposed acquisition of Celgene by BMS, which is expected to close in the third quarter of 2019, subject to receipt of required approvals. BMS markets the anti-PD-1 inhibitor OPDIVO
®
(nivolumab). Assuming that the BMS-Celgene transaction closes, we expect that a likely outcome will be that the PD-1 License Agreement will be terminated under the exclusivity and related provisions, and we will regain the full rights to tislelizumab with a termination fee from Celgene. Prior to that time, we expect to continue to conduct the agreed upon development plans under the existing terms of the agreement, including receipt from Celgene of development funding for the Basket Studies that it has agreed to fund. In the event that the PD-1 License Agreement is terminated, we believe that we are operationally and financially capable of continuing to advance tislelizumab on our own with minimal disruption.
Celgene China Agreements
On July 5, 2017, we and a wholly-owned subsidiary of Celgene, Celgene Logistics Sàrl, or Celgene Logistics, entered into a License and Supply Agreement, which we refer to as the China License Agreement and which became effective on August 31, 2017, pursuant to which we were granted the right to exclusively distribute and promote Celgene’s approved cancer therapies, ABRAXANE
®
, REVLIMID
®
and VIDAZA
®
, and its investigational agent avadomide (CC-122) in clinical development in China, excluding Hong Kong, Macau and Taiwan. In addition, if Celgene decides to commercialize a new oncology product through a third-party in the licensed territory during the first five years of the term, we have a right of first negotiation to obtain the right to commercialize the product, subject to certain conditions. We paid an aggregate of US$4.5 million in cash for the license and our acquisition of Celgene Shanghai, as described below.
The term of the China License Agreement is 10 years and may be terminated by either party upon written notice in the event of uncured material breach or bankruptcy of the other party, or if the underlying regulatory approvals for the covered products are revoked. Celgene Logistics also has the right to terminate the agreement with respect to REVLIMID
®
at any time upon written notice to the Company under certain circumstances.
In the event of an acquisition of Celgene Logistics by another party, the China License Agreement provides that Celgene Logistics shall provide notice to us, and within a specified period of time, requires that the parties discuss in good faith any changes in the supply requirements of the China License Agreement that Celgene Logistics may request as a result of the acquisition. During that period, the China License Agreement requires us to conduct business in the ordinary course and provides that Celgene Logistics is not required to supply more than a specified amount more than the amount of our forecasted
22
demand. We expect to be able to continue to market ABRAXANE
®
, REVLIMID
®
and VIDAZA
®
in China under the China License Agreement following the closing of the announced BMS acquisition of Celgene, if that transaction occurs.
The China License Agreement contains customary representations and warranties and confidentiality and mutual indemnification provisions.
On August 31, 2017, our wholly owned subsidiary, BeiGene (Hong Kong) Co., Ltd., acquired 100% of the equity interests of Celgene Pharmaceutical (Shanghai) Co., Ltd., or Celgene Shanghai, a wholly-owned subsidiary of Celgene Holdings East Corporation established under the laws of China. The purchase price of Celgene Shanghai was determined to be approximately US$28.1 million from an accounting perspective, and comprised of a cash consideration of US$4.5 million and non-cash consideration of US$23.6 million. The amount allocated to non-cash consideration, related to the discount on ordinary shares issued to Celgene in connection with the Share Subscription Agreement and was a result of the increase in fair value of our shares between the fixed price of US$59.55 per ADS specified in the Share Subscription Agreement and the fair value per ADS on August 31, 2017, the date the transaction closed. This company, which we subsequently renamed BeiGene Pharmaceutical (Shanghai) Co., Ltd., is in the business of, among other things, providing marketing and promotional services for the pharmaceutical products that we license from Celgene. Prior to closing, Celgene separated out certain business functions, including regulatory and drug safety, that continue to support the business acquired by us.
Intellectual Property
The proprietary nature of, and protection for, our drug candidates and their methods of use are an important part of our strategy to develop and commercialize novel medicines, as described in more detail below. We have obtained patents and filed patent applications in the United States and other countries and regions, such as China and Europe, relating to certain of our drug candidates, and are pursuing additional patent protection for them and for our other drug candidates and technologies. We rely on trade secrets to protect aspects of our business that are not amenable to, or that we do not consider appropriate for, patent protection including our manufacturing processes. We also rely on know-how, continuing technological innovation and in-licensing opportunities to develop, strengthen and support our development programs.
As of February 11, 2019, we owned 18 issued U.S. patents, 10 issued China patents, a number of pending U.S. and China patent applications, and corresponding patents and patent applications internationally. In addition, we owned pending international patent applications under the Patent Cooperation Treaty, or PCT, which we plan to file nationally in the United States and other jurisdictions, as well as additional priority PCT applications. With respect to any issued patents in the United States and Europe, we may be entitled to obtain a patent term extension to extend the patent expiration date, provided that we meet the applicable requirements for obtaining such patent term extensions. For example, in the United States, we can apply for a patent term extension of up to five years for one of the patents covering a drug product once the product is approved by the FDA. The exact duration of the extension depends on the time that we spend in clinical studies as well as getting approval from the FDA.
The patent portfolios for our later-stage clinical drug candidates as of February 11, 2019, are summarized below:
Zanubrutinib
.
We own two issued U.S. patents, one issued China patent, a number of pending PCT and U.S. patent applications, and corresponding patent applications in other jurisdictions directed to zanubrutinib, a small molecule BTK inhibitor, combinations of zanubrutinib with other therapeutic agents, and its use for the treatment of hematological malignancies or autoimmune disease. The expected expiration for the issued U.S. patents and the issued China patent is 2034, excluding any additional term for patent term extensions. We intend to pursue marketing exclusivity periods that are available under regulatory provisions in certain countries
.
Tislelizumab
.
We own three issued U.S. patents, one issued China patent, pending PCT, U.S. and China patent applications, and corresponding pending patent applications in other jurisdictions directed to tislelizumab, a humanized monoclonal antibody against PD-1, and its use for the treatment of cancer. The expected expiration for the issued U.S. patents and the issued China patent is 2033, excluding any additional term for patent term extensions. We intend to pursue marketing exclusivity periods that are available under regulatory provisions in certain countries.
Pamiparib
.
We own three issued U.S. patents, one issued China patent, a number of pending PCT, U.S. and China patent applications, and corresponding pending patent applications in other jurisdictions directed to pamiparib, a small molecule PARP1/2 inhibitor, and its use for the treatment of cancer, including glioblastomas and breast cancer. The expected expiration for the issued U.S. patents and the issued China patent is 2031, excluding any additional term for patent term extensions. We intend to pursue marketing exclusivity periods that are available under regulatory provisions in certain countries.
23
Lifirafenib
.
We own two issued U.S. patents, two issued China patents, a number of pending PCT, U.S. and China patent applications, and corresponding pending patent applications in other jurisdictions directed to lifirafenib, a small molecule BRAF inhibitor, and its use for the treatment of cancer, including BRAF mutated cancers. The expected expiration for the issued U.S. patents and the issued China patents is 2031, excluding any additional term for patent term extensions. We intend to pursue marketing exclusivity periods that are available under regulatory provisions in certain countries.
The patent portfolios for our three in-licensed commercial products in China are summarized below:
ABRAXANE
®
.
We are the exclusive licensee of five issued Chinese patents and a number of pending Chinese patent applications directed to ABRAXANE
®
, a nanoparticle albumin-bound paclitaxel, covering its composition, liquid formulation, and use for the treatment of cancer. Two of the five issued Chinese patents expired in 2018. The expected expirations for the other three issued Chinese patents are 2021, 2026 and 2031, respectively, excluding any additional term for patent term extensions. However, generic versions of albumin-bound palclitaxel have been approved in China and are being commercialized.
REVLIMID
®
.
We are the exclusive licensee of seven issued Chinese patents directed to REVLIMID
®
(lenalidomide), covering its use for the treatment of cancer, including MM. The expected expirations for the issued Chinese patents are 2023 and 2027, respectively, excluding any additional term for patent term extensions. However, generic versions of lenalidomide have been approved in China and are being commercialized.
VIDAZA
®
.
We do not have any rights in any issued China patent or pending China patent applications directed to VIDAZA
®
, a chemical analog of cytidine, and its use for the treatment of cancer. We are aware of third parties who are seeking to develop and obtain approval for generic forms of this drug.
Furthermore, although various extensions may be available, the life of a patent and the protection it affords, is limited. As noted above, ABRAXANE
®
, REVLIMID
®
and VIDAZA
®
face or are expected to face competition from generic medications, and we may face similar competition for any approved drug candidates even if we successfully obtain patent protection once the patent life has expired for the drug. The scope, validity or enforceability of our patents may be challenged in court, and we may not be successful in enforcing or defending those intellectual property rights and, as a result, may not be able to develop or market the relevant product exclusively, which would have a material adverse effect on any potential sales of that product. Under our license agreement with Celgene, Celgene retains the responsibility for, but is not obligated, to prosecute, defend and enforce the patents for these in-licensed products. As such, any issued patents may not protect us from generic competition for these drugs.
The term of individual patents may vary based on the countries in which they are obtained. In most countries in which we file, including the United States and China, the term of an issued patent is generally 20 years from the earliest claimed filing date of a non-provisional patent application in the applicable country. In the United States, a patent’s term may be lengthened in some cases by a patent term adjustment, which extends the term of a patent to account for administrative delays by the United States Patent and Trademark Office, or USPTO, in excess of a patent applicant’s own delays during the prosecution process, or may be shortened if a patent is terminally disclaimed over a commonly owned patent having an earlier expiration date. In addition, in certain instances, a patent term can be extended to recapture a portion of the term effectively lost as a result of the FDA regulatory review period. However, the restoration period cannot be longer than five years and the total patent term including the restoration period must not exceed 14 years following FDA approval.
In certain foreign jurisdictions similar extensions as compensation for regulatory delays are also available. The actual protection afforded by a patent varies on a claim by claim and country by country basis and depends upon many factors, including the type of patent, the scope of its coverage, the availability of any patent term extensions or adjustments, the availability of legal remedies in a particular country and the validity and enforceability of the patent.
We may rely, in some circumstances, on trade secrets and unpatented know-how to protect aspects of our technology. We seek to protect our proprietary technology and processes, in part, by entering into confidentiality agreements with employees, consultants, scientific advisors and contractors and invention assignment agreements with our employees. We also seek to preserve the integrity and confidentiality of our data and trade secrets by maintaining physical security of our premises and physical and electronic security of our information technology systems.
Additionally, we currently own a number of registered trademarks and pending trademark applications. We currently have registered trademarks for BeiGene and our corporate logo in China, the European Union and other jurisdictions and are seeking trademark protection for BeiGene, our corporate logo, product names and logos, and other marks in the United States and other countries where available and appropriate.
24
Government Regulation
Government authorities in the United States at the federal, state and local level and in other countries extensively regulate, among other things, the research and clinical development, testing, manufacture, quality control, approval, labeling, packaging, storage, record-keeping, promotion, advertising, distribution, post-approval monitoring and reporting, marketing, pricing and export and import of drugs such as those we are developing and commercializing. Generally, before a new drug can be marketed, considerable data demonstrating its quality, safety and efficacy must be obtained, organized into a format specific to each regulatory authority, submitted for review and approved by the regulatory authority.
U.S. Regulation
U.S. Government Regulation and Product Approval
In the United States, the FDA regulates drugs under the Federal Food, Drug, and Cosmetic Act, or FDCA, and its implementing regulations, and biologics under the FDCA, its implementing regulations, and the Public Health Service Act, or PHSA, and its implementing regulations.
Cancer therapies are sometimes characterized as first line, second line or third line, and the FDA often approves new therapies initially only for second or third line use. When cancer is detected early enough, first line therapy is sometimes adequate to cure the cancer or prolong life without a cure. Whenever first line therapy, usually chemotherapy, hormone therapy, surgery or a combination of these, proves unsuccessful, second line therapy may be administered. Second line therapies often consist of more chemotherapy, radiation, antibody drugs, tumor targeted small molecule drugs or a combination of these. Third line therapies can include bone marrow transplantation, antibody and small molecule targeted therapies, more invasive forms of surgery and new technologies.
U.S. Drug Development Process
The process required by the FDA before a drug or biologic may be marketed in the United States generally involves the following:
|
•
|
completion of preclinical laboratory tests, animal studies and formulation studies according to Good Laboratory Practices, or GLP, regulations;
|
|
•
|
submission to the FDA of an investigational new drug, or IND, application, which must become effective before human clinical trials may begin;
|
|
•
|
performance of adequate and well-controlled human clinical trials according to GCP, to establish the safety and efficacy of the proposed drug or safety, purity and potency of the proposed biologic, for the intended use;
|
|
•
|
preparation and submission to the FDA of an NDA for a drug or a BLA for a biologic;
|
|
•
|
a determination by the FDA within 60 days of its receipt of an NDA or BLA to file the application for review;
|
|
•
|
satisfactory completion of an FDA inspection of the manufacturing facility or facilities at which the product, or components thereof, are produced to assess compliance with cGMP;
|
|
•
|
FDA audits of some clinical trial sites to ensure compliance with GCPs; and
|
|
•
|
FDA review and approval of the NDA or licensing of the BLA.
|
Once a product candidate is identified for development, it enters the preclinical testing stage. Preclinical tests include laboratory evaluations of product chemistry, toxicity, formulation and stability, as well as animal studies. An IND sponsor must submit the results of the preclinical tests, together with manufacturing information, analytical data and any available clinical data or literature, to the FDA as part of the IND. The sponsor must also include a protocol detailing, among other things, the objectives of the initial clinical trial, dosing procedures, subject selection and exclusion criteria, the parameters to be used in monitoring safety and the effectiveness criteria to be evaluated if the initial clinical trial lends itself to an efficacy evaluation. Some preclinical testing may continue even after the IND is submitted. The IND automatically becomes effective 30 days after receipt by the FDA, unless the FDA raises concerns or questions related to the proposed clinical trial and places the trial on a clinical hold within that 30-day time period. In such a case, the IND sponsor and the FDA must resolve any outstanding
25
concerns before the clinical trial can begin. Clinical holds also may be imposed by the FDA at any time before or during clinical trials due to safety concerns or noncompliance and may be imposed on all products within a certain class of products. The FDA also can impose partial clinical holds, for example, prohibiting the initiation of clinical trials of a certain duration or for a certain dose.
All clinical trials must be conducted under the supervision of one or more qualified investigators in accordance with GCP regulations. These regulations include the requirement that all research subjects provide informed consent in writing before their participation in any clinical trial. Further, an institutional review board, or IRB, must review and approve the plan for any clinical trial before it commences at any institution, and the IRB must conduct continuing review and reapprove the study at least annually. An IRB considers, among other things, whether the risks to individuals participating in the clinical trial are minimized and are reasonable in relation to anticipated benefits. The IRB also approves the information regarding the clinical trial and the consent form that must be provided to each clinical trial subject or his or her legal representative and must monitor the clinical trial until completed.
Each new clinical protocol and any amendments to the protocol must be filed with the FDA as an IND amendment and submitted to the IRBs for approval.
Human clinical trials are typically conducted in three sequential phases that may overlap or be combined:
|
•
|
Phase 1.
The product is initially introduced into a small number of healthy human subjects or patients and tested for safety, dosage tolerance, absorption, metabolism, distribution and excretion and, if possible, to gain early evidence on effectiveness. In the case of some products for severe or life-threatening diseases, especially when the product is suspected or known to be unavoidably toxic, the initial human testing may be conducted in patients.
|
|
•
|
Phase 2.
Involves clinical trials in a limited patient population to identify possible adverse effects and safety risks, to preliminarily evaluate the efficacy of the product for specific targeted diseases and to determine dosage tolerance and optimal dosage and schedule.
|
|
•
|
Phase 3.
Clinical trials are undertaken to further evaluate dosage, clinical efficacy and safety in an expanded patient population. These clinical trials are intended to evaluate the overall risk/benefit relationship of the product and provide an adequate basis for product labeling.
|
We refer to our Phase 1 programs as dose-escalation and dose-expansion trials. In addition, we refer to some of our Phase 2 programs as pivotal or registrational programs, where the results can be used to support regulatory approval in specific jurisdictions without the need to conduct a Phase 3 trial.
Progress reports detailing the results of the clinical trials must be submitted at least annually to the FDA and safety reports must be submitted to the FDA and the investigators for serious and unexpected suspected AEs, any clinically important increase in the rate of a serious suspected adverse reaction over that listed in the protocol or investigator’s brochure, or any findings from other studies or animal or in vitro testing that suggest a significant risk in humans exposed to the product drug. Phase 1, Phase 2 and Phase 3 studies may not be completed successfully within any specified period, or at all. The FDA or the sponsor may suspend or terminate a clinical trial at any time on various grounds, including a finding that the research subjects or patients are being exposed to an unacceptable health risk. Similarly, an IRB can suspend or terminate approval of a clinical trial at its institution if the clinical trial is not being conducted in accordance with the IRB’s requirements or if the product has been associated with unexpected serious harm to subjects.
Concurrent with clinical trials, companies usually complete additional animal studies and must also develop additional information about the chemistry and physical characteristics of the product and finalize a process for manufacturing the product in commercial quantities in accordance with cGMP requirements. The manufacturing process must be capable of consistently producing quality batches of the product and, among other things, the manufacturer must develop methods for testing the identity, strength, quality and purity of the final product. Additionally, appropriate packaging must be selected and tested, and stability studies must be conducted to demonstrate that the product does not undergo unacceptable deterioration over its shelf life.
U.S. Review and Approval Processes
The results of product development, preclinical studies and clinical trials, along with descriptions of the manufacturing process, analytical tests conducted on the product, proposed labeling and other relevant information, are submitted to the FDA as part of an NDA for a new drug or a BLA for a biologic, requesting approval to market the product. The submission of an
26
NDA or BLA is subject to the payment of a substantial user fee; although a waiver of such fee may be obtained under certain limited circumstances. The sponsor of an approved NDA or BLA is also subject to an annual prescription drug product program fee.
The FDA reviews all NDAs and BLAs submitted to ensure that they are sufficiently complete for substantive review before it accepts them for filing. The FDA may request additional information rather than accept an NDA or BLA for filing. In this event, the NDA or BLA must be re-submitted with the additional information. The re-submitted application also is subject to review before the FDA accepts it for filing. Once the submission is accepted for filing, the FDA begins an in-depth substantive review. The FDA reviews an NDA to determine, among other things, whether a product is safe and effective for its intended use, and a BLA to determine whether the biologic is safe, pure, and potent for its intended use. The FDA also evaluates whether the product’s manufacturing is cGMP-compliant to assure the product’s identity, strength, quality and purity. Before approving an NDA or BLA, the FDA typically will inspect the facility or facilities where the product is or will be manufactured. The FDA will not approve an application unless it determines that the manufacturing processes and facilities are in compliance with cGMP requirements and adequate to assure consistent production of the product within required specifications.
The approval process is lengthy and difficult, and the FDA may refuse to approve an NDA or BLA if the applicable regulatory criteria are not satisfied or may require additional clinical data or other data and information. Even if such data and information are submitted, the FDA may ultimately decide that the NDA or BLA does not satisfy the criteria for approval. Data obtained from clinical trials are not always conclusive, and the FDA may interpret data differently than we interpret the same data. The FDA will issue a complete response letter if the agency decides not to approve the NDA or BLA in its present form. The complete response letter usually describes all of the specific deficiencies that the FDA identified in the NDA or BLA that must be satisfactorily addressed before it can be approved. The deficiencies identified may be minor, for example, requiring labeling changes, or major, for example, requiring additional clinical trials. Additionally, the complete response letter may include recommended actions that the applicant might take to place the application in a condition for approval. If a complete response letter is issued, the applicant may either resubmit the NDA or BLA, addressing all of the deficiencies identified in the letter, or withdraw the application or request an opportunity for a hearing.
If a product receives regulatory approval, the approval may be significantly limited to specific diseases and dosages or the indications for use may otherwise be limited, which could restrict the commercial value of the product. Further, the FDA may require that certain contraindications, warnings or precautions be included in the product labeling. In addition, the FDA may require post-approval studies, including Phase 4 clinical trials, to further assess a product’s safety and effectiveness after NDA or BLA approval and may require testing and surveillance programs to monitor the safety of approved products that have been commercialized. The FDA may also approve an NDA or BLA with a Risk Evaluation and Mitigation Strategy, or REMS, plan to mitigate risks, which could include medication guides, physician communication plans, or elements to assure safe use, such as restricted distribution methods, patient registries and other risk minimization tools.
Regulation of Combination Products in the United States
Certain products may be comprised of components that would normally be regulated under different types of regulatory authorities in certain jurisdictions, and in the United States by different centers at the FDA. These products are known as combination products. Under the FDCA, the FDA is charged with assigning a center with primary jurisdiction, or a lead center, for review of a combination product. That determination is based on the “primary mode of action” of the combination product. We are developing combination products using our own drug candidates and third-party drugs.
Expedited Programs
Fast Track Designation
The FDA has a fast track program that is intended to expedite or facilitate the process for reviewing new drugs, including biologics that meet certain criteria. Specifically, new drugs are eligible for Fast Track designation if they are intended to treat a serious or life-threatening disease or condition for which there is no effective treatment and demonstrate the potential to address unmet medical needs for the condition. Fast track designation applies to the combination of the product and the specific indication for which it is being studied. The sponsor of a new drug may request the FDA to designate the drug as a fast track product concurrently with, or at any time after, submission of an IND, and the FDA must determine if the drug candidate qualifies for fast track designation within 60 days of receipt of the sponsor’s request.
In addition to other benefits, such as the ability to engage in more frequent interactions with the FDA, the FDA may initiate review of sections of a fast track drug’s NDA or BLA before the application is complete. This rolling review is available
27
if the applicant provides, and the FDA approves, a schedule for the submission of each portion of the NDA or BLA and the applicant pays the applicable user fee. However, the FDA’s time period goal for reviewing an application does not begin until the last section of the NDA or BLA is submitted. Additionally, the fast track designation may be withdrawn by the FDA if the FDA believes that the designation is no longer supported by data emerging in the clinical trial process.
Accelerated Approval
Under FDA’s accelerated approval regulations, the FDA may approve a drug, including a biologic, for a serious or life-threatening illness that provides meaningful therapeutic benefit to patients over existing treatments based upon a surrogate endpoint that is reasonably likely to predict clinical benefit, or on a clinical endpoint that can be measured earlier than irreversible morbidity or mortality, that is reasonably likely to predict an effect on irreversible morbidity or mortality or other clinical benefit, taking into account the severity, rarity, or prevalence of the condition and the availability or lack of alternative treatments. In clinical trials, a surrogate endpoint is a marker, such as a laboratory measurement or clinical signs of a disease or condition that is thought to predict clinical benefit but is not itself a measure of clinical benefit. Surrogate endpoints can often be measured more easily or more rapidly than clinical endpoints. A drug candidate approved on this basis is subject to rigorous post-marketing compliance requirements, including the completion of post-approval clinical trials sometimes referred to as Phase 4 trials to confirm the effect on the clinical endpoint. Failure to conduct required post-approval studies, or to confirm a clinical benefit during post-marketing studies, will allow the FDA to withdraw the drug from the market on an expedited basis. All promotional materials for drug candidates approved under accelerated regulations are subject to prior review by the FDA.
Breakthrough Designation
Breakthrough therapy designation is intended to expedite the development and review of a breakthrough therapy. A drug or biologic product can be designated as a breakthrough therapy if it is intended to treat a serious or life-threatening disease or condition and preliminary clinical evidence indicates that it may demonstrate substantial improvement over existing therapies on one or more clinically significant endpoints. A sponsor may request that a product be designated as a breakthrough therapy concurrently with, or at any time after, the submission of an IND, and the FDA must determine if the candidate qualifies for breakthrough therapy designation within 60 days of receipt of the sponsor’s request. If so designated, the FDA shall act to expedite the development and review of the product’s marketing application, including by meeting with the sponsor throughout the product’s development, providing timely advice to the sponsor to ensure that the development program to gather preclinical and clinical data is as efficient as practicable, involving senior managers and experienced review staff in a cross-disciplinary review, and assigning a cross-disciplinary project lead for the FDA review team to facilitate an efficient review of the development program and to serve as a scientific liaison between the review team and the sponsor. The designation may be rescinded if the drug candidate does not continue to meet the criteria for breakthrough therapy designation.
Priority Review
The FDA may grant an NDA for a new molecular entity or BLA a priority review designation, which sets the target date for FDA action on the application at six months after the FDA accepts the application for filing. Priority review is granted where there is evidence that the proposed product would be a significant improvement in the safety or effectiveness of the treatment, diagnosis, or prevention of a serious condition. If criteria are not met for priority review, the application is subject to the standard FDA review period of ten months after FDA accepts the application for filing. Priority review designation does not change the scientific/medical standard for approval or the quality of evidence necessary to support approval.
Post-Approval Requirements
Any products for which we receive FDA approval are subject to continuing regulation by the FDA, including, among other things, record-keeping requirements, reporting of adverse experiences with the product, providing the FDA with updated safety and efficacy information, product sampling and distribution requirements, complying with certain electronic records and signature requirements and complying with FDA promotion and advertising requirements. The FDA strictly regulates labeling, advertising, promotion and other types of information on products that are placed on the market. Products may be promoted only for the approved indications and in accordance with the provisions of the approved label. Further, manufacturers must continue to comply with cGMP requirements, which are extensive and require considerable time, resources and ongoing investment to ensure compliance. In addition, changes to the manufacturing process generally require prior FDA approval before being implemented and other types of changes to the approved product, such as adding new indications and additional labeling claims, are also subject to further FDA review and approval.
Manufacturers and other entities involved in the manufacturing and distribution of approved products are required to register their establishments with the FDA and certain state agencies and are subject to periodic unannounced inspections by
28
the FDA and certain state agencies for compliance with cGMP and other laws. The cGMP requirements apply to all stages of the manufacturing process, including the production, processing, sterilization, packaging, labeling, storage and shipment of the product. Manufacturers must establish validated systems to ensure that products meet specifications and regulatory requirements and test each product batch or lot prior to its release.
The FDA may withdraw a product approval or revoke a biologics license if compliance with regulatory requirements is not maintained or if problems occur after the product reaches the market. Later discovery of previously unknown problems with a product may result in restrictions on the product or even complete withdrawal of the product from the market. Further, the failure to maintain compliance with regulatory requirements may result in administrative or judicial actions, such as fines, untitled or warning letters, holds on clinical trials, product seizures, product detention or refusal to permit the import or export of products, refusal to approve pending applications or supplements, restrictions on marketing or manufacturing, injunctions or civil or criminal penalties. We may undertake or be required to undertake a product recall.
Patent Term Restoration and Marketing Exclusivity
Depending upon the timing, duration and specifics of FDA approval of the use of our drug candidates, some of our U.S. patents may be eligible for limited patent term extension under the Drug Price Competition and Patent Term Restoration Act of 1984, commonly referred to as the Hatch-Waxman Amendments. The Hatch-Waxman Amendments permit a patent restoration term of up to five years as compensation for patent term lost during product development and the FDA regulatory review process. However, patent term restoration cannot extend the remaining term of a patent beyond a total of 14 years from the product’s approval date. The patent term restoration period is generally one-half the time between the effective date of an IND and the submission date of an NDA or BLA plus the time between the submission date of an NDA or BLA and the approval of that application, except that this review period is reduced by any time during which the applicant failed to exercise due diligence. Only one patent applicable to an approved product is eligible for the extension and the application for the extension must be submitted prior to the expiration of the patent. The USPTO, in consultation with the FDA, reviews and approves the application for any patent term extension or restoration. In the future, if available, we intend to apply for restorations of patent term for some of our currently owned patents beyond their current expiration dates, depending on the expected length of the clinical trials and other factors involved in the filing of the relevant NDA or BLA; however, there can be no assurance that any such extension will be granted to us.
Market exclusivity provisions under the FDCA can also delay the submission or the approval of certain applications. The FDCA provides a five-year period of non-patent marketing exclusivity within the United States to the first applicant to gain approval of an NDA for a new chemical entity. A drug is a new chemical entity if the FDA has not previously approved any other new drug containing the same active moiety, which is the molecule or ion responsible for the action of the drug substance. During the exclusivity period, the FDA may not accept for review an abbreviated NDA, or ANDA, or a 505(b)(2) NDA submitted by another company for another version of such drug where the applicant does not own or have a legal right of reference to all the data required for approval. However, such an application may be submitted after four years if it contains a certification of patent invalidity or non-infringement. The FDCA also provides three years of marketing exclusivity for an NDA, 505(b)(2) NDA or supplement to an existing NDA if new clinical investigations, other than bioavailability studies, that were conducted or sponsored by the applicant are deemed by the FDA to be essential to the approval of the application, for example, for new indications, dosages or strengths of an existing drug. This three-year exclusivity covers only the conditions of use associated with the new clinical investigations and does not prohibit the FDA from approving ANDAs for drugs containing the original active agent. Five-year and three-year exclusivity will not delay the submission or approval of a full NDA. However, an applicant submitting a full NDA would be required to conduct or obtain a right of reference to all of the preclinical studies and adequate and well-controlled clinical trials necessary to demonstrate safety and effectiveness.
Pediatric exclusivity is another type of exclusivity in the United States. Pediatric exclusivity, if granted, provides an additional six months of exclusivity, which runs from the end of other exclusivity or patent periods.
Biosimilars and Exclusivity
The PHSA includes an abbreviated approval pathway for biological products shown to be similar to, or interchangeable with, an FDA-licensed reference biological product. Biosimilarity, which requires that there be no clinically meaningful differences between the biological product and the reference product in terms of safety, purity and potency, can be shown through analytical studies, animal studies, and a clinical trial or trials. Interchangeability requires that a product is biosimilar to the reference product and the product must demonstrate that it can be expected to produce the same clinical results as the reference product and, for products administered multiple times, the biologic and the reference biologic may be switched after one has been previously administered without increasing safety risks or risks of diminished efficacy relative to exclusive use of the reference biologic.
29
A reference biologic is granted 12 years of exclusivity from the time of first licensure of the reference product. The first biologic product submitted under the abbreviated approval pathway that is determined to be interchangeable with the reference product has exclusivity against other biologics submitting under the abbreviated approval pathway for the lesser of (i) one year after the first commercial marketing, (ii) 18 months after approval if there is no legal challenge, (iii) 18 months after the resolution in the applicant’s favor of a lawsuit challenging the biologic’s patents if an application has been submitted, or (iv) 42 months after the application has been approved if a lawsuit is ongoing within the 42-month period.
Orphan Drugs
Under the Orphan Drug Act, the FDA may grant orphan drug designation, or ODD, to drugs, including biologics, intended to treat a rare disease or condition-generally a disease or condition that affects fewer than 200,000 individuals in the United States or that affects more than 200,000 individuals in the U.S. and for which there is no reasonable expectation that costs of research and development of the product for the indication can be recovered by sales of the product in the United States. Orphan drug designation must be requested before submitting an NDA or BLA.
After the FDA grants orphan drug designation, the generic identity of the drug or biologic and its potential orphan use are disclosed publicly by the FDA. Orphan drug designation does not convey any advantage in, or shorten the duration of, the regulatory review and approval process. The first NDA or BLA applicant to receive FDA approval for a particular active ingredient to treat a particular disease or condition with FDA orphan drug designation is entitled to a seven-year exclusive marketing period in the United States for that product, for that indication. Among the other benefits of orphan drug designation are tax credits for certain research and a waiver of the NDA or BLA application user fee.
During the exclusivity period, the FDA may not approve any other applications to market the same drug for the same disease or condition, except in limited circumstances, such as if the second applicant demonstrates the clinical superiority of its product to the product with orphan drug exclusivity through a demonstration of superior safety, superior efficacy, or a major contribution to patient care. “Same drug” means a drug that contains the same active moiety if it is a drug composed of small molecules, or the same principal molecular structural features if it is composed of macromolecules and is intended for the same use as a previously approved drug, except that if the subsequent drug can be shown to be clinically superior to the first drug, it will not be considered to be the same drug. Orphan drug exclusivity does not prevent the FDA from approving a different drug for the same disease or condition, or the same drug for a different disease or condition.
Zanubrutinib was granted ODD status by the FDA for the treatment of WM, CLL and MCL on June 29, 2016, July 20, 2016, and June 23, 2016, respectively.
Disclosure of Clinical Trial Information
Sponsors of clinical trials of FDA-regulated products, including drugs and biologics, are required to register and disclose certain clinical trial information, which is publicly available at www.clinicaltrials.gov. Information related to the product, patient population, phase of investigation, study sites and investigators, and other aspects of the clinical trial is then made public as part of the registration. Sponsors are also obligated to disclose the results of their clinical trials after completion. Disclosure of the results of these trials can be delayed until the new product or new indication being studied has been approved. Competitors may use this publicly available information to gain knowledge regarding the progress of development programs.
Pharmaceutical Coverage, Pricing and Reimbursement
In the United States, sales of any products for which we may receive regulatory approval for commercial sale will depend in part on the availability of coverage and reimbursement from third-party payors, including government authorities, managed care providers, private health insurers and other organizations. The process for determining whether a payor will provide coverage for a product may be separate from the process for setting the reimbursement rate that the payor will pay for the product. Third-party payors may limit coverage to specific products on an approved list which might not include all of the FDA-approved products for a particular indication. Moreover, a payor’s decision to provide coverage for a product does not imply that an adequate reimbursement rate will be approved. Adequate third-party reimbursement may not be available to enable us to maintain price levels sufficient to realize an appropriate return on our investment in product development.
Third-party payors are increasingly challenging the price and examining the medical necessity and cost-effectiveness of medical products and services, in addition to their safety and efficacy. In order to obtain coverage and reimbursement for any product that might be approved for sale, we may need to conduct expensive pharmacoeconomic studies in order to demonstrate the medical necessity and cost-effectiveness of any products, in addition to the costs required to obtain regulatory approvals. If third-party payors do not consider a product to be cost-effective or medically-necessary compared to other available therapies,
30
they may not cover the product after approval as a benefit under their plans or, if they do, the level of payment may not be sufficient to allow a company to sell its products at a profit.
The U.S. government and state legislatures have shown significant interest in implementing cost containment programs to limit the growth of government-paid health care costs, including price controls, restrictions on reimbursement and requirements for substitution of generic products for branded prescription drugs. For example, the Affordable Care Act, or ACA, contains provisions that may reduce the profitability of drug products, including, for example, increased rebates for drugs reimbursed by Medicaid programs, extension of Medicaid rebates to Medicaid managed care plans, mandatory discounts for certain Medicare Part D beneficiaries and annual fees based on pharmaceutical companies’ share of sales to federal health care programs. Adoption of government controls and measures and tightening of restrictive policies in jurisdictions with existing controls and measures, could limit payments for pharmaceuticals.
The current U.S. president's administration’s budget proposal for fiscal year 2019 contains further drug price control measures that could be enacted during the 2019 budget process or in other future legislation, including, for example, measures to permit Medicare Part D plans to negotiate the price of certain drugs under Medicare Part B, to allow some states to negotiate drug prices under Medicaid, and to eliminate cost sharing for generic drugs for low-income patients. Additionally, the current administration released a “Blueprint” to lower drug prices and reduce out of pocket costs of drugs that contains additional proposals to increase manufacturer competition, increase the negotiating power of certain federal healthcare programs, incentivize manufacturers to lower the list price of their products and reduce the out of pocket costs of drug products paid by consumers. The U.S. Department of Health and Human Services, or HHS, has already started the process of soliciting feedback on some of these measures and, at the same time, is immediately implementing others under its existing authority. For example, in September 2018, CMS announced that it will allow Medicare Advantage Plans the option to use step therapy for Part B drugs beginning January 1, 2019, and in October 2018, CMS proposed a new rule that would require direct-to-consumer television advertisements of prescription drugs and biological products, for which payment is available through or under Medicare or Medicaid, to include in the advertisement the Wholesale Acquisition Cost, or list price, of that drug or biological product. In addition, CMS issued an Advanced Notice of Proposed Rulemaking, or ANPRM, in October 2018 indicating it is considering issuing a proposed rule in the spring of 2019 on a model called the International Pricing Index, or IPI. This model would utilize a basket of other countries’ prices as a reference for the Medicare program to use in reimbursing for drugs covered under Part B. The ANPRM also included an updated version of the Competitive Acquisition Program, or CAP, as an alternative to current “buy and bill” payment methods for Part B drugs. Such a proposed rule could limit our product pricing and have material adverse effects on our business. Although a number of these, and other proposed measures will require authorization through additional legislation to become effective, Congress and the current administration have each indicated that it will continue to seek new legislative and/or administrative measures to control drug costs. At the state level, legislatures have increasingly passed legislation and implemented regulations designed to control pharmaceutical and biological product pricing, including price or patient reimbursement constraints, discounts, restrictions on certain product access and marketing cost disclosure and transparency measures, and, in some cases, designed to encourage importation from other countries and bulk purchasing.
Other U.S. Healthcare Laws and Compliance Requirements
If we obtain regulatory approval of our product candidates, we may be subject to various federal and state laws targeting fraud and abuse in the healthcare industry. These laws may impact, among other things, our proposed sales, marketing and education programs. In addition, we may be subject to patient privacy regulation by both the federal government and the states in which we conduct our business prior to and after receiving regulatory approval of our product candidates. The laws that may affect our ability to operate include:
|
•
|
the federal Anti-Kickback Statute, which prohibits, among other things, knowingly and willfully soliciting, receiving, offering or paying any remuneration (including any kickback, bribe, or rebate), directly or indirectly, overtly or covertly, in cash or in kind, to induce, or in return for, either the referral of an individual, or the purchase, lease, order or recommendation of any good, facility, item or service for which payment may be made, in whole or in part, under a federal healthcare program, such as the Medicare and Medicaid programs;
|
|
•
|
federal civil and criminal false claims and civil monetary penalty laws, such as the federal False Claims Act, which impose criminal and civil penalties and authorize civil whistleblower or qui tam actions, against individuals or entities for, among other things: knowingly presenting, or causing to be presented, to the federal government, claims for payment that are false or fraudulent; making a false statement or record material to a false or fraudulent claim or obligation to pay or transmit money or property to the federal government; or knowingly concealing or knowingly and improperly avoiding or decreasing an obligation to pay money to the federal government. In addition, the government
|
31
may assert that a claim including items and services resulting from a violation of the federal Anti-Kickback Statute constitutes a false of fraudulent claim for purposes of the False Claims Act;
|
•
|
the federal Health Insurance Portability and Accountability Act of 1996, or HIPAA, which prohibits knowingly and willfully executing, or attempting to execute, a scheme to defraud any healthcare benefit program or obtain, by means of false or fraudulent pretenses, representations, or promises, any of the money or property owned by, or under the custody or control of, any healthcare benefit program, regardless of the payor (e.g., public or private) and knowingly and willfully falsifying, concealing or covering up by any trick or device a material fact or making any materially false statements in connection with the delivery of, or payment for, healthcare benefits, items or services relating to healthcare matters;
|
|
•
|
HIPAA, as amended by the Health Information Technology for Economic and Clinical Health Act of 2009, and their respective implementing regulations, which impose requirements on certain covered healthcare providers, health plans and healthcare clearinghouses as well as their respective business associates who perform services for them that involve the use, or disclosure of, individually identifiable health information, relating to the privacy, security and transmission of individually identifiable health information;
|
|
•
|
the federal transparency requirements under the ACA, including the provision commonly referred to as the Physician Payments Sunshine Act, which require manufacturers of drugs, devices, biologics and medical supplies for which payment is available under Medicare, Medicaid or the Children’s Health Insurance Program to report annually to the U.S. Department of Health and Human Services information related to payments or other transfers of value made to physicians and teaching hospitals, as well as ownership and investment interests held by physicians and their immediate family members; and
|
|
•
|
federal consumer protection and unfair competition laws, which broadly regulate marketplace activities and activities that potentially harm consumers.
|
The ACA broadened the reach of the fraud and abuse laws by, among other things, amending the intent requirement of the federal Anti-Kickback Statute and the applicable criminal healthcare fraud statutes contained within 42 U.S.C. § 1320a-7b. Pursuant to the statutory amendment, a person or entity no longer needs to have actual knowledge of this statute or specific intent to violate it in order to have committed a violation. In addition, the ACA provides that a claim including items or services resulting from a violation of the federal Anti-Kickback Statute constitutes a false or fraudulent claim for purposes of the civil False Claims Act or the civil monetary penalties statute. Many states have adopted laws similar to the federal Anti-Kickback Statute and False Claims Act, some of which apply to claims for, and referral of patients for, healthcare items or services reimbursed by any source, not only the Medicare and Medicaid programs. Similarly, state privacy laws may be broader and require greater protections than HIPAA.
Violations of fraud and abuse laws may be punishable by criminal and/or civil sanctions, including penalties, fines and/or exclusion or suspension from federal and state healthcare programs such as Medicare and Medicaid and debarment from contracting with the U.S. government. In addition, private individuals have the ability to bring actions on behalf of the U.S. government under the federal False Claims Act as well as under the false claims laws of several states.
European Data Collection
The collection and use of personal health data in the European Union are governed by the provisions of the Data Protection Directive, and as of May 2018 the General Data Protection Regulation, or GDPR. This directive imposes several requirements relating to the consent of the individuals to whom the personal data relates, the information provided to the individuals, notification of data processing obligations to the competent national data protection authorities, and the security and confidentiality of the personal data. The Data Protection Directive and GDPR also impose strict rules on the transfer of personal data out of the European Union to the United States. Failure to comply with the requirements of the Data Protection Directive, the GDPR, and the related national data protection laws of the European Union Member States may result in fines and other administrative penalties. The GDPR introduces new data protection requirements in the European Union and substantial fines for breaches of the data protection rules. The GDPR regulations may impose additional responsibility and liability in relation to personal data that we process, and we may be required to put in place additional mechanisms ensuring compliance with the new data protection rules. This may be onerous and adversely affect our business, financial condition, results of operations, and prospects.
32
PRC Regulation
In the People's Republic of China, or PRC, we operate in an increasingly complex legal and regulatory environment. We are subject to a variety of PRC laws, rules and regulations affecting many aspects of our business. This section summarizes the principal PRC laws, rules and regulations that we believe are relevant to our business and operations.
PRC Drug Regulation
Introduction
China heavily regulates the development, approval, manufacturing and distribution of drugs, including biologics. The specific regulatory requirements applicable depend on whether the drug is made and finished in China, which is referred to as a domestically manufactured drug, or made abroad and imported into China in finished form, which is referred to as an imported drug, as well as the approval or “registration” category of the drug. For both imported and domestically manufactured drugs, China typically requires regulatory approval for a clinical trial, or CTA, prior to submitting an application for marketing approval. For a domestically manufactured drug, there is also a requirement to have a drug manufacturing license for a facility in China.
In 2017, the drug regulatory system entered a new and significant period of reform. The State Council and the China Communist Party jointly issued the Opinion on Deepening the Reform of the Regulatory Approval System to Encourage Innovation in Drugs and Medical Devices, or the Innovation Opinion. The expedited programs and other advantages under this and other recent reforms encourage drug manufacturers to seek marketing approval in China first, manufacture domestically, and develop drugs in high priority disease areas, such as oncology.
To implement the regulatory reform introduced by the Innovation Opinion, the NMPA has been revising the fundamental laws, regulations and rules regulating pharmaceutical products and the industry, which include the framework law known as the PRC Drug Administration Law, or DAL. The DAL is also generally implemented by a set of regulations issued by the State Council referred to as the DAL Implementing Regulation. The NMPA has its own set of regulations implementing the DAL; the primary one governing clinical trial applications, marketing approval, and license renewal and amendment is known as the Drug Registration Regulation. Although the NMPA made progress in 2018 on different proposals, finalizing several guidelines and documents, as of January 2019 final implementing regulations for many of the reforms in the Innovation Opinion had not been announced, and therefore, the details regarding the implementation of the regulatory changes remained uncertain in some respects.
Regulatory Authorities and Recent Government Reorganization
In the PRC, the NMPA is the primary regulator for pharmaceutical products and businesses. The agency was newly formed from the prior China Food and Drug Administration, or CFDA, in 2018 as part of a complete government reorganization. NMPA is no longer an independent agency. Its parent agency is now the newly organized State Administration for Market Regulation (SAMR), into which agencies responsible for, among other areas, consumer protection, advertising, anticorruption, pricing, fair competition and intellectual property have been merged.
Like the CFDA, the NMPA is still the chief drug regulatory agency and implements the same laws, regulations, rules, and guidelines as the CFDA, and it regulates almost all of the key stages of the life-cycle of pharmaceutical products, including nonclinical studies, clinical trials, marketing approvals, manufacturing, advertising and promotion, distribution, and pharmacovigilance (i.e., post-marketing safety reporting obligations). The Center for Drug Evaluation, or CDE, which remains under the NMPA, conducts the technical evaluation of each drug and biologic application for safety and effectiveness.
The National Health Commission, or NHC, (formerly known by the names: the Ministry of Health (MOH) and National Health and Family Planning Commission (NHFPC)), is China’s chief healthcare regulator. It is primarily responsible for overseeing the operation of medical institutions, which also serve as clinical trial sites, and regulating the licensure of hospitals and other medical personnel. NHC plays a significant role in drug reimbursement. Furthermore, the NHC and its local counterparts at or below the provincial-level of local government also oversee and organize public medical institutions’ centralized bidding and procurement process for pharmaceutical products. This is the chief way that public hospitals and their internal pharmacies acquire drugs.
Also, as part of the 2018 reorganization, the PRC government formed a new State Medical Insurance Bureau which focuses on regulating reimbursement under the state-sponsored insurance plans.
33
Preclinical and Clinical Development
The NMPA requires preclinical data to support registration applications for imported and domestic drugs. Preclinical work, including pharmacology and toxicology studies, must meet the GLP, issued in July 2017. The NMPA accredits GLP labs and requires that nonclinical studies on chemical drug substances and preparations and biologics that are not yet marketed in China be conducted there. There are no approvals required from the NMPA to conduct preclinical studies.
Registration Categories
Prior to engaging with the NMPA on research and development and approval, an applicant will need to determine the registration category for its drug candidate (which will ultimately need to be confirmed with the NMPA), which will determine the requirements for its clinical trial and marketing application. There are five categories for small molecule drugs: Category 1 (“innovative drugs”) refers to drugs that have a new chemical entity that has not been marketed anywhere in the world, Category 2 (“improved new drugs”) refers to drugs with a new indication, dosage form, route of administration, combination, or certain formulation changes not approved in the world, Categories 3 and 4 are for generics that reference an innovator drug (or certain well-known generic drugs) marketed either abroad or in China, respectively, and Category 5 refers to innovative or generic drugs that have already been marketed abroad but are not yet approved in China (i.e., many imported drugs).
Therapeutic biologics follow a similar categorization, with Category 1 being new to the world, but with fifteen product-specific categories. Like with small molecule drugs, Category 1 is for innovative biologics that have not been approved inside or outside of China. A clear regulatory pathway for biosimilars does not yet exist, but something was proposed in a draft revision to an NMPA regulation in 2017. Each of zanubrutinib, tislelizumab, pamiparib and lifirafenib is classified as Category 1 based on the respective clinical trial approval from the NMPA, which is a favored category for CTA and marketing approval.
Expedited Programs
Priority Evaluation and Approval Programs to Encourage Innovation
The NMPA has adopted several expedited review and approval mechanisms since 2009 and created additional expedited programs in recent years that are intended to encourage innovation. Applications for these expedited programs can be submitted after the CTA is admitted for review by the CDE. Some of the current categories of drugs eligible for priority status that may be particularly relevant for us include: (1) Category 1 innovative drugs that have not been approved inside or outside of China; (2) oncology drugs; (3) drugs using advanced technology, innovative treatment methods, and having clear therapeutic benefit; and (4) new drugs for which clinical trials are already approved in the United States or European Union, or for which marketing authorization applications have been filed simultaneously in China and in the United States or European Union and are manufactured in China using the same production line that passed FDA or EMA inspection.
If admitted to one of these expedited programs, an applicant will be entitled to more frequent and timely communication with reviewers at the CDE, expedited review and approval, and more agency resources throughout the approval process. Each of our drug candidates, zanubrutinib, tislelizumab, pamiparib and lifirafenib, is classified as Category 1 based on the respective clinical trial approval from the NMPA.
NMPA also permits conditional approval of certain medicines based on early phase data. Post-approval the applicant may need to conduct a post-market study. The agency has done this for drugs that meet unmet clinical needs for life-threatening illnesses and also for drugs that treat orphan indications. In 2018, NMPA established a conditional approval program for drugs designated by the CDE that have been approved in the US, EU and Japan within the last 10 years and that meet one of three criteria (1) orphan indications, (2) drugs that treat life threatening illnesses for which there are not effective treatment or preventive methods, and (3) drugs that treat life threatening illnesses and that have a clear clinical advantage over other clinical therapies.
CDE Guideline on PD-1/L1 NDA
In addition to the programs and proposals above, the CDE has recently stated that it will permit applicants for PD-1/L1 agents to submit data on a rolling basis based on the current high unmet medical need for PD-1/L1 agents. In February 2018, the CDE released the Guideline on the Basic Requirements of Information and Data for NDA Submissions of anti-PD-1/L1 Monoclonal Antibody Products on recurrent and refractory advanced cancers without standard-of-care therapies. Under the guideline, the sponsor must have a pre-NDA meeting with the CDE regarding the data and the NDA submission. The CDE will permit the following submission for these applicants: (1) an initial NDA submission with full preliminary safety data and effectiveness data, including the results of at least two independent therapeutic efficacy assessments of all patients who are
34
currently enrolled pursuant to all of the protocol’s requirements; (2) during the CDE’s substantive technical review of the NDA, submission on a rolling basis of follow-up safety and effectiveness data from at least six months from the time of the last enrolled patient showing the duration of the response; and (3) submission of all efficacy and safety data as provided for under the protocol before final approval is granted by the NMPA. Sponsors may also apply for priority review and approval for their NDA to accelerate the progress. If granted, priority status will be applied to various stages of the approval process, including testing, manufacturing site inspection, technical review, and clinical site inspection.
New Policies on Expediting Approval of Imported Oncology Drugs
The PRC government continues to establish measures and incentives to promote the development and swifter approval of marketing for oncology and other innovative drugs. Beginning in May 2018, the PRC eliminated tariffs on a significant number of imported innovative drugs, including oncology drugs, making the importation process more efficient. The PRC government has also stated that it will explore ways to expand access to reimbursement under the state health plans for innovative drugs (particularly for urgently needed oncology drugs).
Clinical Trials and Marketing Approval
Upon completion of preclinical studies, a sponsor typically needs to conduct clinical trials in China for registering a new drug. The materials required for this application and the data requirements are determined by the registration category. The NMPA has taken a number of steps to increase efficiency for approving CTAs, and it has also significantly increased monitoring and enforcement of GCP to ensure data integrity.
Trial Approval
All clinical trials conducted in China must be approved and conducted at hospitals accredited by the NMPA. For imported drugs, proof of foreign approval is required prior to the trial, unless the drug has never been approved anywhere in the world. In addition to a standalone China trial to support development, imported drug applicants may establish a site in China that is part of an international multicenter trial, or IMCT, at the outset of the global trial. Domestically manufactured drugs are not subject to foreign approval requirements, and in contrast to prior practice, the NMPA has recently decided to permit those drugs to conduct development via an IMCT as well.
In 2015, the NMPA began to issue an umbrella approval for all phases (typically three) of a new drug clinical trial, instead of issuing approval phase by phase. For certain types of new drug candidates, clinical trial applications may be prioritized over other applications, and put in a separate expedited queue for approval. Category 1 drugs are new drug trials which would qualify for this expedited umbrella approval status. Other trials that are not part of these expedited lines could still wait up to a year for approval to conduct the trial.
The NMPA has now also adopted a notification system for clinical trials of new drugs. Trials can proceed if after 60 business days, the applicant has not received any objections from the CDE, as opposed to the lengthier previous clinical trial pre-approval process in which the applicant had to wait for affirmative approval. China is also expanding the number of trial sites by truncating the timeline for accreditation by converting it from a pre-approval procedure into a notification procedure.
Human Genetic Resources Approval
According to the Interim Measures for the Administration of Human Genetic Resources, an additional approval is required for any foreign companies or foreign affiliates that conduct trials in China. Prior to entering into a clinical trial agreement and beginning a trial, the foreign sponsor and the Chinese clinical trial site are required to obtain human genetic resources, or HGR, approval to collect any biological samples that contain the genetic material of Chinese human subjects from the Ministry of Science and Technology, and any cross-border transfer of the samples or associated data requires additional approval. Furthermore, one of the key review points for the HGR review and approval process is the IP sharing arrangement between Chinese and foreign parties. The parties are required to share patent rights to inventions arising from the samples. Conducting a clinical trial in China without obtaining the relevant HGR preapproval will subject the sponsor and trial site to administrative liability, including confiscation of HGR samples and associated data, and administrative fines.
35
Trial Exemptions and Acceptance of Foreign Data
The NMPA may reduce requirements for trials and data, depending on the drug and the existing data. The NMPA has granted waivers for all or part of trials, and has stated that it will accept data generated abroad (even if not part of a global study), including early phase data, that meets its requirements. On July 6, 2018, the NMPA issued the Technical Guidance Principles on Accepting Foreign Drug Clinical Trial Data, or the Guidance Principles, as one of the implementing rules for the Innovation Opinion. According to the Guidance Principles, the data of foreign clinical trials must meet the authenticity, completeness and accuracy requirements and such data must be obtained consistent with the relevant requirements under the Good Clinical Trial Practice (GCP) of the International Conference on Harmonisation of Technical Requirements for Registration of Pharmaceuticals for Human Use (ICH). Sponsors must be attentive to potentially meaningful ethnic differences in the subject population.
The NMPA now officially permits, and its predecessor agencies have permitted on a case-by-case basis in the past, drugs approved outside of China to be approved in China on a conditional basis without the need for pre-approval clinical trials inside China. Specifically, in 2018, the NMPA established a program permitting drugs that have been approved within the last ten years in the United States, EU or Japan and that i) prevent or treat orphan diseases, ii) prevent or treat serious life-threatening illnesses for which there is either no effective therapy in China, or for which the foreign-approved drug would have clear clinical advantages. Applicants will be required to establish a risk mitigation plan and may be required to complete trials in China after the drug is marketed. The CDE has developed a list of qualifying drugs that meet this criteria.
Clinical Trial Process and Good Clinical Practices
Typically drug clinical trials in China have three phases. Phase 1 refers to the initial clinical pharmacology and human safety evaluation studies. Phase 2 refers to the preliminary evaluation of a drug candidate’s therapeutic efficacy and safety for target indication(s) in patients. Phase 3 (often the pivotal study) refers to clinical trials to further verify the drug candidate’s therapeutic efficacy and safety on patients with target indication(s) and ultimately provide sufficient evidence for the review of a drug registration application. The NMPA requires that the different phases of clinical trials in China receive ethics committee approval prior to approval of the CTA and comply with GCP. The NMPA conducts inspections to assess GCP compliance and will cancel the CTA if it finds substantial issues.
Generic small molecule drugs are required to conduct a bioequivalence trial, in vitro studies or in some cases a clinical trial to demonstrate therapeutic equivalence to an innovator drug marketed either in China or abroad or an internationally accepted generic drug. The NMPA has released catalogues of reference products, and it released a first installment of a Marketed Drug List (China’s “Orange Book”) with information about drugs that may serve as reference products.
New Drug Application (NDA) and Approval
Upon completion of clinical trials, a sponsor may submit clinical trial data to support marketing approval for the drug. For imported drugs, this means issuance of an import license. Again, the applicant must submit evidence of foreign approval, unless it is an innovative drug that has never been approved anywhere in the world.
NDA sponsors must submit data derived from domestically manufactured drugs in support of a drug approval. Under the current regime, upon approval of the registration application, the NMPA will first issue a new drug certificate to the applicant. Only when the applicant is equipped with relevant manufacturing capability will the NMPA issue a Drug Approval Serial Number, which is effectively the marketing approval allowing the holder to market/commercialize the drug in China.
China has recently implemented a Drug Marketing Authorization Holder Mechanism. The MAH pilot program permits research institutions and individual entities to develop and hold the marketing approvals for drugs without holding a drug manufacturing license. Domestically established research institutions (including domestic companies) can apply through an MAH pilot program if they are established in one of 10 designated provinces (including Beijing and Shanghai), which is now being expanded nationwide in China. The MAHs may engage contract manufacturers and distributors.
The MAH program was originally set up as a pilot program until November 2018. China has now that stated it will expand the program nationwide and make it permanent. Implementing legislation has been proposed, and the MAH pilot has been renewed for one more year until November 2019 in the interim. The Innovation Opinion indicates that China will strive to implement the MAH system nationally as soon as possible by amending the DAL. The NMPA has proposed revisions to accomplish this purpose, but the timeline to finalize these proposals is still unclear.
36
Manufacturing and Distribution
According to the DAL, all facilities that make drugs in China must receive a drug manufacturing license with an appropriate “scope of manufacturing” from the local drug regulatory authority. This license must be renewed every five years. A separate certification of compliance with GMP is also required.
Similarly, to conduct sales, importation, shipping and storage (“distribution activities”) a company must obtain a Drug Distribution License from the local drug regulatory authority, subject to renewal every five years. Like with GMPs, a separate certification of compliance with NMPA’s drug good supply practice, or GSP, is required.
China has formed a “Two Invoice System” to control distribution of prescription drugs. The “Two-Invoice System” generally requires that no more than two invoices may be issued throughout the distribution chain, with one from the manufacturer to a distributor and another from the distributor to the end-user hospital. This excludes the sale of products invoiced from the manufacturer to its wholly owned or controlled distributors, or for imported drugs, to their exclusive distributor, or from a distributor to its wholly owned or controlled subsidiary (or between the wholly owned or controlled subsidiaries). However, the system still significantly limits the options for companies to use multiple distributors to reach a larger geographic area in China. Compliance with the Two-Invoice System will become a prerequisite for pharmaceutical companies to participate in procurement processes with public hospitals, which currently provide most of China’s healthcare. Manufacturers and distributors that fail to implement the Two-Invoice System may lose their qualifications to participate in the bidding process. Non-compliant manufacturers may also be blacklisted from engaging in drug sales to public hospitals in a locality.
The Two-Invoice System was first implemented in 11 provinces that are involved in pilot comprehensive medical reforms, but the program has expanded to nearly all provinces, which have their own individual rules for the program.
Post-Marketing Surveillance
The manufacturer or marketing authorization holder of a drug is primarily responsible for pharmacovigilance, including quality assurance, adverse reaction reporting and monitoring, and product recalls. Distributors and user entities (e.g., hospitals) are also required to report, in their respective roles, adverse reactions of the products they sell or use, and assist with the manufacturer of the product recall. A drug that is currently under the new drug monitoring period has to report all adverse drug reactions (as opposed to just serious adverse reactions) for that period.
Advertising and Promotion of Pharmaceutical Products
China has a strict regime for the advertising of approved medicines. No unapproved medicines may be advertised. The definition of an advertisement is very broad, and does not exclude scientific exchange. It can be any media that directly or indirectly introduces the product to end users. There is no clear line between advertising and any other type of promotion.
An enterprise seeking to advertise a prescription drug may do so only in medical journals jointly approved by NMPA and the NHC, and each advertisement requires approval from a local drug regulatory authority. The content of an approved advertisement may not be altered without filing a new application for approval.
Prescription drug advertisements are subject to strict content restrictions, which prohibit recommendations by doctors and hospitals and guarantees of effectiveness. Advertising that includes content that is outside of the drug’s approval documentation (“off-label content”) is prohibited. False advertising can result in civil suits from end users and administrative liability, including fines. In addition to advertisements, non-promotional websites that convey information about a drug must go through a separate approval process by a local drug regulatory authority.
Regulatory Intellectual Property Protections
Non-patent exclusivities
New Drug Monitoring Period
Currently, new varieties of domestically produced drugs approved under Categories 1 or 2 in China may be placed under a monitoring period for three to five years. Category 1 innovative drugs will be monitored for five years. During the monitoring period, the NMPA will not approve another CTA from another applicant for the same type of drug, except if another sponsor
37
has an approved CTA at the time that the monitoring period is initiated it may proceed with its trial and once approved become another drug that is part of the monitoring period.
Regulatory Data Protection
The Innovation Opinion also lays the foundation for the establishment of a system for regulatory data protection to protect innovators. This protection will be available to the undisclosed clinical trial data of drugs falling into the following categories: innovative drugs, innovative therapeutic biologics, drugs that treat orphan diseases, pediatric drugs, and drugs for which there has been a successful patent challenge.
NMPA published a draft on Implementing Regulations for Pharmaceutical Study Data Protection for public comment that would set regulatory data protection for innovative small molecule drugs at six years and for innovative therapeutic biologics at 12 years; pediatric and orphan drugs would receive six years to run concurrently from their approval dates. Full terms of protection would require reliance on local trials or sites of multi-center trials in China and simultaneous submissions of marketing applications in China and other countries. Submissions in China that are up to six years later than those abroad would result in the term being reduced to 1-5 years. Submissions over six years later in China may not receive protection.
There is also a reduction if the marketing application is filed in China based solely on overseas clinical data with no Chinese subjects (75% reduction) or based on supplemental “China clinical trial data” (50% reduction). Information about the exclusivity term will be included in a Marketed Drug List (similar to the Orange Book in the US) at the time of approval. Some mechanics of these proposed rules are not yet clear, and it is not certain when the proposed rules will be finalized.
Patent-Related Protections
Patent Linkage
The Innovation Opinion also sets forth the basic elements of a patent linkage system to protect innovators, in which a follow-on applicant will be required to specify patents that are relevant to its application and notify relevant patent holders (including, innovators) within a specified period after filing its application, permitting them to sue to protect their rights. The system will require that the NMPA continue to review the potentially infringing follow-on application during any lawsuit by the innovator. However, the NMPA may not approve the follow-on application pending resolution of the patent litigation in favor of the follow-on application or for a specified period of time, whichever is shorter. This reform will require implementing regulations. To date, the NMPA has not issued the relevant implementing regulations.
Patent Term Extension
In early 2019, pursuant to the Innovation Opinion, the National People’s Congress issued a proposal for patent term extension as part of a proposed amendment to the Patent Law. Under this proposal, the State Council may grant a patent term extension of up to five years to compensate for delays in the review process for innovative drugs that are applying simultaneously for marketing approval in both China and abroad. The patent term may not be extended to more than 14 years post-marketing. It is not clear when this will be finalized.
Reimbursement and Pricing
China’s national medical insurance program was adopted pursuant to the Decision of the State Council on the Establishment of the Urban Employee Basic Medical Insurance Program issued by the State Council in 1998, under which all employers in urban cities are required to enroll their employees in the basic medical insurance program. The insurance premium is jointly contributed by the employers and employees. In 2007, the State Council promulgated Guiding Opinions of the State Council about the Pilot Urban Resident Basic Medical Insurance , under which urban residents of the pilot district, rather than urban employees, may voluntarily join Urban Resident Basic Medical Insurance. Participants of the national medical insurance program and their employers, if any, are required to contribute to the payment of insurance premiums on a monthly basis. Program participants are eligible for full or partial reimbursement of the cost of medicines included in the National Reimbursement Drug List, or NRDL. A pharmaceutical product listed in the NRDL must be clinically needed, safe, effective, reasonably priced, easy to use, and available in sufficient quantity.
Factors that affect the inclusion of a pharmaceutical product in the NRDL include whether the product is consumed in large volumes and commonly prescribed for clinical use in the PRC and whether it is considered to be important in meeting the basic healthcare needs of the general public. Since 2016, special consideration has been given to, among others, innovative drugs with high clinical value and drugs for serious diseases. In addition, the PRC Ministry of Human Resources and Social Security
38
has also been negotiating with manufacturers of expensive drugs with high clinical demands and proven effectiveness for price cuts in exchange for inclusion into the NRDL. The version of the NRDL released in 2017 covers 2,535 drugs in total, including 339 new additions, with an emphasis on innovative drugs and drugs that treat cancer and other serious diseases. China has been pursuing a policy of expediting the addition of innovative oncology drugs to this list. In 2018, 17 more oncology drugs were added into the NRDL by the State Medical Insurance Bureau.
Government price controls
The Chinese government has abolished the 15-year-old government-led pricing system for drugs, and lifted the maximum retail price for most drugs, including drugs reimbursed by government medical insurance funds, patented drugs, and some other drugs. The government regulates prices mainly by establishing a consolidated procurement mechanism, restructuring medical insurance reimbursement standards and strengthening regulation of medical and pricing practices as discussed below.
Centralized procurement and tenders
Under current regulations, public medical institutions owned by the government or owned by state-owned or controlled enterprises are required to purchase pharmaceutical products through centralized online procurement processes. There are exceptions for drugs on the National List of Essential Drugs, which must comply with their own procurement rules, and for certain drugs subject to the central government’s special control such as toxic, radioactive and narcotic drugs, and traditional Chinese medicines.
The centralized procurement process takes the form of public tenders operated by provincial or municipal-level government agencies. The centralized tender process is typically conducted once every year. The bids are assessed by a committee randomly selected from a database of experts. The committee members assess the bids based on a number of factors, including but not limited to bid price, product quality, clinical effectiveness, product safety, level of technology, qualifications and reputation of the manufacturer, after-sale services and innovation.
Over the last decade, the government has been using various methods to ensure that drugs are offered at affordable prices. In 2009, the central government announced a campaign to implement a “zero markup” policy on essential drugs among basic healthcare institutions, which has been fully implemented nationwide. In addition, some local government have begun to allow medical institutions to collectively negotiate with manufacturers for a second price to further lower the already agreed bid price. The newly adopted Two-Invoice System is also aimed to reduce price mark-ups brought about by multi-tier distribution chains.
Other PRC national- and provincial-level laws and regulations
We are subject to changing regulations under many other laws and regulations administered by governmental authorities at the national, provincial and municipal levels, some of which are or may become applicable to our business. For example, regulations control the confidentiality of patients’ medical information and the circumstances under which patient medical information may be released for inclusion in our databases or released by us to third parties. The privacy of human subjects in clinical trials is also protected under regulations. For example, the case report forms must avoid disclosing names of the human subjects.
These laws and regulations governing both the disclosure and the use of confidential patient medical information may become more restrictive in the future, including restrictions on transfer of healthcare data. The Cybersecurity Law that took effect in 2017 designates healthcare as a priority area that is part of critical information infrastructure, and China’s cyberspace administration is working to finalize a draft rule on cross-border transfer of personal information.
PRC Regulation of Foreign Investment
Investment activities in China by foreign investors are principally governed by the Guidance Catalogue of Industries for Foreign Investment, or the Catalogue, which was promulgated and is amended from time to time by the MOFCOM and the National Development and Reform Commission. Pursuant to the latest Catalogue which came into effect in July 2017 with the latest amendment being effective as of July 2018, or the 2017 Catalogue, industries are divided into two categories: encouraged industries and the industries within the catalogue of special management measures, or the Negative List. The Negative List is further divided into two sub-categories: restricted industries and prohibited industries. Establishment of wholly foreign-owned enterprises is generally allowed in industries outside of the Negative List. For the restricted industries within the Negative List, some are limited to equity or contractual joint ventures, while in some cases Chinese partners are required to hold the majority interests in such joint ventures. In addition, restricted category projects are subject to government approvals and certain special
39
requirements. Foreign investors are not allowed to invest in industries in the prohibited category. Industries not listed in the Catalogue are generally open to foreign investment unless specifically restricted by other PRC regulations. Pursuant to the 2017 Catalogue, the manufacture of innovative oncology drugs and certain other kinds of pharmaceutical products falls in the encouraged industries for foreign investment.
Regulations Relating to Foreign Exchange
The Foreign Exchange Administration Regulations are the principal regulations governing foreign currency exchange in China. Under the PRC foreign exchange regulations, payments of current account items, such as profit distributions and trade and service-related foreign exchange transactions, may be made in foreign currencies without prior approval from the State Administration of Foreign Exchange, or SAFE, by complying with certain procedural requirements. In contrast, approval from or registration with appropriate government authorities or designated banks is required when RMB is to be converted into a foreign currency and remitted out of China to pay capital expenses such as the repayment of foreign currency-denominated loans.
Under current regulations, the capital of a foreign-invested enterprise and capital in RMB obtained by the foreign-invested enterprise from foreign exchange settlement must not be used for the following purposes: directly or indirectly used for the payment beyond the business scope of the enterprises or the payment prohibited by relevant laws and regulations; directly or indirectly used for investment in securities, unless otherwise provided by relevant laws and regulations; extending loans to non-related parties, unless permitted by the scope of business; and/or paying the expenses related to the purchase of real estate that is not for self-use, except for the real estate enterprises.
In 2017, new regulations were adopted which, among other things, relax the policy restriction on foreign exchange inflow to further enhance trade and investment facilitation and tighten genuineness and compliance verification of cross-border transactions and cross-border capital flows.
Regulations Relating to Dividend Distributions
The principal laws, rules and regulations governing dividend distributions by foreign-invested enterprises in the PRC are the PRC Company Law, as amended, the Wholly Foreign-owned Enterprise Law and its implementating regulations, and the Sino-foreign Joint Venture Law and its implementing regulations. Under these requirements, foreign-invested enterprises may pay dividends only out of their accumulated profit, if any, as determined in accordance with PRC accounting standards and regulations. Both PRC domestic companies and wholly-foreign owned PRC enterprises are required to allocate at least 10% of their respective accumulated after-tax profits each year, if any, to fund certain capital reserve funds until the aggregate amount of these reserve funds have reached 50% of the registered capital of the enterprises. A PRC company is not permitted to distribute any profits until any losses from prior fiscal years have been offset. Profits retained from prior fiscal years may be distributed together with distributable profits from the current fiscal year.
Labor Laws and Social Insurance
Pursuant to the PRC Labor Law and the PRC Labor Contract Law, employers must execute written labor contracts with full-time employees. All employers must comply with local minimum wage standards. Employers must establish a comprehensive management system to protect the rights of their employees, including a system governing occupational health and safety to provide employees with occupational training to prevent occupational injury, and employers are required to truthfully inform prospective employees of the job description, working conditions, location, occupational hazards and status of safe production as well as remuneration and other conditions. Violations of the PRC Labor Contract Law and the PRC Labor Law may result in the imposition of fines and other administrative and criminal liability in the case of serious violations.
In addition, according to the PRC Social Insurance Law, employers like our PRC subsidiaries in China must provide employees with welfare schemes covering pension insurance, unemployment insurance, maternity insurance, work-related injury insurance, medical insurance and housing funds.
Rest of World Regulation
For other countries outside of the United States and the PRC, the requirements governing the conduct of clinical trials, drug licensing, pricing and reimbursement vary from country to country. In all cases the clinical trials must be conducted in accordance with GCP requirements and the applicable regulatory requirements and the ethical principles having their origin in the Declaration of Helsinki.
40
Employees
As of January 31, 2019, we had approximately 2,200 employees. We have also engaged and may continue to engage independent contractors to assist us with our operations. None of our employees are represented by a labor union or covered by a collective bargaining agreement. We have never experienced any employment-related work stoppages, and we consider our relations with our employees to be good.
Financial Information
The financial information required under this Item 1 is incorporated herein by reference to the section of this Annual Report titled “Part II-Item 8-Financial Statements and Supplementary Data.” For financial information regarding our business, see “Part II-Item 7-Management’s Discussion and Analysis of Financial Condition and Results of Operations” of this Annual Report and our consolidated audited financial statements and related notes included elsewhere in this Annual Report.
Corporate Information
We are an exempted company incorporated in the Cayman Islands with limited liability on October 28, 2010. Any company that is registered in the Cayman Islands but conducts business mainly outside of the Cayman Islands may apply to be registered as an exempted company. The principal executive office of our research and development operations is located at No. 30 Science Park Road, Zhong-Guan-Cun Life Science Park, Changping District, Beijing 102206, People’s Republic of China. Our telephone number at this address is +86 10 58958000. Our current registered office in the Cayman Islands is located at the offices of Mourant Governance Services (Cayman) Limited, 94 Solaris Avenue, Camana Bay, Grand Cayman KY1-1108, Cayman Islands. Our website address is www.beigene.com. We do not incorporate the information on or accessible through our website into this Annual Report, and you should not consider any information on, or that can be accessed through, our website as part of this Annual Report.
We own various applications and unregistered trademarks and servicemarks, including the name "BeiGene", and our corporate logo. All other trade names, trademarks and service marks of other companies appearing in this Annual Report are the property of their respective holders. Solely for convenience, some of the trademarks and trade names in this document are referred to without the
®
and ™ symbols, but such references should not be construed as any indicator that their respective owners will not assert, to the fullest extent under applicable law, their rights thereto. We do not intend our use or display of other companies’ trademarks and trade names to imply a relationship with, or endorsement or sponsorship of us by, any other companies.
Available Information
We make available on or through our website certain reports and amendments to those reports that we file with or furnish to the U.S. Securities and Exchange Commission, or SEC, in accordance with the Securities Exchange Act of 1934, as amended, or the Exchange Act. These include our annual reports on Form 10-K, our quarterly reports on Form 10-Q, and our current reports on Form 8-K, and amendments to those reports filed or furnished pursuant to Section 13(a) or 15(d) of the Exchange Act. We also make available, free of charge on our website, the reports filed with the SEC by our executive officers, directors and 10% shareholders pursuant to Section 16 under the Exchange Act. Additionally, we make available on our website our Hong Kong securities filings. We make this information available on or through our website free of charge as soon as reasonably practicable after we electronically file the information with, or furnish it to, the SEC and the Hong Kong Exchanges and Clearing Limited. We use our website as a means of disclosing material non-public information and for complying with our disclosure obligations under Regulation FD.
41
Item 1A. Risk Factors
The following section includes the most significant factors that we believe may adversely affect our business and operations. You should carefully consider the risks and uncertainties described below and all information contained in this Annual Report, including our financial statements and the related notes and “Part II-Item 7-Management’s Discussion and Analysis of Financial Condition and Results of Operations,” before deciding to invest in our ADSs or ordinary shares. The occurrence of any of the events or developments described below could harm our business, financial condition, results of operations and growth prospects. In such an event, the market price of our ADSs and ordinary shares could decline, and you may lose all or part of your investment. Additional risks and uncertainties not presently known to us or that we currently deem immaterial also may impair our business operations.
Risks Related to Clinical Development and Regulatory Approval of Our Drug Candidates
We depend substantially on the success of our drug candidates, which are in clinical development. If we are unable to successfully complete clinical development, obtain regulatory approval and commercialize our drug candidates, or experience significant delays in doing so, our business will be materially harmed.
Our business will depend on the successful development, regulatory approval and commercialization of our drug candidates for the treatment of patients with cancer, which are still in clinical development, and other drug candidates we may develop. We have invested a significant portion of our efforts and financial resources in the development of our existing drug candidates. The success of our drug candidates will depend on several factors, including:
|
•
|
successful enrollment in, and completion of, clinical trials, as well as completion of preclinical studies;
|
|
•
|
favorable safety and efficacy data from our clinical trials and other studies;
|
|
•
|
receipt of regulatory approvals;
|
|
•
|
establishing commercial manufacturing capabilities, either by building facilities ourselves or making arrangements with third-party manufacturers;
|
|
•
|
the performance by contract research organizations, or CROs, or other third parties we may retain of their duties to us in a manner that complies with our protocols and applicable laws and that protects the integrity of the resulting data;
|
|
•
|
obtaining and maintaining patent, trade secret and other intellectual property protection and regulatory exclusivity;
|
|
•
|
ensuring we do not infringe, misappropriate or otherwise violate the patent, trade secret or other intellectual property rights of third parties;
|
|
•
|
successfully launching our drug candidates, if and when approved;
|
|
•
|
obtaining favorable reimbursement from third-party payors for drugs, if and when approved;
|
|
•
|
competition with other products;
|
|
•
|
continued acceptable safety profile following regulatory approval; and
|
|
•
|
manufacturing or obtaining sufficient supplies of our drugs, drug candidates and any competitor drug products that may be necessary for use in clinical trials for evaluation of our drug candidates and commercialization of our drugs.
|
If we do not achieve one or more of these factors in a timely manner or at all, we could experience significant delays in our ability or be unable to obtain approval for and/or to successfully commercialize our drugs and drug candidates, which would materially harm our business and we may not be able to generate sufficient revenues and cash flows to continue our operations.
If we encounter difficulties enrolling patients in our clinical trials, our clinical development activities could be delayed or otherwise adversely affected.
The timely completion of clinical trials in accordance with their protocols depends, among other things, on our ability to enroll a sufficient number of patients who remain in the trial until its conclusion. We may experience difficulties in patient
42
enrollment in our clinical trials for a variety of reasons, including the size and nature of the patient population and the patient eligibility criteria defined in the protocol.
Our clinical trials will likely compete with other clinical trials for drug candidates that are in the same therapeutic areas as our drug candidates, and this competition will reduce the number and types of patients available to us, because some patients who might have opted to enroll in our trials may instead opt to enroll in a trial being conducted by one of our competitors. Because the number of qualified clinical investigators and clinical trial sites is limited, we expect to conduct some of our clinical trials at the same clinical trial sites that some of our competitors use, which will reduce the number of patients who are available for our clinical trials at such clinical trial sites. Even if we are able to enroll a sufficient number of patients in our clinical trials, delays in patient enrollment may result in increased costs or may affect the timing or outcome of the planned clinical trials, which could prevent completion of these trials and adversely affect our ability to advance the development of our drug candidates.
Clinical drug development involves a lengthy and expensive process with an uncertain outcome, and results of earlier studies and trials may not be predictive of future trial results.
Clinical testing is expensive and can take many years to complete, and its outcome is inherently uncertain. Failure can occur at any time during the clinical trial process. The results of preclinical studies and early clinical trials of our drug candidates may not be predictive of the results of later-stage clinical trials, and initial or interim results of a trial may not be predictive of the final results. Drug candidates in later stages of clinical trials may fail to show the desired safety and efficacy traits despite having progressed through preclinical studies and initial clinical trials. In some instances, there can be significant variability in safety and/or efficacy results between different trials of the same drug candidate due to numerous factors, including changes in trial procedures set forth in protocols, differences in the size and type of the patient populations, including genetic differences, patient adherence to the dosing regimen and other trial protocol elements and the rate of dropout among clinical trial participants. In the case of any trials we conduct, results may differ from earlier trials due to the larger number of clinical trial sites and additional countries and languages involved in such trials. A number of companies in the pharmaceutical and biotechnology industries have suffered significant setbacks in advanced clinical trials due to lack of efficacy or adverse safety profiles, notwithstanding promising results in earlier trials. Our future clinical trial results may not be favorable.
Even if our future clinical trial results show favorable efficacy and impressive durability of antitumor responses, not all patients may benefit. For certain drugs, including checkpoint inhibitors, and in certain indications, it is likely that the majority of patients may not respond to the agents at all, some responders may relapse after a period of response and certain tumor types may appear particularly resistant.
If clinical trials of our drug candidates fail to demonstrate safety and efficacy to the satisfaction of regulatory authorities or do not otherwise produce positive results, we may incur additional costs or experience delays in completing, or ultimately be unable to complete, the development and commercialization of our drug candidates.
Before obtaining regulatory approval for the sale of our drug candidates, we must conduct extensive clinical trials to demonstrate the safety and efficacy of our drug candidates in humans. We may experience numerous unexpected events during, or as a result of, clinical trials that could delay or prevent our ability to receive regulatory approval or commercialize our drug candidates, including but not limited to: regulators, institutional review boards, or IRBs, or ethics committees may not authorize us or our investigators to commence a clinical trial or conduct a clinical trial at a prospective trial site; our inability to reach agreements on acceptable terms with prospective CROs and trial sites, the terms of which can be subject to extensive negotiation and may vary significantly among different CROs and trial sites; manufacturing issues, including problems with manufacturing, supply quality, compliance with China’s drug Good Manufacturing Practice, current good manufacturing practice, or GMP, or obtaining from third parties sufficient quantities of a drug candidate for use in a clinical trial or for commercialization; clinical trials of our drug candidates may produce negative or inconclusive results, and we may decide, or regulators may require us, to conduct additional clinical trials or abandon drug development programs; the number of patients required for clinical trials of our drug candidates may be larger than we anticipate, enrollment may be insufficient or slower than we anticipate or patients may drop out at a higher rate than we anticipate; our third-party contractors, including clinical investigators, may fail to comply with regulatory requirements or meet their contractual obligations to us in a timely manner, or at all; we might have to suspend or terminate clinical trials of our drug candidates for various reasons, including a finding of a lack of clinical response or other unexpected characteristics or a finding that participants are being exposed to unacceptable health risks; regulators, IRBs or ethics committees may require that we or our investigators suspend or terminate clinical research or not rely on the results of clinical research for various reasons, including noncompliance with regulatory requirements; the cost of clinical trials of our drug candidates may be greater than we anticipate; and the supply or quality of our drugs and drug candidates, companion diagnostics or other materials necessary to conduct clinical trials of our drug candidates or commercialization of our drugs may be insufficient or inadequate.
43
If we are required to conduct additional clinical trials or other testing of our drug candidates beyond those that we currently contemplate, if we are unable to successfully complete clinical trials of our drug candidates or other testing, if the results of these trials or tests are not positive or are only modestly positive or if they raise safety concerns, we may:
|
•
|
be delayed in obtaining regulatory approval for our drug candidates;
|
|
•
|
not obtain regulatory approval at all;
|
|
•
|
obtain approval for indications that are not as broad as intended;
|
|
•
|
have the drug removed from the market after obtaining regulatory approval;
|
|
•
|
be subject to additional post-marketing testing requirements;
|
|
•
|
be subject to warning labels or restrictions on how the drug is distributed or used; or
|
|
•
|
be unable to obtain reimbursement for use of the drug.
|
Significant clinical trial or regulatory delays may also increase our development costs and could shorten any periods during which we have the exclusive right to commercialize our drug candidates or allow our competitors to bring drugs to market before we do. This could impair our ability to commercialize our drug candidates and may harm our business and results of operations.
Risks Related to Extensive Government Regulation
All material aspects of the research, development, manufacturing and commercialization of pharmaceutical products are heavily regulated.
All jurisdictions in which we intend to conduct our pharmaceutical-industry activities regulate these activities in great depth and detail. We initially intend to focus our activities in the major markets of the United States, China and other Asian countries, and the European Union. These geopolitical areas all strictly regulate the pharmaceutical industry, and in doing so they employ broadly similar regulatory strategies, including regulation of product development and approval, manufacturing, and marketing, sales and distribution of products. However, there are differences in the regulatory regimes-some minor, some significant-that make for a more complex and costly regulatory compliance burden for a company like ours that plans to operate in each of these regions.
The process of obtaining regulatory approvals and compliance with appropriate laws and regulations require the expenditure of substantial time and financial resources. Failure to comply with the applicable requirements at any time during the product development process, approval process, or after approval, may subject an applicant to administrative or judicial sanctions. These sanctions could include a regulator’s refusal to approve pending applications, withdrawal of an approval, license revocation, a clinical hold, voluntary or mandatory product recalls, product seizures, total or partial suspension of production or distribution, injunctions, fines, refusals of government contracts, restitution, disgorgement or civil or criminal penalties. The failure to comply with these regulations could have a material adverse effect on our business. For example, although we received a Breakthrough Therapy designation for zanubrutinib for the treatment of adult patients with mantle cell lymphoma (MCL) who have received at least one prior therapy in January 2019, the FDA may later decide that such drug candidate no longer meets the conditions for qualification and may rescind such designation. In any event, the receipt of a Breakthrough Therapy designation for a drug candidate may not result in a faster development process, review or approval compared to drugs considered for approval under conventional FDA procedures and does not assure ultimate approval by the FDA.
The regulatory approval processes of the regulatory authorities in the United States, China, Europe and other comparable regulatory authorities are lengthy, time consuming and inherently unpredictable. If we are ultimately unable to obtain regulatory approval for our drug candidates, our business will be substantially harmed.
The time required to obtain approval by the U.S. Food and Drug Administration, or FDA, the National Medical Products Administration of China, or NMPA (formerly known as the China Food and Drug Administration or China Drug Administration), the European Medicines Agency, or EMA, and other comparable regulatory authorities is unpredictable and typically takes many years following the commencement of preclinical studies and clinical trials and depends on numerous factors, including the substantial discretion of the regulatory authorities.
44
Our drug candidates could be delayed or fail to receive regulatory approval for many reasons, including:
|
•
|
failure to begin or complete clinical trials due to disagreements with regulatory authorities;
|
|
•
|
failure to demonstrate that a drug candidate is safe and effective or that a biologic candidate is safe, pure, and potent for its proposed indication;
|
|
•
|
failure of clinical trial results to meet the level of statistical significance required for approval;
|
|
•
|
reporting or data integrity issues related to our clinical trials;
|
|
•
|
disagreement with our interpretation of data from preclinical studies or clinical trials;
|
|
•
|
changes in approval policies or regulations that render our preclinical and clinical data insufficient for approval or require us to amend our clinical trial protocols;
|
|
•
|
regulatory requests for additional analyses, reports, data, nonclinical studies and clinical trials, or questions regarding interpretations of data and results and the emergence of new information regarding our drug candidates or other products;
|
|
•
|
failure to satisfy regulatory conditions regarding endpoints, patient population, available therapies and other requirements for our clinical trials in order to support marketing approval on an accelerated basis or at all;
|
|
•
|
our failure to conduct a clinical trial in accordance with regulatory requirements or our clinical trial protocols; and
|
|
•
|
clinical sites, investigators or other participants in our clinical trials deviating from a trial protocol, failing to conduct the trial in accordance with regulatory requirements, or dropping out of a trial.
|
The FDA, NMPA, EMA or a comparable regulatory authority may require more information, including additional preclinical, chemistry, manufacturing and controls, or CMC, and/or clinical data, to support approval, which may delay or prevent approval and our commercialization plans, or we may decide to abandon the development program.
Changes in regulatory requirements and guidance may also occur, and we may need to amend clinical trial protocols submitted to applicable regulatory authorities to reflect these changes. Amendments may require us to resubmit clinical trial protocols to IRBs or ethics committees for re-examination, which may impact the costs, timing or successful completion of a clinical trial.
If we experience delays in the completion of, or the termination of, a clinical trial of any of our drug candidates, the commercial prospects of that drug candidate will be harmed, and our ability to generate product sales revenues from any of those drug candidates will be delayed. In addition, any delays in completing our clinical trials will increase our costs, slow down our drug candidate development and approval process, and jeopardize our ability to commence product sales and generate related revenues for that candidate. Any of these occurrences may harm our business, financial condition and prospects significantly. In addition, many of the factors that cause, or lead to, a delay in the commencement or completion of clinical trials may also ultimately lead to the denial of regulatory approval of our drug candidates.
Our development activities also could be harmed or delayed by a shutdown of the U.S. government, including the FDA.
We believe that our drug candidates’ designation in China as Category 1 products should confer certain regulatory advantages on us. These advantages may not result in commercial benefits to us as we expect, and they might be changed in the future in a manner adverse to us.
In China, prior to seeking approval from the NMPA, a pharmaceutical company needs to determine the drug’s registration category, which will determine the requirements for its clinical trial and marketing application. These categories range from Category 1, for drugs incorporating a new chemical entity that has not previously been marketed anywhere in the world, to Category 2, for drugs with new indications, dosage forms or routes of administration and the like, to Categories 3 and 4, for certain generic drugs, to Category 5, for “originator” (what would be known elsewhere as innovative) or generic drugs previously marketed abroad but not yet approved for marketing in China. Therapeutic biologics follow a similar classification system. All of our internally developed drug candidates are classified as Category 1 based on the respective clinical trial approval from the NMPA, which is a favored category for regulatory review and approval.
45
The NMPA has adopted several mechanisms for expedited review and approval for drug candidates that apply to Category 1 drug candidates. While we believe that the Category 1 designation of our internally developed clinical stage drug candidates should provide us with a significant regulatory, and therefore commercial, advantage over non-Chinese companies seeking to market products in China, we cannot be sure that this will be the case. The pharmaceutical regulatory environment is evolving quickly, and changes in laws, regulations, enforcement and internal policies could result in the “favored” status of Category 1 products changing, or being eliminated altogether or our products classification in Category 1 changing. We cannot be certain that the advantages we believe will be conferred by our Category 1 classifications will be realized or result in any material development or commercial advantage.
The absence of patent-linkage, patent-term extension and data and market exclusivity for NMPA-approved pharmaceutical products could increase the risk of early generic competition with our products in China.
In the United States, the Federal Food, Drug, and Cosmetic Act, as amended by the law generally referred to as the “Hatch-Waxman Amendments,” provides the opportunity for patent-term restoration of up to five years to reflect patent term lost during certain portions of product development and the FDA regulatory review process. The Hatch-Waxman Amendments also have a process for patent linkage, pursuant to which FDA will stay approval of certain follow-on applications during the pendency of litigation between the follow-on applicant and the patent holder or licensee, generally for a period of 30 months. Finally, the Hatch-Waxman Amendments provide for statutory exclusivities that can prevent submission or approval of certain follow-on marketing applications. For example, federal law provides a five-year period of exclusivity within the United States to the first applicant to obtain approval of a new chemical entity (as defined) and three years of exclusivity protecting certain innovations to previously approved active ingredients where the applicant was required to conduct new clinical investigations to obtain approval for the modification. Similarly, the Orphan Drug Act provides seven years of market exclusivity for certain drugs to treat rare diseases, where FDA designates the drug candidate as an orphan drug and the drug is approved for the designated orphan indication. These provisions, designed to promote innovation, can prevent competing products from entering the market for a certain period of time after FDA grants marketing approval for the innovative product.
In China, however, there is no currently effective law or regulation providing patent term extension, patent linkage, or data exclusivity (referred to as regulatory data protection). Therefore, a lower-cost generic drug can emerge onto the market much more quickly. Chinese regulators have set forth a framework for integrating patent linkage and data exclusivity into the Chinese regulatory regime, as well as for establishing a pilot program for patent term extension. To be implemented, this framework will require adoption of regulations. To date, the NMPA has issued several draft implementing regulations in this regard for public comment but no regulations have been formally issued. These factors result in weaker protection for us against generic competition in China than could be available to us in the United States until the relevant implementing regulations for extension, patent linkage, or data exclusivity are put into effect officially in China.
Chinese manufacturing facilities have historically experienced issues operating in line with established cGMPs and international best practices, and passing FDA and NMPA inspections, which may result in a longer and costlier current good manufacturing practice inspection and approval process by the FDA or NMPA for our Chinese manufacturing processes and third party contract manufacturers.
To obtain FDA and NMPA approval for our products in the United States and China, respectively, we will need to undergo strict pre‑approval inspections of our manufacturing facilities, which we have located in China, or the manufacturing facilities of our contract manufacturers located in China and elsewhere. Historically, some manufacturing facilities in China have had difficulty meeting the FDA’s or NMPA's standards. When inspecting our or our contractors' Chinese manufacturing facilities, the FDA or NMPA might cite cGMP deficiencies, both minor and significant, which we may not be required to disclose. Remediating deficiencies can be laborious and costly and consume significant periods of time. Moreover, if the FDA or NMPA notes deficiencies as a result of its inspection, it will generally reinspect the facility to determine if the deficiency was remediated to its satisfaction. The FDA or NMPA may note further deficiencies as a result of its reinspection, either related to the previously identified deficiency or otherwise. If we cannot satisfy the FDA and NMPA as to our compliance with cGMP in a timely basis, FDA or NMPA marketing approval for our products could be seriously delayed, which in turn would delay commercialization of our drug candidates.
Undesirable adverse events caused by our drugs and drug candidates could interrupt, delay or halt clinical trials, delay or prevent regulatory approval, limit the commercial profile of an approved label, or result in significant negative consequences following any regulatory approval.
Undesirable adverse events, or AEs, caused by our drugs and drug candidates could cause us or regulatory authorities to interrupt, delay or halt clinical trials and could result in a more restrictive label or the delay or denial of regulatory approval by the FDA, NMPA, EMA or other comparable regulatory authorities, or could result in limitations or withdrawal following
46
approvals. If the conduct or results of our trials or patient experience following approval reveal a high and unacceptable severity or prevalence of AEs, our trials could be suspended or terminated and the FDA, NMPA, EMA or other comparable regulatory authorities could order us to cease further development of, or deny approval of, our drug candidates or require us to cease commercialization following approval.
Numerous drug-related AEs and serious AEs, or SAEs, have been reported in our clinical trials. Some of these events have led to patient death. Drug-related AEs or SAEs could affect patient recruitment or the ability of enrolled subjects to complete the trial, and could result in product liability claims. Any of these occurrences may harm our reputation, business, financial condition and prospects significantly. In our periodic and current reports filed with the SEC and our press releases and scientific and medical presentations released from time to time we disclose clinical results for our drug candidates, including the occurrence of AEs and SAEs. Each such disclosure speaks only as of the date of the data cutoff used in such report, and we undertake no duty to update such information unless required by applicable law. Also, a number of immune-related adverse events, or IRAEs, have been associated with treatment with checkpoint inhibitors such as our investigational PD-1 inhibitor tislelizumab, including immune-mediated pneumonitis, colitis, hepatitis, endocrinopathies, nephritis and renal dysfunction, skin adverse reactions, and encephalitis. These IRAEs may be more common in certain patient populations (potentially including elderly patients) and may be exacerbated when checkpoint inhibitors are combined with other therapies.
Additionally, undesirable side effects caused by our drugs and drug candidates, or caused by our drugs and drug candidates when used in combination with other drugs, could potentially cause significant negative consequences, including:
|
•
|
regulatory authorities could delay or halt pending clinical trials;
|
|
•
|
we may suspend, delay or alter development of the drug candidate or marketing of the drug;
|
|
•
|
regulatory authorities may withdraw approvals or revoke licenses of the drug, or we may determine to do so even if not required;
|
|
•
|
regulatory authorities may require additional warnings on the label;
|
|
•
|
we may be required to develop a Risk Evaluation Mitigation Strategy, or REMS, for the drug, as is the case with REVLIMID®, or, if a REMS is already in place, to incorporate additional requirements under the REMS, or to develop a similar strategy as required by a comparable regulatory authority;
|
|
•
|
we may be required to conduct post-market studies; and
|
|
•
|
we could be sued and held liable for harm caused to subjects or patients.
|
Any of these events could prevent us from achieving or maintaining market acceptance of the particular drug or drug candidate, and could significantly harm our business, results of operations and prospects.
Our drugs and any future approved drug candidates will be subject to ongoing regulatory obligations and continued regulatory review, which may result in significant additional expense and we may be subject to penalties if we fail to comply with regulatory requirements or experience unanticipated problems with our drug candidates.
Our drugs and any additional drug candidates that are approved will be subject to ongoing regulatory requirements for manufacturing, labeling, packaging, storage, advertising, promotion, sampling, record-keeping, conduct of post-marketing studies, and submission of safety, efficacy, and other post-market information, including both federal and state requirements in the United States and requirements of comparable regulatory authorities in China and other countries.
Manufacturers and manufacturers’ facilities are required to comply with extensive FDA, NMPA, EMA and comparable regulatory authority requirements, including, in the United States, ensuring that quality control and manufacturing procedures conform to cGMP regulations. As such, we and our contract manufacturers are and will be subject to continual review and inspections to assess compliance with cGMP and adherence to commitments made in any New Drug Application, or NDA, or Biologics License Application, or BLA, other marketing application, and previous responses to any inspection observations. Accordingly, we and others with whom we work must continue to expend time, money and effort in all areas of regulatory compliance, including manufacturing, production and quality control.
The regulatory approvals for our drugs and any approvals that we receive for our drug candidates are and may be subject to limitations on the approved indicated uses for which the drug may be marketed or to the conditions of approval, which could
47
adversely affect the drug’s commercial potential or contain requirements for potentially costly post-marketing testing and surveillance to monitor the safety and efficacy of the drug or drug candidate. The FDA, NMPA, EMA or comparable regulatory authorities may also require a REMS program or comparable program as a condition of approval of our drug candidates or following approval, as is the case with REVLIMID®. In addition, if the FDA, NMPA, EMA or a comparable regulatory authority approves our drug candidates, we will have to comply with requirements including, for example, submissions of safety and other post-marketing information and reports, establishment registration, as well as continued compliance with cGMP and Good Clinical Practice, or GCP, for any clinical trials that we conduct post-approval.
The FDA, NMPA, EMA or comparable regulatory authorities may seek to impose a consent decree or withdraw marketing approval if compliance with regulatory requirements is not maintained or if problems occur after the drug reaches the market. Later discovery of previously unknown problems with our drugs or drug candidates or with our drug’s manufacturing processes, or failure to comply with regulatory requirements, may result in revisions to the approved labeling to add new safety information; imposition of post-market studies or clinical studies to assess new safety risks; or imposition of distribution restrictions or other restrictions under a REMS program. Other potential consequences include, among other things:
|
•
|
restrictions on the marketing or manufacturing of our drugs, withdrawal of the product from the market, or voluntary or mandatory product recalls;
|
|
•
|
fines, untitled or warning letters, or holds on clinical trials;
|
|
•
|
refusal by the FDA, NMPA, EMA or comparable regulatory authorities to approve pending applications or supplements to approved applications filed by us or suspension or revocation of license approvals or withdrawal of approvals;
|
|
•
|
product seizure or detention, or refusal to permit the import or export of our drugs and drug candidates; and
|
|
•
|
injunctions or the imposition of civil or criminal penalties.
|
The FDA, NMPA, EMA and other regulatory authorities strictly regulate the marketing, labeling, advertising and promotion of products that are placed on the market. Drugs may be promoted only for their approved indications and for use in accordance with the provisions of the approved label. The FDA, NMPA, EMA and other regulatory authorities actively enforce the laws and regulations prohibiting the promotion of off-label uses, and a company that is found to have improperly promoted off-label uses may be subject to significant liability. The policies of the FDA, NMPA, EMA and of other regulatory authorities may change and additional government regulations may be enacted that could prevent, limit or delay regulatory approval of our drug candidates. We cannot predict the likelihood, nature or extent of government regulation that may arise from future legislation or administrative action, either in the United States or abroad, particularly in China, where the regulatory environment is constantly evolving. If we are slow or unable to adapt to changes in existing requirements or the adoption of new requirements or policies, or if we are not able to maintain regulatory compliance, we may lose any regulatory approval that we may have obtained and we may not achieve or sustain profitability.
In addition, if we were able to obtain accelerated approval of any of our drug candidates, the FDA would require us to conduct a confirmatory study to verify the predicted clinical benefit and may also require post-marketing safety studies. Other comparable regulatory authorities outside the United States, such as the NMPA or EMA, may have similar requirements. The results from the confirmatory study may not support the clinical benefit, which would result in the approval being withdrawn. While operating under accelerated approval, we will be subject to certain restrictions that we would not be subject to upon receiving regular approval.
If safety, efficacy, or other issues arise with any medical product that is used in combination with our drugs, we may be unable to market such drug or may experience significant regulatory delays or supply shortages, and our business could be materially harmed.
We plan to develop certain of our drug candidates for use as a combination therapy. If the FDA, NMPA, EMA or another comparable regulatory agency revokes its approval of another therapeutic we use in combination with our drug candidates, we will not be able to market our drug candidates in combination with such revoked therapeutic. If safety or efficacy issues arise with these or other therapeutics that we seek to combine with our drug candidates in the future, we may experience significant regulatory delays, and we may be required to redesign or terminate the applicable clinical trials. In addition, if manufacturing or other issues result in a supply shortage of any component of our combination drug candidates, we may not be able to complete clinical development of our drug candidates on our current timeline or at all, or we may experience disruptions in the commercialization of our approved drugs.
48
Reimbursement may not be available for our drug candidates. Even if we are able to commercialize our drugs and any approved drug candidates, the drugs may become subject to unfavorable pricing regulations or third-party reimbursement practices, which could harm our business.
The regulations that govern regulatory approvals, pricing and reimbursement for new therapeutic products vary widely from country to country. Some countries require approval of the sale price of a drug before it can be marketed. In many countries, the pricing review period begins after marketing or licensing approval is granted. In some non-U.S. markets, prescription pharmaceutical pricing remains subject to continuing governmental control even after initial approval is granted. As a result, we might obtain regulatory approval for a drug in a particular country, but then be subject to price regulations that delay our commercial launch of the drug and negatively impact our revenues.
Our ability to commercialize any drugs successfully also will depend in part on the extent to which reimbursement for these drugs and related treatments will be available from government health administration authorities, private health insurers and other organizations.
A primary trend in the global healthcare industry is cost containment. Government authorities and these third-party payors have attempted to control costs by limiting coverage and the amount of reimbursement for particular medications.
In the United States, no uniform policy of coverage and reimbursement for drugs exists among third-party payors. As a result, obtaining coverage and reimbursement approval of a drug from a government or other third-party payor is a time-consuming and costly process that could require us to provide to each payor supporting scientific, clinical and cost-effectiveness data for the use of our drugs on a payor-by-payor basis, with no assurance that coverage and adequate reimbursement will be obtained. Even if we obtain coverage for a given drug, the resulting reimbursement rates might not be adequate for us to achieve or sustain profitability or may require co-payments that patients find unacceptably high. Additionally, third-party payors may not cover, or provide adequate reimbursement for, long-term follow-up evaluations required following the use of our genetically modified drugs. Patients are unlikely to use our drugs and any approved drug candidates unless coverage is provided and reimbursement is adequate to cover a significant portion of the cost of the drug. Because some of our drugs and drug candidates have a higher cost of goods than conventional therapies, and may require long-term follow up evaluations, the risk that coverage and reimbursement rates may be inadequate for us to achieve profitability may be greater.
In China, the Ministry of Human Resources and Social Security of China or provincial or local human resources and social security authorities, together with other government authorities, review the inclusion or removal of drugs from China’s National Drug Catalog for Basic Medical Insurance, Work-related Injury Insurance and Maternity Insurance, or the National Reimbursement Drug List, or the NRDL, or provincial or local medical insurance catalogues for the National Medical Insurance Program regularly, and the tier under which a drug will be classified, both of which affect the amounts reimbursable to program participants for their purchases of those drugs. There can be no assurance that our drugs and any approved drug candidates will be included in the NRDL. Products included in the NRDL have been typically generic and essential drugs. Innovative drugs similar to our drug candidates have historically been more limited on their inclusion in the NRDL due to the affordability of the government’s Basic Medical Insurance, although this has been changing in recent years.
Increasingly, third-party payors are requiring that companies provide them with predetermined discounts from list prices and are challenging the prices charged for medical products. We cannot be sure that reimbursement will be available for any drug that we commercialize and, if reimbursement is available, what the level of reimbursement will be. Reimbursement may impact the demand for, or the price of, any drug which we commercialize. Obtaining or maintaining reimbursement for our drugs may be particularly difficult because of the higher prices often associated with drugs administered under the supervision of a physician. If reimbursement is not available or is available only to limited levels, we may not be able to successfully commercialize any drug candidate that we in-license or successfully develop.
There may be significant delays in obtaining reimbursement for approved drugs, and coverage may be more limited than the purposes for which the drug is approved by the FDA or other comparable regulatory authorities outside the United States. Moreover, eligibility for reimbursement does not imply that any drug will be paid for in all cases or at a rate that covers our costs, including research, development, manufacture, sale and distribution. Interim payments for new drugs, if applicable, may also not be sufficient to cover our costs and may not be made permanent. Payment rates may vary according to the use of the drug and the clinical setting in which it is used, may be based on payments allowed for lower cost drugs that are already reimbursed, and may be incorporated into existing payments for other services. Net prices for drugs may be reduced by mandatory discounts or rebates required by government healthcare programs or private payors and by any future weakening of laws that presently restrict imports of drugs from countries where they may be sold at lower prices than in the United States. Our inability to promptly obtain coverage and profitable payment rates from both government-funded and private payors for
49
our drugs and any new drugs that we develop could have a material adverse effect on our business, our operating results, and our overall financial condition.
We intend to seek approval to market our drug candidates in the United States, China, Europe and in other jurisdictions. In some non-U.S. countries, particularly those in the European Union, the pricing of drugs and biologics is subject to governmental control, which can take considerable time even after obtaining regulatory approval. Market acceptance and sales of our drugs will depend significantly on the availability of adequate coverage and reimbursement from third-party payors for drugs and may be affected by existing and future health care reform measures.
Recently enacted and future legislation may increase the difficulty and cost for us to obtain regulatory approval of and commercialize our drug candidates and affect the prices we may obtain.
In the United States, China, the European Union and some other jurisdictions, there have been a number of legislative and regulatory changes and proposed changes regarding healthcare that could prevent or delay regulatory approval of our drug candidates, restrict or regulate post-approval activities and affect our ability to profitably sell our drugs and any drug candidates for which we obtain regulatory approval. We expect that healthcare reform measures may result in more rigorous coverage criteria and in additional downward pressure on the price that we receive for any approved drug. Any reduction in reimbursement from Medicare or other government programs may result in a similar reduction in payments from private payors. The implementation of cost containment measures or other healthcare reforms may prevent us from being able to generate revenue, attain profitability, or commercialize our drugs.
Legislative and regulatory proposals have been made to expand post-approval requirements and restrict sales and promotional activities for pharmaceutical products. We cannot be sure whether additional legislative changes will be enacted, or whether FDA regulations, guidance or interpretations will be changed, or what the impact of such changes on the regulatory approvals of our drug candidates, if any, may be.
In recent years, there have been and will likely continue to be efforts to enact administrative or legislative changes to healthcare laws and policies, including modification, repeal, or replacement of all, or certain provisions of, the Affordable Care Act, or ACA. The implications of the ACA, its possible repeal, any legislation that may be proposed to replace the ACA, modifications to the implementation of the ACA, and the political uncertainty surrounding any repeal or replacement legislation for our business and financial condition, if any, are not yet clear.
Risks Related to Commercialization of Our Drugs and Drug Candidates
If we are not able to obtain, or experience delays in obtaining, required regulatory approvals, we will not be able to commercialize our drug candidates, and our ability to generate revenue will be materially impaired.
Before obtaining regulatory approvals for the commercial sale of any drug candidate for a target indication, we must demonstrate in preclinical studies and well-controlled clinical trials, and, with respect to approval in the United States, to the satisfaction of the FDA, that the drug candidate is safe and effective, or the biologic drug candidate is safe, pure, and potent, for use for that target indication and that the manufacturing facilities, processes and controls are adequate. In addition to preclinical and clinical data, the NDA or BLA must include significant information regarding the chemistry, manufacturing and controls for the drug candidate. Obtaining approval of an NDA or BLA is a lengthy, expensive and uncertain process, and approval may not be obtained. If we submit an NDA or BLA to the FDA, the FDA decides whether to accept or reject the submission for filing. We cannot be certain that any submissions will be accepted for filing and review by the FDA.
We have not yet demonstrated an ability to receive regulatory approval for our drug candidates. For example, we have limited experience in preparing the required materials for regulatory submission and do not have experience navigating the regulatory approval process. As a result, our ability to successfully submit an NDA or BLA and obtain regulatory approval for our drug candidates may involve more inherent risk, take longer, and cost more than it would if we were a company with experience in obtaining regulatory approvals.
Regulatory authorities outside of the United States, such as the NMPA and EMA, also have requirements for approval of drugs for commercial sale with which we must comply prior to marketing in those areas. Regulatory requirements can vary widely from country to country and could delay or prevent the introduction of our drug candidates. Clinical trials conducted in one country may not be accepted by regulatory authorities in other countries, and obtaining regulatory approval in one country does not mean that regulatory approval will be obtained in any other country. Approval processes vary among countries and can involve additional product testing and validation and additional administrative review periods. Seeking non-U.S. regulatory approval could require additional nonclinical studies or clinical trials, which could be costly and time consuming. The non-U.S.
50
regulatory approval process may include all of the risks associated with obtaining FDA approval. For all of these reasons, we may not obtain non-U.S. regulatory approvals on a timely basis, if at all.
The process to develop, obtain regulatory approval for and commercialize drug candidates is long, complex and costly both inside and outside the United States and China, and approval is never guaranteed. Even if our drug candidates were to successfully obtain approval from the regulatory authorities, any approval might significantly limit the approved indications for use, or require that precautions, contraindications or warnings be included on the product labeling, or require expensive and time-consuming post-approval clinical trials or surveillance as conditions of approval. Following any approval for commercial sale of our drug candidates, certain changes to the drug, such as changes in manufacturing processes and additional labeling claims, may be subject to additional review and approval by the FDA, NMPA and EMA and comparable regulatory authorities. Also, regulatory approval for any of our drug candidates may be withdrawn. If we are unable to obtain regulatory approval for our drug candidates in one or more jurisdictions, or any approval contains significant limitations, our target market will be reduced and our ability to realize the full market potential of our drug candidates will be harmed. Furthermore, we may not be able to obtain sufficient funding or generate sufficient revenue and cash flows to continue the development of any other drug candidate in the future.
We have limited manufacturing capability and must rely on third-party manufacturers to manufacture our clinical supplies and commercial products, if and when approved, and if they fail to meet their obligations, the development and commercialization of our products could be adversely affected.
We have limited manufacturing capabilities and experience. Our drug candidates are composed of multiple components and require specialized formulations for which scale-up and manufacturing could be difficult. We have limited experience in such scale-up and manufacturing requiring us to depend on a limited number of third parties, who may not be able to deliver in a timely manner, or at all. In order to develop products, apply for regulatory approvals, and commercialize our products, we will need to develop, contract for, or otherwise arrange for the necessary manufacturing capabilities. There are risks inherent in pharmaceutical manufacturing that could affect the ability of our contract manufacturers to meet our delivery time requirements or provide adequate amounts of material to meet our needs.
Additionally, our internally-developed drug candidates have not yet been manufactured for commercial use. If any of our drug candidates become approved for commercial sale, we will need to establish either internal or third-party manufacturing capacity. Manufacturing partner requirements may require us to fund capital improvements, perhaps on behalf of third parties, to support the scale-up of manufacturing and related activities. We may not be able to establish scaled manufacturing capacity for an approved drug in a timely or economic manner, if at all. If we or our third-party manufacturers are unable to provide commercial quantities of such an approved drug, we will have to successfully transfer manufacturing technology to a different manufacturer. Engaging a new manufacturer for such an approved drug could require us to conduct comparative studies or utilize other means to determine bioequivalence of the new and prior manufacturers’ products, which could delay or prevent our ability to commercialize such an approved drug. If we or any of these manufacturers is unable or unwilling to increase its manufacturing capacity or if we are unable to establish alternative arrangements on a timely basis or on acceptable terms, the development and commercialization of such an approved drug may be delayed or there may be a shortage in supply. Any inability to manufacture our drug candidates or future approved drugs in sufficient quantities when needed would seriously harm our business.
Manufacturers of our approved drugs, if any, must comply with cGMP requirements enforced by the FDA, NMPA and other comparable foreign health authorities through facilities inspection programs. These requirements include quality control, quality assurance, and the maintenance of records and documentation. Manufacturers of our approved drugs, if any, may be unable to comply with these cGMP requirements and with other FDA, NMPA, state, and foreign regulatory requirements. A failure to comply with these requirements may result in fines and civil penalties, suspension of production, suspension or delay in product approval, product seizure or recall, or withdrawal of product approval. If the safety of any quantities supplied is compromised due to a manufacturer’s failure to adhere to applicable laws or for other reasons, we may not be able to obtain regulatory approval for or successfully commercialize our products, which would seriously harm our business.
Our drugs and any future approved drug candidates may fail to achieve the degree of market acceptance by physicians, patients, third-party payors and others in the medical community necessary for commercial success.
Our drugs and any future approved drug candidates may fail to gain sufficient market acceptance by physicians, patients, third-party payors and others in the medical community. For example, current cancer treatments like chemotherapy and radiation therapy are well established in the medical community, and doctors may continue to rely on these treatments to the exclusion of our drugs and drug candidates. In addition, physicians, patients and third-party payors may prefer other novel products to ours. If our drugs and drug candidates do not achieve an adequate level of acceptance, we may not generate
51
significant product revenues and we may not become profitable. The degree of market acceptance of our drugs and drug candidates, if approved for commercial sale, will depend on a number of factors, including:
|
•
|
the clinical indications for which our drugs and drug candidates are approved;
|
|
•
|
physicians, hospitals, cancer treatment centers and patients considering our drugs and drug candidates as a safe and effective treatment;
|
|
•
|
the potential and perceived advantages of our drugs and drug candidates over alternative treatments;
|
|
•
|
the prevalence and severity of any side effects;
|
|
•
|
product labeling or product insert requirements of regulatory authorities;
|
|
•
|
limitations or warnings contained in the labeling approved by regulatory authorities;
|
|
•
|
the timing of market introduction of our drugs and drug candidates as well as competitive drugs;
|
|
•
|
the cost of treatment in relation to alternative treatments;
|
|
•
|
the availability of adequate coverage, reimbursement and pricing by third-party payors and government authorities;
|
|
•
|
the willingness of patients to pay out-of-pocket in the absence of coverage and reimbursement by third-party payors and government authorities; and
|
|
•
|
the effectiveness of our sales and marketing efforts.
|
If any drugs that we commercialize fail to achieve market acceptance among physicians, patients, hospitals, cancer treatment centers or others in the medical community, we will not be able to generate significant revenue. Even if our drugs achieve market acceptance, we may not be able to maintain that market acceptance over time if new products or technologies are introduced that are more favorably received than our drugs, are more cost effective or render our drugs obsolete.
We have limited experience in marketing third-party drugs and no experience in launching an internally-developed drug candidate. If we are unable to further develop marketing and sales capabilities or enter into agreements with third parties to market and sell our drug candidates and third-party drugs, we may not be able to generate product sales revenue.
In connection with our strategic collaboration with Celgene, we were granted an exclusive license in China, excluding Hong Kong, Macau and Taiwan, to commercialize Celgene’s approved cancer therapies, ABRAXANE
®
, REVLIMID
®
, and VIDAZA
®
, and Celgene’s investigational agent avadomide (CC-122) in clinical development, and acquired Celgene’s commercial operations in China, excluding certain functions. We started marketing Celgene’s approved drugs in September 2017. We continue to build our salesforce in China to market these drugs and our drug candidates, in the event they receive commercial approval, and any additional drugs or drug candidates that we may in-license, which will require significant capital expenditures, management resources and time.
We have not yet demonstrated an ability to launch and commercialize any of our drug candidates. For example, we do not have experience in building a commercial team, conducting a comprehensive market analysis, obtaining state licenses and reimbursement, or managing distributors and a sales force for our internally-developed drug candidates. As a result, our ability to successfully commercialize our drug candidates may involve more inherent risk, take longer, and cost more than it would if we were a company with experience launching drug candidates.
We will have to compete with other pharmaceutical and biotechnology companies to recruit, hire, train and retain marketing and sales personnel. If we are unable to, or decide not to, further develop internal sales, marketing and commercial distribution capabilities for any or all of our drugs, we will likely pursue collaborative arrangements regarding the sales and marketing of our drugs. However, there can be no assurance that we will be able to establish or maintain such collaborative arrangements, or if we are able to do so, that they will have effective sales forces. Any revenue we receive will depend upon the efforts of such third parties. We would have little or no control over the marketing and sales efforts of such third parties, and our revenue from product sales may be lower than if we had commercialized our drugs ourselves. We also face competition in our search for third parties to assist us with the sales and marketing efforts for our drugs.
52
There can be no assurance that we will be able to further develop and successfully maintain in-house sales and commercial distribution capabilities or establish or maintain relationships with third-party collaborators to successfully commercialize any product, and as a result, we may not be able to generate product sales revenue.
We face substantial competition, which may result in others discovering, developing or commercializing competing drugs before or more successfully than we do.
The development and commercialization of new drugs is highly competitive. We face competition from major pharmaceutical companies, specialty pharmaceutical companies and biotechnology companies worldwide. There are a number of large pharmaceutical and biotechnology companies that currently market and sell drugs or are pursuing the development of drugs for the treatment of cancer for which we are commercializing our drugs or developing our drug candidates. Potential competitors also include academic institutions, government agencies and other public and private research organizations that conduct research, seek patent protection and establish collaborative arrangements for research, development, manufacturing and commercialization.
Our commercial opportunity could be reduced or eliminated if our competitors develop and commercialize drugs that are safer, more effective, have fewer or less severe side effects, are more convenient or are less expensive than any drugs that we commercialize or may develop. Our competitors also may obtain approval from the FDA, NMPA, EMA or other comparable regulatory authorities for their drugs more rapidly than we may obtain approval for ours, which could result in our competitors establishing a strong market position before we are able to enter the market and or slow our regulatory approval.
Many of the companies against which we are competing or against which we may compete in the future have significantly greater financial resources and expertise in research and development, manufacturing, preclinical testing, conducting clinical trials, obtaining regulatory approvals and marketing approved drugs than we do. Mergers and acquisitions in the pharmaceutical and biotechnology industries may result in even more resources being concentrated among a smaller number of our competitors. Smaller and other early-stage companies may also prove to be significant competitors, particularly through collaborative arrangements with large and established companies. These third parties compete with us in recruiting and retaining qualified scientific and management personnel, establishing clinical trial sites and patient registration for clinical trials, as well as in acquiring technologies complementary to, or necessary for, our programs.
The market opportunities for our drugs and drug candidates may be limited to those patients who are ineligible for or have failed prior treatments and may be small.
In markets with approved therapies, we expect to initially seek approval of our drug candidates as a later stage therapy for patients who have failed other approved treatments. Subsequently, for those drugs that prove to be sufficiently beneficial, if any, we would expect to seek approval as a second line therapy and potentially as a first line therapy, but there is no guarantee that our drug candidates, even if approved, would be approved for second line or first line therapy.
Our projections of both the number of people who have the cancers we are targeting, as well as the subset of people with these cancers in a position to receive later stage therapy and who have the potential to benefit from treatment with our drug candidates, are based on our beliefs and estimates and may prove to be inaccurate or based on imprecise data. Further, new studies may change the estimated incidence or prevalence of these cancers. The number of patients may turn out to be lower than expected. Additionally, the potentially addressable patient population for our drugs and drug candidates may be limited or may not be amenable to treatment with our drugs and drug candidates. Even if we obtain significant market share for our drug candidates, because the potential target populations are small, we may never achieve profitability without obtaining regulatory approval for additional indications, including use as a first or second line therapy.
We may be subject, directly or indirectly, to applicable anti-kickback, false claims laws, physician payment transparency laws, fraud and abuse laws or similar healthcare and security laws and regulations in the United States and other jurisdictions, which could expose us to criminal sanctions, civil penalties, contractual damages, reputational harm and diminished profits and future earnings.
Healthcare providers, physicians and others play a primary role in the recommendation and prescription of any products for which we obtain regulatory approval. If we obtain FDA approval for any of our drug candidates and begin commercializing those drugs in the United States, our operations may be subject to various federal and state fraud and abuse laws, including, without limitation, the federal Anti-Kickback Statute, the federal False Claims Act, and physician payment sunshine laws and regulations. These laws may impact, among other things, our proposed sales, marketing and education programs. In addition, we may be subject to patient privacy regulation by both the federal government and the states in which we conduct our business.
53
Additionally, we are subject to state and non-U.S. equivalents of each of the healthcare laws described above, among others, some of which may be broader in scope and may apply to healthcare services reimbursed by any source, not just governmental payors, including private insurers. In addition, some states have passed laws that require pharmaceutical companies to comply with the April 2003 Office of Inspector General Compliance Program Guidance for Pharmaceutical Manufacturers and/or other voluntary industry codes of conduct. Several states also impose other marketing restrictions or require pharmaceutical companies to make marketing or price disclosures to the state. There are ambiguities as to what is required to comply with these state requirements, and if we fail to comply with an applicable state law requirement, we could be subject to penalties.
Violations of fraud and abuse laws may be punishable by criminal and/or civil sanctions, including penalties, fines and/or exclusion or suspension from federal and state healthcare programs such as Medicare and Medicaid and debarment from contracting with the U.S. government. In addition, private individuals have the ability to bring actions on behalf of the U.S. government under the federal False Claims Act as well as under the false claims laws of several states.
Neither the U.S. government nor the U.S. courts have provided definitive guidance on the applicability of fraud and abuse laws to our business. Law enforcement authorities are increasingly focused on enforcing these laws, and it is possible that some of our practices may be challenged under these laws. Efforts to ensure that our business arrangements with third parties will comply with applicable healthcare laws and regulations will involve substantial costs. It is possible that governmental authorities will conclude that our business practices may not comply with current or future statutes, regulations or case law involving applicable fraud and abuse or other healthcare laws and regulations. If any such actions are instituted against us, and we are not successful in defending ourselves or asserting our rights, those actions could have a significant impact on our business, including the imposition of civil, criminal and administrative penalties, damages, disgorgement, monetary fines, possible exclusion from participation in Medicare, Medicaid and other federal healthcare programs, contractual damages, reputational harm, diminished profits and future earnings, and curtailment of our operations, any of which could adversely affect our ability to operate our business and our results of operations. In addition, the approval and commercialization of any of our drug candidates outside the United States will also likely subject us to non-U.S. equivalents of the healthcare laws mentioned above, among other non-U.S. laws.
If any of the physicians or other providers or entities with whom we expect to do business are found to be not in compliance with applicable laws, they may be subject to criminal, civil or administrative sanctions, including exclusions from government funded healthcare programs, which may also adversely affect our business.
We may explore the licensing of commercialization rights or other forms of collaboration worldwide, which will expose us to additional risks of conducting business in additional international markets.
Non-U.S. markets are an important component of our growth strategy. For example, in connection with the Celgene transactions, we retained exclusive rights for the development and commercialization of tislelizumab for hematological cancers globally and for solid tumors in China and the rest of Asia, other than Japan. We initially intend to focus on opportunities in China, in particular. If we fail to obtain licenses or enter into collaboration arrangements with third parties in other markets, or if these parties are not successful, our revenue-generating growth potential will be adversely affected. Moreover, international business relationships subject us to additional risks that may materially adversely affect our ability to attain or sustain profitable operations, including:
|
•
|
efforts to enter into collaboration or licensing arrangements with third parties in connection with our international sales, marketing and distribution efforts may increase our expenses or divert our management’s attention from the acquisition or development of drug candidates;
|
|
•
|
difficulty of effective enforcement of contractual provisions in local jurisdictions;
|
|
•
|
potential third-party patent rights or potentially reduced protection for intellectual property rights;
|
|
•
|
unexpected changes in tariffs, trade barriers and regulatory requirements, including the loss of normal trade status between China and the United States;
|
|
•
|
economic weakness, including inflation;
|
|
•
|
compliance with tax, employment, immigration and labor laws for employees traveling abroad;
|
|
•
|
the effects of applicable non-U.S. tax structures and potentially adverse tax consequences;
|
54
|
•
|
currency fluctuations, which could result in increased operating expenses and reduced revenue;
|
|
•
|
workforce uncertainty and labor unrest;
|
|
•
|
failure of our employees and contracted third parties to comply with Office of Foreign Asset Control rules and regulations and the Foreign Corrupt Practices Act and other anti-bribery and corruption laws; and
|
|
•
|
business interruptions resulting from geo-political actions, including trade disputes, war and terrorism, or natural disasters, including earthquakes, volcanoes, typhoons, floods, hurricanes and fires.
|
These and other risks may materially adversely affect our ability to attain or sustain revenue from international markets.
The illegal distribution and sale by third parties of counterfeit versions of our drugs or stolen products could have a negative impact on our reputation and business.
Third parties might illegally distribute and sell counterfeit or unfit versions of our drugs, which do not meet our or our collaborators’ rigorous manufacturing and testing standards. A patient who receives a counterfeit or unfit drug may be at risk for a number of dangerous health consequences. Our reputation and business could suffer harm as a result of counterfeit or unfit drugs sold under our or our collaborators’ brand name(s). In addition, thefts of inventory at warehouses, plants or while in-transit, which are not properly stored and which are sold through unauthorized channels, could adversely impact patient safety, our reputation and our business.
Risks Related to Our Financial Position and Need for Additional Capital
We have a limited operating history, which may make it difficult to evaluate our current business and predict our future performance.
We are a commercial-stage biotechnology company formed in October 2010. Our operations to date have focused on organizing and staffing our company, business planning, raising capital, establishing our intellectual property portfolio, conducting preclinical studies and clinical trials of our drug candidates, developing and operating internal manufacturing capabilities, and the commercialization of our drugs. We have not yet completed large-scale, pivotal or registrational clinical trials, obtained regulatory approvals, or manufactured or had manufactured a commercial scale drug. We have no internally-developed products approved for commercial sale and have not generated any revenue from internally-developed product sales. Since September 2017, we have generated revenues from the sale of drugs in China licensed from Celgene. Our limited operating history, particularly in light of the rapidly evolving cancer treatment field, may make it difficult to evaluate our current business and reliably predict our future performance. We may encounter unforeseen expenses, difficulties, complications, delays and other known and unknown factors. If we do not address these risks and difficulties successfully, our business will suffer.
We have incurred significant net losses since our inception and anticipate that we will continue to incur net losses for the foreseeable future and may never become profitable.
Investment in pharmaceutical drug development is highly speculative. It entails substantial upfront capital expenditures and significant risk that a drug candidate will fail to gain regulatory approval or become commercially viable. We continue to incur significant expenses related to our ongoing operations. As a result, we have incurred losses in each period since our inception, except in the third quarter of 2017, when we were profitable due to revenue recognized from an up-front license fee from Celgene. As of December 31, 2018 and 2017, we had an accumulated deficit of
$1.0 billion
and
$330.5 million
, respectively. Substantially all of our operating losses have resulted from costs incurred in connection with our research and development programs and from selling, general and administrative expenses associated with our operations.
We expect to continue to incur losses for the foreseeable future, and we expect these losses to increase in the near term as we continue and expand our development of, and seek regulatory approvals for, our drug candidates, and our manufacturing facilities, and continue to commercialize the drugs that we have licensed from Celgene in China and any other drugs that we may successfully develop or license. Typically, it takes many years to develop one new drug from the time it is discovered to when it is available for treating patients. In addition, we will continue to incur costs associated with operating as a public company in the United States and Hong Kong. We will also incur costs in support of our growth as a commercial-stage global biotechnology company. The size of our future net losses will depend, in part, on the number and scope of our drug development programs and the associated costs of those programs, the cost of our manufacturing activities, the cost of commercializing any approved products, our ability to generate revenues and the timing and amount of milestones and other
55
payments we make or receive with arrangements with third parties. If any of our drug candidates fail in clinical trials or do not gain regulatory approval, or if approved, fail to achieve market acceptance, we may never become profitable. Even if we achieve profitability in the future, we may not be able to sustain profitability in subsequent periods. Our failure to become and remain profitable would decrease the value of our company and could impair our ability to raise capital, maintain our research and development efforts, expand our business or continue our operations.
We will need to obtain additional financing to fund our operations, and if we are unable to obtain such financing, we may be unable to complete the development and commercialization of our primary drug candidates.
Our drug candidates will require the completion of clinical development, regulatory review, scale up and availability of manufacturing resources, significant marketing efforts and substantial investment before they can provide us with product sales revenue. Our operations have consumed substantial amounts of cash since inception. Our operating activities
used
$547.7 million
and
provided
$12.8 million
of net cash during the years ended December 31, 2018 and 2017, respectively. We recorded negative net cash flows from operating activities in 2018 primarily due to our net loss of
$674.0 million
. Although we recorded positive net cash flows from operating activities in 2017, primarily due to the upfront fees received from the Celgene collaboration, we cannot assure you that we will be able to generate positive cash flows from operating activities in the future. Our liquidity and financial condition may be materially and adversely affected by the negative net cash flows, and we cannot assure you that we will have sufficient cash from other sources to fund our operations. If we resort to other financing activities to generate additional cash, we will incur financing costs and we cannot guarantee that we will be able to obtain the financing on terms acceptable to us, or at all, and if we raise finance by issuing further equity securities your interest in our company may be diluted. If we have negative operating cash flows in the future, our liquidity and financial condition may be materially and adversely affected.
We expect to continue to spend substantial amounts on drug discovery, advancing the clinical development of our drug candidates, developing our manufacturing capabilities and securing drug supply, commercializing our drugs and launching and commercializing any drug candidates for which we receive regulatory approval, including building our own commercial organization to address markets in China, the United States and other markets.
While we have generated product revenue in China since September 2017 from sales of our drugs licensed from Celgene, these revenues are not sufficient to support our operations. Although it is difficult to predict our liquidity requirements, based upon our current operating plan, we believe that we have sufficient cash, cash equivalents and short-term investments to meet our projected operating requirements for at least the next 12 months. However, we believe that our existing cash, cash equivalents and short-term investments will not be sufficient to enable us to complete all global development or commercially launch all of our current drug candidates for the currently anticipated indications and to invest in additional programs. Accordingly, we will require further funding through public or private offerings, debt financing, collaboration and licensing arrangements or other sources. Our forecast of the period of time through which our financial resources will be adequate to support our operations is a forward-looking statement and involves risks and uncertainties, and actual results could vary as a result of a number of factors, including the factors discussed elsewhere in this “Risk Factors” section. We have based this estimate on assumptions that may prove to be wrong, and we could exhaust our available capital resources sooner than we currently expect. Our future funding requirements will depend on many factors, including:
|
•
|
the progress, timing, scope and costs of our clinical trials, including the ability to timely enroll patients in our planned and potential future clinical trials;
|
|
•
|
the outcome, timing and cost of regulatory approvals of our drug candidates;
|
|
•
|
the number and characteristics of drug candidates that we may in-license and develop;
|
|
•
|
the amount and timing of the milestone and royalty payments we receive from our collaborators;
|
|
•
|
the cost of filing, prosecuting, defending and enforcing any patent claims and other intellectual property rights;
|
|
•
|
selling and marketing costs associated with our drugs in China and any future drug candidates that may be approved, including the cost and timing of expanding our marketing and sales capabilities;
|
|
•
|
the terms and timing of any potential future collaborations, licensing or other arrangements that we may establish;
|
|
•
|
cash requirements of any future acquisitions, licensing and/or the development of other drug candidates;
|
56
|
•
|
the cost and timing of development and completion of commercial-scale internal or outsourced manufacturing activities; and
|
|
•
|
our headcount growth and associated costs.
|
Adequate additional funding may not be available to us on acceptable terms, or at all. If we are unable to raise capital when needed or on attractive terms, we would be forced to delay, reduce or eliminate our research and development programs or future commercialization efforts. Our inability to obtain additional funding when we need it could seriously harm our business.
Raising additional capital may cause dilution to our shareholders, restrict our operations or require us to relinquish rights to our technologies or drug candidates.
We may seek additional funding through a combination of equity offerings, debt financings, collaborations and licensing arrangements. To the extent that we raise additional capital through the sale of equity or convertible debt securities, your ownership interest will be diluted, and the terms may include liquidation or other preferences that adversely affect your rights as a holder of our ordinary shares and/or ADSs. The incurrence of additional indebtedness or the issuance of certain equity securities could result in increased fixed payment obligations and could also result in certain additional restrictive covenants, such as limitations on our ability to incur additional debt or issue additional equity, limitations on our ability to acquire or license intellectual property rights and other operating restrictions that could adversely impact our ability to conduct our business. In addition, issuance of additional equity securities, or the possibility of such issuance, may cause the market price of our ADSs and/or ordinary shares to decline. In the event that we enter into collaborations or licensing arrangements in order to raise capital, we may be required to accept unfavorable terms, including relinquishing or licensing to a third party on unfavorable terms our rights to technologies or drug candidates that we otherwise would seek to develop or commercialize ourselves or potentially reserve for future potential arrangements when we might be able to achieve more favorable terms.
Fluctuations in exchange rates could result in foreign currency exchange losses and could materially reduce the value of your investment.
We incur portions of our expenses, and derive revenues, in currencies other than the U.S. dollar or Hong Kong dollar, in particular, the RMB, the Euro, and Australian dollar. As a result, we are exposed to foreign currency exchange risk as our results of operations and cash flows are subject to fluctuations in foreign currency exchange rates. We do not regularly engage in hedging transactions to protect against uncertainty in future exchange rates between particular foreign currencies and the U.S. dollar. A decline in the value of the U.S. dollar against currencies in countries in which we conduct clinical trials could have a negative impact on our research and development costs. We cannot predict the impact of foreign currency fluctuations, and foreign currency fluctuations in the future may adversely affect our financial condition, results of operations and cash flows.
The value of the RMB against the U.S. dollar and other currencies may fluctuate and is affected by, among other things, changes in political and economic conditions and the foreign exchange policy proposed or adopted by the People’s Republic of China, or PRC, Australia and other non-U.S. governments. It is difficult to predict how market forces or PRC, Australia, other non-U.S. governments and U.S. government policies may impact the exchange rate of RMB and the U.S. dollar or any other currencies in the future. There remains significant international pressure on the PRC government to adopt a more flexible currency policy, including from the U.S. government, which has threatened to label China as a “currency manipulator,” which could result in greater fluctuation of the RMB against the U.S. dollar.
Substantially all of our revenues are denominated in U.S. dollars and RMB, and our costs are denominated in U.S. dollars, Australian dollars and RMB, and a large portion of our financial assets and a significant portion of our debt is denominated in U.S. dollars and RMB. Any significant revaluation of the RMB may materially reduce any dividends payable on our ordinary shares and/or ADSs in U.S. dollars. To the extent that we need to convert U.S. dollars into RMB for our operations, appreciation of the RMB against the U.S. dollar would have an adverse effect on the RMB amount we would receive. Conversely, if we decide to convert RMB into U.S. dollars for the purpose of making payments for dividends on our ADSs or for other business purposes, appreciation of the U.S. dollar against the RMB would have a negative effect on the U.S. dollar amount we would receive.
In addition, there are limited instruments available for us to reduce our foreign currency risk exposure at reasonable costs. Furthermore, we are also currently required to obtain the State Administration of Foreign Exchange's approval before converting significant sums of foreign currencies into RMB. All of these factors could materially and adversely affect our business, financial condition, results of operations and prospects, and could reduce the value of, and dividends payable on, our ordinary shares and/or ADSs in foreign currency terms.
57
Our business, profitability and liquidity may be adversely affected by deterioration in the credit quality of, or defaults by, our distributors and customers, and an impairment in the carrying value of our short-term investments could negatively affect our consolidated results of operations.
We are exposed to the risk that our distributors and customers may default on their obligations to us as a result of bankruptcy, lack of liquidity, operational failure or other reasons. As we continue to expand our business, the amount and duration of our credit exposure will be expected to increase over the next few years, as will the breadth of the entities to which we have credit exposure. Although we regularly review our credit exposure to specific distributors and customers that we believe may present credit concerns, default risks may arise from events or circumstances that are difficult to detect or foresee.
Also, the carrying amounts of cash and cash equivalents, restricted cash and short-term investments represent the maximum amount of loss due to credit risk. We had cash and cash equivalents of
$712.9 million
and
$239.6 million
, restricted cash of
$27.8 million
and
nil
and short-term investments of
$1.1 billion
and
$597.9 million
at December 31, 2018 and 2017, respectively, most of which are deposited in financial institutions outside of China. Although our cash and cash equivalents in China are deposited with various major reputable financial institutions, the deposits placed with these financial institutions are not protected by statutory or commercial insurance. In the event of bankruptcy of one of these financial institutions, we may be unlikely to claim our deposits back in full. As of December 31, 2018 and December 31, 2017, our short-term investments consisted primarily of U.S. Treasury securities, U.S. agency securities and time deposits. Although we believe that the U.S. Treasury securities, U.S. agency securities and time deposits are of high credit quality and continually monitor the credit worthiness of these institutions, concerns about, or a default by, one institution in the U.S. market, could lead to significant liquidity problems, losses or defaults by other institutions, which in turn could adversely affect us.
Risks Related to Our Intellectual Property
If we are unable to obtain and maintain patent protection for our drug candidates and drugs through intellectual property rights, or if the scope of such intellectual property rights obtained is not sufficiently broad, third parties may compete directly against us.
Our success depends in large part on our ability to protect our proprietary technology and drug candidates and drugs from competition by obtaining, maintaining and enforcing our intellectual property rights, including patent rights. We seek to protect the drugs, drug candidates and technology that we consider commercially important by filing patent applications in the United States, the PRC and other countries, relying on trade secrets or pharmaceutical regulatory protection or employing a combination of these methods. This process is expensive and time-consuming, and we may not be able to file and prosecute all necessary or desirable patent applications at a reasonable cost or in a timely manner. It is also possible that we will fail to identify patentable aspects of our research and development output before it is too late to obtain patent protection.
The patent prosecution process is expensive, time-consuming and complex, and we may not be able to file, prosecute, maintain, enforce or license all necessary or desirable patent applications at a reasonable cost or in a timely manner. As a result, we may not be able to prevent competitors from developing and commercializing competitive drugs in all such fields and territories.
Patents may be invalidated and patent applications may not be granted for a number of reasons, including known or unknown prior art, deficiencies in the patent applications or the lack of novelty of the underlying invention or technology. It is also possible that we will fail to identify patentable aspects of our research and development output in time to obtain patent protection. Although we enter into non-disclosure and confidentiality agreements with parties who have access to confidential or patentable aspects of our research and development output, such as our employees, corporate collaborators, outside scientific collaborators, contract manufacturers, consultants, advisors and any other third parties, any of these parties may breach such agreements and disclose such output before a patent application is filed, thereby jeopardizing our ability to seek patent protection. In addition, publications of discoveries in the scientific literature often lag behind the actual discoveries, and patent applications in the United States and other jurisdictions are typically not published until 18 months after filing, or in some cases, not at all. Therefore, we cannot be certain that we were the first to make the inventions claimed in our patents or pending patent applications or that we were the first to file for patent protection of such inventions. Furthermore, the PRC and, recently, the United States have adopted the “first-to-file” system under which whoever first files a patent application will be awarded the patent if all other patentability requirements are met. Under the first-to-file system, third parties may be granted a patent relating to a technology which we invented.
In addition, under PRC patent law, any organization or individual that applies for a patent in a foreign country for an invention or utility model accomplished in China is required to report to the National Intellectual Property Administration, or NIPA, for security examination. Otherwise, if an application is later filed in China, the patent right will not be granted.
58
The coverage claimed in a patent application can be significantly reduced before the patent is issued, and its scope can be reinterpreted after issuance. Even if patent applications we license or own currently or in the future issue as patents, they may not issue in a form that will provide us with any meaningful protection, prevent competitors or other third parties from competing with us, or otherwise provide us with any competitive advantage. In addition, the patent position of biotechnology and pharmaceutical companies generally is highly uncertain, involves complex legal and factual questions, and has been the subject of much litigation in recent years. As a result, the issuance, scope, validity, enforceability and commercial value of our patent rights are highly uncertain.
The issuance of a patent is not conclusive as to its inventorship, scope, validity or enforceability, and our patents may be challenged in the courts or patent offices in the United States, PRC and other countries. We may be subject to a third-party preissuance submission of prior art to the USPTO or become involved in opposition, derivation, revocation, re-examination, post-grant and
inter partes
review, or interference proceedings or similar proceedings in foreign jurisdictions challenging our patent rights or the patent rights of others. An adverse determination in any such submission, proceeding or litigation could reduce the scope of, or invalidate, our patent rights, allow third parties to commercialize our technology or drug candidates and compete directly with us without payment to us, or result in our inability to manufacture or commercialize drug candidates without infringing, misappropriating or otherwise violating third-party patent rights. Moreover, we may have to participate in interference proceedings declared by the USPTO to determine priority of invention or in post-grant challenge proceedings, such as oppositions in a foreign patent office, that challenge the priority of our invention or other features of patentability of our patents and patent applications. Such challenges may result in loss of patent rights, loss of exclusivity, or in patent claims being narrowed, invalidated, or held unenforceable, which could limit our ability to stop others from using or commercializing similar or identical technology and products, or limit the duration of the patent protection of our technology and drug candidates. Such proceedings also may result in substantial costs and require significant time from our scientists and management, even if the eventual outcome is favorable to us. Consequently, we do not know whether any of our technology or drug candidates will be protectable or remain protected by valid and enforceable patents. Our competitors or other third parties may be able to circumvent our patents by developing similar or alternative technologies or products in a non-infringing manner.
Furthermore, although various extensions may be available, the life of a patent and the protection it affords, is limited. For example, the approved cancer therapies we have licensed from Celgene in China, ABRAXANE®, REVLIMID®, and VIDAZA®, face or are expected to face competition from generic medications, and we may face similar competition for any approved drug candidates even if we successfully obtain patent protection once the patent life has expired for the drug or if the patents are not enforced. Manufacturers of generic drugs may challenge the scope, validity or enforceability of our patents in court, and we may not be successful in enforcing or defending those intellectual property rights and, as a result, may not be able to develop or market the relevant product exclusively, which would have a material adverse effect on any potential sales of that product. The issued patents and pending patent applications, if issued, for our drug candidates are expected to expire on various dates as described in “Part I-Item 1-Business-Intellectual Property” of our Annual Report on Form 10-K for the year ended
December 31, 2018
. Upon the expiration of our issued patents or patents that may issue from our pending patent applications, we will not be able to assert such patent rights against potential competitors and our business and results of operations may be adversely affected.
Given the amount of time required for the development, testing and regulatory review of new drug candidates, patents protecting such drug candidates might expire before or shortly after such drug candidates are commercialized. As a result, our patents and patent applications may not provide us with sufficient rights to exclude others from commercializing products similar or identical to ours. Moreover, some of our patents and patent applications are, and may in the future be, co-owned with or licensed from third parties. If we are unable to obtain an exclusive license to any such third-party co-owners’ interest in such patents or patent applications, such co-owners may be able to license their rights to other third parties, including our competitors, and our competitors could market competing products and technology. In addition, we may need the cooperation of any such co-owners or the licensors of our patents in order to enforce such patents against third parties, and such cooperation may not be provided to us. Any of the foregoing could have a material adverse effect on our competitive position, business, financial conditions, results of operations and prospects.
We may not be able to protect our intellectual property rights throughout the world.
Filing, prosecuting, maintaining and defending patents on drug candidates in all countries throughout the world could be prohibitively expensive for us, and our intellectual property rights in some non-U.S. countries can have a different scope and strength than do those in the United States. In addition, the laws of certain non-U.S. countries do not protect intellectual property rights to the same extent as U.S. federal and state laws do. Consequently, we may not be able to prevent third parties from practicing our inventions in all countries outside the United States, or from selling or importing drugs made using our inventions in and into the United States or non-U.S. jurisdictions. Competitors may use our technologies in jurisdictions where we have not obtained patent protection to develop their own drugs and further, may export otherwise infringing drugs to non-
59
U.S. jurisdictions where we have patent protection, but where enforcement rights are not as strong as those in the United States. These drugs may compete with our drugs and drug candidates and our patent rights or other intellectual property rights may not be effective or adequate to prevent them from competing. In addition, we may not be able to enforce patents that we in-license from third parties, who may delay or decline to enforce patents in the licensed territory.
We currently hold issued trademark registrations and have trademark applications pending, any of which may be the subject of a governmental or third-party objection, which could prevent the maintenance or issuance of the same. If we are unsuccessful in obtaining trademark protection for our primary brands, we may be required to change our brand names, which could materially adversely affect our business. Moreover, as our products mature, our reliance on our trademarks to differentiate us from our competitors will increase, and as a result, if we are unable to prevent third parties from adopting, registering or using trademarks and trade dress that infringe, dilute or otherwise violate our trademark rights, our business could be materially adversely affected.
Many companies have encountered significant problems in protecting and defending intellectual property rights in certain jurisdictions, including China. The legal systems of some countries do not favor the enforcement of patents, trade secrets and other intellectual property, particularly those relating to biopharmaceutical products, which could make it difficult in those jurisdictions for us to stop the infringement or misappropriation of our patents or other intellectual property rights, or the marketing of competing drugs in violation of our proprietary rights.
We may not prevail in any lawsuits that we initiate and the damages or other remedies awarded, if any, may not be commercially meaningful. Accordingly, our efforts to enforce our intellectual property rights around the world may be inadequate to obtain a significant commercial advantage from the intellectual property that we develop.
We may become involved in lawsuits to protect or enforce our intellectual property, which could be expensive, time consuming and unsuccessful. Our patent rights relating to our drug candidates could be found invalid or unenforceable if challenged in court or before the USPTO or comparable non-U.S. authority.
Competitors may infringe our patent rights or misappropriate or otherwise violate our intellectual property rights. To counter infringement or unauthorized use, litigation may be necessary in the future to enforce or defend our intellectual property rights, to protect our trade secrets or to determine the validity and scope of our own intellectual property rights or the proprietary rights of others. This can be expensive and time consuming. Any claims that we assert against perceived infringers could also provoke these parties to assert counterclaims against us alleging that we infringe their intellectual property rights. Many of our current and potential competitors have the ability to dedicate substantially greater resources to enforce and/or defend their intellectual property rights than we can. Accordingly, despite our efforts, we may not be able to prevent third parties from infringing upon or misappropriating our intellectual property. An adverse result in any litigation proceeding could put our patent, as well as any patents that may issue in the future from our pending patent applications, at risk of being invalidated, held unenforceable or interpreted narrowly. Furthermore, because of the substantial amount of discovery required in connection with intellectual property litigation, there is a risk that some of our confidential information could be compromised by disclosure during this type of litigation.
In patent litigation in the United States, defendant counterclaims alleging invalidity or unenforceability are commonplace, and there are numerous grounds upon which a third party can assert invalidity or unenforceability of a patent. Third parties may also raise similar claims before administrative bodies in the United States or abroad, even outside the context of litigation. Such mechanisms include
ex parte
re-examination,
inter partes
review, post-grant review, derivation and equivalent proceedings in non-U.S. jurisdictions, such as opposition proceedings. Such proceedings could result in revocation or amendment to our patents in such a way that they no longer cover and protect our drug candidates. The outcome following legal assertions of invalidity and unenforceability is unpredictable. With respect to the validity of our patents, for example, we cannot be certain that there is no invalidating prior art of which we, our patent counsel, and the patent examiner were unaware during prosecution. If a defendant were to prevail on a legal assertion of invalidity and/or unenforceability, we would lose at least part, and perhaps all, of the patent protection on our drug candidates. Such a loss of patent protection could have a material adverse impact on our business.
We may not be able to prevent misappropriation of our trade secrets or confidential information, particularly in countries where the laws may not protect those rights as fully as in the United States.
60
If we are sued for infringing intellectual property rights of third parties, such litigation could be costly and time consuming and could prevent or delay us from developing or commercializing our drug candidates.
Our commercial success depends in part on our avoiding infringement of the patents and other intellectual property rights of third parties. We are aware of numerous issued patents and pending patent applications belonging to third parties that exist in fields in which we are developing our drug candidates. There may also be third-party patents or patent applications of which we are currently unaware, and given the dynamic area in which we operate, additional patents are likely to issue that relate to aspects of our business. There is a substantial amount of litigation and other claims and proceedings involving patent and other intellectual property rights in the biotechnology and pharmaceutical industries generally. As the biotechnology and pharmaceutical industries expand and more patents are issued, the risk increases that our drug candidates may give rise to claims of infringement of the patent rights of others.
Third parties may assert that we are using technology in violation of their patent or other proprietary rights. Defense of these claims, regardless of their merit, could involve substantial litigation expense and divert our technical personnel, management personnel, or both from their normal responsibilities. Even in the absence of litigation, we may seek to obtain licenses from third parties to avoid the risks of litigation, and if a license is available, it could impose costly royalty and other fees and expenses on us.
If third parties bring successful claims against us for infringement of their intellectual property rights, we may be subject to injunctive or other equitable relief, which could prevent us from developing and commercializing one or more of our drug candidates. Defense of these claims, regardless of their merit, would involve substantial litigation expense and would be a substantial diversion of employee resources from our business. In the event of a successful claim against us of infringement or misappropriation, or a settlement by us of any such claims, we may have to pay substantial damages, including treble damages and attorneys’ fees in the case of willful infringement, pay royalties or redesign our infringing drug candidates, which may be impossible or require substantial time and cost. In the event of an adverse result in any such litigation, or even in the absence of litigation, we may need to obtain licenses from third parties to advance our research or allow commercialization of our drug candidates. Any such license might not be available on reasonable terms or at all. In the event that we are unable to obtain such a license, we would be unable to further develop and commercialize one or more of our drug candidates, which could harm our business significantly. We may also elect to enter into license agreements in order to settle patent infringement claims or to resolve disputes prior to litigation, and any such license agreements may require us to pay royalties and other fees that could significantly harm our business.
We are aware of U.S. patents with claims covering certain antibodies that are relevant to tislelizumab for which patents are expected to expire in 2023 or 2024; complexes of irreversible BTK inhibitors that are relevant to zanubrutinib for which the patent is expected to expire in 2027; and the use of PARP inhibitors to treat certain cancers that are relevant to pamiparib for which patents are expected to expire between 2027 and 2031. We are also aware of issued patents in Europe and China relevant to pamiparib. Although we believe that the relevant claims of these patents would likely be held invalid, we can provide no assurance that a court or an administrative agency would agree with our assessment. If the validity of the relevant claims of one or more of these patents were to be upheld upon a validity challenge, and our related drug candidate was to be approved for sale in the United States before the expiration of the relevant patents, we would need a license to commercialize the drug candidate in the United States before the expiration of the relevant patents. In addition, depending upon the circumstances, we may need licenses for jurisdictions outside of the United States where we wish to commercialize a particular drug candidate before the expiration of corresponding patents covering that drug candidate. In such cases, we can provide no assurance that we would be able to obtain a license or licenses on commercially reasonable terms or at all, which could materially and adversely affect our business.
Even if litigation or other proceedings are resolved in our favor, there could be public announcements of the results of hearings, motions or other interim proceedings or developments, and if securities analysts or investors perceive these results to be negative, it could have a substantial adverse effect on the market price of the ordinary shares and/or ADSs. Such litigation or proceedings could substantially increase our operating losses and reduce the resources available for development activities or any future sales, marketing or distribution activities. We may not have sufficient financial or other resources to adequately conduct such litigation or proceedings. Some of our competitors may be able to sustain the costs of such litigation or proceedings more effectively than we can because of their greater financial resources. Uncertainties resulting from the initiation and continuation of patent litigation or other proceedings could have a material adverse effect on our ability to compete in the marketplace.
61
Obtaining and maintaining our patent protection depends on compliance with various procedural, document submission, fee payment, and other requirements imposed by governmental patent agencies, and our patent protection could be reduced or eliminated for noncompliance with these requirements.
Periodic maintenance fees on any issued patent are due to be paid to the USPTO and other patent agencies in several stages over the lifetime of the patent. The USPTO and various non-U.S. governmental patent agencies require compliance with a number of procedural, documentary, fee payment, and other similar provisions during the patent application process. Although an inadvertent lapse can in many cases be cured by payment of a late fee or by other means in accordance with the applicable rules, there are situations in which noncompliance can result in abandonment or lapse of the patent or patent application, resulting in partial or complete loss of patent rights in the relevant jurisdiction. Noncompliance events that could result in abandonment or lapse of a patent or patent application include failure to respond to official actions within prescribed time limits, non-payment of fees, and failure to properly legalize and submit formal documents. In any such event, our competitors might be able to enter the market, which would have a material adverse effect on our business.
If we do not obtain patent term extension and data exclusivity for any drug candidates we may develop, our business may be materially harmed.
Depending upon the timing, duration and specifics of any FDA marketing approval of any drug candidates we may develop, one or more of our U.S. patents may be eligible for limited patent term extension under the Drug Price Competition and Patent Term Restoration Action of 1984, or Hatch Waxman Amendments. The Hatch Waxman Amendments permit a patent extension term of up to five years as compensation for patent term lost during clinical trials and the FDA regulatory review process. A patent term extension cannot extend the remaining term of a patent beyond a total of 14 years from the date of drug approval, only one patent may be extended and only those claims covering the approved drug, a method for using it, or a method for manufacturing it may be extended. However, we may not be granted an extension because of, for example, failing to exercise due diligence during the testing phase or regulatory review process, failing to apply within applicable deadlines, failing to apply prior to expiration of relevant patents, or otherwise failing to satisfy applicable requirements. Moreover, the applicable time period or the scope of patent protection afforded could be less than we request. In addition, no patent term extension system has been established in the PRC beyond the new pilot program, and implementation of the pilot program may not occur quickly. As a result, the patents we have in the PRC are not yet eligible to be extended for patent term lost during clinical trials and the regulatory review process. If we are unable to obtain patent term extension or term of any such extension is less than we request, our competitors may obtain approval of competing products following our patent expiration, and our business, financial condition, results of operations, and prospects could be materially harmed.
Changes in patent law could diminish the value of patents in general, thereby impairing our ability to protect our drug candidates.
The United States has recently enacted and is currently implementing wide-ranging patent reform legislation. Recent U.S. Supreme Court rulings have narrowed the scope of patent protection available in certain circumstances and weakened the rights of patent owners in certain situations. In addition to increasing uncertainty with regard to our ability to obtain patents in the future, this combination of events has created uncertainty with respect to the value of patents once obtained, if any. Depending on decisions by the U.S. Congress, the federal courts and the USPTO, the laws and regulations governing patents could change in unpredictable ways that would weaken our ability to obtain new patents or to enforce our existing patents and patents that we might obtain in the future. There could be similar changes in the laws of foreign jurisdictions that may impact the value of our patent rights or our other intellectual property rights.
If we are unable to protect the confidentiality of our trade secrets, our business and competitive position would be harmed. We may be subject to claims that our employees have wrongfully used or disclosed alleged trade secrets of their former employers.
In addition to our issued patent and pending patent applications, we rely on trade secrets, including unpatented know-how, technology and other proprietary information, to maintain our competitive position and to protect our drug candidates. We seek to protect these trade secrets, in part, by entering into non-disclosure and confidentiality agreements with parties that have access to them, such as our employees, corporate collaborators, outside scientific collaborators, sponsored researchers, contract manufacturers, consultants, advisors and other third parties. We also enter into confidentiality and invention or patent assignment agreements with our employees and consultants. However, any of these parties may breach such agreements and disclose our proprietary information, and we may not be able to obtain adequate remedies for such breaches. Enforcing a claim that a party illegally disclosed or misappropriated a trade secret can be difficult, expensive and time-consuming, and the outcome is unpredictable. If any of our trade secrets were to be lawfully obtained or independently developed by a competitor,
62
we would have no right to prevent them from using that technology or information to compete with us and our competitive position would be harmed.
Furthermore, many of our employees, including our senior management, were previously employed at other biotechnology or pharmaceutical companies, including our competitors or potential competitors. Some of these employees, including each member of our senior management, executed proprietary rights, non-disclosure and non-competition agreements in connection with such previous employment. Although we try to ensure that our employees do not use the proprietary information or know-how of others in their work for us, we may be subject to claims that we or these employees have used or disclosed intellectual property, including trade secrets or other proprietary information, of any such employee’s former employer. We are not aware of any threatened or pending claims related to these matters or concerning the agreements with our senior management, but in the future litigation may be necessary to defend against such claims. If we fail in defending any such claims, in addition to paying monetary damages, we may lose valuable intellectual property rights or personnel. Even if we are successful in defending against such claims, litigation could result in substantial costs and be a distraction to management.
In addition, while we typically require our employees, consultants and contractors who may be involved in the development of intellectual property to execute agreements assigning such intellectual property to us, we may be unsuccessful in executing such an agreement with each party who in fact develops intellectual property that we regard as our own, which may result in claims by or against us related to the ownership of such intellectual property. If we fail in prosecuting or defending any such claims, in addition to paying monetary damages, we may lose valuable intellectual property rights. Even if we are successful in prosecuting or defending against such claims, litigation could result in substantial costs and be a distraction to our management and scientific personnel.
We may not be successful in obtaining or maintaining necessary rights for our development pipeline through acquisitions and in-licenses.
Because our programs may involve additional drug candidates that may require the use of proprietary rights held by third parties, the growth of our business may depend in part on our ability to acquire and maintain licenses or other rights to use these proprietary rights. We may be unable to acquire or in-license any compositions, methods of use, or other third-party intellectual property rights from third parties that we identify. The licensing and acquisition of third-party intellectual property rights is a competitive area, and a number of more established companies are also pursuing strategies to license or acquire third-party intellectual property rights that we may consider attractive. These established companies may have a competitive advantage over us due to their size, cash resources and greater clinical development and commercialization capabilities. If we are unable to successfully obtain rights to required third-party intellectual property rights, our business, financial condition and prospects for growth could suffer.
If we fail to comply with our obligations in the agreements under which we license intellectual property rights from third parties or otherwise experience disruptions to our business relationships with our licensors, we could be required to pay monetary damages or could lose license rights that are important to our business.
We have entered into license agreements with third parties providing us with rights under various third-party patents and patent applications. These license agreements impose diligence, development or commercialization timelines and milestone payment, royalty, insurance and other obligations on us. If we fail to comply with our obligations under our current or future license agreements, our counterparties may have the right to terminate these agreements, in which event we might not be able to develop, manufacture or market any drug or drug candidate that is covered by the licenses provided for under these agreements or we may face claims for monetary damages or other penalties under these agreements. Such an occurrence could diminish the value of these products and our company. Termination of the licenses provided for under these agreements or reduction or elimination of our rights under these agreements may result in our having to negotiate new or reinstated agreements with less favorable terms, or cause us to lose our rights under these agreements, including our rights to important intellectual property or technology.
Risks Related to Our Reliance on Third Parties
We rely on third parties to conduct our preclinical studies and clinical trials and we must work effectively with collaborators to develop our drug candidates. If these third parties do not successfully carry out their contractual duties or meet expected deadlines, we may not be able to obtain regulatory approval for or commercialize our drug candidates and our business could be substantially harmed.
We have relied upon and plan to continue to rely upon third-party CROs to monitor and manage data for our ongoing preclinical and clinical programs. We rely on these parties for execution of our preclinical studies and clinical trials, and control
63
only certain aspects of their activities. Nevertheless, we are responsible for ensuring that each of our studies is conducted in accordance with the applicable protocol, legal and regulatory requirements and scientific standards, and our reliance on the CROs does not relieve us of our regulatory responsibilities. We, our CROs for our clinical programs and our clinical investigators are required to comply with GCPs, which are regulations and guidelines enforced by the FDA, NMPA, EMA and other comparable regulatory authorities for all of our drugs in clinical development. If we or any of our CROs or clinical investigators fail to comply with applicable GCPs and other regulatory requirements, the clinical data generated in our clinical trials may be deemed unreliable and the FDA, NMPA, EMA or comparable regulatory authorities may require us to perform additional clinical trials before approving our marketing applications. In addition, our pivotal clinical trials must be conducted with product produced under cGMP regulations. Our failure to comply with these regulations may require us to repeat clinical trials, which would delay the regulatory approval process. We could also be subject to government investigation and enforcement actions.
If any of our relationships with these third-party CROs terminate, we may not be able to enter into arrangements with alternative CROs or to do so on commercially reasonable terms. In addition, our CROs are not our employees, and except for remedies available to us under our agreements with such CROs, we cannot control whether or not they devote sufficient time and resources to our ongoing clinical and nonclinical programs. If CROs do not successfully carry out their contractual duties or obligations or meet expected deadlines, if they need to be replaced or if the quality or accuracy of the clinical data they or our clinical investigators obtain is compromised due to the failure to adhere to our clinical protocols, regulatory requirements or for other reasons, our clinical trials may be extended, delayed or terminated and we may not be able to obtain regulatory approval for or successfully commercialize our drug candidates. As a result, our results of operations and the commercial prospects for our drug candidates would be harmed, our costs could increase and our ability to generate revenues could be delayed.
Switching or adding additional CROs involves additional cost and delays, which can materially influence our ability to meet our desired clinical development timelines. There can be no assurance that we will not encounter similar challenges or delays in the future or that these delays or challenges will not have a material adverse effect on our business, financial condition and prospects.
Our future revenues are dependent on our ability to work effectively with collaborators to develop our drug candidates, including to obtain regulatory approval. Our arrangements with collaborators will be critical to successfully bringing products to market and commercializing them. We rely on collaborators in various respects, including to undertake research and development programs and conduct clinical trials, manage or assist with the regulatory filings and approval process and to assist with our commercialization efforts. We do not control our collaborators; therefore, we cannot ensure that these third parties will adequately and timely perform all of their obligations to us. If they fail to complete the remaining studies successfully, or at all, it could delay, adversely affect or prevent regulatory approval. We cannot guarantee the satisfactory performance of any of our collaborators and if any of our collaborators breach or terminate their agreements with us, we may not be able to successfully commercialize the licensed product which could materially and adversely affect our business, financial condition, cash flows and results of operations.
We expect to rely on third parties to manufacture at least a portion of our clinical and commercial drug supplies. Our business could be harmed if those third parties fail to provide us with sufficient quantities of product or fail to do so at acceptable quality levels or prices.
Although we currently have a facility that may be used as our clinical-scale manufacturing and processing facility and are building manufacturing facilities in China, we intend to at least partially rely on outside vendors to manufacture supplies and process our drugs and drug candidates. For example, we have entered into a commercial supply agreement for tislelizumab with Boehringer Ingelheim Biopharmaceuticals (China) Ltd. In addition, we rely on Celgene and its third-party manufacturers for supply of ABRAXANE®, REVLIMID®, and VIDAZA® in China. Our drug candidates have not yet been manufactured or processed on a commercial scale and we may not be able to do so for any of our drug candidates. We have limited experience in managing the manufacturing process, and our process may be more difficult or expensive than the approaches currently in use.
Although we intend to further develop our own manufacturing facilities, we also intend to use third parties as part of our manufacturing process and for the clinical and commercial supply of our drugs and drug candidates. Our anticipated reliance on a limited number of third-party manufacturers exposes us to the following risks:
|
•
|
we may be unable to identify manufacturers on acceptable terms or at all because the number of potential manufacturers is limited and the FDA, NMPA, EMA or other comparable regulatory authorities must evaluate and/or approve any manufacturers as part of their regulatory oversight of our drug candidates. This evaluation would require new testing and cGMP-compliance inspections by FDA, NMPA, EMA or other comparable regulatory authorities;
|
64
|
•
|
our manufacturers may have little or no experience with manufacturing our drug candidates, and therefore may require a significant amount of support from us in order to implement and maintain the infrastructure and processes required to manufacture our drug candidates;
|
|
•
|
our third-party manufacturers might be unable to timely manufacture our drugs and drug candidates or produce the quantity and quality required to meet our clinical and commercial needs, if any;
|
|
•
|
manufacturers are subject to ongoing periodic unannounced inspection by the FDA and corresponding state agencies in the United States to ensure strict compliance with cGMPs and other government regulations and by other comparable regulatory authorities for corresponding non-U.S. requirements. We do not have control over third-party manufacturers’ compliance with these regulations and requirements;
|
|
•
|
we may not own, or may have to share, the intellectual property rights to any improvements made by our third-party manufacturers in the manufacturing process for our drug candidates and drugs;
|
|
•
|
raw materials and components used in the manufacturing process, particularly those for which we have no other source or supplier, may not be available or may not be suitable or acceptable for use due to material or component defects; and
|
|
•
|
our contract manufacturers and critical drug component suppliers may be subject to disruptions in their business, including inclement weather, as well as natural or man-made disasters.
|
Each of these risks could delay or prevent the completion of our clinical trials or the approval of any of our drug candidates, result in higher costs or adversely impact commercialization of our drugs. In addition, we will rely on third parties to perform certain specification tests on our drugs and drug candidates prior to delivery to patients. If these tests are not appropriately done and test data are not reliable, patients could be put at risk of serious harm and regulatory authorities could place significant restrictions on our company until deficiencies are remedied.
Currently, the raw materials for our manufacturing activities are supplied by multiple source suppliers, although portions of our supply chain may rely on sole source suppliers. We have agreements for the supply of drug materials with manufacturers or suppliers that we believe have sufficient capacity to meet our demands. In addition, we believe that adequate alternative sources for such supplies exist. However, there is a risk that, if supplies are interrupted, it would materially harm our business.
Manufacturers of drug and biological products often encounter difficulties in production, particularly in scaling up or out, validating the production process, and assuring high reliability of the manufacturing process (including the absence of contamination). These problems include logistics and shipping, difficulties with production costs and yields, quality control, including stability of the product, product testing, operator error, availability of qualified personnel, as well as compliance with strictly enforced federal, state and non-U.S. regulations. Furthermore, if contaminants are discovered in the supply of our drugs and drug candidates or in the manufacturing facilities, such manufacturing facilities may need to be closed for an extended period of time to investigate and remedy the contamination. We cannot assure you that any stability failures or other issues relating to the manufacture of our drug candidates will not occur in the future. Additionally, our manufacturers may experience manufacturing difficulties due to resource constraints or as a result of labor disputes or unstable political environments. If our manufacturers were to encounter any of these difficulties, or otherwise fail to comply with their contractual obligations, our ability to provide our drugs for commercial sale and our drug candidates to patients in clinical trials would be jeopardized. Any delay or interruption in the supply of clinical trial supplies could delay the completion of clinical trials, increase the costs associated with maintaining clinical trial programs and, depending upon the period of delay, require us to begin new clinical trials at additional expense or terminate clinical trials completely.
If third-party manufacturers fail to comply with manufacturing regulations, our financial results and financial condition will be adversely affected.
Before a third party can begin commercial manufacture of our drugs and drug candidates, contract manufacturers are subject to regulatory inspections of their manufacturing facilities, processes and quality systems. Due to the complexity of the processes used to manufacture drug and biological products and our drug candidates, any potential third-party manufacturer may be unable to initially pass federal, state or international regulatory inspections in a cost-effective manner in order for us to obtain regulatory approval of our drug candidates. If our contract manufacturers do not pass their inspections by the relevant regulatory authorities, our commercial supply of drug product or substance will be significantly delayed and may result in significant additional costs, including the delay or denial of any marketing application for our drug candidates or disruption in sales. In addition, drug and biological manufacturing facilities are continuously subject to inspection by regulatory authorities,
65
before and after drug approval, and must comply with cGMPs. Our contract manufacturers may encounter difficulties in achieving quality control and quality assurance and may experience shortages in qualified personnel. In addition, contract manufacturers’ failure to achieve and maintain high manufacturing standards in accordance with applicable regulatory requirements, or the incidence of manufacturing errors, could result in patient injury, product liability claims, product shortages, product recalls or withdrawals, delays or failures in product testing or delivery, cost overruns or other problems that could seriously harm our business. If a third-party manufacturer with whom we contract is unable to comply with manufacturing regulations, we may also be subject to fines, unanticipated compliance expenses, recall or seizure of our drugs, product liability claims, total or partial suspension of production and/or enforcement actions, including injunctions, and criminal or civil prosecution. These possible sanctions could materially adversely affect our financial results and financial condition.
Furthermore, changes in the manufacturing process or procedure, including a change in the location where the product is manufactured or a change of a third-party manufacturer, could require prior review by regulatory authorities and/or approval of the manufacturing process and procedures in accordance with applicable requirements. This review may be costly and time consuming and could delay or prevent the launch of a product. The new facility will also be subject to pre-approval inspection. In addition, we have to demonstrate that the product made at the new facility is equivalent to the product made at the former facility by physical and chemical methods, which are costly and time consuming. It is also possible that regulatory authorities may require clinical testing as a way to prove equivalency, which would result in additional costs and delay.
We have entered into collaborations, such as with Celgene, and may form or seek collaborations or strategic alliances or enter into additional licensing arrangements in the future, and we may not realize the benefits of such collaborations, alliances or licensing arrangements.
We may form or seek strategic alliances, create joint ventures or collaborations, or enter into additional licensing arrangements with third parties that we believe will complement or augment our research, development and commercialization efforts with respect to our drug candidates and any future drug candidates that we may develop. Any of these relationships may require us to incur non-recurring and other charges, increase our near and long-term expenditures, issue securities that dilute our existing shareholders, or disrupt our management and business.
Our strategic collaboration with Celgene involves numerous risks. There can be no assurance that we will be able to successfully manage and integrate Celgene’s commercial operations in China and its personnel into our business, which could disrupt our business and harm our financial results. Moreover, we may not achieve the revenue and cost synergies expected from our collaboration with Celgene for their commercial products in China and the joint development of tislelizumab outside of Asia (other than Japan), and our management’s attention may be diverted from our drug discovery and development business. These synergies are inherently uncertain, and are subject to significant business, economic and competitive uncertainties and contingencies, many of which are difficult to predict and are beyond our control. If we achieve the expected benefits, they may not be achieved within the anticipated time frame. Also, the synergies from our collaboration with Celgene may be offset by costs incurred in integrating Celgene’s commercial operations in China, increases in other expenses, operating losses or problems in the business unrelated to our collaboration with Celgene. As a result, there can be no assurance that these synergies will be achieved. Lastly, strategic collaborations can be terminated for various reasons. For example, in January 2019, Celgene announced that it was expected to be acquired by Bristol-Myers Squibb Company in the third quarter of 2019. As a result of this transaction, our licensing agreement with Celgene for tislelizumab may be terminated.
We face significant competition in seeking appropriate strategic partners and the negotiation process is time-consuming and complex. Moreover, we may not be successful in our efforts to establish a strategic partnership or other alternative arrangements for our drug candidates because they may be deemed to be at too early of a stage of development for collaborative effort and third parties may not view our drug candidates as having the requisite potential to demonstrate safety and efficacy or commercial viability. If and when we collaborate with a third party for development and commercialization of a drug candidate, we can expect to relinquish some or all of the control over the future success of that drug candidate to the third party. For any drugs or drug candidates that we may seek to in-license from third parties, we may face significant competition from other pharmaceutical or biotechnology companies with greater resources or capabilities than us, and any agreement that we do enter may result in the anticipated benefits.
Further, collaborations involving our drugs and drug candidates are subject to numerous risks, which may include the following:
|
•
|
collaborators have significant discretion in determining the efforts and resources that they will apply to a collaboration;
|
66
|
•
|
collaborators may not pursue development and commercialization of our drug candidates or may elect not to continue or renew development or commercialization programs based on clinical trial results, changes in their strategic focus due to the acquisition of competitive drugs, availability of funding, or other external factors, such as a business combination that diverts resources or creates competing priorities;
|
|
•
|
collaborators may delay clinical trials, provide insufficient funding for a clinical trial, stop a clinical trial, abandon a drug candidate, repeat or conduct new clinical trials, or require a new formulation of a drug candidate for clinical testing;
|
|
•
|
collaborators could independently develop, or develop with third parties, drugs that compete directly or indirectly with our drugs or drug candidates;
|
|
•
|
a collaborator with marketing and distribution rights to one or more drugs may not commit sufficient resources to their marketing and distribution;
|
|
•
|
collaborators may not properly maintain or defend our intellectual property rights or may use our intellectual property or proprietary information in a way that gives rise to actual or threatened litigation that could jeopardize or invalidate our intellectual property or proprietary information or expose us to potential liability;
|
|
•
|
disputes may arise between us and a collaborator that cause the delay or termination of the research, development or commercialization of our drug candidates, or that result in costly litigation or arbitration that diverts management attention and resources;
|
|
•
|
collaborations may be terminated and, if terminated, may result in a need for additional capital to pursue further development or commercialization of the applicable drug candidates; and
|
|
•
|
collaborators may own or co-own intellectual property covering our drugs that results from our collaborating with them, and in such cases, we would not have the exclusive right to commercialize such intellectual property.
|
As a result, we may not be able to realize the benefit of current or future collaborations, strategic partnerships or the license of our third-party drugs if we are unable to successfully integrate such products with our existing operations and company culture, which could delay our timelines or otherwise adversely affect our business. We also cannot be certain that, following a strategic transaction or license, we will achieve the revenue or specific net income that justifies such transaction. If we are unable to reach agreements with suitable collaborators on a timely basis, on acceptable terms, or at all, we may have to curtail the development of a drug candidate, reduce or delay its development program or one or more of our other development programs, delay its potential commercialization or reduce the scope of any sales or marketing activities, or increase our expenditures and undertake development or commercialization activities at our own expense. If we elect to fund and undertake development or commercialization activities on our own, we may need to obtain additional expertise and additional capital, which may not be available to us on acceptable terms or at all. If we fail to enter into collaborations and do not have sufficient funds or expertise to undertake the necessary development and commercialization activities, we may not be able to further develop our drug candidates or bring them to market and generate product sales revenue, which would harm our business prospects, financial condition and results of operations.
If we fail to maintain an effective distribution channel for our products, our business and sales of the relevant products could be adversely affected.
We rely on a third-party distributor to distribute Celgene’s approved cancer therapies, ABRAXANE
®
, REVLIMID
®
, and VIDAZA
®
, and we expect to rely on third-party distributors for the distribution of our internally developed drug products, if approved. Our ability to maintain and grow our business will depend on our ability to maintain an effective distribution channel that ensures the timely delivery of our products to the relevant markets where we generate market demand through our sales and marketing activities. However, we have relatively limited control over our distributors, who may fail to distribute our products in the manner we contemplate. While we have long-standing business relationship with our distributor for the in-licensed products from Celgene, the agreement we entered into with our distributor can be terminated by both parties upon six months’ written notice. If PRC price controls or other factors substantially reduce the margins our distributor can obtain through the resale of our products to hospitals, medical institutions and sub-distributors, it may terminate its relationship with us. As of the date of this report, we rely on one distributor to distribute our products. While we believe alternative distributors are readily available in China, there is a risk that, if the distribution of our drugs is interrupted, our sales volumes and business prospects could be adversely affected.
67
We may be restricted from transferring our scientific data abroad.
On March 17, 2018, the General Office of the State Council promulgated the Measures for the Management of Scientific Data, or the Scientific Data Measures, which provides a broad definition of scientific data and relevant rules for the management of scientific data. According to the Scientific Data Measures, enterprises in China must seek governmental approval before any scientific data involving a state secret may be transferred abroad or to foreign parties. Further, any researcher conducting research funded at least in part by the Chinese government is required to submit relevant scientific data for management by the entity to which such researcher is affiliated before such data may be published in any foreign academic journal. Given that the term state secret is not clearly defined, if and to the extent our research and development of drug candidates will be subject to the Scientific Data Measures and any subsequent laws as required by the relevant government authorities, we cannot assure you that we can always obtain relevant approvals for sending scientific data (such as the results of our preclinical studies or clinical trials conducted within China) abroad or to our foreign partners in China. If we are unable to obtain necessary approvals in a timely manner, or at all, our research and development of drug candidates may be hindered, which may materially and adversely affect our business, results of operations, financial condition and prospects. If the relevant government authorities consider the transmission of our scientific data to be in violation of the requirements under the Scientific Data Measures, we may be subject to fines and other administrative penalties imposed by those government authorities.
Risks Related to Our Industry, Business and Operations
Our future success depends on our ability to retain key executives and to attract, retain and motivate qualified personnel.
We are highly dependent on Xiaodong Wang, Ph.D., our Co-Founder, Chairman of our scientific advisory board, which may from time to time provide us assistance upon our request, and director; John V. Oyler, our Co-Founder, Chief Executive Officer and Chairman of the board of directors; and the other principal members of our management and scientific teams. Although we have formal employment agreements or offer letters with each of our executive officers, these agreements do not prevent our executives from terminating their employment with us at any time. We do not maintain “key person” insurance for any of our executives or other employees. The loss of the services of any of these persons could impede the achievement of our research, development and commercialization objectives.
To induce valuable employees to remain at our company, in addition to salary and cash incentives, we have provided share option, restricted share unit and restricted share grants that vest over time. The value to employees of these equity grants that vest over time may be significantly affected by movements in the ADS and/or ordinary share price that are beyond our control, and may at any time be insufficient to counteract more lucrative offers from other companies. Although we have employment agreements or offer letters with our key employees, any of our employees could leave our employment at any time, with or without notice.
Recruiting and retaining qualified scientific, clinical, manufacturing and sales and marketing personnel will also be critical to our success. In addition, we rely on consultants and advisors, including scientific and clinical advisors, to assist us in formulating our discovery, clinical development, manufacturing and commercialization strategy. The loss of the services of our executive officers or other key employees and consultants could impede the achievement of our research, development, manufacturing and commercialization objectives and seriously harm our ability to successfully implement our business strategy.
Furthermore, replacing executive officers, key employees or consultants may be difficult and may take an extended period of time because of the limited number of individuals in our industry with the breadth of skills and experience required to successfully develop, gain regulatory approval of and commercialize products. Competition to hire from this limited pool is intense, and we may be unable to hire, train, retain or motivate these key personnel or consultants on acceptable terms given the competition among numerous pharmaceutical and biotechnology companies for similar personnel.
We also experience competition for the hiring of scientific and clinical personnel from universities and research institutions. Our consultants and advisors may be employed by employers other than us and may have commitments under consulting or advisory contracts with other entities that may limit their availability to us. If we are unable to continue to attract and retain high quality personnel, our ability to pursue our growth strategy will be limited.
68
We have significantly increased the size and capabilities of our organization, and we may experience difficulties in managing our growth.
At the beginning of 2018, we had 876 employees, and we ended the year with 2,070 employees, an increase of approximately 136%. Most of our employees are full-time. As our research, development, manufacturing and commercialization plans and strategies evolve, we must add a significant number of additional managerial, operational, manufacturing, sales, marketing, financial and other personnel. Our recent growth and any future growth will impose significant added responsibilities on members of management, including:
|
•
|
identifying, recruiting, integrating, maintaining, and motivating additional employees;
|
|
•
|
managing our internal development efforts effectively, including the clinical and regulatory authority review process for our drug candidates, while complying with our contractual obligations to contractors and other third parties; and
|
|
•
|
improving our operational, financial and management controls, reporting systems and procedures.
|
Our future financial performance and our ability to commercialize our drugs and drug candidates will depend, in part, on our ability to effectively manage our recent growth and any future growth, and our management may also have to divert a disproportionate amount of its attention away from day-to-day activities in order to devote a substantial amount of time to managing these growth activities.
We currently rely, and for the foreseeable future will continue to rely, on certain independent organizations, advisors and consultants to provide certain services. There can be no assurance that the services of these independent organizations, advisors and consultants will continue to be available to us on a timely basis when needed, or that we can find qualified replacements. There can be no assurance that we will be able to manage our existing consultants or find other competent outside contractors and consultants on economically reasonable terms, if at all.
If we are not able to effectively manage our growth and further expand our organization by hiring new employees and expanding our groups of consultants and contractors as needed, we may not be able to successfully implement the tasks necessary to further develop, manufacture and commercialize our drugs and drug candidates and, accordingly, may not achieve our research, development, manufacturing and commercialization goals.
We incur significant costs as a result of operating as a public company in the United States and Hong Kong, and our management is required to devote substantial time to compliance requirements, including establishing and maintaining internal controls over financial reporting. We may be exposed to potential risks if we are unable to comply with these requirements
.
As a public company in the United States and Hong Kong, we are subject to the periodic reporting requirements of the Exchange Act and the listing rules of the Stock Exchange of Hong Kong Ltd., or HKEx, and incur significant legal, accounting and other expenses under the Sarbanes-Oxley Act of 2002, or Sarbanes-Oxley Act, together with rules implemented by the U.S. Securities and Exchange Commission, or SEC, and applicable market regulators, and the listing rules of the HKEx. These rules impose various requirements on public companies, including requiring certain corporate governance practices. Our management and other personnel devote a substantial amount of time to these requirements. Moreover, these rules and regulations increase our legal and financial compliance costs and make some activities more time-consuming and costly.
For example, the Sarbanes-Oxley Act requires, among other things, that we maintain effective internal controls for financial reporting and disclosure controls and procedures. In particular, we must perform system and process evaluations and testing of our internal controls over financial reporting to allow management to report on the effectiveness of our internal controls over financial reporting, as required by Section 404 of the Sarbanes-Oxley Act. We have limited experience complying with Section 404, and such compliance may require that we incur substantial accounting expenses and expend significant management efforts. Our testing may reveal deficiencies in our internal controls over financial reporting that are deemed to be material weaknesses. In the event we identify significant deficiencies or material weaknesses in our internal controls that we cannot remediate in a timely manner, the market price of our ordinary shares and/or ADSs could decline if investors and others lose confidence in the reliability of our financial statements, we could be subject to sanctions or investigations by the SEC or other applicable regulatory authorities and our business could be harmed.
69
If we engage in acquisitions or strategic partnerships, this may increase our capital requirements, dilute our shareholders, cause us to incur debt or assume contingent liabilities, and subject us to other risks.
From time to time, we may evaluate various acquisitions and strategic partnerships, including licensing or acquiring complementary products, intellectual property rights, technologies or businesses. Any completed, in-process or potential acquisition or strategic partnership may entail numerous risks, including:
|
•
|
increased operating expenses and cash requirements;
|
|
•
|
the assumption of additional indebtedness or contingent or unforeseen liabilities;
|
|
•
|
the issuance of our equity securities;
|
|
•
|
assimilation of operations, intellectual property and products of an acquired company, including difficulties associated with integrating new personnel;
|
|
•
|
the diversion of our management’s attention from our existing product programs and initiatives in pursuing such a strategic merger or acquisition;
|
|
•
|
retention of key employees, the loss of key personnel, and uncertainties in our ability to maintain key business relationships;
|
|
•
|
risks and uncertainties associated with the other party to such a transaction, including the prospects of that party and their existing drugs or drug candidates and regulatory approvals; and
|
|
•
|
our inability to generate revenue from acquired technology and/or products sufficient to meet our objectives in undertaking the acquisition or even to offset the associated acquisition and maintenance costs.
|
In addition, if we undertake acquisitions, we may issue dilutive securities, assume or incur debt obligations, incur large one-time expenses and acquire intangible assets that could result in significant future amortization expense.
PRC regulations and rules concerning mergers and acquisitions, including the Regulations on Mergers and Acquisitions of Domestic Companies by Foreign Investors, or the M&A Rules, and other recently adopted regulations and rules with respect to mergers and acquisitions established additional procedures and requirements that could make merger and acquisition activities by foreign investors more time consuming and complex. For example, the M&A Rules require that the Ministry of Commerce of the PRC, or the MOFCOM, be notified in advance of any change-of-control transaction in which a foreign investor takes control of a PRC domestic enterprise, if (i) any important industry is concerned, (ii) such transaction involves factors that have or may have impact on the national economic security, or (iii) such transaction will lead to a change in control of a domestic enterprise which holds a famous trademark or PRC time-honored brand. Moreover, according to the Anti-Monopoly Law of PRC and the Provisions on Thresholds for Prior Notification of Concentrations of Undertakings, or the Prior Notification Rules issued by the State Council, the concentration of business undertakings by way of mergers, acquisitions or contractual arrangements that allow one market player to take control of or to exert decisive impact on another market player must also be notified in advance to the State Administration of Market Regulation, or SAMR, when the threshold is crossed and such concentration shall not be implemented without the clearance of prior notification. In addition, the Regulations on Implementation of Security Review System for the Merger and Acquisition of Domestic Enterprise by Foreign Investors, or the Security Review Rules, issued by the MOFCOM specify that mergers and acquisitions by foreign investors that raise “national defense and security” concerns and mergers and acquisitions through which foreign investors may acquire the de facto control over domestic enterprises that raise “national security” concerns are subject to strict review by the MOFCOM, and the rules prohibit any activities attempting to bypass a security review by structuring the transaction through, among other things, trusts, entrustment or contractual control arrangements. In the future, we may grow our business by acquiring complementary businesses. Complying with the requirements of the above-mentioned regulations and other relevant rules to complete such transactions could be time consuming, and any required approval processes, including obtaining approval from the SAMR, the MOFCOM or its local counterparts may delay or inhibit our ability to complete such transactions. It is unclear whether those complementary business we may acquire in the future would be deemed to be in an industry that raises “national defense and security” or “national security” concerns. However, the MOFCOM or other government agencies may publish explanations in the future determining that certain of the complementary business is in an industry subject to the security review, in which case our future acquisitions in the PRC, including those by way of entering into contractual control arrangements with target entities, may be closely scrutinized or prohibited. Our ability to expand our business or maintain or expand our market share through future acquisitions would as such be materially and adversely affected.
70
If we fail to comply with the U.S. Foreign Corrupt Practices Act or other anti-bribery and corruption laws, our reputation may be harmed and we could be subject to penalties and significant expenses that have a material adverse effect on our business, financial condition and results of operations.
We are subject to the Foreign Corrupt Practices Act, or FCPA. The FCPA generally prohibits us from making improper payments to non-U.S. officials for the purpose of obtaining or retaining business. We are also subject to the anti-bribery and corruption laws of other jurisdictions, particularly China. As our business has expanded, the applicability of the FCPA and other anti-bribery and corruption laws to our operations has increased.
We do not fully control the interactions our employees, distributors and third-party promoters have with hospitals, medical institutions and doctors, and they may try to increase sales volumes of our products through means that constitute violations of the PRC anti-corruption and other related laws. If our employees, distributors or third-party promoters engage in corrupt or other improper conduct that results in violation of applicable anti-corruption laws in the PRC or other jurisdictions, our reputation could be harmed. Furthermore, we could be held liable for actions taken by our employees, distributors or third-party promoters, which could expose us to regulatory investigations and penalties.
Our procedures and controls to monitor anti-bribery and corruption compliance may fail to protect us from reckless or criminal acts committed by our employees or agents. If we, due to either our own deliberate or inadvertent acts or those of others, fail to comply with applicable anti-bribery and corruption laws, our reputation could be harmed and we could incur criminal or civil penalties, other sanctions and/or significant expenses, which could have a material adverse effect on our business, including our financial condition, results of operations, cash flows and prospects.
If we or our CROs or contract manufacturing organizations, or CMOs, fail to comply with environmental, health and safety laws and regulations, we could become subject to fines or penalties or incur costs that could have a material adverse effect on the success of our business.
We and third parties, such as our CROs or CMOs, are subject to numerous environmental, health and safety laws and regulations, including those governing laboratory procedures and the handling, use, storage, treatment and disposal of hazardous materials and wastes. In addition, our construction projects can only be put into operation after certain regulatory procedures with the relevant administrative authorities in charge of environmental protection, health and safety have been completed. Our operations involve the use of hazardous and flammable materials, including chemicals and biological materials. Our operations also produce hazardous waste products. We generally contract with third parties for the disposal of these materials and wastes. We cannot eliminate the risk of contamination or injury from these materials. In the event of contamination or injury resulting from our use of hazardous materials, we could be held liable for any resulting damages, and any liability could exceed our resources. We also could incur significant costs associated with civil or criminal fines and penalties.
Although we maintain workers’ compensation insurance to cover us for costs and expenses that we may incur due to injuries to our employees resulting from the use of or exposure to hazardous materials, this insurance may not provide adequate coverage against potential liabilities. We do not maintain insurance for environmental liability or toxic tort claims that may be asserted against us in connection with our storage, use or disposal of biological or hazardous materials.
In addition, we may be required to incur substantial costs to comply with current or future environmental, health and safety laws and regulations. These current or future laws and regulations may impair our research, development or production efforts. Failure to comply with these laws and regulations also may result in substantial fines, penalties or other sanctions.
Our internal computer systems, or those used by our CROs or other contractors or consultants, may fail or suffer security breaches.
Despite the implementation of security measures, our internal computer systems and those of our CROs and other contractors and consultants are vulnerable to damage from computer viruses and unauthorized access. Although to our knowledge we have not experienced any material system failure or security breach to date, if such an event were to occur and cause interruptions in our operations, it could result in a material disruption of our research, development, manufacturing, and commercialization efforts and our business operations.
In the ordinary course of our business, we collect and store sensitive data, including, among other things, legally protected patient health information, personally identifiable information about our employees, intellectual property, and proprietary business information. We manage and maintain our applications and data utilizing on-site systems and outsourced vendors. These applications and data encompass a wide variety of business-critical information including research and development
71
information, commercial information and business and financial information. Because information systems, networks and other technologies are critical to many of our operating activities, shutdowns or service disruptions at our company or vendors that provide information systems, networks, or other services to us pose increasing risks. Such disruptions may be caused by events such as computer hacking, phishing attacks, ransomware, dissemination of computer viruses, worms and other destructive or disruptive software, denial of service attacks and other malicious activity, as well as power outages, natural disasters (including extreme weather), terrorist attacks or other similar events. Such events could have an adverse impact on us and our business, including loss of data and damage to equipment and data. In addition, system redundancy may be ineffective or inadequate, and our disaster recovery planning may not be sufficient to cover all eventualities. Significant events could result in a disruption of our operations, damage to our reputation or a loss of revenues. In addition, we may not have adequate insurance coverage to compensate for any losses associated with such events.
We could be subject to risks caused by misappropriation, misuse, leakage, falsification or intentional or accidental release or loss of information maintained in the information systems and networks of our company and our vendors, including personal information of our employees and patients, and company and vendor confidential data. In addition, outside parties may attempt to penetrate our systems or those of our vendors or fraudulently induce our personnel or the personnel of our vendors to disclose sensitive information in order to gain access to our data and/or systems. Like other companies, we have on occasion experienced, and will continue to experience, threats to our data and systems, including malicious codes and viruses, phishing, business email compromise attacks, or other cyber-attacks. The number and complexity of these threats continue to increase over time. If a material breach of our information technology systems or those of our vendors occurs, the market perception of the effectiveness of our security measures could be harmed and our reputation and credibility could be damaged. We could be required to expend significant amounts of money and other resources to respond to these threats or breaches and to repair or replace information systems or networks, and could suffer financial loss or the loss of valuable confidential information. In addition, we could be subject to regulatory actions and/or claims made by individuals and groups in private litigation involving privacy issues related to data collection and use practices and other data privacy laws and regulations, including claims for misuse or inappropriate disclosure of data, as well as unfair or deceptive practices. Although we develop and maintain systems and controls designed to prevent these events from occurring, and we have a process to identify and mitigate threats, the development and maintenance of these systems, controls and processes is costly and requires ongoing monitoring and updating as technologies change and efforts to overcome security measures become increasingly sophisticated. Moreover, despite our efforts, the possibility of these events occurring cannot be eliminated entirely. As we outsource more of our information systems to vendors, engage in more electronic transactions with payors and patients, and rely more on cloud-based information systems, the related security risks will increase and we will need to expend additional resources to protect our technology and information systems.
Our failure to comply with data protection laws and regulations could lead to government enforcement actions and significant penalties against us, and adversely impact our operating results.
The regulatory framework for the collection, use, safeguarding, sharing, transfer and other processing of personal information worldwide is rapidly evolving and is likely to remain uncertain for the foreseeable future. Regulatory authorities in virtually every jurisdiction in which we operate have implemented and are considering a number of legislative and regulatory proposals concerning personal data protection.
In the United States, we are subject to laws and regulations that address privacy, personal information protection and data security at both the federal and state levels. Numerous laws and regulations, including security breach notification laws, health information privacy laws, and consumer protection laws, govern the collection, use, disclosure and protection of health-related and other personal information. Given the variability and evolving state of these laws, we face uncertainty as to the exact interpretation of the new requirements, and we may be unsuccessful in implementing all measures required by regulators or courts in their interpretation.
Regulatory authorities in Europe have implemented and are considering a number of legislative and regulatory proposals concerning data protection. For example, the General Data Protection Regulation (EU) 2016/679 ("GDPR"), which became effective in May 2018, imposes a broad range of strict requirements on companies subject to the GDPR, such as us, including, but not limited to, requirements relating to having legal bases for processing personal information relating to identifiable individuals and transferring such information outside the European Economic Area (including to the United States), providing details to those individuals regarding the processing of their personal information, keeping personal information secure, having data processing agreements with third parties who process personal information, responding to individuals’ requests to exercise their rights in respect of their personal information, reporting security breaches involving personal data to the competent national data protection authority and affected individuals, and recordkeeping. The GDPR substantially increases the penalties to which we could be subject in the event of any non-compliance, including fines of up to 10,000,000 Euros or up to 2% of our total worldwide annual turnover for certain comparatively minor offenses, or up to 20,000,000 Euros or up to 4% of our total
72
worldwide annual turnover for more serious offenses. Given the new law, we face uncertainty as to the exact interpretation of the new requirements, and we may be unsuccessful in implementing all measures required by data protection authorities or courts in interpretation of the new law. National laws of member states of the EU are in the process of being adapted to the requirements under the GDPR. Because the GDPR specifically gives member states flexibility with respect to certain matters, national laws may partially deviate from the GDPR and impose different obligations from country to country, leading to additional complexity and uncertainty.
Regulatory authorities in China have implemented and are considering a number of legislative and regulatory proposals concerning data protection. For example, China’s Cyber Security Law, which became effective in June 2017, created China’s first national-level data protection for “network operators,” which may include all organizations in China that provide services over the internet or another information network. Numerous regulations, guidelines and other measures are expected to be adopted under the umbrella of the Cyber Security Law. Drafts of some of these measures have now been published, including the draft rules on cross-border transfers published by the China Cyberspace Administration in 2017, which may, upon enactment, require security review before transferring human health-related data out of China. In addition, certain industry-specific laws and regulations affect the collection and transfer of personal data in China. The Interim Measures for the Administration of Human Genetic Resources and implementation guidelines issued by the Ministry of Science and Technology, for example, require approval from the Ministry of Science and Technology before the commencement of clinical trials where foreign sponsors and their Chinese clinical trial sites obtain human genetic resources, or HGR, in China and additional approval for any export or cross-border transfer of the HGR samples or associated data. See “Part I-Item 1-Business-Government Regulation-PRC Regulation-Human Genetic Resources Approval”. It is possible that these laws may be interpreted and applied in a manner that is inconsistent with our practices, potentially resulting in confiscation of HGR samples and associated data and administrative fines. In addition, the interpretation and application of data protection laws in China and elsewhere are often uncertain and in flux.
We expect that we will continue to face uncertainty as to whether our efforts to comply with evolving obligations under global data protection, privacy and security laws will be sufficient. Any failure or perceived failure by us to comply with applicable laws and regulations could result in reputational damage or proceedings or actions against us by governmental entities, individuals or others. These proceedings or actions could subject us to significant civil or criminal penalties and negative publicity, result in the delayed or halted transfer or confiscation of certain personal information, require us to change our business practices, increase our costs and materially harm our business, prospects, financial condition and results of operations. In addition, our current and future relationships with customers, vendors, pharmaceutical partners and other third parties could be negatively affected by any proceedings or actions against us or current or future data protection obligations imposed on them under applicable law, including the GDPR. In addition, a data breach affecting personal information, including health information, could result in significant legal and financial exposure and reputational damage that could potentially have an adverse effect on our business.
If we or parties on whom we rely fail to maintain the necessary licenses for the development, production, sales and distribution of our products, our ability to conduct our business could be materially impaired.
We are required to obtain, maintain and renew various permits, licenses and certificates to develop, produce, promote and sell our products. Third parties, such as distributors, third-party promoters and third-party manufacturers, on whom we may rely to develop, produce, promote, sell and distribute our products may be subject to similar requirements. We and third parties on whom we rely may be also subject to regular inspections, examinations, inquiries or audits by the regulatory authorities, and an adverse outcome of such inspections, examinations, inquiries or audits may result in the loss or non-renewal of the relevant permits, licenses and certificates. Moreover, the criteria used in reviewing applications for, or renewals of permits, licenses and certificates may change from time to time, and there can be no assurance that we or the parties on whom we rely will be able to meet new criteria that may be imposed to obtain or renew the necessary permits, licenses and certificates. Many of such permits, licenses and certificates are material to the operation of our business, and if we or parties on whom we rely fail to maintain or renew material permits, licenses and certificates, our ability to conduct our business could be materially impaired. Furthermore, if the interpretation or implementation of existing laws and regulations change, or new regulations come into effect, requiring us or parties on whom we rely to obtain any additional permits, licenses or certificates that were previously not required to operate our business, there can be no assurance that we or parties on whom we rely will successfully obtain such permits, licenses or certificates.
Business disruptions could seriously harm our future revenue and financial condition and increase our costs and expenses.
Our operations, and those of our third-party research institution collaborators, CROs, suppliers and other contractors and consultants, could be subject natural or man-made disasters or business interruptions, for which we are predominantly self-insured. In addition, we partially rely on our third-party research institution collaborators for conducting research and
73
development of our drug candidates, and they may be affected by government shutdowns or withdrawn funding. The occurrence of any of these business disruptions could seriously harm our operations and financial condition and increase our costs and expenses. We partially rely on third-party manufacturers to produce and process our drugs and drug candidates. Our ability to obtain supplies of our drugs and drug candidates could be disrupted if the operations of these suppliers are affected by a man-made or natural disaster or other business interruption. Damage or extended periods of interruption to our corporate, development, research or manufacturing facilities due to fire, natural disaster, power loss, communications failure, unauthorized entry or other events could cause us to cease or delay development or commercialization of some or all of our drug candidates. Although we maintain property damage and business interruption insurance coverage on these facilities, our insurance might not cover all losses under such circumstances and our business may be seriously harmed by such delays and interruption.
Product liability claims or lawsuits could cause us to incur substantial liabilities.
We face an inherent risk of product liability as a result of the commercialization of our drugs in China and the clinical testing and any future commercialization of our drug candidates globally. For example, we may be sued if our drugs or drug candidates cause or are perceived to cause injury or are found to be otherwise unsuitable during clinical testing, manufacturing, marketing or sale. Any such product liability claims may include allegations of defects in manufacturing, defects in design, a failure to warn of dangers inherent in the drug, negligence, strict liability or a breach of warranties. Claims could also be asserted under applicable consumer protection acts. If we cannot successfully defend ourselves against or obtain indemnification from our collaborators for product liability claims, we may incur substantial liabilities or be required to limit commercialization of our drugs and drug candidates. Even successful defense would require significant financial and management resources. Regardless of the merits or eventual outcome, liability claims may result in: decreased demand for our drugs; injury to our reputation; withdrawal of clinical trial participants and inability to continue clinical trials; initiation of investigations by regulators; costs to defend the related litigation; a diversion of management’s time and our resources; substantial monetary awards to trial participants or patients; product recalls, withdrawals or labeling, marketing or promotional restrictions; loss of revenue; exhaustion of any available insurance and our capital resources; the inability to commercialize any drug candidate; and a decline in the ADS or ordinary share price.
Our inability to obtain sufficient product liability insurance at an acceptable cost to protect against potential product liability claims could prevent or inhibit the commercialization of our drugs and drug candidates. Although we currently hold product liability coverage which we believe to be sufficient in light of our current products and clinical programs, the amount of such insurance coverage may not be adequate, and we may be unable to maintain such insurance at a reasonable cost or in an amount adequate to satisfy any liability that may arise, or we may not be able to obtain additional or replacement insurance at a reasonable cost, if at all. Our insurance policies may also have various exclusions, and we may be subject to a product liability claim for which we have no coverage. We may have to pay any amounts awarded by a court or negotiated in a settlement that exceed our coverage limitations or that are not covered by our insurance, and we may not have, or be able to obtain, sufficient capital to pay such amounts. Even if our agreements with any future collaborators entitle us to indemnification against losses, such indemnification may not be available or adequate should any claim arise.
We are subject to the risks of doing business globally.
Because we operate in China and other countries outside of the United States, our business is subject to risks associated with doing business globally. Accordingly, our business and financial results in the future could be adversely affected due to a variety of factors, including: changes in a specific country’s or region’s political and cultural climate or economic condition; unexpected changes in laws and regulatory requirements in local jurisdictions; difficulty of effective enforcement of contractual provisions in local jurisdictions; inadequate intellectual property protection in certain countries; enforcement of anti-corruption and anti-bribery laws, such as the FCPA; trade-protection measures or disputes, import or export licensing requirements such as Export Administration Regulations promulgated by the United States Department of Commerce and fines, penalties or suspension or revocation of export privileges; laws and regulations on foreign investment in the United States under the jurisdiction of the Committee on Foreign Investment in the United States, or CFIUS, and other agencies, including the Foreign Investment Risk Review Modernization Act, or FIRRMA, adopted in August 2018; the effects of applicable local tax regimes and potentially adverse tax consequences; and significant adverse changes in local currency exchange rates.
74
We manufacture and intend to continue to manufacture ourselves at least a portion of our drug candidates and our drugs, if approved. Delays in completing and receiving regulatory approvals for our manufacturing facilities, or damage to, destruction of or interruption of production at such facilities, could delay our development plans or commercialization efforts.
We currently have manufacturing facilities in Beijing and Suzhou, China and are building a biologics manufacturing facility in Guangzhou, China. These facilities may encounter unanticipated delays and expenses due to a number of factors, including regulatory requirements. If construction, regulatory evaluation and/or approval of our facilities are delayed, we may not be able to manufacture sufficient quantities of our drug candidates and our drugs, if approved, which would limit our development and commercialization activities and our opportunities for growth. Cost overruns associated with constructing or maintaining our facilities could require us to raise additional funds from other sources.
In addition to the similar manufacturing risks described in “-Risks Related to Our Reliance on Third Parties,” our manufacturing facilities will be subject to inspection in connection with new drug approvals and ongoing, periodic inspection by the FDA, NMPA, EMA or other comparable regulatory agencies to ensure compliance with cGMP and other regulatory requirements. Our failure to follow and document our adherence to such cGMP regulations or other regulatory requirements may lead to significant delays in the availability of products for clinical or commercial use, may result in the termination of or a hold on a clinical trial, or may delay or prevent filing or approval of marketing applications for our drug candidates or the commercialization of our drugs, if approved. We also may encounter problems with the following:
|
•
|
achieving adequate or clinical-grade materials that meet FDA, NMPA, EMA or other comparable regulatory agency standards or specifications with consistent and acceptable production yield and costs;
|
|
•
|
shortages of qualified personnel, raw materials or key contractors; and
|
|
•
|
ongoing compliance with cGMP regulations and other requirements of the FDA, NMPA, EMA or other comparable regulatory agencies.
|
Failure to comply with applicable regulations could also result in sanctions being imposed on us, including fines, injunctions, civil penalties, a requirement to suspend or put on hold one or more of our clinical trials, failure of regulatory authorities to grant marketing approval of our drug candidates, delays, suspension or withdrawal of approvals, supply disruptions, license revocation, seizures or recalls of drug candidates or drugs, operating restrictions and criminal prosecutions, any of which could harm our business.
Developing advanced manufacturing techniques and process controls is required to fully utilize our facilities. Advances in manufacturing techniques may render our facilities and equipment inadequate or obsolete.
To produce our drugs in the quantities that we believe will be required to meet anticipated market demand of our drug candidates if approved, we will need to increase, or “scale up,” the production process by a significant factor over the initial level of production. If we are unable to do so, are delayed, or if the cost of this scale up is not economically feasible for us or we cannot find a third-party supplier, we may not be able to produce our drugs in a sufficient quantity to meet future demand.
In addition to the similar manufacturing risks described in “-Risks Related to Our Reliance on Third Parties,” if our manufacturing facilities or the equipment in them is damaged or destroyed, we may not be able to quickly or inexpensively replace our manufacturing capacity or replace it at all. In the event of a temporary or protracted loss of the facilities or equipment, we might not be able to transfer manufacturing to a third party. Even if we could transfer manufacturing to a third party, the shift would likely be expensive and time-consuming, particularly since the new facility would need to comply with the necessary regulatory requirements and we would need regulatory agency approval before selling any drugs manufactured at that facility. Such an event could delay our clinical trials or reduce our product sales. Any interruption in manufacturing operations at our manufacturing facilities could result in our inability to satisfy the demands of our clinical trials or commercialization. Any disruption that impedes our ability to manufacture our drug candidates or drugs in a timely manner could materially harm our business, financial condition and operating results.
Currently, we maintain insurance coverage against damage to our property and equipment in amounts we believe are reasonable. However, our insurance coverage may not reimburse us, or may not be sufficient to reimburse us, for any expenses or losses we may suffer. We may be unable to meet our requirements for our drug candidates and drugs if there were a catastrophic event or interruption or failure of our manufacturing facilities or processes.
75
Future operating results could be negatively affected by changes in tax rates, the adoption of new tax legislation in the jurisdictions in which we operate, or exposure to additional tax liabilities.
The nature of our international operations subjects us to local, state, regional and national tax laws in jurisdictions around the world. Our future tax expense could be affected by changes in the mix of earnings in countries with differing statutory tax rates, changes in the valuation of deferred tax assets and liabilities or changes in tax laws or their interpretation. Additionally, tax rules governing cross-border activities are continually subject to modification as a result of both coordinated actions by governments and unilateral measures designed by individual countries, both intended to tackle concerns over base erosion and profit shifting (BEPS) and perceived international tax avoidance techniques.
We have received tax rulings from various governments that have jurisdictional authority over our operations. If we are unable to meet the requirements of such agreements, or if they expire or are renewed on less favorable terms, the result could negatively impact our future earnings. Additionally, the European Commission has opened formal investigations into specific tax rulings granted by several countries to specific taxpayers. While we believe that our rulings are different than those being discussed, the ultimate resolution of such activities cannot be predicted and could also have an adverse impact on future operating results.
Risks Related to Our Doing Business in the PRC
The pharmaceutical industry in China is highly regulated, and such regulations are subject to change, which may affect approval and commercialization of our drugs.
A large portion of our business is conducted in China. The pharmaceutical industry in China is subject to comprehensive government regulation and supervision, encompassing the approval, registration, manufacturing, packaging, licensing and marketing of new drugs. In recent years, the regulatory framework in China regarding the pharmaceutical industry has undergone significant changes, which we expect will continue. While we believe our strategies regarding pharmaceutical research, development, manufacturing and commercialization in China are aligned with the Chinese government's policies, they may in the future diverge, requiring a change in our strategies. Any such change may result in increased compliance costs on our business or cause delays in or prevent the successful research, development, manufacturing or commercialization of our drug candidates or drugs in China and reduce the current benefits we believe are available to us from developing and manufacturing drugs in China.
Chinese authorities have become increasingly vigilant in enforcing laws in the pharmaceutical industry. Any failure by us or our partners to maintain compliance with applicable laws and regulations or obtain and maintain required licenses and permits may result in the suspension or termination of our business activities in China.
Reports of what have come to be viewed as significant quality-control failures by Chinese vaccine manufacturers have led to enforcement action against officials responsible for implementing national reforms favorable to innovative drugs (such as ours). While not directly affecting us, this macro-industry event could cause state or private resources to be diverted away from fostering innovation and be redirected toward regulatory enforcement, which could adversely affect our research, development, manufacturing and commercialization activities and increase our compliance cost
.
Changes in the political and economic policies of the PRC government or in relations between China and the United States or other governments may materially and adversely affect our business, financial condition and results of operations and may result in our inability to sustain our growth and expansion strategies.
Due to our extensive operations in China, our business, results of operations, financial condition and prospects may be influenced to a significant degree by economic, political, legal and social conditions in the PRC or changes in government relations between China and the United States or other governments. China’s economy differs from the economies of developed countries in many respects, including with respect to the amount of government involvement, level of development, growth rate, control of foreign exchange and allocation of resources. While the PRC economy has experienced significant growth over the past four decades, growth has been uneven across different regions and among various economic sectors of the PRC. The PRC government has implemented various measures to encourage economic development and guide the allocation of resources. Some of these measures may benefit the overall PRC economy, but may have a negative effect on us. For example, our financial condition and results of operations may be adversely affected by government control over capital investments or changes in tax regulations that are currently applicable to us. In addition, in the past the PRC government implemented certain measures, including interest rate increases, to control the pace of economic growth. These measures may cause decreased economic activity in the PRC, which may adversely affect our business and results of operation. More generally, if the business environment in the PRC deteriorates from the perspective of domestic or international investment, or if relations between China and the United States or other governments deteriorate, our business in the PRC may also be adversely affected.
76
There are uncertainties regarding the interpretation and enforcement of PRC laws, rules and regulations.
A large portion of our operations are conducted in the PRC through our PRC subsidiaries, and are governed by PRC laws, rules and regulations. Our PRC subsidiaries are subject to laws, rules and regulations applicable to foreign investment in China. The PRC legal system is a civil law system based on written statutes. Unlike the common law system, prior court decisions may be cited for reference but have limited precedential value.
In 1979, the PRC government began to promulgate a comprehensive system of laws, rules and regulations governing economic matters in general. The overall effect of legislation over the past four decades has significantly enhanced the protections afforded to various forms of foreign investment in China. However, China has not developed a fully integrated legal system, and recently enacted laws, rules and regulations may not sufficiently cover all aspects of economic activities in China or may be subject to significant degrees of interpretation by PRC regulatory agencies. In particular, because these laws, rules and regulations are relatively new and often give the relevant regulator significant discretion in how to enforce them, and because of the limited number of published decisions and the nonbinding nature of such decisions, the interpretation and enforcement of these laws, rules and regulations involve uncertainties and can be inconsistent and unpredictable. In addition, the PRC legal system is based in part on government policies and internal rules, some of which are not published on a timely basis or at all, and which may have a retroactive effect. As a result, we may not be aware of our violation of these policies and rules until after the occurrence of the violation.
The MOFCOM published a discussion draft of the proposed Foreign Investment Law, or the 2015 Draft Foreign Investment Law, in January 2015 and completed the solicitation of comments on this draft in February 2015. In December 2018, the PRC National People’s Congress Standing Committee reviewed and published a revised draft Foreign Investment Law, or the 2018 Draft Foreign Investment Law, which was further revised by the Standing Committee of the National People’s Congress in its second review meeting held on January 29, 2019. The 2018 Draft Foreign Investment Law will replace the major existing laws and regulations governing foreign investment in China upon its enactment. There are substantial uncertainties with respect to the enactment timetable and the final content of the Foreign Investment Law and its implementation rules. The 2018 Draft Foreign Investment Law requires foreign investors or applicable foreign invested entities, or FIEs, to report investment information to government authorities. Although the 2018 Draft Foreign Investment Law does not specify the form, content, scope and frequency of such information reporting, it provides monetary fines of up to RMB 500,000 on non-compliance of such information reporting obligations. The PRC governmental authorities may promulgate implementation rules after the Foreign Investment Law is enacted and further clarify the detailed information reporting requirements on foreign investors and the applicable FIEs. In that case, our current corporate governance practices and business operations may be materially affected and our compliance costs may increase significantly.
Additionally, the NMPA’s recent reform of the drug and approval system may face implementation challenges. The timing and full impact of such reforms is uncertain and could prevent us from commercializing our drug candidates in a timely manner.
In addition, any administrative and court proceedings in the PRC may be protracted, resulting in substantial costs and diversion of resources and management attention. Since PRC administrative and court authorities have significant discretion in interpreting and implementing statutory and contractual terms, it may be more difficult to evaluate the outcome of administrative and court proceedings and the level of legal protection we enjoy than in more developed legal systems. These uncertainties may impede our ability to enforce the contracts we have entered into and could materially and adversely affect our business, financial condition and results of operations.
Any failure to comply with PRC regulations regarding our employee equity plans and investments in offshore companies by PRC residents may subject the PRC plan participants and PRC-residents beneficial owners or us to fines and other legal or administrative sanctions.
We and our directors, executive officers and other employees who are PRC residents have participated in our employee equity plans. We are an overseas listed company, and therefore, we and our directors, executive officers and other employees who are PRC citizens or who have resided in the PRC for a continuous period of not less than one year and who have been granted restricted share units, restricted shares, options or other forms of equity incentives or rights to acquire equity are subject to the Notice on Issues Concerning the Foreign Exchange Administration for Domestic Individuals Participating in Share Incentive Plan of Overseas Publicly Listed Company, according to which, employees, directors, supervisors and other management members participating in any share incentive plan of an overseas publicly listed company who are PRC citizens or who are non-PRC citizens residing in the PRC for a continuous period of not less than one year, subject to limited exceptions, are required to register with the State Administration of Foreign Exchange, or the SAFE, through a domestic qualified agent, which could be a PRC subsidiary of such overseas listed company, and complete certain other procedures. We also face
77
regulatory uncertainties that could restrict our ability to adopt additional equity incentive plans for our directors and employees under PRC law.
Some of our existing shareholders, each of whom owns our ordinary shares as a result of exercising share options, are PRC residents under the Circular on Relevant Issues Concerning Foreign Exchange Control on Domestic Residents’ Offshore Investment and Financing and Roundtrip Investment through Special Purpose Vehicles, or SAFE Circular 37. These shareholders have undertaken to (i) apply to register with local SAFE branch or its delegated commercial bank as soon as possible after exercising their options, and (ii) indemnify and hold harmless us and our subsidiaries against any loss suffered arising from their failure to complete the registration. We do not have control over such shareholders and our other beneficial owners and cannot assure you that all of our PRC-resident beneficial owners have complied with, and will in the future comply with, SAFE Circular 37 and subsequent implementation rules.
If we or our directors, executive officers or other employees who are PRC citizens or who have resided in the PRC for a continuous period of not less than one year and who have been granted equity awards or other rights to acquire equity fail to register the employee equity plans or their exercise of options or vesting of equity awards, or such PRC-resident beneficial owners fails to register or amend their SAFE registrations in a timely manner pursuant to SAFE Circular 37, we and such employees and PRC-beneficial owners may be subject to (i) legal or administrative sanctions imposed by the SAFE or other PRC authorities, including fines; (ii) restrictions on our cross-border investment activities; (iii) limits on the ability of our wholly owned subsidiaries in China to distribute dividends or the proceeds from any reduction in capital, share transfer or liquidation to us; and (iv) prohibitions on our ability to inject additional capital into these subsidiaries. Moreover, failure to comply with the various foreign exchange registration requirements described above could result in liability under PRC law for circumventing applicable foreign exchange restrictions.
We may rely on dividends and other distributions on equity paid by our PRC subsidiaries to fund any cash and financing requirements we may have, and any limitation on the ability of our PRC subsidiaries to make payments to us could have a material and adverse effect on our ability to conduct our business.
We are a holding company incorporated in the Cayman Islands, and we may rely on dividends and other distributions on equity paid by our PRC subsidiaries for our cash and financing requirements, including the funds necessary to pay dividends and other cash distributions to our shareholders or to service any debt we may incur. If any of our PRC subsidiaries incur debt on their own behalf in the future, the instruments governing the debt may restrict their ability to pay dividends or make other distributions to us. Under PRC laws and regulations, our PRC subsidiaries may pay dividends only out of their respective accumulated profits as determined in accordance with PRC accounting standards and regulations. In addition, a wholly foreign-owned enterprise is required to set aside at least 10% of its accumulated after-tax profits each year, if any, to fund a certain statutory reserve fund, until the aggregate amount of such fund reaches 50% of its registered capital. Such reserve funds cannot be distributed to us as dividends. At its discretion, a wholly foreign-owned enterprise may allocate a portion of its after-tax profits based on PRC accounting standards to an enterprise expansion fund, or a staff welfare and bonus fund. In addition, registered share capital and capital reserve accounts are also restricted from withdrawal in the PRC, up to the amount of net assets held in each operating subsidiary. As of
December 31, 2018
and
December 31, 2017
, these restricted assets totaled
$93.3 million
and
$29.9 million
, respectively.
Our PRC subsidiaries generate primarily all of their revenue in RMB, which is not freely convertible into other currencies. As a result, any restriction on currency exchange may limit the ability of our PRC subsidiaries to use their RMB revenues to pay dividends to us.
In response to the persistent capital outflow in the PRC and RMB’s depreciation against the U.S. dollar in the fourth quarter of 2016, China’s People’s Bank of China, or PBOC, and the SAFE promulgated a series of capital control measures, including stricter vetting procedures for domestic companies to remit foreign currency for overseas investments, dividends payments and shareholder loan repayments.
The PRC government may continue to strengthen its capital controls, and more restrictions and substantial vetting process may be put forward by the SAFE for cross-border transactions falling under both the current account and the capital account. Any limitation on the ability of our PRC subsidiaries to pay dividends or make other kinds of payments to us could materially and adversely limit our ability to grow, make investments or acquisitions that could be beneficial to our business, pay dividends, or otherwise fund and conduct our business.
The Enterprise Income Tax Law, or the EIT Law, and its implementation rules provide that China-sourced income of foreign enterprises, such as dividends paid by a PRC subsidiary to its equity holders that are non-PRC resident enterprises, will normally be subject to PRC withholding tax at a rate of 10%, unless any such foreign investor’s jurisdiction of incorporation
78
has a tax treaty with China that provides for a different withholding arrangement. As a result, dividends paid to us by our PRC subsidiaries are expected to be subject to PRC withholding tax at a rate of 10%.
Pursuant to the Arrangement between Mainland China and Hong Kong Special Administrative Region for the Avoidance of Double Taxation and Prevention of Fiscal Evasion with respect to Taxes on Income, or the Hong Kong Tax Treaty, BeiGene HK, the shareholder of some of our PRC subsidiaries, may be subject to a withholding tax at a rate of 5% on dividends received from our PRC operating subsidiaries as a Hong Kong tax resident. Pursuant to the Hong Kong Tax Treaty, subject to certain conditions, this reduced withholding tax rate will be available for dividends from PRC entities provided that the recipient can demonstrate it is a Hong Kong tax resident and it is the beneficial owner of the dividends. The SAT promulgated SAT Circular 9 in February 2018, which became effective from April 2018 and stipulates that in determining whether a non-resident enterprise has the status as a beneficial owner, comprehensive analysis shall be conducted based on the factors listed therein and the actual circumstances of the specific case shall be taken into consideration. Specifically, it expressly excludes an agent or a designated payee from being considered as a “beneficial owner.” BeiGene HK currently does not hold a Hong Kong tax resident certificate from the Inland Revenue Department of Hong Kong and there is no assurance that the reduced withholding tax rate will be available.
We may be treated as a resident enterprise for PRC tax purposes under the EIT Law and we may therefore be subject to PRC income tax on our worldwide taxable income. Dividends payable to foreign investors and gains on the sale of our ADSs or ordinary shares by our foreign investors may become subject to PRC tax.
Under the EIT Law an enterprise established outside the PRC with “de facto management bodies” within the PRC is considered a “resident enterprise,” meaning that it is treated in a manner similar to a Chinese enterprise for PRC enterprise income tax, or EIT, purposes. The implementing rules of the EIT Law define “de facto management bodies” as “management bodies that exercise substantial and overall management and control over the production and operations, personnel, accounting, and properties” of the enterprise. In addition, the Notice Regarding the Determination of Chinese-Controlled Offshore Incorporated Enterprises as PRC Tax Resident Enterprises on the Basis of De Facto Management Bodies, or Circular 82, specifies that certain Chinese-controlled offshore incorporated enterprises, defined as enterprises incorporated under the laws of foreign countries or territories and that have PRC enterprises or enterprise groups as their primary controlling shareholders, will be classified as resident enterprises if all of the following are located or resident in China: (i) senior management personnel and departments that are responsible for daily production, operation and management; (ii) financial and personnel decision-making bodies; (iii) key properties, accounting books, company seal, and minutes of board meetings and shareholders’ meetings; and (iv) half or more of senior management or directors having voting rights. The State Administration of Taxation, or the SAT, has subsequently provided further guidance on the implementation of Circular 82.
Although BeiGene, Ltd. does not have a PRC enterprise or enterprise group as its primary controlling shareholder and is therefore not a Chinese-controlled offshore incorporated enterprise within the meaning of Circular 82, in the absence of guidance specifically applicable to us, we have applied the guidance set forth in Circular 82 to evaluate the tax residence status of BeiGene, Ltd. and its subsidiaries organized outside of the PRC.
We are not aware of any offshore holding company with a corporate structure similar to ours that has been deemed a PRC “resident enterprise” by the PRC tax authorities. Accordingly, we do not believe that our company or any of our overseas subsidiaries should be treated as a PRC resident enterprise.
However, the tax resident status of an enterprise is subject to determination by the PRC tax authorities and uncertainties remain with respect to the interpretation of the term "de facto management body." If the PRC tax authorities determine that our Cayman Islands holding company is a resident enterprise for PRC enterprise income tax purposes, a number of unfavorable PRC tax consequences could follow and we may be subject to enterprise income tax at a rate of 25% on our worldwide taxable income, as well as to PRC enterprise income tax reporting obligations. If we are deemed a PRC resident enterprise, dividends paid on our ordinary shares or ADSs, and any gain realized from the transfer of our ordinary shares or ADSs, may be treated as income derived from sources within the PRC. As a result, dividends paid to non-PRC resident enterprise ADS holders or shareholders may be subject to PRC withholding tax at a rate of 10% (or 20% in the case of non-PRC individual ADS holders or shareholders) and gains realized by non-PRC resident enterprises ADS holders or shareholders from the transfer of our ordinary shares or ADSs may be subject to PRC tax at a rate of 10% (or 20% in the case of non-PRC individual ADS holders or shareholders).
79
We and our shareholders face uncertainties with respect to indirect transfers of equity interests in PRC resident enterprises or other assets attributed to a PRC establishment of a non-PRC company, or other assets attributable to a PRC establishment of a non-PRC company.
Pursuant to the Bulletin on Issues of Enterprise Income Tax and Indirect Transfers of Assets by Non-PRC Resident Enterprises, or Bulletin 7, which was amended by the Announcement on Issues Relating to Withholding at Source of Income Tax on Non-resident Enterprises issued by SAT, or Announcement 37, an “indirect transfer” of “PRC taxable assets,” including equity interests in a PRC resident enterprise, by non-PRC resident enterprises may be recharacterized and treated as a direct transfer of PRC taxable assets, if such arrangement does not have a reasonable commercial purpose and was established for the purpose of avoiding payment of PRC enterprise income tax. As a result, gains derived from such indirect transfer may be subject to PRC enterprise income tax. When determining whether there is a “reasonable commercial purpose” of the transaction arrangement, factors to be taken into consideration include: whether the main value of the equity interest of the relevant offshore enterprise derives from PRC taxable assets; whether the assets of the relevant offshore enterprise mainly consists of direct or indirect investment in the PRC or if its income mainly derives from the PRC; whether the offshore enterprise and its subsidiaries directly or indirectly holding PRC taxable assets have real commercial nature which is evidenced by their actual function and risk exposure; the duration of existence of the business model and organizational structure; the replicability of the transaction by direct transfer of PRC taxable assets; and the tax situation of such indirect transfer and applicable tax treaties or similar arrangements. In respect of an indirect offshore transfer of assets of a PRC establishment, the resulting gain is to be reported on with the enterprise income tax filing of the PRC establishment or place of business being transferred, and would consequently be subject to PRC enterprise income tax at a rate of 25%. Where the underlying transfer relates to equity investments in a PRC resident enterprise, which is not related to a PRC establishment or place of business of a non-resident enterprise, a PRC enterprise income tax at the rate of 10% would apply, subject to available preferential tax treatment under applicable tax treaties or similar arrangements. Late payment of applicable tax will subject the transferor to default interest. Gains derived from the sale of shares by investors through a public stock exchange are not subject to the PRC enterprise income tax pursuant to Bulletin 7 where such shares were acquired in a transaction through a public stock exchange. As such, the sale of the ADSs or ordinary shares on a public stock exchange will not be subject to PRC enterprise income tax pursuant to Bulletin 7. However, the sale of our ordinary shares or ADSs by a non-PRC resident enterprise outside a public stock exchange may be subject to PRC enterprise income tax under Bulletin 7.
There are uncertainties as to the application of Bulletin 7. Bulletin 7 may be determined by the tax authorities to be applicable to sale of the shares of our offshore subsidiaries or investments where PRC taxable assets are involved. The transferors and transferees may be subject to the tax filing and withholding or tax payment obligation, while our PRC subsidiaries may be requested to assist in the filing. Furthermore, we, our non-resident enterprises and PRC subsidiaries may be required to spend valuable resources to comply with Bulletin 7 or to establish that we and our non-resident enterprises should not be taxed under Bulletin 7, for our previous and future restructuring or disposal of shares of our offshore subsidiaries, which may have a material adverse effect on our financial condition and results of operations.
The PRC tax authorities have the discretion under Bulletin 7 to make adjustments to the taxable capital gains based on the difference between the fair value of the taxable assets transferred and the cost of investment. If the PRC tax authorities make adjustments to the taxable income of the transactions under Announcement 37, or Bulletin 7, our income tax costs associated with such potential acquisitions or disposals will increase, which may have an adverse effect on our financial condition and results of operations.
Restrictions on currency exchange may limit our ability to utilize our revenue effectively.
The PRC government imposes controls on the convertibility of RMB into foreign currencies and, in certain cases, the remittance of currency out of the PRC. A portion of our revenue is denominated in RMB. Shortages in availability of foreign currency may then restrict the ability of our PRC subsidiaries to remit sufficient foreign currency to our offshore entities for our offshore entities to pay dividends or make other payments or otherwise to satisfy our foreign currency denominated obligations. The RMB is currently convertible under the “current account,” which includes dividends, trade and service-related foreign exchange transactions, but not under the “capital account,” which includes foreign direct investment and loans, including loans we may secure from our onshore subsidiaries. Currently, our PRC subsidiaries may purchase foreign currency for settlement of “current account transactions,” including payment of dividends to us, without the approval of SAFE by complying with certain procedural requirements. However, the relevant PRC governmental authorities may limit or eliminate our ability to purchase foreign currencies in the future for current account transactions. Since a portion of our revenue is denominated in RMB, any existing and future restrictions on currency exchange may limit our ability to utilize revenue generated in RMB to fund our business activities outside of the PRC or pay dividends in foreign currencies to holders of our ordinary shares and the ADSs. Foreign exchange transactions under the capital account remain subject to limitations and require approvals from, or
80
registration with, SAFE and other relevant PRC governmental authorities or designated banks. This could affect our ability to obtain foreign currency through debt or equity financing for our subsidiaries.
Our business benefits from certain financial incentives and discretionary policies granted by local governments. Expiration of, or changes to, these incentives or policies would have an adverse effect on our results of operations.
Local governments in the PRC have granted certain financial incentives from time to time to our PRC subsidiaries as part of their efforts to encourage the development of local businesses. The timing, amount and criteria of government financial incentives are determined within the sole discretion of the local government authorities and cannot be predicted with certainty before we actually receive any financial incentive. We generally do not have the ability to influence local governments in making these decisions. Local governments may decide to reduce or eliminate incentives at any time. In addition, some of the government financial incentives are granted on a project basis and subject to the satisfaction of certain conditions, including compliance with the applicable financial incentive agreements and completion of the specific project therein. We cannot guarantee that we will satisfy all relevant conditions, and if we do so we may be deprived of the relevant incentives. We cannot assure you of the continued availability of the government incentives currently enjoyed by us. Any reduction or elimination of incentives would have an adverse effect on our results of operations. Government grant and subsidies recognized in the income statement for the years ended December 31, 2018 and 2017 were $4.4 million and $11.3 million, respectively.
The audit report included in our Annual Report on Form 10-K filed with the SEC is prepared by auditors who are not inspected fully by the Public Company Accounting Oversight Board, or the PCAOB, and, as such, investors are deprived of the benefits of such inspection.
As an auditor of companies that are publicly traded in the United States and a firm registered with the PCAOB, Ernst & Young Hua Ming LLP is required under the laws of the United States to undergo regular inspections by the PCAOB. However, because we have substantial operations within the PRC, a jurisdiction where the PCAOB is currently unable to conduct inspections without the approval of the Chinese government authorities, our auditor and its audit work is not currently inspected fully by the PCAOB.
Inspections of other auditors conducted by the PCAOB outside the PRC have at times identified deficiencies in those auditors’ audit procedures and quality control procedures, which may be addressed as part of the inspection process to improve future audit quality. The lack of PCAOB inspections of audit work undertaken in the PRC prevents the PCAOB from regularly evaluating our auditor’s audits and its quality control procedures. As a result, investors may be deprived of the benefits of PCAOB inspections, and may lose confidence in our reported financial information and procedures and the quality of our financial statements.
Proceedings instituted by the SEC against five PRC-based accounting firms, including our independent registered public accounting firm, could result in our financial statements being determined to not be in compliance with the requirements of the Exchange Act.
In December 2012, the SEC brought administrative proceedings against five accounting firms in China, including our independent registered public accounting firm, alleging that they had refused to produce audit work papers and other documents related to certain other PRC-based companies under investigation by the SEC. On January 22, 2014, an initial administrative law decision was issued, censuring these accounting firms and suspending four of these firms from practicing before the SEC for a period of six months. The decision is neither final nor legally effective unless and until reviewed and approved by the SEC. On February 12, 2014, four of these PRC-based accounting firms appealed to the SEC against this decision. In February 2015, each of the four PRC-based accounting firms agreed to a censure and to pay a fine to the SEC to settle the dispute and avoid suspension of their ability to practice before the SEC. These firms’ ability to continue to serve all their respective clients is not affected by the settlement. The settlement requires these firms to follow detailed procedures to seek to provide the SEC with access to Chinese firms’ audit documents via the China Securities Regulatory Commission, or the CSRC. If these firms do not follow these procedures, the SEC could impose penalties such as suspensions, or it could restart the administrative proceedings. The settlement did not require these firms to admit to any violation of law and preserves these firms’ legal defenses in the event the administrative proceeding is restarted. In the event that the SEC restarts the administrative proceedings, depending upon the final outcome, listed companies in the United States with major PRC operations may find it difficult or impossible to retain auditors in respect of their operations in the PRC, which could result in financial statements being determined to not be in compliance with the requirements of the Exchange Act, including possible delisting. Moreover, any negative news about the proceedings against these audit firms may cause investor uncertainty regarding PRC-based, U.S.-listed companies and the market price of the ADSs and/or ordinary shares may be adversely affected.
81
If our independent registered public accounting firm was denied, even temporarily, the ability to practice before the SEC and we were unable to timely find another registered public accounting firm to audit and issue an opinion on our financial statements, our financial statements could be determined not to be in compliance with the requirements of the Exchange Act. Such a determination could ultimately lead to deregistration from the SEC, which would substantially reduce or effectively terminate the trading of the ADSs in the United States. Moreover, any negative news about the proceedings against these audit firms may adversely affect investor confidence in companies with substantial mainland China-based operations listed in the United States. All these would materially and adversely affect the market price of the ADSs and substantially reduce or effectively terminate the trading of the ADSs in the United States, and the market price of the ordinary shares may be adversely affected.
Risks Related to Our American Depositary Shares and Ordinary Shares
The trading prices of our ordinary shares and/or ADSs can be volatile, which could result in substantial losses to you.
The trading price of our ordinary shares and/or ADSs can be volatile and fluctuate widely in response to a variety of factors, many of which are beyond our control. In addition, the performance and fluctuation of the market prices of other companies with business operations located mainly in the PRC that have listed their securities in Hong Kong or the United States may affect the volatility in the price of and trading volumes for our ordinary shares and/or ADSs. Some of these companies have experienced significant volatility. The trading performances of these PRC companies’ securities may affect the overall investor sentiment towards other PRC companies listed in Hong Kong or the United States and consequently may impact the trading performance of our ordinary shares and/or ADSs.
In addition to market and industry factors, the price and trading volume for our ordinary shares and/or ADSs may be highly volatile for specific business reasons, including: announcements of regulatory approval or a complete response letter, or specific label indications or patient populations for its use, or changes or delays in the regulatory review process; announcements of therapeutic innovations, new products, acquisitions, strategic relationships, joint ventures or capital commitments by us or our competitors; adverse actions taken by regulatory agencies with respect to our clinical trials, manufacturing supply chain or sales and marketing activities; any adverse changes to our relationship with manufacturers or suppliers; the results of our testing and clinical trials; the results of our efforts to acquire or license additional drug candidates; variations in the level of expenses related to our existing drugs and drug candidates or preclinical, clinical development and commercialization programs; any intellectual property infringement actions in which we may become involved; announcements concerning our competitors or the pharmaceutical industry in general; fluctuations in product revenue, sales and marketing expenses and profitability; manufacture, supply or distribution shortages; variations in our results of operations; announcements about our results of operations that are not in line with analyst expectations, the risk of which is enhanced because it is our policy not to give guidance on results of operations; publication of operating or industry metrics by third parties, including government statistical agencies, that differ from expectations of industry or financial analysts; changes in financial estimates by securities research analysts; media reports, whether or not true, about our business, our competitors or our industry; additions to or departures of our management; fluctuations of exchange rates between the RMB, the U.S. dollar and Hong Kong dollar; release or expiry of lock-up or other transfer restrictions on our outstanding ordinary shares or ADSs; sales or perceived potential sales of additional ordinary shares or ADSs by us, our executive officers and directors or our shareholders; general economic and market conditions and overall fluctuations in the U.S. or Hong Kong equity markets; changes in accounting principles; and changes or developments in the PRC or global regulatory environment.
In addition, the stock market, in general, and pharmaceutical and biotechnology companies have experienced extreme price and volume fluctuations that have often been unrelated or disproportionate to the operating performance of these companies. Broad market and industry factors may negatively affect the market price of our ordinary shares and/or ADSs, regardless of our actual operating performance. Further, the current volatility in the financial markets and related factors beyond our control may cause the ordinary share and/or ADS price to decline rapidly and unexpectedly.
The characteristics of the U.S. capital markets and the Hong Kong capital markets are different.
The Nasdaq and HKEx have different trading hours, trading characteristics (including trading volume and liquidity), trading and listing rules, and investor bases (including different levels of retail and institutional participation). As a result of these differences, the trading prices of our ordinary shares and the ADSs representing them might not be the same, even allowing for currency differences. Fluctuations in the price of our ADSs due to circumstances peculiar to its home capital market could materially and adversely affect the price of the ordinary shares. Because of the different characteristics of the U.S. and Hong Kong equity markets, the historic market prices of our ADSs may not be indicative of the performance of our securities (including the ordinary shares) going forward.
82
We may be subject to securities litigation, which is expensive and could divert management attention.
Companies that have experienced volatility in the volume and market price of their shares have been subject to an increased incidence of securities class action litigation. We may be the target of this type of litigation in the future. Securities litigation against us could result in substantial costs and divert our management’s attention from other business concerns, and, if adversely determined, could have a material adverse effect on our business, financial condition and results of operations.
Future sales of our ordinary shares and/or ADSs in the public market could cause the ordinary shares and/or ADS price to fall.
Our ordinary share and/or ADS price could decline as a result of sales of a large number of the ordinary shares and/or ADSs or the perception that these sales could occur. These sales, or the possibility that these sales may occur, also might make it more difficult for us to sell equity securities in the future at a time and at a price that we deem appropriate.
As of February 15, 2019, 776,113,184 ordinary shares, par value $0.0001 per share, were outstanding, of which 599,894,893 ordinary shares were held in the form of 46,145,761 American Depositary Shares, each representing 13 ordinary shares.
We filed a registration statement with the SEC on behalf of certain shareholders, registering 299,279,370 ordinary shares in the form of 23,021,490 ADSs to be resold by the selling shareholders identified therein and in any related prospectus supplement from time to time. Furthermore, we have registered or plan to register the offer and sale of all securities that we have issued and may issue in the future under our equity compensation plans, including upon the exercise of share options and vesting of restricted share units. If these additional securities are sold, or if it is perceived that they will be sold, in the public market, the trading price of our ordinary shares and/or ADSs could decline. We have also granted certain registration rights with respect to the shares issued to Celgene in the event that they are not eligible for sale under Rule 144.
In addition, in the future, we may issue additional ordinary shares, ADSs or other equity or debt securities convertible into ordinary shares or ADSs in connection with a financing, acquisition, litigation settlement, employee arrangements or otherwise. Any such issuance could result in substantial dilution to our existing shareholders and could cause the ordinary share and/or ADS price to decline.
Because we do not expect to pay dividends in the foreseeable future, you must rely on price appreciation of the ordinary shares and/or ADSs for return on your investment.
We intend to retain most, if not all, of our available funds and earnings to fund the development and growth of our business. As a result, we do not expect to pay any cash dividends in the foreseeable future. Therefore, you should not rely on an investment in the ordinary shares and/or ADSs as a source for any future dividend income.
Our board of directors has significant discretion as to whether to distribute dividends. Even if our board of directors decides to declare and pay dividends, the timing, amount and form of future dividends, if any, will depend on, among other things, our future results of operations and cash flow, our capital requirements and surplus, the amount of distributions, if any, received by us from our subsidiaries, our financial condition, contractual and regulatory restrictions and other factors deemed relevant by our board of directors. Accordingly, the return on your investment in the ordinary shares and/or ADSs will likely depend entirely upon any future price appreciation of the ordinary shares and/or ADSs. There is no guarantee that the ordinary shares and/or ADSs will appreciate in value or even maintain the price at which you purchased the ordinary shares and/or ADSs. You may not realize a return on your investment in the ordinary shares and/or ADSs and you may even lose your entire investment in the ordinary shares and/or ADSs.
If securities or industry analysts do not continue to publish research or publish inaccurate or unfavorable research about our business, the market price for the ordinary shares and/or ADSs and trading volume could decline.
The trading market for the ordinary shares and ADSs relies in part on the research and reports that equity research analysts publish about us or our business. We do not control these analysts. If research analysts do not maintain adequate research coverage or if one or more of the analysts who covers us downgrades the ordinary shares and/or ADSs or publishes inaccurate or unfavorable research about our business, the market price for the ordinary shares and/or ADSs would likely decline. If one or more of these analysts cease coverage of our company or fail to publish reports on us regularly, we could lose visibility in the financial markets, which, in turn, could cause the market price or trading volume for the ordinary shares and/or ADSs to decline significantly.
83
We are a Cayman Islands company. Because judicial precedent regarding the rights of shareholders is more limited under Cayman Islands law than under Hong Kong law or U.S. law, shareholders may have fewer shareholder rights than they would have under Hong Kong law or U.S. law and may face difficulties in protecting your interests.
We are an exempted company with limited liability incorporated in the Cayman Islands. Our corporate affairs are governed by our amended and restated memorandum and articles of association (as may be further amended from time to time), the Companies Law (as amended) of the Cayman Islands and the common law of the Cayman Islands. The rights of shareholders to take action against the directors, actions by minority shareholders and the fiduciary responsibilities of our directors are to a large extent governed by the common law of the Cayman Islands. This common law is derived in part from comparatively limited judicial precedent in the Cayman Islands as well as from English common law, which has persuasive, but not binding, authority on a court in the Cayman Islands. The rights of our shareholders and the fiduciary responsibilities of our directors under Cayman Islands law are not as clearly established as they would be under statutes or judicial precedent in some jurisdictions in Hong Kong and the United States. In particular, the Cayman Islands has a less developed body of securities law than Hong Kong or the United States. In addition, some states in the United States, such as Delaware, have more fully developed and judicially interpreted bodies of corporate law than the Cayman Islands.
In addition, as a Cayman Islands exempted company, our shareholders have no general rights under Cayman Islands law to inspect corporate records and accounts or to obtain copies of lists of shareholders of these companies with the exception that the shareholders may request a copy of the current amended and restated memorandum and articles of association. Our directors have discretion under our amended and restated articles of association to determine whether or not, and under what conditions, our corporate records may be inspected by our shareholders, but are not obliged to make them available to our shareholders. This may make it more difficult for you to obtain the information needed to establish any facts necessary for a shareholder motion or to solicit proxies from other shareholders in connection with a proxy contest. As a Cayman Islands company, we may not have standing to initiate a derivative action in a Hong Kong or U.S. federal court. As a result, you may be limited in your ability to protect your interests if you are harmed in a manner that would otherwise enable you to sue in a United States federal court. In addition, shareholders of Cayman Islands companies may not have standing to initiate a shareholder derivative action in Hong Kong or U.S. federal courts.
Some of our directors and executive officers reside outside of Hong Kong and the United States and a substantial portion of their assets are located outside of Hong Kong and the United States. As a result, it may be difficult or impossible for you to bring an action against us or against these individuals in the Cayman Islands or in China in the event that you believe that your rights have been infringed under the securities laws of Hong Kong, the United States or otherwise. To the extent our directors and executive officers reside in China or their assets are located in China, it may not be possible for investors to effect service of process upon us or our management inside China. Even if you are successful in bringing an action, the laws of the Cayman Islands and China may render you unable to enforce a judgment against our assets or the assets of our directors and officers. There is no statutory recognition in the Cayman Islands of judgments obtained in the United States, Hong Kong or China, although the courts of the Cayman Islands will generally recognize and enforce a non-penal judgment of a foreign court of competent jurisdiction without retrial on the merits.
As a result of all of the above, public shareholders may have more difficulty in protecting their interests in the face of actions taken by management, members of the board of directors or controlling shareholders than they would as public shareholders of a Hong Kong company or a U.S. company.
Your voting rights as a holder of the ADSs are limited by the terms of the deposit agreement. The depositary for the ADSs will give us a discretionary proxy to vote our ordinary shares underlying your ADSs if you do not vote at shareholders’ meetings, except in limited circumstances, which could adversely affect your interests.
You may exercise your voting rights with respect to the ordinary shares underlying your ADSs only in accordance with the provisions of the deposit agreement. Upon receipt of voting instructions from you in the manner set forth in the deposit agreement, the depositary for the ADSs will endeavor to vote your underlying ordinary shares in accordance with these instructions. Under our articles of association, the minimum notice period required for convening an annual general meeting is twenty-one calendar days and the minimum notice period required for convening an extraordinary general meeting is fourteen calendar days. When a general meeting is convened, you may not receive sufficient notice of a shareholders’ meeting to permit you to withdraw your ordinary shares to allow you to cast your vote with respect to any specific matter at the meeting. In addition, the depositary and its agents may not be able to send voting instructions to you or carry out your voting instructions in a timely manner. We will make all reasonable efforts to cause the depositary to extend voting rights to you in a timely manner, but you may not receive the voting materials in time to ensure that you can instruct the depositary to vote your shares. Furthermore, the depositary and its agents will not be responsible for any failure to carry out any instructions to vote, for the
84
manner in which any vote is cast or for the effect of any such vote. As a result, you may not be able to exercise your right to vote and you may lack recourse if your ordinary shares are not voted as you requested.
Under the deposit agreement, for the ADSs, the depositary will give us a discretionary proxy to vote the ordinary shares underlying your ADSs at shareholders’ meetings if you do not give voting instructions to the depositary, unless:
|
•
|
we have failed to timely provide the depositary with our notice of meeting and related voting materials;
|
|
•
|
we have instructed the depositary that we do not wish a discretionary proxy to be given;
|
|
•
|
we have informed the depositary that there is substantial opposition as to a matter to be voted on at the meeting; or
|
|
•
|
a matter to be voted on at the meeting would have a material adverse impact on shareholders.
|
The effect of this discretionary proxy is that, if you fail to give voting instructions to the depositary, you cannot prevent the ordinary shares underlying your ADSs from being voted, absent the situations described above, and it may make it more difficult for you to influence our management. Holders of our ordinary shares are not subject to this discretionary proxy.
Anti-takeover provisions in our constitutional documents may discourage our acquisition by a third party, which could limit our shareholders’ opportunity to sell their shares at a premium.
Our amended and restated memorandum and articles of association include provisions that could limit the ability of others to acquire control of our company, could modify our structure or could cause us to engage in change-of-control transactions. These provisions could have the effect of depriving our shareholders of an opportunity to sell their shares, at a premium over prevailing market prices by discouraging third parties from seeking to obtain control in a tender offer or similar transaction.
For example, our board of directors has the authority, without further action by our shareholders, to issue preferred shares in one or more series and to fix the powers and rights of these shares, including dividend rights, conversion rights, voting rights, terms of redemption and liquidation preferences, any or all of which may be greater than the rights associated with our ordinary shares. Preferred shares could thus be issued quickly with terms calculated to delay or prevent a change in control or make removal of management more difficult. In addition, if our board of directors authorizes the issuance of preferred shares, the market price of the ordinary shares and/or ADSs may fall and the voting and other rights of the holders of our ordinary shares and/or ADSs may be materially and adversely affected.
Furthermore, the amended and restated articles of association permit the directors to vary all or any of the rights attaching to any class of shares in issue without the consent of the shareholder but only if such variation is considered by the directors not to have a material adverse effect upon such holder. The directors cannot vary the rights of shares if such variation would have a material adverse effect of the holder. The amended and restated articles of association provide that the holders must consent to any such material adverse changes in the manner set out therein.
Because our directors are divided into three classes with staggered terms of three years each, shareholders can only elect or remove a limited number of our directors in any given year. The length of these terms could present an obstacle to certain actions, such as a merger or other change of control, which could be in the interest of our shareholders.
Our amended and restated memorandum and articles of association designate courts in the Cayman Islands as the sole and exclusive forum for certain types of actions and proceedings that may be initiated by our shareholders, which could limit our shareholders' ability to obtain a favorable judicial forum for disputes with us or our directors, officers or other employees.
Our amended and restated memorandum and articles of association provide that, unless we consent in writing to the selection of an alternative forum, the courts of Cayman Islands will be the sole and exclusive forum for any derivative action or proceeding brought on behalf of us, any action asserting a claim of breach of a fiduciary duty owed by any director, officer or other employee of us to us or our shareholders, any action asserting a claim arising pursuant to any provision of the Companies Law of the Cayman Islands as amended from time to time, or the amended and restated memorandum and articles of association, or any action asserting a claim governed by the internal affairs doctrine (as such concept is recognized under the U.S. laws). This provision may limit a shareholder’s ability to bring a claim in a judicial forum that it finds favorable for disputes with us or our directors, officers or other employees, which may discourage such lawsuits. Alternatively, if a court were to find this provision of our amended and restated memorandum and articles of association inapplicable to, or
85
unenforceable in respect of, one or more of the specified types of actions or proceedings, we may incur additional costs associated with resolving such matters in other jurisdictions.
Our amended and restated memorandum and articles of association provide that any shareholder bringing an unsuccessful action against us may be obligated to reimburse us for any costs we have incurred in connection with such unsuccessful action.
Our amended and restated memorandum and articles of association provide that under certain circumstances the fees, costs, and expenses that we incur in connection with actions or proceedings brought by any person or entity, which we refer to as claiming parties, may be shifted to such person or entity. If a claiming party asserts any claim; initiates any proceeding; or joins, offers substantial assistance to, or has a direct financial interest in any claim or proceeding against us, and such claiming party or the third party that received substantial assistance from the claiming party or in whole claim the claiming party had a direct financial interest is unsuccessful in obtaining a judgment on the merits in which the claiming party prevails, then such claiming party shall (to the fullest extent permitted by law) be obligated to reimburse us for all fees, costs, and expenses, including but not limited to all reasonable attorneys’ fees and other litigation expenses, that we may incur in connection with such claim or proceeding.
Fee-shifting articles are relatively new and untested in the Cayman Islands, the United States and Hong Kong. The case law and potential legislative action on fee-shifting articles are evolving and there exists considerable uncertainty regarding the validity of, and potential judicial and legislative responses to, such articles. The application of our fee-shifting article in connection with claims under the Cayman Islands, the United States or Hong Kong securities laws, if any, will depend in part on future developments of the law. We cannot assure you that we will or will not invoke our fee-shifting article in any particular dispute. Consistent with our directors’ fiduciary duties to act in the best interests of the Company, the directors may in their sole discretion from time to time decide whether or not to enforce this article. In addition, given the unsettled state of the law related to fee-shifting articles, such as ours, we may incur significant additional costs associated with resolving disputes with respect to such articles, which could adversely affect our business and financial condition.
If a shareholder that brings any such claim or proceeding is unable to obtain the judgment sought, the attorneys’ fees and other litigation expenses that might be shifted to a claiming party are potentially significant. This fee-shifting article, therefore, may dissuade or discourage current or former shareholders (and their attorneys) from initiating lawsuits or claims against us. In addition, it may impact the fees, contingency or otherwise, required by potential plaintiffs’ attorneys to represent our shareholders or otherwise discourage plaintiffs’ attorneys from representing our shareholders at all. As a result, this article may limit the ability of shareholders to affect the management and direction of our company, particularly through litigation or the threat of litigation.
Holders of the ADSs may be subject to limitations on transfer of their ADSs.
Your ADSs are transferable on the books of the depositary. However, the depositary may close its books at any time or from time to time when it deems expedient in connection with the performance of its duties. The depositary may refuse to deliver, transfer or register transfers of your ADSs generally when our books or the books of the depositary are closed, or at any time if we or the depositary think it is advisable to do so because of any requirement of law, government or governmental body, or under any provision of the deposit agreement, as amended, or for any other reason, subject to your right to cancel your ADSs and withdraw the underlying ordinary shares. Temporary delays in the cancellation of your ADSs and withdrawal of the underlying common shares may arise because the depositary has closed its transfer books or we have closed our transfer books, the transfer of ordinary shares is blocked to permit voting at a shareholders’ meeting or we are paying a dividend on our ordinary shares.
In addition, you may not be able to cancel your ADSs and withdraw the underlying ordinary shares when you owe money for fees, taxes and similar charges and when it is necessary to prohibit withdrawals in order to comply with any laws or governmental regulations that apply to ADSs or to the withdrawal of ordinary shares or other deposited securities.
The depositary for the ADSs is entitled to charge holders fees for various services, including annual service fees.
The depositary for the ADSs is entitled to charge holders fees for various services including for the issuance of ADSs upon deposit of ordinary shares, cancellation of ADSs, distributions of cash dividends or other cash distributions, distributions of ADSs pursuant to share dividends or other free share distributions, distributions of securities other than ADSs and annual service fees. In the case of ADSs issued by the depositary into The Depository Trust Company, or DTC, the fees will be charged by the DTC participant to the account of the applicable beneficial owner in accordance with the procedures and practices of the DTC participant as in effect at the time.
86
Holders of the ADSs may not receive distributions on our ordinary shares or any value for them if it is illegal or impractical to make them available to you.
The depositary of the ADSs has agreed to pay you the cash dividends or other distributions it or the custodian for the ADSs receives on our ordinary shares or other deposited securities after deducting its fees and expenses. You will receive these distributions in proportion to the number of our ordinary shares that your ADSs represent. However, the depositary is not responsible for making such payments or distributions if it is unlawful or impractical to make a distribution available to any holders of ADSs. For example, it would be unlawful to make a distribution to a holder of ADSs if it consists of securities that require registration under the Securities Act of 1933, as amended, or the Securities Act, but that are not properly registered or distributed pursuant to an applicable exemption from registration. The depositary is not responsible for making a distribution available to any holders of ADSs if any government approval or registration required for such distribution cannot be obtained after reasonable efforts made by the depositary. We have no obligation to take any other action to permit the distribution of the ADSs, ordinary shares, rights or anything else to holders of the ADSs. This means that you may not receive the distributions we make on our ordinary shares or any value for them if it is illegal or impractical for us to make them available to you. These restrictions may materially reduce the value of your ADSs.
Holders of the ADSs may not be able to participate in rights offerings and may experience dilution of their holdings.
From time to time, we may distribute rights to our shareholders, including rights to acquire securities. Under the deposit agreement, the depositary will not distribute rights to holders of ADSs unless the distribution and sale of rights and the securities to which these rights relate are either exempt from registration under the Securities Act with respect to all holders of ADSs or are registered under the Securities Act. The depositary may, but is not required to, attempt to sell these undistributed rights to third parties and may allow the rights to lapse. We may be unable to establish an exemption from registration under the Securities Act, and we are under no obligation to file a registration statement with respect to these rights or underlying securities or to try to have a registration statement declared effective. Accordingly, holders of ADSs may be unable to participate in our rights offerings and may experience dilution of their holdings as a result.
Our corporate actions are substantially controlled by our directors, executive officers and other principal shareholders, who can exert significant influence over important corporate matters, which may reduce the price of the ordinary shares and/or ADSs and deprive you of an opportunity to receive a premium for your ordinary shares and/or ADSs.
Our directors, executive officers and principal shareholders beneficially owned approximately 52.6% of our outstanding ordinary shares as of February 15, 2019. These shareholders, if acting together, could exert substantial influence over matters such as electing directors and approving material mergers, acquisitions or other business combination transactions. This concentration of ownership may also discourage, delay or prevent a change in control of our company, which could have the dual effect of depriving our shareholders of an opportunity to receive a premium for their shares as part of a sale of our company and reducing the price of our ordinary shares and/or ADSs. These actions may be taken even if they are opposed by our other shareholders. In addition, these persons could divert business opportunities away from us to themselves or others.
We may be a passive foreign investment company in future taxable years, which may have adverse U.S. federal income tax consequences for U.S. shareholders.
A non-U.S. corporation will be classified as a “passive foreign investment company,” (or a “PFIC”) for any taxable year if either (1) 75% or more of its gross income consists of certain types of passive income or (2) 50% or more of the average quarterly value of its assets during such year produce or are held for the production of passive income. Based upon the current and expected composition of our income and assets, we do not presently expect to be a PFIC for the current taxable year. Nevertheless, because our PFIC status must be determined annually with respect to each taxable year and will depend on the composition and character of our assets and income, and the value of our assets (which may be determined, in part, by reference to the market value of our ADSs and ordinary shares, which may be volatile) over the course of such taxable year, we may be a PFIC in any taxable year. If we determine not to deploy significant amounts of cash for active purposes, our risk of being a PFIC may substantially increase. Because there are uncertainties in the application of the relevant rules and PFIC status is a factual determination made annually after the close of each taxable year, there can be no assurance that we will not be a PFIC for the current taxable year or any future taxable year. In addition, it is possible that the Internal Revenue Service may challenge our classification of certain income and assets as non-passive, which may result in our being or becoming a PFIC in the current or subsequent years. Further, U.S. investors should be aware that we determined we were a PFIC for 2016.
If we are a PFIC for any taxable year during a U.S. shareholder’s holding period of the ordinary shares or ADSs, then such U.S. shareholder may incur significantly increased United States income tax on gain recognized on the sale or other disposition of the ordinary shares or ADSs and on the receipt of distributions on the ordinary shares or ADSs to the extent such distribution
87
is treated as an “excess distribution” under the United States federal income tax rules. In addition, such holders may be subject to burdensome reporting requirements.
Further, if we are classified as a PFIC for any year during which a U.S. shareholder holds our ordinary shares or ADSs, we will generally continue to be treated as a PFIC for all succeeding years during which such U.S. shareholder holds such ordinary shares or ADSs. Each U.S. shareholder should consult its tax advisor regarding the PFIC rules and the U.S. federal income tax consequences of the acquisition, ownership and disposition of the ordinary shares and ADSs.
If you are a “Ten Percent Shareholder,” you may be subject to adverse U.S. federal income tax consequences if we are classified as a Controlled Foreign Corporation.
Each “Ten Percent Shareholder” (as defined below) in a non-U.S. corporation that is classified as a “controlled foreign corporation,” or a CFC, for U.S. federal income tax purposes is generally required to include in income for U.S. federal tax purposes such Ten Percent Shareholder’s pro rata share of the CFC’s “Subpart F income” and investment of earnings in U.S. property, even if the CFC has made no distributions to its shareholders. Each Ten Percent Shareholder is also required to include in gross income its “global intangible low-taxed income,” which is determined by reference to the income of CFCs of which such Ten Percent Shareholder is a Ten Percent Shareholder. Ten Percent Shareholders that are corporations may be entitled to a deduction equal to the foreign portion of any dividend when a dividend is paid. A non-U.S. corporation will generally be classified as a CFC for U.S federal income tax purposes if Ten Percent Shareholders own in the aggregate, directly or indirectly, more than 50% of either the total combined voting power of all classes of stock of such corporation entitled to vote or of the total value of the stock of such corporation. A “Ten Percent Shareholder” is a U.S. person (as defined by the Internal Revenue Code of 1986, as amended), who owns or is considered to own 10% or more of the total combined voting power of all classes of stock entitled to vote of such corporation or 10% of the value of all classes of stock of such corporation. The determination of CFC status is complex and includes attribution rules, the application of which is not entirely certain. Although we believe we are not a CFC now, we may become one or own interests in one in the future. Holders are urged to consult their own tax advisors with respect to our potential CFC status and the consequences thereof.
Item 1B. Unresolved Staff Comments
Not applicable.
Item 2. Properties
We lease all of our facilities other than our manufacturing facility under construction in Guangzhou, China and our offices and laboratories in Changping, Beijing, and believe that our facilities are currently suitable and sufficient to meet our needs. We also lease an aggregate of approximately 42,005 square meters of office space at approximately 17 other locations across China, the United States and Europe, in cities such as Beijing, Shanghai, Suzhou, and Guangzhou, China; Cambridge, MA: Ridgefield Park, NJ; Emeryville and San Mateo, CA; and Basel, Switzerland, primarily for our offices and for our manufacturing facility in Suzhou, pursuant to leases with various expiration dates, with the latest expiring in 2024. We intend to add new facilities or expand existing facilities as we add employees and enter new locations, and we believe that suitable additional or substitute space will be available as needed to accommodate any such expansion of our operations.
Refer to “Note 24: Commitments and Contingencies” in the notes to our consolidated financial statements in this Annual Report on Form 10-K for further information on our property leases.
Item 3. Legal Proceedings
From time to time we may become involved in legal proceedings or be subject to claims arising in the ordinary course of our business. We are not presently a party to any legal proceedings that, if determined adversely to us, would individually or taken together have a material adverse effect on our business, results of operations, financial condition or cash flows. Regardless of the outcome, litigation can have an adverse impact on us because of defense and settlement costs, diversion of management resources and other factors.
Item 4. Mine Safety Disclosures
Not applicable.
88
PART II
Item 5. Market for Registrant’s Common Equity, Related Stockholder Matters and Issuer Purchases of Equity Securities
Market Information
Our ADSs have been publicly traded on the NASDAQ Global Select Market under the symbol “BGNE” since February 3, 2016. Our ordinary shares have been publicly traded on the HKEx under the stock code “06160” since August 8, 2018.
Shareholders
As of January 31, 2019, we had approximately 166 holders of record of our ordinary shares and 7 holders of record of the ADSs. This number does not include beneficial owners whose ordinary shares or ADSs are held by nominees in street name. Because many ordinary shares and ADSs are held by broker nominees, we are unable to estimate the total number of beneficial holders represented by these record holders.
Dividend Policy
We have never declared or paid any dividends on our ordinary shares or any other securities. We currently intend to retain all available funds and earnings, if any, to fund the development and expansion of our business and we do not anticipate paying any cash dividends in the foreseeable future. Investors should not purchase our ordinary shares or ADSs with the expectation of receiving cash dividends.
Performance Comparison Graph
This graph is not “soliciting material,” is not deemed “filed” with the SEC and is not to be incorporated by reference into any of our filings under the Securities Act of 1933, as amended, or the Securities Exchange Act of 1934, as amended, whether made before or after the date hereof and irrespective of any general incorporation language in any such filing.
The following graph shows the total stockholder return of an investment of $100 in cash at market close on February 3, 2016 (the first day of trading of our ADSs) through December 31, 2018 for our ADSs, the NASDAQ Composite Index (U.S.), and the NASDAQ Biotechnology Index.
Pursuant to applicable SEC rules, all values assume reinvestment of the full amount of any dividends, although no dividends have been declared to date. The stockholder return shown on the graph below is not necessarily indicative of future performance, and we do not make or endorse any predictions as to future stockholder returns.
89

|
|
2/3/16
|
3/31/16
|
6/30/16
|
9/30/16
|
12/31/16
|
3/31/17
|
6/30/17
|
9/30/17
|
12/31/17
|
3/31/18
|
6/30/18
|
9/30/18
|
12/31/18
|
||||||||||||||||||||||||||||||||||||||
|
BeiGene, Ltd.
|
$
|
100.00
|
|
$
|
103.50
|
|
$
|
105.23
|
|
$
|
108.79
|
|
$
|
107.20
|
|
$
|
129.27
|
|
$
|
158.90
|
|
$
|
365.32
|
|
$
|
345.06
|
|
$
|
593.22
|
|
$
|
542.83
|
|
$
|
608.12
|
|
$
|
495.27
|
|
||||||||||||
|
NASDAQ Composite
|
100.00
|
|
105.84
|
|
105.58
|
|
115.84
|
|
117.20
|
|
129.17
|
|
134.58
|
|
142.37
|
|
151.45
|
|
155.11
|
|
164.94
|
|
176.31
|
|
145.93
|
|
|||||||||||||||||||||||||
|
NASDAQ Biotechnology
|
100.00
|
|
99.09
|
|
96.20
|
|
106.06
|
|
98.61
|
|
108.14
|
|
114.15
|
|
124.31
|
|
117.43
|
|
115.99
|
|
119.12
|
|
132.67
|
|
106.51
|
|
|||||||||||||||||||||||||
Equity Compensation Plan Information
Our equity compensation plan information required by this item is incorporated by reference to the information in “Part III—Item 12—Security Ownership of Certain Beneficial Owners and Management and Related Stockholder Matters” of this Annual Report.
Recent Sales of Unregistered Securities
None.
Issuer Purchases of Equity Securities
None.
Taxation
Cayman Islands Taxation
The Cayman Islands currently levies no taxes on individuals or corporations based upon profits, income, gains or appreciation and there is no taxation in the nature of inheritance tax or estate duty or withholding tax applicable to us or to any holder of the ADSs and ordinary shares. There are no other taxes likely to be material to us levied by the Government of the Cayman Islands except for stamp duties which may be applicable on instruments executed in, or after execution brought within, the jurisdiction of the Cayman Islands. No stamp duty is payable in the Cayman Islands on the issue of shares by, or any transfers of shares of, Cayman Islands companies (except those which hold interests in land in the Cayman Islands). The Cayman Islands is not party to any double tax treaties that are applicable to any payments made to or by our company. There are no exchange control regulations or currency restrictions in the Cayman Islands.
90
Payments of dividends and capital in respect of the ADSs and ordinary shares will not be subject to taxation in the Cayman Islands and no withholding will be required on the payment of a dividend or capital to any holder of the ADSs or ordinary shares, as the case may be, nor will gains derived from the disposal of the ADSs or ordinary shares be subject to Cayman Islands income or corporation tax.
People’s Republic of China Taxation
Under the Enterprise Income Tax Law, or EIT Law, an enterprise established outside the PRC with a “de facto management body” within the PRC is considered a “resident enterprise,” which means that it is treated in a manner similar to a Chinese enterprise for PRC enterprise income tax purposes. The implementation rules of the EIT Law define “de facto management body” as a managing body that exercises substantial and overall management and control over the production and operations, personnel, accounting and properties of an enterprise. In addition, the Notice Regarding the Determination of Chinese‑Controlled Offshore Incorporated Enterprise as PRC Tax Resident Enterprises on the Basis of De Facto Management Bodies, or Circular 82, issued by the State Administration of Taxation, which provides guidance on the determination of the tax residence status of a Chinese‑controlled offshore incorporated enterprise, defines Chinese-controlled offshore incorporated enterprise as an enterprise that is incorporated under the laws of a foreign country or territory and that has a PRC enterprise or enterprise group as its primary controlling shareholder. Although BeiGene, Ltd. does not have a PRC enterprise or enterprise group as our primary controlling shareholder and is therefore not a Chinese‑controlled offshore incorporated enterprise within the meaning of Circular 82, in the absence of guidance specifically applicable to us, we have applied the guidance set forth in Circular 82 to evaluate the tax residence status of BeiGene, Ltd. and its subsidiaries organized outside the PRC.
According to Circular 82, a Chinese‑controlled offshore incorporated enterprise will be regarded as a PRC tax resident by virtue of having a “de facto management body” in China and will be subject to PRC enterprise income tax on its worldwide income only if all of the following criteria are met:
•
the primary location of the enterprise’s senior executives of the day‑to‑day operational management and senior management departments performing their duties is in the PRC;
•
decisions relating to the enterprise’s financial and human resource matters are made or are subject to approval by organizations or personnel in the PRC;
•
the enterprise’s primary assets, accounting books and records, company seals, and board and shareholder meeting minutes are located or maintained in the PRC; and
•
50% or more of voting board members or senior executives habitually reside in the PRC.
Currently, some of the members of our management team are located in China. However, we do not believe that we meet all of the conditions outlined in the immediately preceding paragraph. BeiGene, Ltd. and its offshore subsidiaries are incorporated outside the PRC. As a holding company, our key assets and records, including the resolutions and meeting minutes of our board of directors and the resolutions and meeting minutes of our shareholders, are located and maintained outside the PRC. We are not aware of any offshore holding companies with a corporate structure similar to ours that has been deemed a PRC “resident enterprise” by the PRC tax authorities. Accordingly, we believe that BeiGene, Ltd. and its offshore subsidiaries should not be treated as a “resident enterprise” for PRC tax purposes if the criteria for “de facto management body” as set forth in Circular 82 were deemed applicable to us. However, as the tax residency status of an enterprise is subject to determination by the PRC tax authorities and uncertainties remain with respect to the interpretation of the term “de facto management body” as applicable to our offshore entities, we will continue to monitor our tax status.
The implementation rules of the EIT Law provide that, (1) if the enterprise that distributes dividends is domiciled in the PRC or (2) if gains are realized from transferring equity interests of enterprises domiciled in the PRC, then such dividends or capital gains are treated as China‑sourced income. It is not clear how “domicile” may be interpreted under the EIT Law, and it may be interpreted as the jurisdiction where the enterprise is a tax resident. Therefore, if we are considered as a PRC tax resident enterprise for PRC tax purposes, any dividends we pay to our overseas shareholders or ADS holders as well as gains realized by such shareholders or ADS holders from the transfer of our shares or ADSs may be regarded as China‑sourced income. As a result, dividends paid to non‑PRC resident enterprise ADS holders or shareholders may be subject to PRC withholding tax at a rate of up to 10% (or 20% in the case of non‑PRC individual ADS holders or shareholders) and gains realized by non‑PRC resident enterprise ADS holders or shareholders from the transfer of our ordinary shares or ADSs may be subject to PRC tax at a rate of 10% (or 20% in the case of non‑PRC individual ADS holders or shareholders). It is also unclear whether, if we are considered a PRC resident enterprise, holders of our shares or ADSs would be able to claim the benefit of income tax treaties or agreements entered into between China and other countries or areas.
91
Item 6. Selected Consolidated Financial Data
The selected financial data set forth below is derived from our audited consolidated financial statements and may not be indicative of future operating results. The following selected consolidated financial data should be read in conjunction with “Item 7—Management’s Discussion and Analysis of Financial Condition and Results of Operations” and the consolidated financial statements and the notes thereto included elsewhere in this Annual Report. The selected financial data in this section are not intended to replace our consolidated financial statements and the related notes. Our historical results are not necessarily indicative of our future results.
|
|
Year Ended December 31,
|
||||||||||||||||||
|
|
2018
|
2017
|
2016
|
2015
|
2014
|
||||||||||||||
|
|
(in thousands, except share and per share data)
|
||||||||||||||||||
|
Statements of Operations:
|
|
|
|
|
|
|
|
|
|
|
|||||||||
|
Revenue:
|
|
|
|
|
|
|
|
|
|
|
|||||||||
|
Product revenue, net
|
$
|
130,885
|
|
$
|
24,428
|
|
$
|
—
|
|
$
|
—
|
|
$
|
—
|
|
||||
|
Collaboration revenue
|
67,335
|
|
213,959
|
|
1,070
|
|
8,816
|
|
13,035
|
|
|||||||||
|
Total revenues
|
198,220
|
|
238,387
|
|
1,070
|
|
8,816
|
|
13,035
|
|
|||||||||
|
Expenses
|
|||||||||||||||||||
|
Cost of sales - product
|
(28,705
|
)
|
(4,974
|
)
|
—
|
|
—
|
|
—
|
|
|||||||||
|
Research and development (1)
|
(679,005
|
)
|
(269,018
|
)
|
(98,033
|
)
|
(58,250
|
)
|
(21,862
|
)
|
|||||||||
|
Selling, general and administrative
|
(195,385
|
)
|
(62,602
|
)
|
(20,097
|
)
|
(7,311
|
)
|
(6,930
|
)
|
|||||||||
|
Amortization of intangible assets
|
(894
|
)
|
(250
|
)
|
—
|
|
—
|
|
—
|
|
|||||||||
|
Total expenses
|
(903,989
|
)
|
(336,844
|
)
|
(118,130
|
)
|
(65,561
|
)
|
(28,792
|
)
|
|||||||||
|
Loss from operations
|
(705,769
|
)
|
(98,457
|
)
|
(117,060
|
)
|
(56,745
|
)
|
(15,757
|
)
|
|||||||||
|
Interest income (expense), net
|
13,947
|
|
(4,108
|
)
|
383
|
|
559
|
|
(3,512
|
)
|
|||||||||
|
Changes in fair value of financial instruments
|
—
|
|
—
|
|
(1,514
|
)
|
(1,826
|
)
|
(2,760
|
)
|
|||||||||
|
Gain on debt extinguishment
|
—
|
|
—
|
|
—
|
|
—
|
|
2,883
|
|
|||||||||
|
Other income, net
|
1,993
|
|
11,501
|
|
(972
|
)
|
910
|
|
600
|
|
|||||||||
|
Loss before income tax expense
|
(689,829
|
)
|
(91,064
|
)
|
(119,163
|
)
|
(57,102
|
)
|
(18,546
|
)
|
|||||||||
|
Income tax benefit (expense)
|
15,796
|
|
(2,235
|
)
|
(54
|
)
|
—
|
|
—
|
|
|||||||||
|
Net loss
|
(674,033
|
)
|
(93,299
|
)
|
(119,217
|
)
|
(57,102
|
)
|
(18,546
|
)
|
|||||||||
|
Less: net loss attributable to noncontrolling interest
|
(264
|
)
|
(194
|
)
|
—
|
|
—
|
|
(268
|
)
|
|||||||||
|
Net loss attributable to BeiGene, Ltd.
|
$
|
(673,769
|
)
|
$
|
(93,105
|
)
|
$
|
(119,217
|
)
|
$
|
(57,102
|
)
|
$
|
(18,278
|
)
|
||||
|
Loss per share attributable to BeiGene, Ltd, basic and diluted (2)
|
$
|
(0.93
|
)
|
$
|
(0.17
|
)
|
$
|
(0.30
|
)
|
$
|
(0.52
|
)
|
$
|
(0.18
|
)
|
||||
|
Weighted-average shares outstanding, basic and diluted
|
720,753,819
|
|
543,185,460
|
|
403,619,446
|
|
110,597,263
|
|
99,857,623
|
|
|||||||||
|
(1)
|
Included in research and development expense in 2018 is $89 million of upfront payments related to collaboration agreements with Zymeworks (see Note 3) and Mirati, and the termination of our collaboration agreement with Merck KGaA.
|
|
(2)
|
See Note 18 to our audited consolidated financial statements appearing elsewhere in this Annual Report for a description of the method used to calculate basic and diluted loss per share of ordinary shares.
|
92
|
|
As of December 31,
|
||||||||||||||||||
|
|
2018
|
2017
|
2016
|
2015
|
2014
|
||||||||||||||
|
|
(in thousands)
|
||||||||||||||||||
|
Balance Sheet Data:
|
|
|
|
|
|
|
|
|
|
|
|||||||||
|
Cash, cash equivalents, and restricted cash
|
$
|
740,713
|
|
$
|
239,602
|
|
$
|
87,514
|
|
$
|
17,869
|
|
$
|
13,898
|
|
||||
|
Short-term investments
|
1,068,509
|
|
597,914
|
|
280,660
|
|
82,617
|
|
30,497
|
|
|||||||||
|
Working capital
|
1,697,390
|
|
763,509
|
|
339,341
|
|
71,097
|
|
33,817
|
|
|||||||||
|
Total assets
|
2,249,684
|
|
1,046,479
|
|
405,813
|
|
116,764
|
|
53,621
|
|
|||||||||
|
Total liabilities
|
496,037
|
|
362,248
|
|
52,906
|
|
42,445
|
|
27,853
|
|
|||||||||
|
Preferred shares
|
—
|
|
—
|
|
—
|
|
176,084
|
|
78,809
|
|
|||||||||
|
Noncontrolling interest
|
14,445
|
|
14,422
|
|
—
|
|
—
|
|
—
|
|
|||||||||
|
Total equity (deficit)
|
1,753,647
|
|
684,231
|
|
352,907
|
|
(101,765
|
)
|
(53,041
|
)
|
|||||||||
93
Item 7. Management’s Discussion and Analysis of Financial Condition and Results of Operations
You should read the following discussion and analysis of our financial condition and results of operations together with “Item 6—Selected Consolidated Financial Data” and our consolidated financial statements and related notes appearing elsewhere in this Annual Report. In addition to historical information, this discussion and analysis contains forward‑looking statements that involve risks, uncertainties and assumptions. Our actual results may differ materially from those anticipated in these forward‑looking statements as a result of certain factors. We discuss factors that we believe could cause or contribute to these differences below and elsewhere in this report, including those set forth under “Part I—Item 1A—Risk Factors” and under “Forward‑Looking Statements and Market Data” in this Annual Report.
Overview
We are a commercial-stage biotechnology company focused on developing and commercializing innovative molecularly-targeted and immuno-oncology drugs for the treatment of cancer. Our internally-developed lead drug candidates are currently in late-stage clinical trials. These candidates are (1) zanubrutinib (BGB-3111), a potentially best-in-class investigational small molecule inhibitor of Bruton’s tyrosine kinase, or BTK, (2) tislelizumab (BGB-A317), an investigational humanized monoclonal antibody against the immune checkpoint receptor programmed cell death protein 1 (PD-1), and (3) pamiparib (BGB-290), an investigational small molecule inhibitor of the poly ADP-ribose polymearase 1 (PARP1) and PARP2 enzymes. All three of these drug candidates are currently in Phase 2 or 3 pivotal trials globally and/or in China, and we filed for regulatory approvals in China in 2018 for zanubrutinib in relapsed/refractory (R/R) mantle cell lymphoma (MCL) and in R/R chronic lymphocytic leukemia or R/R small lymphocytic lymphoma (CLL/SLL); and for tislelizumab in R/R classical Hodgkin's Lymphoma (cHL). We also have additional drug candidates in earlier stage clinical development.
We started as a research and development company in Beijing in 2010, focusing on developing best-in-class oncology drugs. Over the last nine years, we have developed into a fully-integrated global biotechnology company with operations in China, the United States, Europe and Australia, including a more than 800-person global clinical development team running 50 ongoing or planned clinical trials as of January 24, 2019. We also have a growing commercial team that is selling our existing in-licensed drugs in China and preparing for launches of our internally-developed drug candidates in China and the United States, as well as internal manufacturing capabilities in China that are operational or under construction for the clinical and commercial supply of our small molecule and biologic drug candidates.
Recent Developments
On January 14, 2019, we announced that the U.S. Food and Drug Administration (FDA) granted Breakthrough Therapy designation for our investigational Bruton's tyrosine kinase (BTK) inhibitor, zanubrutinib, for the treatment of adult patients with mantle cell lymphoma (MCL) who have received at least one prior therapy.
On December 17, 2018, we announced the initiation of two global Phase 3 clinical trials of our investigational anti-PD-1 antibody, tislelizumab. These trials are evaluating tislelizumab combined with chemotherapy as potential first-line treatments in patients with locally advanced unresectable or metastatic gastric or gastroesophageal junction adenocarcinoma, and in patients with unresectable, locally advanced recurrent or metastatic esophageal squamous cell carcinoma (ESCC).
On November 27, 2018, we entered into a license and collaboration agreement with Zymeworks, Inc. (NYSE/TSX: ZYME) in which we acquired exclusive development and commercial rights to Zymeworks' bispecific candidates, ZW25 and ZW49, in Asia (excluding Japan), Australia and New Zealand. We also acquired licenses for Zymeworks' Azymetric
TM
and EFECT
TM
platforms to develop and commercialize up to three bispecific antibody therapeutics globally directed to BeiGene's targets. Zymeworks received upfront payments totaling $60.0 million and is eligible to receive development and commercial milestone payments plus potential royalties on product sales.
On November 13, 2018, we announced the Center for Drug Evaluation of China's National Medical Product Administration (NMPA, formerly known as CFDA) granted priority review status to the New Drug Applications for zanubrutinib in patients with R/R MCL and for tislelizumab in patients with R/R cHL.
94
Components of Operating Results
Revenue
To date, our revenue has consisted of product sales revenue since September 2017 and upfront license fees and reimbursed research and development expenses from our strategic collaboration with Celgene for tislelizumab entered in 2017 and upfront license fees and milestone payments from our collaboration agreements with Merck KGaA, Darmstadt Germany for pamiparib and lifirafenib entered in 2013. We do not expect to generate significant revenue from internally-developed drug candidates unless and until we successfully complete development and obtain regulatory approval for one or more of our drug candidates, which is subject to significant uncertainty.
Revenues from product sales are recognized when there is a transfer of control from the Company to the distributor. The Company determines transfer of control based on when the product is delivered, and title passes to the distributor. Revenues from product sales are recognized net of variable consideration resulting from rebate accruals and sales returns allowances. Provisions for estimated reductions to revenue are provided for in the same period the related sales are recorded and are based on the sales terms, historical experience and trend analysis. We expect revenue from product sales to increase in 2019 as we expand our efforts to promote and obtain reimbursement for ABRAXANE
®
and REVLIMID
®
and launch VIDAZA
®
in China.
We also record revenue from our collaboration and license agreements with Celgene and Merck KGaA, Darmstadt Germany. Under each agreement, we have received upfront payments related to the license fee which was recognized upon the delivery of the license right. Additionally, the reimbursement of remaining undelivered research and development services under the Celgene arrangement is recognized over the performance period of the collaboration arrangement. In the case of the Celgene arrangement, we will also receive research and development reimbursement revenue for the basket study trials that Celgene opts into. We consider milestone payments variable consideration and include them in the transaction price when a significant reversal of revenue recognized is not expected to occur. See Note 3 to our consolidated financial statements included in this Annual Report for a description of these agreements.
Expenses
Cost of Sales
Cost of sales includes the acquisition costs of our commercial products.
Research and Development Expenses
Research and development expenses consist of the costs associated with our research and development activities, conducting preclinical studies and clinical trials and activities related to regulatory filings. Our research and development expenses consist of:
|
•
|
expenses incurred under agreements with contract research organizations, or CROs, contract manufacturing organizations, and consultants that conduct and support clinical trials and preclinical studies;
|
|
•
|
costs of comparator drugs in certain of our clinical trials;
|
|
•
|
manufacturing costs related to pre-commercial activities;
|
|
•
|
costs associated with preclinical activities and development activities;
|
|
•
|
costs associated with regulatory operations;
|
|
•
|
employee‑related expenses, including salaries, benefits, travel and share‑based compensation expense for research and development personnel;
|
|
•
|
in-process research and development costs expensed as part of collaboration agreements entered into; and
|
|
•
|
other expenses, which include direct and allocated expenses for rent and maintenance of facilities, insurance and other supplies used in research and development activities.
|
95
Our current research and development activities mainly relate to the clinical advancement of our internally-developed drug candidates:
|
•
|
zanubrutinib, an investigational small molecule inhibitor of BTK;
|
|
•
|
tislelizumab, an investigational humanized monoclonal antibody against PD‑1;
|
|
•
|
pamiparib, an investigational small molecule inhibitor of PARP1 and PARP2;
|
|
•
|
lifirafenib, a novel small molecule inhibitor of both the monomer and dimer forms of BRAF;
|
|
•
|
BGB-A333, an investigational humanized monoclonal antibody against PD-L1; and
|
|
•
|
BGB-A425, an investigational humanized monoclonal antibody against TIM-3.
|
Research and development activities also include costs associated with in-licensed drug candidates, including:
|
•
|
sitravatinib, an investigational, spectrum-selective kinase inhibitor in clinical development by Mirati Therapeutics, Inc., and
|
|
•
|
ZW25 and ZW49, two bispecific antibody-based product candidates targeting HER2, under development by Zymeworks Inc.
|
We expense research and development costs when we incur them. We record costs for certain development activities, such as clinical trials, based on an evaluation of the progress to completion of specific tasks using data such as subject enrollment, clinical site activations or information our vendors provide to us. We expense the manufacturing costs of our internally-developed products that are used in clinical trials as they are incurred, as research and development expense. We do not allocate employee‑related costs, depreciation, rental and other indirect costs to specific research and development programs because these costs are deployed across multiple product programs under research and development and, as such, are separately classified as unallocated research and development expenses.
At this time, it is difficult to estimate or know for certain, the nature, timing and estimated costs of the efforts that will be necessary to complete the development of our internally-developed drug candidates. We are also unable to predict when, if ever, material net cash inflows will commence from sales of our internally-developed drug candidates. This is due to the numerous risks and uncertainties associated with developing such drug candidates, including the uncertainty of:
|
•
|
successful enrollment in and completion of clinical trials;
|
|
•
|
establishing an appropriate safety profile;
|
|
•
|
establishing commercial manufacturing capabilities or making arrangements with third‑party manufacturers;
|
|
•
|
receipt of marketing approvals from applicable regulatory authorities;
|
|
•
|
successfully launching and commercializing our drug candidates, if and when approved, whether as monotherapies or in combination with our internally discovered drug candidates or third‑party products;
|
|
•
|
obtaining and maintaining patent and trade secret protection and regulatory exclusivity for our drug candidates;
|
|
•
|
continued acceptable safety profiles of the products following approval;
|
|
•
|
competition from competing products; and
|
|
•
|
retention of key personnel.
|
A change in the outcome of any of these variables with respect to the development of any of our drug candidates would significantly change the costs, timing and viability associated with the development of that drug candidate.
96
Research and development activities are central to our business model. We expect research and development costs to increase significantly for the foreseeable future as our development programs progress, as we continue to support the clinical trials of our drug candidates as treatments for various cancers and as we move these drug candidates into additional clinical trials, including potential pivotal trials. There are numerous factors associated with the successful commercialization of any of our drug candidates, including future trial design and various regulatory requirements, many of which cannot be determined with accuracy at this time based on our stage of development. Additionally, future commercial and regulatory factors beyond our control may impact our clinical development programs and plans.
Selling, General and Administrative Expenses
Selling, general and administrative expenses consist primarily of product promotion costs, distribution costs, salaries and related benefit costs, including share-based compensation for selling, general and administrative personnel. Other selling, general and administrative expenses include professional fees for legal, consulting, auditing and tax services as well as other direct and allocated expenses for rent and maintenance of facilities, travel costs, insurance and other supplies used in selling, general and administrative activities. We anticipate that our selling, general and administrative expenses will increase in future periods to support planned increases in commercialization activities with respect to ABRAXANE® (nanoparticle albumin–bound paclitaxel), REVLIMID® (lenalidomide), and VIDAZA® (azaciditine) in China and the preparation for launch and potential commercialization of our internally-developed drug candidates, if approved. We also expect selling, general and administrative expenses to increase in future periods to support our research and development efforts, including the continuation of the clinical trials of our drug candidates as treatments for various cancers and the initiation of clinical trials for potential new drug candidates. These cost increases will likely be due to increased promotional costs, increased headcount, increased share-based compensation expenses, expanded infrastructure and increased costs for insurance. We also anticipate increased legal, compliance, accounting, insurance and investor and public relations expenses associated with being a public company with our ADS and ordinary shares listed for trading on The NASDAQ Global Select Market and Hong Kong Stock Exchange, respectively.
Interest Income (Expense), Net
Interest Income
Interest income consists primarily of interest generated from our cash and short‑term investments in money market funds, time deposits, U.S. treasury securities and U.S. agency securities.
Interest Expense
Interest expense consists primarily of interest on our long‑term bank loan and shareholder loan.
Other Income (Expense), Net
Other income consists primarily of government grants and subsidies received that involve no conditions or continuing performance obligations by us. Other expense consists primarily of loss from property and equipment disposals and donations made to sponsor certain events. Other income (expense) also consists of unrealized gains and losses related to changes in foreign currency exchange rates and realized gains and losses on the sale of investments.
97
Results of Operations
Comparison of the Years Ended December 31, 2018 and 2017
The following table summarizes our results of operations for the years ended December 31, 2018 and 2017:
|
|
Year Ended December 31,
|
Change
|
||||||||||||
|
|
2018
|
2017
|
$
|
%
|
||||||||||
|
|
(dollars in thousands)
|
|||||||||||||
|
Product revenue, net
|
$
|
130,885
|
|
$
|
24,428
|
|
$
|
106,457
|
|
436
|
%
|
|||
|
Collaboration revenue
|
67,335
|
|
213,959
|
|
(146,624
|
)
|
(69
|
)%
|
||||||
|
Total revenues
|
198,220
|
|
238,387
|
|
(40,167
|
)
|
(17
|
)%
|
||||||
|
Expenses
|
|
|
|
|
|
|
|
|
||||||
|
Cost of sales - product
|
(28,705
|
)
|
(4,974
|
)
|
(23,731
|
)
|
477
|
%
|
||||||
|
Research and development
|
(679,005
|
)
|
(269,018
|
)
|
(409,987
|
)
|
152
|
%
|
||||||
|
Selling, general and administrative
|
(195,385
|
)
|
(62,602
|
)
|
(132,783
|
)
|
212
|
%
|
||||||
|
Amortization of intangible assets
|
(894
|
)
|
(250
|
)
|
(644
|
)
|
258
|
%
|
||||||
|
Total expenses
|
(903,989
|
)
|
(336,844
|
)
|
(567,145
|
)
|
168
|
%
|
||||||
|
Loss from operations
|
(705,769
|
)
|
(98,457
|
)
|
(607,312
|
)
|
617
|
%
|
||||||
|
Interest (expense) income, net
|
13,947
|
|
(4,108
|
)
|
18,055
|
|
NM
|
|
||||||
|
Other income, net
|
1,993
|
|
11,501
|
|
(9,508
|
)
|
(83
|
)%
|
||||||
|
Loss before income tax expense
|
(689,829
|
)
|
(91,064
|
)
|
(598,765
|
)
|
658
|
%
|
||||||
|
Income tax expense
|
15,796
|
|
(2,235
|
)
|
18,031
|
|
NM
|
|
||||||
|
Net loss
|
(674,033
|
)
|
(93,299
|
)
|
(580,734
|
)
|
622
|
%
|
||||||
|
Less: Net loss attributable to noncontrolling interest
|
(264
|
)
|
(194
|
)
|
(70
|
)
|
36
|
%
|
||||||
|
Net loss attributable to BeiGene, Ltd.
|
$
|
(673,769
|
)
|
$
|
(93,105
|
)
|
$
|
(580,664
|
)
|
624
|
%
|
|||
Revenue
Total revenue
decreased
by
$40.2 million
to
$198.2 million
for the year ended
December 31, 2018
, from
$238.4 million
for the year ended
December 31, 2017
. The following table summarizes our components of revenue for the year ended December 31, 2018 and 2017, respectively:
|
|
Year Ended
|
|
|
|||||||||||
|
|
December 31,
|
Changes
|
||||||||||||
|
|
2018
|
2017
|
$
|
%
|
||||||||||
|
Product revenue
|
$
|
130,885
|
|
$
|
24,428
|
|
$
|
106,457
|
|
436
|
%
|
|||
|
Collaboration revenue:
|
|
|
|
|
|
|||||||||
|
License revenue
|
—
|
|
211,391
|
|
(211,391
|
)
|
(100
|
)%
|
||||||
|
Reimbursement of research and development costs
|
56,776
|
|
—
|
|
56,776
|
|
NM
|
|
||||||
|
Research and development service revenue
|
10,559
|
|
2,568
|
|
7,991
|
|
311
|
%
|
||||||
|
Total collaboration revenue
|
67,335
|
|
213,959
|
|
(146,624
|
)
|
(69
|
)%
|
||||||
|
Total
|
$
|
198,220
|
|
$
|
238,387
|
|
$
|
(40,167
|
)
|
(17
|
)%
|
|||
Net product revenue was
$130.9 million
for the year ended December 31, 2018, which related to sales of ABRAXANE
®
, REVLIMID
®
and VIDAZA
®
in China. We began recognizing product revenue with sales to our distributors in China, beginning in September 2017 following the closing of our strategic collaboration with Celgene. VIDAZA
®
was launched in China in February 2018. We had
$24.4 million
product revenue for the year ended December 31, 2017.
Collaboration revenue totaled
$67.3 million
for the year ended December 31, 2018, and was comprised of $56.8 million for the reimbursement of research and development costs for the clinical trials that Celgene has opted into, $9.1 million related to the recognition of deferred revenue for upfront fees allocated to undelivered research and development services to Celgene
98
and $1.5 million research and development services for achieving a milestone under the collaboration agreement with Merck KGaA, Darmstadt Germany.
Collaboration revenue was
$214.0 million
for the year ended December 31, 2017, of which $213.0 million was due to revenue recognized from the Celgene collaboration, including recognition of the upfront consideration allocated to the license fees and recognition of deferred revenue allocated to the undelivered research and development services.
Cost of Sales
Cost of sales
increased
to
$28.7 million
for the year ended
December 31, 2018
from
$5.0 million
for the year ended
December 31, 2017
. The full year period in 2017 was only for four months from the time the Celgene agreement was finalized on August 31, 2017 through year end. Cost of sales for the year ended December 31, 2018 consisted entirely of the cost of products purchased from Celgene and distributed in the PRC.
Research and Development Expense
Research and development expense
increased
by
$410.0 million
, or
152.4%
, to
$679.0 million
for the year ended
December 31, 2018
, from
$269.0 million
for the year ended
December 31, 2017
. The following table summarizes external clinical, external non-clinical and internal research and development expense for the year ended December 31, 2018 and 2017:
|
|
Year Ended
|
|
|
|
||||||||||
|
|
December 31,
|
|
Changes
|
|||||||||||
|
|
2018
|
|
2017
|
|
$
|
%
|
||||||||
|
|
(dollars in thousands)
|
|||||||||||||
|
External cost of clinical-stage programs
|
$
|
291,176
|
|
|
$
|
131,485
|
|
|
$
|
159,691
|
|
121
|
%
|
|
|
In-process research and development expense
|
89,000
|
|
—
|
|
89,000
|
|
—
|
%
|
||||||
|
External cost of non-clinical-stage programs
|
55,600
|
|
|
9,244
|
|
|
46,356
|
|
501
|
%
|
||||
|
Internal research and development expenses
|
243,229
|
|
|
128,289
|
|
|
114,940
|
|
90
|
%
|
||||
|
Total research and development expenses
|
$
|
679,005
|
|
|
$
|
269,018
|
|
|
$
|
409,987
|
|
152
|
%
|
|
The increase in external research and development expense was primarily attributable to the advancement of our clinical and preclinical drug candidates, and included the following:
|
•
|
Increases of approximately $54.2 million, $81.0 million, $20.0 million and $5.0 million, respectively, for zanubrutinib, tislelizumab, pamiparib and sitravatinib, partially offset by a decrease of approximately $0.5 million for lifirafenib. The expense increases were primarily due to the expansion of clinical trials for these candidates, including the initiation or continuation of pivotal trials;
|
|
•
|
Increase of $89.0 million related to in-process research and development expense including $10 million of our in-license of sitravatinib with Mirati for the Asia (excluding Japan), Australia and New Zealand territories, $60 million of upfront and milestone payments to Zymeworks, Inc., in order to obtain exclusive license to develop and commercialize ZW25 in the Asia (excluding Japan), Australia and New Zealand territories, and $19 million for the termination of the PARP collaboration agreement with Merck KGaA Darmstadt Germany; and
|
|
•
|
Approximately $46.4 million increase in external spending for our non-clinical-stage programs, primarily related to manufacturing costs and costs associated with advancing our preclinical candidates toward clinical trials.
|
The increase in internal research and development expense was primarily attributable to the expansion of our development organization and our clinical and preclinical pipeline, and included the following:
|
•
|
$59.1 million increase of employee salary and benefits, which was primarily attributable to hiring more research and development personnel to support our expanding research and clinical activities;
|
|
•
|
$23.8 million increase of share-based compensation expense, primarily attributable to our increased headcount and higher share price;
|
99
|
•
|
$1.7 million increase of materials and reagent expenses, mainly in connection with the in-house manufacture of drug candidates used for clinical purposes, that were previously outsourced and recorded as external cost;
|
|
•
|
$15.1 million increase of consulting fees, which was mainly attributable to increased scientific, regulatory and development consulting activities, in connection with the advancement of our pipeline; and
|
|
•
|
$15.2 million increase of facilities, office expense, rental fee and other expenses to support the growth of our organization.
|
Selling, General and Administrative Expense
Selling, general and administrative expense
increased
by
$132.8 million
, or
212.1%
, to
$195.4 million
for the year ended
December 31, 2018
, from
$62.6 million
for the year ended
December 31, 2017
. The
increase
was primarily attributable to the following:
|
•
|
$46.5 million increase of employee salary and benefits, which was primarily attributable to the hiring of more personnel to support our growing organization, including the acquired workforce in the acquisition of Celgene’s China operations;
|
|
•
|
$20.5 million increase of share-based compensation expense, primarily attributable to our increased headcount and higher share price;
|
|
•
|
$13.3 million increase of professional fees for legal, consulting, recruiting and audit services, mainly in connection with our patent prosecution activities, consulting services, business development activities, compliance, recruiting services and the preparation of periodic reports and filings with the SEC and HKEx;
|
|
•
|
$9.2 million increase of IT expense, which was primarily attributable to increased headcount and upgrades to our IT infrastructure for human resources, financial systems and compliance management, and
|
|
•
|
$43.3 million increase of selling, facility, travel expenses, rental fees and other administrative expenses, primarily attributable to the global expansion of our business, including the post-combination operating costs of our commercial operations in China.
|
Interest Income (Expense), Net
Interest income (net)
increased
to
$13.9 million
for the year ended
December 31, 2018
, from net interest expense of
$4.1 million
for the year ended
December 31, 2017
. The increase in interest income was primarily attributable to interest income on our larger cash and short-term investment balances.
Other Income, Net
Other income, net
decreased
by
$9.5 million
to
$2.0 million
for the year ended
December 31, 2018
, from
$11.5 million
for the year ended
December 31, 2017
. The decrease was mainly attributable to the decrease in government grants and subsidies received and recognized in 2018 and unrealized losses related to changes in foreign currency exchange rates.
Income Tax Benefit (expense)
Income tax
benefit
was
$15.8 million
for the year ended
December 31, 2018
compared with $2.2 million of income tax expense for the year ended December 31, 2017. In the year ended December 31, 2018, the income tax benefit was mainly attributable to research and development tax credits and stock compensation tax deductions of our U.S. operating subsidiary, partially offset by income tax expense from our commercial operations in China.
100
Comparison of the Years Ended December 31, 2017 and 2016
The following table summarizes the results of our operations for the years ended December 31, 2017 and 2016:
|
|
Year Ended December 31,
|
Change
|
||||||||||||
|
|
2017
|
2016
|
$
|
%
|
||||||||||
|
|
(dollars in thousands)
|
|||||||||||||
|
Product revenue, net
|
$
|
24,428
|
|
$
|
—
|
|
$
|
24,428
|
|
—
|
|
|||
|
Collaboration revenue
|
213,959
|
|
1,070
|
|
212,889
|
|
19,896
|
%
|
||||||
|
Total revenues
|
238,387
|
|
1,070
|
|
237,317
|
|
22,179
|
%
|
||||||
|
Expenses
|
|
|
|
|
|
|
|
|
||||||
|
Cost of sales - product
|
(4,974
|
)
|
—
|
|
(4,974
|
)
|
—
|
|
||||||
|
Research and development
|
(269,018
|
)
|
(98,033
|
)
|
(170,985
|
)
|
174
|
%
|
||||||
|
Selling, general and administrative
|
(62,602
|
)
|
(20,097
|
)
|
(42,505
|
)
|
211
|
%
|
||||||
|
Amortization of intangible assets
|
(250
|
)
|
—
|
|
(250
|
)
|
—
|
|
||||||
|
Total expenses
|
(336,844
|
)
|
(118,130
|
)
|
(218,714
|
)
|
185
|
%
|
||||||
|
Loss from operations
|
(98,457
|
)
|
(117,060
|
)
|
18,603
|
|
-16
|
%
|
||||||
|
Interest (expense) income, net
|
(4,108
|
)
|
383
|
|
(4,491
|
)
|
-1,173
|
%
|
||||||
|
Changes in fair value of financial instruments
|
—
|
|
(1,514
|
)
|
1,514
|
|
-100
|
%
|
||||||
|
Other income, net
|
11,501
|
|
(972
|
)
|
12,473
|
|
NM
|
|
||||||
|
Loss before income tax expense
|
(91,064
|
)
|
(119,163
|
)
|
28,099
|
|
-24
|
%
|
||||||
|
Income tax expense
|
(2,235
|
)
|
(54
|
)
|
(2,181
|
)
|
4,039
|
%
|
||||||
|
Net loss
|
(93,299
|
)
|
(119,217
|
)
|
25,918
|
|
-22
|
%
|
||||||
|
Less: Net loss attributable to noncontrolling interest
|
(194
|
)
|
—
|
|
(194
|
)
|
—
|
|
||||||
|
Net loss attributable to BeiGene, Ltd.
|
$
|
(93,105
|
)
|
$
|
(119,217
|
)
|
$
|
26,112
|
|
-22
|
%
|
|||
Revenue
Total revenue increased by $237.3 million to $238.4 million for the year ended December 31, 2017, from $1.1 million for the year ended December 31, 2016. The following table summarizes our components of revenue for the year ended December 31, 2017 and 2016, respectively:
|
|
Year Ended
|
|
|
|||||||||||
|
|
December 31,
|
Changes
|
||||||||||||
|
|
2017
|
2016
|
$
|
%
|
||||||||||
|
Product revenue
|
$
|
24,428
|
|
$
|
—
|
|
$
|
24,428
|
|
—
|
|
|||
|
Collaboration revenue:
|
|
|
|
|
|
|||||||||
|
License revenue
|
211,391
|
|
—
|
|
211,391
|
|
—
|
|
||||||
|
Research and development service revenue
|
2,568
|
|
1,070
|
|
1,498
|
|
140
|
%
|
||||||
|
Total collaboration revenue
|
213,959
|
|
1,070
|
|
212,889
|
|
19,896
|
%
|
||||||
|
Total
|
$
|
238,387
|
|
$
|
1,070
|
|
$
|
237,317
|
|
22,179
|
%
|
|||
Net product revenue was $24.4 million for the year ended December 31, 2017, which related to sales of ABRAXANE® and REVLIMID® in China. We began recognizing product revenue with sales to our distributors in China, beginning in September 2017 following the closing of our strategic collaboration with Celgene. VIDAZA
®
was not launched in China until early 2018. We had no product revenue for the year ended December 31, 2016.
Collaboration revenue was $214.0 million for the year ended December 31, 2017, of which $213.0 million was due to revenue recognition related to the Celgene collaboration, including recognition of the upfront consideration allocated to the license fees and recognition of deferred revenue for allocated to the undelivered research and development services. Collaboration revenue was $1.1 million for the year ended December 31, 2016, which was due to research and development revenue recognition related to collaboration agreement with Merck KGaA, Darmstadt Germany.
101
Research and Development Expense
Research and development expense increased by $171.0 million, or 174.4%, to $269.0 million for the year ended December 31, 2017, from $98.0 million for the year ended December 31, 2016. The following table summarizes external clinical, external preclinical and internal research and development expense for the year ended December 31, 2017 and 2016:
|
|
Year Ended
|
|
|
|
||||||||||
|
|
December 31,
|
|
Changes
|
|||||||||||
|
|
2017
|
|
2016
|
|
$
|
%
|
||||||||
|
|
(dollars in thousands)
|
|||||||||||||
|
External cost of clinical-stage programs
|
$
|
131,485
|
|
|
$
|
54,373
|
|
|
$
|
77,112
|
|
142
|
%
|
|
|
External cost of preclinical-stage programs
|
9,244
|
|
|
6,068
|
|
|
3,176
|
|
52
|
%
|
||||
|
Internal research and development expenses
|
128,289
|
|
|
37,592
|
|
|
90,697
|
|
241
|
%
|
||||
|
Total research and development expenses
|
$
|
269,018
|
|
|
$
|
98,033
|
|
|
$
|
170,985
|
|
174
|
%
|
|
The increase in external research and development expense was primarily attributable to the advancement of our clinical and preclinical drug candidates, and included the following:
|
•
|
Increases of approximately $40.1 million, $27.1 million and $12.9 million, respectively, for zanubrutinib, tislelizumab and pamiparib, partially offset by a decrease of approximately $3.0 million for lifirafenib. The expense increases were primarily due to the expansion of clinical trials for these candidates, including the initiation or continuation of pivotal trials; and
|
|
•
|
Approximately $3.2 million increase in external spending for our preclinical-stage programs, primarily related to costs associated with advancing our preclinical candidates toward clinical trials.
|
The increase in internal research and development expense was primarily attributable to the expansion of our development organization and our clinical and preclinical pipeline, and included the following:
|
•
|
$33.8 million increase of employee salary and benefits, which was primarily attributable to hiring more research and development personnel to support our expanding research and clinical activities;
|
|
•
|
$22.5 million increase of share-based compensation expense, primarily attributable to our increased headcount, as well as the increased valuation of non-employee equity compensation grants due to a higher share price;
|
|
•
|
$15.3 million increase of materials and reagent expenses, mainly in connection with the in-house manufacture of drug candidates used for clinical purposes, that were previously outsourced and recorded as external cost;
|
|
•
|
$9.8 million increase of consulting fees, which was mainly attributable to increased scientific, regulatory and development consulting activities, in connection with the advancement of our pipeline; and
|
|
•
|
$9.3 million increase of facilities, office expense, rental fee and other expenses to support the growth of our organization.
|
Selling, General and Administrative Expense
Selling, general and administrative expense increased by $42.5 million, or 211.5%, to $62.6 million for the year ended December 31, 2017, from $20.1 million for the year ended December 31, 2016. The increase was primarily attributable to the following:
|
•
|
$12.6 million increase of employee salary and benefits, which was primarily attributable to the hiring of more personnel to support our growing organization, including the acquired workforce in the acquisition of Celgene’s China operations;
|
|
•
|
$9.7 million increase of share-based compensation expense, primarily attributable to our increased headcount;
|
102
|
•
|
$8.7 million increase of professional fees for legal, consulting, recruiting and audit services, mainly in connection with our patent prosecution activities, consulting services, business development activities, including the Celgene transactions, recruiting services and the preparation of periodic reports; and
|
|
•
|
$11.5 million increase of selling, facility, travel expenses, rental fees and other administrative expenses, primarily attributable to the global expansion of our business, including the post-combination operating costs of our commercial operations in China.
|
Interest Income (Expense), Net
Interest expense (net) increased by $4.5 million to $4.1 million of expense for the year ended December 31, 2017, from $0.4 million of income for the year ended December 31, 2016. The increase in interest expense was primarily attributable to interest accrued for our long-term bank loan and shareholder loan, partially offset by increased interest income from higher returns on short-term investments.
Other Income(Expense), Net
Other income (expense), net increased by $12.5 million to $11.5 million of net income for the year ended December 31, 2017, from $1.0 million of net expense for the year ended December 31, 2016. The increase was mainly attributable to government grants and subsidies received and recognized, as well as gains on sales of available-for-sale securities.
Income Tax Expense
Income tax expense was $2.2 million for the year ended December 31, 2017 compared with $0.1 million for the year ended December 31, 2016. In the year ended December 31, 2017, the income tax expense was mainly attributable to income tax expense of BeiGene Biologics’s government grant received and recognized as well as our commercial operations in China, partially offset by income tax benefit due to the effect of estimated realized research and development tax credits and the U.S. Orphan Drug Credit for our U.S. operating subsidiary.
Liquidity and Capital Resources
Since inception, we have incurred annual net losses and negative cash flows from our operations. Substantially all of our losses have resulted from the funding of our research and development programs and selling, general and administrative expenses associated with our operations. We incurred net losses of
$674.0 million
,
$93.3 million
and
$119.2 million
for the years ended December 31, 2018, 2017 and 2016, respectively. As of December 31, 2018, we had an accumulated deficit of
$1.0 billion
. Our operating activities
used
$547.7 million
for the year ended December 31, 2018,
provided
$12.8 million
for the year ended December 31, 2017 and
used
$89.5 million
for the years ended December 31, 2016, respectively. We have financed our operations principally through proceeds from public and private offerings of our securities and proceeds from our collaboration agreements with Celgene and Merck KGaA, Darmstadt Germany, and sales of ABRAXANE®, REVLIMID® and VIDAZA
®
in China since September 2017. During the year ended December 31, 2018, we raised $1.6 billion in net proceeds from two follow-on public offerings, including an offering of our ADSs in January 2018 and an offering of our ordinary shares in August 2018 in which we listed our ordinary shares for trading on The Hong Kong Stock Exchange, resulting in the dual listing of our shares in both the United States and Hong Kong.
As of December 31, 2018, we had cash, cash equivalents, restricted cash and short-term investments of
$1.8 billion
, including approximately $149.1 million of cash and cash equivalents and short-term investments held by our joint venture, BeiGene Biologics, to build a commercial biologics facility in Guangzhou, China and to fund research and development of biologics drug candidates in China. Restricted cash of
$27.8 million
represents secured deposits of BeiGene Guangzhou Factory held in designated bank accounts for the issuance of a letter of credit and import duty tax and restricted cash deposits as security for a long-term bank loan.
103
The following table provides information regarding our cash flows for the years ended December 31, 2018, 2017 and 2016:
|
|
Year Ended December 31,
|
||||||||||
|
|
2018
|
2017
|
2016
|
||||||||
|
|
(in thousands)
|
||||||||||
|
Cash, cash equivalents and restricted cash at beginning of period
|
$
|
239,602
|
|
$
|
87,514
|
|
$
|
17,869
|
|
||
|
Net cash (used in) provided by operating activities
|
(547,717
|
)
|
12,752
|
|
(89,513
|
)
|
|||||
|
Net cash used in investing activities
|
(637,613
|
)
|
(356,319
|
)
|
(221,848
|
)
|
|||||
|
Net cash provided by financing activities
|
1,690,537
|
|
490,356
|
|
380,902
|
|
|||||
|
Net effect of foreign exchange rate changes
|
(4,096
|
)
|
5,299
|
|
104
|
|
|||||
|
Net increase in cash, cash equivalents and restricted cash
|
501,111
|
|
152,088
|
|
69,645
|
|
|||||
|
Cash, cash equivalents and restricted cash at end of period
|
$
|
740,713
|
|
$
|
239,602
|
|
$
|
87,514
|
|
||
Use of Funds
The use of cash in all periods presented resulted primarily from our net losses, adjusted for non-cash charges and changes in components of working capital. The primary use of our cash, cash equivalents and short-term investments in all periods presented was to fund research and development, regulatory and other clinical trial costs, selling costs and related supporting administrative expenses. Our prepaid expenses and other current assets, accounts payable and accrued expense balances in all periods presented were affected by the timing of vendor invoicing and payments.
Operating Activities
Operating activities
used
$547.7 million
of cash for the year ended December 31, 2018, which resulted principally from our net loss of
$674.0 million
and
an increase
in our net operating assets and liabilities of
$17.2 million
, offset by non-cash charges of
$143.5 million
. The
increase
in our net operating assets was primarily due to
an increase
of
$46.3 million
in prepaid expenses and other current assets primarily related to prepayments to CROs for clinical trials,
an increase
of
$40.2 million
in other non-current assets primarily related to prepayments for acquiring long-term assets,
an increase
of
$11.6 million
in accounts receivable related to collections on products sales from our collaboration with Celgene,
a decrease
of
$9.1 million
in deferred revenue,
an increase
of
$5.3 million
in inventories and
a decrease
of
$3.4 million
in taxes payable, all of which had a negative impact on operating cash flow. These cash uses were partially offset by
an increase
of
$74.0 million
in accounts payable and accrued expenses related to payments for external research and development costs, payroll-related costs and selling, general and administrative expenses to support our growing business,
an increase
of
$17.0 million
in other long-term liabilities primary related to government subsidies, and
a decrease
in unbilled receivables of
$7.7 million
related to the Celgene and other collaborations, all of which have a positive impact on operating cash flow. Our non-cash charges and other adjustments to our net loss during the year ended December 31, 2018 primarily consisted of
$87.1 million
of share-based compensation expense,
$70.0 million
of acquired in-process research and development related to upfront payments in our license agreements with Mirati and Zymeworks,
$7.8 million
of non-cash interest expense and
$10.4 million
of depreciation expense, offset by
$21.9 million
related to deferred tax benefits,
$8.0 million
of amortization of bond discount and
$1.9 million
of disposal gain on available-for-sale securities and property and equipment.
Operating activities provided $12.8 million of cash for the year ended December 31, 2017, due to cash inflows of $250.0 million from upfront license fees received from Celgene, and decreases in net working capital offsetting significantly increased total expenses, adjusted for non-cash expenses. The overall decrease in our net operating assets was primarily due to an increase in deferred revenue of $37.0 million related to the Celgene collaboration, an increase of $80.3 million due to increased accounts payable and accrued expenses related to higher external research and development costs, increased payroll-related costs and selling, general and administrative expenses to support our growing business, an increase in other long-term liabilities of $31.4 million mainly related to government grants received, offset by an increase in accounts receivable of $29.4 million related to product sales and collaboration with Merck KGaA, Darmstadt Germany, an increase of $28.9 million in prepaid expenses and other current assets, an increase of $10.9 million in inventories and a $29.7 million increase in other non-current assets. Our non-cash charges during the year ended December 31, 2017 primarily consisted of $42.9 million of share-based compensation expense, $7.0 million of non-cash interest expense and $4.8 million of depreciation expense, offset by $5.8 million related to deferred tax benefits.
Operating activities used $89.5 million of cash for the year ended December 31, 2016, which resulted principally from our net loss of $119.2 million, adjusting for non‑cash charges of $15.5 million and interest expense of $0.1 million, and by cash
104
provided in our operating assets and liabilities of $14.1 million. Our net non‑cash charges during the year ended December 31, 2016 primarily consisted of $1.9 million of depreciation expense, $10.6 million of share‑based compensation expense, a $1.4 million loss on sale of available‑for‑sale securities and a $1.5 million loss from changes in the fair value of financial instruments related to the valuation changes of warrants and option liabilities that were exercised during the year.
Investing Activities
Investing activities
used
$637.6 million
of cash for the year ended December 31, 2018, which was primarily due to purchases of investment securities of
$2.6 billion
,
$70.0 million
of in-process research and development related to the license agreements with Mirati and Zymeworks,
$38.3 million
of total costs related to the acquisition of our Changping facility, and capital expenditures of
$70.3 million
primarily related to our Guangzhou and Suzhou manufacturing facilities. These cash uses were offset by sales and maturities of investment securities of
$2.2 billion
.
Investing activities used $356.3 million of cash for the year ended December 31, 2017, which was primarily due to the purchase of investment securities of $741.3 million, capital expenditures of $46.4 million primarily related to our Guangzhou and Suzhou manufacturing facilities and $12.4 million paid to acquire land use rights in Guangzhou, China, partially offset by $423.8 million of proceeds from sale or maturity of investment securities and $19.9 million of cash acquired in the acquisition of BeiGene Pharmaceutical (Shanghai) from Celgene, net of cash paid.
Investing activities used $221.8 million of cash for the year ended December 31, 2016, which was primarily due to the purchase of investment securities of $382.1 million and capital expenditures of $23.5 million, partially offset by $183.7 million of proceeds from sales of investment securities.
Financing Activities
Financing activities
provided
$1.7 billion
of cash for the year ended December 31, 2018, which was primarily due to
$757.6 million
of net proceeds from our follow-on public offering of ADSs in January 2018,
$869.7 million
of net proceeds from our follow-on public offering and the initial listing of our ordinary shares on The Hong Kong Stock Exchange in August 2018,
$42.3 million
from a new long-term bank loan to fund our Guangzhou manufacturing facility, and
$29.7 million
from the exercise of employee share options. These sources of cash were partially offset by a
$8.7 million
repayment of a bank loan for our Suzhou manufacturing facility.
Financing activities provided $490.4 million of cash for the year ended December 31, 2017, which was primarily due to $188.5 million of net proceeds from our follow-on public offering, $149.9 million in proceeds from the sales of our ordinary shares to Celgene Switzerland, net of costs, $132.8 million of proceeds from the shareholder loan, $14.5 million from the capital contribution in BeiGene Biologics by our joint venture collaborator Guangzhou GET Technology Development Co., Ltd., or GET, and $4.6 million in proceeds from the exercise of employee share options.
Financing activities provided $380.9 million of cash for the year ended December 31, 2016, which was due to net proceeds of $366.7 million from our initial and follow-on public offerings, $12.0 million of long-term loan proceeds and $2.2 million of proceeds from the exercise of warrants and employee share options.
Operating Capital Requirements
We do not expect to generate significant revenue from product sales of our internally developed drug candidates unless and until we obtain regulatory approval for and commercialize one of our current or future drug candidates. We have exclusive rights to distribute and promote Celgene’s approved cancer therapies in China, for which we began recognizing revenue in the third quarter of 2017. We anticipate that we will continue to generate losses for the foreseeable future, and we expect our losses to increase as we continue the development of, and seek regulatory approvals for, our drug candidates, and prepare for commercialization and begin to commercialize any approved products. As a growing public company, we will continue to incur additional costs associated with our operations. In addition, we expect to incur significant commercialization expenses for product sales, marketing and manufacturing of our in-licensed drug products in China and, subject to obtaining regulatory approval, our drug candidates. Accordingly, we anticipate that we will need substantial additional funding prior to generating sufficient cash from operations to fund our continuing operations.
Based on our current operating plan, we expect that our existing cash, cash equivalents and short-term investments as of December 31, 2018, will enable us to fund our operating expenses and capital expenditures requirements for at least the next 12 months after the date that the financial statements included in this report are issued. We expect that our expenses will continue to increase substantially as we fund our ongoing research and clinical development efforts, including our ongoing and planned
105
pivotal trials for zanubrutinib, tislelizumab and pamiparib, both in China and globally; our other ongoing and planned clinical trials; regulatory filing and registration of our late-stage drug candidates; expansion of commercial operations in China and preparation for launch of our drug candidates globally; business development and manufacturing activities; and working capital and other general corporate purposes. We have based our estimates on assumptions that may prove to be wrong, and we may use our available capital resources sooner than we currently expect. Because of the numerous risks and uncertainties associated with the development and commercialization of our drug candidates, we are unable to estimate the amounts of increased capital outlays and operating expenditures necessary to complete the development and commercialization of our drug candidates.
Our future capital requirements will depend on many factors, including:
|
•
|
the costs, timing and outcome of regulatory reviews and approvals;
|
|
•
|
the ability of our drug candidates to progress through clinical development successfully;
|
|
•
|
the initiation, progress, timing, costs and results of nonclinical studies and clinical trials for our other programs and potential drug candidates;
|
|
•
|
the number and characteristics of the drug candidates we pursue;
|
|
•
|
the costs of establishing commercial manufacturing capabilities or securing necessary supplies from third-party manufacturers;
|
|
•
|
the costs of preparing, filing and prosecuting patent applications, maintaining and enforcing our intellectual property rights and defending intellectual property‑related claims;
|
|
•
|
the costs of establishing and expanding our commercial operations and the success of those operations;
|
|
•
|
the extent to which we acquire or in‑license other products and technologies; and
|
|
•
|
our ability to maintain and establish collaboration arrangements on favorable terms, if at all.
|
Until such time, if ever, as we can generate substantial product revenue, we expect to finance our cash needs through a combination of equity offerings, debt financings, collaboration agreements, strategic alliances, licensing arrangements, government grants and other available sources. Under SEC rules, we currently qualify as a “well-known seasoned issuer,” which allows us to file shelf registration statements to register an unspecified amount of securities that are effective upon filing. On May 26, 2017, we filed such a shelf registration statement with the SEC for the issuance of an unspecified amount of ordinary shares (including in the form of ADSs), preferred shares, various series of debt securities and/or warrants to purchase any of such securities, either individually or in units, from time to time at prices and on terms to be determined at the time of any such offering. This registration statement was effective upon filing and will remain in effect for up to three years from filing. To the extent that we raise additional capital through the sale of equity or convertible debt securities, the ownership interest of our shareholders will be diluted, and the terms of these securities may include liquidation or other preferences that adversely affect your rights as a holder of ADSs or ordinary shares. Debt financing, if available, may involve agreements that include covenants limiting or restricting our ability to take specific actions, such as incurring additional debt, making capital expenditures or declaring dividends and may require the issuance of warrants, which could potentially dilute your ownership interest. If we raise additional funds through collaboration agreements, strategic alliances or licensing arrangements with third parties, we may have to relinquish valuable rights to our technologies, future revenue streams or research programs or to grant licenses on terms that may not be favorable to us. If we are unable to raise additional funds through equity or debt financings, collaborations or other sources when needed, we may be required to delay, limit, reduce or terminate our product development or commercialization efforts or grant rights to develop and market products or drug candidates that we would otherwise prefer to develop and market ourselves.
106
Contractual Obligations and Commitments
The following table summarizes our significant contractual obligations as of payment due date by period at December 31, 2018:
|
|
Payments Due by Period
|
||||||||||||||||||
|
|
|
Less Than
|
|
|
More Than
|
||||||||||||||
|
|
Total
|
1 Year
|
1–3 Years
|
3–5 Years
|
5 Years
|
||||||||||||||
|
|
(in thousands)
|
||||||||||||||||||
|
Contractual obligations
|
|
|
|
|
|
|
|
|
|
|
|||||||||
|
Operating lease commitments
|
$
|
33,809
|
|
$
|
10,752
|
|
$
|
17,777
|
|
$
|
5,175
|
|
$
|
105
|
|
||||
|
Debt obligations
|
198,399
|
|
8,727
|
|
140
|
|
152,960
|
|
36,572
|
|
|||||||||
|
Purchase commitments
|
9,747
|
|
9,747
|
|
—
|
|
—
|
|
—
|
|
|||||||||
|
Capital commitments
|
45,910
|
|
45,910
|
|
—
|
|
—
|
|
—
|
|
|||||||||
|
Total
|
$
|
287,865
|
|
$
|
75,136
|
|
$
|
17,917
|
|
$
|
158,135
|
|
$
|
36,677
|
|
||||
Operating Lease Commitments
We lease office or manufacturing facilities in Beijing, Shanghai, Suzhou and Guangzhou, People’s Republic of China, or PRC, and office facilities in the United States in California, Massachusetts and New Jersey under non-cancelable operating leases expiring on different dates. Payments under operating leases are expensed on a straight-line basis over the periods of the respective leases. The aggregate future minimum payments under these non-cancelable operating leases are summarized in the table above.
Debt Obligations
Long-term Bank Loans
On September 2, 2015, BeiGene Suzhou entered into a loan agreement with Suzhou Industrial Park Biotech Development Co., Ltd. and China Construction Bank, to borrow $17.5 million (RMB 120 million) at a 7% fixed annual interest rate. The loan is secured by BeiGene Suzhou's equipment with a carrying amount of $13.6 million and our rights to a PRC patent on a drug candidate. $8.7 million was repaid on September 20, 2018, and the remaining $8.7 million is due on September 30, 2019.
On April 4, 2018, BeiGene Guangzhou Factory entered into a nine-year loan agreement with China Construction Bank to borrow $84.4 million (RMB 580 million) at a floating interest rate benchmarking RMB loans interest rate of financial institutions in PRC. The Company plans to draw down the entire available amount before December 31, 2019. The loan is secured by BeiGene Guangzhou Factory’s land use right with a net carrying amount of $11.6 million. Interest expense will be paid quarterly until the loan is fully settled. As of September 30, 2018, the Company has drawn down $40.7 million in aggregate principal amount of this loan. Maturity dates range from 2021 to 2027.
Shareholder Loan
On March 7, 2017, BeiGene Biologics entered into a Shareholder Loan Contract with GET, pursuant to which GET provided a shareholder loan to BeiGene Biologics in the principal amount of RMB900 million at a fixed 8% annual interest rate. The term of the shareholder loan is 72 months, commencing from the actual drawdown date of April 14, 2017 and ending on April 13, 2023, unless converted earlier. On April 14, 2017, we drew down the entire RMB900 million from GET.
Purchase Obligations
As of December 31, 2018, purchase obligations amounted to
$9.7
million related to minimum purchase requirements for finished goods inventory purchased from Celgene.
Capital Commitments
We had capital commitments amounting to $45.9 million for the acquisition of property, plant and equipment as of December 31, 2018, which was primarily for BeiGene Guangzhou Factory’s manufacturing facility in Guangzhou, China.
107
Other Business Agreements
We enter into agreements in the normal course of business with CROs and institutions to license intellectual property. We have not included these future payments in the table of contractual obligations above since the contracts are cancelable at any time by us with prior written notice or the licensing fees are currently not determinable.
Off‑Balance Sheet Arrangements
We did not have during the periods presented, and we do not currently have, any off‑balance sheet arrangements, as defined under SEC rules, such as relationships with unconsolidated entities or financial partnerships, which are often referred to as structured finance or special purpose entities, established for the purpose of facilitating financing transactions that are not required to be reflected on our balance sheets.
Critical Accounting Policies
Our discussion and analysis of our financial condition and results of operations is based on our financial statements, which have been prepared in accordance with accounting principles generally accepted in the United States of America, or GAAP. The preparation of these financial statements requires us to make estimates, assumptions and judgments that affect the reported amounts of assets, liabilities, revenues, costs and expenses. We evaluate our estimates and judgments on an ongoing basis, and our actual results may differ from these estimates. We base our estimates on historical experience, known trends and events, contractual milestones and other various factors that are believed to be reasonable under the circumstances, the results of which form the basis for making judgments about the carrying values of assets and liabilities that are not readily apparent from other sources.
Our most critical accounting policies are summarized below. See Note 2 to our consolidated financial statements included in this Annual Report for a description of our other significant accounting policies.
Revenue Recognition
Effective January 1, 2018, the Company adopted Accounting Standards Codification, Topic 606, Revenue from Contracts with Customers (“ASC 606”). For further information regarding the impact of adoption, see Note 2 Recent Accounting Pronouncements.
Under ASC 606, an entity recognizes revenue when its customer obtains control of promised goods or services, in an amount that reflects the consideration that the entity expects to receive in exchange for those goods or services. To determine revenue recognition for arrangements that an entity determines are within the scope of ASC 606, the entity performs the following five steps: (i) identify the contract(s) with a customer; (ii) identify the performance obligations in the contract; (iii) determine the transaction price, including variable consideration, if any; (iv) allocate the transaction price to the performance obligations in the contract; and (v) recognize revenue when (or as) the entity satisfies a performance obligation. The Company only applies the five-step model to contracts when it is probable that the entity will collect the consideration to which it is entitled in exchange for the goods or services it transfers to the customer.
Once a contract is determined to be within the scope of ASC 606 at contract inception, the Company reviews the contract to determine which performance obligations it must deliver and which of these performance obligations are distinct. The Company recognizes as revenue the amount of the transaction price that is allocated to each performance obligation when that performance obligation is satisfied or as it is satisfied.
Product Revenue
The Company's product revenues are generated from the sale of ABRAXANE®, REVLIMID®, and VIDAZA® to its product distributor in China. The distributor subsequently resells the products to second tier distributors who ultimately sell the products to health care providers and patients. The Company is the principal under the product sale as the Company controls the products with the ability to direct the use of, and obtain substantially all the remaining benefits from the products before they are sold to its first tier distributer. The Company has a single performance obligation which is to sell the products to its first tier distributer. The Company includes variable consideration in the transaction price to the extent it is probable that a significant reversal will not occur and estimates variable consideration from sales rebates and returns using the expected value method. Revenues for product sales are recognized at a point in time when the single performance obligation is satisfied upon delivery to the first tier distributer. The Company's payment terms are approximately 90 days. Actual amounts of consideration ultimately received may differ from the Company’s estimates. The Company will reassess estimates for variable consideration
108
periodically. If actual results in the future vary from the Company’s estimates, the Company will adjust these estimates, which would affect net product revenue and earnings in the period such variances become known.
Rebates, including price compensation credits, are offered to distributors, consistent with pharmaceutical industry practices. The Company records a provision for rebates at the time of sale based on contracted rates and historical redemption rates. Assumptions used to establish the provision include the level of distributor inventories, sales volumes and contract pricing and estimated acceptance of government pricing or reimbursement amounts (such as provincial acceptance of the National Reimbursement Drug List pricing in the PRC). The Company regularly reviews the information related to these estimates and adjust the provision accordingly.
The Company bases its sales returns allowance on estimated distributor inventories, customer demand as reported by third-party sources, and actual returns history, as well as other factors, as appropriate. If the historical data the Company uses to calculate these estimates do not properly reflect future returns, then a change in the allowance would be made in the period in which such a determination is made and revenues in that period could be materially affected. Any changes from the historical trend rates are considered in determining the current sales return allowance. To date, sales returns have not been significant.
Collaboration Revenue
At contract inception, the Company analyzes its collaboration arrangements to assess whether they are within the scope of ASC 808, Collaborative Arrangements (“ASC 808”) to determine whether such arrangements involve joint operating activities performed by parties that are both active participants in the activities and exposed to significant risks and rewards dependent on the commercial success of such activities. For collaboration arrangements within the scope of ASC 808 that contain multiple elements, the Company first determines which elements of the collaboration are deemed to be within the scope of ASC 808 and those that are more reflective of a vendor-customer relationship and therefore within the scope of ASC 606. For elements of collaboration arrangements that are accounted for pursuant to ASC 808, an appropriate recognition method is determined and applied consistently.
In determining the appropriate amount of revenue to be recognized as it fulfills its obligations under each of its agreements, the Company performs the five step model under ASC 606 noted above.
The Company’s collaborative arrangements may contain more than one unit of account, or performance obligation, including grants of licenses to intellectual property rights, agreement to provide research and development services and other deliverables. The collaborative arrangements do not include a right of return for any deliverable. As part of the accounting for these arrangements, the Company must develop assumptions that require judgment to determine the stand-alone selling price for each performance obligation identified in the contract. In developing the stand-alone selling price for a performance obligation, the Company considers competitor pricing for a similar or identical product, market awareness of and perception of the product, expected product life and current market trends. In general, the consideration allocated to each performance obligation is recognized when the respective obligation is satisfied either by delivering a good or providing a service, limited to the consideration that is not constrained. Non-refundable payments received before all of the relevant criteria for revenue recognition are satisfied are recorded as advances from customers.
Licenses of Intellectual Property:
Upfront non-refundable payments for licensing the Company’s intellectual property are evaluated to determine if the license is distinct from the other performance obligations identified in the arrangement. For licenses determined to be distinct, the Company recognizes revenues from non-refundable, up-front fees allocated to the license at a point in time, when the license is transferred to the licensee and the licensee is able to use and benefit from the license.
Research and Development Services
: The portion of the transaction price allocated to research and development services performance obligations is deferred and recognized as collaboration revenue overtime as delivery or performance of such services occurs. R&D reimbursement revenue for revenue attributable to the clinical trials that Celgene has opted into is recognized as delivery or performance of such services occurs.
Milestone Payments:
At the inception of each arrangement that includes development milestone payments, the Company evaluates whether the milestones are considered probable of being reached and estimates the amount to be included in the transaction price using the most likely amount method. If it is probable that a significant revenue reversal would not occur, the associated milestone value is included in the transaction price. Milestones related to the Company’s development-based activities may include initiation of various phases of clinical trials. Due to the uncertainty involved in meeting these development-based targets, they are generally fully constrained at contract inception. The Company will assess whether the variable consideration is fully constrained each reporting period based on the facts and circumstances surrounding the clinical trials. Upon changes to constraint associated with the developmental milestones, variable consideration will be included in the
109
transaction price when a significant reversal of revenue recognized is not expected to occur and allocated to the separate performance obligations. Regulatory milestones are fully constrained until the period in which those regulatory approvals are achieved due to the inherent uncertainty with the approval process. Regulatory milestones are included in the transaction price in the period regulatory approval is obtained.
Royalties:
For arrangements that include sales-based royalties, including milestone payments based on the level of sales, and the license is deemed to be the predominant item to which the royalties relate, the Company recognizes revenue at the later of (i) when the related sales occur, or (ii) when the performance obligation to which some or all of the royalty has been allocated has been satisfied (or partially satisfied).
Research and Development Expenses
Research and development expenses represent costs associated with the collaborative arrangements, which primarily include (1) payroll and related costs (including share‑based compensation) associated with research and development personnel; (2) costs related to clinical trials and preclinical testing of our technologies under development; (3) costs to develop the product candidates, including raw materials and supplies, product testing, depreciation, and facility related expenses; (4) expenses for research services provided by universities and contract laboratories, including sponsored research funding; and (5) other research and development expenses. Research and development expenses are charged to expense as incurred when these expenditures relate to our research and development services and have no alternative future uses.
Clinical trial costs are a significant component of our research and development expenses. We have a history of contracting with third parties that perform various clinical trial activities on behalf of us in the ongoing development of our product candidates. Expenses related to clinical trials are accrued based on our estimates of the actual services performed by the third parties for the respective period. If the contracted amounts are modified (for instance, as a result of changes in the clinical trial protocol or scope of work to be performed), we will modify the related accruals accordingly on a prospective basis. Revisions in the scope of a contract are charged to expense in the period in which the facts that give rise to the revision become reasonably certain.
The process of estimating our research and development expenses involves reviewing open contracts and purchase orders, communicating with our personnel to identify services that have been performed on our behalf and estimating the level of service performed and the associated costs incurred for the services when we have not yet been invoiced or otherwise notified of the actual costs. The majority of our service providers invoice us in arrears for services performed, on a pre‑determined schedule or when contractual milestones are met; however, some require advanced payments. We make estimates of our expenses as of each balance sheet date in our financial statements based on facts and circumstances known to us at that time. Although we do not expect our estimates to be materially different from amounts actually incurred, our understanding of the status and timing of services performed relative to the actual status and timing of services performed may vary and may result in us reporting expenses that are too high or too low in any particular period. To date, we have not made any material adjustments to our prior estimates of research and development expenses.
Acquired In-Process Research and Development Expense
The Company has acquired rights to develop and commercialize product candidates. Upfront payments that relate to the acquisition of a new drug compound, as well as pre-commercial milestone payments, are immediately expensed as acquired in-process research and development in the period in which they are incurred, provided that the new drug compound did not also include processes or activities that would constitute a “business” as defined under GAAP, the drug has not achieved regulatory approval for marketing and, absent obtaining such approval, has no established alternative future use. Milestone payments made to third parties subsequent to regulatory approval are capitalized as intangible assets and amortized over the estimated remaining useful life of the related product. Royalties owed on sales of the products licensed pursuant to the agreements are expensed in the period the related revenues are recognized
.
Share‑Based Compensation
Awards Granted to Employees
We apply ASC 718,
Compensation—Stock Compensation,
or ASC 718, to account for our employee share‑based payments. In accordance with ASC 718, we determine whether an award should be classified and accounted for as a liability award or equity award. All our grants of share‑based awards to employees were classified as equity awards and are recognized in the financial statements based on their grant date fair values. We have elected to recognize compensation expense using the straight‑line method for all employee equity awards granted with graded vesting based on service conditions provided that the
110
amount of compensation cost recognized at any date is at least equal to the portion of the grant‑date value of the options that are vested at that date. We use the accelerated method for all awards granted with graded vesting based on performance conditions. To the extent the required vesting conditions are not met resulting in the forfeiture of the share‑based awards, previously recognized compensation expense relating to those awards are reversed. ASC 718 requires forfeitures to be estimated at the time of grant and revised, if necessary, in the subsequent period if actual forfeitures differ from initial estimates.
Forfeiture rates are estimated based on historical and future expectations of employee turnover rates and are adjusted to reflect future changes in circumstances and facts, if any. Share‑based compensation expense is recorded net of estimated forfeitures such that expense is recorded only for those share‑based awards that are expected to vest. To the extent we revise these estimates in the future, the share‑based payments could be materially impacted in the period of revision, as well as in following periods. We, with the assistance of an independent third‑party valuation firm, determined the estimated fair value of the share options granted to employees using a binomial option pricing model.
Awards Granted to Non‑employees
We have accounted for equity instruments issued to non‑employees in accordance with the provisions of ASC 718,
Share-based payments
, and ASC 505,
Equity
. All transactions in which goods or services are received in exchange for equity instruments are accounted for based on the fair value of the consideration received or the fair value of the equity instrument issued, whichever is more reliably measurable. The measurement date of the fair value of the equity instrument issued is the date on which the counterparty’s performance is completed as there is no associated performance commitment. The expense is recognized in the same manner as if we had paid cash for the services provided by the non‑employees in accordance with ASC 505‑50,
Equity‑based payments to non‑employees
. We estimate the fair value of share options granted to non-employees using the same method as employees.
Modification of Awards
A change in any of the terms or conditions of the awards is accounted for as a modification of the award. Incremental compensation cost is measured as the excess, if any, of the fair value of the modified award over the fair value of the original award immediately before its terms are modified, measured based on the fair value of the awards and other pertinent factors at the modification date. For vested awards, we recognize incremental compensation cost in the period the modification occurs. For unvested awards, we recognize over the remaining requisite service period, the sum of the incremental compensation cost and the remaining unrecognized compensation cost for the original award on the modification date. If the fair value of the modified award is lower than the fair value of the original award immediately before modification, the minimum compensation cost we recognize is the cost of the original award.
Significant Factors, Assumptions and Methodologies Used in Determining Fair Value
The fair value of each share option grant is estimated using the binomial option‑pricing model. The model requires the input of highly subjective assumptions including the estimated expected share price volatility and, the share price upon which (i.e. the exercise multiple) the employees are likely to exercise share options. The trading history and observation period of our own share price movement has not been long enough to match the life of the share option. Therefore, we estimate our expected share price volatility based on the historical volatility of a group of similar companies, which are publicly‑traded. When selecting these public companies on which we have based our expected share price volatility, we selected companies with characteristics similar to us, including the invested capital’s value, business model, development stage, risk profiles, position within the industry, and with historical share price information sufficient to meet the contractual life of our share‑based awards. We will continue to apply this process until a sufficient amount of historical information regarding the volatility of our own share price becomes available. For the exercise multiple, we were not able to develop an exercise pattern as reference, thus the exercise multiple is based on management’s estimation, which we believe is representative of the future exercise pattern of the options. The risk‑free interest rates for the periods within the contractual life of the option are based on the U.S. Treasury yield curve in effect during the period the options were granted. Expected dividend yield is based on the fact that we have never paid, and do not expect to pay cash dividends in the foreseeable future.
111
The assumptions adopted to estimate the fair value of share options using the binomial option pricing model were as follows:
|
|
Year Ended December 31,
|
||||
|
|
2018
|
2017
|
2016
|
||
|
Risk-free interest rate
|
2.5% ~ 3.1%
|
2.2% ~ 2.6%
|
1.5% ~ 2.6%
|
||
|
Expected exercise multiple
|
2.2 ~ 2.8
|
2.2 ~ 2.8
|
2.2 ~ 2.8
|
||
|
Expected volatility
|
60% ~ 64%
|
99% ~ 100%
|
98% ~ 102%
|
||
|
Expected dividend yield
|
0%
|
0%
|
0%
|
||
|
Contractual life (years)
|
10
|
10
|
10
|
||
We are also required to estimate forfeitures at the time of grant, and revise those estimates in subsequent periods if actual forfeitures differ from our estimates. We use historical data to estimate pre‑vesting option forfeitures and record share‑based compensation expense only for those awards that are expected to vest. To the extent that actual forfeitures differ from our estimates, the difference is recorded as a cumulative adjustment in the period the estimates were revised.
These assumptions represented our best estimates, but the estimates involve inherent uncertainties and the application of our judgment. As a result, if factors change and we use significantly different assumptions or estimates when valuing our share options, our share‑based compensation expense could be materially different.
The fair value of restricted shares and restricted share units are based on the closing market price of our ADSs on the NASDAQ Global Select Market on the date of grant.
The following table summarizes total compensation cost recognized for the years ended December 31, 2018, 2017 and 2016:
|
|
Year Ended December 31,
|
||||||||||
|
|
2018
|
2017
|
2016
|
||||||||
|
|
(in thousands)
|
||||||||||
|
Research and development
|
$
|
54,384
|
|
$
|
30,610
|
|
$
|
8,076
|
|
||
|
Selling, general and administration
|
32,743
|
|
12,253
|
|
2,549
|
|
|||||
|
Total
|
$
|
87,127
|
|
$
|
42,863
|
|
$
|
10,625
|
|
||
As of December 31, 2018, there was
$289.9 million
of total unrecognized share-based compensation expense, net of estimated forfeitures, related to unvested share-based awards which are expected to be recognized over a weighted-average period of
2.6
years. As of December 31, 2017, there was $178.2 million of total unrecognized share-based compensation expense, net of estimated forfeitures, related to unvested share-based awards which are expected to be recognized over a weighted-average period of 3.4 years. In future periods, our share-based compensation expense is expected to increase as a result of recognizing our existing unrecognized share-based compensation for awards that will vest and as we issue additional share-based awards to attract and retain our employees.
Income Taxes
We use the liability method of accounting for income taxes. Under this method, deferred tax assets and liabilities are determined based on the differences between the financial reporting and the tax bases of assets and liabilities and are measured using enacted tax rates that will be in effect when the differences are expected to reverse. A valuation allowance is provided when it is more likely than not that some portion or all of a deferred tax asset will not be realized.
In accordance with ASU 2015-17, all deferred income tax assets and liabilities are classified as non-current on the consolidated balance sheets.
We evaluate our uncertain tax positions using the provisions of ASC 740,
Income Taxes
, which prescribes a recognition threshold that a tax position is required to meet before being recognized in the financial statements. We recognize in the financial statements the benefit of a tax position which is “more likely than not” to be sustained under examination based solely on the technical merits of the position assuming a review by tax authorities having all relevant information. Tax positions that meet the recognition threshold are measured using a cumulative probability approach, at the largest amount of tax benefit that
112
has a greater than fifty percent likelihood of being realized upon settlement. It is our policy to recognize interest and penalties related to unrecognized tax benefits, if any, as a component of income tax expense.
Recent Accounting Pronouncements
See Note 2 to our consolidated financial statements included in this Annual Report for information regarding recent accounting pronouncements.
Item 7A. Quantitative and Qualitative Disclosures About Market Risk
Interest and Credit Risk
Financial instruments that are potentially subject to credit risk consist of cash and cash equivalents, restricted cash and short term investments. The carrying amounts of cash, cash equivalents, restricted cash and short term investments represent the maximum amount of loss due to credit risk. We had cash and cash equivalents of
$712.9 million
, $239.6 million and $87.5 million, restricted cash of
$27.8 million
, nil and nil, and short-term investments of
$1.1 billion
, $597.9 million and $280.7 million at December 31, 2018, 2017 and 2016, respectively. Our cash and cash equivalents are deposited with various major reputable financial institutions located within or without People’s Republic of China, or PRC. The deposits placed with these financial institutions are not protected by statutory or commercial insurance. In the event of bankruptcy of one of these financial institutions, we may be unlikely to claim our deposits back in full. We believe that these financial institutions are of high credit quality, and we continually monitor the credit worthiness of these financial institutions. At December 31, 2018, our short term investments consisted primarily of U.S. treasury securities. We believe that the U.S. treasury securities is of high credit quality and continually monitor the credit worthiness of these institutions.
The primary objectives of our investment activities are to preserve principal, provide liquidity and maximize income without significant increasing risk. Our primary exposure to market risk relates to fluctuations in the interest rates which are affected by changes in the general level of PRC and U.S. interest rates. Given the short‑term nature of our cash equivalents, we believe that a sudden change in market interest rates would not be expected to have a material impact on our financial condition and/or results of operation. We estimate that a hypothetical 100‑basis point change in market interest rates would impact the fair value of our investment portfolio as of December 31, 2018 by $2.8 million.
We do not believe that our cash, cash equivalents and short‑term investments have significant risk of default or illiquidity. While we believe our cash, cash equivalents and short-term investments do not contain excessive risk, we cannot provide absolute assurance that in the future investments will not be subject to adverse changes in market value.
Foreign Currency Exchange Rate Risk
We are exposed to foreign exchange risk arising from various currency exposures. Our functional currency is the U.S. dollar, but a portion of our operating transactions and assets and liabilities are in other currencies, such as RMB, Australian dollar and Euro. We do not believe that we currently have any significant direct foreign exchange risk and have not used any derivative financial instruments to hedge exposure to such risk.
RMB is not freely convertible into foreign currencies for capital account transactions. The value of RMB against the U.S. dollar and other currencies is affected by, among other things, changes in China’s political and economic conditions and China’s foreign exchange prices. From July 21, 2005, the RMB is permitted to fluctuate within a narrow and managed band against a basket of certain foreign currencies. For the RMB against U.S. dollars, there were depreciation of approximately 5.7%, appreciation of approximately 6.5% and depreciation of approximately 6.3% in the year ended December 31, 2018, 2017 and 2016. It is difficult to predict how market forces or PRC or U.S. government policy may impact the exchange rate between the RMB and the U.S. dollar in the future.
To the extent that we need to convert U.S. dollars into RMB for capital expenditures and working capital and other business purposes, appreciation of RMB against the U.S. dollar would have an adverse effect on the RMB amount we would receive from the conversion. Conversely, if we decide to convert RMB into U.S. dollars for the purpose of making payments for dividends on our ordinary shares, strategic acquisitions or investments or other business purposes, appreciation of the U.S. dollar against RMB would have a negative effect on the U.S. dollar amount available to us.
In addition, a significant depreciation of the RMB against the U.S. dollar may significantly reduce the U.S. dollar equivalent of our earnings or losses.
113
Currency Convertibility Risk
A significant portion of our expenses, assets and liabilities are denominated in RMB. On January 1, 1994, the PRC government abolished the dual rate system and introduced a single rate of exchange as quoted daily by the People’s Bank of China, or PBOC. However, the unification of exchange rates does not imply that the RMB may be readily convertible into U.S. dollars or other foreign currencies. All foreign exchange transactions continue to take place either through the PBOC or other banks authorized to buy and sell foreign currencies at the exchange rates quoted by the PBOC. Approvals of foreign currency payments by the PBOC or other institutions require submitting a payment application form together with suppliers’ invoices, shipping documents and signed contracts.
Additionally, the value of the RMB is subject to changes in central government policies and international economic and political developments affecting supply and demand in the PRC foreign exchange trading system market.
Effects of Inflation
Inflation generally affects us by increasing our cost of labor and clinical trial costs. We do not believe that inflation has had a material effect on our results of operations during the year ended December 31, 2018.
Item 8. Financial Statements and Supplementary Data
The financial statements required to be filed pursuant to this item are appended to this Annual Report. An index of those financial statements is in “Part IV—Item 15—Exhibits, Financial Statement Schedules.”
Item 9. Changes in and Disagreements with Accountants on Accounting and Financial Disclosure
None.
Item 9A. Controls and Procedures
Evaluation of Disclosure Controls and Procedures
Based on their evaluation, required by paragraph (b) of Rules 13a-15 or 15d-15, promulgated by the Securities Exchange Act of 1934, as amended, or the Exchange Act, our principal executive officer and principal financial officer have concluded that our disclosure controls and procedures as defined in Rules 13a-15(e) and 15d-15(e) of the Exchange Act are effective, at a reasonable assurance level, as of December 31, 2018, to ensure that information required to be disclosed in reports that we file or submit under the Exchange Act is recorded, processed, summarized, and reported within the time periods specified in U.S. Securities and Exchange Commission rules and forms. Disclosure controls and procedures include, without limitation, controls and procedures designed to ensure that information required to be disclosed by us in the reports that we file or submit under the Exchange Act is accumulated and communicated to our management, including our principal executive and principal financial officers, or persons performing similar functions, as appropriate to allow timely decisions regarding required disclosure. In designing and evaluating the disclosure controls and procedures, our management recognized that any controls and procedures, no matter how well designed and operated, can provide only reasonable assurances of achieving the desired control objectives, and management necessarily was required to apply its judgment in designing and evaluating the controls and procedures.
Management’s Annual Report on Internal Control Over Financial Reporting
Our management is responsible for establishing and maintaining adequate internal control over financial reporting (as defined in Rules 13a-15(f) and 15d-15(f) under the Exchange Act of 1934, as amended). Our internal control over financial reporting is a process designed to provide reasonable assurance regarding the reliability of financial reporting and the preparation of financial statements for external purposes in accordance with U.S. generally accepted accounting principles. Because of its inherent limitations, internal control over financial reporting may not prevent or detect misstatements. Also, projections of any evaluation of effectiveness to future periods are subject to the risk that controls may become inadequate because of changes in conditions, or that the degree of compliance with the policies or procedures may deteriorate.
Under the supervision and with the participation of our management, including our Chief Executive Officer and Chief Financial Officer, we conducted an evaluation of the effectiveness of our internal control over financial reporting based on the framework in Internal Control-Integrated Framework (2013) issued by the Committee of Sponsoring Organizations of the Treadway Commission. Based on our assessment and those criteria, management concluded that we maintained effective internal control over financial reporting as of December 31, 2018.
114
The effectiveness of our internal control over financial reporting as of
December 31, 2018
, has been tested by Ernst & Young Hua Ming LLP, our independent registered public accounting firm, as stated in their report which is included in “Item 8—Financial Statements and Other Supplementary Data” in this Annual Report.
Changes in Internal Control over Financial Reporting
There were no changes in our internal control over financial reporting identified in connection with the evaluation required by Rule 13a‑15(d) and 15d‑15(d) of the Exchange Act that occurred during the three months ended
December 31, 2018
that have materially affected, or are reasonably likely to materially affect, our internal control over financial reporting.
Item 9B. Other Information
Not applicable.
115
PART III
Item 10. Directors, Executive Officers and Corporate Governance
The information required under this item is incorporated herein by reference to our definitive proxy statement pursuant to Regulation 14A, which proxy statement will be filed with the U.S. Securities and Exchange Commission not later than 120 days after the close of our fiscal year ended December 31, 2018.
Item 11. Executive Compensation
The information required under this item is incorporated herein by reference to our definitive proxy statement pursuant to Regulation 14A, which proxy statement will be filed with the U.S. Securities and Exchange Commission not later than 120 days after the close of our fiscal year ended December 31, 2018.
Item 12. Security Ownership of Certain Beneficial Owners and Management and Related Stockholder Matters
The information required under this item is incorporated herein by reference to our definitive proxy statement pursuant to Regulation 14A, which proxy statement will be filed with the U.S. Securities and Exchange Commission not later than 120 days after the close of our fiscal year ended December 31, 2018.
Item 13. Certain Relationships and Related Transactions, and Director Independence
The information required under this item is incorporated herein by reference to our definitive proxy statement pursuant to Regulation 14A, which proxy statement will be filed with the U.S. Securities and Exchange Commission not later than 120 days after the close of our fiscal year ended December 31, 2018.
Item 14. Principal Accounting Fees and Services
The information required under this item is incorporated herein by reference to our definitive proxy statement pursuant to Regulation 14A, which proxy statement will be filed with the U.S. Securities and Exchange Commission not later than 120 days after the close of our fiscal year ended December 31, 2018.
116
PART IV
Item 15. Exhibits, Financial Statement Schedules
The financial statements listed in the Index to Consolidated Financial Statements beginning on page F-1 are filed as part of this Annual Report.
No financial statement schedules have been filed as part of this Annual Report because they are not applicable, not required or the information required is shown in the financial statements or the notes thereto.
The exhibits filed as part of this Annual Report are set forth on the Exhibit Index immediately following our consolidated financial statements. The Exhibit Index is incorporated herein by reference.
Item 16. Form 10‑K Summary
Not applicable.
117
BEIGENE, LTD.
INDEX TO CONSOLIDATED FINANCIAL STATEMENTS
|
|
|
|
|
Page
|
F-1
Report of Independent Registered Public Accounting Firm
To the Shareholders and the Board of Directors of BeiGene, Ltd.:
Opinion on the Financial Statements
We have audited the accompanying consolidated balance sheets of BeiGene, Ltd. (the "Company") as of December 31, 2018 and 2017, the related consolidated statements of operations, comprehensive loss,
cash flows and shareholders' equity for each of the three years in the period ended December 31, 2018, and the related notes (collectively referred to as the "consolidated financial statements"). In our opinion, the consolidated financial statements present fairly, in all material respects, the financial position of the Company as of December 31, 2018 and 2017, and the results of its operations and its cash flows for each of the three years in the period ended December 31, 2018, in conformity with US generally accepted accounting principles.
We also have audited, in accordance with the standards of the Public Company Accounting Oversight Board (United States) ("PCAOB"), the Company's internal control over financial reporting as of December 31, 2018, based on criteria established in Internal Control-Integrated Framework issued by the Committee of Sponsoring Organizations of the Treadway Commission (2013 framework) and our report dated February 28, 2019 expressed an unqualified opinion thereon.
Basis for Opinion
These financial statements are the responsibility of the Company's management. Our responsibility is to express an opinion on the Company's financial statements based on our audits. We are a public accounting firm registered with the PCAOB and are required to be independent with respect to the Company in accordance with the U.S. federal securities laws and the applicable rules and regulations of the Securities and Exchange Commission and the PCAOB.
We conducted our audits in accordance with the standards of the PCAOB. Those standards require that we plan and perform the audit to obtain reasonable assurance about whether the financial statements are free of material misstatement, whether due to error or fraud. Our audits included performing procedures to assess the risks of material misstatement of the financial statements, whether due to error or fraud, and performing procedures that respond to those risks. Such procedures include examining, on a test basis, evidence regarding the amounts and disclosures in the financial statements. Our audits also included evaluating the accounting principles used and significant estimates made by management, as well as evaluating the overall presentation of the financial statements. We believe that our audits provide a reasonable basis for our opinion.
/s/ Ernst & Young Hua Ming LLP
We have served as the Company’s auditor since 2014.
Beijing, People’s Republic of China
February 28, 2019
F-2
Report of Independent Registered Public Accounting Firm
To the Shareholders and the Board of Directors of BeiGene, Ltd.:
Opinion on Internal Control over Financial Reporting
We have audited BeiGene, Ltd.’s internal control over financial reporting as of December 31, 2018, based on criteria established in Internal Control — Integrated Framework issued by the Committee of Sponsoring Organizations of the Treadway Commission (2013 framework) (the "COSO criteria"). In our opinion, BeiGene, Ltd. (the "Company") maintained, in all material respects, effective internal control over financial reporting as of December 31, 2018, based on the COSO criteria.
We also have audited, in accordance with the standards of the Public Company Accounting Oversight Board (United States) ("PCAOB"), the consolidated balance sheets of the Company as of December 31, 2018 and 2017, the related consolidated statements of operations, comprehensive loss
,
cash flows and shareholders' equity for each of the three years in the period ended December 31, 2018, and the related notes and our report dated February 28, 2019 expressed an unqualified opinion thereon.
Basis for Opinion
The Company’s management is responsible for maintaining effective internal control over financial reporting and for its assessment of the effectiveness of internal control over financial reporting included in the accompanying Management’s Annual Report on Internal Control over Financial Reporting. Our responsibility is to express an opinion on the Company’s internal control over financial reporting based on our audit. We are a public accounting firm registered with the PCAOB and are required to be independent with respect to the Company in accordance with the U.S. federal securities laws and the applicable rules and regulations of the Securities and Exchange Commission and the PCAOB.
We conducted our audit in accordance with the standards of the PCAOB. Those standards require that we plan and perform the audit to obtain reasonable assurance about whether effective internal control over financial reporting was maintained in all material respects.
Our audit included obtaining an understanding of internal control over financial reporting, assessing the risk that a material weakness exists, testing and evaluating the design and operating effectiveness of internal control based on the assessed risk, and performing such other procedures as we considered necessary in the circumstances. We believe that our audit provides a reasonable basis for our opinion.
Definition and Limitations of Internal Control Over Financial Reporting
A company’s internal control over financial reporting is a process designed to provide reasonable assurance regarding the reliability of financial reporting and the preparation of financial statements for external purposes in accordance with generally accepted accounting principles. A company’s internal control over financial reporting includes those policies and procedures that (1) pertain to the maintenance of records that, in reasonable detail, accurately and fairly reflect the transactions and dispositions of the assets of the company; (2) provide reasonable assurance that transactions are recorded as necessary to permit preparation of financial statements in accordance with generally accepted accounting principles, and that receipts and expenditures of the company are being made only in accordance with authorizations of management and directors of the company; and (3) provide reasonable assurance regarding prevention or timely detection of unauthorized acquisition, use, or disposition of the company’s assets that could have a material effect on the financial statements.
Because of its inherent limitations, internal control over financial reporting may not prevent or detect misstatements. Also, projections of any evaluation of effectiveness to future periods are subject to the risk that controls may become inadequate because of changes in conditions, or that the degree of compliance with the policies or procedures may deteriorate.
/s/ Ernst & Young Hua Ming LLP
Beijing, People’s Republic of China
February 28, 2019
F-3
BEIGENE, LTD.
CONSOLIDATED BALANCE SHEETS
(Amounts in thousands of U.S. Dollars (“$”), except for number of shares and per share data)
|
|
|
As of December 31,
|
|||||
|
|
Note
|
2018
|
2017
|
||||
|
|
|
$
|
$
|
||||
|
Assets
|
|
|
|
|
|||
|
Current assets:
|
|
|
|
|
|||
|
Cash and cash equivalents
|
712,937
|
|
239,602
|
|
|||
|
Short-term restricted cash
|
5
|
14,544
|
|
—
|
|
||
|
Short-term investments
|
6
|
1,068,509
|
|
597,914
|
|
||
|
Accounts receivable
|
41,056
|
|
29,428
|
|
|||
|
Unbilled receivable
|
8,612
|
|
—
|
|
|||
|
Inventories
|
7
|
16,242
|
|
10,930
|
|
||
|
Prepaid expenses and other current assets
|
13
|
81,942
|
|
35,623
|
|
||
|
Total current assets
|
1,943,842
|
|
913,497
|
|
|||
|
Long-term restricted cash
|
5
|
13,232
|
|
—
|
|
||
|
Property and equipment, net
|
9
|
157,061
|
|
62,568
|
|
||
|
Land use right, net
|
10
|
45,058
|
|
12,465
|
|
||
|
Intangible assets, net
|
11
|
7,172
|
|
7,250
|
|
||
|
Goodwill
|
109
|
|
109
|
|
|||
|
Deferred tax assets
|
12
|
29,542
|
|
7,675
|
|
||
|
Other non-current assets
|
13
|
53,668
|
|
42,915
|
|
||
|
Total non-current assets
|
305,842
|
|
132,982
|
|
|||
|
Total assets
|
2,249,684
|
|
1,046,479
|
|
|||
|
Liabilities and shareholders' equity
|
|||||||
|
Current liabilities:
|
|||||||
|
Accounts payable
|
113,283
|
|
69,779
|
|
|||
|
Accrued expenses and other payables
|
13
|
100,414
|
|
49,598
|
|
||
|
Deferred revenue, current portion
|
18,140
|
|
12,233
|
|
|||
|
Tax payable
|
12
|
5,888
|
|
9,156
|
|
||
|
Current portion of long-term bank loan
|
15
|
8,727
|
|
9,222
|
|
||
|
Total current liabilities
|
246,452
|
|
149,988
|
|
|||
|
Non-current liabilities:
|
|||||||
|
Long-term bank loan
|
15
|
40,785
|
|
9,222
|
|
||
|
Shareholder loan
|
16
|
148,888
|
|
146,271
|
|
||
|
Deferred revenue, non-current portion
|
9,842
|
|
24,808
|
|
|||
|
Deferred tax liabilities
|
12
|
11,139
|
|
—
|
|
||
|
Other long-term liabilities
|
13
|
38,931
|
|
31,959
|
|
||
|
Total non-current liabilities
|
249,585
|
|
212,260
|
|
|||
|
Total liabilities
|
496,037
|
|
362,248
|
|
|||
|
Commitments and contingencies
|
24
|
|
|
||||
|
Equity:
|
|||||||
|
Ordinary shares, $0.0001 par value per share; 9,500,000,000 shares authorized; 776,263,184 and 592,072,330 shares issued and outstanding as of December 31, 2018 and 2017, respectively
|
77
|
|
59
|
|
|||
|
Additional paid-in capital
|
2,744,814
|
|
1,000,747
|
|
|||
|
Accumulated other comprehensive income (loss)
|
20
|
1,526
|
|
(480
|
)
|
||
|
Accumulated deficit
|
(1,007,215
|
)
|
(330,517
|
)
|
|||
|
Total BeiGene, Ltd. shareholders’ equity
|
1,739,202
|
|
669,809
|
|
|||
|
Noncontrolling interest
|
14,445
|
|
14,422
|
|
|||
|
Total equity
|
1,753,647
|
|
684,231
|
|
|||
|
Total liabilities and equity
|
2,249,684
|
|
1,046,479
|
|
|||
The accompanying notes are an integral part of these consolidated financial statements.
F-4
BEIGENE, LTD.
CONSOLIDATED STATEMENTS OF OPERATIONS
(Amounts in thousands of U.S. Dollars (“$”), except for number of shares and per share data)
|
|
|
Year Ended December 31,
|
||||||||
|
|
Note
|
2018
|
2017
|
2016
|
||||||
|
|
|
$
|
$
|
$
|
||||||
|
Revenue
|
|
|
|
|
|
|
|
|||
|
Product revenue, net
|
17
|
130,885
|
|
24,428
|
|
—
|
|
|||
|
Collaboration revenue
|
3
|
67,335
|
|
213,959
|
|
1,070
|
|
|||
|
Total revenues
|
198,220
|
|
238,387
|
|
1,070
|
|
||||
|
Expenses
|
||||||||||
|
Cost of sales - product
|
(28,705
|
)
|
(4,974
|
)
|
—
|
|
||||
|
Research and development
|
(679,005
|
)
|
(269,018
|
)
|
(98,033
|
)
|
||||
|
Selling, general and administrative
|
(195,385
|
)
|
(62,602
|
)
|
(20,097
|
)
|
||||
|
Amortization of intangible assets
|
(894
|
)
|
(250
|
)
|
—
|
|
||||
|
Total expenses
|
(903,989
|
)
|
(336,844
|
)
|
(118,130
|
)
|
||||
|
Loss from operations
|
(705,769
|
)
|
(98,457
|
)
|
(117,060
|
)
|
||||
|
Interest income (expense), net
|
13,947
|
|
(4,108
|
)
|
383
|
|
||||
|
Changes in fair value of financial instruments
|
14
|
—
|
|
—
|
|
(1,514
|
)
|
|||
|
Other income (expense), net
|
1,993
|
|
11,501
|
|
(972
|
)
|
||||
|
Loss before income tax expense
|
(689,829
|
)
|
(91,064
|
)
|
(119,163
|
)
|
||||
|
Income tax benefit (expense)
|
12
|
15,796
|
|
(2,235
|
)
|
(54
|
)
|
|||
|
Net loss
|
(674,033
|
)
|
(93,299
|
)
|
(119,217
|
)
|
||||
|
Less: net loss attributable to noncontrolling interests
|
(264
|
)
|
(194
|
)
|
—
|
|
||||
|
Net loss attributable to BeiGene, Ltd.
|
(673,769
|
)
|
(93,105
|
)
|
(119,217
|
)
|
||||
|
Net loss per share attributable to BeiGene, Ltd., basic and diluted
|
18
|
(0.93
|
)
|
(0.17
|
)
|
(0.30
|
)
|
|||
|
Weighted-average shares outstanding, basic and diluted
|
18
|
720,753,819
|
|
543,185,460
|
|
403,619,446
|
|
|||
|
Net loss per American Depositary Share (“ADS”), basic and diluted
|
(12.15
|
)
|
(2.23
|
)
|
(3.84
|
)
|
||||
|
Weighted-average ADSs outstanding, basic and diluted
|
55,442,601
|
|
41,783,497
|
|
31,047,650
|
|
||||
The accompanying notes are an integral part of these consolidated financial statements.
F-5
BEIGENE, LTD.
CONSOLIDATED STATEMENTS OF COMPREHENSIVE LOSS
(Amounts in thousands of U.S. Dollars (“$”), except for number of shares and per share data)
|
|
Year Ended December 31,
|
|||||||
|
|
2018
|
2017
|
2016
|
|||||
|
|
$
|
$
|
$
|
|||||
|
Net loss
|
(674,033
|
)
|
(93,299
|
)
|
(119,217
|
)
|
||
|
Other comprehensive loss, net of tax of nil:
|
||||||||
|
Foreign currency translation adjustments
|
(478
|
)
|
851
|
|
(245
|
)
|
||
|
Unrealized holding gain (loss), net
|
2,133
|
|
(296
|
)
|
1,108
|
|
||
|
Comprehensive loss
|
(672,378
|
)
|
(92,744
|
)
|
(118,354
|
)
|
||
|
Less: comprehensive loss attributable to noncontrolling interests
|
(352
|
)
|
(105
|
)
|
—
|
|
||
|
Comprehensive loss attributable to BeiGene, Ltd.
|
(672,026
|
)
|
(92,639
|
)
|
(118,354
|
)
|
||
The accompanying notes are an integral part of these consolidated financial statements.
F-6
BEIGENE, LTD.
CONSOLIDATED STATEMENTS OF CASH FLOWS
(Amounts in thousands of U.S. Dollars (“$”), except for number of shares and per share data)
|
|
|
Year Ended December 31,
|
||||||||
|
|
Note
|
2018
|
2017
|
2016
|
||||||
|
|
|
$
|
$
|
$
|
||||||
|
Cash flows from operating activities:
|
|
|
|
|
||||||
|
Net loss
|
(674,033
|
)
|
(93,299
|
)
|
(119,217
|
)
|
||||
|
Adjustments to reconcile net loss to net cash used in operating activities:
|
||||||||||
|
Depreciation and amortization expense
|
10,388
|
|
4,758
|
|
1,909
|
|
||||
|
Share-based compensation expenses
|
19
|
87,127
|
|
42,863
|
|
10,625
|
|
|||
|
Acquired in-process research and development
|
70,000
|
|
—
|
|
—
|
|
||||
|
Changes in fair value of financial instruments
|
—
|
|
—
|
|
1,514
|
|
||||
|
Loss on disposal of property and equipment
|
126
|
|
85
|
|
—
|
|
||||
|
Non-cash interest expense
|
7,820
|
|
7,035
|
|
121
|
|
||||
|
Deferred income tax benefits
|
(21,949
|
)
|
(5,845
|
)
|
(768
|
)
|
||||
|
Disposal (gain) loss on available-for-sale securities
|
(1,948
|
)
|
(44
|
)
|
1,415
|
|
||||
|
Non-cash amortization of bond discount
|
(8,034
|
)
|
—
|
|
—
|
|
||||
|
Changes in operating assets and liabilities:
|
||||||||||
|
Accounts receivable
|
(11,628
|
)
|
(29,428
|
)
|
—
|
|
||||
|
Unbilled receivable
|
7,695
|
|
—
|
|
—
|
|
||||
|
Inventories
|
(5,312
|
)
|
(10,930
|
)
|
—
|
|
||||
|
Prepaid expenses and other current assets
|
(46,302
|
)
|
(28,880
|
)
|
(2,070
|
)
|
||||
|
Other non-current assets
|
(40,228
|
)
|
(29,701
|
)
|
112
|
|
||||
|
Accounts payable
|
23,470
|
|
55,298
|
|
2,707
|
|
||||
|
Accrued expenses and other payables
|
50,543
|
|
24,978
|
|
13,946
|
|
||||
|
Tax payable
|
(3,355
|
)
|
7,426
|
|
804
|
|
||||
|
Deferred revenue
|
(9,059
|
)
|
37,041
|
|
(1,070
|
)
|
||||
|
Other long-term liabilities
|
16,962
|
|
31,395
|
|
459
|
|
||||
|
Net cash (used in) provided by operating activities
|
(547,717
|
)
|
12,752
|
|
(89,513
|
)
|
||||
|
Cash flows from investing activities:
|
||||||||||
|
Purchases of property and equipment
|
(70,283
|
)
|
(46,374
|
)
|
(23,502
|
)
|
||||
|
Purchase of intangible assets
|
(553
|
)
|
—
|
|
—
|
|
||||
|
Payment for asset acquisition, net of cash acquired
|
4
|
(38,298
|
)
|
—
|
|
—
|
|
|||
|
Payment for the acquisition of land use right
|
—
|
|
(12,354
|
)
|
—
|
|
||||
|
Cash acquired in business combination, net of cash paid
|
4
|
—
|
|
19,916
|
|
—
|
|
|||
|
Purchases of investments
|
(2,635,686
|
)
|
(741,296
|
)
|
(382,093
|
)
|
||||
|
Proceeds from sale or maturity of available-for-sale securities
|
2,177,207
|
|
423,789
|
|
183,743
|
|
||||
|
Purchase of in-process research and development
|
(70,000
|
)
|
—
|
|
—
|
|
||||
|
Proceeds from disposal of property and equipment
|
—
|
|
—
|
|
4
|
|
||||
|
Net cash used in investing activities
|
(637,613
|
)
|
(356,319
|
)
|
(221,848
|
)
|
||||
|
Cash flows from financing activities:
|
||||||||||
|
Proceeds from public offering, net of underwriter discount
|
21
|
758,001
|
|
189,191
|
|
368,877
|
|
|||
|
Payment of public offering cost
|
21
|
(414
|
)
|
(674
|
)
|
(2,218
|
)
|
|||
|
Proceeds from public offering and HK IPO, net of underwriter discount
|
21
|
875,368
|
|
—
|
|
—
|
|
|||
|
Payment of public offering and HK IPO costs
|
21
|
(5,659
|
)
|
—
|
|
—
|
|
|||
|
Proceeds from sale of ordinary shares, net of cost
|
21
|
—
|
|
149,928
|
|
—
|
|
|||
|
Proceeds from long-term loan
|
15
|
42,315
|
|
—
|
|
12,048
|
|
|||
|
Repayment of long-term loan
|
(8,736
|
)
|
—
|
|
—
|
|
||||
|
Proceeds from short-term loan
|
—
|
|
2,470
|
|
—
|
|
||||
|
Repayment of short-term loan
|
—
|
|
(2,470
|
)
|
—
|
|
||||
|
Capital contribution from noncontrolling interest
|
—
|
|
14,527
|
|
—
|
|
||||
|
Proceeds from shareholder loan
|
16
|
—
|
|
132,757
|
|
—
|
|
|||
|
Proceeds from exercise of warrants and rental deferral option
|
21
|
—
|
|
—
|
|
2,115
|
|
|||
|
Proceeds from option exercises
|
29,662
|
|
4,627
|
|
80
|
|
||||
|
Net cash provided by financing activities
|
1,690,537
|
|
490,356
|
|
380,902
|
|
||||
|
Effect of foreign exchange rate changes, net
|
(4,096
|
)
|
5,299
|
|
104
|
|
||||
|
Net increase in cash, cash equivalents, and restricted cash
|
501,111
|
|
152,088
|
|
69,645
|
|
||||
|
Cash, cash equivalents, and restricted cash, beginning of year
|
239,602
|
|
87,514
|
|
17,869
|
|
||||
|
Cash, cash equivalents, and restricted cash, end of year
|
740,713
|
|
239,602
|
|
87,514
|
|
||||
F-7
|
|
|
Year Ended December 31,
|
||||||||
|
|
Note
|
2018
|
2017
|
2016
|
||||||
|
|
|
$
|
$
|
$
|
||||||
|
Supplemental cash flow disclosures:
|
||||||||||
|
Cash and cash equivalents
|
712,937
|
|
239,602
|
|
87,514
|
|
||||
|
Short-term restricted cash
|
14,544
|
|
—
|
|
—
|
|
||||
|
Long-term restricted cash
|
13,232
|
|
—
|
|
—
|
|
||||
|
Income taxes paid
|
12,361
|
|
29,286
|
|
25
|
|
||||
|
Interest paid
|
2,209
|
|
1,260
|
|
826
|
|
||||
|
Non-cash activities:
|
||||||||||
|
Discount provided on sale of ordinary shares for business combination
|
4
|
—
|
|
23,606
|
|
—
|
|
|||
|
Conversion of senior promissory note
|
—
|
|
—
|
|
14,693
|
|
||||
|
Conversion of deferred rental
|
—
|
|
—
|
|
980
|
|
||||
|
Conversion of convertible preferred shares
|
—
|
|
—
|
|
176,084
|
|
||||
|
Exercise of warrants and option
|
—
|
|
—
|
|
3,687
|
|
||||
|
Follow-on public offering costs accrued in accounts payable
|
—
|
|
—
|
|
269
|
|
||||
|
Acquisitions of equipment included in accounts payable
|
22,105
|
|
2,215
|
|
2,153
|
|
||||
|
Purchase of in-process research and development included in accounts payable
|
19,000
|
|
—
|
|
—
|
|
||||
|
Changes in operating assets and liabilities adjusted through accumulated deficit
|
2,291
|
|
—
|
|
—
|
|
||||
The accompanying notes are an integral part of these consolidated financial statem
ent
s.
F-8
BEIGENE, LTD.
CONSOLIDATED STATEMENTS OF SHAREHOLDERS’ EQUITY
(Amounts in thousands of U.S. Dollars (“$”), except for number of shares and per share data)
|
|
Attributable to BeiGene, Ltd.
|
|
|
||||||||||||||||||||
|
|
Ordinary Shares
|
Additional
Paid-In
Capital
|
Accumulated
OCI
|
Accumulated
Deficit
|
Total
|
Non-
Controlling
Interests
|
|
||||||||||||||||
|
|
Shares
|
Amount
|
Total
|
||||||||||||||||||||
|
Balance at December 31, 2015
|
116,174,094
|
|
12
|
|
18,227
|
|
(1,809
|
)
|
(118,195
|
)
|
(101,765
|
)
|
—
|
|
(101,765
|
)
|
|||||||
|
Issuance of ordinary shares in connection with initial public offering
|
98,670,000
|
|
10
|
|
166,127
|
|
—
|
|
—
|
|
166,137
|
|
—
|
|
166,137
|
|
|||||||
|
Issuance of ordinary shares in connection with follow-on public offering
|
86,206,250
|
|
9
|
|
198,617
|
|
—
|
|
—
|
|
198,626
|
|
—
|
|
198,626
|
|
|||||||
|
Conversion of senior promissory note (Note 21)
|
7,942,314
|
|
1
|
|
14,692
|
|
—
|
|
—
|
|
14,693
|
|
—
|
|
14,693
|
|
|||||||
|
Exercise of warrants in connection with convertible promissory note (Note 21)
|
621,637
|
|
—
|
|
1,513
|
|
—
|
|
—
|
|
1,513
|
|
—
|
|
1,513
|
|
|||||||
|
Exercise of option to purchase shares by rental deferred (note 21)
|
1,451,586
|
|
—
|
|
3,519
|
|
—
|
|
—
|
|
3,519
|
|
—
|
|
3,519
|
|
|||||||
|
Exercise of warrants by Baker Bros. (Note 21)
|
2,592,593
|
|
—
|
|
1,750
|
|
—
|
|
—
|
|
1,750
|
|
—
|
|
1,750
|
|
|||||||
|
Issuance of shares reserved for share options exercise
|
271,284
|
|
—
|
|
—
|
|
—
|
|
—
|
|
—
|
|
—
|
|
—
|
|
|||||||
|
Conversion of preferred shares to ordinary shares (Note 21)
|
199,990,641
|
|
20
|
|
176,064
|
|
—
|
|
—
|
|
176,084
|
|
—
|
|
176,084
|
|
|||||||
|
Share-based compensation
|
1,913,210
|
|
—
|
|
10,704
|
|
—
|
|
—
|
|
10,704
|
|
—
|
|
10,704
|
|
|||||||
|
Net loss
|
—
|
|
—
|
|
—
|
|
—
|
|
(119,217
|
)
|
(119,217
|
)
|
—
|
|
(119,217
|
)
|
|||||||
|
Other comprehensive loss
|
—
|
|
—
|
|
—
|
|
863
|
|
—
|
|
863
|
|
—
|
|
863
|
|
|||||||
|
Balance at December 31, 2016
|
515,833,609
|
|
52
|
|
591,213
|
|
(946
|
)
|
(237,412
|
)
|
352,907
|
|
—
|
|
352,907
|
|
|||||||
|
Issuance of ordinary shares in secondary follow-on offering, net of transaction costs
|
36,851,750
|
|
4
|
|
188,513
|
|
—
|
|
—
|
|
188,517
|
|
—
|
|
188,517
|
|
|||||||
|
Proceeds from sale of ordinary shares, net of cost
|
32,746,416
|
|
3
|
|
149,925
|
|
—
|
|
—
|
|
149,928
|
|
—
|
|
149,928
|
|
|||||||
|
Discount on the sale of ordinary shares
|
—
|
|
—
|
|
23,606
|
|
—
|
|
—
|
|
23,606
|
|
—
|
|
23,606
|
|
|||||||
|
Contributions from shareholders (Note 8)
|
—
|
|
—
|
|
—
|
|
—
|
|
—
|
|
—
|
|
14,527
|
|
14,527
|
|
|||||||
|
Share-based compensation
|
—
|
|
—
|
|
42,863
|
|
—
|
|
—
|
|
42,863
|
|
—
|
|
42,863
|
|
|||||||
|
Issuance of shares reserved for share option exercises
|
787,571
|
|
—
|
|
—
|
|
—
|
|
—
|
|
—
|
|
—
|
|
—
|
|
|||||||
|
Exercise of options
|
5,852,984
|
|
—
|
|
4,627
|
|
—
|
|
—
|
|
4,627
|
|
—
|
|
4,627
|
|
|||||||
|
Other comprehensive income
|
—
|
|
—
|
|
—
|
|
466
|
|
—
|
|
466
|
|
89
|
|
555
|
|
|||||||
|
Net loss
|
—
|
|
—
|
|
—
|
|
—
|
|
(93,105
|
)
|
(93,105
|
)
|
(194
|
)
|
(93,299
|
)
|
|||||||
|
Balance at December 31, 2017
|
592,072,330
|
|
59
|
|
1,000,747
|
|
(480
|
)
|
(330,517
|
)
|
669,809
|
|
14,422
|
|
684,231
|
|
|||||||
|
Adjustment to opening balance of equity
|
—
|
|
—
|
|
—
|
|
263
|
|
(2,929
|
)
|
(2,666
|
)
|
375
|
|
(2,291
|
)
|
|||||||
|
Balance at January 1, 2018
|
592,072,330
|
|
59
|
|
1,000,747
|
|
(217
|
)
|
(333,446
|
)
|
667,143
|
|
14,797
|
|
681,940
|
|
|||||||
|
Issuance of ordinary shares in connection with follow-on public offering
|
102,970,400
|
|
10
|
|
757,577
|
|
—
|
|
—
|
|
757,587
|
|
—
|
|
757,587
|
|
|||||||
|
Issuance of ordinary shares in connection with global offering and HK IPO
|
65,600,000
|
|
7
|
|
869,702
|
|
—
|
|
—
|
|
869,709
|
|
—
|
|
869,709
|
|
|||||||
|
Issuance of shares reserved for share option exercises
|
1,299,186
|
|
—
|
|
—
|
|
—
|
|
—
|
|
—
|
|
—
|
|
—
|
|
|||||||
|
Share-based compensation
|
—
|
|
—
|
|
87,127
|
|
—
|
|
—
|
|
87,127
|
|
—
|
|
87,127
|
|
|||||||
|
Exercise of options and release of RSUs
|
14,321,268
|
|
1
|
|
29,661
|
|
—
|
|
—
|
|
29,662
|
|
—
|
|
29,662
|
|
|||||||
|
Other comprehensive income
|
—
|
|
—
|
|
—
|
|
1,743
|
|
—
|
|
1,743
|
|
(88
|
)
|
1,655
|
|
|||||||
|
Net loss
|
—
|
|
—
|
|
—
|
|
—
|
|
(673,769
|
)
|
(673,769
|
)
|
(264
|
)
|
(674,033
|
)
|
|||||||
|
Balance at December 31, 2018
|
776,263,184
|
|
77
|
|
2,744,814
|
|
1,526
|
|
(1,007,215
|
)
|
1,739,202
|
|
14,445
|
|
1,753,647
|
|
|||||||
The accompanying notes are an integral part of these consolidated financial statements.
F-9
BEIGENE, LTD.
NOTES TO THE CONSOLIDATED FINANCIAL STATEMENTS
FOR THE YEARS ENDED DECEMBER 31, 2018, 2017 AND 2016
(Amounts in thousands of U.S. Dollar (“$”) and Renminbi (“RMB”),
except for number of shares and per share data)
1. Organization
BeiGene, Ltd. (the “Company”) is a commercial-stage biotechnology company focused on developing and commercializing innovative molecularly-targeted and immuno-oncology drugs for the treatment of cancer. The Company’s internally-developed lead drug candidates are currently in late-stage clinical trials, and it is marketing three in-licensed drugs in China from which it has been generating product revenue since September 2017.
The Company was incorporated under the laws of the Cayman Islands as an exempted company with limited liability on October 28, 2010. The Company completed an initial public offering (“IPO”) on the NASDAQ Global Select Market on February 8, 2016 and has completed subsequent follow-on public offerings and a sale of ordinary shares to Celgene Switzerland LLC (“Celgene Switzerland”) in a business development transaction, as described in Note 21, Shareholders’ Equity. On August 8, 2018, the Company completed an IPO on the Stock Exchange of Hong Kong Limited (“HKEx”) and a global follow-on public offering in which it raised approximately
$869,709
in net proceeds, after deducting underwriting discounts and commissions and offering expenses. Effective August 8, 2018, the Company is dual-listed in both the United States and Hong Kong.
As at
December 31, 2018
, the Company’s subsidiaries are as follows:
|
Name of Company
|
Place of Incorporation
|
Date of
Incorporation
|
Percentage of
Ownership by
the Company
|
Principal Activities
|
|||||
|
BeiGene 101
|
Cayman Islands
|
August 30, 2012
|
100
|
%
|
Medical and pharmaceutical research
|
||||
|
BeiGene AUS Pty Ltd. ("BeiGene Australia")
|
Australia
|
July 15, 2013
|
100
|
%
|
Clinical trial activities
|
||||
|
BeiGene (Beijing) Co., Ltd. ("BeiGene Beijing")
|
The People’s Republic of China (“PRC” or “China”)
|
January 24, 2011
|
100
|
%
|
Medical and pharmaceutical research
|
||||
|
BeiGene Biologics Co., Ltd. ("BeiGene Biologics")
|
PRC
|
January 25, 2017
|
95
|
%
|
Biologics manufacturing
|
||||
|
BeiGene Guangzhou Biologics Manufacturing Co., Ltd. ("BeiGene Guangzhou Factory")*
|
PRC
|
March 3, 2017
|
95
|
%
|
Biologics manufacturing
|
||||
|
BeiGene (Guangzhou) Co., Ltd. (“BeiGene Guangzhou”)
|
PRC
|
July 11, 2017
|
100
|
%
|
Medical and pharmaceutical research
|
||||
|
BeiGene (Hong Kong) Co., Limited. ("BeiGene HK")
|
Hong Kong
|
November 22, 2010
|
100
|
%
|
Investment holding
|
||||
|
Beijing Innerway Bio-tech Co., Ltd. ("Innerway")
|
PRC
|
August 9, 2004
|
100
|
%
|
Medical and pharmaceutical research and manufacturing
|
||||
|
BeiGene Ireland Limited ("BeiGene Ireland")
|
Republic of Ireland
|
August 11, 2017
|
100
|
%
|
Clinical trial activities
|
||||
|
BeiGene Pharmaceuticals (Guangzhou) Co., Ltd. ("BeiGene Pharmaceutical (Guangzhou)")
|
PRC
|
April 14, 1999
|
100
|
%
|
Medical and pharmaceutical research and manufacturing
|
||||
|
BeiGene Pharmaceutical (Shanghai) Co., Ltd. ("BeiGene Pharmaceutical (Shanghai)")
|
PRC
|
December 15, 2009
|
100
|
%
|
Medical and pharmaceutical consulting,
marketing and promotional services
|
||||
|
BeiGene (Shanghai) Co., Ltd. (“BeiGene Shanghai”)*
|
PRC
|
September 11, 2015
|
95
|
%
|
Medical and pharmaceutical research
|
||||
|
BeiGene (Suzhou) Co., Ltd. (“BeiGene Suzhou”)
|
PRC
|
April 9, 2015
|
100
|
%
|
Medical and pharmaceutical research and manufacturing
|
||||
|
BeiGene Switzerland GmbH (“BeiGene Switzerland”)
|
Switzerland
|
September 1, 2017
|
100
|
%
|
Clinical trial activities and commercial
|
||||
|
BeiGene UK, Ltd. ("BeiGene UK")
|
United Kingdom
|
December 14, 2018
|
100
|
%
|
Research, development, manufacture and distribution or licensing of pharmaceutical and related products
|
||||
|
BeiGene USA, Inc. ("BeiGene USA")
|
United States
|
July 8, 2015
|
100
|
%
|
Clinical trial activities
|
||||
*
Wholly-owned by BeiGene Biologics.
2. Summary of Significant Accounting Policies
Basis of Presentation and Principles of Consolidation
The consolidated financial statements of the Company have been prepared in accordance with U.S. generally accepted accounting principles (“GAAP”). The consolidated financial statements include the financial statements of the Company and its subsidiaries. All significant intercompany transactions and balances between the Company and its wholly-owned subsidiaries are eliminated upon consolidation.
Noncontrolling interests are recognized to reflect the portion of the equity of subsidiaries which are not attributable, directly or indirectly, to the controlling shareholders. The Company consolidates its interests in its joint venture, BeiGene Biologics, under the voting model and recognizes the minority shareholder's equity interest as a noncontrolling interest in its consolidated financial statements (as described in Note 8).
F-10
BEIGENE, LTD.
NOTES TO THE CONSOLIDATED FINANCIAL STATEMENTS
FOR THE YEARS ENDED DECEMBER 31, 2018, 2017 AND 2016
(Amounts in thousands of U.S. Dollar (“$”) and Renminbi (“RMB”),
except for number of shares and per share data)
Use of Estimates
The preparation of the consolidated financial statements in conformity with GAAP requires management to make estimates and assumptions that affect the reported amounts of assets and liabilities, and disclosures of contingent assets and liabilities at the date of the financial statements and the reported amounts of revenues and expenses during the period. Areas where management uses subjective judgment include, but are not limited to, estimating the useful lives of long-lived assets, estimating variable consideration in product sales and collaboration revenue arrangements, identifying separate accounting units and the standalone selling price of each performance obligation in the Company’s revenue arrangements, estimating the fair value of net assets acquired in business combinations, assessing the impairment of long-lived assets, share-based compensation expenses, realizability of deferred tax assets, estimating uncertain tax positions and the fair value of financial instruments. Management bases the estimates on historical experience, known trends and various other assumptions that are believed to be reasonable, the results of which form the basis for making judgments about the carrying values of assets and liabilities. Actual results could differ from these estimates.
Functional Currency and Foreign Currency Translation
Functional currency
The determination of the respective functional currency is based on the criteria of Accounting Standard Codification (“ASC”) 830, Foreign Currency Matters. The functional currency of the Company and all non-PRC subsidiaries is the United States dollar (“$” or “U.S. dollar”). The Company’s PRC subsidiaries determined their functional currencies to be RMB. The Company uses the U.S. dollar as its reporting currency.
Foreign currency translation
For subsidiaries whose functional currencies are not the U.S. dollar, the Company uses the average exchange rate for the year and the exchange rate at the balance sheet date, to translate the operating results and financial position to U.S. dollar, the reporting currency, respectively. Translation differences are recorded in accumulated other comprehensive loss, a component of shareholders’ equity. Transactions denominated in currencies other than the functional currency are translated into the functional currency at the exchange rates prevailing on the transaction dates. Foreign currency denominated financial assets and liabilities are remeasured at the exchange rates prevailing at the balance sheet date. Exchange gains and losses are included in the consolidated statements of comprehensive loss.
Cash, Cash Equivalents and Restricted Cash
Cash and cash equivalents
Cash and cash equivalents consist of cash on hand and bank deposits, which are unrestricted as to withdrawal and use. The Company considers all highly liquid investments with an original maturity date of three months or less at the date of purchase to be cash equivalents. Cash equivalents which consist primarily of money market funds are stated at fair value.
Restricted cash
Restricted cash consists of the secured deposits held in designated banks for issuance of letters of credit and import duty taxes, and cash deposits as security for long-term bank loans.
Accounts Receivable
Trade accounts receivable are recorded at their invoiced amounts, net of allowances for doubtful accounts. An allowance for doubtful accounts is recorded when the collection of the full amount is no longer probable. In evaluating the collectability of receivable balances, the Company considers specific evidence including aging of the receivable, the customer's payment history, its current creditworthiness and current economic trends. Accounts receivable are written off after all collection efforts have ceased. The Company regularly reviews the adequacy and appropriateness of any allowance for doubtful accounts.
No
allowance for doubtful accounts was recorded as of
December 31, 2018
.
F-11
BEIGENE, LTD.
NOTES TO THE CONSOLIDATED FINANCIAL STATEMENTS
FOR THE YEARS ENDED DECEMBER 31, 2018, 2017 AND 2016
(Amounts in thousands of U.S. Dollar (“$”) and Renminbi (“RMB”),
except for number of shares and per share data)
Inventory
Inventories are stated at the lower of cost and net realizable value, with cost determined on a weighted-average basis. The Company periodically analyzes its inventory levels, and writes down inventory that has become obsolete, inventory that has a cost basis in excess of its estimated realizable value and inventory in excess of expected sales requirements as cost of product sales. The determination of whether inventory costs will be realizable requires estimates by management. If actual market conditions are less favorable than projected by management, additional write-downs of inventory may be required, which would be recorded in the consolidated statements of operations. There have been no write-downs or reserves against inventory to date.
Short-Term Investments
Investments with original maturities of greater than three months at the date of purchase and less than one year from the date of the balance sheet are classified as short-term. Short-term debt investments held to maturity are carried at amortized cost when the Company has the ability and positive intent to hold these securities until maturity. When the Company does not have the ability or positive intent to hold short-term debt investments until maturity, these securities are classified as available-for-sale. None of the Company’s fixed maturity securities met the criteria for held-to-maturity classification at
December 31, 2018
and
2017
.
Available-for-sale securities are stated at fair value, with the unrealized gains and losses, net of tax, reported in other comprehensive loss. The net carrying value of debt securities classified as available-for-sale is adjusted for amortization of premiums and accretion of discounts to maturity. Such amortization is computed using the effective interest method and included in interest income. Interest and dividends are included in interest income.
When the fair value of a debt security classified as available-for-sale is less than its amortized cost, the Company assesses whether or not: (i) it has the intent to sell the security or (ii) it is more likely than not that the Company will be required to sell the security before its anticipated recovery. If either of these conditions is met, the Company must recognize an other-than-temporary impairment through earnings for the difference between the debt security’s amortized cost basis and its fair value. No impairment losses were recorded for any periods presented.
The cost of securities sold is based on the specific identification method.
Property and Equipment
Property and equipment are stated at cost, less accumulated depreciation and amortization. Depreciation is computed using the straight-line method over the estimated useful lives of the respective assets as follows:
|
|
Useful Life
|
|
Building
|
20 years
|
|
Office Equipment
|
5 years
|
|
Electronic Equipment
|
3 years
|
|
Manufacturing equipment
|
3 to 10 years
|
|
Laboratory Equipment
|
3 to 5 years
|
|
Computer Software
|
3 to 5 years
|
|
Leasehold Improvements
|
Lesser of useful life or lease term
|
Land Use Right, Net
All land in the PRC is owned by the PRC government. The PRC government may sell land use rights for a specified period of time. Land use rights represent lease prepayments to the PRC government and are carried at cost less accumulated amortization. Land use rights are amortized on a straight-line basis over the shorter of the estimated usage periods or the terms of the land use right.
F-12
BEIGENE, LTD.
NOTES TO THE CONSOLIDATED FINANCIAL STATEMENTS
FOR THE YEARS ENDED DECEMBER 31, 2018, 2017 AND 2016
(Amounts in thousands of U.S. Dollar (“$”) and Renminbi (“RMB”),
except for number of shares and per share data)
In 2017, the Company acquired a land use right from the local Bureau of Land and Resources in Guangzhou for the purpose of constructing and operating the biologics manufacturing facility in Guangzhou. The Guangzhou land use right is being amortized over the terms of the land use right, which is
50
years.
In 2018, the Company acquired a second land use right in conjunction with the Innerway asset acquisition (see Note 4). The land use right is being amortized over the remaining term of the land use right, which is
36 years
.
Business Combinations
The Company accounts for its business combinations using the acquisition method of accounting in accordance with ASC topic 805 (“ASC 805”): Business Combinations. The acquisition method of accounting requires all of the following steps: (i) identifying the acquirer, (ii) determining the acquisition date, (iii) recognizing and measuring the identifiable assets acquired, the liabilities assumed, and any noncontrolling interest in the acquiree, and (iv) recognizing and measuring goodwill or a gain from a bargain purchase. The consideration transferred in a business combination is measured as the aggregate of the fair values at the date of exchange of the assets given, liabilities incurred, and equity instruments issued as well as the contingent considerations and all contractual contingencies as of the acquisition date.
The costs directly attributable to the acquisition are expensed as incurred. Identifiable assets, liabilities and contingent liabilities acquired or assumed are measured separately at their fair value as of the acquisition date, irrespective of the extent of any noncontrolling interests. The excess of (i) acquisition consideration, fair value of the noncontrolling interests and acquisition date fair value of any previously held equity interest in the acquiree over (ii) the fair value of the identifiable net assets of the acquiree, is recorded as goodwill. If the cost of acquisition is less than the fair value of the net assets of the subsidiary acquired, the difference is recognized directly in the consolidated statements of operations as a gain.
The Company allocates the fair value of purchase consideration to the tangible assets acquired, liabilities assumed and intangible assets acquired based on their estimated fair values. The excess of the fair value of purchase consideration over the fair values of these identifiable assets and liabilities is recorded as goodwill. Such valuations require management to make significant estimates and assumptions, especially with respect to intangible assets. Significant estimates in valuing certain intangible assets may include, but are not limited to, future expected cash flows from acquired assets, timing and probability of success of clinical events and regulatory approvals, and assumptions on useful lives and discount rates. Management's estimates of fair value are based upon assumptions believed to be reasonable, but which are inherently uncertain and unpredictable and, as a result, actual results may differ from estimates. Additional information, such as that related to income tax and other contingencies, existing as of the acquisition date but unknown to us may become known during the remainder of the measurement period, not to exceed
one
year from the acquisition date, which may result in changes to the amounts and allocations recorded.
Acquisitions that do not meet the accounting definition of a business combination are accounted for as asset acquisitions. For transactions determined to be asset acquisitions, the Company allocates the total cost of the acquisition, including transaction costs, to the net assets acquired based on their relative fair values.
Goodwill and Other Intangible Assets
Goodwill is an asset representing the future economic benefits arising from other assets acquired in a business combination that are not individually identified and separately recognized. The Company allocates the cost of an acquired entity to the assets acquired and liabilities assumed based on their estimated fair values at the date of acquisition. The excess of the purchase price for acquisitions over the fair value of the net assets acquired, including other intangible assets, is recorded as goodwill. Goodwill is not amortized, but is tested for impairment at least annually or more frequently if events or changes in circumstances would indicate a potential impairment.
The Company has elected to first assess qualitative factors to determine whether it is more likely than not that the fair value of the Company's reporting unit is less than its carrying amount, including goodwill. The qualitative assessment includes the Company's evaluation of relevant events and circumstances affecting the Company's single reporting unit, including macroeconomic, industry, and market conditions, the Company's overall financial performance, and trends in the market price of the Company's ADSs. If qualitative factors indicate that it is more likely than not that the Company's reporting unit’s fair value is less than its carrying amount, then the Company will perform the quantitative impairment test by comparing the
F-13
BEIGENE, LTD.
NOTES TO THE CONSOLIDATED FINANCIAL STATEMENTS
FOR THE YEARS ENDED DECEMBER 31, 2018, 2017 AND 2016
(Amounts in thousands of U.S. Dollar (“$”) and Renminbi (“RMB”),
except for number of shares and per share data)
reporting unit’s carrying amount, including goodwill, to its fair value. If the carrying amount of the reporting unit exceeds its fair value, an impairment loss will be recognized in an amount equal to that excess. For the year ended
December 31, 2018
, the Company determined that there were no indicators of impairment of our goodwill.
Intangible assets acquired through business combinations are recognized as assets separate from goodwill and are measured at fair value upon acquisition. Intangible assets acquired in transactions that are not business combinations are recorded at the allocated portion of total consideration transferred based on their relative fair value in relation to net assets acquired. Acquired identifiable intangible assets consist of distribution rights for approved cancer therapies licensed from Celgene Corporation ("Celgene"), ABRAXANE®, REVLIMID®, and VIDAZA®, and its investigational agent CC-122, and are amortized on a straight-line basis over the estimated useful lives of the assets, which is
10
years, and the trading license which represents the Guangzhou drug distribution license acquired on September 21, 2018 (see Note 4). The Company is amortizing the trading license over the remainder of the license term through February 2020.
Intangible assets with finite useful lives are tested for impairment when events or circumstances occur that could indicate that the carrying amount of an asset may not be recoverable. When these events occur, the Company evaluates the recoverability of the intangible assets by comparing the carrying amount of the assets to the future undiscounted cash flows expected to result from the use of the assets and their eventual disposition. If the sum of the expected undiscounted cash flows is less than the carrying amount of the assets, the Company recognizes an impairment loss based on the excess of the carrying amount of the assets over their fair value. Fair value is generally determined by discounting the cash flows expected to be generated by the assets, when the market prices are not readily available. For the years ended
December 31, 2018
and December 31, 2017, the Company determined that there were
no
indicators of impairment of its other intangible assets.
Impairment of Long-Lived Assets
Long-lived assets are reviewed for impairment in accordance with authoritative guidance for impairment or disposal of long-lived assets. Long-lived assets are reviewed for events or changes in circumstances, which indicate that their carrying value may not be recoverable. Long-lived assets are reported at the lower of carrying amount or fair value less cost to sell. For the years ended
December 31, 2018
,
2017
and
2016
, there was
no
impairment of the value of the Company’s long-lived assets.
Fair Value Measurements
Fair value of financial instruments
Financial instruments of the Company primarily include cash and cash equivalents, restricted cash, short-term investments, accounts receivable, long-term bank loan, Shareholder Loan (as defined in Note 16) and accounts payable. As of
December 31, 2018
and
2017
, the carrying values of cash and cash equivalents, restricted cash, accounts receivable and accounts payable approximated their fair values due to the short-term maturity of these instruments. The short-term investments represented the available-for-sale debt securities and time deposits. The available-for-sale debt securities are recorded at fair value based on quoted prices in active markets with unrealized gain or loss recorded in other comprehensive loss. The long-term bank loan and Shareholder Loan approximate their fair value due to the fact that the related interest rates approximate the rates currently offered by financial institutions for similar debt instrument of comparable maturities.
The Company applies ASC topic 820 (“ASC 820”),
Fair Value Measurements and Disclosures,
in measuring fair value. ASC 820 defines fair value, establishes a framework for measuring fair value and requires disclosures to be provided on fair value measurement. ASC 820 establishes a three-tier fair value hierarchy, which prioritizes the inputs used in measuring fair value as follows:
Level 1—Observable inputs that reflect quoted prices (unadjusted) for identical assets or liabilities in active markets.
Level 2—Include other inputs that are directly or indirectly observable in the marketplace.
Level 3—Unobservable inputs which are supported by little or no market activity.
ASC 820 describes three main approaches to measuring the fair value of assets and liabilities: (1)market approach; (2) income approach and (3) cost approach. The market approach uses prices and other relevant information generated from market
F-14
BEIGENE, LTD.
NOTES TO THE CONSOLIDATED FINANCIAL STATEMENTS
FOR THE YEARS ENDED DECEMBER 31, 2018, 2017 AND 2016
(Amounts in thousands of U.S. Dollar (“$”) and Renminbi (“RMB”),
except for number of shares and per share data)
transactions involving identical or comparable assets or liabilities. The income approach uses valuation techniques to convert future amounts to a single present value amount. The measurement is based on the value indicated by current market expectations about those future amounts. The cost approach is based on the amount that would currently be required to replace an asset.
Financial instruments measured at fair value on a recurring basis
The following tables set forth assets and liabilities measured at fair value on a recurring basis as of
December 31, 2018
and
2017
:
|
As of December 31, 2018
|
Quoted Price
in Active
Market for
Identical
Assets
(Level 1)
|
Significant
Other
Observable
Inputs
(Level 2)
|
Significant
Unobservable
Inputs
(Level 3)
|
||||||
|
|
$
|
$
|
$
|
||||||
|
Short-term investment (Note 6):
|
|
|
|
|
|||||
|
U.S. treasury securities
|
1,068,509
|
|
—
|
|
—
|
|
|||
|
Cash equivalents
|
|||||||||
|
Money market funds
|
159,810
|
|
—
|
|
—
|
|
|||
|
Total
|
1,228,319
|
|
—
|
|
—
|
|
|||
|
As of December 31, 2017
|
Quoted Price
in Active Market for Identical Assets (Level 1) |
Significant
Other Observable Inputs (Level 2) |
Significant
Unobservable Inputs (Level 3) |
||||||
|
|
$
|
$
|
$
|
||||||
|
Short-term investment (Note 6):
|
|
|
|
||||||
|
U.S. treasury securities
|
561,327
|
|
—
|
|
—
|
|
|||
|
U.S. agency securities
|
17,663
|
|
—
|
|
—
|
|
|||
|
Time deposits
|
18,924
|
|
—
|
|
—
|
|
|||
|
Cash equivalents
|
|||||||||
|
Money market funds
|
44,730
|
|
—
|
|
—
|
|
|||
|
Total
|
642,644
|
|
—
|
|
—
|
|
|||
Revenue Recognition
Effective January 1, 2018, the Company adopted Accounting Standards Codification, Topic 606, Revenue from Contracts with Customers (“ASC 606”) using the modified retrospective method. For further information regarding the impact of adoption, see Note 2
Recent Accounting Pronouncements
.
Under ASC 606, an entity recognizes revenue when its customer obtains control of promised goods or services, in an amount that reflects the consideration that the entity expects to receive in exchange for those goods or services. To determine revenue recognition for arrangements that an entity determines are within the scope of ASC 606, the entity performs the following five steps: (i) identify the contract(s) with a customer; (ii) identify the performance obligations in the contract; (iii) determine the transaction price, including variable consideration, if any; (iv) allocate the transaction price to the performance obligations in the contract; and (v) recognize revenue when (or as) the entity satisfies a performance obligation. The Company only applies the five-step model to contracts when it is probable that the entity will collect the consideration to which it is entitled in exchange for the goods or services it transfers to the customer.
F-15
BEIGENE, LTD.
NOTES TO THE CONSOLIDATED FINANCIAL STATEMENTS
FOR THE YEARS ENDED DECEMBER 31, 2018, 2017 AND 2016
(Amounts in thousands of U.S. Dollar (“$”) and Renminbi (“RMB”),
except for number of shares and per share data)
Once a contract is determined to be within the scope of ASC 606 at contract inception, the Company reviews the contract to determine which performance obligations it must deliver and which of these performance obligations are distinct. The Company recognizes as revenue the amount of the transaction price that is allocated to each performance obligation when that performance obligation is satisfied or as it is satisfied.
Product revenue
The Company's product revenues are generated from the sale of ABRAXANE®, REVLIMID®, and VIDAZA® to its product distributor in China. The distributor subsequently resells the products to second tier distributors who ultimately sell the products to health care providers and patients. The Company is the principal under the product sale as the Company controls the products with the ability to direct the use of, and obtain substantially all the remaining benefits from the products before they are sold to its first tier distributer. The Company has a single performance obligation which is to sell the products to its first tier distributer. The Company includes variable consideration in the transaction price to the extent it is probable that a significant reversal will not occur and estimates variable consideration from sales rebates and returns using the expected value method. Revenues for product sales are recognized at a point in time when the single performance obligation is satisfied upon delivery to the first tier distributer. The Company's payment terms are approximately 90 days. Actual amounts of consideration ultimately received may differ from the Company’s estimates. The Company will reassess estimates for variable consideration periodically. If actual results in the future vary from the Company’s estimates, the Company will adjust these estimates, which would affect net product revenue and earnings in the period such variances become known.
Rebates, including price compensation credits, are offered to distributors, consistent with pharmaceutical industry practices. The Company records a provision for rebates at the time of sale based on contracted rates and historical redemption rates. Assumptions used to establish the provision include the level of distributor inventories, sales volumes and contract pricing and estimated acceptance of government pricing or reimbursement amounts (such as provincial acceptance of the National Reimbursement Drug List pricing in the PRC). The Company regularly reviews the information related to these estimates and adjust the provision accordingly. To date, rebates have not been significant.
The Company bases its sales returns allowance on estimated distributor inventories, customer demand as reported by third-party sources, and actual returns history, as well as other factors, as appropriate. If the historical data the Company uses to calculate these estimates do not properly reflect future returns, then a change in the allowance would be made in the period in which such a determination is made and revenues in that period could be materially affected. Any changes from the historical trend rates are considered in determining the current sales return allowance. To date, sales returns have not been significant.
Collaboration revenue
At contract inception, the Company analyzes its collaboration arrangements to assess whether they are within the scope of ASC 808, Collaborative Arrangements (“ASC 808”) to determine whether such arrangements involve joint operating activities performed by parties that are both active participants in the activities and exposed to significant risks and rewards dependent on the commercial success of such activities. For collaboration arrangements within the scope of ASC 808 that contain multiple elements, the Company first determines which elements of the collaboration are deemed to be within the scope of ASC 808 and those that are more reflective of a vendor-customer relationship and therefore within the scope of ASC 606. For elements of collaboration arrangements that are accounted for pursuant to ASC 808, an appropriate recognition method is determined and applied consistently.
In determining the appropriate amount of revenue to be recognized as it fulfills its obligations under each of its agreements, the Company performs the five step model under ASC 606 noted above.
The Company’s collaborative arrangements may contain more than one unit of account, or performance obligation, including grants of licenses to intellectual property rights, agreement to provide research and development services and other deliverables. The collaborative arrangements do not include a right of return for any deliverable. As part of the accounting for these arrangements, the Company must develop assumptions that require judgment to determine the stand-alone selling price for each performance obligation identified in the contract. In developing the stand-alone selling price for a performance obligation, the Company considers competitor pricing for a similar or identical product, market awareness of and perception of the product, expected product life and current market trends. In general, the consideration allocated to each performance obligation is recognized when the respective obligation is satisfied either by delivering a good or providing a service, limited to
F-16
BEIGENE, LTD.
NOTES TO THE CONSOLIDATED FINANCIAL STATEMENTS
FOR THE YEARS ENDED DECEMBER 31, 2018, 2017 AND 2016
(Amounts in thousands of U.S. Dollar (“$”) and Renminbi (“RMB”),
except for number of shares and per share data)
the consideration that is not constrained. Non-refundable payments received before all of the relevant criteria for revenue recognition are satisfied are recorded as advances from customers.
Licenses of Intellectual Property:
Upfront non-refundable payments for licensing the Company’s intellectual property are evaluated to determine if the license is distinct from the other performance obligations identified in the arrangement. For licenses determined to be distinct, the Company recognizes revenues from non-refundable, up-front fees allocated to the license at a point in time, when the license is transferred to the licensee and the licensee is able to use and benefit from the license.
Research and Development Services:
The portion of the transaction price allocated to research and development services performance obligations is deferred and recognized as collaboration revenue over time as delivery or performance of such services occurs. R&D reimbursement revenue for revenue attributable to the clinical trials that Celgene has opted into is recognized as delivery or performance of such services occurs.
Milestone Payments:
At the inception of each arrangement that includes development milestone payments, the Company evaluates whether the milestones are considered probable of being reached and estimates the amount to be included in the transaction price using the most likely amount method. If it is probable that a significant revenue reversal would not occur, the associated milestone value is included in the transaction price. Milestones related to the Company’s development-based activities may include initiation of various phases of clinical trials. Due to the uncertainty involved in meeting these development-based targets, they are generally fully constrained at contract inception. The Company will assess whether the variable consideration is fully constrained each reporting period based on the facts and circumstances surrounding the clinical trials. Upon changes to constraint associated with the developmental milestones, variable consideration will be included in the transaction price when a significant reversal of revenue recognized is not expected to occur and allocated to the separate performance obligations. Regulatory milestones are fully constrained until the period in which those regulatory approvals are achieved due to the inherent uncertainty with the approval process. Regulatory milestones are included in the transaction price in the period regulatory approval is obtained.
Royalties:
For arrangements that include sales-based royalties, including milestone payments based on the level of sales, and the license is deemed to be the predominant item to which the royalties relate, the Company recognizes revenue at the later of (i) when the related sales occur, or (ii) when the performance obligation to which some or all of the royalty has been allocated has been satisfied (or partially satisfied).
Research and Development Expenses
Research and development expenses represent costs associated with the collaborative arrangements, which primarily include (i) payroll and related costs (including share-based compensation) associated with research and development personnel, (ii) costs related to clinical trials and preclinical testing of the Company’s technologies under development, (iii) costs to develop the product candidates, including raw materials and supplies, product testing, depreciation, and facility related expenses, (iv) expenses for research services provided by universities and contract laboratories, including sponsored research funding, and (v) other research and development expenses. Research and development expenses are charged to expense as incurred when these expenditures relate to the Company’s research and development services and have no alternative future uses.
Clinical trial costs are a significant component of the Company’s research and development expenses. The Company has a history of contracting with third parties that perform various clinical trial activities on behalf of the Company in the ongoing development of the Company’s product candidates. Expenses related to clinical trials are accrued based on the Company’s estimates of the actual services performed by the third parties for the respective period. If the contracted amounts are modified (for instance, as a result of changes in the clinical trial protocol or scope of work to be performed), the Company will modify the related accruals accordingly on a prospective basis. Revisions in the scope of a contract are charged to expense in the period in which the facts that give rise to the revision become reasonably certain. There were no material adjustments for a change in estimate to research and development expenses in the accompanying consolidated financial statements for the years ended
December 31, 2018
,
2017
and
2016
.
Acquired In-Process Research and Development Expense
The Company has acquired rights to develop and commercialize product candidates. Upfront payments that relate to the acquisition of a new drug compound, as well as pre-commercial milestone payments, are immediately expensed as acquired in-
F-17
BEIGENE, LTD.
NOTES TO THE CONSOLIDATED FINANCIAL STATEMENTS
FOR THE YEARS ENDED DECEMBER 31, 2018, 2017 AND 2016
(Amounts in thousands of U.S. Dollar (“$”) and Renminbi (“RMB”),
except for number of shares and per share data)
process research and development in the period in which they are incurred, provided that the new drug compound did not also include processes or activities that would constitute a “business” as defined under GAAP, the drug has not achieved regulatory approval for marketing and, absent obtaining such approval, has no established alternative future use. Milestone payments made to third parties subsequent to regulatory approval are capitalized as intangible assets and amortized over the estimated remaining useful life of the related product. Royalties owed on sales of the products licensed pursuant to the agreements are expensed in the period the related revenues are recognized.
Government Grants
Government financial incentives that involve no conditions or continuing performance obligations of the Company are recognized as other non-operating income upon receipt. In the event government grants or incentives involve continuing performance obligations, the Company will capitalize the payment as a liability and recognize the same financial statement caption as the performance obligation relates over the performance period.
Leases
Leases are classified at the inception date as either a capital lease or an operating lease. The Company assesses a lease to be a capital lease if any of the following conditions exist: (a) ownership is transferred to the lessee by the end of the lease term, (b) there is a bargain purchase option, (c) the lease term is at least
75%
of the property’s estimated remaining economic life, or (d) the present value of the minimum lease payments at the beginning of the lease term is
90%
or more of the fair value of the leased property to the lessor at the inception date. A capital lease is accounted for as if there was an acquisition of an asset and an occurrence of an obligation at the inception of the lease. The Company has no capital leases for the years presented.
All other leases are accounted for as operating leases wherein rental payments are expensed on a straight-line basis over the periods of their respective lease terms. The Company leases office space, employee accommodation and manufactory space under operating lease agreements. Certain of the lease agreements contain rent holidays. Rent holidays are considered in determining the straight-line rent expense to be recorded over the lease term. The lease term begins on the date of initial possession of the lease property for purposes of recognizing lease expense on straight-line basis over the term of the lease.
Comprehensive Loss
Comprehensive loss is defined as the changes in equity of the Company during a period from transactions and other events and circumstances excluding transactions resulting from investments by owners and distributions to owners. Among other disclosures, ASC 220, Comprehensive Income, requires that all items that are required to be recognized under current accounting standards as components of comprehensive loss be reported in a financial statement that is displayed with the same prominence as other financial statements. For each of the periods presented, the Company’s comprehensive loss includes net loss, foreign currency translation adjustments and unrealized holding gains/losses associated with the available-for-sale securities, and is presented in the consolidated statements of comprehensive loss.
Share-Based Compensation
Awards granted to employees
The Company applies ASC 718, Compensation—Stock Compensation (“ASC 718”), to account for its employee share-based payments. In accordance with ASC 718, the Company determines whether an award should be classified and accounted for as a liability award or equity award. All the Company’s grants of share-based awards to employees were classified as equity awards and are recognized in the financial statements based on their grant date fair values. Specifically, the grant date fair value of share options is calculated using an option pricing model. The fair value of restricted shares and restricted share units are based on the closing market price of our ADSs on the NASDAQ Global Select Market on the date of grant. The Company has elected to recognize compensation expense using the straight-line method for all employee equity awards granted with graded vesting based on service conditions provided that the amount of compensation cost recognized at any date is at least equal to the portion of the grant-date value of the options that are vested at that date. The Company uses the accelerated method for all awards granted with graded vesting based on performance conditions. To the extent the required vesting conditions are not met resulting in the forfeiture of the share-based awards, previously recognized compensation expense relating to those awards are
F-18
BEIGENE, LTD.
NOTES TO THE CONSOLIDATED FINANCIAL STATEMENTS
FOR THE YEARS ENDED DECEMBER 31, 2018, 2017 AND 2016
(Amounts in thousands of U.S. Dollar (“$”) and Renminbi (“RMB”),
except for number of shares and per share data)
reversed. ASC 718 requires forfeitures to be estimated at the time of grant and revised, if necessary, in the subsequent period if actual forfeitures differ from initial estimates.
Forfeiture rates are estimated based on historical and future expectations of employee turnover rates and are adjusted to reflect future changes in circumstances and facts, if any. Share-based compensation expense is recorded net of estimated forfeitures such that expense is recorded only for those share-based awards that are expected to vest. To the extent the Company revises these estimates in the future, the share-based payments could be materially impacted in the period of revision, as well as in following periods. The Company, with the assistance of an independent third-party valuation firm, determined the estimated fair value of the stock options granted to employees using the binomial option pricing model.
Awards granted to non-employees
The Company has accounted for equity instruments issued to non-employees in accordance with the provisions of ASC 718 and ASC 505, Equity. All transactions in which goods or services are received in exchange for equity instruments are accounted for based on the fair value of the consideration received or the fair value of the equity instrument issued, whichever is more reliably measurable. The measurement date of the fair value of the equity instrument issued is the date on which the counterparty’s performance is completed as there is no associated performance commitment. The expense is recognized in the same manner as if the Company had paid cash for the services provided by the non-employees in accordance with ASC 505-50, Equity-based payments to non-employees. The Company estimated the fair value of share options granted to non-employees using the same method as employees.
Modification of awards
A change in any of the terms or conditions of the awards is accounted for as a modification of the award. Incremental compensation cost is measured as the excess, if any, of the fair value of the modified award over the fair value of the original award immediately before its terms are modified, measured based on the fair value of the awards and other pertinent factors at the modification date. For vested awards, the Company recognizes incremental compensation cost in the period the modification occurs. For unvested awards, the Company recognizes over the remaining requisite service period, the sum of the incremental compensation cost and the remaining unrecognized compensation cost for the original award on the modification date. If the fair value of the modified award is lower than the fair value of the original award immediately before modification, the minimum compensation cost the Company recognizes is the cost of the original award.
Income Taxes
The Company uses the liability method of accounting for income taxes. Under this method, deferred tax assets and liabilities are determined based on the differences between the financial reporting and the tax bases of assets and liabilities and are measured using enacted tax rates that will be in effect when the differences are expected to reverse. A valuation allowance is provided when it is more likely than not that some portion or all of a deferred tax asset will not be realized.
In accordance with Accounting Standards Update (“ASU”) 2015-17, all deferred income tax assets and liabilities are classified as non-current on the consolidated balance sheets.
The Company evaluates its uncertain tax positions using the provisions of ASC 740,
Income Taxes,
which prescribes a recognition threshold that a tax position is required to meet before being recognized in the financial statements. The Company recognizes in the financial statements the benefit of a tax position which is “more likely than not” to be sustained under examination based solely on the technical merits of the position assuming a review by tax authorities having all relevant information. Tax positions that meet the recognition threshold are measured using a cumulative probability approach, at the largest amount of tax benefit that has a greater than fifty percent likelihood of being realized upon settlement. It is the Company’s policy to recognize interest and penalties related to unrecognized tax benefits, if any, as a component of income tax expense.
Loss Per Share
Loss per share is calculated in accordance with ASC 260,
Earnings per Share
. Basic loss per ordinary share is computed by dividing net loss attributable to ordinary shareholders by the weighted average number of ordinary shares outstanding during
F-19
BEIGENE, LTD.
NOTES TO THE CONSOLIDATED FINANCIAL STATEMENTS
FOR THE YEARS ENDED DECEMBER 31, 2018, 2017 AND 2016
(Amounts in thousands of U.S. Dollar (“$”) and Renminbi (“RMB”),
except for number of shares and per share data)
the period using the two-class method. Under the two-class method, net income is allocated between ordinary shares and participating securities based on dividends declared (or accumulated) and participating rights in undistributed earnings as if all the earnings for the reporting period had been distributed. The Company’s restricted shares are participating securities because they have contractual rights to share in the profits of the Company.
However, the restricted shares do not have contractual rights and obligations to share in the losses of the Company. For the periods presented herein, the computation of basic loss per share using the two-class method is not applicable as the Company is in a net loss position.
Diluted loss per share is calculated by dividing net loss attributable to ordinary shareholders as adjusted for the effect of dilutive ordinary equivalent shares, if any, by the weighted average number of ordinary and dilutive ordinary equivalent shares outstanding during the period. Ordinary equivalent shares consist of the ordinary shares issuable upon the conversion of the Company’s convertible preferred shares using the if-converted method, and ordinary shares issuable upon the conversion of the share options and unvested restricted shares, using the treasury stock method.
Ordinary share equivalents are excluded from the computation of diluted loss per share if their effects would be anti-dilutive. Basic and diluted loss per ordinary share is presented in the Company’s consolidated statements of operations.
Segment Information
In accordance with ASC 280, Segment Reporting, the Company’s chief operating decision maker, the Chief Executive Officer, reviews the consolidated results when making decisions about allocating resources and assessing performance of the Company as a whole and hence, the Company has only
one
reportable segment. The Company does not distinguish between markets or segments for the purpose of internal reporting.
Concentration of Risks
Concentration of credit risk
Financial instruments that are potentially subject to credit risk consist of cash and cash equivalents and short-term investments. The carrying amounts of cash and cash equivalents and short-term investments represent the maximum amount of loss due to credit risk. As of
December 31, 2018
and
2017
,
$712,937
and
$239,602
were deposited with various major reputable financial institutions located in the PRC and international financial institutions outside of the PRC. The deposits placed with financial institutions are not protected by statutory or commercial insurance. In the event of bankruptcy of one of these financial institutions, the Company may be unlikely to claim its deposits back in full. Management believes that these financial institutions are of high credit quality and continually monitors the credit worthiness of these financial institutions. As of
December 31, 2018
and
2017
, the Company had short-term investments amounting to
$1,068,509
and
$597,914
, respectively.
At
December 31, 2018
, the Company’s short-term investments were comprised of U.S. treasury securities. The Company believes that U.S. treasury securities are of high credit quality and continually monitor the credit worthiness of these institutions.
Customer concentration risk
For the years ended
December 31, 2018
and 2017, substantially all of the Company's revenue was from Celgene and our product distributor in China. For the year ended
2016
, substantially all of the Company’s revenue was generated solely from
one
customer, Merck KGaA, Darmstadt Germany.
Business, customer, political, social and economic risks
The Company participates in a dynamic biopharmaceutical industry and believes that changes in any of the following areas could have a material adverse effect on the Company’s future financial position, results of operations or cash flows: changes in the overall demand for services and products; competitive pressures due to new entrants; advances and new trends in new drugs and industry standards; changes in clinical research organizations, contract manufacturers and other key vendors; changes in certain strategic relationships or customer relationships; regulatory considerations; intellectual property considerations; and
F-20
BEIGENE, LTD.
NOTES TO THE CONSOLIDATED FINANCIAL STATEMENTS
FOR THE YEARS ENDED DECEMBER 31, 2018, 2017 AND 2016
(Amounts in thousands of U.S. Dollar (“$”) and Renminbi (“RMB”),
except for number of shares and per share data)
risks associated with the Company’s ability to attract and retain employees necessary to support its growth. The Company’s operations could be also adversely affected by significant political, economic and social uncertainties in the PRC.
Currency convertibility risk
A significant portion of the Company’s expenses, assets and liabilities are denominated in RMB. On January 1, 1994, the PRC government abolished the dual rate system and introduced a single rate of exchange as quoted daily by the People’s Bank of China (the “PBOC”). However, the unification of the exchange rates does not imply that the RMB may be readily convertible into U.S. dollar or other foreign currencies. All foreign exchange transactions continue to take place either through the PBOC or other banks authorized to buy and sell foreign currencies at the exchange rates quoted by the PBOC. Approvals of foreign currency payments by the PBOC or other institutions require submitting a payment application form together with suppliers’ invoices, shipping documents and signed contracts.
Additionally, the value of the RMB is subject to changes in central government policies and international economic and political developments affecting supply and demand in the PRC foreign exchange trading system market.
Foreign currency exchange rate risk
From July 21, 2005, the RMB is permitted to fluctuate within a narrow and managed band against a basket of certain foreign currencies. For RMB against U.S. dollar, there was depreciation of approximately
5.7%
, appreciation of approximately
6.5%
and depreciation of approximately
6.3%
, in the years ended
December 31, 2018
,
2017
and
2016
. It is difficult to predict how market forces or PRC or U.S. government policy may impact the exchange rate between the RMB and the U.S. dollar in the future.
To the extent that the Company needs to convert U.S. dollar into RMB for capital expenditures and working capital and other business purposes, appreciation of RMB against U.S. dollar would have an adverse effect on the RMB amount the Company would receive from the conversion. Conversely, if the Company decides to convert RMB into U.S. dollar for the purpose of making payments for dividends on ordinary shares, strategic acquisitions or investments or other business purposes, appreciation of U.S. dollar against RMB would have a negative effect on the U.S. dollar amount available to the Company. In addition, a significant depreciation of the RMB against the U.S. dollar may significantly reduce the U.S. dollar equivalent of the Company’s earnings or losses.
Recent Accounting Pronouncements
New accounting standards which have been adopted
In May 2014, the Financial Accounting Standards Board (“FASB”) issued ASU No. 2014-9, Revenue from Contracts with Customers (Topic 606), or ASU 2014-9. Subsequently, the FASB issued ASU 2015-14, Revenue from Contracts with Customers (Topic 606), which adjusted the effective date of ASU 2014-9; ASU No. 2016-8, Revenue from Contracts with Customers (Topic 606): Principal versus Agent Considerations (Reporting Revenue Gross versus Net), which amends the principal-versus-agent implementation guidance and illustrations in ASU 2014-9; ASU No. 2016-10, Revenue from Contracts with Customers (Topic 606): Identifying Performance Obligations and Licensing, which clarifies identifying performance obligations and licensing implementation guidance and illustrations in ASU 2014-9; ASU No. 2016-12, Revenue from Contracts with Customers (Topic 606): Narrow-Scope Improvements and Practical Expedients, which addresses implementation issues and is intended to reduce the cost and complexity of applying the new revenue standard in ASU 2014-9; ASU No. 2017-13, Revenue Recognition (Topic 605), Revenue from Contracts with Customers (Topic 606), Leases (Topic 840), and Leases (Topic 842): Amendments to SEC Paragraphs Pursuant to the Staff Announcement at the July 20, 2017 EITF Meeting and Rescission of Prior SEC Staff
Announcements and Observer Comments (SEC Update)
, which codifies recent announcements by the Securities and Exchange Commission, or SEC, staff; and ASU No. 2017-14,
Income Statement—Reporting Comprehensive Income (Topic 220), Revenue Recognition (Topic 605), and Revenue from Contracts with Customers (Topic 606) (SEC Update)
, which adds ASC 606-10-S25-1 as a result of SEC Release 33-10403, or collectively, the Revenue ASUs. The Revenue ASUs provide an accounting standard for a single comprehensive model for use in accounting for revenue arising from contracts with customers, and supersedes most current revenue recognition guidance. The accounting standard is effective for interim and annual periods beginning after December 15, 2017, with an option to early adopt for interim and annual periods beginning after December 15, 2016. The guidance permits two methods of adoption: retrospectively to each
F-21
BEIGENE, LTD.
NOTES TO THE CONSOLIDATED FINANCIAL STATEMENTS
FOR THE YEARS ENDED DECEMBER 31, 2018, 2017 AND 2016
(Amounts in thousands of U.S. Dollar (“$”) and Renminbi (“RMB”),
except for number of shares and per share data)
prior reporting period presented (the full retrospective method), or retrospectively with the cumulative effect of initially applying the guidance recognized at the date of initial application (the modified retrospective method). On January 1, 2018, the Company adopted the new standard using the modified retrospective method.
The impact to the Company on adoption of the Revenue ASUs relates to variable consideration related to its collaboration agreement with Celgene Corporation ("Celgene") and the anticipated opt-in to certain clinical trials that are to be run by the Company, and funded by Celgene. Under Topic 605, even though the Company believed it was probable that the performance obligation related to the variable consideration would be satisfied as of December 31, 2017, the variable consideration was not realizable because formal notice had not been received. Upon its adoption of the Revenue ASUs, the Company determined it was probable that Celgene would opt-in to the clinical trials as of December 31, 2017 such that the variable consideration was not constrained, and therefore, the related revenue would have been recognized. In March 2018, the Company obtained formal notice of opt-in by Celgene.
The Company recognized the cumulative effect of initially applying the new revenue standard as an adjustment to the opening balance of retained earnings. The comparative information has not been restated and continues to be reported under the accounting standards in effect for those periods. The cumulative effect of the changes made to the Company's consolidated January 1, 2018 balance sheet for the adoption of ASU 2014-9 resulted in an increase of $
16,307
to both unbilled receivables and the opening balance of accumulated deficit. Please refer to the “Adoption of New Accounting Standards” section below for a tabular presentation of the impact.
In October 2016, the FASB issued ASU No. 2016-16,
Income Taxes (Topic 740): Intra-Entity Transfers of Assets Other Than Inventory
, which requires the recognition of the income tax consequences of an intra-entity transfer of an asset, other than inventory, when the transfer occurs. The Company adopted ASU 2016-16 during the first quarter of 2018 using the modified retrospective adoption method. In 2017, BeiGene HK's contribution of BeiGene Shanghai to BeiGene Biologics (and subsequent receipt of a related government grant) resulted in tax expenses
$28,588
, which were reflected as other non-current assets in the Company’s December 31, 2017 balance sheet. The related government subsidy of $
9,990
, which was received in 2017, was reflected as other long-term liabilities in the Company’s December 31, 2017 balance sheet. The adoption of this accounting standard resulted in an adjustment to beginning accumulated deficit for both of these items. In addition, the Company has now established a deferred tax asset resulting from a previous transfer of intellectual property to one of its wholly-owned subsidiaries. This deferred tax asset is entirely offset by a corresponding valuation allowance and therefore did not result in a change to beginning accumulated deficit. Please refer to the “Adoption of New Accounting Standards” section below for a tabular presentation of the impact.
In November 2016, the FASB issued ASU No. 2016-18,
Statement of Cash Flows: Restricted Cash
, which requires entities to present the aggregate changes in cash, cash equivalents, restricted cash and restricted cash equivalents in the statement of cash flows. As a result, the statement of cash flows will be required to present restricted cash and restricted cash equivalents as a part of the beginning and ending balances of cash and cash equivalents. The updated guidance became effective on January 1, 2018, and resulted in the presentation of restricted cash of $
27,776
within the ending cash, cash equivalents, and restricted cash balance on the Company’s consolidated statement of cash flows.
In May 2017, the FASB issued ASU No. 2017-9,
Compensation – Stock Compensation: Scope of Modification Accounting
. This standard provides clarity and reduces both (1) diversity in practice and (2) cost and complexity when applying the guidance in Topic 718, Compensation-Stock Compensation, to a change to the terms or conditions of a share-based payment award. The updated guidance became effective on January 1, 2018, and there was no material impact to the Company’s consolidated financial statements.
In June 2018, the FASB issued ASU 2018-7,
Compensation—Stock Compensation (Topic 718): Improvements to Nonemployee Share-Based Payment Accounting.
This update expands the scope of Topic 718 to include share-based payment transactions for acquiring goods and services from nonemployees. This update also specifies that Topic 718 applies to all share-based payment transactions in which a grantor acquires goods or services to be used or consumed in a grantor’s own operations by issuing share-based payment awards. This update is effective in fiscal years, including interim periods, beginning after December 15, 2018. Early adoption is permitted, but no earlier than an entity’s adoption date of Topic 606. The Company elected to early adopt this ASU during the quarter ended September 30, 2018, and there was no material impact to the Company's consolidated financial statements.
F-22
BEIGENE, LTD.
NOTES TO THE CONSOLIDATED FINANCIAL STATEMENTS
FOR THE YEARS ENDED DECEMBER 31, 2018, 2017 AND 2016
(Amounts in thousands of U.S. Dollar (“$”) and Renminbi (“RMB”),
except for number of shares and per share data)
Impact of adopted accounting standards
The cumulative effect of changes made to the Company’s consolidated January 1, 2018 balance sheet for the adoption of the revenue ASUs and ASU 2016-16 were as follows:
|
|
Balance at
|
Adjustments
|
Adjustments
|
Balance at
|
||||||||
|
|
December 31,
|
Due to
|
Due to
|
January 1,
|
||||||||
|
|
2017
|
Revenue ASUs
|
ASU 2016-16
|
2018
|
||||||||
|
|
$
|
$
|
$
|
$
|
||||||||
|
Assets:
|
|
|
|
|
|
|
|
|
||||
|
Unbilled receivable
|
—
|
|
16,307
|
|
—
|
|
16,307
|
|
||||
|
Other non-current assets
|
42,915
|
|
—
|
|
(28,588
|
)
|
14,327
|
|
||||
|
Liabilities:
|
||||||||||||
|
Other long-term liabilities
|
31,959
|
|
—
|
|
(9,990
|
)
|
21,969
|
|
||||
|
Equity:
|
||||||||||||
|
Accumulated other comprehensive loss
|
(480
|
)
|
—
|
|
263
|
|
(217
|
)
|
||||
|
Accumulated deficit
|
(330,517
|
)
|
16,307
|
|
(19,236
|
)
|
(333,446
|
)
|
||||
|
Noncontrolling interest
|
14,422
|
|
—
|
|
375
|
|
14,797
|
|
||||
New accounting standards which have not yet been adopted
In February 2016, the FASB issued ASU No. 2016-2,
Leases
. Subsequently, the FASB issued ASU 2018-1, Land Easement Practical Expedient, which provides an optional transition practical expedient for land easements, ASU 2018-10,
Codification Improvements to Topic 842, Leases
, which clarifies certain aspects of the guidance issued in ASU 2016-2; ASU 2018-11,
Leases (Topic 842): Targeted Improvements
, which provides an additional transition method and a practical expedient for separating components of a contract for lessors, and ASU 2018-20,
Leases (Topic 842)- Narrow-Scope Improvements for Lessors
, which allows certain accounting policy elections for lessors (collectively, the "Lease ASUs"). The Lease ASUs require lessees to recognize assets and liabilities related to lease arrangements longer than 12 months on the balance sheet. This standard also requires additional disclosures by lessees and contains targeted changes to accounting by lessors. The updated guidance is effective for interim and annual periods beginning after December 15, 2018, and early adoption is permitted. Leases will be classified as finance or operating, with the classification affecting the pattern and classification of expense recognition. The recognition, measurement, and presentation of expenses and cash flows arising from a lease by a lessee have not significantly changed from previous GAAP. A modified retrospective transition approach is required, applying the new standard to all leases existing at the date of initial adoption. The guidance permits entities to choose to use either its effective date or the beginning of the earliest period presented in the financial statements as its date of initial application.
The Company will adopt the new standard effective January 1, 2019 using the effective date method and will not restate comparative periods. The Company will elect the package of practical expedients permitted under the transition guidance within the new standard, which permits the Company not to reassess under the new standard its prior conclusions about lease identification, lease classification and initial direct costs. On adoption, we currently expect to recognize additional operating liabilities ranging from $
25,000
to $
30,000
, with corresponding right-of-use (ROU) assets of the same amount based on the present value of the remaining minimum rental payments under existing operating leases. Additionally, the Company expects to reclassify its land use rights of $
45,058
to ROU assets upon adoption.
In June 2016, the FASB issued ASU No. 2016-13,
Financial Instruments—Credit Losses
("ASU 2016-13"). The amendments in ASU 2016-13 update guidance on reporting credit losses for financial assets. These amendments affect loans, debt securities, trade receivables, net investments in leases, off balance sheet credit exposures, reinsurance receivables, and any other financial assets not excluded from the scope that have the contractual right to receive cash. For public business entities that are U.S. SEC filers, ASU 2016-13 is effective for fiscal years beginning after December 15, 2019, and interim periods within those fiscal years. The Company is currently evaluating the impact on its financial statements of adopting this guidance.
In February 2018, the FASB issued ASU 2018-2,
Income Statement—Reporting Comprehensive Income (Topic 220): Reclassification of Certain Tax Effects from Accumulated Other Comprehensive Income
. This update allows companies the
F-23
BEIGENE, LTD.
NOTES TO THE CONSOLIDATED FINANCIAL STATEMENTS
FOR THE YEARS ENDED DECEMBER 31, 2018, 2017 AND 2016
(Amounts in thousands of U.S. Dollar (“$”) and Renminbi (“RMB”),
except for number of shares and per share data)
option to reclassify to retained earnings the tax effects related to items in accumulated other comprehensive income (loss) as a result of the Tax Cuts and Jobs Act that was enacted in the United States on December 22, 2017. This update is effective in fiscal years, including interim periods, beginning after December 15, 2018, and early adoption is permitted. This guidance should be applied either in the period of adoption or retrospectively to each period in which the effects of the change in the U.S. federal income tax rate in the Tax Cuts and Jobs Act is recognized. The Company does not expect this guidance to have a material impact on the Company’s consolidated financial statements.
In August 2018, the FASB issued ASU 2018-13,
Fair Value Measurement (Topic 820): Disclosure Framework- Changes to the Disclosure Requirements for Fair Value Measurement
. The update eliminates, modifies, and adds certain disclosure requirements for fair value measurements. This update is effective in fiscal years, including interim periods, beginning after December 15, 2019, and early adoption is permitted. The added disclosure requirements and the modified disclosure on the narrative description of measurement uncertainty should be applied prospectively for only the most recent interim or annual period presented. All other changes to disclosure requirements in this update should be applied retrospectively to all periods presented upon their effective date. The Company is currently evaluating the impact on its financial statements of adopting this guidance.
In August 2018, the FASB issued ASU 2018-15,
Intangibles-Goodwill and Other-Internal-Use Software (Subtopic 350-40): Customer's Accounting for Implementation Costs Incurred in a Cloud Computing Arrangement That Is a Service Contract
. This update requires a customer in a cloud computing arrangement that is a service contract to follow the internal-use software guidance in ASC 350-40 to determine which implementation costs to defer and recognize as an asset. This update is effective in fiscal years, including interim periods, beginning after December 15, 2019, and early adoption is permitted. This guidance should be applied either retrospectively or prospectively to all implementation costs incurred after the date of adoption. The Company is currently evaluating the impact on its financial statements of adopting this guidance.
In November 2018, the FASB issued ASU 2018-18,
Collaborative Arrangements (Topic 808): Clarifying the Interaction between Topic 808 and Topic 606
. This update clarifies that certain transactions between participants in a collaborative arrangement should be accounted for under ASC 606 when the counterparty is a customer and precludes an entity from presenting consideration from a transaction in a collaborative arrangement as revenue from contracts with customers if the counterparty is not a customer for that transaction. The update is effective in fiscal years beginning after December 15, 2019, and interim periods therein, and early adoption is permitted for entities that have adopted ASC 606. This guidance should be applied retrospectively to the date of initial application of Topic 606. The Company is currently evaluating the impact on its financial statements of adopting this guidance.
3. Research and Development Collaborative Arrangements
To date, the Company’s collaboration revenue has consisted of (1) upfront license fees, research and development reimbursement revenue, and research and development services revenue from its collaboration agreement with Celgene on the Company’s investigational anti-programmed cell death protein 1 (“PD-1”) inhibitor, tislelizumab, and (2) upfront license fees and milestone payments from its collaboration agreement with Merck KGaA, Darmstadt Germany on pamiparib and lifirafenib.
The following table summarizes total collaboration revenue recognized for the years ended
December 31, 2018
,
2017
and
2016
:
|
|
Year Ended December 31,
|
|||||||
|
|
2018
|
2017
|
2016
|
|||||
|
|
$
|
$
|
$
|
|||||
|
License revenue
|
—
|
|
211,391
|
|
—
|
|
||
|
Reimbursement of research and development costs
|
56,776
|
|
—
|
|
—
|
|
||
|
Research and development service revenue
|
10,559
|
|
2,568
|
|
1,070
|
|
||
|
Total
|
67,335
|
|
213,959
|
|
1,070
|
|
||
F-24
BEIGENE, LTD.
NOTES TO THE CONSOLIDATED FINANCIAL STATEMENTS
FOR THE YEARS ENDED DECEMBER 31, 2018, 2017 AND 2016
(Amounts in thousands of U.S. Dollar (“$”) and Renminbi (“RMB”),
except for number of shares and per share data)
Celgene and Celgene Switzerland
On July 5, 2017, the Company entered into a license agreement with Celgene Switzerland pursuant to which the Company granted to the Celgene parties an exclusive right to develop and commercialize the Company’s investigational PD-1 inhibitor, tislelizumab, in all fields of treatment, other than hematology, in the United States, Europe, Japan and the rest of world other than Asia (the “PD-1 License Agreement”). In connection with the closing of the transactions on August 31, 2017, the Company, Celgene and Celgene Switzerland amended and restated the PD-1 License Agreement (the “A&R PD-1 License Agreement”) to, among other things, clarify the parties’ responsibilities relating to the conducting and funding of certain global registration clinical trials and clarify the scope of the regulatory materials transferred by BeiGene to Celgene.
Under the terms of the A&R PD-1 License Agreement, Celgene agreed to pay the Company
$263,000
in upfront non-refundable fees, of which
$92,050
was paid in the third quarter of 2017 and the remaining
$170,950
was paid in December 2017. In addition, subsequent to the completion of the research and development phase of the collaboration, the Company may be eligible to receive product development milestone payments based on the successful achievement of development and regulatory goals, commercial milestone payments based on the successful achievement of commercialization goals, and royalty payments based on a predetermined percentage of Celgene and Celgene Switzerland’s aggregate annual net sales of all products in their territory for a period not to exceed the latest of the expiration of the last valid patent claim, the expiration of regulatory exclusivity or
12
years from the date of the first commercial sale on a product-by-product and country-by-country basis. The Company allocated
$13,000
of upfront fees to the fair value of assets related to the Company’s acquisition of Celgene Shanghai, a wholly-owned subsidiary of Celgene Holdings East Corporation established under the laws of China, which was completed contemporaneously with the A&R PD-1 License Agreement.
In addition to the exclusive right to develop and commercialize tislelizumab, the terms of the A&R PD-1 License Agreement provide Celgene with the right to collaborate with the Company on the development of tislelizumab for specified indications, including required participation on a joint development committee and a joint steering committee as well as a joint commercialization committee upon achievement of commercialization. The joint development and joint steering committees are formed by an equal number of representatives from the Company and Celgene and are responsible for reviewing and approving the development plan and budget for the development of tislelizumab for clinical studies associated with specified indications. Celgene will reimburse the Company for certain research and development costs at a cost plus agreed upon markup for the development of tislelizumab related to the clinical trials that Celgene opts into, as outlined in the development plan.
Under ASC 606, the Company identified the following deliverables of the collaboration agreement as distinct performance obligations: (a) the license provided to Celgene for the exclusive right to develop and commercialize tislelizumab, in all fields of treatment, other than hematology, in the United States, Europe, Japan and the rest of world other than Asia (“the license”); and (b) the research and development services provided to Celgene to develop tislelizumab within specified indications (“R&D services”). For each deliverable, the Company determined the stand-alone selling price and allocated the non-constrained consideration of
$250,000
to the units of accounting using the relative selling price method. The consideration allocated to the license was recognized upon transfer of the license to Celgene at contract inception and the consideration allocated to the R&D services will be recognized over the term of the respective clinical studies for the specified indications.
The payments associated with the defined developmental, regulatory, and commercialization goals are variable consideration and were fully constrained at contract inception. The Company assesses whether the variable consideration is fully constrained each reporting period based on the facts and circumstances surrounding the achievement of milestones. Upon changes to constraint associated with the milestones, variable consideration will be included in the transaction price when a significant reversal of revenue recognized is not expected to occur and allocated to the separate performance obligations. No revenue was recognized related to the milestones for the year ended December 31, 2018.
For the year ended
December 31, 2018
, the Company recognized collaboration revenue of
$65,835
related to the Celgene collaboration. The Company recognized
$56,776
of research and development reimbursement revenue for the year ended December 31,2018 for the trials that Celgene has opted into. In addition,
$16,307
of reimbursement that was billed to Celgene was included as an adjustment to beginning accumulated deficit. The Company recognized research and development services revenue of
$9,059
for the year ended December 31, 2018, which reflects the recognition of upfront consideration that was allocated to R&D services at the time of the collaboration and is recognized from deferred revenue over the term of the respective clinical studies for the specified indications.
For the year ended
December 31, 2017
, the Company recognized
$211,391
as license revenue within collaboration revenue in the Company’s consolidated statements of operations, and research and development revenue of
$1,568
allocated from deferred revenue related to the Celgene collaboration.
F-25
BEIGENE, LTD.
NOTES TO THE CONSOLIDATED FINANCIAL STATEMENTS
FOR THE YEARS ENDED DECEMBER 31, 2018, 2017 AND 2016
(Amounts in thousands of U.S. Dollar (“$”) and Renminbi (“RMB”),
except for number of shares and per share data)
Merck KGaA, Darmstadt Germany
In 2013, the Company entered into a license agreement with Merck KGaA, Darmstadt Germany for lifirafenib, which was amended and restated in 2013 and 2015, in which it granted to Merck KGaA, Darmstadt Germany an exclusive license to develop, manufacture, and, in certain circumstances, commercialize lifirafenib outside of the PRC, and Merck KGaA Darmstadt Germany granted the Company an exclusive license to develop, manufacture and commercialize lifirafenib in the PRC (the “PRC Territory”). In March 2017, the Company regained the worldwide rights to lifirafenib after Merck KGaA, Darmstadt Germany informed the Company that it would not exercise a continuation option, and thus, the ex-PRC portion of the agreements terminated in their entirety, except for certain provisions that survived the termination. In December 2018, the Company received notice from Merck KGaA, Darmstadt Germany that Merck KGaA, Darmstadt Germany was terminating the PRC portion of the agreement. As a result of the termination, Merck KGaA, Darmstadt Germany's exclusive right of first negotiation to acquire exclusive commercialization rights under the lifirafenib RAF dimer program in the PRC was terminated and the Company is no longer required to pay Merck KGaA, Darmstadt Germany royalties on sales of lifirafenib in the PRC or entitled to receive future milestone payments from Merck KGaA, Darmstadt Germany for lifirafenib.
In 2013, the Company also entered into a license agreement with Merck KGaA, Darmstadt Germany for pamiparib, in which it granted to Merck KGaA, Darmstadt Germany an exclusive license to develop, manufacture, and, in certain circumstances, commercialize pamiparib outside of the PRC, and Merck KGaA, Darmstadt Germany granted the Company an exclusive license to develop, manufacture and commercialize pamiparib in the PRC Territory. On October 1, 2015, the Company entered into a purchase of rights agreement with Merck KGaA, Darmstadt Germany, pursuant to which the Company purchased from Merck KGaA, Darmstadt Germany all of its exclusive rights to pamiparib in the ex-PRC territories for consideration of
$10,000
, and reduced the future milestone payments the Company was eligible to receive under the PRC license agreement.
In December 2017, the Company achieved the milestone for dosing a patient in the first Phase 2 clinical trial of pamiparib in the PRC Territory, and the related
$1,000
milestone payment received in January 2018, was recognized as research and development services revenue in year ended
December 31, 2017
.
In May 2018, the Company achieved the milestone for dosing patients in the first Phase 3 clinical trial of pamiparib in the PRC Territory, and the related
$1,500
milestone payment was recognized as research and development services revenue for the year ended
December 31, 2018
. No other milestones were achieved prior to the termination of the agreement.
On December 17, 2018, the Company entered into a letter agreement for the Company to buy back the PRC commercialization option for pamiparib it had granted to Merck KGaA, Darmstadt Germany under the license agreement for initial consideration of
$19,000
. The payment was charged to research and development expense as incurred, as the PRC commercialization option has no alternative future use. As a result of the letter agreement, the license agreement was terminated as of December 31, 2018 and Merck KGaA, Darmstadt Germany was relieved of any future milestone obligations.
As a result of the foregoing termination agreements and notices, as of December 31, 2018, the Company’s license agreements with Merck KGaA, Darmstadt Germany for lifirafenib and pamiparib have been terminated in their entirety.
Zymeworks, Inc.
On November 26, 2018, the Company and Zymeworks entered into collaboration and license agreements whereby the Company acquired licenses to develop and commercialize Zymeworks’ clinical-stage bispecific antibody candidate ZW25 and its preclinical-stage bispecific antibody drug conjugate (ADC) ZW49 in Asia (excluding Japan), Australia, and New Zealand. In addition, Zymeworks granted BeiGene a license to Zymeworks' proprietary Azymetric and EFECT platforms to develop and commercialize globally up to three other bispecific antibodies using the platforms.
Under the collaboration agreements BeiGene will be responsible for all clinical development and regulatory submissions in the licensed territories. BeiGene and Zymeworks have also agreed to collaborate on global development of ZW25 and ZW49 in HER2‑expressing solid tumors, including gastric and breast cancer, with BeiGene enrolling patients and contributing clinical trial data from the licensed territories. Zymeworks retains full rights to both ZW25 and ZW49 outside of the specified countries and will continue to lead global development of these drug candidates.
Under the terms of the license and collaboration agreements for ZW49 and ZW25, Zymeworks received total upfront payments of
$40,000
and is eligible to receive up to an aggregate of $
390,000
in development and commercial milestone payments for both product candidates. In addition, Zymeworks will be eligible to receive tiered royalties on future sales of ZW25 and ZW49 in the licensed territory.
F-26
BEIGENE, LTD.
NOTES TO THE CONSOLIDATED FINANCIAL STATEMENTS
FOR THE YEARS ENDED DECEMBER 31, 2018, 2017 AND 2016
(Amounts in thousands of U.S. Dollar (“$”) and Renminbi (“RMB”),
except for number of shares and per share data)
Under the terms of the research and license agreement for the Azymetric and EFECT platforms, Zymeworks received an upfront payment of
$20,000
and is eligible to receive up to an aggregate of
$702,000
in development and commercial milestone payments for up to three bispecific product candidates developed under the agreement. In addition, Zymeworks will be eligible to receive tiered royalties on future global sales of bispecific products developed by BeiGene under the agreement.
The licenses do not have alternative future uses and the upfront payments totaling
$60,000
were expensed to research and development expense for the year ended
December 31, 2018
in accordance with the Company's acquired in-process research and development expense policy. No milestone payments were accrued as of December 31, 2018.
4. Business Combinations and Asset Acquisitions
Celgene Shanghai
On August 31, 2017, BeiGene HK acquired
100%
of the equity interests of Celgene Shanghai, a wholly-owned subsidiary of Celgene Holdings East Corporation established under the laws of the PRC. Celgene Shanghai is in the business of, among other things, providing marketing and promotional services in connection with certain pharmaceutical products manufactured by Celgene. The name of Celgene Shanghai has been changed to BeiGene Pharmaceutical (Shanghai).
On July 5, 2017, BeiGene and a wholly-owned subsidiary of Celgene, Celgene Logistics Sàrl (“Celgene Logistics”), entered into a license agreement pursuant to which BeiGene has been granted the right to exclusively distribute and promote Celgene’s approved cancer therapies, ABRAXANE®, REVLIMID®, and VIDAZA®, and its investigational agent CC-122 in clinical development (the “Distribution Rights”), in China excluding Hong Kong, Macau and Taiwan (the “Chinese License Agreement”). The China License Agreement became effective on August 31, 2017 contemporaneously with the closing of the acquisition of Celgene Shanghai and the A&R PD-1 License Agreement.
The Company evaluated the acquisition of the Celgene Shanghai equity and the distribution rights acquired under ASU No. 2017-1,
Business Combinations: Clarifying the Definition of a Business
. Because substantially all of the value of the acquisition did not relate to a similar group of assets and the business contained both inputs and processes necessary to manage products and provide economic benefits directly to its owners, it was determined that the acquisition represents a business combination. Therefore, the transaction has been accounted for using the acquisition method of accounting. This method requires that assets acquired and liabilities assumed in a business combination be recognized at their fair values as of the acquisition date.
Share subscription agreement
On August 31, 2017, the Company issued
32,746,416
of its ordinary shares to Celgene Switzerland for an aggregate purchase price of
$150,000
, or
$4.58
per ordinary share, or
$59.55
per ADS, pursuant to a subscription agreement dated July 5, 2017 by and between the Company and Celgene Switzerland (the “Share Subscription Agreement”). See Note 21 for further discussion of the Share Subscription Agreement.
Determination of purchase price
The purchase price of Celgene Shanghai was calculated as
$28,138
, and was comprised of cash consideration of
$4,532
and non-cash consideration of
$23,606
, related to the discount on ordinary shares issued to Celgene in connection with the Share Subscription Agreement. The discount was a result of the increase in fair value of the Company’s shares between the fixed price of
$59.55
per ADS in the Share Subscription Agreement and the fair value per ADS as of the date of issuance, August 31, 2017. The following summarizes the purchase price in the business combination (in thousands).
|
|
Purchase Price
|
||
|
Cash paid to acquire Celgene Shanghai
|
$
|
4,532
|
|
|
Discount on Share Subscription Agreement
|
23,606
|
|
|
|
Total purchase price
|
$
|
28,138
|
|
F-27
BEIGENE, LTD.
NOTES TO THE CONSOLIDATED FINANCIAL STATEMENTS
FOR THE YEARS ENDED DECEMBER 31, 2018, 2017 AND 2016
(Amounts in thousands of U.S. Dollar (“$”) and Renminbi (“RMB”),
except for number of shares and per share data)
Purchase price allocation
The following table summarizes the fair values of assets acquired and liabilities assumed (in thousands):
|
|
Amount
|
||
|
Cash and cash equivalents
|
$
|
24,448
|
|
|
Other current assets
|
518
|
|
|
|
Property and equipment, net
|
204
|
|
|
|
Intangible assets
|
7,500
|
|
|
|
Deferred tax asset
|
1,069
|
|
|
|
Total identifiable assets
|
33,739
|
|
|
|
|
|||
|
Current liabilities
|
(5,710
|
)
|
|
|
Total liabilities assumed
|
(5,710
|
)
|
|
|
|
|||
|
Goodwill
|
109
|
|
|
|
Total fair value of consideration transferred
|
$
|
28,138
|
|
The goodwill resulting from the business combination is primarily attributable to the assembled workforce of the acquired business. The goodwill attributable to the business combination is not deductible for tax purposes.
The following summarizes the business combination as presented on the statement of cash flows (in thousands):
|
Investing activities
|
|
||
|
Cash acquired
|
$
|
24,448
|
|
|
Cash paid to acquire Celgene Shanghai
|
(4,532
|
)
|
|
|
Cash acquired in business combination, net of cash paid
|
$
|
19,916
|
|
|
|
|||
|
Non-cash activities
|
|||
|
Discount provided on sale of ordinary shares for business combination
|
$
|
(23,606
|
)
|
BeiGene Pharmaceuticals (Guangzhou) Co., Ltd.
On September 21, 2018, BeiGene (Guangzhou) Co., Ltd. ("BeiGene Guangzhou") acquired
100%
of the equity interests of Baiji Shenzhou (Guangzhou) Pharmaceuticals Co., Ltd. (formerly known as Huajian Pharmaceuticals Co., Ltd.), which subsequently changed its name to BeiGene Pharmaceuticals (Guangzhou) Co., Ltd., a pharmaceutical distribution company, for total cash consideration of
$612
, including transaction costs of
$59
. The acquisition was concentrated in a single identifiable asset, a drug distribution license, and thus the Company has concluded that the transaction is an asset acquisition as it does not meet the accounting definition of a business combination. The total cost was allocated to the drug distribution license and corresponding deferred tax liability, resulting in a
$816
intangible asset for the license and a deferred tax liability of
$204
.
Beijing Innerway Bio-tech Co., Ltd.
On October 4, 2018, BeiGene HK completed the acquisition of
100%
of the equity interest of Beijing Innerway Bio-tech Co., Ltd., the owner of the Company's research, development and office facility in Changping, Beijing, China, for total cash consideration of
$38,654
. The acquisition was concentrated in a single identifiable asset or group of assets, the building and associated land use right, and thus the Company has concluded that the transaction is an asset acquisition as it does not meet the accounting definition of a business combination. The total cost of the transaction of
$38,865
, which includes transaction costs
F-28
BEIGENE, LTD.
NOTES TO THE CONSOLIDATED FINANCIAL STATEMENTS
FOR THE YEARS ENDED DECEMBER 31, 2018, 2017 AND 2016
(Amounts in thousands of U.S. Dollar (“$”) and Renminbi (“RMB”),
except for number of shares and per share data)
of
$211
, was allocated based on the relative fair values of the net assets acquired, as follows:
|
|
Amount
|
||
|
Land use right
|
$
|
33,783
|
|
|
Building
|
15,874
|
|
|
|
Deferred tax liability
|
(11,221
|
)
|
|
|
Other
|
429
|
|
|
|
Total cost
|
38,865
|
|
|
5. Restricted Cash
The Company’s restricted cash balance of
$27,776
as of December 31, 2018 consisted of BeiGene Guangzhou Biologics Manufacturing Co., Ltd.'s ("BeiGene Guangzhou Factory's") secured deposits held in designated bank accounts for issuance of a letter of credit and import duty tax and restricted cash deposits as security for the long-term bank loan (Note 15).
6. Short-Term Investments
Short-term investments as of
December 31, 2018
consisted of the following available-for-sale debt securities:
|
|
Amortized
Cost
|
Gross
Unrealized
Gains
|
Gross
Unrealized
Losses
|
Fair Value
(Net Carrying
Amount)
|
|||||||
|
|
$
|
$
|
$
|
$
|
|||||||
|
U.S. treasury securities
|
1,066,770
|
|
1,802
|
|
63
|
|
1,068,509
|
|
|||
|
Total
|
1,066,770
|
|
1,802
|
|
63
|
|
1,068,509
|
|
|||
Short-term investments as of
December 31, 2017
consisted of the following available-for-sale debt securities and time deposits:
|
|
Amortized
Cost |
Gross
Unrealized Gains |
Gross
Unrealized Losses |
Fair Value
(Net Carrying Amount) |
|||||||
|
|
$
|
$
|
$
|
$
|
|||||||
|
U.S. treasury securities
|
561,733
|
|
—
|
|
406
|
|
561,327
|
|
|||
|
U.S. agency securities
|
17,651
|
|
12
|
|
—
|
|
17,663
|
|
|||
|
Time deposits
|
18,924
|
|
—
|
|
—
|
|
18,924
|
|
|||
|
Total
|
598,308
|
|
12
|
|
406
|
|
597,914
|
|
|||
The Company does not consider the investments in U.S. treasury securities to be other-than-temporarily impaired at
December 31, 2018
.
7. Inventories
The Company’s inventory balance of $
16,242
and
$10,930
as of
December 31, 2018
and 2017, respectively, consisted entirely of finished goods product purchased from Celgene for distribution in the PRC.
8. Manufacturing Facility in Guangzhou
On March 7, 2017, BeiGene HK, a wholly owned subsidiary of the Company, and Guangzhou GET Technology Development Co., Ltd. ("GET"), entered into a definitive agreement to establish a commercial scale biologics manufacturing facility in Guangzhou, Guangdong Province, PRC.
F-29
BEIGENE, LTD.
NOTES TO THE CONSOLIDATED FINANCIAL STATEMENTS
FOR THE YEARS ENDED DECEMBER 31, 2018, 2017 AND 2016
(Amounts in thousands of U.S. Dollar (“$”) and Renminbi (“RMB”),
except for number of shares and per share data)
On March 7, 2017, BeiGene HK and GET entered into an Equity Joint Venture Contract (the “JV Agreement”). Under the terms of the JV Agreement, BeiGene HK made an initial cash capital contribution of RMB
200,000
and a subsequent contribution of
one
or more biologics assets in exchange for a
95%
equity interest in BeiGene Biologics. GET made a cash capital contribution of RMB
100,000
to BeiGene Biologics, representing a
5%
equity interest in BeiGene Biologics. In addition, on March 7, 2017, BeiGene Biologics entered into a contract with GET, under which GET agreed to provide a RMB
900,000
loan (the “Shareholder Loan”) to BeiGene Biologics (see Note 16). BeiGene Biologics is working to establish a biologics manufacturing facility in Guangzhou, through a wholly-owned subsidiary, the BeiGene Guangzhou Factory, to manufacture biologics for the Company and its subsidiaries.
On April 11, 2017, BeiGene HK, GET and BeiGene Biologics amended the JV Agreement and the capital contribution agreement, among other things, to adjust the capital contribution schedules and adjust the initial term of the governing bodies and a certain management position. On April 13, 2017 and May 4, 2017, BeiGene HK made cash capital contributions of RMB
137,830
and RMB
2,415
, respectively, into BeiGene Biologics. The remainder of the cash capital contribution from BeiGene HK to BeiGene Biologics will be paid by April 10, 2020. On April 14, 2017, GET made cash capital contributions of RMB
100,000
into BeiGene Biologics. On April 14, 2017, BeiGene Biologics drew down the Shareholder Loan of RMB
900,000
from GET (as further described in Note 16).
In the fourth quarter of 2017, BeiGene HK and BeiGene Biologics entered into an Equity Transfer Agreement to transfer
100%
of the equity interest of BeiGene Shanghai into BeiGene Biologics. The transfer consideration for the purchased interests under this Equity Transfer Agreement is the fair value of the
100%
equity of BeiGene Shanghai appraised by a qualified Chinese valuation firm under the laws of the PRC. Upon the transfer of equity in BeiGene Shanghai, BeiGene HK's equity interest in BeiGene Shanghai became
95%
. As of
December 31, 2018
, the Company and GET held
95%
and
5%
equity interests in BeiGene Biologics, respectively.
As of
December 31, 2018
, the Company's cash and cash equivalents, restricted cash and short-term investments included $
149,069
of cash and cash equivalents, restricted cash and short-term investments held by BeiGene Biologics to be used to build the commercial scale biologics facility and to fund research and development of the Company's biologics drug candidates in China.
9. Property and Equipment
Property and equipment are recorded at cost and consisted of the following:
|
|
As of December 31,
|
||||
|
|
2018
|
2017
|
|||
|
|
$
|
$
|
|||
|
Laboratory equipment
|
22,636
|
|
15,596
|
|
|
|
Leasehold improvements
|
18,048
|
|
15,298
|
|
|
|
Building
|
15,857
|
|
—
|
|
|
|
Manufacturing equipment
|
16,048
|
|
15,737
|
|
|
|
Office equipment
|
2,216
|
|
1,597
|
|
|
|
Electronic equipment
|
1,229
|
|
1,244
|
|
|
|
Computer software
|
1,262
|
|
598
|
|
|
|
Property and equipment, at cost
|
77,296
|
|
50,070
|
|
|
|
Less: Accumulated depreciation
|
(19,722
|
)
|
(13,627
|
)
|
|
|
Construction in progress
|
99,487
|
|
26,125
|
|
|
|
Property and equipment, net
|
157,061
|
|
62,568
|
|
|
Construction in progress as of
December 31, 2018
and 2017 of $
99,487
and
$26,125
, respectively, primarily related to the buildout of the Guangzhou manufacturing facility. Depreciation expense for the years ended
December 31, 2018
,
2017
and
2016
were $
9,000
, $
4,340
and $
1,909
, respectively.
F-30
BEIGENE, LTD.
NOTES TO THE CONSOLIDATED FINANCIAL STATEMENTS
FOR THE YEARS ENDED DECEMBER 31, 2018, 2017 AND 2016
(Amounts in thousands of U.S. Dollar (“$”) and Renminbi (“RMB”),
except for number of shares and per share data)
10. Land Use Rights
The land use rights represent the land acquired for constructing and operating the biologics manufacturing facility in Guangzhou, and the land acquired in 2018 for the Company's research, development and office facility in Changping, Beijing (Note 4). The land use rights are amortized over the remaining term of the rights.
The land use rights assets as of
December 31, 2018
and
2017
are summarized as follows:
|
|
As of December 31,
|
||||
|
|
2018
|
2017
|
|||
|
|
$
|
$
|
|||
|
Land use rights, cost
|
45,701
|
|
12,633
|
|
|
|
Accumulated amortization
|
(643
|
)
|
(168
|
)
|
|
|
Land use rights, net
|
45,058
|
|
12,465
|
|
|
Amortization expense of the land use rights for the years ended
December 31, 2018
, 2017 and 2016 was $
494
,
$168
and
nil
, respectively.
As of
December 31, 2018
, expected amortization expense for the land use rights is approximately
$1,181
in 2019,
$1,181
in 2020,
$1,181
in 2021,
$1,181
in 2022,
$1,181
in 2023 and
$39,153
in 2024 and thereafter.
11. Intangible Assets
Intangible assets as of
December 31, 2018
and
December 31, 2017
are summarized as follows:
|
|
December 31, 2018
|
December 31, 2017
|
|||||||||||||||
|
|
Gross
carrying
amount
|
Accumulated
amortization
|
Intangible
assets, net
|
Gross
carrying amount |
Accumulated
amortization |
Intangible
assets, net |
|||||||||||
|
Finite-lived intangible assets:
|
|
|
|
|
|
|
|
|
|
||||||||
|
Product distribution rights
|
7,500
|
|
(1,000
|
)
|
6,500
|
|
7,500
|
|
(250
|
)
|
7,250
|
|
|||||
|
Trading license
|
816
|
|
(144
|
)
|
672
|
|
—
|
|
—
|
|
—
|
|
|||||
|
Total finite-lived intangible assets
|
8,316
|
|
(1,144
|
)
|
7,172
|
|
7,500
|
|
(250
|
)
|
7,250
|
|
|||||
Product distribution rights consist of distribution rights on the approved cancer therapies licensed from Celgene, ABRAXANE®, REVLIMID®, and VIDAZA®, and its investigational agent CC-122 acquired as part of the Celgene transaction. The Company is amortizing the product distribution rights over a period of
10 years
. The trading license represents the Guangzhou drug distribution license acquired on September 21, 2018. The Company is amortizing the drug distribution trading license over the remainder of the license term through February 2020.
Amortization expense of intangible assets for the years ended
December 31, 2018
,
2017
and
2016
was $
894
,
$250
and
nil
, respectively. As of
December 31, 2018
, expected amortization expense for the unamortized finite-lived intangible assets is approximately $
1,326
in 2019, $
846
in 2020, $
750
in 2021, $
750
in 2022, $
750
in 2023, and $
2,750
in 2024 and thereafter.
12. Income Taxes
Cayman Islands
The Company is incorporated in the Cayman Islands. Under the current laws of the Cayman Islands, the Company is not subject to income tax.
F-31
BEIGENE, LTD.
NOTES TO THE CONSOLIDATED FINANCIAL STATEMENTS
FOR THE YEARS ENDED DECEMBER 31, 2018, 2017 AND 2016
(Amounts in thousands of U.S. Dollar (“$”) and Renminbi (“RMB”),
except for number of shares and per share data)
Hong Kong
BeiGene Hong Kong is subject to Hong Kong Profits Tax at a rate of
16.5%
. BeiGene Hong Kong had
no
assessable profits derived from or earned in Hong Kong for any of the periods presented; therefore,
no
provision for income taxes is required.
China
BeiGene conducts business in China through multiple subsidiaries that are subject to a tax rate of
25%
in accordance with the 2008 EIT Law. Under the EIT Law, all enterprises are subject to the
25%
enterprise income tax rate, except for certain entities that enjoyed the tax holidays or preferential tax treatments. Under the EIT Law and its relevant regulations, dividends paid by China enterprises out of profits earned post-2007 to non-China tax resident investors are subject to China withholding tax of
10%
. A lower withholding tax rate may be applied based on applicable tax treaty with certain jurisdictions.
Australia
BeiGene AUS Pty Ltd. is subject to corporate income tax at a rate of
30%
. BeiGene AUS Pty Ltd. has
no
taxable income for all periods presented; therefore,
no
provision for income taxes is required.
United States
BeiGene USA is subject to U.S. federal corporate income tax at a rate of
21%
for the year ended
December 31, 2018
, and
35%
for the years ended December 31,
2017
and
2016
. BeiGene USA is subject to income tax in California, Massachusetts, New Jersey, and various other states and localities for the year ended
December 31, 2018
.
Switzerland
BeiGene Switzerland is subject to corporate income tax at a rate of
10.5%
. BeiGene Switzerland had
no
taxable income for the year ended
December 31, 2018
; therefore,
no
provision for income taxes is required.
The components of income
(
loss) before income taxes are as follows:
|
|
Year Ended December 31,
|
|||||||
|
|
2018
|
2017
|
2016
|
|||||
|
|
$
|
$
|
$
|
|||||
|
PRC
|
(130,552
|
)
|
(59,590
|
)
|
(7,352
|
)
|
||
|
U.S.
|
15,036
|
|
6,928
|
|
678
|
|
||
|
Other
|
(574,313
|
)
|
(38,402
|
)
|
(112,489
|
)
|
||
|
Total
|
(689,829
|
)
|
(91,064
|
)
|
(119,163
|
)
|
||
F-32
BEIGENE, LTD.
NOTES TO THE CONSOLIDATED FINANCIAL STATEMENTS
FOR THE YEARS ENDED DECEMBER 31, 2018, 2017 AND 2016
(Amounts in thousands of U.S. Dollar (“$”) and Renminbi (“RMB”),
except for number of shares and per share data)
The current and deferred components of the income tax expense (benefit) from continuing operations are as follows:
|
|
Year Ended December 31,
|
|||||||
|
|
2018
|
2017
|
2016
|
|||||
|
|
$
|
$
|
|
|||||
|
Current Tax Expense (Benefit):
|
|
|
|
|||||
|
PRC
|
6,890
|
|
2,477
|
|
—
|
|
||
|
U.S.
|
(377
|
)
|
5,695
|
|
822
|
|
||
|
Total
|
6,513
|
|
8,172
|
|
822
|
|
||
|
Deferred Tax Expense (Benefit):
|
||||||||
|
PRC
|
(2,682
|
)
|
115
|
|
—
|
|
||
|
U.S.
|
(19,627
|
)
|
(6,052
|
)
|
(768
|
)
|
||
|
Total
|
(22,309
|
)
|
(5,937
|
)
|
(768
|
)
|
||
|
Income Tax Expense (Benefit)
|
(15,796
|
)
|
2,235
|
|
54
|
|
||
The reconciliation of the statutory tax rate to our effective income tax rate is as follow:
|
|
Year Ended December 31,
|
|||||||
|
|
2018
|
2017
|
2016
|
|||||
|
|
$
|
$
|
$
|
|||||
|
Loss before tax
|
(689,829
|
)
|
(91,064
|
)
|
(119,163
|
)
|
||
|
China statutory tax rate
|
25
|
%
|
25
|
%
|
25
|
%
|
||
|
Expected taxation at China statutory tax rate
|
(172,457
|
)
|
(22,766
|
)
|
(29,791
|
)
|
||
|
Foreign tax rate differential
|
134,673
|
|
23,275
|
|
27,830
|
|
||
|
Non-deductible expenses
|
4,471
|
|
1,608
|
|
593
|
|
||
|
Impact of U.S. statutory tax rate change
|
1,538
|
|
2,642
|
|
—
|
|
||
|
Deductible intellectual property from intercompany transfer
|
—
|
|
(29,438
|
)
|
—
|
|
||
|
Change in valuation allowance
|
34,009
|
|
30,356
|
|
1,627
|
|
||
|
Research and orphan drug tax credits
|
(12,659
|
)
|
(5,431
|
)
|
(205
|
)
|
||
|
Share-based compensation expense
|
(5,371
|
)
|
1,989
|
|
—
|
|
||
|
Taxation for the year
|
(15,796
|
)
|
2,235
|
|
54
|
|
||
|
Effective tax rate
|
2.3
|
%
|
-2.5
|
%
|
-0.1
|
%
|
||
F-33
BEIGENE, LTD.
NOTES TO THE CONSOLIDATED FINANCIAL STATEMENTS
FOR THE YEARS ENDED DECEMBER 31, 2018, 2017 AND 2016
(Amounts in thousands of U.S. Dollar (“$”) and Renminbi (“RMB”),
except for number of shares and per share data)
Significant components of deferred tax assets (liabilities) are as follows:
|
|
Year Ended December 31,
|
|||||||
|
|
2018
|
2017
|
2016
|
|||||
|
|
$
|
$
|
$
|
|||||
|
Deferred Tax Assets:
|
|
|
|
|
|
|
||
|
Accruals and reserves
|
19,193
|
|
7,756
|
|
1,102
|
|
||
|
Net operating losses carryforward
|
61,266
|
|
29,801
|
|
6,987
|
|
||
|
Stock compensation
|
8,642
|
|
4,639
|
|
—
|
|
||
|
Research and orphan drug tax credits
|
13,608
|
|
2,449
|
|
—
|
|
||
|
Depreciation and amortization
|
158,639
|
|
—
|
|
—
|
|
||
|
Gross deferred tax assets
|
261,348
|
|
44,645
|
|
8,089
|
|
||
|
Less valuation allowance
|
(242,945
|
)
|
(36,600
|
)
|
(7,307
|
)
|
||
|
Total deferred tax assets
|
18,403
|
|
8,045
|
|
782
|
|
||
|
Deferred tax liabilities:
|
||||||||
|
Depreciation and amortization
|
—
|
|
(370
|
)
|
(14
|
)
|
||
|
Total deferred tax liabilities
|
—
|
|
(370
|
)
|
(14
|
)
|
||
|
Net deferred tax asset
|
18,403
|
|
7,675
|
|
768
|
|
||
Valuation allowances have been provided on deferred tax assets where, based on all available evidence, it was considered more likely than not that some portion or all of the recorded deferred tax assets will not be realized in future periods. After consideration of all positive and negative evidence, the Company believes that as of
December 31, 2018
it is more likely than not the deferred tax assets will not be realized for our subsidiaries in Australia and Switzerland, and for certain subsidiaries in China. For the years ended
December 31, 2018
and
2017
, there were increases in the valuation allowance (excluding valuation allowances charged to beginning accumulated deficit as detailed in Note 2) of $
34,009
and $
30,356
, respectively, which included the effect of expired net operating losses in 2017 of $
1,637
. Adjustments could be required in the future if the Company estimates that the amount of deferred tax assets to be realized is more or less than the net amount recorded.
As of
December 31, 2018
and
2017
, the Company had net operating losses of approximately $
300,769
and $
209,979
, respectively, of which net operating losses as of
December 31, 2018
included
$47,379
from an entity in Australia that has indefinite carryforward, $
129,922
derived from entities in the PRC which expire in years 2020 through 2023, $
100,780
derived from an entity in Switzerland that expires in 2025, and
$22,688
derived from an entity in the U.S. that has indefinite carryforward. The Company has approximately $
14,897
of U.S. research and orphan drug credits which will begin to expire in 2033.
The gross unrecognized tax benefits for the years ended
December 31, 2018
,
2017
and
2016
were as follows:
|
|
Year Ended December 31,
|
|||||||
|
|
2018
|
2017
|
2016
|
|||||
|
|
$
|
$
|
$
|
|||||
|
Beginning balance, as of January 1
|
918
|
|
110
|
|
—
|
|
||
|
Additions based on tax positions related to prior tax years
|
11
|
|
234
|
|
—
|
|
||
|
Reductions based on tax positions related to prior tax years
|
(44
|
)
|
(91
|
)
|
—
|
|
||
|
Additions based on tax positions related to the current tax year
|
1,410
|
|
665
|
|
110
|
|
||
|
Ending balance, as of December 31
|
2,295
|
|
918
|
|
110
|
|
||
Current year and prior year additions include assessment of potential global transfer pricing adjustments, and U.S. federal and state tax credits and incentives. $
1,532
of unrecognized tax benefits as of
December 31, 2018
would impact the
F-34
BEIGENE, LTD.
NOTES TO THE CONSOLIDATED FINANCIAL STATEMENTS
FOR THE YEARS ENDED DECEMBER 31, 2018, 2017 AND 2016
(Amounts in thousands of U.S. Dollar (“$”) and Renminbi (“RMB”),
except for number of shares and per share data)
consolidated income tax rate if ultimately recognized. The Company does not anticipate that the amount of existing unrecognized tax benefits will significantly change within the next
12 months
.
The Company has elected to record interest and penalties related to income taxes as a component of income tax expense. For the years ended
December 31, 2018
,
2017
and
2016
, the Company's accrued interest and penalties, where applicable, related to uncertain tax positions were not material.
The Company conducts business in a number of tax jurisdictions and, as such, is required to file income tax returns in multiple jurisdictions globally. As of
December 31, 2018
, Australia tax matters are open to examination for the years 2013 through 2018, China tax matters are open to examination for the years 2013 through 2018, and U.S. federal tax matters are open to examination for years 2015 through 2018. Various U.S. states and other non-US tax jurisdictions in which the Company files tax returns remain open to examination for 2010 through 2018.
As of December 31, 2018, the Company asserts indefinite reinvestment on the excess of the financial reporting bases over tax bases in the Company's investments in foreign subsidiaries. A deferred tax liability has not been established for the approximately
$7,100
of cumulative undistributed foreign earnings in subsidiaries with financial reporting basis over tax basis. Determination of the unrecognized deferred tax liability is not practicable.
13. Supplemental Balance Sheet Information
Prepaid expenses and other current assets consist of the following:
|
|
As of December 31,
|
||||
|
|
2018
|
2017
|
|||
|
|
$
|
$
|
|||
|
Prepaid research and development costs
|
58,673
|
|
21,156
|
|
|
|
Prepaid taxes
|
14,588
|
|
9,894
|
|
|
|
Interest receivable
|
3,096
|
|
1,557
|
|
|
|
Other
|
5,585
|
|
3,016
|
|
|
|
Total
|
81,942
|
|
35,623
|
|
|
Other non-current assets consist of the following:
|
|
As of December 31,
|
||||
|
|
2018
|
2017
|
|||
|
|
$
|
$
|
|||
|
Prepayment of property and equipment
|
11,981
|
|
12,867
|
|
|
|
Payment of facility capacity expansion activities (1)
|
25,193
|
|
—
|
|
|
|
Tax on intra-entity contribution of subsidiary
|
—
|
|
28,588
|
|
|
|
Prepaid VAT
|
14,671
|
|
—
|
|
|
|
Rental deposits and other
|
1,823
|
|
1,460
|
|
|
|
Total
|
53,668
|
|
42,915
|
|
|
(1) Represents a payment for a facility expansion under a commercial supply agreement. The payment will be credited back to the Company through credits on supply purchases over the life of the supply agreement.
F-35
BEIGENE, LTD.
NOTES TO THE CONSOLIDATED FINANCIAL STATEMENTS
FOR THE YEARS ENDED DECEMBER 31, 2018, 2017 AND 2016
(Amounts in thousands of U.S. Dollar (“$”) and Renminbi (“RMB”),
except for number of shares and per share data)
Accrued expenses and other payables consisted of the following:
|
|
As of December 31,
|
||||
|
|
2018
|
2017
|
|||
|
|
$
|
$
|
|||
|
Compensation related
|
35,887
|
|
17,051
|
|
|
|
External research and development activities related
|
34,588
|
|
18,721
|
|
|
|
Commercial activities
|
10,433
|
|
2,350
|
|
|
|
Individual income tax and other taxes
|
8,030
|
|
5,088
|
|
|
|
Sales rebates and returns related
|
4,749
|
|
3,997
|
|
|
|
Other
|
6,727
|
|
2,391
|
|
|
|
Total accrued expenses and other payables
|
100,414
|
|
49,598
|
|
|
Other long-term liabilities consist of the following:
|
|
As of December 31,
|
||||
|
|
2018
|
2017
|
|||
|
|
$
|
$
|
|||
|
Deferred government grant income
|
37,851
|
|
31,804
|
|
|
|
Other
|
1,080
|
|
155
|
|
|
|
Total other long-term liabilities
|
38,931
|
|
31,959
|
|
|
14. Warrants and Option Liabilities
Option to purchase shares by rental deferral
On September 1, 2012, in conjunction with a lease agreement for one of its premises, the Company granted the landlord an option to purchase the Company's ordinary shares (the “Option”) in exchange for the deferral of the payment of
one
year's rental expense. The Option was a freestanding instrument and was recorded as a liability in accordance with ASC480, Distinguishing Liabilities from Equity. The Option was initially recognized at fair value with subsequent changes in fair value recorded in losses. Prior to its U.S. IPO, the Company determined the fair value of the Option with the assistance of an independent third-party valuation firm. On February 8, 2016, immediately prior to its U.S. IPO, the landlord exercised the Option to purchase
1,451,586
ordinary shares of the Company. As the exercise date was the U.S. IPO closing date, the exercise date fair value of the Option of
$2,540
was determined based on its intrinsic value, which equaled the difference between the share price at the U.S. IPO closing date and the exercise price of such purchased ordinary shares. During the years ended
December 31, 2018
,
2017
and
2016
, the Company recognized a loss from the increase in fair value of the Option of
nil
,
nil
and $
1,151
, respectively.
Warrants in connection with convertible promissory notes
During the years ended December 31, 2012 to 2014, the Company entered into agreements with several investors to issue convertible promissory notes and related warrants to purchase the Company's preferred shares up to
10%
of the convertible promissory notes' principal amount concurrently, for an aggregate principal amount of
$2,410
. The warrants were freestanding instruments and recorded as liabilities in accordance with ASC480. The warrants were initially recognized at fair value with subsequent changes in fair value recorded in losses. In January 2016 and February 2016, the warrants were exercised for
621,637
preferred shares, which were then converted into
621,637
ordinary shares. As the exercise dates were very close to the U.S. IPO closing date, the respective exercise date fair value of the warrants of
$1,148
was determined based on the intrinsic value, which equaled the difference between the share price at the U.S. IPO closing date and the exercise price of the issued warrants. For the years ended
December 31, 2018
,
2017
and
2016
, the Company recognized a loss from the increase in fair value of
nil
,
nil
and $
363
, respectively.
F-36
BEIGENE, LTD.
NOTES TO THE CONSOLIDATED FINANCIAL STATEMENTS
FOR THE YEARS ENDED DECEMBER 31, 2018, 2017 AND 2016
(Amounts in thousands of U.S. Dollar (“$”) and Renminbi (“RMB”),
except for number of shares and per share data)
15. Long-Term Bank Loan
On September 2, 2015, BeiGene Suzhou entered into a loan agreement with Suzhou Industrial Park Biotech Development Co., Ltd. and China Construction Bank to borrow $
17,454
(RMB
120,000
) at a
7%
fixed annual interest rate. The loan is secured by BeiGene Suzhou's equipment with a carrying amount of $
13,638
and the Company's rights to a PRC patent on a drug candidate. In September 2018, the Company repaid the first tranche of $
8,736
(RMB
60,000
). The remaining loan principal amount outstanding as of December 31, 2018 of $
8,727
is repayable on September 30, 2019.
On April 4, 2018, BeiGene Guangzhou Factory entered into a
nine
-year loan agreement with China Construction Bank to borrow a RMB denominated loan of
$84,358
(RMB
580,000
) at a floating interest rate benchmarking RMB loan interest rates of financial institutions in PRC. The loan is secured by BeiGene Guangzhou Factory’s land use right. Interest expense will be paid quarterly until the loan is fully settled. As of December 31, 2018, the Company has drawn down
$40,725
of this loan. The loan interest rate was
4.9%
for the year ended December 31, 2018, and the maturity dates range from 2021 to 2027.
As of December 31, 2018, the Company has unused long-term credit availability amounting to
$43,633
, attributed to the remaining credit available under the Guangzhou Factory loan. The Company plans to draw down the entire available amount before December 31, 2019. Interest expense recognized for the years ended
December 31, 2018
,
2017
and
2016
amounted to $
2,253
, $
1,260
and $
851
, respectively, among which,
$575
,
nil
and
nil
was capitalized, respectively.
16. Shareholder Loan
On March 7, 2017, BeiGene Biologics entered into the Shareholder Loan Contract with GET, pursuant to which GET agreed to provide the Shareholder Loan of RMB
900,000
to BeiGene Biologics. The Shareholder Loan has a conversion feature, settled in a variable number of shares of common stock upon conversion (the “debt-to-equity conversion”). On April 14, 2017, BeiGene Biologics drew down the entire Shareholder Loan of RMB
900,000
from GET.
Key features of the Shareholder Loan
The Shareholder Loan bears simple interest at a fixed rate of
8%
per annum. No interest payment is due or payable prior to the repayment of the principal or the debt-to-equity conversion. The term of the Shareholder Loan is
72 months
, commencing from the actual drawdown date of April 14, 2017 and ending on April 13, 2023, unless converted earlier.
The Shareholder Loan may be repaid or converted, either partially or in full, into an additional mid-single digit percentage equity interest in BeiGene Biologics prior to its maturity date, pursuant to the terms of the JV Agreement. BeiGene Biologics has the right to make early repayment at any time; provided, however, that if repayment is to occur before the debt-to-equity conversion it would require written approval of both BeiGene Biologics and GET. Upon conversion of the shareholder loan, GET will receive an additional equity interest in BeiGene Biologics, which will be based on the formula outlined in the JV Agreement.
The Shareholder Loan can only be used for BeiGene Biologics, including the construction and operation of the biologics manufacturing facility and research and development and clinical trials to be carried out by BeiGene Biologics. If BeiGene Biologics does not use the Shareholder Loan proceeds for the specified purposes, GET may be entitled to certain liquidated damages. In the event of an early termination of the JV Agreement, the Shareholder Loan will become due and payable at the time of termination of the JV Agreement.
Accounting for the Shareholder Loan
The Shareholder Loan is classified as a long-term liability and initially measured at the principal of RMB
900,000
. Interest will be accrued based on the interest rate of
8%
per annum. As the Shareholder Loan may be share-settled by a number of shares with a fair value equal to a fixed settlement amount, the settlement is not viewed as a conversion feature, but as a redemption feature because the settlement amount does not vary with the share price. This in-substance redemption feature does not require bifurcation because it is clearly and closely related to the debt host that does not involves a substantial premium or discount. Since there is no conversion feature embedded in the Shareholder Loan, no beneficial conversion feature was recorded. There are no other embedded derivatives that are required to be bifurcated. The portion of interest accrued on the
F-37
BEIGENE, LTD.
NOTES TO THE CONSOLIDATED FINANCIAL STATEMENTS
FOR THE YEARS ENDED DECEMBER 31, 2018, 2017 AND 2016
(Amounts in thousands of U.S. Dollar (“$”) and Renminbi (“RMB”),
except for number of shares and per share data)
Shareholder Loan related to borrowings used to construct the BeiGene factory in Guangzhou is being capitalized in accordance with ASC 835-20, Interest – Capitalization of Interest.
For the years ended
December 31, 2018
and
December 31, 2017
, total interest expense generated from the Shareholder Loan was $
10,894
and
$7,649
, respectively, among which, $
3,112
and
$614
was capitalized, respectively.
17. Product Revenue
The Company’s product sales are derived from the sale of ABRAXANE®, REVLIMID®, and VIDAZA® in China under a distribution license from Celgene. The table below presents the Company’s net product sales for the years ended
December 31, 2018
,
2017
and
2016
.
|
|
Year Ended
December 31,
|
|||||||
|
|
2018
|
2017
|
2016
|
|||||
|
|
$
|
$
|
$
|
|||||
|
Product revenue - gross
|
138,046
|
|
28,428
|
|
—
|
|
||
|
Less: Rebates and sales returns
|
(7,161
|
)
|
(4,000
|
)
|
—
|
|
||
|
Product revenue - net
|
130,885
|
|
24,428
|
|
—
|
|
||
The following table presents the rollforward of accrued sales rebates and returns for the years ended
December 31, 2018
and
December 31, 2017
.
|
|
Sales Rebates and Returns
|
|
|
|
$
|
|
|
Balance as of December 31, 2016
|
—
|
|
|
Accrual
|
4,000
|
|
|
Payment
|
(3
|
)
|
|
Balance as of December 31, 2017
|
3,997
|
|
|
Accrual
|
7,161
|
|
|
Payment
|
(6,409
|
)
|
|
Balance as of December 31, 2018
|
4,749
|
|
18. Loss Per Share
Loss per share was calculated as follows:
|
|
Year Ended December 31,
|
|||||||
|
|
2018
|
2017
|
2016
|
|||||
|
|
$
|
$
|
$
|
|||||
|
Numerator:
|
|
|
|
|
|
|
||
|
Net loss attributable to BeiGene, Ltd.
|
(673,769
|
)
|
(93,105
|
)
|
(119,217
|
)
|
||
|
Denominator:
|
||||||||
|
Weighted average shares outstanding for computing basic and diluted loss per share
|
720,753,819
|
|
543,185,460
|
|
403,619,446
|
|
||
|
Net loss per share attributable to BeiGene, Ltd., basic and diluted
|
(0.93
|
)
|
(0.17
|
)
|
(0.30
|
)
|
||
For the years ended
December 31, 2018
,
2017
and
2016
, the computation of basic loss per share using the two-class method was not applicable, as the Company was in a net loss position.
F-38
BEIGENE, LTD.
NOTES TO THE CONSOLIDATED FINANCIAL STATEMENTS
FOR THE YEARS ENDED DECEMBER 31, 2018, 2017 AND 2016
(Amounts in thousands of U.S. Dollar (“$”) and Renminbi (“RMB”),
except for number of shares and per share data)
The effects of all share options and restricted share units were excluded from the calculation of diluted loss per share as their effect would have been anti-dilutive during the years ended
December 31, 2018
and
2017
.
The effects of all convertible preferred shares, share options, warrants and options to purchase ordinary or preferred shares were excluded from the calculation of diluted loss per share, as their effect would have been anti-dilutive during the year ended December 31,
2016
.
19. Share-Based Compensation Expense
2016 Share Option and Incentive Plan
On January 14, 2016, in connection with its U.S. IPO, the board of directors and shareholders of the Company approved the 2016 Share Option and Incentive Plan (the “2016 Plan”), which became effective on February 2, 2016. The Company initially reserved
65,029,595
ordinary shares for the issuance of awards under the 2016 Plan, plus any shares available under the 2011 Option Plan (the “2011 Plan”), and not subject to any outstanding options as of the effective date of the 2016 Plan, along with underlying share awards under the 2011 Plan that are cancelled or forfeited without issuance of ordinary shares. As of
December 31, 2018
, ordinary shares cancelled or forfeited under the 2011 Plan that were carried over to the 2016 Plan totaled
5,144,371
. The 2016 Plan provided for an annual increase in the shares available for issuance, to be added on the first day of each fiscal year, beginning on January 1, 2017, equal to the lesser of (i) five percent
(5)%
of the outstanding shares of the Company's ordinary shares on the last day of the immediately preceding fiscal year or (ii) such number of shares determined by the Company’s board of directors or the compensation committee. On January 1, 2018,
29,603,616
ordinary shares were added to the 2016 Plan under this provision. In August 2018, in connection with the Hong Kong IPO, the board of directors of the Company approved an amended and restated 2016 Plan to remove this "evergreen" provision and implement other changes required by the HKEx rules. In December 2018, the board of directors approved a second amended and restated 2016 Plan to increase the number of shares authorized for issuance by
38,553,159
ordinary shares, as well as amend the cap on annual compensation to independent directors and make other changes. The number of shares available for issuance under the 2016 Plan is subject to adjustment in the event of a share split, share dividend or other change in the Company’s capitalization.
As of
December 31, 2018
, share-based awards to acquire
57,889,708
ordinary shares were available for future grant under the 2016 Plan.
2018 Inducement Equity Plan
On June 6, 2018, the board of directors of the Company approved the 2018 Inducement Equity Plan (the “2018 Plan”) and reserved
12,000,000
ordinary shares to be used exclusively for grants of awards to individuals that were not previously employees of the Company or its subsidiaries, as a material inducement to the individual’s entry into employment with the Company or its subsidiaries within the meaning of Rule 5635(c)(4) of the NASDAQ Listing Rules. The 2018 Plan was approved by the board of directors upon recommendation of the compensation committee, without shareholder approval pursuant to Rule 5635(c)(4) of the NASDAQ Listing Rules. The terms and conditions of the 2018 Plan, and the forms of award agreements to be used thereunder, are substantially similar to the 2016 Plan and the forms of award agreements thereunder. In August 2018, in connection with the listing of the Company’s ordinary shares on the HKEx, the board of directors of the Company approved an amended and restated 2018 Plan to implement changes required by the HKEx rules.
2018 Employee Share Purchase Plan
On June 6, 2018, the shareholders of the Company approved the 2018 Employee Share Purchase Plan (the “ESPP”). Initially,
3,500,000
ordinary shares of the Company were reserved for issuance under the ESPP. In August 2018, in connection with the Hong Kong IPO, the board of directors of the Company approved an amended and restated ESPP to remove an “evergreen” share replenishment provision originally included in the plan and implement other changes required by the HKEx rules. In December 2018, the board of directors approved a second amended and restated ESPP to increase the number of shares authorized for issuance by
3,855,315
ordinary shares to
7,355,315
ordinary shares. The ESPP allows eligible employees to purchase the Company’s ordinary shares (including in the form of ADSs) at the end of each offering period, which will generally be six months, at a
15%
discount to the market price of the Company’s ADSs at the beginning or the end of each offering period, whichever is lower, using funds deducted from their payroll during the offering period. Eligible employees are able to authorize payroll deductions of up to
10%
of their eligible earnings, subject to applicable limitations.
F-39
BEIGENE, LTD.
NOTES TO THE CONSOLIDATED FINANCIAL STATEMENTS
FOR THE YEARS ENDED DECEMBER 31, 2018, 2017 AND 2016
(Amounts in thousands of U.S. Dollar (“$”) and Renminbi (“RMB”),
except for number of shares and per share data)
The first offering under the ESPP began on September 1, 2018 and will end on February 28, 2019. The fair value of options issued under the ESPP is calculated using the Black-Scholes option pricing model. As of December 31, 2018,
no
shares have been issued under the ESPP. Expenses incurred to date under the ESPP have been immaterial.
Share options
Generally, options have a contractual term of
10 years
and vest over a
three
- to
five
-year period, with the first tranche vesting one calendar year after the grant date or the service relationship start date and the remainder of the awards vesting on a monthly basis thereafter. Restricted shares and restricted share units vest over a
four
-year period, with the first tranche vesting one calendar year after the grant date or the service relationship start date and the remainder of the awards vesting on a yearly basis thereafter.
The following table summarizes the Company’s share option activities under the 2011, 2016 and 2018 Plans:
|
|
Number of
Options
|
Weighted
Average
Exercise
Price
|
Weighted
Average
Grant
Date Fair
Value
|
Weighted
Average
Remaining
Contractual
Term
|
Aggregate
Intrinsic Value
|
||||||||
|
|
|
$
|
$
|
Years
|
$
|
||||||||
|
Outstanding at December 31, 2015
|
44,109,990
|
|
0.35
|
|
|||||||||
|
Granted
|
38,921,219
|
|
2.32
|
|
1.60
|
|
|||||||
|
Exercised
|
(610,116
|
)
|
0.10
|
|
1,353
|
|
|||||||
|
Forfeited
|
(5,341,350
|
)
|
0.92
|
|
|||||||||
|
Outstanding at December 31, 2016
|
77,079,743
|
|
1.31
|
|
|||||||||
|
Granted
|
62,085,462
|
|
3.73
|
|
2.65
|
|
|||||||
|
Exercised
|
(5,887,193
|
)
|
0.82
|
|
24,723
|
|
|||||||
|
Forfeited
|
(6,275,115
|
)
|
2.52
|
|
|||||||||
|
Outstanding at December 31, 2017
|
127,002,897
|
|
2.45
|
|
|||||||||
|
Granted
|
9,387,885
|
|
12.32
|
|
7.08
|
|
|||||||
|
Exercised
|
(13,841,036
|
)
|
2.23
|
|
132,687
|
|
|||||||
|
Forfeited
|
(6,467,099
|
)
|
3.59
|
|
|||||||||
|
Outstanding at December 31, 2018
|
116,082,647
|
|
3.21
|
|
7.63
|
894,871
|
|
||||||
|
Exercisable as of December 31, 2018
|
53,829,397
|
|
1.84
|
|
6.95
|
481,796
|
|
||||||
|
Vested and expected to vest at December 31, 2018
|
109,857,323
|
|
3.15
|
|
7.59
|
853,563
|
|
||||||
As of
December 31, 2018
, the unrecognized compensation cost related to
56,027,926
unvested share options expected to vest was
$154,623
. This unrecognized compensation will be recognized over an estimated weighted-average amortization period of
2.4
years.
The total fair value of employee share option awards vested during the years ended
December 31, 2018
,
2017
and
2016
was
$55,642
,
$20,440
and
$2,821
, respectively.
Fair value of options
The Company uses the binomial option-pricing model in determining the estimated fair value of the options granted. The model requires the input of highly subjective assumptions including the estimated expected stock price volatility and, the exercise multiple for which employees are likely to exercise share options. For expected volatilities, the trading history and observation period of the Company’s own share price movement has not been long enough to match the life of the share option. Therefore, the Company has made reference to the historical price volatilities of ordinary shares of several comparable companies in the same industry as the Company. For the exercise multiple, the Company was not able to develop an exercise pattern as reference, thus the exercise multiple is based on management’s estimation, which the Company believes is representative of the future exercise pattern of the options. The risk-free rate for periods within the contractual life of the option is based on the U.S. Treasury Bills yield curve in effect at the time of grant. Prior to the completion of the Company’s U.S. IPO, the estimated fair value of the ordinary shares, at the option grant dates, was determined with assistance from an independent
F-40
BEIGENE, LTD.
NOTES TO THE CONSOLIDATED FINANCIAL STATEMENTS
FOR THE YEARS ENDED DECEMBER 31, 2018, 2017 AND 2016
(Amounts in thousands of U.S. Dollar (“$”) and Renminbi (“RMB”),
except for number of shares and per share data)
third-party valuation firm, and the Company’s management was ultimately responsible for the determination of the estimated fair value of its ordinary shares. With the completion of the Company’s U.S. IPO, a public trading market for the ADSs was established, and it is no longer necessary for the Company to estimate the fair value of ordinary shares at the option grant dates.
The following table presents the assumptions used to estimate the fair values of the share options granted in the years presented:
|
|
Year Ended December 31,
|
||||
|
|
2018
|
2017
|
2016
|
||
|
Fair value of ordinary share
|
4.30 ~ 8.85
|
2.39 ~ 8.71
|
1.85 ~ 2.84
|
||
|
Risk-free interest rate
|
2.5% ~ 3.1%
|
2.2% ~ 2.6%
|
1.5% ~ 2.6%
|
||
|
Expected exercise multiple
|
2.2 ~ 2.8
|
2.2 ~ 2.8
|
2.2 ~ 2.8
|
||
|
Expected volatility
|
60% ~ 64%
|
99% ~ 100%
|
98% ~ 102%
|
||
|
Expected dividend yield
|
0%
|
0%
|
0%
|
||
|
Contractual life
|
10 years
|
10 years
|
10 years
|
||
Restricted shares
The following table summarizes the Company’s employee restricted share activities under the 2016 Plan:
|
|
Numbers
of Shares
|
Weighted-Average
Grant Date Fair Value
|
|||
|
|
|
$
|
|||
|
Outstanding at December 31, 2015
|
44,445
|
|
0.05
|
|
|
|
Granted
|
1,075,000
|
|
2.16
|
|
|
|
Vested
|
(44,445
|
)
|
0.05
|
|
|
|
Forfeited
|
—
|
|
—
|
|
|
|
Outstanding at December 31, 2016
|
1,075,000
|
|
2.16
|
|
|
|
Granted
|
300,000
|
|
2.95
|
|
|
|
Vested
|
(268,750
|
)
|
2.04
|
|
|
|
Forfeited
|
(300,000
|
)
|
2.95
|
|
|
|
Outstanding at December 31, 2017
|
806,250
|
|
2.16
|
|
|
|
Granted
|
—
|
|
—
|
|
|
|
Vested
|
(387,500
|
)
|
2.12
|
|
|
|
Forfeited
|
(118,750
|
)
|
2.04
|
|
|
|
Outstanding at December 31, 2018
|
300,000
|
|
2.25
|
|
|
|
Expected to vest at December 31, 2018
|
270,000
|
|
2.25
|
|
|
The Company had no non-employee restricted share activities during the year ended
December 31, 2018
.
As of
December 31, 2018
, the unrecognized compensation cost related to unvested restricted shares expected to vest was
$514
. This unrecognized compensation will be recognized over an estimated weighted-average amortization period of
1.7
years.
F-41
BEIGENE, LTD.
NOTES TO THE CONSOLIDATED FINANCIAL STATEMENTS
FOR THE YEARS ENDED DECEMBER 31, 2018, 2017 AND 2016
(Amounts in thousands of U.S. Dollar (“$”) and Renminbi (“RMB”),
except for number of shares and per share data)
Restricted share units
The following table summarizes the Company's employee restricted share unit activities under the 2016 and 2018 Plans:
|
|
Numbers
of Shares
|
Weighted-Average
Grant Date Fair Value
|
|||
|
|
|
$
|
|||
|
Outstanding at December 31, 2016
|
—
|
|
—
|
|
|
|
Granted
|
1,469,442
|
|
7.55
|
|
|
|
Vested
|
—
|
|
—
|
|
|
|
Forfeited
|
—
|
|
—
|
|
|
|
Outstanding at December 31, 2017
|
1,469,442
|
|
—
|
|
|
|
Granted
|
14,079,598
|
|
12.07
|
|
|
|
Vested
|
(689,130
|
)
|
8.33
|
|
|
|
Forfeited
|
(757,458
|
)
|
10.89
|
|
|
|
Outstanding at December 31, 2018
|
14,102,452
|
|
11.85
|
|
|
|
Expected to vest at December 31, 2018
|
12,692,207
|
|
11.85
|
|
|
As of
December 31, 2018
, the unrecognized compensation cost related to unvested restricted share units expected to vest was
$134,713
. This unrecognized compensation will be recognized over an estimated weighted-average amortization period of
3.5 years
.
The following table summarizes total share-based compensation cost recognized for the years ended
December 31, 2018
,
2017
and
2016
:
|
|
Year Ended December 31,
|
|||||||
|
|
2018
|
2017
|
2016
|
|||||
|
|
$
|
$
|
$
|
|||||
|
Research and development
|
54,384
|
|
30,610
|
|
8,076
|
|
||
|
Selling, general and administrative
|
32,743
|
|
12,253
|
|
2,549
|
|
||
|
Total
|
87,127
|
|
42,863
|
|
10,625
|
|
||
20. Accumulated Other Comprehensive Income
The movement of accumulated other comprehensive income is as follows:
|
|
Foreign Currency
Translation
Adjustments
|
Unrealized
Gains/Losses on
Available-for-Sale
Securities
|
Total
|
|||||
|
|
$
|
$
|
$
|
|||||
|
Balance as of December 31, 2016
|
(847
|
)
|
(99
|
)
|
(946
|
)
|
||
|
Other comprehensive income (loss) before reclassifications
|
762
|
|
(252
|
)
|
510
|
|
||
|
Amounts reclassified from accumulated other comprehensive income
|
—
|
|
(44
|
)
|
(44
|
)
|
||
|
Net-current period other comprehensive income (loss)
|
762
|
|
(296
|
)
|
466
|
|
||
|
Balance as of December 31, 2017
|
(85
|
)
|
(395
|
)
|
(480
|
)
|
||
|
Adjustment for the opening balance of accumulated other comprehensive loss
|
263
|
|
—
|
|
263
|
|
||
|
Balance as of January 1, 2018
|
178
|
|
(395
|
)
|
(217
|
)
|
||
|
Other comprehensive income before reclassifications
|
(390
|
)
|
4,081
|
|
3,691
|
|
||
|
Amounts reclassified from accumulated other comprehensive income
|
—
|
|
(1,948
|
)
|
(1,948
|
)
|
||
|
Net-current period other comprehensive income
|
(390
|
)
|
2,133
|
|
1,743
|
|
||
|
Balance as of December 31, 2018
|
(212
|
)
|
1,738
|
|
1,526
|
|
||
F-42
BEIGENE, LTD.
NOTES TO THE CONSOLIDATED FINANCIAL STATEMENTS
FOR THE YEARS ENDED DECEMBER 31, 2018, 2017 AND 2016
(Amounts in thousands of U.S. Dollar (“$”) and Renminbi (“RMB”),
except for number of shares and per share data)
21. Shareholders’ Equity
U.S. initial public offering
On February 8, 2016, the Company completed its IPO on the NASDAQ Global Select Market.
6,600,000
ADSs representing
85,800,000
ordinary shares were sold at
$24.00
per ADS, or
$1.85
per ordinary share. Additionally, the underwriters exercised their option to purchase an additional
990,000
ADSs representing
12,870,000
ordinary shares from the Company. Net proceeds from the U.S. IPO, including the underwriter option, after deducting underwriting discounts and offering expenses, were
$166,197
.
Follow-on public offerings
On November 23, 2016, the Company completed a follow-on public offering at a price of
$32.00
per ADS, or
$2.46
per ordinary share. In this offering, the Company sold
5,781,250
ADSs representing
75,156,250
ordinary shares. Additionally, the underwriters exercised their option to purchase an additional
850,000
ADSs representing
11,050,000
ordinary shares from the Company. The selling shareholders sold
468,750
ADSs representing
6,093,750
ordinary shares. Net proceeds from this offering, including the underwriter option, after deducting the underwriting discounts and offering expenses, were
$198,625
. The Company did not receive any proceeds from the sale of the shares by the selling shareholders.
On August 16, 2017, the Company completed a follow-on public offering at a price of
$71.00
per ADS, or
$5.46
per ordinary share. In this offering, the Company sold
2,465,000
ADSs representing
32,045,000
ordinary shares.
Additionally, the underwriters exercised their option to purchase an additional
369,750
ADSs representing
4,806,750
ordinary shares from the Company. Net proceeds from this offering, including the underwriter option, after deducting the underwriting discounts and offering expenses, were
$188,517
.
On January 22, 2018, the Company completed a follow-on public offering under the Company’s effective registration statement on Form S-3 at a price of
$101.00
per ADS, or
$7.77
per ordinary share. In this offering, the Company sold
7,425,750
ADSs representing
96,534,750
ordinary shares. Additionally, the underwriters exercised their option to purchase an additional
495,050
ADSs representing
6,435,650
ordinary shares from the Company. Net proceeds from this offering, including the underwriter option, after deducting the underwriting discounts and offering expenses, were
$757,587
.
On August 8, 2018, the Company completed an initial public offering of its ordinary shares on the Hong Kong Stock Exchange and a follow-on public offering of its ADS on the NASDAQ Global Select Market under the Company's effective registration statement on Form S-3 at a price of
$13.76
per ordinary share, or
$178.90
per ADS. In this offering, the Company sold
65,600,000
ordinary shares. Net proceeds after deducting underwriting discounts and commissions and offering expenses were
$869,709
.
Share Subscription Agreement
On August 31, 2017, the Company sold
32,746,416
of its ordinary shares to Celgene Switzerland for an aggregate cash price of
$150,000
, or
$4.58
per ordinary share, or
$59.55
per ADS, pursuant to a Share Subscription Agreement in connection with the entry into the A&R PD-1 License Agreement. Proceeds from the issuance are recorded net of
$72
of fees related to the share issuance. The offer and sale of the shares issued pursuant to the Share Subscription Agreement was made in a private placement in reliance upon the exemption from registration provided by Section 4(a)(2) of the Securities Act, for transactions by an issuer not involving a public offering, and/or Regulation D under the Securities Act.
Conversion of preferred shares and senior promissory note
Upon completion of the U.S. IPO, all outstanding preferred shares were converted into
199,990,641
ordinary shares and the related carrying value of
$176,084
was reclassified from mezzanine equity to shareholders’ equity. The outstanding unpaid principal and interest of the Senior Promissory Note were converted into
7,942,314
ordinary shares, computed at the initial public offering price of
$1.85
per ordinary share and the related carrying value of
$14,693
was reclassified from current liability to shareholders’ equity.
F-43
BEIGENE, LTD.
NOTES TO THE CONSOLIDATED FINANCIAL STATEMENTS
FOR THE YEARS ENDED DECEMBER 31, 2018, 2017 AND 2016
(Amounts in thousands of U.S. Dollar (“$”) and Renminbi (“RMB”),
except for number of shares and per share data)
Exercise of warrants and option
In January 2016 and February 2016, certain warrants in connection with the convertible promissory notes and short term notes were exercised to purchase
621,637
preferred shares, which were converted into
621,637
ordinary shares. On the U.S. IPO closing date, (i) the Company’s landlord exercised its option to purchase
1,451,586
ordinary shares of the Company; (ii) Baker Bros. exercised its warrants to purchase
2,592,593
ordinary shares at an exercise price of
$0.68
per share; and (iii) a senior executive exercised warrants to purchase
57,777
preferred shares at an exercise price of
$0.68
per share, which were converted into
57,777
ordinary shares. Upon the exercise of the aforementioned option and warrants, except for Baker Bros.’ warrants, which were initially classified in equity, the related carrying value totaling
$3,687
was reclassified from current liabilities to shareholders’ equity.
22. Restricted Net Assets
The Company’s ability to pay dividends may depend on the Company receiving distributions of funds from its PRC subsidiaries. Relevant PRC statutory laws and regulations permit payments of dividends by the Company’s PRC subsidiaries only out of its retained earnings, if any, as determined in accordance with PRC accounting standards and regulations. The results of operations reflected in the consolidated financial statements prepared in accordance with GAAP differ from those reflected in the statutory financial statements of the Company’s PRC subsidiaries.
In accordance with the company law of the PRC, a domestic enterprise is required to provide statutory reserves of at least
10%
of its annual after-tax profit until such reserve has reached
50%
of its respective registered capital based on the enterprise’s PRC statutory accounts. A domestic enterprise is also required to provide discretionary surplus reserve, at the discretion of the Board of Directors, from the profits determined in accordance with the enterprise’s PRC statutory accounts. The aforementioned reserves can only be used for specific purposes and are not distributable as cash dividends. The Company’s PRC subsidiaries were established as domestic invested enterprises and therefore were subject to the above-mentioned restrictions on distributable profits.
During the years ended
December 31, 2018
,
2017
and
2016
,
no
appropriation to statutory reserves was made because the PRC subsidiaries had substantial losses during such periods.
As a result of these PRC laws and regulations including the requirement to make annual appropriations of at least
10%
of after-tax income and set aside as general reserve fund prior to payment of dividends, the Company’s PRC subsidiaries are restricted in their ability to transfer a portion of their net assets to the Company.
Foreign exchange and other regulation in the PRC may further restrict the Company’s PRC subsidiaries from transferring funds to the Company in the form of dividends, loans and advances. As of
December 31, 2018
and
2017
, amounts restricted are the net assets of the Company’s PRC subsidiaries, which amounted to $
93,281
and $
29,920
, respectively.
23. Employee Defined Contribution Plans
Full-time employees of the Company in the PRC participate in a government mandated defined contribution plan, pursuant to which certain pension benefits, medical care, employee housing fund and other welfare benefits are provided to employees. Chinese labor regulations require that the Company’s PRC subsidiaries make contributions to the government for these benefits based on certain percentages of the employees’ salaries. The Company has no legal obligation for the benefits beyond the contributions made. The total amounts for such employee benefits, which were expensed as incurred, were $
12,713
, $
4,103
and $
2,148
for the years ended
December 31, 2018
,
2017
and
2016
, respectively.
During the year ended December 31, 2016, the Company implemented a defined contribution 401(k) savings plan (the "401(k) Plan") for U.S. employees. The 401(k) Plan covers all U.S. employees, and allows participants to defer a portion of their annual compensation on a pretax basis. In addition, the Company implemented a matching contribution to the 401(k) Plan, matching
50%
of an employee's contribution up to a maximum of
3%
of the participant's compensation. Company contributions to the 401(k) plan totaled $
1,275
, $
455
and
$79
in the years ended
December 31, 2018
,
2017
and
2016
, respectively. Employee benefits for the remaining subsidiaries were immaterial.
F-44
BEIGENE, LTD.
NOTES TO THE CONSOLIDATED FINANCIAL STATEMENTS
FOR THE YEARS ENDED DECEMBER 31, 2018, 2017 AND 2016
(Amounts in thousands of U.S. Dollar (“$”) and Renminbi (“RMB”),
except for number of shares and per share data)
24. Commitments and Contingencies
Operating Lease Commitments
The Company leases office and manufacturing facilities under non-cancelable operating leases expiring on different dates in the United States, Switzerland, and China. Payments under operating leases are expensed on a straight-line basis over the periods of their respective leases, and the terms of the leases do not contain rent escalation, contingent rent, renewal, or purchase options.
There are no restrictions placed upon the Company by entering into these leases. Total expenses under these operating leases were $
8,930
, $
3,810
and $
1,974
for the years ended
December 31, 2018
,
2017
and
2016
, respectively.
Future minimum payments under non-cancelable operating leases consist of the following as of
December 31, 2018
:
|
|
$
|
|
|
Year ending December 31:
|
|
|
|
2019
|
10,752
|
|
|
2020
|
9,972
|
|
|
2021
|
7,805
|
|
|
2022
|
3,923
|
|
|
2023 and thereafter
|
1,357
|
|
|
Total
|
33,809
|
|
Purchase Commitments
As of December 31, 2018, purchase commitments amounted to
$9,747
related to minimum purchase requirements for finished goods inventory purchased from Celgene.
Capital Commitments
The Company had capital commitments amounting to $
45,910
for the acquisition of property, plant and equipment as of
December 31, 2018
, which were mainly for BeiGene Guangzhou Factory's manufacturing facility in Guangzhou, China.
25. Selected Quarterly Financial Data (Unaudited)
The following table summarizes the unaudited statements of operations for each quarter of 2018 and 2017 (in thousands except share and per share amounts). The unaudited quarterly information has been prepared on a basis consistent with the audited financial statements and includes all adjustments that the Company considers necessary for a fair presentation of the information shown. The operating results for any fiscal quarter are not necessarily indicative of the operating results for a full fiscal year or for any future period and there can be no assurances that any trend reflected in such results will continue in the future.
|
|
Quarter Ended
|
||||||||||
|
|
March 31,
|
June 30,
|
September 30,
|
December 31,
|
|||||||
|
2018
|
$
|
$
|
$
|
$
|
|||||||
|
Revenue
|
32,544
|
|
52,804
|
|
54,202
|
|
58,670
|
|
|||
|
Loss from operations
|
(110,809
|
)
|
(163,050
|
)
|
(151,102
|
)
|
(280,808
|
)
|
|||
|
Net loss
|
(105,116
|
)
|
(157,715
|
)
|
(144,492
|
)
|
(266,710
|
)
|
|||
|
Net loss attributable to ordinary shareholders
|
(104,596
|
)
|
(156,887
|
)
|
(144,031
|
)
|
(268,255
|
)
|
|||
|
Basic and diluted net loss per share(1)
|
(0.16
|
)
|
(0.22
|
)
|
(0.19
|
)
|
(0.35
|
)
|
|||
F-45
BEIGENE, LTD.
NOTES TO THE CONSOLIDATED FINANCIAL STATEMENTS
FOR THE YEARS ENDED DECEMBER 31, 2018, 2017 AND 2016
(Amounts in thousands of U.S. Dollar (“$”) and Renminbi (“RMB”),
except for number of shares and per share data)
|
|
Quarter Ended
|
||||||||||
|
|
March 31,
|
June 30,
|
September 30,
|
December 31,
|
|||||||
|
2017
|
$
|
$
|
$
|
$
|
|||||||
|
Revenue
|
—
|
|
—
|
|
220,213
|
|
18,174
|
|
|||
|
(Loss) /income from operations
|
(51,542
|
)
|
(58,022
|
)
|
114,905
|
|
(103,798
|
)
|
|||
|
Net (loss) /income
|
(50,623
|
)
|
(60,680
|
)
|
117,284
|
|
(99,280
|
)
|
|||
|
Net (loss) /income attributable to ordinary shareholders
|
(50,623
|
)
|
(60,545
|
)
|
117,386
|
|
(99,323
|
)
|
|||
|
Basic net (loss) /income per share(1)
|
(0.10
|
)
|
(0.12
|
)
|
0.21
|
|
(0.17
|
)
|
|||
|
Diluted net (loss) /income per share(1)
|
(0.10
|
)
|
(0.12)
|
0.20
|
|
(0.17)
|
|||||
(1) Per common share amounts for the quarters and full years have been calculated separately. Accordingly, the sum of quarterly amounts may not equal the annual amount because of differences in the weighted average common shares outstanding during each period, principally due to the effect of share issuances by the Company during the year.
26. Segment and Geographic Information
The Company operates in
one
segment. Its chief operating decision maker is the Chief Executive Officer, who makes operating decisions, assesses performance and allocates resources on a consolidated basis.
The Company’s long-lived assets are substantially located in the PRC.
Net product revenues by geographic area are based upon the location of the customer, and net collaboration revenue is recorded in the jurisdiction in which the related income is expected to be sourced from. Total net revenues by geographic area are presented as follows:
|
|
Year Ended December 31,
|
|||||||
|
|
2018
|
2017
|
2016
|
|||||
|
|
$
|
$
|
$
|
|||||
|
PRC
|
132,385
|
|
24,428
|
|
—
|
|
||
|
U.S.
|
42,793
|
|
138,423
|
|
—
|
|
||
|
Other
|
23,042
|
|
75,536
|
|
1,070
|
|
||
|
Total
|
198,220
|
|
238,387
|
|
1,070
|
|
||
F-46
Exhibit Index
|
Exhibit No.
|
Exhibit Description
|
Filed/ Furnished
Herewith
|
Incorporated by Reference
Herein from Form or Schedule
|
Filing Date
|
SEC File/
Reg. Number
|
|
|
3.1
|
8-K
(Exhibit 3.1)
|
12/12/2018
|
001-37686
|
|||
|
4.1
|
.1
|
8-K
(Exhibit 4.1)
|
2/11/2016
|
001-37686
|
||
|
.2
|
8-K
(Exhibit 4.1)
|
4/11/2016
|
001-37686
|
|||
|
.3
|
10-Q
(Exhibit 4.7)
|
8/10/2016
|
001-37686
|
|||
|
.4
|
10-Q
(Exhibit 4.9)
|
5/10/2017
|
001-37686
|
|||
|
4.2
|
Form of American Depositary Receipt (included in Exhibit 4.1.1)
|
|||||
|
4.3
|
S-1
(Exhibit 4.3)
|
12/9/2015
|
333-207459
|
|||
|
4.4
|
.1
|
S-1
(Exhibit 4.4)
|
10/16/2015
|
333-207459
|
||
|
.2
|
S-1
(Exhibit 10.21)
|
1/27/2016
|
333-207459
|
|||
|
4.5
|
8-K
(Exhibit 4.1)
|
11/17/2016
|
001-37686
|
|||
|
Lease Agreements
|
||||||
|
10.1
|
S-1
(Exhibit 10.4) |
10/16/2015
|
333-207459
|
|||
|
10.2
|
10-Q
(Exhibit 10.5) |
5/12/2016
|
001-37686
|
|||
|
Exhibit No.
|
Exhibit Description
|
Filed/ Furnished
Herewith
|
Incorporated by Reference
Herein from Form or Schedule
|
Filing Date
|
SEC File/
Reg. Number
|
|
|
Collaboration, License and Commercial Agreements
|
||||||
|
10.3#
|
S-1
(Exhibit 10.13) |
10/16/2015
|
333-207459
|
|||
|
10.4#
|
10-Q
(Exhibit 10.4) |
8/10/2016
|
001-37686
|
|||
|
10.5#
|
10-Q
(Exhibit 10.1) |
5/10/2017
|
001-37686
|
|||
|
10.6#
|
10-Q
(Exhibit 10.2) |
5/10/2017
|
001-37686
|
|||
|
10.7#
|
10-Q
(Exhibit 10.3) |
5/10/2017
|
001-37686
|
|||
|
10.8#
|
10-Q
(Exhibit 10.2) |
11/13/2017
|
001-37686
|
|||
|
10.9#
|
10-Q
(Exhibit 10.3) |
11/13/2017
|
001-37686
|
|||
|
10.10
|
8-K
(Exhibit 10.1) |
7/6/2017
|
001-37686
|
|||
|
Exhibit No.
|
Exhibit Description
|
Filed/ Furnished
Herewith
|
Incorporated by Reference
Herein from Form or Schedule
|
Filing Date
|
SEC File/
Reg. Number
|
|
|
Equity and Other Compensation Plans
|
||||||
|
10.11†
|
S-1
(Exhibit 10.1) |
10/16/2015
|
333-207459
|
|||
|
10.12
|
.1†
|
8-K
(Exhibit 10.1) |
12/12/2018
|
001-37686
|
||
|
.2†
|
10-Q
(Exhibit 10.7) |
8/9/2018
|
001-37686
|
|||
|
.3†
|
10-Q (Exhibit 10.2)
|
11/8/2018
|
001-37686
|
|||
|
10.13
|
.1†
|
8-K
(Exhibit 10.1) |
8/13/2018
|
001-37686
|
||
|
.2†
|
8-K
(Exhibit 10.3) |
6/8/2018
|
001-37686
|
|||
|
.3†
|
10-Q
(Exhibit 10.5) |
8/9/2018
|
001-37686
|
|||
|
10.14†
|
8-K
(Exhibit 10.2) |
12/12/2018
|
001-37686
|
|||
|
10.15†
|
S-1
(Exhibit 10.19) |
1/19/2016
|
333-207459
|
|||
|
10.16†
|
8-K
(Exhibit 10.5) |
6/8/2018
|
001-37686
|
|||
|
Agreements with Executive Officers and Directors
|
||||||
|
10.17†
|
S-1
(Exhibit 10.3) |
1/19/2016
|
333-207459
|
|||
|
10.18†
|
8-K
(Exhibit 10.1) |
4/26/2017
|
001-37686
|
|||
|
10.19†
|
10-Q
(Exhibit 10.1) |
8/9/2018
|
001-37686
|
|||
|
10.20†
|
S-1
(Exhibit 10.9) |
10/16/2015
|
333-207459
|
|||
|
10.21†
|
10-Q
(Exhibit 10.1) |
11/10/2016
|
001-37686
|
|||
|
10.22†
|
10-Q
(Exhibit 10.2) |
11/10/2016
|
001-37686
|
|||
|
10.23†
|
10-Q
(Exhibit 10.8) |
8/9/2018
|
001-37686
|
|||
|
Exhibit No.
|
Exhibit Description
|
Filed/ Furnished
Herewith
|
Incorporated by Reference
Herein from Form or Schedule
|
Filing Date
|
SEC File/
Reg. Number
|
|
|
21.1
|
X
|
|||||
|
23.1
|
X
|
|||||
|
31.1
|
X
|
|||||
|
31.2
|
X
|
|||||
|
32.1*
|
X
|
|||||
|
101
|
The following financial statements from the Registrant’s Annual Report on Form 10‑K for the year ended December 31, 2018, formatted in XBRL: (i) Consolidated Balance Sheets (ii) Consolidated Statements of Operations, (iii) Consolidated Statements of Comprehensive Loss, (iv) Consolidated Statements of Cash Flows, (v) Consolidated Statements of Shareholders’ Equity (Deficit), and (vi) Notes to the Consolidated Financial Statements
|
X
|
||||
† Indicates a management contract or any compensatory plan, contract or arrangement.
|
#
|
Confidential treatment has been granted by the U.S. Securities and Exchange Commission as to certain portions of this exhibit omitted and filed separately.
|
* Furnished herewith.
SIGNATURES
Pursuant to the requirements of the Section 13 or 15(d) of the Securities Exchange Act of 1934, the Registrant has duly caused this Form 10‑K to be signed on its behalf by the undersigned, thereunto duly authorized.
|
BEIGENE, LTD.
|
||
|
Date: February 28, 2019
|
By:
|
/s/ JOHN V. OYLER
|
|
|
|
|
|
|
|
John V. Oyler
|
|
|
|
Chief Executive Officer and Chairman
|
|
(Principal Executive Officer)
|
||
POWER OF ATTORNEY
Each person whose individual signature appears below hereby authorizes and appoints John V. Oyler, Howard Liang and Scott A. Samuels, and each of them, with full power of substitution and resubstitution and full power to act without the other, as his or her true and lawful attorney‑in‑fact and agent to act in his or her name, place and stead and to execute in the name and on behalf of each person, individually and in each capacity stated below, and to file any and all amendments to this Annual Report on Form 10‑K and to file the same, with all exhibits thereto, and other documents in connection therewith, with the Securities and Exchange Commission, granting unto said attorneys‑in‑fact and agents, and each of them, full power and authority to do and perform each and every act and thing, ratifying and confirming all that said attorneys‑in‑fact and agents or any of them or their or his substitute or substitutes may lawfully do or cause to be done by virtue thereof.
Pursuant to the requirements of the Securities Exchange Act of 1934, this Annual Report on Form 10‑K has been signed by the following persons in the capacities indicated below and on the dates indicated:
|
Signature
|
|
Title
|
|
Date
|
|
/s/ JOHN V. OYLER
|
|
Chief Executive Officer and Chairman
|
|
February 28, 2019
|
|
John V. Oyler
|
(Principal Executive Officer)
|
|||
|
|
|
|
|
|
|
/s/ HOWARD LIANG
|
|
Chief Financial Officer and Chief Strategy Officer
|
|
February 28, 2019
|
|
Howard Liang
|
(Principal Financial and Accounting Officer)
|
|||
|
|
|
|
|
|
|
/s/ TIMOTHY CHEN
|
|
Director
|
|
February 28, 2019
|
|
Timothy Chen
|
||||
|
|
|
|
|
|
|
/s/ DONALD W. GLAZER
|
|
Director
|
|
February 28, 2019
|
|
Donald W. Glazer
|
||||
|
|
|
|
|
|
|
/s/ MICHAEL GOLLER
|
|
Director
|
|
February 28, 2019
|
|
Michael Goller
|
||||
|
|
|
|
|
|
|
/s/ RANJEEV KRISHANA
|
|
Director
|
|
February 28, 2019
|
|
Ranjeev Krishana
|
||||
|
|
|
|
|
|
|
/s/ THOMAS MALLEY
|
|
Director
|
|
February 28, 2019
|
|
Thomas Malley
|
||||
|
|
|
|
|
|
|
/s/ XIAODONG WANG
|
|
Director
|
|
February 28, 2019
|
|
Xiaodong Wang
|
||||
|
/s/ JING-SHYH (SAM) SU
|
|
Director
|
|
February 28, 2019
|
|
Jing-Shyh (Sam) Su
|
||||
|
/s/ QINGQING YI
|
|
Director
|
|
February 28, 2019
|
|
Qingqing Yi
|
||||
TABLE OF CONTENTS
Part IItem 1. BusinessItem 1A. Risk FactorsItem 1B. Unresolved Staff CommentsItem 2. PropertiesItem 3. Legal ProceedingsItem 4. Mine Safety DisclosuresPart IIItem 5. Market For Registrant S Common Equity, Related Stockholder Matters and Issuer Purchases Of Equity SecuritiesItem 6. Selected Consolidated Financial DataItem 7. Management S Discussion and Analysis Of Financial Condition and Results Of OperationsItem 7A. Quantitative and Qualitative Disclosures About Market RiskItem 8. Financial Statements and Supplementary DataItem 9. Changes in and Disagreements with Accountants on Accounting and Financial DisclosureItem 9A. Controls and ProceduresItem 9B. Other InformationPart IIIItem 10. Directors, Executive Officers and Corporate GovernanceItem 11. Executive CompensationItem 12. Security Ownership Of Certain Beneficial Owners and Management and Related Stockholder MattersItem 13. Certain Relationships and Related Transactions, and Director IndependenceItem 14. Principal Accounting Fees and ServicesPart IVItem 15. Exhibits, Financial Statement SchedulesItem 16. Form 10 K Summary