OCWEN FINANCIAL CORP
10-Ks and 10-Qs
|
|
|
|
|
|
|
|
|
|
|
|
|
|
|
|
|
|
|
|
|
|
|
|
|
|
|
|
|
|
|
|
|
|
|
|
|
|
|
|
|
|
|
|
|
|
|
|
|
|
|
|
|
|
|
|
UNITED STATES
SECURITIES AND EXCHANGE COMMISSION
Washington, D.C. 20549
FORM 10-K
|
x
|
ANNUAL REPORT PURSUANT TO SECTION 13 OR 15(d) OF THE SECURITIES EXCHANGE ACT OF 1934
|
|
|
For the fiscal year ended December 31, 2019
|
OR
|
o
|
TRANSITION REPORT PURSUANT TO SECTION 13 OR 15(d) OF THE SECURITIES EXCHANGE ACT OF 1934
|
|
|
For the transition period from: ____________________ to ____________________
|
Commission File No. 1-13219
OCWEN FINANCIAL CORPORATION
(Exact name of registrant as specified in its charter)
|
Florida
|
|
65-0039856
|
|
(State or other jurisdiction of incorporation or organization)
|
|
(I.R.S. Employer Identification No.)
|
|
1661 Worthington Road, Suite 100
West Palm Beach, Florida
|
|
33409
|
|
(Address of principal executive office)
|
|
(Zip Code)
|
(561) 682-8000
(Registrant’s telephone number, including area code)
Securities registered pursuant to Section 12(b) of the Act:
|
Title of each class
|
Trading Symbol(s)
|
Name of each exchange on which registered
|
|
Common Stock, $0.01 Par Value
|
OCN
|
New York Stock Exchange (NYSE)
|
Securities registered pursuant to Section 12 (g) of the Act: Not applicable.
Indicate by check mark if the registrant is a well-known seasoned issuer, as defined in Rule 405 of the Securities Act. Yes
o
No
x
Indicate by check mark if the registrant is not required to file reports pursuant to Section 13 or Section 15(d) of the Act. Yes
o
No
x
Indicate by check mark whether the registrant (1) has filed all reports required to be filed by Section 13 or 15(d) of the Securities Exchange Act of 1934 during the preceding 12 months (or for such shorter period that the registrant was required to file such reports), and (2) has been subject to such filing requirements for the past 90 days. Yes
x
No
o
Indicate by check mark whether the registrant has submitted electronically every Interactive Data File required to be submitted pursuant to Rule 405 of Regulation S-T (§232.405 of this chapter) during the preceding 12 months (or for such shorter period that the registrant was required to submit such files). Yes
x
No
o
Indicate by check mark whether the registrant is a large accelerated filer, an accelerated filer, a non-accelerated filer, a smaller reporting company, or emerging growth company. See the definitions of “large accelerated filer,” “accelerated filer,” “smaller reporting company,” and “emerging growth company” in Rule 12b-2 of the Exchange Act:
|
|
Large Accelerated filer
|
o
|
Accelerated filer
|
x
|
||
|
|
Non-accelerated filer
|
o
|
Smaller reporting company
|
o
|
||
|
Emerging growth company
|
o
|
|||||
If an emerging growth company, indicate by check mark if the registrant has elected not to use the extended transition period for complying with any new or revised financial accounting standards provided pursuant to Section 13(a) of the Exchange Act.
o
Indicate by check mark whether the registrant is a shell company (as defined in Rule 12b-2 of the Act) Yes
o
No
x
Aggregate market value of the voting and non-voting common equity of the registrant held by nonaffiliates as of
June 30, 2019
:
$275,549,706
Number of shares of common stock outstanding as of
February 21, 2020
:
134,948,008
shares
DOCUMENTS INCORPORATED BY REFERENCE: Portions of our definitive Proxy Statement with respect to our Annual Meeting of Shareholders, which is currently scheduled to be held on
May 27, 2020
, are incorporated by reference into Part III, Items 10 - 14.
OCWEN FINANCIAL CORPORATION
2019
FORM 10-K ANNUAL REPORT
TABLE OF CONTENTS
|
|
|
PAGE
|
|
|
|
|||
|
|
|
|
|
|
|
|
|
|
|
|
|
|
|
|
|
|
|
|
|
|
|
|
|
|
|
|
|
|
|
|
|||
|
|
|
|
|
|
|
|
|
|
|
|
|
|
|
|
|
|
|
|
|
|
|
|
|
|
|
|
|
|
|
|
|
|
|
|
|
|
|
|
|
|
|||
|
|
|
|
|
|
|
|
|
|
|
|
|
|
|
|
|
|
|
|
|
|
|
|
|
|
PART I
V
|
|||
|
|
|||
|
|
|
|
|
1
FORWARD-LOOKING STATEMENTS
This Annual Report contains forward-looking statements within the meaning of Section 27A of the Securities Act of 1933, as amended, and Section 21E of the Securities Exchange Act of 1934, as amended. All statements other than statements of historical fact included in this report, including, statements regarding our financial position, business strategy and other plans and objectives for our future operations, are forward-looking statements.
Forward-looking statements may be identified by a reference to a future period or by the use of forward-looking terminology. Forward-looking statements are typically identified by words such as “expect”, “believe”, “foresee”, “anticipate”, “intend”, “estimate”, “goal”, “strategy”, “plan” “target” and “project” or conditional verbs such as “will”, “may”, “should”, “could” or “would” or the negative of these terms, although not all forward-looking statements contain these words. Forward-looking statements by their nature address matters that are, to different degrees, uncertain. Our business has been undergoing substantial change, which has magnified such uncertainties. Readers should bear these factors in mind when considering forward-looking statements and should not place undue reliance on such statements. Forward-looking statements involve a number of assumptions, risks and uncertainties that could cause actual results to differ materially from those suggested by such statements. In the past, actual results have differed from those suggested by forward-looking statements and this may happen again. Important factors that could cause actual results to differ include, but are not limited to, the risks discussed in “Risk Factors” and the following:
|
•
|
uncertainty related to the adequacy of our financial resources, including our sources of liquidity and ability to fund, sell and recover advances, originate, sell and securitize forward and reverse mortgage loans, fund forward and reverse mortgage loan buyouts, repay, renew and extend borrowings and borrow additional amounts as and when required;
|
|
•
|
uncertainty related to our ability to execute on our cost re-engineering initiatives and take the other actions we believe are necessary for us to improve our financial performance;
|
|
•
|
uncertainty related to our ability to acquire mortgage servicing rights (MSRs) or other assets or businesses at adequate risk-adjusted returns, including our ability to allocate adequate capital for such investments, negotiate and execute purchase documentation and satisfy closing conditions so as to consummate such acquisitions;
|
|
•
|
uncertainty related to our ability to grow our lending business and increase our lending volumes in a competitive market and uncertain interest rate environment;
|
|
•
|
uncertainty related to our long-term relationship and remaining agreements with New Residential Investment Corp. (NRZ), our largest servicing client;
|
|
•
|
our ability to execute an orderly and timely transfer of responsibilities in connection with the termination by NRZ of our legacy PHH Mortgage Corporation (PMC) subservicing agreement;
|
|
•
|
the reactions of regulators, lenders and other contractual counterparties, rating agencies, stockholders and other stakeholders to the announcement of the termination of the PMC subservicing agreement;
|
|
•
|
uncertainty related to claims, litigation, cease and desist orders and investigations brought by government agencies and private parties regarding our servicing, foreclosure, modification, origination and other practices, including uncertainty related to past, present or future investigations, litigation, cease and desist orders and settlements with state regulators, the Consumer Financial Protection Bureau (CFPB), State Attorneys General, the Securities and Exchange Commission (SEC), the Department of Justice or the Department of Housing and Urban Development (HUD) and actions brought under the False Claims Act regarding incentive and other payments made by governmental entities;
|
|
•
|
adverse effects on our business as a result of regulatory investigations, litigation, cease and desist orders or settlements;
|
|
•
|
reactions to the announcement of such investigations, litigation, cease and desist orders or settlements by key counterparties, including lenders, the Federal National Mortgage Association (Fannie Mae), the Federal Home Loan Mortgage Corporation (Freddie Mac) and the Government National Mortgage Association (Ginnie Mae);
|
|
•
|
our ability to comply with the terms of our settlements with regulatory agencies and the costs of doing so;
|
|
•
|
increased regulatory scrutiny and media attention;
|
|
•
|
any adverse developments in existing legal proceedings or the initiation of new legal proceedings;
|
|
•
|
our ability to effectively manage our regulatory and contractual compliance obligations;
|
|
•
|
our ability to interpret correctly and comply with liquidity, net worth and other financial and other requirements of regulators, Fannie Mae, Freddie Mac and Ginnie Mae, as well as those set forth in our debt and other agreements;
|
|
•
|
our ability to comply with our servicing agreements, including our ability to comply with our agreements with, and the requirements of, Fannie Mae, Freddie Mac and Ginnie Mae and maintain our seller/servicer and other statuses with them;
|
|
•
|
our servicer and credit ratings as well as other actions from various rating agencies, including the impact of prior or future downgrades of our servicer and credit ratings;
|
|
•
|
failure of our information technology or other security systems or breach of our privacy protections, including any failure to protect customers’ data;
|
2
|
•
|
uncertainty related to the ability of our technology vendors to adequately maintain and support our systems, including our servicing systems, loan originations and financial reporting systems;
|
|
•
|
our ability to identify and address any issues arising in connection with the transfer of loans to the Black Knight Financial Services, Inc. (Black Knight) LoanSphere MSP® servicing system (Black Knight MSP) without incurring significant cost or disruption to our operations;
|
|
•
|
the loss of the services of our senior managers and key employees;
|
|
•
|
uncertainty related to the actions of loan owners and guarantors, including mortgage-backed securities investors, Federal National Mortgage Association (Fannie Mae) and Federal Home Loan Mortgage Corporation (Freddie Mac) (collectively, the GSEs), Government National Mortgage Association (Ginnie Mae) and trustees regarding loan put-backs, penalties and legal actions;
|
|
•
|
uncertainty related to the GSEs substantially curtailing or ceasing to purchase our conforming loan originations or the Federal Housing Administration (FHA) of the HUD or Department of Veterans Affairs (VA) ceasing to provide insurance;
|
|
•
|
uncertainty related to our ability to continue to collect certain expedited payment or convenience fees and potential liability for charging such fees;
|
|
•
|
uncertainty related to our reserves, valuations, provisions and anticipated realization of assets;
|
|
•
|
uncertainty related to the ability of third-party obligors and financing sources to fund servicing advances on a timely basis on loans serviced by us;
|
|
•
|
volatility in our stock price;
|
|
•
|
the characteristics of our servicing portfolio, including prepayment speeds along with delinquency and advance rates;
|
|
•
|
our ability to successfully modify delinquent loans, manage foreclosures and sell foreclosed properties;
|
|
•
|
uncertainty related to the processes for judicial and non-judicial foreclosure proceedings, including potential additional costs or delays or moratoria in the future or claims pertaining to past practices;
|
|
•
|
our ability to adequately manage and maintain real estate owned (REO) properties and vacant properties collateralizing loans that we service;
|
|
•
|
uncertainty related to legislation, regulations, regulatory agency actions, regulatory examinations, government programs and policies, industry initiatives and evolving best servicing practices;
|
|
•
|
our ability to realize anticipated future gains from future draws on existing loans in our reverse mortgage portfolio;
|
|
•
|
our ability to effectively manage our exposure to interest rate changes and foreign exchange fluctuations;
|
|
•
|
our ability to effectively transform our operations in response to changing business needs, including our ability to do so without unanticipated adverse tax consequences;
|
|
•
|
uncertainty regarding regulatory restrictions on our ability to repurchase our own stock and limitations under our debt agreements on stock repurchases;
|
|
•
|
uncertainty related to the political or economic stability of the United States and of the foreign countries in which we have operations; and
|
|
•
|
our ability to maintain positive relationships with our large shareholders and obtain their support for management proposals requiring shareholder approval.
|
Further information on the risks specific to our business is detailed within this report, including under “Risk Factors.” Forward-looking statements speak only as of the date they were made and we disclaim any obligation to update or revise forward-looking statements whether because of new information, future events or otherwise.
3
PART I
|
ITEM 1.
|
BUSINESS
|
When we use the terms “Ocwen,” “OCN,” “we,” “us” and “our,” we are referring to Ocwen Financial Corporation and its consolidated subsidiaries.
OVERVIEW
We are a financial services company that services and originates mortgage loans. We have a strong track record of success as a leader in the servicing industry in foreclosure prevention and loss mitigation that helps homeowners stay in their homes and improves financial outcomes for mortgage loan investors. This long-standing core competency will continue to be a guiding principle as we seek to grow our business and improve our financial performance.
We are headquartered in West Palm Beach, Florida with offices in the U.S. (West Palm Beach, FL, Mount Laurel, NJ, Rancho Cordova, CA), in the United States Virgin Islands (St. Croix)), and operations in India and the Philippines. At
December 31, 2019
, approximately
72%
of our workforce is located outside the U.S. Ocwen Financial Corporation is a Florida corporation organized in February 1988. With our predecessors, we have been servicing residential mortgage loans since 1988. In late 2018 and throughout 2019, we successfully completed our acquisition and integration of PHH Corporation (PHH). We have been originating forward mortgage loans since 2012 and reverse mortgage loans since 2013. We currently provide solutions through our primary operating, wholly-owned subsidiaries, PHH Mortgage Corporation (PMC) and Liberty Home Equity Solutions, Inc. (Liberty).
Our priority is to return to sustainable profitability in the shortest timeframe possible within an appropriate risk and compliance environment. To do so, we believe we must execute on the following key initiatives. First, we must manage the size of our servicing portfolio through expanding our lending business and acquisitions of mortgage servicing rights (MSRs) that are prudent and well-executed with appropriate financial return targets. Second, we must re-engineer our cost structure to go beyond eliminating redundant costs through the integration process and establish continuous cost improvement as a core strength. Our continuous cost improvement efforts are focused on leveraging our single servicing platform and technology, optimizing strategic sourcing and off-shore utilization, lean process design, automation and other technology-enabled productivity enhancements. Third, we must manage our balance sheet to ensure adequate liquidity and provide a solid platform for financing our ongoing business needs and executing on our other key business initiatives. Finally, we must fulfill our regulatory commitments and resolve our remaining legal and regulatory matters on satisfactory terms.
BUSINESS MODEL AND SEGMENTS
Ocwen’s business model is designed to optimize our value creation for our primary stakeholders, improve our returns and effectively allocate our resources. Over the past twelve months, in addition to our PHH integration efforts, we have continued to adjust and transform our business model to generate growth through diversification and drive operational efficiencies. Our core competencies revolve around our servicing business and we aggressively pursue growth of our servicing portfolio through origination and acquisitions of servicing volume from multiple sources.
Our servicing portfolio is comprised of three components with different economics - our owned MSRs, our subservicing portfolio, and the NRZ servicing portfolio. We invest our capital to fund acquisitions and originations of our owned MSRs and servicing advances, for which we establish a targeted return on investment. Our net return includes servicing revenue net of servicing costs, less MSR portfolio runoff and other fair value changes, and less our MSR and advance funding cost. Our subservicing portfolio generates a relatively more stable source of revenue with lower subservicing fees but without any significant capital utilization and funding of advances. Our NRZ servicing portfolio has effectively been a subservicing relationship - See New Residential Investment Corp. Relationship. We target a balanced mix of our portfolio between servicing and subservicing. Our servicing operations and customer interactions do not differentiate whether loans are serviced or subserviced.
Our growth strategy is built on our relationships with borrowers, lenders and other market participants. We develop these relationships to grow our existing owned MSR portfolio, or develop new subservicing arrangements. We acquire MSRs through bulk portfolio purchases in the open market or through flow purchase agreements with our network of mortgage companies and financial institutions, or through participation in the Agency co-issue programs. In order to diversify our sources of servicing and reduce our reliance on others, we have been developing our origination of MSRs through different channels, including our portfolio recapture channel, retail, wholesale and correspondent lending. In 2019, bulk acquisitions represented the largest volume of MSR additions.
4
The chart below presents our current business model:

We report our activities in three segments, with Servicing and Lending being our primary segments. Our other business activities that are currently individually insignificant are included in the Corporate Items and Other segment. Our business segments reflect the internal reporting that we use to evaluate operating performance of services and to assess the allocation of our resources. The historical financial information of our segments is presented in our financial statements in
Note 23 — Business Segment Reporting
and discussed in the individual business operations sections of Management’s Discussion and Analysis of Financial Condition and Results of Operations.
Servicing
Our Servicing business is primarily comprised of our core residential mortgage servicing business that currently accounts for most of our total revenues, and we also have a small commercial mortgage servicing business. Our servicing clients include some of the largest financial institutions in the U.S., including the GSEs, Ginnie Mae, NRZ and non-Agency residential mortgage-backed securities (RMBS) trusts. As of
December 31, 2019
, our residential servicing portfolio consisted of
1,419,943
loans with an unpaid principal balance (UPB) of
$212.4 billion
.
Servicing involves the collection of principal and interest payments from borrowers, the administration of tax and insurance escrow accounts, the collection of insurance claims, the management of loans that are delinquent or in foreclosure or bankruptcy, including making servicing advances, evaluating loans for modification and other loss mitigation activities and, if necessary, foreclosure referrals and the sale of the underlying mortgaged property following foreclosure (REO) on behalf of mortgage loan investors or other servicers. Master servicing involves the collection of payments from servicers and the distribution of funds to investors in mortgage and asset-backed securities and whole loan packages. We earn contractual monthly servicing fees (which are typically payable as a percentage of UPB) pursuant to servicing agreements as well as other ancillary fees relating to our servicing activities such as late fees and, in certain circumstances, REO referral commissions.
We own MSRs outright, where we typically receive all the servicing economics, and we subservice on behalf of other institutions that own the MSRs or Rights to MSRs, in which case we typically earn a smaller fee for performing the subservicing activities. Special servicing is a form of subservicing where we generally manage only delinquent loans on behalf of a loan owner. We typically earn subservicing and special servicing fees either as a percentage of UPB or on a per loan basis.
Servicing advances are an important component of our business and are amounts that we, as servicer, are required to advance to, or on behalf of, our servicing clients if we do not receive such amounts from borrowers. These amounts include principal and interest payments, property taxes and insurance premiums and amounts to maintain, repair and market real estate properties on behalf of our servicing clients. Most of our advances have the highest reimbursement priority such that we are entitled to repayment of the advances from the loan or property liquidation proceeds before most other claims on these proceeds. The costs incurred in meeting advancing obligations consist principally of the interest expense incurred in financing
5
the advance receivables and the costs of arranging such financing. Under subservicing agreements, Ocwen is promptly reimbursed by the owners of the MSRs who generally finance the advances and incur the associated financing cost.
Reducing delinquencies is important to our business because it enables us to recover advances and recognize additional ancillary income, such as late fees, which we do not recognize on delinquent loans until they are brought current. Performing loans also require less work and thus are generally less costly to service. While increasing borrower participation in loan modification programs is a critical component of our ability to reduce delinquencies, borrower compliance with those modifications is also an important factor.
We report our MSR purchases through flow, agency co-issue programs, and bulk sources in our Servicing segment. We initially recognize our MSR origination with the associated gain in our Lending business, and subsequently transfer the MSR to our Servicing segment. Our Servicing segment reflects all subsequent performance associated with the MSR, including funding cost, run-off and other fair value changes.
Our servicing portfolio naturally decreases over time as homeowners make regularly scheduled mortgage payments, prepay loans prior to maturity, refinance with a mortgage loan not serviced by us or involuntarily liquidate through foreclosure or other liquidation process. In addition, existing clients may determine to terminate their servicing and subservicing arrangements with us and transfer the servicing to others. Therefore, our ability to grow the size of our servicing portfolio depends on our ability to acquire the right to service or subservice additional mortgage loans at a rate that exceeds portfolio runoff and any client terminations. We are focused on profitably replenishing and growing our servicing and subservicing portfolios through a variety of sources, including our lending business channels (retail/recapture, wholesale and correspondent), forward flow MSR arrangements with certain business partners, GSE cash window programs, additional subservicing business arrangements, and bulk MSR acquisitions.
Lending
In
2019
, our Lending business originated or purchased forward and reverse mortgage loans with a UPB of
$1.2 billion
and
$729.4 million
, respectively. These loans were acquired through three primary channels: directly with mortgage customers (retail), through correspondent lender relationships (correspondent) and through broker relationships (wholesale). Per-loan margins vary by channel, with correspondent typically being the lowest margin and retail the highest. We exited the forward lending correspondent and wholesale channels in 2017 for strategic purposes, and re-entered the correspondent channel in the second quarter of 2019. Our forward lending business is also focused on portfolio recapture (i.e., refinancing loans in our servicing portfolio).
Our forward mortgage loans are conventional (conforming to the underwriting standards of the GSEs, collectively Agency loans) and government-insured (insured by the FHA or VA). After origination, we generally package and sell the loans in the secondary mortgage market, through GSE and Ginnie Mae guaranteed securitizations and whole loan transactions. We typically retain the associated MSRs on securitizations, providing the Servicing business with a source of new MSRs to replenish our servicing portfolio and partially offset the impact of loan amortization and prepayments, i.e., portfolio runoff. Whole loan transactions are generally completed on a servicing released basis.
We also originate and purchase Home Equity Conversion Mortgages (HECM or reverse mortgage loans) through our Liberty Home Equity Solutions, Inc. (Liberty) operations. Loans originated under this program are generally guaranteed by the FHA, which provides investors with protection against risk of borrower default. The reverse mortgage business generates revenue from new originations and subsequent tail draws, scheduled and unscheduled, taken by the borrower. In the second half of 2019, we launched our non-FHA guaranteed jumbo proprietary product, EquityIQ, for borrowers in high property value areas that exceed FHA limits.
Retail Lending
. We originate forward and reverse mortgage loans directly with borrowers through our retail lending business. Our forward lending business benefits from our servicing portfolio by offering refinance options to qualified borrowers seeking to lower their mortgage payments. Depending on borrower eligibility, we refinance eligible customers into conforming or government-insured products. We also are increasing our ability to originate retail loans to non-Ocwen servicing customers through various marketing channels. Through lead campaigns and direct marketing, the retail channel seeks to convert leads into loans in a cost-efficient manner. We are focused on increasing recapture rates on our existing servicing portfolio to grow this business.
Correspondent Lending
. Our correspondent lending operation purchases mortgage loans that have been originated by a network of approved third-party lenders. We re-entered the forward correspondent lending channel in the second quarter of 2019.
All the lenders participating in our correspondent lending program are approved by senior management members of our lending and compliance teams. We also employ an ongoing monitoring and renewal process for participating lenders that includes an evaluation of the performance of the loans they have sold to us. We perform a variety of pre- and post-funding
6
review procedures to ensure that the loans we purchase conform to our requirements and to the requirements of the investors to whom we sell loans.
Wholesale Lending
. We originate reverse mortgage loans through a network of approved brokers. Brokers are subject to a formal approval and monitoring process. We underwrite all loans originated through this channel consistent with the underwriting standards required by the ultimate investor prior to funding.
We provide customary origination representations and warranties to investors in connection with our loan sales and securitization activities. We receive customary origination representations and warranties from our network of approved originators relating to loans we purchase through our correspondent lending channel. In the event we cannot remedy a breach of a representation or warranty, we may be required to repurchase the loan or provide an indemnification payment to the investor. To the extent that we have recourse against a third-party originator, we may recover part or all of any loss we incur.
REGULATION
Our business is subject to extensive oversight and regulation by federal, state and local governmental authorities, including the CFPB, HUD and various state agencies that license and conduct examinations of our loan servicing, origination and collection activities. In addition, we operate under a number of regulatory settlements that subject us to ongoing reporting and other obligations. From time to time, we also receive requests (including requests in the form of subpoenas and civil investigative demands) from federal, state and local agencies for records, documents and information relating to the policies, procedures and practices of our loan servicing, origination and collection activities. The GSEs and their conservator, the Federal Housing Finance Authority (FHFA), Ginnie Mae, the United States Treasury Department, various investors, non-Agency securitization trustees and others also subject us to periodic reviews and audits.
In the current regulatory environment, we have faced and expect to continue to face heightened regulatory and public scrutiny as an organization as well as stricter and more comprehensive regulation of the entire mortgage sector. We continue to work diligently to assess and understand the implications of the regulatory environment in which we operate and to meet the requirements of this constantly changing environment. We devote substantial resources to regulatory compliance, while, at the same time, striving to meet the needs and expectations of our customers, clients and other stakeholders. Our actual or alleged failure to comply with applicable federal, state and local laws, regulations and licensing requirements could lead to any of the following:
|
•
|
loss of our licenses and approvals to engage in our servicing and lending businesses;
|
|
•
|
governmental investigations and enforcement actions;
|
|
•
|
administrative fines and penalties and litigation;
|
|
•
|
civil and criminal liability, including class action lawsuits and actions to recover incentive and other payments made by governmental entities;
|
|
•
|
breaches of covenants and representations under our servicing, debt or other agreements;
|
|
•
|
damage to our reputation;
|
|
•
|
inability to raise capital or otherwise secure the necessary financing to operate the business;
|
|
•
|
changes to our operations that may otherwise not occur in the normal course, and that could cause us to incur significant costs; or
|
|
•
|
inability to execute on our business strategy.
|
We must comply with a large number of federal, state and local consumer protection laws including, among others, the Dodd-Frank Wall Street Reform and Consumer Protection Act (the Dodd-Frank Act), the Gramm-Leach-Bliley Act, the Fair Debt Collection Practices Act, the Real Estate Settlement Procedures Act (RESPA), the Truth in Lending Act (TILA), the Fair Credit Reporting Act, the Servicemembers Civil Relief Act, the Homeowners Protection Act, the Federal Trade Commission Act, the Telephone Consumer Protection Act, the Equal Credit Opportunity Act, as well as individual state laws pertaining to licensing, general mortgage origination and servicing practices and foreclosure, and federal and local bankruptcy rules. These statutes apply to many facets of our business, including loan origination, default servicing and collections, use of credit reports, safeguarding of non-public personally identifiable information about our customers, foreclosure and claims handling, investment of and interest payments on escrow balances and escrow payment features, and mandate certain disclosures and notices to borrowers. These requirements can and do change as statutes and regulations are enacted, promulgated, amended, interpreted and enforced.
In recent years, the general trend among federal, state and local lawmakers and regulators has been toward increasing laws, regulations and investigative proceedings with regard to residential mortgage lenders and servicers. The CFPB continues to take a very active role in the mortgage industry, and its rule-making and regulatory agenda relating to loan servicing and origination continues to evolve. Individual states have also been active, as have other regulatory organizations such as the Multistate Mortgage Committee (MMC), a multistate coalition of various mortgage banking regulators. We also believe there has been a shift among certain regulators towards a broader view of the scope of regulatory oversight responsibilities with respect to mortgage lenders and servicers. In addition to their traditional focus on licensing and examination matters, certain
7
regulators have begun to make observations, recommendations or demands with respect to areas such as corporate governance, safety and soundness and risk and compliance management.
The CFPB and state regulators have also focused on the use and adequacy of technology in the mortgage servicing industry, privacy concerns and other topical issues, such as likely discontinuation of the London Interbank Offered Rate (LIBOR). In 2016, the CFPB issued a special edition supervision report that stressed the need for mortgage servicers to assess and make necessary improvements to their information technology systems to ensure compliance with the CFPB’s mortgage servicing requirements. The NY DFS also issued Cybersecurity Requirements for Financial Services Companies, which took effect in 2017, and which required banks, insurance companies, and other financial services institutions regulated by the NY DFS to establish and maintain a cybersecurity program designed to protect consumers and ensure the safety and soundness of New York State’s financial services industry. Likewise, the NY DFS has directed New York-regulated depository and non-depository institutions, insurers and pension funds to submit their plans for managing the risks relating to the likely discontinuation of LIBOR. Similarly, the California Consumer Privacy Act, which was enacted in 2018 and became effective on January 1, 2020, created new consumer rights relating to the access to, deletion of, and sharing of personal information.
New regulatory and legislative measures, or changes in enforcement practices, including those related to the technology we use, could, either individually or in the aggregate, require significant changes to our business practices, impose additional costs on us, limit our product offerings, limit our ability to efficiently pursue business opportunities, negatively impact asset values or reduce our revenues.
Our licensed entities are required to renew their licenses, typically on an annual basis, and to do so they must satisfy the license renewal requirements of each jurisdiction, which generally include financial requirements such as providing audited financial statements or satisfying minimum net worth requirements and non-financial requirements such as satisfactorily completing examinations as to the licensee’s compliance with applicable laws and regulations. The minimum net worth requirements to which our licensed entities are subject are unique to each state and type of license. Failure to satisfy any of the requirements to which our licensed entities are subject could result in a variety of regulatory actions ranging from a fine, a directive requiring a certain step to be taken, a suspension or ultimately a revocation of a license, any of which could have a material adverse impact on our results of operations and financial condition. In addition, we receive information requests and other inquiries, both formal and informal in nature, from our state regulators as part of their general regulatory oversight of our servicing and lending businesses. We also engage with state attorneys general and the CFPB and, on occasion, we engage with other federal agencies, including the Department of Justice and various inspectors general on various matters, including responding to information requests and other inquiries. Many of our regulatory engagements arise from a complaint that the entity is investigating, although some are formal investigations or proceedings. The GSEs and their conservator, FHFA, HUD, FHA, VA, Ginnie Mae, the United States Treasury Department, and others also subject us to periodic reviews and audits. We have in the past resolved, and may in the future resolve, matters via consent orders or payment of monetary amounts to settle issues identified in connection with examinations or regulatory or other oversight activities, and such resolutions could have material and adverse effects on our business, reputation, operations, results of operations and financial condition.
In recent years, we have been subject to significant state and federal regulatory actions against us, including the following:
|
•
|
We are currently in litigation with the CFPB after the CFPB filed a lawsuit in the federal district court for the Southern District of Florida against Ocwen, Ocwen Mortgage Servicing, Inc. (OMS) and Ocwen Loan Servicing, LLC (OLS) alleging violations of federal consumer financial laws relating to our servicing business
|
|
•
|
We are currently in litigation with the Florida Attorney General and the Florida Office of Financial Regulation after they filed a lawsuit in the federal district court for the Southern District of Florida against Ocwen, OMS and OLS alleging violations of federal and state consumer financial laws relating to our servicing business
|
|
•
|
We have settled state regulatory actions against us by 29 states and the District of Columbia after these states and the District of Columbia alleged deficiencies in our compliance with laws and regulations relating to our servicing and lending activities
|
|
•
|
We have entered into regulatory settlements with the New York Department of Financial Services (NY DFS) and the California Department of Business Oversight (CA DBO) relating to our servicing practices and other aspects of our business
|
|
•
|
We have entered into a settlement agreement with the MMC and consent orders with certain state attorneys general to resolve and close out findings of an MMC examination of PMC’s legacy mortgage servicing practices
|
We have incurred, and will continue to incur significant costs to comply with the terms of the settlements into which we have entered. In addition, the restrictions imposed under these settlements have significantly impacted how we run our business and will continue to do so. If we fail to comply with the terms of our settlements, additional legal or other actions could be taken against us. Such actions could have a materially adverse impact on our business, reputation, financial condition, liquidity and results of operations.
8
We continue to be subject to a number of ongoing federal and state regulatory examinations, consent orders, inquiries, subpoenas, civil investigative demands, requests for information and other actions, which could result in further adverse regulatory action against us.
To the extent that an examination, audit or other regulatory engagement identifies an alleged failure by us to comply with applicable laws, regulations or licensing requirements, or if allegations are made that we have failed to comply with applicable laws, regulations or licensing requirements or the commitments we have made in connection with our regulatory settlements (whether such allegations are made through administrative actions such as cease and desist orders, through legal proceedings or otherwise) or if other regulatory actions of a similar or different nature are taken in the future against us, this could lead to (i) administrative fines and penalties and litigation, (ii) loss of our licenses and approvals to engage in our servicing and lending businesses, (iii) governmental investigations and enforcement actions, (iv) civil and criminal liability, including class action lawsuits and actions to recover incentive and other payments made by governmental entities, (v) breaches of covenants and representations under our servicing, debt or other agreements, (vi) damage to our reputation, (vii) inability to raise capital or otherwise fund our operations, (viii) changes to our operations that may otherwise not occur in the normal course, and that could cause us to incur significant costs or (ix) inability to execute on our business strategy. Any of these occurrences could increase our operating expenses and reduce our revenues, hamper our ability to grow or otherwise materially and adversely affect our business, reputation, financial condition, liquidity and results of operations.
Finally, there are a number of foreign laws and regulations that are applicable to our operations outside of the U.S., including laws and regulations that govern licensing, employment, safety, taxes and insurance and laws and regulations that govern the creation, continuation and the winding up of companies as well as the relationships between shareholders, our corporate entities, the public and the government in these countries. Non-compliance with these laws and regulations could result in adverse actions against us, including (i) restrictions on our operations in these counties, (ii) fines, penalties or sanctions or (iii) reputational damage.
COMPETITION
The financial services markets in which we operate are highly competitive. We compete with large and small financial services companies, including bank and non-bank entities, in the servicing and lending markets. Our competitors include large banks, such as Wells Fargo, JPMorgan Chase, Bank of America and Citibank, large non-bank servicers such as Mr. Cooper and PennyMac Loan Services, market disruptors such as Quicken Loans, SunTrust Mortgage and Regions Mortgage who are aggressively investing in the digital transformation of their business platforms, and real estate investment trusts, including New Residential Investment Corp.
In the servicing industry, we compete based on price, quality and risk appetite. Potential counterparties also (1) assess our regulatory compliance track record and examine our systems and processes for maintaining and demonstrating regulatory compliance, (2) consider our customer satisfaction rankings, and (3) consider our third-party servicer ratings. Certain of our competitors, especially large banks, may have substantially lower costs of capital and greater financial resources, which makes it challenging to compete. We believe that our competitive strengths flow from our ability to control and drive down delinquencies using proprietary processes, our lower cost to service non-performing loans and our deep know-how as a long-time operator of servicing loans. Notwithstanding these strengths, we have suffered reputational damage as a result of our regulatory settlements and the associated scrutiny of our business. We believe this has weakened our competitive position against both our bank and non-bank servicing competitors.
In the lending industry, we face intense competition in most areas, including product offerings, rates, fees and customer service. Some of our competitors, including the larger banks, have substantially lower costs of capital and strong retail presence, which makes it challenging to compete. In addition, with the proliferation of smartphones and technological changes enabling improved payment systems and cheaper data storage, newer market participants, often called “disruptors,” are reinventing aspects of the financial industry and capturing profit pools previously enjoyed by existing market participants. As a result, the lending industry could become even more competitive if new market participants are successful in capturing market share from existing market participants such as ourselves. We believe our competitive strengths flow from our existing customer relationships and from our focus on providing strong customer service.
The reverse lending market faces many of the same competitive pressures as the forward market. In addition, the reverse market is significantly smaller than the forward market with a higher market share concentration among the top five Ginnie Mae HMBS issuers. These higher concentration levels can, at times, lead to significant price competition. We believe our competitive advantage flows from Liberty’s long tenure in the industry (Liberty began operations in 2004), which provides us with significant experience and contributes to our name recognition, our strategic partnerships and our use of technology to produce higher levels of productivity to drive down per-loan costs.
9
THIRD-PARTY SERVICER RATINGS
Like other servicers, we are the subject of mortgage servicer ratings or rankings (collectively, ratings) issued and revised from time to time by rating agencies including Moody’s Investors Service, Inc. (Moody’s), S&P Global Ratings, Inc. (S&P) and Fitch Ratings, Inc. (Fitch). Favorable ratings from these agencies are important to the conduct of our loan servicing and lending businesses.
The following table summarizes our key servicer ratings:
|
PHH Mortgage Corporation
|
|||||
|
|
Moody’s
|
S&P
|
Fitch
|
||
|
Residential Prime Servicer
|
SQ3
|
Average
|
RPS3
|
||
|
Residential Subprime Servicer
|
SQ3
|
Average
|
RPS3
|
||
|
Residential Special Servicer
|
SQ3
|
Average
|
RSS3
|
||
|
Residential Second/Subordinate Lien Servicer
|
SQ3
|
Average
|
RPS3
|
||
|
Residential Home Equity Servicer
|
—
|
—
|
RPS3
|
||
|
Residential Alt-A Servicer
|
—
|
—
|
RPS3
|
||
|
Master Servicer
|
SQ3
|
Average
|
RMS3
|
||
|
Ratings Outlook
|
N/A
|
Stable
|
Stable
|
||
|
Date of last action
|
August 29, 2019
|
December 27, 2019
|
December 19, 2019
|
||
Following the merger of OLS into PMC on June 1, 2019, Ocwen submitted requests to withdraw the servicer ratings for OLS. S&P and Moody’s have transferred the Master Servicer rating for OLS to PMC, and Fitch assigned the Master Servicer rating on December 19, 2019.
In addition to servicer ratings, each of the agencies will from time to time assign an outlook (or a ratings watch such as Moody’s review status) to the rating status of a mortgage servicer. A negative outlook is generally used to indicate that a rating “may be lowered,” while a positive outlook is generally used to indicate a rating “may be raised.” There have been no new outlooks released for PMC regarding our servicer ratings.
Downgrades in servicer ratings could adversely affect our ability to service loans, sell or finance servicing advances and could impair our ability to consummate future servicing transactions or adversely affect our dealings with lenders, other contractual counterparties, and regulators, including our ability to maintain our status as an approved servicer by Fannie Mae and Freddie Mac. The servicer rating requirements of Fannie Mae do not necessarily require or imply immediate action, as Fannie Mae has discretion with respect to whether we are in compliance with their requirements and what actions it deems appropriate under the circumstances if we fall below their desired servicer ratings.
See Item 1A. Risk Factors - Risks Relating to Our Business for further discussion of the adverse effects that a failure to maintain minimum servicer ratings could have on our business, financing activities, financial condition or results of operations.
NEW RESIDENTIAL INVESTMENT CORP. RELATIONSHIP
Ocwen has a legacy relationship with NRZ and we acquired PMC’s legacy relationship with NRZ when we acquired PHH in October 2018. As a result, we service loans on behalf of NRZ under various agreements, including traditional subservicing agreements, where NRZ is the legal owner of the MSRs, and in connection with Rights to MSRs, where Ocwen retains legal title to the underlying MSRs but NRZ has generally assumed risks and rewards consistent with an MSR owner. As of
December 31, 2019
, we serviced loans with a UPB of
$58.1 billion
under legacy Ocwen subservicing agreements, loans with a UPB of
$18.5 billion
under legacy Ocwen Rights to MSRs agreements and loans with a UPB of
$42.1 billion
under a legacy PMC subservicing agreement. See
Note 10 — Rights to MSRs
and
Note 25 — Commitments
, NRZ Relationship.
NRZ is our largest servicing client, accounting for
56%
of the UPB of our servicing portfolio as of
December 31, 2019
and approximately
74%
of all delinquent loans that Ocwen serviced. During 2019, NRZ-related servicing fees retained by Ocwen represented approximately
36%
of the total servicing and subservicing fees earned by Ocwen, net of servicing fees remitted to NRZ (excluding ancillary income). We also benefit from the amortization of
$334.2 million
in upfront lump-sum cash payments that we received from NRZ in 2017 and 2018 when we renegotiated certain aspects of the legacy Ocwen agreements. These lump-sum cash payments were deferred and are recorded within Other income (expense) within our financial statements as they amortize through the remaining term of the original agreements (April 2020). As a result, through April 2020, we expect to recognize income of
$35.4 million
due to the amortization of these lump sum payments.
10
During 2019, we completed an assessment of the cost-to-service and the profitability of the NRZ servicing portfolio. Based on this analysis, in the fourth quarter of 2019, we estimated that operating expenses, including direct servicing expenses and overhead allocation, exceeded the net revenue retained for the NRZ servicing portfolio by approximately
$10.0 million
. As with all estimates, this estimate required the exercise of judgment, including with respect to overhead allocations, and it excludes the benefits of the lump-sum payment amortization. The estimated loss for these subservicing agreements is partially driven by the declining revenue as the loan portfolio amortizes down without a corresponding reduction to our servicing cost over time. As performing loans in the NRZ servicing portfolio have run-off, delinquencies have remained high, resulting in a relatively elevated average cost per loan. Because the NRZ portfolio contains a high percentage of delinquent accounts, it has an inherently high level of potential operational and compliance risk and requires a disproportionately high level of operating staff, oversight support infrastructure and overhead which drives the elevated average cost per loan. We actively pursue cost re-engineering initiatives to continue to reduce our cost-to-service and our corporate overhead, as well as pursue actions to grow our non-NRZ servicing portfolio to offset the losses on the NRZ sub servicing.
On February 20, 2020, we received a notice of termination from NRZ with respect to the legacy PMC subservicing agreement. This termination is for convenience (and not for cause). The notice states that the effective date of termination is June 19, 2020 for 25% of the loans under the agreement (not including loans constituting approximately
$6.6 billion
in UPB that were added by NRZ under the agreement in 2019) and August 18, 2020 for the remainder of the loans under the agreement. The actual servicing transfer date(s) will be determined through discussions with NRZ and other stakeholders such as GSEs. In connection with the termination, we estimate that we will receive loan deboarding fees of approximately
$6.1 million
from NRZ. The portfolio subject to termination accounted for
$42.1 billion
in UPB, or
20%
of our total serviced UPB as of December 31, 2019. Under this agreement, in the fourth quarter of 2019, we estimate that operating expenses, including direct expenses and overhead allocation, exceeded the net revenue retained for this portion of the NRZ servicing portfolio by approximately
$3.0 million
. At this stage, we do not anticipate significant operational impacts on our servicing business as a result of this termination. The terminated servicing is comprised of Agency loans with relatively low delinquencies that do not pose a high level of operating and compliance risk or require substantial direct and oversight staffing relative to our non-Agency servicing. Nonetheless, we intend to right-size and reduce expenses in our servicing business and the related corporate support functions to the extent possible to align with our smaller portfolio.
We currently anticipate that the loan deboarding fees from NRZ will offset a significant portion of our transition and restructuring costs assuming an orderly and timely transfer. However, it is possible that the loan deboarding and other transition activities that we will undertake as a result of the termination may not occur in an orderly or timely manner, which could be disruptive and could result in us incurring additional costs or even in disagreements with NRZ relating to our respective rights and obligations. Overall, our current view is that if we can exclude the legacy PMC NRZ servicing portfolio and successfully execute on the necessary transition and expense reduction actions in an orderly and timely manner, we will be able to enhance the long-term financial performance of our servicing business.
The legacy Ocwen agreements have an initial term ending in July 2022 and the underlying loans are almost exclusively non-Agency loans. As a result, the servicing of these loans involves a higher level of operational and regulatory risk and requires substantial direct and oversight staffing relative to Agency loans. NRZ may terminate the agreements for convenience, subject to Ocwen’s right to receive a termination fee and 180 days’ notice at any time during the initial term. The termination fee is calculated as specified in the Ocwen agreements, and is a discounted percentage of the expected revenues that would be owed to Ocwen over the remaining contract term based on certain portfolio run off assumptions. After the initial term, these agreements can be renewed for three-month terms at NRZ’s option. In addition to a base servicing fee, we receive ancillary income, which primarily includes late fees, loan modification fees and Speedpay® fees. We may also receive certain incentive fees or pay penalties tied to various contractual performance metrics. NRZ receives all float earnings and deferred servicing fees related to delinquent borrower payments, as well as certain REO-related income, including REO referral commissions. As legal MSR owner, or in compliance with the Rights to MSRs agreements, NRZ is responsible for financing all servicing advance obligations in connection with the loans underlying the MSRs.
PMC and NRZ are parties to an MSR sale agreement pursuant to which
$2.7 billion
in UPB of MSRs and the related advances remain to be sold to NRZ as of December 31, 2019. These MSRs and the related advances have not been sold because required third-party consents have not been obtained. Ocwen and NRZ are in discussions regarding the disposition of these remaining assets.
In the ordinary course, we regularly share information with NRZ and discuss various aspects of our relationship. At times, we discuss modifications to our relationship that we believe could be to our mutual benefit as our respective businesses evolve over time. We also discuss alternatives to the outcomes contemplated under our agreements when they were originally executed as facts and circumstances change over time. Examples of these discussions include our discussions with respect to the $18.5 billion in UPB of Rights to MSRs and our discussions with respect to the
$2.7 billion
in UPB of MSRs and the related advances that remain to be sold to NRZ under the legacy PMC sale agreement referenced above. With respect to the Rights to MSRs, we are discussing various alternative arrangements, including those contemplated under our existing agreements which
11
provide, among other scenarios, that the Rights to MSRs could (i) remain in the existing Rights to MSR structure, (ii) be acquired by Ocwen or (iii) be sold or transferred to a third party together with Ocwen’s title to the related MSRs. As part of these discussions, we have discussed several potential changes to existing contracts. It is also possible that NRZ could exercise its rights to terminate for convenience some or all of the legacy Ocwen servicing agreements. In our business planning efforts, we have analyzed the potential impact of such an action by NRZ in light of the current and predicted future economics of the NRZ relationship generally. Because of the large percentage of our servicing business that is represented by agreements with NRZ, if NRZ exercised all or a significant portion of these termination rights, we would need to substantially restructure many aspects of our servicing business as well as the related corporate support functions to address our smaller servicing portfolio. This would likely be a complex and expensive undertaking. However, we would also receive termination fees that we would expect to offset a significant portion of our transition and restructuring costs. Overall, we believe that if we were to exclude our NRZ servicing portfolio and successfully execute on the necessary transition and restructuring actions, we would be able to enhance the long-term financial performance and reduce the client concentration and operating risk profile of our servicing business.
ALTISOURCE VENDOR RELATIONSHIP
Ocwen is a party to a number of long-term agreements with Altisource S.à r.l., and certain of other subsidiaries of Altisource Portfolio Solutions, S.A. (Altisource), including a Services Agreement, under which Altisource provides various services, such as property valuation services, property preservation and inspection services and title services, among other things. This agreement expires August 31, 2025 and includes renewal provisions. Ocwen and Altisource have also entered into a Master Services Agreement pursuant to which Altisource currently provides title services to Liberty. Ocwen also has a General Referral Fee Agreement with Altisource pursuant to which Ocwen receives referral fees which are paid out of the commission that would otherwise be paid to Altisource as the selling broker in connection with real estate sales services provided by Altisource. However, for MSRs that transferred to NRZ, as well as those subject to our Rights to MSRs agreements with NRZ, we are not entitled to REO referral commissions.
In February 2019, Ocwen and Altisource signed a Binding Term Sheet, which among other things, confirmed Altisource’s cooperation with the deboarding of loans from Altisource’s REALServicing servicing system to Black Knight MSP. The Binding Term Sheet also amends certain provisions in the Services Agreement. After certain conditions have been met and where Ocwen has the right to select the services provider, Ocwen agreed to use Altisource to provide the types of services that Altisource currently provides under the Services Agreement for at least 90% of services for all portfolios for which Ocwen is the servicer or subservicer, except that Altisource will be the provider for all such services for the portfolios: (i) acquired by Ocwen pursuant to loan servicing under agreements from Homeward (acquired in 2012) or assigned and assumed by Ocwen from Residential Capital, LLC, et al (assets acquired in 2013); and (ii) acquired from Ocwen, excluding certain portfolios in which PHH has an interest, by NRZ or its affiliates prior to the date of the Binding Term Sheet. The Binding Term Sheet also sets forth a framework for negotiating additional service level changes under the Services Agreement in the future. As specified in the Binding Term Sheet, if Altisource fails certain performance standards for specified periods of time, then Ocwen may terminate Altisource as a provider for the applicable service(s), subject to Altisource’s right to cure. For certain claims arising from service referrals received by Altisource after the effective date of the Binding Term Sheet, the provisions include reciprocal indemnification obligations in the event of negligence by either party, and Altisource’s indemnification of Ocwen in the event of breach by Altisource of its obligations under the Services Agreement. The limitations of liability provisions include an exception for losses either party suffers as a result of third-party claims.
Certain services provided by Altisource under these agreements are charged to the borrower and/or mortgage loan investor. Accordingly, such services, while derived from our loan servicing portfolio, are not reported as expenses by Ocwen. These services include residential property valuation, residential property preservation and inspection services, title services and real estate sales-related services.
USVI OPERATIONS
The majority of our USVI operations and assets were transferred to the U.S. during 2019 as a result of our legal entity simplification.
In 2012, as part of an initiative to reorganize the ownership and management of our global servicing assets and operations under a single entity and cost-effectively expand our U.S.- based origination and servicing activities, Ocwen formed OMS under the laws of the USVI where OMS was incorporated and had its principal place of business. OMS was headquartered in Christiansted, St. Croix, USVI and was located in a federally recognized economic development zone where qualified entities are eligible for certain tax benefits. We refer to these benefits as “EDC Benefits” as they are granted by the USVI Economic Development Commission (EDC). We were approved as a Category IIA service business, and are therefore entitled to receive significant benefits that may have a favorable impact on our effective tax rate. These benefits, among others, enabled us to avail ourselves of a credit of 90% of income taxes on certain qualified income related to our servicing business. The exemption was granted as of October 1, 2012 and is available for a period of 30 years until expiration on September 30, 2042. Although we are
12
eligible for a reduced tax rate in the USVI, the reduced tax rate has not provided Ocwen with a foreign tax benefit in recent tax years as we have been incurring taxable losses in the USVI.
During 2019, following our acquisition of PHH in 2018, and in connection with our overall corporate simplification and cost reduction efforts, we executed a legal entity reorganization whereby OLS, through which we previously conducted a substantial portion of our servicing business, was merged into PHH. OLS was previously the wholly-owned subsidiary of OMS, which was incorporated and headquartered in the USVI prior to its merger in November 2019 with Ocwen USVI Services, LLC, an entity which is also organized and headquartered in the USVI. As a result of this reorganization, the majority of our USVI operations and assets were transferred to the U.S. We expect the reorganization to result in efficiencies and operational cost savings through reduced complexity and a simplification of our global structure.
It is possible that we may not be able to retain our qualifications for the EDC Benefits, or that changes in U.S. federal, state, local, territorial or USVI taxation statutes or applicable regulations may cause a reduction in or an elimination of the value of the EDC Benefits, all of which could result in an increase to our tax expense, including a loss of anticipated income tax refunds, and, therefore, adversely affect our financial condition and results of operations. Additionally, although we executed a legal entity reorganization in 2019 such that the majority of our USVI operations and assets were transferred to the U.S., we plan to continue to maintain operations in the USVI until, through and after the reorganization as it is possible that our past and future EDC Benefits could be adversely impacted, which could jeopardize our ability to return to profitability.
On December 22, 2017, significant revisions to the Internal Revenue Code of 1986, as amended, were signed into law (Tax Act). The newly enacted federal income tax law, among other things, contains significant changes to corporate taxation, including reduction of the U.S. corporate tax rate from a top marginal rate of 35% to a flat rate of 21%, elimination of U.S. tax on foreign earnings (subject to certain important exceptions), and a new minimum tax enacted to prevent companies from stripping earnings out of the U.S. through U.S. tax deductible payments made to foreign affiliates. The reduction in the statutory U.S. federal rate is expected to positively impact our future U.S. after-tax earnings. However, the impact of the Tax Act on our future after tax earnings is subject to the effect of other complex provisions in the Tax Act, including the Base Erosion and Anti-Abuse Tax (BEAT), Global Intangible Low-Taxed Income (GILTI), and revised interest deductibility limitations. It is possible that the impact of these provisions could significantly reduce the benefit of the reduction in the statutory U.S. federal rate and may also negatively impact the tax advantages received from the EDC Benefits. In addition, Ocwen is continuing to evaluate the impact of the new tax legislation and recently issued regulations on its global tax position. Certain provisions of the new tax laws and regulations have resulted in an increase to our current income tax obligations.
EMPLOYEES
We had a total of approximately
5,300
and
7,200
employees at
December 31, 2019
and
2018
, respectively. We maintain operations in the U.S., USVI, India and the Philippines. At
December 31, 2019
, approximately
3,400
of our employees were located in India and approximately
400
were based in the Philippines. Of our foreign-based employees,
nearly
80%
were engaged in our Servicing operations as of
December 31, 2019
. Because of the large number of employees in India, our operations could be impacted by significant changes to the political or economic conditions in India or in the political or regulatory climate in the U.S. with respect to U.S. businesses engaging in foreign operations. If we had to curtail or cease our operations in India and transfer some or all of these operations to another geographic area, we could incur significant transition costs as well as higher future overhead costs that could materially and adversely affect our results of operations.
SUBSIDIARIES
For a listing of our significant subsidiaries, refer to Exhibit 21.1 of this Annual Report on Form 10-K.
AVAILABLE INFORMATION
Our annual report on Form 10-K, quarterly reports on Form 10-Q, current reports on Form 8-K and all amendments to those reports are made available free of charge through our website (www.ocwen.com) as soon as reasonably practicable after such material is electronically filed with or furnished to the SEC. The SEC maintains an Internet site that contains reports, proxy and information statements and other information regarding issuers, including Ocwen, that file electronically with the SEC. The address of that site is www.sec.gov. We have also posted on our website, and have available in print upon request (1) the charters for our Audit Committee, Compensation and Human Capital Committee, Nomination/Governance Committee and Risk and Compliance Committee, (2) our Corporate Governance Guidelines, (3) our Code of Business Conduct and Ethics and (4) our Code of Ethics for Senior Financial Officers. Within the time period required by the SEC and the New York Stock Exchange, we will post on our website any amendment to or waiver of the Code of Ethics for Senior Financial Officers, as well as any amendment to the Code of Business Conduct and Ethics or waiver thereto applicable to any executive officer or director. We may post information that is important to investors on our website. The information provided on our website is not part of this report and is, therefore, not incorporated herein by reference.
13
|
ITEM 1A.
|
RISK FACTORS
|
An investment in our common stock involves significant risk. We describe below the most significant risks that management believes affect or could affect us. Understanding these risks is important to understanding any statement in this Annual Report and to evaluating an investment in our common stock. You should carefully read and consider the risks and uncertainties described below together with all the other information included or incorporated by reference in this Annual Report before you make any decision regarding an investment in our common stock. You should also consider the information set forth above under “Forward Looking Statements.” If any of the following risks actually occur, our business, financial condition, liquidity and results of operations could be materially and adversely affected. If this were to happen, the value of our common stock could significantly decline, and you could lose some or all of your investment. While the following discussion provides a description of some of the important risks that could cause our results to vary materially from those expressed in public statements or documents, other factors besides those discussed within this Annual Report or elsewhere in other of our reports filed with or furnished to the SEC could also affect our business or results.
We have divided this section into the following general risk categories:
|
•
|
Legal and Regulatory Related Risks
|
|
•
|
Risks Related to Our Financial Performance, Financing Our Business, Liquidity and Net Worth and the Economy
|
|
•
|
Operational Risks and Other Risks Related to Our Business
|
|
•
|
Tax Risks
|
|
•
|
Risks Relating to Ownership of Our Common Stock
|
Legal and Regulatory Risks
The business in which we engage is complex and heavily regulated. If we fail to operate our business in compliance with both existing and future regulations, our business, reputation, financial condition or results of operations could be materially and adversely affected.
Our business is subject to extensive regulation by federal, state and local governmental authorities, including the CFPB, HUD, the SEC and various state agencies that license and conduct examinations of our servicing and lending activities. In addition, we operate under a number of regulatory settlements that subject us to ongoing reporting and other obligations. See the next risk factor below for additional detail concerning these regulatory settlements. From time to time, we also receive requests (including requests in the form of subpoenas and civil investigative demands) from federal, state and local agencies for records, documents and information relating to our servicing and lending activities. The GSEs (and their conservator, the FHFA), Ginnie Mae, the United States Treasury Department, various investors, non-Agency securitization trustees and others also subject us to periodic reviews and audits.
In the current regulatory environment, we have faced and expect to continue to face heightened regulatory and public scrutiny as an organization as well as stricter and more comprehensive regulation of the entire mortgage sector. We must devote substantial resources to regulatory compliance, and we incurred, and expect to continue to incur, significant ongoing costs to comply with new and existing laws and governmental regulation of our business. If we fail to effectively manage our regulatory and contractual compliance, the resources we are required to devote and our compliance expenses would likely increase. Any significant delay or complication in fulfilling our regulatory commitments and resolving remaining legacy matters may jeopardize our ability to return to profitability.
We must comply with a large number of federal, state and local consumer protection laws including, among others, the Dodd-Frank Act, the Gramm-Leach-Bliley Act, the Fair Debt Collection Practices Act, RESPA, TILA, the Fair Credit Reporting Act, the Servicemembers Civil Relief Act, the Homeowners Protection Act, the Federal Trade Commission Act, the Telephone Consumer Protection Act, the Equal Credit Opportunity Act, as well as individual state licensing and foreclosure laws and federal and local bankruptcy rules. These statutes apply to many facets of our business, including loan origination, default servicing and collections, use of credit reports, safeguarding of non-public personally identifiable information about our customers, foreclosure and claims handling, investment of and interest payments on escrow balances and escrow payment features, and mandate certain disclosures and notices to borrowers. These requirements can and do change as statutes and regulations are enacted, promulgated, amended, interpreted and enforced. In addition, we must maintain an effective corporate governance and compliance management system. See “Business - Regulation” for additional information regarding our regulators and the laws that apply to us.
We must structure and operate our business to comply with applicable laws and regulations and the terms of our regulatory settlements. This can require judgment with respect to the requirements of such laws and regulations and such settlements. While we endeavor to engage proactively with our regulators in an effort to ensure we do so correctly, if we fail to interpret correctly the requirements of such laws and regulations or the terms of our regulatory settlements, we could be found to be in breach of such laws, regulations or settlements.
14
Our actual or alleged failure to comply with the terms of our regulatory settlements or applicable federal, state and local consumer protection laws, regulations and licensing requirements could lead to any of the following:
|
•
|
administrative fines and penalties and litigation;
|
|
•
|
loss of our licenses and approvals to engage in our servicing and lending businesses;
|
|
•
|
governmental investigations and enforcement actions;
|
|
•
|
civil and criminal liability, including class action lawsuits and actions to recover incentive and other payments made by governmental entities;
|
|
•
|
breaches of covenants and representations under our servicing, debt or other agreements;
|
|
•
|
damage to our reputation;
|
|
•
|
inability to raise capital or otherwise secure the necessary financing to operate the business and refinance maturing liabilities;
|
|
•
|
changes to our operations that may otherwise not occur in the normal course, and that could cause us to incur significant costs; or
|
|
•
|
inability to execute on our business strategy.
|
Any of these outcomes could materially and adversely affect our business, reputation, financial condition, liquidity and results of operations.
In recent years, the general trend among federal, state and local lawmakers and regulators has been toward increasing laws, regulations and investigative proceedings with regard to residential mortgage lenders and servicers. The CFPB continues to take a very active role in the mortgage industry, and its rule-making and regulatory agenda relating to loan servicing and originations continues to evolve. Individual states, including New York and California, have also been active, as have other regulatory organizations such as the MMC. We also believe there has been a shift among certain regulators towards a broader view of the scope of regulatory oversight responsibilities with respect to mortgage originators and servicers. In addition to their traditional focus on licensing and examination matters, certain regulators have begun to make observations, recommendations or demands with respect to such areas as corporate governance, safety and soundness, and risk and compliance management. We must endeavor to work cooperatively with our regulators to understand all their concerns if we are to be successful in our business.
The CFPB and state regulators have also increasingly focused on the use, and adequacy, of technology in the mortgage servicing industry, privacy concerns and other topical issues, such as likely discontinuation of the London Interbank Offered Rate (LIBOR). In 2016, the CFPB issued a special edition supervision report that stressed the need for mortgage servicers to assess and make necessary improvements to their information technology systems in order to ensure compliance with the CFPB’s mortgage servicing requirements. The NY DFS also issued Cybersecurity Requirements for Financial Services Companies, effective in 2017, which require banks, insurance companies, and other financial services institutions regulated by the NY DFS to establish and maintain a cybersecurity program designed to protect consumers and ensure the safety and soundness of New York State’s financial services industry. Likewise, the NY DFS has directed New York-regulated depository and non-depository institutions, insurers and pension funds to submit their plans for managing the risks relating to the likely discontinuation of LIBOR. Similarly, the California Consumer Privacy Act, which was enacted in 2018 and became effective on January 1, 2020, created new consumer rights relating to the access to, deletion of, and sharing of personal information.
Presently, a level of heightened uncertainty exists with respect to the future of regulation of mortgage lending and servicing, including the future of the Dodd Frank Act and CFPB. We cannot predict the specific legislative or executive actions that may result or what actions federal or state regulators might take in response to potential changes to the Dodd Frank Act or to the federal regulatory environment generally. Such actions could impact the industry generally or us specifically, could impact our relationships with other regulators, and could adversely impact our business and limit our ability to reach an appropriate resolution with the CFPB, with which we are engaged to attempt to resolve certain concerns relating to our mortgage servicing practices, as described in the next risk factor.
New regulatory and legislative measures, or changes in enforcement practices, including those related to the technology we use, could, either individually or in the aggregate, require significant changes to our business practices, impose additional costs on us, limit our product offerings, limit our ability to efficiently pursue business opportunities, negatively impact asset values or reduce our revenues. Accordingly, they could materially and adversely affect our business and our financial condition, liquidity and results of operations.
Governmental bodies have taken regulatory and legal actions against us in the past and may in the future impose regulatory fines or penalties or impose additional requirements or restrictions on our activities that could increase our operating expenses, reduce our revenues or otherwise adversely affect our business, financial condition, liquidity, results of operations, ability to grow and reputation.
We are subject to a number of ongoing federal and state regulatory examinations, consent orders, inquiries, subpoenas, civil investigative demands, requests for information and other actions that could result in further adverse regulatory action
15
against us, including certain matters summarized below. See
Note 24 — Regulatory Requirements
and
Note 26 — Contingencies
to the Consolidated Financial Statements.
CFPB
In April 2017, the CFPB filed a lawsuit in the federal district court for the Southern District of Florida against Ocwen, OMS and OLS alleging violations of federal consumer financial laws relating to our servicing business dating back to 2014. The CFPB’s claims include allegations regarding (1) the adequacy of Ocwen’s servicing system and integrity of Ocwen’s mortgage servicing data, (2) Ocwen’s foreclosure practices and (3) various purported servicer errors with respect to borrower escrow accounts, hazard insurance policies, timely cancellation of private mortgage insurance, handling of customer complaints, and marketing of optional products. The CFPB alleges violations of unfair, deceptive acts or abusive practices, as well as violations of specific laws or regulations. The CFPB does not claim specific monetary damages, although it does seek consumer relief, disgorgement of allegedly improper gains, and civil money penalties. While we believe we have factual and legal defenses to the CFPB’s allegations and are vigorously defending ourselves, the outcome of the matters raised by the CFPB, whether through negotiated settlements, court rulings or otherwise, could potentially involve monetary fines or penalties or additional restrictions on our business and could have a material adverse impact on our business, reputation, financial condition, liquidity and results of operations.
State Licensing and State Attorneys General
Our licensed entities are required to renew their licenses, typically on an annual basis, and to do so they must satisfy the license renewal requirements of each jurisdiction, which generally include financial requirements such as providing audited financial statements or satisfying minimum net worth requirements and non-financial requirements such as satisfactorily completing examinations as to the licensee’s compliance with applicable laws and regulations. The minimum net worth requirements to which our licensed entities are subject are unique to each state and type of license. We believe our licensed entities were in compliance with all of their minimum net worth requirements at
December 31, 2019
. However, it is possible that regulators could disagree with our calculations, and one state regulator has disagreed with our calculation for a prior year period; we have discussed the matter with the regulator, including why we believe we were in compliance with the applicable net worth requirements. Failure to satisfy any of the requirements to which our licensed entities are subject could result in a variety of regulatory actions ranging from a fine, a directive requiring a certain step to be taken, a suspension or, ultimately, a revocation of a license, any of which could have a material adverse impact on our results of operations and financial condition.
In April 2017 and shortly thereafter, mortgage and banking regulatory agencies from 29 states and the District of Columbia took regulatory actions against OLS and certain other Ocwen companies that alleged deficiencies in our compliance with laws and regulations relating to our servicing and lending activities. These regulatory actions generally took the form of orders styled as “cease and desist orders” and prohibited a range of actions relating to our lending and servicing activities. We entered into agreements with all 29 states plus the District of Columbia to resolve these regulatory actions. These agreements generally contained the Multi-State Common Settlement Terms.
In addition, Ocwen entered into settlements with certain states on different or additional terms, which include making additional communications with and for borrowers, certain restrictions, certain review, reporting and remediation obligations, and requirements to make certain monetary payments.
We have incurred and will continue to incur, significant costs complying with the terms of these settlements, including in connection with the escrow analysis and the transition to Black Knight MSP. In addition, the remediation of errors identified during the escrow analysis could result in payments, credits or other actions to remediate such errors and legal or other actions could be taken against us by regulators or others with respect to such errors, which could result in additional costs or other adverse impacts. If we fail to comply with the terms of our settlements, additional legal or other actions could be taken against us. Such actions could have a materially adverse impact on our business, reputation, financial condition, liquidity and results of operations.
Although we have resolved all of the administrative actions taken by state regulators in April 2017 and shortly thereafter, we have not resolved all of the legal actions. In April 2017, and concurrent with the issuance of the cease and desist orders and the filing of the CFPB lawsuit discussed above, the Florida Attorney General, together with the Florida Office of Financial Regulation, filed a lawsuit in the federal district court for the Southern District of Florida against Ocwen, OMS and OLS alleging violations of federal and state consumer financial laws relating to our servicing business. These claims are similar to the claims made by the CFPB. The Florida lawsuit seeks injunctive and equitable relief, costs, and civil money penalties in excess of $10,000 per confirmed violation of the applicable statute.
Certain of the state regulators’ cease and desist orders referenced a confidential supervisory memorandum of understanding (MOU) that we entered into with the MMC and six states relating to a servicing examination from 2013 to 2015. Among other things, the MOU prohibited us from repurchasing stock during the development of a going forward plan and, thereafter, except as permitted by the plan. We submitted a plan in 2016 that contained no stock repurchase restrictions and, therefore, we do not
16
believe we are currently restricted from repurchasing stock. We requested confirmation from the signatories of the MOU that they agree with this interpretation, and received affirmative responses from the MMC and five states, and a response declining to take a legal position from the remaining state.
In January 2018, prior to our acquisition of PHH, PMC entered into a settlement agreement with the MMC and consent orders with certain state attorneys general to resolve and close out findings of an MMC examination of PMC’s legacy mortgage servicing practices. Under the terms of these settlements, PMC agreed to comply with certain servicing standards, to conduct testing of compliance with such servicing standards for a period of three years ending December 31, 2020, and to report to the MMC regarding the same. To the extent PMC does not comply with the terms of the servicing standards, the MMC or state attorneys general could take regulatory action against us, including imposing fines or penalties or otherwise restricting our business activities.
We continue to work with the NY DFS to address matters they continue to raise with us as well as to fulfill our commitments under the 2017 NY Consent Order and PHH acquisition conditional approval. To the extent that we fail to address adequately any concerns raised by the NY DFS or fail to fulfill our commitments to the NY DFS, the NY DFS could take regulatory action against us, including imposing fines or penalties or otherwise restricting our business activities. Any such actions could have a material adverse impact on our business, financial condition liquidity and results of operations.
We have certain remaining reporting and other obligations under the 2017 CA Consent Order, including our completion of $198.0 million in debt forgiveness for California borrowers by June 30, 2019. We believe we fulfilled this requirement during the first quarter of 2019. However, our completion of this requirement is subject to testing by the CA DBO’s third-party administrator who must confirm, among other things, that modified loans have remained current for specified time periods. If we are unable to satisfy this requirement or obtain an extension, the 2017 CA Consent Order obligates us to pay the remaining amount to the CA DBO in cash. If the CA DBO were to allege that we failed to comply with our obligations under the 2017 CA Consent Order or that we otherwise were in breach of applicable laws, regulations or licensing requirements, the CA DBO could also take regulatory actions against us, including imposing fines or penalties or otherwise restricting our business activities. Any such actions could have a material adverse impact on our business, financial condition liquidity and results of operations.
Other Matters
On occasion, we engage with agencies of the federal government on various matters, including the Department of Justice, the Office of Inspector General of HUD, SIGTARP and the VA Office of the Inspector General. In addition to the expense of responding to subpoenas and other requests for information from such agencies, in the event that any of these engagements result in allegations of wrongdoing by us, we may incur fines or penalties or significant legal expenses defending ourselves against such allegations.
In recent years, we have entered into significant settlements with the NY DFS, the CA DBO, and the 2013 Ocwen National Mortgage Settlement. These settlements involved payments of significant monetary amounts, monitoring by third-party firms for which we were financially responsible and other restrictions on our business. For example, we recognized
$177.5 million
in third-party monitoring costs alone relating to these settlements between 2014 and 2017. While we are not currently subject to active monitorships under these settlements, we remain obligated to comply with the commitments made to our regulators and if we violate those commitments one or more of these entities could take regulatory action against us. Any future settlements or other regulatory actions against us could have a material adverse impact on our business, reputation, operating results, liquidity and financial condition will be adversely affected.
To the extent that an examination or other regulatory engagement results in an alleged failure by us to comply with applicable laws, regulations or licensing requirements, or if allegations are made that we have failed to comply with applicable laws, regulations or licensing requirements or the commitments we have made in connection with our regulatory settlements (whether such allegations are made through administrative actions such as cease and desist orders, through legal proceedings or otherwise) or if other regulatory actions of a similar or different nature are taken in the future against us, this could lead to (i) administrative fines, penalties and litigation, (ii) loss of our licenses and approvals to engage in our servicing and lending businesses, (iii) governmental investigations and enforcement actions, (iv) civil and criminal liability, including class action lawsuits and actions to recover incentive and other payments made by governmental entities, (v) breaches of covenants and representations under our servicing, debt or other agreements, (vi) damage to our reputation, (vii) inability to raise capital or otherwise secure the necessary funding to operate the business, (viii) changes to our operations that may otherwise not occur in the normal course, and that could cause us to incur significant costs, and (ix) inability to execute on our business strategy. Any of these outcomes could increase our operating expenses and reduce our revenues, hamper our ability to grow or otherwise materially and adversely affect our business, reputation, financial condition, liquidity and results of operations.
Our regulatory settlements and public allegations regarding our business practices by regulators and other third parties may affect other regulators’, rating agencies’, and creditors’ perceptions, which could adversely impact our financial results and ongoing operations.
17
Our regulatory settlements and public allegations regarding our business practices by regulators and other third parties may affect other regulators’, rating agencies’ and creditors’ perceptions of us. As a result, our ordinary course interactions with regulators may be adversely affected. We may incur additional compliance costs and management time may be diverted from other aspects of our business to address regulatory issues. It is possible that we may incur additional fines or penalties or even that we could lose the licenses and approvals necessary to engage in our servicing and lending businesses. In addition, certain regulators have begun to make observations, recommendations or demands with respect to areas such as corporate governance, safety and soundness and risk and compliance management, which could require us to incur additional expense or which could result in the imposition of additional requirements such as liquidity and capital requirements or restrictions on business conduct such as engaging in stock repurchases. To the extent that rating agencies or creditors perceive us negatively, our servicer or credit ratings could be adversely impacted and our access to funding could be limited.
If regulators allege that we do not comply with the terms of our regulatory settlements, or if we enter into future regulatory settlements, it could significantly impact our ability to maintain and grow our servicing portfolio.
Our servicing portfolio naturally decreases over time as homeowners make regularly scheduled mortgage payments, prepay loans prior to maturity, refinance with a mortgage loan not serviced by us or involuntarily liquidate through foreclosure or other liquidation process. Our ability to maintain or grow the size of our servicing portfolio depends on our ability to acquire the right to service or subservice additional pools of mortgage loans or to originate additional loans for which we retain the MSRs.
Our regulatory settlements have significantly impacted our ability to maintain or grow our servicing portfolio because we agreed to certain restrictions that effectively prohibited future bulk acquisitions of residential servicing. While certain of these restrictions have been eased in connection with our resolution of state regulatory matters and acquisition of PHH, we are still restricted in our ability to grow our portfolio under the terms of our agreements with the NY DFS. If we are unable to satisfy the conditions of the regulatory commitments we made to these and other regulators, or if a future regulatory settlement restricts our ability to acquire MSRs, we will be unable to grow or even maintain the size of our servicing portfolio through acquisitions and our business could be materially and adversely affected. Moreover, even when regulatory restrictions are lifted, the reputational damage done by these actions may inhibit our ability to acquire new business.
If we are unable to respond timely and effectively to routine or other regulatory examinations and borrower complaints, our business and financial conditions may be adversely affected.
Regulatory examinations by state and federal regulators are part of our ordinary course business activities. If we are unable to respond effectively to regulatory examinations, our business and financial conditions may be adversely affected. For example, our January 2015 consent order with the CA DBO arose out of an alleged failure to respond adequately to requests from the CA DBO as part of a routine regulatory examination. In addition, we receive various escalated borrower complaints and inquiries from our state and federal regulators and state Attorneys General and are required to respond within the time periods prescribed by such entities. If we fail to respond effectively and timely to regulatory examinations and escalations, legal action could be taken against us by such regulators and, as a result, we may incur fines or penalties or we could lose the licenses and approvals necessary to engage in our servicing and lending businesses. We could also suffer from reputational harm and become subject to private litigation.
The Dodd-Frank Act has significantly impacted our business and we expect it to continue to do so. In addition, new rules and regulations or more stringent interpretations of existing rules and regulations by the CFPB could result in increased compliance costs and, potentially, regulatory action against us.
We have devoted substantial resources and incurred significant compliance costs responding to the Dodd-Frank Act and the rules and regulations issued thereunder, including CFPB rules. We expect to continue to do so. If we fail to comply with the Dodd-Frank Act and the rules and regulations issued thereunder, including CFPB rules and subsequent amendments, we could be subject to financial penalties, restrictions on our business activities, private litigation, breaches of our contractual obligations to counterparties (including our debt agreements) and adverse actions by the GSEs or other entities, any of which could have a material adverse effect on our business, financial condition and results of operations. For example, as discussed in greater detail above, we are currently defending ourselves against a lawsuit brought by the CFPB alleging failures to comply with federal consumer finance laws relating to our servicing business.
Private legal proceedings and related costs alleging failures to comply with applicable laws or regulatory requirements could adversely affect our financial condition and results of operations.
We are subject to various
pending private legal proceedings, including purported class actions, challenging whether certain of our loan servicing practices and other aspects of our business comply with applicable laws and regulatory requirements. For example, we are currently a defendant in various matters alleging that (1) certain fees imposed on borrowers relating to payment processing, payment facilitation, or payment convenience violate state laws similar to the Fair Debt Collection Practices Act, (2) certain fees we assess on borrowers are marked up improperly in violation of applicable state and federal law,
18
(3) we breached fiduciary duties we purportedly owe to benefit plans due to the discretion we exercise in servicing certain securitized mortgage loans and (4) certain legacy mortgage reinsurance arrangements violated RESPA.
In the future, we are likely to become subject to other private legal proceedings alleging failures to comply with applicable laws and regulations, including putative class actions, in the ordinary course of our business. While we do not currently believe that the resolution of the vast majority of the legal proceedings we face will have a material adverse effect on our financial condition or results of operations, we cannot express a view with respect to all of these proceedings. The outcome of any pending legal matter is never certain, and it is possible that adverse results in private legal proceedings could materially and adversely affect our financial results and operations. We have paid significant amounts to settle private legal proceedings in recent periods and paid significant amounts in legal and other costs in connection with defending ourselves in such proceedings. To the extent we are unable to avoid such costs in future periods, our business, financial position, results of operations and cash flows could be materially and adversely affected.
Non-compliance with laws and regulations could lead to termination of servicing agreements or defaults under our debt agreements.
Most of our servicing agreements and debt agreements contain provisions requiring compliance with applicable laws and regulations. While the specific language in these agreements takes many forms and materiality qualifiers are often present, if we fail to comply with applicable laws and regulations, we could be terminated as a servicer and defaults could be triggered under our debt agreements, which could materially and adversely affect our revenues, cash flows, liquidity, business and financial condition. We could also suffer reputational damage and trustees, lenders and other counterparties could cease wanting to do business with us.
If new laws and regulations lengthen foreclosure times or introduce new regulatory requirements regarding foreclosure procedures, our operating costs and liquidity requirements could increase and we could be subject to regulatory action.
When a mortgage loan that we service is in foreclosure, we are generally required to continue to advance delinquent principal and interest to the securitization trust and to make advances for delinquent taxes and insurance and foreclosure costs and the upkeep of vacant property in foreclosure to the extent that we determine that such amounts are recoverable. These servicing advances are generally recovered when the delinquency is resolved or upon liquidation. Regulatory actions that lengthen the foreclosure process will increase the amount of servicing advances that we are required to make, lengthen the time it takes for us to be reimbursed for such advances and increase the costs incurred during the foreclosure process.
Increased regulatory scrutiny and new laws and procedures could cause us to adopt additional compliance measures and incur additional compliance costs in connection with our foreclosure processes. We may incur legal and other costs responding to regulatory inquiries or any allegation that we improperly foreclosed on a borrower. We could also suffer reputational damage and could be fined or otherwise penalized if we are found to have breached regulatory requirements.
If we fail to comply with the TILA-RESPA Integrated Disclosure (TRID) rules, our business and operations could be materially and adversely affected and our plans to expand our lending business could be adversely impacted.
The TRID rules include requirements relating to consumer facing disclosure and waiting periods to allow consumers to reconsider committing to loans after receiving required disclosures. If we fail to comply with the TRID rules, we may be unable to sell loans that we originate or purchase, or we may be required to sell such loans at a discount compared to other loans. We also could be subject to repurchase or indemnification claims from purchasers of such loans, including the GSEs. Additionally, loans might stay on our warehouse lines for longer periods before sale, which would increase our liquidity needs, holding costs and interest expense. We could also be subject to regulatory actions or private lawsuits.
In response to the TRID rules, we have implemented significant modifications and enhancements to our loan production processes and systems, and we continue to devote significant resources to TRID compliance. As regulatory guidance and enforcement and the views of the GSEs and other market participants such as warehouse loan lenders evolve, we may need to modify further our loan production processes and systems in order to adjust to evolution in the regulatory landscape and successfully operate our lending business. In such circumstances, if we are unable to make the necessary adjustments, our business and operations could be adversely affected and we may not be able to execute on our plans to grow our lending business.
Failure to comply with the Home Mortgage Disclosure Act (HMDA) and related CFPB regulations could adversely impact our business.
HMDA requires financial institutions to report certain mortgage data in an effort to provide the regulators and the public with information that will help show whether financial institutions are serving the housing credit needs of the neighborhoods and communities in which they are located. The data points include information related to the loan applicant/borrower (e.g., age, ethnicity, race and credit score), the underwriting process, loan terms and fees, lender credits and interest rate, among others. The scope of the information available to the public could increase fair lending regulatory scrutiny and third-party plaintiff litigation, as the changes will expand the ability of regulators and third parties to compare a particular lender to its
19
peers in an effort to determine differences among lenders in certain demographic borrower populations. We have devoted, and will need to devote, significant resources to establishing systems and processes for complying with HMDA on an ongoing basis. If we are not successful in capturing and reporting the new HMDA data, and analyzing and correcting any adverse patterns, we could be exposed to regulatory actions and private litigation against us, we could suffer reputational damage and we could incur losses, any of which could materially and adversely impact our business, financial condition and results of operations.
As a participant in the now ended HAMP program, we are subject to review by SIGTARP, which could adversely affect our business, reputation, and financial condition.
A significant portion of Ocwen’s loan modifications in recent years have been in connection with the now ended HAMP program. SIGTARP has indicated that it is assessing potential unlawful conduct by servicers in the HAMP program. In May 2017, we received a subpoena from SIGTARP requesting various documents and information relating to Ocwen’s participation in the HAMP program, and we have been providing documents and information in response to that subpoena. If SIGTARP were to allege breaches of the HAMP program, such allegations could be referred to the enforcement authorities within the Department of the Treasury or the Department of Justice and if such enforcement authorities elected to take action against Ocwen, it could adversely affect our business, reputation and financial condition, regardless of the outcome of any such enforcement action.
There may be material changes to the laws, regulations, rules or practices applicable to reverse mortgage programs sponsored by HUD and FHA, and securitized by Ginnie Mae, which could materially and adversely affect us and the reverse mortgage industry as a whole.
The reverse mortgage industry is largely dependent upon rules and regulations implemented by HUD, FHA and Ginnie Mae. There can be no guarantee that HUD/FHA will retain Congressional authorization to continue the HECM program, which provides FHA government insurance for qualifying HECM loans, or that they will not make material changes to the laws, regulations, rules or practices applicable to reverse mortgage programs. For example, HUD previously implemented certain lending limits for the HECM program, and added credit-based underwriting criteria designed to assess a borrower’s ability and willingness to satisfy future tax and insurance obligations. In addition, Ginnie Mae’s participation in the reverse mortgage industry may be subject to economic and political changes that cannot be predicted. Any of the aforementioned circumstances could materially and adversely affect the performance of our reverse mortgage business and the value of our common stock.
Regulators continue to be active in the reverse mortgage space, including due to the perceived susceptibility of older borrowers to be influenced by deceptive or misleading marketing activities. Regulators have also focused on appraisal practices because reverse mortgages are largely dependent on collateral valuation. If we fail to comply with applicable laws and regulations relating to the origination of reverse mortgages, we could be subject to adverse regulatory actions, including potential fines, penalties or sanctions, and our business, reputation, financial condition and results of operations could be materially and adversely affected.
Violations of predatory lending and/or servicing laws could negatively affect our business.
Various federal, state and local laws have been enacted that are designed to discourage predatory lending and servicing practices. The federal Home Ownership and Equity Protection Act of 1994 (HOEPA) prohibits inclusion of certain provisions in residential loans that have mortgage rates or origination costs in excess of prescribed levels and requires that borrowers be given certain additional disclosures prior to origination. Some states have enacted, or may enact, similar laws or regulations, which in some cases impose restrictions and requirements greater than are those in HOEPA. In addition, under the anti-predatory lending laws of some states, the origination of certain residential loans, including loans that are not classified as “high cost” loans under HOEPA or other applicable law, must satisfy a net tangible benefits test with respect to the related borrower. A failure by us to comply with these laws, to the extent we originate, service or acquire residential loans that are non-compliant with HOEPA or other predatory lending or servicing laws, could subject us, as an originator or a servicer, or as an assignee, in the case of acquired loans, to monetary penalties and could result in the borrowers rescinding the affected loans. Lawsuits have been brought in various states making claims against originators, servicers and assignees of high cost loans for violations of state law. Named defendants in these cases have included numerous participants within the secondary mortgage market. If we are found to have violated predatory or abusive lending laws, defaults could be declared under our debt or servicing agreements, we could suffer reputational damage, and we could incur losses, any of which could materially and adversely impact our business, financial condition and results of operations.
Failure to comply with FHA underwriting guidelines could adversely impact our business.
We must comply with FHA underwriting guidelines in order to successfully originate FHA loans. If we fail to do so, we may not be able collect on FHA insurance. In addition, we could be subject to allegations of violations of the False Claims Act asserting that we submitted claims for FHA insurance on loans that had not been underwritten in accordance with FHA underwriting guidelines. If we are found to have violated FHA underwriting guidelines, we could face regulatory penalties and
20
damages in litigation, suffer reputational damage, and we could incur losses due to an inability to collect on such insurance, any of which could materially and adversely impact our business, financial condition and results of operations.
Failure to comply with United States and foreign laws and regulations applicable to our global operations could have an adverse effect on our business, financial position, results of operations or cash flows.
As a business with a global workforce, we need to ensure that our activities, including those of our foreign operations, comply with applicable United States and foreign laws and regulations. Various states have implemented regulations which specifically restrict the ability to perform certain servicing and originations functions offshore and, from time to time, various state regulators have scrutinized the operations of our foreign subsidiaries. For example, as previously disclosed, in 2016, two of our foreign subsidiaries entered into a Consent Order with the Washington State Department of Financial Institutions relating to the activities of those entities in Washington State under the Washington Consumer Loan Act. Our failure to comply with applicable laws and regulations could, among other things, result in restrictions on our operations, loss of licenses, fines, penalties or reputational damage and have an adverse effect on our business.
Failure to comply with the S.A.F.E. Act could adversely impact our business.
The Secure and Fair Enforcement for Mortgage Licensing Act of 2008 (the S.A.F.E. Act) requires the individual licensing and registration of those engaged in the business of loan origination. The S.A.F.E. Act is designed to improve accountability on the part of loan originators, combat fraud and enhance consumer protections by encouraging states to establish a national licensing system and minimum qualification requirements for applicants. Thus, Ocwen must ensure proper licensing for all employees who participate in certain specified loan origination activities. Failure to comply with the S.A.F.E. Act licensing requirements could adversely impact Ocwen’s origination business.
Risks Related to Our Financial Performance, Financing Our Business, Liquidity and Net Worth and the Economy
Our strategic plan to return to profitability may not be successful.
We are facing certain challenges and uncertainties that could have significant adverse effects on our business, financial condition, liquidity and results of operations. The ability of management to appropriately address these challenges and uncertainties in a timely manner is critical to our ability to operate our business successfully.
Historical losses have significantly eroded stockholders’ equity and weakened our financial condition. We have established a set of key initiatives to achieve our objective of returning to sustainable profitability in the shortest timeframe possible within an appropriate risk and compliance environment. First, we must expand our originations activities in our lending business and acquisitions of MSRs that are prudent and well-executed with appropriate financial return targets to replenish and grow our servicing portfolio. Second, we must re-engineer our cost structure to go beyond eliminating redundant costs through the integration process and establish continuous cost improvement as a core strength. Third, we must manage our balance sheet to ensure adequate liquidity, finance our ongoing business needs and provide a solid platform for executing on our other key business initiatives. Finally, we must fulfill our regulatory commitments and resolve our remaining legal and regulatory matters on satisfactory terms.
There can be no assurance that we will successfully execute on these initiatives, or that even if we do execute on these initiatives we will be able to return to profitability. In addition to successful operational execution of our key initiatives, our success will also depend on market conditions and other factors outside of our control, including continued access to capital. If we continue to experience losses, our share price, business, reputation, financial condition, liquidity and results of operations could be materially and adversely affected.
If we are unable to obtain sufficient capital to meet the financing requirements of our business, or if we fail to comply with our debt agreements, our business, financing activities, financial condition and results of operations will be adversely affected.
Our business requires substantial amounts of capital and our financing strategy includes the use of leverage. During 2019, total leverage increased significantly relative to prior periods and we may increase our leverage further during 2020 as we execute on our business initiatives, including investing in owned MSRs to replenish portfolio runoff. Accordingly, our ability to finance our operations and repay maturing obligations rests in large part on our ability to continue to borrow money at reasonable rates. If we are unable to maintain adequate financing, or other sources of capital are not available, we could be forced to suspend, curtail or reduce our revenue generating objectives, which could harm our results of operations, liquidity, financial condition and business prospects. Our ability to borrow money is affected by a variety of factors including:
|
•
|
limitations imposed on us by existing debt agreements that contain restrictive covenants that may limit our ability to raise additional debt;
|
|
•
|
credit market conditions;
|
|
•
|
the strength of the lenders from whom we borrow;
|
|
•
|
lenders’ perceptions of us or our sector;
|
21
|
•
|
corporate credit and servicer ratings from rating agencies; and
|
|
•
|
limitations on borrowing under our MSR and advance facilities and mortgage loan warehouse facilities due to structural features in these facilities and the amount of eligible collateral that is pledged.
|
In addition, our advance facilities are revolving facilities, and in a typical monthly cycle, we repay a portion of the borrowings under these facilities from collections. During the remittance cycle, which starts in the middle of each month, we depend on our lenders to provide the cash necessary to make the advances that we are required to make as servicer. If one or more of these lenders were to restrict our ability to access these revolving facilities or were to fail, we may not have sufficient funds to meet our obligations. We typically require significantly more liquidity to meet our advance funding obligations than our available cash on hand.
Our advance financing facilities are comprised of (i) revolving notes issued to large financial institutions that generally have a revolving period of less than two years, and (ii) term notes issued to institutional investors with one-, two- and three-year periods. At December 31, 2019, we had
$679.1 million
outstanding under these facilities. The revolving periods for variable funding notes with a total maximum borrowing capacity of
$260.0 million
end in 2020.
In the event we are unable to renew, replace or extend the revolving period of one or more of these advance financing facilities, we would no longer have access to available borrowing capacity and repayment of the outstanding balances on the revolving and term notes must begin at the end of the applicable revolving period and end of the term, respectively. In addition, we use mortgage loan warehouse facilities to fund newly originated loans on a short-term basis until they are sold to secondary market investors, including GSEs or other third-party investors. Currently, our master repurchase and participation agreements for financing new loan originations generally have 364‑day terms, and similar to the revolving notes in the advance financing facilities, they are typically renewed, replaced or extended annually. At December 31, 2019, we had
$332.2 million
outstanding under these warehouse financing arrangements, all under agreements maturing in 2020.
In 2019, we entered into three separate MSR financing arrangements related to loans we service for (i) Fannie Mae and Freddie Mac, (ii) Ginnie Mae, and (iii) private investors (PLS MSRs). The Fannie Mae/Freddie Mac and Ginnie Mae facilities were provided through bank commitments and had total capacity of
$300.0
million and
$100.0
million and borrowed amounts of
$147.7 million
and
$72.3 million
, respectively at December 31, 2019. The PLS MSR financing was issued as an amortizing note structure to capital markets investors with an initial principal amount of
$100.0
million. The Fannie Mae/Freddie Mac and Ginnie Mae facilities terminate in June 2020 and November 2021, respectively and the PLS MSR facility matures in May 2022. MSR financing structures have become more common in recent years and investor appetite has evolved in both the bank and capital markets. As a result, MSR financing has become a lower cost funding alternative to corporate loans and bonds. Despite these positive developments, MSR financing is not as readily available as secured match funded facilities for servicing advances and whole loans via warehouse facilities. In addition, MSR financing may require a higher level of issuer scrutiny despite being principally an asset-based financing structure.
Our MSR financing facilities provide funding based on an advance rate of MSR value that is subject to periodic mark-to-market valuation adjustments. In the normal course, MSR value is expected to decline over time due to run off of the loan balances in our servicing portfolio. As a result, we anticipate having to repay a portion of our MSR debt over a given time period. The requirements to repay MSR debt including those due to unfavorable fair value adjustment may require us to allocate a substantial amount of our available liquidity or future cash flows to meet these requirements. To the extent we are unable to generate sufficient cash flows from operations to meet these requirements, we may be more constrained to invest in our business and fund other obligations, and our business, financing activities, liquidity, financial condition and results of operations will be adversely affected.
We currently plan to renew, replace or extend all of the above debt agreements consistent with our historical experience. There can be no assurance that we will be able to renew, replace or extend all our debt agreements on appropriate terms or at all and, if we fail to do so, we may not have adequate sources of funding for our business.
Our debt agreements contain various qualitative and quantitative covenants, including financial covenants, covenants to operate in material compliance with applicable laws, monitoring and reporting obligations and restrictions on our ability to engage in various activities, including but not limited to incurring additional debt, paying dividends, repurchasing or redeeming capital stock, transferring assets or making loans, investments or acquisitions. As a result of the covenants to which we are subject, we may be limited in the manner in which we conduct our business and may be limited in our ability to engage in favorable business activities or raise additional capital to finance future operations or satisfy future liquidity needs. In addition, breaches or events that may result in a default under our debt agreements include, among other things, noncompliance with our covenants, nonpayment of principal or interest, material misrepresentations, the occurrence of a material adverse effect or change, insolvency, bankruptcy, certain material judgments and changes of control. Covenants and defaults of this type are commonly found in debt agreements such as ours. Certain of these covenants and defaults are open to subjective interpretation and, if our interpretation were contested by a lender, a court may ultimately be required to determine compliance or lack thereof. In addition, our debt agreements generally include cross default provisions such that a default under one agreement
22
could trigger defaults under other agreements. If we fail to comply with our debt agreements and are unable to avoid, remedy or secure a waiver of any resulting default, we may be subject to adverse action by our lenders, including termination of further funding, acceleration of outstanding obligations, enforcement of liens against the assets securing or otherwise supporting our obligations and other legal remedies.
An actual or alleged default under any of our debt agreements, negative ratings action by a rating agency (including as a result of our increased leverage or erosion of net worth), the perception of financial weakness, an adverse action by a regulatory authority or GSE, a lengthening of foreclosure timelines or a general deterioration in the economy that constricts the availability of credit may increase our cost of funds and make it difficult for us to renew existing credit facilities or obtain new lines of credit. Any or all the above could have an adverse effect on our business, financing activities, financial condition and results of operations.
We may be unable to obtain sufficient servicer advance financing necessary to meet the financing requirements of our business, which could adversely affect our liquidity position and result in a loss of servicing rights.
We currently fund a substantial portion of our servicing advance obligations through our servicing advance facilities. Under normal market conditions, mortgage servicers typically have been able to renew or refinance these facilities. However, market conditions or lenders’ perceptions of us at the time of any renewal or refinancing may mean that we are unable to renew or refinance our advance financing facilities or obtain additional facilities on favorable terms or at all.
If we fail to satisfy minimum net worth and liquidity requirements established by regulators, GSEs, Ginnie Mae, lenders, or other counterparties, our business, financing activities, financial condition or results of operations could be materially and adversely affected.
As a result of our servicing and loan origination activities, we are subject to minimum net worth and liquidity requirements established by state regulators, GSEs, Ginnie Mae, lenders, and other counterparties. We have been incurring losses for the last five years, which has eroded our net worth. In addition, we must structure our business so each subsidiary satisfies the net worth and liquidity requirements applicable to it, which can be challenging.
The minimum net worth and liquidity requirements to which our licensed entities are subject vary by state and type of license. We must also satisfy the minimum net worth and liquidity requirements of the GSEs and Ginnie Mae in order to maintain our approved status with such agencies and the minimum net worth and liquidity requirements set forth in our agreements with our lenders.
Minimum net worth requirements and liquidity are generally calculated using specific adjustments that may require interpretation or judgment. Changes to these adjustments have the potential to significantly affect net worth and liquidity calculations and imperil our ability to satisfy future minimum net worth and liquidity requirements. We believe our licensed entities were in compliance with all of their minimum net worth requirements at
December 31, 2019
. However, it is possible that regulators could disagree with our calculations, and one state regulator has disagreed with our calculation for a prior year period; we have discussed the matter with the regulator, including why we believe we are in compliance with the applicable net worth requirements. If we fail to satisfy minimum net worth requirements, absent a waiver or other accommodation, we could lose our licenses or have other regulatory action taken against us, we could lose our ability to sell and service loans to or on behalf of the GSEs or Ginnie Mae, or it could trigger a default under our debt agreements. Any of these occurrences could have a material adverse effect on our business, financing activities, financial condition or results of operations.
We use estimates in measuring or determining the fair value of the majority of our assets and liabilities. If our estimates prove to be incorrect, we may be required to write down the value of these assets or write up the value of these liabilities, which could adversely affect our earnings.
Our ability to measure and report our financial position and operating results is influenced by the need to estimate the impact or outcome of future events based on information available at the time of the financial statements. An accounting estimate is considered critical if it requires that management make assumptions about matters that were highly uncertain at the time the accounting estimate was made. If actual results differ from our judgments and assumptions, then it may have an adverse impact on the results of operations and cash flows.
Fair value is estimated based on a hierarchy that maximizes the use of observable inputs and minimizes the use of unobservable inputs. Observable inputs are inputs that reflect the assumptions that market participants would use in pricing the asset or liability developed based on market data obtained from sources independent of the reporting entity. Unobservable inputs are inputs that reflect the reporting entity’s own assumptions about the assumptions market participants would use in pricing the asset or liability developed based on the best information available in the circumstances. The fair value hierarchy prioritizes the inputs to valuation techniques into three broad levels whereby the highest priority is given to Level 1 inputs and the lowest to Level 3 inputs.
23
At December 31, 2019,
77%
and
70%
of our consolidated total assets and liabilities are measured at fair value, respectively, on a recurring and nonrecurring basis,
97%
and
100%
of which are considered Level 3 valuations, including our MSR portfolio. Our largest Level 3 asset and liability carried at fair value on a recurring basis is Loans held for investment - reverse mortgages and the related secured financing. We pool home equity conversion mortgages (reverse mortgages) into Ginnie Mae Home Equity Conversion Mortgage-Backed Securities (HMBS). Because the securitization of reverse mortgage loans do not qualify for sale accounting, we account for these transfers as secured financings and classify the transferred reverse mortgages as Loans held for investment - reverse mortgages and recognize the related Financing liabilities. Holders of HMBS have no recourse against our assets, except for standard representations and warranties and our contractual obligations to service the reverse mortgages and HMBS.
We estimate the fair value of our assets and liabilities utilizing assumptions that we believe are appropriate and are used by market participants. We generally engage third party valuation experts to support our fair value determination for Level 3 assets and liabilities. The methodology used to estimate these values is complex and uses asset- and liability-specific data and market inputs for assumptions including interest and discount rates, collateral status and expected future performance. If these assumptions prove to be inaccurate, if market conditions change or if errors are found in our models, the value of certain of our assets may decrease, which could adversely affect our business, financial condition and results of operations, including through negative impacts on our ability to satisfy minimum net worth and liquidity covenants.
Valuations are highly dependent upon the reasonableness of our assumptions and the predictability of the relationships that drive the results of our valuation methodologies. If changes to interest rates or other factors cause prepayment speeds to increase more than estimated, delinquency and default levels are higher than anticipated or financial market illiquidity is greater than anticipated, we may be required to adjust the value of certain assets or liabilities, which could adversely affect our business, financial condition and results of operations.
We are exposed to liquidity, interest rate and foreign currency exchange risks.
We are exposed to liquidity risk primarily because of the highly variable daily cash requirements to support our servicing business, including the requirement to make advances pursuant to our servicing agreements and the process of collecting and applying recoveries of advances. We are also exposed to liquidity risk due to potential accelerated repayment of our debt depending on the performance of the underlying collateral, including the fair value of MSRs, and certain covenants, among other factors. We are also exposed to liquidity and interest rate risk by our decision to originate and finance mortgage loans and sell mortgage loans into the secondary market. Further, as discussed below, the economic hedges that we have entered into in order to limit MSR fair value change exposure may include instruments that require margin, thereby leading to liquidity distributions should the hedge instrument lose value. In general, we finance our operations through operating cash flows and various other sources of funding, including match funded borrowing agreements, secured lines of credit and repurchase agreements.
We are exposed to interest rate risk to the degree that our interest-bearing liabilities mature or reprice at different speeds, or on different bases, than our interest earning assets or when financed assets are not interest-bearing. Our servicing business is characterized by non-interest earning assets financed by interest-bearing liabilities. Servicing advances are among our more significant non-interest earning assets. At December 31, 2019, we had total advances and match funded advances of
$1.1 billion
. We are also exposed to interest rate risk because a portion of our advance financing and other outstanding debt at December 31, 2019 is variable rate. Rising interest rates may increase our interest expense. Earnings on float balances partially offset these higher funding costs. At December 31, 2019, we had no interest rate swaps in place to hedge our exposure to rising interest rates.
Our MSRs, which we carry at fair value, are subject to substantial interest rate risk, primarily because the mortgage loans underlying the servicing rights permit the borrowers to prepay the loans. A decrease in interest rates generally increases prepayment speeds and vice versa. As a result, the valuation assumptions for MSRs are highly correlated to changes across the yield curve. An interest rate decrease could result in an array of fair value changes, the severity of which would depend on several factors, including the magnitude of the change, whether the decrease is across specific rate tenors or a parallel change across the entire yield curve, and impact from market-side adjustments, among others. Beginning in September 2019, we implemented a hedging strategy using economic hedges (derivatives that do not qualify as hedges for accounting purposes) to partially offset the changes in fair value of our MSRs due to interest rate changes. However, as discussed below, there can be no assurance that our hedging strategy will be effective in partially mitigating our exposure to changes in fair value of our MSRs due to interest rate changes.
In our lending business, we are subject to interest rate and price risk on our pipeline (i.e., interest rate loan commitments (IRLCs) and mortgage loans held for sale) from the commitment date up until the date the commitment expires or the loan is sold into the secondary market. Generally, the fair value of the pipeline will decline in value when interest rates increase and will rise in value when interest rates decrease. Our interest rate exposure on our pipeline had previously been economically hedged with freestanding derivatives such as forward contracts. Beginning in September 2019, this exposure is no longer
24
individually hedged, but rather used as an offset to our MSR fair value exposure and managed as part of our MSR hedging strategy described above.
We are exposed to foreign currency exchange rate risk in connection with our investment in non-U.S. dollar currency operations to the extent that our foreign exchange positions remain unhedged. Our operations in the Philippines and India expose us to foreign currency exchange rate risk.
While we have established policies and procedures intended to identify, monitor and manage the risks described above, we cannot assure you that our risk management policies and procedures will be effective. Further, such policies and procedures are not designed to mitigate or eliminate all of the risks we face. As a result, these risks could materially and adversely affect our business, financial condition and results of operations.
Our hedging strategy may not be successful in partially mitigating our exposure to interest rate risk.
Our hedging strategy may not be as effective as desired due to the actual performance of an MSR differing from the expected performance. While we actively track the actual performance of our MSRs across rate change environments, there is potential for our economic hedges to underperform. The underperformance may be a result of various factors, including the following: available hedge instruments have a different profile than the underlying asset, the duration of the hedge is different from the MSR, the convexity of the hedge is not proportional to the valuation change of the MSR asset, the counterparty with which we have traded has failed to deliver under the terms of the contract, or we fail to renew the hedge position in a timely or efficient manner.
Unexpected changes in market rates or secondary liquidity may have a materially adverse impact on the cash flow or operating performance of the Company. The expected hedge coverage profiled may not correlate to the asset as desired, resulting in poorer performance than had we not hedged at all. In addition, hedging strategies involve transaction and other costs. We cannot be assured that our hedging strategy and the derivatives that we use will adequately offset the risks of interest rate volatility or that our hedging transactions will not result in or magnify losses.
GSE and Ginnie Mae initiatives and other actions may affect our financial condition and results of operations.
Due to the significant role that the GSEs play in the secondary mortgage market, new initiatives and other actions that they may implement could become prevalent in the mortgage servicing industry generally. To the extent that FHFA and/or the GSEs implement reforms that materially affect the market not only for conventional and/or government-insured loans but also the non-qualifying loan markets, such reforms could have a material adverse effect on the creation of new MSRs, the economics or performance of any MSRs that we acquire, servicing fees that we can charge and costs that we incur to comply with new servicing requirements.
In addition, our ability to generate revenues through mortgage loan sales to institutional investors depends to a significant degree on programs administered by the GSEs, Ginnie Mae, and others that facilitate the issuance of MBS in the secondary market. These entities play a critical role in the residential mortgage industry and we have significant business relationships with many of them. If it is not possible for us to complete the sale or securitization of certain of our mortgage loans due to changes in GSE and Ginnie Mae programs, we may lack liquidity to continue to fund mortgage loans and our revenues and margins on new loan originations would be materially and negatively impacted.
Our plans to acquire MSRs will require approvals and cooperation by the GSEs and Ginnie Mae. Should approval or cooperation be withheld, we would have difficulty meeting our MSR acquisition objectives.
There are various proposals that deal with the future of the GSEs, including with respect to their ownership and role in the mortgage market, as well as proposals to implement GSE reforms relating to borrowers, lenders and investors in the mortgage market. Thus, the long-term future of the GSEs remains uncertain. Any change in the ownership of the GSEs, or in their programs or role within the mortgage market, could materially and adversely affect our business, liquidity, financial position and results of operations.
An economic slowdown or a deterioration of the housing market could increase both interest expense on servicing advances and operating expenses and could cause a reduction in income from, and the value of, our servicing portfolio.
During any period in which a borrower is not making payments, we are required under most of our servicing agreements to advance our own funds to meet contractual principal and interest remittance requirements for investors, pay property taxes and insurance premiums and process foreclosures. We also advance funds to maintain, repair and market real estate properties on behalf of investors. Most of our advances have the highest standing and are “top of the waterfall” so that we are entitled to repayment from respective loan or REO liquidations proceeds before most other claims on these proceeds, and in the majority of cases, advances in excess of respective loan or REO liquidation proceeds may be recovered from pool level proceeds. Consequently, the primary impacts of an increase in advances are generally increased interest expense as we finance a large portion of servicing advance obligations and a decline in the fair value of MSRs as the projected funding cost of existing and future expected servicing advances is a component of the fair value of MSRs. Our liquidity is also negatively impacted because
25
we must fund the portion of our advance obligations that is not financed. Our liquidity would be more severely impacted if we were unable to continue to finance a large portion of servicing advance obligations.
Higher delinquencies also decrease the fair value of MSRs and increase our cost to service loans, as loans in default require more intensive effort to bring them current or manage the foreclosure process. An increase in delinquencies may delay the timing of revenue recognition because we recognize servicing fees as earned, which is generally upon collection of payments from borrowers or proceeds from REO liquidations. An increase in delinquencies also generally leads to lower balances in custodial and escrow accounts (float balances) and lower net earnings on custodial and escrow accounts (float earnings). Additionally, an increase in delinquencies in our GSE servicing portfolio will result in lower revenue because we collect servicing fees from GSEs only on performing loans.
Foreclosures are involuntary prepayments resulting in a reduction in UPB. This may also result in declines in the value of our MSRs.
Adverse economic conditions could also negatively impact our lending businesses. For example, declining home prices and increasing loan-to-value ratios may preclude many borrowers from refinancing their existing loans or obtaining new loans.
Any of the foregoing could adversely affect our business, liquidity, financial condition and results of operations.
A significant increase in prepayment speeds could adversely affect our financial results.
Prepayment speed is a significant driver of our business. Prepayment speed is the measurement of how quickly borrowers pay down the UPB of their loans or how quickly loans are otherwise brought current, modified, liquidated or charged off. Prepayment speeds have a significant impact on our servicing fee revenues, our expenses and on the valuation of our MSRs as follows:
|
•
|
Revenue.
If prepayment speeds increase, our servicing fees will decline more rapidly than anticipated because of the greater decrease in the UPB on which those fees are based. The reduction in servicing fees would be somewhat offset by increased float earnings because the faster repayment of loans will result in higher float balances that generate the float earnings. Conversely, decreases in prepayment speeds result in increased servicing fees but lead to lower float balances and float earnings.
|
|
•
|
Expenses.
Faster prepayment speeds result in higher compensating interest expense, which represents the difference between the full month of interest we are required to remit in the month a loan pays off and the amount of interest we collect from the borrower for that month. Slower prepayment speeds also lead to lower compensating interest expense.
|
|
•
|
Valuation of MSRs.
The fair value of MSRs is based on, among other things, projection of the cash flows from the related pool of mortgage loans. The expectation of prepayment speeds is a significant assumption underlying those cash flow projections from the perspective of market participants. Increases or decreases in interest rates have an impact on prepayment rates. If prepayment speeds were significantly greater than expected, the fair value of our MSRs, which we carry at fair value, could decrease. When the fair value of these MSRs decreases, we record a loss on fair value, which also has a negative impact on our financial results.
|
Operational Risks and Other Risks Related to Our Business
If we do not comply with our obligations under our servicing agreements or if others allege non-compliance, our business and results of operations may be harmed.
We have contractual obligations under the servicing agreements pursuant to which we service mortgage loans. Our non-Agency servicing agreements generally contain detailed provisions regarding servicing practices, reporting and other matters. In addition, Liberty and PMC are parties to seller/servicer agreements and/or subject to guidelines and regulations (collectively, seller/servicer obligations) with one or more of the GSEs, HUD, FHA, VA and Ginnie Mae. These seller/servicer obligations include financial covenants that include capital requirements related to tangible net worth, as defined by the applicable agency, an obligation to provide audited consolidated financial statements within 90 days of the applicable entity’s fiscal year end as well as extensive requirements regarding servicing, selling and other matters. To the extent that these requirements are not met or waived, the applicable agency may, at its option, utilize a variety of remedies including requirements to provide certain information or take actions at the direction of the applicable agency, requirements to deposit funds as security for our obligations, sanctions, suspension or even termination of approved seller/servicer status, which would prohibit future originations or securitizations of forward or reverse mortgage loans or servicing for the applicable agency.
Many of our servicing agreements require adherence to general servicing standards, and certain contractual provisions delegate judgment over various servicing matters to us. Our servicing practices, and the judgments that we make in our servicing of loans, could be questioned by parties to these agreements, such as GSEs, Ginnie Mae, trustees or master servicers, or by investors in the trusts which own the mortgage loans or other third parties. As a result, we could be required to repurchase mortgage loans, make whole or otherwise indemnify such mortgage loan investors or other parties. Advances that we have made could be unrecoverable. We could also be terminated as servicer or become subject to litigation or other claims seeking
26
damages or other remedies arising from alleged breaches of our servicing agreements. For example, we are currently involved in a dispute with a former subservicing client relating to alleged violations of our contractual agreements, including that we did not properly submit mortgage insurance and other claims for reimbursement. We are presently engaged in a dispute resolution process relating to these claims. We are unable to predict the outcome of this dispute or the size of any loss we might incur. In addition, several trustees are currently defending themselves against claims by RMBS investors that the trustees failed to properly oversee mortgage servicers - including Ocwen - in the servicing of hundreds of trusts. Trustees subject to those suits have informed Ocwen that they may seek indemnification for losses they suffer as a result of the filings.
Any of the foregoing could have a significant negative impact on our business, financial condition and results of operations. Even if allegations against us lack merit, we may have to spend additional resources and devote additional management time to contesting such allegations, which would reduce the resources available to address, and the time management is able to devote to, other matters.
GSEs or Ginnie Mae may curtail or terminate our ability to sell, service or securitize newly originated loans to them.
As noted in the prior risk factor, if we do not comply with our seller/servicer obligations, the GSEs or Ginnie Mae may utilize a variety of remedies against us. Such remedies include curtailment of our ability to sell newly originated loans or even termination of our ability to sell, service or securitize such loans altogether. Any such curtailment or termination would likely have a material adverse impact on our business, liquidity, financial condition and results of operations.
A significant reduction in, or the total loss of, our remaining NRZ-related servicing would significantly impact our business, liquidity, financial condition and results of operations.
NRZ is our largest servicing client, accounting for
56%
of the UPB in our servicing portfolio as of
December 31, 2019
. On February 20, 2020, we received a notice of termination from NRZ with respect to the legacy PMC subservicing agreement, which accounted for approximately
20%
of the UPB of our servicing portfolio as of
December 31, 2019
. It is possible that NRZ could exercise its rights to terminate for convenience some or all of the legacy Ocwen servicing agreements. As of
December 31, 2019
, these agreements accounted for approximately
36.0%
of our servicing portfolio.
In addition, under the legacy Ocwen agreements, any failure under a financial covenant could result in NRZ terminating Ocwen as subservicer under the subservicing agreements or in directing the transfer of servicing away from Ocwen under the Rights to MSRs agreements. Similarly, failure by Ocwen to meet operational requirements, including service levels, critical reporting and other obligations, could also result in termination or transfer for cause. In addition, if there is a change of control to which NRZ did not consent, NRZ could terminate for cause and direct the transfer of servicing away from Ocwen. A termination for cause and transfer of servicing could materially and adversely affect Ocwen’s business, liquidity, financial condition and results of operations.
Further, under our Rights to MSRs agreements, in certain circumstances, NRZ has the right to sell its Rights to MSRs to a third-party and require us to transfer title to the related MSRs, subject to an Ocwen option to acquire at a price based on the winning third-party bid rather than selling to the third party. If NRZ sells its Rights to MSRs to a third party, the transaction can only be completed if the third-party buyer can obtain the necessary third-party consents to transfer the MSRs. NRZ also has the obligation to use reasonable efforts to encourage such third-party buyer to enter into a subservicing agreement with Ocwen. Ocwen may lose future compensation for subservicing, however, if no subservicing agreement is ultimately entered into with the third-party buyer.
Because of the large percentage of our servicing business that is represented by the legacy Ocwen agreements with NRZ that provide NRZ with the termination or transfer rights described above, our business, financial condition, results of operations would be significantly impacted if NRZ exercised all or a significant portion of these rights. If this were to occur, we anticipate that we would need to substantially restructure many aspects of our servicing business as well as the related corporate support functions to address our smaller servicing portfolio, which would likely be a complex and expensive undertaking.
Such a restructuring of our operations could divert management attention and financial resources required to execute on other strategic objectives, which could delay or prevent our growth or otherwise negatively impact the execution of our plans to return to profitability. In addition, it is possible that the unwinding of all or a significant portion of our relationship may not occur in an orderly or timely manner, which could be disruptive and could result in us incurring additional costs or even in disagreements with NRZ relating to our respective rights and obligations.
More generally, if NRZ were to decline to continue doing business with us and we were unable to develop relationships with new servicing clients on a similar scale or otherwise acquire sufficient replacement servicing, our business, liquidity, results of operations and financial condition could be materially and adversely affected. In addition, if NRZ were to take actions to limit or terminate our relationship, that could impact perceptions of other servicing clients, lenders, GSEs, regulators or others, which could cause them to take actions that materially and adversely impact our business, liquidity, results of operations and financial condition.
27
We believe our remaining NRZ servicing will become increasingly unprofitable over time. If we are not successful in our actions to improve the profitability of our remaining NRZ servicing or to acquire additional profitable client relationships to offset the expected impact on our profitability, our business, liquidity, financial condition and results of operations could be materially and adversely affected.
During 2019, we completed an assessment of the cost-to-service and the profitability of the NRZ servicing portfolio. Based on this analysis, in the fourth quarter of 2019, we estimate that operating expenses, including direct servicing expenses and overhead allocation, exceeded the net revenue retained for the legacy Ocwen servicing agreements by approximately
$7.0 million
. This estimate excludes the benefits of the lump-sum payment amortization. The estimated loss for these subservicing agreements is partially driven by the declining revenue as the loan portfolio amortizes down without a corresponding reduction to our servicing cost over time. As performing loans in the legacy Ocwen servicing portfolio have run-off, delinquencies have remained high, resulting in a relatively elevated average cost per loan. Because the NRZ portfolio contains a high percentage of delinquent accounts, it has an inherently high level of potential operational and compliance risk and requires a disproportionately high level of operating staff, oversight support infrastructure and overhead which drives the elevated average cost per loan. While we are actively pursuing cost re-engineering initiatives to reduce our cost-to-service and our corporate overhead, we may be unsuccessful in reducing these costs to the level where the legacy Ocwen servicing is profitable during 2020 or beyond. We are also seeking to acquire, maintain and grow profitable client relationships that would offset any negative impact from legacy Ocwen servicing; however, we may not be successful in these efforts. While we have the ability to not to renew the legacy Ocwen agreements in certain circumstances, in such situations, we would not be entitled to termination fees that would help offset the restructuring and transition costs required to adjust our operations to a significantly smaller servicing portfolio. Consequently, absent a termination for convenience by NRZ, our most economically feasible alternative with respect to these agreements may be to continue to service an increasingly unprofitable portfolio, which could materially and adversely impact our business, liquidity, financial condition and results of operations.
If NRZ were to fail to comply with its servicing advance obligations under its agreements with us, it could materially and adversely affect us.
Under the Rights to MSRs agreements, NRZ is responsible for financing all servicing advance obligations in connection with the loans underlying the MSRs. At
December 31, 2019
, such servicing advances made by NRZ were approximately
$704.2 million
. However, under the Rights to MSRs structure, we are contractually required under our servicing agreements with the RMBS trusts to make the relevant servicing advances even if NRZ does not perform its contractual obligations to fund those advances. Therefore, if NRZ were unable to meet its advance financing obligations, we would remain obligated to meet any future advance financing obligations with respect to the loans underlying these Rights to MSRs, which could materially and adversely affect our liquidity, financial condition and servicing operations.
NRZ currently uses advance financing facilities to fund a substantial portion of the servicing advances that NRZ is contractually obligated to make pursuant to the Rights to MSRs agreements. Although we are not an obligor or guarantor under NRZ’s advance financing facilities, we are a party to certain of the facility documents as the entity performing the work of servicing the underlying loans on which advances are being financed. As such, we make certain representations, warranties and covenants, including representations and warranties in connection with our sale of advances to NRZ. If we were to make representations or warranties that were untrue or if we were otherwise to fail to comply with our contractual obligations, we could become subject to claims for damages or events of default under such facilities could be asserted.
Technology or process failures or employee misconduct could damage our business operations or reputation, harm our relationships with key stakeholders and lead to regulatory sanctions or penalties.
We are responsible for developing and maintaining sophisticated operational systems and infrastructure, which is challenging. As a result, operational risk is inherent in virtually all of our activities. In addition, the CFPB and other regulators have emphasized their focus on the importance of servicers’ and lenders’ systems and infrastructure operating effectively. If our systems and infrastructure fail to operate effectively, such failures could damage our business and reputation, harm our relationships with key stakeholders and lead to regulatory sanctions or penalties.
Our business is substantially dependent on our ability to process and monitor a large number of transactions, many of which are complex, across various parts of our business. These transactions often must adhere to the terms of a complex set of legal and regulatory standards, as well as the terms of our servicing and other agreements. In addition, given the volume of transactions that we process and monitor, certain errors may be repeated or compounded before they are discovered and rectified. For example, in the area of borrower correspondence, in 2014, problems were identified with our letter dating processes such that erroneously dated letters were sent to borrowers, which damaged our reputation and relationships with borrowers, regulators, important counterparties and other stakeholders. Because in an average month we mail over 2 million letters, a process problem such as erroneous letter dating has the potential to negatively affect many parts of our business and have widespread negative implications.
28
We are similarly dependent on our employees. We could be materially adversely affected if an employee or employees, acting alone or in concert with non-affiliated third parties, causes a significant operational break-down or failure, either because of human error or where an individual purposefully sabotages or fraudulently manipulates our operations or systems, including by means of cyberattack or denial-of-service attack. In addition to direct losses from such actions, we could be subject to regulatory sanctions or suffer harm to our reputation, financial condition, customer relationships, and ability to attract future customers or employees. Employee misconduct could prompt regulators to allege or to determine based upon such misconduct that we have not established adequate supervisory systems and procedures to inform employees of applicable rules or to detect and deter violations of such rules. It is not always possible to deter employee misconduct, and the precautions we take to detect and prevent misconduct may not be effective in all cases. Misconduct by our employees, or even unsubstantiated allegations of misconduct, could result in a material adverse effect on our reputation and our business.
Third parties with which we do business could also be sources of operational risk to us, including risks relating to break-downs or failures of such parties’ own systems or employees. Any of these occurrences could diminish our ability to operate one or more of our businesses or lead to potential liability to clients, reputational damage or regulatory intervention. We could also be required to take legal action against or replace third-party vendors, which could be costly, involve a diversion of management time and energy and lead to operational disruptions. Any of these occurrences could materially adversely affect us.
We are dependent on Black Knight, Altisource and other vendors for much of our technology, business process outsourcing and other services.
Our vendor relationships subject us to a variety of risks. We have significant exposure to third-party risks, as we are dependent on vendors, including, Black Knight and Altisource, for a number of key services.
We use the Black Knight MSP servicing system pursuant to a seven-year agreement with Black Knight, and we are highly dependent on the successful functioning of it to operate our loan servicing business effectively and in compliance with our regulatory and contractual obligations. It would be difficult, costly and complex to transfer all of our loans to another servicing system in the event Black Knight failed to perform under its agreements with us and any such transfer would take considerable time. Any such transfer would also likely be subject us to considerable scrutiny from regulators, GSEs, Ginnie Mae and other counterparties.
Ocwen has entered into various long-term agreements with Altisource, including a Services Agreement under which Altisource provides various services, such as property valuation services, property preservation and inspection services and title services, among other things. Previously, Ocwen’s servicing system ran on an information technology system that we licensed under agreements with Altisource.
In February 2019, Ocwen and Altisource signed a Binding Term Sheet, which among other things, confirmed Altisource’s cooperation with the de-boarding of loans from Altisource’s REALServicing servicing system to Black Knight’s MSP servicing system. In addition, Ocwen and Altisource entered into a letter agreement confirming that, except in relation to Ocwen’s transfer off of the REALServicing technology beginning in February 2019 or termination of the REALServicing statement of work, each party reserves its rights and remedies in the event of any disputes between them. While the Binding Term Sheet does not restrict Ocwen’s rights to sell MSRs in any way, the letter agreement specifically includes a reservation of each party’s rights to assert damage claims against the other party regarding such transactions including any transfer by Ocwen to NRZ (or its affiliates) or any third party of the rights to designate a vendor. Ocwen does not believe its agreements with Altisource restrict Ocwen’s rights to sell MSRs or restrict Ocwen from allowing an owner of MSRs, or owner of the economics thereto, the right to designate vendors. As such, Ocwen believes any asserted claims by Altisource against Ocwen arising from Ocwen’s sale of MSRs or related to the rights to designate a vendor to a third party, would be without merit and we have so informed Altisource. However, if Altisource were to assert such claims against us, such disputes could cause us to incur costs, divert the attention of management, and potentially disrupt our operations which rely on Altisource-provided services, regardless of whether such claims were ultimately resolved in our favor.
If either Black Knight or Altisource were to fail to properly fulfill its contractual obligations to us, including through a failure to provide services at the required level to maintain and support our systems, our business and operations would suffer. In addition, if Black Knight fails to develop and maintain its technology so as to provide us with an effective and competitive servicing system, our business could suffer. Similarly, we are reliant on other vendors for the proper maintenance and support of our technological systems and our business and operations would suffer if these vendors do not perform as required. If our vendors do not adequately maintain and support our systems, including our servicing systems, loan originations and financial reporting systems, our business and operations could be materially and adversely affected.
Altisource and other vendors supply us with other services in connection with our business activities such as property preservation and inspection services and valuation services. In the event that a vendor’s activities do not comply with the applicable servicing criteria, we could be exposed to liability as the servicer and it could negatively impact our relationships with our servicing clients, borrowers or regulators, among others. In addition, if our current vendors were to stop providing services to us on acceptable terms, we may be unable to procure alternatives from other vendors in a timely and efficient
29
manner and on acceptable terms, or at all. Further, we may incur significant costs to resolve any such disruptions in service and this could adversely affect our business, financial condition and results of operations.
In addition to our reliance on the vendors discussed above, our business is reliant on a number of technological vendors that provide services such as integrated cloud applications and financial institutions that provide essential banking services on a daily basis. Even short-terms interruptions in the services provided by these vendors and financial institutions could be disruptive to our business and cause us financial loss. Significant or prolonged disruptions in the ability of these companies to provide services to us could have a material adverse impact on our operations.
We have undergone and continue to undergo significant change to our technology infrastructure and business processes. Failure to adequately update our systems and processes could harm our ability to run our business and adversely affect our results of operations.
We are currently making, and will continue to make, technology investments and process improvements to improve or replace the information processes and systems that are key to managing our business, to improve our compliance management system, and to reduce costs. Additionally, as part of the transition to Black Knight MSP and the integration of our information processes and systems with PHH, we have undergone and continue to undergo significant changes to our technology infrastructure and business processes. Failure to select the appropriate technology investments, or to implement them correctly and efficiently, could have a significant negative impact on our operations.
Disagreements with vendors, service providers or other contractual counterparties could materially and adversely affect our business, financing activities, financial condition or results of operations.
We are dependent on Black Knight, Altisource and other vendors and service providers to operate our business effectively and in compliance with applicable regulatory and contractual obligations and on banks, NRZ and other financing sources to finance our business. Certain provisions of the agreements underlying our relationships with our vendors, service providers, financing sources and other contractual counterparties could be open to subjective interpretation. Disagreements with these counterparties, including disagreements over contract interpretation, could lead to business disruptions or could result in litigation or arbitration or mediation proceedings, any of which could be expensive and divert senior management’s attention from other matters. While we have been able to resolve disagreements with these counterparties in the past, if we were unable to resolve a disagreement, a court, arbitrator or mediator might be required to resolve the matter and there can be no assurance that the outcome of a material disagreement with a contractual counterparty would not materially and adversely affect our business, financing activities, financial condition or results of operations.
Cybersecurity breaches or system failures may interrupt or delay our ability to provide services to our customers, expose our business and our customers to harm and otherwise adversely affect our operations.
Disruptions and failures of our systems or those of our vendors may interrupt or delay our ability to provide services to our customers, expose us to remedial costs and reputational damage, and otherwise adversely affect our operations. The secure transmission of confidential information over the Internet and other electronic distribution and communication systems is essential to our maintaining consumer confidence in certain of our services. We have programs in place to detect and respond to security incidents. However, because the techniques used to obtain unauthorized access, disable or degrade service, or sabotage systems change frequently and may be difficult to detect for long periods of time, we may be unable to anticipate these techniques or implement adequate preventive measures. While none of the cybersecurity incidents that we have experienced to date have had a material adverse impact on our business, financial condition or operations, we cannot assure that future incidents will not so impact us.
Security breaches, computer viruses, cyberattacks, hacking and other acts of vandalism are increasing in frequency and sophistication, and could result in a compromise or breach of the technology that we use to protect our borrowers’ personal information and transaction data and other information that we must keep secure. Our financial, accounting, data processing or other operating systems and facilities (or those of our vendors) may fail to operate properly or become disabled as a result of events that are wholly or partially beyond our control, such as a cyberattack, a spike in transaction volume or unforeseen catastrophic events, potentially resulting in data loss and adversely affecting our ability to process transactions or otherwise operate our business. If one or more of these events occurs, this could potentially jeopardize data integrity or confidentiality of information processed and stored in, or transmitted through, our computer systems and networks. Any failure, interruption or breach in our cyber security could result in reputational harm, disruption of our customer relationships, or an inability to originate and service loans and otherwise operate our business. Further, any of these cyber security and operational risks could expose us to lawsuits by customers for identity theft or other damages resulting from the misuse of their personal information and possible financial liability, any of which could have a material adverse effect on our results of operations, financial condition and liquidity.
Regulators may impose penalties or require remedial action if they identify weaknesses in our systems, and we may be required to incur significant costs to address any identified deficiencies or to remediate any harm caused. A number of states
30
have specific reporting and other requirements with respect to cybersecurity in addition to applicable federal laws. For instance, the NY DFS Cybersecurity Regulation requires New York insurance companies, banks, and other regulated financial services institutions - including certain Ocwen entities licensed in the state of New York - to assess their cybersecurity risk profile. Regulated entities are required, among other things, to adopt the core requirements of a cybersecurity program, including a cybersecurity policy, effective access privileges, cybersecurity risk assessments, training and monitoring for all authorized users, and appropriate governance processes. This regulation also requires regulated entities to submit notices to the NY DFS of any security breaches or other cybersecurity events, and to certify their compliance with the regulation on an annual basis. In addition, consumers generally are concerned with security breaches and privacy on the Internet, and Congress or individual states could enact new laws regulating the use of technology in our business that could adversely affect us or result in significant compliance costs.
As part of our business, we may share confidential customer information and proprietary information with customers, vendors, service providers, and business partners. The information systems of these third parties may be vulnerable to security breaches as these third parties may not have appropriate security controls in place to protect the information we share with them. If our confidential information is intercepted, stolen, misused, or mishandled while in possession of a third party, it could result in reputational harm to us, loss of customer business, and additional regulatory scrutiny, and it could expose us to civil litigation and possible financial liability, any of which could have a material adverse effect on our results of operations, financial condition and liquidity.
Damage to our reputation could adversely impact our financial results and ongoing operations.
Our ability to serve and retain customers and conduct business transactions with our counterparties could be adversely affected to the extent our reputation is damaged. Our failure to address, or to appear to fail to address, the various regulatory, operational and other challenges facing Ocwen could give rise to reputational risk that could cause harm to us and our business prospects. Reputational issues may arise from the following, among other factors:
|
•
|
negative news about Ocwen or the mortgage industry generally;
|
|
•
|
allegations of non-compliance with legal and regulatory requirements;
|
|
•
|
ethical issues, including alleged deceptive or unfair servicing or lending practices;
|
|
•
|
our practices relating to collections, foreclosures, property preservation, modifications, interest rate adjustments, loans impacted by natural disasters, escrow and insurance;
|
|
•
|
consumer privacy concerns;
|
|
•
|
consumer financial fraud;
|
|
•
|
data security issues related to our customers or employees;
|
|
•
|
cybersecurity issues and cyber incidents, whether actual, threatened, or perceived;
|
|
•
|
customer service or consumer complaints;
|
|
•
|
legal, reputational, credit, liquidity and market risks inherent in our businesses;
|
|
•
|
a downgrade of or negative watch warning on any of our servicer or credit ratings; and
|
|
•
|
alleged or perceived conflicts of interest.
|
The proliferation of social media websites as well as the personal use of social media by our employees and others, including personal blogs and social network profiles, also may increase the risk that negative, inappropriate or unauthorized information may be posted or released publicly that could harm our reputation or have other negative consequences, including as a result of our employees interacting with our customers in an unauthorized manner in various social media outlets. The failure to address, or the perception that we have failed to address, any of these issues appropriately could give rise to increased regulatory action, which could adversely affect our results of operations.
The industry in which we operate is highly competitive, and, to the extent we fail to meet these competitive challenges, it would have a material adverse effect on our business, financial position, results of operations or cash flows.
We operate in a highly competitive industry that could become even more competitive as a result of economic, legislative, regulatory or technological changes. Competition to service mortgage loans and for mortgage loan originations comes primarily from commercial banks and savings institutions and non-bank lenders and mortgage servicers. Many of our competitors are substantially larger and have considerably greater financial, technical and marketing resources, and lower funding costs. Further, our competitors that are national banks may also benefit from a federal exemption from certain state regulatory requirements that is applicable to depository institutions. In addition, some of our competitors may have higher risk tolerances or different risk assessments, which could allow them to consider a wider variety of revenue generating options (e.g., originating types of loans that we choose not to originate) and establish more favorable relationships than we can. With the proliferation of smartphones and technological changes enabling improved payment systems and cheaper data storage, newer market participants, often called “disruptors,” are reinventing aspects of the financial industry and capturing profit pools previously enjoyed by existing market participants. As a result, the lending industry could become even more competitive if new market participants are successful in capturing market share from existing market participants such as ourselves. Competition to service mortgage loans may result in lower margins. Because of the relatively limited number of servicing
31
clients, our failure to meet the expectations of any significant client could materially impact our business. Ocwen has suffered reputational damage as a result of our regulatory settlements and the associated scrutiny of our business. We believe this may have weakened our competitive position against both our bank and non-bank mortgage servicing competitors. These competitive pressures could have a material adverse effect on our business, financial condition or results of operations.
We are highly dependent on an experienced senior management team, including our President and Chief Executive Officer, and the loss of the services of one or more of our senior officers could have a material adverse effect on us. In addition, high turnover of management and non-management employees could harm our business.
We are highly dependent on an experienced management team. We do not maintain key man life insurance relating to our President and Chief Executive Officer, Glen A. Messina, or any of our other executive officers. The loss of the services of Mr. Messina or any of our other senior officers could have a material adverse effect on us. We could also be harmed by legal actions brought by former senior officers after they have ceased employment with Ocwen.
We have experienced elevated turnover among both management and non-management employees in recent years due, in large part, to the acquisition of PHH, our subsequent integration of the combined company’s business units, and our continued cost re-engineering plans, which may include further reductions in staffing levels and in the proportion of our workforce based in the U.S. While planned departures form part of our plan to capture acquisition synergies, there is a risk that employee departures, even if planned, could lead to operational disruptions, loss of important institutional knowledge or other adverse impacts on our business.
An inability to attract and retain qualified personnel could harm our business, financial condition and results of operations.
Our future success depends, in part, on our ability to identify, attract and retain highly skilled servicing, lending, finance, risk, compliance and technical personnel. We face intense competition for qualified individuals from numerous financial services and other companies, some of which have greater resources, better recent financial performance, fewer regulatory challenges and better reputations than we do. If we were to be unable to attract and retain the qualified personnel we need to succeed, our business, financial condition and results of operations could suffer.
We have operations in India and the Philippines that could be adversely affected by changes in the political or economic stability of these countries or by government policies in India, the Philippines or the U.S.
Approximately
3,400
, or
64%
, of our employees as of December 31, 2019 are located in India. A significant change in India’s economic liberalization and deregulation policies could adversely affect business and economic conditions in India generally and our business in particular. The political or regulatory climate in the U.S. or elsewhere also could change so that it would not be lawful or practical for us to use international operations in the manner in which we currently use them. For example, changes in regulatory requirements could require us to curtail our use of lower-cost operations in India to service our businesses. If we had to curtail or cease our operations in India and transfer some or all of these operations to another geographic area, we could incur significant transition costs as well as higher future overhead costs that could materially and adversely affect our results of operations.
We may need to increase the levels of our employee compensation more rapidly than in the past to retain talent in India. Unless we can continue to enhance the efficiency and productivity of our employees, wage increases in the long-term may negatively impact our financial performance.
Political activity or other changes in political or economic stability in India could affect our ability to operate our business effectively. For example, political protests disrupted our Indian operations in multiple cities for a number of days during 2018. While we have implemented and maintain business continuity plans to reduce the disruption such events cause to our critical operations, we cannot guarantee that such plans will eliminate any negative impact on our business. Depending on the frequency and intensity of future occurrences of instability, our Indian operations could be significantly adversely affected.
Our operations in the Philippines are less substantial than our operations in India. However, they are still at risk of being affected by the same types of risks that affect our Indian operations. If they were to be so affected, our business could be materially and adversely affected.
There are a number of foreign laws and regulations that are applicable to our operations in India and the Philippines, including laws and regulations that govern licensing, employment, safety, taxes and insurance and laws and regulations that govern the creation, continuation and winding up of companies as well as the relationships between shareholders, our corporate entities, the public and the government in these countries. Non-compliance with the laws and regulations of India or the Philippines could result in (i) restrictions on our operations in these countries, (ii) fines, penalties or sanctions or (iii) reputational damage.
32
Our operations are vulnerable to disruptions resulting from severe weather events.
Our operations are vulnerable to disruptions resulting from severe weather events, including our operations in India, the Philippines, the USVI and Florida. Approximately
3,400
, or
64%
, of our employees as of December 31, 2019 are located in India. In recent years, severe weather events caused disruptions to our operations in India, the Philippines, and the USVI and we incurred expense resulting from the evacuation of personnel and from property damage. While we have implemented and maintain business continuity plans to reduce the disruption such events cause to our critical operations, we cannot guarantee that such plans will eliminate any negative impact on our business, including the cost of evacuation and repairs. Consequently, the occurrence of severe weather events in the future could have a significant adverse effect on our business and results of operations.
Pursuit of business or asset acquisitions exposes us to financial, execution and operational risks that could adversely affect us.
We are actively looking for opportunities to grow our business through acquisitions of businesses and assets. The performance of the businesses and assets we acquire through acquisitions may not match the historical performance of our other assets. Nor can we assure you that the businesses and assets we may acquire will perform at levels meeting our expectations. We may find that we overpaid for the acquired businesses or assets or that the economic conditions underlying our acquisition decision have changed. For example, in 2014, we recognized an impairment loss of the full carrying value of goodwill totaling $420.2 million, which was primarily associated with certain large acquisitions in prior years. It may also take several quarters or longer for us to fully integrate newly acquired business and assets into our business, during which period our results of operations and financial condition may be negatively affected. Further, certain one-time expenses associated with such acquisitions may have a negative impact on our results of operations and financial condition. We cannot assure you that acquisitions will not adversely affect our liquidity, results of operations and financial condition.
The risks associated with acquisitions include, among others:
|
•
|
unanticipated issues in integrating servicing, information, communications and other systems;
|
|
•
|
unanticipated incompatibility in servicing, lending, purchasing, logistics, marketing and administration methods;
|
|
•
|
unanticipated liabilities assumed from the acquired business;
|
|
•
|
not retaining key employees; and
|
|
•
|
the diversion of management’s attention from ongoing business concerns.
|
The acquisition integration process can be complicated and time consuming and could potentially be disruptive to borrowers of loans serviced by the acquired business. If the integration process is not conducted successfully and with minimal effect on the acquired business and its borrowers, we may not realize the anticipated economic benefits of particular acquisitions within our expected timeframe, or we could lose subservicing business or employees of the acquired business. In addition, integrating operations may involve significant reductions in headcount or the closure of facilities, which may be disruptive to operations and impair employee morale. Through acquisitions, we may enter into business lines in which we have not previously operated. Such acquisitions could require additional integration costs and efforts, including significant time from senior management. We may not be able to achieve the synergies we anticipate from acquired businesses, and we may not be able to grow acquired businesses in the manner we anticipate. In fact, the businesses we acquire could decrease in size, even if the integration process is successful.
Further, prices at which acquisitions can be made fluctuate with market conditions. We have experienced times during which acquisitions could not be made in specific markets at prices that we considered to be acceptable, and we expect that we will experience this condition in the future. In addition, to finance an acquisition, we may borrow funds, thereby increasing our leverage and diminishing our liquidity, or we could raise additional equity capital, which could dilute the interests of our existing shareholders.
The timing of closing of our acquisitions is often uncertain. We have in the past and may in the future experience delays in closing our acquisitions, or certain aspects of them. For example, we and the applicable seller are often required to obtain certain regulatory and contractual consents as a prerequisite to closing, such as the consents of GSEs, the FHFA, RMBS trustees or regulators. Accordingly, even if we and the applicable seller are efficient and proactive, the actions of third parties can impact the timing under which such consents are obtained. We and the applicable seller may not be able to obtain all the required consents, which may mean that we are unable to acquire all the assets that we wish to acquire. Regulators may have questions relating to aspects of our acquisitions and we may be required to devote time and resources responding to those questions. It is also possible that we will expend considerable resources in the pursuit of an acquisition that, ultimately, either does not close or is terminated.
Loan putbacks and related liabilities for breaches of representations and warranties regarding sold loans could adversely affect our business.
33
We have exposure to representation, warranty and indemnification obligations relating to our lending, sales and securitization activities, and in certain instances, we have assumed these obligations on loans we service. Our contracts with purchasers of originated loans generally contain provisions that require indemnification or repurchase of the related loans under certain circumstances. While the language in the purchase contracts varies, such contracts generally contain provisions that require us to indemnify purchasers of loans or repurchase such loans if:
|
•
|
representations and warranties concerning loan quality, contents of the loan file or loan underwriting circumstances are inaccurate;
|
|
•
|
adequate mortgage insurance is not secured within a certain period after closing;
|
|
•
|
a mortgage insurance provider denies coverage; or
|
|
•
|
there is a failure to comply, at the individual loan level or otherwise, with regulatory requirements.
|
Additionally, in one of the servicing contracts that Homeward acquired in 2008 from Freddie Mac involving non-prime mortgage loans, it assumed the origination representations and warranties even though it did not originate the loans.
We believe that many purchasers of residential mortgage loans are particularly aware of the conditions under which originators must indemnify or repurchase loans and under which such purchasers would benefit from enforcing any indemnification rights and repurchase remedies they may have.
At December 31, 2019, we had outstanding representation and warranty repurchase demands of
$47.0 million
UPB (
285
loans).
If home values decrease, our realized loan losses from loan repurchases and indemnifications may increase as well. As a result, our liability for repurchases may increase beyond our current expectations. Depending on the magnitude of any such increase, our business, financial condition and results of operations could be adversely affected.
We originate and securitize reverse mortgages, which subjects us to risks that could have a material adverse effect on our business, reputation, liquidity, financial condition and results of operations.
We originate, securitize and service reverse mortgages and we have retained third parties to subservice the reverse mortgages. The reverse mortgage business is subject to substantial risks, including market, credit, interest rate, liquidity, operational, reputational and legal risks. Generally, a reverse mortgage is a loan available to seniors aged 62 or older that allows homeowners to borrow money against the value of their home. No repayment of the mortgage is required until a default event under the terms of the mortgage occurs, the borrower dies, the borrower moves out of the home or the home is sold. A decline in the demand for reverse mortgages may reduce the number of reverse mortgages we originate and adversely affect our ability to sell reverse mortgages in the secondary market. Although foreclosures involving reverse mortgages generally occur less frequently than forward mortgages, loan defaults on reverse mortgages leading to foreclosures may occur if borrowers fail to occupy the home as their primary residence, maintain their property or fail to pay taxes or home insurance premiums. A general increase in foreclosure rates may adversely impact how reverse mortgages are perceived by potential customers and thus reduce demand for reverse mortgages. Additionally, we could become subject to negative headline risk in the event that loan defaults on reverse mortgages lead to foreclosures or evictions of the elderly. The HUD HECM reverse mortgage program has in the past responded to scrutiny around similar issues by implementing rule changes, and may do so in the future. It is not possible to predict whether any such rule changes would negatively impact us. All of the above factors could have a material adverse effect on our business, reputation, liquidity, financial condition and results of operations.
If we are unable to fund our tail commitments or securitize our HECM loans (including tails), this could have a material adverse effect on our business, financial condition, liquidity and results of operations.
We have originated and continue to service HECM loans under which the borrower has additional undrawn borrowing capacity in the form of undrawn lines of credit. We are obligated to fund future borrowings drawn on that capacity. As of December 31, 2019, our commitment to fund additional borrowing capacity was
$1.5 billion
. In addition, we are required to pay mortgage insurance premiums on behalf of HECM borrowers. We normally fund these obligations on a short-term basis using our cash resources, and regularly securitize these amounts (along with our servicing fees) through the issuance of tails. In December 2019, we entered into a revolving credit facility to fund HECM tail advances. However, to the extent our funding commitments exceed our borrowing capacity under this facility, or if we are unable to renew this 364-day facility on acceptable terms, we will be dependent on our cash resources to meet these commitments. If our cash resources are insufficient to fund these amounts and we are unable to fund them through the securitization of such tails, this could have a material adverse effect on our business, financial condition, liquidity and results of operations.
Our HMBS repurchase obligations may reduce our liquidity, and if we are unable to comply with such obligations, it could materially adversely affect our business, financial condition, and results of operations.
As an HMBS issuer, we assume the obligation to purchase loans out of the Ginnie Mae securitization pools once the outstanding principal balance of the related HECM is equal to or greater than 98% of the maximum claim amount (MCA repurchases). Active repurchased loans are assigned to HUD and payment is typically received within 60 days of repurchase.
34
HUD reimburses us for the outstanding principal balance on the loan up to the maximum claim amount. We bear the risk of exposure if the amount of the outstanding principal balance on a loan exceeds the maximum claim amount. Inactive repurchased loans (the borrower is deceased, no longer occupies the property or is delinquent on tax and insurance payments) are generally liquidated through foreclosure and subsequent sale of REO, with a claim filed with HUD for recoverable remaining principal and advance balances. The recovery timeline for inactive repurchased loans depends on various factors, including foreclosure status at the time of repurchase, state-level foreclosure timelines, and the post-foreclosure REO liquidation timeline. The timing and amount of our obligations with respect to MCA repurchases are uncertain as repurchase is dependent largely on circumstances outside of our control. MCA repurchases are expected to continue to increase due to the seasoning of our portfolio, and the increased flow of HECMs and REO that are reaching 98% of their maximum claim amount.
If we do not have sufficient liquidity to comply with our Ginnie Mae repurchase obligations, Ginnie Mae could take adverse action against us, including terminating us as an approved HMBS issuer. In addition, if we are required to purchase a significant number of loans with respect to which the outstanding principal balances exceed HUD’s maximum claim amount, we could be required to absorb significant losses on such loans following assignment to HUD or, in the case of inactive loans, liquidation and subsequent claim for HUD reimbursement. Further, during the periods in which HUD reimbursement is pending, our liquidity will be reduced by the repurchase amounts and we will have reduced resources with which to further other business objectives. For all of the foregoing reasons, our liquidity, business, financial condition, and results of operations could be materially and adversely impacted by our HMBS repurchase obligations.
Liabilities relating to our past sales of Agency MSRs could adversely affect our business.
We have made representations, warranties and covenants relating to our past sales of Agency MSRs, including sales made by PHH before we acquired it. To the extent that we (including PHH prior to its acquisition by us) made inaccurate representations or warranties or if we fail otherwise to comply with our sale agreements, we could incur liability to the purchasers of these MSRs pursuant to the contractual provisions of these agreements.
Reinsuring risk through our captive reinsurance entity could adversely impact our results of operation and financial condition.
If our captive reinsurance entity incurs losses from a severe catastrophe or series of catastrophes, particularly in areas where a significant portion of the insured properties are located, claims that result could substantially exceed our expectations, which could adversely impact our results of operation and financial condition.
A significant portion of our business is in the states of California, Florida, Texas, New York and Pennsylvania, and our business may be significantly harmed by a slowdown in the economy or the occurrence of a natural disaster in those states.
A significant portion of the mortgage loans that we service and originate are secured by properties in California, Florida, Texas, New York and Pennsylvania. Any adverse economic conditions in these markets, including a downturn in real estate values, could increase loan delinquencies. Delinquent loans are more costly to service and require us to advance delinquent principal and interest and to make advances for delinquent taxes and insurance and foreclosure costs and the upkeep of vacant property in foreclosure to the extent that we determine that such amounts are recoverable. We could also be adversely affected by business disruptions triggered by natural disasters or acts or war or terrorism in these geographic areas.
We may incur litigation costs and related losses if the validity of a foreclosure action is challenged by a borrower or if a court overturns a foreclosure.
We may incur costs if we are required to, or if we elect to, execute or re-file documents or take other action in our capacity as a servicer in connection with pending or completed foreclosures. We may incur litigation costs if the validity of a foreclosure action is challenged by a borrower. If a court were to overturn a foreclosure because of errors or deficiencies in the foreclosure process, we may have liability to a title insurer of the property sold in foreclosure. These costs and liabilities may not be legally or otherwise reimbursable to us, particularly to the extent they relate to securitized mortgage loans. In addition, if certain documents required for a foreclosure action are missing or defective, we could be obligated to cure the defect or repurchase the loan. A significant increase in litigation costs could adversely affect our liquidity, and our inability to be reimbursed for servicing advances could adversely affect our business, financial condition or results of operations.
A failure to maintain minimum servicer ratings could have an adverse effect on our business, financing activities, financial condition or results of operations.
S&P, Moody’s, Fitch and others rate us as a mortgage servicer. Failure to maintain minimum servicer ratings could adversely affect our ability to sell or fund servicing advances going forward, could affect the terms and availability of debt financing facilities that we may seek in the future, and could impair our ability to consummate future servicing transactions or adversely affect our dealings with lenders, other contractual counterparties and regulators, including our ability to maintain our status as an approved servicer by Fannie Mae and Freddie Mac. The servicer rating requirements of Fannie Mae do not necessarily require or imply immediate action, as Fannie Mae has discretion with respect to whether we are in compliance with
35
their requirements and what actions it deems appropriate under the circumstances in the event that we fall below their desired servicer ratings.
Certain of our servicing agreements require that we maintain specified servicer ratings. As a result of our current servicer ratings, termination rights have been triggered in some non-Agency servicing agreements. While the holders of these termination rights have not exercised them to date, they have not waived the right to do so, and we could, in the future, be subject to terminations either as a result of servicer ratings downgrades or future adverse actions by ratings agencies, which could have an adverse effect on our business, financing activities, financial condition and results of operations. Downgrades in our servicer ratings could also affect the terms and availability of advance financing or other debt facilities that we may seek in the future. Our failure to maintain minimum or specified ratings could adversely affect our dealings with contractual counterparties, including GSEs, Ginnie Mae and regulators, any of which could have a material adverse effect on our business, financing activities, financial condition and results of operations. To date, terminations as servicer as a result of a breach of any of these provisions have been minimal.
Our earnings are subject to volatility.
Our operating results have been and may in the future be significantly affected by inter-period variations in our results of operations, including variations due to sales or acquisitions of MSRs or changes in the value of MSRs due to, among other factors, increases or decreases in prepayment speeds, delinquencies or defaults.
Certain non-recurring gains and losses have significantly affected our operating results in the past, and other non-recurring gains and losses may affect our operating results in future periods, resulting in substantial inter-period variations in financial performance. In particular, our financial results for the year ended
December 31, 2019
reflect substantial costs relating to the integration of PHH, including costs relating to severance agreements and technology transitions. These costs may continue to have a significant impact on our future financial results.
We are subject to, among other things, requirements regarding the effectiveness of our internal controls over financial reporting. If our internal controls over financial reporting are found to be inadequate, our financial condition and results of operations and the trading price of our common stock may be materially and adversely affected.
Effective internal controls are necessary for us to provide reliable financial reports and prevent fraud. In addition, Section 404 of the Sarbanes-Oxley Act of 2002, or the Sarbanes-Oxley Act, requires us to evaluate and report on our internal control over financial reporting. As further detailed under Item 9A, Controls and Procedures, we concluded that, as of
December 31, 2019
, internal control over financial reporting is effective. However, during 2017, we identified a material weakness in internal control over financial reporting that required remediation and subsequent testing and evaluation before we could conclude that our internal control over financial reporting was once again effective. Because of its inherent limitations, internal control over financial reporting may not prevent or detect fraud or misstatements. In addition, projections of any evaluation of effectiveness to future periods are subject to the risk that controls may become inadequate because of changes in conditions or that the degree of compliance with the policies or procedures may deteriorate. Fraud or misstatement could adversely affect our financial condition and results of operations. Failure to implement required new or improved controls, or difficulties encountered in their implementation, could harm our results of operations or cause us to fail to meet our reporting obligations. In addition, investors could lose confidence in our financial reports and the trading price of our common stock may be adversely affected if our internal control over financial reporting is found by management or by our independent registered public accounting firm not to be adequate.
Changes in the method of determining the London Interbank Offered Rate (LIBOR), or the replacement of LIBOR with an alternative reference rate, may adversely affect interest rates, our business, and financial markets as a whole.
On July 27, 2017, the Financial Conduct Authority in the U.K. announced that it would phase out LIBOR as a benchmark by the end of 2021. It is unclear whether new methods of calculating LIBOR will be established such that it continues to exist after 2021, or whether different benchmark rates used to price indebtedness will develop. We presently have no debt facilities with maturities beyond 2021 that incorporate LIBOR and do not provide for its phase-out. As we renew or replace our debt facilities with maturities prior to the end of 2021 that currently incorporate LIBOR, we will need to work with our counterparties to incorporate alternative benchmarks. There is presently substantial uncertainty relating to the process and timeline for developing LIBOR alternatives, how widely any given alternative will be adopted by parties in the financial markets, and the extent to which alternative benchmarks may be subject to volatility or present risks and challenges that LIBOR does not. It is possible that we will disagree with our contractual counterparties over which alternative benchmark to adopt, which could make renewing or replacing our debt facilities and other agreements more complex. In addition, to the extent our adoption of a benchmark alternative impacts the interest rates payable by borrowers, it could lead to borrower complaints and litigation. Consequently, it is difficult to predict what effect, if any, the phase-out of LIBOR and the use of alternative benchmarks may have on our business or on the overall financial markets. If LIBOR alternatives re-allocate risk among parties in a way that is disadvantageous to market participants such as Ocwen, if there is disagreement among market
36
participants, including borrowers, over which alternative benchmark to adopt, or if uncertainty relating to the LIBOR phase-out disrupts financial markets, it could have a material adverse effect on our financial position, results of operations, and liquidity.
Tax Risks
Failure to retain the tax benefits provided by the USVI would adversely affect our financial condition and results of operations.
During 2019, in connection with our acquisition of PHH, overall corporate simplification and cost reduction efforts, we executed a legal entity reorganization whereby OLS, through which we previously conducted a substantial portion of our servicing business, was merged into PMC. OLS was previously the wholly-owned subsidiary of OMS, which was incorporated and headquartered in the USVI prior to its merger with Ocwen USVI Services, LLC, an entity which is also organized and headquartered in the USVI. The USVI has an Economic Development Commission (EDC) that provides certain tax benefits to qualified businesses. OMS received its certificate to operate as a company qualified for EDC benefits in October 2012 and as a result received significant tax benefits. Following our legal entity reorganization, we are no longer able to avail ourselves of favorable tax treatment for our USVI operations on a going forward basis. However, if the EDC were to determine that we failed to conduct our USVI operations in compliance with EDC qualifications prior to our reorganization, the value of the EDC benefits corresponding to the period prior to the reorganization could be reduced or eliminated, resulting in an increase to our tax expense. In addition, under our agreement with the EDC, we remain obligated to continue to operate Ocwen USVI Services, LLC in compliance with EDC requirements through 2042. If we fail to maintain our EDC qualification, we could be alleged to be in violation of our EDC commitments and the EDC could take adverse action against us, which could include demands for payment and reimbursement of past tax benefits, and it could result in the loss of anticipated income tax refunds. If any of these events were to occur, it could adversely affect our financial condition and results of operations.
We may be subject to increased United States federal income taxation.
OMS was incorporated under the laws of the USVI and operated in a manner that caused a substantial amount of its net income to be treated as not related to a trade or business within the United States, which caused such income to be exempt from United States federal income taxation. However, because there are no definitive standards provided by the Internal Revenue Code (the Code), regulations or court decisions as to the specific activities that constitute being engaged in the conduct of a trade or business within the United States, and as any such determination is essentially factual in nature, we cannot assure you that the IRS will not successfully assert that OMS was engaged in a trade or business within the United States with respect to that income.
If the IRS were to successfully assert that OMS had been engaged in a trade or business within the United States with respect to that income in any taxable year, it may become subject to United States federal income taxation on such income. Our tax returns and positions are subject to review and audit by federal and state taxing authorities. An unfavorable outcome to a tax audit could result in higher tax expense.
The recently enacted comprehensive tax reform legislation could adversely affect our business and financial condition.
On December 22, 2017, President Trump signed into law new legislation that significantly revises the Internal Revenue Code of 1986, as amended. The U.S. Tax Cuts and Jobs Act of 2017 (TCJA) significantly changed the taxation of U.S.-based multinational corporations. The U.S. Treasury Department, the U.S. Internal Revenue Service and state tax authorities have issued and are expected to continue to issue guidance on how the provisions of the TCJA will be applied or otherwise administered. As regulations and guidance evolve with respect to the TCJA, the results of newly issued guidance could be adverse and may differ from previous estimates. The TCJA, among other things, contains significant changes to corporate taxation, including reduction of the corporate tax rate from a top marginal rate of 35% to a flat rate of 21%, limitation of the tax deduction for interest expense and net operating loss carryforwards, one time taxation of offshore earnings at reduced rates regardless of whether they are repatriated, elimination of deferral of U.S. tax on foreign earnings (subject to certain important exceptions), a new minimum tax enacted to prevent companies from stripping earnings out of the U.S. through U.S. tax deductible payments made to foreign affiliates, immediate deductions for certain new investments instead of deductions for depreciation expense over time, and modifying or repealing many business deductions and credits. Notwithstanding the reduction in the corporate income tax rate, the overall impact of the new federal tax law is uncertain and our business and financial condition could be adversely affected.
In addition, state legislation and administrative guidance is still evolving. Certain states have recently enacted conformity legislation or decoupling legislation with uncertainty if, and to what extent, the various remaining states will conform to the newly enacted federal tax law. The impact of this tax reform on holders of our common stock is also uncertain and could be adverse.
Changes in taxation, as well as changes to tax filing positions resulting from examinations of our tax returns, and the ability to quantify such changes could adversely affect Ocwen’s financial results.
37
Ocwen is subject to taxation by the various taxing authorities at the Federal, state and local levels where it does business, both in the U.S. and outside the U.S. Legislation or regulation, which could affect Ocwen’s tax burden, could be enacted by any of these governmental authorities. Ocwen cannot predict the timing or extent of such tax-related developments, which could have a negative impact on the financial results. In addition, in the ordinary course of business, our tax filings are subject to examination by these same taxing jurisdictions. The results of an examination of a company’s tax positions by various taxing authorities is inherently uncertain and could result in the disallowance of tax deductions, a reduction in the amount of and/or timing for receiving anticipated tax refunds, and other potential adjustments which could have a negative impact on our financial results.
Any “ownership change” as defined in Section 382 of the Internal Revenue Code could substantially limit our ability to utilize our net operating losses carryforwards and other deferred tax assets.
As of
December 31, 2019
, Ocwen had U.S. federal net operating loss (NOL) carryforwards of approximately
$306.5 million
, which we estimate to be worth approximately
$64.4 million
to Ocwen under our present assumptions related to Ocwen’s various relevant jurisdictional tax rates as a result of recently passed tax legislation (which assumptions reflect a significant degree of uncertainty). As of December 31, 2019, Ocwen had state NOL and state tax credit carryforwards which we estimate to be worth approximately
$70.3 million
. As of
December 31, 2019
, Ocwen had foreign tax credit carryforwards of $0.01 million in the U.S. jurisdiction. As of
December 31, 2019
, Ocwen had disallowed interest under Section 163(j) of $51.9 million in the U.S. jurisdiction and $0.0 million in the USVI jurisdiction. NOL carryforwards, Section 163(j) disallowed interest carryforwards and certain built-in losses or deductions may be subject to annual limitations under Internal Revenue Code Section 382 (Section 382) (or comparable provisions of foreign or state law) in the event that certain changes in ownership were to occur as measured under Section 382. In addition, tax credit carryforwards may be subject to annual limitations under Internal Revenue Code Section 383 (Section 383). We periodically evaluate whether certain changes in ownership have occurred as measured under Section 382 that would limit our ability to utilize our NOLs, tax credit carryforwards, deductions and/or certain built-in losses. If it is determined that an ownership change(s) has occurred, there may be annual limitations under Sections 382 and 383 (or comparable provisions of foreign or state law).
We have evaluated whether we experienced an ownership change under these provisions, and determined that an ownership change did occur in January 2015 and in December 2017 in the U.S. jurisdiction, which also results in an ownership change under Section 382 in the USVI jurisdiction. In addition, a Section 382 ownership change occurred at PHH when Ocwen acquired the stock of PHH in October 2018. PHH was a loss corporation as defined under Section 382 at the date of the acquisition. PHH also had an existing Section 382 ownership change on March 31, 2018. For certain states, an additional Section 382 ownership change occurred on August 9, 2017. These Section 382 ownership changes may limit our ability to fully utilize NOLs, tax credit carryforwards, deductions and/or certain built-in losses that existed as of each respective ownership change date in the various jurisdictions.
Due to the Section 382 and 383 limitations and the maximum carryforward period for our NOLs and tax credits, we will be unable to fully recognize certain deferred tax assets. Accordingly, as of December 31, 2018, we reduced our gross deferred tax asset related to our U.S. federal and USVI NOLs by
$160.9 million
, our foreign tax credit deferred tax asset by
$29.5 million
and corresponding valuation allowance by
$55.7 million
. The realization of all or a portion of our deferred income tax assets (including NOLs and tax credits) is dependent upon the generation of future taxable income during the statutory carryforward periods. In addition, the limitation on the utilization of our NOL and tax credit carryforwards could result in Ocwen incurring a current tax liability in future tax years. Our inability to utilize our pre-ownership change NOL carryforwards, Section 163(j) disallowed interest carryforwards, any future recognized built-in losses or deductions, and tax credit carryforwards could have an adverse effect on our financial condition, results of operations and cash flows. Finally, any future changes in our ownership or sale of our stock could further limit the use of our NOLs and tax credits in the future.
As part of our Section 382 evaluation and consistent with the rules provided within Section 382, Ocwen relies strictly on the existence or absence of, as well as the information contained in, certain publicly available documents (e.g., Schedule 13D, Schedule 13G or other documents filed with the SEC) to identify shareholders that own a 5-percent or greater interest in Ocwen stock throughout the period tested. Further, Ocwen relies on such public filings to identify dates in which such 5-percent shareholders acquired, disposed, or otherwise transacted in Ocwen common stock. As the requirement for filing such notices of ownership from the SEC is to report beneficial ownership, as opposed to actual economic ownership of the stock of Ocwen, certain SEC filings may not represent ownership in Ocwen stock that should be considered in determining whether Ocwen experienced an ownership change under the Section 382 rules. Notwithstanding the preceding sentences (regarding Ocwen’s ability to rely on the existence and absence of information in publicly filed Schedules 13D and 13G), the rules prescribed in Section 382 and the regulations thereunder provide that Ocwen may (but is not required to) seek additional clarification from shareholders filing such Schedules 13D and 13G if there are questions or uncertainty regarding the true economic ownership of shares reported in such filing (whether due to ambiguity in the filing, an overly complex ownership structure, the type of instruments owned and reported in the filings, etc.) (often referred to “actual knowledge” questionnaires). Such information can be sought on a filer by filer basis (i.e., there is no requirement that if actual knowledge is sought with respect to one
38
shareholder, actual knowledge must be sought with respect to all shareholders that filed schedules 13D or 13G). While the seeking of actual knowledge can be beneficial in some instances it may be detrimental in others. Once such actual knowledge is received, Section 382 requires the inclusion of such actual knowledge, even if such inclusion is detrimental to the conclusion reached.
Ocwen has performed its analysis of the rules under Section 382 and, based on all currently available information, identified, in 2018, that it experienced an ownership change for Section 382 purposes in January 2015 and December 2017. Prior to 2018, Ocwen was aware of shareholder activity in 2015 and 2017 that may have caused a Section 382 ownership change(s) but determined that additional information could potentially be obtained from certain shareholders that would indicate a Section 382 ownership change had not occurred. In completing this analysis, Ocwen identified several shareholders that filed a schedule 13G during the period disclosing a greater than 5-percent interest in Ocwen stock where beneficial versus economic ownership of the stock was unclear and Ocwen therefore requested further details. As of the date of this Form 10-K, Ocwen has not received all requested responses from selected shareholders and will continue to consider such shareholders as economic owners of Ocwen’s stock until actual knowledge is otherwise received.
Ocwen is continuing to monitor the ownership in its stock to evaluate information that will become available later in 2020 and that may result in a different outcome for Section 382 purposes and our future cash tax obligations. As part of this monitoring, Ocwen periodically evaluates whether it is appropriate and beneficial to retroactively seek actual knowledge on certain previously identified and included 5-percent shareholders, whereby, depending on the responses received, Ocwen may conclude that either the January 2015 or December 2017 Section 382 ownership changes may have instead occurred on a different date, or did not occur at all. As such, our analysis regarding the amount of tax attributes that may be available to offset taxable income in the future without restrictions imposed by Section 382 may continue to evolve.
The reorganization of our USVI operations could adversely affect our business and financial condition.
During 2019, in connection with our acquisition of PHH, overall corporate simplification and cost reduction efforts, we executed a legal entity reorganization whereby two primary licensed entities (PMC and OLS) would be combined by merging OLS into PMC. OLS was previously the wholly-owned subsidiary of OMS, an entity that was incorporated and headquartered in the USVI. As a result of this merger, a portion of our USVI operations and assets were transferred to the U.S. At this time, we expect the merger to be treated as a reorganization that will result in efficiencies and operational cost savings through reduced complexity and a simplification of our global structure.
Although we expect the reorganization to result in efficiencies and operational cost savings, it is uncertain how the reorganization will ultimately impact Ocwen from a U.S. federal, state and USVI income tax perspective. We are continuing to evaluate the impact of the new U.S. tax legislation and guiding regulations (which are still being promulgated and finalized) on our global tax position. It is possible that our interpretation of the new tax legislation and related guidance that has been provided to date, and for which we are relying on to conclude upon the tax consequences of the reorganization and the future business operations, will not be consistent with final guidance provided by the IRS. In addition, the reorganization of the USVI operations could result in a write-down of our net deferred tax assets, including our NOL carryforwards, as well as a permanent loss of our EDC benefits in the USVI. Finally, the IRS or the Bureau of Internal Revenue may challenge our conclusions regarding the taxation associated with the reorganization and future business operations which could result in an increase to our current income tax obligations. The reorganization and future business operations could have an adverse effect on our financial condition, results of operations and cash flows due to the uncertainty of how the new U.S. tax legislation will impact our global tax position, as well as the other factors noted above.
Risks Relating to Ownership of Our Common Stock
Our common stock price experiences substantial volatility and has dropped significantly on a number of occasions in recent periods, which may affect your ability to sell our common stock at an advantageous price.
The market price of our shares of common stock has been, and may continue to be, volatile. For example, the closing market price of our common stock on the New York Stock Exchange fluctuated during
2019
between $1.27 per share and $2.41 per share and the closing stock price on
February 21, 2020
was
$1.40
per share. Therefore, the volatility and recent decline in our stock price may affect your ability to sell our common stock at an advantageous price. Market price fluctuations in our common stock may be due to factors both within and outside our control, including regulatory or legal actions, acquisitions, dispositions or other material public announcements or speculative trading in our stock (e.g., traders “shorting” our common stock), as well as a variety of other factors including, but not limited to those set forth under “Risk Factors” and “Forward-Looking Statements.”
In addition, the stock markets in general, including the New York Stock Exchange, have, at times, experienced extreme price and trading fluctuations. These fluctuations have resulted in volatility in the market prices of securities that often has been unrelated or disproportionate to changes in operating performance. These broad market fluctuations may adversely affect the market prices of our common stock.
39
When the market price of a company's shares drops significantly, shareholders often institute securities class action lawsuits against the company. A lawsuit against us, even if unsuccessful, could cause us to incur substantial costs and could divert the time and attention of our management and other resources. Further, if the average closing price of our stock over thirty consecutive trading days were to fall below $1.00, we would need to take immediate steps to avoid de-listing by the New York Stock Exchange. Such measures could cause us to incur substantial costs and divert management attention, and could include implementing a reverse stock split, which would entail additional risk, and success in preventing de-listing would not be assured.
We have several large shareholders, and such shareholders may vote their shares to influence matters requiring shareholder approval.
Based on SEC filings, certain shareholders, such as investors Deer Park Road Management Company, LP and Leon G. Cooperman, own or control significant amounts of our common stock. These and our other large shareholders each have the ability to vote a meaningful percentage of our outstanding common stock on all matters put to a vote of our shareholders. As a result, these shareholders could influence matters requiring shareholder approval, including the amendment of our articles of incorporation, the approval of mergers or similar transactions and the election of directors. For instance, we held a special meeting of shareholders in November 2018 in order to implement an amendment to our articles of incorporation that management believed was necessary to help us preserve certain tax assets, but in part due to the fact that we did not receive the vote of several large shareholders, the proposal was not adopted by our shareholders. If, in the future, situations arise in which management and certain large shareholders have divergent views, we may be unable to take actions management believes to be in the best interests of Ocwen.
Further, certain of our large shareholders also hold significant percentages of stock in companies with which we do business. It is possible these interlocking ownership positions could cause these shareholders to take actions based on factors other than solely what is in the best interests of Ocwen.
Our board of directors may authorize the issuance of additional securities that may cause dilution and may depress the price of our securities.
Our charter permits our board of directors, without our stockholders’ approval, to:
|
•
|
authorize the issuance of additional common stock or preferred stock in connection with future equity offerings or acquisitions of securities or other assets of companies; and
|
|
•
|
classify or reclassify any unissued common stock or preferred stock and to set the preferences, rights and other terms of the classified or reclassified shares, including the issuance of shares of preferred stock that have preference rights over the common stock and existing preferred stock with respect to dividends, liquidation, voting and other matters or shares of common stock that have preference rights over common stock with respect to voting.
|
While any such issuance would be subject to compliance with the terms of our debt and other agreements, our issuance of additional securities could be substantially dilutive to our existing stockholders and may depress the price of our common stock.
Future offerings of debt securities, which would be senior to our common stock in liquidation, or equity securities, which would dilute our existing stockholders’ interests and may be senior to our common stock in liquidation or for the purposes of distributions, may harm the market price of our securities.
We will continue to seek to access the capital markets from time to time and, subject to compliance with our other contractual agreements, may make additional offerings of term loans, debt or equity securities, including senior or subordinated notes, preferred stock or common stock. We are not precluded by the terms of our charter from issuing additional indebtedness. Accordingly, we could become more highly leveraged, resulting in an increase in debt service obligations and an increased risk of default on our obligations. If we were to liquidate, holders of our debt and lenders with respect to other borrowings would receive a distribution of our available assets before the holders of our common stock. Additional equity offerings by us may dilute our existing stockholders’ interest in us or reduce the market price of our existing securities. Because our decision to issue securities in any future offering will depend on market conditions and other factors beyond our control, we cannot predict or estimate the amount, timing or nature of our future offerings. Further, conditions could require that we accept less favorable terms for the issuance of our securities in the future. Thus, our existing stockholders will bear the risk of our future offerings reducing the market price of our securities and diluting their ownership interest in us.
Because of certain provisions in our organizational documents and regulatory restrictions, takeovers may be more difficult, possibly preventing you from obtaining an optimal share price. In addition, significant investments in our common stock may be restricted, which could impact demand for, and the trading price of, our common stock.
Our amended and restated articles of incorporation provide that the total number of shares of all classes of capital stock that we have authority to issue is 220 million, of which 200 million are common shares and 20 million are preferred shares. Our
40
board of directors has the authority, without a vote of the shareholders, to establish the preferences and rights of any preferred or other class or series of shares to be issued and to issue such shares. The issuance of preferred shares could delay or prevent a change in control. Since our board of directors has the power to establish the preferences and rights of the preferred shares without a shareholder vote, our board of directors may give the holders of preferred shares preferences, powers and rights, including voting rights, senior to the rights of holders of our common shares. In addition, our bylaws include provisions that, among other things, require advance notice for raising business or making nominations at meetings, which could impact the ability of a third party to acquire control of us or the timing of acquiring such control.
Third parties seeking to acquire us or make significant investments in us must do so in compliance with state regulatory requirements applicable to licensed mortgage servicers and lenders. Many states require change of control applications for acquisitions of “control” as defined under each state’s laws and regulation, which may apply to an investment without regard to the intent of the investor. For example, New York has a control presumption triggered at 10% ownership of the voting stock of the licensee or of any person that controls the licensee. In addition, we have licensed insurance subsidiaries in New York and Vermont. Accordingly, there can be no effective change in control of Ocwen unless the person seeking to acquire control has made the relevant filings and received the requisite approvals in New York and Vermont. These regulatory requirements may discourage potential acquisition proposals or investments, may delay or prevent a change in control of us and may impact demand for, and the trading price of, our common stock.
|
ITEM 1B.
|
UNRESOLVED STAFF COMMENTS
|
None.
|
ITEM 2.
|
PROPERTIES
|
The following table sets forth information relating to our principal facilities at
December 31, 2019
:
|
Location
|
Owned/Leased
|
Square Footage
|
|||
|
Principal executive offices
|
|||||
|
West Palm Beach, Florida
|
Leased
|
51,546
|
|
||
|
Document storage and imaging facility
|
|||||
|
West Palm Beach, Florida
|
Leased
|
51,931
|
|
||
|
Business operations and support offices
|
|||||
|
U.S. facilities:
|
|||||
|
Mt. Laurel, New Jersey (1)
|
Leased
|
483,896
|
|
||
|
Rancho Cordova, California (2)
|
Leased
|
53,107
|
|
||
|
Houston, Texas (3)
|
Leased
|
9,653
|
|
||
|
St. Croix, USVI (4)
|
Leased
|
6,096
|
|
||
|
Offshore facilities (4)
|
|||||
|
Bangalore, India
|
Leased
|
128,606
|
|
||
|
Mumbai, India
|
Leased
|
96,696
|
|
||
|
Pune, India (5)
|
Leased
|
88,683
|
|
||
|
Manila, Philippines
|
Leased
|
39,329
|
|
||
|
Former operations and support offices no longer utilized
|
|||||
|
Waterloo, Iowa (6)
|
Owned
|
154,980
|
|
||
|
Fort Washington, Pennsylvania (6)
|
Leased
|
77,026
|
|
||
|
Westampton, New Jersey (7)
|
Leased
|
71,164
|
|
||
|
Addison, Texas (6)
|
Leased
|
39,646
|
|
||
|
Bannockburn, Illinois (7)
|
Leased
|
36,188
|
|
||
41
|
(1)
|
The Mt. Laurel facility includes two buildings, one with 376,122 square feet of space supporting our servicing and lending operations, as well as our corporate functions. We ceased using 124,795 square feet as a result of the reduction in headcount. The second building has 107,774 square feet of space, all of which is subleased.
|
|
(2)
|
Primarily supports reverse lending operations.
|
|
(3)
|
Primarily supports commercial operations.
|
|
(4)
|
Primarily supports servicing operations.
|
|
(5)
|
We ceased using approximately half of the Pune facility as a result of a reduction in headcount. We did not renew our lease for 44,355 square feet of space on January 1, 2020.
|
|
(6)
|
We ceased operations in these facilities during 2019 and the space is currently unoccupied. We have listed the Waterloo property for sale. The Fort Washington lease expires in June 2020. The Addison lease, which expires in 2025, is currently being marketed for sublease.
|
|
(7)
|
The Westampton and Bannockburn facilities are former PHH facilities. The Westampton lease, which expires in December 2021 is currently subleased and the Bannockburn lease expires in March 2020.
|
In addition to the facilities listed in the table above, we also lease other small facilities in Glendale, California (ceased operations in 2019); Irvine, California (occupied); and Atlanta, Georgia (ceased operations in 2019 and currently subleased).
|
ITEM 3.
|
LEGAL PROCEEDINGS
|
See
Note 26 — Contingencies
to the Consolidated Financial Statements. That information is incorporated into this item by reference.
|
ITEM 4.
|
MINE SAFETY DISCLOSURES
|
Not applicable.
PART II
|
ITEM 5.
|
MARKET FOR REGISTRANT’S COMMON EQUITY, RELATED STOCKHOLDER MATTERS AND ISSUER PURCHASES OF EQUITY SECURITIES
|
Price Range of Our Common Stock
The common stock of Ocwen Financial Corporation is traded under the symbol “OCN” on the New York Stock Exchange (NYSE).
Dividends
We have never declared or paid cash dividends on our common stock. We currently do not intend to pay cash dividends in the foreseeable future but intend to reinvest earnings in our business. The timing and amount of any future dividends will be determined by our Board of Directors and will depend, among other factors, upon our earnings, financial condition, cash requirements, the capital requirements of subsidiaries and investment opportunities at the time any such payment is considered. In addition, the covenants relating to certain of our borrowings contain limitations on our payment of dividends. Our Board of Directors has no obligation to declare dividends on our common stock under Florida law or our amended and restated articles of incorporation.
42
Stock Return Performance
The following graph compares the cumulative total return on the common stock of Ocwen Financial Corporation since December 31, 2014, with the cumulative total return on the stocks included in Standard & Poor’s 500 Market Index and Standard & Poor’s Diversified Financials Market Index. The graph assumes that $100 was invested in our common stock and in each index on December 31, 2014 and the reinvestment of all dividends.
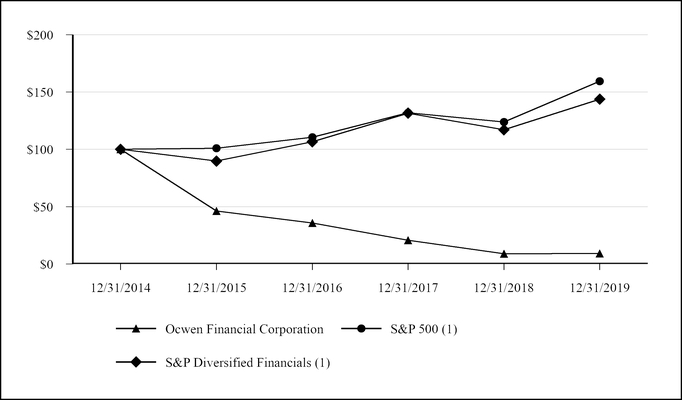
|
Period Ending
|
||||||||||||||||||||||||
|
Index
|
12/31/2014
|
12/31/2015
|
12/31/2016
|
12/31/2017
|
12/31/2018
|
12/31/2019
|
||||||||||||||||||
|
Ocwen Financial Corporation
|
$
|
100.00
|
|
$
|
46.16
|
|
$
|
35.70
|
|
$
|
20.73
|
|
$
|
8.87
|
|
$
|
9.07
|
|
||||||
|
S&P 500
|
$
|
100.00
|
|
$
|
100.88
|
|
$
|
110.50
|
|
$
|
131.96
|
|
$
|
123.73
|
|
$
|
159.45
|
|
||||||
|
S&P 500 Diversified Financials
|
$
|
100.00
|
|
$
|
89.74
|
|
$
|
106.63
|
|
$
|
131.50
|
|
$
|
117.01
|
|
$
|
143.74
|
|
||||||
|
(1)
|
Copyright ©
2017 S&P Dow Jones Indices LLC, a division of S&P Global. All rights reserved. Redistribution or reproduction in whole or in part are prohibited without written permission of S&P Dow Jones Indices LLC. S&P 500® and S&P® are registered trademarks of Standard & Poor's Financial Services LLC, a division of S&P Global (S&P); DOW JONES is a registered trademark of Dow Jones Trademark Holdings LLC (Dow Jones); and these trademarks have been licensed for use by S&P Dow Jones Indices LLC. S&P Dow Jones Indices LLC, Dow Jones, S&P and their respective affiliates (S&P Dow Jones Indices) makes no representation or warranty, express or implied, as to the ability of any index to accurately represent the asset class or market sector that it purports to represent and S&P Dow Jones Indices and its third-party licensors shall have no liability for any errors, omissions, or interruptions of any index or the data included therein. All data and information is provided by S&P DJI "as is". Past performance is not an indication or guarantee of future results.
|
This performance graph shall not be deemed “filed” for purposes of Section 18 of the Securities Exchange Act of 1934, as amended, or incorporated by reference into any filing by us under the Securities Act of 1933, as amended, except as shall be expressly set forth by specific reference in such filing.
Number of Holders of Common Stock
On
February 21, 2020
,
134,948,008
shares of our common stock were outstanding and held by approximately
99
holders of record. Such number of stockholders does not reflect the number of individuals or institutional investors holding our stock in nominee name through banks, brokerage firms and others.
43
Unregistered Sales of Equity Securities and Use of Proceeds
All unregistered sales of equity securities have been previously reported.
Purchases of Equity Securities by the Issuer and Affiliates
There were no repurchases of our common stock during the fourth quarter of the year ended
December 31, 2019
.
|
ITEM 6.
|
SELECTED FINANCIAL DATA (Dollars in thousands, except per share data and unless otherwise indicated)
|
The selected historical consolidated financial information set forth below should be read in conjunction with Business, Management’s Discussion and Analysis of Financial Condition and Results of Operations, our Consolidated Financial Statements and the Notes to the Consolidated Financial Statements. The historical financial information presented may not be indicative of our future performance.
|
|
December 31,
|
|||||||||||||||||||
|
|
2019
|
2018
|
2017
|
2016
|
2015
|
|||||||||||||||
|
Selected Balance Sheet Data
|
|
|
|
|
|
|
|
|
|
|
||||||||||
|
Total Assets
|
$
|
10,406,199
|
|
$
|
9,394,216
|
|
$
|
8,403,164
|
|
$
|
7,655,663
|
|
$
|
7,380,308
|
|
|||||
|
Loans held for sale
|
$
|
275,269
|
|
$
|
242,622
|
|
$
|
238,358
|
|
$
|
314,006
|
|
$
|
414,046
|
|
|||||
|
Loans held for investment
|
6,292,938
|
|
5,498,719
|
|
4,715,831
|
|
3,565,716
|
|
2,488,253
|
|
||||||||||
|
Advances and match funded advances
|
1,056,523
|
|
1,186,676
|
|
1,356,393
|
|
1,709,846
|
|
2,151,066
|
|
||||||||||
|
Mortgage servicing rights
|
1,486,395
|
|
1,457,149
|
|
1,008,844
|
|
1,042,978
|
|
1,138,569
|
|
||||||||||
|
Total Liabilities
|
$
|
9,994,188
|
|
$
|
8,839,511
|
|
$
|
7,856,290
|
|
$
|
7,000,380
|
|
$
|
6,525,670
|
|
|||||
|
HMBS-related borrowings
|
$
|
6,063,435
|
|
$
|
5,380,448
|
|
$
|
4,601,556
|
|
$
|
3,433,781
|
|
$
|
2,391,362
|
|
|||||
|
Other financing liabilities (1)
|
972,595
|
|
1,062,090
|
|
520,943
|
|
497,900
|
|
601,347
|
|
||||||||||
|
Match funded liabilities
|
679,109
|
|
778,284
|
|
998,618
|
|
1,280,997
|
|
1,584,049
|
|
||||||||||
|
Long-term other secured borrowings (1)
|
511,280
|
|
632,694
|
|
704,076
|
|
799,504
|
|
831,309
|
|
||||||||||
|
Total equity
|
$
|
412,011
|
|
$
|
554,705
|
|
$
|
546,874
|
|
$
|
655,283
|
|
$
|
854,638
|
|
|||||
|
Residential Loans and Real Estate
Serviced or Subserviced for Others
|
|
|
|
|
|
|
|
|
|
|
||||||||||
|
Count
|
1,419,943
|
|
1,562,238
|
|
1,221,695
|
|
1,393,766
|
|
1,624,762
|
|
||||||||||
|
UPB
|
$
|
212,366,431
|
|
$
|
256,000,490
|
|
$
|
179,352,553
|
|
$
|
209,092,130
|
|
$
|
250,966,112
|
|
|||||
44
|
|
For the Years Ended December 31,
|
||||||||||||||||||
|
|
2019
|
2018
|
2017
|
2016
|
2015
|
||||||||||||||
|
Selected Results of Operations Data(2)
|
|
|
|
|
|
|
|
|
|
|
|||||||||
|
Revenue
|
|
|
|
|
|
|
|
|
|
|
|||||||||
|
Servicing and subservicing fees
|
$
|
975,507
|
|
$
|
937,083
|
|
$
|
991,597
|
|
$
|
1,188,229
|
|
$
|
1,532,865
|
|
||||
|
Gain on loans held for sale, net
|
38,300
|
|
37,336
|
|
57,183
|
|
51,011
|
|
104,754
|
|
|||||||||
|
Reverse mortgage revenue, net
|
86,309
|
|
60,237
|
|
75,515
|
|
71,681
|
|
46,442
|
|
|||||||||
|
Other
|
23,259
|
|
28,389
|
|
70,281
|
|
76,242
|
|
57,037
|
|
|||||||||
|
Total revenue
|
1,123,375
|
|
1,063,045
|
|
1,194,576
|
|
1,387,163
|
|
1,741,098
|
|
|||||||||
|
MSR valuation adjustments, net
|
(120,876
|
)
|
(153,457
|
)
|
(52,962
|
)
|
(32,978
|
)
|
(99,194
|
)
|
|||||||||
|
Operating expenses
|
673,939
|
|
779,039
|
|
945,683
|
|
1,190,276
|
|
1,378,990
|
|
|||||||||
|
Other income (expense)
|
|
|
|
|
|
|
|
|
|
|
|||||||||
|
Interest expense
|
(114,129
|
)
|
(103,371
|
)
|
(126,927
|
)
|
(178,183
|
)
|
(213,580
|
)
|
|||||||||
|
Pledged MSR liability expense
|
(372,089
|
)
|
(171,670
|
)
|
(236,311
|
)
|
(234,400
|
)
|
(268,793
|
)
|
|||||||||
|
Bargain purchase gain (3)
|
(381
|
)
|
64,036
|
|
—
|
|
—
|
|
—
|
|
|||||||||
|
Gain on sale of MSRs, net (4)
|
453
|
|
1,325
|
|
10,537
|
|
8,492
|
|
83,921
|
|
|||||||||
|
Other, net
|
31,095
|
|
7,655
|
|
12,797
|
|
33,821
|
|
5,677
|
|
|||||||||
|
Other expense, net
|
(455,051
|
)
|
(202,025
|
)
|
(339,904
|
)
|
(370,270
|
)
|
(392,775
|
)
|
|||||||||
|
Loss from continuing operations before income taxes
|
(126,491
|
)
|
(71,476
|
)
|
(143,973
|
)
|
(206,361
|
)
|
(129,861
|
)
|
|||||||||
|
Income tax expense (benefit) (5)
|
15,634
|
|
529
|
|
(15,516
|
)
|
(6,986
|
)
|
116,851
|
|
|||||||||
|
Loss from continuing operations
|
(142,125
|
)
|
(72,005
|
)
|
(128,457
|
)
|
(199,375
|
)
|
(246,712
|
)
|
|||||||||
|
Income from discontinued operations, net of tax
|
—
|
|
1,409
|
|
—
|
|
—
|
|
—
|
|
|||||||||
|
Net loss
|
(142,125
|
)
|
(70,596
|
)
|
(128,457
|
)
|
(199,375
|
)
|
(246,712
|
)
|
|||||||||
|
Net loss (income) attributable to non-controlling interests
|
—
|
|
(176
|
)
|
491
|
|
(387
|
)
|
(305
|
)
|
|||||||||
|
Net loss attributable to Ocwen stockholders
|
$
|
(142,125
|
)
|
$
|
(70,772
|
)
|
$
|
(127,966
|
)
|
$
|
(199,762
|
)
|
$
|
(247,017
|
)
|
||||
|
Earnings (loss) per share - Basic and Diluted
|
|
|
|
|
|
|
|
|
|
|
|||||||||
|
Continuing operations
|
$
|
(1.06
|
)
|
$
|
(0.54
|
)
|
$
|
(1.01
|
)
|
$
|
(1.61
|
)
|
$
|
(1.97
|
)
|
||||
|
Discontinued operations
|
$
|
—
|
|
$
|
0.01
|
|
$
|
—
|
|
$
|
—
|
|
$
|
—
|
|
||||
|
Total attributable to Ocwen stockholders
|
$
|
(1.06
|
)
|
$
|
(0.53
|
)
|
$
|
(1.01
|
)
|
$
|
(1.61
|
)
|
$
|
(1.97
|
)
|
||||
|
Weighted average common shares outstanding
|
|
|
|
|
|
|
|
|
|
|
|||||||||
|
Basic
|
134,444,402
|
|
133,703,359
|
|
127,082,058
|
|
123,990,700
|
|
125,315,899
|
|
|||||||||
|
Diluted (6)
|
134,444,402
|
|
133,703,359
|
|
127,082,058
|
|
123,990,700
|
|
125,315,899
|
|
|||||||||
|
(1)
|
In the consolidated balance sheets at December 31, 2018, 2017, 2016 and 2015, we reclassified borrowings with an outstanding balance of
$65.5 million
,
$72.6 million
,
$81.1 million
and
$96.5 million
, respectively, from Other financing liabilities to Other secured borrowings to conform to the current year presentation. See the Reclassifications section of
Note 1 — Organization, Business Environment, Basis of Presentation and Significant Accounting Policies
for additional information.
|
|
(2)
|
Certain amounts in the consolidated statements of operations for 2015 - 2018 have been reclassified to conform to the current year presentation, including presentation of the MSR valuation adjustments, net line item separately from Operating expenses and adding new line items for Reverse mortgage revenue, net (without any impact on total Revenue) and Pledged MSR liability expense (previously
|
45
included in Interest expense, without any impact on Other income (expense)). Reclassifications of prior years to present Reverse mortgage revenue, net as a separate revenue line item on the face of the statement of operations are provided in the table below. See the Reclassifications section of
Note 1 — Organization, Business Environment, Basis of Presentation and Significant Accounting Policies
for additional information.
|
Years ended December 31,
|
|||||||||||||||||
|
2018
|
2017
|
2016
|
2015
|
||||||||||||||
|
From
|
Gain on loans held for sale, net
|
$
|
40,407
|
|
$
|
46,219
|
|
$
|
39,380
|
|
$
|
30,215
|
|
||||
|
From
|
Other revenue, net
|
22,577
|
|
31,517
|
|
33,910
|
|
17,295
|
|
||||||||
|
From
|
Servicing and subservicing fees
|
(2,747
|
)
|
(2,221
|
)
|
(1,609
|
)
|
(1,068
|
)
|
||||||||
|
To
|
Reverse mortgage revenue, net (New line item)
|
60,237
|
|
75,515
|
|
71,681
|
|
46,442
|
|
||||||||
|
Total revenue
|
$
|
—
|
|
$
|
—
|
|
$
|
—
|
|
$
|
—
|
|
|||||
|
(3)
|
Recognized in connection with the acquisition of PHH on October 4, 2018. See
Note 2 — Business Acquisition
to the Consolidated Financial Statements for additional information.
|
|
(4)
|
During
2019
,
2018
,
2017
,
2016
and
2015
, we sold certain of our MSRs relating to loans with a UPB of
$140.8 million
,
$901.3 million
,
$219.4 million
,
$3.7 billion
and
$87.6 billion
, respectively.
|
|
(5)
|
Income tax expense for 2015 includes a $97.1 million provision to establish valuation allowances relating to deferred tax assets in our U.S. and USVI tax jurisdictions. See
Note 20 — Income Taxes
to the Consolidated Financial Statements for additional information.
|
|
(6)
|
For 2015 - 2019, we have excluded the effect of all dilutive or potentially dilutive shares from the computation of diluted earnings per share because of the anti-dilutive effect of our reported net loss.
|
|
ITEM 7.
|
MANAGEMENT’S DISCUSSION AND ANALYSIS OF FINANCIAL CONDITION AND RESULTS OF OPERATIONS (Dollars in thousands, unless otherwise indicated)
|
The following Management’s Discussion and Analysis of Financial Condition and Results of Operations, as well as other portions of this Form 10-K, may contain certain statements that constitute forward-looking statements within the meaning of the federal securities laws. In some cases, you can identify forward-looking statements by terminology such as “may,” “will,” “should,” “could”, “intend,” “consider,” “expect,” “plan,” “anticipate,” “believe,” “estimate,” “predict” or “continue” or the negative of such terms or other comparable terminology. Forward-looking statements by their nature address matters that are, to different degrees, uncertain. Our business has been undergoing substantial change, which has magnified such risks and uncertainties. You should bear these factors in mind when considering forward-looking statements and should not place undue reliance on such statements. Forward-looking statements involve a number of assumptions, risks and uncertainties that could cause actual results to differ materially from those suggested by such statements. In the past, actual results have differed from those suggested by forward-looking statements and this may happen again. You should consider all uncertainties and risks discussed or referenced
in this report, including those under “Forward-Looking Statements” and Item 1A, Risk Factors, as well as those discussed in any subsequent SEC filings.
The Management’s Discussion and Analysis of Financial Condition and Results of Operations section of this Form 10-K generally discusses 2019 and 2018 items and year-to-year comparisons between 2019 and 2018. Discussions of 2017 items and year-to-year comparisons between 2018 and 2017 that are not included in this Form 10-K can be found in “Management’s Discussion and Analysis of Financial Condition and Results of Operations” in Part II, Item 7 of our Annual Report on Form 10-K for the year ended December 31, 2018.
OVERVIEW
We are a financial services company that services and originates mortgage loans. The majority of our revenues are generated from our residential mortgage servicing business. As of
December 31, 2019
, our residential mortgage servicing portfolio consisted of
1,419,943
loans with a total UPB of
$212.37 billion
. We service all mortgage loan classes, including conventional, government-insured and non-Agency loans.
46
We selectively sourced our MSR originations and acquisitions and subservicing in 2019 through diversified channels, as detailed below:
|
Amounts in billions
|
UPB
|
||||||
|
Quarter Ended December 31, 2019
|
Year Ended December 31, 2019
|
||||||
|
MSR additions:
|
|||||||
|
MSR originations
|
|||||||
|
Recapture origination
|
$
|
0.17
|
|
$
|
0.66
|
|
|
|
Correspondent
|
0.40
|
|
0.49
|
|
|||
|
Flow purchases
|
0.24
|
|
0.24
|
|
|||
|
GSE Cash Window
|
0.55
|
|
0.67
|
|
|||
|
Reverse MSR originations
|
0.26
|
|
0.73
|
|
|||
|
Total MSR originations
|
1.62
|
|
2.79
|
|
|||
|
Bulk MSR purchases
|
2.74
|
|
14.62
|
|
|||
|
Total MSR additions
|
4.36
|
|
17.41
|
|
|||
|
Subservicing additions
|
3.79
|
|
8.68
|
|
|||
|
Total MSR and subservicing additions
|
$
|
8.15
|
|
$
|
26.09
|
|
|
In our lending business, we originate, purchase, sell and securitize forward and reverse mortgage loans that are mostly conventional and government-insured. During 2019, we originated
$1.88 billion
forward and reverse mortgage loans.
On October 4, 2018, we completed the acquisition of PHH, whose servicing portfolio consisted of
537,225
residential mortgage loans with a UPB of
$119.3 billion
,
$68.7 billion
of which were under subservicing agreements. During 2019, we successfully executed our planned integration of PHH’s business with ours with a focus on system integration, elimination of duplicative processes and transformation to create value. We have fully transitioned our servicing onto the Black Knight MSP servicing system. We have reduced total staffing levels by
1,100
or
17%
, with a total headcount of approximately
5,300
at
December 31, 2019
compared to the Ocwen headcount pre-PHH acquisition of
6,400
on September 30, 2018. We have vacated seven U.S. facilities. In the first half of 2019, we completed the mergers of two of our primary licensed operating entities, Homeward and OLS into PMC, with PMC being the surviving corporation.
We have established a set of key business initiatives to achieve our objective of returning to sustainable profitability in the shortest timeframe possible within an appropriate risk and compliance environment. These include:
|
•
|
Managing the size of our servicing portfolio through expanding our lending business to grow sustainable channels of MSR replenishment;
|
|
•
|
Reengineering our cost structure;
|
|
•
|
Effectively managing our balance sheet to fund our ongoing business needs and growth; and,
|
|
•
|
Fulfilling our regulatory commitments and resolving remaining legacy matters.
|
First, we must expand our lending business and targeted MSR acquisitions that have appropriate financial return targets to replenish and grow our servicing portfolio. We expect to continue to focus on acquiring Agency and government-insured MSR portfolios that meet or exceed our minimum targeted investment returns. During 2019, we closed MSR acquisitions with
$14.6 billion
UPB or
$153.5 million
fair value, allowing us to grow our Agency portfolio on a net basis after portfolio runoff. We also executed on our plans to re-enter the forward lending correspondent channel in the second quarter of 2019 and we continue to pursue a number of other MSR acquisition options, including driving improved recapture rates within our existing servicing portfolio. In addition to our organic growth initiatives in lending, we have been actively engaged in evaluating opportunities to acquire complimentary lending businesses with proven capabilities to generate significant volume through mortgage lending cycles and provide a sustainable MSR source. Some of these opportunities could also immediately increase the size of our servicing portfolio through these businesses’ existing MSRs.
Second, we must re-engineer our cost structure to go beyond eliminating redundant costs through the integration process and establish continuous operational efficiencies and cost improvement as a core strength. Our continuous cost improvement efforts are focused on leveraging our single servicing platform and technology, optimizing strategic sourcing and off-shore utilization, lean process design, automation and other technology-enabled productivity enhancements. Our initiatives are
47
targeted at delivering superior accuracy, cost, speed and customer satisfaction. We believe these steps are necessary in order to simplify our operations and drive stronger financial performance.
Third, we must manage our balance sheet to ensure adequate liquidity and maintain diverse sources of capital and a solid platform for financing our ongoing business needs and executing on our other key business initiatives. In 2019, we established three financing facilities secured by MSRs under which we had borrowed
$314.4 million
at
December 31, 2019
, approximately half of which effectively supported our 2019 MSR acquisitions. In addition, in January 2020 we extended the maturity on our senior secured term loan (SSTL) from December 2020 to May 2022 and reduced the outstanding balance from
$326.1 million
to
$200.0 million
consistent with our focus on lower cost asset-backed structured finance debt. We continue to evaluate our capital structure options to determine how to enable the most effective execution of our key business initiatives.
Finally, we must fulfill our regulatory commitments and resolve our remaining legal and regulatory matters on satisfactory terms. Our business, operating results and financial condition have been significantly impacted in recent periods by regulatory actions against us and by significant litigation matters. Should the number or scope of regulatory or legal actions against us increase or expand or should we be unable to reach reasonable resolutions in existing regulatory and legal matters, our business, reputation, financial condition, liquidity and results of operations could be materially and adversely affected, even if we are successful in our ongoing efforts to drive stronger financial performance.
Our ability to execute on these key business initiatives is not certain and is dependent on the successful execution of several complex actions, including our ability to grow our lending business and acquire MSRs with appropriate financial return targets, our ability to acquire, maintain and grow profitable client relationships, our ability to implement further organizational redesign and cost reduction, as well as the absence of significant unforeseen costs, including regulatory or legal costs, that could negatively impact our return to sustainable profitability, and our ability to extend, renew or replace our debt agreements in the ordinary course of business. There can be no assurances that the desired strategic and financial benefits of these actions will be realized.
In recent periods, Ocwen has incurred significant losses as a result of declines in the fair value of our MSRs. Further interest rate decreases, prepayment speed increases or changes to other fair value inputs or assumptions could result in further fair value declines and hamper our ability to return to profitability. Starting in September 2019, we have implemented a hedging strategy to partially offset the changes in fair value of our net MSR portfolio. See Risk Management - Market Risk for further information.
In addition, we have exposure to concentration risk and client retention risk as a result of our relationship with NRZ, which accounted for
56%
of the UPB in our servicing portfolio as of December 31, 2019 and approximately
74%
of all delinquent loans that Ocwen serviced. During 2019, NRZ-related servicing fees retained by Ocwen represented approximately
36%
of the total servicing and subservicing fees earned by Ocwen, net of servicing fees remitted to NRZ (excluding ancillary income).
During 2019, we completed an assessment of the cost-to-service and the profitability of the NRZ servicing portfolio. Based on this analysis, in the fourth quarter of 2019, we estimate that operating expenses, including direct servicing expenses and overhead allocation, exceeded the net revenue retained for the NRZ servicing portfolio by approximately
$10.0 million
. As with all estimates, this estimate required the exercise of judgment, including with respect to overhead allocations, and it excludes the benefits of the lump-sum payment amortization. The estimated loss for these subservicing agreements is partially driven by the declining revenue as the loan portfolio amortizes down without a corresponding reduction to our servicing cost per loan over time. As performing loans in the NRZ servicing portfolio have run-off, delinquencies have remained high, resulting in a relatively elevated average cost per loan. Because the NRZ portfolio contains a high percentage of delinquent accounts, it has an inherently high level of potential operational and compliance risk and requires a disproportionately high level of operating staff, oversight support infrastructure and overhead which drives the elevated average cost per loan. We actively pursue cost re-engineering initiatives to continue to reduce our cost-to-service and corporate overhead, as well as pursue actions to grow our non-NRZ servicing portfolio.
On February 20, 2020, we received a notice of termination from NRZ with respect to the legacy PMC subservicing agreement. This termination is for convenience (and not for cause). The notice states that the effective date of termination is June 19, 2020 for 25% of the loans under the agreement (not including loans constituting approximately
$6.6 billion
in UPB that were added by NRZ under the agreement in 2019) and August 18, 2020 for the remainder of the loans under the agreement. The actual servicing transfer date(s) will be determined through discussions with NRZ and other stakeholders such as GSEs. In connection with the termination, we estimate that we will receive loan deboarding fees of approximately
$6.1 million
from NRZ. The portfolio subject to termination accounted for
$42.1 billion
in UPB, or
20%
of our total serviced UPB as of December 31, 2019. Under this agreement, in the fourth quarter of 2019, we estimate that operating expenses, including direct expenses and overhead allocation, exceeded the net revenue retained for this portion of the NRZ servicing portfolio by approximately
$3.0 million
. At this stage, we do not anticipate significant operational impacts on our servicing business as a result of this termination. The terminated servicing is comprised of Agency loans with relatively low delinquencies that do not pose a high level of operating and compliance risk or require substantial direct and oversight staffing relative to our non-
48
Agency servicing. Nonetheless, we intend to right-size and reduce expenses in our servicing business and the related corporate support functions to the extent possible to align with our smaller portfolio.
We currently anticipate that the loan deboarding fees from NRZ will offset a significant portion of our transition and restructuring costs assuming an orderly and timely transfer. However, it is possible that the loan deboarding and other transition activities that we will undertake as a result of the termination may not occur in an orderly or timely manner, which could be disruptive and could result in us incurring additional costs or even in disagreements with NRZ relating to our respective rights and obligations. Overall, our current view is that if we can exclude the legacy PMC NRZ servicing portfolio and successfully execute on the necessary transition and expense reduction actions in an orderly and timely manner, we will be able to enhance the long-term financial performance of our servicing business.
49
Operations Summary
|
Years Ended December 31,
|
% Change
|
||||||||||||||||
|
2019
|
2018
|
2017
|
2019 vs. 2018
|
2018 vs. 2017
|
|||||||||||||
|
Revenue
|
|||||||||||||||||
|
Servicing and subservicing fees
|
$
|
975,507
|
|
$
|
937,083
|
|
$
|
991,597
|
|
4
|
%
|
|
(5
|
)%
|
|||
|
Gain on loans held for sale, net
|
38,300
|
|
37,336
|
|
57,183
|
|
3
|
|
|
(35
|
)
|
||||||
|
Reverse mortgage revenue, net
|
86,309
|
|
60,237
|
|
75,515
|
|
43
|
|
(20
|
)
|
|||||||
|
Other revenue, net
|
23,259
|
|
28,389
|
|
70,281
|
|
(18
|
)
|
|
(60
|
)
|
||||||
|
Total revenue
|
1,123,375
|
|
1,063,045
|
|
1,194,576
|
|
6
|
|
|
(11
|
)
|
||||||
|
MSR valuation adjustments, net
|
(120,876
|
)
|
(153,457
|
)
|
(52,962
|
)
|
(21
|
)
|
190
|
|
|||||||
|
Operating expenses
|
|
|
|
|
|
||||||||||||
|
Compensation and benefits
|
313,508
|
|
298,036
|
|
358,994
|
|
5
|
|
(17
|
)
|
|||||||
|
Professional services
|
102,638
|
|
165,554
|
|
229,451
|
|
(38
|
)
|
(28
|
)
|
|||||||
|
Servicing and origination
|
109,007
|
|
131,297
|
|
141,496
|
|
(17
|
)
|
(7
|
)
|
|||||||
|
Technology and communications
|
79,166
|
|
98,241
|
|
100,490
|
|
(19
|
)
|
(2
|
)
|
|||||||
|
Occupancy and equipment
|
68,146
|
|
59,631
|
|
66,019
|
|
14
|
|
(10
|
)
|
|||||||
|
Other expenses
|
1,474
|
|
26,280
|
|
49,233
|
|
(94
|
)
|
(47
|
)
|
|||||||
|
Total operating expenses
|
673,939
|
|
779,039
|
|
945,683
|
|
(13
|
)
|
(18
|
)
|
|||||||
|
Other income (expense)
|
|
|
|
|
|
|
|
|
|
|
|||||||
|
Interest income
|
17,104
|
|
14,026
|
|
15,965
|
|
22
|
|
(12
|
)
|
|||||||
|
Interest expense
|
(114,129
|
)
|
(103,371
|
)
|
(126,927
|
)
|
10
|
|
|
(19
|
)
|
||||||
|
Pledged MSR liability expense
|
(372,089
|
)
|
(171,670
|
)
|
(236,311
|
)
|
117
|
|
(27
|
)
|
|||||||
|
Gain on repurchase of senior secured notes
|
5,099
|
|
—
|
|
—
|
|
n/m
|
|
n/m
|
|
|||||||
|
Bargain purchase gain
|
(381
|
)
|
64,036
|
|
—
|
|
(101
|
)
|
n/m
|
|
|||||||
|
Gain on sale of MSRs, net
|
453
|
|
1,325
|
|
10,537
|
|
(66
|
)
|
(87
|
)
|
|||||||
|
Other, net
|
8,892
|
|
(6,371
|
)
|
(3,168
|
)
|
(240
|
)
|
|
101
|
|
||||||
|
Total other expense, net
|
(455,051
|
)
|
(202,025
|
)
|
(339,904
|
)
|
125
|
|
|
(41
|
)
|
||||||
|
Loss from continuing operations before income taxes
|
(126,491
|
)
|
(71,476
|
)
|
(143,973
|
)
|
77
|
|
|
(50
|
)
|
||||||
|
Income tax expense (benefit)
|
15,634
|
|
529
|
|
(15,516
|
)
|
n/m
|
|
|
(103
|
)
|
||||||
|
Loss from continuing operations, net of tax
|
(142,125
|
)
|
(72,005
|
)
|
(128,457
|
)
|
97
|
|
|
(44
|
)
|
||||||
|
Income from discontinued operations, net of tax
|
—
|
|
1,409
|
|
—
|
|
(100
|
)
|
n/m
|
|
|||||||
|
Net loss
|
(142,125
|
)
|
(70,596
|
)
|
(128,457
|
)
|
101
|
|
(45
|
)
|
|||||||
|
Net loss (income) attributable to non-controlling interests
|
—
|
|
(176
|
)
|
491
|
|
(100
|
)
|
(136
|
)
|
|||||||
|
Net loss attributable to Ocwen stockholders
|
$
|
(142,125
|
)
|
$
|
(70,772
|
)
|
$
|
(127,966
|
)
|
101
|
|
(45
|
)
|
||||
|
Segment income (loss) from continuing operations before taxes:
|
|||||||||||||||||
|
Servicing
|
$
|
(70,770
|
)
|
$
|
(31,948
|
)
|
$
|
46,680
|
|
122
|
%
|
(168
|
)%
|
||||
|
Lending
|
40,733
|
|
11,154
|
|
(4,431
|
)
|
265
|
|
(352
|
)
|
|||||||
|
Corporate Items and Other
|
(96,454
|
)
|
(50,682
|
)
|
(186,222
|
)
|
90
|
|
(73
|
)
|
|||||||
|
$
|
(126,491
|
)
|
$
|
(71,476
|
)
|
$
|
(143,973
|
)
|
77
|
|
(50
|
)
|
|||||
|
n/m: not meaningful
|
|||||||||||||||||
50
Year Ended December 31, 2019 versus 2018
Ocwen reported a net loss of
$142.1 million
in 2019, largely impacted by
$65.0 million
re-engineering costs associated with the integration of PHH, a
$53.0 million
net fair value decline of MSRs due to changes in interest rates and valuation assumptions, and
$15.6 million
tax expense related to our foreign jurisdictions. While many factors impacted our performance in 2019 and 2018 as discussed below, the increase in our net loss compared to 2018 is primarily explained by the
$64.0 million
bargain purchase gain on the acquisition of PHH recorded in 2018.
Total revenue was
$1.1 billion
in 2019,
$60.3 million
or
6%
higher
than 2018, mostly due to
$38.4 million
additional
servicing revenue and
$26.1 million
additional
reverse mortgage revenue. The
$38.4 million
increase
in servicing and subservicing fees is primarily due to the
increase
in the average portfolio serviced resulting from the acquisition of PHH on October 4, 2018 with such increase being partially offset by a decline in completed modifications. Reverse mortgage revenue, net
increased
$26.1 million
, or
43%
, as compared to
2018
largely due to a
$37.2 million
favorable net change in the fair values of our HECM reverse mortgage loans and the HMBS-related borrowings due to higher UPB and interest rate changes, and the fair value election in the first quarter of 2019 for future draw commitments on HECM reverse mortgage loans purchased or originated after December 31, 2018. See Segment Results of Operations for additional information.
We reported a
$120.9 million
loss in MSR valuation adjustments, net in 2019, mostly driven by a
$215.1 million
portfolio runoff, a
$175.6 million
loss due to the decline in interest rates, partially offset by
$269.8 million
favorable assumption updates. The loss is mostly attributable to our forward MSR portfolio, with $0.3 million loss related to our reverse MSR reported in our Lending segment. MSR valuation adjustments, net in 2019
decreased
$32.6 million
, as compared to
2018
primarily due to assumption updates. See Segment Results of Operations - Servicing for additional information.
Operating expenses
decreased
$105.1 million
, or
13%
, compared to
2018
, largely due to our integration and cost reduction initiatives, with
$673.9 million
recognized in 2019 compared to
$779.0 million
in 2018. Operating expenses for 2019 include recoveries of
$43.4 million
of prior professional fees and other operating expenses from service providers and a mortgage insurer. The
$105.1 million
reduction in operating expenses in 2019 is partially offset by
$65.0 million
re-engineering costs recorded in 2019 and the recognition of PHH operating expenses starting in the fourth quarter of 2018; i.e., 2018 operating expenses did not include PHH through October 4, 2018.
Compensation and benefits expense
increased
$15.5 million
, or
5%
, as compared to
2018
primarily due to the acquisition of the PHH workforce and
$35.7 million
severance and retention costs, partially offset by a decline in expenses resulting from our efforts to re-engineer our cost structure. Despite the increase in headcount at the time of the PHH acquisition, average total headcount in 2019
declined
10%
as compared to
2018
.
Professional services expense
decreased
$62.9 million
, or
38%
, as compared to
2018
primarily due to the
$34.7 million
recovery of prior expense from service providers and a mortgage insurer and a
$16.8 million
decline
in litigation provisions. Also contributing to the decline in Professional services expense in 2019 is the
$13.7 million
expenses incurred in 2018 in connection with the acquisition of PHH.
Servicing and origination expense
decreased
$22.3 million
, or
17%
, as compared to
2018
primarily due to a
$7.4 million
reduction
in government-insured claim loss provisions in line with a decline in claims and a
$7.6 million
decrease
in provisions for non-recoverable servicing advances and receivables.
Technology and communication expense
decreased
$19.1 million
, or
19%
, as compared to
2018
primarily because we no longer license the REALServicing servicing system from Altisource following our transition to Black Knight MSP, a
$10.3 million
reduction
in depreciation expense that is largely the result of a decline in capitalized technology investments, our closure of seven U.S. facilities and the effects of our other cost reduction efforts which include bringing technology services in-house. These declines were partially offset by an increase in expenses as a result of PHH expenses.
Occupancy and equipment expense
increased
$8.5 million
, or
14%
, as compared to
2018
, due to PHH expenses and the recognition of accelerated amortization of ROU assets in connection with our decision to vacate leased properties in 2019 prior to the contractual maturity date of the lease agreements, offset in part by a decline resulting from our cost reduction efforts which include consolidating vendors and closing and consolidating certain facilities.
Other expenses
decreased
$24.8 million
, or
94%
, as compared to
2018
due to a
$15.7 million
decline
in the provision for indemnification obligations that was largely due to favorable updates to default, defect and severity assumptions relative to historical performance, a
$7.2 million
expense recovery in connection with a settlement with a mortgage insurer and a $2.5 million savings in license fees due to our legal entity reorganization.
Interest expense
increased
$10.8 million
, or
10%
, mostly due to the
$120.0 million
SSTL upsize we executed in March 2019 and the new MSR financing facilities executed in 2019.
Pledged MSR liability expense relates to the MSR sale agreements with NRZ that do not achieve sale accounting and are presented on a gross basis in our financial statements. The
$372.1 million
expense in 2019 primarily includes a
$437.7 million
51
net servicing fee remittance to NRZ partially offset by a
$95.2 million
amortization gain related to the lump-sum cash payments received from NRZ in connection with the 2017 Agreements and New RMSR Agreements in 2017 and 2018, and a
$33.8 million
fair value loss on the pledged MSR liability.
|
Years Ended December 31,
|
Change
|
||||||||||||||||||
|
Amounts in millions
|
2019
|
2018
|
2017
|
2019 vs 2018
|
2018 vs 2017
|
||||||||||||||
|
Net servicing fee remittance to NRZ (a)
|
$
|
437.7
|
|
$
|
396.7
|
|
$
|
254.2
|
|
$
|
41.0
|
|
$
|
142.5
|
|
||||
|
2017/18 lump sum amortization (gain)
|
(95.2
|
)
|
(148.9
|
)
|
(43.9
|
)
|
53.7
|
|
(105.0
|
)
|
|||||||||
|
Pledged MSR liability fair value (gain) loss (b)
|
33.8
|
|
(82.2
|
)
|
26.0
|
|
116.0
|
|
(108.2
|
)
|
|||||||||
|
Other
|
(4.2
|
)
|
6.0
|
|
—
|
|
(10.2
|
)
|
6.0
|
|
|||||||||
|
Pledged MSR liability expense
|
$
|
372.1
|
|
$
|
171.6
|
|
$
|
236.3
|
|
$
|
200.5
|
|
$
|
(64.7
|
)
|
||||
|
(a)
|
Offset by corresponding amount recorded in Servicing and subservicing fee - See below table.
|
|
(b)
|
Offset by corresponding amount recorded in MSR valuation adjustments, net - See below table.
|
The below table reflects the condensed statement of operations together with the included amounts related to the NRZ pledged MSRs that offset each other (nil impact on net income/loss). Net servicing fee remittance and pledged MSR fair value changes are presented on a gross basis and are offset by corresponding amounts presented in other statement of operations line items. In addition, because we record both our pledged MSRs and the associated pledged MSR liability at fair value, the changes in fair value of the pledged MSR liability were offset by the changes in fair value of the MSRs pledged, presented in MSR valuation adjustments, net. Accordingly, only the
$95.2 million
lump sum amortization gain and the
$4.2 million
in “Other” affect our net earnings.
|
Year Ended December 31,
|
|||||||||||||||
|
2019
|
2018
|
||||||||||||||
|
Dollars in millions
|
Statement of Operations
|
NRZ Pledged MSR-related Amounts (a)
|
Statement of Operations
|
NRZ Pledged MSR-related Amounts (a)
|
|||||||||||
|
Total revenue
|
$
|
1,123.4
|
|
$
|
437.7
|
|
$
|
1,063.0
|
|
$
|
396.7
|
|
|||
|
MSR valuation adjustments, net
|
(120.9
|
)
|
33.8
|
|
(153.5
|
)
|
(82.2
|
)
|
|||||||
|
Total operating expenses
|
673.9
|
|
—
|
|
779.0
|
|
—
|
|
|||||||
|
Total other expense, net
|
(455.1
|
)
|
(471.5
|
)
|
(202.0
|
)
|
(314.5
|
)
|
|||||||
|
Loss before income taxes
|
$
|
(126.5
|
)
|
$
|
—
|
|
$
|
(71.5
|
)
|
$
|
—
|
|
|||
|
(a)
|
Amounts included in the specific statement of operations line items.
|
See
Note 10 — Rights to MSRs
to the Consolidated Financial Statements and Segment Results of Operations - Servicing for additional information.
Other, net
increased
$15.3 million
as compared to
2018
primarily due to other income recognized in connection with call rights exercised by, or on behalf of NRZ for MSRs underlying the agreements with NRZ. See
Note 10 — Rights to MSRs
for additional information.
Although we incurred a pre-tax loss for
2019
of
$126.5 million
, we recorded income tax expense of
$15.6 million
due to the mix of earnings among different tax jurisdictions with different statutory tax rates. Our overall effective tax rates for
2019
and
2018
were
(12.4)%
and
(0.7)%
, respectively. Under our transfer pricing agreements, our operations in India and Philippines are compensated on a cost-plus basis for the services they provide, such that even when we have a consolidated pre-tax loss from operations these foreign operations have taxable income, which is subject to statutory tax rates in these jurisdictions that are significantly higher than the U.S. statutory rate of 21%. The change in income tax expense for
2019
, compared with
2018
, was primarily due to tax expense on the gain recognized in the USVI on the merger of OLS into PMC and the effects of revaluing our Indian deferred tax assets as a result of the significant corporate rate reduction enacted in India, as well as increased income tax expense as a result of recognizing income previously deferred for tax purposes related to our NRZ agreements. In addition, income tax expense related to uncertain tax positions increased by
$8.2 million
in
2019
as compared to
2018
.
52
Financial Condition Summary
|
December 31,
|
||||||||||||||
|
|
2019
|
2018
|
$ Change
|
% Change
|
||||||||||
|
Cash and cash equivalents
|
$
|
428,339
|
|
$
|
329,132
|
|
$
|
99,207
|
|
30
|
%
|
|||
|
Restricted cash
|
64,001
|
|
67,878
|
|
(3,877
|
)
|
(6
|
)
|
||||||
|
Mortgage servicing rights (MSRs), at fair value
|
1,486,395
|
|
1,457,149
|
|
29,246
|
|
2
|
|
||||||
|
Advances and match funded advances
|
1,056,523
|
|
1,186,676
|
|
(130,153
|
)
|
(11
|
)
|
||||||
|
Loans held for sale
|
275,269
|
|
242,622
|
|
32,647
|
|
13
|
|
||||||
|
Loans held for investment, at fair value
|
6,292,938
|
|
5,498,719
|
|
794,219
|
|
14
|
|
||||||
|
Other assets
|
802,734
|
|
612,040
|
|
190,694
|
|
31
|
|
||||||
|
Total assets
|
$
|
10,406,199
|
|
$
|
9,394,216
|
|
$
|
1,011,983
|
|
11
|
%
|
|||
|
Total Assets by Segment
|
||||||||||||||
|
Servicing
|
$
|
3,378,515
|
|
$
|
3,306,208
|
|
$
|
72,307
|
|
2
|
%
|
|||
|
Lending
|
6,459,367
|
|
5,603,481
|
|
855,886
|
|
15
|
|
||||||
|
Corporate Items and Other
|
568,317
|
|
484,527
|
|
83,790
|
|
17
|
|
||||||
|
$
|
10,406,199
|
|
$
|
9,394,216
|
|
$
|
1,011,983
|
|
11
|
%
|
||||
|
HMBS-related borrowings, at fair value
|
$
|
6,063,435
|
|
$
|
5,380,448
|
|
$
|
682,987
|
|
13
|
|
|||
|
Match funded liabilities (related to VIEs)
|
679,109
|
|
778,284
|
|
(99,175
|
)
|
(13
|
)
|
||||||
|
Other financing liabilities
|
972,595
|
|
1,062,090
|
|
(89,495
|
)
|
(8
|
)
|
||||||
|
SSTL and other secured borrowings, net
|
1,025,791
|
|
448,061
|
|
577,730
|
|
129
|
|
||||||
|
Senior notes, net
|
311,085
|
|
448,727
|
|
(137,642
|
)
|
(31
|
)
|
||||||
|
Other liabilities
|
942,173
|
|
721,901
|
|
220,272
|
|
31
|
|
||||||
|
Total liabilities
|
9,994,188
|
|
8,839,511
|
|
1,154,677
|
|
13
|
|
||||||
|
Total stockholders’ equity
|
412,011
|
|
554,705
|
|
(142,694
|
)
|
(26
|
)
|
||||||
|
Total liabilities and equity
|
$
|
10,406,199
|
|
$
|
9,394,216
|
|
$
|
1,011,983
|
|
11
|
%
|
|||
|
Total Liabilities by Segment
|
||||||||||||||
|
Servicing
|
$
|
2,862,063
|
|
$
|
2,437,383
|
|
$
|
424,680
|
|
17
|
%
|
|||
|
Lending
|
6,347,159
|
|
5,532,069
|
|
815,090
|
|
15
|
|
||||||
|
Corporate Items and Other
|
784,966
|
|
870,059
|
|
(85,093
|
)
|
(10
|
)
|
||||||
|
$
|
9,994,188
|
|
$
|
8,839,511
|
|
$
|
1,154,677
|
|
13
|
%
|
||||
The
increase
in our balance sheet by
$1.0 billion
between
December 31, 2019
and
December 31, 2018
is principally attributable to the continued growth of our reverse mortgage business, with
additional
$794.2 million
Loans held for investment and
$683.0 million
HMBS-related borrowings, and the
$190.3 million
increase
in the Ginnie Mae contingent loan repurchase asset offset by the corresponding liability. Our liquidity position increased at
December 31, 2019
with
$99.2 million
additional cash sourced through new MSR financing agreements, in anticipation of an SSTL pay-down in January 2020. Match funded liabilities
declined
during
2019
as a result of
lower
advances and match funded advances. Changes in the composition of our financing liabilities are principally attributable to our increased use of cost-effective asset-backed financing, with three new MSR financing agreements entered into in 2019, under which
$314.4 million
was outstanding at
December 31, 2019
and increased warehouse line utilization to finance our pipeline of unsecuritized forward and reverse loans at balance sheet date. Borrowings under our SSTL increased due to the $120.0 million term loan upsize executed during the first quarter of 2019. Senior notes
declined
due to our repayment at the maturity of the
$97.5 million
7.375% notes and our repurchases of
$39.4 million
of our 8.375% notes. Total equity
decreased
$142.7 million
during
2019
mostly as a result of our net loss.
SEGMENT RESULTS OF OPERATIONS
53
Servicing
We earn contractual monthly servicing fees pursuant to servicing agreements, which are typically payable as a percentage of UPB, as well as ancillary fees, including late fees, modification incentive fees, REO referral commissions, float earnings and Speedpay fees. We also earn fees under both subservicing and special servicing arrangements with banks and other institutions that own the MSRs. Subservicing and special servicing fees are earned either as a percentage of UPB or on a per-loan basis. Per-loan fees typically vary based on delinquency status. As of
December 31, 2019
, we serviced
1.4 million
loans with an aggregate UPB of
$212.4 billion
.
The average UPB of loans serviced during 2019
increased
by
20%
or
$39.5 billion
compared to 2018, mostly due to the acquisition of PHH in October 2018. We are actively pursuing actions to manage the size of our servicing portfolio through expanding our lending business and making MSR acquisitions based on our capital availability that are prudent and well-executed with appropriate financial return targets. We closed MSR acquisitions with
$14.6 billion
UPB during 2019. We expect to continue to focus on acquiring Agency and government-insured MSR portfolios that meet or exceed our minimum targeted investment returns. We re-entered the forward lending correspondent channel in the second quarter of 2019 to support the growth of our MSR portfolio and we continue to pursue a number of other MSR acquisition options, including driving improved recapture rates within our existing servicing portfolio.
NRZ is our largest servicing client, accounting for
56%
and
61%
of the UPB and loans in our servicing portfolio as of
December 31, 2019
, respectively. NRZ subservicing fees retained by Ocwen represented approximately
36%
and
38%
of the total servicing and subservicing fees earned by Ocwen, net of servicing fees remitted to NRZ, for
2019
and
2018
, respectively (excluding ancillary income). Consistent with a subservicing relationship, NRZ is responsible for funding the advances we service for NRZ.
In 2017 and early 2018, we renegotiated the Ocwen agreements with NRZ to more closely align with a typical subservicing arrangement whereby we receive a base servicing fee and certain ancillary fees, primarily late fees, loan modification fees and Speedpay fees. We may also receive certain incentive fees or pay penalties tied to various contractual performance metrics. We received upfront cash payments in 2018 and 2017 of
$279.6 million
and
$54.6 million
, respectively, from NRZ in connection with the resulting 2017 and New RMSR Agreements. These upfront payments generally represent the net present value of the difference between the future revenue stream Ocwen would have received under the original agreements and the future revenue Ocwen will receive under the renegotiated agreements. These upfront payments received from NRZ were deferred and are recorded within Other income (expense) as they amortize through the remaining term of the original agreements.
During 2019, we completed an assessment of the cost-to-service and the profitability of the NRZ servicing portfolio. Based on this analysis, in the fourth quarter of 2019, we estimate that operating expenses, including direct servicing expenses and overhead allocation, exceeded the net revenue retained for the NRZ servicing portfolio by approximately $10 million. As with all estimates, this estimate required the exercise of judgment, including with respect to overhead allocations, and it excludes the benefits of the lump-sum payment amortization. The estimated loss for these subservicing agreements is partially driven by the declining revenue as the loan portfolio amortizes down without a corresponding reduction to our servicing cost over time. As performing loans in the NRZ servicing portfolio have run-off, delinquencies have remained high, resulting in a relatively elevated average cost per loan. Because the NRZ portfolio contains a high percentage of delinquent accounts, it has an inherently high level of potential operational and compliance risk and requires a disproportionally high level of operating staff, oversight support infrastructure and overhead which drives the elevated average cost per loan. We actively pursue cost re-engineering initiatives to continue to reduce our cost-to-service and our corporate overhead, as well as pursue actions to grow our non-NRZ servicing portfolio to offset the losses on the NRZ sub servicing.
The following table presents subservicing fees retained by Ocwen under the NRZ agreements and the amortization gain (including fair value change) of the lump-sum payments received in connection with the 2017 Agreements and New RMSR Agreements:
54
|
Years Ended December 31,
|
|||||||||||
|
2019
|
2018
|
2017
|
|||||||||
|
Retained subservicing fees on NRZ agreements
|
$
|
139,343
|
|
$
|
142,334
|
|
$
|
295,192
|
|
||
|
Amortization gain of the lump-sum cash payments received (including fair value change) recorded as a reduction of Pledged MSR liability expense
|
95,237
|
|
148,878
|
|
43,944
|
|
|||||
|
Total retained subservicing fees and amortization gain of lump-sum payments (including fair value change)
|
$
|
234,580
|
|
$
|
291,212
|
|
$
|
339,136
|
|
||
|
Average NRZ UPB
|
$
|
125,070,332
|
|
$
|
104,773,894
|
|
$
|
110,117,808
|
|
||
|
Average retained subservicing fees as a % of NRZ UPB
|
0.11
|
%
|
0.14
|
%
|
0.27
|
%
|
|||||
Our MSR portfolio is carried at fair value. The value of our MSRs is typically correlated to changes in interest rates; as interest rates decrease, the value of the servicing portfolio typically decreases as a result of higher anticipated prepayment speeds. The sensitivity of MSR fair value to interest rates is typically higher for higher credit quality loans. Valuation is also impacted by loan delinquency rates whereby as delinquency rates decline, the value of the servicing portfolio rises.
For those MSR sale transactions with NRZ that do not achieve sale accounting treatment, we present gross the pledged MSR as an asset and the corresponding liability amount pledged MSR liability on our balance sheet. Similarly, we present the total servicing fees and the fair value changes related to the MSR sale transactions with NRZ within Servicing and subservicing fees, net and MSR valuation adjustment, net. Net servicing fee remittance to NRZ and the fair value changes of the pledged MSR liability are separately presented within Pledged MSR liability expense and are offset by the two corresponding amounts presented in other statement of operations line items. We record both our pledged MSRs and the associated MSR liability at fair value, the changes in fair value of the pledged MSR liability were offset by the changes in fair value of the associated MSRs pledged, presented in MSR valuation adjustments, net.
Loan Resolutions
We have a strong track record of success as a leader in the servicing industry in foreclosure prevention and loss mitigation that helps homeowners stay in their homes and improves financial outcomes for mortgage loan investors. Reducing delinquencies also enables us to recover advances and recognize additional ancillary income, such as late fees, which we do not recognize on delinquent loans until they are brought current. Loan resolution activities address the pipeline of delinquent loans and generally lead to (i) modification of the loan terms, (ii) repayment plan alternatives, (iii) a discounted payoff of the loan (e.g., a “short sale”), or (iv) foreclosure or deed-in-lieu-of-foreclosure and sale of the resulting REO. Loan modifications must be made in accordance with the applicable servicing agreement as such agreements may require approvals or impose restrictions upon, or even forbid, loan modifications. To select an appropriate loan modification option for a borrower, we perform a structured analysis, using a proprietary model, of all options using information provided by the borrower as well as external data, including recent broker price opinions to value the mortgaged property. Our proprietary model includes, among other things, an assessment of re-default risk.
Our future financial performance will be less impacted by loan resolutions because, under our NRZ agreements, NRZ receives all deferred servicing fees. Deferred servicing fees related to delinquent borrower payments were
$200.5 million
at
December 31, 2019
, of which
$162.1 million
were attributable to NRZ agreements.
Advance Obligation
As a servicer, we are generally obligated to advance funds in the event borrowers are delinquent on their monthly mortgage related payments. We advance principal and interest (P&I Advances), taxes and insurance (T&I Advances) and legal fees, property valuation fees, property inspection fees, maintenance costs and preservation costs on properties that have been foreclosed (Corporate Advances). For loans in non-Agency securitization trusts, if we determine that our P&I Advances cannot be recovered from the projected future cash flows, we generally have the right to cease making P&I Advances, declare advances, where permitted including T&I and Corporate advances, in excess of net proceeds to be non-recoverable and, in most cases, immediately recover any such excess advances from the general collection accounts of the respective trust. With T&I and Corporate Advances, we continue to advance if net future cash flows exceed projected future advances without regard to advances already made.
Most of our advances have the highest reimbursement priority (i.e., they are “top of the waterfall”) so that we are entitled to repayment from respective loan or REO liquidation proceeds before any interest or principal is paid on the bonds that were issued by the trust. In the majority of cases, advances in excess of respective loan or REO liquidation proceeds may be recovered from pool-level proceeds. The costs incurred in meeting these obligations consist principally of the interest expense incurred in financing the servicing advances. Most, but not all, subservicing agreements, including our agreements with NRZ, provide for more rapid reimbursement of any advances from the owner of the servicing rights.
55
Significant Variables
Aggregate UPB and Loan Count
. Servicing fees are generally expressed as a percentage of UPB and subservicing fees are generally expressed as a percentage of UPB or earned on a per-loan basis. Aggregate UPB and loan count decline as a result of portfolio run-off and increase to the extent we retain MSRs from new originations or engage in MSR acquisitions, to the extent permitted.
Operating Efficiency
. Our operating results are heavily dependent on our ability to scale our operations to cost-effectively and efficiently perform servicing activities in accordance with our servicing agreements. To the extent we are unable to process a high volume of transactions consistently and systematically, the cost of our servicing activities increases and has a negative impact on our operating results. To the extent we are unable to complete servicing activities in accordance with the requirements of our servicing agreements, we may incur additional costs or fail to recover otherwise reimbursable costs and advances.
Delinquencies
. Delinquencies impact our results of operations and operating cash flows. Non-performing loans are more expensive to service because the loss mitigation activities that we must undertake to keep borrowers in their homes or to foreclose, if necessary, are costlier than the activities required to service a performing loan. These loss mitigation activities include increased contact with the borrower for collection and the development of forbearance plans or loan modifications by highly skilled associates who command higher compensation as well as the higher compliance costs associated with these, and similar, activities. While the higher cost is somewhat offset by ancillary fees, for severely delinquent loans or loans that enter the foreclosure process the incremental revenue opportunities are generally not sufficient to cover our increased costs.
In addition, when borrowers are delinquent, the amount of funds that we are required to advance to the investors increases. We incur significant costs to finance those advances. We utilize servicing advance financing facilities, which are asset-backed (i.e., match funded liabilities) securitization facilities, to finance a portion of our advances. As a result, increased delinquencies result in increased interest expense.
Prepayment Speed
. The rate at which portfolio UPB declines can have a significant impact on our business. Items reducing UPB include normal principal payments (runoff), refinancing, loan modifications involving forgiveness of principal, voluntary property sales and involuntary property sales such as foreclosures. Prepayment speed impacts future servicing fees, amortization and valuation of MSRs, float earnings on float balances and interest expense on advances. Increases in anticipated lifetime prepayment speeds generally cause MSR valuation adjustments to increase because MSRs are valued based on total expected servicing income over the life of a portfolio. The converse is true when expectations for prepayment speeds decrease.
56
The following table presents selected results of operations of our Servicing segment. The amounts presented are before the elimination of balances and transactions with our other segments:
|
Years Ended December 31,
|
% Change
|
||||||||||||||||
|
2019
|
2018
|
2017
|
2019 vs. 2018
|
2018 vs. 2017
|
|||||||||||||
|
Revenue
|
|||||||||||||||||
|
Servicing and subservicing fees:
|
|||||||||||||||||
|
Residential
|
$
|
969,700
|
|
$
|
929,969
|
|
$
|
982,929
|
|
4
|
%
|
(5
|
)%
|
||||
|
Commercial
|
3,847
|
|
5,548
|
|
7,700
|
|
(31
|
)
|
(28
|
)
|
|||||||
|
973,547
|
|
935,517
|
|
990,629
|
|
4
|
|
(6
|
)
|
||||||||
|
Gain on loans held for sale, net
|
6,110
|
|
8,435
|
|
11,458
|
|
(28
|
)
|
(26
|
)
|
|||||||
|
Other revenue, net
|
5,445
|
|
7,272
|
|
39,203
|
|
(25
|
)
|
(81
|
)
|
|||||||
|
Total revenue
|
985,102
|
|
951,224
|
|
1,041,290
|
|
4
|
|
(9
|
)
|
|||||||
|
MSR valuation adjustments, net
|
(120,646
|
)
|
(152,983
|
)
|
(52,689
|
)
|
(21
|
)
|
190
|
|
|||||||
|
Operating expenses
|
|||||||||||||||||
|
Compensation and benefits
|
142,674
|
|
145,574
|
|
160,514
|
|
(2
|
)
|
(9
|
)
|
|||||||
|
Servicing and origination
|
91,096
|
|
114,597
|
|
119,569
|
|
(21
|
)
|
(4
|
)
|
|||||||
|
Professional services
|
42,126
|
|
53,643
|
|
66,523
|
|
(21
|
)
|
(19
|
)
|
|||||||
|
Occupancy and equipment
|
44,339
|
|
42,511
|
|
47,419
|
|
4
|
|
(10
|
)
|
|||||||
|
Technology and communications
|
32,607
|
|
45,535
|
|
46,238
|
|
(28
|
)
|
(2
|
)
|
|||||||
|
Corporate overhead allocations
|
197,880
|
|
211,701
|
|
221,049
|
|
(7
|
)
|
(4
|
)
|
|||||||
|
Other expenses
|
(14,569
|
)
|
5,923
|
|
2,383
|
|
(346
|
)
|
149
|
|
|||||||
|
Total operating expenses
|
536,153
|
|
619,484
|
|
663,695
|
|
(13
|
)
|
(7
|
)
|
|||||||
|
Other income (expense)
|
|||||||||||||||||
|
Interest income
|
8,051
|
|
5,383
|
|
783
|
|
50
|
|
587
|
|
|||||||
|
Interest expense
|
(47,347
|
)
|
(41,830
|
)
|
(57,284
|
)
|
13
|
|
(27
|
)
|
|||||||
|
Pledged MSR liability expense
|
(372,172
|
)
|
(172,342
|
)
|
(236,311
|
)
|
116
|
|
(27
|
)
|
|||||||
|
Gain on sale of MSRs, net
|
453
|
|
1,325
|
|
10,537
|
|
(66
|
)
|
(87
|
)
|
|||||||
|
Other, net
|
11,942
|
|
(3,241
|
)
|
4,049
|
|
(468
|
)
|
(180
|
)
|
|||||||
|
Total other expense, net
|
(399,073
|
)
|
(210,705
|
)
|
(278,226
|
)
|
89
|
|
(24
|
)
|
|||||||
|
Loss (income) from continuing operations before income taxes
|
$
|
(70,770
|
)
|
$
|
(31,948
|
)
|
$
|
46,680
|
|
122
|
|
(168
|
)
|
||||
57
The following table provides selected operating statistics for our Servicing segment:
|
% Change
|
|||||||||||||||||
|
2019
|
2018
|
2017
|
2019 vs. 2018
|
2018 vs. 2017
|
|||||||||||||
|
Residential Assets Serviced at December 31
|
|||||||||||||||||
|
Unpaid principal balance (UPB) in billions:
|
|||||||||||||||||
|
Performing loans (1)
|
$
|
198.90
|
|
$
|
243.39
|
|
$
|
162.72
|
|
(18
|
)%
|
50
|
%
|
||||
|
Non-performing loans
|
11.22
|
|
10.38
|
|
13.47
|
|
8
|
|
(23
|
)
|
|||||||
|
Non-performing real estate
|
2.25
|
|
2.23
|
|
3.16
|
|
1
|
|
(29
|
)
|
|||||||
|
Total
|
$
|
212.37
|
|
$
|
256.00
|
|
$
|
179.35
|
|
(17
|
)
|
43
|
|
||||
|
Conventional loans (2)
|
$
|
95.31
|
|
$
|
127.05
|
|
$
|
49.33
|
|
(25
|
)%
|
|
158
|
%
|
|||
|
Government-insured loans
|
30.09
|
|
27.65
|
|
21.26
|
|
9
|
|
30
|
|
|||||||
|
Non-Agency loans
|
86.97
|
|
101.30
|
|
108.76
|
|
(14
|
)
|
|
(7
|
)
|
||||||
|
Total
|
$
|
212.37
|
|
$
|
256.00
|
|
$
|
179.35
|
|
(17
|
)
|
|
43
|
|
|||
|
|
|
|
|
|
|
||||||||||||
|
Percent of total UPB:
|
|||||||||||||||||
|
Servicing portfolio
|
36
|
%
|
28
|
%
|
42
|
%
|
28
|
%
|
(33
|
)%
|
|||||||
|
Subservicing portfolio
|
8
|
|
21
|
|
1
|
|
(61
|
)
|
n/m
|
|
|||||||
|
NRZ (3)
|
56
|
|
51
|
|
57
|
|
10
|
|
(10
|
)
|
|||||||
|
Non-performing residential assets serviced
|
6
|
|
5
|
|
9
|
|
29
|
|
(47
|
)
|
|||||||
|
Number:
|
|||||||||||||||||
|
Performing loans (1)
|
1,344,925
|
|
1,498,960
|
|
1,137,012
|
|
(10
|
)%
|
32
|
%
|
|||||||
|
Non-performing loans
|
60,735
|
|
52,291
|
|
69,135
|
|
16
|
|
(24
|
)
|
|||||||
|
Non-performing real estate
|
14,283
|
|
10,987
|
|
15,548
|
|
30
|
|
(29
|
)
|
|||||||
|
Total
|
1,419,943
|
|
1,562,238
|
|
1,221,695
|
|
(9
|
)
|
28
|
|
|||||||
|
Conventional loans (2)
|
607,854
|
|
677,927
|
|
298,564
|
|
(10
|
)%
|
|
127
|
%
|
||||||
|
Government-insured loans
|
185,138
|
|
182,595
|
|
156,090
|
|
1
|
|
17
|
|
|||||||
|
Non-Agency loans
|
626,951
|
|
701,716
|
|
767,041
|
|
(11
|
)
|
(9
|
)
|
|||||||
|
Total
|
1,419,943
|
|
1,562,238
|
|
1,221,695
|
|
(9
|
)
|
28
|
|
|||||||
|
Percent of total number:
|
|||||||||||||||||
|
Servicing portfolio
|
34
|
%
|
29
|
%
|
39
|
%
|
17
|
%
|
(26
|
)%
|
|||||||
|
Subservicing portfolio
|
5
|
|
10
|
|
2
|
|
(45
|
)
|
485
|
|
|||||||
|
NRZ (3)
|
61
|
|
61
|
|
59
|
|
—
|
|
4
|
|
|||||||
|
Non-performing residential assets serviced
|
5
|
|
4
|
|
7
|
|
30
|
|
(42
|
)
|
|||||||
|
n/m: not meaningful
|
|||||||||||||||||
58
|
% Change
|
|||||||||||||||||
|
2019
|
2018
|
2017
|
2019 vs. 2018
|
2018 vs. 2017
|
|||||||||||||
|
Residential Assets Serviced for the Years Ended December 31
|
|||||||||||||||||
|
Average UPB (in billions)
|
|||||||||||||||||
|
Servicing portfolio
|
$
|
76.14
|
|
$
|
72.28
|
|
$
|
80.93
|
|
5
|
%
|
(11
|
)%
|
||||
|
Subservicing portfolio
|
31.23
|
|
15.93
|
|
3.83
|
|
96
|
|
316
|
|
|||||||
|
NRZ (3)
|
125.07
|
|
104.77
|
|
110.12
|
|
19
|
|
(5
|
)
|
|||||||
|
|
$
|
232.44
|
|
$
|
192.98
|
|
$
|
194.88
|
|
20
|
|
|
(1
|
)
|
|||
|
Prepayment speed (average CPR)
|
15
|
%
|
13
|
%
|
15
|
%
|
15
|
%
|
(13
|
)%
|
|||||||
|
% Voluntary
|
93
|
|
82
|
|
81
|
|
13
|
|
1
|
|
|||||||
|
% Involuntary
|
7
|
|
18
|
|
21
|
|
(61
|
)
|
(14
|
)
|
|||||||
|
% CPR due to principal modification
|
1
|
|
1
|
|
1
|
|
—
|
|
—
|
|
|||||||
|
Average number
|
|
|
|
|
|||||||||||||
|
Servicing portfolio
|
471,808
|
|
463,529
|
|
516,736
|
|
2
|
%
|
(10
|
)%
|
|||||||
|
Subservicing portfolio
|
106,203
|
|
53,043
|
|
28,794
|
|
100
|
|
84
|
|
|||||||
|
NRZ (3)
|
913,249
|
|
748,440
|
|
765,048
|
|
22
|
|
(2
|
)
|
|||||||
|
1,491,260
|
|
1,265,012
|
|
1,310,578
|
|
18
|
|
(3
|
)
|
||||||||
|
Residential Servicing and Subservicing Fees for the Years Ended December 31
|
|||||||||||||||||
|
Loan servicing and subservicing fees
|
|||||||||||||||||
|
Servicing
|
$
|
224,846
|
|
$
|
224,176
|
|
$
|
254,907
|
|
—
|
%
|
(12
|
)%
|
||||
|
Subservicing
|
15,434
|
|
8,904
|
|
7,690
|
|
73
|
|
16
|
|
|||||||
|
NRZ
|
577,015
|
|
539,039
|
|
549,411
|
|
7
|
|
(2
|
)
|
|||||||
|
817,295
|
|
772,119
|
|
812,008
|
|
6
|
|
(5
|
)
|
||||||||
|
Late charges
|
56,876
|
|
61,125
|
|
61,455
|
|
(7
|
)
|
(1
|
)
|
|||||||
|
Custodial accounts (float earnings)
|
47,435
|
|
40,274
|
|
24,973
|
|
18
|
|
61
|
|
|||||||
|
Loan collection fees
|
15,433
|
|
18,353
|
|
22,733
|
|
(16
|
)
|
(19
|
)
|
|||||||
|
HAMP fees
|
5,538
|
|
14,312
|
|
43,274
|
|
(61
|
)
|
(67
|
)
|
|||||||
|
Other
|
27,123
|
|
23,786
|
|
18,486
|
|
14
|
|
29
|
|
|||||||
|
$
|
969,700
|
|
$
|
929,969
|
|
$
|
982,929
|
|
4
|
|
(5
|
)
|
|||||
|
Number of Completed Modifications
|
|||||||||||||||||
|
HAMP
|
503
|
|
1,288
|
|
12,726
|
|
(61
|
)%
|
(90
|
)%
|
|||||||
|
Non-HAMP
|
25,251
|
|
38,257
|
|
32,956
|
|
(34
|
)
|
16
|
|
|||||||
|
Total
|
25,754
|
|
39,545
|
|
45,682
|
|
(35
|
)
|
(13
|
)
|
|||||||
59
|
% Change
|
|||||||||||||||||
|
2019
|
2018
|
2017
|
2019 vs. 2018
|
2018 vs. 2017
|
|||||||||||||
|
Financing Costs
|
|||||||||||||||||
|
Average balance of advances and match funded advances
|
$
|
1,059,607
|
|
$
|
1,214,436
|
|
$
|
1,502,530
|
|
(13
|
)%
|
(19
|
)%
|
||||
|
Average borrowings
|
|
|
|
|
|||||||||||||
|
Match funded liabilities
|
671,824
|
|
736,974
|
|
1,048,944
|
|
(9
|
)
|
(30
|
)
|
|||||||
|
Financing liabilities (4)
|
—
|
|
12,649
|
|
15,976
|
|
(100
|
)
|
(21
|
)
|
|||||||
|
Other secured borrowings
|
395,183
|
|
74,555
|
|
98,023
|
|
430
|
|
(24
|
)
|
|||||||
|
Interest expense on borrowings
|
|
|
|
|
|||||||||||||
|
Match funded liabilities
|
26,902
|
|
30,706
|
|
45,379
|
|
(12
|
)
|
(32
|
)
|
|||||||
|
Financing liabilities
|
—
|
|
66
|
|
634
|
|
(100
|
)
|
(90
|
)
|
|||||||
|
Other secured borrowings
|
11,321
|
|
6,320
|
|
7,515
|
|
79
|
|
(16
|
)
|
|||||||
|
Effective average interest rate
|
|
|
|
|
|||||||||||||
|
Match funded liabilities
|
4.00
|
%
|
4.17
|
%
|
4.33
|
%
|
(4
|
)
|
(4
|
)
|
|||||||
|
Financing liabilities
|
—
|
|
0.52
|
|
3.97
|
|
(100
|
)
|
(87
|
)
|
|||||||
|
Other secured borrowings
|
2.86
|
|
8.48
|
|
7.67
|
|
(66
|
)
|
11
|
|
|||||||
|
Facility costs included in interest expense
|
$
|
8,793
|
|
$
|
5,242
|
|
$
|
7,450
|
|
68
|
|
(30
|
)
|
||||
|
Average 1-month LIBOR
|
1.75
|
%
|
2.45
|
%
|
1.08
|
%
|
(29
|
)
|
127
|
|
|||||||
|
Average Employment
|
|||||||||||||||||
|
India and other
|
3,360
|
|
4,097
|
|
5,090
|
|
(18
|
)%
|
(20
|
)%
|
|||||||
|
U. S.
|
1,158
|
|
1,128
|
|
1,187
|
|
3
|
|
(5
|
)
|
|||||||
|
Total
|
4,518
|
|
5,225
|
|
6,277
|
|
(14
|
)
|
(17
|
)
|
|||||||
|
(1)
|
Performing loans include those loans that are less than 90 days past due and those loans for which borrowers are making scheduled payments under loan modification, forbearance or bankruptcy plans. We consider all other loans to be non-performing.
|
|
(2)
|
Conventional loans at
December 31, 2019
include
111,246
prime loans with a UPB of
$20.4 billion
which we service or subservice. This compares to
115,299
prime loans with a UPB of
$19.6 billion
at
December 31, 2018
. Prime loans are generally good credit quality loans that meet GSE underwriting standards.
|
|
(3)
|
Loans serviced or subserviced pursuant to our agreements with NRZ.
|
|
(4)
|
Excludes the financing liability that we recognized in connection with the sales of Rights to MSRs to NRZ.
|
The following table provides information regarding the changes in our portfolio of residential assets serviced for the years ended December 31:
|
|
Amount of UPB
(in billions)
|
Count
|
||||||||||||||||||
|
|
2019
|
2018
|
2017
|
2019
|
2018
|
2017
|
||||||||||||||
|
Portfolio at beginning of year
|
$
|
256.00
|
|
$
|
179.35
|
|
$
|
209.09
|
|
1,562,238
|
|
1,221,695
|
|
1,393,766
|
|
|||||
|
Acquisition of PHH
|
—
|
|
119.34
|
|
—
|
|
—
|
|
537,225
|
|
—
|
|
||||||||
|
Other portfolio additions(1)
|
26.09
|
|
9.41
|
|
4.03
|
|
100,557
|
|
41,035
|
|
18,974
|
|
||||||||
|
26.09
|
|
128.75
|
|
4.03
|
|
100,557
|
|
578,260
|
|
18,974
|
|
|||||||||
|
Sales
|
(1.15
|
)
|
(0.59
|
)
|
(0.22
|
)
|
(8,256
|
)
|
(3,343
|
)
|
(979
|
)
|
||||||||
|
Servicing transfers (2)
|
(30.31
|
)
|
(23.01
|
)
|
(2.50
|
)
|
(48,548
|
)
|
(73,934
|
)
|
(12,617
|
)
|
||||||||
|
Runoff
|
(38.27
|
)
|
(28.50
|
)
|
(31.05
|
)
|
(186,048
|
)
|
(160,440
|
)
|
(177,449
|
)
|
||||||||
|
Portfolio at end of year
|
$
|
212.36
|
|
$
|
256.00
|
|
$
|
179.35
|
|
1,419,943
|
|
1,562,238
|
|
1,221,695
|
|
|||||
|
(1)
|
Additions in 2019 include purchased MSRs on portfolios consisting of
12,515
loans with a UPB of
$2.7 billion
that have not yet transferred to the Black Knight MSP servicing system. These loans are scheduled to transfer onto Black Knight MSP by April 1, 2020.
|
60
Because we have legal title to the MSRs, the UPB and count of the loans are included in our reported servicing portfolio. The seller continues to subservice the loans on an interim basis between the transaction closing date and the servicing transfer date.
|
(2)
|
Servicing transfers in 2019 include the termination of a subservicing client relationship consisting of 33,626 loans with a UPB of $21.4 billion. For 2019, total servicing fee revenue for this client was $1.3 million which was earned through May 31, 2019 when the loans were released.
|
Year Ended December 31, 2019 versus 2018
The key drivers of our servicing segment operating results for
2019
, as compared to
2018
, are the PHH acquisition and related integration, MSR fair value changes and the effects of cost improvements achieved in aligning our servicing operations more appropriately to the size of our servicing portfolio. Until the Black Knight MSP conversion was completed in June 2019, we were maintaining the infrastructure and related costs of two servicing platforms, including certain corporate functions.
Servicing and subservicing fee revenue
increased
$39.7 million
, or
4%
, due to the increase in the average portfolio resulting from the acquisition of PHH on October 4, 2018 and the acquisitions of MSRs during 2019, offset in part by portfolio runoff and a
decline
in completed modifications. Revenue recognized in connection with loan modifications, including servicing fees, late charges and HAMP fees,
declined
35%
to
$38.5 million
during
2019
as compared to
$59.4 million
in
2018
. Total completed loan modifications
decreased
35%
as compared to
2018
due primarily to the expiration of government sponsored modification programs and fewer available modification opportunities in our servicing portfolio.
We reported a
$120.6 million
loss in MSR valuation adjustments, net in
2019
. This
decline
in MSR fair value is mostly driven by a
$215.1 million
portfolio runoff, a
$175.6 million
loss due to the decline in interest rates, partially offset by
$269.8 million
favorable assumption updates. The assumption fair value gains related mostly to our non-Agency MSR portfolio due to continued improved collateral performance confirmed by market trade activity. The fair value loss reported in MSR valuation adjustments, net,
decreased
$32.3 million
in 2019 as compared to
2018
, primarily due to an $88.1 million favorable valuation adjustment associated with the non-Agency assumption update partially offset by the interest rate impact, with an 81 basis-point decline in the 10-year swap rate in
2019
, as compared to the 25 basis-point increase in
2018
. In addition, we recognized in 2019 an additional $56.0 million loss due to higher runoff, mostly due to the MSRs added from the PHH acquisition.
The
$120.6 million
loss reported in MSR valuation adjustments, net is partially offset by a gain reported on the pledged MSR liability.
$915.1 million
of our MSRs at
December 31, 2019
have been sold under different agreements that did not qualify for sale accounting treatment and, therefore are reported as MSR assets, pledged at fair value together with an associated liability for the MSR failed-sale secured borrowing at fair value. Because both pledged MSRs and the associated MSR liability are measured at fair value, changes in fair value offset each other, although they are separately presented in our statement of operations, as MSR valuation adjustments, net and Pledged MSR liability expense, respectively. The following table summarizes the fair value change impact on our statement of operations of our total MSRs and the MSRs liability associated with the NRZ failed-sale accounting treatment during
2019
:
|
In millions - 2019
|
Total Change in Fair Value
|
Runoff
|
Interest Rate Change
|
Assumption Updates
|
|||||||||||
|
MSR valuation adjustments, net (1)
|
$
|
(120.9
|
)
|
(215.1
|
)
|
(175.6
|
)
|
$
|
269.8
|
|
|||||
|
Pledged MSR liability expense - Fair value changes (2)
|
(33.8
|
)
|
113.4
|
|
86.3
|
|
(233.5
|
)
|
|||||||
|
Total
|
$
|
(154.7
|
)
|
$
|
(101.7
|
)
|
$
|
(89.3
|
)
|
$
|
36.3
|
|
|||
|
(1)
|
Includes $0.3 million recognized in the Lending segment.
|
|
(2)
|
Includes changes in fair value, including runoff and settlement, of the NRZ related MSR liability under the Original Rights to MSRs Agreements and PMC MSR Agreements. See
Note 10 — Rights to MSRs
for further information.
|
As described in the table above, Ocwen’s MSR portfolio net of the pledged MSR liability incurred a fair value loss due to interest rates of
$89.3 million
in 2019, that was partially offset by a
$36.3 million
fair value gain due to assumption updates.
Operating expenses
decreased
$83.3 million
, or
13%
, compared to
2018
largely due to our integration and cost reduction initiatives, as discussed below.
Compensation and benefits expense
declined
$2.9 million
, or
2%
as compared to
2018
due to our efforts to re-engineer our cost structure and align headcount in our servicing operations with the size of our servicing portfolio. Our average servicing headcount
declined
14%
compared to
2018
, despite the PHH headcount added on October 4, 2018.
Servicing and origination expense
declined
$23.5 million
, or
21%
, as compared to
2018
primarily due to an
$8.7 million
decrease
in government-insured claim loss provisions on reinstated or modified loans in line with a decline in the volume of claims and a
$7.6 million
decrease
in provisions for non-recoverable servicing advances and receivables. Government-insured claim loss provisions are generally offset by changes in the fair value of the corresponding MSRs, which are recorded in MSR valuation adjustments, net.
61
Professional services expense
declined
$11.5 million
, or
21%
, as compared to
2018
primarily due to a decline in legal fees and settlements, including a
$5.1 million
decline
in litigation provisions, partially offset by incremental professional services expense associated with the integration of PHH business.
Technology and communication expense
declined
$12.9 million
, or
28%
, as compared to
2018
primarily because we no longer license the REALServicing servicing system from Altisource following our transition to Black Knight MSP.
Corporate overhead allocations
declined
$13.8 million
, as compared to
2018
, primarily due to lower legal fees and technology expenses.
Other expenses
decreased
$20.5 million
as compared to
2018
primarily as a result of a
$17.8 million
decline
in the provision for indemnification obligations that was largely a result of the reversal of a portion of the liability for representation and warranty obligations related to favorable updates to default, defect and severity assumptions relative to historical performance. In addition, Other expenses for 2019 includes a
$7.2 million
expense recovery in connection with a settlement with a mortgage insurer.
Interest expense
increased
by
$5.5 million
, or
13%
, compared to
2018
primarily due to a $5.0 million of interest expense on the new Agency MSR financing facility entered into on July 1, 2019.
Pledged MSR liability expense was
$372.1 million
for 2019 and included
$437.7 million
net servicing fee remittance to NRZ, a
$33.8 million
fair value loss on the MSR secured financing liability, partially offset by a
$95.2 million
amortization. The fair value loss on the MSR liability comprised a
$233.5 million
loss due to assumption updates, mostly related to non-Agency MSRs, partially offset by an
$86.3 million
gain
due to interest rate decline (as rates decline the value of the MSR asset and the offsetting MSR liability decreases resulting in a gain on the liability) and
$113.4 million
gain
due to runoff. Pledged MSR liability expense
increased
$200.4 million
in 2019 as compared to
2018
, largely due to
$115.9 million
unfavorable pledged MSR fair value adjustments,
$53.7 million
lower
2017/18 lump sum amortization gain and
$41.0 million
additional net servicing fee remittance to NRZ. This unfavorable pledged MSR liability fair value adjustment results, among other factors, from an update to our non-Agency MSR fair value assumptions associated with improved collateral performance and market trade activity. We recognized a
lower
2017/18 lump sum amortization gain in 2019 mostly due to a lower underlying collateral balance, i.e., portfolio runoff. Additional servicing fees were remitted to NRZ in 2019 due to the PHH acquisition as similar arrangements applied to the MSR transactions between PHH and NRZ. The following table provides information regarding the Pledged MSR liability expense:
|
Years Ended December 31,
|
||||||||||||
|
In millions
|
2019
|
2018
|
2017
|
|||||||||
|
Net servicing fee remitted to NRZ (a)
|
$
|
437.7
|
|
$
|
396.7
|
|
$
|
254.2
|
|
|||
|
2017/18 lump sum amortization (gain)
|
(95.2
|
)
|
(148.9
|
)
|
(43.9
|
)
|
||||||
|
Other
|
(4.2
|
)
|
6.7
|
|
—
|
|
||||||
|
338.3
|
|
254.5
|
|
210.3
|
|
|||||||
|
Change in fair value (b)
|
||||||||||||
|
Runoff
|
(113.4
|
)
|
(77.3
|
)
|
(57.3
|
)
|
||||||
|
Rate and assumption change
|
147.1
|
|
(4.9
|
)
|
83.3
|
|
||||||
|
33.8
|
|
(82.2
|
)
|
26.0
|
|
|||||||
|
Pledged MSR liability expense
|
$
|
372.1
|
|
$
|
172.3
|
|
$
|
236.3
|
|
|||
(a) Offset by corresponding amount recorded in Servicing and subservicing fee
(b) Offset by corresponding amount recorded in MSR valuation adjustments, net
Pledged MSR liability expense relates to the MSR sale agreements with NRZ that do not achieve sale accounting and are presented on a gross basis in our Consolidated Financial Statements. See the Overview section above, Year ended December 31, 2019 versus 2018 and
Note 10 — Rights to MSRs
to the Consolidated Financial Statements for further detail. As described, the lump sum amortization gain and other affect our net earnings while the other changes are offset by corresponding amounts in other statement of operations line items.
Other, net
increased
$15.2 million
as compared to
2018
primarily due to other income recognized in connection with call rights exercised by NRZ, or by Ocwen at NRZ’s direction, for MSRs underlying the agreements with NRZ. Ocwen derecognizes the MSRs and the related financing liability upon collapse of the securitization. See
Note 10 — Rights to MSRs
for additional information.
62
Lending
We originate and purchase conventional and government-insured forward mortgage loans through our forward lending operations. During 2018 and the first half of 2019, our forward lending efforts were principally focused on targeting existing Ocwen customers by offering them competitive mortgage refinance opportunities (i.e., portfolio recapture), where permitted by the governing servicing and pooling agreement. In doing so, we generate revenues for our forward lending business and protect the servicing portfolio by retaining these customers. We re-entered the forward lending correspondent channel in the second quarter of 2019 to drive higher servicing portfolio replenishment.
A portion of our servicing portfolio is susceptible to refinance activity during periods of declining interest rates. Our lending activity partially mitigates this risk. Origination volume and related gains are a natural economic hedge, to a certain degree, to the impact of declining MSR values as interest rates decline. Under the terms of our agreements with NRZ, to the extent we refinanced a loan underlying the MSRs subject to these agreements, we were obligated to transfer such recaptured MSR to NRZ under the terms of a separate subservicing agreement. Effective June 1, 2019, we no longer perform any portfolio recapture on behalf of NRZ.
We originate and purchase reverse mortgages through our reverse lending operations under the guidelines of the HECM reverse mortgage insurance program of HUD. Loans originated under this program are generally guaranteed by the FHA, which provides investors with protection against risk of borrower default. In the second half of 2019, we started originating proprietary reverse mortgage loans that are not FHA-guarantee eligible and are sold servicing-released to third parties. The financial statement impact of these non-HECM loans was negligible in 2019. We retain the servicing rights to reverse HECM loans securitized through the Ginnie Mae HMBS program. We have originated HECM loans under which the borrowers have additional borrowing capacity of
$1.5 billion
at
December 31, 2019
. These draws are funded by the servicer and can be subsequently securitized or sold (Future Value). We do not incur any substantive underwriting, marketing or compensation costs in connection with any future draws, although we must maintain sufficient capital resources and available borrowing capacity to ensure that we are able to fund these future draws. At
December 31, 2019
, the Future Value related to future draw commitments that is not recognized in our financial statements as part of the fair value of the loan portfolio is estimated to be
$47.0 million
(versus $68.1 million at December 31, 2018) and will be recognized as a one-time adjustment to shareholders equity on January 1, 2020, as we elected to measure future draw commitments at fair value in conjunction with the application of the new credit loss accounting standard. See
Note 1 — Organization, Business Environment, Basis of Presentation and Significant Accounting Policies
to the Consolidated Financial Statements for additional information.
In
2019
, our Lending business originated or purchased forward and reverse mortgage loans with a UPB of
$1.2 billion
and
$729.4 million
, respectively. Loans are originated or acquired through three primary channels: correspondent lender relationships, broker relationships (wholesale) and directly with mortgage customers (retail). Loan margins vary by channel, with correspondent typically being the lowest margin and retail the highest.
After origination, we package and sell the loans in the secondary mortgage market, through GSE and Ginnie Mae securitizations on a servicing retained basis and through whole loan transactions on a servicing released basis. Lending revenues mostly include interest income earned for the period the loans are held by us, gain on sale revenue, which represents the difference between the origination value and the sale value of the loan including its MSR value, and fee income earned at origination. As the securitizations of reverse mortgage loans do not achieve sale accounting treatment, reverse mortgage revenues include the fair value changes of the loan from lock date net of the fair value changes of the MBS-related borrowings.
We provide customary origination representations and warranties to investors in connection with our loan sales and securitization activities. We receive customary origination representations and warranties from our network of approved correspondent lenders. We recognize the fair value of the liability for our representations and warranties at the time of sale. In the event we cannot remedy a breach of a representation or warranty, we may be required to repurchase the loan or provide an indemnification payment to the mortgage loan investor. To the extent that we have recourse against a third-party originator, we may recover part or all of any loss we incur.
As an HMBS issuer, we assume certain obligations related to each security issued. The most significant obligation is the requirement to purchase loans out of the Ginnie Mae securitization pools once the outstanding principal balance of the related HECM is equal to or greater than 98% of the maximum claim amount (MCA repurchases). Active repurchased loans are assigned to HUD and payment is received from HUD, typically within 60 days of repurchase. HUD reimburses us for the outstanding principal balance on the loan up to the maximum claim amount. We bear the risk of exposure if the amount of the outstanding principal balance on a loan exceeds the maximum claim amount. Inactive repurchased loans (the borrower is deceased, no longer occupies the property or is delinquent on tax and insurance payments) are generally liquidated through foreclosure and subsequent sale of real estate owned. State specific foreclosure and REO liquidation timelines have a significant impact on the timing and amount of our recovery. If we are unable to sell the property underlying an inactive reverse loan for an acceptable price within the timeframe established by HUD, we are required to make an appraisal-based claim to HUD. In such cases, HUD reimburses us for the loan balance, eligible expenses and interest, less the appraised value of the
63
underlying property. Thereafter, all the risks and costs associated with maintaining and liquidating the property remains with us. We may incur additional losses on REO properties as they progress through the claims and liquidation processes. The significance of future losses associated with appraisal-based claims is dependent upon the volume of inactive loans, condition of foreclosed properties and the general real estate market.
Significant Variables
Economic Conditions.
General economic conditions impact the capacity for consumer credit and the supply of capital. More specifically, employment and home prices are variables that can each have a material impact on mortgage volume. Employment levels, the level of wages and the stability of employment are underlying factors that impact credit qualification. The effect of home prices on lending volumes is significant and complex. As home prices go up, home equity increases and this improves the position of existing homeowners either to refinance or to sell their home, which often leads to a new home purchase and a new forward mortgage loan, or in the case of a reverse mortgage, increase the size of the mortgage loan available and the number of potential borrowers. However, if home prices increase rapidly, the effect on affordability for first-time and move-up buyers can dampen the demand for mortgage loans. The more restrictive standards for loan to value (LTV) ratios, debt to income (DTI) ratios and employment that characterize the current market amplify the significance and sensitivity of the housing market and related mortgage lending volumes to employment levels and home prices.
Market Size and Composition.
Changes in mortgage rates directly impact the demand for both purchase and refinance forward mortgages. Small changes in mortgage rates directly impact housing affordability for both first-time and move-up home buyers and affect their ability to purchase a home. For refinance loans, current market mortgage rates must be considered relative to the rates on the current mortgage debt outstanding. As the time and cost to refinance has decreased, relatively small reductions in mortgage rates can trigger higher refinancing activity. Given the large size of U.S. residential forward mortgage debt outstanding, the impact of mortgage rate changes can drive significant swings in mortgage refinance volume. A December
2019
Fannie Mae forecast projects a decline in mortgage originations of
5%
from
2019
to
2020
, including a decline in refinance volume of approximately
22%
. Declines in aggregate mortgage market and refinance volume will generally make growing our Lending business more difficult.
Market size is likewise impacted by changes to existing, or development of new, GSE or other government sponsored programs. Changes in GSE or HUD guidelines and costs and the availability of alternative financing sources, such as non-Agency proprietary loans and traditional home equity loans, impact borrower demand for forward and reverse mortgages.
In August 2017, the FHFA announced an extension of the Home Affordable Refinance Program (HARP) to December 31, 2018. This program allowed borrowers with loans sold to Fannie Mae or Freddie Mac prior to June 1, 2009 to refinance through a simplified process with broader underwriting guidelines, most notably, higher LTV ratios. The HARP program has provided a boost to lending volumes and higher relative margins by providing broader refinance opportunities and more effective portfolio recapture.
Effective in October 2017, HUD and FHA changed the amount of mortgage insurance premium paid by borrowers, lowered the lending interest rate floor and updated the principal limit factors, all of which put downward pressure on the amount of proceeds a borrower would receive. Since these changes were implemented, new endorsements, a proxy for market size, have declined according to the HUD HECM Endorsement Summary Reports. To the extent the benefits of a reverse mortgage are reduced, or become less attractive to borrowers, lending volumes and margins will continue to be negatively impacted.
Investor Demand.
The liquidity of the secondary market impacts the size of the market by defining loan attributes and credit guidelines for loans that investors are willing to buy and at what price. In recent years, the GSEs have been the dominant providers of secondary market liquidity for forward mortgages, keeping the product and credit spectrum relatively homogeneous and risk averse (higher credit standards).
Margins.
Changes in pricing margin are closely correlated with changes in market size. As loan demand and market capacity move out of alignment, pricing adjusts. In a growing market, margins expand and in a contracting market, margins tighten as lenders seek to keep their production at or close to full capacity. Managing capacity and cost is critical as volumes change. Among our channels, our margins per loan are highest in the retail channel and lowest in the correspondent channel. We work directly with the borrower to process, underwrite and close loans in our retail and reverse wholesale channels. In our retail channel, we also identify the customer and take loan applications. As a result, our retail channel is the most people- and cost-intensive and experiences the greatest volume volatility.
On February 28, 2019, we merged Homeward into PMC with PMC being the surviving entity. All of our forward lending purchase and origination activities are conducted under the PHH brand effective April 1, 2019.
64
The following table presents the results of operations of our Lending segment. The amounts presented are before the elimination of balances and transactions with our other segments:
|
Years Ended December 31,
|
% Change
|
||||||||||||||||
|
2019
|
2018
|
2017
|
2019 vs. 2018
|
2018 vs. 2017
|
|||||||||||||
|
Revenue
|
|||||||||||||||||
|
Gain on loans held for sale, net
|
$
|
32,181
|
|
$
|
28,901
|
|
$
|
45,588
|
|
11
|
%
|
(37
|
)%
|
||||
|
Reverse mortgage revenue, net
|
86,309
|
|
60,237
|
|
75,515
|
|
43
|
|
(20
|
)
|
|||||||
|
Other revenue, net
|
6,596
|
|
4,534
|
|
6,372
|
|
45
|
|
(29
|
)
|
|||||||
|
Total revenue
|
125,086
|
|
93,672
|
|
127,475
|
|
34
|
|
(27
|
)
|
|||||||
|
MSR valuation adjustments, net
|
(230
|
)
|
(474
|
)
|
(273
|
)
|
(51
|
)
|
74
|
|
|||||||
|
Operating expenses
|
|||||||||||||||||
|
Compensation and benefits
|
45,086
|
|
46,404
|
|
74,299
|
|
(3
|
)
|
(38
|
)
|
|||||||
|
Servicing and origination
|
17,170
|
|
16,447
|
|
17,716
|
|
4
|
|
(7
|
)
|
|||||||
|
Occupancy and equipment
|
6,431
|
|
6,070
|
|
4,778
|
|
6
|
|
27
|
|
|||||||
|
Technology and communications
|
3,157
|
|
1,936
|
|
2,534
|
|
63
|
|
(24
|
)
|
|||||||
|
Professional services
|
1,339
|
|
1,206
|
|
2,359
|
|
11
|
|
(49
|
)
|
|||||||
|
Corporate overhead allocations
|
6,023
|
|
3,691
|
|
3,981
|
|
63
|
|
(7
|
)
|
|||||||
|
Other expenses
|
5,074
|
|
6,678
|
|
22,118
|
|
(24
|
)
|
(70
|
)
|
|||||||
|
Total operating expenses
|
84,280
|
|
82,432
|
|
127,785
|
|
2
|
|
(35
|
)
|
|||||||
|
Other income (expense)
|
|||||||||||||||||
|
Interest income
|
7,277
|
|
6,061
|
|
10,914
|
|
20
|
|
(44
|
)
|
|||||||
|
Interest expense
|
(7,911
|
)
|
(7,311
|
)
|
(13,893
|
)
|
8
|
|
(47
|
)
|
|||||||
|
Other, net
|
791
|
|
1,638
|
|
(869
|
)
|
(52
|
)
|
(288
|
)
|
|||||||
|
Total other income (expense), net
|
157
|
|
388
|
|
(3,848
|
)
|
(60
|
)
|
(110
|
)
|
|||||||
|
Income (loss) from continuing operations before income taxes
|
$
|
40,733
|
|
$
|
11,154
|
|
$
|
(4,431
|
)
|
265
|
|
(352
|
)
|
||||
|
December 31,
|
||||||||||
|
UPB in millions
|
2019
|
2018
|
% Change
|
|||||||
|
Short-term loan funding commitments
|
||||||||||
|
Forward loans
|
$
|
204,021
|
|
$
|
132,076
|
|
54
|
%
|
||
|
Reverse loans
|
28,545
|
|
18,099
|
|
58
|
|
||||
|
Future Value (1) (2)
|
47,038
|
|
68,075
|
|
(31
|
)%
|
||||
|
Future draw commitment (UPB) (3)
|
1,502.2
|
|
1,426.8
|
|
5
|
%
|
||||
65
The following table provides selected operating statistics for our Lending segment:
|
Years Ended December 31,
|
% Change
|
||||||||||||||||
|
UPB in millions
|
2019
|
2018
|
2017
|
2019 vs. 2018
|
2018 vs. 2017
|
||||||||||||
|
Loan Production by Channel
|
|||||||||||||||||
|
Forward loans
|
|||||||||||||||||
|
Retail
|
$
|
656.6
|
|
$
|
868.1
|
|
$
|
857.8
|
|
(24
|
)%
|
1
|
%
|
||||
|
Correspondent
|
494.0
|
|
0.4
|
|
487.5
|
|
n/m
|
|
(100
|
)
|
|||||||
|
Wholesale
|
—
|
|
1.8
|
|
1,173.0
|
|
(100
|
)
|
(100
|
)
|
|||||||
|
$
|
1,150.6
|
|
$
|
870.3
|
|
$
|
2,518.3
|
|
32
|
|
(65
|
)
|
|||||
|
% HARP production
|
—
|
%
|
7
|
%
|
8
|
%
|
(100
|
)%
|
(13
|
)%
|
|||||||
|
% Purchase production
|
18
|
|
4
|
|
33
|
|
350
|
|
(88
|
)
|
|||||||
|
% Refinance production
|
82
|
|
96
|
|
67
|
|
(15
|
)
|
43
|
|
|||||||
|
Reverse loans (4)
|
|||||||||||||||||
|
Correspondent
|
$
|
411.6
|
|
$
|
360.4
|
|
$
|
495.1
|
|
14
|
%
|
(27
|
)%
|
||||
|
Wholesale
|
238.2
|
|
170.9
|
|
382.2
|
|
39
|
|
(55
|
)
|
|||||||
|
Retail
|
79.6
|
|
62.4
|
|
164.4
|
|
28
|
|
(62
|
)
|
|||||||
|
$
|
729.4
|
|
$
|
593.7
|
|
$
|
1,041.7
|
|
23
|
|
(43
|
)
|
|||||
|
Average Employment
|
|||||||||||||||||
|
U.S.
|
387
|
|
425
|
|
698
|
|
(9
|
)%
|
(39
|
)%
|
|||||||
|
India and other
|
97
|
|
131
|
|
234
|
|
(26
|
)
|
(44
|
)
|
|||||||
|
Total
|
484
|
|
556
|
|
932
|
|
(13
|
)
|
(40
|
)
|
|||||||
|
(1)
|
Future Value represents the net present value of estimated future cash flows from customer draws of the reverse mortgage loans and projected performance assumptions based on historical experience and industry benchmarks discounted at 12% related to HECM loans originated prior to January 1, 2019. We have recognized this Future Value over time as future draws were securitized or sold.
|
|
(2)
|
Excludes the fair value of future draw commitments related to HECM loans purchased or originated after December 31, 2018 that we elected to carry at fair value.
|
|
(3)
|
Includes all future draw commitments.
|
|
(4)
|
New loan production excludes reverse mortgage loan draws by borrowers disbursed subsequent to origination of
$293.6 million
and
$301.9 million
in
2019
and
2018
, respectively.
|
Our Lending segment results for
2019
, as compared to
2018
, were primarily driven by the acquisition of PHH, our re-entry into the forward lending correspondent channel, and reverse lending HECM program and market changes and the related impacts on loan production, revenue and expenses. According to the HUD HECM Endorsement Summary Report, industry endorsements, or the number of new HECM loans insured by the FHA during the reporting period, totaled
32,482
and
41,736
during
2019
and
2018
, respectively, representing a
decline
of
22%
as compared to
2018
. The decline in the retail production of forward mortgage loans was mostly driven by the end of the recapture program on behalf of NRZ effective June 1, 2019 and the impact of the closure of a U.S. facility with origination personnel.
Year Ended December 31, 2019 versus 2018
Total revenue
increased
$31.4 million
, or
34%
, as compared to
2018
primarily due to a
$37.2 million
favorable
net change in the fair values of our HECM reverse mortgage loans and the related HMBS-related borrowings included in Reverse mortgage revenue, net.
The
$26.1 million
increase
in reverse mortgage revenue, net in 2019 as compared to 2018 is mostly explained by a
$12.2 million
fair value gain recognized in connection with the fair value election in the first quarter of 2019 for future draw commitments on HECM reverse mortgage loans purchased or originated after December 31, 2018, and a
$12.4 million
fair value gain due to lower interest rates. Lower interest rates generally result in favorable net fair value impacts on our HECM reverse mortgage loans and the related HMBS-related borrowings and higher interest rates generally result in unfavorable net fair value impacts. Fair value gain of HECM loans on securitization declined in spite of a
23%
increase
in loan production due to margin compression in the wholesale and correspondent channels. The
increase
in our reverse lending volume in
2019
as compared to
2018
, versus the
decline
in industry endorsements for the comparable period, is due to our efforts to re-start
66
purchases with former customers and increase wallet share with existing customers in our wholesale, correspondent and closed whole-loan purchase channels.
Gain on loans held for sale, net,
increased
$3.3 million
, or
11%
, as compared to
2018
, mostly due to
higher loan production
by
$416.1 million
, or
28%
, partially offset by lower average gain on sales margins driven by the increased weight of the lower margin correspondent channel and increased price competition as compared to
2018
.
Operating expenses increased
$1.8 million
, or
2%
, as compared to
2018
, primarily due to an increase in corporate overhead allocations that is attributed to PHH integration expenses offset in part by the effects of our cost reduction initiatives. Certain expenses are variable, and as a result, as origination volume increase or decrease so do the related expenses. Examples include commissions, recorded in Compensation and benefits expense, and advertising expense, recorded in Other expenses. Total average headcount
decreased
13%
as compared to
2018
, reflecting reductions in staffing levels as part of our cost re-engineering and simplification plans offset in part by the increase due to the acquisition of PHH. Compensation and benefits expense
declined
by only
$1.3 million
, or
3%
as average higher-cost U.S. headcount
increased
to
80%
of total average headcount for
2019
from
76%
for
2018
.
Interest income consists primarily of interest earned on newly-originated and purchased loans prior to sale to investors. Interest expense is incurred to finance the mortgage loans. We finance originated and purchased forward and reverse mortgage loans with repurchase and participation agreements, commonly referred to as warehouse lines. The
increases
in interest income and interest expense as compared to
2018
is primarily the result of the increase in loan production.
Corporate Items and Other
Corporate Items and Other includes revenues and expenses of corporate support services, our reinsurance business CRL, discontinued operations and inactive entities, and our other business activities that are currently individually insignificant, revenues and expenses that are not directly related to other reportable segments, interest income on short-term investments of cash, gain on repurchases of debt, interest expense on corporate debt and foreign currency exchange gains or losses. Interest expense on direct asset-backed financings are recorded in the respective Servicing and Lending segments, while interest expense on the SSTL and the Senior Notes is recorded in Corporate Items and Other and is not allocated. Our cash balances are included in Corporate Items and Other.
Corporate support services include finance, facilities, human resources, internal audit, legal, risk and compliance and technology functions. Corporate support services costs, specifically compensation and benefits and professional services expense, have been, and continue to be, significantly impacted by regulatory actions against us and by significant litigation matters. As part of our need to return to sustainable profitability as soon as possible, we seek to reduce our corporate support services expenses while complying with our legal and regulatory obligations. We anticipate that our ability to return to sustainable profitability will be significantly impacted by the degree to which we can reduce these costs going forward. Corporate Items and Other also includes severance, retention, facility-related and other expenses incurred in 2019 related to our re-engineering plan and have not been allocated to other segments.
CRL, our wholly-owned captive reinsurance subsidiary, provides re-insurance related to coverage on REO properties owned or serviced by us. CRL assumes a quota share of REO insurance coverage written by a third-party insurer under a blanket policy issued to PMC (formerly OLS). The underlying REO policy provides coverage for direct physical loss on commercial and residential properties, subject to certain limitations. Under the terms of the reinsurance agreement, CRL assumes a 40% share of all related losses and loss adjustment expenses incurred by the third-party insurer. The reinsurance agreement excludes properties located in the State of New York and has an expiration date of December 31, 2020, although it may be terminated by either party at any time with thirty days’ advance written notice.
Certain expenses incurred by corporate support services that are not directly attributable to a segment are allocated to the Servicing and Lending segments. Certain litigation and settlement related expenses or recoveries, costs related to our re-engineering plan, costs related to our Board of Directors and costs related to certain closed facility sites are not allocated and remain within in the Corporate Items and Other segment.
67
The following table presents selected results of operations of Corporate Items and Other. The amounts presented are before the elimination of balances and transactions with our other segments:
|
Years Ended December 31,
|
% Change
|
||||||||||||||||
|
|
2019
|
2018
|
2017
|
2019 vs. 2018
|
2018 vs. 2017
|
||||||||||||
|
Revenue
|
|
|
|
|
|||||||||||||
|
Premiums (CRL)
|
$
|
12,956
|
|
$
|
16,603
|
|
$
|
23,114
|
|
(22
|
)%
|
(28
|
)%
|
||||
|
Other revenue
|
231
|
|
1,546
|
|
2,697
|
|
(85
|
)
|
(43
|
)
|
|||||||
|
Total revenue
|
13,187
|
|
18,149
|
|
25,811
|
|
(27
|
)
|
(30
|
)
|
|||||||
|
Operating expenses
|
|||||||||||||||||
|
Compensation and benefits
|
125,748
|
|
106,058
|
|
124,181
|
|
19
|
|
(15
|
)
|
|||||||
|
Professional services
|
59,173
|
|
110,705
|
|
160,569
|
|
(47
|
)
|
(31
|
)
|
|||||||
|
Technology and communications
|
43,402
|
|
50,770
|
|
51,718
|
|
(15
|
)
|
(2
|
)
|
|||||||
|
Occupancy and equipment
|
17,376
|
|
11,050
|
|
13,822
|
|
57
|
|
(20
|
)
|
|||||||
|
Servicing and origination
|
741
|
|
253
|
|
4,211
|
|
193
|
|
(94
|
)
|
|||||||
|
Other expenses
|
10,969
|
|
13,679
|
|
24,732
|
|
(20
|
)
|
(45
|
)
|
|||||||
|
Total operating expenses before corporate overhead allocations
|
257,409
|
|
292,515
|
|
379,233
|
|
(12
|
)
|
(23
|
)
|
|||||||
|
Corporate overhead allocations
|
|||||||||||||||||
|
Servicing segment
|
(197,880
|
)
|
(211,701
|
)
|
(221,049
|
)
|
(7
|
)
|
(4
|
)
|
|||||||
|
Lending segment
|
(6,023
|
)
|
(3,691
|
)
|
(3,981
|
)
|
63
|
|
(7
|
)
|
|||||||
|
Total operating expenses
|
53,506
|
|
77,123
|
|
154,203
|
|
(31
|
)
|
(50
|
)
|
|||||||
|
Other income (expense), net
|
|||||||||||||||||
|
Interest income
|
1,776
|
|
2,582
|
|
4,268
|
|
(31
|
)
|
(40
|
)
|
|||||||
|
Interest expense
|
(58,871
|
)
|
(54,230
|
)
|
(55,750
|
)
|
9
|
|
(3
|
)
|
|||||||
|
Bargain purchase gain
|
(381
|
)
|
64,036
|
|
—
|
|
(101
|
)
|
n/m
|
|
|||||||
|
Gain on repurchase of senior secured notes
|
5,099
|
|
—
|
|
—
|
|
n/m
|
|
n/m
|
|
|||||||
|
Other, net
|
(3,758
|
)
|
(4,096
|
)
|
(6,348
|
)
|
(8
|
)
|
(35
|
)
|
|||||||
|
Total other (expense) income, net
|
(56,135
|
)
|
8,292
|
|
(57,830
|
)
|
(777
|
)
|
(114
|
)
|
|||||||
|
Loss from continuing operations before income taxes
|
$
|
(96,454
|
)
|
$
|
(50,682
|
)
|
$
|
(186,222
|
)
|
90
|
|
(73
|
)
|
||||
|
n/m: not meaningful
|
|||||||||||||||||
Year Ended December 31, 2019 versus 2018
CRL premium revenue
decreased
$3.6 million
, or
22%
, as compared to
2018
primarily due to the
10%
decline
in the average number of foreclosed real estate properties in our servicing portfolio.
Total operating expenses before corporate overhead allocations
declined
$35.1 million
, or
12%
, as compared to
2018
primarily due to the recovery in 2019 of
$34.7 million
from a service provider and mortgage insurer, lower legal fees and settlements and the effects of our cost-reduction efforts, partly offset by higher compensation and benefits expense attributed to PHH and
$65.0 million
of costs incurred related to our cost re-engineering plan.
Compensation and benefits expense
increased
$19.7 million
, or
19%
, as compared to
2018
due to the PHH acquisition and
$35.7 million
of severance and retention costs recognized in connection with our integration-related headcount reductions of primarily U.S. based employees. Although average total corporate headcount increased
3%
, average higher-cost U.S. headcount increased to
39%
of the total for
2019
from
32%
for
2018
.
Professional services expense
declined
$51.5 million
, or
47%
, as compared to
2018
primarily due to the
$34.7 million
recovery in 2019 of prior expense from a service provider and mortgage insurer and an
$11.7 million
decrease
in provisions for probable losses in connection with litigation. In addition, 2018 included
$13.7 million
of direct costs related to the acquisition of PHH.
Technology and communications expense
decreased
$7.4 million
, or
15%
, as compared to
2018
primarily due to a
$7.2 million
decrease
in depreciation expense that is largely the result of a decline in capitalized technology investments and the
68
closure of seven U.S. facilities, as well as our other cost reduction efforts which included bringing technology services in-house. These reductions were partially offset by an increase in expenses as a result of PHH expenses.
Occupancy and equipment expense
increased
$6.3 million
or
57%
, as compared to
2018
, primarily due to PHH expenses and accelerated amortization of ROU assets in connection with our decision to vacate leased properties in 2019 prior to the contractual maturity date of the lease agreements.
Interest expense
increased
$4.6 million
, or
9%
, as compared to
2018
, primarily as a result of the increase in borrowings under our SSTL due to the $120.0 million SSTL upsize we executed in March 2019 and the financing cost of the senior unsecured notes assumed as part of the PHH acquisition.
We recognized a bargain purchase gain, net of tax, of
$63.7 million
(
$64.0 million
original gain recognized in 2018) in connection with the acquisition of PHH representing the excess of the net assets acquired over the consideration paid. The purchase price we negotiated contemplated that PHH would incur losses after the acquisition date. See
Note 2 — Business Acquisition
to the Consolidated Financial Statements for additional information.
During July and August 2019, we repurchased a total of
$39.4 million
of our 8.375% Senior secured notes in the open market for a price of
$34.3 million
and recognized a gain of
$5.1 million
.
Other, net
declined
$0.3 million
, or
8%
, as compared to
2018
primarily due to a
$3.1 million
decrease
in foreign currency remeasurement losses offset by a
$2.9 million
increase
in losses on fixed assets, including the write-off of $2.2 million of capitalized software no longer used. The higher foreign currency remeasurement losses in 2018 were primarily attributable to depreciation of the India Rupee against the U.S. Dollar. Foreign currency exchange losses were
$0.2 million
and
$3.2 million
for
2019
and
2018
, respectively. While we do not currently hedge our foreign currency exposure, we do maintain India Rupee denominated investments in higher-yielding term deposits to partially offset our exposure.
Total expenses, after corporate overhead allocations, of
$53.5 million
for
2019
includes
$65.0 million
of severance, retention, facility-related and other expenses related to our cost re-engineering plan and the recovery of
$34.7 million
from a service provider and mortgage insurer in 2019, all of which are not allocated.
69
FOURTH QUARTER RESULTS
(Unaudited consolidated statements of operations)
|
Quarters Ended December 31,
|
% Change
|
|||||||||
|
2019
|
2018
|
2019 vs. 2018
|
||||||||
|
Revenue
|
||||||||||
|
Servicing and subservicing fees
|
$
|
229,951
|
|
$
|
276,970
|
|
(17
|
)%
|
||
|
Gain on loans held for sale, net
|
11,988
|
|
9,834
|
|
22
|
|
||||
|
Reverse mortgage revenue, net
|
13,433
|
|
17,568
|
|
(24
|
)
|
||||
|
Other revenue, net
|
5,799
|
|
6,557
|
|
(12
|
)
|
||||
|
Total revenue
|
261,171
|
|
310,929
|
|
(16
|
)
|
||||
|
MSR valuation adjustments, net
|
829
|
|
(61,762
|
)
|
(101
|
)
|
||||
|
Operating expenses
|
||||||||||
|
Compensation and benefits
|
63,115
|
|
86,816
|
|
(27
|
)
|
||||
|
Professional services
|
25,433
|
|
54,733
|
|
(54
|
)
|
||||
|
Servicing and origination
|
21,717
|
|
39,845
|
|
(45
|
)
|
||||
|
Technology and communications
|
18,086
|
|
30,935
|
|
(42
|
)
|
||||
|
Occupancy and equipment
|
15,596
|
|
22,262
|
|
(30
|
)
|
||||
|
Other expenses
|
(5,089
|
)
|
6,466
|
|
(179
|
)
|
||||
|
Total operating expenses
|
138,858
|
|
241,057
|
|
(42
|
)
|
||||
|
Other income (expense)
|
|
|
|
|
||||||
|
Interest income
|
4,580
|
|
4,008
|
|
14
|
|
||||
|
Interest expense
|
(29,493
|
)
|
(25,027
|
)
|
18
|
|
||||
|
Pledged MSR liability expense
|
(68,787
|
)
|
(60,413
|
)
|
14
|
|
||||
|
Bargain purchase gain
|
(118
|
)
|
64,036
|
|
(100
|
)
|
||||
|
Gain on sale of MSRs, net
|
—
|
|
1,022
|
|
(100
|
)
|
||||
|
Other, net
|
7,919
|
|
501
|
|
n/m
|
|
||||
|
Other expense, net
|
(85,899
|
)
|
(15,873
|
)
|
441
|
|
||||
|
Income (loss) from continuing operations before income taxes
|
37,243
|
|
(7,763
|
)
|
(580
|
)
|
||||
|
Income tax expense (benefit)
|
2,370
|
|
(4,012
|
)
|
(159
|
)
|
||||
|
Income (loss) from continuing operations
|
34,873
|
|
(3,751
|
)
|
n/m
|
|
||||
|
Income from discontinued operations, net of income taxes
|
—
|
|
1,409
|
|
(100
|
)
|
||||
|
Net income (loss)
|
$
|
34,873
|
|
$
|
(2,342
|
)
|
n/m
|
|
||
|
Segment income (loss) from continuing operations before taxes:
|
||||||||||
|
Servicing
|
$
|
58,927
|
|
$
|
(40,616
|
)
|
(245
|
)%
|
||
|
Lending
|
3,624
|
|
3,048
|
|
19
|
|
||||
|
Corporate Items and Other
|
(25,308
|
)
|
29,805
|
|
(185
|
)
|
||||
|
$
|
37,243
|
|
$
|
(7,763
|
)
|
(580
|
)
|
|||
|
n/m: not meaningful
|
|
|
||||||||
We reported net income of
$34.9 million
for the fourth quarter of 2019 as compared to a net loss of
$2.3 million
for the fourth quarter of 2018.
Total revenue was
$49.8 million
, or
16%
lower
in the fourth quarter of 2019 as compared to the fourth quarter of 2018. This decrease is primarily due to a
decline
in Servicing and subservicing fees that was mostly driven by a lower average UPB
70
of loans serviced for the quarter, due to runoff and servicing transfers, and fewer borrower loan modifications. The average UPB of our servicing portfolio declined 12% as compared to the fourth quarter of 2018.
We reported a net
$0.8 million
gain in MSR valuation adjustments, net in the fourth quarter of 2019 compared to a
$61.8 million
loss for the fourth quarter of 2018. The
$62.6 million
improvement
is primarily due to a
$77.1 million
positive
change in fair value related to higher interest rates, offset in part by a
$14.7 million
unfavorable
impact from higher portfolio runoff. The 10-year swap rate increased 33 basis points in the fourth quarter of 2019 as compared to a 40 basis-point decline in the fourth quarter of 2018. Fair value adjustments to our MSRs are offset, in part, by fair value adjustments related to the NRZ financing liabilities, which are recorded in Pledged MSR liability expense.
Operating expenses
declined
$102.2 million
, or
42%
, compared with the fourth quarter of 2018. Severance, retention, facility-related and other expenses related to our cost re-engineering plan of
$14.4 million
in the fourth quarter of 2019 were more than offset by significant expense reductions across the company as a result of our cost reduction efforts. Such efforts include eliminating redundant costs through the integration process including headcount reductions, facility closures and legal entity reorganization as well as bringing technology services in-house. We reduced total average headcount by
25%
compared to the fourth quarter of 2018. In addition, the fourth quarter of 2019 includes recoveries of
$15.0 million
from a mortgage insurer and service provider of amounts recognized as expenses in prior periods.
LIQUIDITY AND CAPITAL RESOURCES
Overview
We closely monitor our liquidity position and ongoing funding requirements, and we regularly monitor and project cash flows over various time horizons as a way to anticipate and mitigate liquidity risk.
In assessing our liquidity outlook, our primary focus is on available cash on hand, unused available funding and the following six forecast measures:
|
•
|
Financial projections for ongoing net income, excluding the impact of non-cash items, and working capital needs including loan repurchases;
|
|
•
|
Requirements for amortizing and maturing liabilities compared to sources of cash;
|
|
•
|
The projected change in advances and match funded advances compared to the projected borrowing capacity to fund such advances under our facilities, including capacity for monthly peak needs;
|
|
•
|
Projected funding requirements for acquisitions of MSRs and other investment opportunities;
|
|
•
|
Potential payments or recoveries related to legal and regulatory matters, insurance, taxes and MSR transactions; and
|
|
•
|
Funding capacity for whole loans and tail draws under our reverse mortgage commitments subject to warehouse eligibility requirements.
|
At
December 31, 2019
, our unrestricted cash position was
$428.3 million
compared to
$329.1 million
at
December 31, 2018
. We typically invest cash in excess of our immediate operating needs in money market deposit accounts and other liquid assets. At
December 31, 2019
, no unencumbered loans held for sale were eligible for funding under our warehouse facilities on an uncommitted basis, compared to $62.4 million on a committed basis as of December 31, 2018. Our liquidity was bolstered by the $120.0 million upsizing of our SSTL during the first quarter of 2019 and net borrowings of
$314.4 million
under our new MSR financing facilities in 2019. During 2019, we used
$157.2
million of cash to repay the PHH senior unsecured notes at maturity, partially repurchase second lien senior secured notes and pay the SSTL required amortization. On January 27, 2020, we prepaid
$126.1 million
of the outstanding SSTL balance and executed certain amendments to the SSTL agreement to extend the maturity date to May 15, 2022, reduce the contractual quarterly principal payment from $6.4 million to $5.0 million and modify the interest rate. See
Note 28 — Subsequent Events
for additional information.
We regularly evaluate capital structure options that we believe will most effectively provide the necessary capacity to support our investment plans, address upcoming debt maturities and accommodate our business needs. For example, in 2019, we closed three new financing facilities secured by MSRs resulting in
$314.4 million
of funding at
December 31, 2019
and
$179.97
million of available borrowing capacity. Our capital structure actions were targeted at optimizing access to capital, improving our cost of funds, enhancing financial flexibility, bolstering liquidity and reducing funding risk while maintaining leverage within our risk tolerances. Historical losses have significantly eroded our stockholders’ equity and weakened our financial condition. To the extent we are not successful in achieving our objective of returning to profitability, funding continuing losses will limit our opportunities to grow our business through capital investment.
The available borrowing capacity under our advance financing facilities has increased by
$4.2 million
from
$46.7 million
at
December 31, 2018
to
$50.9 million
at
December 31, 2019
. The
$99.2
million decline in outstanding borrowings in combination with a
$95.0 million
reduction in maximum borrowing capacity from December 31, 2018 drove the net increase in available capacity. Our ability to continue to pledge collateral under our advance financing facilities depends on the
71
performance of the advances, among other factors. At
December 31, 2019
, we had fully funded the amounts that could be funded under the available borrowing capacity based on the amount of eligible collateral that had been pledged to our advance financing facilities.
At
December 31, 2019
, we had maximum borrowing capacity under our forward and reverse warehouse facilities of
$1.5 billion
. Of the borrowing capacity extended on a committed basis,
$288.4 million
was available at
December 31, 2019
, and no additional amounts could be borrowed under the available borrowing capacity based on the amount of eligible collateral that could be pledged. Uncommitted amounts (
$684.4 million
available at
December 31, 2019
) can be advanced solely at the discretion of the lender, and there can be no assurance that any uncommitted amounts will be available to us at any particular time. At
December 31, 2019
, no additional amounts could be borrowed under the uncommitted borrowing capacity based on the amount of eligible collateral that could be pledged, assuming our lenders were willing to do so.
A portion of our cash balances are held in our non-U.S. subsidiaries. Should we wish to utilize this cash in the U.S, we would have to repatriate the cash held by our non-U.S. subsidiaries in compliance with applicable laws and, potentially with tax consequences.
We have considered the impact of financial projections on our liquidity analysis and have evaluated the appropriateness of the key assumptions in our forecast such as revenues, expenses, our assessment of the likely impact of open regulatory and litigation matters, recurring and nonrecurring costs, levels of investment and availability of funding sources. As part of this analysis, we have also assessed the cash requirements to operate our business and service our financial obligations coming due. Based upon these evaluations and analysis, we believe that we have sufficient liquidity and access to adequate sources of new capital to meet our obligations and fund our operations for the next twelve months.
Sources of Funds
Our primary sources of funds for near-term liquidity in normal course include:
|
•
|
Collections of servicing fees and ancillary revenues;
|
|
•
|
Collections of advances in excess of new advances;
|
|
•
|
Proceeds from match funded advance financing facilities;
|
|
•
|
Proceeds from other borrowings, including warehouse facilities and MSR financing facilities;
|
|
•
|
Proceeds from sales and securitizations of originated loans and repurchased loans; and
|
|
•
|
Net positive working capital from changes in other assets and liabilities.
|
Servicing advances are an important component of our business and represent amounts that we, as servicer, are required to advance to, or on behalf of, our servicing clients if we do not receive such amounts from borrowers. Our use of advance financing facilities is integral to our servicing advance financing strategy. Revolving variable funding notes issued by our advance financing facilities to financial institutions have revolving periods of 12 to 18 months. Term notes are generally issued to institutional investors with one-, two- or three-year revolving periods.
We use mortgage loan warehouse facilities (commonly called warehouse lines) to fund newly-originated loans on a short-term basis until they are sold to secondary market investors, including GSEs or other third-party investors, and to fund repurchases of certain Ginnie Mae forward loans, HECM loans, second lien loans and other types of loans. Warehouse facilities are structured as repurchase or participation agreements under which ownership of the loans is temporarily transferred to the lender. These facilities contain eligibility criteria that include aging and concentration limits by loan type among other provisions. Currently, our master repurchase and participation agreements generally have maximum terms of 364-days. The funds are typically repaid using the proceeds from the sale of the loans to the secondary market investors, usually within 30 days.
We also rely on the secondary mortgage market as a source of consistent liquidity to support our lending operations. Substantially all of the mortgage loans that we originate or purchase are sold or securitized in the secondary mortgage market in the form of residential mortgage backed securities guaranteed by Fannie Mae or Freddie Mac and, in the case of mortgage backed securities guaranteed by Ginnie Mae, are mortgage loans insured or guaranteed by the FHA or VA.
72
Collateral
Our assets held as collateral related to secured borrowings, committed under sale or other contractual obligations and which may be subject to a secured lien under the SSTL are as follows at
December 31, 2019
:
|
Collateral for Secured Borrowings
|
|||||||||||||||||||||||
|
Assets
|
Total
|
Match Funded Liabilities
|
Financing Liabilities
|
Mortgage Loan Warehouse/MSR Facilities
|
Sales and Other Commitments
|
Other
|
|||||||||||||||||
|
Cash
|
$
|
428,339
|
|
$
|
—
|
|
$
|
—
|
|
$
|
—
|
|
$
|
—
|
|
$
|
428,339
|
|
|||||
|
Restricted cash
|
64,001
|
|
17,332
|
|
—
|
|
5,944
|
|
40,725
|
|
—
|
|
|||||||||||
|
MSRs (1)
|
1,486,395
|
|
—
|
|
915,148
|
|
575,471
|
|
—
|
|
525
|
|
|||||||||||
|
Advances, net
|
254,533
|
|
—
|
|
—
|
|
—
|
|
28,737
|
|
225,796
|
|
|||||||||||
|
Match funded assets
|
801,990
|
|
801,990
|
|
—
|
|
—
|
|
—
|
|
—
|
|
|||||||||||
|
Loans held for sale
|
275,269
|
|
—
|
|
—
|
|
236,517
|
|
—
|
|
38,752
|
|
|||||||||||
|
Loans held for investment
|
6,292,938
|
|
—
|
|
6,144,275
|
|
115,130
|
|
—
|
|
33,533
|
|
|||||||||||
|
Receivables, net
|
201,220
|
|
—
|
|
—
|
|
24,795
|
|
—
|
|
176,425
|
|
|||||||||||
|
Premises and equipment, net
|
38,274
|
|
—
|
|
—
|
|
—
|
|
—
|
|
38,274
|
|
|||||||||||
|
Other assets
|
563,240
|
|
—
|
|
—
|
|
5,285
|
|
510,236
|
|
47,719
|
|
|||||||||||
|
Total Assets
|
$
|
10,406,199
|
|
$
|
819,322
|
|
$
|
7,059,423
|
|
$
|
816,944
|
|
$
|
590,398
|
|
$
|
1,120,112
|
|
|||||
|
Liabilities
|
|||||||||||||||||||||||
|
HMBS - related borrowings
|
$
|
6,063,435
|
|
$
|
—
|
|
$
|
6,063,435
|
|
$
|
—
|
|
$
|
—
|
|
$
|
—
|
|
|||||
|
Other financing liabilities
|
972,595
|
|
—
|
|
937,150
|
|
—
|
|
—
|
|
35,445
|
|
|||||||||||
|
Match funded liabilities
|
679,109
|
|
679,109
|
|
—
|
|
—
|
|
—
|
|
—
|
|
|||||||||||
|
Other secured borrowings, net
|
1,025,791
|
|
—
|
|
—
|
|
703,033
|
|
—
|
|
322,758
|
|
|||||||||||
|
Senior notes, net
|
311,085
|
|
—
|
|
—
|
|
—
|
|
—
|
|
311,085
|
|
|||||||||||
|
Other liabilities
|
942,173
|
|
—
|
|
—
|
|
—
|
|
510,236
|
|
431,937
|
|
|||||||||||
|
Total Liabilities
|
$
|
9,994,188
|
|
$
|
679,109
|
|
$
|
7,000,585
|
|
$
|
703,033
|
|
$
|
510,236
|
|
$
|
1,101,225
|
|
|||||
|
Total Equity
|
$
|
412,011
|
|
|
|
|
|
|
|
||||||||||||||
(1)
Certain MSR cohorts with a net negative fair value of $4.7 million that would be presented as Other are excluded from the eligible collateral of the facilities and are comprised of $27.9 million of negative fair value related to RMBS and $23.2 million of positive fair value related to private EBO and PLS MSRs.
See
Note 14 — Borrowings
for information on assets held as collateral related to secured borrowings, committed under sale or other contractual obligations and which may be subject to a secured lien under the SSTL.
Use of Funds
Our primary uses of funds in normal course include:
|
•
|
Payment of operating costs and corporate expenses;
|
|
•
|
Payments for advances in excess of collections;
|
|
•
|
Investing in our servicing and lending businesses, including MSR and other asset acquisitions;
|
|
•
|
Originated and repurchased loans, including scheduled and unscheduled equity draws on reverse mortgage loans;
|
|
•
|
Repayments of borrowings, including under our MSR financing, advance financing and warehouse facilities, and payment of interest expense; and
|
|
•
|
Net negative working capital and other general corporate cash outflows.
|
73
Under the terms of our SSTL facility agreement, subject to certain exceptions, we are required to prepay the SSTL with certain percentage amounts of excess cash flow as defined and 100% of the net cash proceeds from certain permitted asset sales, subject to our ability to reinvest such proceeds in our business within 270 days of receipt.
Outlook
Regarding the current maturities of our borrowings, as of
December 31, 2019
, we had approximately
$1.2 billion
of debt outstanding that would either come due, begin amortizing or require partial repayment prior to December 31, 2020. This amount is comprised of
$326.1 million
in contractual repayments of our SSTL,
$332.2 million
of borrowings under warehouse facilities,
$394.1 million
of variable funding and term notes under advance financing facilities that will enter their respective amortization periods and
$147.7 million
outstanding under one of our new MSR financing facilities which will terminate in June 2020 unless renewed or extended. On January 27, 2020, we prepaid
$126.1 million
of the SSTL outstanding balance, executed an amendment to the SSTL agreement which reduced the maximum borrowing capacity to $200.0 million, extended the maturity date to May 15, 2022, reduced the contractual quarterly principal payment from $6.4 million to $5.0 million and modified the interest rate.
We believe that we will be able to renew, replace or extend our debt agreements to the extent necessary to finance our operations before or as they become due, consistent with our historical experience.
We are actively engaged with our lenders and as a result, have successfully completed the following with respect to our current and anticipated financing needs:
|
•
|
On February 4, 2019, we entered into a mortgage loan warehouse agreement under which the lender will provide
$300.0 million
of borrowing capacity on an uncommitted basis for forward mortgage loan originations. On January 27, 2020, we renewed this facility through April 3, 2020.
|
|
•
|
On March 18, 2019, we amended the SSTL to provide an additional term loan of $120.0 million subject to the same maturity, interest rate and other material terms of existing borrowings under the SSTL. The required quarterly principal payment was increased from $4.2 million to $6.4 million beginning March 31, 2019. On January 27, 2020, we executed another amendment to the SSTL which reduced the maximum borrowing capacity to $200.0 million, extended the maturity date to May 15, 2022, reduced the quarterly principal payment to $5.0 million and modified the interest rate. See
Note 28 — Subsequent Events
for additional information.
|
|
•
|
On June 6, 2019, we renewed our OFAF advance financing facility through June 5, 2020 and reduced the borrowing capacity from $65.0 million to
$60.0 million
.
|
|
•
|
On July 1, 2019, we entered into a committed financing facility that is secured by certain Fannie Mae and Freddie Mac MSRs. The maximum amount which we may borrow is
$300.0 million
. This facility will terminate in June 2020 unless the parties mutually agree to renew or extend.
|
|
•
|
On August 13, 2019, we renewed a reverse mortgage loan warehouse agreement with a maximum borrowing capacity of
$100.0 million
(all of which is uncommitted) through August 14, 2020.
|
|
•
|
On August 14, 2019, we issued two fixed-rate term notes (Series 2019 T-1 and Series 2019-T2) totaling
$470.0 million
and repaid Series 2016-T2, 2018-T1 and 2018-T2 fixed-rate term notes on August 15, 2019. The amortization period for the Series 2019 T-1 and Series 2019-T2 notes begin on August 17, 2020 and August 16, 2021, respectively.
|
|
•
|
On September 2, 2019, we redeemed all of the $97.5 million outstanding of our
7.375%
Senior unsecured notes due in September 2019, at a redemption price of
100.0%
of the outstanding principal balance plus accrued and unpaid interest.
|
|
•
|
On September 27, 2019, we renewed a mortgage loan warehouse agreement with a maximum borrowing capacity of
$175.0 million
(
$100.0 million
of which is committed) through September 25, 2020.
|
|
•
|
On November 26, 2019, we entered into a committed financing facility that is secured by certain Ginnie Mae MSRs. The maximum amount which we may borrow is
$100.0 million
. This facility will terminate in November 2021 unless the parties mutually agree to renew or extend.
|
|
•
|
On November 26, 2019, PMC issued notes secured by certain of PMC’s non-Agency or private label MSRs (PLS MSRs) pursuant to a credit agreement. The Class A Notes issued pursuant to the credit agreement have an initial principal amount of
$100.0 million
and amortize in accordance with a pre-determined schedule subject to modification under certain events.
|
|
•
|
On December 6, 2019, we renewed a reverse mortgage loan warehouse agreement with a maximum borrowing capacity of
$250.0 million
(
$200.0 million
of which is committed) through December 5, 2020.
|
|
•
|
On December 12, 2019, we renewed OMART advance financing facility through December 11, 2020 and reduced the borrowing capacity from $225.0 million to
$200.0 million
.
|
|
•
|
On December 26, 2019, we entered into a mortgage loan warehouse agreement to fund reverse mortgage loan draws by borrowers subsequent to origination. Under this agreement, the lender provides financing for up to
$50.0 million
on a committed basis.
|
74
|
•
|
On January 27, 2020, as discussed above, we prepaid $126.1 million of the outstanding SSTL balance and executed certain amendments to the SSTL agreement. See
Note 28 — Subsequent Events
for additional information.
|
Our liquidity forecast requires management to use judgment and estimates and includes factors that may be beyond our control. Additionally, our business has been undergoing substantial change, which has magnified the uncertainties that are inherent in the forecasting process. Our actual results could differ materially from our estimates. If we were to default under any of our debt agreements, it could become very difficult for us to renew, replace or extend some or all of our debt agreements. Challenges to our liquidity position could have a material adverse effect on our operating results and financial condition and could cause us to take actions that would be outside the normal course of our operations to generate additional liquidity.
Covenants
Our debt agreements contain various qualitative and quantitative covenants including financial covenants, covenants to operate in material compliance with applicable laws and regulations, monitoring and reporting obligations and restrictions on our ability to engage in various activities, including but not limited to incurring additional debt, paying dividends, repurchasing or redeeming capital stock, transferring assets or making loans, investments or acquisitions. Because of the covenants to which we are subject, we may be limited in the manner in which we conduct our business and may be limited in our ability to engage in favorable business activities or raise additional capital to finance future operations or satisfy future liquidity needs. In addition, breaches or events that may result in a default under our debt agreements include, among other things, nonpayment of principal or interest, noncompliance with our covenants, breach of representations, the occurrence of a material adverse change, insolvency, bankruptcy, certain material judgments and litigation and changes of control.
Covenants and default provisions of this type are commonly found in debt agreements such as ours. Certain of these covenants and default provisions are open to subjective interpretation and, if our interpretation were contested by a lender, a court may ultimately be required to determine compliance or lack thereof. In addition, our debt agreements generally include cross default provisions such that a default under one agreement could trigger defaults under other agreements. If we fail to comply with our debt agreements and are unable to avoid, remedy or secure a waiver of any resulting default, we may be subject to adverse action by our lenders, including termination of further funding, acceleration of outstanding obligations, enforcement of liens against the assets securing or otherwise supporting our obligations, and other legal remedies, any of which could have a material adverse effect on our business, financial condition, liquidity and results of operations. We believe that we are in compliance with the qualitative and quantitative covenants in our debt agreements as of the date this Annual Report on Form 10-K is filed with the SEC.
Credit Ratings
Credit ratings are intended to be an indicator of the creditworthiness of a company’s debt obligations. Lower ratings generally result in higher borrowing costs and reduced access to capital markets. The following table summarizes the current ratings and outlook for PMC by the respective nationally recognized rating agencies. A credit rating is not a recommendation to buy, sell or hold securities and may be subject to revision or withdrawal at any time.
|
Rating Agency
|
Long-term Corporate Rating
|
Review Status / Outlook
|
Date of last action
|
|||
|
Moody’s
|
Caa1
|
Negative
|
September 11, 2019
|
|||
|
S&P
|
B-
|
Stable
|
January 27, 2020
|
|||
On September 11, 2019 Moody’s withdrew the Caa1 corporate family rating of Ocwen as it no longer maintained any rated debt outstanding and issued a corporate family rating of Caa1 with negative outlook to PMC. It is possible that additional actions by credit rating agencies could have a material adverse impact on our liquidity and funding position, including materially changing the terms on which we may be able to borrow money. On January 27, 2020 S&P upgraded the Outlook on our long-term issuer rating from Negative to Stable simultaneous with the closing of the transaction to amend and extend our SSTL.
Cash Flows
Our operating cash flow is primarily impacted by operating results, changes in our servicing advance balances, the level of mortgage loan production and the timing of sales and securitizations of mortgage loans. We classify proceeds from the sale of servicing advances, including advances sold in connection with the sale of MSRs, as investing activity. We classify changes in HECM loans held for investment as investing activity and changes in the related HMBS-related borrowings as financing activity.
Our NRZ agreements have a significant impact on our consolidated statements of cash flows. Because the lump-sum payments we received in connection with our 2017 Agreements and New RMSR Agreements are recorded as secured
75
financings, additions to, and reductions in, the balance of those secured financings are recognized as financing activity in our consolidated statements of cash flows. Excluding the impact of changes to the secured financings attributed to changes in fair value, changes in the balance of these secured financings are reflected in cash flows from operating activities despite having no impact on our consolidated cash balance. Net cash provided by operating activities for the years ended
December 31, 2019
,
2018
and
2017
includes
$101.0 million
,
$136.7 million
and
$1.9 million
, respectively, of such cash flows and they were offset by corresponding amounts in net cash used in financing activities in the same periods.
Cash flows for the year ended December 31, 2019
Our operating activities provided
$151.9 million
of cash largely due to
$105.1 million
of net collections of servicing advances, offset in part by
net cash paid on loans held for sale
of
$108.8 million
.
Our investing activities used
$587.4 million
of cash. The primary uses of cash in our investing activities include
net cash outflows in connection with our HECM reverse mortgages
of
$467.4 million
. Cash outflows also include
$145.7 million
to purchase MSRs.
Our financing activities provided
$530.8 million
of cash. Cash inflows include
$962.1 million
received in connection with our reverse mortgage securitizations, which are accounted for as secured financings, less repayments on the related financing liability of
$549.6 million
. We increased borrowings under the SSTL through the issuance of an additional term loan of $120.0 million (before a discount of $0.9 million), less repayments of
$25.4 million
. In addition,
we increased borrowings under our mortgage loan warehouse facilities
by
$176.5 million
and borrowed
$314.4 million
under new MSR financing facilities. Cash outflows include
$99.2 million
of
net repayments on match funded liabilities
as a result of advance recoveries,
$214.4 million
of net payments on the financing liabilities related to MSRs pledged, and
$131.8 million
to redeem and repurchase Senior notes.
Cash flows for the year ended December 31, 2018
Our operating activities provided
$272.6 million
of cash largely due to
$258.9 million
of net collections of servicing advances. Net cash paid on loans held for sale during the year was
$90.1 million
.
Our investing activities used
$344.9 million
of cash. The primary uses of cash in our investing activities include net cash outflows in connection with our HECM reverse mortgages of
$520.0 million
. Cash inflows include net cash of
$64.7 million
and restricted cash of
$38.8 million
acquired in connection with acquisition of PHH, net proceeds of
$33.0 million
on dealer financing notes issued by our automotive capital services business, which we decided to exit in January 2018, and the receipt of
$41.1 million
of net proceeds from the sale of MSRs and related advances.
Our financing activities provided
$166.7 million
of cash. Cash inflows include
$948.9 million
received in connection with our reverse mortgage securitizations, which are accounted for as secured financings, less repayments on the related financing liability of
$392.0 million
. In January 2018, we received a lump-sum payment of
$279.6 million
in accordance with the terms of the New RMSR Agreements. Cash outflows include
$220.3 million
of net repayments on match funded liabilities as a result of advance recoveries,
$211.8 million
of net payments on the financing liability related to MSRs pledged,
$66.8 million
of repayments on the SSTL and
$18.5 million
to repurchase Senior notes. In addition, we reduced borrowings under our mortgage loan warehouse facilities by $100.1 million.
RISK MANAGEMENT
Our risk management framework seeks to mitigate risk and appropriately balance risk and return. We have established policies and procedures intended to identify, assess, monitor and manage the types of risk to which we are subject, including strategic, market, credit, liquidity and operational risks.
Our Chief Risk and Compliance Officer is responsible for the design, implementation and oversight of our global risk management and compliance programs. Risks unique to our businesses are governed through various management processes and governance committees to oversee risk and related control activities across the company and provide a framework for potential issues to be identified, assessed and remediated under the direction of senior executives from our business, finance, risk, compliance, internal audit and law departments, as applicable. Information is aggregated and reports on risk matters are made to the Board of Directors, its Risk and Compliance Committee or its other committees, as applicable, to enable the Board of Directors and its committees to fulfill their governance and oversight responsibilities.
Strategic Risk
We are exposed to risk with respect to the strategic initiatives we need to undertake in order to return to growth and profitability. Strategic risk represents the risk to shareholder or enterprise value, current or future earnings, capital and liquidity from adverse business decisions and/or improper implementation of business strategies. Management is responsible for developing and implementing business strategies that leverage our core competencies and are appropriately structured, resourced and executed.
76
Oversight for our strategic actions is provided by the Board of Directors. Our performance, relative to our business plans and our longer-term strategic plans, is reviewed by management and the Board of Directors.
To achieve our near-term financial objectives, we believe we need to execute on the key business initiatives discussed above under “Overview”. Our ability to achieve our objectives is highly dependent on the success of our business relationships with our critical counterparties like the GSEs, FHFA, Ginnie Mae, our lenders, regulators, significant customers and our ability to attract new customers, all of which are impacted by our capability to adequately address the competitive challenges we face. There can be no assurance that we will be successful in executing on these initiatives. Further, there can be no assurance that even if we execute on these initiatives we will be able to return to profitability. In addition to successful operational execution of our key initiatives, our success will also depend on market conditions and other factors outside of our control. If we continue to experience losses, our share price, business, reputation, financial condition, liquidity and results of operations could be materially and adversely affected.
Market Risk
Interest Rates
Our principal market risk exposure is the impact of interest rate changes on our mortgage-related assets and commitments, including MSRs, loans held for sale, loans held for investment and interest rate lock commitments (IRLCs). In addition, changes in interest rates could materially and adversely affect our volume of mortgage loan originations or result in MSR fair value changes. We also have exposure to the effects of changes in interest rates on our floating-rate borrowings, including advance financing facilities.
Interest rate risk is a function of (i) the timing of re-pricing and (ii) the dollar amount of assets and liabilities that re-price at various times. We are exposed to interest rate risk to the extent that our interest rate-sensitive liabilities mature or re-price at different speeds, or on different bases, than interest-earning assets.
Our management-level Market Risk Committee establishes and maintains policies that govern our hedging program, including such factors as market volatility, duration and interest rate sensitivity measures, targeted hedge ratios, the hedge instruments that we are permitted to use in our hedging activities and the counterparties with whom we are permitted to enter into hedging transactions and our liquidity risk profile. See
Note 17 — Derivative Financial Instruments and Hedging Activities
to the Consolidated Financial Statements for additional information regarding our use of derivatives.
Our market risk exposure may also be affected by the phase-out of LIBOR, expected to occur by the end of 2021. Many of our debt facilities incorporate LIBOR. These facilities either mature prior to the end of 2021 or have terms in place that provide for an alternative to LIBOR upon its phase-out. As we renew or replace these debt facilities, we will need to work with our counterparties to incorporate alternative benchmarks. There is presently substantial uncertainty relating to the process and timeline for developing LIBOR alternatives, how widely any given alternative will be adopted by parties in the financial markets, and the extent to which alternative benchmarks may be subject to volatility or present risks and challenges that LIBOR does not. Consequently, it is difficult to predict what effect, if any, the phase-out of LIBOR and the use of alternative benchmarks may have on our business or on the overall financial markets. If LIBOR alternatives re-allocate risk among parties in a way that is disadvantageous to market participants such as Ocwen, or if uncertainty relating to the LIBOR phase-out disrupts financial markets, it could have a material adverse effect on our financial position, results of operations, and liquidity.
MSR Hedging Strategy
MSRs are carried at fair value with changes in fair value being recorded in earnings in the period in which the changes occur. The fair value of MSRs is subject to changes in market interest rates and prepayment speeds. Beginning in September 2019, management implemented a hedging strategy to partially offset the changes in fair value of our net MSR portfolio attributable to interest rate changes. As a general matter, the impact of interest rates on the fair value of our MSR portfolio is naturally offset by other exposures, including our pipeline and our economic MSR value embedded in our reverse mortgage loan portfolio. Our hedging strategy is targeted at mitigating the residual exposure, which we refer to as our net MSR portfolio exposure. We define our net MSR portfolio exposure as follows:
|
•
|
our more interest rate-sensitive Agency MSR portfolio,
|
|
•
|
less the Agency MSRs subject to our agreements with NRZ (See
Note 10 — Rights to MSRs
),
|
|
•
|
less the unsecuritized reverse mortgage loans and tails classified as held-for-investment,
|
|
•
|
less the asset value for securitized HECM loans net of the corresponding HMBS-related borrowings, and
|
|
•
|
less the net value of our held for sale loan portfolio and lock commitments (pipeline).
|
We determine and monitor daily the hedge coverage based on the duration and interest rate sensitivity measures of our net MSR portfolio exposure, considering market and liquidity conditions. At
December 31, 2019
, our hedging strategy provides for a partial coverage of our net MSR portfolio exposure of approximately
37%
. The changes in fair value of our hedging instruments
77
may not offset the changes in fair value of our net MSR portfolio exposure attributable to interest rate changes due to the partial hedge coverage and other factors.
The following table illustrates the composition of our net MSR portfolio exposure at
December 31, 2019
with the associated interest rate sensitivity for a hypothetical, instantaneous decrease in interest rate of 25 basis points assuming a parallel shift in interest rate yield curves (refer to the description below under Sensitivity Analysis). The amounts based on market risk sensitive measures are hypothetical and presented for illustrative purposes only. Changes in fair value cannot be extrapolated because the relationship to the change in fair value may not be linear.
|
Dollars in millions
|
Fair value at December 31, 2019
|
Hypothetical change in fair value due to 25 bps rate decrease
|
|||||
|
Agency MSR - interest rate sensitive
|
$
|
714.0
|
|
$
|
(54.2
|
)
|
|
|
Less NRZ Agency MSR financing liability
|
(312.1
|
)
|
29.5
|
|
|||
|
Net Agency MSR exposure
|
$
|
401.9
|
|
$
|
(24.7
|
)
|
|
|
Asset value of securitized HECM loans, net of HMBS-related liability
|
$
|
60.6
|
|
$
|
2.6
|
|
|
|
HFI unsecuritized HECM loans and tails
|
145.5
|
|
0.7
|
|
|||
|
Loans held for sale
|
208.8
|
|
1.9
|
|
|||
|
Pipeline IRLCs
|
4.9
|
|
(0.2
|
)
|
|||
|
Net MSR portfolio exposure (sum of the above)
|
(19.7
|
)
|
|||||
|
Hypothetical 30% offset by hedging instruments
|
5.9
|
|
|||||
|
Hypothetical residual exposure to changes in interest rates
|
$
|
(13.8
|
)
|
||||
We use forward trades of MBS or Agency TBAs with different banking counterparties as hedging instruments that are not designated as accounting hedges. TBAs, or To-Be-Announced securities are actively traded, forward contracts to purchase or sell Agency MBS on a specific future date. We report changes in fair value of these derivative instruments in MSR valuation adjustments, net in our consolidated statements of operations.
The TBAs are subject to margin requirements. Ocwen may be required to post or may be entitled to receive cash collateral with its counterparties, based on daily value changes of the instruments. Changes in market factors, including interest rates, and our credit rating could require us to post additional cash collateral and could have a material adverse impact on our financial condition and liquidity.
MSRs and MSR Financing Liabilities
Effective January 1, 2018, we elected fair value accounting for our MSRs previously accounted for using the amortization method, which included Agency MSRs and government-insured MSRs. Effective with this election, our entire portfolio of MSRs is accounted for using the fair value measurement method. MSRs are subject to interest rate risk as the mortgage loans underlying the MSRs permit borrowers to prepay their loans. The fair value of MSRs generally decreases in periods where interest rates are declining, as prepayments increase, and generally increases in periods where interest rates are increasing, as prepayments decrease.
While the majority of our non-Agency MSRs have been sold to NRZ, these transactions did not qualify as sales and are accounted for as secured financings. We have elected fair value accounting for these MSR financing liabilities. Through these transactions, the majority of the risks and rewards of ownership of the MSRs transferred to NRZ, including interest rate risk. Changes in the fair value of the MSRs sold to NRZ are offset by a corresponding change in the fair value of the MSR financing liabilities, which are recognized as a component of interest expense in our consolidated statements of operations.
Loans Held for Sale, Loans Held for Investment and IRLCs
In our lending business, newly-originated forward mortgage loans held for sale and newly originated reverse mortgage loans held for investment that we have elected to carry at fair value and IRLCs are subject to the effects of changes in mortgage interest rates from the date of the commitment through the sale of the loan into the secondary market. IRLCs represent an agreement to purchase loans from a third-party originator or an agreement to extend credit to a mortgage loan applicant, whereby the interest rate on the loan is set prior to funding. We are exposed to interest rate risk and related price risk during the period from the date of the lock commitment through (i) the lock commitment cancellation or expiration date or (ii) through the date of sale of the resulting loan into the secondary mortgage market. Loan commitments for forward loans range from 5 to 90 days, but the majority of our commitments are for 60 days. Our holding period for forward mortgage loans from funding to sale is typically
78
less than 30 days. Loan commitments for reverse mortgage loans range from 10 to 30 days. The majority of our reverse loans are variable rate loan commitments. This interest rate exposure had historically been economically hedged with freestanding derivatives, including forward sales of agency “to be announced” securities (TBAs) and forward mortgage-backed securities (Forward MBS). Beginning in September 2019, this exposure is not individually hedged, but rather used as an offset to our MSR exposure and managed as part of our MSR hedging strategy described above.
Loans Held for Investment and HMBS-related Borrowings
We elected fair value accounting for the entire reverse mortgage HECM loan portfolio, which is held for investment, together with the HMBS-related borrowings. The fair value of our HECM loan portfolio decreases as market interest rates rise and increases as market rates fall. As our HECM loan portfolio is predominantly comprised of ARMs, higher interest rates cause the loan balance to accrue and reach a 98% maximum claim amount liquidation event more quickly, with lower interest rates extending the timeline to liquidation
.
The fair value of our HECM loan portfolio net of the fair value of the HMBS-related borrowings comprise the fair value of reverse mortgage loans and tails that are unsecuritized at the balance sheet date (reverse pipeline) and the fair value of securitized HECM loans net of the corresponding HMBS-related borrowings that represent the reverse mortgage economic MSR (HMSR) for risk management purposes. Both reverse assets (reverse pipeline and HMSR) act as a partial hedge for our forward MSR value sensitivity. Due to this characteristic, beginning in September 2019, this exposure is used as an offset to our MSR exposure and managed as part of our MSR hedging strategy described above.
Match Funded Liabilities
We monitor the effect of increases in interest rates on the interest paid on our variable-rate advance financing debt. Earnings on cash and float balances are a partial offset to our exposure to changes in interest expense. We purchase interest rate caps as economic hedges (not designated as a hedge for accounting purposes) when required by our advance financing arrangements.
Sensitivity Analysis
Fair Value MSRs, Loans Held for Sale, Loans Held for Investment and Related Derivatives
The following table summarizes the estimated change in the fair value of our MSRs, HECM loans held for investment and loans held for sale that we have elected to carry at fair value as well as any related derivatives at
December 31, 2019
, given hypothetical instantaneous parallel shifts in the yield curve. We used
December 31, 2019
market rates to perform the sensitivity analysis. The estimates are based on the interest rate risk sensitive portfolios described in the preceding paragraphs and assume instantaneous, parallel shifts in interest rate yield curves. These sensitivities are hypothetical and presented for illustrative purposes only. Changes in fair value based on variations in assumptions generally cannot be extrapolated because the relationship to the change in fair value may not be linear.
|
|
Change in Fair Value
|
||||||
|
Dollars in millions
|
Down 25 bps
|
Up 25 bps
|
|||||
|
Asset value of securitized HECM loans, net of HMBS-related liability
|
$
|
2.6
|
|
$
|
(2.2
|
)
|
|
|
HFI unsecuritized HECM loans and tails
|
0.7
|
|
(0.7
|
)
|
|||
|
Loans held for sale
|
1.9
|
|
(2.3
|
)
|
|||
|
TBA / Forward MBS trades
|
10.1
|
|
(12.4
|
)
|
|||
|
Total
|
15.3
|
|
(17.6
|
)
|
|||
|
MSRs (1)
|
(53.5
|
)
|
53.4
|
|
|||
|
MSRs, embedded in pipeline
|
(0.2
|
)
|
0.3
|
|
|||
|
Total MSRs (2)
|
(53.7
|
)
|
53.7
|
|
|||
|
Total, net
|
$
|
(38.4
|
)
|
$
|
36.1
|
|
|
|
(1)
|
Primarily reflects the impact of market interest rate changes on projected prepayments on the Agency MSR portfolio and on advance funding costs on the non-Agency MSR portfolio carried at fair value. Fair value adjustments to our MSRs are offset, in part, by fair value adjustments related to the NRZ financing liabilities, which are recorded in Pledged MSR liability expense. Approximately
54%
of the above change in fair value would be offset by Pledged MSR liability expense on the NRZ financing liabilities.
|
|
(2)
|
Forward mortgage loans only.
|
79
Borrowings
The majority of the debt used to finance much of our operations is exposed to interest rate fluctuations. We may purchase interest rate swaps and interest rate caps to minimize future interest rate exposure from increases in interest rates, or when required by the financing agreements.
Based on
December 31, 2019
balances, if interest rates were to increase by 1% on our variable rate debt and interest earning cash and float balances, we estimate a net positive impact of approximately
$9.3 million
resulting from an increase of
$22.3 million
in annual interest income and an increase of
$13.0 million
in annual interest expense.
Home Prices
Inactive reverse mortgage loans for which the maximum claim amount has not been met are generally foreclosed upon on behalf of Ginnie Mae with the REO remaining in the related HMBS until liquidation. Inactive MCA repurchased loans are generally foreclosed upon and liquidated by the HMBS issuer. Although active and inactive reverse mortgage loans are insured by FHA, we may incur expenses and losses in the process of repurchasing and liquidating these loans that are not reimbursable by FHA in accordance with program guidelines. In addition, in certain circumstances, we may be subject to real estate price risk to the extent we are unable to liquidate REO within the FHA program guidelines. As our reverse mortgage portfolio seasons, and the volume of MCA repurchases increases, our exposure to this risk will increase.
Interest Rate Sensitive Financial Instruments
The tables below present the notional amounts of our financial instruments that are sensitive to changes in interest rates categorized by expected maturity and the related fair value of these instruments at
December 31, 2019
and
2018
. We use certain assumptions to estimate the expected maturity and fair value of these instruments. We base expected maturities upon contractual maturity and projected repayments and prepayments of principal based on our historical experience. The actual maturities of these instruments could vary substantially if future prepayments differ from our historical experience. Average interest rates are based on the contractual terms of the instrument and, in the case of variable rate instruments, reflect estimates of applicable forward rates. The averages presented represent weighted averages.
|
|
Expected Maturity Date at December 31, 2019
|
|
|
||||||||||||||||||||||||||||
|
|
2020
|
2021
|
2022
|
2023
|
2024
|
There- after
|
Total Balance
|
Fair Value (1)
|
|||||||||||||||||||||||
|
Rate-Sensitive Assets:
|
|
|
|
|
|
|
|
|
|
|
|
|
|
|
|
|
|||||||||||||||
|
Interest-earning cash
|
$
|
433,224
|
|
$
|
—
|
|
$
|
—
|
|
$
|
—
|
|
$
|
—
|
|
$
|
—
|
|
$
|
433,224
|
|
$
|
433,224
|
|
|||||||
|
Average interest rate
|
1.74
|
%
|
—
|
%
|
—
|
%
|
—
|
%
|
—
|
%
|
—
|
%
|
1.74
|
%
|
|
|
|||||||||||||||
|
Loans held for sale, at fair value
|
208,752
|
|
—
|
|
—
|
|
—
|
|
—
|
|
—
|
|
208,752
|
|
208,752
|
|
|||||||||||||||
|
Average interest rate
|
5.41
|
%
|
—
|
%
|
—
|
%
|
—
|
%
|
—
|
%
|
—
|
%
|
5.41
|
%
|
|
|
|||||||||||||||
|
Loans held for sale, at lower of cost or fair value (2)
|
5,009
|
|
6
|
|
—
|
|
559
|
|
203
|
|
60,740
|
|
66,517
|
|
66,517
|
|
|||||||||||||||
|
Average interest rate
|
4.67
|
%
|
5.29
|
%
|
—
|
%
|
5.52
|
%
|
7.06
|
%
|
4.38
|
%
|
4.42
|
%
|
|
|
|||||||||||||||
|
Loans held for investment
|
258,058
|
|
275,651
|
|
608,912
|
|
1,231,545
|
|
1,566,200
|
|
2,329,230
|
|
6,269,596
|
|
6,269,596
|
|
|||||||||||||||
|
Average interest rate
|
4.77
|
%
|
4.57
|
%
|
4.71
|
%
|
4.92
|
%
|
4.91
|
%
|
4.95
|
%
|
4.82
|
%
|
|||||||||||||||||
|
Debt service accounts and interest-earning time deposits
|
23,463
|
|
203
|
|
—
|
|
—
|
|
—
|
|
—
|
|
23,666
|
|
23,666
|
|
|||||||||||||||
|
Average interest rate
|
0.11
|
%
|
9.90
|
%
|
—
|
%
|
—
|
%
|
—
|
%
|
—
|
%
|
0.19
|
%
|
|
|
|||||||||||||||
|
Total rate-sensitive assets
|
$
|
928,506
|
|
$
|
275,860
|
|
$
|
608,912
|
|
$
|
1,232,104
|
|
$
|
1,566,403
|
|
$
|
2,389,970
|
|
$
|
7,001,755
|
|
$
|
7,001,755
|
|
|||||||
|
Percent of total
|
13.26
|
%
|
3.94
|
%
|
8.70
|
%
|
17.60
|
%
|
22.37
|
%
|
34.13
|
%
|
100.00
|
%
|
|
|
|||||||||||||||
|
Rate-Sensitive Liabilities:
|
|
|
|
|
|
|
|
|
|
|
|
|
|
|
|
|
|||||||||||||||
|
Match funded liabilities
|
$
|
394,109
|
|
$
|
285,000
|
|
$
|
—
|
|
$
|
—
|
|
$
|
—
|
|
$
|
—
|
|
$
|
679,109
|
|
$
|
679,507
|
|
|||||||
|
Average interest rate
|
3.02
|
%
|
2.53
|
%
|
—
|
%
|
—
|
%
|
—
|
%
|
—
|
%
|
2.81
|
%
|
|||||||||||||||||
|
Senior notes
|
—
|
|
21,543
|
|
291,509
|
|
—
|
|
—
|
|
—
|
|
313,052
|
|
270,022
|
|
|||||||||||||||
|
Average interest rate
|
—
|
%
|
6.38
|
%
|
8.38
|
%
|
—
|
%
|
—
|
%
|
—
|
%
|
7.80
|
%
|
|||||||||||||||||
|
SSTL and other borrowings (3) (4)
|
832,078
|
|
98,971
|
|
41,663
|
|
—
|
|
—
|
|
57,594
|
|
1,030,306
|
|
1,010,789
|
|
|||||||||||||||
|
Average interest rate
|
4.96
|
%
|
5.71
|
%
|
—
|
%
|
—
|
%
|
5.07
|
%
|
—
|
%
|
4.74
|
%
|
|||||||||||||||||
|
Total rate-sensitive liabilities
|
$
|
1,226,187
|
|
$
|
405,514
|
|
$
|
333,172
|
|
$
|
—
|
|
$
|
—
|
|
$
|
57,594
|
|
$
|
2,022,467
|
|
$
|
1,960,318
|
|
|||||||
|
Percent of total
|
60.63
|
%
|
20.05
|
%
|
16.47
|
%
|
—
|
%
|
—
|
%
|
3
|
%
|
100.00
|
%
|
|
|
|||||||||||||||
80
|
|
Expected Maturity Date at December 31, 2019 (Notional Amounts)
|
|
|
||||||||||||||||||||||||||||
|
|
2020
|
2021
|
2022
|
2023
|
2024
|
There- after
|
Total
Balance
|
Fair
Value (1)
|
|||||||||||||||||||||||
|
Rate-Sensitive Derivative Financial Instruments:
|
|||||||||||||||||||||||||||||||
|
Derivative assets (liabilities)
|
|||||||||||||||||||||||||||||||
|
Interest rate caps
|
$
|
27,083
|
|
$
|
—
|
|
$
|
—
|
|
$
|
—
|
|
$
|
—
|
|
$
|
—
|
|
$
|
27,083
|
|
$
|
—
|
|
|||||||
|
Average strike rate
|
3.00
|
%
|
—
|
%
|
—
|
%
|
—
|
%
|
—
|
%
|
—
|
%
|
3.00
|
%
|
|||||||||||||||||
|
Forward MBS trades
|
60,000
|
|
—
|
|
—
|
|
—
|
|
—
|
|
—
|
|
$
|
60,000
|
|
$
|
(92
|
)
|
|||||||||||||
|
Average coupon
|
—
|
%
|
—
|
%
|
—
|
%
|
—
|
%
|
—
|
%
|
—
|
%
|
—
|
%
|
|||||||||||||||||
|
TBA / Forward MBS Trades
|
1,200,000
|
|
—
|
|
—
|
|
—
|
|
—
|
|
—
|
|
1,200,000
|
|
1,121
|
|
|||||||||||||||
|
Average coupon
|
3.00
|
%
|
—
|
|
—
|
|
—
|
|
—
|
|
—
|
|
3.00
|
%
|
|||||||||||||||||
|
IRLCs
|
232,566
|
|
—
|
|
—
|
|
—
|
|
—
|
|
—
|
|
232,566
|
|
4,878
|
|
|||||||||||||||
|
Total derivatives, net
|
$
|
1,519,649
|
|
$
|
—
|
|
$
|
—
|
|
|
$
|
—
|
|
|
$
|
—
|
|
|
$
|
—
|
|
|
$
|
1,519,649
|
|
|
$
|
5,907
|
|
||
|
Forward LIBOR curve (5)
|
1.76
|
%
|
1.51
|
%
|
1.48
|
%
|
1.58
|
%
|
1.68
|
%
|
1.77
|
%
|
|||||||||||||||||||
|
|
Expected Maturity Date at December 31, 2018
|
|
|
||||||||||||||||||||||||||||
|
|
2019
|
2020
|
2021
|
2022
|
2023
|
There- after
|
Total Balance
|
Fair Value (1)
|
|||||||||||||||||||||||
|
Rate-Sensitive Assets:
|
|
|
|
|
|
|
|
|
|
|
|
|
|
|
|
|
|||||||||||||||
|
Interest-earning cash
|
$
|
266,235
|
|
$
|
—
|
|
$
|
—
|
|
$
|
—
|
|
$
|
—
|
|
$
|
—
|
|
$
|
266,235
|
|
$
|
266,235
|
|
|||||||
|
Average interest rate
|
2.31
|
%
|
—
|
%
|
—
|
%
|
—
|
%
|
—
|
%
|
—
|
%
|
2.31
|
%
|
|
|
|||||||||||||||
|
Loans held for sale, at fair value
|
176,525
|
|
—
|
|
—
|
|
—
|
|
—
|
|
—
|
|
176,525
|
|
176,525
|
|
|||||||||||||||
|
Average interest rate
|
7.33
|
%
|
—
|
%
|
—
|
%
|
—
|
%
|
—
|
%
|
—
|
%
|
7.33
|
%
|
|
|
|||||||||||||||
|
Loans held for sale, at lower of cost or fair value (2)
|
8,858
|
|
—
|
|
24
|
|
—
|
|
272
|
|
56,943
|
|
66,097
|
|
66,097
|
|
|||||||||||||||
|
Average interest rate
|
5.00
|
%
|
—
|
%
|
8.97
|
%
|
—
|
%
|
5.51
|
%
|
4.89
|
%
|
4.91
|
%
|
|
|
|||||||||||||||
|
Loans held for investment
|
572,968
|
|
508,371
|
|
544,145
|
|
611,628
|
|
687,869
|
|
2,547,218
|
|
5,472,199
|
|
5,472,199
|
|
|||||||||||||||
|
Average interest rate
|
4.95
|
%
|
4.89
|
%
|
4.84
|
%
|
4.85
|
%
|
4.93
|
%
|
4.99
|
%
|
4.85
|
%
|
|||||||||||||||||
|
Debt service accounts and interest-earning time deposits
|
27,569
|
|
235
|
|
160
|
|
—
|
|
—
|
|
—
|
|
27,964
|
|
27,964
|
|
|||||||||||||||
|
Average interest rate
|
0.24
|
%
|
12.61
|
%
|
7.65
|
%
|
—
|
%
|
—
|
%
|
—
|
%
|
0.19
|
%
|
|
|
|||||||||||||||
|
Total rate-sensitive assets
|
$
|
1,052,155
|
|
$
|
508,606
|
|
$
|
544,329
|
|
$
|
611,628
|
|
$
|
688,141
|
|
$
|
2,604,161
|
|
$
|
6,009,020
|
|
$
|
6,009,020
|
|
|||||||
|
Percent of total
|
17.51
|
%
|
8.46
|
%
|
9.06
|
%
|
10.18
|
%
|
11.45
|
%
|
43.34
|
%
|
100.00
|
%
|
|
|
|||||||||||||||
|
Rate-Sensitive Liabilities:
|
|
|
|
|
|
|
|
|
|
|
|
|
|
|
|
|
|||||||||||||||
|
Match funded liabilities
|
$
|
628,284
|
|
$
|
150,000
|
|
$
|
—
|
|
$
|
—
|
|
$
|
—
|
|
$
|
—
|
|
$
|
778,284
|
|
$
|
776,485
|
|
|||||||
|
Average interest rate
|
3.57
|
%
|
3.81
|
%
|
—
|
%
|
—
|
%
|
—
|
%
|
—
|
%
|
3.61
|
%
|
|
|
|||||||||||||||
|
Senior notes
|
97,521
|
|
—
|
|
21,543
|
|
330,878
|
|
—
|
|
—
|
|
449,942
|
|
426,147
|
|
|||||||||||||||
|
Average interest rate
|
7.38
|
%
|
—
|
%
|
6.38
|
%
|
8.38
|
%
|
—
|
%
|
—
|
%
|
8.07
|
%
|
|||||||||||||||||
|
SSTL and other borrowings (3) (4)
|
172,463
|
|
214,750
|
|
—
|
|
—
|
|
—
|
|
—
|
|
387,213
|
|
383,162
|
|
|||||||||||||||
|
Average interest rate
|
2.96
|
%
|
6.50
|
%
|
—
|
%
|
—
|
%
|
—
|
%
|
—
|
%
|
5.49
|
%
|
|
|
|||||||||||||||
|
Total rate-sensitive liabilities
|
$
|
898,268
|
|
$
|
364,750
|
|
$
|
21,543
|
|
$
|
330,878
|
|
$
|
—
|
|
$
|
—
|
|
$
|
1,615,439
|
|
$
|
1,585,794
|
|
|||||||
|
Percent of total
|
55.61
|
%
|
22.58
|
%
|
1.33
|
%
|
20.48
|
%
|
—
|
%
|
—
|
%
|
100.00
|
%
|
|
|
|||||||||||||||
|
|
Expected Maturity Date at December 31, 2018 (Notional Amounts)
|
|
|
||||||||||||||||||||||||||||
|
|
2019
|
2020
|
2021
|
2022
|
2023
|
There- after
|
Total
Balance
|
Fair
Value (1)
|
|||||||||||||||||||||||
|
Rate-Sensitive Derivative Financial Instruments:
|
|
|
|
|
|
|
|
|
|
|
|
|
|
|
|
|
|||||||||||||||
|
Derivative assets (liabilities)
|
|
|
|
|
|
|
|
|
|
|
|
|
|
|
|
|
|||||||||||||||
|
Interest rate caps
|
$
|
240,833
|
|
$
|
19,167
|
|
$
|
—
|
|
$
|
—
|
|
$
|
—
|
|
$
|
—
|
|
$
|
260,000
|
|
$
|
678
|
|
|||||||
|
Average strike rate
|
1.98
|
%
|
3.00
|
%
|
—
|
%
|
—
|
%
|
—
|
%
|
—
|
%
|
2.06
|
%
|
|
|
|||||||||||||||
|
Forward MBS trades
|
165,363
|
|
—
|
|
—
|
|
—
|
|
—
|
|
—
|
|
165,363
|
|
(4,983
|
)
|
|||||||||||||||
|
Average coupon
|
4.02
|
%
|
—
|
%
|
—
|
%
|
—
|
%
|
—
|
%
|
—
|
%
|
4.02
|
%
|
|||||||||||||||||
|
IRLCs
|
150,175
|
|
—
|
|
—
|
|
—
|
|
—
|
|
—
|
|
150,175
|
|
3,871
|
|
|||||||||||||||
|
Total derivatives, net
|
$
|
556,371
|
|
$
|
19,167
|
|
$
|
—
|
|
$
|
—
|
|
$
|
—
|
|
$
|
—
|
|
$
|
575,538
|
|
$
|
(434
|
)
|
|||||||
|
Forward LIBOR curve (5)
|
2.50
|
%
|
2.49
|
%
|
2.35
|
%
|
2.37
|
%
|
2.44
|
%
|
2.53
|
%
|
|
|
|
|
|||||||||||||||
|
(1)
|
See
Note 5 — Fair Value
to the Consolidated Financial Statements for additional fair value information on financial instruments.
|
|
(2)
|
Net of valuation allowances and including non-performing loans.
|
|
(3)
|
Excludes financing liabilities that result from sales of assets that do not qualify as sales for accounting purposes and, therefore, are accounted for as secured financings, which have no contractual maturity and are amortized over the life of the related assets.
|
81
|
(4)
|
Amounts are exclusive of any related discount or unamortized debt issuance costs.
|
|
(5)
|
Average 1-Month LIBOR for the periods indicated.
|
Liquidity Risk
We are exposed to liquidity risk through our ongoing needs to originate and finance mortgage loans, sell mortgage loans into secondary markets, retain and finance MSRs, make and finance advances, fund and sell additional future draws by borrowers under variable rate HECM loans, meet our HMBS issuer obligations with respect to MCA repurchases, repay maturing debt, meet our contractual obligations and otherwise fund our operations. Liquidity is an essential component of our ability to operate and grow our business; therefore, it is crucial that we maintain adequate levels of excess liquidity to fund our businesses during normal economic cycles and events of market stress.
We estimate how our liquidity needs may be impacted by a number of factors, including fluctuations in asset and liability levels due to our business strategy, asset valuations, changes in cash flows from operations, levels of interest rates, debt service requirements including contractual amortization and maturities, and unanticipated events, including legal and regulatory expenses. We also assess market conditions and capacity for debt issuance in the various markets that we access to fund our business needs. We have established internal processes to anticipate future cash needs and continuously monitor the availability of funds pursuant to our existing debt arrangements. We monitor MSR asset valuations monthly and communicate closely with our lenders for this asset class to ensure adequate liquidity is maintained for mark-to-market valuation changes within MSR financing facilities. We manage this risk in multiple ways, including but not limited to engaging in MSR hedging activities, and maintaining liquidity earmarks at levels to support potential changes in MSR fair values.
We regularly evaluate capital structure options that we believe will most effectively provide the necessary capacity to support our investment objectives, address upcoming debt maturities and contractual amortization, and accommodate our business needs. Our objective is to maximize the total investment capacity through diversification of our funding sources while optimizing cost, advance rates and terms. Historical losses have significantly eroded our stockholders’ equity and weakened our financial condition. To the extent we are not successful in achieving our near-term objective of returning to profitability, funding continuing losses will limit opportunities to grow our business.
We address liquidity risk by maintaining borrowing capacity in excess of our expected needs and by extending the tenor of our financing arrangements from time to time. For example, to fund additional advance obligations, we have typically “upsized” existing advance facilities or entered into new advance facilities in anticipation of the funding obligation and then pledged additional advances to support the borrowing. In general, we finance our assets and operating requirements through cash on hand, operating cash flow, advance financing facilities and other secured borrowings.
Operational Risk
Operational risk is inherent in each of our business lines and related support activities. This risk can manifest itself in various ways, including process execution errors, clerical or technological failures or errors, business interruptions and frauds, all of which could cause us to incur losses. Operational risk includes the following key risks:
|
•
|
legal risk, as we can have legal disputes with borrowers or counterparties;
|
|
•
|
compliance risk, as we are subject to many federal and state rules and regulations;
|
|
•
|
third-party risk, as we have many processes that have been outsourced to third parties;
|
|
•
|
information technology risk, as we operate many information systems that depend on proper functioning of hardware and software;
|
|
•
|
information security risk, as our information systems and associates handle personal financial data of borrowers.
|
The Board of Directors provides direction to senior executives by setting our organization’s risk appetite, and delegates to our Chief Executive Officer and senior executives the primary ownership and responsibility for operational risk management and control. Senior executives in our risk department oversee the establishment of policies and control frameworks that are designed, executed and administered to provide a sound and well-controlled operational environment in accordance with our risk appetite framework. We mandate training for our employees in respect to these policies, require business line change control oversight, and we conduct control assessment/reviews on a regular basis. Risk issues identified are tracked in our Governance, Risk and Compliance (GRC) system. Remediation and assurance testing are also tracked in our GRC system. We also have several channels for employees to report operational and/or technological issues affecting their operations to management, the operational risk or compliance teams or the Board.
We seek to embed a culture of compliance and business line responsibility for managing operational and compliance risks in our enterprise-wide approach toward risk management. Ocwen has adopted a “Three Lines of Defense” model to enable risks and controls to be properly managed on an on-going basis. The model delineates business line management's accountabilities and responsibilities over risk management and the control environment and includes mechanisms to assess the effectiveness of executing these responsibilities.
82
The first line of defense consists of business line management, dedicated control directors and quality assurance personnel who are accountable and responsible for their day-to-day activities, processes and controls. The first line of defense is responsible for ensuring that key risks within their activities and operations are identified, assessed, mitigated and monitored by an appropriate control environment that is commensurate with the operations risk profile.
The second line of defense is independent from the business and comprises a Risk Management function (including Third-Party Risk and Information Security) and a Compliance function, which are responsible for:
|
•
|
providing assurance, oversight, and credible challenge over the effectiveness of the risk and control activities conducted by the first line;
|
|
•
|
establishing frameworks to identify and measure the risks being taken by different parts of the business;
|
|
•
|
monitoring risk levels, through key indicators and oversight/assurance and testing programs; and
|
|
•
|
provide periodic reporting to Senior Management and the Board of Directors for transparency.
|
The third line of defense, Internal Audit, provides independent assurance as to the effectiveness of the design, implementation and embedding of the risk management frameworks, as well as the management of the risks and controls by the first line and control oversight by the second line. The Internal Audit function provides periodic reporting on its activities to Senior Management and the Board of Directors for transparency.
All business units and overhead functions are subject to unrestricted audits by our internal audit department. Internal audit is granted unrestricted access to our records, physical properties, systems, management and employees in order to perform these audits. The internal audit department reports to the Audit Committee of the Board and assists the Audit Committee in fulfilling its governance and oversight responsibility.
Compliance risk is managed through an enterprise-wide compliance risk management program designed to monitor, detect and deter compliance issues. Our compliance and risk management policies assign primary responsibility and accountability for the management of compliance risk in the lines of business to business line management.
Information Security Risk oversight is performed by our Chief Information Security Officer. Ocwen’s information security plans are developed to meet or exceed Federal Financial Institutions Examination Council standards.
Credit Risk
Consumer Credit Risk
The credit-related risks inherent in maintaining a mortgage loan portfolio as an investment tend to impact us less than a typical long-term investor because we generally sell the mortgage loans that we originate in the secondary market shortly after origination through GSE and Ginnie Mae guaranteed securitizations and whole loan transactions. We are exposed to early payment defaults from the time that we originate a loan to the time that the loan is sold in the secondary market or shortly thereafter. Early payment defaults are monitored and loans are audited by our quality assurance teams for origination defects. Our exposure to early payment defaults remains very limited and we do not anticipate material losses from this exposure.
Servicing costs are generally higher on higher credit risk loans. In addition, higher credit risk loans are generally affected to a greater extent by an economic downturn or a deterioration of the housing market. An increase in delinquencies and foreclosure rates generally results in increased advances for delinquent principal and interest, taxes and insurance, foreclosure costs and the upkeep of vacant property in foreclosure. Interest expense on advances and higher operating expenses decrease the value of our servicing portfolio. We track the credit risk profile of our servicing portfolio, including the recoverability of advances, with a view to ensuring that changes in portfolio credit risk are identified on a timely basis.
We have loan repurchase and indemnification obligations arising from potential breaches of the representation and warranty provisions in connection with loans we sell in the secondary market. In the event of a breach of these representations and warranties, we may be required to repurchase a mortgage loan or indemnify the purchaser, and we may bear any subsequent loss on the mortgage loan.
We endeavor to minimize our losses from loan repurchases and indemnifications by focusing on originating fully compliant mortgage loans and closely monitoring investor and agency eligibility requirements for loan sales. Our quality assurance teams perform independent audits related to the processing and underwriting of mortgage loans prior to closing, as well as after the closing but before the sale of loans, to identify potential repurchase exposures due to breach of representations and warranties. In addition, we perform a comprehensive review of the loan files where we receive investor requests for repurchase and indemnification to establish the validity of the claims and determine our obligation. In limited circumstances, we may retain the full risk of loss on loans sold to the extent that the liquidation value of the asset collateralizing the loan is insufficient to cover the loan itself and associated servicing expenses. In instances where we have purchased loans from third parties, we usually have the ability to recover the loss from the third-party originator.
83
Counterparty Credit Risk
Counterparty credit risk represents the potential loss that may occur because a party to a transaction fails to perform according to the terms of the contract. We regularly evaluate the financial position and creditworthiness of our counterparties and disperse risk among multiple counterparties to the extent possible. We manage derivative counterparty credit risk by entering into financial instrument transactions through national exchanges, primary dealers or approved counterparties and using mutual margining agreements whenever possible to limit potential exposure.
NRZ is contractually obligated, pursuant to our agreements with them related to the Rights to MSRs, to make all advances required in connection with the loans underlying such MSRs. If NRZ’s advance financing facilities do not perform as envisaged or should NRZ otherwise be unable to meets its advance financing obligations, we would be required to meet our advance financing obligations with respect to the loans underlying these Rights to MSRs, which could materially and adversely affect our liquidity, financial condition and servicing operations.
Counterparty credit risk exists with our third-party originators, including our correspondent lenders, from whom we purchase originated mortgage loans. The third-party originators make certain representations and warranties to us when we acquire the mortgage loan from them, and they agree to reimburse us for losses incurred due to an origination defect. We become exposed to losses for origination defects if the third-party originator is not able to reimburse us for losses incurred for indemnification or repurchase. We mitigate this risk by monitoring purchase levels from our third-party originators (to reduce concentration risk), by performing regular quality control reviews of the third-party originators’ underwriting standards and by regular reviews of the creditworthiness of third-party originators.
Concentration Risk
Our Servicing segment has exposure to concentration risk and client retention risk. As of
December 31, 2019
, our servicing portfolio included significant client relationships with NRZ which represented
56%
and
61%
of our servicing portfolio UPB and loan count, respectively. The NRZ servicing portfolio accounts for approximately
74%
of all delinquent loans that Ocwen services. During 2019, NRZ-related servicing fees retained by Ocwen represented approximately
36%
of the total servicing and subservicing fees earned by Ocwen, net of servicing fees remitted to NRZ (excluding ancillary income). The current terms of our agreements with NRZ extend through June 2020 (legacy PMC agreement) and July 2022 (legacy Ocwen agreements).
On February 20, 2020, we received a notice of termination from NRZ with respect to the legacy PMC subservicing agreement. This termination is for convenience (and not for cause). The notice states that the effective date of termination is June 19, 2020 for 25% of the loans under the agreement (not including loans constituting approximately
$6.6 billion
in UPB that were added by NRZ under the agreement in 2019) and August 18, 2020 for the remainder of the loans under the agreement. The actual servicing transfer date(s) will be determined through discussions with NRZ and other stakeholders such as GSEs. In connection with the termination, we estimate that we will receive loan deboarding fees of approximately
$6.1 million
from NRZ. The portfolio subject to termination accounted for
$42.1 billion
in UPB, or
20%
of our total serviced UPB as of December 31, 2019. Under this agreement, in the fourth quarter of 2019, we estimate that operating expenses, including direct expenses and overhead allocation, exceeded the net revenue retained for this portion of the NRZ servicing portfolio by approximately
$3.0 million
. At this stage, we do not anticipate significant operational impacts on our servicing business as a result of this termination. The terminated servicing is comprised of Agency loans with relatively low delinquencies that do not pose a high level of operating and compliance risk or require substantial direct and oversight staffing relative to our non-Agency servicing. Nonetheless, we intend to right-size and reduce expenses in our servicing business and the related corporate support functions to the extent possible to align with our smaller portfolio.
We currently anticipate that the loan deboarding fees from NRZ will offset a significant portion of our transition and restructuring costs assuming an orderly and timely transfer. However, it is possible that the loan deboarding and other transition activities that we will undertake as a result of the termination may not occur in an orderly or timely manner, which could be disruptive and could result in us incurring additional costs or even in disagreements with NRZ relating to our respective rights and obligations. Overall, our current view is that if we can exclude the legacy PMC NRZ servicing portfolio and successfully execute on the necessary transition and expense reduction actions in an orderly and timely manner, we will be able to enhance the long-term financial performance of our servicing business.
Currently, subject to proper notice (generally180 days) and the payment of termination fees, NRZ has rights to terminate the legacy Ocwen agreements for convenience.
In the ordinary course, we regularly share information with NRZ and discuss various aspects of our relationship. At times, we discuss modifications to our relationship that we believe could be to our mutual benefit as our respective businesses evolve over time. We also discuss alternatives to the outcomes contemplated under our agreements when they were originally executed as facts and circumstances change over time. Examples of these discussions include our discussions with respect to the Rights to MSRs and with respect to the $2.7 billion in UPB of MSRs and the related advances that remain to be sold to NRZ under the legacy PMC sale agreement referenced above. As part of these discussions, we discussed several potential changes to existing
84
contracts. It is possible that NRZ could exercise its rights to terminate for convenience some or all of the legacy Ocwen servicing agreements. As of
December 31, 2019
, these agreements accounted for approximately
36.0%
of our servicing portfolio.
Given the NRZ concentration in our servicing segment, senior management has been monitoring two main risks associated with our NRZ relationship, in addition to its strategic component.
First, management has been monitoring the profitability of the NRZ servicing agreements. Based on this analysis, in the fourth quarter of 2019, while a significant portion of the Company’s revenue is derived from the NRZ servicing agreements, we estimated that operating expenses, including direct servicing expenses and overhead allocation, exceeded the net revenue retained for the NRZ servicing portfolio by approximately
$10 million
. As with all estimates, this estimate required the exercise of judgment, including with respect to overhead allocations, and it excludes the benefits of the lump-sum payment amortization. The estimated loss for these subservicing agreements is partially driven by the declining revenue as the loan portfolio amortizes down without a corresponding reduction to our servicing cost over time. As performing loans in the NRZ servicing portfolio have run-off, delinquencies have remained high, resulting in a relatively elevated average cost per loan. Because the NRZ portfolio contains a high percentage of delinquent accounts, it has an inherently high level of potential operational and compliance risk and requires a disproportionately high level of operating staff, oversight support infrastructure and overhead which drives the elevated average cost per loan. We actively pursue cost re-engineering initiatives to continue to reduce our cost-to-service and our corporate overhead, as well as pursue actions to grow our non-NRZ servicing portfolio.
Second, because NRZ has rights to terminate for convenience subject to certain conditions, senior management has been monitoring the Company’s risks associated with a potential early termination or non-renewal of some or all agreements with NRZ. Management developed stress scenarios to assess the operational and financial impact of such termination scenarios, and the necessary mitigating actions. Management’s responses to the different scenarios are all based on the appropriate right-sizing or restructuring of the Company’s operations and include, but are not limited to the adequate reduction of direct servicing resources, the closure of certain facilities in different locations to rationalize property utilization, the appropriate planning of loan deboarding, and the potential reduction in corporate support functions without impairing our ability to effectively operate in a controlled environment.
It is possible that the unwinding of all or a significant portion of our relationship with NRZ may not occur in an orderly or timely manner, which could be disruptive and could result in us incurring additional costs or even in disagreements with NRZ relating to our respective rights and obligations. Furthermore, if NRZ were to take actions to limit or terminate our relationship, that could impact perceptions of other servicing clients, lenders, GSEs or others, which could cause them to take actions that materially and adversely impact our business, liquidity, results of operations and financial condition.
Market conditions, including interest rates and future economic projections, could impact investor demand to hold MSRs, which may result in our loss of additional subservicing relationships, or significantly decrease the number of loans under such relationships.
The mortgaged properties securing the residential loans that we service are geographically dispersed throughout all 50 states, the District of Columbia and two U.S. territories. The five largest concentrations of properties are located in California,
Florida, Texas, New York and Pennsylvania, which, taken together, comprise
40%
of the number of loans serviced at
December 31, 2019
. California has the largest concentration with
13%
of the total loans serviced.
85
CONTRACTUAL OBLIGATIONS AND OFF-BALANCE SHEET ARRANGEMENTS
Contractual Obligations
We believe that we have adequate resources to fund all unfunded commitments to the extent required and meet all contractual obligations as they come due. The following table sets forth certain information regarding amounts we owe to others under contractual obligations as of
December 31, 2019
:
|
|
Less Than
One Year
|
After One Year
Through Three
Years
|
After Three
Years
Through
Five Years
|
After Five
Years
|
Total
|
||||||||||||||
|
Senior secured term loan (1)
|
$
|
326,066
|
|
$
|
—
|
|
$
|
—
|
|
$
|
—
|
|
$
|
326,066
|
|
||||
|
Senior notes (1)
|
—
|
|
313,052
|
|
—
|
|
—
|
|
313,052
|
|
|||||||||
|
Other secured borrowings (1)
|
506,012
|
|
140,634
|
|
—
|
|
57,594
|
|
704,240
|
|
|||||||||
|
Contractual interest payments (2)
|
70,328
|
|
58,819
|
|
1,298
|
|
1,368
|
|
131,813
|
|
|||||||||
|
Originate/purchase mortgages or securities
|
232,566
|
|
—
|
|
—
|
|
—
|
|
232,566
|
|
|||||||||
|
Reverse mortgage equity draws (3)
|
1,502,163
|
|
—
|
|
—
|
|
—
|
|
1,502,163
|
|
|||||||||
|
Operating leases
|
16,652
|
|
28,458
|
|
3,785
|
|
654
|
|
49,549
|
|
|||||||||
|
|
$
|
2,653,787
|
|
$
|
540,963
|
|
$
|
5,083
|
|
$
|
59,616
|
|
$
|
3,259,449
|
|
||||
|
(1)
|
Amounts are exclusive of any related discount, unamortized debt issuance costs or fair value adjustment. Excludes match funded liabilities as these represent debt where the holders only have recourse to the assets that collateralize the debt and such assets are not available to satisfy general claims against Ocwen. Also excludes financing liabilities that result from sales of assets that do not qualify as sales for accounting purposes and, therefore, are accounted for as secured financings. See
Note 14 — Borrowings
to the Consolidated Financial Statements for additional information related to these excluded borrowings. On January 27, 2020, we executed an amendment to the SSTL which reduced the maximum borrowing capacity to $200.0 million (requiring a
$126.1 million
paydown of the outstanding balance), extended the maturity date to May 15, 2022, reduced the quarterly principal payment from $6.4 million to $5.0 million and modified the interest rate. See
Note 28 — Subsequent Events
to the Consolidated Financial Statements for additional information.
|
|
(2)
|
Represents estimated future interest payments on MSR financing facilities, warehouse lines, senior notes and the SSTL, based on applicable interest rates as of
December 31, 2019
.
|
|
(3)
|
Represents additional equity draw obligations in connection with reverse mortgage loans originated or purchased by Liberty. Because these draws can be made in their entirety, we have classified them as due in less than one year at
December 31, 2019
.
|
As of
December 31, 2019
, we had gross unrecognized tax benefits of
$10.6 million
and an additional
$6.6 million
for gross interest and penalties classified as Other liabilities. At this time, we are unable to make a reasonably reliable estimate of the timing of payments in individual years in connection with these tax liabilities, including whether or not these tax liabilities will be paid; therefore, such amounts are not included in the above contractual obligation table.
Our forecasting with respect to our ability to satisfy our contractual obligations requires management to use judgment and estimates and includes factors that may be beyond our control. Additionally, our business has been undergoing substantial change, which has magnified the uncertainties that are inherent in the forecasting process. Our actual results could differ materially from our estimates, and if this were to occur, it could have a material adverse effect on our business, financial condition, liquidity and results of operations.
Off-Balance Sheet Arrangements
In the normal course of business, we engage in transactions with a variety of financial institutions and other companies that are not reflected on our balance sheet. We are subject to potential financial loss if the counterparties to our off-balance sheet transactions are unable to complete an agreed upon transaction. We manage counterparty credit risk by entering into financial instrument transactions through national exchanges, primary dealers or approved counterparties and through the use of mutual margining agreements whenever possible to limit potential exposure. We regularly evaluate the financial position and creditworthiness of our counterparties. Our off-balance sheet arrangements include mortgage loan repurchase and indemnification obligations, unconsolidated special purpose entities (SPEs) (a type of variable interest entity or VIE) and notional amounts of our derivatives.
Mortgage Loan Repurchase and Indemnification Liabilities.
We have exposure to representation, warranty and indemnification obligations in our capacity as a loan originator and servicer. We recognize the fair value of representation and warranty obligations in connection with originations upon sale of the loan or upon completion of an acquisition. Thereafter, the estimation of the liability considers probable future obligations based on industry data of loans of similar type segregated by year of origination and estimated loss severity based on current loss rates for similar loans. Our historical loss severity
86
considers the historical loss experience that we incur upon sale or liquidation of a repurchased loan as well as current market conditions. See
Note 4 — Securitizations and Variable Interest Entities
,
Note 15 — Other Liabilities
and
Note 26 — Contingencies
to the Consolidated Financial Statements for additional information.
Unfunded Lending Commitments.
We have originated floating-rate reverse mortgage loans under which the borrowers have additional borrowing capacity of
$1.5 billion
at
December 31, 2019
. This additional borrowing capacity is available on a scheduled or unscheduled payment basis. See
Note 25 — Commitments
to the Consolidated Financial Statements for additional information.
HMBS Issuer Obligations.
As an HMBS issuer, we assume certain obligations related to each security issued. The most significant obligation is the requirement to purchase loans out of the Ginnie Mae securitization pools once the outstanding principal balance of the related HECM is equal to or greater than 98% of the maximum claim amount (MCA repurchases). Active repurchased loans are assigned to HUD and payment is received from HUD, typically within 60 days of repurchase. HUD reimburses us for the outstanding principal balance on the loan up to the maximum claim amount. We bear the risk of exposure if the amount of the outstanding principal balance on a loan exceeds the maximum claim amount. Inactive repurchased loans (the borrower is deceased, no longer occupies the property or is delinquent on tax and insurance payments) are generally liquidated through foreclosure and subsequent sale of REO, with a claim filed with HUD for recoverable remaining principal and advance balances. See
Note 25 — Commitments
to the Consolidated Financial Statements for additional information.
Involvement with VIEs
. We use SPEs and VIEs for a variety of purposes but principally in the financing of our servicing advances, in the securitization of mortgage loans and in the financing of our MSRs. We include VIEs in our consolidated financial statements if we determine we are the primary beneficiary. See
Note 4 — Securitizations and Variable Interest Entities
to the Consolidated Financial Statements for additional information.
We generally use match funded securitization facilities to finance our servicing advances. The SPEs to which the receivables for servicing advances are transferred in the securitization transaction are included in our consolidated financial statements either because we have the majority equity interest in the SPE or because we are the primary beneficiary where the SPE is a VIE. Holders of the debt issued by the SPEs have recourse only to the assets of the SPEs for satisfaction of the debt.
Derivatives
. We record all derivatives at fair value on our consolidated balance sheets. We use these derivatives primarily to manage our interest rate risk. The notional amounts of our derivative contracts do not reflect our exposure to credit loss. See
Note 17 — Derivative Financial Instruments and Hedging Activities
to the Consolidated Financial Statements for additional information.
CRITICAL ACCOUNTING POLICIES AND ESTIMATES
Our ability to measure and report our financial position and operating results is influenced by the need to estimate the impact or outcome of future events based on information available at the date of the financial statements. An accounting estimate is considered critical if it requires that management make assumptions about matters that were highly uncertain at the time the accounting estimate was made. If actual results differ from our judgments and assumptions, then it may have an adverse impact on the results of operations and cash flows. We have processes in place to monitor these judgments and assumptions, and management is required to review critical accounting policies and estimates with the Audit Committee of the Board of Directors. Our significant accounting policies and critical accounting estimates are described in
Note 1 — Organization, Business Environment, Basis of Presentation and Significant Accounting Policies
to the Consolidated Financial Statements.
Fair Value Measurements
We use fair value measurements to record fair value adjustments to certain instruments in our statement of operations and to determine fair value disclosures. Refer to
Note 5 — Fair Value
to the Consolidated Financial Statements for the fair value hierarchy, descriptions of valuation methodologies used to measure significant assets and liabilities at fair value and details of the valuation models, key inputs to those models, and significant assumptions utilized. We follow the fair value hierarchy to prioritize the inputs utilized to measure fair value. We review and modify, as necessary, our fair value hierarchy classifications on a quarterly basis. As such, there may be reclassifications between hierarchy levels.
87
The following table summarizes assets and liabilities measured at fair value on a recurring and nonrecurring basis and the amounts measured using Level 3 inputs:
|
December 31,
|
|||||||
|
2019
|
2018
|
||||||
|
Loans held for sale
|
$
|
275,269
|
|
$
|
242,622
|
|
|
|
Loans held for investment
|
6,292,938
|
|
5,498,719
|
|
|||
|
MSRs
|
1,486,395
|
|
1,457,149
|
|
|||
|
Derivative assets
|
6,007
|
|
4,552
|
|
|||
|
Mortgage-backed securities
|
2,075
|
|
1,502
|
|
|||
|
U.S. Treasury notes and corporate bonds
|
441
|
|
1,514
|
|
|||
|
Assets at fair value
|
$
|
8,063,125
|
|
$
|
7,206,058
|
|
|
|
As a percentage of total assets
|
77
|
%
|
77
|
%
|
|||
|
Financing liabilities
|
|||||||
|
HMBS-related borrowings
|
6,063,435
|
|
5,380,448
|
|
|||
|
Financing liability - MSRs pledged
|
950,593
|
|
1,032,856
|
|
|||
|
Financing liability - Owed to securitization investors
|
22,002
|
|
24,815
|
|
|||
|
|
7,036,030
|
|
6,438,119
|
|
|||
|
Derivative liabilities
|
100
|
|
4,986
|
|
|||
|
Liabilities at fair value
|
$
|
7,036,130
|
|
$
|
6,443,105
|
|
|
|
As a percentage of total liabilities
|
70
|
%
|
73
|
%
|
|||
|
Assets at fair value using Level 3 inputs
|
$
|
7,847,925
|
|
$
|
7,024,145
|
|
|
|
As a percentage of assets at fair value
|
97
|
%
|
97
|
%
|
|||
|
Liabilities at fair value using Level 3 inputs
|
$
|
7,036,030
|
|
$
|
6,438,119
|
|
|
|
As a percentage of liabilities at fair value
|
100
|
%
|
100
|
%
|
|||
Assets at fair value using Level 3 inputs increased during
2019
primarily due to reverse mortgage originations. Liabilities at fair value using Level 3 inputs increased primarily in connection with reverse mortgage securitizations, which we account for as secured financings.
Our net economic exposure to Loans held for investment - Reverse mortgages and the related Financing liabilities (HMBS-related borrowings) is limited to the residual value we retain. Changes in inputs used to value the loans held for investment are largely offset by changes in the value of the related secured financing.
We have various internal controls in place to ensure the appropriateness of fair value measurements. Significant fair value measures are subject to analysis and management review and approval. Additionally, we utilize a number of operational controls to ensure the results are reasonable, including comparison, or “back testing,” of model results against actual performance and monitoring the market for recent trades, including our own price discovery in connection with potential and completed sales, and other market information that can be used to benchmark inputs or outputs. Considerable judgment is used in forming conclusions about Level 3 inputs such as interest rate movements, prepayment speeds, delinquencies, credit losses and discount rates. Changes to these inputs could have a significant effect on fair value measurements.
Valuation and Amortization of MSRs
MSRs are assets that represent the right to service a portfolio of mortgage loans. We originate MSRs from our lending activities and obtain MSRs through asset acquisitions or business combinations. For initial measurement, acquired and originated MSRs are initially measured at fair value. Subsequent to acquisition or origination, we elect to account for MSRs using either the amortization method or the fair value measurement method. For MSRs accounted for using the amortization measurement method, we assess servicing assets or liabilities for impairment or increased obligation based on fair value on a quarterly basis. We group our MSRs by stratum for impairment testing based on the predominant risk characteristics of the underlying mortgage loans. Historically, our strata had been defined as conventional loans (i.e. conforming to the underwriting standards of Fannie Mae or Freddie Mac), government-insured loans (insured by FHA or VA) and non-Agency loans (i.e. all private label primary and master serviced).
Effective January 1, 2018, we elected fair value accounting for our MSRs previously accounted for using the amortization method, which included Agency MSRs and government-insured MSRs. Effective with this election, our entire portfolio of
88
MSRs is accounted for using the fair value measurement method. This irrevocable election applies to all subsequently acquired or originated servicing assets and liabilities that have characteristics consistent with each of these classes. We recorded a cumulative-effect adjustment of
$82.0 million
to retained earnings as of January 1, 2018 to reflect the excess of the fair value of the Agency MSRs over their carrying amount. The government-insured MSRs were impaired by
$24.8 million
at December 31, 2017; therefore, these MSRs are already effectively carried at fair value.
The determination of the fair value of MSRs requires management judgment due to the number of assumptions that underlie the valuation. We determine the fair value of MSRs primarily using discounted cash flow methodologies. The significant components of the estimated future cash inflows for MSRs include servicing fees, late fees, float earnings and other ancillary fees. Significant cash outflows include the cost of servicing, the cost of financing servicing advances and compensating interest payments.
We engage third-party valuation experts who generally utilize: (a) transactions involving instruments with similar collateral and risk profiles, adjusted as necessary based on specific characteristics of the asset or liability being valued; and/or (b) industry-standard modeling, such as a discounted cash flow model and a prepayment model, in arriving at their estimate of fair value. The prices provided by the valuation experts reflect their observations and assumptions related to market activity, incorporating available industry survey results and client feedback, and including risk premiums and liquidity adjustments. While the models and related assumptions used by the valuation experts are proprietary to them, we understand the methodologies and assumptions used to develop the prices based on our ongoing due diligence, which includes regular discussions with the valuation experts. We believe that the procedures executed by the valuation experts, supported by our verification and analytical procedures, provide reasonable assurance that the prices used in our consolidated financial statements comply with the accounting guidance for fair value measurements and disclosures and reflect the assumptions that a market participant would use.
We evaluate the reasonableness of our third-party experts’ assumptions using historical experience adjusted for prevailing market conditions. The following table provides the range of key assumptions and weighted average (expressed as a percentage of UPB) by class projected for the five-year period beginning
December 31, 2019
:
|
|
Conventional
|
Government-Insured
|
Non-Agency
|
||
|
Prepayment speed
|
|||||
|
Range
|
8.5% to 15.7%
|
10.3% to 21.9%
|
9.2% to 14.1%
|
||
|
Weighted average
|
12.7%
|
16.3%
|
12.0%
|
||
|
Delinquency
|
|||||
|
Range
|
1.5% to 3.3%
|
7.0% to 18.6%
|
24.7% to 28.6%
|
||
|
Weighted average
|
1.9%
|
10.6%
|
27.4%
|
||
|
Cost to service
|
|||||
|
Range
|
$68 to $75
|
$83 to $139
|
$247 to $280
|
||
|
Weighted average
|
$70
|
$103
|
$273
|
||
|
Discount rate
|
9.1%
|
10.2%
|
11.3%
|
||
Changes in these assumptions are generally expected to affect our results of operations as follows:
|
•
|
Increases in prepayment speeds generally reduce the value of our MSRs as the underlying loans prepay faster which causes accelerated MSR portfolio runoff, higher compensating interest payments and lower overall servicing fees, partially offset by a lower overall cost of servicing, increased float earnings on higher float balances and lower interest expense on lower servicing advance balances.
|
|
•
|
Increases in delinquencies generally reduce the value of our MSRs as the cost of servicing increases during the delinquency period, and the amounts of servicing advances and related interest expense also increase.
|
|
•
|
Increases in the discount rate reduce the value of our MSRs due to the lower overall net present value of the net cash flows.
|
|
•
|
Increases in interest rate assumptions will increase interest expense for financing servicing advances although this effect is partially offset because rate increases will also increase the amount of float earnings that we recognize.
|
89
The following table provides information related to the sensitivity of our MSR fair value estimate to a 10% adverse change in key valuation inputs as of
December 31, 2019
:
|
|
Conventional
|
Government-Insured
|
Non-Agency
|
||||||||
|
Prepayment speed
|
$
|
(54,329
|
)
|
$
|
(13,548
|
)
|
$
|
(49,073
|
)
|
||
|
Delinquency
|
(9,894
|
)
|
(10,758
|
)
|
(52,220
|
)
|
|||||
|
Cost to service
|
(12,934
|
)
|
(4,358
|
)
|
(75,899
|
)
|
|||||
|
Discount rate
|
(20,621
|
)
|
(3,868
|
)
|
(24,975
|
)
|
|||||
We currently account for the MSR sale agreements with NRZ as secured financings because the transactions did not achieve sale accounting treatment. Accordingly, our balance sheets reflect MSRs at fair value, pledged to NRZ as assets, and a corresponding pledged MSR liability at fair value within Other financing liabilities. The fair value of the pledged MSR liability is determined based on the fair value of the associated pledged MSR assets subject to the sale agreements.
Allowance for Losses on Servicing Advances and Receivables
We record an allowance for losses on servicing advances through a charge to earnings to the extent that we believe that a portion of advances are uncollectible under the provisions of each servicing contract taking into consideration, among other factors, our historical collection rates, probability of default, cure or modification, length of delinquency and the amount of the advance. We continually assess collectibility using proprietary cash flow projection models that incorporate a number of different factors, depending on the characteristics of the mortgage loan or pool, including, for example, the probable loan liquidation path, estimated time to a foreclosure sale, estimated costs of foreclosure action, estimated future property tax payments and the estimated value of the underlying property net of estimated carrying costs, commissions and closing costs. At
December 31, 2019
, the allowance for losses on servicing advances was
$9.9 million
, which represents
1%
of the combined total balance of servicing advances and match funded advances.
We record an allowance for losses on receivables in our Servicing business related to defaulted FHA or VA insured loans repurchased from Ginnie Mae guaranteed securitizations (government-insured loan claims). This allowance represents management’s estimate of incurred losses and is maintained at a level that management considers adequate based upon continuing assessments of collectibility, current trends, and historical loss experience. At
December 31, 2019
, the allowance for losses on receivables related to government-insured claims was
$56.9 million
, which represents
46%
of the total balance of government-insured claims receivables.
Determining an allowance for losses involves degrees of judgment and assumptions that, given similar information at any given point, may result in a different but reasonable estimate.
Income Taxes
In December 2017, the Securities and Exchange Commission Staff issued Staff Accounting Bulletin (SAB) 118 (as further clarified by Financial Accounting Standards Board (FASB) Accounting Standards Update (ASU) 2018-05, Income Taxes (Topic 740): “Amendments to SEC Paragraphs Pursuant to SEC Staff Accounting Bulletin No. 118”), which provides guidance on accounting for the income tax effects of the Tax Act. SAB 118 provides a measurement period that should not extend beyond one year from the Tax Act enactment date of December 22, 2017 for companies to complete the accounting under Accounting Standards Codification (ASC) 740,
Income Taxes
. In accordance with SAB 118, a company must reflect the income tax effects of those aspects of the Tax Act for which the accounting under ASC 740 is complete. To the extent that a company's accounting for certain income tax effects of the Tax Act is incomplete but it is able to determine a reasonable estimate, it must record a provisional estimate in the financial statements and should continue to apply ASC 740 on the basis of the provisions of the tax laws that were in effect immediately before the enactment of the Tax Act. We adopted the guidance of SAB 118 as of December 31, 2017. We finalized our provisional amounts under SAB 118 in the fourth quarter of 2018. See
Note 20 — Income Taxes
to the Consolidated Financial Statements for additional information on the Tax Act and the impact on our consolidated financial statements.
We record a tax provision for the anticipated tax consequences of the reported results of operations. We compute the provision for income taxes using the asset and liability method, under which deferred tax assets and liabilities are recognized for the expected future tax consequences of temporary differences between the financial reporting and tax bases of assets and liabilities, and for operating losses and tax credit carryforwards. We measure deferred tax assets and liabilities using the currently enacted tax rates in each jurisdiction that applies to taxable income in effect for the years in which those tax assets are expected to be realized or settled. We record a valuation allowance to reduce deferred tax assets to the amount that is believed more likely than not to be realized.
We conduct periodic evaluations of positive and negative evidence to determine whether it is more likely than not that the deferred tax asset can be realized in future periods
.
In these evaluations, we gave more significant weight to objective evidence,
90
such as our actual financial condition and historical results of operations, as compared to subjective evidence, such as projections of future taxable income or losses.
For the three-year periods ended
December 31, 2019
and
2018
, the USVI filing jurisdiction was in a material cumulative loss position. The U.S. jurisdiction was also in a three-year cumulative loss position as of
December 31, 2019
and
2018
. We recognize that cumulative losses in recent years is an objective form of negative evidence in assessing the need for a valuation allowance and that such negative evidence is difficult to overcome. Other factors considered in these evaluations are estimates of future taxable income, future reversals of temporary differences, tax character and the impact of tax planning strategies that may be implemented, if warranted.
As a result of these evaluations, we recognized a full valuation allowance of
$199.5 million
and
$46.3 million
on our U.S. deferred tax assets at
December 31, 2019
and
2018
, respectively, and a full valuation allowance of
$0.4 million
and
$21.3 million
on our USVI deferred tax assets at
December 31, 2019
and
2018
, respectively. The U.S. and USVI jurisdictional deferred tax assets are not considered to be more likely than not realizable based on all available positive and negative evidence. We intend to continue maintaining a full valuation allowance on our deferred tax assets in both the U.S. and USVI until there is sufficient evidence to support the reversal of all or some portion of these allowances. Release of the valuation allowance would result in the recognition of certain deferred tax assets and a decrease to income tax expense for the period in which the release is recorded. However, the exact timing and amount of the valuation allowance release are subject to change based on the profitability that we achieve.
We recognize tax benefits from uncertain tax positions only if it is more likely than not that the tax position will be sustained on examination by the taxing authorities, based on the technical merits of the position. The tax benefits recognized in the financial statements from such positions are then measured based on the largest benefit that has a greater than 50% likelihood of being realized upon ultimate settlement.
NOL carryforwards may be subject to annual limitations under Internal Revenue Code Section 382 (Section 382) (or comparable provisions of foreign or state law) in the event that certain changes in ownership were to occur. In addition, tax credit carryforwards may be subject to annual limitations under Internal Revenue Code Section 383 (Section 383). We periodically evaluate our NOL and tax credit carryforwards and whether certain changes in ownership have occurred as measured under Section 382 that would limit our ability to utilize a portion of our NOL and tax credit carryforwards. If it is determined that an ownership change(s) has occurred, there may be annual limitations on the use of these NOL and tax credit carryforwards under Sections 382 and 383 (or comparable provisions of foreign or state law).
We have evaluated whether we experienced an ownership change under these provisions, and determined that an ownership change did occur in January 2015 and in December 2017 in the U.S. jurisdiction, which also results in an ownership change under Section 382 in the USVI jurisdiction. In addition, a Section 382 ownership change occurred at PHH when Ocwen acquired the stock of PHH in October 2018. PHH was a loss corporation as defined under Section 382 at the date of the acquisition. PHH also had an existing Section 382 ownership change on March 31, 2018. For certain states, an additional Section 382 ownership change occurred on August 9, 2017. These Section 382 ownership changes may limit our ability to fully utilize NOLs, tax credit carryforwards, deductions and/or certain built-in losses that existed as of each respective ownership change date in the various jurisdictions
Due to the Section 382 and 383 limitations and the maximum carryforward period for our NOLs and tax credits, we will be unable to fully recognize certain deferred tax assets. Accordingly, as of December 31, 2018, we had reduced our gross deferred tax asset related to our U.S. federal and USVI NOLs by
$160.9 million
, our foreign tax credit deferred tax asset by
$29.5 million
and corresponding valuation allowance by
$55.7 million
. The realization of all or a portion of our deferred income tax assets (including NOLs and tax credits) is dependent upon the generation of future taxable income during the statutory carryforward periods. In addition, the limitation on the utilization of our NOL and tax credit carryforwards could result in Ocwen incurring a current tax liability in future tax years. Our inability to utilize our pre-ownership change NOL carryforwards, Section 163(j) disallowed interest carryforwards, any future recognized built-in losses or deductions, and tax credit carryforwards could have an adverse effect on our financial condition, results of operations and cash flows. Finally, any future changes in our ownership or sale of our stock could further limit the use of our NOLs and tax credits in the future.
As part of our Section 382 evaluation and consistent with the rules provided within Section 382, Ocwen relies strictly on the existence or absence, as well as the information contained in certain publicly available documents (
e.g.
, Schedule 13D, Schedule 13G or other documents filed with the SEC) to identify shareholders that own a 5-percent or greater interest in Ocwen stock throughout the period tested. Further, Ocwen relies on such public filings to identify dates in which such 5-percent shareholders acquired, disposed, or otherwise transacted in Ocwen common stock. As the requirement for filing such notices of ownership from the SEC is to report beneficial ownership, as opposed to actual economic ownership of the stock of Ocwen, certain SEC filings may not represent ownership in Ocwen stock that should be considered in determining whether Ocwen experienced an ownership change under the Section 382 rules. Notwithstanding the preceding sentences (regarding Ocwen’ s ability to rely on the existence and absence of information in publicly filed Schedules 13D and 13G), the rules prescribed in
91
Section 382 and the regulations thereunder provide that Ocwen may (but is not required to) seek additional clarification from shareholders filing such Schedules 13D and 13G if there are questions or uncertainty regarding the true economic ownership of shares reported in such filing (whether due to ambiguity in the filing, an overly complex ownership structure, the type of instruments owned and reported in the filings, etc.) (often referred to “actual knowledge” questionnaires). Such information can be sought on a filer by filer basis (
i.e.,
there is no requirement that if actual knowledge is sought with respect to one shareholder, actual knowledge must be sought with respect to all shareholders that filed schedules 13D or 13G). While the seeking of actual knowledge can be beneficial in some instances it may be detrimental in others. Once such actual knowledge is received, Section 382 requires the inclusion of such actual knowledge, even if such inclusion is detrimental to the conclusion reached.
Ocwen has performed its analysis of the rules under Section 382 and, based on all currently available information, identified it experienced an ownership change for Section 382 purposes in January 2015 and December 2017. Prior to 2018, Ocwen was aware of shareholder activity in 2015 and 2017 that may have caused a Section 382 ownership change(s), but determined that additional information could potentially be obtained from certain shareholders that would indicate a Section 382 ownership change had not occurred. In completing this analysis, Ocwen identified several shareholders that filed a schedule 13G during the period disclosing a greater than 5-percent interest in Ocwen stock where beneficial versus economic ownership of the stock was unclear, and Ocwen therefore requested further details. As of the date of this Form 10-K, Ocwen has not received all requested responses from selected shareholders, and will continue to consider such shareholders as economic owners of Ocwen’s stock until actual knowledge is otherwise received.
Ocwen is continuing to monitor the ownership in its stock to evaluate information that will become available later in 2019 and that may result in a different outcome for Section 382 purposes and our future cash tax obligations. As part of this monitoring, Ocwen periodically evaluates whether it is appropriate and beneficial to retroactively seek actual knowledge on certain previously identified and included 5-percent shareholders, whereby, depending on the responses received, Ocwen may conclude that either the January 2015 or December 2017 Section 382 ownership changes may have instead occurred on a different date, or did not occur at all. As such, our analysis regarding the amount of tax attributes that may be available to offset taxable income in the future without restrictions imposed by Section 382 may continue to evolve.
Indemnification Obligations
We have exposure to representation, warranty and indemnification obligations because of our lending, sales and securitization activities, our acquisitions to the extent we assume one or more of these obligations, and in connection with our servicing practices. We initially recognize these obligations at fair value. Thereafter, the estimation of the liability considers probable future obligations based on industry data of loans of similar type segregated by year of origination, to the extent applicable, and estimated loss severity based on current loss rates for similar loans, our historical rescission rates and the current pipeline of unresolved demands. Our historical loss severity considers the historical loss experience that we incur upon sale or liquidation of a repurchased loan as well as current market conditions. We monitor the adequacy of the overall liability and make adjustments, as necessary, after consideration of other qualitative factors including ongoing dialogue and experience with our counterparties. As of
December 31, 2019
, we have recorded a liability for representation and warranty obligations, compensatory fees related to foreclosure timelines, and similar indemnification obligations of
$50.8 million
. See
Note 26 — Contingencies
for additional information.
Litigation
We monitor our litigation matters, including advice from external legal counsel, and regularly perform assessments of these matters for potential loss accrual and disclosure. We establish liabilities for settlements, judgments on appeal and filed and/or threatened claims for which we believe it is probable that a loss has been or will be incurred and the amount can be reasonably estimated.
Going Concern
In accordance with ASC 205-40,
Presentation of Financial Statements - Going Concern
, we evaluate whether there are conditions that are known or reasonably knowable that raise substantial doubt about our ability to continue as a going concern within one year after the date that our financial statements are issued. We perform a detailed review and analysis of relevant quantitative and qualitative information from across our organization in connection with this evaluation. To support this effort, senior management from key business units reviews and assesses the following information:
|
•
|
our current financial condition, including liquidity sources at the date that the financial statements are issued (e.g., available liquid funds and available access to credit, including covenant compliance);
|
|
•
|
our conditional and unconditional obligations due or anticipated within one year after the date that the financial statements are issued (regardless of whether those obligations are recognized in our financial statements);
|
|
•
|
funds necessary to maintain operations considering our current financial condition, obligations and other expected cash flows within one year after the date that the financial statements are issued (i.e., financial forecasting); and
|
92
|
•
|
other conditions and events, when considered in conjunction with the above items, that may adversely affect our ability to meet obligations within one year after the date that the financial statements are issued (e.g., negative financial trends, indications of possible financial difficulties, internal matters such as a need to significantly revise operations and external matters such as adverse regulatory or legal proceedings, adverse counterparty actions or rating agency decisions, and our client concentration).
|
Our evaluation of whether it is probable that we will be unable to meet our obligations as they become due within one year after the date that our financial statements are issued involves a degree of judgment, including about matters that are, to different degrees, uncertain.
If such conditions exist, management evaluates its plans that when implemented would mitigate the condition(s) and alleviate the substantial doubt about our ability to continue as a going concern. Such plans are considered only if information available as of the date that the financial statements are issued indicates both of the following are true:
|
•
|
it is probable management’s plans will be implemented within the evaluation period; and
|
|
•
|
it is probable management’s plans, when implemented individually or in the aggregate, will mitigate the condition(s) that raise substantial doubt about our ability to continue as a going concern in the evaluation period.
|
Our evaluation of whether it is probable that management’s plans will be effectively implemented within the evaluation period is based on the feasibility of implementation of management’s plans in light of our specific facts and circumstances.
Our evaluation of whether it is probable that our plans, individually or in the aggregate, will be implemented in the evaluation period involves a degree of judgment, including about matters that are, to different degrees, uncertain.
Based on our evaluation, we have determined that there are no conditions that are known or reasonably knowable that raise substantial doubt about our ability to continue as a going concern within one year after the date that our Consolidated Financial Statements for the year ended December 31, 2019 are issued.
RECENT ACCOUNTING DEVELOPMENTS
Recent Accounting Pronouncements
Listed below are ASUs that we adopted on January 1, 2019.
|
•
|
ASU 2016-02: Leases
|
|
•
|
ASU 2017-08: Receivables: Nonrefundable Fees and Other Costs
|
|
•
|
ASU 2018-02: Income Statement - Reporting Comprehensive Income: Reclassification of Certain Tax Effects from Accumulated Other Comprehensive Income
|
|
•
|
ASU 2018-09: Codification Improvements
|
The adoption of ASU 2016-02 resulted in the recognition of an insignificant cumulative-effect adjustment to the opening balance of Retained earnings on January 1, 2019, the recognition of a gross ROU asset and lease liability of $66.2 million, and the reclassification of balances which existed at December 31, 2018 for our leases.
Additional ASUs were adopted on January 1, 2020, including Financial Instruments - Credit Losses: Measurement of Credit Losses on Financial Instruments (ASU 2016-13 and ASU 2019-04). For additional information, see
Note 1 — Organization, Business Environment, Basis of Presentation and Significant Accounting Policies
to the Consolidated Financial Statements.
|
ITEM 7A.
|
QUANTITATIVE AND QUALITATIVE DISCLOSURES ABOUT MARKET RISK
|
Refer to the Market Risk sections of Item 7. Management’s Discussion and Analysis of Financial Condition and Results of Operations for our quantitative and qualitative disclosures about market risk.
|
ITEM 8.
|
FINANCIAL STATEMENTS AND SUPPLEMENTARY DATA
|
The information required by this section is contained in the Consolidated Financial Statements of Ocwen Financial Corporation and Report of Deloitte & Touche LLP, Independent Registered Public Accounting Firm, beginning on Page F-1.
|
ITEM 9.
|
CHANGES IN AND DISAGREEMENTS WITH ACCOUNTANTS ON ACCOUNTING AND FINANCIAL DISCLOSURE
|
None.
93
|
ITEM 9A.
|
CONTROLS AND PROCEDURES
|
Evaluation of Disclosure Controls and Procedures
Our management, under the supervision of and with the participation of our principal executive officer and our principal financial officer, has evaluated the effectiveness of our disclosure controls and procedures, as such term is defined in Rules 13a-15(e) and 15d-15(e) under the Securities Exchange Act of 1934, as amended (Exchange Act), as of the end of the period covered by this Annual Report. Based on such evaluation, management concluded that, as of the end of such period, our disclosure controls and procedures are effective.
Management’s Report on Internal Control over Financial Reporting
Our management is responsible for establishing and maintaining adequate internal control over financial reporting, as that term is defined in Exchange Act Rules 13a-15(f) and 15d-15(f).
Under the supervision of and with the participation of our management, including our principal executive officer and principal financial officer, we conducted an evaluation of our internal control over financial reporting as of
December 31, 2019
, based on the framework set forth by the Committee of Sponsoring Organizations of the Treadway Commission (COSO) in Internal Control—Integrated Framework (2013 framework). Based on that evaluation, our management concluded that, as of
December 31, 2019
, internal control over financial reporting is effective based on criteria established in Internal Control—Integrated Framework issued by the COSO.
The effectiveness of Ocwen’s internal control over financial reporting as of
December 31, 2019
has been audited by Deloitte & Touche LLP, an independent registered public accounting firm, as stated in their report that appears herein.
Limitations on the Effectiveness of Controls
A company’s internal control over financial reporting is a process designed to provide reasonable assurance regarding the reliability of financial reporting and the preparation of financial statements for external purposes in accordance with accounting principles generally accepted in the United States of America. A company’s internal control over financial reporting includes those policies and procedures that (i) pertain to the maintenance of records that, in reasonable detail, accurately and fairly reflect the transactions and dispositions of the assets of the company; (ii) provide reasonable assurance that transactions are recorded as necessary to permit preparation of financial statements in accordance with accounting principles generally accepted in the United States of America and that receipts and expenditures of the company are being made only in accordance with authorizations of management and directors of the company; and (iii) provide reasonable assurance regarding prevention or timely detection of unauthorized acquisition, use or disposition of the company’s assets that could have a material effect on the financial statements.
Because of its inherent limitations, internal control over financial reporting may not prevent or detect misstatements. In addition, projections of any evaluation of effectiveness to future periods are subject to the risk that controls may become inadequate because of changes in conditions or that the degree of compliance with the policies or procedures may deteriorate.
Changes in Internal Control over Financial Reporting
There have not been any changes in our internal control over financial reporting during our fiscal quarter ended
December 31, 2019
that have materially affected, or are reasonably likely to materially affect, our internal control over financial reporting.
|
ITEM 9B.
|
OTHER INFORMATION
|
There was no information required to be reported on Form 8-K during the fourth quarter of the year covered by this Form 10-K that was not so reported.
PART III
|
ITEM 10.
|
DIRECTORS, EXECUTIVE OFFICERS AND CORPORATE GOVERNANCE
|
The information required by this item is incorporated by reference to the information contained under the captions “Election of Directors-Nominees for Director,” “Executive Officers Who Are Not Directors,” “Board of Directors and Corporate Governance-Committees of the Board of Directors-Audit Committee”, “Security Ownership of Certain Beneficial Owners and Related Shareholder Matters-Section 16(a) Beneficial Ownership Reporting Compliance” and “Board of Directors and Corporate Governance-Code of Ethics” in our definitive Proxy Statement with respect to our
2020
Annual Meeting, which we intend to file with the SEC no later than
April 29, 2020
.
94
|
ITEM 11.
|
EXECUTIVE COMPENSATION
|
The information required by this item is incorporated by reference to the information contained under the captions “Executive Compensation” and “Board of Directors Compensation” in our definitive Proxy Statement with respect to our
2020
Annual Meeting, which we intend to file with the SEC no later than
April 29, 2020
.
|
ITEM 12.
|
SECURITY OWNERSHIP OF CERTAIN BENEFICIAL OWNERS AND MANAGEMENT AND RELATED STOCKHOLDER MATTERS
|
The information required by this item is incorporated by reference to the information contained under the captions “Security Ownership of Certain Beneficial Owners and Related Shareholder Matters-Beneficial Ownership of Equity Securities” and “Equity Compensation Plan Information” in our definitive Proxy Statement with respect to our
2020
Annual Meeting, which we intend to file with the SEC no later than
April 29, 2020
.
|
ITEM 13.
|
CERTAIN RELATIONSHIPS AND RELATED TRANSACTIONS, AND DIRECTOR INDEPENDENCE
|
The information required by this item is incorporated by reference to the information contained under the captions “Board of Directors and Corporate Governance-Independence of Directors” and “Business Relationships and Related Transactions” in our definitive Proxy Statement with respect to our
2020
Annual Meeting, which we intend to file with the SEC no later than
April 29, 2020
.
|
ITEM 14.
|
PRINCIPAL ACCOUNTING FEES AND SERVICES
|
The information required by this item is incorporated by reference to the information contained under the caption “Ratification of Appointment of Independent Registered Public Accounting Firm” in our definitive Proxy Statement with respect to our
2020
Annual Meeting, which we intend to file with the Securities and Exchange Commission no later than
April 29, 2020
.
PART IV
|
ITEM 15.
|
EXHIBITS, FINANCIAL STATEMENT SCHEDULES
|
(1) and (2) Financial Statements and Schedules.
The information required by this section is contained in the Consolidated Financial Statements of Ocwen Financial Corporation and Report of Deloitte & Touche LLP, Independent Registered Public Accounting Firm, beginning on Page F-1.
|
(3)
|
Exhibits.
|
|||
|
|
||||
|
|
||||
|
4.2
|
The Company agrees to furnish to the Securities and Exchange Commission upon request a copy of each instrument with respect to the issuance of long-term debt of the Company and its subsidiaries, the authorized principal amount of which does not exceed 10% of the consolidated assets of the Company and its subsidiaries.
|
|||
95
|
|
||||
|
|
||||
|
|
||||
|
|
|
|||
96
|
10.
31
|
||||
97
|
|
||||
|
|
||||
|
|
||||
|
101.INS
|
XBRL Instance Document (filed herewith)
|
|||
|
101.SCH
|
XBRL Taxonomy Extension Schema Document (filed herewith)
|
|||
|
101.CAL
|
XBRL Taxonomy Extension Calculation Linkbase Document (filed herewith)
|
|||
|
101.DEF
|
XBRL Taxonomy Extension Definition Linkbase Document (filed herewith)
|
|||
|
101.LAB
|
XBRL Taxonomy Extension Label Linkbase Document (filed herewith)
|
|||
|
101.PRE
|
XBRL Taxonomy Extension Presentation Linkbase Document (filed herewith)
|
|||
|
*
|
Management contract or compensatory plan or agreement.
|
|
†
|
Certain schedules and exhibits have been omitted in accordance with Item 601(b)(2) of Regulation S-K. A copy of any referenced schedules will be furnished supplementally to the SEC upon request.
|
|
††
|
Portions of this exhibit have been omitted pursuant to a request for confidential treatment.
|
|
†††
|
Certain confidential information contained in this agreement has been omitted because it is not material and would be competitively harmful if publicly disclosed.
|
98
|
††††
|
Certain schedules and exhibits have been omitted in accordance with Item 601(a)(5) of Regulation S-K. A copy of any referenced schedules will be furnished supplementally to the SEC upon request.
|
|
(1)
|
Incorporated by reference from the similarly described exhibit included with the Registrant’s Form 8-K filed on October 5, 2012.
|
|
(2)
|
Incorporated by reference from the similarly described exhibit included with the Registrant’s Annual Report on Form 10-K filed for the year ended December 31, 2018 filed on February 27, 2019.
|
|
(3)
|
Incorporated by reference to the similarly described exhibit included with the Registrant’s Quarterly Report on Form 10-Q for the period ended March 31, 2018 filed on May 2, 2018.
|
|
(4)
|
Incorporated by reference from the similarly described exhibit included with the Registrant’s Form 8-K filed on April 4, 2013.
|
|
(5)
|
Incorporated by reference from the similarly described exhibit included with the Registrant’s Quarterly Report on Form 10-Q for the period ended June 30, 2017 filed on August 3, 2017.
|
|
(6)
|
Incorporated by reference from the similarly described exhibit included with the Registrant’s Annual Report on Form 10-K for the year ended December 31, 2013 filed on March 3, 2014.
|
|
(7)
|
Incorporated by reference from the similarly described exhibit included with the Registrant’s Quarterly Report on Form 10-Q for the period ended March 31, 2019 filed on May 7, 2019.
|
|
(8)
|
Incorporated by reference from the similarly described exhibit included with the Registrant’s Quarterly Report on Form 10-Q for the period ended June 30, 2019 filed on August 6, 2019.
|
|
(9)
|
Incorporated by reference to the similarly described exhibit to the Registrant’s Form 8-K filed on March 18, 2019.
|
|
(10)
|
Incorporated by reference from the similarly described exhibit included with the Registrant’s Form 8-K filed on August 12, 2009.
|
|
(11)
|
Incorporated by reference from the similarly described exhibit included with the Registrant’s Annual Report on Form 10-K for the year ended December 31, 2004 filed on March 16, 2005.
|
|
(12)
|
Incorporated by reference from the similarly described exhibit to our definitive Proxy Statement with respect to our 2007 Annual Meeting of Shareholders as filed on March 30, 2007.
|
|
(13)
|
Incorporated by reference from the similarly described exhibit included with the Registrant’s Form 8-K filed on April 18, 2013.
|
|
(14)
|
Incorporated by reference from the similarly described exhibit included with the Registrant’s Form 8-K filed on July 8, 2013.
|
|
(15)
|
Incorporated by reference from the similarly described exhibit included with the Registrant’s Quarterly Report on Form 10-Q for the period ended September 30, 2013 filed on November 5, 2013.
|
|
(16)
|
Incorporated by reference from the similarly described exhibit included with the Registrant’s Form 8-K filed on April 6, 2015.
|
|
(17)
|
Incorporated by reference from the similarly described exhibit included with the Registrant’s Form 8-K filed on February 19, 2013.
|
|
(18)
|
Incorporated by reference from the similarly described exhibit included with the Registrant’s Quarterly Report on Form 10-Q for the period ended March 31, 2014 filed on May 2, 2014.
|
|
(19)
|
Incorporated by reference from the similarly described exhibit included with the Registrant’s Form 8-K filed on January 20, 2015.
|
|
(20)
|
Incorporated by reference from the similarly described exhibit included with the Registrant’s Form 8-K filed on March 26, 2015.
|
|
(21)
|
Incorporated by reference from the similarly described exhibit included with the Registrant’s Form 8-K filed on December 6, 2016.
|
|
(22)
|
Incorporated by reference from the similarly described exhibit included with the Registrant’s Annual Report on Form 10-K for the year ended December 31, 2016 filed February 23, 2017.
|
|
(23)
|
Incorporated by reference from the similarly described exhibit included with the Registrant’s Form 8-K filed on May 24, 2017.
|
|
(24)
|
Incorporated by reference from the similarly described exhibit included with the Registrant’s Quarterly Report on Form 10-Q for the period ended September 30, 2017 filed on November 2, 2017.
|
|
(25)
|
Incorporated by reference to the similarly described exhibit included with PHH Corporation's Quarterly Report on Form 10-Q for the period ended June 30, 2017 filed on August 9, 2017.
|
|
(26)
|
Incorporated by reference to the similarly described exhibit to PHH Corporation's Annual Report on Form 10-K for the year ended December 31, 2017 filed on March 1, 2018.
|
|
(27)
|
Incorporated by reference to the similarly described exhibit included with the Registrant’s Form 8-K filed on February 12, 2018.
|
|
(28)
|
Incorporated by reference to the similarly described exhibit included with the Registrant’s Form 8-K filed on April 19, 2018.
|
99
|
(29)
|
Incorporated by reference to the similarly described exhibit included with the Registrant’s Form 8-K filed on May 29, 2018.
|
|
(30)
|
Incorporated by reference to the similarly described exhibit to PHH Corporation’s Form 8-K filed on January 17, 2012.
|
|
(31)
|
Incorporated by reference to the similarly described exhibit to the Registrant’s Form 8-K filed on October 4, 2018.
|
|
(32)
|
Incorporated by reference to the similarly described exhibit to PHH Corporation’s Form 8-K filed on August 23, 2012.
|
|
(33)
|
Incorporated by reference to the similarly described exhibit to PHH Corporation’s Form 8-K filed on August 20, 2013.
|
|
(34)
|
Incorporated by reference to the similarly described exhibit to PHH Corporation’s Form 8-K filed on July 5, 2017.
|
|
(35)
|
Incorporated by reference to the similarly described exhibit included with the Registrant’s Quarterly Report on Form 10-Q for the period ended September 30, 2018 filed on November 6, 2018.
|
|
(36)
|
Incorporated by reference to the similarly described exhibit to PHH Corporation’s Form 8-K filed on December 28, 2016.
|
|
(37)
|
Incorporated by reference to the similarly described exhibit to PHH Corporation’s Form 8-K filed on June 19, 2017.
|
|
(38)
|
Incorporated by reference to the similarly described exhibit to PHH Corporation’s Form 8-K filed on May 25, 2016.
|
|
(39)
|
Incorporated by reference to the similarly described exhibit to PHH Corporation’s Annual Report on Form 10-K filed on February 27, 2015.
|
|
(40)
|
Incorporated by reference to the similarly described exhibit included with the Registrant’s Quarterly Report on Form 10-Q for the period ended March 31, 2016 filed on April 28, 2016.
|
|
(41)
|
Incorporated by reference from the similarly described exhibit included with the Registrant’s Form 8-K filed on January 27, 2020.
|
|
(42)
|
Incorporated by reference from the Description of Capital Stock included in the Registrant’s Registration Statement on Form S-3 filed on May 9, 2013
|
|
ITEM 16.
|
FORM 10-K SUMMARY
|
None.
100
Signatures
Pursuant to the requirements of Section 13 or 15(d) of the Securities Exchange Act of 1934, as amended, the Registrant has duly caused this report to be signed on our behalf by the undersigned, thereunto duly authorized.
|
Ocwen Financial Corporation
|
||
|
By:
|
/s/ Glen A. Messina
|
|
|
Glen A. Messina
|
||
|
President and Chief Executive Officer
|
||
|
Date: February 26, 2020
|
||
Pursuant to the requirements of the Securities Exchange Act of 1934, as amended, this Report has been signed below by the following persons on behalf of the registrant and in the capacities and on the dates indicated:
|
/s/ Phyllis R. Caldwell
|
Date: February 26, 2020
|
|
|
Phyllis R. Caldwell, Chair of the Board of Directors
|
||
|
/s/ Glen A. Messina
|
Date: February 26, 2020
|
|
|
Glen A. Messina, President, Chief Executive Officer and Director
(principal executive officer)
|
||
|
/s/ Alan J. Bowers
|
Date: February 26, 2020
|
|
|
Alan J. Bowers, Director
|
||
|
/s/ Jacques J. Busquet
|
Date: February 26, 2020
|
|
|
Jacques J. Busquet, Director
|
||
|
/s/ Kevin Stein
|
Date: February 26, 2020
|
|
|
Kevin Stein, Director
|
||
|
/s/ Robert J. Lipstein
|
Date: February 26, 2020
|
|
|
Robert J. Lipstein, Director
|
||
|
/s/ Jenne K. Britell
|
Date: February 26, 2020
|
|
|
Jenne K. Britell, Director
|
||
|
/s/ DeForest B. Soaries, Jr.
|
Date: February 26, 2020
|
|
|
DeForest B. Soaries, Jr., Director
|
||
|
/s/ June C. Campbell
|
Date: February 26, 2020
|
|
|
June C. Campbell, Executive Vice President and Chief Financial Officer
(principal financial officer)
|
||
|
/s/ Francois Grunenwald
|
Date: February 26, 2020
|
|
|
Francois Grunenwald, Senior Vice President and Chief Accounting Officer
(principal accounting officer) |
||
101
OCWEN FINANCIAL CORPORATION AND SUBSIDIARIES
CONSOLIDATED FINANCIAL STATEMENTS AND
REPORT OF INDEPENDENT REGISTERED PUBLIC ACCOUNTING FIRM
December 31, 2019
102
OCWEN FINANCIAL CORPORATION AND SUBSIDIARIES
INDEX TO CONSOLIDATED FINANCIAL STATEMENTS AND SCHEDULES
December 31, 2019
|
|
Page
|
|
|
|
|
|
|
|
|
|
|
Consolidated Financial Statements:
|
|
|
|
|
|
Consolidated Balance Sheets at December 31, 2019 and 2018
|
|
|
|
|
|
Consolidated Statements of Operations for the years ended December 31, 2019, 2018 and 2017
|
|
|
|
|
|
Consolidated Statements of Comprehensive Loss for the years ended December 31, 2019, 2018 and 2017
|
|
|
|
|
|
Consolidated Statements of Changes in Equity for the years ended December 31, 2019, 2018 and 2017
|
|
|
|
|
|
Consolidated Statements of Cash Flows for the years ended December 31, 2019, 2018 and 2017
|
|
|
|
|
F-1
REPORT OF INDEPENDENT REGISTERED PUBLIC ACCOUNTING FIRM
To the shareholders and the Board of Directors of Ocwen Financial Corporation:
Opinion on the Financial Statements
We have audited the accompanying consolidated balance sheets of Ocwen Financial Corporation and subsidiaries (the “Company”) as of
December 31, 2019
and
2018
, the related consolidated statements of operations, comprehensive loss, changes in equity, and cash flows for each of the three years in the period ended
December 31, 2019
, and the related notes (collectively referred to as the “financial statements”). In our opinion, the financial statements present fairly, in all material respects, the financial position of the Company as of December 31, 2019 and 2018, and the results of its operations and its cash flows for each of the three years in the period ended December 31, 2019, in conformity with accounting principles generally accepted in the United States of America.
We have also audited, in accordance with the standards of the Public Company Accounting Oversight Board (United States) (PCAOB), the Company's internal control over financial reporting as of December 31, 2019, based on criteria established in
Internal Control - Integrated Framework (2013)
issued by the Committee of Sponsoring Organizations of the Treadway Commission and our report dated February 26, 2020, expressed an unqualified opinion on the Company's internal control over financial reporting.
Basis for Opinion
These financial statements are the responsibility of the Company’s management. Our responsibility is to express an opinion on the Company’s financial statements based on our audits. We are a public accounting firm registered with the PCAOB and are required to be independent with respect to the Company in accordance with the U.S. federal securities laws and the applicable rules and regulations of the Securities and Exchange Commission and the PCAOB.
We conducted our audits in accordance with the standards of the PCAOB. Those standards require that we plan and perform the audit to obtain reasonable assurance about whether the financial statements are free of material misstatement, whether due to error or fraud. Our audits included performing procedures to assess the risks of material misstatement of the financial statements, whether due to error or fraud, and performing procedures that respond to those risks. Such procedures included examining, on a test basis, evidence regarding the amounts and disclosures in the financial statements. Our audits also included evaluating the accounting principles used and significant estimates made by management, as well as evaluating the overall presentation of the financial statements. We believe that our audits provide a reasonable basis for our opinion.
|
/s/ DELOITTE & TOUCHE LLP
|
|
|
|
New York, New York
|
|
February 26, 2020
|
|
We have served as the Company’s auditor since 2009.
|
F-2
REPORT OF INDEPENDENT REGISTERED PUBLIC ACCOUNTING FIRM
To the shareholders and the Board of Directors of Ocwen Financial Corporation:
Opinion on Internal Control over Financial Reporting
We have audited the internal control over financial reporting of Ocwen Financial Corporation and subsidiaries (the “Company”) as of
December 31, 2019
, based on criteria established in
Internal Control - Integrated Framework (2013)
issued by the Committee of Sponsoring Organizations of the Treadway Commission (COSO). In our opinion, the Company maintained, in all material respects, effective internal control over financial reporting as of December 31, 2019, based on criteria established in
Internal Control - Integrated Framework (2013)
issued by COSO.
We have also audited, in accordance with the standards of the Public Company Accounting Oversight Board (United States) (PCAOB), the consolidated financial statements as of and for the year ended December 31, 2019, of the Company and our report dated February 26, 2020, expressed an unqualified opinion on those financial statements.
Basis for Opinion
The Company’s management is responsible for maintaining effective internal control over financial reporting and for its assessment of the effectiveness of internal control over financial reporting, included in the accompanying Management Report on Internal Control over Financial Reporting. Our responsibility is to express an opinion on the Company’s internal control over financial reporting based on our audit. We are a public accounting firm registered with the PCAOB and are required to be independent with respect to the Company in accordance with the U.S. federal securities laws and the applicable rules and regulations of the Securities and Exchange Commission and the PCAOB.
We conducted our audit in accordance with the standards of the PCAOB. Those standards require that we plan and perform the audit to obtain reasonable assurance about whether effective internal control over financial reporting was maintained in all material respects. Our audit included obtaining an understanding of internal control over financial reporting, assessing the risk that a material weakness exists, testing and evaluating the design and operating effectiveness of internal control based on the assessed risk, and performing such other procedures as we considered necessary in the circumstances. We believe that our audit provides a reasonable basis for our opinion.
Definition and Limitations of Internal Control over Financial Reporting
A company’s internal control over financial reporting is a process designed to provide reasonable assurance regarding the reliability of financial reporting and the preparation of financial statements for external purposes in accordance with generally accepted accounting principles. A company’s internal control over financial reporting includes those policies and procedures that (1) pertain to the maintenance of records that, in reasonable detail, accurately and fairly reflect the transactions and dispositions of the assets of the company; (2) provide reasonable assurance that transactions are recorded as necessary to permit preparation of financial statements in accordance with generally accepted accounting principles, and that receipts and expenditures of the company are being made only in accordance with authorizations of management and directors of the company; and (3) provide reasonable assurance regarding prevention or timely detection of unauthorized acquisition, use, or disposition of the company’s assets that could have a material effect on the financial statements.
Because of its inherent limitations, internal control over financial reporting may not prevent or detect misstatements. Also, projections of any evaluation of effectiveness to future periods are subject to the risk that controls may become inadequate because of changes in conditions, or that the degree of compliance with the policies or procedures may deteriorate.
|
/s/ DELOITTE & TOUCHE LLP
|
|
|
|
New York, New York
|
|
February 26, 2020
|
F-3
OCWEN FINANCIAL CORPORATION AND SUBSIDIARIES
CONSOLIDATED BALANCE SHEETS
(Dollars in thousands, except per share data)
|
|
December 31, 2019
|
December 31, 2018
|
|||||
|
Assets
|
|
|
|
|
|||
|
Cash and cash equivalents
|
$
|
428,339
|
|
$
|
329,132
|
|
|
|
Restricted cash (amounts related to variable interest entities (VIEs) of $20,434 and $20,968)
|
64,001
|
|
67,878
|
|
|||
|
Mortgage servicing rights (MSRs), at fair value
|
1,486,395
|
|
1,457,149
|
|
|||
|
Advances, net
|
254,533
|
|
249,382
|
|
|||
|
Match funded advances (related to VIEs)
|
801,990
|
|
937,294
|
|
|||
|
Loans held for sale ($208,752 and $176,525 carried at fair value)
|
275,269
|
|
242,622
|
|
|||
|
Loans held for investment, at fair value (amounts related to VIEs of $23,342 and $26,520)
|
6,292,938
|
|
5,498,719
|
|
|||
|
Receivables, net
|
201,220
|
|
198,262
|
|
|||
|
Premises and equipment, net
|
38,274
|
|
33,417
|
|
|||
|
Other assets ($8,524 and $7,568 carried at fair value) (amounts related to VIEs of $4,078 and $2,874)
|
563,240
|
|
379,567
|
|
|||
|
Assets related to discontinued operations
|
—
|
|
794
|
|
|||
|
Total assets
|
$
|
10,406,199
|
|
$
|
9,394,216
|
|
|
|
Liabilities and Stockholders’ Equity
|
|
|
|
|
|||
|
Liabilities
|
|
|
|
|
|||
|
Home Equity Conversion Mortgage-Backed Securities (HMBS) - related borrowings, at fair value
|
$
|
6,063,435
|
|
$
|
5,380,448
|
|
|
|
Other financing liabilities ($972,595 and $1,057,671 carried at fair value) (amounts related to VIEs of $22,002 and $24,815)
|
972,595
|
|
1,062,090
|
|
|||
|
Match funded liabilities (related to VIEs)
|
679,109
|
|
778,284
|
|
|||
|
Other secured borrowings, net (amounts related to VIEs of $242,101 and $0)
|
1,025,791
|
|
448,061
|
|
|||
|
Senior notes, net
|
311,085
|
|
448,727
|
|
|||
|
Other liabilities ($100 and $4,986 carried at fair value) (amounts related to VIEs of $144 and $0)
|
942,173
|
|
703,636
|
|
|||
|
Liabilities related to discontinued operations
|
—
|
|
18,265
|
|
|||
|
Total liabilities
|
9,994,188
|
|
8,839,511
|
|
|||
|
Commitments and Contingencies (Notes 25 and 26)
|
|
|
|
|
|||
|
Stockholders’ Equity
|
|
|
|
|
|||
|
Common stock, $.01 par value; 200,000,000 shares authorized; 134,862,232 and 133,912,425 shares issued and outstanding at December 31, 2019 and December 31, 2018, respectively
|
1,349
|
|
1,339
|
|
|||
|
Additional paid-in capital
|
556,798
|
|
554,056
|
|
|||
|
(Accumulated deficit) retained earnings
|
(138,542
|
)
|
3,567
|
|
|||
|
Accumulated other comprehensive loss, net of income taxes
|
(7,594
|
)
|
(4,257
|
)
|
|||
|
Total stockholders’ equity
|
412,011
|
|
554,705
|
|
|||
|
Total liabilities and stockholders’ equity
|
$
|
10,406,199
|
|
$
|
9,394,216
|
|
|
The accompanying notes are an integral part of these consolidated financial statements
F-4
OCWEN FINANCIAL CORPORATION AND SUBSIDIARIES
CONSOLIDATED STATEMENTS OF OPERATIONS
(Dollars in thousands, except per share data)
|
For the Years Ended December 31,
|
|||||||||||
|
2019
|
2018
|
2017
|
|||||||||
|
Revenue
|
|||||||||||
|
Servicing and subservicing fees
|
$
|
975,507
|
|
$
|
937,083
|
|
$
|
991,597
|
|
||
|
Gain on loans held for sale, net
|
38,300
|
|
37,336
|
|
57,183
|
|
|||||
|
Reverse mortgage revenue, net
|
86,309
|
|
60,237
|
|
75,515
|
|
|||||
|
Other revenue, net
|
23,259
|
|
28,389
|
|
70,281
|
|
|||||
|
Total revenue
|
1,123,375
|
|
1,063,045
|
|
1,194,576
|
|
|||||
|
MSR valuation adjustments, net
|
(120,876
|
)
|
(153,457
|
)
|
(52,962
|
)
|
|||||
|
Operating expenses
|
|||||||||||
|
Compensation and benefits
|
313,508
|
|
298,036
|
|
358,994
|
|
|||||
|
Servicing and origination
|
109,007
|
|
131,297
|
|
141,496
|
|
|||||
|
Professional services
|
102,638
|
|
165,554
|
|
229,451
|
|
|||||
|
Technology and communications
|
79,166
|
|
98,241
|
|
100,490
|
|
|||||
|
Occupancy and equipment
|
68,146
|
|
59,631
|
|
66,019
|
|
|||||
|
Other expenses
|
1,474
|
|
26,280
|
|
49,233
|
|
|||||
|
Total operating expenses
|
673,939
|
|
779,039
|
|
945,683
|
|
|||||
|
Other income (expense)
|
|||||||||||
|
Interest income
|
17,104
|
|
14,026
|
|
15,965
|
|
|||||
|
Interest expense
|
(114,129
|
)
|
(103,371
|
)
|
(126,927
|
)
|
|||||
|
Pledged MSR liability expense
|
(372,089
|
)
|
(171,670
|
)
|
(236,311
|
)
|
|||||
|
Gain on repurchase of senior secured notes
|
5,099
|
|
—
|
|
—
|
|
|||||
|
Bargain purchase gain
|
(381
|
)
|
64,036
|
|
—
|
|
|||||
|
Gain on sale of MSRs, net
|
453
|
|
1,325
|
|
10,537
|
|
|||||
|
Other, net
|
8,892
|
|
(6,371
|
)
|
(3,168
|
)
|
|||||
|
Total other expense, net
|
(455,051
|
)
|
(202,025
|
)
|
(339,904
|
)
|
|||||
|
Loss from continuing operations before income taxes
|
(126,491
|
)
|
(71,476
|
)
|
(143,973
|
)
|
|||||
|
Income tax expense (benefit)
|
15,634
|
|
529
|
|
(15,516
|
)
|
|||||
|
Loss from continuing operations, net of tax
|
(142,125
|
)
|
(72,005
|
)
|
(128,457
|
)
|
|||||
|
Income from discontinued operations, net of tax
|
—
|
|
1,409
|
|
—
|
|
|||||
|
Net loss
|
(142,125
|
)
|
(70,596
|
)
|
(128,457
|
)
|
|||||
|
Net (income) loss attributable to non-controlling interests
|
—
|
|
(176
|
)
|
491
|
|
|||||
|
Net loss attributable to Ocwen stockholders
|
$
|
(142,125
|
)
|
$
|
(70,772
|
)
|
$
|
(127,966
|
)
|
||
|
|
|||||||||||
|
Earnings (loss) per share attributable to Ocwen stockholders - Basic and Diluted
|
|||||||||||
|
Continuing operations
|
$
|
(1.06
|
)
|
$
|
(0.54
|
)
|
$
|
(1.01
|
)
|
||
|
Discontinued operations
|
—
|
|
0.01
|
|
—
|
|
|||||
|
$
|
(1.06
|
)
|
$
|
(0.53
|
)
|
$
|
(1.01
|
)
|
|||
|
Weighted average common shares outstanding
|
|||||||||||
|
Basic
|
134,444,402
|
|
133,703,359
|
|
127,082,058
|
|
|||||
|
Diluted
|
134,444,402
|
|
133,703,359
|
|
127,082,058
|
|
|||||
The accompanying notes are an integral part of these consolidated financial statements
F-5
OCWEN FINANCIAL CORPORATION AND SUBSIDIARIES
CONSOLIDATED STATEMENTS OF COMPREHENSIVE LOSS
(Dollars in thousands)
|
|
For the Years Ended December 31,
|
||||||||||
|
|
2019
|
2018
|
2017
|
||||||||
|
Net loss
|
$
|
(142,125
|
)
|
$
|
(70,596
|
)
|
$
|
(128,457
|
)
|
||
|
Other comprehensive income (loss), net of income taxes
|
|
|
|
|
|
|
|||||
|
Reclassification adjustment for losses on cash flow hedges included in net income
|
147
|
|
149
|
|
201
|
|
|||||
|
Change in unfunded pension plan obligation liability
|
(3,442
|
)
|
(3,219
|
)
|
—
|
|
|||||
|
Other
|
(42
|
)
|
61
|
|
—
|
|
|||||
|
Comprehensive loss
|
(145,462
|
)
|
(73,605
|
)
|
(128,256
|
)
|
|||||
|
Comprehensive (income) loss attributable to non-controlling interests
|
—
|
|
(176
|
)
|
491
|
|
|||||
|
Comprehensive loss attributable to Ocwen stockholders
|
$
|
(145,462
|
)
|
$
|
(73,781
|
)
|
$
|
(127,765
|
)
|
||
The accompanying notes are an integral part of these consolidated financial statements
F-6
OCWEN FINANCIAL CORPORATION AND SUBSIDIARIES
CONSOLIDATED STATEMENTS OF CHANGES IN EQUITY
FOR THE YEARS ENDED
DECEMBER 31, 2019
,
2018
and
2017
(Dollars in thousands, except per share data)
|
|
Ocwen Stockholders
|
|
|
|||||||||||||||||||||||
|
|
Common Stock
|
Additional Paid-in
Capital
|
Retained Earnings (Accumulated Deficit)
|
Accumulated Other Comprehensive Income (Loss), Net of Taxes
|
Non-controlling Interest in Subsidiaries
|
Total
|
||||||||||||||||||||
|
|
Shares
|
Amount
|
||||||||||||||||||||||||
|
Balance at January 1, 2017
|
123,988,160
|
|
$
|
1,240
|
|
$
|
527,001
|
|
$
|
126,167
|
|
$
|
(1,450
|
)
|
$
|
2,325
|
|
$
|
655,283
|
|
||||||
|
Net loss
|
—
|
|
—
|
|
—
|
|
(127,966
|
)
|
—
|
|
(491
|
)
|
(128,457
|
)
|
||||||||||||
|
Cumulative effect of adoption of Financial Accounting Standards Board (FASB) Accounting Standards Update (ASU) No. 2016-09
|
—
|
|
—
|
|
284
|
|
(284
|
)
|
—
|
|
—
|
|
—
|
|
||||||||||||
|
Issuance of common stock
|
6,700,510
|
|
67
|
|
15,258
|
|
—
|
|
—
|
|
—
|
|
15,325
|
|
||||||||||||
|
Equity-based compensation and other
|
795,388
|
|
8
|
|
4,514
|
|
—
|
|
—
|
|
—
|
|
4,522
|
|
||||||||||||
|
Other comprehensive income (loss), net of income taxes
|
—
|
|
—
|
|
—
|
|
—
|
|
201
|
|
—
|
|
201
|
|
||||||||||||
|
Balance at December 31, 2017
|
131,484,058
|
|
1,315
|
|
547,057
|
|
(2,083
|
)
|
(1,249
|
)
|
1,834
|
|
546,874
|
|
||||||||||||
|
Net loss
|
—
|
|
—
|
|
—
|
|
(70,772
|
)
|
—
|
|
176
|
|
(70,596
|
)
|
||||||||||||
|
Cumulative effect of fair value election - MSRs, net of income taxes
|
—
|
|
—
|
|
—
|
|
82,043
|
|
—
|
|
—
|
|
82,043
|
|
||||||||||||
|
Cumulative effect of adoption of FASB ASU No. 2016-16
|
—
|
|
—
|
|
—
|
|
(5,621
|
)
|
—
|
|
—
|
|
(5,621
|
)
|
||||||||||||
|
Issuance of common stock
|
1,875,000
|
|
19
|
|
5,700
|
|
—
|
|
—
|
|
—
|
|
5,719
|
|
||||||||||||
|
Equity-based compensation and other
|
553,367
|
|
5
|
|
1,299
|
|
—
|
|
—
|
|
—
|
|
1,304
|
|
||||||||||||
|
Capital distribution to non-controlling interest
|
—
|
|
—
|
|
—
|
|
—
|
|
—
|
|
(822
|
)
|
(822
|
)
|
||||||||||||
|
Purchase of non-controlling interest
|
—
|
|
—
|
|
—
|
|
—
|
|
—
|
|
(1,188
|
)
|
(1,188
|
)
|
||||||||||||
|
Other comprehensive income (loss), net of income taxes
|
—
|
|
—
|
|
—
|
|
—
|
|
(3,008
|
)
|
—
|
|
(3,008
|
)
|
||||||||||||
|
Balance at December 31, 2018
|
133,912,425
|
|
1,339
|
|
554,056
|
|
3,567
|
|
(4,257
|
)
|
—
|
|
554,705
|
|
||||||||||||
|
Net loss
|
—
|
|
—
|
|
—
|
|
(142,125
|
)
|
—
|
|
—
|
|
(142,125
|
)
|
||||||||||||
|
Cumulative effect of adoption of FASB ASU No. 2016-02
|
—
|
|
—
|
|
—
|
|
16
|
|
—
|
|
—
|
|
16
|
|
||||||||||||
|
Equity-based compensation and other
|
949,807
|
|
10
|
|
2,742
|
|
—
|
|
—
|
|
—
|
|
2,752
|
|
||||||||||||
|
Other comprehensive income (loss), net of income taxes
|
—
|
|
—
|
|
—
|
|
—
|
|
(3,337
|
)
|
—
|
|
(3,337
|
)
|
||||||||||||
|
Balance at December 31, 2019
|
134,862,232
|
|
$
|
1,349
|
|
$
|
556,798
|
|
$
|
(138,542
|
)
|
$
|
(7,594
|
)
|
$
|
—
|
|
$
|
412,011
|
|
||||||
The accompanying notes are an integral part of these consolidated financial statements
F-7
OCWEN FINANCIAL CORPORATION AND SUBSIDIARIES
CONSOLIDATED STATEMENTS OF CASH FLOWS
(Dollars in thousands)
|
For the Years Ended December 31,
|
|||||||||||
|
2019
|
2018
|
2017
|
|||||||||
|
Cash flows from operating activities
|
|
|
|
|
|
|
|||||
|
Net loss
|
$
|
(142,125
|
)
|
$
|
(70,596
|
)
|
$
|
(128,457
|
)
|
||
|
MSR valuation adjustments, net
|
120,876
|
|
153,457
|
|
52,962
|
|
|||||
|
Gain on sale of MSRs, net
|
(453
|
)
|
(1,325
|
)
|
(10,537
|
)
|
|||||
|
Provision for bad debts
|
34,867
|
|
49,180
|
|
76,828
|
|
|||||
|
Depreciation
|
31,911
|
|
27,202
|
|
26,886
|
|
|||||
|
Loss on write-off of fixed assets, net
|
—
|
|
—
|
|
8,502
|
|
|||||
|
Amortization of debt issuance costs
|
3,170
|
|
2,921
|
|
2,738
|
|
|||||
|
Gain on repurchase of senior secured notes
|
(5,099
|
)
|
—
|
|
—
|
|
|||||
|
Provision for (reversal of) valuation allowance on deferred tax assets
|
32,470
|
|
(23,347
|
)
|
(29,979
|
)
|
|||||
|
Decrease (increase) in deferred tax assets other than provision for valuation allowance
|
(29,350
|
)
|
20,058
|
|
30,710
|
|
|||||
|
Equity-based compensation expense
|
2,697
|
|
2,366
|
|
5,624
|
|
|||||
|
(Gain) loss on valuation of financing liability
|
152,986
|
|
(19,269
|
)
|
41,282
|
|
|||||
|
(Gain) loss on trading securities
|
(215
|
)
|
(527
|
)
|
6,756
|
|
|||||
|
Net gain on valuation of mortgage loans held for investment and HMBS-related borrowings
|
(55,869
|
)
|
(18,698
|
)
|
(23,733
|
)
|
|||||
|
Bargain purchase gain
|
381
|
|
(64,036
|
)
|
—
|
|
|||||
|
Gain on loans held for sale, net
|
(38,300
|
)
|
(32,722
|
)
|
(53,209
|
)
|
|||||
|
Origination and purchase of loans held for sale
|
(1,488,974
|
)
|
(1,715,190
|
)
|
(3,695,163
|
)
|
|||||
|
Proceeds from sale and collections of loans held for sale
|
1,380,138
|
|
1,625,116
|
|
3,662,065
|
|
|||||
|
Changes in assets and liabilities:
|
|
|
|
|
|
|
|||||
|
Decrease in advances and match funded advances
|
105,052
|
|
258,899
|
|
330,052
|
|
|||||
|
Decrease in receivables and other assets, net
|
126,881
|
|
144,310
|
|
199,209
|
|
|||||
|
Decrease in other liabilities
|
(72,182
|
)
|
(69,207
|
)
|
(100,650
|
)
|
|||||
|
Other, net
|
(6,922
|
)
|
3,986
|
|
7,135
|
|
|||||
|
Net cash provided by operating activities
|
151,940
|
|
272,578
|
|
409,021
|
|
|||||
|
Cash flows from investing activities
|
|
|
|
|
|
|
|||||
|
Origination of loans held for investment
|
(1,026,154
|
)
|
(920,476
|
)
|
(1,277,615
|
)
|
|||||
|
Principal payments received on loans held for investment
|
558,720
|
|
400,521
|
|
444,388
|
|
|||||
|
Net cash acquired in the acquisition of PHH
|
—
|
|
64,692
|
|
—
|
|
|||||
|
Restricted cash acquired in the acquisition of PHH
|
—
|
|
38,813
|
|
—
|
|
|||||
|
Purchase of MSRs
|
(145,668
|
)
|
(5,433
|
)
|
(1,658
|
)
|
|||||
|
Proceeds from sale of MSRs
|
4,984
|
|
7,276
|
|
4,234
|
|
|||||
|
Acquisition of advances in connection with the purchase of MSRs
|
(1,457
|
)
|
—
|
|
—
|
|
|||||
|
Proceeds from sale of advances and match funded advances
|
14,186
|
|
33,792
|
|
9,446
|
|
|||||
|
Issuance of automotive dealer financing notes
|
—
|
|
(19,642
|
)
|
(174,363
|
)
|
|||||
|
Collections of automotive dealer financing notes
|
—
|
|
52,598
|
|
162,965
|
|
|||||
|
Additions to premises and equipment
|
(1,954
|
)
|
(9,016
|
)
|
(9,053
|
)
|
|||||
|
Proceeds from sale of real estate
|
7,548
|
|
9,546
|
|
3,147
|
|
|||||
|
Other, net
|
2,357
|
|
2,464
|
|
(707
|
)
|
|||||
|
Net cash used in investing activities
|
(587,438
|
)
|
(344,865
|
)
|
(839,216
|
)
|
|||||
|
Cash flows from financing activities
|
|
|
|
|
|
|
|||||
|
Repayment of match funded liabilities, net
|
(99,175
|
)
|
(220,334
|
)
|
(282,379
|
)
|
|||||
|
Proceeds from mortgage loan warehouse facilities and other secured borrowings
|
3,137,326
|
|
2,991,261
|
|
7,215,264
|
|
|||||
|
Repayments of mortgage loan warehouse facilities and other secured borrowings
|
(2,875,377
|
)
|
(3,350,648
|
)
|
(7,395,013
|
)
|
|||||
|
Repayment and repurchase of senior notes
|
(131,791
|
)
|
(18,482
|
)
|
—
|
|
|||||
|
Proceeds from issuance of additional senior secured term loan (SSTL)
|
119,100
|
|
—
|
|
—
|
|
|||||
|
Repayment of SSTL borrowing
|
(25,433
|
)
|
(66,750
|
)
|
(36,750
|
)
|
|||||
|
Payment of debt issuance costs
|
(2,813
|
)
|
—
|
|
(841
|
)
|
|||||
|
Proceeds from sale of MSRs accounted for as a financing
|
—
|
|
279,586
|
|
54,601
|
|
|||||
|
Proceeds from sale of Home Equity Conversion Mortgages (HECM, or reverse mortgages) accounted for as a financing (HMBS-related borrowings)
|
962,113
|
|
948,917
|
|
1,281,543
|
|
|||||
|
Repayment of HMBS-related borrowings
|
(549,600
|
)
|
(391,985
|
)
|
(418,503
|
)
|
|||||
|
Issuance of common stock
|
—
|
|
—
|
|
13,913
|
|
|||||
|
Capital distribution to non-controlling interest
|
—
|
|
(822
|
)
|
—
|
|
|||||
|
Purchase of non-controlling interest
|
—
|
|
(1,188
|
)
|
—
|
|
|||||
|
Other, net
|
(3,522
|
)
|
(2,818
|
)
|
(1,478
|
)
|
|||||
|
Net cash provided by financing activities
|
530,828
|
|
166,737
|
|
430,357
|
|
|||||
|
Net increase in cash, cash equivalents and restricted cash
|
95,330
|
|
94,450
|
|
162
|
|
|||||
|
Cash, cash equivalents and restricted cash at beginning of year
|
397,010
|
|
302,560
|
|
302,398
|
|
|||||
|
Cash, cash equivalents and restricted cash at end of year
|
$
|
492,340
|
|
$
|
397,010
|
|
$
|
302,560
|
|
||
|
Supplemental cash flow information
|
|
|
|
|
|
|
|||||
|
Interest paid
|
$
|
111,144
|
|
$
|
100,165
|
|
$
|
128,391
|
|
||
|
Income tax payments (refunds), net
|
4,075
|
|
10,957
|
|
(23,501
|
)
|
|||||
|
Supplemental non-cash investing and financing activities
|
|
|
|
|
|
|
|||||
|
Initial consolidation of mortgage-backed securitization trusts (VIEs):
|
|||||||||||
|
Loans held for investment
|
$
|
—
|
|
$
|
28,373
|
|
$
|
—
|
|
||
|
Other financing liabilities
|
—
|
|
26,643
|
|
—
|
|
|||||
|
Transfers from loans held for investment to loans held for sale
|
1,892
|
|
1,038
|
|
3,803
|
|
|||||
|
Transfers of loans held for sale to real estate owned (REO)
|
6,636
|
|
4,241
|
|
875
|
|
|||||
|
Issuance of common stock in connection with litigation settlement
|
—
|
|
5,719
|
|
1,937
|
|
|||||
|
Cumulative effect adjustment for election of fair value for MSRs previously accounted for using the amortization method
|
—
|
|
82,043
|
|
—
|
|
|||||
|
Recognition of gross right-of-use asset and lease liability upon adoption of FASB ASU No. 2016-02:
|
|||||||||||
|
Right-of-use asset
|
66,231
|
|
—
|
|
—
|
|
|||||
|
Lease liability
|
66,247
|
|
—
|
|
—
|
|
|||||
|
Supplemental business acquisition information
|
|||||||||||
|
Fair value of assets acquired
|
$
|
262
|
|
$
|
1,192,155
|
|
$
|
—
|
|
||
|
Fair value of liabilities assumed
|
643
|
|
769,723
|
|
—
|
|
|||||
|
Total identifiable net assets acquired
|
(381
|
)
|
422,432
|
|
—
|
|
|||||
|
Bargain purchase gain related to acquisition of PHH
|
(381
|
)
|
64,036
|
|
—
|
|
|||||
|
Total consideration
|
—
|
|
358,396
|
|
—
|
|
|||||
|
Less: Cash consideration paid by PHH
|
—
|
|
(325,000
|
)
|
—
|
|
|||||
|
Cash consideration paid by Ocwen
|
—
|
|
33,396
|
|
—
|
|
|||||
|
Cash acquired from PHH
|
—
|
|
98,088
|
|
—
|
|
|||||
|
Net cash acquired by Ocwen
|
$
|
—
|
|
$
|
64,692
|
|
$
|
—
|
|
||
The following table provides a reconciliation of cash and restricted cash reported within the consolidated balance sheets that sums to the total of the same such amounts reported in the consolidated statements of cash flows:
|
December 31, 2019
|
December 31, 2018
|
December 31, 2017
|
|||||||||
|
Cash and cash equivalents
|
$
|
428,339
|
|
$
|
329,132
|
|
$
|
259,655
|
|
||
|
Restricted cash and equivalents:
|
|||||||||||
|
Debt service accounts
|
23,276
|
|
26,626
|
|
33,726
|
|
|||||
|
Other restricted cash
|
40,725
|
|
41,252
|
|
9,179
|
|
|||||
|
Total cash, cash equivalents and restricted cash reported in the statements of cash flows
|
$
|
492,340
|
|
$
|
397,010
|
|
$
|
302,560
|
|
||
The accompanying notes are an integral part of these consolidated financial statements
F-8
OCWEN FINANCIAL CORPORATION AND SUBSIDIARIES
NOTES TO CONSOLIDATED FINANCIAL STATEMENTS
DECEMBER 31, 2019
,
2018
AND
2017
(Dollars in thousands, except per share data and unless otherwise indicated)
Note 1 — Organization, Business Environment, Basis of Presentation and Significant Accounting Policies
Organization
Ocwen Financial Corporation (NYSE: OCN) (Ocwen, we, us and our) is a non-bank mortgage servicer and originator providing solutions through its primary operating subsidiaries, PHH Mortgage Corporation (PMC) and Liberty Home Equity Solutions, Inc. (Liberty). We are headquartered in West Palm Beach, Florida with offices in the United States (U.S.) and the United States Virgin Islands (USVI) and operations in India and the Philippines. Ocwen is a Florida corporation organized in February 1988.
Ocwen directly or indirectly owns all of the outstanding common stock of its operating subsidiaries, including PMC since its acquisition on October 4, 2018, Liberty, Ocwen Financial Solutions Private Limited (OFSPL) and Ocwen USVI Services, LLC (OVIS).
We perform servicing activities related to our own MSR portfolio (primary) and on behalf of other servicers (subservicing), the largest being New Residential Investment Corp. (NRZ), and investors (primary and master servicing), including the Federal National Mortgage Association (Fannie Mae) and Federal Home Loan Mortgage Corporation (Freddie Mac) (collectively, the GSEs), the Government National Mortgage Association (Ginnie Mae) and private-label securitizations (non-Agency). As a subservicer or primary servicer, we may be required to make advances for certain property tax and insurance premium payments, default and property maintenance payments and principal and interest payments on behalf of delinquent borrowers to mortgage loan investors before recovering them from borrowers. Most, but not all, of our subservicing agreements provide for us to be reimbursed for any such advances by the owner of the servicing rights. Advances made by us as primary servicer are generally recovered from the borrower or the mortgage loan investor. As master servicer, we collect mortgage payments from primary servicers and distribute the funds to investors in the mortgage-backed securities. To the extent the primary servicer does not advance the scheduled principal and interest, as master servicer we are responsible for advancing the shortfall, subject to certain limitations.
We originate, sell and securitize conventional (conforming to the underwriting standards of Fannie Mae or Freddie Mac; collectively referred to as Agency loans) and government-insured (Federal Housing Administration (FHA) or Department of Veterans Affairs (VA)) forward mortgages, generally servicing retained. The GSEs or Ginnie Mae guarantee these mortgage securitizations. We originate HECM loans, or reverse mortgages, that are mostly insured by the FHA and are an approved issuer of HMBS that are guaranteed by Ginnie Mae.
We had a total of approximately
5,300
employees at
December 31, 2019
of which approximately
3,400
were located in India and approximately
400
were based in the Philippines. Our operations in India and the Philippines primarily provide internal support services, principally to our loan servicing business and our corporate functions. Of our foreign-based employees,
nearly
80%
were engaged in supporting our loan servicing operations as of
December 31, 2019
.
Business Environment
We are facing certain challenges and uncertainties that could have significant adverse effects on our business, financial condition, liquidity and results of operations. The ability of management to appropriately address these challenges and uncertainties in a timely manner is critical to our ability to operate our business successfully.
Losses have significantly eroded stockholders’ equity and weakened our financial condition. Our near-term priority is to return to sustainable profitability in the shortest timeframe possible within an appropriate risk and compliance environment. If we execute on our key business initiatives, we believe we will drive stronger financial performance.
First, we must expand our lending business and acquisitions of MSRs that are prudent and well-executed with appropriate financial return targets to replenish and grow our servicing portfolio.
Second, we must re-engineer our cost structure to go beyond eliminating redundant costs through the integration process and establish continuous cost improvement as a core strength. Our continuous cost improvement efforts are focused on leveraging our single servicing platform and technology, optimizing strategic sourcing and off-shore utilization, lean process design, automation and other technology-enabled productivity enhancements. Our initiatives are targeted at delivering superior accuracy, cost, speed and customer satisfaction. We believe these steps are necessary to simplify our operations and drive stronger financial performance.
F-9
Third, we must manage our balance sheet to ensure adequate liquidity, finance our ongoing business needs and provide a solid platform for executing on our other key business initiatives. Regarding the current maturities of our borrowings, as of
December 31, 2019
, we had approximately
$1.2 billion
of debt outstanding under facilities coming due in 2020. In January 2020, we extended the maturity of our SSTL from December 2020 to May 2022 and we reduced the outstanding balance from
$326.1 million
to
$200.0 million
.
Portions of our match funded advance facilities and all of our mortgage loan warehouse facilities have
364
-day terms consistent with market practice. We have historically renewed these facilities on or before their expiration in the ordinary course of financing our business. We expect to renew, replace or extend all such borrowings to the extent necessary to finance our business on or prior to their respective maturities consistent with our historical experience.
Finally, we must fulfill our regulatory commitments and resolve our remaining legal and regulatory matters on satisfactory terms. See
Note 24 — Regulatory Requirements
and
Note 26 — Contingencies
for further information.
Our debt agreements contain various qualitative and quantitative events of default provisions that include, among other things, noncompliance with covenants, breach of representations, or the occurrence of a material adverse change. If a lender were to allege an event of default and we are unable to avoid, remedy or secure a waiver of such alleged default, we could be subject to adverse actions by our lenders that could have a material adverse impact on us. In addition, PMC and Liberty are parties to seller/servicer agreements and/or subject to guidelines and regulations (collectively, seller/servicer obligations) with one or more of the GSEs, the Department of Housing and Urban Development (HUD), FHA, VA and Ginnie Mae. To the extent these requirements are not met or waived, the applicable agency may, at its option, utilize a variety of remedies including requirements to provide certain information or take actions at the direction of the applicable agency, requirements to deposit funds as security for our obligations, sanctions, suspension or even termination of approved seller/servicer status, which would prohibit future originations or securitizations of forward or reverse mortgage loans or servicing for the applicable agency. Any of these actions could have a material adverse impact on us. See
Note 14 — Borrowings
,
Note 24 — Regulatory Requirements
and
Note 26 — Contingencies
for further information.
In certain recent periods, Ocwen has incurred significant losses as a result of accelerated declines in the fair value of our MSRs due to interest rate decreases. Further interest rate decreases, prepayment speed increases and changes to other fair value inputs or assumptions could result in further fair value declines and hamper our ability to return to profitability. Starting in September 2019, we have implemented a hedging strategy to partially offset the changes in fair value of our net MSR portfolio. See
Note 17 — Derivative Financial Instruments and Hedging Activities
for further information.
In addition, we have exposure to concentration risk and client retention risk as a result of our relationship with NRZ, which accounted for
56%
of the UPB in our servicing portfolio as of December 31, 2019. Currently, subject to proper notice (generally 180 days’ notice), the payment of termination and loan deboarding fees and certain other provisions, NRZ has rights to terminate these agreements for convenience. Because of the large percentage of our servicing business that is represented by agreements with NRZ, if NRZ exercised all or a significant portion of these termination rights, we might need to right-size or restructure certain aspects of our servicing business as well as the related corporate support functions. On February 20, 2020, we received a notice of termination from NRZ with respect to the subservicing agreement between NRZ and PMC, which accounted for
20%
of our servicing portfolio UPB at December 31, 2019. See
Note 28 — Subsequent Events
.
Our ability to execute on our key initiatives is not certain and is dependent on the successful execution of several complex actions, including our ability to grow our lending business and acquire MSRs with appropriate financial return targets, our ability to acquire, maintain and grow profitable client relationships, our ability to maintain relationships with the GSEs, Ginnie Mae, FHFA, lenders and regulators, our ability to implement further organizational redesign and cost reduction, as well as the absence of significant unforeseen costs, including regulatory or legal costs, that could negatively impact our return to sustainable profitability, and our ability to extend, renew or replace our debt agreements in the ordinary course of business. There can be no assurances that the desired strategic and financial benefits of these actions will be realized.
Basis of Presentation and Significant Accounting Policies
Consolidation and Basis of Presentation
Principles of Consolidation
Our consolidated financial statements have been prepared in conformity with accounting principles generally accepted in the U.S. (GAAP).
Our consolidated financial statements include the accounts of Ocwen, its wholly-owned subsidiaries and any variable interest entity (VIE) for which we have determined that we are the primary beneficiary. We apply the equity method of accounting to investments when the entity is not a VIE, and we are able to exercise significant influence, but not control,
F-10
over the policies and procedures of the entity but own
50%
or less of the voting securities. Our statements of operations and consolidated balance sheets include the accounts and results of PHH Corporation and its subsidiaries since acquisition on October 4, 2018. See
Note 2 — Business Acquisition
for additional information.
We have eliminated intercompany accounts and transactions in consolidation.
Foreign Currency Translation
The functional currency of each of our foreign subsidiaries is the U.S. dollar. Re-measurement adjustments of foreign-denominated amounts to U.S. dollars are included in Other, net in our consolidated statements of operations.
Reclassifications
Certain amounts in the consolidated statements of operations for 2018 and 2017 have been reclassified to conform to the current year presentation. The reclassifications had no impact on net income (loss) or total revenue in our consolidated statements of operations and no impact on operating, investing and financing cash flows in our consolidated statements of cash flows.
We now present Reverse mortgage revenue, net as a separate revenue line item on the face of the statements of operations to provide a further breakdown of Other revenue, net and provide greater transparency on the performance associated with our portfolio of HECM loans, net of the HMBS-related borrowings that are both measured at fair value, as follows:
|
Years ended December 31,
|
||||||||||
|
2018
|
2017
|
|||||||||
|
Statements of Operations
|
||||||||||
|
Revenue
|
||||||||||
|
From
|
Gain on loans held for sale, net
|
$
|
40,407
|
|
$
|
46,219
|
|
|||
|
From
|
Other revenue, net
|
22,577
|
|
31,517
|
|
|||||
|
From
|
Servicing and subservicing fees
|
(2,747
|
)
|
(2,221
|
)
|
|||||
|
To
|
Reverse mortgage revenue, net (New line item)
|
60,237
|
|
75,515
|
|
|||||
|
Total revenue
|
—
|
|
—
|
|
||||||
In addition to the above reclassifications, we have made the following presentation changes:
|
•
|
In the consolidated statements of operations, we now separately present MSR valuation adjustments, net from Total expenses, renamed “Operating expenses”. The purpose of this reclassification is to separately present fair value changes from operating expenses and provide additional insights on the nature of our performance.
|
|
•
|
Within the Other income (expense), net on the consolidated statements of operations, we now present the expense related to the pledged MSR liability recorded at fair value separately from Interest expense. The purpose of this reclassification is to improve transparency between the interest expense associated with interest-bearing liabilities recorded on an accrual basis and expenses that are attributable to the pledged MSR liability recorded at fair value. The pledged MSR liability is the obligation to deliver NRZ all contractual cash flows associated with the underlying MSR that did not meet the requirements for sale accounting treatment. The Pledged MSR liability expense reflects net servicing fee remittance and fair value changes. In the Supplemental cash flow section of the consolidated statements of cash flows, as a result of this reclassification of Pledged MSR liability expense from interest expense, we have reclassified
$171.7 million
and
$236.3 million
of Pledged MSR liability expense out of Interest paid in 2018 and 2017, respectively.
|
|
•
|
Within the Total liabilities section of our consolidated balance sheet at December 31, 2018, we reclassified borrowings with an outstanding balance of
$65.5 million
from Other financing liabilities to Other secured borrowings. Effective with this reclassification, all amounts included in Other financing liabilities represent secured financing as a result of sale transactions that do not meet the requirements for sale accounting treatment.
|
|
•
|
Within the Cash flows from financing activities section of our consolidated statements of cash flows, we reclassified repayments of our SSTL from the Repayments of mortgage loan warehouse facilities and other secured borrowings line item to a new line item (Repayment of SSTL borrowings).
|
Use of Estimates and Assumptions
The preparation of financial statements in conformity with GAAP requires that management make estimates and assumptions that affect the reported amounts of assets and liabilities and disclosure of contingent assets and liabilities at the date of the financial statements and the reported amounts of revenues and expenses during the reporting period. Such
F-11
estimates and assumptions include, but are not limited to fair value measurements, allowance for losses, income taxes, indemnification obligations, litigation-related obligations, and our going concern evaluation. In developing estimates and assumptions, management uses all available information; however, actual results could materially differ from those estimates and assumptions.
Significant Accounting Policies
Cash and cash equivalents
Cash includes both interest-bearing and non-interest-bearing demand deposits with financial institutions that have original maturities of 90 days or less.
Restricted Cash
Restricted cash includes amounts specifically designated to repay debt, to provide over-collateralization for secured borrowings and match funded debt facilities, and to provide additional collateral to support certain obligations, including letters of credit.
Mortgage Servicing Rights
MSRs are assets representing our right to service portfolios of mortgage loans. We retain MSRs on originated or purchased loans when they are sold in the secondary market. We also acquire MSRs through asset purchases or business combination transactions. The unpaid principal balance (UPB) of the loans underlying the MSRs is not included on our consolidated balance sheets. For servicing retained in connection with the securitization of reverse mortgage loans accounted for as secured financings, we do not recognize an MSR.
All newly acquired or retained MSRs are initially measured at fair value. To the extent any portfolio contract is not expected to compensate us adequately for performing the servicing, we would recognize a servicing liability. We define contracts as Agency, government-insured or non-Agency (commonly referred to as non-prime, subprime or private-label loans) based on their general comparability with regard to servicing guidelines, underwriting standards and borrower risk characteristics. We identify classes of servicing assets and servicing liabilities based on the availability of market inputs used in determining their fair value and our methods for managing their risks. Servicing assets are not recognized for subservicing arrangements entered into with the entity that owns the MSRs.
Subsequent to acquisition, we account for servicing assets and servicing liabilities at fair value, and report changes in fair value in earnings (MSR valuation adjustments, net) in the period in which the changes occur. Effective January 1, 2018, we elected fair value accounting for our MSRs previously accounted for using the amortization method, which included Agency MSRs and government-insured MSRs. Effective with this election, our entire portfolio of MSRs is accounted for using the fair value measurement method. We recorded a cumulative-effect adjustment of
$82.0 million
to retained earnings as of January 1, 2018 to reflect the excess of the fair value over the carrying amount. See
Note 9 — Mortgage Servicing
for additional information.
Until December 31, 2017, for servicing assets or liabilities that we previously accounted for using the amortization method, we amortized the balances in proportion to, and over the period of, estimated net servicing income (if servicing revenues exceed servicing costs) or net servicing loss (if servicing costs exceed servicing revenues). Estimated net servicing income is primarily driven by the estimated future cash flows of the underlying mortgage loan portfolio, which, absent new purchases, declines over time from prepayments and scheduled loan amortization. We adjusted MSR amortization prospectively in response to changes in estimated projections of future cash flows. We stratified servicing assets or liabilities based upon one or more of the predominant risk characteristics of the underlying portfolios and assess servicing assets or liabilities for impairment or increased obligation by determining the difference, if any, between the carrying amount and estimated fair value at each reporting date. We recognized any impairment, or increased obligation, through a valuation allowance which was adjusted to reflect subsequent changes in the measurement of impairment and reported in earnings (MSR valuation adjustments, net) in the period in which the changes occurred. We do not recognize fair value in excess of the carrying amount of servicing assets for any stratum.
We earn fees for servicing and subservicing mortgage loans. We collect servicing and subservicing fees, generally expressed as a percent of UPB, from the borrowers’ payments. In addition to servicing and subservicing fees, we also report late fees, prepayment penalties, float earnings and other ancillary fees as revenue in Servicing and subservicing fees in our consolidated statements of operations. We recognize servicing and subservicing fees as revenue when the fees are earned, which is generally when the borrowers’ payments are collected or when loans are modified or liquidated through the sale of the underlying real estate collateral or otherwise.
F-12
Advances and Match Funded Advances
During any period in which a borrower does not make payments, servicing and subservicing agreements may require that we advance our own funds to meet contractual principal and interest remittance requirements for the investors, to pay property taxes and insurance premiums and to process foreclosures. We also advance funds to maintain, repair and market foreclosed real estate properties on behalf of investors. These advances are made pursuant to the terms of each servicing and subservicing contract. Each servicing and subservicing contract is associated with specific loans, identified as a pool.
When we make an advance on a loan under each servicing or subservicing contract, we are entitled to recover that advance either from the borrower, for reinstated and performing loans, or from guarantors (GSEs), insurers (FHA/VA) and investors, for modified and liquidated loans. Most of our servicing and subservicing contracts provide that the advances made under the respective agreement have priority over all other cash payments from the proceeds of the loan, and in the majority of cases, the proceeds of the pool of loans that are the subject of that servicing or subservicing contract. As a result, we are entitled to repayment from loan proceeds before any interest or principal is paid on the bonds, and in the majority of cases, advances in excess of loan proceeds may be recovered from pool level proceeds.
We establish an allowance for losses through a charge to earnings (Servicing and origination expense) to the extent we believe that a portion of advances are uncollectible under the provisions of each servicing contract taking into consideration, among other factors, probability of cure or modification, length of delinquency and the amount of the advance. We are generally only obligated to advance funds to the extent that we believe the advances are recoverable from expected proceeds from the loan. We continually assess collectibility using proprietary cash flow projection models that incorporate a number of different factors, depending on the characteristics of the mortgage loan or pool, including, for example, estimated time to a foreclosure sale, estimated costs of foreclosure action, estimated future property tax payments and the estimated value of the underlying property net of estimated carrying costs, commissions and closing costs.
Under the terms of our subservicing agreements, we are generally reimbursed by our subservicing clients on a monthly or more frequent basis. For those advances that have been reimbursed, i.e., that are off-balance sheet, if a loss contingency is probable and reasonably estimable, we recognize a loss contingency accrual for the amount of advances deemed uncollectible caused by our failure to comply with the subservicing agreements or our servicing practices. We report such loss contingency within Other liabilities - Liability for indemnification obligations.
Loans Held for Sale
Loans held for sale include forward and reverse mortgage loans that we do not intend to hold until maturity. We report loans held for sale at either fair value or the lower of cost or fair value computed on an aggregate basis. For loans we measure at the lower of cost or fair value, we account for any excess of cost over fair value as a valuation allowance and include changes in the valuation allowance in Other, net, in the consolidated statements of operations in the period in which the change occurs. For loans that we elected to measure at fair value on a recurring basis, we report changes in fair value in Gain on loans held for sale, net in the consolidated statements of operations in the period in which the changes occur. These loans are expected to be sold into the secondary market to the GSEs, into Ginnie Mae guaranteed securitizations or to third-party investors.
We report any gain or loss on the transfer of loans held for sale in Gain on loans held for sale, net in the consolidated statements of operations along with the changes in fair value of the loans and the gain or loss on any related derivatives. When loans are sold or securitized with servicing retained, the gain on sale includes the MSR retained as non-cash proceeds at the date of sale. We include all changes in loans held for sale and related derivative balances in operating activities in the consolidated statements of cash flows.
We accrue interest income as earned. We place loans on non-accrual status after any portion of principal or interest has been delinquent for more than
89 days
, or earlier if management determines the borrower is unable to continue performance. When we place a loan on non-accrual status, we reverse the interest that we have accrued but not yet received. We return loans to accrual status only when we reinstate the loan and there is no significant uncertainty as to collectability.
Loans Held for Investment
Newly originated reverse residential mortgage loans that are insured by the FHA and pooled into Ginnie Mae guaranteed securities that we sell into the secondary market with servicing rights retained are classified as loans held for investment. We have elected to measure these loans at fair value. Loan transfers in these Ginnie Mae securitizations do not meet the definition of a participating interest and as a result, the transfers of the reverse mortgages do not qualify for sale accounting. Therefore, we account for these transfers as financings, with the reverse mortgages classified as Loans held for investment, at fair value, on our consolidated balance sheets, with no gain or loss recognized on the transfer.
We have elected to fair value future draw commitments for HECM loans purchased or originated after December 31, 2018. The estimated fair value is included in Loans held for investment on our consolidated balance sheet with changes in
F-13
fair value recognized in Reverse mortgage revenue, net in our consolidated statement of operations. The value of future draw commitments for HECM loans purchased or originated before January 1, 2019 is recognized as the draws are securitized or sold.
Upfront costs and fees related to loans held for investment, including broker fees, are recognized in Reverse mortgage revenue, net in the statement of operations as incurred and are not capitalized. Premiums on loans purchased via the correspondent channel are capitalized upon origination because they represent part of the purchase price. However, the loans are subsequently measured at fair value on a recurring basis.
We record the proceeds from the transfer of assets as secured borrowings (HMBS-related borrowings) in Financing liabilities and recognize no gain or loss on the transfer. We measure the HECM loans and HMBS-related borrowings at fair value on a recurring basis. The changes in fair value of the HECM loans and HMBS-related borrowings are included in Reverse mortgage revenue, net in our consolidated statements of operations. Included in net fair value changes on the HECM loans and related HMBS borrowings are the net interest income that we expect to be collected on the HECM loans and the interest expense that we expect to be paid on the HMBS-related borrowings. In addition, reverse mortgage revenue, net includes the fair value changes of the interest rate lock commitments related to reverse mortgage loans. We report originations and collections of HECM loans in investing activities in the consolidated statements of cash flows. We report net fair value gains on HECM loans and the related HMBS borrowings as an adjustment to the net cash provided by or used in operating activities in the consolidated statements of cash flows. Proceeds from securitizations of HECM loans and payments on HMBS-related borrowings are included in financing activities in the consolidated statements of cash flows.
Transfers of Financial Assets and MSRs
We securitize, sell and service forward and reverse residential mortgage loans. Securitization transactions typically involve the use of VIEs and are accounted for either as sales or as secured financings. We typically retain economic interests in the securitized assets in the form of servicing rights and obligations. In order to efficiently finance our assets and operations and create liquidity, we may sell servicing advances, MSRs or the right to receive certain servicing fees relating to MSRs (Rights to MSRs).
In order to determine whether or not a VIE is required to be consolidated, we consider our ongoing involvement with the VIE. In circumstances where we have both the power to direct the activities that most significantly impact the performance of the VIE and the obligation to absorb losses or the right to receive benefits that could be significant, we would conclude that we would consolidate the entity, which precludes us from recording an accounting sale in connection with the transfer of the financial assets. In the case of a consolidated VIE, we continue to report the underlying residential mortgage loans or servicing advances, and we record the securitized debt on our consolidated balance sheet.
In the case of transfers where either one or both of the power or economic criteria above are not met, we evaluate whether a sale has occurred for accounting purposes. In order to recognize a sale, the transferred assets must be legally isolated, not be constrained by restrictions from further transfer and be deemed to be beyond our control. If the transfer does not meet any of these three criteria, the transaction is accounted for consistent with a secured financing. In certain situations, we may have continuing involvement in transferred loans through our retained servicing. Transactions involving retained servicing would still be eligible for sale accounting, as we have ceded effective control of these loans to the purchaser. Subsequent to the determination that a transaction does not meet the accounting sale criteria, we may determine that we meet the criteria. In the event we subsequently meet the accounting sale criteria, we derecognize the transferred assets and related liabilities.
In connection with the Ginnie Mae early buyout program, our agreements provide either that: (a) we have the right, but not the obligation, to repurchase previously transferred mortgage loans under certain conditions, including the mortgage loans becoming eligible for pooling under a program sponsored by Ginnie Mae; or (b) we have the obligation to repurchase previously transferred mortgage loans that have been subject to a successful trial modification before any permanent modification is made. Once these conditions are met, we have effectively regained control over the mortgage loan(s), and under GAAP, must re-recognize the loans on our consolidated balance sheets and establish a corresponding repurchase liability. With respect to those loans that we have the right, but not the obligation, to repurchase under the applicable agreement, this requirement applies regardless of whether we have any intention to repurchase the loan. We re-recognize the loans in Other assets and a corresponding liability in Other liabilities.
In the case of transfers of MSRs and Rights to MSRs where we retain the right to subservice, we defer any related gain or loss and amortize the balance over the life of the subservicing agreement.
Gains or losses on off-balance sheet securitizations take into consideration any retained interests, including servicing rights and representation and warranty obligations, both of which are initially recorded at fair value at the date of sale in Gain on loans held for sale, net, in our consolidated statements of operations.
F-14
Premises and Equipment
We report premises and equipment at cost and, except for land, depreciate them over their estimated useful lives on a straight-line basis as follows:
|
Computer software
|
2 – 3 years
|
|
Computer hardware
|
3 years
|
|
Buildings
|
40 years
|
|
Leasehold improvements
|
Term of the lease not to exceed useful life
|
|
Right of Use (ROU) assets
|
Term of the lease not to exceed useful life
|
|
Furniture and fixtures
|
5 years
|
|
Office equipment
|
5 years
|
Litigation
We monitor our legal matters, including advice from external legal counsel, and periodically perform assessments of these matters for potential loss accrual and disclosure. We establish a liability for settlements, judgments on appeal and filed and/or threatened claims for which we believe that it is probable that a loss has been or will be incurred and the amount can be reasonably estimated. We recognize legal costs associated with loss contingencies in Professional services expense in the consolidated statement of operations as incurred.
Stock-Based Compensation
We initially measure the cost of employee services received in exchange for a stock-based award as the fair value of the award on the grant date. For awards which must be settled in cash and are therefore classified as liabilities rather than equity in the consolidated balance sheet, fair value is subsequently remeasured and fair value changes are reported as compensation expense at each reporting date. For equity awards with a service condition, we recognize the cost as compensation expense ratably over the vesting period. For equity awards with a market condition, we recognize the cost as compensation expense ratably over the expected life of the option that is derived from an options pricing model. When equity awards with a market condition meet their vesting requirements, any unrecognized compensation at the vesting date is recognized ratably over the vesting period. For equity awards with both a market condition and a service condition for vesting, we recognize cost as compensation expense over the requisite service period for each tranche of the award using the graded-vesting method.
Income Taxes
We file consolidated U.S. federal income tax returns. We allocate consolidated income tax among all subsidiaries included in the consolidated return as if each subsidiary filed a separate return or, in certain cases, a consolidated return.
We account for income taxes using the asset and liability method, which requires the recognition of deferred tax liabilities and assets for the expected future tax consequences of temporary differences between the carrying amounts and the tax bases of assets and liabilities. Additionally, we adjust deferred taxes to reflect estimated tax rate changes. We conduct periodic evaluations to determine whether it is more likely than not that some or all of our deferred tax assets will not be realized. Among the factors considered in this evaluation are estimates of future earnings, the future reversal of temporary differences and the impact of tax planning strategies that we can implement if warranted. We provide a valuation allowance for any portion of our deferred tax assets that, more likely than not, will not be realized. We recognize the financial statement benefit of a tax position only after determining that the relevant tax authority would more likely than not sustain the position following an audit. For tax positions meeting the more-likely-than-not threshold, the amount recognized in the consolidated financial statements is the largest benefit that has a greater than 50 percent likelihood of being realized upon ultimate settlement with the relevant tax authority. We recognize interest and penalties related to income tax matters in Income tax expense.
In December 2017, the Securities and Exchange Commission Staff issued Staff Accounting Bulletin (SAB) 118 (as further clarified by FASB ASU 2018-05, Income Taxes (Topic 740): Amendments to SEC Paragraphs Pursuant to SEC Staff Accounting Bulletin No. 118), which provides guidance on accounting for the income tax effects of the Tax Cuts and Jobs Act (Tax Act) signed into law by the President of the United States on December 22, 2017. SAB 118 provides a measurement period that should not extend beyond one year from the Tax Act enactment date for companies to complete the accounting under Accounting Standards Codification (ASC) 740,
Income Taxes
. In accordance with SAB 118, a company must reflect the income tax effects of those aspects of the Tax Act for which the accounting under ASC 740 is complete. To the extent that a company's accounting for certain income tax effects of the Tax Act is incomplete but it is able to determine a reasonable estimate, it must record a provisional estimate in the financial statements and should continue to apply ASC 740 on the basis of the provisions of the tax laws that were in effect immediately before the enactment of the Tax Act. We
F-15
adopted the guidance of SAB 118 as of December 31, 2017. We finalized our provisional amounts recognized under SAB 118 in the fourth quarter of 2018. See
Note 20 — Income Taxes
for additional information.
Basic and Diluted Earnings per Share
We calculate basic earnings per share based upon the weighted average number of shares of common stock outstanding during the year. We calculate diluted earnings per share based upon the weighted average number of shares of common stock outstanding and all dilutive potential common shares outstanding during the year. The computation of diluted earnings per share includes the estimated impact of the exercise of the outstanding options to purchase common stock using the treasury stock method.
Going Concern
In accordance with FASB ASC 205-40,
Presentation of Financial Statements - Going Concern
, we evaluate whether there are conditions that are known or reasonably knowable, such as those discussed in the “Business Environment” section, that raise substantial doubt about our ability to continue as a going concern within one year after the date that our financial statements are issued.
Our financial statements have been prepared on a going concern basis, which contemplates the realization of assets and the satisfaction of liabilities in the normal course of business.
The assessment of our ability to meet our future obligations is inherently judgmental, subjective and susceptible to change. Our assessment considers information including, but not limited to, our financial condition, liquidity sources, obligations coming due within one year after the financial statements are issued, funds necessary to maintain current operations and any negative financial trends or other indicators of possible financial difficulty, including adverse regulatory or legal proceedings, adverse counterparty actions or rating agency decisions, and our client concentration.
Based on our evaluation, we have determined that there are no conditions that are known or reasonably knowable that raise substantial doubt about our ability to continue as a going concern within one year after the date that our financial statements for the year ended December 31, 2019 are issued.
Accounting Standards Adopted in
2019
Leases (ASU 2016-02, ASU 2018-10, ASU 2018-11 and ASU 2019-01)
This ASU requires a lessee to recognize right-of-use (ROU) assets and lease liabilities on the balance sheet, regardless of whether the lease is classified as a finance or operating lease.
We adopted the new leasing guidance on January 1, 2019, and we elected practical expedients permitted by the new standard which provided us transition relief when assessing leases that commenced prior to the adoption date, including determining whether existing contracts are or contain leases, the classification of such leases as operating or financing, and the accounting for initial direct costs. No adjustments were made to comparative prior periods.
F-16
The adoption resulted in the recognition of a cumulative-effect adjustment to the opening balance of Retained earnings, the recognition of a gross ROU asset and lease liability, and the reclassification of existing balances for our leases as follows:
|
Balances as of December 31, 2018
(1)
|
Recognition of Gross ROU Asset and Lease Liability
|
Reclassification of Existing Balances
|
Balances
January 1, 2019 after Transition Adjustments (2) |
||||||||||||
|
Premises and Equipment:
|
|||||||||||||||
|
Right-of-use assets
|
$
|
—
|
|
$
|
66,231
|
|
$
|
(21,438
|
)
|
$
|
44,793
|
|
|||
|
Other Assets:
|
|||||||||||||||
|
Prepaid expenses (rent)
|
977
|
|
—
|
|
(977
|
)
|
—
|
|
|||||||
|
Other Liabilities:
|
|||||||||||||||
|
Liability for lease abandonments and deferred rent
|
(5,498
|
)
|
—
|
|
5,498
|
|
—
|
|
|||||||
|
Lease liability
|
—
|
|
(66,247
|
)
|
977
|
|
(65,270
|
)
|
|||||||
|
Liabilities related to discontinued operations:
|
|||||||||||||||
|
Liability for lease abandonments (3)
|
(15,940
|
)
|
—
|
|
15,940
|
|
—
|
|
|||||||
|
Retained Earnings:
|
|||||||||||||||
|
Cumulative effect of adopting ASU 2016-02
|
—
|
|
16
|
|
—
|
|
16
|
|
|||||||
|
(1)
|
Represents amounts related to leases impacted by the adoption of this ASU that were included in our December 31, 2018 consolidated balance sheet.
|
|
(2)
|
ROU assets as of January 1, 2019 after transition adjustments includes
$30.4 million
related to premises located in the U.S.,
$13.6 million
related to premises located in India and the Philippines, and
$0.7 million
related to equipment.
|
|
(3)
|
Represents lease impairments recognized by PHH prior to the acquisition.
|
Our leases include non-cancelable operating leases for premises and equipment with maturities extending to 2025, exclusive of renewal option periods. At lease commencement and renewal date, we estimate the ROU assets and lease liability at present value using our estimated incremental borrowing rate, which was
7.5%
on the initial recognition date of January 1, 2019. We elected to recognize ROU assets and lease liabilities that arise from short-term leases.
Restricted cash includes a
$23.2 million
deposit as collateral for an irrevocable standby letter of credit issued in connection with one of our leased facilities. This letter of credit requirement under the terms of the lease agreement is primarily the result of PHH not meeting certain credit rating criteria prior to the acquisition. The required amount of the letter of credit will be reduced each month beginning in January 2021 through the lease expiration on December 31, 2022.
We amortize the balance of the ROU assets and recognize interest on the lease liability that we report in Occupancy and equipment expense in our consolidated statements of operations. Our lease liability represents the present value of the lease payments and is reduced as we make cash payments on our lease obligations. Our ROU lease assets are evaluated for impairment, in accordance with ASC 360,
Premises and Equipment
, at each reporting date.
Subsequent to adoption, we made the decision to vacate six leased properties prior to the contractual maturity date of the lease agreements. As a result of our plan to vacate the office space, we accelerated the recognition of amortization on the ROU assets based on the shortened remaining useful life of the leases. During 2019, we recorded total accelerated amortization and other expenses of
$8.3 million
related to these leases in Occupancy and equipment expense in our consolidated statements of operations.
Receivables: Nonrefundable Fees and Other Costs (ASU 2017-08)
This ASU amends the amortization period for certain purchased callable debt securities held at a premium. This standard shortens the amortization period for the premium to the earliest call date, rather than generally amortizing the premium as an adjustment of yield over the contractual life of the instrument. Our adoption of this standard on January 1, 2019 did not have a material impact on our consolidated financial statements.
Income Statement - Reporting Comprehensive Income: Reclassification of Certain Tax Effects from Accumulated Other Comprehensive Income (ASU 2018-02)
This ASU provides entities with an option to reclassify stranded tax effects within accumulated other comprehensive income to retained earnings in each period in which the effect of the change in the U.S. federal corporate income tax rate in
F-17
the Tax Act (or portion thereof) is recorded. Our adoption of this standard on January 1, 2019 did not have a material impact on our consolidated financial statements.
Accounting Standards Issued but Not Adopted in
2019
Financial Instruments - Credit Losses: Measurement of Credit Losses on Financial Instruments (ASU 2016-13 and ASU 2019-04)
This ASU will require more timely recording of credit losses on loans and other financial instruments. This standard aligns the accounting with the economics of lending by requiring banks and other lending institutions to immediately record the full amount of credit losses that are expected in their loan portfolios. The new guidance requires an organization to measure all expected credit losses for financial assets and certain off-balance sheet credit exposures at the reporting date based on historical experience, current conditions, and reasonable and supportable forecasts. This standard requires enhanced disclosures related to the significant estimates and judgments used in estimating credit losses, as well as the credit quality and underwriting standards of an organization’s portfolio. Additionally, the new guidance amends the accounting for credit losses on available-for-sale debt securities and purchased financial assets with credit deterioration.
We will adopt this standard on January 1, 2020 by applying the guidance at the adoption date with a cumulative-effect adjustment to the opening balance of retained earnings. As permitted by this standard, we will make an irrevocable fair value election for certain financial instruments within the scope of the standard, including the future draw commitments for HECM loans that are not accounted at fair value (i.e., those purchased or originated before January 1, 2019). We expect to record a
$47.0 million
cumulative-effect transition gain adjustment (before income taxes) to retained earnings as of January 1, 2020 to reflect the fair value of these financial instruments. We do not expect any significant tax effect of this adjustment as the increase in the deferred tax liability is expected to be offset by a corresponding decrease to the valuation allowance. We currently do not expect the transition adjustment related to financial instruments for which we are not electing the fair value option to result in a significant adjustment to the opening balance of retained earnings.
Fair Value Measurement: Disclosure Framework - Changes to the Disclosure Requirements for Fair Value Measurement (ASU 2018-13)
This ASU modifies the disclosure requirements for fair value measurements in FASB ASC Topic 820, Fair Value Measurement. The main provisions in this ASU include removal of the following disclosure requirements: 1) the amount of and reasons for transfers between Level 1 and Level 2 of the fair value hierarchy, 2) the policy for timing of transfers between levels and 3) the valuation processes for Level 3 fair value measurements. This standard adds disclosure requirements to report the changes in unrealized gains and losses for the period included in other comprehensive income for recurring Level 3 fair value measurements held at the end of the reporting period, and for certain unobservable inputs an entity may disclose other quantitative information in lieu of the weighted average if the entity determines that other quantitative information would be a more reasonable and rational method to reflect the distribution of unobservable inputs used to develop Level 3 fair value measurements.
Our adoption of this standard on January 1, 2020 did not have a material impact on our consolidated financial statements. The amendments on changes in unrealized gains and losses, the range and weighted average of significant unobservable inputs used to develop Level 3 fair value measurements, and the narrative description of measurement uncertainty will be applied prospectively for only the most recent interim or annual period presented in the initial fiscal year of adoption. All other amendments will be applied retrospectively to all periods presented upon their effective date.
Intangibles - Goodwill and Other - Internal-Use Software: Customer’s Accounting for Implementation Costs Incurred in a Cloud Computing Arrangement That Is a Service Contract (ASU 2018-15)
This ASU aligns the requirements for capitalizing implementation costs incurred in a hosting arrangement that is a service contract with the requirements for capitalizing implementation costs incurred to develop or obtain internal-use software (and hosting arrangements that include an internal use software license). The accounting for the service element of a hosting arrangement that is a service contract is not affected by the amendments in this ASU. The amendments in this ASU require an entity (customer) in a hosting arrangement that is a service contract to follow the guidance to determine which implementation costs to capitalize as an asset related to the service contract and which costs to expense. The amendments in this ASU require the entity (customer) to expense the capitalized implementation costs of a hosting arrangement that is a service contract over the term of the hosting arrangement. The amendments in this ASU also require the entity to present the expense related to the capitalized implementation costs in the same line item in the statement of operations as the fees associated with the hosting element (service) of the arrangement and classify payments for capitalized implementation costs in the statement of cash flows in the same manner as payments made for fees associated with the hosting element.
Upon adoption of this standard on January 1, 2020, we elected to apply the amendments in this ASU prospectively to all implementation costs incurred subsequent to that date. We do not anticipate that our adoption of this standard will have a material impact on our consolidated financial statements.
F-18
Compensation - Retirement Benefits - Defined Benefit Plans: Disclosure Framework - Changes to the Disclosure Requirements for Defined Benefit Plans (ASU 2018-14)
This ASU modifies the disclosure requirements for defined benefit plans in FASB ASC Subtopic 715-20, Compensation-Retirement Benefits-Defined Benefit Plans-General. The main provisions in this ASU include removal of the following disclosure requirements: 1) the amounts in accumulated other comprehensive income expected to be recognized as components of net periodic benefit cost over the next fiscal year, 2) the amount and timing of plan assets expected to be returned to the employer, 3) related party disclosures about the amount of future annual benefits covered by insurance and annuity contracts and significant transactions between the employer or related parties and the plan, and 4) the effects of a one-percentage-point change in assumed health care cost trend rates on the (a) aggregate of the service and interest cost components of net periodic benefit costs and (b) benefit obligation for postretirement health care benefits.
This ASU adds disclosure requirements to report 1) the weighted-average interest crediting rates for cash balance plans and other plans with promised interest crediting rates and 2) an explanation of the reasons for significant gains and losses related to changes in the benefit obligation for the period. The ASU clarifies disclosure requirements in paragraph 715-20-50-3, which state that the 1) projected benefit obligation (PBO) and fair value of plan assets for plans with PBOs in excess of plan assets and 2) accumulated benefit obligation (ABO) and fair value of plan assets for plans with ABOs in excess of plan assets should be disclosed for defined benefit plans.
Our adoption of this standard on January 1, 2020 did not have a material impact on our consolidated financial statements. Upon adoption, we elected to apply the amendments in this ASU prospectively.
Note 2 — Business Acquisition
On October 4, 2018, we completed our acquisition of PHH, a non-bank servicer with established servicing and origination recapture capabilities. As a result of the acquisition, PHH became a wholly owned subsidiary of Ocwen.
The acquisition has been accounted for under the acquisition method of accounting pursuant to ASC 805,
Business Combinations
. Assets acquired and liabilities assumed are recorded at their fair value as of the date of acquisition based on management’s estimates using currently available information. The results of PHH operations are included in Ocwen’s consolidated statements of operations from the date of acquisition. For U.S. income tax purposes, the acquisition of PHH is treated as a stock purchase.
The aggregate consideration paid to the former holders of PHH common stock was
$358.4 million
in cash and was funded by a combination of PHH cash on hand of
$325.0 million
and Ocwen cash on hand of
$33.4 million
. At the closing, there were
32,581,485
shares of PHH common stock, par value
$0.01
, outstanding, all of which were converted into the right to receive
$11.00
in cash per share. In connection with the acquisition, all outstanding options to purchase PHH common stock and all PHH equity awards with performance-based vesting conditions were cancelled without any consideration or cash payment. All other PHH equity awards were cancelled in exchange for a cash payment equal to
$11.00
per share underlying the award.
We recognized a bargain purchase gain, net of tax, of
$63.7 million
(
$64.0 million
in 2018) in connection with the acquisition. The bargain purchase gain results from the fair value of PHH’s net assets exceeding the purchase price we paid. The purchase price we negotiated contemplated that PHH would incur losses after the acquisition date. To the extent those losses are realized, they are included in our consolidated statements of operations.
Costs incurred in connection with the transaction are expensed as incurred and are reported in Professional services in the consolidated statements of operations. Such costs were
$13.7 million
during 2018.
Purchase Price Allocation
The purchase price allocation provided in the table below reflects the final determination of the fair value of assets acquired and liabilities assumed in the acquisition of PHH, with the excess of total identifiable net assets over total consideration paid recorded as a bargain purchase gain. Independent valuation specialists conducted analyses to assist management in determining the fair value of certain acquired assets and assumed liabilities. Management is responsible for these third-party valuations and appraisals. The methodologies that we use and key assumptions that we made to estimate the fair value of the acquired assets and assumed debt are described in
Note 5 — Fair Value
.
F-19
|
Purchase Price Allocation
|
October 4, 2018
|
Adjustments
|
Final
|
||||||||
|
Cash
|
$
|
423,088
|
|
$
|
—
|
|
$
|
423,088
|
|
||
|
Restricted cash
|
38,813
|
|
—
|
|
38,813
|
|
|||||
|
MSRs
|
518,127
|
|
—
|
|
518,127
|
|
|||||
|
Advances
|
96,163
|
|
(96
|
)
|
96,067
|
|
|||||
|
Loans held for sale
|
42,324
|
|
358
|
|
42,682
|
|
|||||
|
Receivables
|
46,838
|
|
—
|
|
46,838
|
|
|||||
|
Premises and equipment
|
15,203
|
|
—
|
|
15,203
|
|
|||||
|
Real estate owned (REO)
|
3,289
|
|
—
|
|
3,289
|
|
|||||
|
Other assets
|
6,293
|
|
—
|
|
6,293
|
|
|||||
|
Assets related to discontinued operations
|
2,017
|
|
—
|
|
2,017
|
|
|||||
|
Financing liabilities (MSRs pledged, at fair value)
|
(481,020
|
)
|
—
|
|
(481,020
|
)
|
|||||
|
Other secured borrowings
|
(27,594
|
)
|
—
|
|
(27,594
|
)
|
|||||
|
Senior notes (Senior unsecured notes)
|
(120,624
|
)
|
—
|
|
(120,624
|
)
|
|||||
|
Accrued legal fees and settlements
|
(9,960
|
)
|
—
|
|
(9,960
|
)
|
|||||
|
Other accrued expenses
|
(36,889
|
)
|
—
|
|
(36,889
|
)
|
|||||
|
Loan repurchase and indemnification liability
|
(27,736
|
)
|
—
|
|
(27,736
|
)
|
|||||
|
Unfunded pension liability
|
(9,815
|
)
|
—
|
|
(9,815
|
)
|
|||||
|
Other liabilities
|
(34,131
|
)
|
(643
|
)
|
(34,774
|
)
|
|||||
|
Liabilities related to discontinued operations
|
(21,954
|
)
|
—
|
|
(21,954
|
)
|
|||||
|
Total identifiable net assets
|
422,432
|
|
(381
|
)
|
422,051
|
|
|||||
|
Total consideration paid to seller
|
(358,396
|
)
|
—
|
|
(358,396
|
)
|
|||||
|
Bargain purchase gain
|
$
|
64,036
|
|
$
|
(381
|
)
|
$
|
63,655
|
|
||
Post-Acquisition Results of Operations
The following table presents the results of operations of PHH that are included in our consolidated statements of operations from the acquisition date of October 4, 2018 through December 31, 2018:
|
Revenues
|
$
|
72,487
|
|
|
|
Expenses
|
84,877
|
|
||
|
Other income (expense)
|
(19,132
|
)
|
||
|
Income tax benefit
|
(6,711
|
)
|
||
|
Net loss from continuing operations
|
$
|
(24,811
|
)
|
|
Pro Forma Results of Operations (Unaudited)
The following table presents supplemental pro forma information for Ocwen as if the PHH Acquisition occurred on January 1, 2017. Pro forma adjustments include:
|
•
|
Increase (decrease) in MSR valuation adjustments, net of
$24.4 million
and
$(16.9) million
in 2018 and 2017, respectively, to conform the accounting for MSRs to the valuation policies of Ocwen related to acquired MSRs;
|
|
•
|
Adjust interest expense for a total net impact of
$30.6 million
and
$(73.8) million
in 2018 and 2017, respectively. The pro forma adjustments primarily pertain to fair value adjustments of
$31.4 million
and
$(79.3) million
in 2018 and 2017, respectively, related to the assumed MSR secured liability using valuation assumptions consistent with Ocwen's methodology;
|
|
•
|
Report the bargain purchase gain of
$63.7 million
as if the acquisition had occurred in 2017 rather than 2018;
|
|
•
|
Report Ocwen and PHH acquisition-related charges of
$18.5 million
for professional services as if they had been incurred in 2017 rather than 2018;
|
|
•
|
Adjust depreciation expense to amortize internally developed software acquired from PHH on a straight-line basis based on a useful life of
three
years;
|
|
•
|
Adjust revenue for a total net increase of
$120.6 million
and
$134.6 million
in 2018 and 2017, respectively, which primarily include adjusting servicing and subservicing fees for
$127.7 million
and
$97.0 million
in 2018 and 2017,
|
F-20
respectively, to gross up activity related to PHH MSRs sold accounted for as secured borrowings consistent with Ocwen’s presentation. The offset to these adjustments are interest income and interest expense, with no net effect on earnings.
|
•
|
Income tax benefit of
$0.3 million
and
$0.2 million
in 2018 and 2017, respectively, to record lower 2018 current federal tax under the new base erosion and anti-abuse tax (BEAT) provision of the Tax Act assuming Ocwen and PHH would file a consolidated federal tax return beginning January 1, 2017 and the benefit of the additional acquisition-related charges as if they had been incurred in 2017, based on management’s estimate of the blended applicable statutory tax rates and observing the continued need for a valuation allowance.
|
|
2018
|
2017
|
||||||
|
(Unaudited)
|
(Unaudited)
|
||||||
|
Revenues
|
$
|
1,305,972
|
|
$
|
1,785,408
|
|
|
|
Loss from continuing operations, net of tax attributable to Ocwen common stockholders
|
$
|
(201,382
|
)
|
$
|
(356,824
|
)
|
|
The pro forma consolidated results presented above are not indicative of what Ocwen’s consolidated results would have been had we completed the acquisition on the date indicated due to a number of factors, including but not limited to expected reductions in servicing, origination and overhead costs through the realization of targeted cost synergies and improved economies of scale, the impact of incremental costs to integrate the two companies and differences in servicing practices and cost structures between Ocwen and PHH. In addition, the pro forma consolidated results do not purport to project combined future operating results of Ocwen and PHH nor do they reflect the expected realization of any cost savings associated with the acquisition of PHH.
Discontinued Operations
In November 2016, PHH announced its plan to exit the private label solutions (PLS) business, and in February 2017, PHH announced its intention to operate as a smaller business that is focused solely on subservicing and portfolio retention services, and exit the Real Estate channel. As a result, PHH would exit the PLS business through the run-off of operations, and exit the Real Estate channel through the sale of certain assets of PHH Home Loans, LLC (PHH Home Loans) and its subsidiaries and subsequent run-off of the operations. Those exit activities were substantially complete prior to our acquisition of PHH, and as such, the results of PLS and Real Estate have been presented as discontinued operations in the consolidated statement of operations and consolidated statement of comprehensive income (loss), and are excluded from continuing operations and segment results for the post-acquisition period.
Results of Operations
The results of discontinued operations for the post-acquisition period (October 4, 2018, through December 31, 2018) are summarized below:
|
Net revenues
|
$
|
413
|
|
|
Total expenses (1)
|
(996
|
)
|
|
|
Income before income taxes
|
1,409
|
|
|
|
Income tax expense (benefit)
|
—
|
|
|
|
Income from discontinued operations
|
$
|
1,409
|
|
(1) Total expenses are shown net of a severance expense reversal that occurred as a result of voluntary post-acquisition employee departures and amortization of facility exit costs.
There was no gain or loss directly attributed to the completion of the disposal of these businesses.
F-21
Assets and Liabilities
The carrying amounts of major classes of assets and liabilities related to discontinued operations consisted of the following at December 31, 2018:
|
Assets
|
|||
|
Mortgage loans held for sale
|
$
|
650
|
|
|
Accounts receivable, net
|
144
|
|
|
|
Total assets related to discontinued operations
|
$
|
794
|
|
|
Liabilities
|
|||
|
Other liabilities (1)
|
18,265
|
|
|
|
Total liabilities related to discontinued operations
|
$
|
18,265
|
|
|
(1)
|
The primary component of Other liabilities is an exit cost liability which includes
$14.9 million
of facility exit costs related to vacating certain facilities.
|
Cash Flows
The cash flows related to discontinued operations have not been segregated and are included in the consolidated statement of cash flows for the post-acquisition period. There were no significant adjustments necessary to reconcile Net loss to net cash provided by operating activities that relate to discontinued operations.
Note 3 — Cost Re-Engineering Plan
In February 2019, we announced our intention to execute cost re-engineering opportunities in order to drive stronger financial performance and, in the longer term, simplify our operations. Our cost re-engineering plans extend beyond eliminating redundant costs through the integration process and address organizational, process and control redesign and automation, human capital planning, off-shore utilization, strategic sourcing and facilities rationalization. Costs for this plan include severance, retention and other incentive awards, facilities-related costs and other costs to execute the reorganization. While we continue to pursue additional cost re-engineering initiatives, this cost re-engineering plan announced in February 2019 was completed by December 31, 2019 and our remaining liability at December 31, 2019 is
$11.9 million
.
The following table provides a summary of the aggregate activity of the liability for the re-engineering plan costs, including the detail of the
$65.0 million
total cost incurred in the year ended December 31, 2019:
|
Employee-related
|
Facility-related
|
Other
|
Total
|
||||||||||||
|
Beginning balance
|
$
|
—
|
|
$
|
—
|
|
$
|
—
|
|
$
|
—
|
|
|||
|
Charges (1)
|
35,704
|
|
10,133
|
|
19,133
|
|
64,970
|
|
|||||||
|
Payments / Other
|
(29,449
|
)
|
(7,202
|
)
|
(16,414
|
)
|
(53,065
|
)
|
|||||||
|
Ending balance (2)
|
$
|
6,255
|
|
$
|
2,931
|
|
$
|
2,719
|
|
$
|
11,905
|
|
|||
|
(1)
|
The expenses were all incurred within the Corporate Items and Other segment. Employee-related costs and facility-related costs are reported in Compensation and benefits expense and Occupancy and equipment expense, respectively, in the consolidated statement of operations. Other costs are primarily reported in Professional services expense and Other expenses.
|
|
(2)
|
The liability for re-engineering plan costs at December 31, 2019 is included in Other liabilities (Other accrued expenses).
|
Note 4 — Securitizations and Variable Interest Entities
We securitize, sell and service forward and reverse residential mortgage loans and regularly transfer financial assets in connection with asset-backed financing arrangements. We have aggregated these securitizations and asset-backed financing arrangements using special purpose entities (SPEs) or VIEs into three groups: (1) securitizations of residential mortgage loans, (2) financings of advances and (3) MSR financings. Financing transactions that do not use SPEs or VIEs are disclosed in
Note 14 — Borrowings
.
We have determined that the SPEs created in connection with our match funded advance financing facilities are VIEs for which we are the primary beneficiary.
F-22
From time to time, we may acquire beneficial interests issued in connection with mortgage-backed securitizations where we may also be the master and/or primary servicer. These beneficial interests consist of subordinate and residual interests acquired from third-parties in market transactions. We consolidate the VIE when we conclude we are the primary beneficiary.
Securitizations of Residential Mortgage Loans
Transfers of Forward Loans
We sell or securitize forward loans that we originate or purchased from third parties, generally in the form of mortgage-backed securities guaranteed by the GSEs or Ginnie Mae. Securitization typically occurs within
30 days
of loan closing or purchase. We act only as a fiduciary and do not have a variable interest in the securitization trusts. As a result, we account for these transactions as sales upon transfer.
The following table presents a summary of cash flows received from and paid to securitization trusts related to transfers of loans accounted for as sales that were outstanding:
|
Years Ended December 31,
|
|||||||||||
|
2019
|
2018
|
2017
|
|||||||||
|
Proceeds received from securitizations
|
$
|
1,248,837
|
|
$
|
1,290,682
|
|
$
|
3,256,625
|
|
||
|
Servicing fees collected (1)
|
50,326
|
|
45,046
|
|
41,509
|
|
|||||
|
Purchases of previously transferred assets, net of claims reimbursed
|
(4,602
|
)
|
(4,395
|
)
|
(5,948
|
)
|
|||||
|
$
|
1,294,561
|
|
$
|
1,331,333
|
|
$
|
3,292,186
|
|
|||
|
(1)
|
We receive servicing fees based upon the securitized loan balances and certain ancillary fees, all of which are reported in Servicing and subservicing fees in the consolidated statements of operations.
|
In connection with these transfers, we retained MSRs of
$7.5 million
,
$8.3 million
and
$20.7 million
during
2019
,
2018
and
2017
, respectively. We securitize forward and reverse residential mortgage loans involving the GSEs and loans insured by the FHA or VA through Ginnie Mae.
Certain obligations arise from the agreements associated with our transfers of loans. Under these agreements, we may be obligated to repurchase the loans, or otherwise indemnify or reimburse the investor or insurer for losses incurred due to material breach of contractual representations and warranties.
The following table presents the carrying amounts of our assets that relate to our continuing involvement with forward loans that we have transferred with servicing rights retained as well as an estimate of our maximum exposure to loss including the UPB of the transferred loans:
|
December 31,
|
|||||||
|
2019
|
2018
|
||||||
|
Carrying value of assets
|
|||||||
|
MSRs, at fair value
|
$
|
109,581
|
|
$
|
132,774
|
|
|
|
Advances and match funded advances
|
141,829
|
|
138,679
|
|
|||
|
UPB of loans transferred
|
14,490,984
|
|
15,600,971
|
|
|||
|
Maximum exposure to loss
|
$
|
14,742,394
|
|
$
|
15,872,424
|
|
|
At
December 31, 2019
and
2018
,
7.7%
and
8.3%
, respectively, of the transferred residential loans that we service were
60 days
or more past due.
Transfers of Reverse Mortgages
We pool HECM loans into HMBS that we sell into the secondary market with servicing rights retained or we sell the loans to third parties with servicing rights released. We have determined that loan transfers in the HMBS program do not meet the definition of a participating interest because of the servicing requirements in the product that require the issuer/servicer to absorb some level of interest rate risk, cash flow timing risk and incidental credit risk. As a result, the transfers of the HECM loans do not qualify for sale accounting, and therefore, we account for these transfers as financings. Under this accounting treatment, the HECM loans are classified as Loans held for investment, at fair value, on our consolidated balance sheets. Holders of participating interests in the HMBS have no recourse against the assets of Ocwen, except with respect to standard representations and warranties and our contractual obligation to service the HECM loans and the HMBS.
F-23
Financings of Advances
Match funded advances result from our transfers of residential loan servicing advances to SPEs in exchange for cash. We consolidate these SPEs because we have determined that Ocwen is the primary beneficiary of the SPE. These SPEs issue debt supported by collections on the transferred advances, and we refer to this debt as Match funded liabilities.
We make transfers to these SPEs in accordance with the terms of our advance financing facility agreements. Debt service accounts require us to remit collections on pledged advances to the trustee within
two
days of receipt. Collected funds that are not applied to reduce the related match funded debt until the payment dates specified in the indenture are classified as debt service accounts within Restricted cash in our consolidated balance sheets. The balances also include amounts that have been set aside from the proceeds of our match funded advance facilities to provide for possible shortfalls in the funds available to pay certain expenses and interest, as well as amounts set aside as required by our warehouse facilities as security for our obligations under the related agreements. The funds are held in interest earning accounts and those amounts related to match funded advance facilities are held in the name of the SPE created in connection with the facility.
We classify the transferred advances on our consolidated balance sheets as a component of Match funded assets and the related liabilities as Match funded liabilities. The SPEs use collections of the pledged advances to repay principal and interest and to pay the expenses of the SPE. Holders of the debt issued by these entities have recourse only to the assets of the SPE for satisfaction of the debt. The assets and liabilities of the advance financing SPEs are comprised solely of Match funded advances, Restricted cash (debt service accounts), Match funded liabilities and amounts due to affiliates. Amounts due to affiliates are eliminated in consolidation in our consolidated balance sheets.
MSR Financings
On July 1, 2019, we entered into a
$300.0 million
financing facility with a third-party secured by certain Fannie Mae and Freddie Mac MSRs. Two trusts were established in connection with this facility. On July 1, 2019 we entered into an MSR Excess Spread Participation Agreement under which we created a 100% participation interest in the Portfolio Excess Servicing Fees, as defined, pursuant to which the holder of the participation interest is entitled to receive certain funds collected on the related portfolio of mortgage loans (other than ancillary income and advance reimbursement amounts) with respect to such Portfolio Excess Servicing Fees. Portfolio Excess Servicing Fees are defined within the Excess Spread Participation Agreement as: (a) the portfolio collections received during the collection period, net of the base servicing fee; and (b) all other amounts payable by a loan owner or master servicer with respect to the servicing rights for the portfolio mortgage loans, including any portfolio termination payments. This participation interest has been contributed to the trusts.
In connection with this facility, we entered into repurchase agreements with a third-party pursuant to which we sold trust certificates of the trusts representing certain indirect economic interests in the MSRs and agreed to repurchase such certificates at a future date at the repurchase price set forth in the repurchase agreements. Our obligations under the facility are secured by a lien on the related MSRs. In addition, Ocwen guarantees the obligations under the facility. This facility will terminate in June 2020 unless the parties mutually agree to renew or extend.
We determined that the trusts are VIEs for which we are the primary beneficiary. Therefore, we have included the trusts in our consolidated financial statements effective July 1, 2019. We have the power to direct the activities of the VIEs that most significantly impact the VIE’s economic performance given that we are the servicer of the MSRs that result in cash flows to the trusts. In addition, we have designed the trusts at inception to facilitate the third-party funding facility under which we have the obligation to absorb the losses of the VIEs that could be potentially significant to the VIEs.
At
December 31, 2019
,
$147.7 million
was outstanding under this facility which is included in Other secured borrowings, net on our consolidated balance sheet. See
Note 14 — Borrowings
for additional information. The carrying value of the pledged MSRs was
$245.5 million
at
December 31, 2019
. At
December 31, 2019
,
$0.9 million
of unamortized debt issuance costs related to this facility are included in Other assets,
$0.1 million
of accrued interest payable related to this facility are included in Other liabilities and
$0.1 million
of debt service account related to this facility are included in Restricted cash. The assets and liabilities of the trusts include amounts due to or from affiliates which are eliminated in consolidation in our consolidated balance sheets.
On November 26, 2019, we issued
$100.0 million
Ocwen Excess Spread-Collateralized Notes, Series 2019-PLS1 Class A (PLS Notes)
secured by certain of PMC’s private label MSRs (PLS MSRs). PMC PLS ESR Issuer LLC (PLS Issuer) was established in this connection as a wholly owned subsidiary of PMC. PMC entered into an MSR Excess Spread Participation Agreement with PLS Issuer. PMC created a participation interest in the Excess Servicing Fees, related float and REO fees pursuant to which the holder of the participation interest will be entitled to receive such Excess Servicing Fees, related float and REO fees. PMC holds the MSRs and services the loans which create the related excess cash flows pledged under the MSR Excess Spread Participation Agreement. “Excess Servicing Fees” shall mean: “with respect to each servicing agreement and any collection period, an amount equal to the total Servicing Fees payable under such servicing agreement for such collection period minus the product of 13.0 basis points multiplied by the unpaid principal balance of the related mortgage loans for such
F-24
servicing agreement as of the first day of such collection period.” PLS Issuer’s obligations under the facility are secured by a lien on the related PLS MSRs. PMC sold a participation certificate representing certain economic interests in the PLS MSRs and in order to secure its obligations under the participation certificate, it granted a security interest to PLS Issuer in the PLS MSRs. The PLS Issuer assigned the security interest in the PLS MSRs to the collateral agent for the noteholders. Ocwen guarantees the obligations of PLS Issuer under the facility.
We determined that PLS Issuer is a VIE for which we are the primary beneficiary. Therefore, we have included PLS Issuer in our consolidated financial statements effective November 26, 2019. We have the power to direct the activities of the VIE that most significantly impact the VIE’s economic performance given that we are the servicer of the MSRs that result in cash flows to PLS Issuer. In addition, PMC has designed PLS Issuer at inception to facilitate the funding for general corporate purposes. Separately, in return for the participation interests, PMC received the proceeds from issuance of the PLS Notes. PMC is the sole member of PLS Issuer, thus PMC has the obligation to absorb the losses of the VIE that could be potentially significant to the VIE.
At
December 31, 2019
,
$94.4 million
was outstanding under this facility which is included in Other secured borrowings on our consolidated balance sheet. See
Note 14 — Borrowings
for additional information. The carrying value of the pledged MSRs was
$146.2 million
at
December 31, 2019
. At
December 31, 2019
,
$1.2 million
of unamortized debt issuance costs related to the PLS Notes is reported as a reduction to the secured borrowing liability,
$0.1 million
of accrued interest payable related to this facility are included in Other liabilities and a
$3.0 million
debt service account related to this facility is included in Restricted cash. The assets and liabilities of PLS Issuer include amounts due to or from affiliates which are eliminated in consolidation in our consolidated balance sheets.
Mortgage-Backed Securitizations
The table below presents the carrying value and classification of the assets and liabilities of two consolidated mortgage-backed securitization trusts included in our consolidated balance sheet as a result of residual securities issued by the trust that we acquired during the third quarter of 2018.
|
December 31,
|
|||||||
|
2019
|
2018
|
||||||
|
Loans held for investment, at fair value - Restricted for securitization investors
|
$
|
23,342
|
|
$
|
26,520
|
|
|
|
Financing liability - Owed to securitization investors, at fair value
|
22,002
|
|
24,815
|
|
|||
We have concluded we are the primary beneficiary of certain residential mortgage-backed securitizations as a result of beneficial interests consisting of residual securities, which expose us to the expected losses and residual returns of the trust, and our role as master servicer, where we have the ability to direct the activities that most significantly impact the performance of the trust.
Upon consolidation of the securitization trusts, we elected to apply the measurement alternative to ASC Topic 820,
Fair Value Measurement
for collateralized financing entities. The measurement alternative requires a reporting entity to use the more observable of the fair value of the financial assets or the financial liabilities to measure both the financial assets and the financial liabilities of the entity. We determined that the fair value of the loans held by the trusts is more observable than the fair value of the debt certificates issued by the trusts. Through the application of the measurement alternative, the fair value of the financial liabilities of the trusts are measured as the difference between the fair value of the financial assets and the fair value of our investment in the residual securities of the trusts.
Holders of the debt issued by the two securitization trust entities have recourse only to the assets of the SPE for satisfaction of the debt and have no recourse against the assets of Ocwen. Similarly, the general creditors of Ocwen have no claim on the assets of the trusts. Our exposure to loss as a result of our continuing involvement is limited to the carrying values of our investments in the residual securities of the trusts, our MSRs and related advances.
F-25
Note 5 — Fair Value
Fair value is estimated based on a hierarchy that maximizes the use of observable inputs and minimizes the use of unobservable inputs. Observable inputs are inputs that reflect the assumptions that market participants would use in pricing the asset or liability developed based on market data obtained from sources independent of the reporting entity. Unobservable inputs are inputs that reflect the reporting entity’s own assumptions about the assumptions market participants would use in pricing the asset or liability developed based on the best information available in the circumstances. The fair value hierarchy prioritizes the inputs to valuation techniques into three broad levels whereby the highest priority is given to Level 1 inputs and the lowest to Level 3 inputs.
|
Level 1:
|
Quoted prices (unadjusted) in active markets for identical assets or liabilities that the reporting entity can access at the measurement date.
|
|
Level 2:
|
Inputs other than quoted prices included in Level 1 that are observable for the asset or liability, either directly or indirectly.
|
|
Level 3:
|
Unobservable inputs for the asset or liability.
|
We classify assets in their entirety based on the lowest level of input that is significant to the fair value measurement.
We have elected to fair value future draw commitments for HECM loans purchased or originated after December 31, 2018. The estimated fair value is included in Loans held for investment on our consolidated balance sheets with changes in fair value recognized in Reverse mortgage revenue, net in our consolidated statements of operations. The value of future draw commitments for HECM loans purchased or originated before January 1, 2019 is recognized as the draws are securitized or sold.
The carrying amounts and the estimated fair values of our financial instruments and certain of our nonfinancial assets measured at fair value on a recurring or non-recurring basis or disclosed, but not measured, at fair value are as follows:
|
December 31,
|
|||||||||||||||||
|
|
|
2019
|
2018
|
||||||||||||||
|
|
Level
|
Carrying Value
|
Fair Value
|
Carrying Value
|
Fair Value
|
||||||||||||
|
Financial assets:
|
|
|
|
|
|
|
|
|
|
||||||||
|
Loans held for sale
|
|||||||||||||||||
|
Loans held for sale, at fair value (a)
|
2
|
$
|
208,752
|
|
$
|
208,752
|
|
$
|
176,525
|
|
$
|
176,525
|
|
||||
|
Loans held for sale, at lower of cost or fair value (b)
|
3
|
66,517
|
|
66,517
|
|
66,097
|
|
66,097
|
|
||||||||
|
Total Loans held for sale
|
$
|
275,269
|
|
$
|
275,269
|
|
$
|
242,622
|
|
$
|
242,622
|
|
|||||
|
Loans held for investment
|
|||||||||||||||||
|
Loans held for investment - Reverse mortgages (a)
|
3
|
$
|
6,269,596
|
|
$
|
6,269,596
|
|
$
|
5,472,199
|
|
$
|
5,472,199
|
|
||||
|
Loans held for investment - Restricted for securitization investors (a)
|
3
|
23,342
|
|
23,342
|
|
26,520
|
|
26,520
|
|
||||||||
|
Total loans held for investment
|
6,292,938
|
|
6,292,938
|
|
5,498,719
|
|
5,498,719
|
|
|||||||||
|
Advances (including match funded), net (c)
|
3
|
1,056,523
|
|
1,056,523
|
|
1,186,676
|
|
1,186,676
|
|
||||||||
|
Receivables, net (c)
|
3
|
201,220
|
|
201,220
|
|
198,262
|
|
198,262
|
|
||||||||
|
Mortgage-backed securities (a)
|
3
|
2,075
|
|
2,075
|
|
1,502
|
|
1,502
|
|
||||||||
|
U.S. Treasury notes (a)
|
1
|
—
|
|
—
|
|
1,064
|
|
1,064
|
|
||||||||
|
Corporate bonds (a)
|
2
|
441
|
|
441
|
|
450
|
|
450
|
|
||||||||
F-26
|
December 31,
|
|||||||||||||||||
|
|
|
2019
|
2018
|
||||||||||||||
|
|
Level
|
Carrying Value
|
Fair Value
|
Carrying Value
|
Fair Value
|
||||||||||||
|
Financial liabilities:
|
|
|
|
|
|
|
|
|
|
||||||||
|
Match funded liabilities (c)
|
3
|
$
|
679,109
|
|
$
|
679,507
|
|
$
|
778,284
|
|
$
|
776,485
|
|
||||
|
Financing liabilities:
|
|||||||||||||||||
|
HMBS-related borrowings (a)
|
3
|
$
|
6,063,435
|
|
$
|
6,063,435
|
|
$
|
5,380,448
|
|
$
|
5,380,448
|
|
||||
|
Financing liability - MSRs pledged (Rights to MSRs) (a)
|
3
|
950,593
|
|
950,593
|
|
1,032,856
|
|
1,032,856
|
|
||||||||
|
Financing liability - Owed to securitization investors (a)
|
3
|
22,002
|
|
22,002
|
|
24,815
|
|
24,815
|
|
||||||||
|
Other (c)
|
3
|
—
|
|
—
|
|
4,419
|
|
4,419
|
|
||||||||
|
Total Financing liabilities
|
$
|
7,036,030
|
|
$
|
7,036,030
|
|
$
|
6,442,538
|
|
$
|
6,442,538
|
|
|||||
|
Other secured borrowings:
|
|||||||||||||||||
|
Senior secured term loan (c) (d)
|
2
|
$
|
322,758
|
|
$
|
324,643
|
|
$
|
226,825
|
|
$
|
227,449
|
|
||||
|
Other (c)
|
3
|
703,033
|
|
686,146
|
|
221,236
|
|
204,864
|
|
||||||||
|
Total Other secured borrowings
|
$
|
1,025,791
|
|
$
|
1,010,789
|
|
$
|
448,061
|
|
$
|
432,313
|
|
|||||
|
Senior notes:
|
|||||||||||||||||
|
Senior unsecured notes (c) (d)
|
2
|
$
|
21,046
|
|
$
|
13,821
|
|
$
|
119,924
|
|
$
|
119,258
|
|
||||
|
Senior secured notes (c) (d)
|
2
|
290,039
|
|
256,201
|
|
328,803
|
|
306,889
|
|
||||||||
|
Total Senior notes
|
$
|
311,085
|
|
$
|
270,022
|
|
$
|
448,727
|
|
$
|
426,147
|
|
|||||
|
Derivative financial instrument assets (liabilities)
|
|
|
|
|
|
|
|
|
|
||||||||
|
Interest rate lock commitments (a)
|
2
|
$
|
4,878
|
|
$
|
4,878
|
|
$
|
3,871
|
|
$
|
3,871
|
|
||||
|
Forward trades - Loans held for sale (a)
|
1
|
(92
|
)
|
(92
|
)
|
(4,983
|
)
|
(4,983
|
)
|
||||||||
|
TBA / Forward mortgage-backed securities (MBS) trades - MSR hedging (a)
|
1
|
1,121
|
|
1,121
|
|
—
|
|
—
|
|
||||||||
|
Interest rate caps (a)
|
3
|
—
|
|
—
|
|
678
|
|
678
|
|
||||||||
|
MSRs (a)
|
3
|
$
|
1,486,395
|
|
$
|
1,486,395
|
|
$
|
1,457,149
|
|
$
|
1,457,149
|
|
||||
|
(a)
|
Measured at fair value on a recurring basis.
|
|
(b)
|
Measured at fair value on a non-recurring basis.
|
|
(c)
|
Disclosed, but not measured, at fair value.
|
|
(d)
|
The carrying values are net of unamortized debt issuance costs and discount. See
Note 14 — Borrowings
for additional information
.
|
F-27
The following tables present a reconciliation of the changes in fair value of Level 3 assets and liabilities that we measure at fair value on a recurring basis:
|
|
Loans Held for Investment - Reverse Mortgages
|
HMBS-Related Borrowings
|
Loans Held for Inv. - Restricted for Securitiza-
tion Investors |
Financing Liability - Owed to Securitiza -
tion Investors |
Mortgage-Backed Securities
|
Financing Liability - MSRs Pledged
|
Derivatives
|
MSRs
|
|||||||||||||||||||||||
|
Year Ended December 31, 2019
|
|||||||||||||||||||||||||||||||
|
Beginning balance
|
$
|
5,472,199
|
|
$
|
(5,380,448
|
)
|
$
|
26,520
|
|
$
|
(24,815
|
)
|
$
|
1,502
|
|
$
|
(1,032,856
|
)
|
$
|
678
|
|
$
|
1,457,149
|
|
|||||||
|
Purchases, issuances, sales and settlements
|
|
|
|
|
|||||||||||||||||||||||||||
|
Purchases
|
—
|
|
—
|
|
—
|
|
—
|
|
—
|
|
(1,276
|
)
|
—
|
|
162,300
|
|
|||||||||||||||
|
Issuances
|
1,026,154
|
|
(962,113
|
)
|
—
|
|
—
|
|
—
|
|
—
|
|
—
|
|
—
|
|
|||||||||||||||
|
Sales
|
—
|
|
—
|
|
—
|
|
—
|
|
—
|
|
(44
|
)
|
—
|
|
(4,344
|
)
|
|||||||||||||||
|
Settlements
|
(558,720
|
)
|
549,600
|
|
(3,178
|
)
|
2,813
|
|
—
|
|
214,364
|
|
—
|
|
(7,309
|
)
|
|||||||||||||||
|
Transfers (to) from:
|
|||||||||||||||||||||||||||||||
|
Loans held for sale, at fair value
|
(1,892
|
)
|
—
|
|
—
|
|
—
|
|
—
|
|
—
|
|
—
|
|
—
|
|
|||||||||||||||
|
Receivables, net
|
(327
|
)
|
—
|
|
—
|
|
—
|
|
—
|
|
—
|
|
—
|
|
—
|
|
|||||||||||||||
|
Other assets
|
(513
|
)
|
—
|
|
—
|
|
—
|
|
—
|
|
—
|
|
—
|
|
—
|
|
|||||||||||||||
|
|
464,702
|
|
(412,513
|
)
|
(3,178
|
)
|
2,813
|
|
—
|
|
213,044
|
|
—
|
|
150,647
|
|
|||||||||||||||
|
Total realized and unrealized gains (losses)
|
|
|
|
|
|||||||||||||||||||||||||||
|
Included in earnings:
|
|||||||||||||||||||||||||||||||
|
Change in fair value (1)
|
332,430
|
|
(270,473
|
)
|
—
|
|
—
|
|
573
|
|
(152,986
|
)
|
(678
|
)
|
(121,401
|
)
|
|||||||||||||||
|
Calls and other
|
—
|
|
—
|
|
—
|
|
—
|
|
—
|
|
22,205
|
|
—
|
|
—
|
|
|||||||||||||||
|
|
332,430
|
|
(270,473
|
)
|
—
|
|
—
|
|
573
|
|
(130,781
|
)
|
(678
|
)
|
(121,401
|
)
|
|||||||||||||||
|
Transfers in and / or out of Level 3
|
—
|
|
—
|
|
—
|
|
—
|
|
—
|
|
—
|
|
—
|
|
—
|
|
|||||||||||||||
|
Ending balance
|
$
|
6,269,331
|
|
$
|
(6,063,434
|
)
|
$
|
23,342
|
|
$
|
(22,002
|
)
|
$
|
2,075
|
|
$
|
(950,593
|
)
|
$
|
—
|
|
$
|
1,486,395
|
|
|||||||
F-28
|
|
Loans Held for Investment - Reverse Mortgages
|
HMBS-Related Borrowings
|
Loans Held for Inv. - Restricted for Securitiza-
tion Investors |
Financing Liability - Owed to Securitiza -
tion Investors |
Mortgage-Backed Securities
|
Financing Liability - MSRs Pledged
|
Derivatives
|
MSRs
|
|||||||||||||||||||||||
|
Year Ended December 31, 2018
|
|||||||||||||||||||||||||||||||
|
Beginning balance
|
$
|
4,715,831
|
|
$
|
(4,601,556
|
)
|
$
|
—
|
|
$
|
—
|
|
$
|
1,592
|
|
$
|
(508,291
|
)
|
$
|
2,056
|
|
$
|
671,962
|
|
|||||||
|
Purchases, issuances, sales and settlements
|
|
|
|
|
|||||||||||||||||||||||||||
|
Purchases
|
—
|
|
—
|
|
—
|
|
—
|
|
—
|
|
(667
|
)
|
95
|
|
13,712
|
|
|||||||||||||||
|
Recognized (assumed) in connection with the acquisition of PHH
|
—
|
|
—
|
|
—
|
|
—
|
|
—
|
|
(481,020
|
)
|
—
|
|
518,127
|
|
|||||||||||||||
|
Issuances (2)
|
920,476
|
|
(948,917
|
)
|
—
|
|
—
|
|
—
|
|
(279,586
|
)
|
—
|
|
—
|
|
|||||||||||||||
|
Consolidation of mortgage-backed securitization trusts
|
—
|
|
—
|
|
28,373
|
|
(26,643
|
)
|
—
|
|
—
|
|
—
|
|
—
|
|
|||||||||||||||
|
Sales
|
—
|
|
—
|
|
—
|
|
—
|
|
—
|
|
—
|
|
—
|
|
(6,240
|
)
|
|||||||||||||||
|
Settlements
|
(400,521
|
)
|
391,985
|
|
(1,853
|
)
|
1,828
|
|
—
|
|
211,766
|
|
(371
|
)
|
(5,880
|
)
|
|||||||||||||||
|
Transfers (to) from:
|
|||||||||||||||||||||||||||||||
|
MSRs carried at amortized cost, net of valuation allowance
|
—
|
|
—
|
|
—
|
|
—
|
|
—
|
|
—
|
|
—
|
|
418,925
|
|
|||||||||||||||
|
Loans held for sale, at fair value
|
(1,039
|
)
|
—
|
|
—
|
|
—
|
|
—
|
|
—
|
|
—
|
|
—
|
|
|||||||||||||||
|
Receivables, net
|
(158
|
)
|
—
|
|
—
|
|
—
|
|
—
|
|
—
|
|
—
|
|
—
|
|
|||||||||||||||
|
Other assets
|
(411
|
)
|
—
|
|
—
|
|
—
|
|
—
|
|
—
|
|
—
|
|
—
|
|
|||||||||||||||
|
|
518,347
|
|
(556,932
|
)
|
26,520
|
|
(24,815
|
)
|
—
|
|
(549,507
|
)
|
(276
|
)
|
938,644
|
|
|||||||||||||||
|
Total realized and unrealized gains (losses)
|
|
|
|
|
|||||||||||||||||||||||||||
|
Included in earnings:
|
|||||||||||||||||||||||||||||||
|
Change in fair value (2)
|
238,021
|
|
(221,960
|
)
|
—
|
|
—
|
|
(90
|
)
|
19,269
|
|
(1,102
|
)
|
(153,457
|
)
|
|||||||||||||||
|
Calls and other
|
—
|
|
—
|
|
—
|
|
—
|
|
—
|
|
5,673
|
|
—
|
|
—
|
|
|||||||||||||||
|
|
238,021
|
|
(221,960
|
)
|
—
|
|
—
|
|
(90
|
)
|
24,942
|
|
(1,102
|
)
|
(153,457
|
)
|
|||||||||||||||
|
Transfers in and / or out of Level 3
|
—
|
|
—
|
|
—
|
|
—
|
|
—
|
|
—
|
|
—
|
|
—
|
|
|||||||||||||||
|
Ending balance
|
$
|
5,472,199
|
|
$
|
(5,380,448
|
)
|
$
|
26,520
|
|
$
|
(24,815
|
)
|
$
|
1,502
|
|
$
|
(1,032,856
|
)
|
$
|
678
|
|
$
|
1,457,149
|
|
|||||||
F-29
|
|
Loans Held for Investment - Reverse Mortgages
|
HMBS-Related Borrowings
|
Mortgage-Backed Securities
|
Financing Liability - MSRs Pledged
|
Derivatives
|
MSRs
|
|||||||||||||||||
|
Year Ended December 31, 2017
|
|||||||||||||||||||||||
|
Beginning balance
|
$
|
3,565,716
|
|
$
|
(3,433,781
|
)
|
$
|
8,342
|
|
$
|
(477,707
|
)
|
$
|
1,836
|
|
$
|
679,256
|
|
|||||
|
Purchases, issuances, sales and settlements
|
|
|
|||||||||||||||||||||
|
Purchases
|
—
|
|
—
|
|
—
|
|
—
|
|
655
|
|
—
|
|
|||||||||||
|
Issuances (3)
|
1,277,615
|
|
(1,281,543
|
)
|
—
|
|
(54,601
|
)
|
—
|
|
(2,214
|
)
|
|||||||||||
|
Sales
|
—
|
|
—
|
|
—
|
|
—
|
|
—
|
|
(540
|
)
|
|||||||||||
|
Settlements
|
(444,388
|
)
|
418,503
|
|
—
|
|
59,190
|
|
(445
|
)
|
—
|
|
|||||||||||
|
Transfers (to) from:
|
|||||||||||||||||||||||
|
Loans held for sale, at fair value
|
(3,803
|
)
|
—
|
|
—
|
|
—
|
|
—
|
|
—
|
|
|||||||||||
|
Receivables, net
|
(3,583
|
)
|
—
|
|
—
|
|
—
|
|
—
|
|
—
|
|
|||||||||||
|
Other assets
|
(1,929
|
)
|
—
|
|
—
|
|
—
|
|
—
|
|
—
|
|
|||||||||||
|
|
823,912
|
|
(863,040
|
)
|
—
|
|
4,589
|
|
210
|
|
(2,754
|
)
|
|||||||||||
|
Total realized and unrealized gains (losses) (4)
|
|
|
|||||||||||||||||||||
|
Included in earnings
|
|||||||||||||||||||||||
|
Change in fair value (3)
|
326,203
|
|
(304,735
|
)
|
(6,750
|
)
|
(41,282
|
)
|
10
|
|
(4,540
|
)
|
|||||||||||
|
Calls and other
|
—
|
|
—
|
|
—
|
|
6,109
|
|
—
|
|
—
|
|
|||||||||||
|
|
326,203
|
|
(304,735
|
)
|
(6,750
|
)
|
(35,173
|
)
|
10
|
|
(4,540
|
)
|
|||||||||||
|
Transfers in and / or out of Level 3
|
—
|
|
—
|
|
—
|
|
—
|
|
—
|
|
—
|
|
|||||||||||
|
Ending balance
|
$
|
4,715,831
|
|
$
|
(4,601,556
|
)
|
$
|
1,592
|
|
$
|
(508,291
|
)
|
$
|
2,056
|
|
$
|
671,962
|
|
|||||
|
(1)
|
The change in fair value adjustments on Loans held for investment for 2019 include
$12.2 million
in connection with the fair value election for future draw commitments on HECM reverse mortgage loans purchased or originated after December 31, 2018.
|
|
(2)
|
On January 18, 2018, Ocwen received a lump-sum payment of
$279.6 million
in accordance with terms of the agreements with NRZ. See
Note 10 — Rights to MSRs
.
|
|
(3)
|
On September 1, 2017, Ocwen transferred MSRs with UPB of
$15.9 billion
to NRZ and received a lump-sum payment of
$54.6 million
. See
Note 10 — Rights to MSRs
.
|
|
(4)
|
Total gains (losses) attributable to derivative financial instruments still held at
December 31, 2019
and
2018
and
2017
were
$(0.7)
million,
$(1.1) million
and
$0.1 million
for
2019
,
2018
and
2017
, respectively. Total losses for
2019
,
2018
and
2017
attributable to MSRs still held at
December 31, 2019
,
2018
and
2017
were
$98.1 million
,
$153.5 million
and
$4.5 million
, respectively.
|
The methodologies that we use and key assumptions that we make to estimate the fair value of financial instruments and other assets and liabilities measured at fair value on a recurring or non-recurring basis and those disclosed, but not carried, at fair value are described below.
Loans Held for Sale
Residential forward and reverse mortgage loans that we intend to sell are carried at fair value as a result of a fair value election. Such loans are subject to changes in fair value due to fluctuations in interest rates from the closing date through the date of the sale of the loan into the secondary market. These loans are classified within Level 2 of the valuation hierarchy because the primary component of the price is obtained from observable values of mortgage forwards for loans of similar terms and characteristics. We have the ability to access this market, and it is the market into which conventional and government-insured mortgage loans are typically sold.
We purchase certain loans from Ginnie Mae guaranteed securitizations in connection with loan modifications, strategic early buyouts (EBO) and loan resolution activity as part of our contractual obligations as the servicer of the loans. Modified and EBO loans are classified as loans held for sale at the lower of cost or fair value as we expect to redeliver (sell) the loans into new Ginnie Mae guaranteed securitizations (in the case of modified loans) or sell the loans to a private investor (in the case of EBO loans). The fair value of these loans is estimated using published forward Ginnie Mae prices or existing sale contracts. Loans repurchased in connection with loan resolution activities are classified as receivables. Because these loans are insured or guaranteed by the FHA or VA, the fair value of these loans represents the net recovery value taking into consideration the insured or guaranteed claim.
F-30
We report all other loans held for sale at the lower of cost or fair value. When we enter into an agreement to sell a loan or pool of loans to an investor at a set price, we value the loan or loans at the commitment price, unless facts and circumstances exist that could impact deal economics, at which point we use judgment to determine appropriate adjustments to recorded fair value, if any. We determine the fair value of loans for which we have no agreement to sell on the expected future cash flows discounted at a rate commensurate with the risk of the estimated cash flows.
Loans Held for Investment
Loans Held for Investment - Reverse Mortgages
We measure these loans at fair value based on the expected future cash flows discounted over the expected life of the loans at a rate commensurate with the risk of the estimated cash flows, including future draw commitments for HECM loans purchased or originated after December 31, 2018. Significant assumptions include expected future draws and prepayment and delinquency rates and cumulative loss curves. The discount rate assumption for these assets is primarily based on an assessment of current market yields on newly originated reverse mortgage loans, expected duration of the asset and current market interest rates.
|
December 31,
|
|||||
|
Significant valuation assumptions
|
2019
|
2018
|
|||
|
Life in years
|
|||||
|
Range
|
2.4 to 7.8
|
|
3.0 to 7.6
|
|
|
|
Weighted average
|
6.0
|
|
5.9
|
|
|
|
Conditional repayment rate
|
|||||
|
Range
|
7.8% to 28.3%
|
|
6.8% to 38.4%
|
|
|
|
Weighted average
|
14.6
|
%
|
14.7
|
%
|
|
|
Discount rate
|
2.8
|
%
|
3.4
|
%
|
|
Significant increases or decreases in any of these assumptions in isolation could result in a significantly lower or higher fair value, respectively. The effects of changes in the assumptions used to value the loans held for investment, excluding future draw commitments, are largely offset by the effects of changes in the assumptions used to value the HMBS-related borrowings that are associated with these loans.
Loans Held for Investment – Restricted for securitization investors
We have elected to measure loans held by consolidated mortgage-backed securitization trusts at fair value. The loans are secured by first liens on single family residential properties. Fair value is based on proprietary cash flow modeling processes from a third-party broker/dealer and a third-party valuation expert. Significant assumptions used in the valuation include projected monthly payments, projected prepayments and defaults, property liquidation values and discount rates.
MSRs
We determine the fair value of MSRs primarily using discounted cash flow methodologies. The significant components of the estimated future cash inflows for MSRs include servicing fees, late fees, float earnings and other ancillary fees. Significant cash outflows include the cost of servicing, the cost of financing servicing advances and compensating interest payments.
We engage third-party valuation experts who generally utilize: (a) transactions involving instruments with similar collateral and risk profiles, adjusted as necessary based on specific characteristics of the asset or liability being valued; and/or (b) industry-standard modeling, such as a discounted cash flow model and a prepayment model, in arriving at their estimate of fair value. The prices provided by the valuation experts reflect their observations and assumptions related to market activity, incorporating available industry survey results and client feedback, and including risk premiums and liquidity adjustments. While the models and related assumptions used by the valuation experts are proprietary to them, we understand the methodologies and assumptions used to develop the prices based on our ongoing due diligence, which includes regular discussions with the valuation experts. We believe that the procedures executed by the valuation experts, supported by our verification and analytical procedures, provide reasonable assurance that the prices used in our consolidated financial statements comply with the accounting guidance for fair value measurements and disclosures and reflect the assumptions that a market participant would use.
F-31
We evaluate the reasonableness of our third-party experts’ assumptions using historical experience adjusted for prevailing market conditions. Assumptions used in the valuation of MSRs include:
|
•
|
Mortgage prepayment speeds
|
•
|
Delinquency rates
|
|
•
|
Cost of servicing
|
•
|
Interest rate used for computing float earnings
|
|
•
|
Discount rate
|
•
|
Compensating interest expense
|
|
•
|
Interest rate used for computing the cost of financing servicing advances
|
•
|
Collection rate of other ancillary fees
|
|
•
|
Curtailment on advances
|
||
MSRs are carried at fair value and classified within Level 3 of the valuation hierarchy. The fair value is determined using the mid-point of the range of prices provided by third-party valuation experts, without adjustment, except in the event we have a potential or completed sale, including transactions where we have executed letters of intent, in which case the fair value of the MSRs is recorded at the estimated sale price. Fair value reflects actual Ocwen sale prices for orderly transactions where available in lieu of independent third-party valuations. Our valuation process includes discussions of bid pricing with the third-party valuation experts and are contemplated along with other market-based transactions in their model validation.
A change in valuation inputs or assumptions may result in a significantly higher or lower fair value measurement. Changes in market interest rates predominantly impact the fair value for Agency MSRs via prepayment speeds by altering the borrower refinance incentive and the non-Agency MSRs due to the impact on advance costs. Other key assumptions used in the valuation of these MSRs include delinquency rates and discount rates.
|
December 31,
|
|||||||||||||||
|
Significant valuation assumptions
|
2019
|
2018
|
|||||||||||||
|
Agency
|
Non-Agency
|
Agency
|
Non-Agency
|
||||||||||||
|
Weighted average prepayment speed
|
11.7
|
%
|
12.2
|
%
|
8.5
|
%
|
15.4
|
%
|
|||||||
|
Weighted average delinquency rate
|
3.2
|
%
|
27.3
|
%
|
6.6
|
%
|
27.1
|
%
|
|||||||
|
Advance financing cost
|
5-year swap
|
|
5-yr swap plus 2.00%
|
|
5-year swap
|
|
5-yr swap plus 2.75%
|
|
|||||||
|
Interest rate for computing float earnings
|
5-year swap
|
|
5-yr swap minus 0.50%
|
|
5-year swap
|
|
5-yr swap minus 0.50%
|
|
|||||||
|
Weighted average discount rate
|
9.3
|
%
|
11.3
|
%
|
9.1
|
%
|
12.8
|
%
|
|||||||
|
Weighted average cost to service (in dollars)
|
$
|
85
|
|
$
|
277
|
|
$
|
90
|
|
$
|
297
|
|
|||
Because the mortgages underlying these MSRs permit the borrowers to prepay the loans, the value of the MSRs generally tends to diminish in periods of declining interest rates, an improving housing market or expanded product availability (as prepayments increase) and increase in periods of rising interest rates, a deteriorating housing market or reduced product availability (as prepayments decrease). The following table summarizes the estimated change in the value of the MSRs that we carry at fair value as of
December 31, 2019
given hypothetical shifts in lifetime prepayments and yield assumptions:
|
Adverse change in fair value
|
10%
|
20%
|
|||||
|
Weighted average prepayment speeds
|
$
|
(116,951
|
)
|
$
|
(224,689
|
)
|
|
|
Weighted average discount rate
|
(49,463
|
)
|
(95,885
|
)
|
|||
The sensitivity analysis measures the potential impact on fair values based on hypothetical changes, which in the case of our portfolio at
December 31, 2019
are increased prepayment speeds and an increase in the yield assumption.
Advances
We value advances and match funded advances at their net realizable value, which generally approximates fair value. Servicing advances have no stated maturity and do not bear interest. Principal and interest advances are generally realized within a relatively short period of time. The timing of recovery of taxes, insurance and other corporate advances depends on the underlying loan attributes, performance, and in many cases, foreclosure or liquidation timeline. The fair value adjustment to servicing advances associated with the estimated time to recover such advances is separately measured and reported as a component of the fair value of the associated MSR, consistent with actual market transactions. Refer to MSRs above for a description of the valuation methodology and assumptions related to the cost of financing servicing advances and discount rate, among other factors. The fair value of advances and match funded advances does not include the fair value of any servicer advance commitments that is included and measured as a component of the fair value of the associated MSR.
F-32
Receivables
The carrying value of receivables generally approximates fair value because of the relatively short period of time between their origination and realization.
Mortgage-Backed Securities (MBS)
Our subordinate and residual securities are not actively traded, and therefore, we estimate the fair value of these securities using a process based upon the use of an independent third-party valuation expert. Where possible, we consider observable trading activity in the valuation of our securities. Key inputs include expected prepayment rates, delinquency and cumulative loss curves and discount rates commensurate with the risks. Where possible, we use observable inputs in the valuation of our securities. However, the subordinate and residual securities in which we have invested trade infrequently and therefore have few or no observable inputs and little price transparency. Additionally, during periods of market dislocation, the observability of inputs is further reduced. We classify subordinate and residual securities as trading securities and account for them at fair value on a recurring basis. Changes in the fair value of our investment in subordinate and residual securities are recognized in Other, net in the consolidated statements of operations.
U.S. Treasury Notes
We classify U.S. Treasury notes as trading securities and account for them at fair value on a recurring basis. We base the fair value on quoted prices in active markets to which we have access. Changes in the fair value of our investment in U.S. Treasury notes are recognized in Other, net in the consolidated statements of operations.
Match Funded Liabilities
For match funded liabilities that bear interest at a rate that is adjusted regularly based on a market index, the carrying value approximates fair value. For match funded liabilities that bear interest at a fixed rate, we determine fair value by discounting the future principal and interest repayments at a market rate commensurate with the risk of the estimated cash flows. We assume the notes are refinanced at the end of their revolving periods, consistent with how we manage our advance facilities.
Financing Liabilities
HMBS-Related Borrowings
We have elected to measure these borrowings at fair value. These borrowings are not actively traded, and therefore, quoted market prices are not available. We determine fair value by discounting the projected recovery of principal, interest and advances over the estimated life of the borrowing at a market rate commensurate with the risk of the estimated cash flows. Significant assumptions include prepayments, discount rate and borrower mortality rates. The discount rate assumption for these liabilities is based on an assessment of current market yields for newly issued HMBS, expected duration and current market interest rates.
|
December 31,
|
|||||
|
Significant valuation assumptions
|
2019
|
2018
|
|||
|
Life in years
|
|||||
|
Range
|
2.4 to 7.8
|
|
3.0 to 7.6
|
|
|
|
Weighted average
|
6.0
|
|
5.9
|
|
|
|
Conditional repayment rate
|
|||||
|
Range
|
7.8% to 28.3%
|
|
6.8% to 38.4%
|
|
|
|
Weighted average
|
14.6
|
%
|
14.7
|
%
|
|
|
Discount rate
|
2.7
|
%
|
3.3
|
%
|
|
Significant increases or decreases in any of these assumptions in isolation would result in a significantly higher or lower fair value.
MSRs Pledged (Rights to MSRs)
We have elected to measure and record these borrowings at fair value. We recognize the proceeds received in connection with Rights to MSRs transactions as a secured borrowing that we account for at fair value. We determine the fair value of the pledged MSR liability following a similar approach as for the associated pledged MSRs. Fair value for the portion of the borrowing attributable to the MSRs underlying the Rights to MSRs is determined using the mid-point of the range of prices provided by third-party valuation experts. Fair value for the portion of the borrowing attributable to any lump sum payments received in connection with the transfer of MSRs underlying such Rights to MSRs to the extent such transfer is accounted for
F-33
as a financing is determined by discounting the relevant future cash flows that were altered through such transfer using assumptions consistent with the mid-point of the range of prices provided by third-party valuation experts for the related MSR.
|
December 31,
|
|||||||
|
Significant valuation assumptions
|
2019
|
2018
|
|||||
|
Weighted average prepayment speed
|
11.9
|
%
|
13.9
|
%
|
|||
|
Weighted average delinquency rate
|
20.3
|
%
|
20.3
|
%
|
|||
|
Advance financing cost
|
5-year swap plus 0% to 2.00%
|
|
5-year swap plus 0% to 2.75%
|
|
|||
|
Interest rate for computing float earnings
|
5-year swap minus 0% to 0.50%
|
|
5-year swap minus 0% to 0.50%
|
|
|||
|
Weighted average discount rate
|
10.7
|
%
|
12.0
|
%
|
|||
|
Weighted average cost to service (in dollars)
|
$
|
223
|
|
$
|
234
|
|
|
Significant increases or decreases in these assumptions in isolation would result in a significantly higher or lower fair value.
Financing Liability – Owed to Securitization Investors
Consists of securitization debt certificates due to third parties that represent beneficial ownership interests in mortgage-backed securitization trusts that we include in our consolidated financial statements. We determine fair value using the measurement alternative to ASC Topic 820,
Fair Value Measurement
as disclosed in
Note 4 — Securitizations and Variable Interest Entities
. In accordance with the measurement alternative, the fair value of the consolidated securitization debt certificates is measured as the fair value of the loans held by the trust less the fair value of the beneficial interests held by us in the form of residual securities.
Other Secured Borrowings
The carrying value of secured borrowings that bear interest at a rate that is adjusted regularly based on a market index approximates fair value. For other secured borrowings that bear interest at a fixed rate, we determine fair value by discounting the future principal and interest repayments at a market rate commensurate with the risk of the estimated cash flows. For the SSTL, we base the fair value on valuation data obtained from a pricing service.
Secured Notes
In 2014, we issued Ocwen Asset Servicing Income Series (OASIS), Series 2014-1 Notes secured by Ocwen-owned MSRs relating to Freddie Mac mortgages. In 2019, we issued Ocwen Excess Spread-Collateralized Notes, Series 2019-PLS1 notes secured by certain of PMC’s private label MSRs. We determine the fair value of these notes based on bid prices provided by third parties involved in the issuance and placement of the notes.
Senior Notes
We base the fair value on quoted prices in a market with limited trading activity, or on valuation data obtained from a pricing service in the absence of trading data.
Derivative Financial Instruments
Interest rate lock commitments (IRLCs) represent an agreement to purchase loans from a third-party originator or an agreement to extend credit to a mortgage applicant (locked pipeline), whereby the interest rate is set prior to funding. IRLCs are classified within Level 2 of the valuation hierarchy as the primary component of the price is obtained from observable values of mortgage forwards for loans of similar terms and characteristics. Fair value amounts of IRLCs are adjusted for expected “fallout” (locked pipeline loans not expected to close) using models that consider cumulative historical fallout rates and other factors.
We entered into forward MBS trades to provide an economic hedge against changes in the fair value of residential forward and reverse mortgage loans held for sale that we carry at fair value until August 2019 and, beginning in September 2019, to hedge of our net MSR portfolio. Forward contracts are actively traded in the market and we obtain unadjusted market quotes for these derivatives; thus, they are classified within Level 1 of the valuation hierarchy.
In addition, we may use interest rate caps to minimize future interest rate exposure on variable rate debt issued on servicing advance financing facilities from increases in one-month or three-month Eurodollar rate (1ML or 3ML, respectively) interest rates. The fair value for interest rate caps is based on counterparty market prices and adjusted for counterparty credit risk.
F-34
Note 6 — Loans Held for Sale
|
Loans Held for Sale - Fair Value
|
Years Ended December 31,
|
||||||||||
|
2019
|
2018
|
2017
|
|||||||||
|
Beginning balance
|
$
|
176,525
|
|
$
|
214,262
|
|
$
|
284,632
|
|
||
|
Originations and purchases
|
1,168,885
|
|
944,627
|
|
2,678,372
|
|
|||||
|
Proceeds from sales
|
(1,124,247
|
)
|
(1,019,211
|
)
|
(2,785,422
|
)
|
|||||
|
Principal collections
|
(23,116
|
)
|
(20,774
|
)
|
(4,867
|
)
|
|||||
|
Acquired in connection with the acquisition of PHH
|
—
|
|
42,324
|
|
—
|
|
|||||
|
Transfers from (to):
|
|||||||||||
|
Loans held for investment, at fair value
|
1,892
|
|
1,038
|
|
3,803
|
|
|||||
|
Receivables
|
(2,480
|
)
|
(1,132
|
)
|
—
|
|
|||||
|
REO (Other assets)
|
(2,520
|
)
|
(1,886
|
)
|
—
|
|
|||||
|
Gain on sale of loans
|
25,253
|
|
34,724
|
|
35,429
|
|
|||||
|
(Decrease) increase in fair value of loans
|
(589
|
)
|
(13,435
|
)
|
151
|
|
|||||
|
Other
|
(10,851
|
)
|
(4,012
|
)
|
2,164
|
|
|||||
|
Ending balance (1)
|
$
|
208,752
|
|
$
|
176,525
|
|
$
|
214,262
|
|
||
|
(1)
|
At
December 31, 2019
,
2018
and
2017
, the balances include
$(7.8) million
,
$(7.2) million
and
$5.0 million
, respectively, of fair value adjustments.
|
|
Loans Held for Sale - Lower of Cost or Fair Value
|
Years Ended December 31,
|
||||||||||
|
2019
|
2018
|
2017
|
|||||||||
|
Beginning balance
|
$
|
66,097
|
|
$
|
24,096
|
|
$
|
29,374
|
|
||
|
Purchases
|
320,089
|
|
770,563
|
|
1,016,791
|
|
|||||
|
Proceeds from sales
|
(221,471
|
)
|
(569,718
|
)
|
(861,569
|
)
|
|||||
|
Principal collections
|
(11,304
|
)
|
(15,413
|
)
|
(10,207
|
)
|
|||||
|
Transfers from (to):
|
|||||||||||
|
Receivables, net
|
(104,635
|
)
|
(155,586
|
)
|
(171,797
|
)
|
|||||
|
REO (Other assets)
|
(4,116
|
)
|
(2,355
|
)
|
(875
|
)
|
|||||
|
Gain on sale of loans
|
4,974
|
|
3,659
|
|
11,683
|
|
|||||
|
Decrease (increase) in valuation allowance
|
4,926
|
|
(4,251
|
)
|
2,746
|
|
|||||
|
Other
|
11,957
|
|
15,102
|
|
7,950
|
|
|||||
|
Ending balance (1)
|
$
|
66,517
|
|
$
|
66,097
|
|
$
|
24,096
|
|
||
|
(1)
|
At
December 31, 2019
,
2018
and
2017
, the balances include
$60.6 million
,
$51.8 million
and
$19.6 million
, respectively, of loans that we repurchased from Ginnie Mae guaranteed securitizations pursuant to Ginnie Mae servicing guidelines. We may repurchase loans that have been modified, to facilitate loss reduction strategies, or as otherwise obligated as a Ginnie Mae servicer. Repurchased loans may be modified or otherwise remediated through loss mitigation activities, may be sold to a third party, or are reclassified to Receivables.
|
|
Valuation Allowance - Loans Held for Sale at Lower of Cost or Fair Value
|
Years Ended December 31,
|
||||||||||
|
2019
|
2018
|
2017
|
|||||||||
|
Beginning balance
|
$
|
11,569
|
|
$
|
7,318
|
|
$
|
10,064
|
|
||
|
Provision
|
2,537
|
|
4,033
|
|
3,109
|
|
|||||
|
Transfer from Liability for indemnification obligations (Other liabilities)
|
403
|
|
2,021
|
|
3,246
|
|
|||||
|
Sales of loans
|
(7,866
|
)
|
(1,824
|
)
|
(9,415
|
)
|
|||||
|
Other
|
—
|
|
21
|
|
314
|
|
|||||
|
Ending balance
|
$
|
6,643
|
|
$
|
11,569
|
|
$
|
7,318
|
|
||
F-35
|
Years Ended December 31,
|
|||||||||||
|
Gains on Loans Held for Sale, Net
|
2019
|
2018
|
2017
|
||||||||
|
Gain on sales of loans, net
|
|||||||||||
|
MSRs retained on transfers of forward mortgage loans
|
$
|
7,458
|
|
$
|
7,412
|
|
$
|
20,900
|
|
||
|
Gain on sale of forward mortgage loans
|
25,310
|
|
34,216
|
|
35,445
|
|
|||||
|
Gain on sale of repurchased Ginnie Mae loans
|
4,764
|
|
3,659
|
|
11,683
|
|
|||||
|
|
37,532
|
|
45,287
|
|
68,028
|
|
|||||
|
Change in fair value of IRLCs
|
756
|
|
3,809
|
|
(3,089
|
)
|
|||||
|
Change in fair value of loans held for sale
|
3,005
|
|
(11,569
|
)
|
1,475
|
|
|||||
|
(Loss) gain on economic hedge instruments
|
(2,689
|
)
|
136
|
|
(8,529
|
)
|
|||||
|
Other
|
(304
|
)
|
(327
|
)
|
(702
|
)
|
|||||
|
$
|
38,300
|
|
$
|
37,336
|
|
$
|
57,183
|
|
|||
Note 7 — Advances
|
December 31,
|
|||||||
|
|
2019
|
2018
|
|||||
|
Principal and interest
|
$
|
80,229
|
|
$
|
43,671
|
|
|
|
Taxes and insurance
|
92,315
|
|
160,373
|
|
|||
|
Foreclosures, bankruptcy, REO and other
|
91,914
|
|
68,597
|
|
|||
|
|
264,458
|
|
272,641
|
|
|||
|
Allowance for losses
|
(9,925
|
)
|
(23,259
|
)
|
|||
|
|
$
|
254,533
|
|
$
|
249,382
|
|
|
The following table summarizes the activity in net advances:
|
Years Ended December 31,
|
|||||||||||
|
2019
|
2018
|
2017
|
|||||||||
|
Beginning balance
|
$
|
249,382
|
|
$
|
211,793
|
|
$
|
257,882
|
|
||
|
Asset acquisition
|
1,457
|
|
—
|
|
—
|
|
|||||
|
Acquired in connection with the acquisition of PHH
|
—
|
|
96,163
|
|
—
|
|
|||||
|
Transfers to match funded advances
|
—
|
|
(71,623
|
)
|
—
|
|
|||||
|
Sales of advances
|
(11,791
|
)
|
(32,081
|
)
|
(444
|
)
|
|||||
|
Collections of advances, charge-offs and other, net
|
2,151
|
|
51,924
|
|
(67,132
|
)
|
|||||
|
Net decrease (increase) in allowance for losses (1)
|
13,334
|
|
(6,794
|
)
|
21,487
|
|
|||||
|
Ending balance
|
$
|
254,533
|
|
$
|
249,382
|
|
$
|
211,793
|
|
||
|
Allowance for Losses
|
Years Ended December 31,
|
||||||||||
|
2019
|
2018
|
2017
|
|||||||||
|
Beginning balance
|
$
|
23,259
|
|
$
|
16,465
|
|
$
|
37,952
|
|
||
|
Provision
|
3,220
|
|
5,732
|
|
21,429
|
|
|||||
|
Net charge-offs and other (1)
|
(16,554
|
)
|
1,062
|
|
(42,916
|
)
|
|||||
|
Ending balance
|
$
|
9,925
|
|
$
|
23,259
|
|
$
|
16,465
|
|
||
|
(1)
|
Net change for the year ended December 31, 2019 includes
$18.0 million
allowance related to sold advances presented in Other liabilities (Liability for indemnification obligations).
|
F-36
Note 8 — Match Funded Assets
|
December 31,
|
|||||||
|
|
2019
|
2018
|
|||||
|
Advances:
|
|||||||
|
Principal and interest
|
$
|
334,617
|
|
$
|
412,897
|
|
|
|
Taxes and insurance
|
330,068
|
|
374,853
|
|
|||
|
Foreclosures, bankruptcy, REO and other
|
137,305
|
|
149,544
|
|
|||
|
|
$
|
801,990
|
|
$
|
937,294
|
|
|
The following table summarizes the activity in match funded assets:
|
Years Ended December 31,
|
|||||||||||||||||||
|
2019
|
2018
|
2017
|
|||||||||||||||||
|
Advances
|
Advances
|
Automotive Dealer Financing Notes
|
Advances
|
Automotive Dealer Financing Notes
|
|||||||||||||||
|
Beginning balance
|
$
|
937,294
|
|
$
|
1,144,600
|
|
$
|
32,757
|
|
$
|
1,451,964
|
|
$
|
—
|
|
||||
|
Transfers from advances
|
—
|
|
71,623
|
|
—
|
|
—
|
|
—
|
|
|||||||||
|
Transfer (to) from Other assets
|
—
|
|
—
|
|
(36,896
|
)
|
—
|
|
25,180
|
|
|||||||||
|
Sales
|
—
|
|
—
|
|
—
|
|
(691
|
)
|
—
|
|
|||||||||
|
New advances (collections), net
|
(135,304
|
)
|
(278,929
|
)
|
1,504
|
|
(306,673
|
)
|
10,212
|
|
|||||||||
|
Decrease (increase) in allowance for losses
|
—
|
|
—
|
|
2,635
|
|
—
|
|
(2,635
|
)
|
|||||||||
|
Ending balance
|
$
|
801,990
|
|
$
|
937,294
|
|
$
|
—
|
|
$
|
1,144,600
|
|
$
|
32,757
|
|
||||
|
Note 9 — Mortgage Servicing
|
|
|
Mortgage Servicing Rights – Amortization Method
|
Years Ended December 31,
|
||||||
|
2018
|
2017
|
||||||
|
Beginning balance
|
$
|
336,882
|
|
$
|
363,722
|
|
|
|
Fair value election - transfer to MSRs carried at fair value (1)
|
(361,670
|
)
|
—
|
|
|||
|
Additions recognized in connection with asset acquisitions
|
—
|
|
1,658
|
|
|||
|
Additions recognized on the sale of mortgage loans
|
—
|
|
20,738
|
|
|||
|
Sales
|
—
|
|
(1,066
|
)
|
|||
|
Servicing transfers and adjustments
|
—
|
|
252
|
|
|||
|
(24,788
|
)
|
385,304
|
|
||||
|
Decrease in impairment valuation allowance (1) (2)
|
24,788
|
|
3,366
|
|
|||
|
Amortization (1)
|
—
|
|
(51,788
|
)
|
|||
|
Ending balance
|
$
|
—
|
|
$
|
336,882
|
|
|
|
Estimated fair value at end of year
|
$
|
—
|
|
$
|
418,745
|
|
|
|
(1)
|
Effective January 1, 2018, we elected fair value accounting for our MSRs previously accounted for using the amortization method, which included Agency MSRs and government-insured MSRs. This irrevocable election applies to all subsequently acquired or originated servicing assets and liabilities that have characteristics consistent with each of these classes. We recorded a cumulative-effect adjustment of
$82.0 million
to retained earnings as of January 1, 2018 to reflect the excess of the fair value of the Agency MSRs over their carrying amount. We also recognized the tax effect of this adjustment through an increase in retained earnings of
$6.8 million
and a deferred tax asset for the same amount. However, we established a full valuation allowance on the resulting deferred tax asset through a reduction in retained earnings. The government-insured MSRs were impaired by
$24.8 million
at December 31, 2017; therefore, these MSRs were already effectively carried at fair value.
|
F-37
|
(2)
|
Impairment of MSRs is recognized in MSR valuation adjustments, net in the consolidated statements of operations for 2017. Impairment valuation allowance balance of
$24.8 million
was reclassified to reduce the carrying value of the related MSRs on January 1, 2018 in connection with our fair value election.
|
|
Mortgage Servicing Rights – Fair Value Measurement Method
|
Years Ended December 31,
|
||||||||||||||||||||||||||||||||||
|
2019
|
2018
|
2017
|
|||||||||||||||||||||||||||||||||
|
Agency
|
Non-Agency
|
Total
|
Agency
|
Non-Agency
|
Total
|
Agency
|
Non-Agency
|
Total
|
|||||||||||||||||||||||||||
|
Beginning balance
|
$
|
865,587
|
|
$
|
591,562
|
|
$
|
1,457,149
|
|
$
|
11,960
|
|
$
|
660,002
|
|
$
|
671,962
|
|
$
|
13,357
|
|
$
|
665,899
|
|
$
|
679,256
|
|
||||||||
|
Fair value election - Transfer from MSRs carried at amortized cost
|
—
|
|
—
|
|
—
|
|
336,882
|
|
—
|
|
336,882
|
|
—
|
|
—
|
|
—
|
|
|||||||||||||||||
|
Cumulative effect of fair value election
|
—
|
|
—
|
|
—
|
|
82,043
|
|
—
|
|
82,043
|
|
—
|
|
—
|
|
—
|
|
|||||||||||||||||
|
Sales
|
(3,578
|
)
|
(766
|
)
|
(4,344
|
)
|
(4,748
|
)
|
(1,492
|
)
|
(6,240
|
)
|
—
|
|
(540
|
)
|
(540
|
)
|
|||||||||||||||||
|
Additions:
|
|||||||||||||||||||||||||||||||||||
|
Recognized on the sale of residential mortgage loans
|
8,795
|
|
—
|
|
8,795
|
|
8,279
|
|
—
|
|
8,279
|
|
162
|
|
—
|
|
162
|
|
|||||||||||||||||
|
Recognized in connection with the acquisition of PHH
|
—
|
|
—
|
|
—
|
|
494,348
|
|
23,779
|
|
518,127
|
|
—
|
|
—
|
|
—
|
|
|||||||||||||||||
|
Purchase of MSRs
|
153,505
|
|
—
|
|
153,505
|
|
5,433
|
|
—
|
|
5,433
|
|
—
|
|
—
|
|
—
|
|
|||||||||||||||||
|
Servicing transfers and adjustments
|
—
|
|
(7,309
|
)
|
(7,309
|
)
|
(1,047
|
)
|
(4,833
|
)
|
(5,880
|
)
|
—
|
|
(2,376
|
)
|
(2,376
|
)
|
|||||||||||||||||
|
Changes in fair value (1):
|
|
|
|||||||||||||||||||||||||||||||||
|
Changes in valuation inputs or other assumptions
|
(171,050
|
)
|
265,003
|
|
93,953
|
|
11,558
|
|
(5,705
|
)
|
5,853
|
|
243
|
|
86,721
|
|
86,964
|
|
|||||||||||||||||
|
Realization of expected future cash flows and other changes
|
(139,253
|
)
|
(76,101
|
)
|
(215,354
|
)
|
(79,121
|
)
|
(80,189
|
)
|
(159,310
|
)
|
(1,802
|
)
|
(89,702
|
)
|
(91,504
|
)
|
|||||||||||||||||
|
Ending balance
|
$
|
714,006
|
|
$
|
772,389
|
|
$
|
1,486,395
|
|
$
|
865,587
|
|
$
|
591,562
|
|
$
|
1,457,149
|
|
$
|
11,960
|
|
$
|
660,002
|
|
$
|
671,962
|
|
||||||||
|
(1)
|
Changes in fair value are recognized in MSR valuation adjustments, net in the consolidated statements of operations.
|
Portfolio of Assets Serviced
The following table presents the composition of our primary servicing and subservicing portfolios as measured by UPB. The UPB amounts in the table below are not included on our consolidated balance sheets.
|
UPB at December 31,
|
|||||||||||
|
2019
|
2018
|
2017
|
|||||||||
|
Servicing (1)
|
$
|
76,657,932
|
|
$
|
72,378,693
|
|
$
|
75,469,327
|
|
||
|
Subservicing (1)
|
17,120,905
|
|
53,104,560
|
|
2,063,669
|
|
|||||
|
NRZ (1) (2)
|
118,587,594
|
|
130,517,237
|
|
101,819,557
|
|
|||||
|
|
$
|
212,366,431
|
|
$
|
256,000,490
|
|
$
|
179,352,553
|
|
||
|
(1)
|
UPB at December 31, 2018 includes
$6.3 billion
,
$51.3 billion
and
$42.3 billion
UPB of loans serviced, subserviced or subserviced on behalf of NRZ, respectively, added to the portfolio in connection with the PHH acquisition.
|
|
(2)
|
UPB of loans for which the Rights to MSRs have been sold to NRZ, including
$57.7 billion
for which third-party consents have been received and the MSRs have been transferred to NRZ (the MSRs remain on balance sheet as the transactions do not achieve sale
|
F-38
accounting treatment). At December 31, 2019, the
$118.6 billion
NRZ UPB includes
$6.6 billion
of loans that are subserviced on behalf of NRZ and were added in 2019 by NRZ to the PMC subservicing agreement. This
$6.6 billion
loan UPB is not included in the MSR loan UPB or associated Rights to MSRs - See
Note 10 — Rights to MSRs
.
On February 20, 2020, we received a notice of termination from NRZ with respect to the subservicing agreement between NRZ and PMC, which accounted for
20%
of our servicing portfolio UPB at December 31, 2019. See
Note 28 — Subsequent Events
.
We acquired MSRs on portfolios with a UPB of
$14.6 billion
and
$144.1 million
during
2019
and
2018
, respectively. We also sold MSRs with a UPB of
$140.8 million
,
$901.3 million
and
$219.4 million
during
2019
,
2018
and
2017
, respectively.
A significant portion of the servicing agreements for our non-Agency servicing portfolio contain provisions where we could be terminated as servicer without compensation upon the failure of the serviced loans to meet certain portfolio delinquency or cumulative loss thresholds. To date, terminations as servicer as a result of a breach of any of these provisions have been minimal.
At
December 31, 2019
, the S&P Global Ratings, Inc.’s (S&P) and Fitch Ratings, Inc.’s (Fitch) servicer ratings outlook for both PMC is stable. Downgrades in servicer ratings could adversely affect our ability to service loans, sell or finance servicing advances and could impair our ability to consummate future servicing transactions or adversely affect our dealings with lenders, other contractual counterparties, and regulators, including our ability to maintain our status as an approved servicer by Fannie Mae and Freddie Mac. The servicer rating requirements of Fannie Mae do not necessarily require or imply immediate action, as Fannie Mae has discretion with respect to whether we are in compliance with their requirements and what actions it deems appropriate under the circumstances in the event that we fall below their desired servicer ratings.
Certain of our servicing agreements require that we maintain specified servicer ratings from rating agencies such as Moody’s and S&P. As a result of our current servicer ratings, termination rights have been triggered in some non-Agency servicing agreements. To date, terminations as servicer as a result of a breach of any of these provisions have been minimal.
The geographic concentration of the UPB of residential loans and real estate we serviced at
December 31, 2019
was as follows:
|
|
Amount
|
Count
|
||||
|
California
|
$
|
47,350,699
|
|
189,959
|
|
|
|
New York
|
19,557,621
|
|
90,805
|
|
||
|
Florida
|
16,366,372
|
|
121,875
|
|
||
|
New Jersey
|
10,921,867
|
|
57,182
|
|
||
|
Texas
|
10,073,637
|
|
100,868
|
|
||
|
Other
|
108,096,235
|
|
859,254
|
|
||
|
|
$
|
212,366,431
|
|
1,419,943
|
|
|
|
|
Years Ended December 31,
|
||||||||||
|
Servicing Revenue
|
2019
|
2018
|
2017
|
||||||||
|
Loan servicing and subservicing fees
|
|||||||||||
|
Servicing
|
$
|
227,490
|
|
$
|
227,639
|
|
$
|
259,640
|
|
||
|
Subservicing
|
15,459
|
|
8,904
|
|
7,775
|
|
|||||
|
NRZ
|
577,015
|
|
539,039
|
|
549,411
|
|
|||||
|
819,964
|
|
775,582
|
|
816,826
|
|
||||||
|
Late charges
|
57,194
|
|
61,453
|
|
61,763
|
|
|||||
|
Home Affordable Modification Program (HAMP) fees (1)
|
5,538
|
|
14,312
|
|
43,310
|
|
|||||
|
Custodial accounts (float earnings)
|
47,562
|
|
40,115
|
|
25,237
|
|
|||||
|
Loan collection fees
|
15,539
|
|
18,392
|
|
22,770
|
|
|||||
|
Other
|
29,710
|
|
27,229
|
|
21,691
|
|
|||||
|
|
$
|
975,507
|
|
$
|
937,083
|
|
$
|
991,597
|
|
||
|
(1)
|
The HAMP expired on December 31, 2016. Borrowers who had requested assistance or to whom an offer of assistance had been extended as of that date had until September 30, 2017 to finalize their modification. We continue to earn HAMP success fees for HAMP modifications that remain less than 90 days delinquent at the first-, second- and third-year anniversary of the start of the trial modification.
|
F-39
Float balances (balances in custodial accounts, which represent collections of principal and interest that we receive from borrowers) are held in escrow by unaffiliated banks and are excluded from our consolidated balance sheets. Float balances amounted to
$1.7 billion
,
$1.7 billion
and
$1.5 billion
at
December 31, 2019
,
2018
and
2017
, respectively.
Note 10 — Rights to MSRs
Ocwen and PMC have entered into agreements to sell MSRs or Rights to MSRs and the related servicing advances to NRZ, and in all cases have been retained by NRZ as subservicer. In the case of Ocwen Rights to MSRs transactions, while the majority of the risks and rewards of ownership were transferred in 2012 and 2013, legal title was retained by Ocwen, causing the Rights to MSRs transactions to be accounted for as secured financings. In the case of the PMC transactions, and for those Ocwen MSRs where consents were subsequently received and legal title was transferred to NRZ, due to the length of the non-cancellable term of the subservicing agreements, the transactions do not qualify as a sale and are accounted for as secured financings. As a result, we continue to recognize the MSRs and related financing liability on our consolidated balance sheets, as well as the full amount of servicing revenue and changes in the fair value of the MSRs and related financing liability in our consolidated statements of operations. Changes in fair value of the Rights to MSRs are recognized in MSR valuation adjustments, net in the consolidated statements of operations. Changes in fair value of the MSR related financing liability are reported in Pledged MSR liability expense.
The following tables present selected assets and liabilities recorded on our consolidated balance sheets as well as the impacts to our consolidated statements of operations in connection with our NRZ agreements.
|
Years Ended December 31,
|
|||||||||||
|
2019
|
2018
|
2017
|
|||||||||
|
Balance Sheets
|
|||||||||||
|
MSRs, at fair value
|
$
|
915,148
|
|
$
|
894,002
|
|
$
|
499,042
|
|
||
|
Due from NRZ (Receivables)
|
|||||||||||
|
Sales and transfers of MSRs (1)
|
24,167
|
|
23,757
|
|
—
|
|
|||||
|
Advance funding, subservicing fees and reimbursable expenses
|
9,197
|
|
30,845
|
|
14,924
|
|
|||||
|
$
|
33,364
|
|
$
|
54,602
|
|
$
|
14,924
|
|
|||
|
Due to NRZ (Other liabilities)
|
$
|
63,596
|
|
$
|
53,001
|
|
$
|
98,493
|
|
||
|
Financing liability - MSRs pledged, at fair value
|
|||||||||||
|
Original Rights to MSRs Agreements
|
$
|
603,046
|
|
$
|
436,511
|
|
$
|
499,042
|
|
||
|
2017 Agreements and New RMSR Agreements (2)
|
35,445
|
|
138,854
|
|
9,249
|
|
|||||
|
PMC MSR Agreements
|
312,102
|
|
457,491
|
|
—
|
|
|||||
|
$
|
950,593
|
|
$
|
1,032,856
|
|
$
|
508,291
|
|
|||
|
Statements of Operations
|
|||||||||||
|
Servicing fees collected on behalf of NRZ
|
$
|
577,015
|
|
$
|
539,039
|
|
$
|
549,411
|
|
||
|
Less: Subservicing fee retained
|
139,343
|
|
142,334
|
|
295,192
|
|
|||||
|
Net servicing fees remitted to NRZ
|
437,672
|
|
396,705
|
|
254,219
|
|
|||||
|
Less: Reduction (increase) in financing liability
|
|||||||||||
|
Changes in fair value:
|
|||||||||||
|
Original Rights to MSRs Agreements
|
(229,198
|
)
|
171
|
|
(83,300
|
)
|
|||||
|
2017 Agreements and New RMSR Agreements
|
(5,866
|
)
|
14,369
|
|
42,018
|
|
|||||
|
PMC MSR Agreements
|
82,078
|
|
4,729
|
|
—
|
|
|||||
|
(152,986
|
)
|
19,269
|
|
(41,282
|
)
|
||||||
F-40
|
Years Ended December 31,
|
|||||||||||
|
2019
|
2018
|
2017
|
|||||||||
|
Runoff and settlement:
|
|||||||||||
|
Original Rights to MSRs Agreements
|
48,729
|
|
58,837
|
|
57,264
|
|
|||||
|
2017 Agreements and New RMSR Agreements
|
101,003
|
|
134,509
|
|
1,926
|
|
|||||
|
PMC MSR Agreements
|
64,631
|
|
18,420
|
|
—
|
|
|||||
|
214,363
|
|
211,766
|
|
59,190
|
|
||||||
|
Other
|
4,206
|
|
(6,000
|
)
|
—
|
|
|||||
|
Pledged MSR liability expense
|
$
|
372,089
|
|
$
|
171,670
|
|
$
|
236,311
|
|
||
|
(1)
|
Balance represents the holdback of proceeds from PMC MSR sales and transfers to address indemnification claims and mortgage loan document deficiencies. These sales were executed by PMC prior to the acquisition date.
|
|
(2)
|
$35.4 million
income is expected to be recognized for the year ended December 31, 2020 as a reduction in the pledged MSR liability.
|
|
Year Ended December 31, 2019
|
|||||||||||||||
|
Financing Liability - MSRs Pledged
|
Original Rights to MSRs Agreements
|
2017 Agreements and New RMSR Agreements
|
PMC MSR Agreements
|
Total
|
|||||||||||
|
Beginning balance
|
$
|
436,511
|
|
$
|
138,854
|
|
$
|
457,491
|
|
$
|
1,032,856
|
|
|||
|
Additions
|
—
|
|
—
|
|
1,276
|
|
1,276
|
|
|||||||
|
Sales
|
—
|
|
—
|
|
44
|
|
44
|
|
|||||||
|
Changes in fair value:
|
|||||||||||||||
|
Original Rights to MSRs Agreements
|
229,198
|
|
—
|
|
—
|
|
229,198
|
|
|||||||
|
2017 Agreements and New RMSR Agreements
|
—
|
|
5,866
|
|
—
|
|
5,866
|
|
|||||||
|
PMC MSR Agreements
|
—
|
|
—
|
|
(82,078
|
)
|
(82,078
|
)
|
|||||||
|
Runoff and settlement:
|
|||||||||||||||
|
Original Rights to MSRs Agreements
|
(48,730
|
)
|
—
|
|
—
|
|
(48,730
|
)
|
|||||||
|
2017 Agreements and New RMSR Agreements
|
—
|
|
(101,003
|
)
|
—
|
|
(101,003
|
)
|
|||||||
|
PMC MSR Agreements
|
—
|
|
—
|
|
(64,631
|
)
|
(64,631
|
)
|
|||||||
|
Calls (1):
|
|||||||||||||||
|
Original Rights to MSRs Agreements
|
(13,933
|
)
|
—
|
|
—
|
|
(13,933
|
)
|
|||||||
|
2017 Agreements and New RMSR Agreements
|
—
|
|
(8,272
|
)
|
—
|
|
(8,272
|
)
|
|||||||
|
PMC MSR Agreements
|
—
|
|
—
|
|
—
|
|
—
|
|
|||||||
|
Ending balance
|
$
|
603,046
|
|
$
|
35,445
|
|
$
|
312,102
|
|
$
|
950,593
|
|
|||
F-41
|
Year Ended December 31, 2018
|
|||||||||||||||
|
Financing Liability - MSRs Pledged
|
Original Rights to MSRs Agreements
|
2017 Agreements and New RMSR Agreements
|
PMC MSR Agreements
|
Total
|
|||||||||||
|
Beginning balance
|
$
|
499,042
|
|
$
|
9,249
|
|
$
|
—
|
|
$
|
508,291
|
|
|||
|
Additions
|
—
|
|
—
|
|
667
|
|
667
|
|
|||||||
|
Assumed in connection with the acquisition of PHH
|
—
|
|
—
|
|
481,020
|
|
481,020
|
|
|||||||
|
Receipt of lump-sum cash payments
|
—
|
|
279,586
|
|
—
|
|
279,586
|
|
|||||||
|
Changes in fair value:
|
|||||||||||||||
|
Original Rights to MSRs Agreements
|
(171
|
)
|
—
|
|
—
|
|
(171
|
)
|
|||||||
|
2017 Agreements and New RMSR Agreements
|
—
|
|
(14,369
|
)
|
—
|
|
(14,369
|
)
|
|||||||
|
PMC MSR Agreements
|
—
|
|
—
|
|
(4,729
|
)
|
(4,729
|
)
|
|||||||
|
Runoff and settlement:
|
|||||||||||||||
|
Original Rights to MSRs Agreements
|
(58,837
|
)
|
—
|
|
—
|
|
(58,837
|
)
|
|||||||
|
2017 Agreements and New RMSR Agreements
|
—
|
|
(134,509
|
)
|
—
|
|
(134,509
|
)
|
|||||||
|
PMC MSR Agreements
|
—
|
|
—
|
|
(18,420
|
)
|
(18,420
|
)
|
|||||||
|
Calls (1):
|
—
|
|
—
|
|
—
|
|
|||||||||
|
Original Rights to MSRs Agreements
|
(3,523
|
)
|
—
|
|
—
|
|
(3,523
|
)
|
|||||||
|
2017 Agreements and New RMSR Agreements
|
—
|
|
(1,103
|
)
|
—
|
|
(1,103
|
)
|
|||||||
|
PMC MSR Agreements
|
—
|
|
—
|
|
(1,047
|
)
|
(1,047
|
)
|
|||||||
|
Ending balance
|
$
|
436,511
|
|
$
|
138,854
|
|
$
|
457,491
|
|
$
|
1,032,856
|
|
|||
|
(1)
|
Represents the carrying value of MSRs in connection with call rights exercised by NRZ, for MSRs transferred to NRZ under the 2017 Agreements and New RMSR Agreements, or by Ocwen at NRZ’s direction, for MSRs underlying the Original Rights to MSRs Agreements. Ocwen derecognizes the MSRs and the related financing liability upon collapse of the securitization.
|
Ocwen Transactions
Prior to the transfer of legal title under the Master Servicing Rights Purchase Agreement dated as of October 1, 2012, as amended, and certain Sale Supplements, as amended (collectively, the Original Rights to MSRs Agreements), Ocwen agreed to service the mortgage loans underlying the MSRs on the economic terms set forth in the Original Rights to MSRs Agreements. After the transfer of legal title as contemplated under the Original Rights to MSRs Agreements, Ocwen was to service the mortgage loans underlying the MSRs as subservicer on substantially the same economic terms.
On July 23, 2017 and January 18, 2018, we entered into a series of agreements with NRZ that collectively modify, supplement and supersede the arrangements among the parties as set forth in the Original Rights to MSRs Agreements. The July 23, 2017 agreements, as amended, include a Master Agreement, a Transfer Agreement and the Subservicing Agreement between Ocwen and New Residential Mortgage LLC (NRM), a subsidiary of NRZ, relating to non-agency loans (the NRM Subservicing Agreement) (collectively, the 2017 Agreements) pursuant to which the parties agreed, among other things, to undertake certain actions to facilitate the transfer from Ocwen to NRZ of Ocwen’s legal title to the remaining MSRs that were subject to the Original Rights to MSRs Agreements and under which Ocwen would subservice mortgage loans underlying the MSRs for an initial term ending July 2022 (the Initial Term).
On January 18, 2018, the parties entered into new agreements (including a Servicing Addendum) regarding the Rights to MSRs related to MSRs that remained subject to the Original Rights to MSRs Agreements as of January 1, 2018 and amended the Transfer Agreement (collectively, New RMSR Agreements) to accelerate the implementation of certain parts of our arrangements in order to achieve the intent of the 2017 Agreements sooner. Under the new agreements, following receipt of the required consents and transfer of the MSRs, Ocwen subservices the mortgage loans underlying the transferred MSRs pursuant to the 2017 Agreements and the August 2018 subservicing agreement with NewRez LLC dba Shellpoint Mortgage Servicing (Shellpoint) described below.
Ocwen received lump-sum cash payments of
$54.6 million
and
$279.6 million
in September 2017 and January 2018 in accordance with the terms of the 2017 Agreements and New RMSR Agreements, respectively. These upfront payments generally represent the net present value of the difference between the future revenue stream Ocwen would have received under the Original Rights to MSRs Agreements and the future revenue stream Ocwen expects to receive under the 2017 Agreements
F-42
and the New RMSR Agreements. We recognized the cash received as a financing liability that we are accounting for at fair value through the remaining term of the original agreements (April 2020). Changes in fair value are recognized in Pledged MSR liability expense in the consolidated statements of operations.
On August 17, 2018, Ocwen and NRZ entered into certain amendments (i) to the New RMSR Agreements to include Shellpoint, a subsidiary of NRZ, as a party to which legal title to the MSRs could be transferred after related consents are received, (ii) to add a Subservicing Agreement between Ocwen and Shellpoint relating to non-agency loans (the Shellpoint Subservicing Agreement), (iii) to add an Agency Subservicing Agreement between Ocwen and NRM relating to agency loans (the Agency Subservicing Agreement), and (iv) to conform the New RMSR Agreements and the NRM Subservicing Agreement to certain of the terms of the Shellpoint Subservicing Agreement and the Agency Subservicing Agreement.
At any time during the Initial Term, NRZ may terminate the Subservicing Agreements and Servicing Addendum for convenience, subject to Ocwen’s right to receive a termination fee and 180 days’ notice. The termination fee is calculated as specified in the Subservicing Agreements and Servicing Addendum, and is a discounted percentage of the expected revenues that would be owed to Ocwen over the remaining contract term based on certain portfolio run off assumptions.
Following the Initial Term, NRZ may extend the term of the Subservicing Agreements and Servicing Addendum for additional
three
-month periods by providing proper notice. Following the Initial Term, the Subservicing Agreements and Servicing Addendum can be cancelled by Ocwen on an annual basis. NRZ and Ocwen have the ability to terminate the Subservicing Agreements and Servicing Addendum for cause if certain specified conditions occur. The terminations must be terminations in whole (i.e., cover all the loans under the relevant Subservicing Agreement or Servicing Addendum) and not in part, except for limited circumstances specified in the agreements. In addition, if NRZ terminates any of the NRM or Shellpoint Subservicing Agreements or the Servicing Addendum for cause, the other agreements will also terminate automatically.
Under the terms of the Subservicing Agreements and Servicing Addendum, in addition to a base servicing fee, Ocwen receives certain ancillary fees, primarily late fees, loan modification fees and Speedpay
®
fees. We may also receive certain incentive fees or pay penalties tied to various contractual performance metrics. NRZ receives all float earnings and deferred servicing fees related to delinquent borrower payments, as well as being entitled to receive certain real estate owned (REO) related income including REO referral commissions.
As of
December 31, 2019
, the UPB of MSRs subject to the Servicing Agreements and the New RMSR Agreements is
$76.1 billion
, including
$18.5 billion
for which title has not transferred to NRZ. We and NRZ are currently discussing various alternative arrangements for the servicing of these MSRs. As the third-party consents required for title to the MSRs to transfer were not obtained by May 31, 2019, the New RMSR Agreements set forth a process under which NRZ’s
$18.5 billion
Rights to MSRs may (i) be acquired by Ocwen at a price determined in accordance with the terms of the New RMSR Agreements, at the option of Ocwen, or (ii) be sold, together with Ocwen’s title to those MSRs, to a third party in accordance with the terms of the New RMSR Agreements, subject to an additional Ocwen option to acquire at a price based on the winning third-party bid rather than selling to the third party. If the Rights to MSRs are not transferred pursuant to these alternatives, then the Rights to MSRs will remain subject to the New RMSR Agreements.
In addition, as noted above, during the Initial Term, NRZ has the right to terminate the
$18.5 billion
New RMSR Agreements for convenience, in whole but not in part, subject to payment of a termination fee and 180 days’ notice. If NRZ exercises this termination right, NRZ has the option of seeking (i) the transfer of the MSRs through a sale to a third party of its Rights to MSRs (together with a transfer of Ocwen’s title to those MSRs) or (ii) a substitute RMSR arrangement that substantially replicates the Rights to MSRs structure (a Substitute RMSR Arrangement) under which we would transfer title to the MSRs to a successor servicer and NRZ would continue to own the economic rights and obligations related to the MSRs. In the case of option (i), we have a purchase option as specified in the New RMSR Agreements. If NRZ is not able to sell the Rights to MSRs or establish a Substitute RMSR Arrangement with another servicer, NRZ has the right to revoke its termination notice and re-instate the Servicing Addendum or to establish a subservicing arrangement whereby the MSRs remaining subject to the New RMSR Agreements would be transferred to up to three subservicers who would subservice under Ocwen’s oversight. If such a subservicing arrangement were established, Ocwen would receive an oversight fee and reimbursement of expenses. We may also agree on alternative arrangements that are not contemplated under our existing agreements or that are variations of those contemplated under our existing agreements.
F-43
PMC Transactions
On December 28, 2016, PMC entered into an agreement to sell substantially all of its MSRs, and the related servicing advances, to NRM (the 2016 PMC Sale Agreement). In connection with this agreement, on December 28, 2016, PMC also entered into a subservicing agreement with NRZ, which was subsequently amended and restated as of March 29, 2019 (together with the 2016 PMC Sale Agreement, the PMC MSR Agreements). The PMC subservicing agreement has an initial term of
three years
from the initial transaction date of June 16, 2017, subject to certain transfer and termination provisions.
The PMC subservicing agreement generates revenue based on a schedule of fees per loan per month that includes revenue adjustments for delinquent loans to cover the incremental cost associated with servicing such loans. As of
December 31, 2019
, Ocwen serviced
278,909
loans (with a UPB of
$35.5 billion
) under this arrangement, excluding loans added by NRZ in 2019, and recorded servicing fee revenues for 2019 and 2018 of
$28.8 million
and
$7.4 million
, respectively. In addition to the
$35.5 billion
in UPB of loans in the PMC subservicing agreement for which the MSR sale transaction did not achieve sale accounting treatment, PMC is also subservicing loans with approximately
$6.6 billion
in UPB at December 31, 2019 that NRZ added to the PMC subservicing agreement after NRZ acquired the MSRs from an unrelated party during 2019. Consistent with a subservicing relationship, no MSR or pledged MSR liability is recorded on our consolidated balance sheets for the
$6.6 billion
loan UPB.
Through its acquisition of PHH on October 4, 2018, Ocwen added MSRs with
$42.3 billion
UPB related to the 2016 PMC Sale Agreement. As of
December 31, 2019
,
$2.7 billion
UPB of MSRs and related advances remain to be sold to NRZ under this agreement. Ocwen and NRZ are in discussions regarding the disposition of these remaining assets.
Subject to the payment of the applicable deboarding fee and proper notice, NRZ has the right to terminate an amount not to exceed
25%
of the underlying mortgage loans (not including loans added by NRZ in 2019) being subserviced during the period from June 2019 through the end of the initial term in June 2020. The PMC subservicing agreement automatically renews for successive
one
-year terms unless either party provides notice of non-renewal in accordance with the PMC subservicing agreement, which is
180
days’ notice in the case of NRZ and
nine
months’ notice in the case of PMC. NRZ and PMC each also has the right to terminate the PMC subservicing agreement after the initial term without cause subject to
180
days’ notice in the case of NRZ and
nine
months’ notice in the case of PMC and, if NRZ elects to terminate, NRZ’s payment of deboarding fees. NRZ and PMC each has the ability to terminate the subservicing agreement for cause if certain specified conditions occur.
On February 20, 2020, we received a notice of termination from NRZ with respect to the subservicing agreement between NRZ and PMC, which accounted for
20%
of our servicing portfolio UPB at December 31, 2019. See
Note 28 — Subsequent Events
.
Note 11 — Receivables
|
December 31,
|
|||||||
|
|
2019
|
2018
|
|||||
|
Servicing-related receivables:
|
|
|
|||||
|
Government-insured loan claims
|
$
|
122,557
|
|
$
|
105,258
|
|
|
|
Due from custodial accounts
|
27,175
|
|
9,060
|
|
|||
|
Due from NRZ:
|
|||||||
|
Sales and transfers of MSRs
|
24,167
|
|
23,757
|
|
|||
|
Advance funding, subservicing fees and reimbursable expenses
|
9,197
|
|
30,845
|
|
|||
|
Reimbursable expenses
|
13,052
|
|
11,508
|
|
|||
|
Other
|
4,970
|
|
7,754
|
|
|||
|
201,118
|
|
188,182
|
|
||||
|
Income taxes receivable
|
37,888
|
|
45,987
|
|
|||
|
Other receivables
|
20,086
|
|
17,672
|
|
|||
|
259,092
|
|
251,841
|
|
||||
|
Allowance for losses
|
(57,872
|
)
|
(53,579
|
)
|
|||
|
|
$
|
201,220
|
|
$
|
198,262
|
|
|
At
December 31, 2019
and
2018
, the allowance for losses related to receivables of our Servicing business. Allowance for losses related to defaulted FHA- or VA-insured loans repurchased from Ginnie Mae guaranteed securitizations and not subsequently sold to third-party investors (government-insured loan claims) was
$56.9 million
and
$52.5 million
at December 2019 and 2018, respectively. This allowance represents management’s estimate of incurred losses and is maintained at a level
F-44
that management considers adequate based upon continuing assessments of collectibility, current trends, and historical loss experience.
|
Allowance for Losses - Government-Insured Loan Claims
|
Years Ended December 31,
|
||||||||||
|
2019
|
2018
|
2017
|
|||||||||
|
Beginning balance
|
$
|
52,497
|
|
$
|
53,340
|
|
$
|
53,258
|
|
||
|
Provision
|
29,034
|
|
37,352
|
|
40,424
|
|
|||||
|
Charge-offs and other, net
|
(24,663
|
)
|
(38,195
|
)
|
(40,342
|
)
|
|||||
|
Ending balance
|
$
|
56,868
|
|
$
|
52,497
|
|
$
|
53,340
|
|
||
Note 12 — Premises and Equipment
|
December 31,
|
|||||||
|
|
2019
|
2018
|
|||||
|
Computer hardware
|
$
|
32,747
|
|
$
|
34,240
|
|
|
|
Operating lease right-of-use assets
|
31,329
|
|
—
|
|
|||
|
Computer software
|
24,377
|
|
46,029
|
|
|||
|
Leasehold improvements
|
22,019
|
|
27,798
|
|
|||
|
Buildings
|
8,550
|
|
9,689
|
|
|||
|
Office equipment
|
6,929
|
|
7,370
|
|
|||
|
Furniture and fixtures
|
3,506
|
|
4,674
|
|
|||
|
Other
|
44
|
|
818
|
|
|||
|
|
129,501
|
|
130,618
|
|
|||
|
Less accumulated depreciation and amortization
|
(91,227
|
)
|
(97,201
|
)
|
|||
|
|
$
|
38,274
|
|
$
|
33,417
|
|
|
Note 13 — Other Assets
|
December 31,
|
|||||||
|
|
2019
|
2018
|
|||||
|
Contingent loan repurchase asset
|
$
|
492,900
|
|
$
|
302,581
|
|
|
|
Other prepaid expenses
|
21,996
|
|
27,647
|
|
|||
|
Prepaid representation, warranty and indemnification claims - Agency MSR sale
|
15,173
|
|
15,173
|
|
|||
|
Prepaid lender fees, net (1)
|
8,647
|
|
6,589
|
|
|||
|
REO
|
8,556
|
|
7,368
|
|
|||
|
Derivatives, at fair value
|
6,007
|
|
4,552
|
|
|||
|
Deferred tax assets, net
|
2,169
|
|
5,289
|
|
|||
|
Security deposits
|
2,163
|
|
2,278
|
|
|||
|
Mortgage-backed securities, at fair value
|
2,075
|
|
1,502
|
|
|||
|
Interest-earning time deposits
|
390
|
|
1,338
|
|
|||
|
Other
|
3,164
|
|
5,250
|
|
|||
|
|
$
|
563,240
|
|
$
|
379,567
|
|
|
|
(1)
|
We amortize these costs to the earlier of the scheduled amortization date, contractual maturity date or prepayment date of the debt.
|
F-45
Note 14 — Borrowings
|
Match Funded Liabilities
|
December 31, 2019
|
December 31, 2018
|
||||||||||||||||||||
|
Borrowing Type
|
Maturity (1)
|
Amorti-zation Date (1)
|
Available Borrowing Capacity (2)
|
Weighted Average Interest Rate (3)
|
Balance
|
Weighted Average Interest Rate (3)
|
Balance
|
|||||||||||||||
|
Advance Financing Facilities
|
||||||||||||||||||||||
|
Advance Receivables Backed Notes - Series 2015-VF5 (4)
|
Dec. 2049
|
Dec. 2020
|
$
|
9,445
|
|
3.36
|
|
$
|
190,555
|
|
4.06
|
|
$
|
216,559
|
|
|||||||
|
Advance Receivables Backed Notes - Series 2016-T2 (5)
|
Aug. 2049
|
Aug. 2019
|
—
|
|
—
|
|
—
|
|
2.99
|
|
235,000
|
|
||||||||||
|
Advance Receivables Backed Notes, Series 2018-T1 (5)
|
Aug. 2049
|
Aug. 2019
|
—
|
|
—
|
|
—
|
|
3.50
|
|
150,000
|
|
||||||||||
|
Advance Receivables Backed Notes, Series 2018-T2 (5)
|
Aug. 2050
|
Aug. 2020
|
—
|
|
—
|
|
—
|
|
3.81
|
|
150,000
|
|
||||||||||
|
Advance Receivables Backed Notes, Series 2019-T1 (5)
|
Aug. 2050
|
Aug. 2020
|
—
|
|
2.62
|
|
185,000
|
|
—
|
|
—
|
|
||||||||||
|
Advance Receivables Backed Notes, Series 2019-T2 (5)
|
Aug. 2051
|
Aug. 2021
|
—
|
|
2.53
|
|
285,000
|
|
—
|
|
—
|
|
||||||||||
|
Total Ocwen Master Advance Receivables Trust (OMART)
|
9,445
|
|
2.79
|
|
660,555
|
|
3.56
|
|
751,559
|
|
||||||||||||
|
Ocwen Freddie Advance Funding (OFAF
) - Advance Receivables Backed Notes, Series 2015-VF1 (6)
|
Jun. 2050
|
Jun. 2020
|
41,446
|
|
3.53
|
|
18,554
|
|
5.03
|
|
26,725
|
|
||||||||||
|
$
|
50,891
|
|
2.81
|
%
|
$
|
679,109
|
|
3.61
|
%
|
$
|
778,284
|
|
||||||||||
|
(1)
|
The amortization date of our facilities is the date on which the revolving period ends under each advance facility note and repayment of the outstanding balance must begin if the note is not renewed or extended. The maturity date is the date on which all outstanding balances must be repaid. In
all
of our advance facilities, there are multiple notes outstanding. For each note, after the amortization date, all collections that represent the repayment of advances pledged to the facility must be applied ratably to each outstanding amortizing note to reduce the balance and as such the collection of advances allocated to the amortizing note may not be used to fund new advances.
|
|
(2)
|
Borrowing capacity under the OMART and OFAF facilities is available to us provided that we have sufficient eligible collateral to pledge. At
December 31, 2019
,
none
of the available borrowing capacity of our advance financing notes could be used based on the amount of eligible collateral.
|
|
(3)
|
1ML was
1.76%
and
2.50%
at
December 31, 2019
and
2018
, respectively.
|
|
(4)
|
On December 12, 2019, we renewed this facility through December 11, 2020 and borrowing capacity was reduced from
$225.0 million
to
$200.0 million
, with interest computed based on the lender’s cost of funds plus a margin. At
December 31, 2019
, the weighted average interest margin was
136
bps.
|
|
(5)
|
On August 14, 2019, we issued two fixed-rate term notes of
$185.0 million
(Series 2019 T-1) and
$285.0 million
(Series 2019-T2) with amortization dates of August 17, 2020 and August 16, 2021, respectively, for a total combined borrowing capacity of
$470.0 million
. The weighted average rate of the notes at
December 31, 2019
is
2.57%
with rates on the individual classes of notes ranging from
2.42%
to
4.44%
. The Series 2016-T2, 2018-T1 and 2018-T2 fixed-rate term notes were all redeemed on August 15, 2019.
|
|
(6)
|
On June 6, 2019, we renewed this facility through June 5, 2020 and borrowing capacity was reduced from
$65.0 million
to
$60.0 million
with interest computed based on the lender’s cost of funds plus a margin. At
December 31, 2019
, the weighted average interest margin was
157
bps.
|
Pursuant to the 2017 Agreements and New RMSR Agreements, NRZ is obligated to fund new servicing advances with respect to the MSRs underlying the Rights to MSRs. We are dependent upon NRZ for funding the servicing advance obligations for Rights to MSRs where we are the servicer. As the servicer, we are contractually required under our servicing agreements to make certain servicing advances even if NRZ does not perform its contractual obligations to fund those advances. NRZ currently uses advance financing facilities in order to fund a substantial portion of the servicing advances that they are contractually obligated to purchase pursuant to our agreements with them. As of
December 31, 2019
, we were the servicer of Rights to MSRs sold to NRZ pertaining to
$18.5 billion
in UPB, which excludes those Rights to MSRs where legal title has transferred to NRZ. NRZ’s associated outstanding servicing advances as of such date were approximately
$704.2 million
. Should NRZ’s advance financing facilities fail to perform as envisaged or should NRZ otherwise be unable to meet its advance funding obligations, our liquidity, financial condition, result of operations and business could be materially and adversely affected. As the servicer, we are contractually required under our servicing agreements to make certain servicing advances even if NRZ does not perform its contractual obligations to fund those advances. See
Note 10 — Rights to MSRs
for additional information.
F-46
In addition, although we are not an obligor or guarantor under NRZ’s advance financing facilities, we are a party to certain of the facility documents as the servicer of the underlying loans on which advances are being financed. As the servicer, we make certain representations, warranties and covenants, including representations and warranties in connection with advances subsequently sold to, or reimbursed by, NRZ.
|
Financing Liabilities
|
Outstanding Balance at December 31,
|
|||||||||||||
|
Borrowing Type
|
Collateral
|
Interest Rate
|
Maturity
|
2019
|
2018
|
|||||||||
|
HMBS-Related Borrowings, at fair value (1)
|
Loans held for investment
|
1ML + 260 bps
|
(1)
|
$
|
6,063,435
|
|
$
|
5,380,448
|
|
|||||
|
Other Financing Liabilities
|
||||||||||||||
|
MSRs pledged (Rights to MSRs), at fair value:
|
||||||||||||||
|
Original Rights to MSRs Agreements
|
MSRs
|
(2)
|
(2)
|
603,046
|
|
436,511
|
|
|||||||
|
2017 Agreements and New RMSR Agreements
|
MSRs
|
(3)
|
(3)
|
35,445
|
|
138,854
|
|
|||||||
|
PMC MSR Agreements
|
MSRs
|
(4)
|
(4)
|
312,102
|
|
457,491
|
|
|||||||
|
950,593
|
|
1,032,856
|
|
|||||||||||
|
Financing liability - Owed to securitization investors, at fair value:
|
||||||||||||||
|
IndyMac Mortgage Loan Trust (INDX 2004-AR11) (5)
|
Loans held for investment
|
(5)
|
(5)
|
9,794
|
|
11,012
|
|
|||||||
|
Residential Asset Securitization Trust 2003-A11 (RAST 2003-A11) (5)
|
Loans held for investment
|
(5)
|
(5)
|
12,208
|
|
13,803
|
|
|||||||
|
22,002
|
|
24,815
|
|
|||||||||||
|
Advances pledged (6)
|
Advances on loans
|
(6)
|
—
|
|
4,419
|
|
||||||||
|
Total Other financing liabilities
|
972,595
|
|
1,062,090
|
|
||||||||||
|
$
|
7,036,030
|
|
$
|
6,442,538
|
|
|||||||||
|
(1)
|
Represents amounts due to the holders of beneficial interests in Ginnie Mae guaranteed HMBS which did not qualify for sale accounting treatment of HECM loans. Under this accounting treatment, the HECM loans securitized with Ginnie Mae remain on our consolidated balance sheet and the proceeds from the sale are recognized as a secured liability. The beneficial interests have no maturity dates, and the borrowings mature as the related loans are repaid. We elected to record the HMBS-related borrowings at fair value consistent with the related HECM loans. Changes in fair value are reported within Reverse mortgage revenue, net.
|
|
(2)
|
This pledged MSR liability is recognized due to the accounting treatment of MSR sale transactions with NRZ which did not qualify as sales for accounting purposes. Under this accounting treatment, the MSRs transferred to NRZ remain on the consolidated balance sheet and the proceeds from the sale are recognized as a secured liability. This financing liability has no contractual maturity or repayment schedule. We elected to record the liability at fair value consistent with the related MSRs. The balance of the liability is adjusted each reporting period to its fair value based on the present value of the estimated future cash flows underlying the related MSRs. Changes in fair value are reported within Pledged MSR liability expense, and are offset by corresponding changes in fair value of the MSR pledged to NRZ within MSR valuation adjustments, net.
|
|
(3)
|
This financing liability arose in connection with lump sum payments of
$54.6 million
received upon transfer of legal title of the MSRs related to the Rights to MSRs transactions to NRZ in September 2017. In connection with the execution of the New RMSR Agreements in January 2018, we received a lump sum payment of
$279.6 million
as compensation for foregoing certain payments under the Original Rights to MSRs Agreements. The balance of the liability is adjusted each reporting period to its fair value based on the present value of the estimated future cash flows. The expected maturity of the liability is April 30, 2020, the date through which we were scheduled to be the servicer on loans underlying the Rights to MSRs per the Original Rights to MSRs Agreements.
|
|
(4)
|
Represents a liability for sales of MSRs to NRZ which did not qualify for sale accounting treatment and are accounted for as a secured borrowing which we assumed in connection with the acquisition of PHH. Under this accounting treatment, the MSRs transferred to NRZ remain on the consolidated balance sheet and the proceeds from the sale are recognized as a secured liability. We elected to record the liability at fair value consistent with the related MSRs.
|
|
(5)
|
Consists of securitization debt certificates due to third parties that represent beneficial interests in trusts that we include in our consolidated financial statements, as more fully described in
Note 4 — Securitizations and Variable Interest Entities
. The holders of these certificates have no recourse against the assets of Ocwen. The certificates in the INDX 2004-AR11 Trust pay interest based on variable rates which are generally based on weighted average net mortgage rates and which range between
3.39%
and
3.85%
at
|
F-47
December 31, 2019
. The certificates in the RAST 2003-A11 Trust pay interest based on fixed rates ranging between
4.25%
and
5.75%
and a variable rate based on 1ML plus
0.45%
. The maturity of the certificates occurs upon maturity of the loans held by the trust. The remaining loans in the INDX 2004-AR11 Trust and RAST 2003-A11 Trust have maturity dates extending through November 2034 and October 2033, respectively.
|
(6)
|
Certain sales of advances did not qualify for sales accounting treatment and were accounted for as a financing. This financing liability has no contractual maturity. The effective interest rate is based on 1ML plus a margin of
450
bps.
|
|
Other Secured Borrowings
|
Outstanding Balance at December 31,
|
|||||||||||||||||
|
Borrowing Type
|
Collateral
|
Interest Rate
|
Termination / Maturity
|
Available Borrowing Capacity (1)
|
2019
|
2018
|
||||||||||||
|
SSTL (2)
|
(2)
|
1-Month Euro-dollar rate + 500 bps with a Eurodollar floor of 100 bps (2)
|
Dec. 2020
|
$
|
—
|
|
$
|
326,066
|
|
$
|
231,500
|
|
||||||
|
Mortgage loan warehouse facilities
|
||||||||||||||||||
|
Master repurchase agreement (3)
|
Loans held for sale (LHFS)
|
1ML + 195 - 300 bps
|
Sep. 2020
|
8,427
|
|
91,573
|
|
74,693
|
|
|||||||||
|
Participation agreements (4)
|
LHFS
|
N/A
|
Jul. 2019
|
—
|
|
—
|
|
42,331
|
|
|||||||||
|
Mortgage warehouse agreement (5)
|
LHFS (reverse mortgages)
|
1ML + 250 bps; 1ML floor of 350 bps
|
Aug. 2020
|
—
|
|
72,443
|
|
8,009
|
|
|||||||||
|
Master repurchase agreement (6)
|
LHFS (forward and reverse mortgages)
|
1ML + 225 bps forward; 1ML + 275 bps reverse
|
Dec. 2020
|
60,773
|
|
139,227
|
|
30,680
|
|
|||||||||
|
Master repurchase agreement (7)
|
LHFS (reverse mortgages)
|
Prime - 0.25% (3.75% floor)
|
Jan. 2020
|
—
|
|
898
|
|
—
|
|
|||||||||
|
Master repurchase agreement (8)
|
N/A
|
1ML + 170 bps
|
N/A
|
—
|
|
—
|
|
—
|
|
|||||||||
|
Participation agreement (9)
|
LHFS
|
(9)
|
Feb. 2020
|
—
|
|
17,304
|
|
—
|
|
|||||||||
|
Mortgage warehouse agreement (10)
|
LHFS (reverse mortgages)
|
1ML + 350 bps; 1ML floor of 525 bps
|
Dec. 2020
|
39,220
|
|
10,780
|
|
—
|
|
|||||||||
|
108,420
|
|
332,225
|
|
155,713
|
|
|||||||||||||
F-48
|
Other Secured Borrowings
|
Outstanding Balance at December 31,
|
|||||||||||||||||
|
Borrowing Type
|
Collateral
|
Interest Rate
|
Termination / Maturity
|
Available Borrowing Capacity (1)
|
2019
|
2018
|
||||||||||||
|
Agency MSR financing facility (11)
|
MSRs
|
1ML + 300 bps
|
Jun. 2020
|
152,294
|
|
147,706
|
|
—
|
|
|||||||||
|
Ginnie Mae MSR financing facility (12)
|
MSRs
|
1ML + 395 bps
|
Nov. 2021
|
27,680
|
|
72,320
|
|
—
|
|
|||||||||
|
Ocwen Excess Spread-Collateralized Notes, Series 2019-PLS1 (13)
|
MSRs
|
5.07%
|
Nov. 2024
|
—
|
|
94,395
|
|
—
|
|
|||||||||
|
Ocwen Asset Servicing Income Series Notes, Series 2014-1 (14)
|
MSRs
|
(14)
|
Feb. 2028
|
—
|
|
57,594
|
|
65,523
|
|
|||||||||
|
179,974
|
|
372,015
|
|
65,523
|
|
|||||||||||||
|
$
|
288,394
|
|
1,030,306
|
|
452,736
|
|
||||||||||||
|
Unamortized debt issuance costs - SSTL and PLS Notes
|
(3,381
|
)
|
(3,098
|
)
|
||||||||||||||
|
Discount - SSTL
|
(1,134
|
)
|
(1,577
|
)
|
||||||||||||||
|
|
|
$
|
1,025,791
|
|
$
|
448,061
|
|
|||||||||||
|
Weighted average interest rate
|
4.74
|
%
|
4.70
|
%
|
||||||||||||||
|
(1)
|
Available borrowing capacity for our mortgage loan warehouse facilities does not consider the amount of the facility that the lender has extended on an uncommitted basis. Of the borrowing capacity extended on a committed basis,
none
of the available borrowing capacity could be used at
December 31, 2019
based on the amount of eligible collateral that could be pledged.
|
|
(2)
|
On March 18, 2019, we entered into a Joinder and Amendment Agreement which amends the existing Amended and Restated SSTL Facility Agreement dated December 5, 2016 to provide an additional term loan of
$120.0 million
subject to the same maturity, interest rate and other material terms of existing borrowings under the SSTL. Effective with this amendment, the quarterly principal payment increased from
$4.2 million
to
$6.4 million
beginning March 31, 2019. See information regarding collateral in the table below.
|
Borrowings bear interest, at the election of Ocwen, at a rate per annum equal to either (a) the base rate (the greatest of (i)
the prime rate in effect on such day
, (ii)
the federal funds rate in effect on such day
plus
0.50%
and (iii)
1ML
, plus a margin of
4.00%
and subject to a base rate floor of
2.00%
or (b)
1ML
, plus a margin of
5.00%
and subject to a 1ML floor of
1.00%
. To date we have elected option (b) to determine the interest rate.
On January 27, 2020, we prepaid
$126.1 million
of the outstanding balance at December 31, 2019 and executed an additional amendment to the SSTL which reduced the maximum borrowing capacity to
$200.0 million
, extended the maturity date to May 15, 2022, reduced the quarterly principal payment to
$5.0 million
and modified the interest rate. See
Note 28 — Subsequent Events
for additional information.
|
(3)
|
The maximum borrowing under this agreement is
$175.0 million
, of which
$100.0 million
is available on a committed basis and the remainder is available at the discretion of the lender. On September 27, 2019, we renewed this facility through September 25, 2020.
|
|
(4)
|
Effective with the mergers of Homeward Residential, Inc. (Homeward) into PMC in February 2019 and Ocwen Loan Servicing, LLC (OLS) into PMC in June 2019, the participation agreements with total uncommitted borrowing capacity of
$250.0 million
were terminated.
|
|
(5)
|
Under this participation agreement, the lender provides financing for
$100.0 million
on an uncommitted basis. The participation agreement allows the lender to acquire a
100%
beneficial interest in the underlying mortgage loans. The transaction does not qualify for sale accounting treatment and is accounted for as a secured borrowing. On August 13, 2019, we renewed this facility through August 14, 2020.
|
|
(6)
|
On December 6, 2019, we renewed this facility through December 5, 2020. The maximum borrowing under this agreement is
$250.0 million
, of which
$200.0 million
is available on a committed basis and the remainder is available on an uncommitted basis. The agreement allows the lender to acquire a
100%
beneficial interest in the underlying mortgage loans. The transaction does not qualify for sale accounting treatment and is accounted for as a secured borrowing.
|
|
(7)
|
Under this agreement, t
he lender provides financing for up to
$50.0 million
on an uncommitted basis.
This facility expired on January 22, 2020 and was not renewed.
|
|
(8)
|
This agreement was originally entered into by PHH and subsequently assumed by Ocwen in connection with its acquisition of PHH. T
he lender provides financing for up to
$200.0 million
at the discretion of the lender. The agreement has no stated maturity date.
|
|
(9)
|
We entered into a master participation agreement on February 4, 2019 under which the lender will provide
$300.0 million
of borrowing capacity to PMC on an uncommitted basis. The participation agreement allows the lender to acquire a
100%
beneficial interest in the underlying mortgage loans. The transaction does not qualify for sale accounting treatment and is accounted for as a secured borrowing. The lender earns the stated interest rate of the underlying mortgage loans less
25 bps
while the loans are financed under the participation agreement. On January 27, 2020, we renewed this facility through April 3, 2020.
|
F-49
|
(10)
|
On December 26, 2019, PMC entered into a warehouse facility. Under this agreement, t
he lender provides financing for up to
$50.0 million
on a committed basis.
The lender earns the stated interest rate of 1ML plus a margin of
350 bps
.
|
|
(11)
|
On July 1, 2019, PMC entered into a financing facility that is secured by certain Fannie Mae and Freddie Mac MSRs. In connection with this facility, PMC entered into repurchase agreements pursuant to which PMC sold trust certificates representing certain indirect economic interests in the MSRs and agreed to repurchase such trust certificates at a future date at the repurchase price set forth in the repurchase agreements. PMC’s obligations under this facility are secured by a lien on the related MSRs. Ocwen guarantees the obligations of PMC under this facility. The maximum amount which we may borrow pursuant to the repurchase agreements is
$300.0 million
on a committed basis. The lender earns the stated interest rate of 1ML plus a margin of
300 bps
. See
Note 4 — Securitizations and Variable Interest Entities
for additional information.
|
|
(12)
|
On November 26, 2019, PMC entered into a financing facility that is secured by certain Ginnie Mae MSRs. In connection with the facility, PMC entered into a repurchase agreement pursuant to which PMC has sold a participation certificate representing certain economic interests in the Ginnie Mae MSRs and has agreed to repurchase such participation certificate at a future date at the repurchase price set forth in the repurchase agreement. PMC’s obligations under the facility are secured by a lien on the related Ginnie Mae MSRs. Ocwen guarantees the obligations of PMC under the facility. The maximum amount available to be borrowed pursuant to the facility is
$27.7 million
on a committed basis. The lender earns the stated interest rate of 1ML plus a margin of
395 bps
.
|
|
(13)
|
On November 26, 2019, PMC issued the PLS Notes secured by certain of PMC’s MSRs (PLS MSRs) pursuant to a credit agreement. PLS Issuer’s obligations under the facility are secured by a lien on the related PLS MSRs. Ocwen guarantees the obligations of PLS Issuer under the facility. The Class A PLS Notes issued pursuant to the credit agreement have an initial principal amount of
$100.0 million
and amortize in accordance with a pre-determined schedule subject to modification under certain events. The notes have a stated coupon rate of
5.07%
. See
Note 4 — Securitizations and Variable Interest Entities
for additional information.
|
|
(14)
|
OASIS noteholders are entitled to receive a monthly payment equal to the sum of: (a)
21
basis points of the UPB of the reference pool of Freddie Mac mortgages; (b) any termination payment amounts; (c) any excess refinance amounts; and (d) the note redemption amounts, each as defined in the indenture supplement for the notes. Monthly amortization of the liability is estimated using the proportion of monthly projected service fees on the underlying MSRs as a percentage of lifetime projected fees, adjusted for the term of the notes.
|
|
Senior Notes
|
Outstanding Balance at December 31,
|
||||||||||
|
Interest Rate
|
Maturity
|
2019
|
2018
|
||||||||
|
Senior unsecured notes:
|
|||||||||||
|
PHH (1) (2)
|
7.375%
|
Sep. 2019
|
$
|
—
|
|
$
|
97,521
|
|
|||
|
PHH (2)
|
6.375%
|
Aug. 2021
|
21,543
|
|
21,543
|
|
|||||
|
21,543
|
|
119,064
|
|
||||||||
|
Senior secured notes (3)
|
8.375%
|
Nov. 2022
|
291,509
|
|
330,878
|
|
|||||
|
313,052
|
|
449,942
|
|
||||||||
|
Unamortized debt issuance costs
|
(1,470
|
)
|
(2,075
|
)
|
|||||||
|
Fair value adjustments (2)
|
(497
|
)
|
860
|
|
|||||||
|
$
|
311,085
|
|
$
|
448,727
|
|
||||||
|
(1)
|
On September 2, 2019, we redeemed all of the Senior unsecured notes due in September 2019, at a redemption price of
100.0%
of the outstanding principal balance plus accrued and unpaid interest.
|
|
(2)
|
These notes were originally issued by PHH and subsequently assumed by Ocwen in connection with its acquisition of PHH. We recorded the notes at their respective fair values on the date of acquisition, and we are amortizing the resulting fair value purchase accounting adjustments over the remaining term of the notes. We have the option to redeem the notes due in August 2021, in whole or in part, on or after January 1, 2019 at a redemption price equal to
100.0%
of the principal amount plus any accrued and unpaid interest.
|
|
(3)
|
During July and August 2019, we repurchased a total of
$39.4 million
of our
8.375%
Senior secured notes in the open market for a price of
$34.3 million
. We recognized a gain of
$5.1 million
on these repurchases which is reported in Gain on repurchases of senior secured notes in the consolidated statement of operations.
|
At any time, we may redeem all or a part of the
8.375%
Senior secured notes, upon not less than
30
nor more than
60
days’ notice at a specified redemption price, plus accrued and unpaid interest to the date of redemption. We may redeem all or a part of these notes at the redemption prices (expressed as percentages of principal amount) specified in the Indenture. The redemption prices during the twelve-month periods beginning on November 15
th
of each year are as follows:
|
Year
|
Redemption Price
|
||
|
2018
|
106.281
|
%
|
|
|
2019
|
104.188
|
|
|
|
2020
|
102.094
|
|
|
|
2021 and thereafter
|
100.000
|
|
|
F-50
Upon a change of control (as defined in the Indenture), we are required to make an offer to the holders of the
8.375%
Senior secured notes to repurchase all or a portion of each holder’s notes at a purchase price equal to
101.0%
of the principal amount of the notes purchased plus accrued and unpaid interest to the date of purchase.
The Indenture contains certain covenants, including, but not limited to, limitations and restrictions on Ocwen’s ability and the ability of its restricted subsidiaries (including PMC as the surviving entity in the merger with OLS) to (i) incur additional debt or issue preferred stock; (ii) pay dividends or make distributions on or purchase equity interests of Ocwen (iii) repurchase or redeem subordinated debt prior to maturity; (iv) make investments or other restricted payments; (v) create liens on assets to secure debt of PMC or any Guarantor; (vi) sell or transfer assets; (vii) enter into transactions with affiliates; and (viii) enter into mergers, consolidations, or sales of all or substantially all of the assets of Ocwen and its restricted subsidiaries, taken as a whole. As of the date of the Indenture, all of Ocwen’s subsidiaries are restricted subsidiaries. The restrictive covenants set forth in the Indenture are subject to important exceptions and qualifications. Many of the restrictive covenants will be suspended if (i) the Senior Secured Notes achieve an investment grade rating from both Moody’s and S&P and (ii) no default or event of default has occurred and is continuing under the Indenture. Covenants that are suspended as a result of achieving these ratings will again apply if one or both of Moody’s and S&P withdraws its investment grade rating or downgrades the rating assigned to the Senior Secured Notes below an investment grade rating.
Credit Ratings
Credit ratings are intended to be an indicator of the creditworthiness of a company’s debt obligation. At
December 31, 2019
, the S&P issuer credit rating for Ocwen was “B-”. On June 1, 2019, OLS, the borrower under the SSTL and
8.375%
Senior secured notes, merged with PMC which became the successor obligor for these borrowings. As a result, on July 3, 2019, S&P withdrew the ratings of OLS and assigned a B- issuer credit rating with Negative outlook to PMC. On January 27, 2020 S&P upgraded the outlook for the issuer rating from Negative to Stable simultaneously with the closing of the SSTL transaction. On September 11, 2019 Moody’s withdrew the Caa1 corporate family rating of Ocwen as it no longer maintained any rated debt outstanding and issued a corporate family rating of Caa1 with negative outlook to PMC. It is possible that additional actions by credit rating agencies could have a material adverse impact on our liquidity and funding position, including materially changing the terms on which we may be able to borrow money.
Covenants
Under the terms of our debt agreements, we are subject to various qualitative and quantitative covenants. Collectively, these covenants include:
|
•
|
Financial covenants;
|
|
•
|
Covenants to operate in material compliance with applicable laws;
|
|
•
|
Restrictions on our ability to engage in various activities, including but not limited to incurring additional forms of debt, paying dividends or making distributions on or purchasing equity interests of Ocwen, repurchasing or redeeming capital stock or junior capital, repurchasing or redeeming subordinated debt prior to maturity, issuing preferred stock, selling or transferring assets or making loans or investments or acquisitions or other restricted payments, entering into mergers or consolidations or sales of all or substantially all of the assets of Ocwen and its subsidiaries, creating liens on assets to secure debt of any guarantor, entering into transactions with affiliates;
|
|
•
|
Monitoring and reporting of various specified transactions or events, including specific reporting on defined events affecting collateral underlying certain debt agreements; and
|
|
•
|
Requirements to provide audited financial statements within specified timeframes, including requirements that Ocwen’s financial statements and the related audit report be unqualified as to going concern.
|
Many of the restrictive covenants arising from the indenture for the Senior Secured Notes will be suspended if the Senior Secured Notes achieve an investment-grade rating from both Moody’s and S&P and if no default or event of default has occurred and is continuing.
Financial covenants in certain of our debt agreements require that we maintain, among other things:
|
•
|
a
40%
loan to collateral value ratio (i.e., the ratio of total outstanding loans under the SSTL to certain collateral and other assets as defined under the SSTL) as of the last date of any fiscal quarter; and
|
|
•
|
specified levels of tangible net worth and liquidity at the consolidated Ocwen level.
|
Certain new financial covenants were added as part of the amendment and extension of our SSTL which closed on January 27, 2020. These include i) maintain a minimum unencumbered asset coverage ratio (i.e., the ratio of unrestricted cash and certain first priority perfected collateral to total outstanding loans under the SSTL) as of the last day of any fiscal quarter of
200%
increasing to
225%
after December 31, 2020 and ii) maintain minimum unrestricted cash of
$125.0 million
as of the last day of each fiscal quarter.
F-51
As of
December 31, 2019
, the most restrictive consolidated tangible net worth requirements contained in our debt agreements were for a minimum of
$200.0 million
in consolidated tangible net worth, as defined, under certain of our match funded debt, MSR financing facilities and mortgage warehouse agreements. The most restrictive liquidity requirements were for a minimum of
$100.0 million
in consolidated liquidity, as defined, under certain of our match funded debt and mortgage warehouse agreements.
As a result of the covenants to which we are subject, we may be limited in the manner in which we conduct our business and may be limited in our ability to engage in favorable business and investment activities or raise certain types of capital to finance future operations or satisfy future liquidity needs. In addition, breaches or events that may result in a default under our debt agreements include, among other things, nonpayment of principal or interest, noncompliance with our covenants, breach of representations, the occurrence of a material adverse change, insolvency, bankruptcy, certain material judgments and changes of control.
Covenants and default provisions of this type are commonly found in debt agreements such as ours. Certain of these covenants and default provisions are open to subjective interpretation and, if our interpretation was contested by a lender, a court may ultimately be required to determine compliance or lack thereof. In addition, our debt agreements generally include cross default provisions such that a default under one agreement could trigger defaults under other agreements. If we fail to comply with our debt agreements and are unable to avoid, remedy or secure a waiver of any resulting default, we may be subject to adverse action by our lenders, including termination of further funding, acceleration of outstanding obligations, enforcement of liens against the assets securing or otherwise supporting our obligations and other legal remedies. Our lenders can waive their contractual rights in the event of a default.
We believe we were in compliance with all of the qualitative and quantitative covenants in our debt agreements as of the date of these financial statements.
Collateral
Our assets held as collateral related to secured borrowings, committed under sale or other contractual obligations and which may be subject to secured liens under the SSTL and Senior Secured Notes are as follows at
December 31, 2019
:
|
Collateral for Secured Borrowings
|
|||||||||||||||||||||||
|
Total Assets
|
Match Funded Liabilities
|
Financing Liabilities
|
Mortgage Loan Warehouse/MSR Facilities
|
Sales and Other Commitments (1)
|
Other (2)
|
||||||||||||||||||
|
Cash
|
$
|
428,339
|
|
$
|
—
|
|
$
|
—
|
|
$
|
—
|
|
$
|
—
|
|
$
|
428,339
|
|
|||||
|
Restricted cash
|
64,001
|
|
17,332
|
|
—
|
|
5,944
|
|
40,725
|
|
—
|
|
|||||||||||
|
MSRs (3)
|
1,486,395
|
|
—
|
|
915,148
|
|
575,471
|
|
—
|
|
525
|
|
|||||||||||
|
Advances, net
|
254,533
|
|
—
|
|
—
|
|
—
|
|
28,737
|
|
225,796
|
|
|||||||||||
|
Match funded assets
|
801,990
|
|
801,990
|
|
—
|
|
—
|
|
—
|
|
—
|
|
|||||||||||
|
Loans held for sale
|
275,269
|
|
—
|
|
—
|
|
236,517
|
|
—
|
|
38,752
|
|
|||||||||||
|
Loans held for investment
|
6,292,938
|
|
—
|
|
6,144,275
|
|
115,130
|
|
—
|
|
33,533
|
|
|||||||||||
|
Receivables, net
|
201,220
|
|
—
|
|
—
|
|
24,795
|
|
—
|
|
176,425
|
|
|||||||||||
|
Premises and equipment, net
|
38,274
|
|
—
|
|
—
|
|
—
|
|
—
|
|
38,274
|
|
|||||||||||
|
Other assets
|
563,240
|
|
—
|
|
—
|
|
5,285
|
|
510,236
|
|
47,719
|
|
|||||||||||
|
Total Assets
|
$
|
10,406,199
|
|
$
|
819,322
|
|
$
|
7,059,423
|
|
$
|
963,142
|
|
$
|
579,698
|
|
$
|
989,363
|
|
|||||
|
(1)
|
Sales and Other Commitments include MSRs and related advances committed under sale agreements, Restricted cash and deposits held as collateral to support certain contractual obligations, and Contingent loan repurchase assets related to the Ginnie Mae EBO program for which a corresponding liability is recognized in Other liabilities.
|
|
(2)
|
The borrowings under the SSTL are secured by a first priority security interest in substantially all of the assets of Ocwen, PHH, PMC and the other guarantors thereunder, excluding among other things, 35% of the voting capital stock of foreign subsidiaries, securitization assets and equity interests of securitization entities, assets securing permitted funding indebtedness and non-recourse indebtedness, REO assets, as well as other customary carve-outs (collectively, the Collateral). The Collateral is subject to certain permitted liens set forth under the SSTL and related security agreement. The Senior Secured Notes are guaranteed by Ocwen and the other guarantors that guarantee the SSTL, and the borrowings under the Senior Secured Notes are secured by a second priority security interest in the Collateral. Assets securing borrowings under the SSTL and Senior Secured Notes may include amounts presented in Other as well as certain assets presented in Collateral for Secured Borrowings and Sales and Other Commitments, subject to permitted liens as defined in
|
F-52
the applicable debt documents. The amounts presented here may differ in their calculation and are not intended to represent amounts that may be used in connection with covenants under the applicable debt documents.
|
(3)
|
MSRs pledged as collateral for secured borrowings includes MSRs pledged to NRZ in connection with the Rights to MSRs transactions which are accounted for as secured financings and MSRs securing the financing facilities. Certain MSR cohorts with a negative fair value of
$4.7 million
that would be presented as Other are excluded from the eligible collateral of the facilities and are comprised of
$27.9 million
of negative fair value related to RMBS and
$23.2 million
of positive fair value related to private EBO and PLS MSRs.
|
Maturities of Borrowings and Management’s Plans to Address Maturing Borrowings
Certain of our borrowings mature within one year of the date of issuance of these financial statements. Based on management’s evaluation, we expect to renew, replace or extend all such borrowings to the extent necessary to finance our business on or prior to their respective maturities consistent with our historical experience.
|
Expected Maturity Date (1) (2) (3)
|
|||||||||||||||||||||||||||||||
|
2020
|
2021
|
2022
|
2023
|
2024
|
Thereafter
|
Total
Balance |
Fair
Value |
||||||||||||||||||||||||
|
Match funded liabilities
|
$
|
394,109
|
|
$
|
285,000
|
|
$
|
—
|
|
$
|
—
|
|
$
|
—
|
|
$
|
—
|
|
$
|
679,109
|
|
$
|
679,507
|
|
|||||||
|
Other secured borrowings
|
832,078
|
|
98,971
|
|
41,663
|
|
—
|
|
—
|
|
57,594
|
|
1,030,306
|
|
1,010,789
|
|
|||||||||||||||
|
Senior notes
|
—
|
|
21,543
|
|
291,509
|
|
—
|
|
—
|
|
—
|
|
313,052
|
|
270,022
|
|
|||||||||||||||
|
$
|
1,226,187
|
|
$
|
405,514
|
|
$
|
333,172
|
|
$
|
—
|
|
$
|
—
|
|
$
|
57,594
|
|
$
|
2,022,467
|
|
$
|
1,960,318
|
|
||||||||
|
(1)
|
Amounts are exclusive of any related discount, unamortized debt issuance costs or fair value adjustment.
|
|
(2)
|
For match funded liabilities, the Expected Maturity Date is the date on which the revolving period ends for each advance financing facility note and repayment of the outstanding balance must begin if the note is not renewed or extended.
|
|
(3)
|
Excludes financing liabilities recognized in connection with asset sales transactions accounted for as financings, including
$1.0 billion
recorded in connection with sales of Rights to MSRs and MSRs and
$6.1 billion
recorded in connection with the securitizations of HMBS. These financing liabilities have no contractual maturity and are amortized over the life of the underlying assets.
|
Our MSR financing facilities provide funding based on an advance rate of MSR value that is subject to periodic mark-to-market valuation adjustments. In the normal course, MSR value is expected to decline over time due to runoff of the loan balances in our servicing portfolio. As a result, we anticipate having to repay a portion of our MSR debt over a given time period. The requirements to repay MSR debt including those due to unfavorable fair value adjustment may require us to allocate a substantial amount of our available liquidity or future cash flows to meet these requirements.
F-53
Note 15 — Other Liabilities
|
December 31,
|
|||||||
|
2019
|
2018
|
||||||
|
Contingent loan repurchase liability
|
$
|
492,900
|
|
$
|
302,581
|
|
|
|
Servicing-related obligations
|
88,167
|
|
41,922
|
|
|||
|
Other accrued expenses
|
67,241
|
|
94,835
|
|
|||
|
Due to NRZ - Advance collections and servicing fees
|
63,596
|
|
53,001
|
|
|||
|
Liability for indemnification obligations
|
52,785
|
|
51,574
|
|
|||
|
Lease liability
|
44,488
|
|
—
|
|
|||
|
Checks held for escheat
|
31,959
|
|
20,686
|
|
|||
|
Accrued legal fees and settlements
|
30,663
|
|
62,763
|
|
|||
|
Liability for uncertain tax positions
|
17,197
|
|
13,739
|
|
|||
|
Liability for unfunded pension obligation
|
13,383
|
|
12,683
|
|
|||
|
Accrued interest payable
|
5,964
|
|
7,209
|
|
|||
|
Liability for mortgage insurance contingency
|
6,820
|
|
6,820
|
|
|||
|
Liability for unfunded India gratuity plan
|
5,331
|
|
4,904
|
|
|||
|
Deferred revenue
|
488
|
|
4,441
|
|
|||
|
Derivatives, at fair value
|
100
|
|
4,986
|
|
|||
|
Other
|
21,091
|
|
21,492
|
|
|||
|
$
|
942,173
|
|
$
|
703,636
|
|
||
|
Accrued Legal Fees and Settlements
|
Years Ended December 31,
|
||||||||||
|
2019
|
2018
|
2017
|
|||||||||
|
Beginning balance
|
$
|
62,763
|
|
$
|
51,057
|
|
$
|
93,797
|
|
||
|
Accrual for probable losses (1)
|
3,011
|
|
19,774
|
|
131,113
|
|
|||||
|
Payments (2)
|
(30,356
|
)
|
(12,983
|
)
|
(174,941
|
)
|
|||||
|
Assumed in connection with the acquisition of PHH
|
—
|
|
9,960
|
|
—
|
|
|||||
|
Issuance of common stock in settlement of litigation (3)
|
—
|
|
(5,719
|
)
|
(1,937
|
)
|
|||||
|
Net increase (decrease) in accrued legal fees
|
(4,884
|
)
|
(1,917
|
)
|
482
|
|
|||||
|
Other
|
129
|
|
2,591
|
|
2,543
|
|
|||||
|
Ending balance
|
$
|
30,663
|
|
$
|
62,763
|
|
$
|
51,057
|
|
||
|
(1)
|
Consists of amounts accrued for probable losses in connection with legal and regulatory settlements and judgments. Such amounts are reported in Professional services expense in the consolidated statements of operations.
|
|
(2)
|
Includes cash payments made in connection with resolved legal and regulatory matters.
|
|
(3)
|
See
Note 16 — Equity
for
additional information.
|
Note 16 — Equity
Common Stock
In 2017, Ocwen and NRZ entered into a share purchase agreement pursuant to which Ocwen sold NRZ
6,075,510
shares of newly-issued Ocwen common stock for
$13.9 million
. Ocwen received the sales proceeds from NRZ on July 24, 2017 and issued the shares. The shares have not been registered under the Securities Act of 1933 and were issued and sold in reliance upon the exemption from registration contained in Section 4(a)(2) of the Act and Rule 506(b) promulgated thereunder.
In 2017, Ocwen agreed to issue an aggregate of
2,500,000
shares of common stock in connection with a mediated settlement of litigation. Ocwen issued
625,000
of the shares in December 2017 and the remaining
1,875,000
shares in January 2018. The shares have not been registered under the Securities Act of 1933 and were issued in reliance upon the exemption from registration set forth in Section 3(a)(10) of the Act.
F-54
Accumulated Other Comprehensive Loss
The components of accumulated other comprehensive loss (AOCL), net of income taxes, were as follows:
|
December 31,
|
|||||||
|
|
2019
|
2018
|
|||||
|
Unfunded pension plan obligation, net
|
$
|
6,789
|
|
$
|
3,347
|
|
|
|
Unrealized losses on cash flow hedges, net
|
832
|
|
979
|
|
|||
|
Other
|
(27
|
)
|
(69
|
)
|
|||
|
|
$
|
7,594
|
|
$
|
4,257
|
|
|
Note 17 — Derivative Financial Instruments and Hedging Activities
The following table summarizes derivative activity, including the derivatives used in each of our identified hedging programs. The notional amount of our contracts does not represent our exposure to credit loss. None of the derivatives were designated as a hedge for accounting purposes as of or during the years ended
December 31, 2019
,
2018
and
2017
:
|
Interest Rate Risk
|
|||||||||||||||
|
MSR Hedging
|
IRLCs and Loans Held for Sale
|
Borrowings
|
|||||||||||||
|
|
IRLCs
|
TBA / Forward MBS Trades
|
Forward Trades
|
Interest Rate Caps
|
|||||||||||
|
Notional balance at December 31, 2019
|
$
|
232,566
|
|
$
|
1,200,000
|
|
$
|
60,000
|
|
$
|
27,083
|
|
|||
|
Maturity
|
Jan. 2020 - Mar. 2020
|
Jan. 2020 - Mar. 2020
|
|
Jan. 2020
|
May 2020
|
||||||||||
|
Fair value of derivative assets (liabilities) at:
|
|
|
|
|
|
|
|||||||||
|
December 31, 2019
|
$
|
4,878
|
|
1,121
|
|
$
|
(92
|
)
|
$
|
—
|
|
||||
|
December 31, 2018
|
3,871
|
|
—
|
|
(4,983
|
)
|
678
|
|
|||||||
|
Gains (losses) on derivatives during the years ended:
|
Gain on loans held for sale, net
|
MSR valuation adjustments, net
|
Gain on loans held for sale, net
|
Other, net
|
|||||||||||
|
December 31, 2019
|
$
|
756
|
|
525
|
|
$
|
(2,689
|
)
|
$
|
(358
|
)
|
||||
|
December 31, 2018
|
3,809
|
|
—
|
|
136
|
|
(841
|
)
|
|||||||
We report derivatives at fair value in Other assets or in Other liabilities on our consolidated balance sheets. Derivative instruments are generally entered into as economic hedges against changes in the fair value of a recognized asset or liability and are not designated as hedges for accounting purposes. We report the changes in fair value of such derivative instruments in the same line item in the consolidated statement of operations as the changes in fair value of the related asset or liability. For all other derivative instruments not designated as a hedging instrument, we report changes in fair value in Other, net.
Foreign Currency Exchange Rate Risk
Our operations in India and the Philippines expose us to foreign currency exchange rate risk to the extent that our foreign exchange positions remain unhedged. We have not entered into any forward exchange contracts during the reported periods to hedge against the effect of changes in the value of the India Rupee or Philippine Peso. Foreign currency remeasurement exchange gains (losses) were
$(0.2) million
,
$(3.2) million
and
$1.7 million
during the years ended
December 31, 2019
,
2018
and
2017
, respectively, and are reported in Other, net in the consolidated statements of operations.
Interest Rate Risk
MSR Hedging
MSRs are carried at fair value with changes in fair value being recorded in earnings in the period in which the changes occur. The fair value of MSRs is subject to changes in market interest rates and prepayment speeds, among other factors.
F-55
Beginning in September 2019, management implemented a hedging strategy to partially offset the changes in fair value of our net MSR portfolio to interest rate changes. We define our net MSR portfolio exposure as follows:
|
•
|
our more interest rate-sensitive Agency MSR portfolio,
|
|
•
|
less the Agency MSRs subject to our agreements with NRZ (See
Note 10 — Rights to MSRs
),
|
|
•
|
less the asset value for securitized HECM loans, net of the corresponding HMBS-related borrowings, and
|
|
•
|
less the net value of our held for sale loan portfolio and interest rate lock commitments (pipeline).
|
We determine and monitor daily a hedge coverage based on the duration and interest rate sensitivity measures of our net MSR portfolio exposure, considering market and liquidity conditions. At
December 31, 2019
, our hedging strategy provides for a partial coverage of our net MSR portfolio exposure.
We use forward trades of MBS or Agency TBAs with different banking counterparties as hedging instruments that are not designated as accounting hedges. TBAs, or To-Be-Announced securities are actively traded, forward contracts to purchase or sell Agency MBS on a specific future date. We report changes in fair value of these derivative instruments in MSR valuation adjustments, net in our consolidated statements of operations.
The TBAs are subject to margin requirements. Ocwen may be required to post or may be entitled to receive cash collateral with its counterparties, based on daily value changes of the instruments. Changes in market factors, including interest rates, and our credit rating could require us to post additional cash collateral and could have a material adverse impact on our financial condition and liquidity.
Interest Rate Lock Commitments
A loan commitment binds us (subject to the loan approval process) to fund the loan at the specified rate, regardless of whether interest rates have changed between the commitment date and the loan funding date. As such, outstanding IRLCs are subject to interest rate risk and related price risk during the period from the date of the commitment through the loan funding date or expiration date. The borrower is not obligated to obtain the loan; thus, we are subject to fallout risk related to IRLCs, which is realized if approved borrowers choose not to close on the loans within the terms of the IRLCs. Our interest rate exposure on these derivative loan commitments had previously been economically hedged with freestanding derivatives such as forward contracts. Beginning in September 2019, this exposure is not individually hedged, but rather used as an offset to our MSR exposure and managed as part of our MSR hedging strategy described above.
Loans Held for Sale, at Fair Value
Mortgage loans held for sale that we carry at fair value are subject to interest rate and price risk from the loan funding date until the date the loan is sold into the secondary market. Generally, the fair value of a loan will decline in value when interest rates increase and will rise in value when interest rates decrease. To mitigate this risk, we had previously entered into forward MBS trades to provide an economic hedge against those changes in fair value on mortgage loans held for sale. Forward MBS trades were primarily used to fix the forward sales price that would be realized upon the sale of mortgage loans into the secondary market. Beginning in September 2019, this exposure is not individually hedged, but rather used as an offset to our MSR exposure and managed as part of our MSR hedging strategy described above.
Match Funded Liabilities
When required by our advance financing arrangements, we purchase interest rate caps to minimize future interest rate exposure from increases in the interest on our variable rate debt as a result of increases in the index, such as 1ML, which is used in determining the interest rate on the debt. We currently do not hedge our fixed-rate debt.
Note 18 — Interest Income
|
Years Ended December 31,
|
|||||||||||
|
2019
|
2018
|
2017
|
|||||||||
|
Loans held for sale
|
$
|
14,669
|
|
$
|
10,756
|
|
$
|
11,100
|
|
||
|
Interest earning cash deposits and other
|
2,435
|
|
2,850
|
|
1,796
|
|
|||||
|
Automotive dealer financing notes
|
—
|
|
420
|
|
3,069
|
|
|||||
|
$
|
17,104
|
|
$
|
14,026
|
|
$
|
15,965
|
|
|||
F-56
Note 19 — Interest Expense
|
Years Ended December 31,
|
|||||||||||
|
|
2019
|
2018
|
2017
|
||||||||
|
Senior notes
|
$
|
31,804
|
|
$
|
31,280
|
|
$
|
29,806
|
|
||
|
Match funded liabilities
|
26,902
|
|
31,870
|
|
47,624
|
|
|||||
|
Other secured borrowings
|
46,278
|
|
35,412
|
|
45,099
|
|
|||||
|
Financing liabilities
|
—
|
|
66
|
|
635
|
|
|||||
|
Other
|
9,145
|
|
4,743
|
|
3,763
|
|
|||||
|
|
$
|
114,129
|
|
$
|
103,371
|
|
$
|
126,927
|
|
||
Note 20 — Income Taxes
On December 22, 2017, the U.S. government enacted comprehensive tax legislation commonly referred to as the Tax Cuts and Jobs Act (Tax Act), which made broad and complex changes to the U.S. federal corporate income tax rules. The Tax Act amends the Internal Revenue Code to reduce tax rates, requires companies to pay a one-time transition tax on earnings of certain foreign subsidiaries that were previously tax deferred and creates new taxes on certain foreign-sourced earnings, among other provisions. For businesses, the Tax Act reduced the corporate federal tax rate from a maximum of 35% to a flat 21% rate. The rate reduction took effect on January 1, 2018. The Tax Act significantly changed the taxation of U.S.-based multinational corporations.
The reduction in the statutory U.S. federal rate is expected to positively impact our future U.S. after-tax earnings. However, the ultimate impact is subject to the effect of other complex provisions in the Tax Act (including the BEAT, Global Intangible Low-Taxed Income (GILTI), and revised interest deductibility limitations). The U.S. Treasury Department, the U.S. Internal Revenue Service and state tax authorities have issued and are expected to continue to issue guidance on how the provisions of the Tax Act will be applied or otherwise administered. As regulations and guidance evolve with respect to the Tax Act, the results of newly issued guidance could be adverse and may differ from previous estimates. As such, we are continuing to evaluate the impact of the new U.S. tax legislation, including recently issued regulations on our global tax position.
SAB 118 Measurement Period
We applied the guidance in SAB 118 when accounting for the enactment date effects of the Tax Act in 2017 and throughout 2018. At December 31, 2017, we had not completed our accounting for all of the enactment-date income tax effects of the Tax Act under ASC 740,
Income Taxes
; therefore, we recorded provisional amounts related to the one-time deemed repatriation tax (Transition Tax) liability related to the undistributed earnings of certain foreign subsidiaries that were not previously taxed and adjusted deferred tax assets and liabilities to account for the reduction in the statutory U.S. federal rate. As of December 31, 2018, we had completed our accounting for all of the enactment-date income tax effects of the Tax Act. As further discussed below, during 2018, we recognized adjustments to the provisional amounts recorded at December 31, 2017, which produced changes in the amount of deferred tax assets recorded in the U.S. and USVI jurisdictions. As the net deferred tax assets in these jurisdictions have full valuation allowances, the adjustments to the provisional amounts recorded under SAB 118 did not have an impact on our consolidated statements of financial position or consolidated statements of operations.
One-Time Transition Tax
Under the Tax Act, the transition to a new territorial tax system caused Ocwen to incur a Transition Tax on our total post-1986 undistributed earnings and profits (E&P) of our non-U.S. subsidiaries, the tax on which we previously deferred from U.S. income taxes under U.S. law. The amount of the Transition Tax was dependent upon many factors, including the accumulated E&P of Ocwen’s non-U.S. subsidiaries, our ability and willingness to utilize foreign tax credits and/or net operating loss (NOL) carryforwards, and 2017 taxable income or loss amounts in the U.S. and non-U.S. jurisdictions. We recorded a provisional amount for our one-time Transition Tax liability in our December 31, 2017 financial statements as a reduction to the U.S. federal NOL carryforward of
$16.9 million
. The reduction of the NOL deferred tax asset resulted in an offsetting release of the valuation allowance.
Due to the various factors affecting the calculation, our decision regarding how best to utilize the foreign tax credits and/or NOL carryforwards was subject to change as we continued to wait for further guidance and analyze additional information necessary to finalize the calculations and maximize the long-term value to Ocwen. Upon further analysis of the Tax Act as well as notices and regulations issued and proposed by the U.S. Department of the Treasury and the Internal Revenue Service, we finalized our calculations of the Transition Tax liability in 2018. We increased our December 31, 2017 provisional amount by increasing foreign tax credits by
$19.9 million
and further reducing the U.S. federal NOL carryforward by
$51.7 million
. As the
F-57
net deferred tax asset in the U.S. jurisdiction has a full valuation allowance, the recording of the changes to these deferred tax assets does not have an impact on our consolidated balance sheets or consolidated statements of operations.
Deferred Tax Assets & Liabilities
As a result of the reduction in the corporate income tax rate, we revalued our U.S. and USVI net deferred tax assets at December 31, 2017. In 2017, we recorded a provisional decrease to our net deferred tax assets in the U.S. and USVI jurisdictions of
$36.1 million
and
$26.6 million
, respectively, due to the change in the corporate tax rate. Upon further analysis of certain aspects of the Tax Act as well as notices and regulations issued and proposed by the U.S. Department of the Treasury and the Internal Revenue Service and refinement of our calculations during 2018, we adjusted our provisional amount by recording an increase to our net deferred tax assets in the U.S. and USVI jurisdictions of
$6.0 million
and
$4.6 million
, respectively. This increase resulted in a net decrease to the deferred tax assets in 2018 in the U.S. and USVI jurisdictions of
$30.1 million
and
$22.0 million
, respectively. As the net deferred tax assets in these jurisdictions have full valuation allowances, the revaluation of our net deferred tax assets did not have any impact on our consolidated balance sheets or consolidated statements of operations.
Global Intangible Low-Taxed Income (GILTI)
The Tax Act subjects a U.S. shareholder to tax on GILTI earned by certain foreign subsidiaries. The FASB Staff Q&A, Topic 740, No. 5,
Accounting for Global Intangible Low-Taxed Income
, states that an entity can make an accounting policy election to either recognize deferred taxes for temporary basis differences expected to reverse as GILTI in future years or to provide for the tax expense related to GILTI in the year the tax is incurred as a period expense only. Because we were evaluating the provision of GILTI at December 31, 2017, we recorded no GILTI-related deferred taxes in 2017. After further consideration in 2018, we elected to account for GILTI in the year the tax is incurred.
For income tax purposes, the components of loss from continuing operations before taxes were as follows:
|
Years Ended December 31,
|
|||||||||||
|
|
2019
|
2018
|
2017
|
||||||||
|
Domestic
|
$
|
(93,487
|
)
|
$
|
11,477
|
|
$
|
(75,143
|
)
|
||
|
Foreign
|
(33,004
|
)
|
(82,953
|
)
|
(68,830
|
)
|
|||||
|
|
$
|
(126,491
|
)
|
$
|
(71,476
|
)
|
$
|
(143,973
|
)
|
||
The components of income tax expense (benefit) were as follows:
|
Years Ended December 31,
|
|||||||||||
|
|
2019
|
2018
|
2017
|
||||||||
|
Current:
|
|
|
|
|
|
|
|||||
|
Federal
|
$
|
873
|
|
$
|
(7,670
|
)
|
$
|
(21,859
|
)
|
||
|
State
|
4,460
|
|
356
|
|
(3,938
|
)
|
|||||
|
Foreign
|
7,181
|
|
11,132
|
|
9,550
|
|
|||||
|
|
12,514
|
|
3,818
|
|
(16,247
|
)
|
|||||
|
Deferred:
|
|
|
|
|
|
|
|||||
|
Federal
|
(40,429
|
)
|
23,991
|
|
27,289
|
|
|||||
|
State
|
(914
|
)
|
319
|
|
702
|
|
|||||
|
Foreign
|
11,993
|
|
(4,252
|
)
|
2,719
|
|
|||||
|
Provision for (reversal of) valuation allowance on deferred tax assets
|
32,470
|
|
(23,347
|
)
|
(29,979
|
)
|
|||||
|
|
3,120
|
|
(3,289
|
)
|
731
|
|
|||||
|
Total
|
$
|
15,634
|
|
$
|
529
|
|
$
|
(15,516
|
)
|
||
Ocwen is a global company with operations in the USVI, India and the Philippines, among other jurisdictions. In the effective tax rate reconciliation, we first calculate income tax expense attributable to worldwide continuing operations at the U.S. statutory tax rate. The foreign tax rate differential therefore represents the difference in tax expense between jurisdictional income taxed at the U.S. statutory rate and each respective jurisdictional statutory rate.
F-58
Income tax expense differs from the amounts computed by applying the U.S. Federal corporate income tax rate as follows:
|
Years Ended December 31,
|
|||||||||||
|
|
2019
|
2018
|
2017
|
||||||||
|
Expected income tax expense (benefit) at statutory rate (1)
|
$
|
(26,563
|
)
|
$
|
(15,010
|
)
|
$
|
(50,391
|
)
|
||
|
Differences between expected and actual income tax expense (2):
|
|
|
|
|
|
|
|||||
|
Bargain purchase gain disallowance
|
80
|
|
(13,448
|
)
|
—
|
|
|||||
|
Revaluation of deferred tax assets related to legal entity mergers
|
(25,509
|
)
|
—
|
|
—
|
|
|||||
|
Reduction in tax attributes for Section 382 & 383 limitations
|
—
|
|
55,668
|
|
—
|
|
|||||
|
U.S. Tax Reform - Change in Federal rate
|
—
|
|
(10,666
|
)
|
62,758
|
|
|||||
|
U.S. Tax Reform - Transition Tax
|
—
|
|
14,412
|
|
34,846
|
|
|||||
|
U.S. Tax Reform - BEAT Tax
|
(555
|
)
|
1,076
|
|
—
|
|
|||||
|
U.S. Tax Reform - GILTI inclusion
|
11,859
|
|
—
|
|
—
|
|
|||||
|
Foreign tax differential including effectively connected income (3)
|
15,979
|
|
22,990
|
|
(12,140
|
)
|
|||||
|
Provision for (reversal of) liability for uncertain tax positions
|
4,198
|
|
(3,987
|
)
|
(16,925
|
)
|
|||||
|
Provision for (reversal of) valuation allowance on deferred tax assets (4)
|
32,470
|
|
(23,347
|
)
|
(29,979
|
)
|
|||||
|
Provision for liability for intra-entity transactions (5)
|
—
|
|
—
|
|
2,484
|
|
|||||
|
State tax, after Federal tax benefit
|
(784
|
)
|
675
|
|
(3,938
|
)
|
|||||
|
Excess tax benefits from share-based compensation
|
381
|
|
(356
|
)
|
(3,701
|
)
|
|||||
|
Other permanent differences
|
66
|
|
122
|
|
(267
|
)
|
|||||
|
Foreign tax credit (generation) utilization
|
263
|
|
(25,601
|
)
|
—
|
|
|||||
|
Executive compensation disallowance
|
1,344
|
|
959
|
|
221
|
|
|||||
|
Subpart F income
|
—
|
|
3,222
|
|
2,824
|
|
|||||
|
Other provision to return differences
|
1,242
|
|
(6,559
|
)
|
221
|
|
|||||
|
Other
|
1,163
|
|
379
|
|
(1,529
|
)
|
|||||
|
Actual income tax expense (benefit)
|
$
|
15,634
|
|
$
|
529
|
|
$
|
(15,516
|
)
|
||
|
(1)
|
The U.S. Federal corporate income tax rate is 21% beginning January 1, 2018 and was 35% until December 31, 2017.
|
|
(2)
|
ASC 740-10-50 and SEC Regulation S-X, Rule 4-08(h) require the disclosure of significant reconciling items in the effective tax rate reconciliation schedule. We have prepared the 2019 effective tax rate reconciliation consistent with prior years, taking into account the materiality of reconciling items, comparability with prior years and the usefulness of the information.
|
|
(3)
|
The foreign tax differential includes expense recognized in
2019
and a benefit recognized in
2018
and
2017
for taxable income or losses earned by Ocwen Mortgage Servicing, Inc. (OMS) prior to the merger of OMS into OVIS in 2019 as disclosed below, which are taxable in the U.S. as effectively connected income (ECI). The impact of ECI to income tax expense (benefit) for
2019
,
2018
and
2017
was
$2.6 million
,
$(3.3) million
and
$(28.5) million
, respectively.
|
|
(4)
|
The benefit recorded for the provision for valuation allowance in 2017 relates primarily to the reduction in the valuation allowance necessary as a result of revaluing our deferred tax assets due to U.S. tax reform and the reduction in the corporate tax rate. This benefit is partially offset by an increase in valuation allowance necessary for current year losses.
|
|
(5)
|
ASU 2016-16 requires an entity to recognize the income tax consequences of intra-entity transfers of assets other than inventory when the transfer occurs. Previously, recognition of current and deferred income taxes for an intra-entity transfer was prohibited until the asset had been sold to an outside party. We adopted this standard on a modified retrospective basis on January 1, 2018 by recording a cumulative-effect reduction of
$5.6 million
to retained earnings.
|
F-59
Net deferred tax assets were comprised of the following:
|
December 31,
|
|||||||
|
|
2019
|
2018
|
|||||
|
Deferred tax assets
|
|
|
|
|
|||
|
Net operating loss carryforwards - federal and foreign
|
$
|
64,817
|
|
$
|
31,587
|
|
|
|
Net operating loss carryforwards and credits - state and local
|
70,254
|
|
—
|
|
|||
|
Reserve for servicing exposure
|
7,711
|
|
10,331
|
|
|||
|
Accrued other liabilities
|
6,377
|
|
8,966
|
|
|||
|
Foreign deferred assets
|
3,620
|
|
7,142
|
|
|||
|
Partnership losses
|
7,029
|
|
6,681
|
|
|||
|
Stock-based compensation expense
|
5,297
|
|
5,610
|
|
|||
|
Interest expense disallowance
|
12,423
|
|
4,773
|
|
|||
|
Intangible asset amortization
|
4,946
|
|
4,579
|
|
|||
|
Accrued incentive compensation
|
5,063
|
|
4,527
|
|
|||
|
Accrued legal settlements
|
6,028
|
|
4,350
|
|
|||
|
Bad debt and allowance for loan losses
|
2,530
|
|
3,498
|
|
|||
|
Tax residuals and deferred income on tax residuals
|
2,885
|
|
2,905
|
|
|||
|
Foreign tax credit
|
94
|
|
357
|
|
|||
|
Lease liabilities
|
5,459
|
|
580
|
|
|||
|
Deferred income
|
8,493
|
|
—
|
|
|||
|
Other
|
8,708
|
|
8,252
|
|
|||
|
221,734
|
|
104,138
|
|
||||
|
Deferred tax liabilities
|
|
|
|
|
|||
|
Mortgage servicing rights amortization
|
16,358
|
|
27,860
|
|
|||
|
Foreign undistributed earnings
|
1,615
|
|
2,059
|
|
|||
|
Other
|
1,151
|
|
804
|
|
|||
|
19,124
|
|
30,723
|
|
||||
|
202,610
|
|
73,415
|
|
||||
|
Valuation allowance
|
(200,441
|
)
|
(68,126
|
)
|
|||
|
Deferred tax assets, net
|
$
|
2,169
|
|
$
|
5,289
|
|
|
As of
December 31, 2019
, we had a deferred tax asset, net of deferred tax liability, including
$199.5 million
in the U.S.
Valuation Allowances
We conduct periodic evaluations of positive and negative evidence to determine whether it is more likely than not that the deferred tax asset can be realized in future periods. In these evaluations, we gave more significant weight to objective evidence, such as our actual financial condition and historical results of operations, as compared to subjective evidence, such as projections of future taxable income or losses. Both the U.S. and USVI jurisdictions are in a three-year cumulative loss position as of
December 31, 2019
. Other factors considered in these evaluations are estimates of future taxable income, future reversals of temporary differences, taxable income in prior carryback years, tax character and the impact of tax planning strategies that may be implemented, if warranted.
As a result of these evaluations, we recorded a valuation allowance of
$199.5 million
and
$46.3 million
on our U.S. net deferred tax assets at
December 31, 2019
and
2018
, respectively, and a valuation allowance of
$0.4 million
and
$21.3 million
on our USVI net deferred tax assets at
December 31, 2019
and
2018
, respectively. These U.S. and USVI jurisdictional deferred tax assets are not considered to be more likely than not realizable based on all available positive and negative evidence. We intend to continue maintaining a full valuation allowance on our deferred tax assets in both the U.S. and USVI until there is sufficient evidence to support the reversal of all or some portion of these allowances.
Net Operating Loss Carryforwards
At
December 31, 2019
, we had U.S. NOL carryforwards of
$306.5 million
. In addition to our historic NOL carryforwards, this amount includes U.S. NOL carryforwards of
$125.7 million
acquired in connection with the acquisition of PHH. At December 31, 2019, we had state NOL and tax credit carryforwards valued at
$70.3 million
, including state NOLs and tax
F-60
credits acquired in connection with the acquisition of PHH of
$54.3 million
. All of the acquired tax attributes were fully offset by a valuation allowance.
These U.S. federal and state NOL carryforwards will expire beginning 2020 through 2039 with U.S. federal NOLs generated after 2017 never expiring. We believe that it is more likely than not that the benefit from certain U.S. federal and state NOL carryforwards will not be realized. In recognition of this risk, we have provided a total valuation allowance of
$64.4 million
and
$70.3 million
on the deferred tax assets relating to the U.S. federal and state NOL carryforwards, respectively. If our assumptions change and we determine we will be able to realize these NOLs, the tax benefits relating to any reversal of the valuation allowance on deferred tax assets as of
December 31, 2019
will be accounted for as a reduction of income tax expense. Additionally,
$334.5 million
of USVI NOLs have been carried back to offset prior period tax due in the USVI and we have, therefore, reflected the tax-effect of this attribute as a
$12.9 million
income taxes receivable. We also have U.S. capital loss carryforwards of
$7.6 million
at
December 31, 2019
against which a valuation allowance has been recorded.
Change of Control: Annual Limitations on Utilization of Tax Attributes
NOL carryforwards may be subject to annual limitations under Internal Revenue Code Section 382 (Section 382) (or comparable provisions of foreign or state law) in the event that certain changes in ownership were to occur. We periodically evaluate our NOL carryforwards and whether certain changes in ownership have occurred that would limit our ability to utilize a portion of our NOL and tax credit carryforwards. If it is determined that an ownership change(s) has occurred, there may be annual limitations on the use of these NOL and tax credit carryforwards under Section 382 (or comparable provisions of foreign or state law).
Generally, a Section 382 ownership change occurs if, over a rolling three-year period, there has been an aggregate increase of
50
percentage points or more in the percentage of our stock owned by one or more “
5
-percent shareholders.” Ownership for Section 382 purposes is determined primarily by an economic test, while the SEC definition of beneficial ownership focuses generally on the right to vote or control disposition of the shares. In general, the Section 382 economic test looks to who has the right to receive dividends paid with respect to shares, and who has the right to receive proceeds from the sale or other disposition of shares. Section 382 also contains certain constructive ownership rules, which generally attribute ownership of stock held by estates, trusts, corporations, partnerships or other entities to the ultimate indirect individual owner of the shares, or to related individuals. Generally, a person’s direct or indirect economic ownership interest in shares (rather than record title, voting control or other factors) is taken into account for Section 382 purposes.
For purposes of determining the existence and identity of, and the amount of stock owned by any shareholder, the Internal Revenue Service permits us to rely on the existence or absence of filings with the SEC of Schedules 13D, 13F and 13G (or similar filings) as of any date, subject to our actual knowledge of the ownership of our common stock. Investors who file a Schedule 13G or Schedule 13D (or list our common stock in their Schedules 13F) may beneficially own
5%
or more of our common stock for SEC reporting purposes but nonetheless may not be Section 382 “
5
-percent shareholders” and therefore their beneficial ownership will not result in a Section 382 ownership change.
We have evaluated whether we experienced an ownership change, as defined under Section 382, and determined that an ownership change did occur in the U.S. jurisdiction in January 2015 and in December 2017, which also results in an ownership change under Section 382 in the USVI jurisdiction. In addition, a Section 382 ownership change occurred at PHH when Ocwen acquired the stock of PHH in October 2018. PHH was a loss corporation as defined under Section 382 at the date of the acquisition. PHH also had an existing Section 382 ownership change on March 31, 2018. For certain states, an additional Section 382 ownership change occurred on August 9, 2017. These Section 382 ownership changes may limit our ability to fully utilize NOLs, tax credit carryforwards, deductions and/or certain built-in losses that existed as of each respective ownership change date in various jurisdictions.
Due to the Section 382 and 383 limitations and the maximum carryforward period for our NOLs and tax credits, we will be unable to fully recognize certain deferred tax assets. Accordingly, as of December 31, 2018, we reduced our gross deferred tax asset related to our U.S. federal and USVI NOLs by
$160.9 million
, our foreign tax credit deferred tax asset by
$29.5 million
, and corresponding valuation allowance by
$55.7 million
. The realization of all or a portion of our remaining deferred income tax assets (including NOLs and tax credits) is dependent upon the generation of future taxable income during the statutory carryforward periods. In addition, the limitation on the utilization of our NOL and tax credit carryforwards could result in Ocwen incurring a current tax liability in future tax years. Our inability to utilize our pre-ownership change NOL carryforwards, any future recognized built-in losses or deductions, and tax credit carryforwards could have an adverse effect on our financial condition, results of operations and cash flows.
As part of our Section 382 evaluation and consistent with the rules provided within Section 382, Ocwen relies strictly on the existence or absence, as well as the information contained in certain publicly available documents (
e.g.
, Schedule 13D, Schedule 13G or other documents filed with the SEC) to identify shareholders that own a 5-percent or greater interest in Ocwen stock throughout the period tested. Further, Ocwen relies on such public filings to identify dates in which such 5-percent shareholders acquired, disposed, or otherwise transacted in Ocwen common stock. As the requirement for filing such notices of
F-61
ownership from the SEC is to report beneficial ownership, as opposed to actual economic ownership of the stock of Ocwen, certain SEC filings may not represent ownership in Ocwen stock that should be considered in determining whether Ocwen experienced an ownership change under the Section 382 rules. Notwithstanding the preceding sentences (regarding Ocwen’ s ability to rely on the existence and absence of information in publicly filed Schedules 13D and 13G), the rules prescribed in Section 382 and the regulations thereunder provide that Ocwen may (but is not required to) seek additional clarification from shareholders filing such Schedules 13D and 13G if there are questions or uncertainty regarding the true economic ownership of shares reported in such filing (whether due to ambiguity in the filing, an overly complex ownership structure, the type of instruments owned and reported in the filings, etc.) (often referred to “actual knowledge” questionnaires). Such information can be sought on a filer by filer basis (
i.e.,
there is no requirement that if actual knowledge is sought with respect to one shareholder, actual knowledge must be sought with respect to all shareholders that filed schedules 13D or 13G). While the seeking of actual knowledge can be beneficial in some instances it may be detrimental in others. Once such actual knowledge is received, Section 382 requires the inclusion of such actual knowledge, even if such inclusion is detrimental to the conclusion reached.
Ocwen has performed its analysis of the rules under Section 382 and, based on all currently available information, identified it experienced an ownership change for Section 382 purposes in January 2015 and December 2017. Prior to 2018, Ocwen was aware of shareholder activity in 2015 and 2017 that may have caused a Section 382 ownership change(s) but determined that additional information could potentially be obtained from certain shareholders that would indicate a Section 382 ownership change had not occurred. In completing this analysis, Ocwen identified several shareholders that filed a schedule 13G during the period disclosing a greater than 5-percent interest in Ocwen stock where beneficial versus economic ownership of the stock was unclear, and Ocwen therefore requested further details. As of the date of this Form 10-K, Ocwen has not received all requested responses from selected shareholders and will continue to consider such shareholders as economic owners of Ocwen’s stock until actual knowledge is otherwise received.
Ocwen is continuing to monitor the ownership in its stock to evaluate information that will become available in 2020 and that may result in a different outcome for Section 382 purposes and our future cash tax obligations. As part of this monitoring, Ocwen periodically evaluates whether it is appropriate and beneficial to retroactively seek actual knowledge on certain previously identified and included 5-percent shareholders, whereby, depending on the responses received, Ocwen may conclude that either the January 2015 or December 2017 Section 382 ownership changes may have instead occurred on a different date, or did not occur at all. As such, our analysis regarding the amount of tax attributes that may be available to offset taxable income in the future without restrictions imposed by Section 382 may continue to evolve.
Uncertain Tax Positions
Our major jurisdiction tax years that remain subject to examination are our U.S. federal tax return for the years ended December 31, 2016 through the present, our USVI corporate tax return for the years ended December 31, 2013 through the present, and our India corporate tax returns for the years ended March 31, 2010 through the present. We are currently under audit in the USVI jurisdiction for tax years 2013 - 2016 due to the carryback of losses generated in 2015 and 2016 to tax years 2013 and 2014, respectively.
A reconciliation of the beginning and ending amounts of the total unrecognized tax benefits for uncertain tax positions, which are included in the Liability for uncertain tax positions in Other liabilities, is as follows:
|
Years Ended December 31,
|
|||||||||||
|
|
2019
|
2018
|
2017
|
||||||||
|
Beginning balance
|
$
|
9,622
|
|
$
|
2,281
|
|
$
|
16,994
|
|
||
|
Additions - PHH acquisition
|
—
|
|
13,108
|
|
—
|
|
|||||
|
Additions for tax positions of current year
|
207
|
|
412
|
|
—
|
|
|||||
|
Additions for tax positions of prior years
|
3,110
|
|
1,354
|
|
2,281
|
|
|||||
|
Reductions for tax positions of prior years
|
—
|
|
(236
|
)
|
—
|
|
|||||
|
Reductions for settlements
|
(1,293
|
)
|
(3,188
|
)
|
(387
|
)
|
|||||
|
Lapses in statute of limitations
|
(1,057
|
)
|
(4,109
|
)
|
(16,607
|
)
|
|||||
|
Ending balance
|
$
|
10,589
|
|
$
|
9,622
|
|
$
|
2,281
|
|
||
We recognized total interest and penalties of
$2.7 million
,
$2.9 million
and
$5.1 million
as income tax expense or benefit in
2019
,
2018
and
2017
, respectively. At
December 31, 2019
and
2018
, accruals for interest and penalties were
$6.6 million
and
$4.1 million
, respectively, and are included in the Liability for uncertain tax positions in Other liabilities. As of
December 31, 2019
and
2018
, we had unrecognized tax benefits for uncertain tax positions, excluding accrued interest and penalties, of
$10.6 million
and
$9.6 million
, respectively, all of which if recognized would affect the effective tax rate.
F-62
It is reasonably possible that there could be a change in the amount of our unrecognized tax benefits within the next
12
months due to activities of the Internal Revenue Service or other taxing authorities, including proposed assessments of additional tax, possible settlement of audit issues, or the expiration of applicable statutes of limitations. We believe that it is reasonably possible that a decrease of up to
$8.8 million
in unrecognized tax benefits may be necessary within the next 12 months.
Undistributed Foreign Earnings and Non-U.S. Jurisdictions
As of
December 31, 2019
, we have recognized a deferred tax liability of
$1.6 million
for foreign subsidiary undistributed earnings. We do not consider our foreign subsidiary undistributed earnings to be indefinitely invested outside the U.S.
OVIS (and formerly OMS) is headquartered in St. Croix, USVI and is located in a federally recognized economic development zone where qualified entities are eligible for certain benefits. We refer to these benefits as “EDC benefits” as they are granted by the USVI Economic Development Commission. We were approved as a Category IIA service business, and are therefore entitled to receive benefits that may have a favorable impact on our effective tax rate. These benefits, among others, enable us to avail ourselves of a credit of
90%
of income taxes on certain qualified income related to our servicing business. The exemption was granted as of October 1, 2012 and is available for a period of
30
years until expiration on September 30, 2042. The EDC benefits had no impact on our current foreign tax benefit in 2019, 2018 and 2017 because we are incurring current losses in the USVI and do not have carryback potential for these losses. As a result, no current benefit can be recognized for these losses.
During 2019, in connection with our acquisition of PHH, overall corporate simplification and cost reduction efforts, we executed a legal entity reorganization whereby OLS, through which we previously conducted a substantial portion of our servicing business, was merged into PHH. OLS was previously the wholly-owned subsidiary of OMS, which was incorporated and headquartered in the USVI prior to its merger with OVIS, an entity which is also organized and headquartered in the USVI. As a result of this reorganization, the majority of our USVI operations and assets were transferred to the U.S. We plan to continue to maintain operations and the EDC Benefits in the USVI until, through and after the reorganization. We expect the reorganization to result in efficiencies and operational cost savings through reduced complexity and a simplification of our global structure.
Note 21 — Basic and Diluted Earnings (Loss) per Share
Basic earnings or loss per share excludes common stock equivalents and is calculated by dividing net income or loss attributable to Ocwen common stockholders by the weighted average number of common shares outstanding during the year. We calculate diluted earnings or loss per share by dividing net income or loss attributable to Ocwen by the weighted average number of common shares outstanding including the potential dilutive common shares related to outstanding stock options and restricted stock awards. For 2019, 2018 and 2017, we have excluded the effect of all stock options and common stock awards from the computation of diluted loss per share because of the anti-dilutive effect of our reported net loss.
|
Years Ended December 31,
|
|||||||||||
|
2019
|
2018
|
2017
|
|||||||||
|
Loss from continuing operations, net of tax attributable to Ocwen common stockholders
|
$
|
(142,125
|
)
|
$
|
(72,181
|
)
|
$
|
(127,966
|
)
|
||
|
Income from discontinued operations, net of tax
|
—
|
|
1,409
|
|
—
|
|
|||||
|
Net loss attributable to Ocwen stockholders
|
$
|
(142,125
|
)
|
$
|
(70,772
|
)
|
$
|
(127,966
|
)
|
||
|
Weighted average shares of common stock outstanding - Basic and Diluted
|
134,444,402
|
|
133,703,359
|
|
127,082,058
|
|
|||||
|
Earnings (loss) per share - Basic and Diluted
|
|||||||||||
|
Continuing operations
|
$
|
(1.06
|
)
|
$
|
(0.54
|
)
|
$
|
(1.01
|
)
|
||
|
Discontinued operations
|
$
|
—
|
|
$
|
0.01
|
|
$
|
—
|
|
||
|
Total attributable to Ocwen stockholders
|
$
|
(1.06
|
)
|
$
|
(0.53
|
)
|
$
|
(1.01
|
)
|
||
|
Stock options and common stock awards excluded from the computation of diluted earnings per share
|
|||||||||||
|
Anti-dilutive (1)
|
3,167,624
|
|
4,989,725
|
|
5,487,164
|
|
|||||
|
Market-based (2)
|
787,204
|
|
670,829
|
|
862,446
|
|
|||||
|
(1)
|
Includes stock options that are anti-dilutive because their exercise price was greater than the average market price of Ocwen’s stock, and stock awards that are anti-dilutive based on the application of the treasury stock method.
|
F-63
|
(2)
|
Shares that are issuable upon the achievement of certain market-based performance criteria related to Ocwen’s stock price.
|
Note 22 — Employee Compensation and Benefit Plans
We maintain defined contribution plans to provide post-retirement benefits to our eligible employees and non-contributory defined benefit pension plans which are frozen and cover certain former eligible employees. We also maintain additional incentive compensation plans for certain employees. We designed these plans to facilitate a pay-for-performance culture, further align the interests of our officers and key employees with the interests of our shareholders and to assist in attracting and retaining employees vital to our long-term success. These plans are summarized below.
Defined Contribution Savings Plans
We sponsor defined contribution savings plans for eligible employees in the U.S (401(k) plan) and India (Provident Fund). Effective July 1, 2019, the PHH Corporation Employee Savings Plan and the PHH Home Loans, LLC Employee Savings Plan were merged into the Ocwen Financial Corporation 401(k) Savings Plan which applied to all current and former employees with account balances as of the date of the merger.
Contributions of participating employees to the plans are matched on the basis specified by these plans. For the 401(k) plans, we match
50%
of the first
6%
of each eligible participant’s contribution to the 401(k) plans with maximum aggregate matching of
$8,400
for
2019
. For the Provident Fund, both the employee and the employer are required to make minimum contributions to the fund at a predetermined rate (currently
12%
) applied to a portion of the employee's salary. Employers are not required to make contributions beyond this minimum.
Our contributions to these plans were
$5.9 million
,
$4.8 million
and
$5.3 million
for the years ended
December 31, 2019
,
2018
and
2017
, respectively.
Defined Benefit Pension Plans
Ocwen sponsors different non-contributory defined benefit pension plans for which benefits are based on an employee’s years of credited service and a percentage of final average compensation, or as otherwise described by the plan. Both defined benefit pension plans were assumed as part of business acquisitions and are frozen, wherein the plans only accrue additional benefits for a limited number of employees and no additional employees are eligible for participation in the plans.
The following table shows the total change in the benefit obligation, plan assets and funded status for the pension plans:
|
|
December 31,
|
||||||
|
2019
|
2018
|
||||||
|
Benefit obligation
|
$
|
54,603
|
|
$
|
49,122
|
|
|
|
Fair value of plan assets
|
41,220
|
|
36,439
|
|
|||
|
Unfunded status recognized in Other liabilities
|
$
|
(13,383
|
)
|
$
|
(12,683
|
)
|
|
|
Amounts recognized in Accumulated other comprehensive income
|
$
|
6,864
|
|
$
|
3,422
|
|
|
The net periodic benefit cost related to the defined benefit pension plans, included in Other expenses, was
$(2.0) million
and
$0.4 million
for
2019
and
2018
, respectively, and insignificant for
2017
.
As of
December 31, 2019
, future expected benefit payments to be made from the assets of the defined benefit pension plans is
$2.9 million
for the year ending December 31, 2020,
$2.8 million
for the years ending December 31, 2021 through 2023 and
$3.1 million
for the year ending December 31, 2024. The expected benefit payments to be made for the subsequent five years ending December 31, 2025 through 2029 are
$15.7 million
.
Ocwen contributes to the defined benefit pension plans amounts sufficient to meet minimum funding requirements as set forth in employee benefit and tax laws as well as additional amounts at their discretion. Our contributions to the defined benefit pension plans were
$0.8 million
,
$0.2 million
and
$0.1 million
for the years ended December 31,
2019
,
2018
and
2017
, respectively. On October 4, 2018, Ocwen assumed all benefit obligations associated with PHH’s defined benefit pension plan as a result of its completed acquisition of PHH and no contribution was required to be made during the post-acquisition period ended December 31,
2018
.
Gratuity Plan
In accordance with India law, OFSPL provides for a defined benefit retirement plan (Gratuity Plan) covering all of its employees in India. The Gratuity Plan provides a lump-sum payment to vested employees at retirement or termination of employment based upon the respective employee’s salary and years of employment. OFSPL provides for the gratuity benefit
through actuarially determined valuations.
F-64
The following table shows the total change in the benefit obligation, plan assets and funded status for the Gratuity Plan:
|
|
December 31,
|
||||||
|
2019
|
2018
|
||||||
|
Benefit obligation
|
$
|
5,370
|
|
$
|
4,941
|
|
|
|
Fair value of plan assets
|
39
|
|
37
|
|
|||
|
Unfunded status recognized in Other liabilities
|
$
|
(5,331
|
)
|
$
|
(4,904
|
)
|
|
During the years ended December 31,
2019
and
2018
, benefits of
$0.9 million
and
$0.3 million
were paid by OFSPL. As of
December 31, 2019
, future expected benefit payments to be made from the assets of the Gratuity Plan, which reflect expected future service, is
$1.0 million
,
$0.9 million
,
$0.8 million
,
$0.7 million
and
$0.6 million
for the years ending December 31, 2020, 2021, 2022, 2023 and 2024, respectively. The expected benefit payments to be made for the subsequent five years ending December 31, 2025 through 2029 are
$1.9 million
.
Annual Incentive Plan
The Ocwen Financial Corporation Amended 1998 Annual Incentive Plan and the 2017 Performance Incentive Plan (the 2017 Equity Plan) are our primary incentive compensation plans for executives and other eligible employees. Previously issued equity awards remain outstanding under the 2007 Equity Incentive Plan (the 2007 Equity Plan). Under the terms of these plans, participants can earn cash and equity-based awards as determined by the Compensation and Human Capital Committee of the Board of Directors (the Committee). The awards are based on objective and subjective performance criteria established by the Committee. The Committee may at its discretion adjust performance measurements to reflect significant unforeseen events. We recognized
$16.6 million
,
$20.5 million
and
$24.5 million
of compensation expense during
2019
,
2018
and
2017
, respectively, related to annual incentive compensation awarded in cash.
The 2007 Equity Plan and the 2017 Equity Plan authorize the grant of stock options, restricted stock, stock units or other equity-based awards, including cash-settled awards, to employees. Effective with the approval of the 2017 Equity Plan by Ocwen shareholders on May 24, 2017, no new awards will be granted under the 2007 Equity Plan. The number of remaining shares available for award grants under the 2007 Equity Plan became available for award grants under the 2017 Equity Plan effective upon shareholder approval. At
December 31, 2019
, there were
6,841,386
shares of common stock remaining available for future issuance under these plans.
Equity Awards
Outstanding equity awards granted under the 2007 Equity Plan and the 2017 Equity Plan had the following characteristics in common:
|
Type of Award
|
Percent of Total Equity Award
|
Vesting Period
|
|||
|
2011 - 2014 Awards:
|
|||||
|
Options:
|
|||||
|
Service Condition:
|
|||||
|
Time-based
|
60
|
%
|
Ratably over four years (25% on each of the four anniversaries of the grant date)
|
||
|
Market Condition:
|
|
|
|
||
|
Market performance-based
|
35
|
|
Over three years beginning with 25% vesting on the date that the stock price has at least doubled over the exercise price and the compounded annual gain over the exercise price is at least 20% and then ratably over three years (25% on each of the next three anniversaries of the achievement of the market condition)
|
||
|
Extraordinary market performance-based
|
5
|
|
Over three years beginning with 25% vesting on the date that the stock price has at least tripled over the exercise price and the compounded annual gain over the exercise price is at least 25% and then ratably over three years (25% on each of the next three anniversaries of the achievement of the market condition)
|
||
|
Total Award
|
100
|
%
|
|||
F-65
|
Type of Award
|
Percent of Total Equity Award
|
Vesting Period
|
|||
|
2015 - 2016 Awards:
|
|||||
|
Options:
|
|||||
|
Service Condition:
|
|||||
|
Time-based
|
34
|
%
|
Ratably over four years (25% vesting on each of the first four anniversaries of the grant date.)
|
||
|
Stock Units:
|
|||||
|
Service Condition:
|
|||||
|
Time-based
|
—
|
|
Over four years with 1/3 vesting on each of the 2
nd
, 3
rd
and 4
th
anniversaries of the grant date.
|
||
|
Market Condition:
|
|||||
|
Time-based vesting schedule and Market performance-based vesting date
|
66
|
|
Vest over four years with 25% vesting on each of the four anniversaries of the grant date. However, none are considered vested until the first trading day (if any) on or before the 4
th
anniversary of the award date on which the average stock price equals or exceeds the price set in the individual award agreement, at which time all units that have met their time-based vesting schedule vest immediately with the remainder vesting in accordance with their time-based schedule.
|
||
|
Total Award
|
100
|
%
|
|||
|
2017 - 2019 Awards:
|
|||||
|
Options:
|
|||||
|
Service Condition:
|
|||||
|
Time-based
|
15
|
%
|
Ratably over three years (1/3 vesting on each of the first three anniversaries of the grant date).
|
||
|
Stock Units:
|
|||||
|
Service Condition:
|
|||||
|
Time-based
|
56
|
|
Over three years with 1/3 vesting on each of the first three anniversaries of the grant date.
|
||
|
Market Condition:
|
|||||
|
Time-based vesting schedule and Market performance-based vesting date
|
29
|
|
Vest over four years with 25% vesting on each of the four anniversaries of the grant date. However, none are considered vested until the first trading day (if any) on or before the 4
th
anniversary of the award date on which the average stock price equals or exceeds the price set in the individual award agreement, at which time all units that have met their time-based vesting schedule vest immediately with the remainder vesting in accordance with their time-based schedule.
|
||
|
Total Award
|
100
|
%
|
|||
The contractual term of all options granted is
ten
years from the grant date, except where employment terminates by reason of death, disability or retirement, in which case, the agreement may provide for an earlier termination of the options. The terms of the market-based options do not include a retirement provision. Stock units have a three-year or four-year term. If the market conditions are not met by the third or fourth anniversary of the award of stock units, those units terminate on that date.
F-66
|
Years Ended December 31,
|
||||||||||||||||||||
|
Stock Options
|
2019
|
2018
|
2017
|
|||||||||||||||||
|
|
Number of
Options
|
Weighted
Average
Exercise
Price
|
Number of
Options
|
Weighted
Average
Exercise
Price
|
Number of
Options
|
Weighted
Average
Exercise
Price
|
||||||||||||||
|
Outstanding at beginning of year
|
2,092,599
|
|
$
|
19.22
|
|
6,708,655
|
|
$
|
9.97
|
|
6,926,634
|
|
$
|
9.88
|
|
|||||
|
Granted (1) (2)
|
51,409
|
|
2.08
|
|
348,385
|
|
3.66
|
|
—
|
|
—
|
|
||||||||
|
Exercised
|
—
|
|
—
|
|
—
|
|
—
|
|
—
|
|
—
|
|
||||||||
|
Forfeited / Expired (3)
|
(164,577
|
)
|
18.69
|
|
(4,964,441
|
)
|
5.62
|
|
(217,979
|
)
|
7.16
|
|
||||||||
|
Outstanding at end of year
(4)(5)
|
1,979,431
|
|
$
|
18.82
|
|
2,092,599
|
|
$
|
19.22
|
|
6,708,655
|
|
$
|
9.97
|
|
|||||
|
Exercisable at end of year (4)(5)(6)
|
1,580,766
|
|
$
|
20.16
|
|
1,520,039
|
|
$
|
21.29
|
|
6,234,830
|
|
$
|
8.87
|
|
|||||
|
(1)
|
Stock options granted in 2019 include
33,180
options awarded to Ocwen’s Chief Financial Officer at a strike price of
$2.17
equal to the closing price of our common stock on the effective date of her employment. Stock options granted in 2018 include
266,990
options awarded to Ocwen’s current Chief Executive Officer (CEO) at an exercise price of
$4.12
equal to the closing price of our common stock on the effective date of his employment, which was the closing date of the PHH acquisition.
|
|
(2)
|
The weighted average grant date fair value of stock options granted in 2019 was
$1.49
.
|
|
(3)
|
Includes
73,696
and
4,719,750
options which expired unexercised in 2019 and 2018, because their exercise price was greater than the market price of Ocwen’s stock.
|
|
(4)
|
At
December 31, 2019
,
115,000
options with a market condition for vesting based on an average common stock trading price of
$38.41
, had not met their performance criteria. Outstanding and exercisable stock options at
December 31, 2019
have a net aggregate intrinsic value of
$0
. A total of
810,939
market-based options were outstanding at
December 31, 2019
, of which
695,939
were exercisable.
|
|
(5)
|
At
December 31, 2019
, the weighted average remaining contractual term of options outstanding and options exercisable was
4.13 years
and
3.28 years
, respectively.
|
|
(6)
|
The total fair value of stock options that vested and became exercisable during
2019
,
2018
and
2017
, based on grant-date fair value, was
$0.6 million
,
$0.6 million
and
$0.7 million
, respectively.
|
|
Years Ended December 31,
|
||||||||||||||||||||
|
Stock Units - Equity Awards
|
2019
|
2018
|
2017
|
|||||||||||||||||
|
|
Number of
Stock Units |
Weighted
Average Grant Date Fair Value |
Number of
Stock Units |
Weighted
Average Grant Date Fair Value |
Number of
Stock Units |
Weighted
Average Grant Date Fair Value |
||||||||||||||
|
Unvested at beginning of year
|
2,946,800
|
|
$
|
3.75
|
|
2,753,918
|
|
$
|
3.69
|
|
2,752,054
|
|
$
|
3.91
|
|
|||||
|
Granted (1)(2)
|
1,256,952
|
|
2.00
|
|
1,809,373
|
|
3.57
|
|
971,761
|
|
2.56
|
|
||||||||
|
Vested (3)(4)
|
(1,137,696
|
)
|
3.08
|
|
(796,856
|
)
|
2.78
|
|
(896,272
|
)
|
3.26
|
|
||||||||
|
Forfeited/Cancelled (1)
|
(406,931
|
)
|
9.58
|
|
(819,635
|
)
|
4.57
|
|
(73,625
|
)
|
2.20
|
|
||||||||
|
Unvested at end of year (5)(6)
|
2,659,125
|
|
$
|
2.63
|
|
2,946,800
|
|
$
|
3.75
|
|
2,753,918
|
|
$
|
3.69
|
|
|||||
|
(1)
|
Upon the resignation of Ocwen’s former CEO on June 30, 2018,
377,525
unvested stock units which would have been forfeited immediately were modified to allow continued vesting in accordance with the original terms. This had the equivalent effect of canceling the original award and granting a new award.
|
|
(2)
|
Stock units granted in 2019 include
1,130,653
units granted to Ocwen’s CEO under the new long-term incentive (LTI) program described below. Stock units granted in 2018 include
983,010
units granted to Ocwen’s current CEO on the effective date of his employment, which was the closing date of the PHH acquisition.
|
|
(3)
|
The total intrinsic value of stock units vested, which is defined as the market value of the stock on the date of vesting, was
$2.1 million
,
$3.3 million
and
$4.6 million
for
2019
,
2018
and
2017
, respectively.
|
|
(4)
|
The total fair value of the stock units that vested during
2019
,
2018
and
2017
, based on grant-date fair value, was
$3.5 million
,
$2.2 million
and
$2.9 million
, respectively.
|
|
(5)
|
Excluding the
787,204
market-based stock awards that have not met their performance criteria, the net aggregate intrinsic value of stock awards outstanding at
December 31, 2019
was
$2.6 million
. At
December 31, 2019
,
40,000
,
93,023
,
57,604
, and
31,250
stock units with a market condition for vesting based on an average common stock trading price of
$11.72
,
$5.80
,
$4.34
, and
$3.84
respectively, as well as
565,327
stock units requiring an average common stock trading price of
$2.56
to vest a minimum of
50%
of units, had not yet met the market condition (and time-vesting requirements, where applicable).
|
|
(6)
|
At
December 31, 2019
, the weighted average remaining contractual term of share units outstanding was
1.88 years
.
|
Liability Awards
F-67
In 2019, Ocwen established a long-term incentive (LTI) program in connection with changes made by the Committee to the compensation structure of Ocwen’s executives. The LTI program is designed to promote actions and decisions aligned with our strategic objectives and reward our executives and other program participants for long-term value creation for our shareholders in a manner that is consistent with our pay-for-performance philosophy. The 2019 awards granted under the LTI program are cash-settled to avoid share dilution, except that a portion of awards to Ocwen’s Chief Executive Officer will be settled in shares of common stock. The program includes both a time-vesting component for retention purposes and a performance component to align with pay-for-performance objectives, using absolute total shareholder return as the performance metric. The LTI awards are granted under the 2017 Equity Plan. A total of
4,896,796
awards were granted in 2019 under the LTI, of which
3,766,143
were cash-settled awards and
1,130,653
were equity-settled awards granted to Ocwen’s CEO as disclosed above.
Of the awards granted under the LTI program in 2019,
74%
were performance-based with a market condition and the remaining
26%
were time-based. The time-based awards vest equally (one-third) on the first, second and third anniversaries of the award grant date if the continued employment condition is met. The recurring annual performance-based awards cliff-vest
100%
after three years subject to meeting the performance conditions and continuing employment. Certain one-time retention and transitional performance-based awards granted in 2019 vest equally (one-third) on the first, second and third anniversaries of the award grant date subject to meeting the performance conditions and continuing employment. Because the cash-settled awards must be settled in cash, they are classified as liabilities (Other liabilities) in the consolidated balance sheets and remeasured at fair value at each reporting date with adjustments recorded as Compensation expense in the consolidated statements of operations.
|
Stock Units - Liability Awards
|
Year Ended December 31, 2019
|
|
|
Unvested units at beginning of year
|
—
|
|
|
Granted
|
3,766,143
|
|
|
Vested
|
—
|
|
|
Forfeited/Cancelled
|
114,528
|
|
|
Unvested units at end of year
|
3,651,615
|
|
The performance-based awards vest in separate tranches based on the total shareholder return (TSR), as defined, over one, two and three-year annual performance periods ending March 29, 2020, 2021 and 2022. TSR is calculated using the average closing stock prices during the
30
trading days up to and including the beginning and end date of each performance period. The number of units earned depends on the level of performance achieved (Threshold = 50%; Target = 100%; Maximum = 200%, with results between levels interpolated). No units will be awarded for performance below the Threshold level.
Compensation expense related to all stock-based awards is initially measured at fair value on the grant date using an appropriate valuation model based on the vesting conditions of the awards. Awards classified as liabilities are subsequently remeasured at fair value at each reporting date, as described above. The fair value of the time-based option awards was determined using the Black-Scholes options pricing model, while a lattice (binomial) model was used to determine the fair value of the market-based option awards. Lattice (binomial) models incorporate ranges of assumptions for inputs. Stock unit awards with only a service condition are valued at their intrinsic value, which is the market value of the stock on the date of the award. The fair value of Stock unit awards with both a service condition and a market-based vesting condition is based on the output of a Monte Carlo simulation.
The following assumptions were used to value awards:
|
Years Ended December 31,
|
|||||||
|
|
2019
|
2018
|
2017
|
||||
|
|
Black-Scholes
|
Monte Carlo
|
Black-Scholes
|
Monte Carlo
|
Monte Carlo
|
||
|
Risk-free interest rate
|
2.60%
|
1.16% - 2.40%
|
2.79% – 3.14%
|
1.15% – 1.18%
|
1.12% – 1.18%
|
||
|
Expected stock price volatility (1)
|
68%
|
72.5% - 75.9%
|
67%
|
71% - 74%
|
71% - 77%
|
||
|
Expected dividend yield
|
—%
|
—%
|
—%
|
—%
|
—%
|
||
|
Expected life (in years) (2)
|
8.5
|
(3)
|
8.5
|
(3)
|
(3)
|
||
|
Contractual life (in years)
|
N/A
|
N/A
|
N/A
|
N/A
|
N/A
|
||
|
Fair value
|
$1.37 - $1.55
|
$1.75 - $2.25
|
$1.53 - $2.96
|
$1.84 - $4.80
|
$2.00 - $4.80
|
||
F-68
|
(1)
|
We generally estimate volatility based on the historical volatility of Ocwen’s common stock over the most recent period that corresponds with the estimated expected life of the option. For awards valued using a Monte Carlo simulation, volatility is computed as a blend of historical volatility and implied volatility based on traded options on Ocwen’s common stock.
|
|
(2)
|
For the options valued using the Black-Scholes model we determined the expected life based on historical experience with similar awards, giving consideration to the contractual term, exercise patterns and post vesting forfeitures. The expected term of the options valued using the lattice (binomial) model is derived from the output of the model. The lattice (binomial) model incorporates exercise assumptions based on analysis of historical data. For all options, the expected life represents the period of time that options granted were expected to be outstanding at the date of the award.
|
|
(3)
|
The stock units that contain both a service condition and a market-based condition are valued using the Monte Carlo simulation. The expected term is derived from the output of the simulation and represents the expected time to meet the market-based vesting condition. For equity awards with both service and market conditions, the requisite service period is the longer of the derived or explicit service period. In this case, the explicit service condition (vesting period) is the requisite service period, and the graded vesting method is used for expense recognition.
|
The following table summarizes Ocwen's stock-based compensation expense included as a component of Compensation and benefits expense in the consolidated statements of operations:
|
Years Ended December 31,
|
|||||||||||
|
|
2019
|
2018
|
2017
|
||||||||
|
Compensation expense - Equity awards
|
|||||||||||
|
Stock option awards
|
$
|
(121
|
)
|
$
|
(368
|
)
|
$
|
1,457
|
|
||
|
Stock awards
|
2,818
|
|
2,734
|
|
4,167
|
|
|||||
|
|
2,697
|
|
2,366
|
|
5,624
|
|
|||||
|
Compensation expense - Liability awards
|
1,082
|
|
—
|
|
—
|
|
|||||
|
(Tax deficiency) excess tax benefit related to share-based awards
|
(381
|
)
|
294
|
|
3,701
|
|
|||||
As of
December 31, 2019
, unrecognized compensation costs related to non-vested stock options amounted to
$0.6 million
, which will be recognized over a weighted-average remaining requisite service period of
1.80 years
. Unrecognized compensation costs related to non-vested stock units as of
December 31, 2019
amounted to
$5.5 million
, which will be recognized over a weighted-average remaining life of
1.88
years. Unrecognized compensation costs related to unvested liability awards as of
December 31, 2019
amounted to
$3.1
million, which will be recognized over a weighted-average remaining life of
2.34
years.
Note 23 — Business Segment Reporting
Our business segments reflect the internal reporting that we use to evaluate operating performance of services and to assess the allocation of our resources. A brief description of our current business segments is as follows:
Servicing.
This segment is primarily comprised of our core residential mortgage servicing business and currently accounts for most of our total revenues. We provide residential and commercial mortgage loan servicing, special servicing and asset management services. We earn fees for providing these services to owners of the mortgage loans and foreclosed real estate. In most cases, we provide these services either because we purchased the MSRs from the owner of the mortgage, retained the MSRs on the sale or securitization of residential mortgage loans or because we entered into a subservicing or special servicing agreement with the entity that owns the MSR. Our residential servicing portfolio includes conventional, government-insured and non-Agency loans. Non-Agency loans include subprime loans, which represent residential loans that generally did not qualify under GSE guidelines or have subsequently become delinquent.
Lending.
The Lending segment purchases and originates conventional and government-insured residential forward and reverse mortgage loans. The loans are typically sold shortly after origination into a liquid market on a servicing retained (securitization) or servicing released (sale to a third party) basis. We originate forward mortgage loans directly with customers (retail channel) as well as through correspondent lending arrangements since the second quarter of 2019. We originate reverse mortgage loans in all three channels through our correspondent lending arrangements, broker relationships (wholesale) and retail channels. In 2017, we closed our forward correspondent lending channel and exited the forward wholesale lending business due to higher liquidity and capital requirements versus the available liquidity at the time. We wrote off the capitalized balance of software developed internally for the forward wholesale lending business and recorded a loss of
$6.8 million
in Other expenses in 2017.
Corporate Items and Other.
Corporate Items and Other includes revenues and expenses of corporate support services, CR Limited (CRL), our wholly-owned captive reinsurance subsidiary, discontinued operations and inactive entities, business activities that are individually insignificant, revenues and expenses that are not directly related to other reportable segments, interest income on short-term investments of cash and interest expense on corporate debt. Corporate Items and Other also includes severance, retention, facility-related and other expenses incurred in 2019 related to our cost re-engineering plan. Our
F-69
cash balances are included in Corporate Items and Other. CRL provides re-insurance related to coverage on foreclosed real estate properties owned or serviced by us. In January 2018, we decided to exit the ACS business and have liquidated our portfolio of inventory-secured loans to independent used car dealers.
We allocate a portion of interest income to each business segment, including interest earned on cash balances and short-term investments. We also allocate expenses incurred by corporate support services to each business segment. Interest expense on direct asset-backed financings are recorded in the respective Servicing and Lending segments, while interest expense on the SSTL and Senior Notes is recorded in Corporate Items and Other and is not allocated.
Financial information for our segments is as follows:
|
Results of Operations
|
Servicing
|
Lending
|
Corporate Items and Other
|
Corporate Eliminations
|
Business Segments Consolidated
|
|||||||||||||||
|
Year Ended December 31, 2019
|
||||||||||||||||||||
|
Revenue
|
$
|
985,102
|
|
$
|
125,086
|
|
$
|
13,187
|
|
$
|
—
|
|
$
|
1,123,375
|
|
|||||
|
MSR valuation adjustments, net
|
(120,646
|
)
|
(230
|
)
|
—
|
|
—
|
|
(120,876
|
)
|
||||||||||
|
Operating expenses (1) (2)
|
536,153
|
|
84,280
|
|
53,506
|
|
—
|
|
673,939
|
|
||||||||||
|
Other income (expense):
|
||||||||||||||||||||
|
Interest income
|
8,051
|
|
7,277
|
|
1,776
|
|
—
|
|
17,104
|
|
||||||||||
|
Interest expense
|
(47,347
|
)
|
(7,911
|
)
|
(58,871
|
)
|
—
|
|
(114,129
|
)
|
||||||||||
|
Pledged MSR liability expense
|
(372,172
|
)
|
—
|
|
83
|
|
—
|
|
(372,089
|
)
|
||||||||||
|
Gain on repurchase of senior secured notes
|
—
|
|
—
|
|
5,099
|
|
—
|
|
5,099
|
|
||||||||||
|
Bargain purchase gain
|
—
|
|
—
|
|
(381
|
)
|
|
|
(381
|
)
|
||||||||||
|
Gain on sale of MSRs, net
|
453
|
|
—
|
|
—
|
|
—
|
|
453
|
|
||||||||||
|
Other, net
|
11,942
|
|
791
|
|
(3,841
|
)
|
—
|
|
8,892
|
|
||||||||||
|
Other income (expense), net
|
(399,073
|
)
|
157
|
|
(56,135
|
)
|
—
|
|
(455,051
|
)
|
||||||||||
|
Income (loss) before income taxes
|
$
|
(70,770
|
)
|
$
|
40,733
|
|
$
|
(96,454
|
)
|
$
|
—
|
|
$
|
(126,491
|
)
|
|||||
F-70
|
Results of Operations
|
Servicing
|
Lending
|
Corporate Items and Other
|
Corporate Eliminations
|
Business Segments Consolidated
|
|||||||||||||||
|
Year Ended December 31, 2018
|
||||||||||||||||||||
|
Revenue
|
$
|
951,224
|
|
$
|
93,672
|
|
$
|
18,149
|
|
$
|
—
|
|
$
|
1,063,045
|
|
|||||
|
MSR valuation adjustments, net
|
(152,983
|
)
|
(474
|
)
|
—
|
|
—
|
|
(153,457
|
)
|
||||||||||
|
Operating expenses (1)
|
619,484
|
|
82,432
|
|
77,123
|
|
—
|
|
779,039
|
|
||||||||||
|
Other income (expense):
|
||||||||||||||||||||
|
Interest income
|
5,383
|
|
6,061
|
|
2,582
|
|
—
|
|
14,026
|
|
||||||||||
|
Interest expense
|
(41,830
|
)
|
(7,311
|
)
|
(54,230
|
)
|
—
|
|
(103,371
|
)
|
||||||||||
|
Pledged MSR liability expense
|
(172,342
|
)
|
672
|
|
—
|
|
—
|
|
(171,670
|
)
|
||||||||||
|
Bargain purchase gain
|
—
|
|
—
|
|
64,036
|
|
—
|
|
64,036
|
|
||||||||||
|
Gain on sale of mortgage servicing rights, net
|
1,325
|
|
—
|
|
—
|
|
—
|
|
1,325
|
|
||||||||||
|
Other, net
|
(3,241
|
)
|
966
|
|
(4,096
|
)
|
—
|
|
(6,371
|
)
|
||||||||||
|
Other income (expense), net
|
(210,705
|
)
|
388
|
|
8,292
|
|
—
|
|
(202,025
|
)
|
||||||||||
|
Income (loss) from continuing operations before income taxes
|
$
|
(31,948
|
)
|
$
|
11,154
|
|
$
|
(50,682
|
)
|
$
|
—
|
|
$
|
(71,476
|
)
|
|||||
|
Year Ended December 31, 2017
|
||||||||||||||||||||
|
Revenue
|
$
|
1,041,290
|
|
$
|
127,475
|
|
$
|
25,811
|
|
$
|
—
|
|
$
|
1,194,576
|
|
|||||
|
MSR valuation adjustments, net
|
(52,689
|
)
|
(273
|
)
|
—
|
|
—
|
|
(52,962
|
)
|
||||||||||
|
Operating expenses
|
663,695
|
|
127,785
|
|
154,203
|
|
—
|
|
945,683
|
|
||||||||||
|
Other income (expense):
|
||||||||||||||||||||
|
Interest income
|
783
|
|
10,914
|
|
4,268
|
|
—
|
|
15,965
|
|
||||||||||
|
Interest expense
|
(57,284
|
)
|
(13,893
|
)
|
(55,750
|
)
|
—
|
|
(126,927
|
)
|
||||||||||
|
Pledged MSR liability expense
|
(236,311
|
)
|
—
|
|
—
|
|
—
|
|
(236,311
|
)
|
||||||||||
|
Gain on sale of MSRs
|
10,537
|
|
—
|
|
—
|
|
—
|
|
10,537
|
|
||||||||||
|
Other, net
|
4,049
|
|
(869
|
)
|
(6,348
|
)
|
—
|
|
(3,168
|
)
|
||||||||||
|
Other expense, net
|
(278,226
|
)
|
(3,848
|
)
|
(57,830
|
)
|
—
|
|
(339,904
|
)
|
||||||||||
|
Income (loss) before income taxes
|
$
|
46,680
|
|
$
|
(4,431
|
)
|
$
|
(186,222
|
)
|
$
|
—
|
|
$
|
(143,973
|
)
|
|||||
|
(1)
|
Compensation and benefits expense in the Corporate Items and Other segment for 2019 and 2018
includes
$20.3 million
and
$11.9 million
, respectively, of severance expense attributable to PHH integration-related headcount reductions of primarily U.S.-based employees in 2019 and severance expense attributable to headcount reductions in connection with our strategic decisions to exit the automotive capital services business and the forward lending correspondent and wholesale channels in late 2017 and early 2018, as well as our overall efforts to reduce costs.
|
|
(2)
|
Included in the Corporate Items and Other segment for 2019, we recorded in Professional services expense a recovery from a service provider of
$30.7 million
during the first quarter of amounts previously recognized as expense.
|
F-71
|
Total Assets
|
Servicing
|
Lending
|
Corporate Items and Other
|
Corporate Eliminations
|
Business Segments Consolidated
|
|||||||||||||||
|
December 31, 2019
|
$
|
3,378,515
|
|
$
|
6,459,367
|
|
$
|
568,317
|
|
$
|
—
|
|
$
|
10,406,199
|
|
|||||
|
December 31, 2018
|
3,306,208
|
|
5,603,481
|
|
484,527
|
|
—
|
|
9,394,216
|
|
||||||||||
|
December 31, 2017
|
3,033,243
|
|
4,945,456
|
|
424,465
|
|
—
|
|
8,403,164
|
|
||||||||||
|
Depreciation and Amortization Expense
|
Servicing
|
Lending
|
Corporate Items and Other
|
Business Segments Consolidated
|
||||||||||||
|
Year Ended December 31, 2019:
|
|
|
|
|
|
|
|
|
||||||||
|
Depreciation expense
|
$
|
1,925
|
|
$
|
93
|
|
$
|
29,893
|
|
$
|
31,911
|
|
||||
|
Amortization of debt discount
|
—
|
|
—
|
|
1,342
|
|
1,342
|
|
||||||||
|
Amortization of debt issuance costs
|
71
|
|
—
|
|
3,099
|
|
3,170
|
|
||||||||
|
Year Ended December 31, 2018:
|
|
|
|
|
|
|
|
|
||||||||
|
Depreciation expense
|
$
|
4,601
|
|
$
|
103
|
|
$
|
22,498
|
|
$
|
27,202
|
|
||||
|
Amortization of debt discount
|
—
|
|
—
|
|
1,183
|
|
1,183
|
|
||||||||
|
Amortization of debt issuance costs
|
—
|
|
—
|
|
2,921
|
|
2,921
|
|
||||||||
|
Year Ended December 31, 2017:
|
|
|
|
|
|
|
|
|
||||||||
|
Depreciation expense
|
$
|
5,797
|
|
$
|
194
|
|
$
|
20,895
|
|
$
|
26,886
|
|
||||
|
Amortization of mortgage servicing rights
|
51,515
|
|
273
|
|
—
|
|
51,788
|
|
||||||||
|
Amortization of debt discount
|
—
|
|
—
|
|
1,114
|
|
1,114
|
|
||||||||
|
Amortization of debt issuance costs
|
—
|
|
—
|
|
2,738
|
|
2,738
|
|
||||||||
Note 24 — Regulatory Requirements
Our business is subject to extensive regulation by federal, state and local governmental authorities, including the Consumer Financial Protection Bureau (CFPB), HUD, the SEC and various state agencies that license and conduct examinations of our servicing and lending activities. In addition, we operate under a number of regulatory settlements that subject us to ongoing reporting and other obligations. From time to time, we also receive requests (including requests in the form of subpoenas and civil investigative demands) from federal, state and local agencies for records, documents and information relating to our servicing and lending activities. The GSEs (and their conservator, the Federal Housing Finance Authority (FHFA)), Ginnie Mae, the United States Treasury Department, various investors, non-Agency securitization trustees and others also subject us to periodic reviews and audits.
In the current regulatory environment, we have faced and expect to continue to face heightened regulatory and public scrutiny as an organization as well as stricter and more comprehensive regulation of the entire mortgage sector. We continue to work diligently to assess and understand the implications of the evolving regulatory environment in which we operate and to meet its requirements. We devote substantial resources to regulatory compliance, while, at the same time, striving to meet the needs and expectations of our customers, clients and other stakeholders. Our failure to comply with applicable federal, state and local laws, regulations and licensing requirements could lead to (i) administrative fines and penalties and litigation, (ii) loss of our licenses and approvals to engage in our servicing and lending businesses, (iii) governmental investigations and enforcement actions, (iv) civil and criminal liability, including class action lawsuits and actions to recover incentive and other payments made by governmental entities, (v) breaches of covenants and representations under our servicing, debt or other agreements, (vi) damage to our reputation, (vii) inability to raise capital or otherwise fund our operations and (viii) inability to execute on our business strategy. In addition to amounts paid to resolve regulatory matters, we have in the past incurred, and may in the future incur, costs to comply with the terms of such resolutions, including staffing costs, legal costs and, in certain cases the costs of audits, reviews and third-party firms to monitor our compliance with such resolutions.
F-72
We must comply with a large number of federal, state and local consumer protection and other laws and regulations, including, among others, the Dodd-Frank Wall Street Reform and Consumer Protection Act (the Dodd-Frank Act), the Telephone Consumer Protection Act (TCPA), the Gramm-Leach-Bliley Act, the Fair Debt Collection Practices Act (FDCPA), the Real Estate Settlement Procedures Act (RESPA), the Truth in Lending Act (TILA), the Servicemembers Civil Relief Act, the Homeowners Protection Act, the Federal Trade Commission Act, the Fair Credit Reporting Act, the Equal Credit Opportunity Act, as well as individual state licensing and foreclosure laws, individual state and local laws relating to registration of vacant or foreclosed properties, and federal and local bankruptcy rules. These laws and regulations apply to many facets of our business, including loan origination, default servicing and collections, use of credit reports, safeguarding of non-public personally identifiable information about our customers, foreclosure and claims handling, investment of, and interest payments on, escrow balances and escrow payment features and fees assessed on borrowers, and they mandate certain disclosures and notices to borrowers. These requirements can and do change as laws and regulations are enacted, promulgated, amended, interpreted and enforced, including through CFPB interpretive bulletins and other regulatory pronouncements. In addition, the actions of legislative bodies and regulatory agencies relating to a particular matter or business practice may or may not be coordinated or consistent. As a result, ensuring ongoing compliance with applicable legal and regulatory requirements can be challenging. Over the past decade, the general trend among federal, state and local legislative bodies and regulatory agencies as well as state attorneys general has been toward increasing laws, regulations, investigative proceedings and enforcement actions with regard to residential real estate lenders and servicers. New regulatory and legislative measures, or changes in enforcement practices, including those related to the technology we use, could, either individually or in the aggregate, require significant changes to our business practices, impose additional costs on us, limit our product offerings, limit our ability to efficiently pursue business opportunities, negatively impact asset values or reduce our revenues. Accordingly, they could materially and adversely affect our business, financial condition, liquidity and results of operations.
As further described below and in
Note 26 — Contingencies
, in recent years Ocwen has entered into a number of significant settlements with federal and state regulators and state attorneys general that have imposed additional requirements on our business. For example, we made various commitments relating to the process of transferring loans off the REALServicing
®
servicing system and onto the Black Knight Financial Services, Inc. (Black Knight) LoanSphere MSP® servicing system (Black Knight MSP), we have engaged a third-party auditor to perform an analysis with respect to our compliance with certain federal and state laws relating to the escrow of mortgage loan payments, we have revised various aspects of our complaint handling processes and we have extensive review and reporting obligations to various regulatory bodies with respect to various matters, including our financial condition. We devote significant management time and resources to compliance with these additional requirements. These requirements are generally unique to Ocwen and, while certain of our competitors may have entered into regulatory-related settlements of their own, our competitors are generally not subject to either the same specific or the same breadth of additional requirements to which we are subject.
Ocwen has various subsidiaries that are licensed to originate and/or service forward and reverse mortgage loans in those jurisdictions in which they operate, and which require licensing. Our licensed entities are required to renew their licenses, typically on an annual basis, and to do so they must satisfy the license renewal requirements of each jurisdiction, which generally include financial requirements such as providing audited financial statements and satisfying minimum net worth requirements and non-financial requirements such as satisfactory completion of examinations relating to the licensee’s compliance with applicable laws and regulations. Failure to satisfy any of the requirements to which our licensed entities are subject could result in a variety of regulatory actions ranging from a fine, a directive requiring a certain step to be taken, entry into a consent order, a suspension or, ultimately, a revocation of a license, any of which could have a material adverse impact on our business, reputation, results of operations and financial condition. The minimum net worth requirements to which our licensed entities are subject are unique to each state and type of license. We believe our licensed entities were in compliance with all of their minimum net worth requirements at
December 31, 2019
.
PMC and Liberty are also subject to seller/servicer obligations under agreements with one or more of the GSEs, HUD, FHA, VA and Ginnie Mae. These seller/servicer obligations contain financial requirements, including capital requirements related to tangible net worth, as defined by the applicable agency, an obligation to provide audited consolidated financial statements within
90
days of the applicable entity’s fiscal year end as well as extensive requirements regarding servicing, selling and other matters. To the extent that these requirements are not met or waived, the applicable agency may, at its option, utilize a variety of remedies including requirements to provide certain information or take actions at the direction of the applicable agency, requirements to deposit funds as security for our obligations, sanctions, suspension or even termination of approved seller/servicer status, which would prohibit future originations or securitizations of forward or reverse mortgage loans or servicing for the applicable agency. Any of these actions could have a material adverse impact on us. To date, none of these counterparties has communicated any material sanction, suspension or prohibition in connection with our seller/servicer obligations. We believe we were in compliance with applicable net worth requirements at
December 31, 2019
. Our non-Agency servicing agreements also contain requirements regarding servicing practices and other matters, and a failure to comply with these requirements could have a material adverse impact on our business.
F-73
The most restrictive of the various net worth requirements for licensing and seller/servicer obligations referenced above is due to Fannie Mae’s eligibility requirements for PMC related to a decline in lender adjusted net worth. Fannie Mae required PMC to demonstrate an adjusted net worth of
$268.7 million
at December 31, 2019. PMC’s net worth was
$341.5 million
at
December 31, 2019
.
In addition, a number of foreign laws and regulations apply to our operations outside of the U.S., including laws and regulations that govern licensing, privacy, employment, safety, taxes and insurance and laws and regulations that govern the creation, continuation and the winding up of companies as well as the relationships between shareholders, our corporate entities, the public and the government in these countries. Non-compliance with these laws and regulations could result in adverse actions against us, including (i) restrictions on our operations in these countries, (ii) fines, penalties or sanctions or (iii) reputational damage.
New York Department of Financial Services.
In March 2017, we entered into a consent order with the NY DFS (the 2017 NY Consent Order) that provided for the termination of the engagement of a monitor appointed pursuant to an earlier 2014 consent order and for us to address certain concerns raised by the NY DFS that primarily relate to our servicing operations, as well as for us to comply with certain reporting and other obligations. In addition, in connection with the NY DFS’ approval in September 2018 of our acquisition of PHH, we agreed to satisfy certain post-closing requirements, including reporting obligations and record retention and other requirements relating to the transfer of loans collateralized by New York property (New York loans) onto Black Knight MSP and certain requirements with respect to the evaluation and supervision of management of both Ocwen and PMC. In addition, we were prohibited from boarding any additional loans onto the REALServicing system and we were required to transfer all New York loans off the REALServicing system by April 30, 2020. The conditional approval also modified a preexisting restriction on our ability to acquire MSRs such that the restriction applies only to New York loans and, with respect to New York loans, provides that Ocwen may not increase its aggregate portfolio of New York loans serviced or subserviced by Ocwen by more than
2%
per year (based on the unpaid principal balance of loans serviced at the prior calendar year-end). This restriction will remain in place until the NY DFS determines that all loans serviced on the REALServicing system have been successfully migrated to Black Knight MSP and that Ocwen has developed a satisfactory infrastructure to board sizable portfolios of MSRs. We have transferred all loans onto Black Knight MSP and no longer service any loans on the REALServicing system.
We continue to work with the NY DFS to address matters they continue to raise with us as well as to fulfill our commitments under the 2017 NY Consent Order and PHH acquisition conditional approval. To the extent that we fail to address adequately any concerns raised by the NY DFS or fail to fulfill our commitments to the NY DFS, the NY DFS could take regulatory action against us, including imposing fines or penalties or otherwise further restricting our business activities. Any such actions could have a material adverse impact on our business, financial condition, liquidity and results of operations.
California Department of Business Oversight.
In January 2015, OLS entered into a consent order (the 2015 CA Consent Order) with the CA DBO relating to our alleged failure to produce certain information and documents during a routine licensing examination. In February 2017, we entered into another consent order with the CA DBO (the 2017 CA Consent Order) that terminated the 2015 CA Consent Order and resolved open matters between us and the CA DBO. We believe that we have completed those obligations of the 2017 CA Consent Order that have already come due, and we have so notified the CA DBO. We have certain remaining reporting and other obligations under the 2017 CA Consent Order. Pursuant to the 2017 CA Consent Order, the CA DBO has engaged a third-party administrator who, at the expense of the CA DBO, has commenced work to confirm that Ocwen has completed certain commitments under the 2017 CA Consent Order. Still outstanding, however, is confirmation of our completion of
$198.0 million
in debt forgiveness for California borrowers by June 30, 2019. We believe that we fulfilled this requirement during the first quarter of 2019. However, our completion of this requirement is subject to testing by the CA DBO’s third-party administrator who must confirm, among other things, that modified loans have remained current for specified time periods. If we are unable to satisfy this requirement or obtain an extension, the 2017 CA Consent Order obligates us to pay the remaining amount to the CA DBO in cash. Our debt forgiveness activities take place as we modify loans - our loan modifications are designed to be sustainable for homeowners while providing a net present value for mortgage loan investors that is superior to that of foreclosure. Debt forgiveness as part of a loan modification is determined on a case-by-case basis in accordance with the applicable servicing agreement. Debt forgiveness does not involve an expense to Ocwen other than the operating expense incurred in arranging the modification, which is part of Ocwen’s role as loan servicer. If the CA DBO were to allege that we failed to comply with our obligations under the 2017 CA Consent Order or that we otherwise were in breach of applicable laws, regulations or licensing requirements, the CA DBO could also take regulatory actions against us, including imposing fines or penalties or otherwise restricting our business activities. Any such actions could have a material adverse impact on our business, financial condition, liquidity and results of operations.
F-74
Note 25 — Commitments
Unfunded Lending Commitments
We have originated floating-rate reverse mortgage loans under which the borrowers have additional borrowing capacity of
$1.5 billion
at
December 31, 2019
. This additional borrowing capacity is available on a scheduled or unscheduled payment basis. We also had short-term commitments to lend
$204.0 million
and
$28.5 million
in connection with our forward and reverse mortgage loan IRLCs, respectively, outstanding at
December 31, 2019
. We finance originated and purchased forward and reverse mortgage loans with repurchase and participation agreements, commonly referred to as warehouse lines.
HMBS Issuer Obligations
As an HMBS issuer, we assume certain obligations related to each security issued. The most significant obligation is the requirement to purchase loans out of the Ginnie Mae securitization pools once the outstanding principal balance of the related HECM is equal to or greater than
98%
of the maximum claim amount (MCA repurchases). Active repurchased loans are assigned to HUD and payment is received from HUD, typically within 60 days of repurchase. HUD reimburses us for the outstanding principal balance on the loan up to the maximum claim amount. We bear the risk of exposure if the amount of the outstanding principal balance on a loan exceeds the maximum claim amount. Inactive repurchased loans (the borrower is deceased, no longer occupies the property or is delinquent on tax and insurance payments) are generally liquidated through foreclosure and subsequent sale of REO, with a claim filed with HUD for recoverable remaining principal and advance balances. The recovery timeline for inactive repurchased loans depends on various factors, including foreclosure status at the time of repurchase, state-level foreclosure timelines, and the post-foreclosure REO liquidation timeline.
The timing and amount of our obligation with respect to MCA repurchases is uncertain as repurchase is dependent largely on circumstances outside of our control including the amount and timing of future draws and the status of the loan. MCA repurchases are expected to continue to increase due to the increased flow of HECMs and REO that are reaching
98%
of their maximum claim amount. Activity with regard to HMBS repurchases, including MCA repurchases, follows:
|
Year Ended December 31, 2019
|
||||||||||||||||||||
|
Active
|
Inactive
|
Total
|
||||||||||||||||||
|
Number
|
Amount
|
Number
|
Amount
|
Number
|
Amount
|
|||||||||||||||
|
Beginning balance
|
10
|
|
$
|
2,047
|
|
252
|
|
$
|
14,833
|
|
262
|
|
$
|
16,880
|
|
|||||
|
Additions (1)
|
81
|
|
19,671
|
|
241
|
|
24,517
|
|
322
|
|
44,188
|
|
||||||||
|
Recoveries, net (2)
|
(30
|
)
|
(10,414
|
)
|
(234
|
)
|
(12,520
|
)
|
(264
|
)
|
(22,934
|
)
|
||||||||
|
Transfers
|
1
|
|
(785
|
)
|
(1
|
)
|
785
|
|
—
|
|
—
|
|
||||||||
|
Changes in value
|
—
|
|
27
|
|
—
|
|
(2,468
|
)
|
—
|
|
(2,441
|
)
|
||||||||
|
Ending balance
|
62
|
|
$
|
10,546
|
|
258
|
|
$
|
25,147
|
|
320
|
|
$
|
35,693
|
|
|||||
|
(1)
|
Total repurchases during the year ended
December 31, 2019
, includes
189
loans totaling
$38.4 million
related to MCA repurchases.
|
|
(2)
|
Includes amounts received upon assignment of loan to HUD, loan payoff, REO liquidation and claim proceeds less any amounts charged off as unrecoverable.
|
Active loan repurchases are classified as Receivables as reimbursement from HUD is generally received within 60 days and are initially recorded at fair value. Inactive loan repurchases are classified as Loans held for sale and are initially recorded at fair value. Loans are reclassified to REO in Other assets or Receivables as the loans move through the resolution process and permissible claims are submitted to HUD for reimbursement. Loans held for sale repurchased prior to October 1, 2018 are carried at the lower of cost or fair value. Receivables are valued at net realizable value. REO is valued at the estimated value of the underlying property less cost to sell.
F-75
Lease Commitments
We lease certain of our premises and equipment under non-cancelable operating leases with terms expiring through
2025
exclusive of renewal option periods. At December 31, 2019, the weighted average remaining term of our leases was
3.3
years. A maturity analysis of our lease liability as of
December 31, 2019
is summarized as follows:
|
2020
|
$
|
16,652
|
|
|
2021
|
15,356
|
|
|
|
2022
|
13,102
|
|
|
|
2023
|
3,088
|
|
|
|
2024
|
697
|
|
|
|
Thereafter
|
654
|
|
|
|
49,549
|
|
||
|
Less: Adjustment to present value
|
(5,061
|
)
|
|
|
Total lease payments, net
|
$
|
44,488
|
|
|
(1)
|
At December 31, 2019, the weighted average of the discount rate used to estimate the present value was
7.5%
based on our incremental borrowing rate.
|
We converted rental commitments for our facilities outside the U.S. to U.S. dollars using exchange rates in effect at
December 31, 2019
. Operating lease cost for
2019
and Rent expense for
2018
and
2017
was
$26.1 million
,
$16.6 million
and
$18.8 million
, respectively. The operating lease cost for
2019
includes
$5.4 million
of variable lease expense.
We have subleased certain of our premises with terms expiring through
2022
. Sublease income for
2019
,
2018
and
2017
was
$1.5 million
,
$0.9 million
and
$0.8 million
, respectively. For
2020
,
2021
and
2022
, our future annual aggregate minimum sublease income is
$1.7 million
,
$1.6 million
and
$1.2 million
, respectively.
NRZ Relationship
Our Servicing segment has exposure to concentration risk and client retention risk. As of
December 31, 2019
, our servicing portfolio included significant client relationships with NRZ which represented
56%
and
61%
of our servicing portfolio UPB and loan count, respectively. The NRZ servicing portfolio accounts for approximately
74%
of all delinquent loans that Ocwen services. The current terms of our agreements with NRZ extend through June 2020, subject to an automatic renewal provision (legacy PMC agreement) and July 2022 (legacy Ocwen agreements).
Currently, subject to proper notice (generally 180 days’ notice), the payment of deboarding fees (in the case of the legacy PMC agreement) and termination fees (in the case of the legacy Ocwen agreements) and certain other provisions, NRZ has rights to terminate these agreements for convenience. Because of the large percentage of our servicing business that is represented by agreements with NRZ, if NRZ exercised all or a significant portion of these termination rights, we might need to right-size or restructure certain aspects of our servicing business as well as the related corporate support functions.
We currently account for the MSR sale agreements with NRZ as secured financings as the transactions did not achieve sale accounting treatment. Accordingly, our balance sheet reflects a
$915.1 million
MSR asset pledged to NRZ out of a total
$1.5 billion
MSRs at fair value at December 31, 2019, and a corresponding
$915.1 million
pledged MSR liability at fair value within Other financing liabilities. Similarly, our statement of operations reflects
$437.7 million
net servicing fee collected on behalf of, and remitted to NRZ out of a total
$975.5 million
Servicing and subservicing fees for the year ended December 31, 2019, and a corresponding
$437.7 million
expense reported within Pledged MSR liability expense. The
$437.7 million
net servicing fees collected on behalf of, and remitted to NRZ did not affect our net earnings. In addition, we recognize amortization income related to lump sum payments we received from NRZ in 2017 and 2018, through April 2020, with an outstanding unamortized balance of
$35.4 million
at December 31, 2019. The reporting of MSRs and revenue gross versus net in our financial statements is required until sale accounting criteria are met, upon the earliest of the terms of the agreements or any termination notice.
The NRZ agreements affect our net earnings through the recognition of subservicing fees we retain, which amounted
$139.3 million
for the year ended December 31, 2019, and ancillary income, which we estimated to be
$84.7 million
for the year ended December 31, 2019. If NRZ were to exercise its termination rights, our net earnings would be affected by the loss of such subservicing revenue and the decrease of operating expenses for servicing the NRZ portfolio and the associated corporate overhead allocation.
Selected assets and liabilities recorded on our consolidated balance sheets as well as the impacts to our consolidated statements of operations in connection with our NRZ agreements are disclosed in
Note 10 — Rights to MSRs
.
F-76
On February 20, 2020, we received a notice of termination from NRZ with respect to the subservicing agreement between NRZ and PMC, which accounted for
20%
of our servicing portfolio UPB at December 31, 2019. See
Note 28 — Subsequent Events
.
Note 26 — Contingencies
When we become aware of a matter involving uncertainty for which we may incur a loss, we assess the likelihood of any loss. If a loss contingency is probable and the amount of the loss can be reasonably estimated, we record an accrual for the loss. In such cases, there may be an exposure to potential loss in excess of the amount accrued. Where a loss is not probable but is reasonably possible or where a loss in excess of the amount accrued is reasonably possible, we disclose an estimate of the amount of the loss or range of possible losses for the claim if a reasonable estimate can be made, unless the amount of such reasonably possible loss is not material to our financial position, results of operations or cash flows. If a reasonable estimate of loss cannot be made, we do not accrue for any loss or disclose any estimate of exposure to potential loss even if the potential loss could be material and adverse to our business, reputation, financial condition and results of operations. An assessment regarding the ultimate outcome of any such matter involves judgments about future events, actions and circumstances that are inherently uncertain. The actual outcome could differ materially. Where we have retained external legal counsel or other professional advisers, such advisers assist us in making such assessments.
Litigation
In the ordinary course of business, we are a defendant in, or a party or potential party to, many threatened and pending legal proceedings, including proceedings brought by regulatory agencies (discussed further under “Regulatory” below), those brought on behalf of various classes of claimants, those brought derivatively on behalf of Ocwen against certain current or former officers and directors or others and those brought by commercial counterparties, including claims by parties to whom we have sold MSRs or other assets or those on whose behalf we service mortgage loans.
The majority of these proceedings are based on alleged violations of federal, state and local laws and regulations governing our mortgage servicing and lending activities, including, among others, the Dodd-Frank Act, the Gramm-Leach-Bliley Act, the FDCPA, the RESPA, the TILA, the Fair Credit Reporting Act, the Servicemembers Civil Relief Act, the Homeowners Protection Act, the Federal Trade Commission Act, the TCPA, the Equal Credit Opportunity Act, as well as individual state licensing and foreclosure laws and federal and local bankruptcy rules. Such proceedings include wrongful foreclosure and eviction actions, allegations of wrongdoing in connection with lender-placed insurance and mortgage reinsurance arrangements, claims relating to our property preservation activities, claims related to REO management, claims relating to our written and telephonic communications with our borrowers such as claims under the TCPA, claims related to our payment, escrow and other processing operations, claims relating to fees imposed on borrowers relating to payment processing, payment facilitation or payment convenience, claims related to ancillary products marketed and sold to borrowers, and claims regarding certifications of our legal compliance related to our participation in certain government programs. In some of these proceedings, claims for substantial monetary damages are asserted against us. For example, we are currently a defendant in various matters alleging that (1) certain fees imposed on borrowers relating to payment processing, payment facilitation or payment convenience violate the FDCPA and similar state laws, (2) certain fees we assess on borrowers are marked up improperly in violation of applicable state and federal law, (3) we breached fiduciary duties we purportedly owe to benefit plans due to the discretion we exercise in servicing certain securitized mortgage loans and (4) certain legacy mortgage reinsurance arrangements violated RESPA. In the future, we are likely to become subject to other private legal proceedings alleging failures to comply with applicable laws and regulations, including putative class actions, in the ordinary course of our business.
In view of the inherent difficulty of predicting the outcome of any threatened or pending legal proceedings, particularly where the claimants seek very large or indeterminate damages, including punitive damages, or where the matters present novel legal theories or involve a large number of parties, we generally cannot predict what the eventual outcome of such proceedings will be, what the timing of the ultimate resolution will be, or what the eventual loss, if any, will be. Any material adverse resolution could materially and adversely affect our business, reputation, financial condition, liquidity and results of operations.
Where we determine that a loss contingency is probable in connection with a pending or threatened legal proceeding and the amount of our loss can be reasonably estimated, we record an accrual for the loss. We have accrued for losses relating to threatened and pending litigation that we believe are probable and reasonably estimable based on current information regarding these matters. Where we determine that a loss is not probable but is reasonably possible or where a loss in excess of the amount accrued is reasonably possible, we disclose an estimate of the amount of the loss or range of possible losses for the claim if a reasonable estimate can be made, unless the amount of such reasonably possible loss is not material to our financial position, results of operations or cash flows. It is possible that we will incur losses relating to threatened and pending litigation that materially exceed the amount accrued. Our accrual for probable and estimable legal and regulatory matters, including accrued legal fees, was
$30.7 million
at
December 31, 2019
. We cannot currently estimate the amount, if any, of reasonably possible losses above amounts that have been recorded at
December 31, 2019
.
F-77
In 2014, plaintiffs filed a putative class action against Ocwen in the United States District Court for the Northern District of Alabama, alleging that Ocwen violated the FDCPA by charging borrowers a convenience fee for making certain loan payments. See
McWhorter et al. v. Ocwen Loan Servicing, LLC (N.D. Ala.)
. The plaintiffs sought statutory damages under the FDCPA, compensatory damages and injunctive relief. We subsequently entered into an agreement in principle to resolve this matter, and in August 2019, the court granted final approval of the class settlement. While we believe we had sound legal and factual defenses, we agreed to this settlement in order to avoid the uncertain outcome of litigation and the additional expense and demands on the time of our senior management that such litigation would involve. Our accrual with respect to this matter is included in the
$30.7 million
legal and regulatory accrual referenced above. We are also subject to individual lawsuits relating to our FDCPA compliance and putative state law class actions based on state laws similar to the FDCPA. At this time, we cannot estimate the amount, if any, of reasonably possible loss related to these matters.
Ocwen has been named in putative class actions and individual actions related to its compliance with the TCPA. Generally, plaintiffs in these actions allege that Ocwen knowingly and willfully violated the TCPA by using an automated telephone dialing system to call individuals’ cell phones without their consent. In July 2017, Ocwen entered into an agreement in principle to resolve two such putative class actions, which have been consolidated in the United States District Court for the Northern District of Illinois. See
Snyder v. Ocwen Loan Servicing, LLC (N.D. Ill.); Beecroft v. Ocwen Loan Servicing, LLC (N.D. Ill.)
. In October 2017, the court preliminarily approved the settlement and, thereafter, we paid a settlement amount into an escrow account held by the settlement administrator. However, in September 2018, the Court denied the motion for final approval. In November 2018, the parties engaged in mediation to address the issues raised by the Court in its denial order. The parties thereafter reached agreement on a revised settlement. In June 2019, the court entered an order approving the settlement, which provided for the establishment of a settlement fund to be distributed to class members that submit claims for settlement benefits pursuant to a claims administration process. While Ocwen believes that it has sound legal and factual defenses, Ocwen agreed to the settlement in order to avoid the uncertain outcome of litigation and the additional expense and demands on the time of its senior management that such litigation would involve.
Ocwen is also involved in a related TCPA class action that involves claims against trustees of RMBS trusts based on vicarious liability for Ocwen’s alleged non-compliance with the TCPA. The trustees have sought indemnification from Ocwen based on the vicarious liability claims. Additional lawsuits have been and may be filed against us in relation to our TCPA compliance. Our accrual with respect to TCPA matters is included in the
$30.7 million
legal and regulatory accrual referenced above. At this time, Ocwen is unable to predict the outcome of existing lawsuits or any additional lawsuits that may be filed, the possible loss or range of loss, if any, above the amount accrued or the potential impact such lawsuits may have on us or our operations. Ocwen intends to vigorously defend against these lawsuits. If our efforts to defend these lawsuits are not successful, our business, reputation, financial condition, liquidity and results of operations could be materially and adversely affected.
From time to time we are also subject to indemnification claims from contractual parties on whose behalf we service or subservice loans. We are currently involved in a dispute with a former subservicing client relating to alleged violations of our contractual agreements, including that we did not properly submit mortgage insurance and other claims for reimbursement. We are presently engaged in a dispute resolution process relating to these claims. Ocwen is currently unable to predict the outcome of this dispute or estimate the size of any loss which could result from a potential resolution reached through mediation, following litigation or otherwise.
We have settled two “opt-out” securities fraud actions brought on behalf of certain putative shareholders of Ocwen based on allegations in connection with the restatements of our 2013 and first quarter 2014 financial statements, among other matters.
See Brahman Partners et al. v. Ocwen Financial Corporation et al. (S.D. Fla.)
and
Owl Creek et al. v. Ocwen Financial Corporation et al.
(S.D. Fla.).
Both of these cases were dismissed with prejudice in February 2019.
We have previously disclosed that as a result of the federal and state regulatory actions taken in April 2017 and shortly thereafter, which are described below under “Regulatory”, and the impact on our stock price, several putative securities fraud class action lawsuits were filed against Ocwen and certain of its officers that contain allegations in connection with Ocwen’s statements concerning its efforts to satisfy the evolving regulatory environment, and the resources it devoted to regulatory compliance, among other matters. Those lawsuits were consolidated in the United States District Court for the Southern District of Florida in the matter captioned
Carvelli v. Ocwen Financial Corporation et al. (S.D. Fla.).
In April 2018, the court in Carvelli granted our motion to dismiss, and dismissed the consolidated case with prejudice. Plaintiffs thereafter filed a notice of appeal with the Court of Appeals for the Eleventh Circuit, and a hearing took place in June 2019. In August 2019, the Court of Appeals affirmed the district court’s ruling dismissing the consolidated case with prejudice. Plaintiffs had until November 13, 2019 to appeal to the United States Supreme Court, but did not do so. Therefore, the case remains dismissed with prejudice.
Over the past several years, lawsuits have been filed by RMBS trust investors alleging that the trustees and master servicers breached their contractual and statutory duties by (i) failing to require loan servicers to abide by their contractual obligations; (ii) failing to declare that certain alleged servicing events of default under the applicable contracts occurred; and (iii) failing to demand that loan sellers repurchase allegedly defective loans, among other things. Ocwen has received several letters from trustees and master servicers purporting to put Ocwen on notice that the trustees and master servicers may
F-78
ultimately seek indemnification from Ocwen in connection with the litigations. Ocwen has not yet been impleaded into any of these cases, but it has produced and continues to produce documents to the parties in response to third-party subpoenas.
Ocwen has, however, been impleaded as a third-party defendant into five consolidated loan repurchase cases first filed against Nomura Credit & Capital, Inc. in 2012 and 2013. Ocwen is vigorously defending itself in those cases against allegations by the mortgage loan seller-defendant that Ocwen failed to inform its contractual counterparties that it had discovered defective loans in the course of servicing them and had otherwise failed to service the loans in accordance with accepted standards. Ocwen is unable at this time to predict the ultimate outcome of these matters, the possible loss or range of loss, if any, associated with the resolution of these matters or any potential impact they may have on us or our operations. If, however, we were required to compensate claimants for losses related to the alleged loan servicing breaches, then our business, reputation, financial condition, liquidity and results of operations could be adversely affected.
In addition, several RMBS trustees have received notices of default alleging material failures by servicers to comply with applicable servicing agreements. Although Ocwen has not yet been sued by an RMBS trustee in response to a notice of default, there is a risk that Ocwen could be replaced as servicer as a result of said notices, that the trustees could take legal action on behalf of the trust certificateholders, or, under certain circumstances, that the RMBS investors who issue notices of default could seek to press their allegations against Ocwen, independent of the trustees. We are unable at this time to predict what, if any, actions any trustee will take in response to a notice of default, nor can we predict at this time the potential loss or range of loss, if any, associated with the resolution of any notices of default or the potential impact on our operations. If Ocwen were to be terminated as servicer, or other related legal actions were pursued against Ocwen, it could have an adverse effect on Ocwen’s business, reputation, financial condition, liquidity and results of operations.
Regulatory
We are subject to a number of ongoing federal and state regulatory examinations, consent orders, inquiries, subpoenas, civil investigative demands, requests for information and other actions. Where we determine that a loss contingency is probable in connection with a regulatory matter and the amount of our loss can be reasonably estimated, we record an accrual for the loss. Where we determine that a loss is not probable but is reasonably possible or where a loss in excess of the amount accrued is reasonably possible, we disclose an estimate of the amount of the loss or range of possible losses for the claim if a reasonable estimate can be made, unless the amount of such reasonably possible loss is not material to our financial position, results of operations or cash flows. It is possible that we will incur losses relating to regulatory matters that materially exceed any accrued amount. Predicting the outcome of any regulatory matter is inherently difficult and we generally cannot predict the eventual outcome of any regulatory matter or the eventual loss, if any, associated with the outcome.
To the extent that an examination, audit or other regulatory engagement results in an alleged failure by us to comply with applicable laws, regulations or licensing requirements, or if allegations are made that we have failed to comply with applicable laws, regulations or licensing requirements or the commitments we have made in connection with our regulatory settlements (whether such allegations are made through administrative actions such as cease and desist orders, through legal proceedings or otherwise) or if other regulatory actions of a similar or different nature are taken in the future against us, this could lead to (i) administrative fines and penalties and litigation, (ii) loss of our licenses and approvals to engage in our servicing and lending businesses, (iii) governmental investigations and enforcement actions, (iv) civil and criminal liability, including class action lawsuits and actions to recover incentive and other payments made by governmental entities, (v) breaches of covenants and representations under our servicing, debt or other agreements, (vi) damage to our reputation, (vii) inability to raise capital or otherwise fund our operations and (viii) inability to execute on our business strategy. Any of these occurrences could increase our operating expenses and reduce our revenues, hamper our ability to grow or otherwise materially and adversely affect our business, reputation, financial condition, liquidity and results of operations.
CFPB
In April 2017, the CFPB filed a lawsuit in the federal district court for the Southern District of Florida against Ocwen, OMS and OLS alleging violations of federal consumer financial laws relating to our servicing business dating back to 2014. The CFPB’s claims include allegations regarding (1) the adequacy of Ocwen’s servicing system and integrity of Ocwen’s mortgage servicing data, (2) Ocwen’s foreclosure practices and (3) various purported servicer errors with respect to borrower escrow accounts, hazard insurance policies, timely cancellation of private mortgage insurance, handling of customer complaints, and marketing of optional products. The CFPB alleges violations of laws prohibiting unfair, deceptive or abusive acts or practices, as well as violations of other laws or regulations. The CFPB does not claim specific monetary damages, although it does seek consumer relief, disgorgement of allegedly improper gains, and civil money penalties. We believe we have factual and legal defenses to the CFPB’s allegations and are vigorously defending ourselves. In September 2019, the court issued a ruling on our motion to dismiss, granting it in part and denying it in part. The court granted our motion dismissing the entire complaint without prejudice because the court found that the CFPB engaged in impermissible “shotgun pleading,” holding that the CFPB must amend its complaint to specifically allege and distinguish the facts between all claims. The CFPB filed an amended complaint in October 2019, and we filed our answer and affirmative defenses on November 1, 2019.
F-79
Prior to the initiation of legal proceedings, we had been engaged with the CFPB in efforts to resolve the matter and recorded
$12.5 million
as of December 31, 2016 as a result of these discussions. Our accrual with respect to this matter is included in the
$30.7 million
legal and regulatory accrual referenced above. The outcome of the matters raised by the CFPB, whether through negotiated settlements, court rulings or otherwise, could potentially involve monetary fines or penalties or additional restrictions on our business and could have a material adverse impact on our business, reputation, financial condition, liquidity and results of operations.
State Licensing, State Attorneys General and Other Matters
Our licensed entities are required to renew their licenses, typically on an annual basis, and to do so they must satisfy the license renewal requirements of each jurisdiction, which generally include financial requirements such as providing audited financial statements or satisfying minimum net worth requirements and non-financial requirements such as satisfactorily completing examinations as to the licensee’s compliance with applicable laws and regulations. Failure to satisfy any of the requirements to which our licensed entities are subject could result in a variety of regulatory actions ranging from a fine, a directive requiring a certain step to be taken, entry into a consent order, a suspension or ultimately a revocation of a license, any of which could have a material adverse impact on our results of operations and financial condition. In addition, we receive information requests and other inquiries, both formal and informal in nature, from our state financial regulators as part of their general regulatory oversight of our servicing and lending businesses. We also regularly engage with state attorneys general and the CFPB and, on occasion, we engage with other federal agencies, including the Department of Justice and various inspectors general on various matters, including responding to information requests and other inquiries. Many of our regulatory engagements arise from a complaint that the entity is investigating, although some are formal investigations or proceedings. The GSEs (and their conservator, FHFA), HUD, FHA, VA, Ginnie Mae, the United States Treasury Department, and others also subject us to periodic reviews and audits. We have in the past resolved, and may in the future resolve, matters via consent orders, payments of monetary amounts and other agreements in order to settle issues identified in connection with examinations or other oversight activities, and such resolutions could have material and adverse effects on our business, reputation, operations, results of operations and financial condition.
In April 2017 and shortly thereafter, mortgage and banking regulatory agencies from
29
states and the District of Columbia took regulatory actions against OLS and certain other Ocwen companies that alleged deficiencies in our compliance with laws and regulations relating to our servicing and lending activities. An additional state regulator brought legal action together with that state’s attorney general, as described below. In general, the regulatory actions took the form of orders styled as “cease and desist orders,” and we use that term to refer to all of the orders for ease of reference; for ease of reference we also include the District of Columbia as a state when we reference states below. All of the cease and desist orders were applicable to OLS, but additional Ocwen entities were named in some orders, including Ocwen Financial Corporation, OMS, Homeward, Liberty, OFSPL and Ocwen Business Solutions, Inc. (OBS).
We entered into agreements with all
29
states plus the District of Columbia to resolve these regulatory actions. These agreements generally contained the following key terms (the Multi-State Common Settlement Terms):
|
•
|
Ocwen would not acquire any new residential MSRs until April 30, 2018.
|
|
•
|
Ocwen would develop a plan of action and milestones regarding its transition from the REALServicing servicing system to an alternate servicing system and, with certain exceptions, would not board any new loans onto the REALServicing system.
|
|
•
|
In the event that Ocwen chose to merge with or acquire an unaffiliated company or its assets in order to effectuate a transfer of loans from the REALServicing system, Ocwen was required to comply with regulatory notice and waiting period requirements.
|
|
•
|
Ocwen would engage a third-party auditor to perform an analysis with respect to our compliance with certain federal and state laws relating to escrow by testing approximately
9,000
loan files relating to residential real property in various states, and Ocwen would develop corrective action plans for any errors identified by the third-party auditor.
|
|
•
|
Ocwen would develop and submit for review a plan to enhance our consumer complaint handling processes.
|
|
•
|
Ocwen would provide financial condition reporting on a confidential basis as part of each state’s supervisory framework through September 2020.
|
In addition to the terms described above, Ocwen entered into settlements with certain states on different or additional terms, which include making additional communications with and for borrowers, certain restrictions, certain review, reporting and remediation obligations, and the following additional terms:
|
•
|
Ocwen agreed with the Connecticut Department of Banking to pay certain amounts only in the event we fail to comply with certain requirements under our agreement with Connecticut.
|
|
•
|
In its agreement with the Maryland Office of the Commissioner of Financial Regulation, Ocwen agreed to complete an independent management assessment and enterprise risk assessment and to a prohibition, with certain de minimis exceptions, on repurchases of our stock until December 7, 2018. Ocwen also agreed to make certain payments to
|
F-80
Maryland, to provide remediation to certain borrowers in the form of cash payments or credits and to pay certain amounts only in the event we fail to comply with certain requirements under our agreement with Maryland.
|
•
|
Ocwen agreed with the Massachusetts Division of Banks to pay
$1.0 million
to the Commonwealth of Massachusetts Mortgage Education Trust. Ocwen and the Massachusetts regulatory agency also agreed on a schedule pursuant to which we would regain eligibility to acquire residential MSRs on Massachusetts loans (including loans originated by Ocwen) as we met certain thresholds in our transition to a new servicing system. Pursuant to this agreement, all restrictions on Massachusetts MSR acquisitions would be lifted when Ocwen completed the second phase of a three-phase data integrity audit. Having now completed both the first and second phases of this audit, Ocwen is no longer bound by any restriction on the volume of MSR acquisitions in Massachusetts.
|
|
•
|
Ocwen agreed with the Nebraska Department of Banking and Finance until April 30, 2019, to limit its growth through acquisition from correspondent relationships to no more than ten percent per year for Nebraska loans (based on the total number of loans held at the prior calendar year-end).
|
Accordingly, we have now resolved all of the administrative actions (but not all of the legal actions, which are described below) taken by state regulators in April 2017 and shortly thereafter.
We have taken substantial steps toward fulfilling our commitments under the agreements described above, including completing the transfer of loans to Black Knight MSP, completing pre-transfer and post-transfer data integrity audits as described above, developing and implementing certain enhancements to our consumer complaint process, engaging a third-party auditor who has completed the initial testing phase of its escrow review and ongoing reporting and information sharing.
Concurrent with the issuance of the cease and desist orders and the filing of the CFPB lawsuit discussed above,
two
state attorneys general took actions against us relating to our servicing practices. The Florida Attorney General, together with the Florida Office of Financial Regulation, filed a lawsuit in the federal district court for the Southern District of Florida against Ocwen, OMS and OLS alleging violations of federal and state consumer financial laws relating to our servicing business. These claims are similar to the claims made by the CFPB. The Florida lawsuit seeks injunctive and equitable relief, costs, and civil money penalties in excess of
$10,000
per confirmed violation of the applicable statute. In September 2019, the court issued its ruling on our motion to dismiss, granting it in part and denying it in part. The court granted our motion dismissing the entire complaint without prejudice because the court found that the plaintiffs engaged in impermissible “shotgun pleading,” holding that the plaintiffs must amend their complaint to specifically allege and distinguish the facts between all claims. The plaintiffs filed an amended complaint on November 1, 2019. We filed a partial motion to dismiss the amended complaint on December 6, 2019. We believe we have factual and legal defenses to the allegations raised in this lawsuit and are vigorously defending ourselves. The outcome of this lawsuit, whether through a negotiated settlement, court rulings or otherwise, could potentially involve monetary fines or penalties or additional restrictions on our business and could be materially adverse to our business, reputation, financial condition, liquidity and results of operations. Our accrual with respect to this matter is included in the
$30.7 million
litigation and regulatory matters accrual referenced above. We cannot currently estimate the amount, if any, of reasonably possible loss above the amount currently accrued.
The Massachusetts Attorney General filed a lawsuit against OLS in the Superior Court for the Commonwealth of Massachusetts alleging violations of state consumer financial laws relating to our servicing business, including with respect to our activities relating to lender-placed insurance and property preservation fees. In April 2019, we agreed to resolve this matter without admitting liability. The resolution includes a payment to the Commonwealth of Massachusetts of
$675,000
, a loan modification program for certain eligible Massachusetts borrowers, and certain already-completed relief. The settlement amount of
$675,000
was paid in April 2019.
Our accrual with respect to the administrative and legal actions initiated in April 2017 is included in the
$30.7 million
litigation and regulatory matters accrual referenced above. We have also incurred, and will continue to incur costs to comply with the terms of the settlements we have entered into, including the costs of conducting an escrow review, Maryland organizational assessments and Massachusetts data integrity audits, and costs relating to the transition to Black Knight MSP. With respect to the escrow review, although the initial testing phase is now complete, the third-party auditor continues its work, including drafting its final report. To the extent that errors that have been identified require remediation, we will incur costs in connection with remediating those errors. In addition, it is possible that legal or other actions could be taken against us with respect to such errors, which could result in additional costs or other adverse impacts. If we fail to comply with the terms of our settlements, additional legal or other actions could be taken against us. Such actions could have a materially adverse impact on our business, reputation, financial condition, liquidity and results of operations.
Certain of the state regulators’ cease and desist orders referenced a confidential supervisory memorandum of understanding (MOU) that we entered into with the Multistate Mortgage Committee (MMC) and
six
states relating to a servicing examination from 2013 to 2015. Among other things, the MOU prohibited us from repurchasing stock during the development of a going forward plan and, thereafter, except as permitted by the plan. We submitted a plan in 2016 that contained no stock repurchase restrictions and, therefore, we do not believe we are currently restricted from repurchasing stock. We requested confirmation
F-81
from the signatories of the MOU that they agree with this interpretation, and received affirmative responses from the MMC and
five
states, and a response declining to take a legal position from the remaining state.
On occasion, we engage with agencies of the federal government on various matters. For example, OLS received a letter from the Department of Justice, Civil Rights Division, notifying OLS that the Department of Justice had initiated a general investigation into OLS’s policies and procedures to determine whether violations of the Servicemembers Civil Relief Act by OLS might exist. The Department of Justice has informed us that it has decided not to take enforcement action related to this matter at this time and has, consequently, closed its investigation. In addition, Ocwen was named as a defendant in a HUD administrative complaint filed by a non-profit organization alleging discrimination in the manner in which the company maintains REO properties in minority communities. In February 2018, this matter was administratively closed, and similar claims were filed in federal court. We believe these claims are without merit and intend to vigorously defend ourselves.
In May 2016, Ocwen received a subpoena from the Office of Inspector General of HUD requesting the production of documentation related to HECM loans originated by Liberty. We understand that other lenders in the industry have received similar subpoenas. In April 2017, Ocwen received a subpoena from the Office of Inspector General of HUD requesting the production of documentation related to lender-placed insurance arrangements with a mortgage insurer and the amounts paid for such insurance. We understand that other servicers in the industry have received similar subpoenas. In May 2017, Ocwen received a subpoena from the Office of the Special Inspector General for the Troubled Asset Relief Program requesting documents and information related to Ocwen’s participation from 2009 to the present in the Treasury Department’s Making Home Affordable Program and its HAMP. We have been providing documents and information in response to these subpoenas. In April 2019, PMC received a subpoena from the VA Office of the Inspector General requesting the production of documentation related to the origination and underwriting of loans guaranteed by the Veterans Benefits Administration. We understand that other servicers in the industry have received similar subpoenas.
Loan Put-Back and Related Contingencies
Our contracts with purchasers of originated loans contain provisions that require indemnification or repurchase of the related loans under certain circumstances. While the language in the purchase contracts varies, they generally contain provisions that require us to indemnify purchasers of related loans or repurchase such loans if:
|
•
|
representations and warranties concerning loan quality, contents of the loan file or loan underwriting circumstances are inaccurate;
|
|
•
|
adequate mortgage insurance is not secured within a certain period after closing;
|
|
•
|
a mortgage insurance provider denies coverage; or
|
|
•
|
there is a failure to comply, at the individual loan level or otherwise, with regulatory requirements.
|
We received origination representations and warranties from our network of approved originators in connection with loans we purchased through our correspondent lending channel. To the extent that we have recourse against a third-party originator, we may recover part or all of any loss we incur.
We believe that, as a result of historical actions by investors, many purchasers of residential mortgage loans are particularly aware of the conditions under which originators must indemnify or repurchase loans and under which such purchasers would benefit from enforcing any indemnification rights and repurchase remedies they may have.
In our lending business, we have exposure to indemnification risks and repurchase requests. In our servicing business, claims alleging that we did not comply with our servicing obligations may require us to repurchase mortgage loans, make whole or otherwise indemnify investors or other parties. If home values were to decrease, our realized losses from loan repurchases and indemnifications may increase as well. As a result, our liability for repurchases may increase beyond our current expectations. If we are required to indemnify or repurchase loans that we originate and sell, or where we have assumed this risk on loans that we service, as discussed above, in either case resulting in losses that exceed our related liability, our business, financial condition and results of operations could be adversely affected.
We have exposure to origination representation, warranty and indemnification obligations relating to our lending, sales and securitization activities. We initially recognize these obligations at fair value. Thereafter, the estimation of the liability considers probable future obligations based on industry data of loans of similar type segregated by year of origination, to the extent applicable, and estimated loss severity based on current loss rates for similar loans, our historical rescission rates and the current pipeline of unresolved demands. Our historical loss severity considers the historical loss experience that we incur upon loan sale or collateral liquidation as well as current market conditions. We have exposure to servicing representation, warranty and indemnification obligations relating to our servicing practices. We record an accrual for a loss contingency if the loss contingency is probable and the amount can be reasonably estimated. We monitor the adequacy of the overall liability and make adjustments, as necessary, after consideration of our historical losses and other qualitative factors including ongoing dialogue and experience with our counterparties.
F-82
At
December 31, 2019
and
2018
, we had outstanding representation and warranty repurchase demands of
$47.0 million
UPB (
285
loans) and
$51.3 million
UPB (
316
loans), respectively. We review each demand and monitor through resolution, primarily through rescission, loan repurchase or make-whole payment.
The following table presents the changes in our liability for representation and warranty obligations, compensatory fees for foreclosures that may ultimately exceed investor timelines and similar indemnification obligations:
|
Years Ended December 31,
|
|||||||||||
|
2019
|
2018
|
2017
|
|||||||||
|
Beginning balance (1)
|
$
|
49,267
|
|
$
|
19,229
|
|
$
|
24,285
|
|
||
|
Provision (reversal) for representation and warranty obligations
|
(11,701
|
)
|
4,649
|
|
(1,371
|
)
|
|||||
|
New production reserves
|
304
|
|
7,437
|
|
702
|
|
|||||
|
Obligation assumed in connection with the acquisition of PHH
|
—
|
|
27,736
|
|
—
|
|
|||||
|
Charge-offs and other (2) (3)
|
12,968
|
|
(9,784
|
)
|
(4,387
|
)
|
|||||
|
Ending balance (1)
|
$
|
50,838
|
|
$
|
49,267
|
|
$
|
19,229
|
|
||
|
(1)
|
The liability for representation and warranty obligations and compensatory fees for foreclosures is reported in Other liabilities (a component of Liability for indemnification obligations) on our consolidated balance sheets.
|
|
(2)
|
Includes principal and interest losses realized in connection with repurchased loans, make-whole, indemnification and fee payments and settlements net of recoveries, if any.
|
|
(3)
|
Includes
$18.0 million
liability for representation and warranty obligations related to sold advances previously presented as allowance for losses. See
Note 7 — Advances
.
|
We believe that it is reasonably possible that losses beyond amounts currently recorded for potential representation and warranty obligations and other claims described above could occur, and such losses could have an adverse impact on our results of operations, financial condition or cash flows. However, based on currently available information, we are unable to estimate a range of reasonably possible losses above amounts that have been recorded at
December 31, 2019
.
Other
Ocwen, on its own behalf and on behalf of various mortgage loan investors, is engaged in a variety of activities to seek payments from mortgage insurers for unpaid claims, including claims where the mortgage insurers paid less than the full claim amount. Ocwen believes that many of the actions by mortgage insurers were in violation of the applicable insurance policies and insurance law. In some cases, Ocwen has entered into tolling agreements, initiated arbitration or litigation, engaged in settlement discussions, or taken other similar actions. To date, Ocwen has settled with four mortgage insurers, and expects the ultimate outcome to result in recovery of additional unpaid claims, although we cannot quantify the likely amount at this time.
We may, from time to time, have affirmative indemnification and other claims against parties from whom we acquired MSRs or other assets. We collected
$29.9 million
during the quarter ended December 31, 2017 under one such claim in connection with the acquisition of MSRs and advances in 2013. Although we pursue these claims, we cannot currently estimate the amount, if any, of further recoveries. Similarly, from time to time, indemnification and other claims are made against us by parties to whom we sold MSRs or other assets or by parties on whose behalf we service mortgage loans. We cannot currently estimate the amount, if any, of reasonably possible loss above amounts recorded.
F-83
Note 27 — Quarterly Results of Operations
(Unaudited)
|
|
Quarters Ended
|
||||||||||||||
|
|
December 31, 2019
|
September 30, 2019
|
June 30, 2019
|
March 31, 2019
|
|||||||||||
|
Revenue
|
$
|
261,171
|
|
$
|
283,660
|
|
$
|
274,493
|
|
$
|
304,051
|
|
|||
|
MSR valuation adjustments, net (1)
|
829
|
|
134,561
|
|
(147,268
|
)
|
(108,998
|
)
|
|||||||
|
Operating expenses
|
138,858
|
|
179,430
|
|
184,381
|
|
171,270
|
|
|||||||
|
Other income (expense), net
|
(85,899
|
)
|
(277,108
|
)
|
(27,177
|
)
|
(64,867
|
)
|
|||||||
|
Income (loss) before income taxes
|
37,243
|
|
(38,317
|
)
|
(84,333
|
)
|
(41,084
|
)
|
|||||||
|
Income tax expense
|
2,370
|
|
4,450
|
|
5,404
|
|
3,410
|
|
|||||||
|
Net income (loss) attributable to Ocwen stockholders
|
$
|
34,873
|
|
$
|
(42,767
|
)
|
$
|
(89,737
|
)
|
$
|
(44,494
|
)
|
|||
|
Earnings (loss) per share attributable to Ocwen stockholders
|
|||||||||||||||
|
Basic
|
$
|
0.26
|
|
$
|
(0.32
|
)
|
$
|
(0.67
|
)
|
$
|
(0.33
|
)
|
|||
|
Diluted
|
0.26
|
|
(0.32
|
)
|
(0.67
|
)
|
(0.33
|
)
|
|||||||
|
(1)
|
Positive valuation adjustments indicated in the above table represent fair value gains and negative valuation adjustments represent fair value losses.
|
|
Quarters Ended
|
|||||||||||||||
|
December 31, 2018 (1)
|
September 30, 2018
|
June 30, 2018
|
March 31, 2018
|
||||||||||||
|
Revenue
|
$
|
310,929
|
|
$
|
238,278
|
|
$
|
253,581
|
|
$
|
260,257
|
|
|||
|
MSR valuation adjustments, net
|
(61,762
|
)
|
(41,448
|
)
|
(33,118
|
)
|
(17,129
|
)
|
|||||||
|
Operating expenses
|
241,057
|
|
176,078
|
|
172,532
|
|
189,372
|
|
|||||||
|
Other income (expense), net (2)
|
(15,873
|
)
|
(61,025
|
)
|
(76,336
|
)
|
(48,791
|
)
|
|||||||
|
Income (loss) from continuing operations before income taxes
|
(7,763
|
)
|
(40,273
|
)
|
(28,405
|
)
|
4,965
|
|
|||||||
|
Income tax expense (benefit)
|
(4,012
|
)
|
845
|
|
1,348
|
|
2,348
|
|
|||||||
|
Income (loss) from continuing operations
|
(3,751
|
)
|
(41,118
|
)
|
(29,753
|
)
|
2,617
|
|
|||||||
|
Income from discontinued operations, net of income taxes
|
1,409
|
|
—
|
|
—
|
|
—
|
|
|||||||
|
Net income (loss)
|
(2,342
|
)
|
(41,118
|
)
|
(29,753
|
)
|
2,617
|
|
|||||||
|
Net income attributable to non-controlling interests
|
—
|
|
(29
|
)
|
(78
|
)
|
(69
|
)
|
|||||||
|
Net loss (income) attributable to Ocwen stockholders
|
$
|
(2,342
|
)
|
$
|
(41,147
|
)
|
$
|
(29,831
|
)
|
$
|
2,548
|
|
|||
|
Earnings (loss) per share attributable to Ocwen stockholders - Basic and Diluted
|
|||||||||||||||
|
Continuing operations
|
$
|
(0.03
|
)
|
$
|
(0.31
|
)
|
$
|
(0.22
|
)
|
$
|
0.02
|
|
|||
|
Discontinued operations
|
0.01
|
|
—
|
|
—
|
|
—
|
|
|||||||
|
$
|
(0.02
|
)
|
$
|
(0.31
|
)
|
$
|
(0.22
|
)
|
$
|
0.02
|
|
||||
|
(1)
|
The quarter ended December 31, 2018 includes the results of operations of PHH from the acquisition date of October 4, 2018 through December 31, 2018. See
Note 2 — Business Acquisition
for additional information.
|
|
(2)
|
Includes a bargain purchase gain, net of tax, of
$64.0 million
recognized during the quarter ended December 31, 2018 in connection with the acquisition of PHH.
|
Note 28 — Subsequent Events
On January 27, 2020, we entered into a Joinder and Second Amendment Agreement (the Amendment) which amends the Amended and Restated SSTL Facility Agreement dated as of December 5, 2016, as amended by a Joinder and Amendment Agreement dated as of March 18, 2019. The Amendment provides for a net prepayment of
$126.1 million
of the outstanding loan
F-84
amounts as of December 31, 2019 such that the facility has a maximum size and total initial outstanding amount of
$200.0 million
. The Amendment also (i) extends the maturity of the remaining outstanding loans under the SSTL to May 15, 2022, (ii) provides that the loans under the SSTL will bear interest at the one, two, three or six month Eurodollar Rate or the Base Rate (as defined in the SSTL), at our option, plus a margin of
6.00%
per annum for Eurodollar Rate loans or
5.00%
per annum for Base Rate loans (increasing to a margin of
6.50%
per annum for Eurodollar Rate loans or
5.50%
per annum for Base Rate loans on January 27, 2021) and (iii) provides for a prepayment premium of
2.00%
until January 27, 2022. The loans under the amended SSTL are subject to quarterly principal payments of
$5.0 million
.
On February 3, 2020, Ocwen’s Board of Directors authorized a share repurchase program for an aggregate amount of up to
$5.0 million
of Ocwen’s issued and outstanding shares of common stock. Repurchases may be made in open market transactions at prevailing market prices. The timing and execution of any related share repurchases is subject to market conditions, among other factors. Unless we amend the share repurchase program or repurchase the full
$5.0 million
amount by an earlier date, the share repurchase program will continue through February 3, 2021. No assurances can be given as to the amount of shares, if any, that we may repurchase in any given period.
On February 20, 2020, we received a notice of termination from NRZ with respect to the PMC subservicing agreement discussed in
Note 10 — Rights to MSRs
. The notice states that the effective date of termination is June 19, 2020 with respect to
25%
of the Initial Mortgage Loans under the agreement and August 18, 2020 for the remainder of the loans under the agreement. The portfolio subject to termination accounted for
$42.1 billion
in UPB, or
20%
of our total servicing portfolio UPB at December 31, 2019, and
$28.8 million
servicing fees, or
4%
of our total servicing and subservicing fees in 2019 (excluding ancillary income). The loans that were added by NRZ under the PMC subservicing agreement in 2019 and amounted to approximately
$6.6 billion
in UPB are subject to the termination with the stated effective date of August 18, 2020. At December 31, 2019, we reported a
$312.1 million
MSR asset at fair value for the servicing agreement subject to termination, or
3%
of our total assets, and a corresponding
$312.1 million
pledged MSR liability at fair value. In connection with the termination, we estimate that we will receive loan deboarding fees of approximately
$6.1 million
from NRZ. This termination is for convenience and not for cause. We intend to work with NRZ to transfer the servicing of the loans in an orderly manner. NRZ has not provided notice of termination with respect to its other servicing agreements.
F-85
TABLE OF CONTENTS
Part IItem 1. BusinessNote 23 Business Segment ReportingNote 10 Rights To MsrsNote 25 CommitmentsItem 1A. Risk FactorsNote 24 Regulatory RequirementsNote 26 ContingenciesItem 1B. Unresolved Staff CommentsItem 2. PropertiesItem 3. Legal ProceedingsItem 4. Mine Safety DisclosuresPart IIItem 5. Market For Registrant S Common Equity, Related Stockholder Matters and Issuer Purchases Of Equity SecuritiesItem 6. Selected Financial Data (dollars in Thousands, Except Per Share Data and Unless Otherwise Indicated)Note 1 Organization, Business Environment, Basis Of Presentation and Significant Accounting PoliciesNote 2 Business AcquisitionNote 20 Income TaxesNote 28 Subsequent EventsNote 14 BorrowingsNote 17 Derivative Financial Instruments and Hedging ActivitiesNote 5 Fair ValueNote 4 Securitizations and Variable Interest EntitiesNote 15 Other LiabilitiesItem 7A. Quantitative and Qualitative Disclosures About Market RiskItem 8. Financial Statements and Supplementary DataItem 9. Changes in and Disagreements with Accountants on Accounting and Financial DisclosureItem 9A. Controls and ProceduresItem 9B. Other InformationPart IIIItem 10. Directors, Executive Officers and Corporate GovernanceItem 11. Executive CompensationItem 12. Security Ownership Of Certain Beneficial Owners and Management and Related Stockholder MattersItem 13. Certain Relationships and Related Transactions, and Director IndependenceItem 14. Principal Accounting Fees and ServicesPart IVItem 15. Exhibits, Financial Statement SchedulesItem 16. Form 10-k SummaryNote 9 Mortgage ServicingNote 3 Cost Re-engineering PlanNote 6 Loans Held For SaleNote 7 AdvancesNote 8 Match Funded AssetsNote 11 ReceivablesNote 12 Premises and EquipmentNote 13 Other AssetsNote 16 EquityNote 18 Interest IncomeNote 19 Interest ExpenseNote 21 Basic and Diluted Earnings (loss) Per ShareNote 22 Employee Compensation and Benefit PlansNote 27 Quarterly Results Of Operations (unaudited)Note 27 Quarterly Results Of Operations