OPTION CARE HEALTH, INC.
10-Ks and 10-Qs
|
|
|
|
|
|
|
|
|
|
|
|
|
|
|
|
|
|
|
|
|
|
|
|
|
|
|
|
|
|
|
|
|
|
|
|
|
|
|
|
|
|
|
|
|
|
|
|
|
|
|
|
|
|
|
|
|
|
|
UNITED STATES
SECURITIES AND EXCHANGE COMMISSION
Washington, D.C. 20549
Form 10-K
|
(Mark One)
|
|
|
þ
|
ANNUAL REPORT PURSUANT TO SECTION 13 OR 15(d) OF THE SECURITIES EXCHANGE ACT OF 1934
|
|
|
For the fiscal year ended December 31, 2019
|
|
OR
|
|
|
o
|
TRANSITION REPORT PURSUANT TO SECTION 13 OR 15(d) OF THE SECURITIES EXCHANGE ACT OF 1934
|
|
|
For the transition period from to
|
Commission file number: 001-11993

OPTION CARE HEALTH, INC.
(Exact name of registrant as specified in its charter)
|
Delaware
|
05-0489664
|
|
(State of incorporation)
|
(I.R.S. Employer Identification No.)
|
|
3000 Lakeside Dr. Suite 300N, Bannockburn, IL
|
60015
|
|
(Address of principal executive offices)
|
(Zip Code)
|
Registrant’s telephone number, including area code:
312-940-2443
Securities registered pursuant to Section 12(b) of the Act:
|
Title of each class
|
Trading Symbol
|
Name of each exchange on which registered
|
|
Common Stock, $0.0001 par value per share
|
OPCH
|
Nasdaq Global Select Market
|
Securities registered pursuant to section 12(g) of the Act: None
Indicate by check mark if the registrant is a well-known seasoned issuer, as defined in Rule 405 of the Securities Act. Yes
o
No
þ
Indicate by check mark if the registrant is not required to file reports pursuant to Section 13 or Section 15(d) of the Act. Yes
o
No
þ
Indicate by check mark whether the registrant (1) has filed all reports required to be filed by Section 13 or 15(d) of the Securities Exchange Act of 1934 during the preceding 12 months (or for such shorter period that the registrant was required to file such reports), and (2) has been subject to such filing requirements for the past 90 days. Yes
þ
No
o
Indicate by check mark whether the registrant has submitted electronically every Interactive Data File required to be submitted pursuant to Rule 405 of Regulation S-T (§ 232.405 of this chapter) during the preceding 12 months (or for such shorter period that the registrant was required to submit such files). Yes
þ
No
£
Indicate by check mark whether the registrant is a large accelerated filer, an accelerated filer, or a non-accelerated filer, a smaller reporting company, or an emerging growth company. See definition of “large accelerated filer”, “accelerated filer”, “smaller reporting company” and “emerging growth company” in Rule 12b-2 of the Exchange Act.
Large accelerated filer
o
Accelerated filer
þ
Non-accelerated filer
o
Smaller reporting company
o
Emerging growth company
o
If an emerging growth company, indicate by check mark if the registrant has elected not to use the extended transition period for complying with any new or revised financial accounting standards provided pursuant to Section 13(a) of the Exchange Act.
o
Indicate by check mark whether the registrant is a shell company (as defined in Rule 12b-2 of the Exchange Act). Yes
o
No
þ
The aggregate market value of the registrant’s Common Stock held by non-affiliates of the registrant as of June 30, 2019, the last business day of the registrant’s most recently completed second fiscal quarter, was approximately
$337,013,747
based on the closing price of the registrant’s Common Stock on the Nasdaq Global Select Market on such date.
As of
March 3, 2020
, there were
176,703,983
shares of the registrant’s Common Stock outstanding.
DOCUMENTS INCORPORATED BY REFERENCE
Portions of the registrant’s definitive proxy statement for its
2020
Annual Meeting of Stockholders to be filed with the Securities and Exchange Commission (the “SEC”) within 120 days after the close of the registrant’s fiscal year are incorporated by reference into Part III of this Annual Report on Form 10-K.
TABLE OF CONTENTS
|
|
|
Page
Number
|
|
PART I
|
||
|
PART II
|
||
|
PART III
|
||
|
PART IV
|
||
|
|
||
|
|
||
2
Forward-Looking Statements
This Annual Report on Form 10-K (“Annual Report”) contains statements not purely historical and which may be considered forward-looking statements within the meaning of Section 27A of the Securities Act of 1933, as amended (the “Securities Act”), and Section 21E of the Securities Exchange Act of 1934, as amended (the “Exchange Act’), including statements regarding our expectations, beliefs, future plans and strategies, anticipated events or trends concerning matters that are not historical facts or that necessarily depend upon future events. In some cases, you can identify forward-looking statements by terms such as “may,” “will,” “should,” “could,” “would,” “expect,” “plan,” “anticipate,” “believe,” “estimate,” “project,” “predict,” “potential,” and similar expressions. This Annual Report contains, among others, forward-looking statements based upon current expectations that involve numerous risks and uncertainties, including those described in Item 1A “Risk Factors”.
Investors are cautioned that any such forward-looking statements are not guarantees of future performance, involve risks and uncertainties and that actual results may differ materially from those possible results discussed in the forward-looking statements as a result of various factors.
Do not place undue reliance on such forward-looking statements as they speak only as of the date they are made. Except as required by law, Option Care Health, Inc. assumes no obligation to publicly update or revise any forward-looking statement even if experience or future changes make it clear that any projected results expressed or implied therein will not be realized.
3
PART I
Item 1.
Business
Overview
Option Care Health, Inc. (“Option Care Health”, “we”, “us”, “our”, or the “Company”) is the largest independent provider of home and alternate site infusion services through its national network of
158
locations in
45
states. Option Care Health draws on nearly 40 years of clinical care experience to offer patient-centered, cost-effective infusion therapy. Option Care Health’s infusion services include the clinical management of infusion therapy, nursing support and care coordination. Option Care Health’s multidisciplinary team of approximately
2,900
clinicians, including pharmacists, pharmacy technicians, nurses and dietitians, are able to provide infusion service coverage for nearly all patients across the United States needing treatment for complex and chronic medical conditions.
HC Group Holdings II, Inc. (“HC II”) was incorporated under the laws of the State of Delaware on January 7, 2015, with its sole shareholder being HC Group Holdings I, LLC. (“HC I”). On April 7, 2015, HC I and HC II collectively acquired Walgreens Infusion Services, Inc. and its subsidiaries from Walgreen Co., and the business was rebranded as Option Care, Inc. (“Option Care”).
On March 14, 2019, HC I and HC II entered into a definitive agreement (the “Merger Agreement”) to merge with and into a wholly-owned subsidiary of BioScrip, Inc. (“BioScrip”), a national provider of infusion and home care management solutions, along with certain other subsidiaries of BioScrip and HC II. The merger contemplated by the Merger Agreement (the “Merger”) was completed on August 6, 2019 (the “Merger Date”). The Merger was accounted for as a reverse merger under the acquisition method of accounting for business combinations with Option Care being considered the accounting acquirer and BioScrip being considered the legal acquirer. Following the close of the transaction, BioScrip was rebranded as Option Care Health, Inc.
Option Care Health contracts with managed care organizations, third-party payers, hospitals, physicians, and other referral sources to provide pharmaceuticals and complex compounded solutions to patients for intravenous delivery in the patients’ homes or other nonhospital settings. The Company operates in one segment, infusion services.
The Company’s operating model enables it to provide favorable outcomes to its stakeholders as follows:
|
•
|
Patients
.
The Company improves patients’ quality of life by allowing them to receive infusion therapy at home or at one of its ambulatory infusion suites. In addition, the Company helps manage patients’ conditions through counseling and education regarding their treatment and by providing ongoing monitoring to encourage patient compliance with the prescribed therapy. The Company also provides services to help patients receive reimbursement benefits.
|
|
•
|
Payers
.
The Company provides payers with a comprehensive approach to meeting their pharmacy service needs and providing a cost-effective solution. The Company’s provision of infusion pharmacy services in the patient’s home or at one of its local ambulatory infusion suites offers a lower cost alternative to providing these therapies in a hospital setting. The Company also provides payers with utilization and outcome data to evaluate therapy effectiveness.
|
|
•
|
Physicians
.
The Company provides physicians with timely patient clinical support by providing care management related to their patients’ pharmacy needs and improving compliance with therapy protocols. The Company eliminates the need for physicians to carry inventories of high cost prescriptions by distributing the medications directly to patients’ homes. The Company either bills the payer directly or assists the patient in the submission of claims to the payer.
|
|
•
|
Pharmaceutical Manufacturers
.
The Company collaborates with pharmaceutical manufacturers to provide a broad distribution channel for their existing pharmaceuticals and their new product launches. The Company implements patient monitoring programs that encourage compliance with the prescribed therapy. The Company also provides valuable clinical information in the form of outcomes and compliance data to manufacturers to aid in their evaluation of the efficacy of their products.
|
Quality
Quality is at the core of the Company’s mission as it strives to deliver quality healthcare, leading to favorable outcomes and more cost-effective care. The Company offers comprehensive services that align with specific healthcare provider needs and has demonstrated success in improving outcomes across a broad range of therapies through improved clinical-reported patient adherence rates and decreased rates of un-planned hospital re-admissions.
4
The Company’s commitment to continuous quality improvement to provide optimal outcomes for its patients is evidenced by its national accreditations, including accreditations from Accreditation Commission for Health Care (“ACHC”), Pharmacy Compounding Accreditation Board (“PCAB”), American Society of Health-System Pharmacists (“ASHP”) and Utilization Review Accreditation Commission (“URAC”).
ACHC accreditation is awarded to healthcare organizations that meet regulatory requirements and accreditation standards, and PCAB accreditation offers the most comprehensive compliance solution in the industry based on more than 40 sterile compounding standards in the U.S. Pharmacopeia Pharmaceutical Compounding - Sterile Preparations Standards (“USP 797”).
Services
The Company is the largest independent provider of home and alternate site infusion services. The Company’s services are most typically provided in the patient’s home, but may also be provided at clinics, the physician’s office or at one of its ambulatory infusion suites. The Company provides a broad therapy portfolio through its network of
115
full service pharmacies and
43
stand-alone ambulatory infusion suites. The Company’s home infusion services include medication and supplies for administration and use at home or within one of its ambulatory infusion suites, consultation and education regarding the patient’s condition and the prescribed medication nursing support, clinical monitoring and assistance in monitoring potential side effects, and assistance in obtaining reimbursement. The Company administers a wide variety of therapies and services, including the following:
|
•
|
Immunoglobulin Infusion.
The Company offers industry-leading expertise, access, and support in immunoglobulin (“IG”) infusion therapy designed to treat immune deficiencies. Immune deficiencies are disorders that reduce the patient’s ability to identify and destroy substances that do not belong in the human body and are characterized by reduced levels of antibodies. Intravenous IG infusions are concentrated antibodies that have been purified from large numbers of human blood donors.
|
|
•
|
Anti-Infectives Infusion.
The Company provides comprehensive home infusion services to combat serious infections in patients of all ages. The Company’s anti-infective therapy and services help avoid hospitalizations for many infections that can be safely treated at home.
|
|
•
|
Nutrition Support Infusion.
The Company delivers comprehensive nutrition support across pediatric, adult, and geriatric patients. The Company’s expert team provides home parenteral nutrition and enteral nutrition support for numerous acute and chronic conditions negatively affecting nutritional status, such as stroke, cancer, and gastrointestinal diseases.
|
|
•
|
Bleeding Disorders Infusion.
As a leading provider of home infusion therapy for hemophilia and von Willebrand disease, the Company streamlines the administrative burdens associated with infusion therapies for bleeding disorders. The Company works with medical specialists across the country to offer access to all approved factor products, a full range of therapies, and dedicated support services. Hemophilia is one of the most costly diseases to treat. The treatment goal is to raise the level of the deficient clotting factor and maintain it to stop the bleeding. Treatments include infusion of the clotting factor products and other biologic prescription drugs. The length of treatment depends on the severity of the bleeding episode, and the need for treatment continues throughout the life of the patient.
|
|
•
|
Other.
The Company offers a range of other infusion therapies to treat a variety of conditions, including heart failure, pain management, chemotherapy and respiratory medication.
|
The Company also provides nursing services to support the above therapies, comprised of its nursing team of approximately
1,300
employees, and through its network of sub-contracted nursing agencies.
Sales and Marketing
The Company’s sales and marketing efforts focus on three primary objectives: (1) building new relationships and expanding existing contracts with managed care organizations; (2) establishing, maintaining and strengthening relationships with local and regional patient referral sources; and (3) establishing, maintaining existing and developing new relationships with pharmaceutical manufacturers to gain distribution access as they release new products.
The Company’s sales structure is focused on maintaining and expanding its relationships with drug manufacturers to establish its position as a participating provider when they release new products. In addition, the Company’s sales structure allows it to leverage its national managed care relationships to provide sales and contract pull-through by the Company’s local field-based sales personnel. This cross-utility enables the Company to market its services to numerous sources of patient referrals, including physicians, hospital discharge planners, hospital personnel, Health Maintenance Organizations (“HMOs”) and Preferred Provider Organizations (“PPOs”).
5
Competition
The Company competes in the large and highly fragmented home infusion market for contracts with managed care organizations and other third party payers to receive referrals from physicians, case managers and hospital discharge planners. Competition in the home infusion market is based on quality of care, clinical outcomes, pricing and cost of service, reputation, and reliability of service. Its competitors within the home infusion market include Coram CVS/specialty infusion services (a division of CVS Health), Accredo Health Group, Inc. (a unit of Cigna), Briova (a subsidiary of OptumRx, which is a unit of the United Healthcare Insurance Company) and various regional and local providers. The Company believes that its reputation for providing quality services, the strength of its growing national presence and its ability to effectively market its services at national, regional and local levels places it in a strong position against existing and potential competitors. The Company believes that the value created by the Merger has put the Company in a unique position to efficiently capture market share through its expanded footprint and synergies.
Intellectual Property
The Company owns a variety of trademarks, licenses, and service marks, including but not limited to: “Option Care Health”, “Option Care”, “Critical Care Systems”, “Clinical Specialties”, “BioScrip”, “BioScrip Infusion Services”, “BioScrip Nursing Services”, “BioScrip Pharmacy Services”, “CarePoint Partners”, “HomeChoice Partners”, “InfuScience”, “InfusionCare”, “Infusion Partners”, “Infusion Solutions”, “New England Home Therapies”, “Option Health”, “Professional Home Care Services”, “Wilcox Home Infusion”, “Home Solutions”, as well as several others.
Suppliers
The Company purchases pharmaceuticals and medical supplies through pharmaceutical manufacturers, distributors and group purchasing organizations. Through the coverage and clinical expertise of its
115
full service pharmacies, the Company provides pharmaceutical manufacturers with a broad distribution channel for its existing pharmaceutical products. Many of the pharmaceuticals that the Company purchases are available from multiple sources and are available in sufficient quantities to meet its needs and the needs of its patients. However, some drugs are only available through the manufacturer and may be subject to limits on distribution. In such cases, it is important the Company establishes and maintains good working relations with the manufacturer to secure sufficient supply to meet its patients’ needs. Additionally, certain drugs may become subject to supply shortages. Such shortages can result in cost increases or hamper the Company’s ability to obtain sufficient quantities to meet the needs of its patients. The Company actively manages its relationships with direct manufacturers and distributors to ensure consistent supply and cost-effective procurement. These relationships provide the Company the opportunity to become a selected partner in the launch of their new products. The Company may receive fees, which it records as other revenue, from certain biotech manufacturers for providing them with clinical outcomes data. The Company’s continued growth will be dependent on maintaining its existing relationships with manufacturers and establishing new relationships with additional manufacturers as the Company launches new specialty products.
For the year ended December 31, 2019, approximately
70%
of the Company’s pharmaceutical and medical supply purchases are from three vendors. Although there are a limited number of suppliers, the Company believes that other vendors could provide similar products on comparable terms. However, a change in suppliers could cause delays in service delivery and possible losses in revenue, which could adversely affect the Company’s financial condition or operating results.
Through the purchasing power of its national platform, the Company is able to negotiate favorable terms and economics, including volume purchase rebates and vendor administration fees. Such fees are recorded as reductions to cost of revenue when the pharmaceuticals are delivered to the patient.
Billing & Significant Payers
The Company generates most of its revenue from contracts with third party payers, including managed care organizations, insurance companies, self-insured employers, Medicare, and Medicaid programs. Where permissible, the Company bills patients for any amounts not reimbursed by third party payers. The majority of the Company’s infusion pharmacy revenue consists of reimbursement for both the cost of the pharmaceuticals sold and the cost of services provided. Pharmaceuticals are typically reimbursed on a percentage discount from the published average wholesale price (“AWP”) of each drug or on a percentage premium to average sales price (“ASP”). Nursing services are typically billed separately, while other patient support services, such as pharmacy compounding service, delivery service and ancillary medical supplies are reimbursed either separately or on a per diem basis, where applicable.
The Company’s largest payer is with United Health Group, which represented approximately
16%
of its revenue for the year ended December 31, 2019. No other single payer represented more than 10% of its revenue. The Company also provides services that are reimbursable through government healthcare programs such as Medicare and state Medicaid programs. For the
6
year ended December 31, 2019, approximately 12% of the Company’s revenue was directly reimbursable through governmental programs, such as Medicare and Medicaid.
Governmental Regulation
The home infusion industry is subject to extensive regulation by a number of federal, state and local governmental entities. The industry is also subject to frequent regulatory change. Laws and regulations in the healthcare industry are complex and, in many instances, the industry does not benefit from significant regulatory or judicial interpretation that would clarify how these laws and regulations should be applied. Moreover, the Company’s business is also impacted by certain laws and regulations that are applicable to its managed care and other clients. If the Company fails to comply with the laws and regulations directly applicable to its business, the Company could suffer civil and/or criminal penalties, and the Company could be excluded from participating in Medicare, Medicaid and other federal and state healthcare programs, which would have an adverse impact on its business.
Professional Licensure
Nurses, pharmacists and certain other healthcare professionals employed by the Company are required to be individually licensed or certified under applicable state law. The Company performs criminal and other background checks on employees and takes steps to ensure that its employees possess all necessary licenses and certifications, and the Company believes that its employees comply in all material respects with applicable licensure laws.
Pharmacy Licensing and Registration
State laws require that each of its pharmacy locations be licensed as an in-state pharmacy to dispense pharmaceuticals in that state. Certain states also require that its pharmacy locations be licensed as an out-of-state pharmacy if the Company delivers prescription pharmaceuticals into those states from locations outside of the state. The Company believes that it materially complies with all applicable state licensing laws. If the Company is unable to maintain its licenses or if states place burdensome regulations on non-resident pharmacies, its ability to operate in some states would be limited, which could have an adverse impact on its business. Laws enforced by the Drug Enforcement Administration (“DEA”), as well as some similar state agencies, require its pharmacy locations to individually register in order to handle controlled substances, including prescription pharmaceuticals. A separate registration is required at each principal place of business where the Company dispenses controlled substances. Federal and state laws also require that the Company follow specific labeling, reporting and record-keeping requirements for controlled substances. The Company maintains federal and state controlled substance registrations for each of its facilities that require such registration and follows procedures intended to comply with all applicable federal and state requirements regarding controlled substances.
Many states in which the Company operates also require home infusion companies to be licensed as home health agencies. The Company believes it is in compliance with these laws, as applicable.
The Company believes that it materially complies with all applicable state licensing laws, including any applicable change of control requirements that may have triggered in connection with the Merger.
Matters Affecting Drug Prices
Pricing benchmarks in the pharmacy industry are periodically published by third parties such as First DataBank, Medi-Span, RJ Health, and CMS, and the benchmark reimbursement varies by payer contract. The most commonly used benchmarks are AWP and ASP. AWP is based on self-reported prices charged by wholesalers and manufacturers. Reimbursement is generally AWP minus a percentage and may include a per diem fee or a fixed dispensing fee. ASP is based on actual sales transactions reported by wholesalers, and is generally lower than AWP. Reimbursement is generally ASP plus a percentage. The Company may also receive a fixed dispensing fee or a per diem fee for each day a patient is on service. Changes to these pricing benchmarks may have a significant impact on the profitability of the Company’s business.
Privacy and Security Requirements
The Health Insurance Portability and Accountability Act of 1996 (“HIPAA”) as amended by the Health Information Technology for Economic and Clinical Health Act (“HITECH”), and its implementing regulations regulate the use, disclosure, confidentiality, availability and integrity of individually identifiable health information, known as “protected health information,” and provide for a number of individual rights with respect to such information. The federal privacy regulations (the “Privacy Regulations”) are designed to protect health-related information that could be used to identify an individual’s protected health information.
The requirements imposed by HIPAA are extensive, and the Company has taken and intends to continue to take steps to ensure its policies and procedures are in compliance with the applicable provisions.
7
Regulations
Food, Drug and Cosmetic Act.
Certain provisions of the Food, Drug and Cosmetic Act (“FDCA”) govern the handling and distribution of pharmaceutical products. This law exempts many pharmaceuticals and medical devices from federal labeling and packaging requirements as long as they are not adulterated or misbranded and are dispensed in accordance with and pursuant to a valid prescription. The Company believes it complies with all applicable requirements. The FDCA also governs interstate commerce for pharmaceutical products. The Company cannot predict the impact of any proposed FDCA regulations on its ability to ship drugs to different states from its pharmacies.
The Drug Quality and Security Act (“DQSA”) amended the FDCA to grant the Food and Drug Administration (“FDA”) authority to regulate the manufacturing of compounded pharmaceutical drugs. The Company complies with the PCAB and Accreditation Standards for Sterile and Non-Sterile Pharmacy Compounding, and aggressively pursues accreditation from quality associations. The Company believes it complies in all material respects with all applicable requirements of a non-outsourcing-facility pharmacy.
The FDA also regulates certain medical devices, such as infusion pumps the Company uses to provide its services. In recent years, the FDA has increased its oversight of infusion pumps, resulting in additional requirements around patient education and adverse event reporting. The Company believes it complies in all material respects with all applicable requirements and that its employees have the level of proficiency required to use these devices and provide training to its patients.
Anti-Kickback Statute
. The federal Anti-Kickback Statute prohibits individuals and entities from knowingly and willfully paying, offering, receiving, or soliciting money or anything else of value in order to induce the referral of patients or to induce a person to purchase, lease, order, arrange for, or recommend services or goods covered by Medicare, Medicaid, or other government healthcare programs. The Anti-Kickback Statute is broad and potentially covers many standard business arrangements. A number of states also have statutes and regulations that prohibit the same general types of conduct as those prohibited by the Anti-Kickback Statute described above. Violations can lead to significant criminal or civil penalties, including imprisonment. The Office of the Inspector General (“OIG”) of the U.S. Department of Health and Human Services (“HHS”) has published clarifying regulations that identify a limited number of safe harbors from criminal enforcement or civil administrative actions. The Company attempts to structure its business relationships to comply with these statutes and to satisfy an applicable safe harbor where applicable. However, in situations where a business relationship does not fully satisfy the elements of a safe harbor, or where no safe harbor exists, the Company attempts to satisfy as many elements of an applicable safe harbor as possible.
False Claims Act
. The Company is subject to state and federal laws that govern the submission of claims for reimbursement. These laws generally prohibit an individual or entity from knowingly and willfully presenting a claim or causing a claim to be presented for payment from a federal healthcare program that is false or fraudulent. The standard for “knowing and willful” may include conduct that amounts to a reckless disregard for the accuracy of information presented to payers. Penalties under these statutes include substantial civil and criminal fines, exclusion from the Medicare or Medicaid programs and imprisonment. One of the most prominent of these laws is the federal False Claims Act, which may be enforced by the federal government directly or by a private plaintiff by filing a qui tam lawsuit on the government’s behalf. Under the False Claims Act, the government and private plaintiffs, if any, may recover monetary penalties in the amount of $5,500 to $11,000 per false claim, as well as an amount equal to three times the amount of damages sustained by the government as a result of the false claim. A number of states, including states in which the Company operates, have adopted their own false claims statutes as well as statutes that allow individuals to bring
qui tam
actions. The Company believes that it has procedures in place to ensure the accuracy of its claims.
Medicare Home Health CY 2020 Home Health Prospective Payment Systems Rate Update
. On October 31, 2019, the Centers for Medicare & Medicaid Services (“CMS”) issued a final rule that includes updates to payment policies, payment rates, and quality provisions for services. The final rule set forth routine updates to the home infusion therapy services for calendar year 2021 and subsequent years, and solicits comments on options to enhance future efforts to improve policies related to coverage of eligible drugs for home infusion therapy.
Ethics in Patient Referrals Law (Stark Law)
The Stark Law exempts certain business relationships that meet its exception requirements. However, unlike the Anti-Kickback Statute under which an activity may fall outside a safe harbor and still be lawful, a referral for certain Designated Health Services (“DHS”) that does not fall within an exception is strictly prohibited by the Stark Law. In addition to the Stark Law, many of the states in which the Company operates have comparable restrictions on the ability of physicians to refer patients for certain services to entities with which the Company has a financial relationship. Certain of these state statutes
8
mirror the Stark Law while others may be more restrictive. The Company attempts to structure all of its business relationships with physicians to comply with the Stark Law and any applicable state self-referral laws.
The federal Stark Law generally prohibits a physician from making referrals for certain DHS, reimbursable by Medicare or Medicaid, to entities with which the physician or an immediate family member has a financial relationship, unless an exception applies. A financial relationship is generally defined as an ownership, investment or compensation relationship. DHS includes outpatient pharmaceuticals, parenteral and enteral nutrition products, home health services, durable medical equipment, physical and occupational therapy services, and inpatient and outpatient hospital services. Among other sanctions, a civil monetary penalty may be imposed for each bill or claim for a service a person knows or should know is for a service for which payment may not be made due to the Stark Law. Such persons or entities are also subject to exclusion from the Medicare and Medicaid programs. Any person or entity participating in a circumvention scheme to avoid the referral prohibitions is liable for civil monetary penalties, and additional fines may be imposed for failure to comply with reporting requirements regarding an entity’s ownership, investment and compensation arrangements for each day for which reporting is required to have been made under the Stark Law.
Employees
As of December 31, 2019, the Company employed
5,081
persons on a full-time basis and
822
persons on a part-time basis. The majority of its part-time employees are clinicians due to the nature and timing of the services the Company provides.
Available Information
The Company’s corporate headquarters is located at 3000 Lakeside Drive, Suite 300N, Bannockburn, IL 60015. The Company maintains a website at http://www.optioncarehealth.com. The information contained on our website is not incorporated by reference into this Annual Report and should not be considered part of this report. Our Annual Reports on Form 10-K, Quarterly Reports on Form 10-Q, Current Reports on Form 8-K, and our Proxy Statements are available through our website at https://investors.optioncarehealth.com/, free of charge, as soon as reasonably practicable after they are filed with or furnished to the SEC.
The SEC maintains a website that contains reports, proxy and information statements, and other information regarding issuers that file electronically with the SEC at www.sec.gov.
Item 1A.
Risk Factors
Investors should carefully consider the following risk factors.
Our revenue and profitability will decline if the pharmaceutical industry undergoes certain changes, including limiting or discontinuing research, development, production and marketing of the pharmaceuticals that are compatible with the services we provide.
Our business is highly dependent on the ability of pharmaceutical manufacturers to develop, supply and market pharmaceuticals that are compatible with the services we provide. Our revenue and profitability will decline if those companies were to sell pharmaceuticals directly to the public, fail to support existing pharmaceuticals or develop new pharmaceuticals with different administration requirements than our service offerings are currently equipped to handle. Our business could also be harmed if the pharmaceutical industry experiences any supply shortages, pharmaceutical recalls, changes in the FDA approval processes, or changes to how pharmaceutical manufacturers finance, promote or sell pharmaceutical products. A reduction in the supply of and market for pharmaceuticals that are compatible with the services we provide may have a material adverse effect on our financial condition and results of operations.
If we lose relationships with managed care organizations (“MCOs”) and other non-governmental third party payers, we could lose access to a significant number of patients and our revenue and profitability could decline.
We are highly dependent on reimbursement from MCOs, government programs such as Medicare and Medicaid and commercial insurers (collectively, “Third Party Payers”). For the year ended December 31, 2019, 87% of our revenue came from managed care organizations and other nongovernmental payers, including Medicare Advantage plans, Managed Medicaid plans, pharmacy benefit managers (“PBM’s”), and self-pay patients. Many payers seek to limit the number of providers that supply pharmaceuticals to their enrollees in order to build volume that justifies their discounted pricing. From time to time, payers with whom we have relationships require that we bid against our competitors to keep their business. As a result of this bidding process, we may not be retained, and even if we are retained, the prices at which we are able to retain the business may be reduced. The loss of a payer relationship could significantly reduce the number of patients we serve and have a material adverse effect on our revenue and net income, and a reduction in pricing could reduce our gross margins and net income.
9
The healthcare industry is highly competitive.
The healthcare industry is highly competitive. We compete directly with national, regional and local healthcare providers. There are many other companies and individuals currently providing healthcare services that we provide, many of which have been in business longer and/or have substantially more resources. Other companies could enter the healthcare industry in the future and divert some or all of our business. We expect to continue to encounter competition in the future that could limit our ability to grow revenue and/or maintain acceptable pricing levels.
Some of our competitors have vertically integrated business models with commercial payers, or are under common control with, or owned by, pharmaceutical wholesalers and distributors, managed care organizations, PBMs or retail pharmacy chains and may be better positioned with respect to the cost-effective distribution of pharmaceuticals. In addition, some of our competitors may have secured long-term supply or distribution arrangements for prescription pharmaceuticals necessary to treat certain chronic disease states on price terms substantially more favorable than the terms currently available to us. Consequently, we may be less price competitive than some of these competitors with respect to certain pharmaceutical products.
Accountable Care Organizations (“ACOs”) and other clinical integration models may result in lower reimbursement rates. Some of our competitors may negotiate exclusivity provisions with managed care plans or otherwise interfere with the ability of managed care companies to contract with us. Increasing consolidation in the payer and supplier industries, including vertical integration efforts among insurers, providers, and suppliers, and cost-reduction strategies by large employer groups and their affiliates may limit our ability to negotiate favorable terms and conditions in our contracts and otherwise intensify competitive pressure. In addition, our competitive position could be adversely affected by any inability to obtain access to new biotech pharmaceutical products.
Delays in reimbursement may adversely affect our liquidity, cash flows and operating results.
The reimbursement process for the services we provide is complex, resulting in delays between the time we bill for a service and receipt of payment that can be significant. Reimbursement and procedural issues often require us to resubmit claims multiple times and respond to multiple administrative requests before payment is remitted. The collection of accounts receivable is challenging, and requires constant focus and involvement by management and ongoing enhancements to information systems and billing center operating procedures. While management believes that our controls and processes are satisfactory, there can be no assurance that collections of accounts receivable will continue at historical rates. The risks associated with Third Party Payers and the inability to collect outstanding accounts receivable could have a material adverse effect on our liquidity, cash flows and operating results.
We are subject to pricing pressures and other risks involved with Third Party Payers.
Competition to provide healthcare services, efforts by traditional Third Party Payers to contain or reduce healthcare costs, and the increasing influence of managed care payers such as health maintenance organizations, has resulted in reduced rates of reimbursement for home infusion and specialty pharmacy services. Changes in reimbursement policies of governmental Third Party Payers, including policies relating to Medicare, Medicaid and other federal and state funded programs, could reduce the amounts reimbursed to our customers for our products and, in turn, the amount these customers would be willing to pay for our products and services, or could directly reduce the amounts payable to us by such payers. Pricing pressures by Third Party Payers may continue, and these trends may adversely affect our business.
Also, continued growth in managed care plans has pressured healthcare providers to find ways of becoming more cost competitive. MCOs have grown substantially in terms of the percentage of the population they cover and in terms of the portion of the healthcare economy they control. MCOs have continued to consolidate to enhance their ability to influence the delivery of healthcare services and to exert pressure to control healthcare costs. A rapid concentration of revenue derived from individual managed care payers could harm our business.
If we are unable to maintain relationships with existing patient referral sources, our business and consolidated financial condition, results of operations, and cash flows could be materially adversely affected.
Our success depends on referrals from physicians, hospitals, and other sources in the communities we serve and on our ability to maintain good relationships with existing referral sources. Our referral sources are not contractually obligated to refer patients to us and may refer their patients to other providers. Our growth and profitability depends, in part, on our ability to establish and maintain close working relationships with these patient referral sources, and to increase awareness and acceptance of the benefits of home infusion by our referral sources and their patients. Our loss of, or failure to maintain, existing
10
relationships or our failure to develop new referral relationships could have a material adverse effect on our business and consolidated financial condition, results of operations, and cash flows.
Changes in industry pricing benchmarks could adversely affect our financial performance.
Our contracts generally use certain published benchmarks to establish pricing for the reimbursement of prescription medications we dispense. These benchmarks include AWP, wholesale acquisition cost, and average manufacturer price. Many of our contracts utilize the AWP benchmark. Publication of the AWP benchmark was expected to cease in 2011 as a result of the settlement of class-action lawsuits brought against First DataBank and Medi-Span, third-party publishers of various pricing benchmarks. However, Medi-Span continues to publish the AWP benchmark and has indicated that it will continue to do so until a new benchmark is widely accepted. Several industry participants have explored establishing a new benchmark but there is not currently a viable generally accepted alternative to the AWP benchmark. Without a suitable pricing benchmark in place, many of our contracts will have to be modified and could potentially change the economic structure of our agreements.
Pending and future litigation could subject us to significant monetary damages and/or require us to change our business practices.
We employ pharmacists, dieticians, nurses and other health care professionals. We are subject to liability for negligent acts, omissions, or injuries occurring at one of these clinics or caused by one of our employees. We are subject to risks relating to asserted claims, litigation and other proceedings in connection with our operations. We are or may face claims or become a party to a variety of legal actions that affect our business, including breach of contract actions, employment and employment discrimination-related suits, employee benefit claims, stockholder suits and other securities laws claims, and tort claims. Due to the nature of our business, we, through our employees and caregivers who provide services on our behalf, may be the subject of medical malpractice claims. A court could find these individuals should be considered our agents, and, as a result, we could be held liable for their acts or omissions.
We may incur substantial expenses in defending such claims or litigation, regardless of merit, and such claims or litigation could result in a significant diversion of the efforts of our management personnel. Successful claims against us may result in monetary liability or a material disruption in the conduct of our business. Similarly, if we settle such legal proceedings, it may affect how we operate our business. See Item 3 for a description of material proceedings pending against us. We believe that these suits are without merit and, to the extent not already concluded, intend to contest them vigorously. However, an adverse outcome in one or more of these suits may have a material adverse effect on our consolidated results of operations, consolidated financial position, and/or consolidated cash flow from operations, or may require us to make material changes to our business practices.
We may be subject to liability claims for damages and other expenses that are not covered by insurance.
As a result of operating in the home infusion industry, our business entails an inherent risk of claims, losses and potential lawsuits alleging incidents involving our employees that are likely to occur in a patient’s home. We maintain professional liability insurance to provide coverage to us and our subsidiaries against these risks. A successful product or professional liability claim in excess of our insurance coverage could harm our consolidated financial statements. Various aspects of our business may subject us to litigation and liability for damages. For example, a prescription drug dispensing error could result in a patient receiving the wrong or incorrect amount of medication, leading to personal injury or death. Our business and consolidated financial statements could suffer if we pay damages or defense costs in connection with a claim that is outside the scope of any applicable contractual indemnity or insurance coverage.
Our insurance coverage also includes fire, property damage and general liability with varying limits. We cannot assure that the insurance we maintain will satisfy claims made against us or that insurance coverage will continue to be available to us at commercially reasonable rates, in adequate amounts or on satisfactory terms. Any claims made against us, regardless of their merit or eventual outcome, could damage our reputation and business.
Pressures relating to downturns in the economy could adversely affect our business and consolidated financial statements.
Medicare and other federal and state payers account for a portion of our revenues. During economic downturns and periods of stagnant or slow economic growth, federal and state budgets are typically negatively affected, resulting in reduced reimbursements or delayed payments by the federal and state government health care coverage programs in which we participate, including Medicare, Medicaid, and other federal or state assistance plans. Government programs could also slow or temporarily suspend payments, negatively impacting our cash flow and increasing our working capital needs and interest
11
payments. We have seen, and believe we will continue to see, Medicare and state Medicaid programs institute measures aimed at controlling spending growth, including reductions in reimbursement rates.
Higher unemployment rates and significant employment layoffs and downsizings may lead to lower numbers of patients enrolled in employer-provided plans. Adverse economic conditions could also cause employers to stop offering, or limit, healthcare coverage, or modify program designs, shifting more costs to the individual and exposing us to greater credit risk from patients or the discontinuance of therapy.
Acquisitions, strategic investments and strategic relationships involve certain risks.
We may pursue acquisitions, strategic investments in, or strategic relationships with businesses and technologies. Acquisitions may entail numerous risks, including difficulties in assessing values for acquired businesses, intangible assets and technologies, difficulties in the assimilation of acquired operations and products, diversion of management’s attention from other business concerns, assumption of unknown material liabilities of acquired companies, amortization of acquired intangible assets which could reduce future reported earnings, and potential loss of clients or key employees of acquired companies. We may not be able to successfully fully integrate the operations, personnel, services or products that we have acquired or may acquire in the future. Strategic investments may also entail some of the risks described above. If these investments are unsuccessful, we may need to incur charges against earnings. We may also pursue a number of strategic relationships. These relationships and others we may enter into in the future may be important to our business and growth prospects. We may not be able to maintain these relationships or develop new strategic alliances.
Changes in our relationships with pharmaceutical suppliers, including changes in drug availability or pricing, could adversely affect our business and financial results.
We have contractual relationships with pharmaceutical manufacturers to purchase the pharmaceuticals that we dispense. In order to have access to these pharmaceuticals, and to be able to participate in the launch of new pharmaceuticals, we must maintain a good working relationship with these manufacturers. Most of the manufacturers of the pharmaceuticals we sell have the right to cancel their supply contracts with us without cause and after giving only minimal notice. Any changes to these relationships, including, but not limited, to loss of a manufacturer relationship, drug shortages or changes in pricing, could have an adverse effect on our business and financial results.
Some pharmaceutical manufacturers attempt to limit the number of preferred distributors that may market certain of their pharmaceutical products. We cannot provide assurance that we will be selected and retained as a preferred distributor or can remain a preferred distributor to market these products. Although we believe we can effectively meet our suppliers’ requirements, we cannot provide assurance that we will be able to compete effectively with other providers to retain our position as a distributor of each of our core products. Adverse developments with respect to this trend could have a material adverse effect on our financial condition and results of operations.
A disruption in supply could adversely impact our business.
For the year ended December 31, 2019, approximately 70% of our pharmaceutical and medical supply purchases are from three vendors. Most of the pharmaceuticals that we purchase are available from multiple sources, and we believe they are available in sufficient quantities to meet our needs and the needs of our patients. We keep safety stock to ensure continuity of service for reasonable, but limited, periods of time. Should a supply disruption result in the inability to obtain especially high margin drugs and compound components necessary for patient care, our consolidated financial statements could be negatively impacted.
A shortage of qualified registered nursing staff, pharmacists and other professionals could adversely affect our ability to attract, train and retrain qualified personnel and could increase operating costs.
Our business relies on our ability to attract and retain nursing staff, pharmacists and other professionals who possess the skills, experience and licenses necessary to meet the requirements of their job responsibilities. From time to time and particularly in recent years, there have been shortages of nursing staff, pharmacists and other professionals in certain local and regional markets. As a result, we are often required to compete for personnel with other healthcare systems and our competitors. Our ability to attract and retain personnel depends on several factors, including our ability to provide them with engaging assignments and competitive salaries and benefits. We may not be successful in any of these areas.
In addition, where labor shortages arise in markets in which we operate, we may face higher costs to attract personnel, and we may have to provide them with more attractive benefit packages than originally anticipated or are being paid in other
12
markets where such shortages do not exist at the time. In either case, such circumstances could cause our profitability to decline. Finally, if we expand our operations into geographic areas where healthcare providers historically have unionized or unionization occurs in our existing geographic areas, negotiating collective bargaining agreements may have a negative effect on our ability to timely and successfully recruit qualified personnel and on our financial results. If we are unable to attract and retain nursing staff, pharmacists and other professionals, the quality of our services may decline and we could lose patients and referral sources, which could have a material adverse effect on our business and consolidated financial condition, results of operations and cash flows.
Introduction of new drugs or accelerated adoption of existing lower margin drugs could cause us to experience lower revenues and profitability when prescribers prescribe these drugs for their patients or they are mandated by Third Party Payers.
The pharmaceutical industry pipeline of new drugs includes many drugs that over the long term may replace older, more expensive therapies. As a result of such older drugs losing patent protection and being replaced by generic substitutes, new and less expensive delivery methods (such as when an infusion or injectable drug is replaced with an oral drug) or additional products are added to a therapeutic class, thereby increasing price competition among competing manufacturer’s products in that therapeutic category. In such cases, manufacturers have the ability to increase drug acquisition costs or lower the selling price of replaced products. This could negatively impact our revenues and/or margins.
Failure to develop new services or adapt to changes and trends within the industry may adversely affect our business.
We operate in a highly competitive environment. We develop new services from time to time to assist our clients. If we are unsuccessful in developing innovative services, our ability to attract new clients and retain existing clients may suffer.
Technology, including the ability to capture and report outcomes, is also an important component of our business as we continue to utilize new and better channels to communicate and interact with our clients, members and business partners. If our competitors are more successful than us in employing this technology, our ability to attract new clients, retain existing clients and operate efficiently may suffer. Any significant shifts in the structure of the healthcare products and services industry in general could alter the industry dynamics and adversely affect our ability to attract or retain clients. Our failure to anticipate or appropriately adapt to changes in the industry could negatively impact our competitive position and adversely affect our business and results of operations.
Cybersecurity risks could compromise our information and expose us to liability, which may harm our ability to operate effectively and may cause our business and reputation to suffer.
Cybersecurity refers to the combination of technologies, processes and procedures established to protect information technology systems and data from unauthorized access, attack, or damage. We rely on our information systems to provide security for processing, transmission and storage of confidential information about our patients, customers and personnel, such as names, addresses and other individually identifiable information protected by HIPAA and other privacy laws. Cyber incidents can result from deliberate attacks or unintentional events. Cyber-attacks are increasingly more common, including in the health care industry. The regulatory environment surrounding information security and privacy is increasingly demanding, with the frequent imposition of new and changing requirements. Compliance with changes in privacy and information security laws and with rapidly evolving industry standards may result in our incurring significant expense due to increased investment in technology and the development of new operational processes.
We have not experienced any known attacks on our information technology systems that compromised any confidential information. We maintain our information technology systems with safeguard protection against cyber-attacks including passive intrusion protection, firewalls and virus detection software. However, these safeguards do not ensure that a significant cyber-attack could not occur. Although we have taken steps to protect the security of our information systems and the data maintained in those systems, it is possible that our safety and security measures will not prevent the systems’ improper functioning or damage or the improper access or disclosure of personally identifiable information such as in the event of cyber-attacks.
Security breaches, including physical or electronic break-ins, computer viruses, attacks by hackers and similar breaches can create system disruptions or shutdowns or the unauthorized use or disclosure of confidential information. If personal information or protected health information is improperly accessed, tampered with or disclosed as a result of a security breach, we may incur significant costs to notify and mitigate potential harm to the affected individuals, and we may be subject to sanctions and civil or criminal penalties if we are found to be in violation of the privacy or security rules under HIPAA or other similar federal or state laws protecting confidential personal information. In addition, a security breach of our information
13
systems could damage our reputation, subject us to liability claims or regulatory penalties for compromised personal information and could have a material adverse effect on our business, financial condition, and results of operations.
Our business is dependent on the services provided by third party information technology vendors.
Our information technology infrastructure includes hosting services provided by third parties. While we believe these third parties are high-performing organizations with secure platforms and customary certifications, they could suffer a security breach or business interruption which in turn could impact our operations negatively. In addition, changes in pricing terms charged by our technology vendors may adversely affect our financial performance.
Changes in future business conditions could cause business investments and/or recorded goodwill to become impaired, and our financial condition, and results of operations could suffer if there is an impairment of goodwill.
Our acquisitions resulted in significant goodwill reported on our financial statements. Goodwill results when the purchase price exceeds the fair value of the net identifiable tangible and intangible assets acquired. We may not realize the full value of this goodwill. As such, we evaluate on at least an annual basis whether events and circumstances indicate that all or some of the carrying value of goodwill is no longer recoverable, in which case we would recognize the unrecoverable goodwill as a charge against our earnings. When evaluating goodwill for potential impairment, we compare the fair value of our reporting units to their respective carrying amounts. We estimate the fair value of our reporting units using the income approach. If the carrying amount of a reporting unit exceeds its estimated fair value, a goodwill impairment loss is recognized in an amount equal to the excess to the extent of the goodwill balance. The income approach requires us to estimate a number of factors for our reporting units, including projected future operating results, economic projections, anticipated future cash flows, and discount rates. The fair value determined using the income approach is then compared to marketplace fair value data from within a comparable industry grouping for reasonableness. Because of the significance of our goodwill, any future impairment could result in material non-cash charges to our results of operations, which could have an adverse effect on our financial condition and results of operations.
Failure to maintain effective internal control over our financial reporting could have an adverse effect on our ability to report our financial results on a timely and accurate basis.
Our management is responsible for establishing and maintaining adequate internal control over financial reporting, as defined in Rule 13a-15(f) under the Securities Exchange Act of 1934 (the “Exchange Act”), and is required to evaluate the effectiveness of these controls and procedures on a periodic basis and publicly disclose the results of these evaluations and related matters in accordance with the requirements of Section 404 of the Sarbanes-Oxley Act of 2002. Effective internal control over financial reporting is necessary for us to provide reliable financial reports, to help mitigate the risk of fraud and to operate successfully. Any failure to implement and maintain effective internal controls could result in material weaknesses or material misstatements in our consolidated financial statements.
If we fail to maintain effective internal control over financial reporting, or our independent registered public accounting firm is unable to provide us with an unqualified attestation report on our internal control, we may be required to take corrective measures or restate the affected historical financial statements. In addition, we may be subjected to investigations and/or sanctions by federal and state securities regulators, and/or civil lawsuits by security holders. Any of the foregoing could also cause investors to lose confidence in our reported financial information and in us and would likely result in a decline in the market price of our stock and in our ability to raise additional financing if needed in the future.
Acts of God such as major weather disturbances could disrupt our business.
We operate in a network of prescribers, providers, patients and facilities that can be negatively impacted by local weather disturbances and other force majeure events. For example, in anticipation of major weather events, patients with impaired health may be moved to alternate sites. After a major weather event, availability of electricity, clean water and transportation can impact our ability to provide service in the home. Similarly, such events could impact key suppliers or vendors, disrupting the services or materials they provide us. In addition, acts of God and other force majeure events may cause a reduction in our business or increased costs, such as increased costs in our operations as we incur overtime charges or redirect services to other locations, delays in our ability to work with payers, hospitals, physicians and other strategic partners on new business initiatives, and disruption to referral patterns as patients are moved out of facilities affected by such events or are unable to return to sites of service in the home.
14
An outbreak of a pandemic or epidemic disease could adversely affect our financial performance.
An outbreak of a pandemic or epidemic disease could result in a general economic downturn, supply chain disruption, and/or a compromise in the ability of our clinicians to access patients, any of which, or a combination of which, could have a material adverse effect on our business and financial results.
A significant change in, or noncompliance with, governmental regulations and other legal requirements could have a material adverse effect on our reputation and profitability
We operate in complex, highly regulated environments and could be materially and adversely affected by changes to applicable legal requirements including the related interpretations and enforcement practices, new legal requirements and/or any failure to comply with applicable regulations. Our home infusion and alternate site infusion businesses are subject to numerous federal, state and local regulations including licensing and other requirements for pharmacies and reimbursement arrangements.
The federal and state statutes and regulations to which we are subject include, but are not limited to, laws requiring the registration and regulation of pharmacies; laws governing the dispensing of pharmaceuticals and controlled substances; laws regulating the protection of the environment and health and safety matters, including those governing exposure to, and the management and disposal of, hazardous substances; laws regarding food and drug safety, including those of the FDA and DEA; applicable governmental payer regulations, including those applicable to Medicare and Medicaid; data privacy and security laws, including HIPAA and its associated regulations; federal and state fraud and abuse laws, including, but not limited to, the anti-kickback statute and false claims laws; trade regulations, including those of the U.S. Federal Trade Commission (“FTC”); the U.S. Foreign Corrupt Practices Act (the “FCPA”) and similar anti-corruption laws in connection with the services provided by certain of our contractors; and the consumer protection and safety laws, including those of the Consumer Product Safety Commission.
We are required to hold valid DEA and state-level licenses, meet various security and operating standards and comply with the federal and various state controlled substance acts and related regulations governing the sale, dispensing, disposal, holding and distribution of controlled substances. The DEA, FDA and state regulatory authorities have broad enforcement powers, including the ability to seize or recall products and impose significant criminal, civil and administrative sanctions for violations of these laws and regulations.
We use, disclose and otherwise process personally identifiable information, including health information, making us subject to HIPAA and other federal and state privacy and security regulations and failure to comply with those regulations or to adequately secure the information we hold could result in significant liability or reputational harm and, in turn, have a material adverse effect on our patient base and revenue.
We are also governed by federal and state laws of general applicability, including laws regulating matters of working conditions, health and safety and equal employment opportunity and other labor and employment matters as well as employee benefit, competition and antitrust matters. In addition, we could have significant exposure if we are found to have infringed another party’s intellectual property rights.
Changes in laws, regulations and policies and the related interpretations and enforcement practices may alter the landscape in which we do business and may significantly affect our cost of doing business. The impact of new laws, regulations and policies and the related interpretations and enforcement practices generally cannot be predicted, and changes in applicable laws, regulations and policies and the related interpretations and enforcement practices may require extensive system and operational changes, be difficult to implement, increase our operating costs and require significant capital expenditures. Untimely compliance or noncompliance with applicable laws and regulations could result in the imposition of civil and criminal penalties that could adversely affect the continued operation of our businesses, including: suspension of payments from government programs; loss of required government certifications; loss of authorizations to participate in or exclusion from government programs, including the Medicare and Medicaid programs; loss of licenses; and significant fines or monetary penalties. Any failure to comply with applicable regulatory requirements could result in significant legal and financial exposure, damage our reputation, and have a material adverse effect on our business operations, financial condition and results of operations.
The Affordable Care Act and other healthcare reform efforts could have a material adverse effect on our business.
In recent years, healthcare reform efforts at federal and state levels of government have resulted in sweeping changes to the delivery and funding of health care. The Affordable Care Act is the most prominent of these efforts. However, there is substantial uncertainty regarding its net effect and its future. The Affordable Care Act has been subject to legislative and
15
regulatory changes and court challenges. Effective January 2019, Congress eliminated the financial penalty associated with the individual mandate to maintain health insurance coverage. Because the penalty associated with the individual mandate was eliminated, a federal court in Texas ruled in December 2018 that the entire Affordable Care Act was unconstitutional. However, the law remains in place pending appeal. It is impossible to predict the full impact of the Affordable Care Act and related regulations or the impact of its modification on our operations in light of the uncertainty regarding whether, when or how the law will be changed and what alternative reforms, such as single-payer proposals, may be enacted. Health reform efforts may adversely affect our customers, which may cause them to reduce or delay use of our products and services. As such, we cannot predict the impact of the Affordable Care Act on our business, operations or financial performance.
Federal actions and legislation may reduce reimbursement rates from governmental payers and adversely affect our results of operations.
In recent years, Congress has passed legislation reducing payments to health care providers. The Budget Control Act of 2011, as amended, requires automatic spending reductions to reduce the federal deficit, including Medicare spending reductions of up to 2% per fiscal year that extend through 2027. The Center for Medicare & Medicaid Services (“CMS”) began imposing a 2% reduction on Medicare claims on April 1, 2013. The Affordable Care Act provides for material reductions in the growth of Medicare program spending. More recently, the Cures Act significantly reduced the amount paid by Medicare for drug costs, while delaying the implementation of a clinical services payment, although Congress also passed a temporary transitional service payment that takes effect January 1, 2019. In addition, from time to time, CMS revises the reimbursement systems used to reimburse health care providers, which may result in reduced Medicare payments.
For the year ended December 31, 2019, 12% of our revenue is derived from reimbursement by direct federal and state programs such as Medicare and Medicaid. Reimbursement from these and other government programs is subject to statutory and regulatory requirements, administrative rulings, interpretations of policy, implementation of reimbursement procedures, retroactive payment adjustments, governmental funding restrictions and changes to or new legislation, all of which may materially affect the amount and timing of reimbursement payments to us. Changes to the way Medicare pays for our services, including mandatory payment reductions such as sequestration, may reduce our revenue and profitability on services provided to Medicare patients and increase our working capital requirements. In addition, we are sensitive to possible changes in state Medicaid programs.
Because most states must operate with balanced budgets and because the Medicaid program is often a state’s largest program, some states have enacted or may consider enacting legislation designed to reduce their Medicaid expenditures. Further, many states have taken steps to reduce coverage and/or enroll Medicaid recipients in managed care programs. The current economic environment has increased the budgetary pressures on many states, and these budgetary pressures have resulted, and likely will continue to result, in decreased spending, or decreased spending growth, for Medicaid programs and the Children’s Health Insurance Program in many states.
In some cases, Third Party Payers rely on all or portions of Medicare payment systems to determine payment rates. Changes to government healthcare programs that reduce payments under these programs may negatively impact payments from Third Party Payers. Current or future healthcare reform and deficit reduction efforts, changes in other laws or regulations affecting government healthcare programs, changes in the administration of government healthcare programs and changes by Third Party Payers could have a material, adverse effect on our financial position and results of operations.
We face periodic reviews and billing audits by governmental and private payers, and these audits could have adverse findings that may negatively impact our business.
As a result of our participation in the Medicare and Medicaid programs, we are subject to various governmental reviews and audits to verify our compliance with these programs and applicable laws and regulations. We also are subject to audits under various government programs in which third party firms engaged by CMS conduct extensive reviews of claims data and medical and other records to identify potential improper payments under the Medicare program. Third Party Payers may also conduct audits. Disputes with payers can arise from these reviews. Payers can claim that payments based on certain billing practices or billing errors were made incorrectly. If billing errors are identified in the sample of reviewed claims, the billing error can be extrapolated to all claims filed which could result in a larger overpayment than originally identified in the sample of reviewed claims. Our costs to respond to and defend claims, reviews and audits may be significant and could have a material adverse effect on our business and consolidated financial condition, results of operations and cash flows. Moreover, an adverse claim, review or audit could result in:
|
•
|
required refunding or retroactive adjustment of amounts we have been paid by governmental payers or Third Party Payers;
|
16
|
•
|
state or federal agencies imposing fines, penalties and other sanctions on us;
|
|
•
|
suspension or exclusion from the Medicare program, state programs, or one or more third party payer networks; or
|
|
•
|
damage to our business and reputation in various markets.
|
These results could have a material adverse effect on our business and consolidated financial condition, results of operations and cash flows.
If any of our pharmacies fail to comply with the conditions of participation in the Medicare program, that pharmacy could be terminated from Medicare, which could adversely affect our consolidated financial statements.
Our pharmacies must comply with the extensive conditions of participation in the Medicare program. If a pharmacy fails to meet any of the Medicare supplier standards, that pharmacy could be terminated from the Medicare program. We respond in the ordinary course to deficiency notices issued by surveyors, and none of our pharmacies has ever been terminated from the Medicare program for failure to comply with the supplier standards. Any termination of one or more of our pharmacies from the Medicare program for failure to satisfy the Medicare supplier standards could adversely affect our consolidated financial statements.
We cannot predict the impact of changing requirements on compounding pharmacies.
Compounding pharmacies are closely monitored by federal and state governmental agencies. We believe that our compounding is performed in safe environments and we have clinically appropriate policies and procedures in place. We only compound pursuant to a patient-specific prescription and do so in compliance with USP 797 standards. In 2013, Congress passed the DQSA, which creates a new category of compounding facilities called outsourcing facilities, which are regulated by the FDA. We do not believe that our current compounding practices qualify us as an outsourcing facility and therefore we continue to operate consistently with USP 797 standards and applicable state pharmacy laws. Should state regulators or the FDA disagree, or should our business practices change to qualify us as an outsourcing facility, there is a risk of regulatory action and/or increased resources required to comply with federal requirements imposed pursuant to the DQSA on outsourcing facilities that could significantly increase our costs or otherwise affect our results of operations. Furthermore, we cannot predict the overall impact of increased scrutiny on compounding pharmacies.
Our existing indebtedness could adversely affect our business and growth prospects.
As of December 31, 2019, we had $1,337.3 million of outstanding borrowings, including (i) $925.0 million under our First Lien Term Loan and (ii) $412.3 million under our Second Lien Notes. All obligations under the credit agreements and indenture governing these facilities and notes are secured by first-priority perfected security interests in substantially all of our assets and the assets of our subsidiaries, subject to permitted liens and other exceptions. Our indebtedness, or any additional indebtedness we may incur, could require us to divert funds identified for other purposes for debt service and impair our liquidity position. If we cannot generate sufficient cash flow from operations to service our debt, we may need to refinance our debt, dispose of assets or issue equity to obtain necessary funds. We do not know whether we will be able to take any of these actions on a timely basis, on terms satisfactory to us or at all.
Our indebtedness, the cash flow needed to satisfy our debt and the covenants contained in our credit agreement and indenture have important consequences, including but not limited to:
|
•
|
limiting funds otherwise available for financing our capital expenditures by requiring us to dedicate a portion of our cash flows from operations to the repayment of debt and the interest on this debt;
|
|
•
|
limiting our ability to incur additional indebtedness;
|
|
•
|
limiting our ability to capitalize on significant business opportunities;
|
|
•
|
making us more vulnerable to rising interest rates; and
|
|
•
|
making us more vulnerable in the event of a downturn in our business.
|
Our level of indebtedness may place us at a competitive disadvantage to our competitors that are not as highly leveraged. Fluctuations in interest rates can increase borrowing costs. Increases in interest rates may directly impact the amount of interest we are required to pay and reduce earnings accordingly. In addition, developments in tax policy, such as the disallowance of tax deductions for interest paid on outstanding indebtedness, could have an adverse effect on our liquidity and our business, financial conditions and results of operations. Further, our credit agreements and indenture contain customary affirmative and negative covenants and certain restrictions on operations that could impose operating and financial limitations and restrictions on us, including restrictions on our ability to enter into particular transactions and to engage in other actions that we may believe are advisable or necessary for our business. Our term loan facility is also subject to mandatory prepayments in certain
17
circumstances and requires a prepayment of a certain percentage of our excess cash flow. This excess cash flow payment, and future required prepayments, will reduce our cash available for investment in our business.
We expect to use cash flow from operations to meet current and future financial obligations, including funding our operations, debt service requirements and capital expenditures. The ability to make these payments depends on our financial and operating performance, which is subject to prevailing economic, industry and competitive conditions and to certain financial, business, economic and other factors beyond our control.
Despite our substantial indebtedness, we may still need to incur significantly more debt. This could exacerbate the risks associated with our substantial leverage.
We may need to incur substantial additional indebtedness, including additional secured indebtedness, in the future, in connection with future acquisitions, strategic investments and strategic relationships. Although the financing documents governing our indebtedness contain covenants and restrictions on the incurrence of additional debt, these restrictions are subject to a number of qualifications and exceptions and, under certain circumstances, debt incurred in compliance with these restrictions, including secured debt, could be substantial. Adding additional debt to current debt levels could exacerbate the leverage-related risks described above.
We may not be able to generate sufficient cash flow to service all of our indebtedness, and may be forced to take other actions to satisfy our obligations under such indebtedness, which may not be successful.
Our ability to make scheduled payments or to refinance outstanding debt obligations depends on our financial and operating performance, which will be affected by prevailing economic, industry and competitive conditions and by financial, business and other factors beyond our control. We may not be able to maintain a sufficient level of cash flow from operating activities to permit us to pay the principal, premium, if any, and interest on our indebtedness. Any failure to make payments of interest and principal on our outstanding indebtedness on a timely basis would likely result in a reduction of our credit rating, which would also harm our ability to incur additional indebtedness.
If our cash flows and capital resources are insufficient to fund our debt service obligations, we may be forced to reduce or delay capital expenditures, sell assets, seek additional capital or seek to restructure or refinance our indebtedness. Any refinancing of our indebtedness could be at higher interest rates and may require us to comply with more onerous covenants. These alternative measures may not be successful and may not permit us to meet our scheduled debt service obligations. In the absence of such cash flows and resources, we could face substantial liquidity problems and might be required to sell material assets or operations to attempt to meet our debt service obligations. The financing documents governing our First Lien Term Loan, our ABL Facility and our Second Lien Notes restrict our ability to conduct asset sales and/or use the proceeds from asset sales. We may not be able to consummate these asset sales to raise capital or sell assets at prices and on terms that we believe are fair and any proceeds that we do receive may not be adequate to meet any debt service obligations then due. If we cannot meet our debt service obligations, the holders of our indebtedness may accelerate such indebtedness and, to the extent such indebtedness is secured, foreclose on our assets. In such an event, we may not have sufficient assets to repay all of our indebtedness.
The transition from the London Interbank Offered Rate (“LIBOR”) could negatively affect our interest rates and results of operations.
In 2017, the U.K. Financial Conduct Authority announced that it intends to phase out LIBOR by the end of 2021. In addition, other regulators have suggested reforming or replacing other benchmark rates. The discontinuation, reform, or replacement of LIBOR or any other benchmark rates may result in fluctuating interest rates that may have a negative impact on our interest expense and our profitability.
Continuing to combine businesses between BioScrip and Option Care may be more difficult, costly or time-consuming than expected and the anticipated benefits and cost savings of the Merger may not continue to be realized.
The continuing success of the Merger, including anticipated benefits and cost savings, depend, in part, on our ability to successfully combine and integrate both businesses.
Integration of the businesses following the Merger is a complex, costly and time-consuming process. If we experience difficulties with the continued integration process, the anticipated benefits of the Merger may not continue to be realized fully or at all, or may take longer to realize than expected. These integration matters could have an adverse effect for an
18
undetermined period after completion of the Merger. In addition, the actual cost savings of the Merger could be less than anticipated.
Our future results may be adversely impacted if we do not effectively manage our expanded operations.
Following the completion of the Merger, the size of our combined business is significantly larger than the size of either Option Care or BioScrip’s respective businesses prior to the Merger. Our ability to successfully manage this expanded business depends, in part, upon management’s ability to manage the integration of two discrete companies, as well as the increased scale and scope of the combined business with its associated increased costs and complexity. There can be no assurances that we will be successful or that we will realize the expected operating efficiencies, cost savings and other benefits currently anticipated from the Merger.
We are a “controlled company” within the meaning of the rules of Nasdaq and, as a result, qualify for and rely on, exemptions from certain corporate governance standards, which limit the presence of independent directors on our board of directors or board committees.
Following the Merger, approximately 81% of the outstanding shares of our common stock is held by HC Group Holdings I, LLC. As a result, we are a “controlled company” for purposes of the Nasdaq listing rules and are exempt from certain governance requirements otherwise required by Nasdaq, including requirements that:
|
•
|
a majority of our board of directors consist of independent directors;
|
|
•
|
we have a nominating and corporate governance committee that is composed entirely of independent directors with a written charter addressing the committee's purpose and responsibilities;
|
|
•
|
we have a compensation committee that is composed entirely of independent directors with a written charter addressing the committee's purpose and responsibilities;
|
|
•
|
we conduct annual performance evaluation of the nominating and corporate governance and compensation committees.
|
Accordingly, you will not have the same protections afforded to stockholders of companies that are subject to all of the corporate governance requirements of the Nasdaq.
A significant portion of our total outstanding shares are restricted from immediate resale but may be sold into the market in the near future. This could cause the market price of our common stock to drop significantly, even if our business is doing well.
The shares of our common stock issued in the Merger to HC Group Holdings I, LLC as Merger consideration, or approximately 81% of the outstanding shares of our common stock as of December 31, 2019, are generally eligible for resale subject to a 12-month lockup period beginning on the Merger Date. The market price of our common stock could decline as a result of sales of a large number of shares of our common stock in the market after the expiration of the lockup period or even the perception that these sales could occur.
As of December 31, 2019, Madison Dearborn Partners is our largest stockholder, controlling approximately 81% of our common stock, and has the ability to exercise significant influence over decisions requiring our stockholders’ approval.
As of December 31, 2019, Madison Dearborn Partners controls approximately 81% of our common stock through its control of HC Group Holding I, LLC, with an economic interest in approximately 39% of our common stock. As a result, Madison Dearborn Partners has the ability to exercise significant influence over decisions requiring approval of our stockholders including the election of directors, amendments to our certificate of incorporation and approval of significant corporate transactions, such as a Merger or other sale of us or our assets.
This concentration of ownership may have the effect of delaying, preventing or deterring a change in control of us and may negatively affect the market price of our common stock. Also, Madison Dearborn Partners is in the business of making investments in companies and may from time to time acquire and hold interests in businesses that compete with us. Madison Dearborn Partners or its affiliates may also pursue acquisition opportunities that are complementary to our business and, as a result, those acquisition opportunities may not be available to us.
19
Provisions of our corporate governance documents could make an acquisition of us more difficult and may prevent attempts by our stockholders to replace or remove our current management, even if beneficial to our stockholders.
In addition to HC Group Holding I, LLC’s beneficial ownership of approximately 81% of our common stock, our third amended and restated certificate of incorporation contains provisions that could make it more difficult for a third party to acquire us, even if doing so might be beneficial to our stockholders. Among other things:
|
•
|
these provisions allow us to authorize the issuance of undesignated preferred stock, the terms of which may be established and the shares of which may be issued without stockholder approval, and which may include supermajority voting, special approval, dividend, or other rights or preferences superior to the rights of stockholders;
|
|
•
|
these provisions provide that, at any time when HC Group Holdings I, LLC beneficially owns, in the aggregate, less than 50% in voting power of our stock entitled to vote generally in the election of directors, directors may be removed with or without cause only by the affirmative vote of holders of at least 66 2∕3% in voting power of all the then-outstanding vote thereon, voting together as a single class;
|
|
•
|
these provisions prohibit stockholder action by written consent from and after the date on which HC Group Holding I, LLC beneficially owns, in the aggregate, less than 50% in voting power of our stock entitled to vote generally in the election of directors; and
|
|
•
|
these provisions provide that for as long as HC Group Holdings I, LLC beneficially owns, in the aggregate, 50% or more in voting power of our stock entitled to vote generally in the election of directors, any amendment, alteration, rescission or repeal of our bylaws or certificate of incorporation by our stockholders will require the affirmative vote of at least a majority in voting power of the outstanding shares of our stock and at any time when HC Group Holdings I, LLC beneficially owns, in the aggregate, less than 50% in voting power of all outstanding shares of our stock entitled to vote generally in the election of directors, any amendment, alteration, rescission or repeal of our bylaws or certificate of incorporation by our stockholders will require the affirmative vote of the holders of at least 66 2∕3% in voting power of all the then-outstanding shares of our stock entitled to vote thereon, voting together as a single class.
|
These and other provisions in our certificate of incorporation, bylaws and Delaware law could make it more difficult for shareholders or potential acquirers to obtain control of our Board or initiate actions that are opposed by our then-current Board, including delay or impede a merger, tender offer or proxy contest involving our company. The existence of these provisions could negatively affect the price of our common stock and limit opportunities to realize value in a corporate transaction.
Moreover, Section 203 of the General Corporation Law of the State of Delaware (“DGCL”) may discourage, delay, or prevent a change of control of our company. Section 203 imposes certain restrictions on mergers, business combinations, and other transactions between us and holders of 15% or more of our common stock.
Our third amended and restated certificate of incorporation designates the Court of Chancery of the State of Delaware as the exclusive forum for certain litigation that may be initiated by our stockholders, which could limit our stockholders’ ability to obtain a favorable judicial forum for disputes with us.
Pursuant to our third amended and restated certificate of incorporation, unless we consent in writing to the selection of an alternative forum, the Court of Chancery of the State of Delaware will be the sole and exclusive forum for (1) any derivative action or proceeding brought on our behalf, (2) any action asserting a claim of breach of a fiduciary duty owed by any of our directors, officers, employees and stockholders to us or our stockholders, (3) any action asserting a claim against us arising pursuant to any provision of the DGCL or as to which the DGCL confers jurisdiction on the Court of Chancery of the State of Delaware, our third amended and restated certificate of incorporation or our bylaws or (4) any other action asserting a claim against us that is governed by the internal affairs doctrine; provided that for the avoidance of doubt, the forum selection provision that identifies the Court of Chancery of the State of Delaware as the exclusive forum for certain litigation, including any “derivative action”, will not apply to suits to enforce a duty or liability created by the Exchange Act or any other claim for which the federal courts have exclusive jurisdiction. Our third amended and restated certificate of incorporation will further provide that any person or entity purchasing or otherwise acquiring any interest in shares of our capital stock is deemed to have notice of and consented to the provisions of our certificate of incorporation described above. The forum selection clause in our third amended and restated certificate of incorporation may have the effect of discouraging lawsuits against us or our directors and officers and may limit our stockholders’ ability to obtain a favorable judicial forum for disputes with us.
20
We may issue shares of preferred stock in the future, which could make it difficult for another company to acquire us or could otherwise adversely affect holders of our common stock, which could depress the price of our common stock.
Our third amended and restated certificate of incorporation authorizes us to issue one or more series of preferred stock. Our Board has the authority to determine the preferences, limitations and relative rights of the shares of preferred stock and to fix the number of shares constituting any series and the designation of such series, without any further vote or action by our stockholders. Our preferred stock could be issued with voting, liquidation, dividend and other rights superior to the rights of our common stock. The potential issuance of preferred stock may delay or prevent a change in control, discouraging bids for our common stock at a premium to the market price, and materially adversely affect the market price and the voting and other rights of the holders of our common stock.
Item 1B.
Unresolved Staff Comments
None.
21
Item 2.
Properties
We currently lease all of our properties from third parties under various lease terms expiring over periods extending through 2029, in addition to a number of non-material, month-to-month leases. Our corporate headquarters are located at 3000 Lakeside Drive, Suite 300N, Bannockburn, IL 60015. Our other properties mainly consist of infusion pharmacies equipped with clean room and compounding capabilities. Some infusion pharmacies are co-located with an ambulatory infusion center where patients receive infusion treatments. As of December 31, 2019 our material property locations, consisting of our pharmacies, all in support of our infusion services business, were as follows:
|
Birmingham, AL
|
Augusta, GA
|
Bozeman, MT
|
Plymouth Meeting, PA
|
|
Hoover, AL
|
Peachtree Corners, GA
|
Charlotte, NC
|
York, PA
|
|
Mobile, AL
|
Savannah, GA
|
Fayetteville, NC
|
Cranston, RI
|
|
Jonesboro, AR
|
Honolulu, HI
|
Morrisville, NC
|
Smithfield, RI
|
|
Little Rock, AR
|
Urbandale, IA
|
Wilmington, NC
|
Duncan, SC
|
|
Tempe, AZ
|
Meridian, ID
|
Lincoln, NE
|
Mount Pleasant, SC
|
|
Bakersfield, CA
|
Lombard, IL
|
Omaha, NE
|
Knoxville, TN
|
|
Burbank, CA
|
Wood Dale, IL
|
Bedford, NH
|
Memphis, TN
|
|
Chico, CA
|
Carmel, IN
|
Eatontown, NJ
|
Nashville, TN
|
|
Hayward, CA
|
Overland Park, KS
|
Morris Plains, NJ
|
Austin, TX
|
|
Irvine, CA
|
Ashland, KY
|
Somers Point, NJ
|
Houston, TX (2)
|
|
Riverside, CA
|
Lexington, KY
|
Las Vegas, NV
|
Irving, TX
|
|
Sacramento, CA
|
Louisville, KY
|
Reno, NV
|
Richardson, TX
|
|
San Diego, CA
|
Baton Rouge, LA
|
College Point, NY
|
San Antonio, TX
|
|
Santa Fe Springs, CA (2)
|
New Orleans, LA
|
Lake Success, NY
|
Salt Lake City, UT
|
|
Sun Valley, CA
|
Shreveport, LA
|
Orchard Park, NY
|
Ashland, VA
|
|
Englewood, CO
|
Marlborough, MA
|
Brecksville, OH
|
Chantilly, VA
|
|
Cromwell, CT (2)
|
Southborough, MA
|
Canfield, OH
|
Newport News, VA
|
|
Shelton, CT
|
Columbia, MD
|
Columbus, OH
|
Norfolk, VA
|
|
Newark, DE
|
Auburn, ME
|
Dublin, OH
|
Roanoke, VA
|
|
Fort Myers, FL
|
Farmington Hills, MI
|
Milford, OH
|
Rutland, VT
|
|
Gainesville, FL
|
Grand Rapids, MI
|
Sylvania, OH
|
Everett, WA
|
|
Jacksonville, FL
|
Eagan, MN
|
Oklahoma City, OK
|
Kennewick, WA
|
|
Melbourne, FL
|
Roseville, MN
|
Bend, OR
|
Spokane Valley, WA
|
|
Miramar, FL
|
Sauk Rapids, MN
|
Portland, OR
|
Tukwila, WA
|
|
St. Petersburg, FL
|
Columbia, MO
|
Audubon, PA
|
Wauwatosa, WI
|
|
Tampa, FL
|
Fenton, MO
|
Dunmore, PA
|
Charleston, WV
|
|
Albany, GA
|
Pearl, MS
|
Monroeville, PA
|
Fairmont, WV
|
Item 3.
Legal Proceedings
For a summary of material legal proceedings, if any, refer to Note 15,
Commitments and Contingencies
, of the consolidated financial statements included in Item 8 of this report.
Item 4.
Mine Safety Disclosures
Item not applicable.
22
PART II
Item 5.
Market for Registrant’s Common Equity, Related Stockholder Matters and Issuer Purchases of Equity Securities
Common Stock
During 2019, our Common Stock, par value $0.0001 per share, was traded on the Nasdaq Capital Market under the symbol “BIOS”. On February 3, 2020, we changed our symbol to “OPCH” and began trading on the Nasdaq Global Select Market.
Holders of Record
As of March 3, 2020, there were 173 stockholders of record of our Common Stock.
Dividend Policy
We have never paid cash dividends on our Common Stock and do not anticipate doing so in the foreseeable future.
Securities Authorized for Issuance under Equity Compensation Plans
See Item 12, “Security Ownership of Certain Beneficial Owners and Management and Related Stockholder Matters.”
Recent Sale of Unregistered Securities and Use of Proceeds
None.
Stock Performance Graph
The following graph compares the total cumulative returns of BioScrip through August 6, 2019 and Option Care Health from August 7, 2019 through December 31, 2019 with the total cumulative returns of the Nasdaq Composite Index and the Nasdaq Health Services Index for the five-year period from December 31, 2014 through December 31, 2019. The graph shows the performance of a $100 investment in our Common Stock and each index as of December 31, 2014.
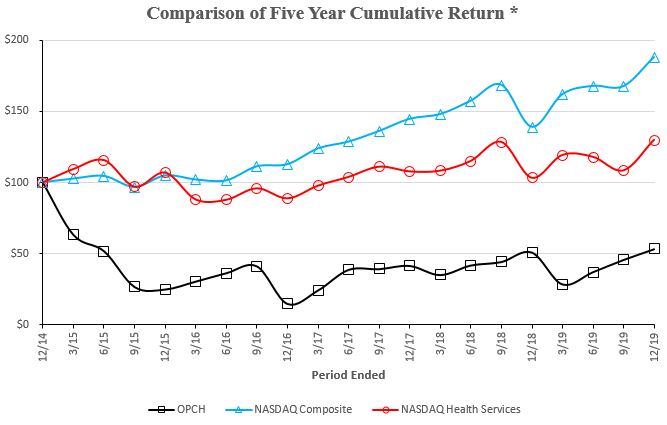
23
|
Years Ended December 31,
|
|||||||||||||||||||||||
|
2014
|
2015
|
2016
|
2017
|
2018
|
2019
|
||||||||||||||||||
|
Option Care Health, Inc.
|
$
|
100.00
|
|
$
|
25.04
|
|
$
|
14.88
|
|
$
|
41.63
|
|
$
|
51.07
|
|
$
|
53.36
|
|
|||||
|
Nasdaq Composite Index
|
$
|
100.00
|
|
$
|
104.81
|
|
$
|
112.68
|
|
$
|
144.50
|
|
$
|
138.89
|
|
$
|
187.81
|
|
|||||
|
Nasdaq Health Services Index
|
$
|
100.00
|
|
$
|
106.86
|
|
$
|
88.78
|
|
$
|
107.70
|
|
$
|
103.21
|
|
$
|
129.87
|
|
|||||
* $100 invested on December 31, 2014 in stock or index, including reinvestment of dividends.
24
Item 6.
Selected Financial Data
The selected consolidated financial data presented below should be read in conjunction with, and is qualified in its entirety by reference to, Management’s Discussion and Analysis of Financial Condition and Results of Operations and our Consolidated Financial Statements and the Notes thereto appearing elsewhere in this Annual Report. The selected consolidated financial data for the years ended December 31, 2019 and 2018 reflect the adoption of ASU 2014-09,
Revenue from Contracts with Customers
(“ASC 606”) and the selected financial data for the year ended December 31, 2019 reflects the adoption of ASU 2016-02,
Leases
(“ASC 842”). Further discussion on the impacts of ASC 606 can be found in Note 4,
Revenue
, and further discussion on the impacts of ASC 842 can be found in Note 8,
Leases
, within the Consolidated Financial Statements included in Item 8 of this report. The below periods include the results of operations from BioScrip, Inc. from the August 6, 2019 Merger Date onward. Prior to April 7, 2015, Option Care (the “Successor”) was a wholly owned subsidiary of Walgreen Co. operating under the name Walgreens Infusion Services, Inc. ( the Predecessor”). The Consolidated Statements of Comprehensive Income (Loss) presented below include the Predecessor’s results of operations for the period from January 1, 2015 through April 6, 2015 and are demarcated by a black line.
|
|
December 31,
|
||||||||||||||||||
|
|
2019
|
|
2018
|
|
2017
|
|
2016
|
|
2015
|
||||||||||
|
|
(in thousands)
|
||||||||||||||||||
|
Consolidated Balance Sheets Data:
|
|
|
|
|
|
|
|
|
|||||||||||
|
Working capital (1) (2)
|
$
|
228,650
|
|
|
$
|
227,428
|
|
|
$
|
226,535
|
|
|
$
|
227,763
|
|
|
$
|
229,243
|
|
|
Total assets (2)
|
2,589,547
|
|
|
1,428,211
|
|
|
1,429,542
|
|
|
1,405,285
|
|
|
1,377,275
|
|
|||||
|
Total debt, net
|
1,286,496
|
|
|
539,375
|
|
|
540,346
|
|
|
541,500
|
|
|
542,888
|
|
|||||
|
Stockholders' equity
|
906,827
|
|
|
602,825
|
|
|
606,105
|
|
|
600,770
|
|
|
596,121
|
|
|||||
(1) Working capital consists of total current assets less total current liabilities.
(2) Working capital and total assets for the year ended December 31, 2019 reflect the adoption of ASU 2016-02,
Leases
, and are, therefore, not comparable to prior periods. For a full discussion on the impacts of the adoption see Note 8.
Leases
, included in Item 8 of this report.
|
Periods Ended
|
||||||||||||||||||||||||
|
|
Year Ended December 31,
|
|
Successor
|
|
|
Predecessor
|
||||||||||||||||||
|
|
2019
(1)
|
|
2018
|
|
2017
|
|
2016
|
|
April 7, 2015 -
December 31, 2015 |
|
|
January 1, 2015 -
April 6, 2015 |
||||||||||||
|
(in thousands)
|
||||||||||||||||||||||||
|
Consolidated Statements of Comprehensive Income (Loss)
|
|
|
|
|
|
|
|
|
|
|
|
|||||||||||||
|
Net revenue (2)
|
$
|
2,310,417
|
|
|
$
|
1,939,791
|
|
|
$
|
1,828,046
|
|
|
$
|
1,711,438
|
|
|
$
|
1,163,009
|
|
|
|
$
|
379,672
|
|
|
Gross profit (2)
|
512,999
|
|
|
422,215
|
|
|
445,999
|
|
|
449,307
|
|
|
312,597
|
|
|
|
96,518
|
|
||||||
|
Operating income (loss)
|
(319
|
)
|
|
38,269
|
|
|
27,279
|
|
|
52,448
|
|
|
6,129
|
|
|
|
(1,721
|
)
|
||||||
|
Net income (loss)
|
(75,920
|
)
|
|
(6,115
|
)
|
|
3,878
|
|
|
3,910
|
|
|
(17,696
|
)
|
|
|
(5,761
|
)
|
||||||
|
Net comprehensive income (loss)
|
(83,959
|
)
|
|
(5,341
|
)
|
|
3,936
|
|
|
3,910
|
|
|
(17,696
|
)
|
|
|
(5,761
|
)
|
||||||
|
Net income (loss) per share, basic and diluted (3)
|
(0.49
|
)
|
|
(0.04
|
)
|
|
0.03
|
|
|
0.03
|
|
|
(0.12
|
)
|
|
|
|
|||||||
|
Weighted average common shares outstanding, basic and diluted (3)
|
156,280
|
|
|
142,614
|
|
|
142,614
|
|
|
142,614
|
|
|
142,614
|
|
|
|
|
|||||||
(1) 2019 includes the results of operations of BioScrip from August 6, 2019 onward and are, therefore, not comparable to prior periods.
(2) Net revenue and gross profit for the years ended December 31, 2019 and 2018 reflect the adoption of ASU 2014-09,
Revenue from Contracts with Customers
, and are, therefore, not comparable to prior periods. For a full discussion on the impacts of the adoption see Note 4,
Revenue
, included in Item 8 of this report.
25
(3) Predecessor period represents the period prior to the acquisition of Walgreens Infusion Services from Walgreen Co., and therefore no shares of common stock were outstanding. As a result, there is no net income (loss) per share or weighted average common shares outstanding information available for this period.
Item 7.
Management’s Discussion and Analysis of Financial Condition and
Results of Operations
The following Management’s Discussion and Analysis of Financial Condition and Results of Operations is designed to assist the reader in understanding our Consolidated Financial Statements, the changes in certain key items in those financial statements from year-to-year and the primary factors that accounted for those changes as well as how certain accounting principles affect our Consolidated Financial Statements.
Except for the historical information contained herein, the following discussion contains forward-looking statements that are subject to known and unknown risks, uncertainties and other factors that may cause our actual results to differ materially from those expressed or implied by such forward-looking statements. We discuss such risks, uncertainties and other factors throughout this Annual Report and specifically under the caption “Forward-Looking Statements” and under “
Item 1A. Risk Factors
” in this Annual Report. In addition, the following discussion of financial condition and results of operations should be read in conjunction with the Consolidated Financial Statements and Notes thereto appearing in Item 8 in this Annual Report.
Business Overview
Option Care Health, and its wholly-owned subsidiaries, provides infusion therapy and other ancillary health care services through a national network of
158
locations around the United States. The Company contracts with managed care organizations, third-party payers, hospitals, physicians, and other referral sources to provide pharmaceuticals and complex compounded solutions to patients for intravenous delivery in the patients’ homes or other nonhospital settings. Our services are provided in coordination with, and under the direction of, the patient’s physician. Our multidisciplinary team of clinicians, including pharmacists, nurses, dietitians and respiratory therapists, work with the physician to develop a plan of care suited to each patient’s specific needs. We provide home infusion services consisting of anti-infectives, nutrition support, bleeding disorder therapies, immunoglobulin therapy, and other therapies for chronic and acute conditions.
HC Group Holdings II, Inc. (“HC II”) was incorporated under the laws of the State of Delaware on January 7, 2015, with its sole shareholder being HC Group Holdings I, LLC. (“HC I”). On April 7, 2015, HC I and HC II collectively acquired Walgreens Infusion Services, Inc. and its subsidiaries from Walgreen Co., and the business was rebranded as Option Care, Inc. (“Option Care”).
On March 14, 2019, HC I and HC II entered into a definitive agreement (the “Merger Agreement”) to merge with and into a wholly-owned subsidiary of BioScrip, Inc. (“BioScrip”) (the “Merger”), a national provider of infusion and home care management solutions, which was completed on August 6, 2019 (the “Merger Date”). The Merger was accounted for as a reverse merger under the acquisition method of accounting for business combinations with Option Care being considered the accounting acquirer and BioScrip being considered the legal acquirer. Following the close of the transaction, BioScrip was rebranded as Option Care Health, Inc. and the combined company’s stock, par value $0.0001, was listed on the Nasdaq Capital Market as of December 31, 2019. Effective February 3, 2020, the Company was listed on the Nasdaq Global Select Market under the ticker symbol “OPCH”. See Note 3,
Business Acquisitions
, of the consolidated financial statements for further discussion of the Merger.
Merger Integration Execution
The Merger of Option Care and BioScrip into Option Care Health has created an opportunity to realize cost synergies while continuing to drive organic growth in chronic and acute therapies through our expanded national platform. Option Care Health is well-positioned to leverage the investments in corporate infrastructure and drive economies of scale as a result of the Merger. The forecasted synergy categories are as follows:
|
•
|
Selling, General and Administrative Expenses Savings. Merged corporate infrastructure has created significant opportunity for streamlining corporate and administrative costs, including headcount and functional spend.
|
|
•
|
Network Optimization. The previous investments in technology and compounding pharmacies, along with the overlapping geographic footprint, allow for facility rationalization and the optimization of assets.
|
|
•
|
Procurement Savings. The enhanced scale of the Company generates supply chain efficiencies through increased purchasing leverage. The Company’s platform is also positioned to be the partner of choice for pharmaceutical manufacturers seeking innovative distribution channels and patient support models to access the market.
|
26
We believe the achievement of these synergies will enable the delivery of high-quality, cost-effective solutions to providers across the country and help facilitate the introduction of new therapies to the marketplace while improving the profitability profile of the Company.
Since the Merger, we have worked to align our field and sales teams. We have also made strides at combining our procurement processes and contracts, all while continuing to focus on serving our patients. Patient health is personal to us, which is why, throughout the integration process, we strive to improve and set the standard for quality care that is matched by best-in-class service. After completion of the Merger, we have additional resources to invest in our people, processes and systems, providing us improved strength and scale to drive better patient outcomes.
Changes to Medicare Reimbursement
In recent years, legislative changes have resulted in reductions in reimbursement under government healthcare programs. In December 2016, the Cures Act legislation was signed into law, which decreased reimbursement for Medicare Part B Durable Medical Equipment infusion drugs administered in an alternate site setting effective January 1, 2017. The original legislation did not provide for reimbursement for the service component until 2021. Center for Medicare and Medicaid Services issued a final rule in October 2018 implementing a temporary transition benefit for Medicare Part B home infusion services, which will continue from January 1, 2019 until January 1, 2021. This temporary transition benefit defines professional services as only including nursing, and not pharmacy, care planning, care coordination, or monitoring, and only pays for an infusion day when the nurse is in the home.
Acquisitions
The Company has made strategic acquisitions to expand both its national footprint as well as its service line offering. These acquisitions are comprised of the following:
Option Care merged with BioScrip on August 6, 2019. BioScrip was a national provider of infusion and home care management, who partnered with physicians, hospital systems, payers, pharmaceutical manufacturers and skilled nursing facilities to provide patients access to post-acute care services. The fair value of purchase consideration transferred, net of cash acquired, on the closing date of $1,087.2 million includes the value of the number of shares of the combined company to be owned by BioScrip shareholders at closing of the Merger, the value of common shares to be issued to certain warrant and preferred shareholders in conjunction with the Merger, the value of stock-based instruments that were vested or earned as of the Merger, and cash payments made in conjunction with the Merger. The fair value per share of BioScrip’s common stock was $2.67 per share on August 6, 2019. For additional information on this transaction, see Note 3,
Business Acquisitions,
of the consolidated financial statements.
In September 2018, we completed the acquisition of 100% of the outstanding shares of Home I.V. Specialists, Inc. (“Home IV”), for a purchase price of $11.6 million, net of cash acquired. The Home IV acquisition expands our presence in Arkansas as we acquired Home IV’s three pharmacy locations in that state.
Composition of Results of Operations
The following results of operations include the accounts of Option Care Health and our subsidiaries for the years ended December 31, 2019, 2018 and 2017. The BioScrip results have been included since the August 6, 2019 Merger Date.
Net Revenue
Infusion and related health care services revenue is reported at the estimated net realizable amounts from third-party payers and patients for goods sold and services rendered. When pharmaceuticals are provided to a patient, revenue is recognized upon delivery of the goods. When nursing services are provided, revenue is recognized when the services are rendered.
Due to the nature of the health care industry and the reimbursement environment in which the Company operates, certain estimates are required to record revenue and accounts receivable at their net realizable values at the time goods or services are provided. Inherent in these estimates is the risk that they will have to be revised or updated as additional information becomes available. Specifically, the complexity of many third-party billing arrangements and the uncertainty of reimbursement amounts for certain services from certain payers may result in adjustments to amounts originally recorded.
27
Cost of Revenue
Cost of revenue consists of the actual cost of pharmaceuticals and other medical supplies dispensed to patients. In addition to product costs, cost of revenue includes warehousing costs, purchasing costs, depreciation expense relating to revenue-generating assets, such as infusion pumps, shipping and handling costs, and wages and related costs for the pharmacists, nurses, and all other employees and contracted workers directly involved in providing service to the patient.
The Company receives volume-based rebates and prompt payment discounts from some of its pharmaceutical and medical supplies vendors. These payments are recorded as a reduction of inventory and are accounted for as a reduction of cost of revenue when the related inventory is sold.
Operating Costs and Expenses
Selling, General and Administrative Expenses
. Selling, general and administrative expenses consist principally of salaries for administrative employees that directly and indirectly support the operations, occupancy costs, marketing expenditures, insurance, and professional fees.
Depreciation and Amortization Expense.
Depreciation within this caption includes infrastructure items such as computer hardware and software, office equipment and leasehold improvements. Depreciation of revenue-generating assets, such as infusion pumps, is included in cost of revenue.
Other Income (Expense)
Interest Expense, Net
. Interest expense consists principally of interest payments on the Company’s outstanding borrowings under the ABL Facility, the First Lien Term Loan and Second Lien Notes, as well as the amortization of discount and deferred financing fees. Refer to the “Liquidity and Capital Resources” section below for further discussion of these outstanding borrowings.
Equity in Earnings of Joint Ventures
. Equity in earnings of joint ventures consists of our proportionate share of equity earnings or losses from equity investments in two infusion joint ventures with health systems.
Other, Net
. Other income (expense) primarily includes third-party fees paid in conjunction with our 2019 debt issuance of the Loan Facilities and Second Lien Notes and loss on extinguishment of debt for the Company’s Previous Credit Facilities.
Income Tax Expense (Benefit)
. The Company is subject to taxation in the United States and various states. The Company’s income tax (benefit) expense is reflective of the current federal tax rates.
Change in unrealized (losses) gains on cash flow hedges, net of income taxes
. Change in unrealized (losses) gains on cash flow hedges, net of income taxes, consists of the gains and losses associated with the changes in the fair value of hedging instruments related to the interest rate caps and interest rate swaps, net of income taxes.
Results of Operations
The following table presents Option Care Health’s consolidated results of operations for the years ended December 31, 2019, 2018, and 2017 (in thousands):
28
|
Year Ended December 31,
|
|||||||||||||||||||||
|
|
2019
(1)
|
2018
|
2017
|
||||||||||||||||||
|
Amount
|
|
% of Revenue
|
|
Amount
|
|
% of Revenue
|
|
Amount
|
|
% of Revenue
|
|
||||||||||
|
NET REVENUE
|
$
|
2,310,417
|
|
100.0
|
%
|
$
|
1,939,791
|
|
100.0
|
%
|
$
|
1,828,046
|
|
100.0
|
%
|
||||||
|
COST OF REVENUE
|
1,797,418
|
|
77.8
|
%
|
1,517,576
|
|
78.2
|
%
|
1,382,047
|
|
75.6
|
%
|
|||||||||
|
GROSS PROFIT
|
512,999
|
|
22.2
|
%
|
422,215
|
|
21.8
|
%
|
445,999
|
|
24.4
|
%
|
|||||||||
|
OPERATING COSTS AND EXPENSES:
|
|||||||||||||||||||||
|
Selling, general and administrative expenses
|
459,628
|
|
19.9
|
%
|
345,884
|
|
17.8
|
%
|
338,456
|
|
18.5
|
%
|
|||||||||
|
Provision for doubtful accounts (2)
|
—
|
|
—
|
%
|
—
|
|
—
|
%
|
45,602
|
|
2.5
|
%
|
|||||||||
|
Depreciation and amortization expense
|
53,690
|
|
2.3
|
%
|
38,062
|
|
2.0
|
%
|
34,662
|
|
1.9
|
%
|
|||||||||
|
Total operating expenses
|
513,318
|
|
22.2
|
%
|
383,946
|
|
19.8
|
%
|
418,720
|
|
22.9
|
%
|
|||||||||
|
OPERATING (LOSS) INCOME
|
(319
|
)
|
(0.0
|
)%
|
38,269
|
|
2.0
|
%
|
27,279
|
|
1.5
|
%
|
|||||||||
|
OTHER INCOME (EXPENSE):
|
|||||||||||||||||||||
|
Interest expense, net
|
(73,724
|
)
|
(3.2
|
)%
|
(45,824
|
)
|
(2.4
|
)%
|
(44,307
|
)
|
(2.4
|
)%
|
|||||||||
|
Equity in earnings of joint ventures
|
2,840
|
|
0.1
|
%
|
1,020
|
|
0.1
|
%
|
2,186
|
|
0.1
|
%
|
|||||||||
|
Other, net
|
(6,991
|
)
|
(0.3
|
)%
|
(2,233
|
)
|
(0.1
|
)%
|
135
|
|
0.0
|
%
|
|||||||||
|
Total other expense
|
(77,875
|
)
|
(3.4
|
)%
|
(47,037
|
)
|
(2.4
|
)%
|
(41,986
|
)
|
(2.3
|
)%
|
|||||||||
|
LOSS BEFORE INCOME TAXES
|
(78,194
|
)
|
(3.4
|
)%
|
(8,768
|
)
|
(0.5
|
)%
|
(14,707
|
)
|
(0.8
|
)%
|
|||||||||
|
INCOME TAX BENEFIT
|
(2,274
|
)
|
(0.1
|
)%
|
(2,653
|
)
|
(0.1
|
)%
|
(18,585
|
)
|
(1.0
|
)%
|
|||||||||
|
NET (LOSS) INCOME
|
$
|
(75,920
|
)
|
(3.3
|
)%
|
$
|
(6,115
|
)
|
(0.3
|
)%
|
$
|
3,878
|
|
0.2
|
%
|
||||||
|
OTHER COMPREHENSIVE (LOSS) INCOME, NET OF TAX:
|
|||||||||||||||||||||
|
Change in unrealized (losses) gains on cash flow hedges, net of income taxes of $259, $234 and $36, respectively
|
(8,039
|
)
|
(0.3
|
)%
|
774
|
|
0.0
|
%
|
58
|
|
0.0
|
%
|
|||||||||
|
OTHER COMPREHENSIVE (LOSS) INCOME
|
(8,039
|
)
|
(0.3
|
)%
|
774
|
|
0.0
|
%
|
58
|
|
0.0
|
%
|
|||||||||
|
NET COMPREHENSIVE (LOSS) INCOME
|
$
|
(83,959
|
)
|
(3.6
|
)%
|
$
|
(5,341
|
)
|
(0.3
|
)%
|
$
|
3,936
|
|
0.2
|
%
|
||||||
(1) 2019 includes the results of operations of BioScrip from August 6, 2019 onward and are, therefore, not comparable to prior periods.
(2) Provision for doubtful accounts for the years ended December 31, 2019 and 2018 reflect the adoption of ASU 2014-09,
Revenue from Contracts with Customers
, and are, therefore, not comparable to prior periods. For a full discussion on the impacts of the adoption see Note 4,
Revenue
, included in Item 8 of this report.
Year Ended December 31, 2019 Compared to Year Ended December 31, 2018
The following tables present selected consolidated comparative results of operations for the years ended December 31, 2019 and 2018:
Net Revenue
|
|
Year Ended December 31,
|
|||||||||||||
|
|
2019
|
2018
|
Variance
|
|||||||||||
|
(in thousands, except for percentages)
|
||||||||||||||
|
Net revenue
|
$
|
2,310,417
|
|
$
|
1,939,791
|
|
$
|
370,626
|
|
|
19.1
|
%
|
||
The
19.1%
increase in net revenue was primarily driven by additional revenue following the Merger of $308.9 million.
29
Additional increases in net revenue were the result of growth in the Company’s portfolio of therapies, particularly those therapies to treat chronic conditions such as autoimmune inflammatory disorders.
Cost of Revenue
|
|
Year Ended December 31,
|
|||||||||||||
|
|
2019
|
2018
|
Variance
|
|||||||||||
|
(in thousands, except for percentages)
|
||||||||||||||
|
Cost of revenue
|
$
|
1,797,418
|
|
$
|
1,517,576
|
|
$
|
279,842
|
|
18.4
|
%
|
|||
|
Gross profit margin
|
22.2
|
%
|
21.8
|
%
|
||||||||||
The
18.4%
increase in cost of revenue was primarily attributable to the increase in revenue. The increase in gross margin was driven by the therapy mix shift along with favorable formulary management and procurement contracts as we were able to take advantage of more favorable pricing due to increased buying power after the Merger.
Operating Expenses
|
|
Year Ended December 31,
|
|||||||||||||
|
|
2019
|
2018
|
Variance
|
|||||||||||
|
(in thousands, except for percentages)
|
||||||||||||||
|
Selling, general and administrative expenses
|
$
|
459,628
|
|
$
|
345,884
|
|
$
|
113,744
|
|
32.9
|
%
|
|||
|
Depreciation and amortization expense
|
53,690
|
|
38,062
|
|
15,628
|
|
41.1
|
%
|
||||||
|
Total operating expenses
|
$
|
513,318
|
|
$
|
383,946
|
|
$
|
129,372
|
|
33.7
|
%
|
|||
The increase in selling, general and administrative expenses in dollars and as a percent of revenue (17.8% of revenue for the
year ended December 31, 2018
to 19.9% for the
year ended December 31, 2019
) was driven by transaction and integration expenses related to the Merger during the year ended December 31, 2019.
The increase in depreciation and amortization was primarily related to the deprecation of fixed assets acquired and the amortization of intangibles acquired from the Merger of $6.2 million and $6.5 million, respectively.
Other Income (Expense)
|
|
Year Ended December 31,
|
|||||||||||||
|
2019
|
2018
|
Variance
|
||||||||||||
|
(in thousands, except for percentages)
|
||||||||||||||
|
Interest expense, net
|
$
|
(73,724
|
)
|
$
|
(45,824
|
)
|
$
|
(27,900
|
)
|
60.9
|
%
|
|||
|
Equity in earnings of joint ventures
|
2,840
|
|
1,020
|
|
1,820
|
|
178.4
|
%
|
||||||
|
Other, net
|
(6,991
|
)
|
(2,233
|
)
|
(4,758
|
)
|
213.1
|
%
|
||||||
|
Total other expense
|
$
|
(77,875
|
)
|
$
|
(47,037
|
)
|
$
|
(30,838
|
)
|
65.6
|
%
|
|||
The increase in interest expense of
60.9%
was primarily attributable to the additional expense related to the new debt issued at the close of the Merger.
The increase in other, net of
213.1%
was the result of the debt extinguishment costs incurred in 2019 of $5.5 million as a result of the extinguishment of debt in conjunction with the Merger.
30
Income Tax Expense (Benefit)
|
|
Year Ended December 31,
|
|||||||||||||
|
|
2019
|
2018
|
Variance
|
|||||||||||
|
(in thousands, except for percentages)
|
||||||||||||||
|
Income tax expense (benefit)
|
$
|
(2,274
|
)
|
$
|
(2,653
|
)
|
$
|
379
|
|
(14.3
|
)%
|
|||
The Company’s tax benefit for the year ended December 31, 2019 is comprised of a deferred tax benefit partially offset by a change in valuation allowance and state tax liabilities. This results in an effective tax rate of 2.9% for the year ended December 31, 2019. During the year ended December 31, 2018, the effective tax rate was 30.3%. These rates differ from the Company’s 21% federal statutory rate primarily due to a change in valuation allowance, certain state and local taxes, non-deductible costs, and resolution of certain tax matters.
Net (Loss) Income and Other Comprehensive (Loss) Income
|
|
Year Ended December 31,
|
|||||||||||||
|
|
2019
|
2018
|
Variance
|
|||||||||||
|
(in thousands, except for percentages)
|
||||||||||||||
|
Net (loss) income
|
$
|
(75,920
|
)
|
$
|
(6,115
|
)
|
$
|
(69,805
|
)
|
1,141.5
|
%
|
|||
|
Other comprehensive income (loss), net of tax:
|
||||||||||||||
|
Changes in unrealized (losses) gains on cash flow hedges, net of income taxes
|
(8,039
|
)
|
774
|
|
(8,813
|
)
|
(1,138.6
|
)%
|
||||||
|
Other comprehensive (loss) income
|
(8,039
|
)
|
774
|
|
(8,813
|
)
|
(1,138.6
|
)%
|
||||||
|
Net comprehensive (loss) income
|
$
|
(83,959
|
)
|
$
|
(5,341
|
)
|
$
|
(78,618
|
)
|
1,472.0
|
%
|
|||
Net loss increased
$69.8 million
primarily driven by increased depreciation and amortization expense, transaction expenses and integration costs related to the Merger, increased interest expense, as well as the loss on the extinguishment of debt.
Changes in unrealized (losses) gains on cash flow hedges, net of income taxes, decreased as a result of the decrease in the variable interest rates during 2019. The interest rate swaps in 2019 are hedging against the first $911.1 million of the First Lien Term Loan and the first $400.0 million of the Second Lien Term Loan, whereas the interest rate caps in 2018 through April 2019 were on the first $250.0 million of the Previous First Lien Term Loan, resulting in a larger impact on unrealized (losses) gains on cash flow hedges in 2019.
Net comprehensive loss increased
$78.6 million
for the
year ended December 31, 2019
as a result of the changes in net loss, discussed above, further reduced by the impact of the fair value of the hedging instruments.
Year Ended December 31, 2018 Compared to Year Ended December 31, 2017
The following tables present selected consolidated comparative results of operations for the years ended December 31, 2018 and 2017:
Net Revenue
|
|
Year Ended December 31,
|
|||||||||||||
|
|
2018
|
2017
|
Variance
|
|||||||||||
|
(in thousands, except for percentages)
|
||||||||||||||
|
Net revenue
|
$
|
1,939,791
|
|
$
|
1,828,046
|
|
$
|
111,745
|
|
6.1
|
%
|
|||
The
6.1%
increase in net revenue was primarily driven by growth in the Company’s portfolio of therapies to treat chronic conditions such as autoimmune inflammatory disorders, as well as a shift in commercial strategy to better leverage the capabilities of its care transition specialists to capture additional market share. The 2017 launch of additional therapies for the treatment of amyotrophic lateral sclerosis and Duchenne muscular dystrophy resulted in a $138.9 million increase in the Company’s revenue in 2018. The favorable impact of these items offset the disruption impact from the implementation of a new pharmacy system, which was deployed from November 2016 to November 2018. Additionally, 2018 net revenue reflects a
31
decrease of $61.3 million related to the implementation of ASC Topic 606,
Revenue from Contracts with Customers,
(See “Revenue Recognition” within Note 2,
Summary of Significant Accounting Policies
), which resulted in the previously reported provision for doubtful accounts being treated as an implicit price concession that reduces net revenue upon adoption in 2018.
Cost of Revenue
|
|
Year Ended December 31,
|
|||||||||||||
|
|
2018
|
2017
|
Variance
|
|||||||||||
|
(in thousands, except for percentages)
|
||||||||||||||
|
Cost of revenue
|
$
|
1,517,576
|
|
$
|
1,382,047
|
|
$
|
135,529
|
|
9.8
|
%
|
|||
|
Gross profit margin
|
21.8
|
%
|
24.4
|
%
|
||||||||||
The increase in cost of revenue was primarily attributable to the increase in revenue, combined with a number of higher cost pharmaceuticals being introduced into the Company’s therapy mix. This impact of the therapy mix shift on gross profit margin was partially offset by favorable formulary management and procurement contracts, as well as the introduction of generic alternatives. Over the course of the year, the Company focused on pharmacy efficiency through the utilization of regional compounding facilities and centers of excellence. In addition, the adoption of ASC 606 in 2018 contributed to the decline in gross margin.
Operating Expenses
|
|
Year Ended December 31,
|
|||||||||||||
|
|
2018
|
2017
|
Variance
|
|||||||||||
|
(in thousands, except for percentages)
|
||||||||||||||
|
Selling, general and administrative expenses
|
$
|
345,884
|
|
$
|
338,456
|
|
$
|
7,428
|
|
2.2
|
%
|
|||
|
Provision for doubtful accounts
|
—
|
|
45,602
|
|
(45,602
|
)
|
(100.0
|
)%
|
||||||
|
Depreciation and amortization expense
|
38,062
|
|
34,662
|
|
3,400
|
|
9.8
|
%
|
||||||
|
Total operating expenses
|
$
|
383,946
|
|
$
|
418,720
|
|
$
|
(34,774
|
)
|
(8.3
|
)%
|
|||
The
$7.4 million
increase in selling, general and administrative expenses was associated with the increase in sales volume, but as a percentage revenue declined to 17.8% in 2018 from 18.5% in 2017 as topline growth outpaced this incremental increase in operating costs and expenses.
Provision for doubtful accounts decreased as a result of the implementation of ASC Topic 606 (See “Revenue Recognition” within Note 2,
Summary of Significant Accounting Policies
) which resulted in the previously reported provision for doubtful accounts in 2017 being treated as an implicit price concession that reduces net revenue upon adoption in 2018.
The increase in depreciation and amortization expense was primarily due to the investments made into the Company’s pharmacy and information technology infrastructure in 2018.
Other Income (Expense)
|
|
Year Ended December 31,
|
|||||||||||||
|
2018
|
2017
|
Variance
|
||||||||||||
|
(in thousands, except for percentages)
|
||||||||||||||
|
Interest expense, net
|
$
|
(45,824
|
)
|
$
|
(44,307
|
)
|
$
|
(1,517
|
)
|
3.4
|
%
|
|||
|
Equity in earnings of joint ventures
|
1,020
|
|
2,186
|
|
(1,166
|
)
|
(53.3
|
)%
|
||||||
|
Other, net
|
(2,233
|
)
|
135
|
|
(2,368
|
)
|
(1,754.1
|
)%
|
||||||
|
Total other expense
|
$
|
(47,037
|
)
|
$
|
(41,986
|
)
|
$
|
(5,051
|
)
|
12.0
|
%
|
|||
The $1.5 million increase in interest expense was attributable to the increasing variable interest rates associated with the outstanding debt. To minimize the impact of these increasing rates, the Company repriced its first lien debt in June 2018
32
resulting in a lower spread over the underlying interest rate. Additionally, the interest rate cap contracts entered into in 2017 partially mitigated the increase in interest expense.
The increase in other, net was primarily due to costs incurred associated with the repricing of the Previous First Lien Term Loan.
Income Tax Expense (Benefit)
|
|
Year Ended December 31,
|
|||||||||||||
|
|
2018
|
2017
|
Variance
|
|||||||||||
|
(in thousands, except for percentages)
|
||||||||||||||
|
Income tax benefit
|
$
|
(2,653
|
)
|
$
|
(18,585
|
)
|
$
|
15,932
|
|
(85.7
|
)%
|
|||
Income tax benefit decreased $15.9 million, or 85.7%. In December 2017, the United States Government enacted the Tax Cuts and Jobs Act of 2017 (“TCJA”), which significantly changed U.S. tax law by, among other things, reducing the corporate tax rate from 35% to 21%, effective January 1, 2018. Included in the tax benefit for 2017 is a benefit of $17.0 million related to the tax rate reduction, resulting in an effective income rate of 126.4%. The Company’s 2018 income tax benefit returned to a normalized run-rate with an effective income tax rate of 30.3%.
Net (Loss) Income and Other Comprehensive (Loss) Income
|
|
Year Ended December 31,
|
|||||||||||||
|
|
2018
|
2017
|
Variance
|
|||||||||||
|
(in thousands, except for percentages)
|
||||||||||||||
|
Net (loss) income
|
$
|
(6,115
|
)
|
$
|
3,878
|
|
$
|
(9,993
|
)
|
(257.7
|
)%
|
|||
|
Other comprehensive income, net of tax:
|
||||||||||||||
|
Changes in unrealized gains on cash flow hedges, net of income taxes
|
774
|
|
58
|
|
716
|
|
1,234.5
|
%
|
||||||
|
Other comprehensive income
|
774
|
|
58
|
|
716
|
|
1,234.5
|
%
|
||||||
|
Net comprehensive (loss) income
|
$
|
(5,341
|
)
|
$
|
3,936
|
|
$
|
(9,277
|
)
|
(235.7
|
)%
|
|||
Net income decreased $10.0 million. The decrease was primarily driven by the run-rate normalization of the impact of the tax reform legislation, which had a favorable impact in 2017.
Changes in unrealized gains on cash flow hedges, net of income taxes, increased $0.7 million. The increase in the variable interest rates during 2018 resulted in a corresponding increase in the fair value of the interest rate cap.
Net comprehensive loss was $5.3 million for the twelve months ended December 31, 2018, compared to net comprehensive income of $3.9 million for the twelve months ended December 31, 2017, primarily related to the impact of the tax reform legislation previously discussed.
Liquidity and Capital Resources
For the years ended December 31, 2019 and 2018, the Company’s primary sources of liquidity were cash on hand of
$67.1 million
and
$36.4 million
, respectively, as well as borrowings under its credit facilities, described further below. During the years ended December 31, 2019 and 2018, the Company’s positive cash flows from operations have enabled investments in pharmacy and information technology infrastructure to support growth and create additional capacity in the future, as well as pursue acquisitions.
The Company’s primary uses of cash include supporting our ongoing business activities, integration efforts, and investment in various acquisitions and our infrastructure to support additional business volumes. Ongoing operating cash outflows are associated with procuring and dispensing prescription drugs, personnel and other costs associated with servicing patients, as well as paying cash interest on the outstanding debt. Ongoing investing cash flows are primarily associated with capital projects related to business acquisitions, the improvement and maintenance of our pharmacy facilities and investment in our information technology systems. Ongoing financing cash flows are primarily associated with the quarterly principal
33
payments on our outstanding debt. In addition to these ongoing investing and financing activities, during the year ended December 31, 2019, the Company entered into the Merger Agreement, and the Merger resulted in cash used in investing activities of $700.2 million and net cash provided by financing activities for net proceeds of indebtedness of $724.3 million.
Our business strategy includes the selective acquisition of additional infusion pharmacies and other related healthcare businesses. We continue to evaluate acquisition opportunities and view acquisitions as a key part of our growth strategy. The Company historically has funded its acquisitions with cash with the exception of the Merger. The Company may require additional capital in excess of current availability in order to complete future acquisitions. It is impossible to predict the amount of capital that may be required for acquisitions, and there is no assurance that sufficient financing for these activities will be available on acceptable terms.
Short-Term and Long-Term Liquidity Requirements
The Company’s ability to make principal and interest payments on any borrowings under our credit facilities and our ability to fund planned capital expenditures will depend on our ability to generate cash in the future, which, to a certain extent, is subject to general economic, financial, competitive, regulatory and other conditions. Based on our current level of operations and planned capital expenditures, we believe that our existing cash balances and expected cash flows generated from operations will be sufficient to meet our operating requirements for at least the next 12 months. We may require additional borrowings under our credit facilities and alternative forms of financings or investments to achieve our longer-term strategic plans.
Credit Facilities
During 2015, Option Care entered into two credit arrangements administered by Bank of America, N.A. and U.S. Bank. The agreements provided for up to
$645.0 million
in senior secured credit facilities through an
$80.0 million
revolving credit facility (the “Previous Revolving Credit Facility”), a
$415.0 million
first lien term loan (the “Previous First Lien Term Loan”), and a
$150.0 million
second lien term loan (the “Previous Second Lien Term Loan”, and together with the Previous First Lien Term Loan, the “Previous Term Loans”, and the Previous Term Loans, together with the Previous Revolving Credit Facility, the “Previous Credit Facilities”). Amounts borrowed under the credit agreements were secured by substantially all of the assets of the Company.
On August 6, 2019, the Company repaid the outstanding balance of the Previous Term Loans and retired the outstanding credit arrangements for $551.7 million. Proceeds of $575.0 million from the two new credit arrangements and indenture, discussed below, were also used, in part, to repay the outstanding debt of BioScrip as of the Merger.
In conjunction with the Merger, the Company entered into an asset-based-lending revolving credit facility and a first lien term loan facility. The Company also issued senior secured second lien PIK toggle floating rate notes due 2027 (the “Second Lien Notes”). The two new credit agreements and the indenture were entered into on August 6, 2019 and provide for up to
$1,475.0 million
in senior secured credit facilities through a
$150.0 million
asset-based-lending revolving credit facility (the “ABL Facility”), a
$925.0 million
first lien term loan (the “First Lien Term Loan”, and together with the ABL Facility, the “Loan Facilities”), and a
$400.0 million
issuance of Second Lien Notes. Amounts borrowed under the credit agreements are secured by substantially all of the assets of the Company.
The ABL Facility credit agreement provides for borrowings up to
$150.0 million
, which matures on
August 6, 2024
. The ABL Facility bears interest at a per annum rate that is determined by the Company’s periodic selection of rate type, either the Base Rate or the Eurocurrency Rate. The Base Rate is charged between
1.25%
and
1.75%
and the Eurocurrency Rate is charged between
2.25%
and
2.75%
based on the historical excess availability as a percentage of the Line Cap, as defined in the ABL Facility credit agreement. The revolving credit facility contains commitment fees payable on the unused portion of the ABL ranging from
0.25%
to
0.375%
, depending on various factors including the Company’s leverage ratio, type of loan and rate type, and letter of credit fees of
2.50%
. The Company had
no
outstanding borrowings under the ABL Facility at
December 31, 2019
. The Company had
$9.6 million
of undrawn letters of credit issued and outstanding, resulting in net borrowing availability under the ABL of
$140.4 million
as of
December 31, 2019
.
The principal balance of the First Lien Term Loan is repayable in quarterly installments of
$2.3 million
plus interest, with a final payment of all remaining outstanding principal due on
August 6, 2026
. The quarterly principal payments will commence in March of 2020. Interest on the First Lien Term Loan is payable monthly on Base Rate loans at Base Rate, as defined, plus
3.25%
to
3.50%
, depending on the Company’s leverage ratio. Interest is charged on Eurocurrency Rate loans at the Eurocurrency Rate, as defined, plus
4.25%
to
4.50%
, depending on the Company’s leverage ratio. The interest rate on the First Lien Term Loan was
6.20%
as of
December 31, 2019
.
34
The Second Lien Notes mature on
August 6, 2027
. Interest on the Second Lien Notes is payable quarterly and is at the greater of
1.00%
or LIBOR, plus
8.75%
. The Company elected to pay-in-kind the first quarterly interest payment, due in November 2019, which resulted in the Company capitalizing the interest payment to the principal balance on the interest payment date, increasing the outstanding principal balance to $412.3 million. The interest rate on the Second Lien Notes was
10.66%
as of
December 31, 2019
.
Cash Flows
Year Ended December 31, 2019 Compared to Year Ended December 31, 2018
The following table presents selected data from Option Care Health’s consolidated statements of cash flows for the years ended December 31, 2019 and 2018:
|
|
Year Ended December 31,
|
||||||||||
|
|
2019
|
2018
|
Variance
|
||||||||
|
(in thousands)
|
|||||||||||
|
Net cash provided by operating activities
|
$
|
39,467
|
|
$
|
24,428
|
|
$
|
15,039
|
|
||
|
Net cash used in investing activities
|
(727,826
|
)
|
(37,003
|
)
|
(690,823
|
)
|
|||||
|
Net cash provided by (used in) financing activities
|
719,024
|
|
(4,150
|
)
|
723,174
|
|
|||||
|
Net increase (decrease) in cash and cash equivalents
|
30,665
|
|
(16,725
|
)
|
47,390
|
|
|||||
|
Cash and cash equivalents - beginning of period
|
36,391
|
|
53,116
|
|
(16,725
|
)
|
|||||
|
Cash and cash equivalents - end of period
|
$
|
67,056
|
|
$
|
36,391
|
|
$
|
30,665
|
|
||
Cash Flows from Operating Activities
For the
year ended December 31, 2019
, Option Care Health generated
$39.5 million
in cash flow from operating activities, a
$15.0 million
increase over the
year ended December 31, 2018
. The cash provided by operating activities for the
year ended December 31, 2019
was driven by working capital efficiencies, primarily in accounts receivable, as the Company’s efforts to increase cash velocity and improve the aging of the accounts receivable balance resulted in stronger cash collections. The strong collections were partially offset by the change in accounts payable as the Company had a net pay down of acquired payables from the Merger.
Cash Flows from Investing Activities
For the
year ended December 31, 2019
, Option Care Health used
$727.8 million
in cash for investing activities as compared to
$37.0 million
for the
year ended December 31, 2018
. For the
year ended December 31, 2019
, the cash used was primarily attributable to the Merger of $700.2 million as well as investments in pharmacy and information technology infrastructure of
$28.3 million
. Similarly, for the
year ended December 31, 2018
,
$26.3 million
was invested in our pharmacies and information technology and $10.7 million was deployed for the Baptist Health and Home IV, Inc. acquisitions.
Cash Flows from Financing Activities
Cash flows from financing increased
$723.2 million
from cash used in financing activities of
$4.2 million
for the
year ended December 31, 2018
to cash provided by financing activities of
$719.0 million
for the
year ended December 31, 2019
. The change is primarily related to the proceeds from the issuance of new debt of
$981.1 million
, partially offset by the retirement of the Company’s previous debt of
$226.7 million
and the payment of deferred financing costs of $30.0 million for the
year ended December 31, 2019
. Cash used in financing activities for the
year ended December 31, 2018
primarily related to repayments of the Previous Credit Facilities.
Year Ended December 31, 2018 Compared to Year Ended December 31, 2017
The following table presents selected data from Option Care Health’s consolidated statements of cash flows for the years ended December 31, 2018 and 2017:
35
|
|
Year Ended December 31,
|
||||||||||
|
|
2018
|
2017
|
Variance
|
||||||||
|
(in thousands)
|
|||||||||||
|
Net cash provided by operating activities
|
$
|
24,428
|
|
$
|
37,871
|
|
$
|
(13,443
|
)
|
||
|
Net cash used in investing activities
|
(37,003
|
)
|
(24,472
|
)
|
(12,531
|
)
|
|||||
|
Net cash used in financing activities
|
(4,150
|
)
|
(5,150
|
)
|
1,000
|
|
|||||
|
Net (decrease) increase in cash and cash equivalents
|
(16,725
|
)
|
8,249
|
|
(24,974
|
)
|
|||||
|
Cash and cash equivalents - beginning of period
|
53,116
|
|
44,867
|
|
8,249
|
|
|||||
|
Cash and cash equivalents - end of period
|
$
|
36,391
|
|
$
|
53,116
|
|
$
|
(16,725
|
)
|
||
Cash Flows from Operating Activities
For the year ended December 31, 2018, Option Care Health generated $24.4 million in positive cash flow from operating activities. This represented a $13.4 million decrease from the $37.9 million generated for the year ended December 31, 2017. The primary drivers of the decline in cash provided by operating activities included: (i) a reduction in accounts payable and accrued expenses and other current liabilities of $32.1 million related to timing of vendor payments in the ordinary course of business; and (ii) an increase in prepaid expenses and other current assets of $17.2 million primarily driven by the timing of vendor rebate payments. Partially offsetting these declines were the following improvements: (i) an improvement in accounts receivable of $13.0 million as the Company was recovering from the prior year disruption impact of the new pharmacy dispensing system deployment and billing center consolidation; (ii) an improvement in operating income of $11.0 million; (iii) a $6.7 million increase in accrued compensation and employee benefits related to the timing of payroll cycles; and (iv) a $6.4 million reduction in inventory.
Cash Flows from Investing Activities
For the year ended December 31, 2018, Option Care Health used $37.0 million in cash for investing activities. This was primarily attributable to capital investments in pharmacy and information technology infrastructure, as well as to fund the Baptist and Home IV acquisitions.
The increase of $12.5 million in net cash used in investing activities for the year ended December 31, 2018 compared to the year ended December 31, 2017 is due primarily to the Baptist and Home IV acquisitions.
Cash Flows from Financing Activities
For the year ended December 31, 2018, Option Care Health used $4.2 million in cash for financing activities. This was related to repayments of long-term debt.
Commitments and Contractual Obligations
The following table presents Option Care Health’s commitments and contractual obligations as of
December 31, 2019
, as well as its long-term obligations:
|
Payments Due by Period
|
||||||||||||||||||||
|
Total
|
Less than 1 year
|
1 - 3 years
|
3-5 years
|
More than 5 years
|
||||||||||||||||
|
(in thousands)
|
||||||||||||||||||||
|
Long-term debt obligations
(1)
|
$
|
1,337,256
|
|
$
|
9,250
|
|
$
|
18,500
|
|
$
|
18,500
|
|
$
|
1,291,006
|
|
|||||
|
Interest payments on long-term debt obligations
(2)
|
741,228
|
|
101,121
|
|
200,498
|
|
198,171
|
|
241,438
|
|
||||||||||
|
Operating lease obligations
|
94,257
|
|
24,983
|
|
33,160
|
|
18,452
|
|
17,662
|
|
||||||||||
|
Total
|
$
|
2,172,741
|
|
$
|
135,354
|
|
$
|
252,158
|
|
$
|
235,123
|
|
$
|
1,550,106
|
|
|||||
|
(1)
|
Includes aggregate principal payment on the indebtedness from the First Lien Term Loan and the Second Lien Notes incurred in
2019
.
|
|
(2)
|
Interest payments calculated based on LIBOR rate as of
December 31, 2019
. Actual payments are based on changes in
|
36
LIBOR. Calculated interest payments exclude interest rate swap agreements the Company entered into in connection with the new indebtedness incurred in
2019
.
Other noncurrent liabilities and deferred income taxes were excluded from this table, as the Company is unable to determine the timing of future payments. There were no significant capital expenditure commitments as of
December 31, 2019
. The contractual commitment amounts in the table above are associated with agreements that are enforceable and legally binding.
Off-Balance Sheet Arrangements
As of
December 31, 2019
, Option Care Health did not have any off-balance sheet arrangements, as defined in Item 303(a)(4)(ii) of Regulation S-K.
Critical Accounting Policies and Estimates
The Company prepares its consolidated financial statements in accordance with United States generally accepted accounting principles (“GAAP”), which requires the Company to make estimates and assumptions. The Company evaluates its estimates and judgments on an ongoing basis. Estimates and judgments are based on historical experience and on various other factors that are believed to be reasonable under the circumstances, the results of which form the basis for making judgments about the carrying values of assets and liabilities at the date of the financial statements and the reported amounts of revenues and expenses for the period presented. The Company’s actual results may differ from these estimates, and different assumptions or conditions may yield different estimates.
The following discussion is not intended to be a comprehensive list of all the accounting policies, estimates or judgments made in the preparation of our financial statements. A discussion of our significant accounting policies, including further discussion of the accounting policies described below, can be found in Note 2,
Summary of Significant Accounting Policies
, within the Notes to the Consolidated Financial Statements included in Item 8 of this Annual Report.
Revenue Recognition and Accounts Receivable
Net revenue is reported at the net realizable value amount that reflects the consideration the Company expects to receive in exchange for providing services. Revenues are from commercial payers, government payers, and patients for goods and services provided and are based on a gross price based on payer contracts, fee schedules, or other arrangements less any implicit price concessions.
Due to the nature of the health care industry and the reimbursement environment in which the Company operates, certain estimates are required to record revenue and accounts receivable at their net realizable values at the time goods or services are provided. Inherent in these estimates is the risk that they will have to be revised or updated as additional information becomes available.
The Company assesses the expected consideration to be received at the time of patient acceptance based on the verification of the patient’s insurance coverage, historical information with the patient, similar patients, or the payer. Performance obligations are determined based on the nature of the services provided by the Company. The majority of the Company’s performance obligations are to provide infusion services to deliver medicine, nutrients, or fluids directly into the body.
The Company provides a variety of infusion-related therapies to patients, which frequently include multiple deliverables of pharmaceutical drugs and related nursing services. After applying the criteria from ASC 606, the Company concluded that multiple performance obligations exist in its contracts with its customers. Revenue is allocated to each performance obligation based on relative standalone price, determined based on reimbursement rates established in the third-party payer contracts. Pharmaceutical drug revenue is recognized at the time the pharmaceutical drug is delivered to the patient, and nursing revenue is recognized on the date of service.
The Company’s accounts receivable are reported at the net realizable value amount that reflects the consideration the Company expects to receive in exchange for providing services, which is inclusive of adjustments for price concessions. The majority of accounts receivable are due from private insurance carriers and governmental health care programs, such as Medicare and Medicaid.
Price concessions may result from patient hardships, patient uncollectible accounts sent to collection agencies, lack of recovery due to not receiving prior authorization, differing interpretations of covered therapies in payer contracts, different pricing methodologies, or various other reasons.
37
Included in accounts receivable are earned but unbilled gross receivables. Delays ranging from one day up to several weeks between the date of service and billing can occur due to delays in obtaining certain required payer-specific documentation from internal and external sources.
Prior to the adoption of ASC 606, estimates of uncollectible accounts receivable were recorded as either a pricing adjustment to revenue (“contractual adjustment”) or as an uncollectible account to provision for doubtful accounts. The Company recorded an allowance for doubtful accounts based on historical experience and a detailed assessment of the collectability of its accounts receivable. In estimating the allowance for doubtful accounts, the Company considered, among other factors, (i) the balance and aging composition of the accounts receivable, (ii) the Company’s historical write-offs and recoveries, (iii) the creditworthiness of its payers, and (iv) general economic conditions. Accounts receivable were written-off as bad debts after all reasonable collection efforts have been exhausted. Subsequent to the adoption of ASC 606, an allowance for doubtful accounts is established only as a result of an adverse change in the payers’ ability to pay outstanding billings. The Company recorded an allowance for contractual adjustment based on its historical experience of additional revenue being recorded or revenue being written off when amounts received are greater than or less than the originally estimated net realizable value. The detailed assessments included, among other factors, (i) current over/under payments which had not yet been applied to an account, (ii) historical contractual adjustments, and (iii) an estimate for contractual adjustments expected to be realized in the future. Contractual allowance estimates were adjusted to actual amounts as cash was received and claims were settled.
Goodwill
Goodwill represents the excess of the purchase price over the fair value of assets acquired and liabilities assumed. The Company tests goodwill for impairment annually, or more frequently whenever events or circumstances indicate impairment may exist. Goodwill is stated at cost less accumulated impairment losses. The Company completes its goodwill impairment test annually in the fourth quarter.
Circumstances that could trigger an interim impairment test include: a significant adverse change in the business climate or legal factors; an adverse action or assessment by a regulator; unanticipated competition; the loss of key personnel; a change in reporting units; the likelihood that a reporting unit or significant portion of a reporting unit will be sold or otherwise disposed of; and the results of testing for recoverability of a significant asset group within a reporting unit.
A qualitative impairment analysis was performed in the fourth quarter of 2019 to assess whether it is more likely than not that the fair value of the Company’s reporting unit is less than its carrying value. The Company assessed relevant events and circumstances including macroeconomic conditions, industry and market considerations, overall financial performance, entity-specific events, and changes in the Company’s stock price. The Company determined that there was no goodwill impairment in 2019.
A quantitative impairment analysis was performed in the fourth quarter of 2018 and 2017, and the Company estimated the fair value of its reporting unit using an income approach. The income approach requires the Company to estimate a number of factors for its reporting unit, including projected future operating results, economic projections, anticipated future cash flows, and discount rates. The fair value determined using he income approach was then compared to marketplace fair value data from within a comparable industry grouping for reasonableness. The Company determined that there was no goodwill impairment in 2018 or 2017.
The determination of fair value and the allocation of that value to individual assets and liabilities within the reporting unit requires the Company to make significant estimates and assumptions. These estimates and assumptions primarily include, but are not limited to, the selection of appropriate peer group companies; control premiums appropriate for acquisitions in the industries in which the Company competes; the discount rate; terminal growth rates; and forecasts of revenue, operating income, depreciation and amortization, and capital expenditures. Actual financial results could differ from those estimates due to inherent uncertainty involved in making such estimates. Changes in assumptions concerning future financial results or other underlying assumptions could have a significant impact on either the fair value of the reporting unit, the amount of the goodwill impairment charge, or both.
Business Acquisitions
The Company accounts for business acquisitions in accordance with ASC Topic 805 (“ASC 805”),
Business Combinations
, with assets and liabilities being recorded at their acquisition date fair values and goodwill being calculated as the purchase price in excess of the net identifiable assets. The application of ASC 805 requires management to make estimates and assumptions when determining the acquisition date fair values of acquired assets and assumed liabilities. Management’s estimates and assumptions include, but are not limited to, the future cash flows an asset is expected to generate and the weighted-average cost of capital.
38
Item 7A.
Quantitative and Qualitative Disclosures about Market Risk
Interest Rate Risk
The Company’s primary market risk exposure is changing LIBOR‑based interest rates. Interest rate risk is highly sensitive due to many factors, including U.S. monetary and tax policies, U.S. and international economic factors and other factors beyond our control. Our First Lien Term Loan bears interest at the Eurocurrency Rate, as defined, plus 4.50%, based on our leverage ratio as of December 31, 2019. Our Second Lien Notes bear interest at the greater of 1.00% or LIBOR, plus 8.75%. Our ABL Facility bears interest at the Eurocurrency Rate, as defined, plus 2.25%. At December 31, 2019, we had total outstanding debt of $925.0 million under our First Lien Term Loan. As of December 31, 2019, we had $412.3 million Second Lien Notes issued and outstanding. We had no outstanding borrowings under the ABL Facility as of December 31, 2019.
To minimize interest rate risk, the Company entered into two interest rate swap contracts to hedge against fluctuations in LIBOR rates on the First Lien Term Loan and Second Lien Term Loan. The first interest rate swap for $925.0 million notional was effective in August 2019 with $911.1 million designated as a cash flow hedge against the underlying interest rate on the First Lien Term Loan indexed to one-month LIBOR through August 2021. The second interest rate swap for $400.0 million notional was effective in November 2019 and is designated as a cash flow hedge against the underlying interest rate on the Second Lien Notes interest payment indexed to three-month LIBOR through November 2020.
Based on the amounts outstanding coupled with interest rate swaps, a 100-basis point increase or decrease in market interest rates over a twelve-month period would result in a change to interest expense of $0.9 million. We do not anticipate a significant impact from a change in market interest rates through the period of the interest rate swaps, discussed further in Note 13,
Derivative Instruments
, of the consolidated financial statements and the notes related thereto included in Item 8 of this report.
Foreign Exchange Risk
All sales are in the U.S. and are U.S.-dollar denominated. Option Care Health makes a limited amount of purchases from foreign sources, which subjects Option Care Health to foreign currency exchange risk. As a result of the limited amount of transactions in a foreign currency, Option Care Health does not expect its future cash flows or operating results to be affected to any significant degree by foreign currency exchange risk.
Inflation Rate Risk
Based on its analysis of the periods presented, the Company believes that inflation has not had a material effect on its operating results. There can be no assurance that future inflation will not have an adverse impact on the Company’s operating results and financial condition.
39
Item 8.
Financial Statements and Supplementary Data
Report of Independent Registered Public Accounting Firm
To the Stockholders and Board of Directors
Option Care Health, Inc.:
Opinion on the Consolidated Financial Statements
We have audited the accompanying consolidated balance sheets of Option Care Health, Inc. and subsidiaries (the Company) as of December 31, 2019 and 2018, the related consolidated statements of comprehensive income (loss), stockholders’ equity, and cash flows for each of the years in the three-year period ended December 31, 2019, and the related notes (collectively, the consolidated financial statements). In our opinion, the consolidated financial statements present fairly, in all material respects, the financial position of the Company as of December 31, 2019 and 2018, and the results of its operations and its cash flows for each of the years in the three year period ended December 31, 2019, in conformity with U.S. generally accepted accounting principles.
We also have audited, in accordance with the standards of the Public Company Accounting Oversight Board (United States) (PCAOB), the Company’s internal control over financial reporting as of December 31, 2019, based on criteria established in
Internal Control - Integrated Framework (2013)
issued by the Committee of Sponsoring Organizations of the Treadway Commission, and our report dated March 5, 2020 expressed an unqualified opinion on the effectiveness of the Company’s internal control over financial reporting.
Change in Accounting Principle
As discussed in Note 2 to the consolidated financial statements, the Company has changed its method of accounting for revenue recognition as of January 1, 2018 and leases as of January 1, 2019 due to the adoptions of ASU No. 2014-09, “Revenue from Contracts with Customers” and ASU No. 2016-02, “Leases”.
Basis for Opinion
These consolidated financial statements are the responsibility of the Company’s management. Our responsibility is to express an opinion on these consolidated financial statements based on our audits. We are a public accounting firm registered with the PCAOB and are required to be independent with respect to the Company in accordance with the U.S. federal securities laws and the applicable rules and regulations of the Securities and Exchange Commission and the PCAOB.
We conducted our audits in accordance with the standards of the PCAOB. Those standards require that we plan and perform the audit to obtain reasonable assurance about whether the consolidated financial statements are free of material misstatement, whether due to error or fraud. Our audits included performing procedures to assess the risks of material misstatement of the consolidated financial statements, whether due to error or fraud, and performing procedures that respond to those risks. Such procedures included examining, on a test basis, evidence regarding the amounts and disclosures in the consolidated financial statements. Our audits also included evaluating the accounting principles used and significant estimates made by management, as well as evaluating the overall presentation of the consolidated financial statements. We believe that our audits provide a reasonable basis for our opinion.
/s/ KPMG LLP
We have served as the Company’s auditor since 2015.
Chicago, Illinois
March 5, 2020
40
OPTION CARE HEALTH, INC.
CONSOLIDATED BALANCE SHEETS
(IN THOUSANDS, EXCEPT SHARES AND PER SHARE AMOUNTS)
|
December 31,
|
|||||||
|
2019
|
2018
|
||||||
|
ASSETS
|
|||||||
|
CURRENT ASSETS:
|
|||||||
|
Cash and cash equivalents
|
$
|
67,056
|
|
$
|
36,391
|
|
|
|
Accounts receivable, net
|
324,416
|
|
310,169
|
|
|||
|
Inventories
|
115,876
|
|
83,340
|
|
|||
|
Prepaid expenses and other current assets
|
51,306
|
|
37,525
|
|
|||
|
Total current assets
|
558,654
|
|
467,425
|
|
|||
|
NONCURRENT ASSETS:
|
|||||||
|
Property and equipment, net
|
133,198
|
|
93,142
|
|
|||
|
Operating lease right-of-use asset
|
63,502
|
|
—
|
|
|||
|
Intangible assets, net
|
385,910
|
|
219,713
|
|
|||
|
Goodwill
|
1,425,542
|
|
632,469
|
|
|||
|
Other noncurrent assets
|
22,741
|
|
15,462
|
|
|||
|
Total noncurrent assets
|
2,030,893
|
|
960,786
|
|
|||
|
TOTAL ASSETS
|
$
|
2,589,547
|
|
$
|
1,428,211
|
|
|
|
LIABILITIES AND STOCKHOLDERS’ EQUITY
|
|
|
|
|
|||
|
CURRENT LIABILITIES:
|
|
|
|
|
|||
|
Accounts payable
|
$
|
221,060
|
|
$
|
187,886
|
|
|
|
Accrued compensation and employee benefits
|
45,765
|
|
24,895
|
|
|||
|
Accrued expenses and other current liabilities
|
33,538
|
|
23,066
|
|
|||
|
Current portion of operating lease liability
|
20,391
|
|
—
|
|
|||
|
Current portion of long-term debt
|
9,250
|
|
4,150
|
|
|||
|
Total current liabilities
|
330,004
|
|
239,997
|
|
|||
|
NONCURRENT LIABILITIES:
|
|||||||
|
Long-term debt, net of discount, deferred financing costs and current portion
|
1,277,246
|
|
535,225
|
|
|||
|
Operating lease liability, net of current portion
|
58,242
|
|
—
|
|
|||
|
Deferred income taxes
|
2,143
|
|
33,481
|
|
|||
|
Other noncurrent liabilities
|
15,085
|
|
16,683
|
|
|||
|
Total noncurrent liabilities
|
1,352,716
|
|
585,389
|
|
|||
|
Total liabilities
|
1,682,720
|
|
825,386
|
|
|||
|
STOCKHOLDERS’ EQUITY:
|
|||||||
|
Preferred stock; $0.0001 par value; 12,500,000 shares authorized, no shares outstanding as of December 31, 2019. No preferred stock authorized or outstanding as of December 31, 2018.
|
—
|
|
—
|
|
|||
|
Common stock; $0.0001 par value: 250,000,000 shares authorized, 176,975,628 shares issued and 176,591,907 shares outstanding as of December 31, 2019; 142,613,749 shares issued and outstanding as of December 31, 2018.
|
18
|
|
14
|
|
|||
|
Treasury stock; 383,722 shares outstanding, at cost, as of December 31, 2019; no shares outstanding as of December 31, 2018
|
(2,403
|
)
|
—
|
|
|||
|
Paid-in capital
|
1,008,362
|
|
619,621
|
|
|||
|
Management notes receivable
|
—
|
|
(1,619
|
)
|
|||
|
Accumulated deficit
|
(91,955
|
)
|
(16,035
|
)
|
|||
|
Accumulated other comprehensive (loss) income
|
(7,195
|
)
|
844
|
|
|||
|
Total stockholders’ equity
|
906,827
|
|
602,825
|
|
|||
|
TOTAL LIABILITIES AND STOCKHOLDERS’ EQUITY
|
$
|
2,589,547
|
|
$
|
1,428,211
|
|
|
The notes to consolidated financial statements are an integral part of these statements.
41
OPTION CARE HEALTH, INC.
CONSOLIDATED STATEMENTS OF COMPREHENSIVE INCOME (LOSS)
(IN THOUSANDS, EXCEPT PER SHARE AMOUNTS)
|
Year Ended December 31,
|
||||||||||||
|
|
2019
|
2018
|
2017
|
|||||||||
|
NET REVENUE
|
$
|
2,310,417
|
|
$
|
1,939,791
|
|
$
|
1,828,046
|
|
|||
|
COST OF REVENUE
|
1,797,418
|
|
1,517,576
|
|
1,382,047
|
|
||||||
|
GROSS PROFIT
|
512,999
|
|
422,215
|
|
445,999
|
|
||||||
|
OPERATING COSTS AND EXPENSES:
|
||||||||||||
|
Selling, general and administrative expenses
|
459,628
|
|
345,884
|
|
338,456
|
|
||||||
|
Provision for doubtful accounts
|
—
|
|
—
|
|
45,602
|
|
||||||
|
Depreciation and amortization expense
|
53,690
|
|
38,062
|
|
34,662
|
|
||||||
|
Total operating expenses
|
513,318
|
|
383,946
|
|
418,720
|
|
||||||
|
OPERATING (LOSS) INCOME
|
(319
|
)
|
38,269
|
|
27,279
|
|
||||||
|
OTHER INCOME (EXPENSE):
|
||||||||||||
|
Interest expense, net
|
(73,724
|
)
|
(45,824
|
)
|
(44,307
|
)
|
||||||
|
Equity in earnings of joint ventures
|
2,840
|
|
1,020
|
|
2,186
|
|
||||||
|
Other, net
|
(6,991
|
)
|
(2,233
|
)
|
135
|
|
||||||
|
Total other expense
|
(77,875
|
)
|
(47,037
|
)
|
(41,986
|
)
|
||||||
|
LOSS BEFORE INCOME TAXES
|
(78,194
|
)
|
(8,768
|
)
|
(14,707
|
)
|
||||||
|
INCOME TAX BENEFIT
|
(2,274
|
)
|
(2,653
|
)
|
(18,585
|
)
|
||||||
|
NET (LOSS) INCOME
|
$
|
(75,920
|
)
|
$
|
(6,115
|
)
|
$
|
3,878
|
|
|||
|
OTHER COMPREHENSIVE (LOSS) INCOME, NET OF TAX:
|
||||||||||||
|
Change in unrealized (losses) gains on cash flow hedges, net of income taxes of $259, $234 and $36, respectively
|
(8,039
|
)
|
774
|
|
58
|
|
||||||
|
OTHER COMPREHENSIVE (LOSS) INCOME
|
(8,039
|
)
|
774
|
|
58
|
|
||||||
|
NET COMPREHENSIVE (LOSS) INCOME
|
$
|
(83,959
|
)
|
$
|
(5,341
|
)
|
$
|
3,936
|
|
|||
|
(LOSS) EARNINGS PER COMMON SHARE
|
||||||||||||
|
Net (loss) earnings per share, basic and diluted
|
$
|
(0.49
|
)
|
$
|
(0.04
|
)
|
$
|
0.03
|
|
|||
|
Weighted average common shares outstanding, basic and diluted
|
156,280
|
|
142,614
|
|
142,614
|
|
||||||
The notes to consolidated financial statements are an integral part of these statements.
42
OPTION CARE HEALTH, INC.
CONSOLIDATED STATEMENTS OF CASH FLOWS
(IN THOUSANDS)
|
Year Ended December 31,
|
|||||||||||
|
|
2019
|
2018
|
2017
|
||||||||
|
CASH FLOWS FROM OPERATING ACTIVITIES:
|
|||||||||||
|
Net (loss) income
|
$
|
(75,920
|
)
|
$
|
(6,115
|
)
|
$
|
3,878
|
|
||
|
Adjustments to reconcile net (loss) income to net cash provided by operations:
|
|||||||||||
|
Depreciation and amortization expense
|
57,869
|
|
41,055
|
|
38,062
|
|
|||||
|
Non-cash operating lease costs
|
19,719
|
|
—
|
|
—
|
|
|||||
|
Deferred income taxes - net
|
(4,607
|
)
|
(3,595
|
)
|
(19,804
|
)
|
|||||
|
Loss on sale of assets
|
3,269
|
|
1,123
|
|
999
|
|
|||||
|
Business casualty loss
|
(626
|
)
|
3,549
|
|
—
|
|
|||||
|
Loss on extinguishment of debt
|
5,469
|
|
72
|
|
—
|
|
|||||
|
Amortization of deferred financing costs
|
4,544
|
|
3,107
|
|
2,996
|
|
|||||
|
Paid-in-kind interest capitalized as principal
|
12,256
|
|
—
|
|
—
|
|
|||||
|
Equity in earnings of joint ventures
|
(2,840
|
)
|
(1,020
|
)
|
(2,186
|
)
|
|||||
|
Stock-based incentive compensation expense
|
4,170
|
|
2,139
|
|
1,455
|
|
|||||
|
Interest on management notes receivable
|
(62
|
)
|
(78
|
)
|
(56
|
)
|
|||||
|
Capital distribution from equity method investments
|
500
|
|
2,000
|
|
1,250
|
|
|||||
|
Change in contingent consideration liability
|
(300
|
)
|
—
|
|
—
|
|
|||||
|
Changes in operating assets and liabilities:
|
|
|
|||||||||
|
Accounts receivable, net
|
82,285
|
|
(21,012
|
)
|
(34,003
|
)
|
|||||
|
Inventories
|
(12,853
|
)
|
2,965
|
|
(3,481
|
)
|
|||||
|
Prepaid expenses and other current assets
|
(2,940
|
)
|
(4,715
|
)
|
12,452
|
|
|||||
|
Accounts payable
|
(30,856
|
)
|
10,965
|
|
47,411
|
|
|||||
|
Accrued compensation and employee benefits
|
2,671
|
|
(5,586
|
)
|
(12,246
|
)
|
|||||
|
Accrued expenses and other current liabilities
|
(317
|
)
|
(1,740
|
)
|
(4,095
|
)
|
|||||
|
Operating lease liabilities
|
(17,253
|
)
|
—
|
|
—
|
|
|||||
|
Other noncurrent assets and liabilities
|
(4,711
|
)
|
1,314
|
|
5,239
|
|
|||||
|
Net cash provided by operating activities
|
39,467
|
|
24,428
|
|
37,871
|
|
|||||
|
CASH FLOWS FROM INVESTING ACTIVITIES:
|
|||||||||||
|
Acquisition of property and equipment
|
(28,292
|
)
|
(26,276
|
)
|
(24,956
|
)
|
|||||
|
Proceeds from sale of assets
|
10
|
|
—
|
|
484
|
|
|||||
|
Insurance proceeds from business casualty loss
|
626
|
|
—
|
|
—
|
|
|||||
|
Business acquisitions, net of cash acquired
|
(700,170
|
)
|
(10,727
|
)
|
—
|
|
|||||
|
Net cash used in investing activities
|
(727,826
|
)
|
(37,003
|
)
|
(24,472
|
)
|
|||||
|
CASH FLOWS FROM FINANCING ACTIVITIES:
|
|||||||||||
|
Redemptions to related parties
|
(2,000
|
)
|
—
|
|
—
|
|
|||||
|
Sale of management notes receivable
|
1,310
|
|
—
|
|
—
|
|
|||||
|
Exercise of stock options, vesting of restricted stock, and related tax withholdings
|
(2,501
|
)
|
—
|
|
—
|
|
|||||
|
Payment of contingent consideration liability
|
—
|
|
—
|
|
(1,000
|
)
|
|||||
|
Proceeds from debt
|
981,050
|
|
1,000
|
|
—
|
|
|||||
|
Repayments of debt principal
|
(2,075
|
)
|
(5,150
|
)
|
(4,150
|
)
|
|||||
|
Retirement of debt obligations
|
(226,738
|
)
|
—
|
|
—
|
|
|||||
|
Deferred financing costs
|
(30,022
|
)
|
—
|
|
—
|
|
|||||
|
Net cash provided by (used in) financing activities
|
719,024
|
|
(4,150
|
)
|
(5,150
|
)
|
|||||
|
NET INCREASE (DECREASE) IN CASH AND CASH EQUIVALENTS
|
30,665
|
|
(16,725
|
)
|
8,249
|
|
|||||
|
Cash and cash equivalents - beginning of the period
|
36,391
|
|
53,116
|
|
44,867
|
|
|||||
|
CASH AND CASH EQUIVALENTS - END OF PERIOD
|
$
|
67,056
|
|
$
|
36,391
|
|
$
|
53,116
|
|
||
|
Supplemental disclosure of cash flow information:
|
|||||||||||
|
Cash paid for interest
|
$
|
50,808
|
|
$
|
47,173
|
|
$
|
43,485
|
|
||
|
Cash paid for income taxes
|
$
|
2,405
|
|
$
|
1,600
|
|
$
|
1,194
|
|
||
|
Cash paid for operating leases
|
$
|
18,992
|
|
|
|
||||||
The notes to consolidated financial statements are an integral part of these statements.
43
OPTION CARE HEALTH, INC.
CONSOLIDATED STATEMENTS OF STOCKHOLDERS’ EQUITY
(IN THOUSANDS)
|
Preferred Stock
|
Common Stock
|
Treasury Stock
|
Paid-in Capital
|
Management Notes Receivable
|
Accumulated Deficit
|
Accumulated Other Comprehensive (Loss)
Income
|
Total Stockholders’ Equity
|
||||||||||||||||||||||||
|
Balance - December 31, 2016
|
$
|
—
|
|
$
|
14
|
|
$
|
—
|
|
$
|
615,713
|
|
$
|
(1,171
|
)
|
$
|
(13,786
|
)
|
$
|
—
|
|
$
|
600,770
|
|
|||||||
|
Interest on management notes receivable
|
—
|
|
—
|
|
—
|
|
—
|
|
(56
|
)
|
—
|
|
—
|
|
(56
|
)
|
|||||||||||||||
|
Stockholders' redemptions
|
—
|
|
—
|
|
—
|
|
(111
|
)
|
111
|
|
—
|
|
—
|
|
—
|
|
|||||||||||||||
|
Stock-based incentive compensation
|
—
|
|
—
|
|
—
|
|
1,455
|
|
—
|
|
—
|
|
—
|
|
1,455
|
|
|||||||||||||||
|
Net income
|
—
|
|
—
|
|
—
|
|
—
|
|
—
|
|
3,878
|
|
—
|
|
3,878
|
|
|||||||||||||||
|
Reclassification of certain tax effects
|
—
|
|
—
|
|
—
|
|
—
|
|
—
|
|
(12
|
)
|
12
|
|
—
|
|
|||||||||||||||
|
Other comprehensive income
|
—
|
|
—
|
|
—
|
|
—
|
|
—
|
|
—
|
|
58
|
|
58
|
|
|||||||||||||||
|
Balance - December 31, 2017
|
$
|
—
|
|
$
|
14
|
|
$
|
—
|
|
$
|
617,057
|
|
$
|
(1,116
|
)
|
$
|
(9,920
|
)
|
$
|
70
|
|
$
|
606,105
|
|
|||||||
|
Stockholders' contributions
|
—
|
|
—
|
|
—
|
|
425
|
|
(425
|
)
|
—
|
|
—
|
|
—
|
|
|||||||||||||||
|
Interest on management notes receivable
|
—
|
|
—
|
|
—
|
|
—
|
|
(78
|
)
|
—
|
|
—
|
|
(78
|
)
|
|||||||||||||||
|
Stock-based incentive compensation
|
—
|
|
—
|
|
—
|
|
2,139
|
|
—
|
|
—
|
|
—
|
|
2,139
|
|
|||||||||||||||
|
Net loss
|
—
|
|
—
|
|
—
|
|
—
|
|
—
|
|
(6,115
|
)
|
—
|
|
(6,115
|
)
|
|||||||||||||||
|
Other comprehensive income
|
—
|
|
—
|
|
—
|
|
—
|
|
—
|
|
—
|
|
774
|
|
774
|
|
|||||||||||||||
|
Balance - December 31, 2018
|
$
|
—
|
|
$
|
14
|
|
$
|
—
|
|
$
|
619,621
|
|
$
|
(1,619
|
)
|
$
|
(16,035
|
)
|
$
|
844
|
|
$
|
602,825
|
|
|||||||
|
Purchase of BioScrip, Inc.
|
—
|
|
4
|
|
—
|
|
387,040
|
|
—
|
|
—
|
|
—
|
|
387,044
|
|
|||||||||||||||
|
Interest on management notes receivable
|
—
|
|
—
|
|
—
|
|
—
|
|
(62
|
)
|
—
|
|
—
|
|
(62
|
)
|
|||||||||||||||
|
Repayment of management notes receivable
|
—
|
|
—
|
|
—
|
|
—
|
|
1,310
|
|
—
|
|
—
|
|
1,310
|
|
|||||||||||||||
|
Stockholders' redemptions
|
—
|
|
—
|
|
—
|
|
(2,371
|
)
|
371
|
|
—
|
|
—
|
|
(2,000
|
)
|
|||||||||||||||
|
Stock-based incentive compensation
|
—
|
|
—
|
|
—
|
|
4,170
|
|
—
|
|
—
|
|
—
|
|
4,170
|
|
|||||||||||||||
|
Exercise of stock options, vesting of restricted stock, and related tax withholdings
|
—
|
|
—
|
|
(2,403
|
)
|
(98
|
)
|
—
|
|
—
|
|
—
|
|
(2,501
|
)
|
|||||||||||||||
|
Net loss
|
—
|
|
—
|
|
—
|
|
—
|
|
—
|
|
(75,920
|
)
|
—
|
|
(75,920
|
)
|
|||||||||||||||
|
Other comprehensive loss
|
—
|
|
—
|
|
—
|
|
—
|
|
—
|
|
—
|
|
(8,039
|
)
|
(8,039
|
)
|
|||||||||||||||
|
Balance - December 31, 2019
|
$
|
—
|
|
$
|
18
|
|
$
|
(2,403
|
)
|
$
|
1,008,362
|
|
$
|
—
|
|
$
|
(91,955
|
)
|
$
|
(7,195
|
)
|
$
|
906,827
|
|
|||||||
The notes to consolidated financial statements are an integral part of these statements.
44
OPTION CARE HEALTH, INC.
NOTES TO CONSOLIDATED FINANCIAL STATEMENTS
1. NATURE OF OPERATIONS AND PRESENTATION OF FINANCIAL STATEMENTS
Corporate Organization and Business
— HC Group Holdings II, Inc. (“HC II”) was incorporated under the laws of the State of Delaware on January 7, 2015, with its sole shareholder being HC Group Holdings I, LLC. (“HC I”). On April 7, 2015, HC I and HC II collectively acquired Walgreens Infusion Services, Inc. and its subsidiaries from Walgreen Co., and the business was rebranded as Option Care (“Option Care”).
On March 14, 2019, HC I and HC II entered into a definitive agreement (the “Merger Agreement”) to merge with and into a wholly-owned subsidiary of BioScrip, Inc. (“BioScrip”), a national provider of infusion and home care management solutions, along with certain other subsidiaries of BioScrip and HC II. The merger contemplated by the Merger Agreement (the “Merger”) was completed on August 6, 2019 (the “Merger Date”). The Merger was accounted for as a reverse merger under the acquisition method of accounting for business combinations with Option Care being considered the accounting acquirer and BioScrip being considered the legal acquirer.
Under the terms of the Merger Agreement, shares of HC II common stock issued and outstanding immediately prior to the Merger Date were converted into
542,261,567
shares (
135,565,392
equivalent shares after adjusting for the one share for four share reverse stock split - see Note 20,
Subsequent Events
) of BioScrip common stock, par value
$0.0001
(the “BioScrip common stock”). BioScrip also issued an additional
28,193,428
shares (
7,048,357
equivalent shares after adjusting for the reverse stock split) to HC I in respect of certain outstanding unvested contingent restricted stock units of BioScrip, which are held in escrow to prevent dilution related to potential additional vesting on certain share-based instruments. See Note 17,
Stockholders’ Equity
, for additional discussion of these shares held in escrow. In conjunction with the Merger, holders of BioScrip preferred shares and certain warrants received
3,458,412
additional shares (
864,603
equivalent shares after adjusting for the reverse stock split) of BioScrip common stock and preferred shares were repurchased for
$125.8 million
of cash. In addition, all legacy BioScrip debt was settled for
$575.0 million
. As a result of the Merger, BioScrip’s stockholders hold approximately
19.2%
of the combined company, and HC I holds approximately
80.8%
of the combined company. Following the close of the transaction, BioScrip was rebranded as Option Care Health, Inc. (“Option Care Health”, or the “Company”). The combined company’s stock was listed on the Nasdaq Capital Market as of
December 31, 2019
. See Note 3,
Business Acquisitions
, for further discussion on the Merger.
Option Care Health, and its wholly-owned subsidiaries, provides infusion therapy and other ancillary health care services through a national network of
115
full service pharmacies. The Company contracts with managed care organizations, third-party payers, hospitals, physicians, and other referral sources to provide pharmaceuticals and complex compounded solutions to patients for intravenous delivery in the patients’ homes or other nonhospital settings. The Company operates in one segment, infusion services.
Basis of Presentation
— The accompanying consolidated financial statements have been prepared in conformity with generally accepted accounting principles (“GAAP”) in the United States. These principals require management to make certain estimates and assumptions in determining assets, liabilities, revenue, expenses, and related disclosures. Actual amounts could differ materially from those estimates.
Principles of Consolidation
— The Company’s consolidated financial statements include the accounts of Option Care Health, Inc. and its subsidiaries. The BioScrip results have been included in the consolidated financial results since the Merger Date. All intercompany transactions and balances are eliminated in consolidation.
The Company has investments in companies that are
50%
owned and are accounted for as equity-method investments. The Company’s share of earnings from equity-method investments is included in the line entitled “Equity in earnings of joint ventures” in the consolidated statements of comprehensive income (loss). See Note 11,
Equity-Method Investments
, for further discussion of the Company’s equity-method investments.
2. SUMMARY OF SIGNIFICANT ACCOUNTING POLICIES
Cash and Cash Equivalents
— The Company considers all highly liquid investments with original maturities of three months or less to be cash equivalents.
Accounts Receivable
— The Company’s accounts receivable are reported at the net realizable value amount that reflects the consideration the Company expects to receive in exchange for providing services, which is inclusive of adjustments for
45
price concessions. The majority of accounts receivable are due from private insurance carriers and governmental health care programs, such as Medicare and Medicaid.
Price concessions may result from patient hardships, patient uncollectible accounts sent to collection agencies, lack of recovery due to not receiving prior authorization, differing interpretations of covered therapies in payer contracts, different pricing methodologies, or various other reasons. Subsequent to the adoption of Financial Accounting Standards Board (“FASB”) Accounting Standards Codification (“ASC”) Topic 606,
Revenue from Contracts with Customers
(“ASC 606”), an allowance for doubtful accounts is established only as a result of an adverse change in the Company’s payers’ ability to pay outstanding billings. The allowance for doubtful accounts balance is
$0
as of
December 31, 2019
and
2018
, respectively.
Prior to the adoption of ASC 606, estimates of uncollectible accounts receivable were recorded as either a pricing adjustment to revenue (“contractual adjustment”) or as an uncollectible account to provision for doubtful accounts. The Company recorded an allowance for doubtful accounts based on historical experience and a detailed assessment of the collectability of its accounts receivable. In estimating the allowance for doubtful accounts, the Company considered, among other factors, (i) the balance and aging composition of the accounts receivable, (ii) the Company’s historical write-offs and recoveries, (iii) the creditworthiness of its payers, and (iv) general economic conditions. Accounts receivable were written-off as bad debts after all reasonable collection efforts have been exhausted.
Included in accounts receivable are earned but unbilled gross receivables of
$68.7 million
and
$43.0 million
as of
December 31, 2019
and
2018
, respectively. Delays ranging from one day up to several weeks between the date of service and billing can occur due to delays in obtaining certain required payer-specific documentation from internal and external sources.
See
Revenue Recognition
for a further discussion of the Company’s revenue recognition policy.
Inventory
— Inventory, which consists primarily of pharmaceuticals, is stated at the lower of first‑in, first‑out cost or net realizable value basis, which the Company believes is reflective of the physical flow of inventories.
During the year ended
December 31, 2018
, one Company location was destroyed by a hurricane, resulting in a loss of
$2.9 million
of inventory. This business casualty loss was recorded as a component of operating costs and expenses within the consolidated statements of comprehensive income (loss). The Company received insurance proceeds of
$0.8 million
during the
year ended
December 31, 2018
, and recorded a receivable of
$1.0 million
as a component of prepaid expenses and other current assets within the consolidated balance sheets at
December 31, 2018
. Both of these amounts were recorded as a partial offset to the business casualty loss in the consolidated statements of comprehensive income (loss). The
$0.8 million
of insurance proceeds were reflected as a component of cash flows from operating activities in the consolidated statements of cash flows. During the
year ended December 31, 2019
,
$3.0 million
in proceeds were received related to recovery of inventory and business interruption and was included as a component of cash flows from operating activities in the consolidated statements of cash flows. These proceeds resulted in a gain on business casualty loss of
$2.0 million
recorded as a component of selling, general and administrative expense in the consolidated statement of comprehensive income (loss).
Leases
— The Company has lease agreements for facilities, warehouses, office space and property and equipment. Effective as of January 1, 2019, at the inception of a contract, the Company determines if the contract is a lease or contains an embedded lease arrangement. Operating leases are included in the operating lease right-of-use asset (“ROU asset”) and operating lease liabilities in the consolidated financial statements.
ROU assets, which represent the Company’s right to use the leased assets, and operating lease liabilities, which represent the present value of unpaid lease payments, are both recognized by the Company at the lease commencement date. The Company utilizes its estimated incremental borrowing rate at the lease commencement date to determine the present value of unpaid lease obligations. The rates were estimated primarily using a methodology dependent on the Company’s financial condition, creditworthiness, and availability of certain observable data. In particular, the Company considered its actual cost of borrowing for collateralized loans and its credit rating, along with the corporate bond yield curve in estimating its incremental borrowing rates. ROU assets are recorded as the amount of operating lease liability, adjusted for prepayments, accrued lease payments, initial direct costs, lease incentives, and impairment of the ROU asset. Tenant improvement allowances used to fund leasehold improvements are recognized when earned and reduce the related ROU asset. Tenant improvement allowances are recognized through the ROU asset as a reduction of expense over the term of the lease.
Leases may contain rent escalations, however the Company recognizes the lease expense on a straight-line basis over the expected lease term. The Company reviews the terms of any lease renewal options to determine if it is reasonably certain that the renewal options will be exercised. The Company has determined that the expected lease term is typically the minimum non-cancelable period of the lease.
46
The Company has lease agreements that contain both lease and non-lease components which the Company has elected to account for as a single lease component for all asset classes. Leases with an initial term of 12 months or less are not recorded on the consolidated balance sheet and are expensed on a straight-line basis over the term of the lease. The Company’s lease agreements do not contain any material residual value guarantees or material restrictive covenants. See Note 8,
Leases
, for further discussion on leases.
Goodwill, Intangible Assets, and Property and Equipment
— Goodwill represents the excess of the purchase price over the fair value of assets acquired and liabilities assumed. The Company accounts for goodwill under ASC Topic 350,
Intangibles
-
Goodwill and Other.
The Company tests goodwill for impairment annually, or more frequently whenever events or circumstances indicate impairment may exist. Goodwill is stated at cost less accumulated impairment losses. The Company completes its goodwill impairment test annually in the fourth quarter. See Note 10,
Goodwill and Other Intangible Assets
, for further discussion of the Company’s goodwill and other intangible assets.
Intangible assets arising from the Company’s acquisitions are amortized on a straight‑line basis over the estimated useful life of each asset. Referral sources have a useful life of
15
-
20
years. Trademarks/names have a useful life ranging from
two
to
fifteen
years. The useful lives for other amortizable intangible assets range from approximately
two
to
nine
years. The Company does not have any indefinite‑lived intangible assets.
Property and equipment is recorded at cost, net of accumulated depreciation. Depreciation on owned property and equipment is provided for on a straight‑line basis over the estimated useful lives of owned assets. Leasehold improvements are amortized over the estimated useful life of the property or over the term of the lease, whichever is shorter. Estimated useful lives are
seven
years for infusion pumps and
three
years to
thirteen
years for equipment. Major repairs, which extend the useful life of an asset, are capitalized in the property and equipment accounts. Routine maintenance and repairs are expensed as incurred. Computer software is included in property and equipment and consists of purchased software and internally-developed software. The Company capitalizes application-stage development costs for significant internally-developed software projects. Once the software is ready for its intended use, these costs are amortized on a straight‑line basis over the software’s estimated useful life, generally
five
years. Costs recognized in the preliminary project phase and the post-implementation phase, as well as maintenance and training costs, are expensed as incurred.
The Company tests long‑lived assets for impairment whenever events or circumstances indicate that a certain asset or asset group may be impaired. Once identified, the amount of the impairment is computed by comparing the carrying value of the respective asset or asset group to its fair value, which is based on the discounted estimated future cash flows.
Equity Method Investments
— The Company’s investments in certain unconsolidated entities are accounted for under the equity method. The balance of these investments is included in other noncurrent assets in the accompanying consolidated balance sheets. The investment is increased to reflect the Company’s capital contributions and equity in earnings of the investees. The investment is decreased to reflect the Company’s equity in losses of the investees and for distributions received that are not in excess of the carrying amount of the investments. The Company’s proportionate share of earnings or losses of the investees are recorded in equity in earnings of joint ventures in the accompanying consolidated statements of comprehensive income (loss). See Note 11,
Equity-Method Investments
, for a further discussion of the Company’s equity method investments.
Hedging Instruments
— The Company uses derivative financial instruments to limit its exposure to increases in the interest rate of its variable rate debt instruments. The derivative financial instruments are recognized on the consolidated balance sheets at fair value. See Note 13,
Derivative Instruments,
for additional information.
At inception of the hedge, the Company designated the derivative instruments as a hedge of the cash flows related to the interest on the variable rate debt. For all hedging relationships, the Company documents the hedging relationships and its risk management objective of the hedging relationship. For all hedging instruments, the terms of the hedge perfectly offset the hedged expected cash flows.
Revenue Recognition
— Net revenue is reported at the net realizable value amount that reflects the consideration the Company expects to receive in exchange for providing services. Revenues are from government payers, commercial payers, and patients for goods and services provided and are based on a gross price based on payer contracts, fee schedules, or other arrangements less any implicit price concessions.
Due to the nature of the health care industry and the reimbursement environment in which the Company operates, certain estimates are required to record revenue and accounts receivable at their net realizable values at the time goods or services are provided. Inherent in these estimates is the risk that they will have to be revised or updated as additional information becomes available.
47
The Company assesses the expected consideration to be received at the time of patient acceptance based on the verification of the patient’s insurance coverage, historical information with the patient, similar patients, or the payer. Performance obligations are determined based on the nature of the services provided by the Company. The majority of the Company’s performance obligations are to provide infusion services to deliver medicine, nutrients, or fluids directly into the body.
The Company provides a variety of infusion-related therapies to patients, which frequently include multiple deliverables of pharmaceutical drugs and related nursing services. After applying the criteria from ASC 606, the Company concluded that multiple performance obligations exist in its contracts with its customers. Revenue is allocated to each performance obligation based on relative standalone price, determined based on reimbursement rates established in the third-party payer contracts. Pharmaceutical drug revenue is recognized at the time the pharmaceutical drug is delivered to the patient, and nursing revenue is recognized on the date of service.
The Company's outstanding performance obligations relate to contracts with a duration of less than one year. Therefore, the Company has elected to apply the practical expedient provided by ASC 606 and is not required to disclose the aggregate amount of the transaction price allocated to performance obligations that are unsatisfied or partially unsatisfied at the end of the reporting period. Any unsatisfied or partially unsatisfied performance obligations at the end of a reporting period are generally completed prior to the patient being discharged. See Note 4,
Revenue
for a further discussion on revenue.
Cost of Revenue
— Cost of revenue consists of the actual cost of pharmaceuticals and other medical supplies dispensed to patients, as well as all other costs directly related to the production of revenue. These costs include warehousing costs, purchasing costs, freight costs, cash discounts, wages and related costs for pharmacists and nurses, along with depreciation expense relating to revenue-generating assets, such as infusion pumps.
The Company receives prompt payment discounts from some of its pharmaceutical and medical supplies vendors. These prompt payment discounts are recorded as a reduction of inventory and are accounted for as a reduction of cost of goods sold when the related inventory is sold.
The Company also receives rebates from pharmaceutical and medical supply manufacturers. Rebates are generally volume-based incentives and are recorded as a reduction of inventory and are accounted for as a reduction of cost of goods sold when the related inventory is sold.
Selling, General and Administrative Expenses
— Selling, general and administrative expenses mainly consist of salaries for administrative employees that directly and indirectly support the operations, occupancy costs, marketing expenditures, insurance, and professional fees.
Stock Based Incentive Compensation
- The Company accounts for stock-based incentive compensation expense in accordance with ASC Topic 718,
Compensation-Stock Compensation
(“ASC 718”). Stock-based incentive compensation expense is based on the grant date fair value. The Company estimates the fair value of stock option awards using a Black-Scholes option pricing model and the fair value of restricted stock unit awards using the closing price of the Company’s common stock on the grant date. For awards with a service-based vesting condition, the Company recognizes expense on a straight-line basis over the service period of the award. For awards with performance-based vesting conditions, the Company will recognize expense when it is probable that the performance-based conditions will be met. When the Company determines that it is probable that the performance-based conditions will be met, a cumulative catch-up of expense will be recorded as if the award had been vesting on a straight-line basis from the award date. The award will continue to be expensed on a straight-line basis through the remainder of the vesting period and will be updated if the Company determines that there has been a change in the probability of achieving the performance-based conditions. The Company records the impact of forfeited awards in the period in which the forfeiture occurs.
Prior to the Merger, HCI issued incentive units to certain employees of Option Care, who remained employees of the Company following the Merger. In accordance with ASC 718, the Company recognizes compensation expense on a straight-line basis over the shorter of the vesting period of the award or the employee’s expected eligibility date. HC I also issued equity incentive units to certain members of the Option Care Board of Directors, who remained members of the Board of Directors following the Merger. See Note 16,
Stock-Based Incentive Compensation
, for a further discussion of equity incentive plans.
Business Acquisitions
- The Company accounts for business acquisitions in accordance with ASC Topic 805,
Business Combinations
, with assets and liabilities being recorded at their acquisition date fair value and goodwill being calculated as the purchase price in excess of the net identifiable assets. See Note 3,
Business Acquisitions
, for further discussion of the Company’s business acquisitions.
48
Income Taxes
— On December 22, 2017, the U.S. government enacted H.R. 1, commonly known as the Tax Cuts and Jobs Act of 2017 (the “Tax Act”). The Tax Act significantly changed U.S. tax law by, among other things, reducing the corporate tax rate from 35% to 21%, effective January 1, 2018. In addition, there are many new provisions including changes to bonus depreciation, the deduction for executive compensation and interest expense, and usage of future net operating losses. Included in the tax benefit for 2017 is the impact of the corporate tax rate reduction which resulted in a
$17.0 million
non-cash adjustment of our net deferred tax liabilities and a corresponding credit to income tax benefit. While the corporate tax rate reduction was effective January 1, 2018, the Company accounted for this anticipated rate change in 2017, the period of enactment.
The Company accounts for income taxes using the asset and liability method. Deferred tax assets and liabilities are reported for book-tax basis differences and are measured based on currently enacted tax laws using rates expected to apply to taxable income in the years in which the differences are expected to reverse. The effect of a change in tax rate on deferred taxes is recognized in income tax expense in the period that includes the enactment date of the change.
In assessing the realizability of deferred tax assets, management considers whether it is more likely than not that some portion or all of the deferred tax assets will not be realized. Valuation allowances are established when necessary to reduce deferred tax assets to the amounts more likely than not to be realized.
The Company recognizes income tax positions that are more likely than not to be sustained on their technical merits. The Company measures recognized income tax positions at the maximum benefit that is more likely than not, based on cumulative probability, realizable upon final settlement of the position. Interest and penalties related to unrecognized tax benefits are reported in income tax expense.
Concentrations of Business Risk
— The Company generates revenue from managed care contracts and other agreements with commercial third-party payers. Revenue related to the Company’s largest payer was approximately
16%
,
17%
and
17%
for the
years ended
December 31, 2019
,
2018
and
2017
, respectively. In December 2019, the Company renewed and expanded its multi-year contract with this payer. The contract renewal is effective in February 2020 for a two-year term and auto-renews at the end of that term. There were no other managed care contracts that represent greater than 10% of revenue for the years presented.
For the
years ended
December 31, 2019
,
2018
and
2017
, approximately
12%
,
12%
and
14%
, respectively, of the Company’s revenue was reimbursable through direct government healthcare programs such as Medicare and Medicaid. As of
December 31, 2019
and
2018
, approximately
12%
and
13%
, respectively, of the Company’s accounts receivable was related to these programs. Governmental programs reimburse for services based on fee schedules and rates that are determined by the related governmental agency. Laws and regulations pertaining to government programs are complex and subject to interpretation. As a result, there is at least a reasonable possibility that recorded estimates will change in the near term.
The Company does not require its patients nor other payers to carry collateral for any amounts owed for goods or services provided. Other than as discussed above, concentrations of credit risk relating to trade accounts receivable is limited due to the Company’s diversity of patients and payers. Further, the Company generally does not provide charity care.
For the
year ended December 31, 2019
, approximately
70%
of the Company’s pharmaceutical and medical supply purchases were from three vendors. For the
years ended
December 31, 2018
and
2017
, approximately
66%
and
73%
, respectively, of the Company’s pharmaceutical and medical supply purchases were from two vendors. Although there are a limited number of suppliers, the Company believes that other vendors could provide similar products on comparable terms. However, a change in suppliers could cause delays in service delivery and possible losses in revenue, which could adversely affect the Company’s financial condition or operating results.
Fair Value Measurements
— The fair value measurement accounting standard, ASC Topic 820,
Fair Value Measurement
(“ASC 820”), provides a framework for measuring fair value and defines fair value as the price that would be received to sell an asset or paid to transfer a liability. Fair value is a market-based measurement that should be determined using assumptions that market participants would use in pricing an asset or liability. The standard establishes a valuation hierarchy for inputs used in measuring fair value that maximizes the use of observable inputs and minimizes the use of unobservable inputs by requiring that the most observable inputs be used when available. Observable inputs are inputs market participants would use in valuing the asset or liability developed based on independent market data sources. Unobservable inputs are inputs that reflect the Company’s assumptions about the factors market participants would use in valuing the asset or liability developed based upon the best information available. The valuation hierarchy is composed of three categories. The categorization within the valuation hierarchy is based on the lowest level of input that is significant to the fair value measurement. The categories within the valuation hierarchy are described as follows:
49
|
•
|
Level 1 - Inputs to the fair value measurement are quoted prices in active markets for identical assets or liabilities.
|
|
•
|
Level 2 - Inputs to the fair value measurement include quoted prices in active markets for similar assets or liabilities, quoted prices for identical or similar assets or liabilities in markets that are not active, and inputs other than quoted prices that are observable for the asset or liability, either directly or indirectly.
|
|
•
|
Level 3 - Inputs to the fair value measurement are unobservable inputs or valuation techniques.
|
While the Company believes its valuation methods are appropriate and consistent with other market participants, the use of
different methodologies or assumptions to determine the fair value of certain financial instruments could result in a different fair value measurement at the reporting date.
Recently-Adopted Accounting Pronouncements
— In February 2016, the FASB issued ASU No. 2016-02,
Leases
, intended to improve financial reporting about leasing transactions. The new guidance requires entities that lease assets to recognize on their balance sheets the ROU assets and lease liabilities for the rights and obligations created by those leases and to disclose key information about leasing arrangements. ASU 2016-02 is effective for interim and annual periods beginning after December 15, 2018 for public entities and certain not-for-profits. The Company adopted the standard as of January 1, 2019. ASU 2016-02 allows for an optional transition method, which was elected by the Company, and permits the application of the standard as of the effective date without requiring the standard to be applied to the comparative periods presented in the consolidated financial statements. The Company elected the transition package of three practical expedients allowed by ASU 2016-02, which allows the Company not to reassess prior conclusions about lease identification, lease classification and initial, direct costs. The Company did not elect the practical expedient to use hindsight and, accordingly, the initial lease term did not differ under the new standard versus prior accounting practice. The Company also made a policy election not to apply this standard to any leases with a term of 12 months or less. Adoption of ASU 2016-02 resulted in the Company recording an operating lease liability of
$67.0 million
and a corresponding ROU asset of
$59.9 million
in the consolidated balance sheet as of January 1, 2019. See Note 8,
Leases
, for further discussion on leases.
In May 2014, the FASB issued ASU 2014-09,
Revenue from Contracts with Customers
. The ASU requires that an entity recognizes revenue to depict the transfer of promised goods or services to a customer in an amount that reflects the consideration to which the Company expects to be entitled in exchange for these goods or services. ASU 2014-09 is effective for interim and annual reporting periods beginning after December 15, 2017 for public entities and certain not-for-profits. The Company adopted the standard as of January 1, 2018. ASU 2014-09 allows for a modified retrospective approach upon adoption, which was elected by the Company, and permits application of the standard only to contracts that are not completed at the adoption date with no adjustment to the comparative periods presented in the consolidated financial statements. The Company also elected the practical expedient for the portfolio approach, allowing contracts with similar characteristics and impacts to the financial statements to be evaluated together. ASU 2014-09 requires the Company to recognize revenue as the amount of cash that is ultimately expected to be collected, which resulted in the Company treating its previously-reported provision for doubtful accounts as an implicit price concession and a reduction to revenue. Other than the treatment of bad debt expense, the adoption of this standard did not have a material impact on the Company’s consolidated financial statements. See Note 4,
Revenue
, for further discussion on revenue.
In May 2017, the FASB issued ASU 2017-09,
Compensation-Stock Compensation (Topic 718): Scope of Modification Accounting
. ASU 2019-09 modifies when a change to the terms or conditions of share-based payment award must be accounted for as a modification. The new guidance requires modification accounting if the fair value, vesting condition, or the classification of the award is not the same immediately before and after a change to the terms and conditions of the award. The effective date for ASU 2017-09 is for annual or interim periods beginning after December 15, 2017. The Company adopted the standard as of January 1, 2018. The adoption of this standard did not have a material impact on the Company’s consolidated financial statements.
Recent Accounting Pronouncements
— In June 2016, the FASB issued ASU 2016-13,
Financial Instruments
—
Credit Losses (Topic 326): Measurement of Credit Losses on Financial Instruments
, which requires measurement and recognition of expected credit losses for financial assets held. The amendments in ASU 2016-13 eliminate the probable threshold for initial recognition of a credit loss in current GAAP and reflect an entity’s current estimate of all expected credit losses. ASU 2016-13 is effective for interim and annual reporting periods beginning after December 15, 2019, and is to be applied using a modified retrospective transition method. Early adoption is permitted. The adoption of this standard is not expected to have a material impact on the Company’s consolidated financial statements.
50
Immaterial Error Correction
— During the
year ended December 31, 2019
, the Company identified prior period misstatements in the recording of other noncurrent liabilities that resulted in an overstatement of goodwill and other noncurrent liabilities in the Company’s consolidated balance sheets. The Company assessed the materiality of these misstatements both quantitatively and qualitatively and determined the correction of these errors to be immaterial to the prior consolidated financial statements taken as a whole. As a result, the Company has corrected the misstatements by decreasing goodwill and other noncurrent liabilities by
$6.5 million
in the accompanying financial statements. The misstatements had no impact on net (loss) income or net cash flows from operating, investing, or financing activities in any of the periods presented.
During the fourth quarter of the year ended December 31, 2019, the Company identified a misstatement in the recording of certain transaction fees related to the Merger, which resulted in a
$6.5 million
understatement of net loss for the three and nine months ended September 30, 2019 and a
$6.5 million
understatement of long term debt, net, at September 30, 2019, as reported in the third quarter 2019 report on Form 10-Q. The Company assessed the materiality of these misstatements both quantitatively and qualitatively and determined the correction of these errors to be immaterial to the results as reported in the third quarter report on Form 10-Q. As a result, the Company has corrected the misstatements by (i) increasing selling, general and administrative expense on the statement of comprehensive income (loss), (ii) increasing long-term debt, net and reducing retained earnings on the balance sheet, and (iii) decreasing net cash provided by operating activities and increasing net cash provided by financing activities on the statement of cash flows in the fourth quarter of 2019.
3. BUSINESS ACQUISITIONS
Merger with BioScrip, Inc.
— As discussed in Note 1,
Nature of Operations and Presentation of Financial Statements,
Option Care merged with BioScrip on August 6, 2019. BioScrip was a national provider of infusion and home care management solutions. The Merger of Option Care and BioScrip into Option Care Health created an expanded national platform and the opportunity to drive economies of scale through procurement savings, facility rationalization and other operating cost savings.
The fair value of purchase consideration transferred on the closing date includes the value of the number of shares of the combined company owned by BioScrip shareholders at closing of the Merger, the value of common shares issued to certain warrant and preferred shareholders in conjunction with the Merger, the fair value of stock-based instruments that were vested or earned as of the Merger, and cash payments made in conjunction with the Merger. The fair value per share of BioScrip’s common stock was
$2.67
per share. This is the closing price of the BioScrip common stock on August 6, 2019.
Under the acquisition method of accounting, the calculation of total consideration exchanged is as follows (in thousands):
|
Amount
|
||||
|
Number of BioScrip common shares outstanding at time of the Merger (1)
|
129,181
|
|
||
|
Common shares issued to warrant and preferred stockholders at time of the Merger (1)
|
3,458
|
|
||
|
Total shares of BioScrip common stock outstanding at time of the Merger (1)
|
132,639
|
|
||
|
BioScrip share price as of August 6, 2019
|
$
|
2.67
|
|
|
|
Fair value of common shares
|
$
|
354,146
|
|
|
|
Fair value of share-based instruments
|
$
|
32,898
|
|
|
|
Cash paid in conjunction with the Merger included in purchase consideration
|
$
|
714,957
|
|
|
|
Fair value of total consideration transferred
|
$
|
1,102,001
|
|
|
|
Less: cash acquired
|
$
|
14,787
|
|
|
|
Fair value of total consideration acquired, net of cash acquired
|
$
|
1,087,214
|
|
|
(1) These shares were not adjusted for the one share for four share reverse stock split, which occurred on February 3, 2020. See Note 20,
Subsequent Events
, for further discussion of this stock split.
Cash paid in conjunction with the Merger includes payments made for settlement of
$575.0 million
in legacy BioScrip debt,
$125.8 million
in existing BioScrip preferred shares, and
$14.1 million
in legacy BioScrip success-based fees owed to third-party advisors. HC II financed these payments primarily through cash on hand and debt financing, which is discussed in Note 12,
Indebtedness
.
51
The Company's allocation of consideration exchanged to the net tangible and intangible assets acquired and liabilities assumed in the Merger is based on estimated fair values as of the Merger Date. The fair values were determined based upon a valuation and the estimates and assumptions used in the valuation of certain contingent liabilities are pending completion and subject to change, which could be significant, within the measurement period, up to one year from the August 6, 2019 acquisition date.
The following is a preliminary estimate of the allocation of the consideration transferred to acquired identifiable assets and assumed liabilities, net of cash acquired, in the Merger as of August 6, 2019 (in thousands):
|
Amount
|
||||||
|
Accounts receivable, net (1)
|
$
|
96,532
|
|
|||
|
Inventories (2)
|
19,683
|
|
||||
|
Property and equipment, net (3)
|
48,732
|
|
||||
|
Intangible assets, net (4)
|
193,245
|
|
||||
|
Deferred tax assets, net of deferred tax liabilities (5)
|
26,731
|
|
||||
|
Operating lease right-of-use asset (6)
|
22,378
|
|
||||
|
Operating lease liability (6)
|
(28,897
|
)
|
||||
|
Accounts payable (7)
|
(64,030
|
)
|
||||
|
Other assumed liabilities, net of other acquired assets (7)
|
(20,233
|
)
|
||||
|
Total acquired identifiable assets and liabilities
|
294,141
|
|
||||
|
Goodwill (8)
|
793,073
|
|
||||
|
Total consideration transferred
|
$
|
1,087,214
|
|
|||
|
(1)
|
Management has valued accounts receivables based on the estimated future collectability of the receivables portfolio.
|
|
(2)
|
Inventories are stated at fair value as of the Merger Date.
|
|
(3)
|
The fair value of the property and equipment was determined based upon the best and highest use of the property with final values determined based upon an analysis of the cost, sales comparison, and income capitalization approaches for each property appraised.
|
|
(4)
|
The allocation of consideration exchanged to intangible assets acquired is as follows (in thousands):
|
|
Fair Value
|
Weighted Average Estimated Life (in years)
|
|||||
|
Trademarks/Names
|
$
|
12,536
|
|
2
|
||
|
Patient referral sources
|
180,329
|
|
20
|
|||
|
Licenses
|
380
|
|
1.5
|
|||
|
Total intangible assets, net
|
$
|
193,245
|
|
18.8
|
||
The Company valued trademarks/names utilizing the relief of royalty method and patient referral sources utilizing the multi-period excess earnings method, a form of the income approach.
|
(5)
|
Net deferred tax assets represented the expected future tax consequences of temporary differences between the fair values of the assets acquired and liabilities assumed and their tax bases. See Note 6,
Income Taxes
, for additional discussion of the Company’s combined income tax position subsequent to the Merger.
|
|
(6)
|
The fair value of the operating lease liability and corresponding right-of-use asset (current and long-term) was based on current market rates available to the Company.
|
|
(7)
|
Accounts payable as well as certain other current and non-current assets and liabilities are stated at fair value as of the Merger Date.
|
|
(8)
|
The Merger preliminarily resulted in
$793.1 million
of goodwill, which is attributable to cost synergies resulting from procurement and operational efficiencies and elimination of duplicative administrative costs. The goodwill created in the Merger is not expected to be deductible for tax purposes.
|
Assuming BioScrip had been acquired as of January 1, 2018, and the results of BioScrip had been included in operations beginning on January 1, 2018, the following tables provide estimated unaudited pro forma results of operations for the
years ended
December 31,
2019
and
2018
(in thousands). The estimated pro forma net income adjusts for the effect of fair value
52
adjustments related to the Merger, transaction costs and other non-recurring costs directly attributable to the Merger and the impact of the additional debt to finance the Merger.
|
Year Ended December 31,
|
||||||||
|
2019
|
2018
|
|||||||
|
Net revenue
|
$
|
2,755,361
|
|
$
|
2,648,694
|
|
||
|
Net loss
|
(49,566
|
)
|
(70,932
|
)
|
||||
Estimated unaudited pro forma information is not necessarily indicative of the results that actually would have occurred had the Merger been completed on the date indicated or the future operating results.
For the periods subsequent to the Merger Date that are included in the results of operations for the
years ended
December 31, 2019
, BioScrip had net revenue of
$308.9 million
and a net loss of
$30.1 million
.
Acquisition-related costs were expensed as incurred, with the exception of BioScrip success-based fees that are included in consideration transferred. The Company recorded transaction costs that are expensed in selling, general and administrative expenses during the
year ended December 31, 2019
of approximately
$25.8 million
. Transaction expenses consisted of professional fees for advisory, consulting and underwriting services as well as other incremental costs directly related to the acquisition.
Baptist Health Asset Acquisition
— In August 2018, pursuant to the Purchase and Sale Agreement dated August 8, 2018, Option Care completed the acquisition of certain assets of Baptist Health in Little Rock, Arkansas for a purchase price of
$1.0 million
.
Home I.V. Specialists, Inc. Acquisition
— In September 2018, pursuant to the Stock Purchase Agreement dated September 18, 2018, Option Care completed the acquisition of
100%
of the outstanding shares of Home I.V. Specialists, Inc. (“Home I.V.”) for a purchase price of
$11.6 million
, net of cash acquired. The total consideration was comprised of cash paid of
$9.8 million
and a contingent payment of
$1.8 million
payable one year after the acquisition date. During the
year ended December 31, 2019
, the Company reduced the contingent liability by
$0.3 million
. Subsequent to
December 31, 2019
, it was determined that the contingent payment was not payable.
Healthy Connections Homecare Services, Inc. Acquisition
— In October 2016, pursuant to the Share Purchase Agreement dated September 14, 2016, the Company completed the acquisition of
100%
of the outstanding shares of Healthy Connections Homecare Services, Inc. (“HCHS”), for a purchase price of
$5.2 million
, net of cash acquired. The total consideration was comprised of cash paid of
$4.2 million
and a contingent payment of
$1.0 million
payable one year after the acquisition date. The contingent payment was determined based on the operations of HCHS. The contingent payment of
$1.0 million
was paid by the Company during the year ended
December 31, 2017
.
4. REVENUE
On January 1, 2018, the Company adopted ASC 606,
Revenue from Contracts with Customers,
using the modified retrospective approach applied to those contracts that were not completed as of that date. The Company did not record a cumulative catch-up adjustment, as the timing and measurement of revenue for the Company’s customers is similar to its prior revenue recognition model.
ASC 606 requires an entity to recognize revenue to depict the transfer of goods or services to customers in an amount that reflects the consideration that it expects to be entitled to in exchange for those goods or services. ASC 606 requires application of a five-step model to determine when to recognize revenue and at what amount. The revenue standard applies to all contracts with customers and revenues are to be recognized when control of the promised goods or services is transferred to the Company’s patients in an amount that reflects consideration expected to be received in exchange for those goods or services.
Adoption of the standard impacted the Company’s results as follows (in thousands):
53
|
Prior to ASC 606 Adoption
|
Adjustments for ASC 606
|
Subsequent to ASC 606 Adoption
|
||||||||||
|
As of December 31, 2019
|
||||||||||||
|
Consolidated Balance Sheets
|
||||||||||||
|
Accounts receivable, net
|
$
|
324,416
|
|
$
|
—
|
|
$
|
324,416
|
|
|||
|
Year Ended December 31, 2019
|
||||||||||||
|
Consolidated Statement of Comprehensive Income (Loss)
|
||||||||||||
|
Net revenue
|
$
|
2,382,058
|
|
$
|
(71,641
|
)
|
$
|
2,310,417
|
|
|||
|
Provision for doubtful accounts
|
(71,641
|
)
|
71,641
|
|
—
|
|
||||||
|
Operating loss
|
(319
|
)
|
—
|
|
(319
|
)
|
||||||
|
Consolidated Statements of Cash Flows
|
||||||||||||
|
Changes in operating cash flows:
|
||||||||||||
|
Accounts receivable, net
|
82,285
|
|
—
|
|
82,285
|
|
||||||
|
As of December 31, 2018
|
||||||||||||
|
Consolidated Balance Sheets
|
||||||||||||
|
Accounts receivable, net
|
$
|
310,169
|
|
$
|
—
|
|
$
|
310,169
|
|
|||
|
Year Ended December 31, 2018
|
||||||||||||
|
Consolidated Statement of Comprehensive Income (Loss)
|
||||||||||||
|
Net revenue
|
$
|
2,001,132
|
|
$
|
(61,341
|
)
|
$
|
1,939,791
|
|
|||
|
Provision for doubtful accounts
|
(61,341
|
)
|
61,341
|
|
—
|
|
||||||
|
Operating income
|
38,269
|
|
—
|
|
38,269
|
|
||||||
|
Consolidated Statements of Cash Flows
|
||||||||||||
|
Changes in operating cash flows:
|
||||||||||||
|
Accounts receivable, net
|
(21,012
|
)
|
—
|
|
(21,012
|
)
|
||||||
The following table presents the allowance for doubtful accounts for the
years ended
December 31, 2019
,
2018
and
2017
(in thousands):
|
Balance at Beginning of Period
|
Write-Off of Receivables
|
Charged to Costs and Expenses
|
Balance at End of Period
|
||||||||||||
|
Year ended December 31, 2017
|
|||||||||||||||
|
Allowance for doubtful accounts
|
$
|
32,144
|
|
$
|
(34,920
|
)
|
$
|
45,602
|
|
$
|
42,826
|
|
|||
|
Year ended December 31, 2018
|
|||||||||||||||
|
Allowance for doubtful accounts
(1)
|
$
|
—
|
|
$
|
—
|
|
$
|
—
|
|
$
|
—
|
|
|||
|
Year ended December 31, 2019
|
|||||||||||||||
|
Allowance for doubtful accounts
(1)
|
$
|
—
|
|
$
|
—
|
|
$
|
—
|
|
$
|
—
|
|
|||
(1) Subsequent to the adoption of ASC 606, an allowance for doubtful accounts is established only as a result of an adverse change in the Company’s payers’ ability to pay outstanding billings.
The following table sets forth the net revenue earned by category of payer for the
years ended
December 31, 2019
,
2018
and
2017
(in thousands):
54
|
Year Ended December 31,
|
||||||||||||
|
2019
|
2018
|
2017
|
||||||||||
|
Commercial payers
|
$
|
2,001,105
|
|
$
|
1,699,450
|
|
$
|
1,598,703
|
|
|||
|
Government payers
|
285,128
|
|
217,876
|
|
203,651
|
|
||||||
|
Patients
|
24,184
|
|
22,465
|
|
25,692
|
|
||||||
|
Net revenue
|
$
|
2,310,417
|
|
$
|
1,939,791
|
|
$
|
1,828,046
|
|
|||
5. EMPLOYEE BENEFIT PLANS
The Company maintains a 401(k) plan and matches
100%
of employee contributions, up to
4%
of employee compensation. The Company recorded expense for the defined contribution plan of
$6.4 million
,
$6.3 million
and
$6.6 million
for the
years ended
December 31, 2019
,
2018
and
2017
, respectively. In the
years ended
December 31, 2019
,
2018
and
2017
, Company contributions of
$6.6 million
,
$6.3 million
and
$14.4 million
, respectively, were paid.
6. INCOME TAXES
The income tax benefit consists of the following for the
years ended
December 31, 2019
,
2018
and
2017
(in thousands):
|
2019
|
2018
|
2017
|
|||||||||
|
US federal income tax (benefit) expense:
|
|||||||||||
|
Current
|
$
|
—
|
|
$
|
—
|
|
$
|
—
|
|
||
|
Deferred
|
(3,072
|
)
|
(2,688
|
)
|
(21,944
|
)
|
|||||
|
(3,072
|
)
|
(2,688
|
)
|
(21,944
|
)
|
||||||
|
State income tax (benefit) expense:
|
|||||||||||
|
Current
|
2,074
|
|
1,176
|
|
1,244
|
|
|||||
|
Deferred
|
(1,276
|
)
|
(1,141
|
)
|
2,115
|
|
|||||
|
798
|
|
35
|
|
3,359
|
|
||||||
|
Total income tax benefit
|
$
|
(2,274
|
)
|
$
|
(2,653
|
)
|
$
|
(18,585
|
)
|
||
The difference between the statutory federal income tax rate and the effective tax rate is as follows for the
years ended
December 31, 2019
,
2018
and
2017
:
|
2019
|
2018
|
2017
|
||||||
|
US federal statutory tax rate
|
21.0
|
%
|
21.0
|
%
|
35.0
|
%
|
||
|
US federal statutory tax rate change
|
—
|
|
—
|
|
115.9
|
|
||
|
State income taxes - net of federal benefit
|
(0.5
|
)
|
2.4
|
|
(10.1
|
)
|
||
|
Valuation allowance
|
(13.4
|
)
|
—
|
|
—
|
|
||
|
Changes in uncertain tax positions
|
—
|
|
14.7
|
|
(8.8
|
)
|
||
|
Non-deductible expenses
|
(3.5
|
)
|
(7.5
|
)
|
(5.6
|
)
|
||
|
Other, net
|
(0.7
|
)
|
(0.3
|
)
|
—
|
|
||
|
Effective income tax rate
|
2.9
|
%
|
30.3
|
%
|
126.4
|
%
|
||
55
The components of deferred income tax assets and liabilities using the 21% U.S. Federal statutory tax rate were as follows as of
December 31, 2019
and
2018
(in thousands):
|
2019
|
2018
|
||||||
|
Deferred tax assets:
|
|||||||
|
Price concessions
|
$
|
12,302
|
|
$
|
14,879
|
|
|
|
Compensation and benefits
|
3,672
|
|
1,925
|
|
|||
|
Interest limitation carryforward
|
38,623
|
|
3,486
|
|
|||
|
Operating lease liability
|
19,462
|
|
1,640
|
|
|||
|
Net operating losses
|
147,749
|
|
10,155
|
|
|||
|
Other
|
5,506
|
|
3,644
|
|
|||
|
Deferred tax assets before valuation allowance
|
227,314
|
|
35,729
|
|
|||
|
Valuation allowance
|
(109,531
|
)
|
(1,373
|
)
|
|||
|
Deferred tax assets net of valuation allowance
|
117,783
|
|
34,356
|
|
|||
|
Deferred tax liabilities:
|
|||||||
|
Accelerated depreciation
|
(10,376
|
)
|
(9,483
|
)
|
|||
|
Operating lease right-of-use asset
|
(15,442
|
)
|
—
|
|
|||
|
Intangible assets
|
(71,204
|
)
|
(39,977
|
)
|
|||
|
Goodwill
|
(20,250
|
)
|
(14,700
|
)
|
|||
|
Other
|
(2,654
|
)
|
(3,677
|
)
|
|||
|
Deferred tax liabilities
|
(119,926
|
)
|
(67,837
|
)
|
|||
|
Net deferred tax liabilities
|
$
|
(2,143
|
)
|
$
|
(33,481
|
)
|
|
As a result of the Merger, the Company recorded a full valuation allowance against all of its net U.S. federal and state deferred tax assets with the exception of
$0.8 million
of estimated state net operating losses (“NOL”). The initial recognition of this valuation allowance by the Company was reflected in the opening balance sheet of BioScrip and, to that extent, did not impact the Company’s tax expense (benefit) for the year ended
December 31, 2019
. The valuation allowance for deferred tax assets as of
December 31, 2019
was
$109.5 million
.
In assessing the realizability of deferred tax assets, the Company considers whether it is more likely than not that some or all of the deferred tax assets will not be realized. The ultimate realization of deferred tax assets depends on the generation of future taxable income during the periods in which those temporary differences are deductible. The Company considers the scheduled reversal of deferred tax liabilities (including the effect in available carryback and carryforward periods), projected taxable income, and tax-planning strategies in making this assessment. On a quarterly basis, the Company evaluates the positive and negative evidence in determining if the valuation allowance is fairly stated.
The Company is subject to taxation in the United States and various states. As a result of the Merger, BioScrip carried over
$461.5 million
of federal net operating losses,
$491.9 million
of state net operating losses, and
$85.0 million
of interest limitation carryforwards. At
December 31, 2019
, the Company had
$541.0 million
of gross federal NOL carryforwards of which
$401.2 million
are available to offset future taxable income in the United States. These NOL’s will begin to expire in 2026 if not utilized. The remaining gross federal NOL’s of
$139.8 million
at
December 31, 2019
are expected to expire unutilized due to limitations under Internal Revenue Code Section 382. At
December 31, 2018
, the Company had
$38.1 million
of gross federal NOL’s. At
December 31, 2019
and
2018
, the Company had
$156.6 million
and
$13.6 million
of interest limitation carryforwards. At
December 31, 2019
and
2018
, the Company also had
$601.9 million
and
$43.5 million
of cumulative gross state NOL carryforwards available to offset future taxable income in various states.
At
December 31, 2019
and
2018
, the unrecognized tax benefits for uncertain tax positions was
$0
.
56
The following table presents the valuation allowance for deferred tax assets for the
years ended
December 31, 2019
,
2018
and
2017
(in thousands):
|
Additions
|
|||||||||||||||
|
Description
|
Balance at Beginning of Period
|
Charged (Benefit) to Costs and Expenses
|
Charged to Other Accounts
|
Balance at End Period
|
|||||||||||
|
2017: Valuation allowance for deferred tax assets
|
$
|
765
|
|
$
|
498
|
|
$
|
—
|
|
$
|
1,263
|
|
|||
|
2018: Valuation allowance for deferred tax assets
|
$
|
1,263
|
|
$
|
110
|
|
$
|
—
|
|
$
|
1,373
|
|
|||
|
2019: Valuation allowance for deferred tax assets
|
$
|
1,373
|
|
$
|
15,395
|
|
$
|
92,763
|
|
$
|
109,531
|
|
|||
Currently, the Company is not subject to any U.S. Federal income tax audits. The Company is subject to various state tax audits, and believes that the outcome of these audits will not have a material impact on the Company.
7. (LOSS) EARNINGS PER SHARE
The Company presents basic and diluted (loss) earnings per share for its common stock. Basic (loss) earnings per share is calculated by dividing the net (loss) income of the Company by the weighted average number of shares of common stock outstanding during the period. Diluted (loss) earnings per share is determined by adjusting the profit or loss and the weighted average number of shares of common stock outstanding for the effects of all dilutive potential common shares.
As a result of the Merger, all historical per share data and number of shares and equity awards were retroactively adjusted. The (loss) earnings is used as the basis of determining whether the inclusion of common stock equivalents would be anti-dilutive. Accordingly, the computation of diluted shares for the
year ended December 31, 2019
excludes the effect of shares that would be issued in connection with warrants, stock options and restricted stock awards, as their inclusion would be anti-dilutive to the loss per share. As of
December 31, 2019
there were
2,328,120
warrants,
644,975
stock options and
231,562
restricted stock awards outstanding that were excluded from the calculation as they would be anti-dilutive. There are
no
dilutive potential common shares for the
years ended
December 31, 2018
or
2017
.
In conjunction with the one share for four share reverse stock split discussed in Note 20,
Subsequent Events
, all historical per share data and number of shares and equity awards were retroactively adjusted.
The following table presents the Company’s basic and diluted (loss) earnings per share and shares outstanding (in thousands, except per share data):
|
Year Ended December 31,
|
|||||||||||
|
|
2019
|
2018
|
2017
|
||||||||
|
Numerator:
|
|
|
|||||||||
|
Net (loss) income
|
$
|
(75,920
|
)
|
$
|
(6,115
|
)
|
$
|
3,878
|
|
||
|
Denominator:
|
|
|
|
|
|||||||
|
Weighted average number of common shares outstanding
|
156,280
|
|
142,614
|
|
142,614
|
|
|||||
|
(Loss) Earnings per Common Share:
|
|||||||||||
|
(Loss) earnings per common share, basic and diluted
|
$
|
(0.49
|
)
|
$
|
(0.04
|
)
|
$
|
0.03
|
|
||
8. LEASES
During the
year ended December 31, 2019
, the Company incurred operating lease expenses of
$25.8 million
including short-term lease expenses, which were included as a component of selling, general and administrative expenses in the consolidated statements of comprehensive income (loss).
As of December 31, 2019
, the weighted-average remaining lease term was
5.3 years
and the weighted-average discount rate was
5.40%
.
Operating leases mature as follows (in thousands):
57
|
Year Ending December 31
|
Minimum Payments
|
|||
|
2020
|
$
|
24,983
|
|
|
|
2021
|
19,178
|
|
||
|
2022
|
13,982
|
|
||
|
2023
|
10,605
|
|
||
|
2024
|
7,847
|
|
||
|
2025 and beyond
|
17,662
|
|
||
|
Total lease payments
|
94,257
|
|
||
|
Less: Interest
|
(15,624
|
)
|
||
|
Present value of lease liabilities
|
$
|
78,633
|
|
|
In addition, the Company had
$0.7 million
of financing leases outstanding at
December 31, 2019
which mature over the next year.
During the
year ended December 31, 2019
, the Company did not enter into any significant new operating or financing leases. As of
December 31, 2019
, the Company did not have any significant operating or financing leases that had not yet commenced.
During the
years ended
December 31, 2018
and
2017
, the Company incurred rent expense of
$17.3 million
, respectively, under ASC Topic 840,
Leases
, which was included as a component of selling, general and administrative expenses in the consolidated statements of comprehensive income (loss).
9. PROPERTY AND EQUIPMENT
Property and equipment was as follows as of
December 31, 2019
and
2018
(in thousands):
|
December 31, 2019
|
December 31, 2018
|
||||||
|
Infusion pumps
|
$
|
30,416
|
|
$
|
20,339
|
|
|
|
Equipment, furniture, and other
|
51,454
|
|
34,433
|
|
|||
|
Leasehold improvements
|
80,916
|
|
61,302
|
|
|||
|
Computer software, purchased and internally developed
|
34,884
|
|
29,668
|
|
|||
|
Assets under development
|
14,150
|
|
5,447
|
|
|||
|
211,820
|
|
151,189
|
|
||||
|
Less accumulated depreciation
|
78,622
|
|
58,047
|
|
|||
|
Property and equipment, net
|
$
|
133,198
|
|
$
|
93,142
|
|
|
Depreciation expense is recorded within cost of revenue and operating expenses within the consolidated statements of comprehensive income (loss), depending on the nature of the underlying fixed assets. The depreciation expense included in cost of revenue relates to revenue-generating assets, such as infusion pumps. The depreciation expense included in operating expenses is related to infrastructure items, such as furniture, computer and office equipment, and leasehold improvements. The following table presents the amount of depreciation expense recorded in cost of revenue and operating expenses for the
years ended
December 31, 2019
,
2018
and
2017
(in thousands):
|
Year ended December 31,
|
|||||||||||
|
2019
|
2018
|
2017
|
|||||||||
|
Depreciation expense in cost of revenue
|
$
|
4,179
|
|
$
|
2,993
|
|
$
|
3,400
|
|
||
|
Depreciation expense in operating expenses
|
27,629
|
|
18,490
|
|
14,868
|
|
|||||
|
Total depreciation expense
|
$
|
31,808
|
|
$
|
21,483
|
|
$
|
18,268
|
|
||
During the
year ended December 31, 2018
, one company location was destroyed by a hurricane, resulting in a loss of
$0.6 million
of property and equipment. A business casualty loss was recorded as a component of operating costs and expenses within the consolidated statements of comprehensive income (loss). During the
year ended December 31, 2019
,
$0.6 million
in
58
proceeds were received related to recovery of property and equipment. These proceeds resulted in a gain on business casualty loss of
$0.6 million
recorded as a component of selling, general, and administrative expenses in the consolidated statements of comprehensive income (loss) during the
year ended December 31, 2019
. These proceeds were reflected as a component of cash flows from investing activities in the consolidated statement of cash flows.
10. GOODWILL AND OTHER INTANGIBLE ASSETS
Goodwill is not amortized, but is evaluated for impairment annually in the fourth quarter of the fiscal year, or more frequently if an event occurs or circumstances change that would more likely than not reduce the fair value of a reporting unit below its carrying value.
Circumstances that could trigger an interim impairment test include: a significant adverse change in the business climate or legal factors; an adverse action or assessment by a regulator; unanticipated competition; the loss of key personnel; a change in reporting units; the likelihood that a reporting unit or significant portion of a reporting unit will be sold or otherwise disposed of; and the results of testing for recoverability of a significant asset group within a reporting unit.
A qualitative impairment analysis was performed in the fourth quarter of 2019 to assess whether it is more likely than not that the fair value of the Company’s reporting unit is less than its carrying value. The Company assessed relevant events and circumstances including macroeconomic conditions, industry and market considerations, overall financial performance, entity-specific events, and changes in the Company’s stock price. The Company determined that there was
no
goodwill impairment in 2019.
A quantitative impairment analysis was performed in the fourth quarter of
2018
and
2017
, and the Company estimated the fair value of its reporting unit using an income approach. The income approach requires management to estimate a number of factors for its reporting unit, including projected future operating results, economic projections, anticipated future cash flows, and discount rates. The fair value determined using the income approach was then compared to marketplace fair value data from within a comparable industry grouping for reasonableness. The Company determined that there was
no
goodwill impairment in
2018
or
2017
.
The determination of fair value and the allocation of that value to individual assets and liabilities within the reporting unit requires the Company to make significant estimates and assumptions. These estimates and assumptions primarily include, but are not limited to, the selection of appropriate peer group companies; control premiums appropriate for acquisitions in the industries in which the Company competes; the discount rate; terminal growth rates; and forecasts of revenue, operating income, depreciation and amortization, and capital expenditures. Actual financial results could differ from those estimates due to the inherent uncertainty involved in making such estimates. Changes in assumptions concerning future financial results or other underlying assumptions could have a significant impact on either the fair value of the reporting unit, the amount of the goodwill impairment charge, or both.
Changes in the carrying amount of goodwill consist of the following activity for the
years ended
December 31, 2019
and
2018
(in thousands):
|
Balance at December 31, 2017
|
$
|
627,392
|
|
|
|
Acquisitions
|
5,077
|
|
||
|
Balance at December 31, 2018
|
$
|
632,469
|
|
|
|
Acquisitions
|
793,073
|
|
||
|
Balance at December 31, 2019
|
$
|
1,425,542
|
|
|
There was no change in the carrying amount of goodwill for the
year ended
December 31, 2017
.
The carrying amount and accumulated amortization of intangible assets consists of the following as of
December 31, 2019
and
2018
(in thousands):
59
|
December 31, 2019
|
December 31, 2018
|
|||||||
|
Gross intangible assets:
|
||||||||
|
Referral sources
|
$
|
438,121
|
|
$
|
257,792
|
|
||
|
Trademarks/names
|
44,536
|
|
32,000
|
|
||||
|
Other amortizable intangible assets
|
402
|
|
4,151
|
|
||||
|
Total gross intangible assets
|
483,059
|
|
293,943
|
|
||||
|
Accumulated amortization:
|
||||||||
|
Referral sources
|
(84,295
|
)
|
(63,353
|
)
|
||||
|
Trademarks/names
|
(12,748
|
)
|
(8,000
|
)
|
||||
|
Other amortizable intangible assets
|
(106
|
)
|
(2,877
|
)
|
||||
|
Total accumulated amortization
|
(97,149
|
)
|
(74,230
|
)
|
||||
|
Total intangible assets, net
|
$
|
385,910
|
|
$
|
219,713
|
|
||
Amortization expense for intangible assets was
$26.1 million
,
$19.6 million
and
$19.8 million
for the
years ended
December 31, 2019
,
2018
and
2017
, respectively.
Expected future amortization expense for intangible assets recorded at
December 31, 2019
, is as follows (in thousands):
|
2020
|
$
|
34,859
|
|
|
|
2021
|
32,015
|
|
||
|
2022
|
28,338
|
|
||
|
2023
|
28,338
|
|
||
|
2024
|
28,338
|
|
||
|
2025 and beyond
|
234,022
|
|
||
|
Total
|
$
|
385,910
|
|
|
The weighted average amortization period of intangible assets by class and in total as of
December 31, 2019
are as follows:
17.1 years
for referral sources,
4.2 years
for trademarks/names,
1.5 years
for other amortizable intangible assets, and
15.9 years
for total intangible assets.
11. EQUITY-METHOD INVESTMENTS
The Company’s
two
equity-method investments totaled
$17.0 million
and
$14.6 million
as of
December 31, 2019
and
2018
, respectively, and are included in other noncurrent assets in the accompanying consolidated balance sheets. The Company’s related proportionate share of earnings is recorded in equity in earnings of joint ventures in the accompanying consolidated statements of comprehensive income (loss). For the
years ended
December 31, 2019
,
2018
and
2017
, the Company’s proportionate share of earnings in its equity-method investees was
$2.8 million
,
$1.0 million
and
$2.2 million
, respectively.
Legacy Health Systems
— The Company’s
50%
ownership interest in this limited liability company, which provides infusion pharmacy services, expands the Company’s presence in the Portland, Oregon market. In 2005, Option Care’s initial cash investment in this joint venture was
$1.3 million
. The Company received a capital distribution from this investment of
$0.5 million
,
$2.0 million
and
$1.3 million
for the
years ended
December 31, 2019
,
2018
and
2017
, respectively. The following presents condensed financial information as of
December 31, 2019
and
December 31, 2018
and for the
years ended
December 31, 2019
,
2018
and
2017
(in thousands):
60
|
Consolidated statements of comprehensive income (loss) data:
|
|||||||||||||
|
Year Ended December 31,
|
|||||||||||||
|
2019
|
2018
|
2017
|
|||||||||||
|
Net revenue
|
$
|
21,037
|
|
$
|
21,309
|
|
$
|
23,295
|
|
||||
|
Cost of revenue
|
14,792
|
|
15,042
|
|
17,069
|
|
|||||||
|
Gross profit
|
6,245
|
|
6,267
|
|
6,226
|
|
|||||||
|
Net income
|
1,986
|
|
1,772
|
|
3,278
|
|
|||||||
|
Equity in net income
|
993
|
|
886
|
|
1,639
|
|
|||||||
|
Consolidated balance sheet data:
|
|||||||
|
As of December 31,
|
|||||||
|
2019
|
2018
|
||||||
|
Current assets
|
$
|
7,643
|
|
$
|
5,666
|
|
|
|
Noncurrent assets
|
3,846
|
|
3,403
|
|
|||
|
Current liabilities
|
903
|
|
119
|
|
|||
|
Noncurrent liabilities
|
659
|
|
8
|
|
|||
Vanderbilt Health Services
— The Company’s
50%
ownership interest in this limited liability company, which provides infusion pharmacy services, expands the Company’s presence in the Nashville, Tennessee market. In 2009, Option Care contributed both cash and certain operating assets into the joint venture for a total initial investment of
$1.1 million
. The following presents condensed financial information as of
December 31, 2019
and
2018
and for the
years ended
December 31, 2019
,
2018
and
2017
, (in thousands):
|
Consolidated statements of comprehensive income (loss) data:
|
|||||||||||||
|
Year Ended December 31,
|
|||||||||||||
|
2019
|
2018
|
2017
|
|||||||||||
|
Net revenue
|
$
|
38,744
|
|
$
|
31,517
|
|
$
|
27,805
|
|
||||
|
Cost of revenue
|
29,952
|
|
24,433
|
|
20,665
|
|
|||||||
|
Gross profit
|
8,792
|
|
7,084
|
|
7,140
|
|
|||||||
|
Net income
|
3,694
|
|
268
|
|
1,094
|
|
|||||||
|
Equity in net income
|
1,847
|
|
134
|
|
547
|
|
|||||||
|
Consolidated balance sheet data:
|
|||||||||
|
As of December 31,
|
|||||||||
|
2019
|
2018
|
||||||||
|
Current assets
|
$
|
11,111
|
|
$
|
6,517
|
|
|||
|
Noncurrent assets
|
2,033
|
|
1,008
|
|
|||||
|
Current liabilities
|
1,228
|
|
192
|
|
|||||
|
Noncurrent liabilities
|
956
|
|
68
|
|
|||||
61
12. INDEBTEDNESS
Long-term debt consisted of the following as of
December 31, 2019
(in thousands):
|
Principal Amount
|
Discount
|
Debt Issuance Costs
|
Net Balance
|
|||||||||||||
|
ABL Facility
|
$
|
—
|
|
$
|
—
|
|
$
|
—
|
|
$
|
—
|
|
||||
|
First Lien Term Loan
|
925,000
|
|
(8,399
|
)
|
(22,825
|
)
|
893,776
|
|
||||||||
|
Second Lien Notes
|
412,256
|
|
(11,672
|
)
|
(7,864
|
)
|
392,720
|
|
||||||||
|
$
|
1,337,256
|
|
$
|
(20,071
|
)
|
$
|
(30,689
|
)
|
1,286,496
|
|
||||||
|
Less: current portion
|
(9,250
|
)
|
||||||||||||||
|
Total long-term debt
|
$
|
1,277,246
|
|
|||||||||||||
Long-term debt consisted of the following as of
December 31, 2018
(in thousands):
|
Principal Amount
|
Discount
|
Debt Issuance Costs
|
Net Balance
|
|||||||||||||
|
Previous Revolving Credit Facility
|
$
|
—
|
|
$
|
—
|
|
$
|
—
|
|
$
|
—
|
|
||||
|
Previous First Lien Term Loan
|
401,513
|
|
(1,062
|
)
|
(5,678
|
)
|
394,773
|
|
||||||||
|
Previous Second Lien Term Loan
|
150,000
|
|
—
|
|
(5,398
|
)
|
144,602
|
|
||||||||
|
$
|
551,513
|
|
$
|
(1,062
|
)
|
$
|
(11,076
|
)
|
539,375
|
|
||||||
|
Less: current portion
|
(4,150
|
)
|
||||||||||||||
|
Total long-term debt
|
$
|
535,225
|
|
|||||||||||||
Retired Debt Obligations
— During 2015, Option Care entered into two credit arrangements administered by Bank of America, N.A. and U.S. Bank. The agreements provided for up to
$645.0 million
in senior secured credit facilities through an
$80.0 million
revolving credit facility (the “Previous Revolving Credit Facility”), a
$415.0 million
first lien term loan (the “Previous First Lien Term Loan”), and a
$150.0 million
second lien term loan (the “Previous Second Lien Term Loan”, and together with the Previous First Lien Term Loan, the “Previous Term Loans”, and the Previous Term Loans, together with the Previous Revolving Credit Facility, the “Previous Credit Facilities”). Amounts borrowed under the credit agreements were secured by substantially all of the assets of the Company.
The Company incurred an original issue discount in conjunction with entering into the Previous First Lien Term Loan of
$2.1 million
, and also incurred an aggregate of
$21.1 million
in debt issuance costs to obtain the two credit agreements. These costs were recorded as a reduction to the carrying amount in the consolidated balance sheets and were being amortized over the term of the related debt using the effective interest method for the Previous Term Loans and the straight-line method for the Previous Revolving Credit Facility.
On August 6, 2019, the Company repaid the outstanding balance of Previous Term Loans and retired the outstanding Previous Credit Facilities by entering into two new credit arrangements and a notes indenture, described below under “New Debt Obligations”. At the time of repayment, the outstanding balance of the Previous First Lien Term Loan was
$393.8 million
, which was comprised of principal of
$399.4 million
, net of debt issuance costs of
$0.9 million
and deferred financing costs of
$4.7 million
. The balance of the Previous Second Lien Term Loan was
$145.8 million
, which was comprised of principal of
$150.0 million
, net of deferred financing costs of
$4.2 million
. Proceeds from the two new credit arrangements and notes indenture were also used, in part, to repay the outstanding debt of BioScrip as of the Merger Date of
$575.0 million
.
The principal balance on the Previous First Lien Term Loan was repayable in quarterly installments of
$1.0 million
. There were
no
quarterly principal payments required for the Previous Second Lien Term Loan. Interest was payable monthly for the Previous First Lien Term Loan and quarterly for the Previous Second Lien Term Loan. The interest rate on the Previous First Lien Term Loan was
6.10%
as of
December 31, 2018
and the interest rate on the Previous Second Lien Term Loan was
11.15%
as of
December 31, 2018
. The weighted average interest rate paid on the Previous First Lien Term Loan was
6.20%
and
6.30%
for the
years ended
December 31, 2019
and
2018
, respectively, prior to the retirement of the debt obligations. The weighted average interest paid on the Previous Second Lien Term Loan was
11.36%
and
10.80%
for the
years ended
December 31, 2019
and
2018
, respectively, prior to the retirement of the debt obligations.
62
New Debt Obligations
— In conjunction with the Merger, the Company entered into an asset-based-lending revolving credit facility administered by Bank of America, N.A. The Company also issued senior secured second lien PIK toggle floating rate notes due 2027 (the “Second Lien Notes”) under an indenture with Ankura Trust Company, LLC. The two new credit agreements and the indenture were entered into on August 6, 2019 and provide for up to
$1,475.0 million
in senior secured credit facilities through a
$150.0 million
asset-based-lending revolving credit facility (the “ABL Facility”), a
$925.0 million
first lien term loan (the “First Lien Term Loan”, and together with the ABL Facility, the “Loan Facilities”), and a
$400.0 million
issuance of Second Lien notes.
The ABL Facility provides for borrowings up to
$150.0 million
, which matures on
August 6, 2024
. The ABL Facility bears interest at a per annum rate that is determined by the Company’s periodic selection of rate type, either the Base Rate or the Eurocurrency Rate. Interest on the ABL Facility is charged on Base Rate loans at Base Rate, as defined, plus
1.25%
to
1.75%
, depending on the historical excess availability as a percentage of the Line Cap, as defined in the ABL Facility credit agreement. Interest on the ABL Facility is charged on Eurocurrency Rate Loans at the Eurocurrency Rate, as defined, plus
2.25%
to
2.75%
, depending on the historical excess availability as a percentage of the Line Cap, as defined in the ABL Facility credit agreement. The ABL Facility contains commitment fees payable on the unused portion ranging from
0.25%
to
0.375%
, depending on various factors including the Company’s leverage ratio, type of loan and rate type, and letter of credit fees of
2.50%
. Borrowings under the ABL Facility are secured by a first priority security interest in the Company’s and each of its subsidiaries’ inventory, accounts receivable, cash, deposit accounts and certain assets and property related thereto (the “ABL Priority Collateral”), in each case subject to certain exceptions, and a third priority security interest in the Term Loan Priority Collateral, as defined below. The Company had
no
outstanding borrowings under the ABL Facility at
December 31, 2019
. The Company had
$9.6 million
of undrawn letters of credit issued and outstanding, resulting in net borrowing availability under the ABL of
$140.4 million
as of
December 31, 2019
.
The principal balance of the First Lien Term Loan is repayable in quarterly installments commencing in March 2020 of
$2.3 million
plus interest, with a final payment of all remaining outstanding principal due on
August 6, 2026
. Interest on the First Lien Term Loan is payable monthly on Base Rate loans at Base Rate, as defined, plus
3.25%
to
3.50%
, depending on the Company’s leverage ratio. Interest is charged on Eurocurrency Rate loans at the Eurocurrency Rate, as defined, plus
4.25%
to
4.50%
, depending on the Company’s leverage ratio. The interest rate on the First Lien Term Loan was
6.20%
as of
December 31, 2019
. The weighted average interest rate incurred was
6.47%
for the period August 6, 2019 through
December 31, 2019
. Amounts borrowed under the First Lien Term Loan are secured by a first priority security interest in each of the Company’s subsidiaries’ capital stock (subject to certain exceptions) and substantially all of the Company’s property and assets (other than the ABL Priority Collateral), (the “Term Loan Priority Collateral”), in each case subject to certain exceptions, and a second priority security interest in the ABL Priority Collateral.
The Second Lien Notes mature on
August 6, 2027
. Interest on the Second Lien Notes is payable quarterly and is at the greater of
1%
or the London Interbank Offered Rate (“LIBOR”), plus
8.75%
. The Company elected to pay-in-kind (“PIK”) the first quarterly interest payment, due in November 2019, which resulted in the Company capitalizing
$12.3 million
in interest to the principal balance on the interest payment date. In connection with the PIK election, the Company was charged an additional
1.00%
in interest expense on the first quarterly interest payment. The interest rate on the Second Lien Notes was
10.66%
as of
December 31, 2019
. The weighted average interest incurred was
11.45%
for the period August 6, 2019 through
December 31, 2019
.
The Company assessed whether the repayment of the Previous Term Loans and subsequent issuance of the First Lien Term Loan and the Second Lien Notes resulted in an insubstantial modification or an extinguishment of the existing debt for each loan in the syndication by grouping lenders as follows: (i) Lenders participating in both the Previous Credit Facilities and the new Loan Facilities and Second Lien Notes; (ii) previous lenders that exited; and (iii) new lenders. The Company determined that
$226.7 million
of the Previous First Lien Term Loan was extinguished and
none
of the Previous Second Lien Term Loan was extinguished, which is disclosed as an outflow from financing activities in the consolidated statements of cash flows. The Company determined that
$752.4 million
of new debt was issued related to the First Lien Term Loan and
$250.0 million
of new debt was issued related to the Second Lien Notes, which is disclosed as an inflow from financing activities in the consolidated statements of cash flows. In connection with the issuance of the First Lien Term Loan, the Second Lien Notes, and the ABL Facility, the Company incurred
$52.6 million
in debt issuance costs and third-party fees, of which
$48.1 million
was capitalized,
$1.3 million
was expensed as a component of other expense and
$3.2 million
was expensed as a loss on extinguishment as a component of other expense. Further,
$21.3 million
of the total fees incurred of
$52.6 million
was netted against the
$981.1 million
of proceeds from debt as a component of the cash flows from financing activities,
$30.0 million
was presented as deferred financing costs as a component of cash flows from financing activities, and the remaining
$1.3 million
was included in cash flows from operating activities.
63
The Company recognized a loss on extinguishment of debt of $
5.5 million
, of which
$3.2 million
related to debt issue costs incurred with the issuance of the Loan Facilities and Second Lien Notes, as discussed above, and
$2.3 million
related to deferred financing fees on the Previous Credit Facilities, which were written off upon extinguishment. All remaining deferred financing fees related to the Previous Credit Facilities of
$7.6 million
were attributed to modified loans, which are capitalized and will be amortized over the remaining term of the Loan Facilities and Second Lien Notes.
Long-term debt matures as follows (in thousands):
|
Year Ending December 31,
|
Minimum Payments
|
|||
|
2020
|
$
|
9,250
|
|
|
|
2021
|
9,250
|
|
||
|
2022
|
9,250
|
|
||
|
2023
|
9,250
|
|
||
|
2024
|
9,250
|
|
||
|
2025 and beyond
|
1,291,006
|
|
||
|
Total
|
$
|
1,337,256
|
|
|
During the year ended
December 31, 2019
, the Company engaged in hedging activities to limit its exposure to changes in interest rates. See Note 13,
Derivative Instruments
, for further discussion.
The following table presents the estimated fair values of the Company’s debt obligations as of
December 31, 2019
(in thousands):
|
Financial Instrument
|
Carrying Value as of December 31, 2019
|
Markets for Identical Item (Level 1)
|
Significant Other Observable Inputs (Level 2)
|
Significant Unobservable Inputs (Level 3)
|
||||||||||||
|
First Lien Note Facility
|
$
|
893,776
|
|
$
|
—
|
|
$
|
922,688
|
|
$
|
—
|
|
||||
|
Second Lien Note Facility
|
392,720
|
|
—
|
|
—
|
|
411,119
|
|
||||||||
|
Total debt instruments
|
$
|
1,286,496
|
|
$
|
—
|
|
$
|
922,688
|
|
$
|
411,119
|
|
||||
The following table sets forth the changes in Level 3 measurements for the
year ended December 31, 2019
(in thousands):
|
Level 3 Measurements
|
||||
|
Previous Term Loans fair value as of January 1, 2019
|
$
|
551,882
|
|
|
|
Change in fair value
|
(369
|
)
|
||
|
Repayments of debt principal
|
(2,075
|
)
|
||
|
Retirements of Previous Term Loans
|
(549,438
|
)
|
||
|
Issuance of Second Lien Notes as of August 6, 2019
|
388,000
|
|
||
|
Interest rate PIK
|
12,256
|
|
||
|
Change in fair value
|
10,863
|
|
||
|
Second Lien Notes fair value as of December 31, 2019
|
$
|
411,119
|
|
|
See Note 14,
Fair Value Measurements
, for further discussion.
13. DERIVATIVE INSTRUMENTS
The Company utilizes derivative financial instruments for hedging and non-trading purposes to limit the Company’s exposure to its variable interest rate risk. Use of derivative financial instruments in hedging strategies subjects the Company to certain risks, such as market and credit risks. Market risk represents the possibility that the value of the derivative financial instrument will change. Credit risk related to a derivative financial instrument represents the possibility that the counterparty will not fulfill the terms of the contract. The notional, or contractual, amount of the Company’s derivative financial instruments is used to measure interest to be paid or received and does not represent the Company’s exposure due to credit risk. Credit risk is monitored through established approval procedures, including reviewing credit ratings when appropriate.
64
During
2017
, Option Care entered into interest rate caps that reduce the risk of increased interest payments due to rising interest rates. The hedges offset the risk of rising interest rates through 2020 on the first
$250.0 million
of the Previous First Lien Term Loan. The interest rate caps perfectly offset the terms of the interest rates associated with the variable interest rate Previous First Lien Term Loan. Option Care entered into the interest rate caps as a cash flow hedge for a notional amount of
$1.9 million
. In April 2019, Option Care terminated its interest rate caps and received cash proceeds of
$1.7 million
, net of early termination fees. In conjunction with the termination of the interest rate caps, Option Care discontinued the hedge accounting associated with the interest rate caps.
In August 2019, the Company entered into interest rate swap agreements that reduce the variability in the interest rates on the newly-issued debt obligations. The first interest rate swap for
$925.0 million
notional was effective in August 2019 with
$911.1 million
designated as a cash flow hedge against the underlying interest rate on the First Lien Term Loan interest payments indexed to one-month LIBOR through August 2021. The second interest rate swap for
$400.0 million
notional was effective in November 2019 and is designated as a cash flow hedge against the underlying interest rate on the Second Lien Notes interest payment indexed to three-month LIBOR through November 2020. In accordance with ASU 2017-12,
Targeted Improvements to Accounting for Hedges
, the Company has determined that the hedges are perfectly effective. The remaining
$13.9 million
notional amount of the first interest rate swap is not designated as a hedging instrument.
The following table summarizes the amount and location of the Company’s derivative instruments in the consolidated balance sheets (in thousands):
|
Fair value - Derivatives in asset position
|
||||||||||
|
Derivative
|
Balance Sheet Caption
|
December 31, 2019
|
December 31, 2018
|
|||||||
|
Interest rate caps designated as cash flow hedges
|
Prepaid expenses and other current assets
|
$
|
—
|
|
$
|
2,627
|
|
|||
|
Total derivatives
|
$
|
—
|
|
$
|
2,627
|
|
||||
|
Fair value - Derivatives in liability position
|
||||||||||
|
Derivative
|
Balance Sheet Caption
|
December 31, 2019
|
December 31, 2018
|
|||||||
|
Interest rate swaps designated as cash flow hedges
|
Accrued expenses and other current liabilities
|
$
|
1,275
|
|
$
|
—
|
|
|||
|
Interest rate swaps designated as cash flow hedges
|
Other noncurrent liabilities
|
5,920
|
|
—
|
|
|||||
|
Interest rate swaps not designated as hedges
|
Other noncurrent liabilities
|
90
|
|
—
|
|
|||||
|
Total derivatives
|
$
|
7,285
|
|
$
|
—
|
|
||||
The gain and loss associated with the changes in the fair value of the effective portion of the hedging instrument are recorded into other comprehensive (loss) income. The gain and loss associated with the changes in the fair value of the
$13.9 million
notional amount not designated as a hedging instrument are recognized in net income through interest expense. The following table presents the pre-tax gains (losses) from derivative instruments recognized in other comprehensive (loss) income in the Company’s consolidated statements of comprehensive income (loss) (in thousands):
|
Years Ended December 31,
|
|||||||||||
|
Derivative
|
2019
|
2018
|
2017
|
||||||||
|
Interest rate caps designated as cash flow hedges
|
$
|
(1,103
|
)
|
$
|
1,008
|
|
$
|
94
|
|
||
|
Interest rate swaps designated as cash flow hedges
|
(7,195
|
)
|
—
|
|
—
|
|
|||||
|
Total
|
$
|
(8,298
|
)
|
$
|
1,008
|
|
$
|
94
|
|
||
The following table presents the amount and location of pre-tax income (loss) recognized in the Company’s consolidated statement of comprehensive income (loss) related to the Company’s derivative instruments (in thousands):
65
|
Year Ended December 31,
|
|||||||||||||
|
Derivative
|
Income Statement Caption
|
2019
|
2018
|
2017
|
|||||||||
|
Interest rate caps designated as cash flow hedges
|
Interest expense
|
$
|
(125
|
)
|
$
|
300
|
|
$
|
5
|
|
|||
|
Interest rate swaps designated as cash flow hedges
|
Interest expense
|
(115
|
)
|
—
|
|
—
|
|
||||||
|
Interest rate swaps not designated as hedges
|
Interest expense
|
(92
|
)
|
—
|
|
—
|
|
||||||
|
Total
|
$
|
(332
|
)
|
$
|
300
|
|
$
|
5
|
|
||||
The Company expects to reclassify
$5.1 million
of total interest rate costs from accumulated other comprehensive loss against interest expense during the next 12 months.
14. FAIR VALUE MEASUREMENTS
Fair value measurements are determined by maximizing the use of observable inputs and minimizing the use of unobservable inputs. The hierarchy places the highest priority on unadjusted quoted market prices in active markets for identical assets or liabilities (Level 1 measurements) and gives the lowest priority to unobservable inputs (Level 3 measurements). The three levels of inputs within the fair value hierarchy are defined in Note 2,
Summary of Significant Accounting Policies.
While the Company believes its valuation methods are appropriate and consistent with other market participants, the use of
different methodologies or assumptions to determine the fair value of certain financial instruments could result in a different fair value measurement at the reporting date.
First Lien Term Loan
: The fair value of the First Lien Term Loan is derived from a broker quote on the loans in the syndication (Level 2 inputs). See Note 12,
Indebtedness
, for further discussion on the carrying amount and fair value of the First Lien Term Loan.
Second Lien Notes
: The fair value of the Second Lien Notes is derived from a cash flow model that discounted the cash flows based on market interest rates (Level 3 inputs). See Note 12,
Indebtedness
, for further discussion on the carrying amount and fair value of the Second Lien Notes.
Interest rate swaps
: The fair values of interest rate swaps are derived from the interest rates prevalent in the market and future expectations of those interest rates (Level 2 inputs). The Company determines the fair value of the investments based on quoted prices from third-party brokers. See Note 13,
Derivative Instruments
, for further discussion on the fair value of the interest rate swaps.
Interest rate caps
: The fair values of interest rate caps are derived from the interest rates prevalent in the market and future expectations of those interest rates (Level 2 inputs). The Company determines the fair value of the investments based on quoted prices from third-party brokers. In April 2019, Option Care terminated its interest rate caps. See Note 13,
Derivative Instruments
, for further discussion on the fair value of the interest rate caps.
There were no other assets or liabilities measured at fair value at
December 31, 2019
or
2018
.
15. COMMITMENTS AND CONTINGENCIES
The Company is involved in legal proceedings and is subject to investigations, inspections, audits, inquiries, and similar actions by governmental authorities, arising in the normal course of the Company’s business. Some of these suits may purport or may be determined to be class actions and/or involve parties seeking large and/or indeterminate amounts, including punitive or exemplary damages, and may remain unresolved for several years. From time to time, the Company may also be involved in legal proceedings as a plaintiff involving antitrust, tax, contract, intellectual property, and other matters. Gain contingencies, if any, are recognized when they are realized. The results of legal proceedings are often uncertain and difficult to predict, and the costs incurred in litigation can be substantial, regardless of the outcome. The Company believes that its defenses and assertions in pending legal proceedings have merit and does not believe that any of these pending matters, after consideration of applicable reserves and rights to indemnification, will have a material adverse effect on the Company’s consolidated balance sheets. However, substantial unanticipated verdicts, fines, and rulings may occur. As a result, the Company may from time to time incur judgments, enter into settlements, or revise expectations regarding the outcome of certain matters, and such developments could have a material adverse effect on its results of operations in the period in which the amounts are accrued and/or its cash flows in the period in which the amounts are paid.
66
16. STOCK-BASED INCENTIVE COMPENSATION
Equity Incentive Plans
— Under the Company’s 2018 Equity Incentive Plan (the “2018 Plan”), approved at the annual meeting by the BioScrip stockholders on May 3, 2018, the Company may issue, among other things, incentive stock options, non-qualified stock options, stock appreciation rights, restricted stock units, stock grants, and performance units to key employees and directors. The 2018 plan is administered by the Company’s Compensation Committee, a standing committee of the Board of Directors. A total of
16,406,939
shares (
4,101,735
equivalent shares after adjusting for the one share for four share reverse stock split) of common stock were initially authorized for issuance under the 2018 Plan.
Stock Options
— Options granted under the 2018 Plan typically vest over a
three
-year period and, in certain instances, may fully vest upon a change in control of the Company. The options also typically have an exercise price that may not be less than 100% of its fair market value on the date of grant and are exercisable
seven
to
ten
years after the date of grant, subject to earlier termination in certain circumstances.
Compensation expense from stock options is recognized on a straight-line basis over the requisite service period. During the
year ended
December 31, 2019
, the Company recognized compensation expense related to stock options of
$0.4 million
. The Company did not recognize any compensation expense related to stock options prior to the Merger.
The Company did
no
t grant any options during the year ended
December 31, 2019
.
A summary of stock option activity from the Merger Date through
December 31, 2019
was as follows (all amounts adjusted for the one share for four share reverse stock split):
|
Options
|
Weighted Average Exercise Price
|
Aggregate Intrinsic Value (thousands)
|
Weighted Average Remaining Contractual Life
|
|||||||||
|
Balance at December 31, 2018
|
—
|
|
$
|
—
|
|
$
|
—
|
|
|
|||
|
Acquired in Merger
|
812,565
|
|
$
|
13.88
|
|
$
|
3,935
|
|
||||
|
Granted
|
—
|
|
$
|
—
|
|
$
|
—
|
|
||||
|
Exercised
|
(158,270
|
)
|
$
|
7.64
|
|
$
|
995
|
|
||||
|
Forfeited and expired
|
(9,320
|
)
|
$
|
17.72
|
|
$
|
29
|
|
||||
|
Balance at December 31, 2019
|
644,975
|
|
$
|
15.36
|
|
$
|
2,754
|
|
2.4 years
|
|||
|
Exercisable at December 31, 2019
|
597,856
|
|
$
|
15.76
|
|
$
|
2,524
|
|
1.9 years
|
|||
During the
year ended December 31, 2019
, shares were surrendered to satisfy tax withholding obligations on the exercise of stock options with a cost basis of
$0.4 million
, which are all held as treasury stock as of
December 31, 2019
. No cash was received from stock option exercises under share-based payment arrangements for the
years ended
December 31, 2019
,
2018
or
2017
.
The maximum term of stock options under these plans is
ten
years. Options outstanding as of
December 31, 2019
expire on various dates ranging from February 2020 through November 2028. The following table outlines the outstanding and exercisable stock options as of
December 31, 2019
(all amounts adjusted for the one share for four share reverse stock split):
67
|
Options Outstanding
|
Options Exercisable
|
||||||||||||||||
|
Range of Option Exercise Price
|
Outstanding Options
|
Weighted Average Exercise Price
|
Weighted Average Remaining Contractual Life
|
Options Exercisable
|
Weighted Average Exercise Price
|
||||||||||||
|
$0.00 - $8.24
|
139,168
|
|
$
|
4.87
|
|
1.0 year
|
|
135,867
|
|
$
|
4.83
|
|
|||||
|
$8.24 - $16.52
|
295,224
|
|
$
|
10.33
|
|
3.7 years
|
|
251,406
|
|
$
|
10.34
|
|
|||||
|
$16.52 - $24.76
|
38,250
|
|
$
|
20.97
|
|
2.5 years
|
|
38,250
|
|
$
|
20.97
|
|
|||||
|
$24.76 - $33.00
|
148,333
|
|
$
|
28.57
|
|
0.8 years
|
|
148,333
|
|
$
|
28.57
|
|
|||||
|
$33.00 - $41.28
|
—
|
|
$
|
—
|
|
—
|
|
—
|
|
$
|
—
|
|
|||||
|
$41.28 - $49.52
|
18,750
|
|
$
|
44.16
|
|
3.2 years
|
|
18,750
|
|
$
|
44.16
|
|
|||||
|
$49.52 - $57.76
|
4,000
|
|
$
|
56.24
|
|
3.0 years
|
|
4,000
|
|
$
|
56.24
|
|
|||||
|
$57.76 - $66.00
|
—
|
|
$
|
—
|
|
—
|
|
—
|
|
$
|
—
|
|
|||||
|
$66.00 - $74.28
|
1,250
|
|
$
|
66.52
|
|
3.6 years
|
|
1,250
|
|
$
|
66.52
|
|
|||||
|
All options
|
644,975
|
|
597,856
|
|
|||||||||||||
As of December 31, 2019
, there was
$0.2 million
of unrecognized compensation expense related to unvested option grants that is expected to be recognized over a weighted-average period of
1.5 years
.
Restricted Stock
— Restricted stock grants subject solely to an employee’s continued service with the Company generally will become fully vested within
one
to
three
years from the grant date and, in certain instances, may fully vest upon a change in control of the Company. Restricted stock grants subject solely to a Director’s continued service with the Company generally will become fully vested within
one year
from the date of grant.
Compensation expense from restricted stock is recognized on a straight-line basis over the requisite service period. During the
year ended
December 31, 2019
, the Company recognized compensation expense related to restricted stock awards of
$1.9 million
. The Company did not recognize any compensation expense related to restricted stock awards prior to the Merger.
A summary of restricted stock award activity from the Merger Date through
December 31, 2019
was as follows:
|
Restricted Stock
|
Weighted Average Grant Date Fair Value
|
|||||
|
Balance at December 31, 2018
|
—
|
|
$
|
—
|
|
|
|
Acquired in Merger (1)
|
280,120
|
|
$
|
10.68
|
|
|
|
Granted
|
169,123
|
|
$
|
10.72
|
|
|
|
Vested and issued (1)
|
(214,926
|
)
|
$
|
10.68
|
|
|
|
Forfeited and expired (1)
|
(2,755
|
)
|
$
|
10.68
|
|
|
|
Balance at December 31, 2019
|
231,562
|
|
$
|
10.68
|
|
|
(1) Weighted average grant date fair value was calculated as
$2.67
stock price on the August 6, 2019 Merger Date, multiplied by four to adjust for the one share for four share reverse stock split.
During the
year ended December 31, 2019
, shares were surrendered to satisfy tax withholding obligations on the vesting of restricted stock awards with a cost basis of
$2.1 million
, of which
$2.0 million
is held as treasury stock as of
December 31, 2019
.
As of December 31, 2019, there was
$2.4 million
in unrecognized compensation expense related to unvested restricted stock awards that is expected to be recognized over a weighted average period of
2.7 years
. The total fair value of restricted stock awards vested during the
years ended
December 31, 2019
,
2018
and
2017
was
$1.9 million
,
$0
and
$0
, respectively.
HC I Incentive Units
— Beginning in October 2015, HC I implemented an equity incentive plan for certain officers and employees of the Company. Incentive units are equity-based awards subject to time and performance vesting restrictions. The compensation expense related to this plan has been reflected in the Company’s financial statements.
68
In accordance with ASC Topic 718,
Compensation-Stock Compensation
, compensation expense is recognized on a straight-line basis over the vesting period of the award or the employee’s retirement eligible date, if earlier. During the
years ended
December 31, 2019
,
2018
and
2017
, the Company recognized compensation expense related to the HC I incentive units of
$1.9 million
,
$2.1 million
and
$1.4 million
, respectively.
The fair value of each award was determined using a Monte-Carlo simulation with the following weighted average assumptions used for the
years ended
December 31, 2019
and
2018
:
|
Risk-free interest rate (1)
|
2.25
|
%
|
|
|
Average time to liquidity (years) (2)
|
2.13
|
|
|
|
Volatility (3)
|
47.00
|
%
|
|
|
Discount for lack of marketability (4)
|
30.00
|
%
|
|
|
Weighted-average grant-date fair value per share
|
$1.13
|
||
|
(1) Represents the US Treasury security rate for the expected time to liquidity event.
|
|||
|
(2) Represents the period of time expected prior to liquidity event.
|
|||
|
(3) Based on historical volatility of comparable public companies.
|
|||
|
(4) Represents a discount taken to reflect the private nature of the investment.
|
|||
17. STOCKHOLDERS’ EQUITY
As further discussed in Note 20,
Subsequent Events
, on February 3, 2020, the Company completed a one share for four share reverse stock split. All common shares, warrants and stock awards have been retrospectively adjusted for the reverse stock split for all periods presented in these consolidated financial statements.
2017 Warrants
— Prior to the Merger, BioScrip issued warrants to certain debt holders pursuant to a Warrant Purchase Agreement dated as of June 29, 2017. In conjunction with the Merger, the 2017 Warrants were amended to entitle the purchasers of the warrants to purchase
8.3 million
shares (
2.1 million
equivalent shares after adjusting for the reverse stock split) of common stock. The 2017 Warrants have a
10
-year term and an exercise price of
$2.00
per share (
$8.00
per share after adjusting for the reverse stock split), and may be exercised by payment of the exercise price in cash or surrender of shares of common stock into which the 2017 Warrants are being converted in an aggregate amount sufficient to pay the exercise price. The 2017 Warrants are classified as equity instruments, and the fair value of these warrants of
$14.1 million
was recorded in paid-in capital as of the Merger Date. Subsequent to the Merger Date through December 31, 2019, warrant holders exercised warrants to purchase
2.6 million
shares (
0.7 million
equivalent shares after adjusting for the reverse stock split) of common stock. No proceeds were received from these exercises as the warrant holders elected to surrender shares to pay the exercise price. At December 31, 2019, the remaining warrant holders are entitled to purchase
5.7 million
shares (
1.4 million
equivalent shares after adjusting for the reverse stock split) of common stock.
2015 Warrants
— Prior to the Merger, BioScrip issued warrants pursuant to a Common Stock Warrant Agreement dated as of March 9, 2015 which entitle the holders to purchase
3.7 million
shares (
0.9 million
equivalent shares after adjusting for the reverse stock split) of common stock. The 2015 Warrants have a
10
-year term and have exercise prices in a range of
$5.17
per share to
$6.45
per share (
$20.68
per share to
$25.80
per share after adjusting for the reverse stock split). The 2015 Warrants were assumed by the Company in conjunction with the Merger and are classified as equity instruments, and the fair value of these warrants of
$4.6 million
was recorded in paid in capital as of the Merger Date.
Home Solutions Restricted Stock
— In conjunction with BioScrip’s 2016 acquisition of Home Solutions, Inc.,
7.1 million
(
1.8 million
equivalent shares after adjusting for the reverse stock split) restricted shares of common stock were issued, of which
3.1 million
(
0.8 million
equivalent shares after adjusting for the reverse stock split) of these units vest upon the closing price of the Company’s common stock averaging at or above
$4.00
per share (
$16.00
per share after adjusting for the reverse stock split) over
20
consecutive trading days prior to
December 31, 2019
and
4.0 million
(
1.0 million
equivalent shares after adjusting for the reverse stock split) of these units vest upon the closing price of the Company’s common stock averaging at or above
$5.00
per share (
$20.00
per share after adjusting for the reverse stock split) over
20
consecutive trading days prior to
December 31, 2019
. The restricted stock expired on
December 31, 2019
. As discussed in Note 1,
Nature of Operations and Presentation of Financial Statements
,
28,193,428
common shares (
7,048,357
equivalent shares after adjusting for the reverse stock split) issued to HC I in conjunction with the Merger are held in escrow to prevent dilution related to the vesting of the Home Solutions restricted stock. In the event the Home Solutions restricted stock expires unvested, the
28,193,428
common
69
shares (
7,048,357
equivalent shares after adjusting for the reverse stock split) held in escrow will be returned to the Company and canceled. As of
December 31, 2019
, the Home Solutions restricted stock remained in escrow pending final resolution of this matter.
Treasury Stock
— During the
year ended December 31, 2019
,
1,160,469
shares (
290,117
equivalent shares after adjusting for the reverse stock split) were surrendered to satisfy tax withholding obligations on the exercise of stock options and the vesting of restricted stock awards with a cost basis of
$2.5 million
, of which
$2.4 million
remains held in treasury as of
December 31, 2019
. At
December 31, 2019
, the Company held
1,534,886
shares (
383,722
equivalent shares after adjusting for the reverse stock split) of treasury stock. No treasury stock existed prior to the Merger.
Preferred Stock
— In conjunction with the Merger, all legacy BioScrip preferred stock was settled, and
no
preferred stock is outstanding as of
December 31, 2019
. There was
no
preferred stock existing as of
December 31, 2018
.
18. RELATED-PARTY TRANSACTIONS
Management Services
— In conjunction with the Option Care Acquisition, the Company entered into two separate Management Services Agreements with Madison Dearborn Partners VI-B, L.P. and Walgreen Co. Each Management Services Agreement required the Company to pay
$0.3 million
to each party quarterly beginning July 1, 2015 for on-going management, consulting and financial services provided to the Company. Following the close of the Merger, both Management Services Agreements were terminated. In 2019, prior to the Merger, the Company incurred
$1.5 million
of management services expense, which has been reflected as a component of selling, general and administrative expense in the consolidated statements of comprehensive income (loss) for the
year ended December 31, 2019
. During the
years ended
December 31, 2018
and
2017
, management services expense of
$2.0 million
was recorded as a component of selling, general, and administrative expense in the consolidated statements of comprehensive income (loss).
Management Equity Ownership Plan
— In October 2015, HC I implemented an equity ownership and incentive plan for certain officers and employees of Option Care. The officers were able to purchase membership units in HC I and could fund a portion of the purchase with a loan from Option Care. These loans were treated as a shareholder contribution in Option Care. For the
year ended December 31, 2019
,
2018
and
2017
,
$0
,
$0.4 million
, and
$0
, respectively, were credited to paid-in capital related to HC I membership units purchased with a loan from Option Care. During the
year ended December 31, 2019
, shareholder redemptions totaled
$2.4 million
, comprised of a cash distribution to HC I of
$2.0 million
and notes redeemed of
$0.4 million
. There were
no
shareholder redemptions during the
year ended December 31, 2018
. During the
year ended
December 31, 2017
, shareholder redemptions totaled
$0.1 million
for notes redeemed by the officers, which was treated as a shareholder redemption that reduced paid-in-capital.
During the
year ended December 31, 2019
, prior to the Merger, Option Care sold its notes receivable from management, along with all accrued interest expense, to a third-party bank. Option Care received cash proceeds of
$1.3 million
, which represented payment of
$1.1 million
in outstanding notes receivable from management and payment of
$0.2 million
in accrued interest expense. Notes receivable from management of
$0
and
$1.6 million
remained outstanding as of
December 31, 2019
and
2018
, respectively. The notes receivable from management and associated interest receivable are recorded in management notes receivable as a reduction to equity on the Company’s consolidated balance sheets as of
December 31, 2018
.
Transactions with Equity-Method Investees
— The Company provides management services to its joint ventures such as accounting, invoicing and collections in addition to day-to-day managerial support of the operations of the businesses. The Company recorded management fee income of
$2.5 million
,
$2.2 million
and
$1.3 million
for the
years ended
December 31, 2019
,
2018
and
2017
, respectively. Management fees are recorded in net revenues in the accompanying consolidated statements of comprehensive income (loss).
The Company had amounts due to its joint ventures of
$4.3 million
as of
December 31, 2019
. The Company also had amounts due to its joint ventures of
$0.9 million
and amounts due from its joint ventures of
$0.1 million
as of
December 31, 2018
. These payables were included in accrued expenses and other current liabilities in the accompanying balance sheets and these receivables were included in prepaid expenses and other current assets in the accompanying balance sheets. These balances primarily relate to cash collections received by the Company on behalf of the joint ventures, offset by certain pharmaceutical inventories purchased by the Company on behalf of the joint ventures.
70
19. SELECTED QUARTERLY FINANCIAL DATA (UNAUDITED)
A summary of unaudited quarterly financial information for the years ended
December 31, 2019
and
2018
is as follows (in thousands except per share amounts).
|
First Quarter
|
Second Quarter
|
Third Quarter
|
Fourth Quarter
|
||||||||||||
|
Year ended December 31, 2019
|
|||||||||||||||
|
Net revenue
|
$
|
476,492
|
|
$
|
497,266
|
|
$
|
615,880
|
|
$
|
720,779
|
|
|||
|
Gross profit
|
98,194
|
|
101,390
|
|
137,773
|
|
175,642
|
|
|||||||
|
Operating income (loss)
|
5,438
|
|
(8,005
|
)
|
(11,725
|
)
|
13,973
|
|
|||||||
|
Net loss
|
$
|
(3,712
|
)
|
$
|
(13,603
|
)
|
$
|
(42,794
|
)
|
$
|
(15,811
|
)
|
|||
|
Loss per share, basic and diluted
|
$
|
(0.03
|
)
|
$
|
(0.10
|
)
|
$
|
(0.26
|
)
|
$
|
(0.09
|
)
|
|||
|
First Quarter
|
Second Quarter
|
Third Quarter
|
Fourth Quarter
|
||||||||||||
|
Year ended December 31, 2018
|
|||||||||||||||
|
Net revenue
|
$
|
460,643
|
|
$
|
479,490
|
|
$
|
493,928
|
|
$
|
505,730
|
|
|||
|
Gross profit
|
101,696
|
|
101,274
|
|
108,245
|
|
111,000
|
|
|||||||
|
Operating income
|
3,065
|
|
8,897
|
|
12,759
|
|
13,548
|
|
|||||||
|
Net (loss) income
|
$
|
(6,851
|
)
|
$
|
(4,309
|
)
|
$
|
1,791
|
|
$
|
3,254
|
|
|||
|
(Loss) income per share, basic and diluted
|
$
|
(0.05
|
)
|
$
|
(0.03
|
)
|
$
|
0.01
|
|
$
|
0.02
|
|
|||
The net loss in the third quarter of
2019
included transaction expenses, integration costs and loss on extinguishment of debt incurred in conjunction with the Merger.
20. SUBSEQUENT EVENTS
The Company has evaluated whether any subsequent events occurred since
December 31, 2019
and noted the following subsequent events:
On January 3, 2020, the Company’s board of directors and HC I, the stockholder of a majority of the Company’s common stock, approved a reverse stock split of the Company’s issued and outstanding common stock on a one share for four share basis and appropriately amended the Company’s Third Amended and Restated Certificate of Incorporation to reflect the change. On February 3, 2020, the reverse stock split became effective. In connection with the reverse stock split, the Company changed its ticker symbols from “BIOS” to “OPCH” and transferred the Company’s common stock from the Nasdaq Capital Market to the Nasdaq Global Select Market. The par value of the Company’s common stock remained unchanged as a result of the reverse stock split, resulting in a decrease to the aggregate par value of common stock and corresponding increase to paid-in capital in the Company’s consolidated financial statements, which was retrospectively applied to all periods presented in the consolidated financial statements.
71
Item 9.
Changes in and Disagreements with Accountants on Accounting and Financial Disclosure
None.
Item 9A.
Controls and Procedures
Evaluation of Disclosure Controls and Procedures
The Company maintains disclosure controls and procedures (as such term is defined under Rule 13a-15(e) promulgated under the Exchange Act) that are designed to ensure that information required to be disclosed by the Company in the reports we file or submit under the Exchange Act is recorded, processed, summarized and reported within the time periods specified in the SEC’s rules and forms, and that such information is accumulated and communicated to the Company’s management, including its Chief Executive Officer (“CEO”) and Chief Financial Officer (“CFO”), as appropriate to allow timely decisions regarding required disclosure. Under the supervision and with the participation of the Company’s management, including its Chief Executive Officer and Chief Financial Officer, management evaluated the effectiveness of the Company’s disclosure controls and procedures as of December 31, 2019. Based on that evaluation, the Company’s Chief Executive Officer and its Chief Financial Officer concluded that our disclosure controls and procedures were effective as of December 31, 2019.
Management Report on Internal Control over Financial Reporting
Our management is responsible for establishing and maintaining adequate internal control over financial reporting for the Company, as defined in Rules 13a-15(f) and 15d-15(f) under the Exchange Act. Our internal control system is designed to provide reasonable assurance regarding the reliability of financial reporting and the preparation of the Company’s financial statements for external purposes in accordance with U.S. GAAP.
On August 6, 2019, BioScrip and Option Care completed the Merger, and, after giving effect to the Merger, the stockholders of Option Care as of immediately prior to the Merger Date owned approximately 80% of BioScrip common stock on a fully diluted basis following the closing, and the stockholders of BioScrip as of immediately prior to the Merger Date owned approximately 20% of BioScrip common stock on a fully diluted basis following the closing. BioScrip was the legal acquirer in the Merger. Option Care was the accounting acquirer in the Merger under U.S. GAAP. Prior to the Merger, Option Care was a privately-held company and was not subject to Section 404 of the Sarbanes-Oxley Act (“SOX”), while BioScrip was a publicly-traded company subject to Section 404 of SOX. For all filings under the Exchange Act after the Merger, the historical financial statements for the period prior to the Merger are and will be those of Option Care. BioScrip’s businesses are and will be included in consolidated financial statements for all periods subsequent to the Merger.
As noted above, BioScrip was the legal acquirer in the Merger and subject to Section 404 of SOX. As of the date of its report, management was able to evaluate the effectiveness of the design and operation of our ongoing internal controls related to BioScrip. As the Merger occurred during the third quarter of 2019, and Option Care was the accounting acquirer and not previously subject to Section 404 of SOX, management concluded there was insufficient time to complete its assessment of the internal controls over financial reporting related to Option Care, and, therefore, Option Care internal control over financial reporting was excluded from our report on internal control over financial reporting.
Our management, with the participation of the CEO and CFO, assessed the effectiveness of the Company’s internal control over financial reporting, by focusing on those controls that relate exclusively to ongoing BioScrip operations (covering approximately 13% of the revenue on the Consolidated Statements of Income for the year ended December 31, 2019 and 7% of the total assets on the Consolidated Balance Sheet as of December 31, 2019). Based on the criteria for effective internal control over financial reporting established in Internal Control - Integrated Framework (2013) issued by the Committee of Sponsoring Organizations of the Treadway Commission (“COSO”), management concluded that the internal control over financial reporting was effective as of December 31, 2019.
All internal control systems, no matter how well designed, have inherent limitations and may not prevent or detect misstatements. Also, projections of any evaluation of effectiveness to future periods are subject to the risk that controls may become inadequate because of changes in conditions or that the degree of compliance with the policies or procedures may deteriorate.
72
Changes in Internal Controls over Financial Reporting
The Merger, which was completed on August 6, 2019, has had a material impact on the financial position, results of operations, and cash flows of the combined company from the date of acquisition through December 31 2019. The business combination also resulted in material changes in the combined company's internal controls over financial reporting. The Company is in the process of designing and integrating policies, processes, operations, technology, and other components of internal controls over financial reporting of the combined company. Management will monitor the implementation of new controls and test the operating effectiveness when instances are available in future periods.
73
Report of Independent Registered Public Accounting Firm
To the Stockholders and Board of Directors
Option Care Health, Inc.:
Opinion on Internal Control Over Financial Reporting
We have audited Option Care Health, Inc. and subsidiaries’ (the Company) internal control over financial reporting as of December 31, 2019, based on criteria established in
Internal Control - Integrated Framework (2013)
issued by the Committee of Sponsoring Organizations of the Treadway Commission. In our opinion, the Company maintained, in all material respects, effective internal control over financial reporting as of December 31, 2019, based on “criteria established in
Internal Control - Integrated Framework (2013)
issued by the Committee of Sponsoring Organizations of the Treadway Commission”.
We also have audited, in accordance with the standards of the Public Company Accounting Oversight Board (United States) (PCAOB), the consolidated balance sheets of the Company as of December 31, 2019 and 2018, the related consolidated statements of comprehensive income (loss), stockholders’ equity, and cash flows for each of the years in the three-year period ended December 31, 2019, and the related notes (collectively, the consolidated financial statements), and our report dated March 5, 2020 expressed an unqualified opinion on those consolidated financial statements.
As described in the Management Report on Internal Control Over Financial Reporting, HC Group Holdings I, Inc. and HC Group Holdings II, Inc. (collectively, Option Care) merged with and into a wholly owned subsidiary of BioScrip, Inc. (BioScrip) on August 6, 2019, forming the Company, and management excluded from its assessment of the effectiveness of the Company’s internal control over financial reporting as of December 31, 2019, Option Care’s internal control over financial reporting associated with 93% of total assets and 87% of total revenues included in the consolidated financial statements of the Company as of and for the year ended December 31, 2019. Our audit of internal control over financial reporting of the Company also excluded an evaluation of the internal control over financial reporting of Option Care.
Basis for Opinion
The Company’s management is responsible for maintaining effective internal control over financial reporting and for its assessment of the effectiveness of internal control over financial reporting, included in the accompanying Management Report on Internal Control over Financial Reporting. Our responsibility is to express an opinion on the Company’s internal control over financial reporting based on our audit. We are a public accounting firm registered with the PCAOB and are required to be independent with respect to the Company in accordance with the U.S. federal securities laws and the applicable rules and regulations of the Securities and Exchange Commission and the PCAOB.
We conducted our audit in accordance with the standards of the PCAOB. Those standards require that we plan and perform the audit to obtain reasonable assurance about whether effective internal control over financial reporting was maintained in all material respects. Our audit of internal control over financial reporting included obtaining an understanding of internal control over financial reporting, assessing the risk that a material weakness exists, and testing and evaluating the design and operating effectiveness of internal control based on the assessed risk. Our audit also included performing such other procedures as we considered necessary in the circumstances. We believe that our audit provides a reasonable basis for our opinion.
Definition and Limitations of Internal Control Over Financial Reporting
A company’s internal control over financial reporting is a process designed to provide reasonable assurance regarding the reliability of financial reporting and the preparation of financial statements for external purposes in accordance with generally accepted accounting principles. A company’s internal control over financial reporting includes those policies and procedures that (1) pertain to the maintenance of records that, in reasonable detail, accurately and fairly reflect the transactions and dispositions of the assets of the company; (2) provide reasonable assurance that transactions are recorded as necessary to permit preparation of financial statements in accordance with generally accepted accounting principles, and that receipts and expenditures of the company are being made only in accordance with authorizations of management and directors of the company; and (3) provide reasonable assurance regarding prevention or timely detection of unauthorized acquisition, use, or disposition of the company’s assets that could have a material effect on the financial statements.
Because of its inherent limitations, internal control over financial reporting may not prevent or detect misstatements. Also, projections of any evaluation of effectiveness to future periods are subject to the risk that controls may become inadequate because of changes in conditions, or that the degree of compliance with the policies or procedures may deteriorate.
/s/ KPMG LLP
Chicago, Illinois March 5, 2020
74
Item 9B.
Other Information
None.
PART III
Item 10.
Directors, Executive Officers and Corporate Governance
We have adopted a Code of Ethics that applies to all of our directors, officers and employees, including our principal executive, principal financial and principal accounting officers, or persons performing similar functions. Our Code of Ethics is posted on our website located at http://investors.optioncarehealth.com/corporate-governance/highlights. We intend to disclose future amendments to certain provisions of the Code of Ethics, and waivers of the Code of Ethics granted to executive officers and directors.
The other information required by this item s incorporated by reference from the information contained in our definitive proxy statement to be filed with the SEC no later than 120 days after December 31, 2019 in connection with our 2020 Annual Meeting of Stockholders.
Item 11.
Executive Compensation
The information required by this item is incorporated by reference from the information contained in our definitive proxy statement to be filed with the SEC no later than 120 days after December 31, 2019 in connection with our 2020 Annual Meeting of Stockholders.
Item 12.
Security Ownership of Certain Beneficial Owners and Management and Related Stockholder Matters
The information required by this item is incorporated by reference from the information contained in our definitive proxy statement to be filed with the SEC no later than 120 days after December 31, 2019 in connection with our 2020 Annual Meeting of Stockholders.
Item 13.
Certain Relationships and Related Transactions, and Director Independence
The information required by this item is incorporated by reference from the information contained in our definitive proxy statement to be filed with the SEC no later than 120 days after December 31, 2019 in connection with our 2020 Annual Meeting of Stockholders.
Item 14.
Principal Accountant Fees and Services
The information required by this item is incorporated by reference from the information contained in our definitive proxy statement to be filed with the SEC no later than 120 days after December 31, 2019 in connection with our 2020 Annual Meeting of Stockholders.
75
PART IV
|
Item 15.
|
Exhibits, Financial Statement Schedules
|
|
Page
|
|
|
(a)(1) Financial Statements.
|
|
|
The following financial statements appear in Part II, Item 8:
|
|
|
Report of Independent Registered Public Accounting Firm
|
|
|
Consolidated Balance Sheets as of December 31, 2019 and 2018
|
|
|
Consolidated Statements of Comprehensive Income (Loss) for the years ended December 31, 2019, 2018 and 2017
|
|
|
Consolidated Statements of Cash Flows for the years ended December 31, 2019, 2018 and 2017
|
|
|
Consolidated Statements of Stockholders’ Equity for the years ended December 31, 2019, 2018 and 2017
|
|
|
Notes to Consolidated Financial Statements
|
|
|
All other schedules not listed above have been omitted since they are not applicable or are not required.
|
|
(a)(3) Exhibits.
Index to Exhibits
|
Exhibit Number
|
Description
|
|
2.1+
|
|
|
2.2+
|
|
|
2.3
|
|
|
2.4
|
|
|
2.5
|
|
|
2.6
|
|
|
2.7+
|
|
|
3.1
|
|
|
3.2
|
|
|
3.3
|
|
|
4.1
|
|
|
4.2
|
|
|
4.3
|
|
|
4.4
|
|
76
|
4.5
|
|
|
4.6
|
|
|
4.7
|
|
|
4.8
|
|
|
4.9
|
|
|
4.10
|
|
|
4.11
|
|
|
4.12
|
|
|
10.1
†
|
|
|
10.2
†
|
|
|
10.3
†
|
|
|
10.4
†
|
|
|
10.5
|
|
|
10.6
|
|
|
10.7
|
|
|
10.8
|
|
|
10.9
|
|
|
10.10
|
|
|
10.11
|
|
|
10.12
†
|
|
|
10.13
†
|
|
|
10.14
†
|
|
|
21.1
|
|
77
|
23.1
|
|
|
31.1
|
|
|
31.2
|
|
|
32.1
|
|
|
32.2
|
|
|
101
|
The following financial information from the Company’s Form 10-K for the fiscal year ended December 31, 2019, formatted in XBRL (Extensible Business Reporting Language): (i) Consolidated Statements of Comprehensive Income (Loss) for the fiscal years ended December 31, 2019, 2018 and 2017, (ii) Consolidated Balance Sheets as of December 31, 2019 and 2018, (iii) Consolidated Statements of Stockholders’ Equity for the fiscal years ended December 31, 2019, 2018 and 2017, (iv) Consolidated Statements of Cash Flows for the fiscal years ended December 31, 2019, 2018 and 2017, and (v) Notes to Consolidated Financial Statements.
|
|
101.INS
|
XBRL Instance Document
|
|
101.SCH
|
XBRL Taxonomy Extension Schema Document
|
|
101.CAL
|
XBRL Taxonomy Extension Calculation Linkbase Document
|
|
101.DEF
|
XBRL Taxonomy Extension Definition Linkbase Document
|
|
101.LAB
|
XBRL Taxonomy Extension Labels Linkbase Document
|
|
101.PRE
|
XBRL Taxonomy Extension Presentation Linkbase Document
|
|
†
|
Designates the Company’s management contracts or compensatory plan or arrangement.
|
|
|
+
|
Certain schedules attached to the Agreement and Plan of Merger have been omitted pursuant to Item 601(b)(2) of Regulation S-K. The Company will furnish copies of the omitted schedules to the Securities and Exchange Commission upon request by the Commission.
|
|
Item 16.
Form 10-K Summary
None.
SIGNATURES
Pursuant to the requirements of the Securities Exchange Act of 1934, the registrant has duly caused this report to be signed on its behalf by the undersigned, thereunto duly authorized, on
March 5, 2020
.
|
OPTION CARE HEALTH, INC.
|
|
|
|
/s/ Michael Shapiro
|
|
Michael Shapiro
|
|
Chief Financial Officer and Senior Vice President (Principal Financial Officer and Duly Authorized Officer)
|
Pursuant to the requirements of the Securities Exchange Act of 1934, this report has been signed below by the following persons on behalf of the registrant and in the capacities on the dates indicated.
78
|
Signature
|
Title(s)
|
Date
|
|
/
s/ John C. Rademacher
John C. Rademacher
|
Chief Executive Officer, President and Director
(Principal Executive Officer)
|
March 5, 2020
|
|
/
s/ Michael Shapiro
Michael Shapiro
|
Chief Financial Officer and Senior Vice President
(Principal Financial Officer)
|
March 5, 2020
|
|
|
|
|
|
/s/ Robert R. Kampstra
Robert R. Kampstra
|
Senior Vice President, Finance and Chief Accounting Officer
(Principal Accounting Officer)
|
March 5, 2020
|
|
|
|
|
|
/s/ Harry M. Jansen Kraemer, Jr.
Harry M. Jansen Kraemer, Jr.
|
Non-Executive Chairman of the Board
|
March 5, 2020
|
|
/s/ John J. Arlotta
John J. Arlotta
|
Director
|
March 5, 2020
|
|
/s/ Elizabeth Q. Betten
Elizabeth Q. Betten
|
Director
|
March 5, 2020
|
|
/s/ David W. Golding
David W. Golding
|
Director
|
March 5, 2020
|
|
/s/ Alan Nielsen
Alan Nielsen
|
Director
|
March 5, 2020
|
|
|
|
|
|
/s/ R. Carter Pate
R. Carter Pate
|
Director
|
March 5, 2020
|
|
/s/ Nitin Sahney
Nitin Sahney
|
Director
|
March 5, 2020
|
|
/s/ Timothy P. Sullivan
Timothy P. Sullivan
|
Director
|
March 5, 2020
|
|
/s/ Mark Vainisi
Mark Vainisi
|
Director
|
March 5, 2020
|
79
TABLE OF CONTENTS
Part IItem 1. BusinessItem 1A. Risk FactorsItem 1B. Unresolved Staff CommentsItem 2. PropertiesItem 3. Legal ProceedingsItem 4. Mine Safety DisclosuresItem Not ApplicablePart IIItem 5. Market For Registrant S Common Equity, Related Stockholder Matters and Issuer Purchases Of Equity SecuritiesItem 6. Selected Financial DataItem 7. Management S Discussion and Analysis Of Financial Condition and Results Of OperationsItem 7A. Quantitative and Qualitative Disclosures About Market RiskItem 8. Financial Statements and Supplementary DataItem 9. Changes in and Disagreements with Accountants on Accounting and Financial DisclosureItem 9A. Controls and ProceduresItem 9B. Other InformationPart IIIItem 10. Directors, Executive Officers and Corporate GovernanceItem 11. Executive CompensationItem 12. Security Ownership Of Certain Beneficial Owners and Management and Related Stockholder MattersItem 13. Certain Relationships and Related Transactions, and Director IndependenceItem 14. Principal Accountant Fees and ServicesPart IVItem 15. Exhibits, Financial Statement SchedulesItem 16. Form 10-k Summary