ORCHID ISLAND CAPITAL, INC.
10-Ks and 10-Qs
|
|
|
|
|
|
|
|
|
|
|
|
|
|
|
|
|
|
|
|
|
|
|
|
|
|
|
|
|
|
|
|
|
|
|
|
|
|
|
|
|
|
|
|
UNITED STATES
SECURITIES AND EXCHANGE COMMISSION
Washington, D.C. 20549
FORM 10‑K
ANNUAL REPORT PURSUANT TO SECTION 13 OR 15(d) OF THE SECURITIES EXCHANGE ACT OF 1934
For the fiscal year ended December 31, 2017
Commission File Number
: 001-35236

Orchid Island Capital, Inc.
(Exact name of registrant as specified in its charter)
|
Maryland
|
27-3269228
|
|
|
(State or other jurisdiction of
incorporation or organization)
|
(I.R.S. Employer
Identification No.)
|
3305 Flamingo Drive, Vero Beach, Florida 32963
(Address of principal executive offices) (Zip Code)
(772) 231-1400
(Registrant's telephone number, including area code)
Securities registered pursuant to Section 12(b) of the Act:
|
Title of Each Class
|
Name of Each Exchange on Which Registered
|
|
Common Stock, $0.01 par value
|
New York Stock Exchange
|
Securities registered pursuant to Section 12(g) of the Act: None
Indicate by check mark if the registrant is a well-known seasoned issuer, as defined in Rule 405 of the Securities Act. Yes
☐
No
ý
Indicate by check mark if the registrant is not required to file reports pursuant to Section 13 or Section 15(d) of the Act. Yes
☐
No
ý
Indicate by check mark whether the registrant (1) has filed all reports required to be filed by Section 13 or 15(d) of the Securities Exchange Act of 1934 during the preceding 12 months (or for such shorter period that the registrant was required to file such reports), and (2) has been subject to such filing requirements for the past 90 days. Yes
ý
No
☐
Indicate by check mark whether the registrant has submitted electronically and posted on its corporate Web site, if any, every Interactive Data File required to be submitted and posted pursuant to Rule 405 of Regulation S-T (§232.405 of this chapter) during the preceding 12 months (or for such shorter period that the registrant was required to submit and post such files). Yes
ý
No
☐
Indicate by check mark if disclosure of delinquent filers pursuant to Item 405 of Regulation S‑K is not contained herein, and will not be contained, to the best of the registrant's knowledge, in definitive proxy or information statements incorporated by reference in Part III of this Form 10‑K or any amendment to this Form 10‑K.
☐
Indicate by check mark whether the registrant is a large accelerated filer, an accelerated filer, a non-accelerated filer or a smaller reporting company. See the definitions of "large accelerated filer," "accelerated filer," "smaller reporting company," and "emerging growth company" in Rule 12b‑2 of the Exchange Act.
Large accelerated filer
☐
Accelerated filer
ý
Non-accelerated filer
☐
Smaller reporting company
☐
Emerging growth company
ý
If an emerging growth company, indicate by check mark if the registrant has elected not to use the extended transition period for complying with any new or revised financial accounting standards provided pursuant to Section 13(a) of the Exchange Act.
ý
Indicate by check mark whether the registrant is a shell company (as defined in Rule 12b-2 of the Act). Yes
☐
No
ý
As of June 30, 2017 the aggregate market value of the common stock held by nonaffiliates was $430,417,877
Number of shares outstanding at February 14, 2018: 53,065,790
DOCUMENTS INCORPORATED BY REFERENCE:
Portions of the Registrant's definitive Proxy Statement, to be issued in connection with the 2018 Annual Meeting of Stockholders of the Registrant, are incorporated by reference into Part III of this Annual Report on Form 10-K.
ORCHID ISLAND CAPITAL, INC.
INDEX
|
Page
|
||||
|
PART I
|
||||
|
ITEM 1. Business.
|
2
|
|||
|
ITEM 1A. Risk Factors
|
12
|
|||
|
ITEM 1B. Unresolved Staff Comments.
|
41
|
|||
|
ITEM 2. Properties.
|
41
|
|||
|
ITEM 3. Legal Proceedings.
|
41
|
|||
|
ITEM 4. Mine Safety Disclosures.
|
41
|
|||
|
PART II
|
||||
|
ITEM 5. Market for Registrant's Common Equity, Related Stockholder Matters and Issuer Purchases of Equity Securities.
|
42
|
|||
|
ITEM 6. Selected Financial Data.
|
45
|
|||
|
ITEM 7. Management's Discussion and Analysis of Financial Condition and Results of Operations.
|
46
|
|||
|
ITEM 7A. Quantitative and Qualitative Disclosures About Market Risk.
|
71
|
|||
|
ITEM 8. Financial Statements and Supplementary Data.
|
75
|
|||
|
ITEM 9. Changes in and Disagreements with Accountants on Accounting and Financial Disclosure.
|
101
|
|||
|
ITEM 9A. Controls and Procedures.
|
101
|
|||
|
ITEM 9B. Other Information.
|
102
|
|||
|
PART III
|
||||
|
ITEM 10. Directors, Executive Officers and Corporate Governance.
|
105
|
|||
|
ITEM 11. Executive Compensation.
|
105
|
|||
|
ITEM 12. Security Ownership of Certain Beneficial Owners and Management and Related Stockholder Matters.
|
105
|
|||
|
ITEM 13. Certain Relationships and Related Transactions, and Director Independence.
|
105
|
|||
|
ITEM 14. Principal Accountant Fees and Services.
|
105
|
|||
|
PART IV
|
||||
|
ITEM 15. Exhibits, Financial Statement Schedules.
|
106
|
|||
SPECIAL NOTE REGARDING FORWARD-LOOKING STATEMENTS
We make forward-looking statements in this annual report that are subject to risks and uncertainties. These forward-looking statements include information about possible or assumed future results of our business, financial condition, liquidity, results of operations, plans and objectives. When we use the words "believe," "expect," "anticipate," "estimate," "intend," "should," "may," "plans," "projects," "will," or similar expressions, or the negative of these words, we intend to identify forward-looking statements. Statements regarding the following subjects are forward-looking by their nature:
|
·
|
our business and investment strategy;
|
|
·
|
our expected operating results;
|
|
·
|
our ability to acquire investments on attractive terms;
|
|
·
|
the effect of actual or proposed actions of the U.S. Federal Reserve (the "Fed") and the Federal Open Market Committee (the "FOMC") with respect to monetary policy or interest rates;
|
|
·
|
the effect of U.S. government actions on interest rates, fiscal policy and the housing and credit markets;
|
|
·
|
the effect of rising interest rates on unemployment, inflation and mortgage supply and demand;
|
|
·
|
the effect of increased prepayment rates on the value of our assets;
|
|
·
|
our ability to access the capital markets;
|
|
·
|
our ability to obtain future financing arrangements;
|
|
·
|
our ability to successfully hedge the interest rate risk and prepayment risk associated with our portfolio;
|
|
·
|
the federal conservatorship of Fannie Mae and Freddie Mac and related efforts, along with any changes in laws and regulations affecting the relationship between Fannie Mae and Freddie Mac and the U.S. Government;
|
|
·
|
our ability to make distributions to our stockholders in the future;
|
|
·
|
mortgage loan modification programs and future legislative action;
|
|
·
|
our understanding of our competition and our ability to compete effectively;
|
|
·
|
our ability to quantify risk based on historical experience;
|
|
·
|
our ability to qualify and maintain our qualification as a real estate investment trust, or REIT, for U.S. federal income tax purposes;
|
|
·
|
our ability to maintain our exemption from registration under the Investment Company Act of 1940, as amended, or the Investment Company Act;
|
|
·
|
our ability to maintain the listing of our common stock on the New York Stock Exchange, or NYSE;
|
|
·
|
market trends;
|
|
·
|
expected capital expenditures; and
|
|
·
|
the impact of technology on our operations and business.
|
The forward-looking statements are based on our beliefs, assumptions and expectations of our future performance, taking into account all information currently available to us. You should not place undue reliance on these forward-looking statements. These beliefs, assumptions and expectations can change as a result of many possible events or factors, not all of which are known to us. Some of these factors are described under the caption ''Risk Factors'' in this Annual Report on Form 10-K and any subsequent Quarterly Reports on Form 10-Q. If a change occurs, our business, financial condition, liquidity and results of operations may vary materially from those expressed in our forward-looking statements. Any forward-looking statement speaks only as of the date on which it is made. New risks and uncertainties arise from time to time, and it is impossible for us to predict those events or how they may affect us. Except as required by law, we are not obligated to, and do not intend to, update or revise any forward-looking statements, whether as a result of new information, future events or otherwise.
PART I
ITEM 1. BUSINESS
Our Company
Orchid Island Capital, Inc., a Maryland corporation ("Orchid," the "Company," "we" or "us"), is a specialty finance company that invests in residential mortgage-backed securities ("RMBS"). The principal and interest payments of these RMBS are guaranteed by the Federal National Mortgage Association ("Fannie Mae"), the Federal Home Loan Mortgage Corporation, ("Freddie Mac") or the Government National Mortgage Association ("Ginnie Mae" and, collectively with Fannie Mae and Freddie Mac, "GSEs") and are backed primarily by single-family residential mortgage loans. We refer to these types of RMBS as Agency RMBS. Our investment strategy focuses on, and our portfolio consists of, two categories of Agency RMBS: (i) traditional pass-through Agency RMBS and (ii) structured Agency RMBS, such as collateralized mortgage obligations ("CMOs"), interest only securities ("IOs"), inverse interest only securities ("IIOs") and principal only securities ("POs"), among other types of structured Agency RMBS. Our website is located at
http://www.orchidislandcapital.com
. Information on our website is not part of this Annual Report on Form 10-K.
We were formed by Bimini Capital Management, Inc. (sometimes referred to herein as "Bimini") in August 2010, commenced operations on November 24, 2010 and completed our initial public offering on February 20, 2013. On October 8, 2014, we transferred the listing of our common stock from the NYSE MKT to the New York Stock Exchange ("NYSE") and trade under the symbol "ORC."
Bimini managed our portfolio from our inception through the completion of our initial public offering on February 20, 2013. Upon completion of the offering, we became externally managed by Bimini Advisors, LLC ("Bimini Advisors," or our "Manager"). Our Manager is an investment advisor registered with the Securities and Exchange Commission ("SEC"). Additionally, our Manager is a wholly-owned subsidiary of Bimini, which has a long track record of managing investments in Agency RMBS.
We are organized and conduct our operations to qualify to be taxed as a real estate investment trust, or "REIT," for federal income tax purposes. As such, we are required to distribute 90% of our taxable net income annually. We generally will not be subject to income taxes on our net taxable income to the extent we currently distribute our net taxable income to our stockholders and maintain our REIT qualification.
It is our intention to distribute 100% of our taxable net income, after application of available tax attributes, within the limits prescribed by the Internal Revenue Code of 1986, as amended (the "Code"), which may extend into the subsequent taxable year.
We are an "emerging growth company," as defined in the Jumpstart Our Business Startups Act of 2012 (the "JOBS Act"), and as such, we are not required to comply with the auditor attestation requirements of Section 404 of the Sarbanes-Oxley Act of 2002 (the "Sarbanes-Oxley Act"), we have reduced disclosure obligations regarding executive compensation in our periodic reports and proxy statements, and we are exempt from the requirements of holding a nonbinding advisory vote on executive compensation and stockholder approval of any golden parachute payments not previously approved. Although we are an emerging growth company under the JOBS Act, we have elected to opt out of the extended transition period for complying with new or revised accounting standards, and such election is irrevocable.
2
Our Manager
Upon completion of our initial public offering, we became externally managed and advised by Bimini Advisors and its experienced RMBS investment team pursuant to the terms of a management agreement. Our Manager is a Maryland limited liability company that is a wholly-owned subsidiary of Bimini. We believe our relationship with our Manager enables us to leverage our Manager's established portfolio management resources for each of our targeted asset classes and its infrastructure supporting those resources. Additionally, we have benefitted and expect to continue to benefit from our Manager's finance and administration functions, which address legal, compliance, investor relations and operational matters, including portfolio management, trade allocation and execution, securities valuation, risk management and information technologies in connection with the performance of its duties. Our Manager's parent, Bimini, commenced active investment management operations in 2003, as it self-manages its own portfolio.
Our Manager is responsible for administering our business activities and day-to-day operations. Pursuant to the terms of the management agreement, our Manager provides us with our management team, including our officers, along with appropriate support personnel. Our Manager is at all times subject to the supervision and oversight of our board of directors (the "Board of Directors") and has only such functions and authority as we delegate to it.
Our Investment and Capital Allocation Strategy
Investment Strategy
Our business objective is to provide attractive risk-adjusted total returns to our investors over the long term through a combination of capital appreciation and the payment of regular monthly distributions. We intend to achieve this objective by investing in and strategically allocating capital between pass-through Agency RMBS and structured Agency RMBS. We seek to generate income from (i) the net interest margin on our leveraged pass-through Agency RMBS portfolio and the leveraged portion of our structured Agency RMBS portfolio, and (ii) the interest income we generate from the unleveraged portion of our structured Agency RMBS portfolio. We also seek to minimize the volatility of both the net asset value of, and income from, our portfolio through a process which emphasizes capital allocation, asset selection, liquidity and active interest rate risk management.
We fund our pass-through Agency RMBS and certain of our structured Agency RMBS, such as fixed and floating rate tranches of CMOs and POs, through repurchase agreements. However, we generally do not employ leverage on our structured Agency RMBS that have no principal balance, such as IOs and IIOs. We may pledge a portion of these assets to increase our cash balance, but we do not intend to invest the cash derived from pledging the assets. Otherwise, we do not use leverage in these instances because the securities contain structural leverage.
Our target asset categories and principal assets in which we intend to invest are as follows:
Pass-through Agency RMBS
We invest in pass-through securities, which are securities secured by residential real property in which payments of both interest and principal on the securities are generally made monthly. In effect, these securities pass through the monthly payments made by the individual borrowers on the mortgage loans that underlie the securities, net of fees paid to the issuer or guarantor of the securities. Pass-through certificates can be divided into various categories based on the characteristics of the underlying mortgages, such as the term or whether the interest rate is fixed or variable.
The payment of principal and interest on mortgage pass-through securities issued by Ginnie Mae, but not the market value, is guaranteed by the full faith and credit of the federal government. Payment of principal and interest on mortgage pass-through certificates issued by Fannie Mae and Freddie Mac, but not the market value, is guaranteed by the respective agency issuing the security.
3
A key feature of most mortgage loans is the ability of the borrower to repay principal earlier than scheduled. This is called a prepayment. Prepayments arise primarily due to sale of the underlying property, refinancing or foreclosure. Prepayments result in a return of principal to pass-through certificate holders. This may result in a lower or higher rate of return upon reinvestment of principal. This is generally referred to as prepayment uncertainty. If a security purchased at a premium prepays at a higher-than-expected rate, then the value of the premium would be eroded at a faster-than-expected rate. Similarly, if a discount mortgage prepays at a lower-than-expected rate, the amortization towards par would be accumulated at a slower-than-expected rate. The possibility of these undesirable effects is sometimes referred to as "prepayment risk."
In general, declining interest rates tend to increase prepayments, and rising interest rates tend to slow prepayments. Like other fixed-income securities, when interest rates rise, the value of Agency RMBS generally declines. The rate of prepayments on underlying mortgages will affect the price and volatility of Agency RMBS and may shorten or extend the effective maturity of the security beyond what was anticipated at the time of purchase. If interest rates rise, our holdings of Agency RMBS may experience reduced spreads over our funding costs if the borrowers of the underlying mortgages pay off their mortgages later than anticipated. This is generally referred to as "extension risk."
The mortgage loans underlying pass-through certificates can generally be classified into the following three categories:
|
·
|
Fixed-Rate Mortgages
.
Fixed-rate mortgages are those where the borrower pays an interest rate that is constant throughout the term of the loan. Traditionally, most fixed-rate mortgages have an original term of 30 years. However, shorter terms (also referred to as "final maturity dates") have become common in recent years. Because the interest rate on the loan never changes, even when market interest rates change, there can be a divergence between the interest rate on the loan and current market interest rates over time. This in turn can make fixed-rate mortgages price-sensitive to market fluctuations in interest rates. In general, the longer the remaining term on the mortgage loan, the greater the price sensitivity to movements in interest rates and, therefore, the likelihood for greater price variability.
|
|
·
|
ARMs
. Adjustable-Rate Mortgages ("ARMs") are mortgages for which the borrower pays an interest rate that varies over the term of the loan. The interest rate usually resets based on market interest rates, although the adjustment of such an interest rate may be subject to certain limitations. Traditionally, interest rate resets occur at regular intervals (for example, once per year). We refer to such ARMs as "traditional" ARMs. Because the interest rates on ARMs fluctuate based on market conditions, ARMs tend to have interest rates that do not deviate from current market rates by a large amount. This in turn can mean that ARMs have less price sensitivity to interest rates and, consequently, are less likely to experience significant price volatility.
|
|
·
|
Hybrid Adjustable-Rate Mortgages
.
Hybrid ARMs have a fixed-rate for the first few years of the loan, often three, five, seven or ten years, and thereafter reset periodically like a traditional ARM. Effectively, such mortgages are hybrids, combining the features of a pure fixed-rate mortgage and a traditional ARM. Hybrid ARMs have price sensitivity to interest rates similar to that of a fixed-rate mortgage during the period when the interest rate is fixed and similar to that of an ARM when the interest rate is in its periodic reset stage. However, because many hybrid ARMs are structured with a relatively short initial time span during which the interest rate is fixed, even during that segment of its existence, the price sensitivity may be high.
|
Structured Agency RMBS
We also invest in structured Agency RMBS, which include CMOs, IOs, IIOs and POs. The payment of principal and interest, as appropriate, on structured Agency RMBS issued by Ginnie Mae, but not the market value, is guaranteed by the full faith and credit of the federal government. Payment of principal and interest, as appropriate, on structured Agency RMBS issued by Fannie Mae and Freddie Mac, but not the market value, is guaranteed by the respective agency issuing the security. The types of structured Agency RMBS in which we invest are described below.
4
|
·
|
CMOs
. CMOs are a type of RMBS, the principal and interest of which are paid, in most cases, on a monthly basis. CMOs may be collateralized by whole mortgage loans, but are more typically collateralized by portfolios of mortgage pass-through securities issued directly by or under the auspices of Ginnie Mae, Freddie Mac or Fannie Mae. CMOs are structured into multiple classes, with each class bearing a different stated maturity. Monthly payments of principal, including prepayments, are first returned to investors holding the shortest maturity class. Investors holding the longer maturity classes receive principal only after the first class has been retired. Generally, fixed-rate mortgages are used to collateralize CMOs. However, the CMO tranches need not all have fixed-rate coupons. Some CMO tranches have floating rate coupons that adjust based on market interest rates, subject to some limitations. Such tranches, often called "CMO floaters," can have relatively low price sensitivity to interest rates.
|
|
·
|
IOs
. IOs represent the stream of interest payments on a pool of mortgages, either fixed-rate mortgages or hybrid ARMs. Holders of IOs have no claim to any principal payments. The value of IOs depends primarily on two factors, which are prepayments and interest rates. Prepayments on the underlying pool of mortgages reduce the stream of interest payments going forward, hence IOs are highly sensitive to prepayment rates. IOs are also sensitive to changes in interest rates. An increase in interest rates reduces the present value of future interest payments on a pool of mortgages. On the other hand, an increase in interest rates has a tendency to reduce prepayments, which increases the expected absolute amount of future interest payments.
|
|
·
|
IIOs
. IIOs represent the stream of interest payments on a pool of mortgages, either fixed-rate mortgages or hybrid ARMs. Holders of IIOs have no claim to any principal payments. The value of IIOs depends primarily on three factors, which are prepayments, the London Interbank Offered Rate ("LIBOR") and term interest rates. Prepayments on the underlying pool of mortgages reduce the stream of interest payments, making IIOs highly sensitive to prepayment rates. The coupon on IIOs is derived from both the coupon interest rate on the underlying pool of mortgages and 30-day LIBOR. IIOs are typically created in conjunction with a floating rate CMO that has a principal balance and which is entitled to receive all of the principal payments on the underlying pool of mortgages. The coupon on the floating rate CMO is also based on 30-day LIBOR. Typically, the coupon on the floating rate CMO and the IIO, when combined, equal the coupon on the pool of underlying mortgages. The coupon on the pool of underlying mortgages typically represents a cap or ceiling on the combined coupons of the floating rate CMO and the IIO. Accordingly, when the value of 30-day LIBOR increases, the coupon of the floating rate CMO will increase and the coupon on the IIO will decrease. When the value of 30-day LIBOR falls, the opposite is true. Accordingly, the value of IIOs are sensitive to the level of 30-day LIBOR and expectations by market participants of future movements in the level of 30-day LIBOR. IIOs are also sensitive to changes in interest rates. An increase in interest rates reduces the present value of future interest payments on a pool of mortgages. On the other hand, an increase in interest rates has a tendency to reduce prepayments, which increases the expected absolute amount of future interest payments.
|
|
·
|
POs
. POs represent the stream of principal payments on a pool of mortgages. Holders of POs have no claim to any interest payments, although the ultimate amount of principal to be received over time is known, equaling the principal balance of the underlying pool of mortgages. The timing of the receipt of the principal payments is not known. The value of POs depends primarily on two factors, which are prepayments and interest rates. Prepayments on the underlying pool of mortgages accelerate the stream of principal repayments, making POs highly sensitive to the rate at which the mortgages in the pool are prepaid. POs are also sensitive to changes in interest rates. An increase in interest rates reduces the present value of future principal payments on a pool of mortgages. Further, an increase in interest rates has a tendency to reduce prepayments, which decelerates, or pushes further out in time, the ultimate receipt of the principal payments. The opposite is true when interest rates decline.
|
Our investment strategy consists of the following components:
|
·
|
investing in pass-through Agency RMBS and certain structured Agency RMBS, such as fixed and floating rate tranches of CMOs and POs, on a leveraged basis to increase returns on the capital allocated to this portfolio;
|
|
·
|
investing in certain structured Agency RMBS, such as IOs and IIOs, generally on an unleveraged basis in order to (i) increase returns due to the structural leverage contained in such securities, (ii) enhance liquidity due to the fact that these securities will be unencumbered or, when encumbered, retain the cash from such borrowings and (iii) diversify portfolio interest rate risk due to the different interest rate sensitivity these securities have compared to pass-through Agency RMBS;
|
|
·
|
investing in Agency RMBS in order to minimize credit risk;
|
|
·
|
investing in assets that will cause us to maintain our exclusion from regulation as an investment company under the Investment Company Act; and
|
|
·
|
investing in assets that will allow us to qualify and maintain our qualification as a REIT.
|
5
We rely on our Manager's expertise in identifying assets within our target asset class. Our Manager makes investment decisions based on various factors, including, but not limited to, relative value, expected cash yield, supply and demand, costs of hedging, costs of financing, liquidity requirements, expected future interest rate volatility and the overall shape of the U.S. Treasury and interest rate swap yield curves. We do not attribute any particular quantitative significance to any of these factors, and the weight we give to these factors depends on market conditions and economic trends.
Over time, we will modify our investment strategy as market conditions change to seek to maximize the returns from our investment portfolio. We believe that this strategy, combined with our Manager's experience, will enable us to provide attractive long-term returns to our stockholders.
Capital Allocation Strategy
The percentage of capital invested in our two asset categories will vary and will be managed in an effort to maintain the level of income generated by the combined portfolios, the stability of that income stream and the stability of the value of the combined portfolios. Typically, pass-through Agency RMBS and structured Agency RMBS exhibit materially different sensitivities to movements in interest rates. Declines in the value of one portfolio may be offset by appreciation in the other, although we cannot assure you that this will be the case. Additionally, our Manager will seek to maintain adequate liquidity as it allocates capital.
We allocate our capital to assist our interest rate risk management efforts. The unleveraged portfolio does not require unencumbered cash or cash equivalents to be maintained in anticipation of possible margin calls. To the extent more capital is deployed in the unleveraged portfolio, our liquidity needs will generally be less.
During periods of rising interest rates, refinancing opportunities available to borrowers typically decrease because borrowers are not able to refinance their current mortgage loans with new mortgage loans at lower interest rates. In such instances, securities that are highly sensitive to refinancing activity, such as IOs and IIOs, typically increase in value. Our capital allocation strategy allows us to redeploy our capital into such securities when and if we believe interest rates will be higher in the future, thereby allowing us to hold securities, the value of which we believe is likely to increase as interest rates rise. Also, by being able to re-allocate capital into structured Agency RMBS, such as IOs, during periods of rising interest rates, we may be able to offset the likely decline in the value of our pass-through Agency RMBS, which are negatively impacted by rising interest rates.
We intend to operate in a manner that will not subject us to regulation under the Investment Company Act. In order to rely on the exemption provided by Section 3(c)(5)(C) under the Investment Company Act, we must maintain at least 55% of our assets in qualifying real estate assets. For purposes of this test, structured Agency RMBS are non-qualifying real estate assets. Accordingly, while we have no explicit limitation on the amount of our capital that we will deploy to the unleveraged structured Agency RMBS portfolio, we will deploy our capital in such a way so as to maintain our exemption from registration under the Investment Company Act.
6
Financing Strategy
We borrow against our Agency RMBS using short term repurchase agreements. We may use other sources of leverage, such as secured or unsecured debt or issuances of preferred stock. We do not have a policy limiting the amount of leverage we may incur. However, we generally expect that the ratio of our total liabilities compared to our equity, which we refer to as our leverage ratio, will be less than 12 to 1. Our amount of leverage may vary depending on market conditions and other factors that we deem relevant.
We allocate our capital between two sub-portfolios. The pass-through Agency RMBS portfolio will be leveraged generally through repurchase agreement funding. The structured Agency RMBS portfolio generally will not be leveraged. The leverage ratio is calculated by dividing our total liabilities by total stockholders' equity at the end of each period. The amount of leverage will be a function of the capital allocated to the pass-through Agency RMBS portfolio and the amount of haircuts required by our lenders on our borrowings. When the capital allocation to the pass-through Agency RMBS portfolio is high, the leverage ratio will be high since more capital is being explicitly leveraged and less capital is un-leveraged. If the haircuts, which are a percentage of the market value of the collateral pledged, required by our lenders on our borrowings are higher, all else being equal, our leverage will be lower since our lenders will lend less against the value of the capital deployed to the pass-through Agency RMBS portfolio. The allocation of capital between the two portfolios will be a function of several factors:
|
·
|
The relative durations of the respective portfolios — We generally seek to have a combined duration at or near zero. If our pass-through securities have a longer duration, we will allocate more capital to the structured security portfolio to achieve a combined duration close to zero.
|
|
·
|
The relative attractiveness of pass-through securities versus structured securities — To the extent we believe the expected returns of one type of security are higher than the other, we will allocate more capital to the more attractive securities, subject to the caveat that its combined duration remains at or near zero.
|
|
·
|
Liquidity — We seek to maintain adequate cash and unencumbered securities relative to our repurchase agreement borrowings to ensure we can meet any price or prepayment related margin calls from our lenders. To the extent we feel price or prepayment related margin calls will be higher/lower, we will allocate less/more capital to the pass-through Agency RMBS portfolio. Our pass-through Agency RMBS portfolio likely will be our only source of price or prepayment related margin calls because we generally will not apply leverage to our structured Agency RMBS portfolio. From time to time we may pledge a portion of our structured securities and retain the cash derived so it can be used to enhance our liquidity.
|
Risk Management
We invest in Agency RMBS to mitigate credit risk. Additionally, our Agency RMBS are backed by a diversified base of mortgage loans to mitigate geographic, loan originator and other types of concentration risks.
Interest Rate Risk Management
We believe that the risk of adverse interest rate movements represents the most significant risk to our portfolio. This risk arises because (i) the interest rate indices used to calculate the interest rates on the mortgages underlying our assets may be different from the interest rate indices used to calculate the interest rates on the related borrowings and (ii) interest rate movements affecting our borrowings may not be reasonably correlated with interest rate movements affecting our assets. We attempt to mitigate our interest rate risk by using the techniques described below:
7
Agency RMBS Backed by ARMs
. We seek to minimize the differences between interest rate indices and interest rate adjustment periods of our Agency RMBS backed by ARMs and related borrowings. At the time of funding, we typically align (i) the underlying interest rate index used to calculate interest rates for our Agency RMBS backed by ARMs and the related borrowings and (ii) the interest rate adjustment periods for our Agency RMBS backed by ARMs and the interest rate adjustment periods for our related borrowings. As our borrowings mature or are renewed, we may adjust the index used to calculate interest expense, the duration of the reset periods and the maturities of our borrowings.
Agency RMBS Backed by Fixed-Rate Mortgages
. As interest rates rise, our borrowing costs increase; however, the income on our Agency RMBS backed by fixed-rate mortgages remains unchanged. Subject to qualifying and maintaining a qualification as a REIT, we may seek to limit increases to our borrowing costs through the use of interest rate swap or cap agreements, options, put or call agreements, futures contracts, forward rate agreements or similar financial instruments to effectively convert our floating-rate borrowings into fixed-rate borrowings.
Agency RMBS Backed by Hybrid ARMs
. During the fixed-rate period of our Agency RMBS backed by hybrid ARMs, the security is similar to Agency RMBS backed by fixed-rate mortgages. During this period, subject to qualifying and maintaining a qualification as a REIT, we may employ the same hedging strategy that we employ for our Agency RMBS backed by fixed-rate mortgages. Once our Agency RMBS backed by hybrid ARMs convert to floating rate securities, we may employ the same hedging strategy as we employ for our Agency RMBS backed by ARMs.
Derivative Instruments.
We enter into derivative instruments to economically hedge against the possibility that rising rates may adversely impact our repurchase agreement liabilities.
The principal instruments that the Company has used to date are Eurodollar and Treasury Note ("T-Note") futures contracts, interest rate swaps, and options to enter into interest rate swaps ("interest rate swaptions"), but we may enter into other transactions in the future.
A futures contract is a legally binding agreement to buy or sell a commodity or financial instrument in a designated future month at a price agreed upon at the initiation of the contract by the buyer and seller. A futures contract differs from an option in that an option gives one of the counterparties a right, and the other an obligation, to buy or sell, while a futures contract represents an obligation of both counterparties to buy or sell a commodity or financial instrument, with one party typically paying a fixed interest rate and the other paying a floating interest rate.
We engage in interest rate swaps as a means of managing our interest rate risk on forecasted interest expense associated with repurchase agreement borrowings for the term of the swap contract. An interest rate swap is a contractual agreement entered into by two counterparties, under which each agrees to make periodic payments to the other for an agreed period of time based upon a notional amount of principal.
Interest rate swaptions provide us the option to enter into an interest rate swap agreement for a predetermined notional amount, stated term and pay and receive interest rates in the future. We may enter into swaption agreements that provide us the option to enter into a pay fixed rate interest rate swap ("payer swaption"), or swaption agreements that provide us the option to enter into a receive fixed interest rate swap ("receiver swaptions").
Additionally, our structured Agency RMBS generally exhibit sensitivities to movements in interest rates different than our pass-through Agency RMBS. To the extent they do so, our structured Agency RMBS may protect us against declines in the market value of our combined portfolio that result from adverse interest rate movements, although we cannot assure you that this will be the case.
8
We purchase a portion of our Agency RMBS through forward settling transactions, including "to-be-announced" ("TBA") securities transactions. We account for TBA securities as derivative instruments if either the TBA securities do not settle in the shortest period of time possible or if we cannot assert that it is probable at the inception of the TBA transaction, and throughout its term, that we will take physical delivery
of the Agency RMBS for a long position, or make delivery of the Agency RMBS for a short position, upon settlement of the trade.
Prepayment Risk Management
The risk of mortgage prepayments is another significant risk to our portfolio. When prevailing interest rates fall below the current interest rate of a mortgage, mortgage prepayments are likely to increase. Conversely, when prevailing interest rates increase above the coupon rate of a mortgage, mortgage prepayments are likely to decrease.
When prepayment rates increase, we may not be able to reinvest the money received from prepayments at yields comparable to those of the securities prepaid. Also, some ARMs and hybrid ARMs which back our Agency RMBS may bear initial "teaser" interest rates that are lower than their fully-indexed interest rates. If these mortgages are prepaid during this "teaser" period, we may lose the opportunity to receive interest payments at the higher, fully-indexed rate over the expected life of the security. Additionally, some of our structured Agency RMBS, such as IOs and IIOs, may be negatively affected by an increase in prepayment rates because their value is wholly contingent on the underlying mortgage loans having an outstanding principal balance.
A decrease in prepayment rates may also have an adverse effect on our portfolio. For example, if we invest in POs, the purchase price of such securities will be based, in part, on an assumed level of prepayments on the underlying mortgage loan. Because the returns on POs decrease the longer it takes the principal payments on the underlying loans to be paid, a decrease in prepayment rates could decrease our returns on these securities.
Prepayment risk also affects our hedging activities. When an Agency RMBS backed by a fixed-rate mortgage or hybrid ARM is acquired with borrowings, we may cap or fix our borrowing costs for a period close to the anticipated average life of the fixed-rate portion of the related Agency RMBS. If prepayment rates are different than our projections, the term of the related hedging instrument may not match the fixed-rate portion of the security, which could cause us to incur losses.
Because our business may be adversely affected if prepayment rates are different than our projections, we seek to invest in Agency RMBS backed by mortgages with well-documented and predictable prepayment histories. To protect against increases in prepayment rates, we invest in Agency RMBS backed by mortgages that we believe are less likely to be prepaid. For example, we invest in Agency RMBS backed by mortgages (i) with loan balances low enough such that a borrower would likely have little incentive to refinance, (ii) extended to borrowers with credit histories weak enough to not be eligible to refinance their mortgage loans, (iii) that are newly originated fixed-rate or hybrid ARMs or (iv) that have interest rates low enough such that a borrower would likely have little incentive to refinance. To protect against decreases in prepayment rates, we may also invest in Agency RMBS backed by mortgages with characteristics opposite to those described above, which would typically be more likely to be refinanced. We may also invest in certain types of structured Agency RMBS as a means of mitigating our portfolio-wide prepayment risks. For example, certain tranches of CMOs are less sensitive to increases in prepayment rates, and we may invest in those tranches as a means of hedging against increases in prepayment rates.
Liquidity Management Strategy
Because of our use of leverage, we manage liquidity to meet our lenders' margin calls by maintaining cash balances or unencumbered assets well in excess of anticipated margin calls and making margin calls on our lenders when we have an excess of collateral pledged against our borrowings.
9
We also attempt to minimize the number of margin calls we receive by:
|
·
|
Deploying capital from our leveraged Agency RMBS portfolio to our unleveraged Agency RMBS portfolio;
|
|
·
|
Investing in Agency RMBS backed by mortgages that we believe are less likely to be prepaid to decrease the risk of excessive margin calls when monthly prepayments are announced. Prepayments are declared, and the market value of the related security declines, before the receipt of the related cash flows. Prepayment declarations give rise to a temporary collateral deficiency and generally result in margin calls by lenders;
|
|
·
|
Obtaining funding arrangements which defer or waive prepayment-related margin requirements in exchange for payments to the lender tied to the dollar amount of the collateral deficiency and a predetermined interest rate; and
|
|
·
|
Reducing our overall amount of leverage.
|
To the extent we are unable to adequately manage our interest rate exposure and are subjected to substantial margin calls, we may be forced to sell assets at an inopportune time, which in turn could impair our liquidity and reduce our borrowing capacity and book value.
Tax Structure
We have elected to be taxed as a REIT for U.S. federal income tax purposes. Our qualification as a REIT, and the maintenance of such qualification, will depend upon our ability to meet, on a continuing basis, various complex requirements under the Code relating to, among other things, the sources of our gross income, the composition and values of our assets, our distribution levels and the concentration of ownership of our capital stock. We believe that we have been organized and have operated in conformity with the requirements for qualification and taxation as a REIT under the Code, and we intend to continue to operate in a manner that will enable us to continue to meet the requirements for qualification and taxation as a REIT.
As a REIT, we generally will not be subject to U.S. federal income tax on the REIT taxable income that we currently distribute to our stockholders. Taxable income generated by any taxable REIT subsidiary ("TRS") that we may form or acquire will be subject to U.S. federal, state and local income tax. Under the Code, REITs are subject to numerous organizational and operational requirements, including a requirement that they distribute annually at least 90% of their REIT taxable income, determined without regard to the deduction for dividends paid and excluding any net capital gains. If we fail to qualify as a REIT in any calendar year and do not qualify for certain statutory relief provisions, our income would be subject to U.S. federal income tax, and we would likely be precluded from qualifying for treatment as a REIT until the fifth calendar year following the year in which we failed to qualify. Even if we continue to qualify as a REIT, we may still be subject to certain U.S. federal, state and local taxes on our income and assets and to U.S. federal income and excise taxes on our undistributed income.
Investment Company Act Exemption
We operate our business so that we are exempt from registration under the Investment Company Act. We rely on the exemption provided by Section 3(c)(5)(C) of the Investment Company Act, which applies to companies in the business of purchasing or otherwise acquiring mortgages and other liens on, and interests in, real estate. In order to rely on the exemption provided by Section 3(c)(5)(C), we must maintain at least 55% of our assets in qualifying real estate assets. For the purposes of this test, structured Agency RMBS are non-qualifying real estate assets. We monitor our portfolio continuously and prior to each investment to confirm that we continue to qualify for the exemption. To qualify for the exemption, we make investments so that at least 55% of the assets we own consist of qualifying mortgages and other liens on and interests in real estate, which we refer to as qualifying real estate assets, and so that at least 80% of the assets we own consist of real estate-related assets, including our qualifying real estate assets.
10
We treat whole-pool pass-through Agency RMBS as qualifying real estate assets based on no-action letters issued by the staff of the SEC. In August 2011, the SEC, through a concept release, requested comments on interpretations of Section 3(c)(5)(C). To the extent that the SEC or its staff publishes new or different guidance with respect to these matters, we may fail to qualify for this exemption. Our Manager manages our pass-through Agency RMBS portfolio such that we have sufficient whole-pool pass-through Agency RMBS to ensure we maintain our exemption from registration under the Investment Company Act. At present, we generally do not expect that our investments in structured Agency RMBS will constitute qualifying real estate assets but will constitute real estate-related assets for purposes of the Investment Company Act.
Employees
We have no employees. We are externally managed and advised by our Manager pursuant to a management agreement as discussed below.
Competition
Our net income largely depends on our ability to acquire Agency RMBS at favorable spreads over our borrowing costs. When we invest in Agency RMBS and other investment assets, we compete with a variety of institutional investors, including other REITs, insurance companies, mutual funds, pension funds, investment banking firms, banks and other financial institutions that invest in the same types of assets, the Federal Reserve Bank and other governmental entities or government-sponsored entities. Many of these investors have greater financial resources and access to lower costs of capital than we do. The existence of these competitive entities, as well as the possibility of additional entities forming in the future, may increase the competition for the acquisition of mortgage related securities, resulting in higher prices and lower yields on assets.
Distributions
To maintain a qualification as a REIT, we must distribute substantially all of our REIT taxable income (as defined in the Code) to our stockholders for each year. We plan to continue to declare and pay regular monthly dividends to our stockholders.
Available Information
Our investor relations website is www.orchidislandcapital.com. We make available on the website under "Financial Information/SEC filings," free of charge, our annual report on Form 10-K, our quarterly reports on Form 10-Q, our current reports on Form 8-K and any other reports (including any amendments to such reports) as soon as reasonably practicable after we electronically file or furnish such materials to the SEC. Information on our website, however, is not part of this Annual Report on Form 10-K. All reports filed with the SEC may also be read and copied at the SEC's public reference room at 100 F Street, N.E., Washington, D.C. 20549. Further information regarding the operation of the public reference room may be obtained by calling 1-800-SEC-0330. In addition, all of our filed reports can be obtained at the SEC's website at www.sec.gov.
11
ITEM 1A.
RISK FACTORS
You should carefully consider the risks described below and all other information contained in this Annual Report on Form 10-K, including our annual consolidated financial statements and related notes thereto, before making an investment decision regarding our common stock. Our business, financial condition or results of operations could be harmed by any of these risks. Similarly, these risks could cause the market price of our common stock to decline and you might lose all or part of your investment. Our forward-looking statements in this annual report are subject to the following risks and uncertainties. Our actual results could differ materially from those anticipated by our forward-looking statements as a result of the risk factors below.
Risks Related to Our Business
Increases in interest rates may negatively affect the value of our investments and increase the cost of our borrowings, which could result in reduced earnings or losses and materially adversely affect our ability to pay distributions to our stockholders.
Under a normal yield curve, an investment in Agency RMBS will decline in value if interest rates increase. In addition, net interest income could decrease if the yield curve becomes inverted or flat. While Fannie Mae, Freddie Mac or Ginnie Mae guarantee the principal and interest payments related to the Agency RMBS we own, this guarantee does not protect us from declines in market value caused by changes in interest rates. Declines in the market value of our investments may ultimately result in losses to us, which may reduce earnings and negatively affect our ability to pay distributions to our stockholders.
Significant increases in both long-term and short-term interest rates pose a substantial risk associated with our investment in Agency RMBS. If long-term rates were to increase significantly, the market value of our Agency RMBS would decline, and the duration and weighted average life of the investments would increase. We could realize a loss if the securities were sold. At the same time, an increase in short-term interest rates would increase the amount of interest owed on our repurchase agreements used to finance the purchase of Agency RMBS, which would decrease cash available for distribution to our stockholders. Using this business model, we are particularly susceptible to the effects of an inverted yield curve, where short-term rates are higher than long-term rates. Although rare in a historical context, many countries in Europe have experienced inverted yield curves in recent months. Given the volatile nature of the U.S. economy and the Federal Reserve's recent increase and probable future increases in short-term interest rates, there can be no guarantee that the yield curve will not become and/or remain inverted. If this occurs, it could result in a decline in the value of our Agency RMBS, our business, financial position and results of operations and our ability to pay distributions to our stockholders could be materially adversely affected.
An increase in interest rates may also cause a decrease in the volume of newly issued, or investor demand for, Agency RMBS, which could materially adversely affect our ability to acquire assets that satisfy our investment objectives and our business, financial condition and results of operations and our ability to pay distributions to our stockholders.
Rising interest rates generally reduce the demand for consumer credit, including mortgage loans, due to the higher cost of borrowing. A reduction in the volume of mortgage loans may affect the volume of Agency RMBS available to us, which could affect our ability to acquire assets that satisfy our investment objectives. Rising interest rates may also cause Agency RMBS that were issued prior to an interest rate increase to provide yields that exceed prevailing market interest rates. If rising interest rates cause us to be unable to acquire a sufficient volume of Agency RMBS or Agency RMBS with a yield that exceeds our borrowing costs, our ability to satisfy our investment objectives and to generate income and pay dividends, our business, financial condition and results of operations, and our ability to pay distributions to our stockholders may be materially adversely affected.
12
Interest rate mismatches between our Agency RMBS and our borrowings may reduce our net interest margin during periods of changing interest rates, which could materially adversely affect our business, financial condition and results of operations and our ability to pay distributions to our stockholders.
Our portfolio includes Agency RMBS backed by ARMs, hybrid ARMs and fixed-rate mortgages, and the mix of these securities in the portfolio may be increased or decreased over time. Additionally, the interest rates on ARMs and hybrid ARMs may vary over time based on changes in a short-term interest rate index, of which there are many.
We finance our acquisitions of pass-through Agency RMBS with short-term financing. During periods of rising short-term interest rates, the income we earn on these securities will not change (with respect to Agency RMBS backed by fixed-rate mortgage loans) or will not increase at the same rate (with respect to Agency RMBS backed by ARMs and hybrid ARMs) as our related financing costs, which may reduce our net interest margin or result in losses.
We invest in structured Agency RMBS, including CMOs, IOs, IIOs and POs. Although structured Agency RMBS are generally subject to the same risks as our pass-through Agency RMBS, certain types of risks may be enhanced depending on the type of structured Agency RMBS in which we invest.
The structured Agency RMBS in which we invest are securitizations (i) issued by Fannie Mae, Freddie Mac or Ginnie Mae, (ii) collateralized by Agency RMBS and (iii) divided into various tranches that have different characteristics (such as different maturities or different coupon payments). These securities may carry greater risk than an investment in pass-through Agency RMBS. For example, certain types of structured Agency RMBS, such as IOs, IIOs and POs, are more sensitive to prepayment risks than pass-through Agency RMBS. If we were to invest in structured Agency RMBS that were more sensitive to prepayment risks relative to other types of structured Agency RMBS or pass-through Agency RMBS, we may increase our portfolio-wide prepayment risk.
Differences in the stated maturity of our fixed rate assets, or in the timing of interest rate adjustments on our adjustable-rate assets, and our borrowings may adversely affect our profitability.
We rely primarily on short-term and/or variable rate borrowings to acquire fixed-rate securities with long-term maturities. In addition, we may have adjustable-rate assets with interest rates that vary over time based upon changes in an objective index, such as LIBOR or the U.S. Treasury rate. These indices generally reflect short-term interest rates but these assets may not reset in a manner that matches our borrowings.
The relationship between short-term and longer-term interest rates is often referred to as the "yield curve." Ordinarily, short-term interest rates are lower than longer-term interest rates. If short-term interest rates rise disproportionately relative to longer-term interest rates (a "flattening" of the yield curve), our borrowing costs may increase more rapidly than the interest income earned on our assets. Because our investments generally bear interest at longer-term rates than we pay on our borrowings, a flattening of the yield curve would tend to decrease our net interest income and the market value of our investment portfolio. Additionally, to the extent cash flows from investments that return scheduled and unscheduled principal are reinvested, the spread between the yields on the new investments and available borrowing rates may decline, which would likely decrease our net income. It is also possible that short-term interest rates may exceed longer-term interest rates (a yield curve "inversion"), in which event, our borrowing costs may exceed our interest income and we could incur operating losses and our ability to make distributions to our stockholders could be adversely affected.
13
We cannot predict the impact, if any, on our earnings or cash available for distributions to our stockholders of the proposed revisions of the Federal Housing Finance Agency ("FHFA") to Fannie Mae's, Freddie Mac's and Ginnie Mae's existing infrastructures to align the standards and practices of these entities.
On February 21, 2012, the FHFA released its
Strategic Plan for Enterprise Conservatorships
, which set forth three objectives for the next phase of the Fannie Mae and Freddie Mac conservatorships: (i) build a new infrastructure for the secondary mortgage market, (ii) gradually contract Fannie Mae and Freddie Mac's presence in the marketplace while simplifying and shrinking their operations, and (iii) maintain foreclosure prevention activities and credit availability for new and refinanced mortgages. On October 4, 2012, the FHFA released its white paper entitled
Building a New Infrastructure for the Secondary Mortgage Market
, which proposes a new Fannie Mae and Freddie Mac infrastructure built around two principles.
First, replace Fannie Mae and Freddie Mac's current infrastructures with a common infrastructure that efficiently aligns the standards and practices of the two entities, beginning with overlapping core functions such as issuance, master servicing, bond administration, collateral management and data integration. The FHFA has taken steps to establish a common securitization platform ("CSP") for residential mortgage-backed securities reflecting feedback from a broad cross-section of industry participants. In July 2016, the FHFA released an update on the CSP, detailing progress made in the development of a new infrastructure for the securitization of single-family mortgages by Fannie Mae and Freddie Mac. Developing the CSP is a key goal of FHFA's 2014
Strategic Plan for the Conservatorships
of Fannie Mae and Freddie Mac, which details the organizational structure of Common Securitization Solutions, LLC, a joint venture company that was established by Fannie Mae and Freddie Mac to lead the work on this project. In December 2016, the FHFA announced that Release 1 of the CSP was successfully implemented on November 21, 2016. This means that Freddie Mac now uses the CSP for data acceptance, issuance support, and bond administration activities related to current single-class, fixed-rate, mortgage-backed securities. The FHFA continues to review Release 2, which involves issuance by Freddie Mac and Fannie Mae of a common, single mortgage-backed security, which will be known as the Uniform Mortgage-Backed Security. The FHFA anticipates implementation of Release 2 in the second quarter of 2019. The second, establish an operating framework for Fannie Mae and Freddie Mac that is consistent with housing finance reform progress that encourages and accommodates increased participation of private capital in assuming credit risk associated with the secondary mortgage market.
The FHFA recognizes the challenges faced in these formative stages which may or may not be surmountable, such as the absence of meaningful secondary mortgage market mechanisms beyond Fannie Mae, Freddie Mac and Ginnie Mae. As a result, it is uncertain if the proposals will be enacted, what exactly will be enacted, and how they will be enacted. As a result, we cannot be certain what the effects of the enactment will have on our book value, earnings or cash available for distribution to stockholders.
Purchases and sales of Agency RMBS by the Fed may adversely affect the price and return associated with Agency RMBS.
The Fed owned approximately $1.7 trillion of Agency RMBS as of December 31, 2017. The Fed's former policy was to reinvest principal payments from its holdings of Agency RMBS into new Agency RMBS purchases. During its meeting in September 2017, the FOMC directed the Open Market Trading Desk (the "Desk") at the Fed Bank of New York to initiate, in October 2017, the program to gradually reduce the reinvestment of principal payments from the Fed's securities holdings. Specifically, the FOMC directed the Desk to reinvest each month's principal payments from Treasury securities, agency debt, and Agency RMBS only to the extent that such payments exceed gradually rising caps. The Fed also announced at the September 2017 meeting that it would be reducing its holdings of U.S. Treasury bonds and mortgage-backed securities, starting in October 2017.
While we cannot predict the impact of these actions by the Fed on the prices and liquidity of Agency RMBS, we expect that during periods in which the Fed purchases significant volumes of Agency RMBS, yields on Agency RMBS may be lower and refinancing volumes may be higher than they would have been absent their large scale purchases. As a result, returns on Agency RMBS may be adversely affected. There is also a risk that as the Fed reduces its purchases of Agency RMBS, or if it decides to sell some or all of its holdings of Agency RMBS, the pricing of our Agency RMBS portfolio may be adversely affected.
14
Increased levels of prepayments on the mortgages underlying our Agency RMBS might decrease net interest income or result in a net loss, which could materially adversely affect our business, financial condition and results of operations and our ability to pay distributions to our stockholders.
In the case of residential mortgages, there are seldom any restrictions on borrowers' ability to prepay their loans. Prepayment rates generally increase when interest rates fall and decrease when interest rates rise. Prepayment rates also may be affected by other factors, including, without limitation, conditions in the housing and financial markets, governmental action, general economic conditions and the relative interest rates on ARMs, hybrid ARMs and fixed-rate mortgage loans. With respect to pass-through Agency RMBS, faster-than-expected prepayments could also materially adversely affect our business, financial condition and results of operations and our ability to pay distributions to our stockholders in various ways, including the following:
|
·
|
A portion of our pass-through Agency RMBS backed by ARMs and hybrid ARMs may initially bear interest at rates that are lower than their fully indexed rates, which are equivalent to the applicable index rate plus a margin. If a pass-through Agency RMBS backed by ARMs or hybrid ARMs is prepaid prior to or soon after the time of adjustment to a fully-indexed rate, we will have held that Agency RMBS while it was less profitable and lost the opportunity to receive interest at the fully-indexed rate over the remainder of its expected life.
|
|
·
|
If we are unable to acquire new Agency RMBS to replace the prepaid Agency RMBS, our returns on capital may be lower than if we were able to quickly acquire new Agency RMBS.
|
When we acquire structured Agency RMBS, we anticipate that the underlying mortgages will prepay at a projected rate, generating an expected yield. When the prepayment rates on the mortgages underlying our structured Agency RMBS are higher than expected, our returns on those securities may be materially adversely affected. For example, the value of our IOs and IIOs are extremely sensitive to prepayments because holders of these securities do not have the right to receive any principal payments on the underlying mortgages. Therefore, if the mortgage loans underlying our IOs and IIOs are prepaid, such securities would cease to have any value, which, in turn, could materially adversely affect our business, financial condition and results of operations and our ability to pay distributions to our stockholders.
While we seek to minimize prepayment risk, we must balance prepayment risk against other risks and the potential returns of each investment. No strategy can completely insulate us from prepayment or other such risks.
A decrease in prepayment rates on the mortgages underlying our Agency RMBS might decrease net interest income or result in a net loss, which could materially adversely affect our business, financial condition and results of operations and our ability to pay distributions to our stockholders.
Certain of our structured Agency RMBS may be adversely affected by a decrease in prepayment rates. For example, because POs are similar to zero-coupon bonds, our expected returns on such securities will be contingent on our receiving the principal payments of the underlying mortgage loans at expected intervals that assume a certain prepayment rate. If prepayment rates are lower than expected, we will not receive principal payments as quickly as we anticipated and, therefore, our expected returns on these securities will be adversely affected, which, in turn, could materially adversely affect our business, financial condition and results of operations and our ability to pay distributions to our stockholders.
While we seek to minimize prepayment risk, we must balance prepayment risk against other risks and the potential returns of each investment. No strategy can completely insulate us from prepayment or other such risks.
15
Interest rate caps on the ARMs and hybrid ARMs backing our Agency RMBS may reduce our net interest margin during periods of rising interest rates, which could materially adversely affect our business, financial condition and results of operations and our ability to pay distributions to our stockholders.
ARMs and hybrid ARMs are typically subject to periodic and lifetime interest rate caps. Periodic interest rate caps limit the amount an interest rate can increase during any given period. Lifetime interest rate caps limit the amount an interest rate can increase through the maturity of the loan. Our borrowings typically are not subject to similar restrictions. Accordingly, in a period of rapidly increasing interest rates, our financing costs could increase without limitation while caps could limit the interest we earn on the ARMs and hybrid ARMs backing our Agency RMBS. This problem is magnified for ARMs and hybrid ARMs that are not fully indexed because such periodic interest rate caps prevent the coupon on the security from fully reaching the specified rate in one reset. Further, some ARMs and hybrid ARMs may be subject to periodic payment caps that result in a portion of the interest being deferred and added to the principal outstanding. As a result, we may receive less cash income on Agency RMBS backed by ARMs and hybrid ARMs than necessary to pay interest on our related borrowings. Interest rate caps on Agency RMBS backed by ARMs and hybrid ARMs could reduce our net interest margin if interest rates were to increase beyond the level of the caps, which could materially adversely affect our business, financial condition and results of operations and our ability to pay distributions to our stockholders.
Failure to procure adequate repurchase agreement financing, or to renew or replace existing repurchase agreement financing as it matures, could materially adversely affect our business, financial condition and results of operations and our ability to make distributions to our stockholders.
We intend to maintain master repurchase agreements with several counterparties. We cannot assure you that any, or sufficient, repurchase agreement financing will be available to us in the future on terms that are acceptable to us. Any decline in the value of Agency RMBS, or perceived market uncertainty about their value, would make it more difficult for us to obtain financing on favorable terms or at all, or maintain our compliance with the terms of any financing arrangements already in place. We may be unable to diversify the credit risk associated with our lenders. In the event that we cannot obtain sufficient funding on acceptable terms, our business, financial condition and results of operations and our ability to pay distributions to our stockholders may be materially adversely affected.
Furthermore, because we intend to rely primarily on short-term borrowings to fund our acquisition of Agency RMBS, our ability to achieve our investment objective will depend not only on our ability to borrow money in sufficient amounts and on favorable terms, but also on our ability to renew or replace on a continuous basis our maturing short-term borrowings. If we are not able to renew or replace maturing borrowings, we will have to sell some or all of our assets, possibly under adverse market conditions. In addition, if the regulatory capital requirements imposed on our lenders change, they may be required to significantly increase the cost of the financing that they provide to us. Our lenders also may revise their eligibility requirements for the types of assets they are willing to finance or the terms of such financings, based on, among other factors, the regulatory environment and their management of perceived risk.
16
Adverse market developments could cause our lenders to require us to pledge additional assets as collateral. If our assets were insufficient to meet these collateral requirements, we might be compelled to liquidate particular assets at inopportune times and at unfavorable prices, which could materially adversely affect our business, financial condition and results of operations and our ability to pay distributions to our stockholders.
Adverse market developments, including a sharp or prolonged rise in interest rates, a change in prepayment rates or increasing market concern about the value or liquidity of one or more types of Agency RMBS, might reduce the market value of our portfolio, which might cause our lenders to initiate margin calls. A margin call means that the lender requires us to pledge additional collateral to re-establish the ratio of the value of the collateral to the amount of the borrowing. The specific collateral value to borrowing ratio that would trigger a margin call is not set in the master repurchase agreements and not determined until we engage in a repurchase transaction under these agreements. Our fixed-rate Agency RMBS generally are more susceptible to margin calls as increases in interest rates tend to more negatively affect the market value of fixed-rate securities. If we are unable to satisfy margin calls, our lenders may foreclose on our collateral. The threat or occurrence of a margin call could force us to sell, either directly or through a foreclosure, our Agency RMBS under adverse market conditions. Because of the significant leverage we expect to have, we may incur substantial losses upon the threat or occurrence of a margin call, which could materially adversely affect our business, financial condition and results of operations and our ability to pay distributions to our stockholders. Additionally, the liquidation of collateral may jeopardize our ability to maintain our qualification as a REIT, as we must comply with requirements regarding our assets and our sources of gross income. Our failure to maintain our qualification as a REIT would cause us to be subject to U.S. federal income tax (and any applicable state and local taxes) on all of our net taxable income.
Hedging against interest rate exposure may not completely insulate us from interest rate risk and could materially adversely affect our business, financial condition and results of operations and our ability to pay distributions to our stockholders.
To the extent consistent with maintaining our qualification as a REIT, we may enter into interest rate cap or swap agreements or pursue other hedging strategies, including the purchase of puts, calls or other options and futures contracts in order to hedge the interest rate risk of our portfolio. In general, our hedging strategy depends on our view of our entire portfolio consisting of assets, liabilities and derivative instruments, in light of prevailing market conditions. We could misjudge the condition of our investment portfolio or the market. Our hedging activity will vary in scope based on the level and volatility of interest rates and principal prepayments, the type of Agency RMBS we hold and other changing market conditions. Hedging may fail to protect or could adversely affect us because, among other things:
|
·
|
hedging can be expensive, particularly during periods of rising and volatile interest rates;
|
|
·
|
available interest rate hedging may not correspond directly with the interest rate risk for which protection is sought;
|
|
·
|
the duration of the hedge may not match the duration of the related liability;
|
|
·
|
certain types of hedges may expose us to risk of loss beyond the fee paid to initiate the hedge;
|
|
·
|
the amount of gross income that a REIT may earn from hedging transactions, other than hedging transactions that satisfy certain requirements of the Code, is limited by federal income tax provisions governing REITs;
|
|
·
|
the credit quality of the counterparty on the hedge may be downgraded to such an extent that it impairs our ability to sell or assign our side of the hedging transaction; and
|
|
·
|
the counterparty in the hedging transaction may default on its obligation to pay.
|
There are no perfect hedging strategies, and interest rate hedging may fail to protect us from loss. Alternatively, we may fail to properly assess a risk to our investment portfolio or may fail to recognize a risk entirely, leaving us exposed to losses without the benefit of any offsetting hedging activities. The derivative financial instruments we select may not have the effect of reducing our interest rate risk. The nature and timing of hedging transactions may influence the effectiveness of these strategies. Poorly designed strategies or improperly executed transactions could actually increase our risk and losses. In addition, hedging activities could result in losses if the event against which we hedge does not occur.
17
Because of the foregoing risks, our hedging activity could materially adversely affect our business, financial condition and results of operations and our ability to pay distributions to our stockholders.
Our use of certain hedging techniques may expose us to counterparty risks.
To the extent that our hedging instruments are not traded on regulated exchanges, guaranteed by an exchange or its clearinghouse, or regulated by any U.S. or foreign governmental authorities, there may not be requirements with respect to record keeping, financial responsibility or segregation of customer funds and positions. Furthermore, the enforceability of agreements underlying hedging transactions may depend on compliance with applicable statutory and commodity and other regulatory requirements and, depending on the domicile of the counterparty, applicable international requirements. Consequently, if any of these issues causes a counterparty to fail to perform under a derivative agreement we could incur a significant loss.
For example, if a swap exchange utilized in an interest rate swap agreement that we enter into as part of our hedging strategy cannot perform under the terms of the interest rate swap agreement, we may not receive payments due under that agreement, and, thus, we may lose any potential benefit associated with the interest rate swap. Additionally, we may also risk the loss of any collateral we have pledged to secure our obligations under these swap agreements if the exchange becomes insolvent or files for bankruptcy. Similarly, if an interest rate swaption counterparty fails to perform under the terms of the interest rate swaption agreement, in addition to not being able to exercise or otherwise cash settle the agreement, we could also incur a loss for the premium paid for that swaption.
It may be uneconomical to "roll" our TBA dollar roll transactions or we may be unable to meet margin calls on our TBA contracts, which could negatively affect our financial condition and results of operations.
We may utilize TBA dollar roll transactions as a means of investing in and financing Agency RMBS. TBA contracts enable us to purchase or sell, for future delivery, Agency RMBS with certain principal and interest terms and certain types of collateral, but the particular Agency RMBS to be delivered are not identified until shortly before the TBA settlement date. Prior to settlement of the TBA contract we may choose to move the settlement of the securities out to a later date by entering into an offsetting position (referred to as a "pair off"), net settling the paired off positions for cash, and simultaneously purchasing a similar TBA contract for a later settlement date, collectively referred to as a "dollar roll." The Agency RMBS purchased for a forward settlement date under the TBA contract are typically priced at a discount to Agency RMBS for settlement in the current month. This difference (or discount) is referred to as the "price drop." The price drop is the economic equivalent of net interest income earned from carrying the underlying Agency RMBS over the roll period (interest income less implied financing cost) and is commonly referred to as "dollar roll income." Consequently, dollar roll transactions and such forward purchases of Agency RMBS represent a form of off-balance sheet financing and increase our "at risk" leverage.
Under certain market conditions, TBA dollar roll transactions may result in negative carry income whereby the Agency RMBS purchased for a forward settlement date under the TBA contract are priced at a premium to Agency RMBS for settlement in the current month. Additionally, sales of some or all of the Fed's holdings of Agency RMBS, or declines in purchases of Agency RMBS by the Fed could adversely impact the dollar roll market. Under such conditions, it may be uneconomical to roll our TBA positions prior to the settlement date and we could have to take physical delivery of the underlying securities and settle our obligations for cash. We may not have sufficient funds or alternative financing sources available to settle such obligations. In addition, pursuant to the margin provisions established by the Mortgage-Backed Securities Division ("MBSD") of the Fixed Income Clearing Corporation, we are subject to margin calls on our TBA contracts. Further, our prime brokerage agreements may require us to post additional margin above the levels established by the MBSD. Negative carry income on TBA dollar roll transactions or failure to procure adequate financing to settle our obligations or meet margin calls under our TBA contracts could result in defaults or force us to sell assets under adverse market conditions and adversely affect our financial condition and results of operations.
18
Our forward settling transactions, including TBA transactions, subject us to certain risks, including price risks and counterparty risks.
We purchase some of our Agency RMBS through forward settling transactions, including TBAs. In a forward settling transaction, we enter into a forward purchase agreement with a counterparty to purchase either (i) an identified Agency RMBS, or (ii) a TBA, or to-be-issued, Agency RMBS with certain terms. As with any forward purchase contract, the value of the underlying Agency RMBS may decrease between the contract date and the settlement date. Furthermore, a transaction counterparty may fail to deliver the underlying Agency RMBS at the settlement date. If any of these risks were to occur, our financial condition and results of operations may be materially adversely affected.
We rely on analytical models and other data to analyze potential asset acquisition and disposition opportunities and to manage our portfolio. Such models and other data may be incorrect, misleading or incomplete, which could cause us to purchase assets that do not meet our expectations or to make asset management decisions that are not in line with our strategy.
We rely on analytical models, and information and other data supplied by third parties. These models and data may be used to value assets or potential asset acquisitions and dispositions and in connection with our asset management activities. If our models and data prove to be incorrect, misleading or incomplete, any decisions made in reliance thereon could expose us to potential risks.
Our reliance on models and data may induce us to purchase certain assets at prices that are too high, to sell certain other assets at prices that are too low or to miss favorable opportunities altogether. Similarly, any hedging activities that are based on faulty models and data may prove to be unsuccessful.
Some models, such as prepayment models, may be predictive in nature. The use of predictive models has inherent risks. For example, such models may incorrectly forecast future behavior, leading to potential losses. In addition, the predictive models used by us may differ substantially from those models used by other market participants, resulting in valuations based on these predictive models that may be substantially higher or lower for certain assets than actual market prices. Furthermore, because predictive models are usually constructed based on historical data supplied by third parties, the success of relying on such models may depend heavily on the accuracy and reliability of the supplied historical data, and, in the case of predicting performance in scenarios with little or no historical precedent (such as extreme broad-based declines in home prices, or deep economic recessions or depressions), such models must employ greater degrees of extrapolation and are therefore more speculative and less reliable.
All valuation models rely on correct market data input. If incorrect market data is entered into even a well-founded valuation model, the resulting valuations will be incorrect. However, even if market data is inputted correctly, "model prices" will often differ substantially from market prices, especially for securities with complex characteristics or whose values are particularly sensitive to various factors. If our market data inputs are incorrect or our model prices differ substantially from market prices, our business, financial condition and results of operations and our ability to make distributions to our stockholders could be materially adversely affected.
19
Valuations of some of our assets are inherently uncertain, may be based on estimates, may fluctuate over short periods of time and may differ from the values that would have been used if a ready market for these assets existed. As a result, the values of some of our assets are uncertain.
While in many cases our determination of the fair value of our assets is based on valuations provided by third-party dealers and pricing services, we can and do value assets based upon our judgment, and such valuations may differ from those provided by third-party dealers and pricing services. Valuations of certain assets are often difficult to obtain or are unreliable. In general, dealers and pricing services heavily disclaim their valuations. Additionally, dealers may claim to furnish valuations only as an accommodation and without special compensation, and so they may disclaim any and all liability for any direct, incidental or consequential damages arising out of any inaccuracy or incompleteness in valuations, including any act of negligence or breach of any warranty. Depending on the complexity and illiquidity of an asset, valuations of the same asset can vary substantially from one dealer or pricing service to another. The valuation process during times of market distress can be particularly difficult and unpredictable and during such time the disparity of valuations provided by third-party dealers can widen.
Our business, financial condition and results of operations and our ability to make distributions to our stockholders could be materially adversely affected if our fair value determinations of these assets were materially higher than the values that would exist if a ready market existed for these assets.
Because the assets that we acquire might experience periods of illiquidity, we might be prevented from selling our Agency RMBS at favorable times and prices, which could materially adversely affect our business, financial condition and results of operations and our ability to pay distributions to our stockholders.
Agency RMBS might experience periods of illiquidity. Such conditions are more likely to occur for structured Agency RMBS because such securities are generally traded in markets much less liquid than the pass-through Agency RMBS market. As a result, we may be unable to dispose of our Agency RMBS at advantageous times and prices or in a timely manner. The lack of liquidity might result from the absence of a willing buyer or an established market for these assets as well as legal or contractual restrictions on resale. The illiquidity of Agency RMBS could materially adversely affect our business, financial condition and results of operations and our ability to pay distributions to our stockholders.
Our use of leverage could materially adversely affect our business, financial condition and results of operations and our ability to pay distributions to our stockholders.
We calculate our leverage ratio by dividing our total liabilities by total equity at the end of each period. Under normal market conditions, we generally expect our leverage ratio to be less than 12 to 1, although at times our borrowings may be above or below this level. We incur this indebtedness by borrowing against a substantial portion of the market value of our pass-through Agency RMBS and a portion of our structured Agency RMBS. Our total indebtedness, however, is not expressly limited by our policies and will depend on our prospective lenders' estimates of the stability of our portfolio's cash flow. As a result, there is no limit on the amount of leverage that we may incur. We face the risk that we might not be able to meet our debt service obligations or a lender's margin requirements from our income and, to the extent we cannot, we might be forced to liquidate some of our Agency RMBS at unfavorable prices. Our use of leverage could materially adversely affect our business, financial condition and results of operations and our ability to pay distributions to our stockholders. For example:
|
·
|
our borrowings are secured by our pass-through Agency RMBS and a portion of our structured Agency RMBS under repurchase agreements. A decline in the market value of the pass-through Agency RMBS or structured Agency RMBS used to secure these debt obligations could limit our ability to borrow or result in lenders requiring us to pledge additional collateral to secure our borrowings. In that situation, we could be required to sell Agency RMBS under adverse market conditions in order to obtain the additional collateral required by the lender. If these sales are made at prices lower than the carrying value of the Agency RMBS, we would experience losses.
|
|
·
|
to the extent we are compelled to liquidate qualifying real estate assets to repay debts, our compliance with the REIT rules regarding our assets and our sources of gross income could be negatively affected, which could jeopardize our qualification as a REIT. Losing our REIT qualification would cause us to be subject to U.S. federal income tax (and any applicable state and local taxes) on all of our income and would decrease profitability and cash available for distributions to stockholders.
|
20
If we experience losses as a result of our use of leverage, such losses could materially adversely affect our business, results of operations and financial condition and our ability to make distributions to our stockholders.
Our use of repurchase agreements may give our lenders greater rights in the event that either we or any of our lenders file for bankruptcy, which may make it difficult for us to recover our collateral in the event of a bankruptcy filing.
Our borrowings under repurchase agreements may qualify for special treatment under the bankruptcy code, giving our lenders the ability to avoid the automatic stay provisions of the bankruptcy code and to take possession of and liquidate our collateral under the repurchase agreements without delay if we file for bankruptcy. Furthermore, the special treatment of repurchase agreements under the bankruptcy code may make it difficult for us to recover our pledged assets in the event that any of our lenders files for bankruptcy. Thus, the use of repurchase agreements exposes our pledged assets to risk in the event of a bankruptcy filing by either our lenders or us. In addition, if the lender is a broker or dealer subject to the Securities Investor Protection Act of 1970, or an insured depository institution subject to the Federal Deposit Insurance Act, our ability to exercise our rights to recover our investment under a repurchase agreement or to be compensated for any damages resulting from the lender's insolvency may be further limited by those statutes.
If our lenders default on their obligations to resell the Agency RMBS back to us at the end of the repurchase transaction term, or if the value of the Agency RMBS has declined by the end of the repurchase transaction term or if we default on our obligations under the repurchase transaction, we will lose money on these transactions, which, in turn, may materially adversely affect our business, financial condition and results of operations and our ability to pay distributions to our stockholders.
When we engage in a repurchase transaction, we initially sell securities to the financial institution under one of our master repurchase agreements in exchange for cash, and our counterparty is obligated to resell the securities to us at the end of the term of the transaction, which is typically from 24 to 90 days but may be up to 364 days or more. The cash we receive when we initially sell the securities is less than the value of those securities, which is referred to as the haircut. Many financial institutions from which we may obtain repurchase agreement financing have increased their haircuts in the past and may do so again in the future. If these haircuts are increased, we will be required to post additional cash or securities as collateral for our Agency RMBS. If our counterparty defaults on its obligation to resell the securities to us, we would incur a loss on the transaction equal to the amount of the haircut (assuming there was no change in the value of the securities). We would also lose money on a repurchase transaction if the value of the underlying securities had declined as of the end of the transaction term, as we would have to repurchase the securities for their initial value but would receive securities worth less than that amount. Any losses we incur on our repurchase transactions could materially adversely affect our business, financial condition and results of operations and our ability to pay distributions to our stockholders.
If we default on one of our obligations under a repurchase transaction, the counterparty can terminate the transaction and cease entering into any other repurchase transactions with us. In that case, we would likely need to establish a replacement repurchase facility with another financial institution in order to continue to leverage our portfolio and carry out our investment strategy. There is no assurance we would be able to establish a suitable replacement facility on acceptable terms or at all.
21
Clearing facilities or exchanges upon which some of our hedging instruments are traded may increase margin requirements on our hedging instruments in the event of adverse economic developments.
In response to events having or expected to have adverse economic consequences or which create market uncertainty, clearing facilities or exchanges upon which some of our hedging instruments, such as Eurodollar futures contracts and interest rate swaps, are traded may require us to post additional collateral against our hedging instruments. In the event that future adverse economic developments or market uncertainty result in increased margin requirements for our hedging instruments, it could materially adversely affect our liquidity position, business, financial condition and results of operations.
Our ability to achieve our investment objectives will depend on our ability to manage future growth effectively.
Our ability to achieve our investment objectives will depend on our ability to grow, which will depend, in turn, on our Manager's ability to identify and invest in securities that meet our investment criteria. Accomplishing this result on a cost-effective basis largely will be a function of our Manager's structuring and implementation of the investment process, its ability to provide competent, attentive and efficient services to us and our access to financing on acceptable terms. Our Manager has substantial responsibilities, and, in order to grow, needs to hire, train, supervise and manage new employees successfully. Any failure to manage our future growth effectively could have a material adverse effect on our business, financial condition and results of operations and our ability to pay distributions to our stockholders.
We may change our investment strategy, investment guidelines and asset allocation without notice or stockholder consent, which may result in riskier investments. In addition, our charter provides that our Board of Directors may revoke or otherwise terminate our REIT election, without the approval of our stockholders.
Our Board of Directors has the authority to change our investment strategy or asset allocation at any time without notice to or consent from our stockholders. To the extent that our investment strategy changes in the future, we may make investments that are different from, and possibly riskier than, the investments described in this annual report. A change in our investment strategy may increase our exposure to interest rate and real estate market fluctuations. Furthermore, a change in our asset allocation could result in our allocating assets in a different manner than as described in this annual report.
In addition, our charter provides that our Board of Directors may revoke or otherwise terminate our REIT election, without the approval of our stockholders, if it determines that it is no longer in our best interests to qualify as a REIT. These changes could materially adversely affect our business, financial condition, results of operations, the market value of our common stock and our ability to make distributions to our stockholders.
22
Competition might prevent us from acquiring Agency RMBS at favorable yields, which could materially adversely affect our business, financial condition and results of operations and our ability to pay distributions to our stockholders.
We operate in a highly competitive market for investment opportunities. Our net income largely depends on our ability to acquire Agency RMBS at favorable spreads over our borrowing costs. In acquiring Agency RMBS, we compete with a variety of institutional investors, including other REITs, investment banking firms, savings and loan associations, banks, insurance companies, mutual funds, other lenders, other entities that purchase Agency RMBS, the Federal Reserve, other governmental entities and government-sponsored entities, many of which have greater financial, technical, marketing and other resources than we do. Some competitors may have a lower cost of funds and access to funding sources that may not be available to us, such as funding from the U.S. Government. Additionally, many of our competitors are not subject to REIT tax compliance or required to maintain an exemption from the Investment Company Act. In addition, some of our competitors may have higher risk tolerances or different risk assessments, which could allow them to consider a wider variety of investments. Furthermore, competition for investments in Agency RMBS may lead the price of such investments to increase, which may further limit our ability to generate desired returns. As a result, we may not be able to acquire sufficient Agency RMBS at favorable spreads over our borrowing costs, which would materially adversely affect our business, financial condition and results of operations and our ability to pay distributions to our stockholders.
We are an "emerging growth company," and we cannot be certain if the reduced disclosure requirements applicable to emerging growth companies will make our common stock less attractive to investors.
We are an "emerging growth company," as defined in the Jumpstart Our Business Startups Act of 2012, or the JOBS Act, and as such, we are not required to comply with the auditor attestation requirements of Section 404 of the Sarbanes-Oxley Act of 2002, or the Sarbanes-Oxley Act, we have reduced disclosure obligations regarding executive compensation in our periodic reports and proxy statements, and we are exempt from the requirements of holding a nonbinding advisory vote on executive compensation and stockholder approval of any golden parachute payments not previously approved. Although we are an emerging growth company under the JOBS Act, we have elected to opt out of the extended transition period for complying with new or revised accounting standards, and such election is irrevocable. We cannot predict if investors will find our shares of common stock less attractive because we may rely on these provisions. If some investors find our shares of common stock less attractive as a result, there may be a less active trading market for our shares and our share price may be more volatile.
Our obligation to comply with the requirements of the Sarbanes-Oxley Act of 2002 will increase.
As long as we remain an emerging growth company, as that term is defined in the JOBS Act, we will be permitted to gradually comply with certain of the on-going reporting and disclosure obligations of public companies pursuant to the Sarbanes-Oxley Act. We cannot be certain if the reduced disclosure requirements applicable to emerging growth companies will make our common stock less attractive to investors.
23
Management is required to deliver a report that assesses the effectiveness of our internal controls over financial reporting pursuant to Section 302 of the Sarbanes-Oxley Act. Section 404 of the Sarbanes-Oxley Act may require our auditors to deliver an attestation report on the effectiveness of our internal controls over financial reporting in conjunction with their opinion on our audited financial statements in future years. Substantial work on our part is required to implement appropriate processes, document the system of internal control over key processes, assess their design, remediate any deficiencies identified and test their operation. This process is expected to be both costly and challenging. We cannot give any assurances that material weaknesses will not be identified in the future in connection with our compliance with the provisions of Section 302 and 404 of the Sarbanes-Oxley Act. The existence of any material weakness described above would preclude a conclusion by management and our independent auditors that we maintained effective internal control over financial reporting. Our management may be required to devote significant time and expense to remediate any material weaknesses that may be discovered and may not be able to remediate any material weakness in a timely manner. The existence of any material weakness in our internal control over financial reporting could also result in errors in our financial statements that could require us to restate our financial statements, cause us to fail to meet our reporting obligations and cause investors to lose confidence in our reported financial information, all of which could lead to a decline in the trading price of our common stock.
We are highly dependent on communications and information systems operated by third parties, and systems failures could significantly disrupt our business, which may, in turn, adversely affect our business, financial condition and results of operations and our ability to pay distributions to our stockholders.
Our business is highly dependent on communications and information systems that allow us to monitor, value, buy, sell, finance and hedge our investments. These systems are operated by third parties and, as a result, we have limited ability to ensure their continued operation. In the event of a systems failure or interruption, we will have limited ability to affect the timing and success of systems restoration. Any failure or interruption of our systems could cause delays or other problems in our securities trading activities, including Agency RMBS trading activities, which could have a material adverse effect on our business, financial condition and results of operations and our ability to pay distributions to our stockholders.
If we issue debt securities, our operations may be restricted and we will be exposed to additional risk.
If we decide to issue debt securities in the future, it is likely that such securities will be governed by an indenture or other instrument containing covenants restricting our operating flexibility. Additionally, any convertible or exchangeable securities that we issue in the future may have rights, preferences and privileges more favorable than those of our common stock. We, and indirectly our stockholders, will bear the cost of issuing and servicing such securities. Holders of debt securities may be granted specific rights, including but not limited to, the right to hold a perfected security interest in certain of our assets, the right to accelerate payments due under the indenture, rights to restrict dividend payments, and rights to approve the sale of assets. Such additional restrictive covenants and operating restrictions could have a material adverse effect on our business, financial condition and results of operations and our ability to pay distributions to our stockholders.
No assurance can be given that the actions taken by the U.S. Government for the purpose of seeking to stimulate the economy will achieve their intended effect or will benefit our business, and further, government or market developments could adversely affect us.
The current administration of the U.S. Government has announced that it may implement initiatives intended to stimulate the U.S. economy. No assurance can be given that these initiatives will beneficially impact the economy or our business. If these initiatives do not function as intended or interest rates increase as a result of these initiatives, the pricing, supply, liquidity and value of our assets and the availability of financing on attractive terms may be materially adversely affected.
24
Adoption of the Basel III standards and other proposed supplementary regulatory standards may negatively impact our access to financing or affect the terms of our future financing arrangements.
In response to various financial crises and the volatility of financial markets, the Basel Committee on Banking Supervision, an international body comprised of senior representatives of bank supervisory authorities and central banks from 27 countries, including the United States, adopted the Basel III standards several years ago. The final package of Basel III reforms was approved by the G20 leaders in November 2010. In January 2013, the Basel Committee agreed to delay implementation of the Basel III standards and expanded the scope of assets permitted to be included in a bank's liquidity measurement. In 2014, the Basel Committee announced that it would propose additional changes to capital requirements for banks over the next few years. U.S. regulators have elected to implement substantially all of the Basel III standards. These new standards, including the Supplementary Leverage Ratio imposed by the Federal Reserve Board, the Federal Deposit Insurance Corporation and the Office of the Comptroller of the Currency, which will be fully phased in by 2019, will require banks to hold more capital, predominantly in the form of common equity, than under the current capital framework. These increased bank capital requirements may constrain our ability to obtain attractive future financings and increase the cost of such financings if they are obtained.
In April 2014, U.S. regulators adopted rules requiring enhanced supplementary leverage ratio standards beginning in January 2018, which impose capital requirements more stringent than those of the Basel III standards for the most systematically significant banking organizations in the U.S. Adoption and implementation of the Basel III standards and the supplemental regulatory standards adopted by U.S. regulators may negatively impact our access to financing or affect the terms of our future financing arrangements.
We may be subject to adverse legislative or regulatory changes that could reduce the market price of our common stock.
At any time, laws or regulations, or the administrative interpretations of those laws or regulations, which impact our business and Maryland corporations may be amended. In addition, the markets for RMBS and derivatives, including interest rate swaps, have been the subject of intense scrutiny in recent years. We cannot predict when or if any new law, regulation or administrative interpretation, or any amendment to any existing law, regulation or administrative interpretation, will be adopted or promulgated or will become effective. Additionally, revisions to these laws, regulations or administrative interpretations could cause us to change our investments. We could be materially adversely affected by any such change to any existing, or any new, law, regulation or administrative interpretation, which could reduce the market price of our common stock.
Risks Related to Conflicts of Interest in Our Relationship with Our Manager and Bimini
The management agreement with our Manager was not negotiated on an arm's-length basis and the terms, including fees payable and our inability to terminate, or our election not to renew, the management agreement based on our Manager's poor performance without paying our Manager a significant termination fee, except for a termination of the Manager with cause, may not be as favorable to us as if it were negotiated with an unaffiliated third party.
The management agreement with our Manager was negotiated between related parties, and we did not have the benefit of arm's-length negotiations of the type normally conducted with an unaffiliated third party. The terms of the management agreement with our Manager, including fees payable and our inability to terminate, or our election not to renew, the management agreement based on our Manager's poor performance without paying our Manager a significant termination fee, except for a termination of the Manager with cause, may not reflect the terms we may have received if it was negotiated with an unrelated third party. In addition, as a result of the relationship with our Manager, we may choose not to enforce, or to enforce less vigorously, our rights under the management agreement because of our desire to maintain our ongoing relationship with our Manager.
25
We have no employees, and our Manager is responsible for making all of our investment decisions. None of our or our Manager's officers are required to devote any specific amount of time to our business, and each of them may provide their services to Bimini, which could result in conflicts of interest.
Our Manager is responsible for making all of our investments. We do not have any employees, and we are completely reliant on our Manager to provide us with investment advisory services. Each of our and our Manager's officers is an employee of Bimini and none of them will devote their time to us exclusively. Each of Messrs. Cauley and Haas, who are the members of our Manager's investment committee, is an officer of Bimini and has significant responsibilities to Bimini. Due to the fact that each of our officers is responsible for providing services to Bimini, they may not devote sufficient time to the management of our business operations. At times when there are turbulent conditions in the mortgage markets or distress in the credit markets or other times when we will need focused support and assistance from our executive officers and our Manager, Bimini and its affiliates will likewise require greater focus and attention from them. In such situations, we may not receive the level of support and assistance that we otherwise would likely have received if we were internally managed or if such executives were not otherwise committed to provide support to Bimini.
Our Board of Directors has adopted investment guidelines that require that any investment transaction between us and Bimini or any affiliate of Bimini receive the prior approval of a majority of our independent directors. However, this policy will not eliminate the conflicts of interest that our officers will face in making investment decisions on behalf of Bimini and us. Further, we do not have any agreement or understanding with Bimini that would give us any priority over Bimini or any of its affiliates. Accordingly, we may compete for access to the benefits that we expect our relationship with our Manager and Bimini to provide.
We are completely dependent upon our Manager and certain key personnel of Bimini who provide services to us through the management agreement, and we may not find suitable replacements for our Manager and these personnel if the management agreement is terminated or such key personnel are no longer available to us.
We are completely dependent on our Manager to conduct our operations pursuant to the management agreement. Because we do not have any employees or separate facilities, we are reliant on our Manager to provide us with the personnel, services and resources necessary to carry out our day-to-day operations. Our management agreement does not require our Manager to dedicate specific personnel to our operations or a specific amount of time to our business. Additionally, because we are affiliated with Bimini, we may be negatively impacted by an event or factors, including ongoing and potential legal proceedings against Bimini and its subsidiaries, that negatively impacts or could negatively impact Bimini's business or financial condition.
Our management agreement is automatically renewed in accordance with the terms of the agreement, each year, on February 20. Upon the expiration of any automatic renewal term, our Manager may elect not to renew the management agreement without cause, and without penalty, on 180-days' prior written notice to us. If we elect not to renew the management agreement without cause, we would have to pay a termination fee equal to three times the average annual management fee earned by our Manager during the prior 24-month period immediately preceding the most recently completed calendar quarter prior to the effective date of termination. During the term of the management agreement and for two years after its expiration or termination, we may not, without the consent of our Manager, employ any employee of the Manager or any of its affiliates or any person who has been employed by our Manager or any of its affiliates at any time within the two-year period immediately preceding the date on which the person commences employment with us. We do not have retention agreements with any of our officers. We believe that the successful implementation of our investment and financing strategies depends to a significant extent upon the experience of Bimini's executive officers. None of these individuals' continued service is guaranteed. If the management agreement is terminated or these individuals leave Bimini, we may be unable to execute our business plan.
26
We, Bimini and other accounts managed by our Manager may compete for opportunities to acquire assets, which are allocated in accordance with the Investment Allocation Agreement by and among Bimini, our Manager and us.
From time to time Bimini may seek to purchase for itself the same or similar assets that our Manager seeks to purchase for us, or our Manager may seek to purchase the same or similar assets for us as it does for other accounts that may be managed by our Manager in the future. In such an instance, our Manager has no duty to allocate such opportunities in a manner that preferentially favors us. Bimini and our Manager make available to us opportunities to acquire assets that they determine, in their reasonable and good faith judgment, based on our objectives, policies and strategies, and other relevant factors, are appropriate for us in accordance with the Investment Allocation Agreement.
Because many of our targeted assets are typically available only in specified quantities and because many of our targeted assets are also targeted assets for Bimini and may be targeted assets for other accounts our Manager may manage in the future, neither Bimini nor our Manager may be able to buy as much of any given asset as required to satisfy the needs of Bimini, us and any other account our Manager may manage in the future. In these cases, the Investment Allocation Agreement will require the allocation of such assets to multiple accounts in proportion to their needs and available capital. The Investment Allocation Agreement will permit departure from such proportional allocation when (i) allocating purchases of whole-pool Agency RMBS, because those securities cannot be divided into multiple parts to be allocated among various accounts, and (ii) such allocation would result in an inefficiently small amount of the security being purchased for an account. In that case, the Investment Allocation Agreement allows for a protocol of allocating assets so that, on an overall basis, each account is treated equitably.
There are conflicts of interest in our relationships with our Manager and Bimini, which could result in decisions that are not in the best interests of our stockholders.
We are subject to conflicts of interest arising out of our relationships with Bimini and our Manager. All of our executive officers are employees of Bimini. As a result, our officers may have conflicts between their duties to us and their duties to Bimini or our Manager.
We may acquire or sell assets in which Bimini or its affiliates have or may have an interest. Similarly, Bimini or its affiliates may acquire or sell assets in which we have or may have an interest. Although such acquisitions or dispositions may present conflicts of interest, we nonetheless may pursue and consummate such transactions. Additionally, we may engage in transactions directly with Bimini or its affiliates, including the purchase and sale of all or a portion of a portfolio asset.
The officers of Bimini and our Manager devote as much time to us as our Manager deems appropriate. However, these officers may have conflicts in allocating their time and services among us, Bimini and our Manager. During turbulent conditions in the mortgage industry, distress in the credit markets or other times when we will need focused support and assistance from our Manager's officers and Bimini's employees, Bimini and other entities for which our Manager may serve as a manager in the future will likewise require greater focus and attention, placing our Manager's and Bimini's resources in high demand. In such situations, we may not receive the necessary support and assistance we require or would otherwise receive if we were internally managed.
Mr. Cauley, our Chief Executive Officer and Chairman of our Board of Directors, also serves as Chief Executive Officer and Chairman of the Board of Directors of Bimini and owns shares of common stock of Bimini. Mr. Haas, our Chief Financial Officer, Chief Investment Officer, Secretary and a member of our Board of Directors, also serves as the Chief Financial Officer, Chief Investment Officer and Treasurer of Bimini and owns shares of common stock of Bimini. Accordingly, Messrs. Cauley and Haas may have a conflict of interest with respect to actions by our Board of Directors that relate to Bimini or our Manager.
As of February 14, 2018, Bimini owned approximately 2.9% of our outstanding shares of common stock. In evaluating opportunities for us and other management strategies, this may lead our Manager to emphasize certain asset acquisition, disposition or management objectives over others, such as balancing risk or capital preservation objectives against return objectives. This could increase the risks or decrease the returns of your investment.
27
If we elect to not renew the management agreement without cause, we would be required to pay our Manager a substantial termination fee. These and other provisions in our management agreement make non-renewal of our management agreement difficult and costly.
Electing not to renew the management agreement without cause would be difficult and costly for us. Our management agreement is automatically renewed in accordance with the terms of the agreement, each year, on February 20. However, with the consent of the majority of our independent directors, we may elect not to renew our management agreement in subsequent years upon 180-days' prior written notice. If we elect to not renew the agreement because of a decision by our Board of Directors that the management fee is unfair, our Manager has the right to renegotiate a mutually agreeable management fee. If we elect to not renew the management agreement without cause, we are required to pay our Manager a termination fee equal to three times the average annual management fee earned by our Manager during the prior 24-month period immediately preceding the most recently completed calendar quarter prior to the effective date of termination. These provisions may increase the effective cost to us of electing to not renew the management agreement, thereby adversely affecting our inclination to end our relationship with our Manager even if we believe our Manager's performance is unsatisfactory.
Our Manager's management fee is payable regardless of our performance.
Our Manager is entitled to receive a management fee from us that is based on the amount of our equity (as defined in the management agreement), regardless of the performance of our investment portfolio. For example, we would pay our Manager a management fee for a specific period even if we experienced a net loss during the same period. Our Manager's entitlement to substantial nonperformance-based compensation may reduce its incentive to devote sufficient time and effort to seeking investments that provide attractive risk-adjusted returns for our investment portfolio. This in turn could materially adversely affect our business, financial condition and results of operations and our ability to make distributions to our stockholders.
Our Manager will not be liable to us for any acts or omissions performed in accordance with the management agreement, including with respect to the performance of our investments.
Our Manager has not assumed any responsibility other than to render the services called for under the management agreement in good faith and is not responsible for any action of our Board of Directors in following or declining to follow its advice or recommendations, including as set forth in the investment guidelines. Our Manager and its affiliates, and the directors, officers, employees, members and stockholders of our Manager and its affiliates, will not be liable to us, our Board of Directors or our stockholders for any acts or omissions performed in accordance with and pursuant to the management agreement, except by reason of acts constituting bad faith, willful misconduct, gross negligence or reckless disregard of their respective duties under the management agreement. We have agreed to indemnify our Manager and its affiliates, and the directors, officers, employees, members and stockholders of our Manager and its affiliates, with respect to all expenses, losses, damages, liabilities, demands, charges and claims in respect of or arising from any acts or omissions of our Manager, its affiliates, and the directors, officers, employees, members and stockholders of our Manager and its affiliates, performed in good faith under the management agreement and not constituting bad faith, willful misconduct, gross negligence, or reckless disregard of their respective duties. Therefore, our stockholders have no recourse against our Manager with respect to the performance of investments made in accordance with the management agreement.
Risks Related to Our Common Stock
Investing in our common stock may involve a high degree of risk.
The investments we make in accordance with our investment objectives may result in a high amount of risk when compared to alternative investment options and volatility or loss of principal. Our investments may be highly speculative and aggressive, and therefore an investment in our common stock may not be suitable for someone with lower risk tolerance.
28
There may not be an active market for our common stock, which may cause our common stock to trade at a discount and make it difficult to sell the common stock you purchase.
Our common stock is listed on the NYSE under the symbol "ORC." Trading on the NYSE does not ensure that there is or will be an actual market for our common stock. Accordingly, no assurance can be given as to:
|
·
|
the likelihood that an actual market for our common stock will develop, or be continued once developed;
|
|
·
|
the liquidity of any such market;
|
|
·
|
the ability of any holder to sell shares of our common stock; or
|
|
·
|
the prices that may be obtained for our common stock.
|
We have not established a minimum distribution payment level, and we cannot assure you of our ability to make distributions to our stockholders in the future.
We intend to continue to make monthly distributions to our stockholders in amounts such that we distribute all or substantially all of our REIT taxable income in each year, subject to certain adjustments. We have not established a minimum distribution payment level, and our ability to make distributions might be harmed by the risk factors described herein. All distributions will be made at the discretion of our Board of Directors out of funds legally available therefor and will depend on our earnings, our financial condition, maintaining our qualification as a REIT and such other factors as our Board of Directors may deem relevant from time to time. We cannot assure you that we will have the ability to make distributions to our stockholders in the future. To the extent that we decide to pay distributions from the proceeds of a securities offerings, such distributions would generally be considered a return of capital for U.S. federal income tax purposes. A return of capital reduces the basis of a stockholder's investment in our common stock to the extent of such basis and is treated as capital gain thereafter.
Future offerings of debt securities, which would be senior to our common stock upon liquidation, or equity securities, which would dilute our existing stockholders and may be senior to our common stock for the purposes of distributions, may harm the value of our common stock.
In the future, we may attempt to increase our capital resources by making additional offerings of debt or equity securities, including commercial paper, medium-term notes, senior or subordinated notes and classes of preferred stock or common stock, as well as warrants to purchase shares of common stock or convertible preferred stock. Upon the liquidation of the Company, holders of our debt securities and shares of preferred stock and lenders with respect to other borrowings will receive a distribution of our available assets prior to the holders of our common stock. Additional equity offerings by us may dilute the holdings of our existing stockholders or reduce the market value of our common stock, or both. Our preferred stock, if issued, would have a preference on distributions that could limit our ability to make distributions to the holders of our common stock. Furthermore, our Board of Directors may, without stockholder approval, amend our charter to increase the aggregate number of our shares or the number of shares of any class or series that we have the authority to issue, and to classify or reclassify any unissued shares of common stock or preferred stock. Because our decision to issue securities in any future offering will depend on market conditions and other factors beyond our control, we cannot predict or estimate the amount, timing or nature of our future offerings. Our stockholders are therefore subject to the risk of our future securities offerings reducing the market price of our common stock and diluting their common stock.
29
The market value of our common stock may be volatile.
The market value of shares of our common stock may be based primarily upon current and expected future cash dividends and our book value. The market price of shares of our common stock may be influenced by the dividends on those shares relative to market interest rates. Rising interest rates may lead potential buyers of our common stock to expect a higher dividend rate, which could adversely affect the market price of shares of our common stock. In addition, our book value could decrease, which could reduce the market price of our common stock to the extent our common stock trades relative to our book value. As a result, the market price of our common stock may be highly volatile and subject to wide price fluctuations. In addition, the trading volume in our common stock may fluctuate and cause significant price variations to occur. Some of the factors that could negatively affect the share price or trading volume of our common stock include:
|
·
|
actual or anticipated variations in our operating results or distributions;
|
|
·
|
changes in our earnings estimates or publication of research reports about us or the real estate or specialty finance industry;
|
|
·
|
increases in market interest rates that lead purchasers of our common stock to expect a higher dividend yield;
|
|
·
|
changes in our book value;
|
|
·
|
changes in market valuations of similar companies;
|
|
·
|
adverse market reaction to any increased indebtedness we incur in the future;
|
|
·
|
a change in our Manager or additions or departures of key management personnel;
|
|
·
|
actions by institutional stockholders;
|
|
·
|
speculation in the press or investment community; and
|
|
·
|
general market and economic conditions.
|
We cannot make any assurances that the market price of our common stock will not fluctuate or decline significantly in the future.
Shares of our common stock eligible for future sale may harm our share price.
We cannot predict the effect, if any, of future sales of shares of our common stock, or the availability of shares for future sales, on the market price of our common stock. Sales of substantial amounts of these shares of our common stock, or the perception that these sales could occur, may harm prevailing market prices for our common stock. The 2012 Equity Incentive Plan provides for grants of up to an aggregate of 10% of the issued and outstanding shares of our common stock (on a fully diluted basis) at the time of the award, subject to a maximum aggregate number of shares of common stock that may be issued under the 2012 Equity Incentive Plan of 4,000,000 shares of common stock. As of February 14, 2018, Bimini owns 1,520,036 shares of our common stock. If Bimini sells a large number of our securities in the public market, the sale could reduce the market price of our common stock and could impede our ability to raise future capital.
30
Risks Related to Our Organization and Structure
Loss of our exemption from regulation under the Investment Company Act would negatively affect the value of shares of our common stock and our ability to pay distributions to our stockholders.
We have operated and intend to continue to operate our business so as to be exempt from registration under the Investment Company Act, because we are "primarily engaged in the business of purchasing or otherwise acquiring mortgages and other liens on and interests in real estate." Specifically, we invest and intend to continue to invest so that at least 55% of the assets that we own on an unconsolidated basis consist of qualifying mortgages and other liens and interests in real estate, which are collectively referred to as "qualifying real estate assets," and so that at least 80% of the assets we own on an unconsolidated basis consist of real estate-related assets (including our qualifying real estate assets). We treat Fannie Mae, Freddie Mac and Ginnie Mae whole-pool residential mortgage pass-through securities issued with respect to an underlying pool of mortgage loans in which we hold all of the certificates issued by the pool as qualifying real estate assets based on no-action letters issued by the SEC. To the extent that the SEC publishes new or different guidance with respect to these matters, we may fail to qualify for this exemption.
If we fail to qualify for this exemption, we could be required to restructure our activities in a manner that, or at a time when, we would not otherwise choose to do so, which could negatively affect the value of shares of our common stock and our ability to distribute dividends. For example, if the market value of our investments in CMOs or structured Agency RMBS, neither of which are qualifying real estate assets for Investment Company Act purposes, were to increase by an amount that resulted in less than 55% of our assets being invested in pass-through Agency RMBS, we might have to sell CMOs or structured Agency RMBS in order to maintain our exemption from the Investment Company Act. The sale could occur during adverse market conditions, and we could be forced to accept a price below that which we believe is acceptable.
Alternatively, if we fail to qualify for this exemption, we may have to register under the Investment Company Act and we could become subject to substantial regulation with respect to our capital structure (including our ability to use leverage), management, operations, transactions with affiliated persons (as defined in the Investment Company Act), portfolio composition, including restrictions with respect to diversification and industry concentration, and other matters.
We may be required at times to adopt less efficient methods of financing certain of our securities, and we may be precluded from acquiring certain types of higher yielding securities. The net effect of these factors would be to lower our net interest income. If we fail to qualify for an exemption from registration as an investment company or an exclusion from the definition of an investment company, our ability to use leverage would be substantially reduced, and we would not be able to conduct our business as described herein. Our business will be materially and adversely affected if we fail to qualify for and maintain an exemption from regulation pursuant to the Investment Company Act.
31
Failure to obtain and maintain an exemption from being regulated as a commodity pool operator could subject us to additional regulation and compliance requirements and may result in fines and other penalties which could materially adversely affect our business and financial condition.
The Dodd-Frank Act established a comprehensive new regulatory framework for derivative contracts commonly referred to as "swaps." As a result, any investment fund that trades in swaps may be considered a "commodity pool," which would cause its operators (in some cases the fund's directors) to be regulated as "commodity pool operators" ("CPOs"). Under new rules adopted by the U.S. Commodity Futures Trading Commission (the "CFTC"), those funds that become commodity pools solely because of their use of swaps must register with the National Futures Association (the "NFA"). Registration requires compliance with the CFTC's regulations and the NFA's rules with respect to capital raising, disclosure, reporting, recordkeeping and other business conduct. However, the CFTC's Division of Swap Dealer and Intermediary Oversight issued a no-action letter saying, although it believes that mortgage REITs are properly considered commodity pools, it would not recommend that the CFTC take enforcement action against the operator of a mortgage REIT who does not register as a CPO if, among other things, the mortgage REIT limits the initial margin and premiums required to establish its swaps, futures and other commodity interest positions to not more than five percent (5%) of its total assets, the mortgage REIT limits the net income derived annually from those commodity interest positions which are not qualifying hedging transactions to less than five percent (5%) of its gross income and interests in the mortgage REIT are not marketed to the public as or in a commodity pool or otherwise as or in a vehicle for trading in the commodity futures, commodity options or swaps markets.
We use hedging instruments in conjunction with our investment portfolio and related borrowings to reduce or mitigate risks associated with changes in interest rates, mortgage spreads, yield curve shapes and market volatility. These hedging instruments may include interest rate swaps, interest rate futures and options on interest rate futures. We do not currently engage in any speculative derivatives activities or other non-hedging transactions using swaps, futures or options on futures. We do not use these instruments for the purpose of trading in commodity interests, and we do not consider the Company or its operations to be a commodity pool as to which CPO registration or compliance is required. We have claimed the relief afforded by the above-described no-action letter. Consequently, we will be restricted to operating within the parameters discussed in the no-action letter and will not enter into hedging transactions covered by the no-action letter if they would cause us to exceed the limits set forth in the no-action letter. However, there can be no assurance that the CFTC will agree that we are entitled to the no-action letter relief claimed.
The CFTC has substantial enforcement power with respect to violations of the laws over which it has jurisdiction, including their anti-fraud and anti-manipulation provisions. For example, the CFTC may suspend or revoke the registration of or the no-action relief afforded to a person who fails to comply with commodities laws and regulations, prohibit such a person from trading or doing business with registered entities, impose civil money penalties, require restitution and seek fines or imprisonment for criminal violations. In the event that the CFTC asserts that we are not entitled to the no-action letter relief claimed, we may be obligated to furnish additional disclosures and reports, among other things. Further, a private right of action exists against those who violate the laws over which the CFTC has jurisdiction or who willfully aid, abet, counsel, induce or procure a violation of those laws. In the event that we fail to comply with statutory requirements relating to derivatives or with the CFTC's rules thereunder, including the no-action letter described above, we may be subject to significant fines, penalties and other civil or governmental actions or proceedings, any of which could have a materially adverse effect on our business, financial condition and results of operations and our ability to pay distributions to our stockholders.
32
Our ownership limitations and certain other provisions of applicable law and our charter and bylaws may restrict business combination opportunities that would otherwise be favorable to our stockholders.
Our charter and bylaws and Maryland law contain provisions that may delay, defer or prevent a change in control or other transaction that might involve a premium price for our common stock or otherwise be in the best interests of our stockholders, including business combination provisions, supermajority vote and cause requirements for removal of directors, provisions that vacancies on our Board of Directors may be filled only by the remaining directors, for the full term of the directorship in which the vacancy occurred, the power of our Board of Directors to increase or decrease the aggregate number of authorized shares of stock or the number of shares of any class or series of stock, to cause us to issue additional shares of stock of any class or series and to fix the terms of one or more classes or series of stock without stockholder approval, the restrictions on ownership and transfer of our stock and advance notice requirements for director nominations and stockholder proposals.
To assist us in qualifying as a REIT, among other purposes, ownership of our stock by any person will generally be limited to 9.8% in value or number of shares, whichever is more restrictive, of any class or series of our stock. Additionally, our charter will prohibit beneficial or constructive ownership of our stock that would otherwise result in our failure to qualify as a REIT. The ownership rules in our charter are complex and may cause the outstanding stock owned by a group of related individuals or entities to be deemed to be owned by one individual or entity. As a result, these ownership rules could cause an individual or entity to unintentionally own shares beneficially or constructively in excess of our ownership limits. Any attempt to own or transfer shares of our common stock or preferred stock in excess of our ownership limits without the consent of our Board of Directors will result in such shares being transferred to a charitable trust. These provisions may inhibit market activity and the resulting opportunity for our stockholders to receive a premium for their stock that might otherwise exist if any person were to attempt to assemble a block of shares of our stock in excess of the number of shares permitted under our charter and that may be in the best interests of our security holders.
Our Board of Directors may, without stockholder approval, amend our charter to increase or decrease the aggregate number of our shares or the number of shares of any class or series that we have the authority to issue and to classify or reclassify any unissued shares of common stock or preferred stock, and set the preferences, rights and other terms of the classified or reclassified shares. As a result, our Board of Directors may take actions with respect to our common stock or preferred stock that may have the effect of delaying or preventing a change in control, including transactions at a premium over the market price of our shares, even if stockholders believe that a change in control is in their interest. These provisions, along with the restrictions on ownership and transfer contained in our charter and certain provisions of Maryland law described below, could discourage unsolicited acquisition proposals or make it more difficult for a third party to gain control of us, which could adversely affect the market price of our securities.
Our rights and the rights of our stockholders to take action against our directors and officers are limited, which could limit your recourse in the event of actions not in your best interests.
Our charter limits the liability of our directors and officers to us and our stockholders for money damages, except for liability resulting from:
|
·
|
actual receipt of an improper benefit or profit in money, property or services; or
|
|
·
|
a final judgment based upon a finding of active and deliberate dishonesty by the director or officer that was material to the cause of action adjudicated.
|
33
We have entered into indemnification agreements with our directors and executive officers that obligate us to indemnify them to the maximum extent permitted by Maryland law. In addition, our charter authorizes the Company to obligate itself to indemnify our present and former directors and officers for actions taken by them in those and other capacities to the maximum extent permitted by Maryland law. Our bylaws require us, to the maximum extent permitted by Maryland law, to indemnify each present and former director or officer in the defense of any proceeding to which he or she is made, or threatened to be made, a party by reason of his or her service to us. In addition, we may be obligated to advance the defense costs incurred by our directors and officers. As a result, we and our stockholders may have more limited rights against our directors and officers than might otherwise exist absent the provisions in our charter, bylaws and indemnification agreements or that might exist with other companies.
Certain provisions of Maryland law could inhibit changes in control.
Certain provisions of the Maryland General Corporation Law (the "MGCL"), may have the effect of inhibiting a third party from making a proposal to acquire us or impeding a change of control under circumstances that otherwise could provide our stockholders with the opportunity to realize a premium over the then-prevailing market price of our common stock, including:
|
·
|
"business combination" provisions that, subject to limitations, prohibit certain business combinations between us and an "interested stockholder" (defined generally as any person who beneficially owns 10% or more of the voting power of our outstanding voting stock or an affiliate or associate of ours who, at any time within the two-year period immediately prior to the date in question, was the beneficial owner of 10% or more of the voting power of our then-outstanding stock) or an affiliate of an interested stockholder for five years after the most recent date on which the stockholder became an interested stockholder, and thereafter require two supermajority stockholder votes to approve any such combination; and
|
|
·
|
"control share" provisions that provide that a holder of "control shares" of the Company (defined as voting shares of stock which, when aggregated with all other shares of stock owned by the acquiror or in respect of which the acquiror is able to exercise or direct the exercise of voting power (except solely by virtue of a revocable proxy), entitle the acquiror to exercise one of three increasing ranges of voting power in electing directors) acquired in a "control share acquisition" (defined as the direct or indirect acquisition of ownership or control of issued and outstanding "control shares," subject to certain exceptions) generally has no voting rights with respect to the control shares except to the extent approved by our stockholders by the affirmative vote of two-thirds of all the votes entitled to be cast on the matter, excluding all interested shares.
|
We have elected to opt-out of these provisions of the MGCL, in the case of the business combination provisions, by resolution of our Board of Directors (provided that such business combination is first approved by our Board of Directors, including a majority of our directors who are not affiliates or associates of such person), and in the case of the control share provisions, pursuant to a provision in our bylaws. However, our Board of Directors may by resolution elect to repeal the foregoing opt-out from the business combination provisions of the MGCL, and we may, by amendment to our bylaws, opt-in to the control share provisions of the MGCL in the future.
U.S. Federal Income Tax Risks
Your investment has various U.S. federal income tax risks.
This summary of certain tax risks is limited to the federal tax risks addressed below. Additional risks or issues may exist that are not addressed in this Form 10-K and that could affect the federal tax treatment of us or our stockholders. This is not intended to be used and cannot be used by any stockholder to avoid penalties that may be imposed on stockholders under the Code. We strongly urge you to seek advice based on your particular circumstances from an independent tax advisor concerning the effects of federal, state and local income tax law on an investment in common stock and on your individual tax situation.
34
Our failure to maintain our qualification as a REIT would subject us to U.S. federal income tax, which could adversely affect the value of the shares of our common stock and would substantially reduce the cash available for distribution to our stockholders.
We believe that commencing with our short taxable year ended December 31, 2013, we have been organized and have operated in conformity with the requirements for qualification as a REIT under the Code, and we intend to operate in a manner that will enable us to continue to meet the requirements for qualification and taxation as a REIT. However, we cannot assure you that we will remain qualified as a REIT. Moreover, our qualification and taxation as a REIT will depend upon our ability to meet on a continuing basis, through actual annual operating results, certain qualification tests set forth in the U.S. federal tax laws. Accordingly, given the complex nature of the rules governing REITs, the ongoing importance of factual determinations, including the potential tax treatment of investments we make, and the possibility of future changes in our circumstances, no assurance can be given that our actual results of operations for any particular taxable year will satisfy such requirements.
If we fail to qualify as a REIT in any calendar year, we would be required to pay U.S. federal income tax (and any applicable state and local tax), including any applicable alternative minimum tax, on our taxable income at regular corporate rates, and dividends paid to our stockholders would not be deductible by us in computing our taxable income. Further, if we fail to qualify as a REIT, we might need to borrow money or sell assets in order to pay any resulting tax. Our payment of income tax would decrease the amount of our income available for distribution to our stockholders. Furthermore, if we fail to maintain our qualification as a REIT, we no longer would be required under U.S. federal tax laws to distribute substantially all of our REIT taxable income to our stockholders. Unless our failure to qualify as a REIT was subject to relief under U.S. federal tax laws, we could not re-elect to qualify as a REIT until the fifth calendar year following the year in which we failed to qualify.
If Bimini failed to qualify as a REIT in its 2009 through 2013 taxable years, we would be prevented from electing to qualify as a REIT under applicable Treasury Regulations.
We were formed by Bimini in August 2010. We believe that from the time of our formation until the closing of the public offering of our common stock, we were a "qualified REIT subsidiary" of Bimini. However, under applicable Treasury Regulations, if Bimini failed to qualify as a REIT in its 2009 through 2013 taxable years, unless Bimini's failure to qualify as a REIT was subject to relief under U.S. federal tax laws, we would be prevented from electing to qualify as a REIT prior to the fifth calendar year following the year in which Bimini failed to qualify.
Complying with REIT requirements may cause us to forego or liquidate otherwise attractive investments.
To qualify as a REIT, we must continually satisfy various tests regarding the sources of our income, the nature and diversification of our assets, the amounts we distribute to our stockholders and the ownership of our stock. In order to meet these tests, we may be required to forego investments we might otherwise make. Thus, compliance with the REIT requirements may hinder our investment performance.
35
In particular, we must ensure that at the end of each calendar quarter, at least 75% of the value of our total assets consists of cash, cash items, government securities and qualified REIT real estate assets, including Agency RMBS. The remainder of our investment in securities (other than government securities and qualified real estate assets) generally cannot include more than 10% of the outstanding voting securities of any one issuer or more than 10% of the total value of the outstanding securities of any one issuer. In addition, in general, no more than 5% of the value of our total assets (other than government securities, TRS securities, and qualified real estate assets) can consist of the securities of any one issuer, no more than 20% of the value of our total assets can be represented by securities of one or more TRSs and no more than 25% of the value of our assets can be represented by debt of "publicly offered REITs" that is not secured by real property or interests in real property. Generally, if we fail to comply with these requirements at the end of any calendar quarter, we must correct the failure within 30 days after the end of the calendar quarter or qualify for certain statutory relief provisions to avoid losing our REIT qualification and becoming subject to U.S. federal income tax (and any applicable state and local taxes) on all of our income. As a result, we may be required to liquidate from our portfolio otherwise attractive investments or contribute such investments to a TRS. These actions could have the effect of reducing our income and amounts available for distribution to our stockholders.
Failure to make required distributions would subject us to tax, which would reduce the cash available for distribution to our stockholders.
To qualify as a REIT, we must distribute to our stockholders each calendar year at least 90% of our REIT taxable income (including certain items of non-cash income), determined without regard to the deduction for dividends paid and excluding net capital gain. To the extent that we satisfy the 90% distribution requirement, but distribute less than 100% of our taxable income, we will be subject to federal corporate income tax on our undistributed income. In addition, we will incur a 4% nondeductible excise tax on the amount, if any, by which our distributions in any calendar year are less than the sum of:
|
·
|
85% of our REIT ordinary income for that year;
|
|
·
|
95% of our REIT capital gain net income for that year; and
|
|
·
|
any undistributed taxable income from prior years
|
We intend to distribute our REIT taxable income to our stockholders in a manner intended to satisfy the 90% distribution requirement and to avoid both corporate income tax and the 4% nondeductible excise tax.
Our taxable income may be substantially different than our net income as determined based on generally accepted accounting principles in the United States ("GAAP"), because, for example, realized capital losses will be deducted in determining our GAAP net income, but may not be deductible in computing our taxable income. In addition, unrealized portfolio gains and losses are included in GAAP net income, but are not included in REIT taxable income. Also, we may invest in assets that generate taxable income in excess of economic income or in advance of the corresponding cash flow from the assets. As a result of the foregoing, we may generate less cash flow than taxable income in a particular year. To the extent that we generate such non-cash taxable income in a taxable year, we may incur corporate income tax and the 4% nondeductible excise tax on that income if we do not distribute such income to stockholders in that year. In that event, we may be required to use cash reserves, incur debt, sell assets, make taxable distributions of our stock or debt securities or liquidate non-cash assets at rates or at times that we regard as unfavorable to satisfy the distribution requirement and to avoid corporate income tax and the 4% nondeductible excise tax in that year.
Even if we qualify as a REIT, we may face other tax liabilities that reduce our cash flows.
Even if we qualify for taxation as a REIT, we may be subject to certain U.S. federal, state and local taxes on our income and assets, including taxes on any undistributed income, tax on income from some activities conducted as a result of a foreclosure, and state or local income, property and transfer taxes. In addition, any TRSs we form will be subject to regular corporate U.S. federal, state and local taxes. Any of these taxes would decrease cash available for distributions to stockholders.
36
The failure of Agency RMBS subject to a repurchase agreement to qualify as real estate assets would adversely affect our ability to qualify as a REIT.
We have entered and intend to continue to enter into repurchase agreements under which we will nominally sell certain of our Agency RMBS to a counterparty and simultaneously enter into an agreement to repurchase the sold assets. We believe that for U.S. federal income tax purposes these transactions will be treated as secured debt and we will be treated as the owner of the Agency RMBS that are the subject of any such agreement notwithstanding that such agreement may transfer record ownership of such assets to the counterparty during the term of the agreement. It is possible, however, that the IRS could successfully assert that we do not own the Agency RMBS during the term of the repurchase agreement, in which case we could fail to qualify as a REIT.
Our ability to invest in and dispose of forward settling contracts, including TBA securities, could be limited by the requirements necessary to qualify as a REIT, and we could fail to qualify as a REIT as a result of these investments.
We may purchase Agency RMBS through forward settling contracts, including TBA securities transactions. We may recognize income or gains on the disposition of forward settling contracts. For example, rather than take delivery of the Agency RMBS subject to a TBA, we may dispose of the TBA through a "roll" transaction in which we agree to purchase similar securities in the future at a predetermined price or otherwise, which may result in the recognition of income or gains. The law is unclear regarding whether forward settling contracts will be qualifying assets for the 75% asset test and whether income and gains from dispositions of forward settling contracts will be qualifying income for the 75% gross income test.
Until we receive a favorable private letter ruling from the IRS or we are advised by counsel that forward settling contracts should be treated as qualifying assets for purposes of the 75% asset test, we will limit our investment in forward settling contracts and any non-qualifying assets to no more than 25% of our total gross assets at the end of any calendar quarter and will limit the forward settling contracts issued by any one issuer to no more than 5% of our total gross assets at the end of any calendar quarter. Further, until we receive a favorable private letter ruling from the IRS or we are advised by counsel that income and gains from the disposition of forward settling contracts should be treated as qualifying income for purposes of the 75% gross income test, we will limit our income and gains from dispositions of forward settling contracts and any non-qualifying income to no more than 25% of our gross income for each calendar year. Accordingly, our ability to purchase Agency RMBS through forward settling contracts and to dispose of forward settling contracts through roll transactions or otherwise, could be limited.
Moreover, even if we are advised by counsel that forward settling contracts should be treated as qualifying assets or that income and gains from dispositions of forward settling contracts should be treated as qualifying income, it is possible that the IRS could successfully take the position that such assets are not qualifying assets and such income is not qualifying income. In that event, we could be subject to a penalty tax or we could fail to qualify as a REIT if (i) the value of our forward settling contracts together with our non-qualifying assets for the 75% asset test, exceeded 25% of our total gross assets at the end of any calendar quarter, (ii) the value of our forward settling contracts, including TBAs, issued by any one issuer exceeds 5% of our total assets at the end of any calendar quarter, or (iii) our income and gains from the disposition of forward settling contracts together with our non-qualifying income for the 75% gross income test, exceeded 25% of our gross income for any taxable year.
Complying with REIT requirements may limit our ability to hedge effectively.
The REIT provisions of the Code substantially limit our ability to hedge. Our aggregate gross income from non-qualifying hedges, fees, and certain other non-qualifying sources cannot exceed 5% of our annual gross income. As a result, we might have to limit our use of advantageous hedging techniques or implement those hedges through a TRS. Any hedging income earned by a TRS would be subject to federal, state and local income tax at regular corporate rates. This could increase the cost of our hedging activities or expose us to greater risks associated with changes in interest rates than we would otherwise want to bear.
37
Our ownership of and relationship with any TRSs that we form will be limited and a failure to comply with the limits would jeopardize our REIT qualification and may result in the application of a 100% excise tax.
A REIT may own up to 100% of the stock of one or more TRSs. A TRS may earn income that would not be qualifying income if earned directly by the parent REIT. Both the subsidiary and the REIT must jointly elect to treat the subsidiary as a TRS. A corporation (other than a REIT) of which a TRS directly or indirectly owns more than 35% of the voting power or value of the stock will automatically be treated as a TRS. Overall, no more than 20% of the value of a REIT's total assets may consist of stock or securities of one or more TRSs. A domestic TRS will pay U.S. federal, state and local income tax at regular corporate rates on any income that it earns. In addition, the TRS rules limit the deductibility of interest paid or accrued by a TRS to its parent REIT to assure that the TRS is subject to an appropriate level of corporate taxation. The rules also impose a 100% excise tax on certain transactions between a TRS and its parent REIT that are not conducted on an arm's length basis. Any domestic TRS that we may form will pay U.S. federal, state and local income tax on its taxable income, and its after-tax net income will be available for distribution to us but is not required to be distributed to us unless necessary to maintain our REIT qualification.
We may pay taxable dividends in cash and our common stock, in which case stockholders may sell shares of our common stock to pay tax on such dividends, placing downward pressure on the market price of our common stock.
We may make taxable dividends that are payable partly in cash and partly in our common stock. On August 11, 2017, the IRS issued Revenue Procedure 2017-45 authorizing elective cash/stock dividends to be made by publicly offered REITs (e.g., REITs that are required to file annual and periodic reports with the SEC under the Exchange Act). Pursuant to Revenue Procedure 2017-45, effective for distributions declared on or after August 11, 2017, the IRS will treat the distribution of stock pursuant to an elective cash/stock dividend as a distribution of property under Section 301 of the Code (e.g., a dividend), as long as at least 20% of the total dividend is available in cash and certain other parameters detailed in the Revenue Procedure are satisfied. Although we have no current intention of paying dividends in our own stock, if in the future we choose to pay dividends in our own stock, our stockholders may be required to pay tax in excess of the cash that they receive. If a U.S. stockholder sells the shares that it receives as a dividend in order to pay this tax, the sales proceeds may be less than the amount included in income with respect to the dividend, depending on the market price of our common stock at the time of the sale. Furthermore, with respect to certain non-U.S. stockholders, we may be required to withhold U.S. federal income tax with respect to such dividends, including in respect of all or a portion of such dividend that is payable in common stock. If we pay dividends in our common stock and a significant number of our stockholders determine to sell shares of our common stock in order to pay taxes owed on dividends, it may put downward pressure on the trading price of our common stock.
Our ownership limitations may restrict change of control or business combination opportunities in which our stockholders might receive a premium for their stock.
In order for us to qualify as a REIT for each taxable year after 2013, no more than 50% in value of our outstanding stock may be owned, directly or indirectly, by five or fewer individuals during the last half of any calendar year. "Individuals" for this purpose include natural persons, private foundations, some employee benefit plans and trusts, and some charitable trusts. In order to assist us in qualifying as a REIT, among other purposes, ownership of our stock by any person is generally limited to 9.8% in value or number of shares, whichever is more restrictive, of any class or series of our stock.
These ownership limitations could have the effect of discouraging a takeover or other transaction in which holders of our common stock might receive a premium for their common stock over the then-prevailing market price or which holders might believe to be otherwise in their best interests.
38
Dividends payable by REITs do not qualify for the reduced tax rates available for some dividends.
The maximum tax rate applicable to "qualified dividend income" payable to U.S. stockholders that are taxed at individual rates is lower than ordinary income tax rates. Dividends payable by REITs, however, are generally not eligible for the reduced rates on qualified dividend income. Rather, under the recently enacted Tax Cuts and Jobs Act (the "TCJA"), REIT dividends constitute "qualified business income" and thus a 20% deduction is available to individual taxpayers with respect to such dividends, resulting in a 29.6% maximum federal tax rate (plus the 3.8% surtax on net investment income, if applicable) for individual U.S. stockholders. Additionally, without further legislative action, the 20% deduction applicable to REIT dividends will expire on January 1, 2026. The more favorable rates applicable to regular corporate qualified dividends could cause investors who are taxed at individual rates to perceive investments in REITs to be relatively less attractive than investments in the stocks of non-REIT corporations that pay dividends, which could adversely affect the value of the shares of REITs, including our common stock.
We may be subject to adverse legislative or regulatory tax changes that could reduce the market price of our common stock.
At any time, the U.S. federal income tax laws or regulations governing REITs or the administrative interpretations of those laws or regulations may be amended. We cannot predict when or if any new U.S. federal income tax law, regulation or administrative interpretation, or any amendment to any existing U.S. federal income tax law, regulation or administrative interpretation, will be adopted, promulgated or become effective and any such law, regulation or interpretation may take effect retroactively. We and our stockholders could be adversely affected by any such change in, or any new, U.S. federal income tax law, regulation or administrative interpretation.
The recently-enacted TCJA makes significant changes to the U.S. federal income tax rules for taxation of individuals and corporations. In the case of individuals, the tax brackets have been adjusted, the top federal income rate has been reduced to 37%, special rules reduce taxation of certain income earned through pass-through entities and reduce the top effective rate applicable to ordinary dividends from REITs to 29.6% (through a 20% deduction for ordinary REIT dividends received) and various deductions have been eliminated or limited, including limiting the deduction for state and local taxes to $10,000 per year. Most of the changes applicable to individuals are temporary and apply only to taxable years beginning after December 31, 2017 and before January 1, 2026. The top corporate income tax rate has been reduced to 21%. There are only minor changes to the REIT rules (other than the 20% deduction applicable to individuals for ordinary REIT dividends received). The TCJA makes numerous other large and small changes to the tax rules that do not affect REITs directly but may affect our stockholders and may indirectly affect us. For example, the TCJA amends the rules for accrual of income so that income is taken into account no later than when it is taken into account on applicable financial statements, even if financial statements take such income into account before it would accrue under the original issue discount rules, market discount rules or other Code rules. Such rule may cause us to recognize income before receiving any corresponding receipt of cash. In addition, the TCJA reduces the limit for individual's mortgage interest expense to interest on $750,000 of mortgages and does not permit deduction of interest on home equity loans (after grandfathering all existing mortgages). Such change and the reduction in deductions for state and local taxes (including property taxes) may adversely affect the residential mortgage markets in which we invest.
Prospective stockholders are urged to consult with their tax advisors with respect to the status of the TCJA and any other regulatory or administrative developments and proposals and their potential effect on investment in our common stock.
39
Certain financing activities may subject us to U.S. federal income tax and could have negative tax consequences for our stockholders.
We currently do not intend to enter into any transactions that could result in our, or a portion of our assets, being treated as a taxable mortgage pool for U.S. federal income tax purposes. If we enter into such a transaction in the future, we will be taxable at the highest corporate income tax rate on a portion of the income arising from a taxable mortgage pool, referred to as "excess inclusion income," that is allocable to the percentage of our stock held in record name by disqualified organizations (generally tax-exempt entities that are exempt from the tax on unrelated business taxable income, such as state pension plans, charitable remainder trusts and government entities). In that case, under our charter, we will reduce distributions to such stockholders by the amount of tax paid by us that is attributable to such stockholder's ownership.
If we were to realize excess inclusion income, IRS guidance indicates that the excess inclusion income would be allocated among our stockholders in proportion to our dividends paid. Excess inclusion income cannot be offset by losses of our stockholders. If the stockholder is a tax-exempt entity and not a disqualified organization, then this income would be fully taxable as unrelated business taxable income under Section 512 of the Code. If the stockholder is a foreign person, it would be subject to U.S. federal income tax at the maximum tax rate and withholding will be required on this income without reduction or exemption pursuant to any otherwise applicable income tax treaty.
Our recognition of "phantom" income may reduce a stockholder's after-tax return on an investment in our common stock.
We may recognize taxable income in excess of our economic income, known as phantom income, in the first years that we hold certain investments, and experience an offsetting excess of economic income over our taxable income in later years. As a result, stockholders at times may be required to pay U.S. federal income tax on distributions that economically represent a return of capital rather than a dividend. These distributions would be offset in later years by distributions representing economic income that would be treated as returns of capital for U.S. federal income tax purposes. Taking into account the time value of money, this acceleration of U.S. federal income tax liabilities may reduce a stockholder's after-tax return on his or her investment to an amount less than the after-tax return on an investment with an identical before-tax rate of return that did not generate phantom income.
Liquidation of our assets may jeopardize our REIT qualification.
To qualify and maintain our qualification as a REIT, we must comply with requirements regarding our assets and our sources of income. If we are compelled to liquidate our assets to repay obligations to our lenders, we may be unable to comply with these requirements, thereby jeopardizing our qualification as a REIT, or we may be subject to a 100% tax on any resultant gain if we sell assets that are treated as inventory or property held primarily for sale to customers in the ordinary course of business.
Our qualification as a REIT and exemption from U.S. federal income tax with respect to certain assets may be dependent on the accuracy of legal opinions or advice rendered or given or statements by the issuers of assets that we acquire, and the inaccuracy of any such opinions, advice or statements may adversely affect our REIT qualification and result in significant corporate-level tax.
When purchasing securities, we may rely on opinions or advice of counsel for the issuer of such securities, or statements made in related offering documents, for purposes of determining whether such securities represent debt or equity securities for U.S. federal income tax purposes, the value of such securities, and also to what extent those securities constitute qualified real estate assets for purposes of the REIT asset tests and produce income which qualifies under the 75% gross income test. The inaccuracy of any such opinions, advice or statements may adversely affect our REIT qualification and result in significant corporate-level tax.
40
ITEM 1B. UNRESOLVED STAFF COMMENTS
None
.
ITEM 2. PROPERTIES
We do not own any real property. Our offices are owned by Bimini, the parent of our Manager, and are located at 3305 Flamingo Drive, Vero Beach, Florida 32963. We consider this property to be adequate for our business as currently conducted. Our telephone number is (772) 231-1400.
ITEM 3. LEGAL PROCEEDINGS
We are not party to any material pending legal proceedings as described in Item 103 of Regulation S-K.
ITEM 4. MINE SAFETY DISCLOSURES
Not Applicable.
41
PART II
ITEM 5. MARKET FOR REGISTRANT'S COMMON EQUITY, RELATED STOCKHOLDER MATTERS AND ISSUER PURCHASES OF EQUITY SECURITIES
Market Information
Our common stock began trading publicly on the NYSE MKT under the trading symbol "ORC" on February 14, 2013. There was no established public market for our common stock prior to February 14, 2013. Effective as of
October 8, 2014, our common stock began trading on the NYSE under the symbol "ORC."
As of January 31, 2018, we had 53,065,790 shares of common stock issued and outstanding which were held by 11 shareholders of record and 27,711 beneficial owners whose shares were held in "street name" by brokers and depository institutions.
The following table is a summary of historical price information and dividends declared and paid per share of common stock.
|
High
|
Low
|
Close
|
Dividends Declared
|
|||||||||||||
|
2017
|
||||||||||||||||
|
First quarter
|
$
|
12.60
|
$
|
9.23
|
$
|
9.99
|
$
|
0.42
|
||||||||
|
Second quarter
|
11.13
|
9.81
|
9.86
|
0.42
|
||||||||||||
|
Third quarter
|
10.30
|
9.18
|
10.19
|
0.42
|
||||||||||||
|
Fourth quarter
|
10.47
|
9.20
|
9.28
|
0.42
|
||||||||||||
|
2016
|
||||||||||||||||
|
First quarter
|
$
|
10.70
|
$
|
7.50
|
$
|
10.37
|
$
|
0.42
|
||||||||
|
Second quarter
|
10.94
|
9.26
|
10.29
|
0.42
|
||||||||||||
|
Third quarter
|
11.25
|
10.08
|
10.42
|
0.42
|
||||||||||||
|
Fourth quarter
|
11.12
|
9.95
|
10.83
|
0.42
|
||||||||||||
Dividend Distribution Policy
We intend to continue to make regular monthly cash distributions to our stockholders, as more fully described below. To qualify as a REIT, we must distribute annually to our stockholders an amount at least equal to 90% of our REIT taxable income, determined without regard to the deduction for dividends paid and excluding any net capital gain. We will be subject to income tax on our taxable income that is not distributed and to an excise tax to the extent that certain percentages of our taxable income are not distributed by specified dates. Income as computed for purposes of the foregoing tax rules will not necessarily correspond to our income as determined for financial reporting purposes pursuant to GAAP.
Any additional distributions we make will be authorized by and at the discretion of our Board of Directors based upon a variety of factors deemed relevant by our directors, which may include:
|
·
|
actual results of operations;
|
|
·
|
our financial condition;
|
|
·
|
our level of retained cash flows;
|
|
·
|
our capital requirements;
|
|
·
|
any debt service requirements;
|
|
·
|
our taxable income;
|
|
·
|
the annual distribution requirements under the REIT provisions of the Code;
|
|
·
|
applicable provisions of Maryland law; and
|
|
·
|
other factors that our Board of Directors may deem relevant.
|
42
We have not established a minimum distribution payment level, and we cannot assure you of our ability to make distributions to our stockholders in the future.
Our charter authorizes us to issue preferred stock that could have a preference over our common stock with respect to distributions. We currently have no intention to issue any preferred stock, but if we do, the distribution preference on the preferred stock could limit our ability to make distributions to the holders of our common stock.
Our ability to make distributions to our stockholders will depend upon the performance of our investment portfolio, and, in turn, upon our Manager's management of our business. To the extent that our cash available for distribution is less than the amount required to be distributed under the REIT provisions of the Code, we may consider various funding sources to cover any shortfall, including selling certain of our assets, borrowing funds or using a portion of the net proceeds we receive in future offerings (and thus all or a portion of such distributions may constitute a return of capital for U.S. federal income tax purposes). We also may elect to pay all or a portion of any distribution in the form of a taxable distribution of our stock or debt securities. In addition, our Board of Directors may change our distribution policy in the future.
Performance Graph
Set forth below is a graph comparing the yearly percentage change in the cumulative total return on our common stock, with the cumulative total return of the S&P 500 Total Return Index, the FTSE NAREIT Mortgage REIT Index and an index of selected issuers in our Agency REIT Peer group (composed of AGNC Investment Corp., Annaly Capital Management, Inc., Anworth Mortgage Asset Corporation, Armour Residential REIT, Inc., Capstead Mortgage Corporation and CYS Investments, Inc.) for the period beginning February 13, 2013 (the date of our IPO) and ending December 31, 2017, assuming the investment of $100 on February 13, 2013 and the reinvestment of dividends. The information in the performance chart and the table below has been obtained from sources believed to be reliable, but its accuracy nor its completeness can be guaranteed. The historical information set forth below is not necessarily indicative of future performance.
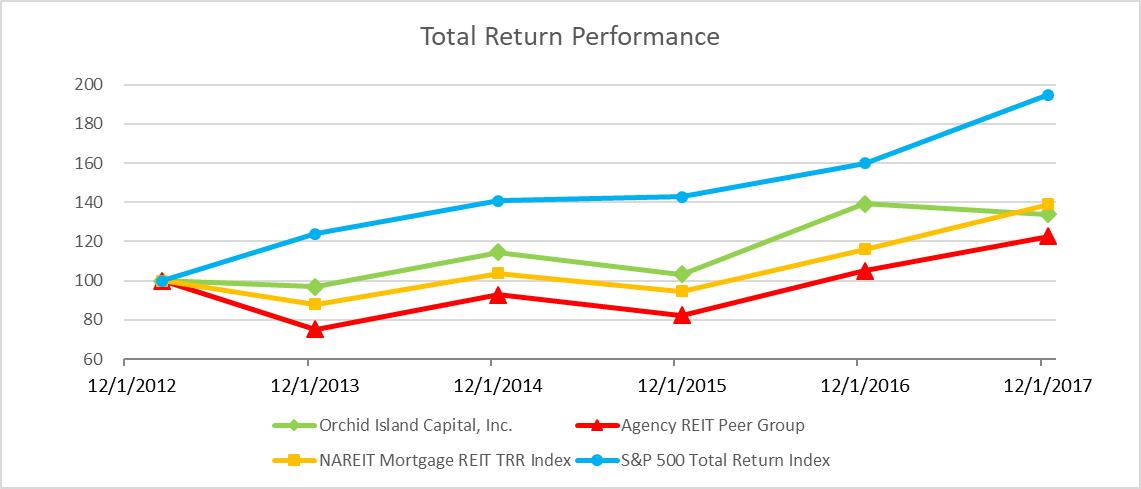
|
2/13/13
|
12/31/13
|
12/31/14
|
12/31/15
|
12/31/16
|
12/31/17
|
|||||||||||||||||||
|
Orchid Island Capital, Inc.
|
100.00
|
96.94
|
114.56
|
103.34
|
139.12
|
133.99
|
||||||||||||||||||
|
Agency REIT Peer Group
|
100.00
|
75.33
|
92.85
|
82.30
|
104.94
|
122.62
|
||||||||||||||||||
|
NAREIT Mortgage REIT TRR Index
|
100.00
|
87.97
|
103.71
|
94.50
|
116.10
|
139.07
|
||||||||||||||||||
|
S&P 500 Total Return Index
|
100.00
|
123.87
|
140.83
|
142.78
|
159.85
|
194.75
|
||||||||||||||||||
43
Securities Authorized for Issuance under Equity Compensation Plans
Information about securities authorized for issuance under our equity compensation plans required for this Item 5 is incorporated by reference to our definitive Proxy Statement to be filed in connection with our 2018 annual meeting of stockholders.
Unregistered Sales of Equity Securities
The Company did not issue or sell equity securities that were not registered under the Securities Act during the year ended December 31, 2017.
Issuer Purchases of Equity Securities
The table below presents share repurchase activity for the three months ended December 31, 2017.
|
Shares Purchased
|
Maximum Number
|
|||||||||||||||
|
Total Number
|
Weighted-Average
|
as Part of Publicly
|
of Shares That May Yet
|
|||||||||||||
|
of Shares
|
Price Paid
|
Announced
|
Be Repurchased Under
|
|||||||||||||
|
Repurchased
(1)
|
Per Share
|
Programs
(2)
|
the Authorization
(2)
|
|||||||||||||
|
October
|
-
|
$
|
-
|
-
|
783,757
|
|||||||||||
|
November
|
-
|
-
|
-
|
783,757
|
||||||||||||
|
December
|
457
|
9.40
|
-
|
783,757
|
||||||||||||
|
Totals / Weighted Average
|
457
|
$
|
9.40
|
-
|
783,757
|
|||||||||||
|
(1)
|
The only shares of the Company's common stock acquired by the Company were in connection with the satisfaction of tax withholding obligations on vested employment-related awards under equity incentive plans.
|
|
(2)
|
On July 29, 2015, the Board of Directors passed a resolution authorizing the repurchase of up to 2,000,000 shares of the Company's common stock. As part of the stock repurchase program, shares may be purchased in open market transactions, including through block purchases, privately negotiated transactions, or pursuant to any trading plan that may be adopted in accordance with Rule 10b5-1 of the Securities Exchange Act of 1934, as amended (the "Exchange Act"). Open market repurchases will be made in accordance with Exchange Act Rule 10b-18, which sets certain restrictions on the method, timing, price and volume of open market stock repurchases. The timing, manner, price and amount of any repurchases will be determined by the Company in its discretion and will be subject to economic and market conditions, stock price, applicable legal requirements and other factors. The authorization does not obligate the Company to acquire any particular amount of common stock, and the program may be suspended or discontinued at the Company's discretion without prior notice. Through December 31, 2017, the Company repurchased a total of 1,216,243 shares under the stock repurchase program at an aggregate cost of approximately $10.8 million, including commissions and fees, for a weighted average price of $8.92 per share. On February 8, 2018, the Board of Directors approved an increase in the stock repurchase program for up to an additional
4,522,822
shares of the Company's common stock, which results in a total authorization under the repurchase program for up to
5,306,579
shares of our common stock. This repurchase program has no termination date. There were no shares purchased under this program during 2017.
|
44
ITEM 6. SELECTED FINANCIAL DATA
The following selected financial data are derived from our audited financial statements for the five years ended December 31, 2017. The selected financial data should be read in conjunction with the more detailed information contained in the Consolidated Financial Statements and Notes thereto and "Management's Discussion and Analysis of Financial Condition and Results of Operations" included elsewhere in this Annual Report on Form 10-K.
|
($ in thousands, except per share data)
|
||||||||||||||||||||
|
December 31,
|
||||||||||||||||||||
|
2017
|
2016
|
2015
|
2014
|
2013
|
||||||||||||||||
|
Balance Sheet Data:
|
||||||||||||||||||||
|
Mortgage-backed securities
|
$
|
3,744,811
|
$
|
3,022,174
|
$
|
2,158,010
|
$
|
1,549,171
|
$
|
351,223
|
||||||||||
|
Total assets
|
$
|
4,023,343
|
$
|
3,138,694
|
$
|
2,241,837
|
$
|
1,657,808
|
$
|
363,576
|
||||||||||
|
Borrowings
|
$
|
3,533,786
|
$
|
2,793,705
|
$
|
1,986,313
|
$
|
1,436,651
|
$
|
318,557
|
||||||||||
|
Total liabilities
|
$
|
3,561,132
|
$
|
2,805,915
|
$
|
1,988,582
|
$
|
1,439,730
|
$
|
318,811
|
||||||||||
|
Total stockholders' equity
|
$
|
462,211
|
$
|
332,779
|
$
|
253,255
|
$
|
218,078
|
$
|
44,765
|
||||||||||
|
Book value per share of common stock
|
$
|
8.71
|
$
|
10.10
|
$
|
11.64
|
$
|
13.06
|
$
|
13.40
|
||||||||||
|
Year Ended December 31,
|
||||||||||||||||||||
|
2017
|
2016
|
2015
|
2014
|
2013
|
||||||||||||||||
|
Income Statement Data
|
||||||||||||||||||||
|
Interest income
|
$
|
145,962
|
$
|
87,127
|
$
|
68,811
|
$
|
31,804
|
$
|
9,199
|
||||||||||
|
Interest expense
|
(41,671
|
)
|
(15,604
|
)
|
(7,271
|
)
|
(3,031
|
)
|
(1,126
|
)
|
||||||||||
|
Net interest income
|
104,291
|
71,523
|
61,540
|
28,773
|
8,073
|
|||||||||||||||
|
(Losses) gains
|
(91,118
|
)
|
(60,451
|
)
|
(52,575
|
)
|
234
|
(7,103
|
)
|
|||||||||||
|
Expenses
|
11,166
|
9,093
|
7,894
|
4,488
|
1,668
|
|||||||||||||||
|
Net income
|
$
|
2,007
|
$
|
1,979
|
$
|
1,071
|
$
|
24,519
|
$
|
(698
|
)
|
|||||||||
|
Weighted average shares outstanding
|
41,062,039
|
24,099,714
|
20,266,706
|
9,890,058
|
3,011,912
|
|||||||||||||||
|
Basic and diluted net income per share
|
$
|
0.05
|
$
|
0.08
|
$
|
0.05
|
$
|
2.48
|
$
|
(0.23
|
)
|
|||||||||
|
Dividends declared per share
|
$
|
1.68
|
$
|
1.68
|
$
|
1.92
|
$
|
2.16
|
$
|
1.40
|
||||||||||
|
Other Data (unaudited)
|
||||||||||||||||||||
|
Average RMBS
(1)
|
$
|
3,578,419
|
$
|
2,322,973
|
$
|
1,955,673
|
$
|
937,373
|
$
|
316,124
|
||||||||||
|
Average borrowings
(1)
|
$
|
3,300,722
|
$
|
2,172,106
|
$
|
1,782,086
|
$
|
892,132
|
$
|
284,522
|
||||||||||
|
Average stockholders' equity
(1)
|
$
|
391,071
|
$
|
267,719
|
$
|
251,607
|
$
|
134,327
|
$
|
42,955
|
||||||||||
|
Leverage ratio (at period end)
(2)
|
7.7:1
|
8.4:1
|
7.9:1
|
6.6:1
|
7.1:1
|
|||||||||||||||
|
Average yield on RMBS
(3)
|
4.08
|
%
|
3.75
|
%
|
3.52
|
%
|
3.39
|
%
|
2.91
|
%
|
||||||||||
|
Average cost of funds
(3)
|
1.26
|
%
|
0.72
|
%
|
0.41
|
%
|
0.34
|
%
|
0.40
|
%
|
||||||||||
|
Average economic cost of funds
(4)
|
1.70
|
%
|
1.17
|
%
|
0.58
|
%
|
0.36
|
%
|
0.44
|
%
|
||||||||||
|
Average interest rate spread
(5)
|
2.82
|
%
|
3.03
|
%
|
3.11
|
%
|
3.05
|
%
|
2.51
|
%
|
||||||||||
|
Average economic interest rate spread
(6)
|
2.38
|
%
|
2.58
|
%
|
2.94
|
%
|
3.03
|
%
|
2.47
|
%
|
||||||||||
|
(1)
|
Average RMBS, borrowings and stockholders' equity balances are calculated as the average of the quarterly averages.
|
|
(2)
|
The leverage ratio is calculated by dividing total ending liabilities by ending stockholders' equity.
|
|
(3)
|
Portfolio yields and costs of funds are calculated based on the average balances of the underlying investment portfolio/borrowing balances and are annualized for the quarterly periods presented.
|
|
(4)
|
Represents interest cost of our borrowings and the effect of Eurodollar and T-Note futures contracts, interest rate swaps and interest rate swaptions attributed to the period related to hedging activities, divided by average borrowings.
|
|
(5)
|
Average interest rate spread is calculated by subtracting average cost of funds from average yield on RMBS.
|
|
(6)
|
Average economic interest rate spread is calculated by subtracting average economic cost of funds from average yield on RMBS.
|
45
ITEM 7. MANAGEMENT'S DISCUSSION AND ANALYSIS OF FINANCIAL CONDITION AND RESULTS OF OPERATIONS
The following discussion of our financial condition and results of operations should be read in conjunction with the consolidated financial statements and notes to those statements included in Item 8 of this Form 10-K. The discussion may contain certain forward-looking statements that involve risks and uncertainties. Forward-looking statements are those that are not historical in nature. As a result of many factors, such as those set forth under "Risk Factors" in this Form 10-K, our actual results may differ materially from those anticipated in such forward-looking statements.
Overview
We are a specialty finance company that invests in residential mortgage-backed securities ("RMBS") which are issued and guaranteed by a federally chartered corporation or agency ("Agency RMBS"). Our investment strategy focuses on, and our portfolio consists of, two categories of Agency RMBS: (i) traditional pass-through Agency RMBS ("PT RMBS") and (ii) structured Agency RMBS, such as collateralized mortgage obligations ("CMOs"), interest-only securities ("IOs"), inverse interest-only securities ("IIOs") and principal only securities ("POs"), among other types of structured Agency RMBS. We were formed by Bimini in August 2010, commenced operations on November 24, 2010 and completed our initial public offering ("IPO") on February 20, 2013. We are externally managed by Bimini Advisors, a registered investment adviser with the Securities and Exchange Commission (the "SEC").
Our business objective is to provide attractive risk-adjusted total returns over the long term through a combination of capital appreciation and the payment of regular monthly distributions. We intend to achieve this objective by investing in and strategically allocating capital between the two categories of Agency RMBS described above. We seek to generate income from (i) the net interest margin on our leveraged PT RMBS portfolio and the leveraged portion of our structured Agency RMBS portfolio, and (ii) the interest income we generate from the unleveraged portion of our structured Agency RMBS portfolio. We intend to fund our PT RMBS and certain of our structured Agency RMBS through short-term borrowings structured as repurchase agreements. PT RMBS and structured Agency RMBS typically exhibit materially different sensitivities to movements in interest rates. Declines in the value of one portfolio may be offset by appreciation in the other. The percentage of capital that we allocate to our two Agency RMBS asset categories will vary and will be actively managed in an effort to maintain the level of income generated by the combined portfolios, the stability of that income stream and the stability of the value of the combined portfolios. We believe that this strategy will enhance our liquidity, earnings, book value stability and asset selection opportunities in various interest rate environments.
We operate so as to qualify to be taxed as a real estate investment trust ("REIT") under the Internal Revenue Code of 1986, as amended (the "Code"). We generally will not be subject to U.S. federal income tax to the extent that we currently distribute all of our REIT taxable income (as defined in the Code) to our stockholders and maintain our REIT qualification.
The Company's common stock trades on the New York Stock Exchange ("NYSE") under the symbol "ORC".
Capital Raising Activities
On March 2, 2015, we entered into an equity distribution agreement (the "March 2015 Equity Distribution Agreement") with two sales agents pursuant to which we could offer and sell, from time to time, up to an aggregate amount of $100,000,000 of shares of our common stock in transactions that were deemed to be "at the market" offerings and privately negotiated transactions. We issued a total of 7,218,766 shares under the March 2015 Equity Distribution Agreement for aggregate gross proceeds of approximately $95.4 million, and net proceeds of approximately $93.2 million, net of commissions and fees, prior to its termination.
46
On July 29, 2015, the Company's Board of Directors authorized the repurchase of up to 2,000,000 shares of our common stock. The timing, manner, price and amount of any repurchases will be determined by the Company in its discretion and will be subject to economic and market conditions, stock price, applicable legal requirements and other factors. The authorization does not obligate the Company to acquire any particular amount of common stock and the program may be suspended or discontinued at the Company's discretion without prior notice. From the inception of the share repurchase program through December 31, 2015, we repurchased a total of 1,216,243 shares at an aggregate cost of approximately $10.8 million, including commissions and fees, for a weighted average price of $8.92 per share. On February 8, 2018, the Board of Directors approved an increase in the stock repurchase program for up to an additional
4,522,822
shares of the Company's common stock, which results in a total authorization under the repurchase program for up to
5,306,579
shares of our common stock. This repurchase program has no termination date. There were no shares purchased under this program during 2017. We did not repurchase any shares of our common stock in 2016 or 2017.
On July 29, 2016, we entered into an equity distribution agreement (the "July 2016 Equity Distribution Agreement") with two sales agents pursuant to which we could offer and sell, from time to time, up to an aggregate amount of $125,000,000 of shares of our common stock in transactions that were deemed to be "at the market" offerings and privately negotiated transactions.
The July 2016 Equity Distribution Agreement replaced the March 2015 Equity Distribution Agreement.
We issued a total of 10,174,992 shares under the July 2016 Equity Distribution Agreement for aggregate gross proceeds of $110.0 million, and net proceeds of approximately $108.2 million, net of commissions and fees, prior to its termination.
On February 23, 2017, we entered into another equity distribution agreement, as amended and restated on May 10, 2017 (the "May 2017 Equity Distribution Agreement"), with two sales agents pursuant to which we could offer and sell, from time to time, up to an aggregate amount of $125,000,000 of shares of our common stock in transactions that were deemed to be "at the market" offerings and privately negotiated transactions. The May 2017 Equity Distribution Agreement replaced the July 2016 Equity Distribution Agreement. We issued a total of 12,299,032 shares under the May 2017 Equity Distribution Agreement for aggregate gross proceeds of $125.0 million, and net proceeds of approximately $122.9 million, net of commissions and fees, prior to its termination.
On August 2, 2017, we entered into another equity distribution agreement (the "August 2017 Equity Distribution Agreement") with two sales agents pursuant to which we may offer and sell, from time to time, up to an aggregate amount of $125,000,000 of shares of our common stock in transactions that are deemed to be "at the market" offerings and privately negotiated transactions. The August 2017 Equity Distribution Agreement replaced the May 2017 Equity Distribution Agreement. Through December 31, 2017, we issued a total of 7,746,052 shares under the August 2017 Equity Distribution Agreement for aggregate gross proceeds of $76.0 million, and net proceeds of approximately $74.7 million, net of commissions and fees.
Factors that Affect our Results of Operations and Financial Condition
A variety of industry and economic factors may impact our results of operations and financial condition. These factors include:
|
·
|
interest rate trends;
|
|
·
|
the difference between Agency RMBS yields and our funding and hedging costs;
|
|
·
|
competition for, and supply of, investments in Agency RMBS;
|
|
·
|
actions taken by the U.S. government, including the presidential administration, the Federal Reserve (the "Fed"), the Federal Open Market Committee (the "FOMC") and the U.S. Treasury;
|
|
·
|
prepayment rates on mortgages underlying our Agency RMBS, and credit trends insofar as they affect prepayment rates; and
|
|
·
|
other market developments.
|
In addition, a variety of factors relating to our business may also impact our results of operations and financial condition. These factors include:
|
·
|
our degree of leverage;
|
|
·
|
our access to funding and borrowing capacity;
|
|
·
|
our borrowing costs;
|
|
·
|
our hedging activities;
|
|
·
|
the market value of our investments; and
|
|
·
|
the requirements to qualify as a REIT and the requirements to qualify for a registration exemption under the Investment Company Act.
|
47
Results of Operations
Described below are the Company's results of operations for the years ended December 31, 2017, as compared to the Company's results of operations for the years ended December 31, 2016 and 2015.
Net Income Summary
Net income for the year ended December 31, 2017 was $2.0 million, or $0.05 per share. Net income for the year ended December 31, 2016 was $2.0 million, or $0.08 per share. Net income for the year ended December 31, 2015 was $1.1 million, or $0.05 per share. The components of net income for the years ended December 31, 2017, 2016 and 2015 are presented in the table below:
|
(in thousands)
|
||||||||||||
|
2017
|
2016
|
2015
|
||||||||||
|
Interest income
|
$
|
145,962
|
$
|
87,127
|
$
|
68,811
|
||||||
|
Interest expense
|
(41,671
|
)
|
(15,604
|
)
|
(7,271
|
)
|
||||||
|
Net interest income
|
104,291
|
71,523
|
61,540
|
|||||||||
|
Losses on RMBS and derivative contracts
|
(91,118
|
)
|
(60,451
|
)
|
(52,575
|
)
|
||||||
|
Net portfolio income
|
13,173
|
11,072
|
8,965
|
|||||||||
|
Expenses
|
(11,166
|
)
|
(9,093
|
)
|
(7,894
|
)
|
||||||
|
Net income
|
$
|
2,007
|
$
|
1,979
|
$
|
1,071
|
||||||
GAAP and Non-GAAP Reconciliations
In addition to the results presented in accordance with GAAP, our results of operations discussed below include certain non-GAAP financial information, including "Net Earnings Excluding Realized and Unrealized Gains and Losses", "Economic Interest Expense" and "Economic Net Interest Income."
Net Earnings Excluding Realized and Unrealized Gains and Losses
We have elected to account for our Agency RMBS under the fair value option. Securities held under the fair value option are recorded at estimated fair value, with changes in the fair value recorded as unrealized gains or losses through the consolidated statements of operations.
In addition, we have not elected to designate our derivative holdings for hedge accounting treatment under the Financial Accounting Standards Board (the "FASB") Accounting Standards Codification ("ASC") Topic 815,
Derivatives and Hedging
. Changes in fair value of these instruments are presented in a separate line item in the Company's consolidated statements of operations and not included in interest expense. As such, for financial reporting purposes, interest expense and cost of funds are not impacted by the fluctuation in value of the derivative instruments.
48
Presenting net earnings excluding realized and unrealized gains allows management to: (i) isolate the net interest income and other expenses of the Company over time, free of all mark-to-market adjustments and (ii) assess the effectiveness of our funding and hedging strategies on our capital allocation decisions and our asset allocation performance. Our funding and hedging strategies, capital allocation and asset selection are integral to our risk management strategy, and therefore critical to the management of our portfolio. We believe that the presentation of our net earnings excluding realized and unrealized gains is useful to investors because it provides a means of comparing our results of operations to those of our peers who have not elected the same accounting treatment. Our presentation of net earnings excluding realized and unrealized gains and losses may not be comparable to similarly-titled measures of other companies, who may use different calculations. As a result, net earnings excluding realized and unrealized gains and losses should not be considered as a substitute for our GAAP net income (loss) as a measure of our financial performance or any measure of our liquidity under GAAP. The table below presents a reconciliation of our net income (loss) determined in accordance with GAAP and net earnings excluding realized and unrealized gains.
|
Net Earnings Excluding Realized and Unrealized Gains and Losses
|
||||||||||||||||||||||||
|
(in thousands, except per share data)
|
||||||||||||||||||||||||
|
Per Share
|
||||||||||||||||||||||||
|
Net Earnings
|
Net Earnings
|
|||||||||||||||||||||||
|
Excluding
|
Excluding
|
|||||||||||||||||||||||
|
Realized and
|
Realized and
|
Realized and
|
Realized and
|
|||||||||||||||||||||
|
Net
|
Unrealized
|
Unrealized
|
Net
|
Unrealized
|
Unrealized
|
|||||||||||||||||||
|
Income
|
Gains and
|
Gains and
|
Income
|
Gains and
|
Gains and
|
|||||||||||||||||||
|
(GAAP)
|
Losses
(1)
|
Losses
|
(GAAP)
|
Losses
|
Losses
|
|||||||||||||||||||
|
Three Months Ended
|
||||||||||||||||||||||||
|
December 31, 2017
|
$
|
(5,982
|
)
|
(29,540
|
)
|
$
|
23,558
|
$
|
(0.12
|
)
|
$
|
(0.61
|
)
|
$
|
0.49
|
|||||||||
|
September 30, 2017
|
15,183
|
(8,254
|
)
|
23,437
|
0.33
|
(0.18
|
)
|
0.52
|
||||||||||||||||
|
June 30, 2017
|
(9,643
|
)
|
(32,597
|
)
|
22,954
|
(0.26
|
)
|
(0.88
|
)
|
0.62
|
||||||||||||||
|
March 31, 2017
|
2,449
|
(20,727
|
)
|
23,176
|
0.07
|
(0.63
|
)
|
0.70
|
||||||||||||||||
|
December 31, 2016
|
(20,419
|
)
|
(38,003
|
)
|
17,584
|
(0.72
|
)
|
(1.33
|
)
|
0.62
|
||||||||||||||
|
September 30, 2016
|
20,526
|
4,418
|
16,108
|
0.85
|
0.18
|
0.67
|
||||||||||||||||||
|
June 30, 2016
|
6,463
|
(7,319
|
)
|
13,782
|
0.29
|
(0.33
|
)
|
0.63
|
||||||||||||||||
|
March 31, 2016
|
(4,591
|
)
|
(19,561
|
)
|
14,970
|
(0.21
|
)
|
(0.90
|
)
|
0.69
|
||||||||||||||
|
December 31, 2015
|
7,809
|
(6,813
|
)
|
14,622
|
0.36
|
(0.31
|
)
|
0.67
|
||||||||||||||||
|
September 30, 2015
|
(9,416
|
)
|
(23,682
|
)
|
14,266
|
(0.42
|
)
|
(1.05
|
)
|
0.63
|
||||||||||||||
|
June 30, 2015
|
(2,831
|
)
|
(16,017
|
)
|
13,186
|
(0.14
|
)
|
(0.81
|
)
|
0.67
|
||||||||||||||
|
March 31, 2015
|
5,509
|
(6,063
|
)
|
11,572
|
0.33
|
(0.36
|
)
|
0.69
|
||||||||||||||||
|
Years Ended
|
||||||||||||||||||||||||
|
December 31, 2017
|
$
|
2,007
|
$
|
(91,118
|
)
|
$
|
93,125
|
$
|
(0.05
|
)
|
$
|
(2.22
|
)
|
$
|
2.27
|
|||||||||
|
December 31, 2016
|
1,979
|
(60,465
|
)
|
62,444
|
0.08
|
(2.51
|
)
|
2.59
|
||||||||||||||||
|
December 31, 2015
|
1,071
|
(52,575
|
)
|
53,646
|
0.05
|
(2.59
|
)
|
2.65
|
||||||||||||||||
|
(1)
|
Includes realized and unrealized gains (losses) on RMBS and derivative financial instruments, including net interest expense on interest rate swaps
.
|
Economic Interest Expense and Economic Net Interest Income
We use derivative instruments, specifically Eurodollar and Treasury Note ("T-Note") futures contracts, interest rate swaps and swaptions, to hedge a portion of the interest rate risk on repurchase agreements in a rising rate environment.
49
We have not elected to designate our derivative holdings for hedge accounting treatment under the Financial Accounting Standards Board, (the "FASB"), Accounting Standards Codification, ("ASC"), Topic 815,
Derivatives and Hedging
. Changes in fair value of these instruments are presented in a separate line item in our consolidated statements of operations and not included in interest expense. As such, for financial reporting purposes, interest expense and cost of funds are not impacted by the fluctuation in value of the derivative instruments.
For the purpose of computing economic net interest income and ratios relating to cost of funds measures, GAAP interest expense has been adjusted to reflect the realized gains or losses on specific derivative instruments that pertain to each period presented. We believe that adjusting our interest expense for the periods presented by the gains or losses on all derivative instruments would not accurately reflect our economic interest expense for these periods. For each period presented, we have combined the effects of the derivative financial instruments in place for the respective period with the actual interest expense incurred on borrowings to reflect total economic interest expense for the applicable period. Interest expense, including the effect of derivative instruments for the period, is referred to as economic interest expense. Net interest income, when calculated to include the effect of derivative instruments for the period, is referred to as economic net interest income. This presentation includes gains or losses on all contracts in effect during the reporting period, covering the current period as well as periods in the future.
We believe that economic interest expense and economic net interest income provide meaningful information to consider, in addition to the respective amounts prepared in accordance with GAAP. The non-GAAP measures help management to evaluate its financial position and performance without the effects of certain transactions and GAAP adjustments that are not necessarily indicative of our current investment portfolio or operations. The unrealized gains or losses on derivative instruments presented in our consolidated statements of operations are not necessarily representative of the total interest rate expense that we will ultimately realize. This is because as interest rates move up or down in the future, the gains or losses we ultimately realize, and which will affect our total interest rate expense in future periods, may differ from the unrealized gains or losses recognized as of the reporting date.
Our presentation of the economic value of our hedging strategy has important limitations. First, other market participants may calculate economic interest expense and economic net interest income differently than the way we calculate them. Second, while we believe that the calculation of the economic value of our hedging strategy described above helps to present our financial position and performance, it may be of limited usefulness as an analytical tool. Therefore, the economic value of our investment strategy should not be viewed in isolation and is not a substitute for interest expense and net interest income computed in accordance with GAAP.
50
The tables below present a reconciliation of the adjustments to interest expense shown for each period relative to our derivative instruments, and the income statement line item, gains (losses) on derivative instruments, calculated in accordance with GAAP for the years ended December 31, 2017, 2016 and 2015 and each quarter during 2017, 2016 and 2015.
|
Gains (Losses) on Derivative Instruments
|
||||||||||||||||
|
(in thousands)
|
||||||||||||||||
|
Funding Hedges
|
||||||||||||||||
|
Recognized in
|
Attributed to
|
Attributed to
|
||||||||||||||
|
Income
|
TBA
|
Current
|
Future
|
|||||||||||||
|
Statement
|
Securities
|
Period
|
Periods
|
|||||||||||||
|
(GAAP)
|
Income
|
(Non-GAAP)
|
(Non-GAAP)
|
|||||||||||||
|
Three Months Ended
|
||||||||||||||||
|
December 31, 2017
|
$
|
13,982
|
$
|
(2,094
|
)
|
$
|
(3,763
|
)
|
$
|
19,839
|
||||||
|
September 30, 2017
|
(5,470
|
)
|
(1,459
|
)
|
(3,761
|
)
|
(250
|
)
|
||||||||
|
June 30, 2017
|
(19,442
|
)
|
(2,384
|
)
|
(3,654
|
)
|
(13,404
|
)
|
||||||||
|
March 31, 2017
|
(4,419
|
)
|
-
|
(3,193
|
)
|
(1,226
|
)
|
|||||||||
|
December 31, 2016
|
23,207
|
(133
|
)
|
(2,967
|
)
|
26,307
|
||||||||||
|
September 30, 2016
|
6,587
|
(474
|
)
|
(2,660
|
)
|
9,721
|
||||||||||
|
June 30, 2016
|
(11,591
|
)
|
(786
|
)
|
(2,210
|
)
|
(8,595
|
)
|
||||||||
|
March 31, 2016
|
(27,590
|
)
|
(1,125
|
)
|
(1,933
|
)
|
(24,532
|
)
|
||||||||
|
December 31, 2015
|
12,770
|
362
|
(1,196
|
)
|
13,604
|
|||||||||||
|
September 30, 2015
|
(22,506
|
)
|
55
|
(881
|
)
|
(21,680
|
)
|
|||||||||
|
June 30, 2015
|
(803
|
)
|
(88
|
)
|
(595
|
)
|
(120
|
)
|
||||||||
|
March 31, 2015
|
(12,351
|
)
|
57
|
(306
|
)
|
(12,102
|
)
|
|||||||||
|
Years Ended
|
||||||||||||||||
|
December 31, 2017
|
$
|
(15,349
|
)
|
$
|
(5,937
|
)
|
$
|
(14,371
|
)
|
$
|
4,959
|
|||||
|
December 31, 2016
|
(9,387
|
)
|
(2,518
|
)
|
(9,770
|
)
|
2,901
|
|||||||||
|
December 31, 2015
|
(22,890
|
)
|
386
|
(2,978
|
)
|
(20,298
|
)
|
|||||||||
51
|
Economic Interest Expense and Economic Net Interest Income
|
||||||||||||||||||||||||
|
(in thousands)
|
||||||||||||||||||||||||
|
Interest Expense on Borrowings
|
||||||||||||||||||||||||
|
Gains
|
||||||||||||||||||||||||
|
(Losses) on
|
||||||||||||||||||||||||
|
Derivative
|
||||||||||||||||||||||||
|
Instruments
|
Net Interest Income
|
|||||||||||||||||||||||
|
GAAP
|
Attributed
|
Economic
|
GAAP
|
Economic
|
||||||||||||||||||||
|
Interest
|
Interest
|
to Current
|
Interest
|
Net Interest
|
Net Interest
|
|||||||||||||||||||
|
Income
|
Expense
|
Period
(1)
|
Expense
(2)
|
Income
|
Income
(3)
|
|||||||||||||||||||
|
Three Months Ended
|
||||||||||||||||||||||||
|
December 31, 2017
|
$
|
40,098
|
$
|
13,555
|
$
|
(3,763
|
)
|
$
|
17,318
|
$
|
26,543
|
$
|
22,780
|
|||||||||||
|
September 30, 2017
|
38,974
|
12,638
|
(3,761
|
)
|
16,399
|
26,336
|
22,575
|
|||||||||||||||||
|
June 30, 2017
|
34,579
|
8,763
|
(3,654
|
)
|
12,417
|
25,816
|
22,162
|
|||||||||||||||||
|
March 31, 2017
|
32,311
|
6,715
|
(3,193
|
)
|
9,908
|
25,596
|
22,403
|
|||||||||||||||||
|
December 31, 2016
|
25,068
|
4,976
|
(2,967
|
)
|
7,943
|
20,092
|
17,125
|
|||||||||||||||||
|
September 30, 2016
|
22,358
|
3,979
|
(2,660
|
)
|
6,639
|
18,379
|
15,719
|
|||||||||||||||||
|
June 30, 2016
|
19,235
|
3,330
|
(2,210
|
)
|
5,540
|
15,905
|
13,695
|
|||||||||||||||||
|
March 31, 2016
|
20,466
|
3,319
|
(1,933
|
)
|
5,252
|
17,147
|
15,214
|
|||||||||||||||||
|
December 31, 2015
|
19,092
|
2,371
|
(1,196
|
)
|
3,567
|
16,721
|
15,525
|
|||||||||||||||||
|
September 30, 2015
|
18,352
|
2,037
|
(881
|
)
|
2,918
|
16,315
|
15,434
|
|||||||||||||||||
|
June 30, 2015
|
16,753
|
1,567
|
(595
|
)
|
2,162
|
15,186
|
14,591
|
|||||||||||||||||
|
March 31, 2015
|
14,614
|
1,296
|
(306
|
)
|
1,602
|
13,318
|
13,012
|
|||||||||||||||||
|
Years Ended
|
||||||||||||||||||||||||
|
December 31, 2017
|
$
|
145,962
|
$
|
41,671
|
$
|
(14,371
|
)
|
$
|
56,042
|
$
|
104,291
|
$
|
89,920
|
|||||||||||
|
December 31, 2016
|
87,127
|
15,604
|
(9,770
|
)
|
25,374
|
71,523
|
61,753
|
|||||||||||||||||
|
December 31, 2015
|
68,811
|
7,271
|
(2,978
|
)
|
10,249
|
61,540
|
58,562
|
|||||||||||||||||
|
(1)
|
Reflects the effect of derivative instrument hedges for only the period presented.
|
|
(2)
|
Calculated by adding the effect of derivative instrument hedges attributed to the period presented to GAAP interest expense.
|
|
(3)
|
Calculated by adding the effect of derivative instrument hedges attributed to the period presented to GAAP net interest income.
|
Net Interest Income
During the year ended December 31, 2017, we generated $104.3 million of net interest income, consisting of $146.0 million of interest income from RMBS assets offset by $41.7 million of interest expense on borrowings. For the comparable period ended December 31, 2016, we generated $71.5 million of net interest income, consisting of $87.1 million of interest income from RMBS assets offset by $15.6 million of interest expense on borrowings. The $58.8 million increase in interest income and $26.1 million increase in interest expense for the year ended December 31, 2017 primarily reflects the growth of our portfolio fueled by our net capital raising activities, combined with increased yields earned on our portfolio and increased costs and amounts of our borrowings.
For the year ended December 31, 2015, we generated $61.5 million of net interest income, consisting of $68.8 million of interest income from RMBS assets offset by $7.3 million of interest expense on borrowings. The $18.3 million increase in interest income and $8.3 million increase in interest expense for the year ended December 31, 2016 primarily reflects the growth of our portfolio due to our net capital raising activities, combined with increased yields earned on our portfolio and increased costs and amounts of our borrowings.
On an economic basis, our interest expense on borrowings for the years ended December 31, 2017, 2016 and 2015 was $56.0 million, $25.4 million and $10.2 million, respectively, resulting in $89.9 million, $61.8 million and $58.6 million of economic net interest income, respectively.
52
The tables below provide information on our portfolio average balances, interest income, yield on assets, average borrowings, interest expense, cost of funds, net interest income and net interest spread for each quarter in 2017, 2016 and 2015 and for the years ended December 31, 2017, 2016 and 2015 on both a GAAP and economic basis.
|
($ in thousands)
|
||||||||||||||||||||||||||||||||
|
Average
|
Yield on
|
Interest Expense
|
Average Cost of Funds
|
|||||||||||||||||||||||||||||
|
RMBS
|
Interest
|
Average
|
Average
|
GAAP
|
Economic
|
GAAP
|
Economic
|
|||||||||||||||||||||||||
|
Held
(1)
|
Income
|
RMBS
|
Borrowings
(1)
|
Basis
|
Basis
(2)
|
Basis
|
Basis
(3)
|
|||||||||||||||||||||||||
|
Three Months Ended
|
||||||||||||||||||||||||||||||||
|
December 31, 2017
|
$
|
3,837,575
|
$
|
40,098
|
4.18
|
%
|
$
|
3,621,931
|
$
|
13,554
|
$
|
17,317
|
1.50
|
%
|
1.91
|
%
|
||||||||||||||||
|
September 30, 2017
|
3,834,083
|
38,974
|
4.07
|
%
|
3,494,266
|
12,638
|
16,399
|
1.45
|
%
|
1.88
|
%
|
|||||||||||||||||||||
|
June 30, 2017
|
3,499,922
|
34,579
|
3.95
|
%
|
3,164,532
|
8,763
|
12,417
|
1.11
|
%
|
1.57
|
%
|
|||||||||||||||||||||
|
March 31, 2017
|
3,142,095
|
32,311
|
4.11
|
%
|
2,922,157
|
6,715
|
9,908
|
0.92
|
%
|
1.36
|
%
|
|||||||||||||||||||||
|
December 31, 2016
|
2,761,836
|
25,068
|
3.63
|
%
|
2,545,901
|
4,974
|
7,943
|
0.78
|
%
|
1.25
|
%
|
|||||||||||||||||||||
|
September 30, 2016
|
2,362,377
|
22,358
|
3.79
|
%
|
2,179,462
|
3,979
|
6,639
|
0.73
|
%
|
1.22
|
%
|
|||||||||||||||||||||
|
June 30, 2016
|
2,100,151
|
19,235
|
3.66
|
%
|
2,000,158
|
3,330
|
5,540
|
0.67
|
%
|
1.11
|
%
|
|||||||||||||||||||||
|
March 31, 2016
|
2,067,527
|
20,466
|
3.96
|
%
|
1,962,901
|
3,319
|
5,252
|
0.68
|
%
|
1.07
|
%
|
|||||||||||||||||||||
|
December 31, 2015
|
2,137,810
|
19,092
|
3.57
|
%
|
1,964,806
|
2,372
|
3,567
|
0.48
|
%
|
0.73
|
%
|
|||||||||||||||||||||
|
September 30, 2015
|
2,146,240
|
18,352
|
3.42
|
%
|
1,978,685
|
2,037
|
2,918
|
0.41
|
%
|
0.59
|
%
|
|||||||||||||||||||||
|
June 30, 2015
|
1,925,746
|
16,753
|
3.48
|
%
|
1,736,781
|
1,567
|
2,162
|
0.36
|
%
|
0.50
|
%
|
|||||||||||||||||||||
|
March 31, 2015
|
1,612,896
|
14,614
|
3.62
|
%
|
1,448,071
|
1,296
|
1,602
|
0.36
|
%
|
0.44
|
%
|
|||||||||||||||||||||
|
Years Ended
|
||||||||||||||||||||||||||||||||
|
December 31, 2017
|
$
|
3,578,419
|
$
|
145,962
|
4.08
|
%
|
$
|
3,300,722
|
$
|
41,670
|
$
|
56,041
|
1.26
|
%
|
1.70
|
%
|
||||||||||||||||
|
December 31, 2016
|
2,322,973
|
87,127
|
3.75
|
%
|
2,172,106
|
15,602
|
25,374
|
0.72
|
%
|
1.17
|
%
|
|||||||||||||||||||||
|
December 31, 2015
|
1,955,673
|
68,811
|
3.52
|
%
|
1,782,086
|
7,272
|
10,249
|
0.41
|
%
|
0.58
|
%
|
|||||||||||||||||||||
|
($ in thousands)
|
||||||||||||||||
|
Net Interest Income
|
Net Interest Spread
|
|||||||||||||||
|
GAAP
|
Economic
|
GAAP
|
Economic
|
|||||||||||||
|
Basis
|
Basis
(2)
|
Basis
|
Basis
(4)
|
|||||||||||||
|
Three Months Ended
|
||||||||||||||||
|
December 31, 2017
|
$
|
26,543
|
$
|
22,780
|
2.68
|
%
|
2.27
|
%
|
||||||||
|
September 30, 2017
|
26,336
|
22,575
|
2.62
|
%
|
2.19
|
%
|
||||||||||
|
June 30, 2017
|
25,816
|
22,162
|
2.84
|
%
|
2.38
|
%
|
||||||||||
|
March 31, 2017
|
25,596
|
22,403
|
3.19
|
%
|
2.75
|
%
|
||||||||||
|
December 31, 2016
|
20,092
|
17,125
|
2.85
|
%
|
2.38
|
%
|
||||||||||
|
September 30, 2016
|
18,379
|
15,719
|
3.06
|
%
|
2.57
|
%
|
||||||||||
|
June 30, 2016
|
15,905
|
13,695
|
2.99
|
%
|
2.55
|
%
|
||||||||||
|
March 31, 2016
|
17,146
|
15,214
|
3.28
|
%
|
2.89
|
%
|
||||||||||
|
December 31, 2015
|
16,720
|
15,525
|
3.09
|
%
|
2.84
|
%
|
||||||||||
|
September 30, 2015
|
16,315
|
15,434
|
3.01
|
%
|
2.83
|
%
|
||||||||||
|
June 30, 2015
|
15,186
|
14,591
|
3.12
|
%
|
2.98
|
%
|
||||||||||
|
March 31, 2015
|
13,318
|
13,012
|
3.26
|
%
|
3.18
|
%
|
||||||||||
|
Years Ended
|
||||||||||||||||
|
December 31, 2017
|
$
|
104,291
|
$
|
89,920
|
2.82
|
%
|
2.38
|
%
|
||||||||
|
December 31, 2016
|
71,522
|
61,753
|
3.03
|
%
|
2.58
|
%
|
||||||||||
|
December 31, 2015
|
61,539
|
58,562
|
3.11
|
%
|
2.94
|
%
|
||||||||||
|
(1)
|
Portfolio yields and costs of borrowings presented in the tables above and the tables on pages 54-56 are calculated based on the average balances of the underlying investment portfolio/borrowings balances and are annualized for the periods presented. Average balances for quarterly periods are calculated using two data points, the beginning and ending balances.
|
|
(2)
|
Economic interest expense and economic net interest income
presented in the table above and the tables on pages 55-56 includes the effect of our derivative instrument hedges for only the periods presented.
|
| (3) |
Represents interest cost of our borrowings and the effect of derivative instrument hedges attributed to the period divided by average RMBS.
|
| (4) |
Economic net interest spread is calculated by subtracting average economic cost of funds from realized yield on average RMBS.
|
53
Interest Income and Average Asset Yield
Our interest income for the years ended December 31, 2017 and 2016 was $146.0 million and $87.1 million, respectively. We had average RMBS holdings of $3,578.4 million and $2,323.0 million for the years ended December 31, 2017 and 2016, respectively. The yield on our portfolio was 4.08% and 3.75% for the years ended December 31, 2017 and 2016, respectively. For the year ended December 31, 2017 as compared to the year ended December 31, 2016, there was a $58.8 million increase in interest income due to a $1,255.4 million increase in average RMBS, combined with a 33 basis point ("bps") increase in the yield on average RMBS. The increase in average RMBS during the year ended December 31, 2017 reflects the deployment of the proceeds of our net capital raising activities, on a leveraged basis.
For the year ended December 31, 2015, we had interest income of $68.8 million and average RMBS holdings of $1,955.7 million, resulting in a yield on our portfolio of 3.52%. For the year ended December 31, 2016, as compared to the year ended December 31, 2015, there was a $18.3 million increase in interest income due to a $367.3 million increase in average RMBS, combined with a 23 bps increase in the yield on average RMBS. The increase in average RMBS during the year ended December 31, 2016 reflects the deployment of the proceeds of our net capital raising activities, on a leveraged basis.
The table below presents the average portfolio size, income and yields of our respective sub-portfolios, consisting of structured RMBS and PT RMBS for the years ended December 31, 2017, 2016 and 2015 and for each quarter during 2017, 2016 and 2015.
|
($ in thousands)
|
||||||||||||||||||||||||||||||||||||
|
Average RMBS Held
|
Interest Income
|
Realized Yield on Average RMBS
|
||||||||||||||||||||||||||||||||||
|
PT
|
Structured
|
PT
|
Structured
|
PT
|
Structured
|
|||||||||||||||||||||||||||||||
|
RMBS
|
RMBS
|
Total
|
RMBS
|
RMBS
|
Total
|
RMBS
|
RMBS
|
Total
|
||||||||||||||||||||||||||||
|
Three Months Ended
|
||||||||||||||||||||||||||||||||||||
|
December 31, 2017
|
$
|
3,704,163
|
$
|
133,412
|
$
|
3,837,575
|
$
|
38,927
|
$
|
1,171
|
$
|
40,098
|
4.20
|
%
|
3.51
|
%
|
4.18
|
%
|
||||||||||||||||||
|
September 30, 2017
|
3,687,533
|
146,550
|
3,834,083
|
38,476
|
498
|
38,974
|
4.17
|
%
|
1.36
|
%
|
4.07
|
%
|
||||||||||||||||||||||||
|
June 30, 2017
|
3,349,042
|
150,880
|
3,499,922
|
32,479
|
2,100
|
34,579
|
3.88
|
%
|
5.57
|
%
|
3.95
|
%
|
||||||||||||||||||||||||
|
March 31, 2017
|
2,990,937
|
151,158
|
3,142,095
|
29,772
|
2,539
|
32,311
|
3.98
|
%
|
6.72
|
%
|
4.11
|
%
|
||||||||||||||||||||||||
|
December 31, 2016
|
2,628,967
|
132,869
|
2,761,836
|
23,647
|
1,421
|
25,068
|
3.60
|
%
|
4.28
|
%
|
3.63
|
%
|
||||||||||||||||||||||||
|
September 30, 2016
|
2,257,480
|
104,897
|
2,362,377
|
21,898
|
460
|
22,358
|
3.88
|
%
|
1.75
|
%
|
3.79
|
%
|
||||||||||||||||||||||||
|
June 30, 2016
|
2,006,392
|
93,759
|
2,100,151
|
19,072
|
163
|
19,235
|
3.80
|
%
|
0.70
|
%
|
3.66
|
%
|
||||||||||||||||||||||||
|
March 31, 2016
|
1,968,690
|
98,837
|
2,067,527
|
19,682
|
784
|
20,466
|
4.00
|
%
|
3.17
|
%
|
3.96
|
%
|
||||||||||||||||||||||||
|
December 31, 2015
|
2,034,623
|
103,187
|
2,137,810
|
19,337
|
(245
|
)
|
19,092
|
3.80
|
%
|
(0.95
|
)%
|
3.57
|
%
|
|||||||||||||||||||||||
|
September 30, 2015
|
2,033,494
|
112,746
|
2,146,240
|
18,642
|
(290
|
)
|
18,352
|
3.67
|
%
|
(1.03
|
)%
|
3.42
|
%
|
|||||||||||||||||||||||
|
June 30, 2015
|
1,824,893
|
100,853
|
1,925,746
|
16,549
|
204
|
16,753
|
3.63
|
%
|
0.81
|
%
|
3.48
|
%
|
||||||||||||||||||||||||
|
March 31, 2015
|
1,541,497
|
71,399
|
1,612,896
|
14,629
|
(15
|
)
|
14,614
|
3.80
|
%
|
(0.09
|
)%
|
3.62
|
%
|
|||||||||||||||||||||||
|
Years Ended
|
||||||||||||||||||||||||||||||||||||
|
December 31, 2017
|
$
|
3,432,919
|
$
|
145,500
|
$
|
3,578,419
|
$
|
139,654
|
$
|
6,308
|
$
|
145,962
|
4.07
|
%
|
4.34
|
%
|
4.08
|
%
|
||||||||||||||||||
|
December 31, 2016
|
2,215,382
|
107,591
|
2,322,973
|
84,299
|
2,828
|
87,127
|
3.81
|
%
|
2.63
|
%
|
3.75
|
%
|
||||||||||||||||||||||||
|
December 31, 2015
|
1,858,627
|
97,046
|
1,955,673
|
69,157
|
(346
|
)
|
68,811
|
3.72
|
%
|
(0.36
|
)%
|
3.52
|
%
|
|||||||||||||||||||||||
54
Interest Expense and the Cost of Funds
We had average outstanding borrowings of $3,300.7 million and $2,172.1 million and total interest expense of $41.7 million and $15.6 million for the years ended December 31, 2017 and 2016, respectively. Our average cost of funds was 1.26% for the year ended December 31, 2017, compared to 0.72% for the comparable period in 2016. There was a $1,128.6 million increase in average outstanding borrowings during the year ended December 31, 2017 as compared to the year ended December 31, 2016. The higher cost of funds for the year ended December 31, 2017, compared to the same period in 2016, reflects the higher short-term rates as presented in the table below. The increase in average outstanding borrowings reflects the investment, on a leveraged basis, of the proceeds of our net capital raising activities.
For the year ended December 31, 2015, we had average borrowings of $1,782.1 million and total interest expense of $7.3 million, resulting in an average cost of funds of 0.41%. There was a 31 bps increase in the average cost of funds and an $390.0 million increase in average outstanding borrowings during the year ended December 31, 2016 as compared to the year ended December 31, 2015. The increase in average outstanding borrowings, and the corresponding increase in interest expense, reflects the leveraging of the proceeds of our net capital raising activities.
Our economic interest expense was $56.0 million, $25.4 million and $10.2 million for the years ended December 31, 2017, 2016 and 2015, respectively. There was a 53 bps increase in the average economic cost of funds to 1.70% for the year ended December 31, 2017 from 1.17% for the year ended December 31, 2016. The reason for the increase in economic cost of funds is due to the increases in our average outstanding borrowings and the cost of our borrowings noted above, combined with the negative performance of our derivative financial instruments during the period. There was a 59 bps increase in the average economic cost of funds to 1.17% for the year ended December 31, 2016 from 0.58% for the year ended December 31, 2015.
Since all of our repurchase agreements are short-term, changes in market rates directly affect our interest expense. Our average cost of funds calculated on a GAAP basis was 14 bps above average one-month LIBOR and 12 bps below average six-month LIBOR for the quarter ended December 31, 2017. Our average economic cost of funds was 55 bps above average one-month LIBOR and 29 bps above average six-month LIBOR for the quarter ended December 31, 2017. The average term to maturity of the outstanding repurchase agreements was 52 days and 22 days at December 31, 2017 and 2016, respectively.
55
The tables below present the average balance of borrowings outstanding, interest expense and average cost of funds, and average one-month and six-month LIBOR rates for each quarter in 2017, 2016 and 2015 and for the years ended December 31, 2017, 2016 and 2015 on both a GAAP and economic basis.
|
($ in thousands)
|
||||||||||||||||||||
|
Average
|
Interest Expense
|
Average Cost of Funds
|
||||||||||||||||||
|
Balance of
|
GAAP
|
Economic
|
GAAP
|
Economic
|
||||||||||||||||
|
Borrowings
|
Basis
|
Basis
|
Basis
|
Basis
|
||||||||||||||||
|
Three Months Ended
|
||||||||||||||||||||
|
December 31, 2017
|
$
|
3,621,931
|
$
|
13,555
|
$
|
17,318
|
1.50
|
%
|
1.91
|
%
|
||||||||||
|
September 30, 2017
|
3,494,266
|
12,638
|
16,399
|
1.45
|
%
|
1.88
|
%
|
|||||||||||||
|
June 30, 2017
|
3,164,532
|
8,763
|
12,417
|
1.11
|
%
|
1.57
|
%
|
|||||||||||||
|
March 31, 2017
|
2,922,157
|
6,715
|
9,908
|
0.92
|
%
|
1.36
|
%
|
|||||||||||||
|
December 31, 2016
|
2,545,901
|
4,974
|
7,943
|
0.78
|
%
|
1.25
|
%
|
|||||||||||||
|
September 30, 2016
|
2,179,462
|
3,979
|
6,639
|
0.73
|
%
|
1.22
|
%
|
|||||||||||||
|
June 30, 2016
|
2,000,158
|
3,330
|
5,540
|
0.67
|
%
|
1.11
|
%
|
|||||||||||||
|
March 31, 2016
|
1,962,901
|
3,319
|
5,252
|
0.68
|
%
|
1.07
|
%
|
|||||||||||||
|
December 31, 2015
|
1,964,806
|
2,372
|
3,567
|
0.48
|
%
|
0.73
|
%
|
|||||||||||||
|
September 30, 2015
|
1,978,685
|
2,037
|
2,918
|
0.41
|
%
|
0.59
|
%
|
|||||||||||||
|
June 30, 2015
|
1,736,781
|
1,567
|
2,162
|
0.36
|
%
|
0.50
|
%
|
|||||||||||||
|
March 31, 2015
|
1,448,071
|
1,296
|
1,602
|
0.36
|
%
|
0.44
|
%
|
|||||||||||||
|
Years Ended
|
||||||||||||||||||||
|
December 31, 2017
|
$
|
3,300,722
|
$
|
41,671
|
$
|
56,042
|
1.26
|
%
|
1.70
|
%
|
||||||||||
|
December 31, 2016
|
2,172,106
|
15,602
|
25,374
|
0.72
|
%
|
1.17
|
%
|
|||||||||||||
|
December 31, 2015
|
1,782,086
|
7,272
|
10,249
|
0.41
|
%
|
0.58
|
%
|
|||||||||||||
|
Average GAAP Cost of Funds
|
Average Economic Cost of Funds
|
|||||||||||||||||||||||
|
Relative to Average
|
Relative to Average
|
|||||||||||||||||||||||
|
Average LIBOR
|
One-Month
|
Six-Month
|
One-Month
|
Six-Month
|
||||||||||||||||||||
|
One-Month
|
Six-Month
|
LIBOR
|
LIBOR
|
LIBOR
|
LIBOR
|
|||||||||||||||||||
|
Three Months Ended
|
||||||||||||||||||||||||
|
December 31, 2017
|
1.36
|
%
|
1.62
|
%
|
0.14
|
%
|
(0.12
|
)%
|
0.55
|
%
|
0.29
|
%
|
||||||||||||
|
September 30, 2017
|
1.20
|
%
|
1.45
|
%
|
0.25
|
%
|
(0.00
|
)%
|
0.68
|
%
|
0.43
|
%
|
||||||||||||
|
June 30, 2017
|
1.05
|
%
|
1.43
|
%
|
0.06
|
%
|
(0.32
|
)%
|
0.52
|
%
|
0.14
|
%
|
||||||||||||
|
March 31, 2017
|
0.82
|
%
|
1.37
|
%
|
0.10
|
%
|
(0.45
|
)%
|
0.54
|
%
|
(0.01
|
)%
|
||||||||||||
|
December 31, 2016
|
0.62
|
%
|
1.28
|
%
|
0.16
|
%
|
(0.50
|
)%
|
0.63
|
%
|
(0.03
|
)%
|
||||||||||||
|
September 30, 2016
|
0.49
|
%
|
1.09
|
%
|
0.24
|
%
|
(0.36
|
)%
|
0.73
|
%
|
0.13
|
%
|
||||||||||||
|
June 30, 2016
|
0.44
|
%
|
0.92
|
%
|
0.23
|
%
|
(0.25
|
)%
|
0.67
|
%
|
0.19
|
%
|
||||||||||||
|
March 31, 2016
|
0.40
|
%
|
0.84
|
%
|
0.28
|
%
|
(0.16
|
)%
|
0.67
|
%
|
0.23
|
%
|
||||||||||||
|
December 31, 2015
|
0.28
|
%
|
0.65
|
%
|
0.20
|
%
|
(0.17
|
)%
|
0.45
|
%
|
0.08
|
%
|
||||||||||||
|
September 30, 2015
|
0.19
|
%
|
0.49
|
%
|
0.22
|
%
|
(0.08
|
)%
|
0.40
|
%
|
0.10
|
%
|
||||||||||||
|
June 30, 2015
|
0.18
|
%
|
0.40
|
%
|
0.18
|
%
|
(0.04
|
)%
|
0.32
|
%
|
0.10
|
%
|
||||||||||||
|
March 31, 2015
|
0.17
|
%
|
0.35
|
%
|
0.19
|
%
|
0.01
|
%
|
0.27
|
%
|
0.09
|
%
|
||||||||||||
|
Years Ended
|
||||||||||||||||||||||||
|
December 31, 2017
|
1.11
|
%
|
1.47
|
%
|
0.15
|
%
|
(0.21
|
)%
|
0.59
|
%
|
0.23
|
%
|
||||||||||||
|
December 31, 2016
|
0.49
|
%
|
1.03
|
%
|
0.23
|
%
|
(0.31
|
)%
|
0.68
|
%
|
0.14
|
%
|
||||||||||||
|
December 31, 2015
|
0.21
|
%
|
0.47
|
%
|
0.20
|
%
|
(0.06
|
)%
|
0.37
|
%
|
0.11
|
%
|
||||||||||||
56
Gains or Losses
The table below presents our gains or losses for the years ended December 31, 2017, 2016 and 2015.
|
(in thousands)
|
||||||||||||
|
2017
|
2016
|
2015
|
||||||||||
|
Realized (losses) gains on sales of RMBS
|
$
|
(7,788
|
)
|
$
|
3,071
|
$
|
(1,411
|
)
|
||||
|
Unrealized losses on RMBS
|
(67,981
|
)
|
(54,149
|
)
|
(28,274
|
)
|
||||||
|
Total losses on RMBS
|
(75,769
|
)
|
(51,078
|
)
|
(29,685
|
)
|
||||||
|
Losses on interest rate futures
|
(13,665
|
)
|
(16,408
|
)
|
(21,628
|
)
|
||||||
|
Gains on interest rate swaps
|
3,216
|
9,503
|
-
|
|||||||||
|
Gains (losses) on receiver swaptions
|
-
|
36
|
(431
|
)
|
||||||||
|
Gains (losses) on payer swaptions
|
1,038
|
-
|
(1,217
|
)
|
||||||||
|
(Losses) gains on TBA securities
|
(5,938
|
)
|
(2,518
|
)
|
386
|
|||||||
We invest in RMBS with the intent to earn net income from the realized yield on those assets over their related funding and hedging costs, and not for purposes of making short term gains from sales. However, we have sold, and may continue to sell, existing assets to acquire new assets, which our management believes might have higher risk-adjusted returns in light of current or anticipated interest rates, federal government programs or general economic conditions or to manage our balance sheet as part of our asset/liability management strategy. During the years ended December 31, 2017, 2016 and 2015, the Company received proceeds of $5,335.6 million, $2,002.8 million and $1,832.2 million, respectively, from the sales of RMBS.
Realized and unrealized gains and losses on RMBS are driven in part by changes in yields and interest rates, which affect the pricing of the securities in our portfolio. Gains and losses on interest rate futures contracts are affected by changes in implied forward rates during the reporting period.
The table below presents historical interest rate data for each quarter end during 2017, 2016 and 2015.
|
15 Year
|
30 Year
|
Three
|
||||||||||||||||||
|
5 Year
|
10 Year
|
Fixed-Rate
|
Fixed-Rate
|
Month
|
||||||||||||||||
|
Treasury Rate
(1)
|
Treasury Rate
(1)
|
Mortgage Rate
(2)
|
Mortgage Rate
(2)
|
LIBOR
(3)
|
||||||||||||||||
|
December 31, 2017
|
2.21
|
%
|
2.40
|
%
|
3.39
|
%
|
3.95
|
%
|
1.61
|
%
|
||||||||||
|
September 30, 2017
|
1.93
|
%
|
2.33
|
%
|
3.11
|
%
|
3.81
|
%
|
1.32
|
%
|
||||||||||
|
June 30, 2017
|
1.88
|
%
|
2.30
|
%
|
3.17
|
%
|
3.90
|
%
|
1.26
|
%
|
||||||||||
|
March 31, 2017
|
1.93
|
%
|
2.40
|
%
|
3.41
|
%
|
4.20
|
%
|
1.13
|
%
|
||||||||||
|
December 31, 2016
|
1.93
|
%
|
2.45
|
%
|
3.43
|
%
|
4.20
|
%
|
0.98
|
%
|
||||||||||
|
September 30, 2016
|
1.16
|
%
|
1.61
|
%
|
2.76
|
%
|
3.46
|
%
|
0.85
|
%
|
||||||||||
|
June 30, 2016
|
1.01
|
%
|
1.49
|
%
|
2.84
|
%
|
3.57
|
%
|
0.65
|
%
|
||||||||||
|
March 31, 2016
|
1.22
|
%
|
1.79
|
%
|
2.97
|
%
|
3.69
|
%
|
0.63
|
%
|
||||||||||
|
December 31, 2015
|
1.76
|
%
|
2.27
|
%
|
3.21
|
%
|
3.96
|
%
|
0.54
|
%
|
||||||||||
|
September 30, 2015
|
1.38
|
%
|
2.06
|
%
|
3.10
|
%
|
3.89
|
%
|
0.33
|
%
|
||||||||||
|
June 30, 2015
|
1.63
|
%
|
2.34
|
%
|
3.19
|
%
|
3.98
|
%
|
0.28
|
%
|
||||||||||
|
March 31, 2015
|
1.38
|
%
|
1.93
|
%
|
3.04
|
%
|
3.77
|
%
|
0.27
|
%
|
||||||||||
|
(1)
|
Historical 5 and 10 Year Treasury Rates are obtained from quoted end of day prices on the Chicago Board Options Exchange.
|
|
(2)
|
Historical 30 Year and 15 Year Fixed Rate Mortgage Rates are obtained from Freddie Mac's Primary Mortgage Market Survey.
|
|
(3)
|
Historical LIBOR are obtained from the Intercontinental Exchange Benchmark Administration Ltd.
|
57
Expenses
Total operating expenses were $11.2 million, $9.1 million and $7.9 million for the years ended December 31, 2017, 2016 and 2015, respectively. The table below provides a breakdown of operating expenses for the years ended December 31, 2017, 2016 and 2015.
|
(in thousands)
|
||||||||||||
|
2017
|
2016
|
2015
|
||||||||||
|
Management fees
|
$
|
5,855
|
$
|
4,188
|
$
|
3,978
|
||||||
|
Overhead allocation
|
1,576
|
1,300
|
1,064
|
|||||||||
|
Accrued incentive compensation
|
640
|
806
|
646
|
|||||||||
|
Directors fees and liability insurance
|
949
|
1,007
|
983
|
|||||||||
|
Audit, legal and other professional fees
|
706
|
871
|
706
|
|||||||||
|
Direct REIT operating expenses
|
1,124
|
652
|
241
|
|||||||||
|
Other administrative
|
316
|
269
|
276
|
|||||||||
|
Total expenses
|
$
|
11,166
|
$
|
9,093
|
$
|
7,894
|
||||||
We are externally managed and advised by Bimini Advisors, LLC (the "Manager") pursuant to the terms of a management agreement. The management agreement has been renewed through February 20, 2018 and provides for automatic one-year extension options thereafter and is subject to certain termination rights. Under the terms of the management agreement, the Manager is responsible for administering the business activities and day-to-day operations of the Company. The Manager receives a monthly management fee in the amount of:
|
·
|
One-twelfth of 1.5% of the first $250 million of the Company's equity, as defined in the management agreement,
|
|
·
|
One-twelfth of 1.25% of the Company's equity that is greater than $250 million and less than or equal to $500 million, and
|
|
·
|
One-twelfth of 1.00% of the Company's equity that is greater than $500 million.
|
We are obligated to reimburse Bimini Advisors for any direct expenses incurred on its behalf. In addition, beginning July 1, 2014, Bimini Advisors began allocating to us its pro rata portion of certain overhead costs in accordance with the management agreement. Should we terminate the management agreement without cause, we will pay to the Manager a termination fee equal to three times the average annual management fee, as defined in the management agreement, before or on the last day of term of the agreement.
Financial Condition:
Mortgage-Backed Securities
As of December 31, 2017, our RMBS portfolio consisted of $3,744.8 million of Agency RMBS at fair value and had a weighted average coupon on assets of 4.23%. During the year ended December 31, 2017, we received principal repayments of $365.2 million compared to $254.6 million for the year ended December 31, 2016. The average prepayment speeds for the quarters ended December 31, 2017 and 2016 were 9.1% and 12.2%, respectively.
58
The following table presents the constant prepayment rate ("CPR") experienced on our structured and PT RMBS sub-portfolios, on an annualized basis, for the quarterly periods presented. CPR is a method of expressing the prepayment rate for a mortgage pool that assumes that a constant fraction of the remaining principal is prepaid each month or year. Specifically, the CPR in the chart below represents the three month prepayment rate of the securities in the respective asset category. Assets that were not owned for the entire quarter have been excluded from the calculation. The exclusion of certain assets during periods of high trading activity can create a very high, and often volatile, reliance on a small sample of underlying loans.
|
Structured
|
||||||||||||
|
PT RMBS
|
RMBS
|
Total
|
||||||||||
|
Three Months Ended
|
Portfolio (%)
|
Portfolio (%)
|
Portfolio (%)
|
|||||||||
|
December 31, 2017
|
7.0
|
13.6
|
9.1
|
|||||||||
|
September 30, 2017
|
8.3
|
14.9
|
10.3
|
|||||||||
|
June 30, 2017
|
7.0
|
12.7
|
9.5
|
|||||||||
|
March 31, 2017
|
7.5
|
14.3
|
9.9
|
|||||||||
|
December 31, 2016
|
9.7
|
18.4
|
12.2
|
|||||||||
|
September 30, 2016
|
8.9
|
17.9
|
11.7
|
|||||||||
|
June 30, 2016
|
8.4
|
15.9
|
11.0
|
|||||||||
|
March 31, 2016
|
5.5
|
12.4
|
8.2
|
|||||||||
The following tables summarize certain characteristics of the Company's PT RMBS and structured RMBS as of December 31, 2017 and 2016:
|
($ in thousands)
|
|||||||||
|
Weighted
|
Weighted
|
||||||||
|
Percentage
|
Average
|
Average
|
Weighted
|
Weighted
|
|||||
|
of
|
Weighted
|
Maturity
|
Coupon
|
Average
|
Average
|
||||
|
Fair
|
Entire
|
Average
|
in
|
Longest
|
Reset in
|
Lifetime
|
Periodic
|
||
|
Asset Category
|
Value
|
Portfolio
|
Coupon
|
Months
|
Maturity
|
Months
|
Cap
|
Cap
|
|
|
December 31, 2017
|
|||||||||
|
Adjustable Rate RMBS
|
$
|
1,754
|
0.0%
|
3.95%
|
206
|
1-Sep-35
|
5.5
|
10.05%
|
2.00%
|
|
Fixed Rate RMBS
|
3,594,533
|
96.0%
|
4.25%
|
338
|
1-Dec-47
|
NA
|
NA
|
NA
|
|
|
Hybrid Adjustable Rate RMBS
|
27,398
|
0.7%
|
2.59%
|
301
|
1-Aug-43
|
59.77
|
7.59%
|
2.00%
|
|
|
Total Mortgage-backed Pass-through
|
3,623,685
|
96.7%
|
4.24%
|
338
|
1-Dec-47
|
NA
|
NA
|
NA
|
|
|
Interest-Only Securities
|
86,918
|
2.3%
|
3.75%
|
262
|
15-Apr-47
|
NA
|
NA
|
NA
|
|
|
Inverse Interest-Only Securities
|
34,208
|
1.0%
|
4.02%
|
318
|
15-Jul-47
|
NA
|
5.11%
|
NA
|
|
|
Total Structured RMBS
|
121,126
|
3.3%
|
3.82%
|
278
|
15-Jul-47
|
NA
|
NA
|
NA
|
|
|
Total Mortgage Assets
|
$
|
3,744,811
|
100.0%
|
4.23%
|
336
|
1-Dec-47
|
NA
|
NA
|
NA
|
|
December 31, 2016
|
|||||||||
|
Adjustable Rate RMBS
|
$
|
2,062
|
0.1%
|
3.50%
|
219
|
1-Sep-35
|
5.67
|
10.05%
|
2.00%
|
|
Fixed Rate RMBS
|
2,826,694
|
93.5%
|
4.21%
|
325
|
1-Dec-46
|
NA
|
NA
|
NA
|
|
|
Hybrid Adjustable Rate RMBS
|
45,459
|
1.5%
|
2.55%
|
313
|
1-Aug-43
|
73.08
|
7.55%
|
2.00%
|
|
|
Total Mortgage-backed Pass-through
|
2,874,215
|
95.1%
|
4.19%
|
324
|
1-Dec-46
|
NA
|
NA
|
NA
|
|
|
Interest-Only Securities
|
69,726
|
2.3%
|
3.59%
|
235
|
25-Apr-45
|
NA
|
NA
|
NA
|
|
|
Inverse Interest-Only Securities
|
78,233
|
2.6%
|
5.40%
|
338
|
25-Dec-46
|
NA
|
6.14%
|
NA
|
|
|
Total Structured RMBS
|
147,959
|
4.9%
|
4.55%
|
290
|
25-Dec-46
|
NA
|
NA
|
NA
|
|
|
Total Mortgage Assets
|
$
|
3,022,174
|
100.0%
|
4.20%
|
323
|
25-Dec-46
|
NA
|
NA
|
NA
|
59
|
($ in thousands)
|
||||||||||||||||
|
December 31, 2017
|
December 31, 2016
|
|||||||||||||||
|
Percentage of
|
Percentage of
|
|||||||||||||||
|
Agency
|
Fair Value
|
Entire Portfolio
|
Fair Value
|
Entire Portfolio
|
||||||||||||
|
Fannie Mae
|
$
|
2,242,213
|
59.9
|
%
|
$
|
2,226,893
|
73.7
|
%
|
||||||||
|
Freddie Mac
|
1,496,615
|
40.0
|
%
|
785,496
|
26.0
|
%
|
||||||||||
|
Ginnie Mae
|
5,983
|
0.1
|
%
|
9,785
|
0.3
|
%
|
||||||||||
|
Total Portfolio
|
$
|
3,744,811
|
100.0
|
%
|
$
|
3,022,174
|
100.0
|
%
|
||||||||
|
December 31, 2017
|
December 31, 2016
|
|||||||
|
Weighted Average Pass-through Purchase Price
|
$
|
107.52
|
$
|
108.64
|
||||
|
Weighted Average Structured Purchase Price
|
$
|
13.82
|
$
|
15.39
|
||||
|
Weighted Average Pass-through Current Price
|
$
|
106.79
|
$
|
107.14
|
||||
|
Weighted Average Structured Current Price
|
$
|
12.50
|
$
|
15.49
|
||||
|
Effective Duration
(1)
|
2.989
|
4.579
|
||||||
|
(1)
|
Effective duration is the approximate percentage change in price for a 100 bps change in rates. An effective duration of 2.989 indicates that an interest rate increase of 1.0% would be expected to cause a 2.989% decrease in the value of the RMBS in the Company's investment portfolio at December 31, 2017. An effective duration of 4.579 indicates that an interest rate increase of 1.0% would be expected to cause a 4.579% decrease in the value of the RMBS in the Company's investment portfolio at December 31, 2016. These figures include the structured securities in the portfolio, but do not include the effect of the Company's funding cost hedges. Effective duration quotes for individual investments are obtained from The Yield Book, Inc.
|
The following table presents a summary of portfolio assets acquired during the years ended December 31, 2017 and 2016.
|
($ in thousands)
|
||||||||||||||||||||||||
|
2017
|
2016
|
|||||||||||||||||||||||
|
Total Cost
|
Average Price
|
Weighted Average Yield
|
Total Cost
|
Average Price
|
Weighted Average Yield
|
|||||||||||||||||||
|
Pass-through RMBS
|
$
|
6,426,822
|
$
|
107.83
|
2.77
|
%
|
$
|
3,090,522
|
$
|
109.09
|
2.40
|
%
|
||||||||||||
|
Structured RMBS
|
72,331
|
14.46
|
6.21
|
%
|
81,479
|
18.28
|
5.85
|
%
|
||||||||||||||||
Borrowings
As of December 31, 2017, we had established borrowing facilities in the repurchase agreement market with a number of commercial banks and other financial institutions and had borrowings in place with 22 of these counterparties. None of these lenders are affiliated with the Company. These borrowings are secured by the Company's RMBS and cash, and bear interest at prevailing market rates. We believe our established repurchase agreement borrowing facilities provide borrowing capacity in excess of our needs.
As of December 31, 2017, we had obligations outstanding under the repurchase agreements of approximately $3,533.8 million with a net weighted average borrowing cost of 1.54%. The remaining maturity of our outstanding repurchase agreement obligations ranged from 2 to 226 days, with a weighted average remaining maturity of 52 days. Securing the repurchase agreement obligations as of December 31, 2017 are RMBS with an estimated fair value, including accrued interest, of approximately $3,726.5 million and a weighted average maturity of 337 months, and cash pledged to counterparties of approximately $25.3 million. Through February 14, 2018, we have been able to maintain our repurchase facilities with comparable terms to those that existed at December 31, 2017 with maturities through August 14, 2018.
60
The table below presents information about our period end and average repurchase agreement obligations for each quarter in 2017 and 2016.
|
($ in thousands)
|
||||||||||||||||
|
Difference Between Ending
|
||||||||||||||||
|
Ending
|
Average
|
Borrowings and
|
||||||||||||||
|
Balance of
|
Balance of
|
Average Borrowings
|
||||||||||||||
|
Three Months Ended
|
Borrowings
|
Borrowings
|
Amount
|
Percent
|
||||||||||||
|
December 31, 2017
|
$
|
3,533,786
|
$
|
3,621,931
|
$
|
(88,145
|
)
|
(2.43
|
)%
|
|||||||
|
September 30, 2017
|
3,710,077
|
3,494,266
|
215,811
|
6.18
|
%
|
|||||||||||
|
June 30, 2017
|
3,278,456
|
3,164,532
|
113,924
|
3.60
|
%
|
|||||||||||
|
March 31, 2017
|
3,050,608
|
2,922,157
|
128,451
|
4.40
|
%
|
|||||||||||
|
December 31, 2016
|
2,793,705
|
2,545,901
|
247,804
|
9.73
|
%
|
|||||||||||
|
September 30, 2016
|
2,298,097
|
2,179,462
|
118,635
|
5.44
|
%
|
|||||||||||
|
June 30, 2016
|
2,060,827
|
2,000,158
|
60,669
|
3.03
|
%
|
|||||||||||
|
March 31, 2016
|
1,939,489
|
1,962,901
|
(23,412
|
)
|
(1.19
|
)%
|
||||||||||
Liquidity and Capital Resources
Liquidity is our ability to turn non-cash assets into cash, purchase additional investments, repay principal and interest on borrowings, fund overhead, fulfill margin calls and pay dividends. Our principal immediate sources of liquidity include cash balances, unencumbered assets and borrowings under repurchase agreements. Our borrowing capacity will vary over time as the market value of our interest earning assets varies. Our balance sheet also generates liquidity on an on-going basis through payments of principal and interest we receive on our RMBS portfolio. Management believes that we currently have sufficient liquidity and capital resources available for (a) the acquisition of additional investments consistent with the size and nature of our existing RMBS portfolio, (b) the repayments on borrowings and (c) the payment of dividends to the extent required for our continued qualification as a REIT. We may also generate liquidity from time to time by selling our equity or debt securities in public offerings or private placements.
Because our PT RMBS portfolio consists entirely of government and agency securities, we do not anticipate having difficulty converting our assets to cash should our liquidity needs ever exceed our immediately available sources of cash. Our structured RMBS portfolio also consists entirely of governmental agency securities, although they typically do not trade with comparable bid / ask spreads as PT RMBS. However, we anticipate that we would be able to liquidate such securities readily, even in distressed markets, although we would likely do so at prices below where such securities could be sold in a more stable market. To enhance our liquidity even further, we may pledge a portion of our structured RMBS as part of a repurchase agreement funding, but retain the cash in lieu of acquiring additional assets. In this way we can, at a modest cost, retain higher levels of cash on hand and decrease the likelihood we will have to sell assets in a distressed market in order to raise cash.
Our strategy for hedging our funding costs typically involves taking short positions in interest rate futures, treasury futures, interest rate swaps, interest rate swaptions or other instruments. When the market causes these short positions to decline in value we are required to meet margin calls with cash. This can reduce our liquidity position to the extent other securities in our portfolio move in price in such a way that we do not receive enough cash via margin calls to offset the derivative related margin calls. If this were to occur in sufficient magnitude, the loss of liquidity might force us to reduce the size of the levered portfolio, pledge additional structured securities to raise funds or risk operating the portfolio with less liquidity.
Our master repurchase agreements have no stated expiration, but can be terminated at any time at our option or at the option of the counterparty. However, once a definitive repurchase agreement under a master repurchase agreement has been entered into, it generally may not be terminated by either party. A negotiated termination can occur, but may involve a fee to be paid by the party seeking to terminate the repurchase agreement transaction.
61
Under our repurchase agreement funding arrangements, we are required to post margin at the initiation of the borrowing. The margin posted represents the haircut, which is a percentage of the market value of the collateral pledged. To the extent the market value of the asset collateralizing the financing transaction declines, the market value of our posted margin will be insufficient and we will be required to post additional collateral. Conversely, if the market value of the asset pledged increases in value, we would be over collateralized and we would be entitled to have excess margin returned to us by the counterparty. Our lenders typically value our pledged securities daily to ensure the adequacy of our margin and make margin calls as needed, as do we. Typically, but not always, the parties agree to a minimum threshold amount for margin calls so as to avoid the need for nuisance margin calls on a daily basis.
Our master repurchase agreements do not specify the haircut; rather haircuts are determined on an individual repurchase transaction basis. Throughout the year ended December 31, 2017, haircuts on our pledged collateral remained stable and as of December 31, 2017, our weighted average haircut was approximately 5.4% of the value of our collateral.
As discussed earlier, we invest a portion of our capital in structured Agency RMBS. We do not apply leverage to this portion of our portfolio. The leverage inherent in structured securities replaces the leverage obtained by acquiring PT securities and funding them in the repurchase market. This structured RMBS strategy has been a core element of the Company's overall investment strategy since inception. However, we have and may continue to pledge a portion of our structured RMBS in order to raise our cash levels, but generally will not pledge these securities in order to acquire additional assets.
The following table summarizes the effect on our liquidity and cash flows from contractual obligations for repurchase agreements and interest expense on repurchase agreements.
|
(in thousands)
|
||||||||||||||||||||
|
Obligations Maturing
|
||||||||||||||||||||
|
Within One Year
|
One to Three Years
|
Three to Five Years
|
More than Five Years
|
Total
|
||||||||||||||||
|
Repurchase agreements
|
$
|
3,533,786
|
$
|
-
|
$
|
-
|
$
|
-
|
$
|
3,533,786
|
||||||||||
|
Interest expense on repurchase agreements
(1)
|
14,320
|
-
|
-
|
-
|
14,320
|
|||||||||||||||
|
Totals
|
$
|
3,548,106
|
$
|
-
|
$
|
-
|
$
|
-
|
$
|
3,548,106
|
||||||||||
|
(1)
|
Interest expense on repurchase agreements is based on current interest rates as of December 31, 2017 and the remaining term of the liabilities existing at that date.
|
In future periods, we expect to continue to finance our activities in a manner that is consistent with our current operations through repurchase agreements. As of December 31, 2017, we had cash and cash equivalents of $214.4 million. We generated cash flows of $508.2 million from principal and interest payments on our RMBS and had average repurchase agreements outstanding of $3,300.7 million during the year ended December 31, 2017.
Stockholders' Equity
On July 29, 2016, we entered into an equity distribution agreement (the "July 2016 Equity Distribution Agreement") with two sales agents pursuant to which we could offer and sell, from time to time, up to an aggregate amount of $125,000,000 of shares of our common stock in transactions that were deemed to be "at the market" offerings and privately negotiated transactions. We issued a total of 10,174,992 shares under the July 2016 Equity Distribution Agreement for aggregate gross proceeds of $110.0 million, and net proceeds of approximately $108.2 million, net of commissions and fees, prior to its termination.
62
On February 23, 2017, we entered into another equity distribution agreement, as amended and restated on May 10, 2017 (the "May 2017 Equity Distribution Agreement"), with two sales agents pursuant to which we could offer and sell, from time to time, up to an aggregate amount of $125,000,000 of shares of our common stock in transactions that were deemed to be "at the market" offerings and privately negotiated transactions. The May 2017 Equity Distribution Agreement replaced the July 2016 Equity Distribution Agreement. We issued a total of 12,299,032 shares under the May 2017 Equity Distribution Agreement for aggregate gross proceeds of $125.0 million, and net proceeds of approximately $122.9 million, net of commissions and fees, prior to its termination.
On August 2, 2017, we entered into another equity distribution agreement (the "August 2017 Equity Distribution Agreement") with two sales agents pursuant to which we may offer and sell, from time to time, up to an aggregate amount of $125,000,000 of shares of our common stock in transactions that are deemed to be "at the market" offerings and privately negotiated transactions. The August 2017 Equity Distribution Agreement replaced the May 2017 Equity Distribution Agreement. Through December 31, 2017, we issued a total of 7,746,052 shares under the August 2017 Equity Distribution Agreement for aggregate gross proceeds of $76.0 million, and net proceeds of approximately $74.7 million, net of commissions and fees.
Outlook
Interest Rates and the MBS Market
The fourth quarter of 2017 marked a reversal of the trend in place for the first nine months of the year. The shifts that occurred were numerous. Perhaps the most significant from a long-term perspective was the surprise success the Trump administration had in passing a substantive tax package – The Tax Cuts and Jobs Act of 2017 (the "Act"). The significance of the Act was two-fold. On the one hand, its passage ended the Trump administration's string of legislative failures, and on the other, we believe the legislation should be simulative for the economy – at least for the first five years after passage and before certain provisions are reduced or eliminated. Passage of the Act coincided with continuing strong economic data and contributed to the "risk on" sentiment in the markets. The result was a continuation of the ever-increasing levels in the equity markets, particularly the domestic equity markets, as well as other risk assets such as commodities, investment grade and sub-investment grade debt.
Some of the clouds on the economic horizon that existed at the end of the third quarter of 2017 did not prove to be troubling. The three hurricanes that made landfall in the U
.
S
.
in August and September 2017 did not impact economic growth in a material way
,
and President Trump's selection of the new chairman of the Federal Reserve, Jerome Powell, was perceived as a "status quo" selection by the markets and not a shift in the hawkish direction.
A second significant event that impacted the markets during the fourth quarter of 2017 actually occurred late in the third quarter of 2017. At the conclusion of the September 2017 meeting of the FOMC, chair Yellen stated that the Fed viewed recent soft inflation data as owing to transitory factors and that they remained confident that inflation would trend towards their 2% target level over the medium term. This acknowledgement by the Fed that they would look past soft inflation data in the near term
,
and continue to remove accommodation
,
forced the market to revisit expectations for additional interest rate hikes. While there was a substantial gap in the markets pricing for additional Fed rate hikes and the extent of hikes implied in the Fed's "dot plot" prior to the September 2017 meeting, this gap closed markedly by the end of the year. Fed public comments since the September 2017 meeting, coupled with continued strong data, have reinforced the markets thinking. The Fed's "dot plot" implies three rate hikes in 2018 and current market pricing is over 2.5 hikes, a meaningful closing of the gap that existed in August and early September 2017 when the 10-year US T-Note flirted with breaking below 2%. The yield on the 10-year U
.
S
.
T-Note reached 2.406% by December 29, 2017 and surpassed 2.6% in January 2018.
63
During the fourth quarter of 2017, inflation data was mixed and year over year figures remained below the Fed's 2% target. The combination of benign inflation readings and a Fed that seems intent on removing accommodation, even more so as strong economic data continues to be released, has caused the yield curve to flatten. This trend has continued into 2018. The market is convinced the Fed will be vigilant in staying ahead of inflation
,
and therefore longer dated treasuries, that are most sensitive to inflation
,
have increased in yield far less that short term treasuries that are more sensitive to Fed rate increases. The fact the Fed is ahead of their central bank peers at removing accommodation has allowed yield spreads between U
.
S
.
rates and sovereign debt rates across Europe and Japan to remain large, helping to keep additional downward pressure on longer term rates in the U
.
S.
The mortgage market was impacted by these events in a positive way. The strong "risk on" tone of the markets continued to drive spreads available in the various investment grade and sub-investment grade markets tighter. This enabled spreads available in the Agency RMBS market to appear relatively attractive and continue to tighten over the course of the quarter. The spread of the 30-year, fixed rate conventional mortgage to the 10-year U
.
S
.
T-Note hit its tightest level since early 2013 in early January 2018. This spread has since widened as longer-term rates continue to inch higher
,
causing extension fears to enter the market – the fear that mortgage cash flows will extend materially as prepayment activity is driven lower by higher prevailing mortgage rates available to borrowers. The flattening of the yield – and U
.
S
.
dollar swap – curves tends to hurt fixed income markets generally as spreads on these assets relative to funding levels are compressed. However, in the case of the Agency RMBS market, we believe this effect is off-set somewhat by the seasonal slow-down in prepayment activity that occurs around year end and into the first quarter. Going forward
,
the balance between slower prepayment activity, and thus mortgage origination levels, and reduced purchases by the Fed, will be critical for Agency RMBS performance. The shape of the yield curve will also be important for the relative performance of higher versus lower coupon mortgages, as a flatter yield curve tends to cause lower coupon mortgages to out-perform higher coupon mortgages - since higher coupon mortgages are more sensitive to prepayment rates and a flatter yield curve usually does not slow prepayment behavior materially.
Recent Regulatory Developments
On January 12, 2016, the FHFA issued RIN 2590-AA39, Members of Federal Home Loan Banks (the "Final Rule"). The Final Rule, among other things, expressly excludes captive insurance companies, such as our wholly-owned captive insurance subsidiary, Orchid Island Casualty, LLC ("Orchid Island Casualty"), from being eligible for membership in the Federal Home Loan Bank ("FHLB") system. Under the Final Rule, there was a one-year transition period from the effective date of February 19, 2016 within which the FHLBs were required to wind down their relationships with any captive insurance companies that had been admitted to membership on or after September 12, 2014, including Orchid Island Casualty ("Post-NPR Captives"). The Final Rule also precludes the FHLBs from making any new advances or extending existing advances to Post-NPR Captives. In addition, upon the termination of membership, the FHLBs were required to liquidate all outstanding advances to Post-NPR Captives, settle all other business transactions, and repurchase or redeem all FHLB stock held by the terminated Post-NPR Captive in accordance with the Final Rule. Therefore, Orchid Island Casualty, along with all other Post-NPR Captives, was required to completely wind down all business relationships with the FHLB, including the repayment of all outstanding advances, prior to or simultaneously with the termination of Orchid Island Casualty's membership with the FHLB.
The adopting release for the Final Rule expressly invited Congress to address the treatment of Post-NPR Captives with respect to membership in the FHLB. In October 2015, Reps. Blaine Luetkemeyer (R-Mo.), Denny Heck (D-Wash.), Patrick McHenry (R-N.C.) and John Carney (D-Del.) introduced H.R. 3808, a bill that would have preemptively prevented the FHFA from adopting the Final Rule in such a way that would foreclose membership in the FHLB to captive insurance companies. There can be no way of predicting if any subsequent legislation addressing the status of Post-NPR Captives with respect to the FHLB will be proposed in either house of Congress, the likelihood of passage of any such legislation, and the ultimate effects, if any, on the availability of short-term, low-cost funding provided by the FHLBs to Post-NPR Captives subsequent to the enactment of any such legislation.
64
The scope and nature of the actions the U.S. government or the Fed will ultimately undertake are unknown and will continue to evolve. Although the Trump administration has made statements of its intentions to reform housing finance and tax policy, many of these potential policy changes will require congressional action. In addition, the Fed has made statements regarding additional increases to the Federal Funds Rate in 2018 and beyond.
At its September 2017 meeting, the FOMC agreed to start the program for gradually reducing the Fed's holdings of Agency RMBS and U.S. Treasuries, starting in October 2017, as part of its overall approach to monetary policy normalization, by reducing its reinvestment of Agency RMBS and U.S. Treasuries held in the System Open Market Account.
On January 30, 2018, legislation was introduced in the United States Senate that would permit captive insurance companies that were FHLB members prior to January 19, 2016 to restore or continue their membership in the FHLB. In June 2017, legislation was introduced in the United States House of Representatives that would permit a captive insurance company that was admitted to the FHLB prior to September 12, 2014 to continue its membership in the FHLB. The Company joined the FHLBC after September 12, 2014, so the House version of the legislation would not permit the Company to rejoin the FHLBC. It is still uncertain whether legislation on FHLB membership will be adopted, and if so, whether it would permit us to rejoin the FHLB.
Effect on Us
Regulatory developments, movements in interest rates and prepayment rates affect us in many ways, including the following:
Effects on our Assets
A change in or elimination of the guarantee structure of Agency RMBS may increase our costs (if, for example, guarantee fees increase) or require us to change our investment strategy altogether. For example, the elimination of the guarantee structure of Agency RMBS may cause us to change our investment strategy to focus on non-Agency RMBS, which in turn would require us to significantly increase our monitoring of the credit risks of our investments in addition to interest rate and prepayment risks.
Lower long-term interest rates can affect the value of our Agency RMBS in a number of ways. If prepayment rates are relatively low (due, in part, to the refinancing problems described above), lower long-term interest rates can increase the value of higher-coupon Agency RMBS. This is because investors typically place a premium on assets with yields that are higher than market yields. Although lower long-term interest rates may increase asset values in our portfolio, we may not be able to invest new funds in similarly-yielding assets.
If prepayment levels increase, the value of our Agency RMBS affected by such prepayments may decline. This is because a principal prepayment accelerates the effective term of an Agency RMBS, which would shorten the period during which an investor would receive above-market returns (assuming the yield on the prepaid asset is higher than market yields). Also, prepayment proceeds may not be able to be reinvested in similar-yielding assets. Agency RMBS backed by mortgages with high interest rates are more susceptible to prepayment risk because holders of those mortgages are most likely to refinance to a lower rate. IOs and IIOs, however, may be the types of Agency RMBS most sensitive to increased prepayment rates. Because the holder of an IO or IIO receives no principal payments, the values of IOs and IIOs are entirely dependent on the existence of a principal balance on the underlying mortgages. If the principal balance is eliminated due to prepayment, IOs and IIOs essentially become worthless. Although increased prepayment rates can negatively affect the value of our IOs and IIOs, they have the opposite effect on POs. Because POs act like zero-coupon bonds, meaning they are purchased at a discount to their par value and have an effective interest rate based on the discount and the term of the underlying loan, an increase in prepayment rates would reduce the effective term of our POs and accelerate the yields earned on those assets, which would increase our net income.
65
Higher long-term rates can also affect the value of our Agency RMBS. As long-term rates rise, rates available to borrowers also rise. This tends to cause prepayment activity to slow and extend the expected average life of mortgage cash flows. As the expected average life of the mortgage cash flows increase, coupled with higher discount rates, the value of Agency RMBS declines. Some of the instruments the Company uses to hedge our Agency RMBS assets, such as Euro Dollar futures, swaps, interest rate futures and swaptions, are stable average life instruments. This means that to the extent we use such instruments to hedge our Agency RMBS assets, our hedges may not adequately protect us from price declines, and therefore may negatively impact our book value. It is for this reason we use interest only securities in our portfolio. As interest rates rise, the expected average life of these securities increase, causing generally positive price movements as the number and size of the cash flows increase the longer the underlying mortgages remain outstanding. This makes interest only securities desirable hedge instruments for pass-through Agency RMBS.
As the economy has rebounded from the financial crisis, the Fed has taken steps to remove the considerable accommodation that was employed to combat the crisis. At the conclusion of its meeting in September 2017, the Fed announced it would implement caps on the amount of Agency RMBS assets it would allow to run off- or not be re-invested – starting in October 2017. Previously the Fed would re-invest all of the principal repayments it received each month on the Agency RMBS assets it had acquired during their quantitative easing programs. By capping the amount they would allow to run off each month, the Fed was effectively limiting the amount it would re-invest. Per the September 2017 announcement, the cap would eventually reach $20 billion per month by the end of 2018. At the time of the Fed's announcement, its monthly re-investments were approximately $20 billion per month as well, so this implied the Fed would stop, or nearly stop, re-investing its monthly pay-downs by the end of 2018. The purchases each month by the Fed have been a significant source of demand in the Agency RMBS market and as it is reduced slowly over the course of 2018 and essentially eliminated beyond 2018, the removal of this source of demand could negatively impact Agency RMBS prices. The extent this negatively impacts the Agency RMBS market will be a function of the level of supply each month – as the supply/demand balance affects the price of any asset – and whether or not another source of demand emerges to replace the Fed.
Because we base our investment decisions on risk management principles rather than anticipated movements in interest rates, in a volatile interest rate environment we may allocate more capital to structured Agency RMBS with shorter durations, such as short-term fixed and floating rate CMOs. We believe these securities have a lower sensitivity to changes in long-term interest rates than other asset classes. We may attempt to mitigate our exposure to changes in long-term interest rates by investing in IOs and IIOs, which typically have different sensitivities to changes in long-term interest rates than PT RMBS, particularly PT RMBS backed by fixed-rate mortgages.
If Fannie Mae and Freddie Mac were to modify or end their repurchase programs, our investment portfolio could be negatively impacted.
Effects on our borrowing costs
We leverage our PT RMBS portfolio and a portion of our structured Agency RMBS with principal balances through the use of short-term repurchase agreement transactions. The interest rates on our debt are determined by market levels of both the Federal Funds Rate and LIBOR. An increase in the Federal Funds Rate or LIBOR would increase our borrowing costs, which could affect our interest rate spread if there is no corresponding increase in the interest we earn on our assets. This would be most prevalent with respect to our Agency RMBS backed by fixed rate mortgage loans because the interest rate on a fixed-rate mortgage loan does not change even though market rates may change.
In order to protect our net interest margin against increases in short-term interest rates, we may enter into interest rate swaps, which effectively convert our floating-rate repurchase agreement debt to fixed-rate debt, or utilize other hedging instruments such as Eurodollar and T-Note futures contracts or interest rate swaptions.
66
Summary
The market direction changed appreciably during the fourth quarter of 2017. As we entered 2017, risk assets were performing very well as the Trump administration took office in late January and appeared to be very pro-business. The markets looked forward to a roll back of recently expanding regulations across many industries, a new and hopefully improved health care act, tax reform and possibly much needed infrastructure spending to refurbish the nation's aging roads, highways, bridges and airports. While the administration made bold promises, there was little delivered. Market optimism was quickly replaced with pessimism. Geopolitical events surfaced in April, specifically the Korean peninsula. These events kept the market on edge and induced sporadic flight to quality rallies as headlines hit the market from time to time. Starting in March
,
incoming inflation data was consistently below expectations. In the case of the core Consumer Price Index ("CPI") measure, the year over year figure moved from 2.3% in January 2017 to 1.7% by May and has not moved back above 1.8% since. Despite these readings, the Fed remains convinced these readings are being driven by temporary or transitory phenomenon
,
and that inflation will reverse and head back towards their 2% target over the medium term. This was a significant development and marked a clear change in the bias of the Fed from a dovish to a more hawkish, or aggressive stance. Over the course of the fourth quarter of 2017 and into early 2018
,
the market has grown to accept this outcome - as reflected in Fed Funds futures pricing.
Late in the fourth quarter of 2017, the Trump administration had its first major legislative success when the Tax Cuts and Jobs Act of 2017 was passed. The legislation was viewed as very pro-growth and added to the high-level of animal spirits and "risk on" tone in the markets. Risk markets performed very well into year end and incoming economic data was consistently strong. These developments drove the markets to price in a more aggressive Fed going forward. More importantly, the combination of benign inflation readings, coupled with hawkish Fed expectations, caused the yield curve to flatten significantly in 2017, to multi-year lows.
The Agency RMBS market has performed well in this environment
,
resulting in low volatility and tight trading spreads across most comparable asset classes. In early January 2018, current coupon, 30-year fixed rate mortgage traded at their tightest spread to comparable duration treasuries since early 2013. Going forward
,
the balance between prepayment activity, and thus mortgage origination levels, and reduced purchases by the Fed, will be critical for Agency RMBS performance. The shape of the yield curve will also be important for the relative performance of higher versus lower coupon mortgages, as a flatter yield curve tends to cause lower coupon mortgages to out-perform higher coupon mortgages, our core holding. On the other hand, if incoming inflation data were to exceed market expectations
,
not only would the Fed be very likely to carry out their professed intentions to raise rates three times in 2018 and more so in the years after, but this would also put upward pressure on longer-term rates and volatility, both negatively impacting Agency RMBS performance.
Critical Accounting Policies
Our consolidated financial statements are prepared in accordance with GAAP. GAAP requires our management to make some complex and subjective decisions and assessments. Our most critical accounting policies involve decisions and assessments which could significantly affect reported assets, liabilities, revenues and expenses. Management has identified its most critical accounting policies:
67
Mortgage-Backed Securities
Our investments in Agency RMBS are accounted for under the fair value option. We acquire our Agency RMBS for the purpose of generating long-term returns, and not for the short-term investment of idle capital. Changes in the fair value of securities accounted for under the fair value option are reflected as part of our net income or loss in our consolidated statement of operations, as opposed to a component of other comprehensive income in our statement of stockholders' equity if they were instead reclassified as available-for-sale securities. We elected to account for all of our Agency RMBS under the fair value option in order to reflect changes in the fair value of our Agency RMBS in our consolidated statement of operations, which we believe more appropriately reflects the results of our operations for a particular reporting period. GAAP requires the use of a three-level valuation hierarchy to disclose the classification of fair value measurements used for determining the fair value of our Agency RMBS. These levels include:
|
·
|
Level 1 valuations, where the valuation is based on quoted market prices for identical assets or liabilities traded in active markets (which include exchanges and over-the-counter markets with sufficient volume),
|
|
·
|
Level 2 valuations, where the valuation is based on quoted market prices for similar instruments traded in active markets, quoted prices for identical or similar instruments in markets that are not active and model-based valuation techniques for which all significant assumptions are observable in the market, and
|
|
·
|
Level 3 valuations, where the valuation is generated from model-based techniques that use significant assumptions not observable in the market, but observable based on Company- specific data. These unobservable assumptions reflect the Company's own estimates for assumptions that market participants would use in pricing the asset or liability. Valuation techniques typically include option pricing models, discounted cash flow models and similar techniques, but may also include the use of market prices of assets or liabilities that are not directly comparable to the subject asset or liability.
|
Our Agency RMBS are valued using Level 2 valuations, and such valuations currently are determined by our manager based on independent pricing sources and/or third party broker quotes, when available. Because the price estimates may vary, our Manager must make certain judgments and assumptions about the appropriate price to use to calculate the fair values. Alternatively, our Manager could opt to have the value of all of our positions in Agency RMBS determined by either an independent third-party or do so internally.
In managing our portfolio, Bimini Advisors employs the following four-step process at each valuation date to determine the fair value of our Agency RMBS:
|
·
|
First, our Manager obtains fair values from subscription-based independent pricing sources. These prices are used by both our Manager as well as many of our repurchase agreement counterparty on a daily basis to establish margin requirements for our borrowings.
|
|
·
|
Second, our Manager requests non-binding quotes from one to four broker-dealers for certain Agency RMBS in order to validate the values obtained by the pricing service. Our Manager requests these quotes from broker-dealers that actively trade and make markets in the respective asset class for which the quote is requested.
|
|
·
|
Third, our Manager reviews the values obtained by the pricing source and the broker-dealers for consistency across similar assets.
|
|
·
|
Finally, if the data from the pricing services and broker-dealers is not homogenous or if the data obtained is inconsistent with our Manager's market observations, our Manager makes a judgment to determine which price appears the most consistent with observed prices from similar assets and selects that price. To the extent our Manager believes that none of the prices are consistent with observed prices for similar assets, which is typically the case for only an immaterial portion of our portfolio each quarter, our Manager may use a third price that is consistent with observed prices for identical or similar assets. In the case of assets that have quoted prices such as Agency RMBS backed by fixed-rate mortgages, our Manager generally uses the quoted or observed market price. For assets such as Agency RMBS backed by ARMs or structured Agency RMBS, our Manager may determine the price based on the yield or spread that is identical to an observed transaction or a similar asset for which a dealer mark or subscription-based price has been obtained.
|
68
Management believes its pricing methodology to be consistent with the definition of fair value described in FASB ASC 820,
Fair Value Measurements
.
Derivative Financial Instruments
We use derivative instruments to manage interest rate risk, facilitate asset/liability strategies and manage other exposures, and we may continue to do so in the future. The principal instruments that we have used to date are T-Note and Eurodollar futures contracts, interest rate swaps, interest rate swaptions and TBA securities, but we may enter into other derivatives in the future.
We purchase a portion of our Agency RMBS through forward settling transactions, including "to-be-announced" ("TBA") securities transactions.
At times when market conditions are conducive, we may choose to move the settlement of these TBA securities transactions out to a later date by entering into an offsetting short position, which is then net settled for cash, and simultaneously entering into a substantially similar TBA securities trade for a later settlement date. Such a set of transactions is referred to as a TBA "dollar roll" transaction. The TBA securities purchased at the later settlement date are typically priced at a discount to securities for settlement in the current month. This difference is referred to as the "price drop." The price drop represents compensation to us for foregoing net interest margin and is referred to as TBA "dollar roll income."
We account for TBA securities as derivative instruments if either the TBA securities do not settle in the shortest period of time possible or if we cannot assert that it is probable at the inception of the TBA transaction, and throughout its term, that we will take physical delivery
of the Agency RMBS for a long position, or make delivery of the Agency RMBS for a short position, upon settlement of the trade.
We account for TBA dollar roll transactions as a series of derivative transactions. Gains, losses and dollar roll income associated with TBA securities transactions and dollar roll transactions are reported in gain (loss) on derivative instruments in the accompanying consolidated statements of operations. The fair value of TBA securities is estimated based on similar methods used to value RMBS securities.
We have elected not to treat any of our derivative financial instruments as hedges in order to align the accounting treatment of its derivative instruments with the treatment of our portfolio assets under the fair value option election. FASB ASC Topic 815,
Derivatives and Hedging
, requires that all derivative instruments be carried at fair value. Changes in fair value are recorded in earnings for each period.
Repurchase Agreements
We finance the acquisition of a portion of our Agency RMBS through repurchase transactions under master repurchase agreements. Repurchase transactions are treated as collateralized financing transactions and are carried at their contractual amounts, including accrued interest, which due to their short term nature approximate fair value.
In instances where we acquire Agency RMBS through repurchase agreements with the same counterparty from whom the Agency RMBS were purchased, we account for the purchase commitment and repurchase agreement on a net basis and record a forward commitment to purchase Agency RMBS as a derivative instrument if the transaction does not comply with the criteria in FASB ASC 860,
Transfers and Servicing
, for gross presentation. If the transaction complies with the criteria for gross presentation, we present the assets and the related financing on a gross basis in our consolidated balance sheets, and the corresponding interest income and interest expense in our consolidated statement of operations. Such forward commitments are recorded at fair value with subsequent changes in fair value recognized in income. Additionally, we record the cash portion of our investment in Agency RMBS as a mortgage related receivable from the counterparty on our consolidated balance sheet.
69
Income Recognition
Since we commenced operations, we have elected to account for all of our Agency RMBS under the fair value option.
All of our Agency RMBS are either pass-through securities or structured Agency RMBS, including CMOs, IOs, IIOs or POs. Income on pass-through securities, POs and CMOs that contain principal balances is based on the stated interest rate of the security. As a result of accounting for our RMBS under the fair value option, premium or discount present at the date of purchase is not amortized. For IOs, IIOs and CMOs that do not contain principal balances, income is accrued based on the carrying value and the effective yield. The difference between income accrued and the interest received on the security is characterized as a return of investment and serves to reduce the asset's carrying value. At each reporting date, the effective yield is adjusted prospectively from the reporting period based on the new estimate of prepayments, current interest rates and current asset prices. The new effective yield is calculated based on the carrying value at the end of the previous reporting period, the new prepayment estimates and the contractual terms of the security. Changes in fair value of all of our Agency RMBS during the period are recorded in earnings and reported as unrealized gains (losses) on mortgage-backed securities in the accompanying consolidated statements of operations. For IIO securities, effective yield and income recognition calculations also take into account the index value applicable to the security.
Capital Expenditures
At December 31, 2017, we had no material commitments for capital expenditures.
Off-Balance Sheet Arrangements
At December 31, 2017, we did not have any off-balance sheet arrangements.
Dividends
In addition to other requirements that must be satisfied to qualify as a REIT, we must pay annual dividends to our stockholders of at least 90% of our REIT taxable income, determined without regard to the deduction for dividends paid and excluding any net capital gains.
REIT taxable income (loss) is computed in accordance with the Code, and can be greater than or less than our financial statement net income (loss) computed in accordance with GAAP. These b
ook to tax differences primarily relate to the recognition of interest income on RMBS, unrealized gains and losses on RMBS, and the amortization of losses on derivative instruments that are treated as funding hedges for tax purposes.
We intend to pay regular monthly dividends to our stockholders and have declared the following dividends since the completion of our IPO.
|
(in thousands, except per share amounts)
|
||||||||
|
Year
|
Per Share Amount
|
Total
|
||||||
|
2013
|
$
|
1.395
|
$
|
4,662
|
||||
|
2014
|
2.160
|
22,643
|
||||||
|
2015
|
1.920
|
38,748
|
||||||
|
2016
|
1.680
|
41,388
|
||||||
|
2017
|
1.680
|
70,717
|
||||||
|
2018 - YTD
(1)
|
0.110
|
5,842
|
||||||
|
Totals
|
$
|
8.945
|
$
|
184,000
|
||||
|
(1)
|
On January 10, 2018, the Company declared a dividend of $0.11 per share to be paid on February 9, 2018. The effect of this dividend is included in the table above, but is not reflected in the Company's financial statements as of December 31, 2017.
|
70
Inflation
Virtually all of our assets and liabilities are interest rate sensitive in nature. As a result, interest rates and other factors influence our performance far more so than does inflation. Changes in interest rates do not necessarily correlate with inflation rates or changes in inflation rates. Our consolidated financial statements are prepared in accordance with GAAP and our distributions will be determined by our Board of Directors consistent with our obligation to distribute to our stockholders at least 90% of our REIT taxable income on an annual basis in order to maintain our REIT qualification; in each case, our activities and balance sheet are measured with reference to historical cost and/or fair market value without considering inflation.
Jumpstart Our Business Startups Act of 2012
We are an "emerging growth company" as defined in the Jumpstart Our Business Startups Act of 2012 (the "JOBS Act"). The JOBS Act permits emerging growth companies to take advantage of an extended transition period to comply with new or revised accounting standards applicable to public companies. We have elected to "opt out" of this provision and, as a result, we will be required to comply with new or revised accounting standards as required when they are adopted. The decision to opt out of the extended transition period under the JOBS Act is irrevocable.
ITEM 7A. QUANTITATIVE AND QUALITATIVE DISCLOSURES ABOUT MARKET RISK
Market risk is the exposure to loss resulting from changes in market factors such as interest rates, foreign currency exchange rates, commodity prices and equity prices. The primary market risks that we are exposed to are interest rate risk, prepayment risk, spread risk, liquidity risk, extension risk and counterparty credit risk.
Interest Rate Risk
Interest rate risk is highly sensitive to many factors, including governmental monetary and tax policies, domestic and international economic and political considerations and other factors beyond our control.
Changes in the general level of interest rates can affect our net interest income, which is the difference between the interest income earned on interest-earning assets and the interest expense incurred in connection with our interest-bearing liabilities, by affecting the spread between our interest-earning assets and interest-bearing liabilities. Changes in the level of interest rates can also affect the rate of prepayments of our securities and the value of the RMBS that constitute our investment portfolio, which affects our net income and ability to realize gains from the sale of these assets and impacts our ability to borrow
,
and the amount that we can borrow against
,
these securities.
We may utilize a variety of financial instruments in order to limit the effects of changes in interest rates on our operations. The principal instruments that we use are futures contracts and options to enter into interest rate swaps. These instruments are intended to serve as a hedge against future interest rate increases on our repurchase agreement borrowings. Hedging techniques are partly based on assumed levels of prepayments of our Agency RMBS. If prepayments are slower or faster than assumed, the life of the Agency RMBS will be longer or shorter, which would reduce the effectiveness of any hedging strategies we may use and may cause losses on such transactions. Hedging strategies involving the use of derivative securities are highly complex and may produce volatile returns. Hedging techniques are also limited by the rules relating to REIT qualification. In order to preserve our REIT status, we may be forced to terminate a hedging transaction at a time when the transaction is most needed.
Our profitability and the value of our investment portfolio (including derivatives used for hedging purposes) may be adversely affected during any period as a result of changing interest rates including changes in the forward yield curve.
71
Our portfolio of PT RMBS is typically comprised of adjustable-rate RMBS ("ARMs"), fixed-rate RMBS and hybrid adjustable-rate RMBS. We generally seek to acquire low duration assets that offer high levels of protection from mortgage prepayments provided they are reasonably priced by the market. Although the duration of an individual asset can change as a result of changes in interest rates, we strive to maintain a hedged PT RMBS portfolio with an effective duration of less than 2.0. The stated contractual final maturity of the mortgage loans underlying our portfolio of PT RMBS generally ranges up to 30 years. However, the effect of prepayments of the underlying mortgage loans tends to shorten the resulting cash flows from our investments substantially. Prepayments occur for various reasons, including refinancing of underlying mortgages and loan payoffs in connection with home sales.
The duration of our IO and IIO portfolios will vary greatly depending on the structural features of the securities. While prepayment activity will always affect the cash flows associated with the securities, the interest only nature of IOs may cause their durations to become extremely negative when prepayments are high, and less negative when prepayments are low. Prepayments affect the durations of IIOs similarly, but the floating rate nature of the coupon of IIOs (which is inversely related to the level of one month LIBOR) cause their price movements, and model duration, to be affected by changes in both prepayments and one month LIBOR, both current and anticipated levels. As a result, the duration of IIO securities will also vary greatly.
Prepayments on the loans underlying our RMBS can alter the timing of the cash flows from the underlying loans to us. As a result, we gauge the interest rate sensitivity of our assets by measuring their effective duration. While modified duration measures the price sensitivity of a bond to movements in interest rates, effective duration captures both the movement in interest rates and the fact that cash flows to a mortgage related security are altered when interest rates move. Accordingly, when the contract interest rate on a mortgage loan is substantially above prevailing interest rates in the market, the effective duration of securities collateralized by such loans can be quite low because of expected prepayments.
We face the risk that the market value of our PT RMBS assets will increase or decrease at different rates than that of our structured RMBS or liabilities, including our hedging instruments. Accordingly, we assess our interest rate risk by estimating the duration of our assets and the duration of our liabilities. We generally calculate duration using various third party models. However, empirical results and various third party models may produce different duration numbers for the same securities.
The following sensitivity analysis shows the estimated impact on the fair value of our interest rate-sensitive investments and hedge positions as of December 31, 2017 and 2016, assuming rates instantaneously fall 100 bps, fall 50 bps, rise 50 bps and rise 100 bps, adjusted to reflect the impact of convexity, which is the measure of the sensitivity of our hedge positions and Agency RMBS' effective duration to movements in interest rates.
All changes in value in the table below are measured as percentage changes from the investment portfolio value and net asset value at the base interest rate scenario. The base interest rate scenario assumes interest rates and prepayment projections as of December 31, 2017 and 2016. We apply a floor of 0% for the down rate scenarios on our interest bearing liabilities and hedge positions, such that any hypothetical interest rate decrease would have a limited positive impact on our funding costs beyond a certain level.
Actual results could differ materially from estimates, especially in the current market environment. To the extent that these estimates or other assumptions do not hold true, which is likely in a period of high price volatility, actual results will likely differ materially from projections and could be larger or smaller than the estimates in the table below. Moreover, if different models were employed in the analysis, materially different projections could result. Lastly, while the table below reflects the estimated impact of interest rate increases and decreases on a static portfolio, we may from time to time sell any of our agency securities as a part of our overall management of our investment portfolio.
72
|
Interest Rate Sensitivity
(1)
|
||||||||
|
Portfolio
|
||||||||
|
Market
|
Book
|
|||||||
|
Change in Interest Rate
|
Value
(2)(3)
|
Value
(2)(4)
|
||||||
|
As of December 31, 2017
|
||||||||
|
-100 Basis Points
|
(0.32
|
)%
|
(2.63
|
)%
|
||||
|
-50 Basis Points
|
(0.21
|
)%
|
(1.73
|
)%
|
||||
|
+50 Basis Points
|
(0.59
|
)%
|
(4.82
|
)%
|
||||
|
+100 Basis Points
|
(1.61
|
)%
|
(13.05
|
)%
|
||||
|
As of December 31, 2016
|
||||||||
|
-100 Basis Points
|
0.55
|
%
|
4.96
|
%
|
||||
|
-50 Basis Points
|
0.55
|
%
|
4.97
|
%
|
||||
|
+50 Basis Points
|
(0.95
|
)%
|
(8.61
|
)%
|
||||
|
+100 Basis Points
|
(2.20
|
)%
|
(19.98
|
)%
|
||||
|
(1)
|
Interest rate sensitivity is derived from models that are dependent on inputs and assumptions provided by third parties as well as by our Manager, and assumes there are no changes in mortgage spreads and assumes a static portfolio. Actual results could differ materially from these estimates.
|
|
(2)
|
Includes the effect of derivatives and other securities used for hedging purposes.
|
|
(3)
|
Estimated dollar change in investment portfolio value expressed as a percent of the total fair value of our investment portfolio as of such date.
|
|
(4)
|
Estimated dollar change in portfolio value expressed as a percent of stockholders' equity as of such date.
|
In addition to changes in interest rates, other factors impact the fair value of our interest rate-sensitive investments, such as the shape of the yield curve, market expectations as to future interest rate changes and other market conditions. Accordingly, in the event of changes in actual interest rates, the change in the fair value of our assets would likely differ from that shown above and such difference might be material and adverse to our stockholders.
Prepayment Risk
Because residential borrowers have the option to prepay their mortgage loans at par at any time, we face the risk that we will experience a return of principal on our investments faster than anticipated. Various factors affect the rate at which mortgage prepayments occur, including changes in the level of and directional trends in housing prices, interest rates, general economic conditions, loan age and size, loan-to-value ratio, the location of the property and social and demographic conditions. Additionally, changes to GSE underwriting practices or other governmental programs could also significantly impact prepayment rates or expectations. Generally, prepayments on Agency RMBS increase during periods of falling mortgage interest rates and decrease during periods of rising mortgage interest rates. However, this may not always be the case. We may reinvest principal repayments at a yield that is lower or higher than the yield on the repaid investment, thus affecting our net interest income by altering the average yield on our assets.
Spread Risk
When the market spread widens between the yield on our Agency RMBS and benchmark interest rates, our net book value could decline if the value of our Agency RMBS fall by more than the offsetting fair value increases on our hedging instruments tied to the underlying benchmark interest rates. We refer to this as "spread risk" or "basis risk." The spread risk associated with our mortgage assets and the resulting fluctuations in fair value of these securities can occur independent of changes in benchmark interest rates and may relate to other factors impacting the mortgage and fixed income markets, such as actual or anticipated monetary policy actions by the Fed, market liquidity, or changes in required rates of return on different assets. Consequently, while we use futures contracts and interest rate swaps and swaptions to attempt to protect against moves in interest rates, such instruments typically will not protect our net book value against spread risk.
73
Liquidity Risk
The primary liquidity risk for us arises from financing long-term assets with shorter-term borrowings through repurchase agreements. Our assets that are pledged to secure repurchase agreements are Agency RMBS and cash. As of December 31, 2017, we had unrestricted cash and cash equivalents of $214.4 million and unpledged securities of approximately $32.3 million (not including securities pledged to us) available to meet margin calls on our repurchase agreements and derivative contracts and for other corporate purposes. However, should the value of our Agency RMBS pledged as collateral or the value of our derivative instruments suddenly decrease, margin calls relating to our repurchase and derivative agreements could increase, causing an adverse change in our liquidity position. Further, there is no assurance that we will always be able to renew (or roll) our repurchase agreements. In addition, our counterparties have the option to increase our haircuts (margin requirements) on the assets we pledge, against repurchase agreements thereby reducing the amount that can be borrowed against an asset even if they agree to renew or roll the repurchase agreement. Significantly higher haircuts can reduce our ability to leverage our portfolio or even force us to sell assets, especially if correlated with asset price declines or faster prepayment rates on our assets.
Extension Risk
The projected weighted average life and the duration (or interest rate sensitivity) of our investments is based on our Manager's assumptions regarding the rate at which the borrowers will prepay the underlying mortgage loans. In general, we use futures contracts and interest rate swaps and swaptions to help manage our funding cost on our investments in the event that interest rates rise. These hedging instruments allow us to reduce our funding exposure on the notional amount of the instrument for a specified period of time.
However, if prepayment rates decrease in a rising interest rate environment, the average life or duration of our fixed-rate assets or the fixed-rate portion of the ARMs or other assets generally extends. This could have a negative impact on our results from operations, as our hedging instrument expirations are fixed and will, therefore, cover a smaller percentage of our funding exposure on our mortgage assets to the extent that their average lives increase due to slower prepayments. This situation may also cause the market value of our agency securities collateralized by fixed rate mortgages or hybrid ARMs to decline by more than otherwise would be the case while most of our hedging instruments would not receive any incremental offsetting gains. In extreme situations, we may be forced to sell assets to maintain adequate liquidity, which could cause us to incur realized losses.
Counterparty Credit Risk
We are exposed to counterparty credit risk relating to potential losses that could be recognized in the event that the counterparties to our repurchase agreements and derivative contracts fail to perform their obligations under such agreements. The amount of assets we pledge as collateral in accordance with our agreements varies over time based on the market value and notional amount of such assets as well as the value of our derivative contracts. In the event of a default by a counterparty, we may not receive payments provided for under the terms of our agreements and may have difficulty obtaining our assets pledged as collateral under such agreements. Our credit risk related to certain derivative transactions is largely mitigated through daily adjustments to collateral pledged based on changes in market value and we limit our counterparties to major financial institutions with acceptable credit ratings. However, there is no guarantee our efforts to manage counterparty credit risk will be successful and we could suffer significant losses if unsuccessful.
74
ITEM 8. FINANCIAL STATEMENTS AND SUPPLEMENTARY DATA
Index to Financial Statements
|
Page
|
||||
|
Report of Independent Registered Public Accounting Firm
|
76
|
|||
|
Consolidated Balance Sheets
|
77
|
|||
|
Consolidated Statements of Operations
|
78
|
|||
|
Consolidated Statements of Stockholders' Equity
|
79
|
|||
|
Consolidated Statements of Cash Flows
|
80
|
|||
|
Notes to Consolidated Financial Statements
|
81
|
|||
75
Report of Independent Registered Public Accounting Firm
Shareholders and Board of Directors
Orchid Island Capital, Inc.
Vero Beach, Florida
Opinion on the Consolidated Financial Statements
We have audited the accompanying consolidated balance sheets of Orchid Island Capital, Inc. (the "Company") and subsidiary as of December 31, 2017 and 2016, the related consolidated statements of operations, stockholders' equity, and cash flows for each of the three years in the period ended December 31, 2017, and the related notes (collectively referred to as the "consolidated financial statements"). In our opinion, the consolidated financial statements present fairly, in all material respects, the financial position of the Company and subsidiaries at December 31, 2017 and 2016, and the results of their operations and their cash flows for each of the three years in the period ended December 31, 2017
,
in conformity with accounting principles generally accepted in the United States of America.
Basis for Opinion
These consolidated financial statements are the responsibility of the Company's management. Our responsibility is to express an opinion on the Company's consolidated financial statements based on our audits. We are a public accounting firm registered with the Public Company Accounting Oversight Board (United States) ("PCAOB") and are required to be independent with respect to the Company in accordance with the U.S. federal securities laws and the applicable rules and regulations of the Securities and Exchange Commission and the PCAOB.
We conducted our audits in accordance with the standards of the PCAOB. Those standards require that we plan and perform the audit to obtain reasonable assurance about whether the consolidated financial statements are free of material misstatement, whether due to error or fraud. The Company is not required to have, nor were we engaged to perform, an audit of its internal control over financial reporting. As part of our audits we are required to obtain an understanding of internal control over financial reporting but not for the purpose of expressing an opinion on the effectiveness of the Company's internal control over financial reporting. Accordingly, we express no such opinion.
Our audits included performing procedures to assess the risks of material misstatement of the consolidated financial statements, whether due to error or fraud, and performing procedures that respond to those risks. Such procedures included examining, on a test basis, evidence regarding the amounts and disclosures in the consolidated financial statements. Our audits also included evaluating the accounting principles used and significant estimates made by management, as well as evaluating the overall presentation of the consolidated financial statements. We believe that our audits provide a reasonable basis for our opinion.
/s/ BDO USA, LLP
Certified Public Accountants
We have served as the Company's auditor since 2011.
West Palm Beach, Florida
February 14, 2018
76
|
ORCHID ISLAND CAPITAL, INC.
|
||||||||
|
CONSOLIDATED BALANCE SHEETS
|
||||||||
|
DECEMBER 31, 2017 and 2016
|
||||||||
|
($ in thousands, except per share data)
|
||||||||
|
2017
|
2016
|
|||||||
|
ASSETS:
|
||||||||
|
Mortgage-backed securities, at fair value
|
||||||||
|
Pledged to counterparties
|
$
|
3,712,561
|
$
|
2,972,290
|
||||
|
Unpledged
|
32,250
|
49,884
|
||||||
|
Total mortgage-backed securities
|
3,744,811
|
3,022,174
|
||||||
|
Cash and cash equivalents
|
214,363
|
73,475
|
||||||
|
Restricted cash
|
32,349
|
20,950
|
||||||
|
Accrued interest receivable
|
14,444
|
11,512
|
||||||
|
Derivative assets, at fair value
|
17,160
|
10,365
|
||||||
|
Other assets
|
216
|
218
|
||||||
|
Total Assets
|
$
|
4,023,343
|
$
|
3,138,694
|
||||
|
LIABILITIES AND STOCKHOLDERS' EQUITY
|
||||||||
|
LIABILITIES:
|
||||||||
|
Repurchase agreements
|
$
|
3,533,786
|
$
|
2,793,705
|
||||
|
Dividends payable
|
7,429
|
4,616
|
||||||
|
Derivative liabilities, at fair value
|
2,038
|
1,982
|
||||||
|
Accrued interest payable
|
6,516
|
1,826
|
||||||
|
Due to affiliates
|
797
|
566
|
||||||
|
Other liabilities
|
10,566
|
3,220
|
||||||
|
Total Liabilities
|
3,561,132
|
2,805,915
|
||||||
|
COMMITMENTS AND CONTINGENCIES
|
||||||||
|
STOCKHOLDERS' EQUITY:
|
||||||||
|
Preferred stock, $0.01 par value; 100,000,000 shares authorized; no shares issued
|
||||||||
|
and outstanding as of December 31, 2017 and December 31, 2016
|
-
|
-
|
||||||
|
Common Stock, $0.01 par value; 500,000,000 shares authorized, 53,061,904
|
||||||||
|
shares issued and outstanding as of December 31, 2017 and 32,962,919 shares issued
|
||||||||
|
and outstanding as of December 31, 2016
|
531
|
330
|
||||||
|
Additional paid-in capital
|
461,680
|
332,449
|
||||||
|
Retained earnings (accumulated deficit)
|
-
|
-
|
||||||
|
Total Stockholders' Equity
|
462,211
|
332,779
|
||||||
|
Total Liabilities and Stockholders' Equity
|
$
|
4,023,343
|
$
|
3,138,694
|
||||
|
See Notes to Consolidated Financial Statements
|
||||||||
77
|
ORCHID ISLAND CAPITAL, INC.
|
||||||||||||
|
CONSOLIDATED STATEMENTS OF OPERATIONS
|
||||||||||||
|
For the Years Ended December 31, 2017, 2016 and 2015
|
||||||||||||
|
($ in thousands, except per share data)
|
||||||||||||
|
2017
|
2016
|
2015
|
||||||||||
|
Interest income
|
$
|
145,962
|
$
|
87,127
|
$
|
68,811
|
||||||
|
Interest expense
|
(41,671
|
)
|
(15,604
|
)
|
(7,271
|
)
|
||||||
|
Net interest income
|
104,291
|
71,523
|
61,540
|
|||||||||
|
Realized (losses) gains on mortgage-backed securities
|
(7,788
|
)
|
3,071
|
(1,411
|
)
|
|||||||
|
Unrealized losses on mortgage-backed securities
|
(67,981
|
)
|
(54,149
|
)
|
(28,274
|
)
|
||||||
|
Losses on derivative instruments
|
(15,349
|
)
|
(9,387
|
)
|
(22,890
|
)
|
||||||
|
FHLB stock dividends
|
-
|
14
|
-
|
|||||||||
|
Net portfolio income
|
13,173
|
11,072
|
8,965
|
|||||||||
|
Expenses:
|
||||||||||||
|
Management fees
|
5,855
|
4,188
|
3,978
|
|||||||||
|
Allocated overhead
|
1,576
|
1,300
|
1,064
|
|||||||||
|
Accrued incentive compensation
|
640
|
806
|
646
|
|||||||||
|
Directors' fees and liability insurance
|
949
|
1,007
|
983
|
|||||||||
|
Audit, legal and other professional fees
|
706
|
871
|
706
|
|||||||||
|
Direct REIT operating expenses
|
1,124
|
652
|
241
|
|||||||||
|
Other administrative
|
316
|
269
|
276
|
|||||||||
|
Total expenses
|
11,166
|
9,093
|
7,894
|
|||||||||
|
Net income
|
$
|
2,007
|
$
|
1,979
|
$
|
1,071
|
||||||
|
Basic and diluted net income per share
|
$
|
0.05
|
$
|
0.08
|
$
|
0.05
|
||||||
|
Weighted Average Shares Outstanding
|
41,062,039
|
24,099,714
|
20,266,706
|
|||||||||
|
See Notes to Consolidated Financial Statements
|
||||||||||||
78
|
ORCHID ISLAND CAPITAL, INC.
|
||||||||||||||||
|
CONSOLIDATED STATEMENT OF STOCKHOLDERS' EQUITY
|
||||||||||||||||
|
Years Ended December 31, 2017, 2016 and 2015
|
||||||||||||||||
|
($ in thousands, except per share data)
|
||||||||||||||||
|
Additional
|
Retained
|
|||||||||||||||
|
Common
|
Paid-in
|
Earnings
|
||||||||||||||
|
Stock
|
Capital
|
(Deficit)
|
Total
|
|||||||||||||
|
Balances, January 1, 2015
|
$
|
167
|
$
|
217,419
|
$
|
492
|
$
|
218,078
|
||||||||
|
Net income
|
-
|
-
|
1,071
|
1,071
|
||||||||||||
|
Cash dividends declared, $1.92 per share
|
-
|
(37,185
|
)
|
(1,563
|
)
|
(38,748
|
)
|
|||||||||
|
Issuance of common stock pursuant to public offerings, net
|
62
|
83,213
|
-
|
83,275
|
||||||||||||
|
Issuance of common stock pursuant to stock based
|
||||||||||||||||
|
compensation plan
|
-
|
287
|
-
|
287
|
||||||||||||
|
Amortization of stock based compensation
|
-
|
144
|
-
|
144
|
||||||||||||
|
Shares repurchased and retired
|
(12
|
)
|
(10,840
|
)
|
-
|
(10,852
|
)
|
|||||||||
|
Balances, December 31, 2015
|
217
|
253,038
|
-
|
253,255
|
||||||||||||
|
Net income
|
-
|
-
|
1,979
|
1,979
|
||||||||||||
|
Cash dividends declared, $1.68 per share
|
-
|
(39,409
|
)
|
(1,979
|
)
|
(41,388
|
)
|
|||||||||
|
Issuance of common stock pursuant to public offerings, net
|
113
|
118,215
|
-
|
118,328
|
||||||||||||
|
Issuance of common stock pursuant to stock based
|
||||||||||||||||
|
compensation plan
|
-
|
301
|
-
|
301
|
||||||||||||
|
Amortization of stock based compensation
|
-
|
304
|
-
|
304
|
||||||||||||
|
Balances, December 31, 2016
|
$
|
330
|
$
|
332,449
|
$
|
-
|
$
|
332,779
|
||||||||
|
Net income
|
-
|
-
|
2,007
|
2,007
|
||||||||||||
|
Cash dividends declared, $1.68 per share
|
-
|
(68,710
|
)
|
(2,007
|
)
|
(70,717
|
)
|
|||||||||
|
Issuance of common stock pursuant to public offerings, net
|
200
|
197,407
|
-
|
197,607
|
||||||||||||
|
Issuance of common stock pursuant to stock based
|
||||||||||||||||
|
compensation plan
|
1
|
261
|
-
|
262
|
||||||||||||
|
Amortization of stock based compensation
|
-
|
273
|
-
|
273
|
||||||||||||
|
Balances, December 31, 2017
|
$
|
531
|
$
|
461,680
|
$
|
-
|
$
|
462,211
|
||||||||
|
See Notes to Consolidated Financial Statements
|
||||||||||||||||
79
|
ORCHID ISLAND CAPITAL, INC.
|
||||||||||||
|
CONSOLIDATED STATEMENTS OF CASH FLOWS
|
||||||||||||
|
For the Years Ended December 31, 2017, 2016 and 2015
|
||||||||||||
|
($ in thousands)
|
||||||||||||
|
2017
|
2016
|
2015
|
||||||||||
|
CASH FLOWS FROM OPERATING ACTIVITIES:
|
||||||||||||
|
Net income
|
$
|
2,007
|
$
|
1,979
|
$
|
1,071
|
||||||
|
Adjustments to reconcile net income to net cash provided by operating activities:
|
||||||||||||
|
Stock based compensation
|
535
|
605
|
431
|
|||||||||
|
Realized and unrealized losses on mortgage-backed securities
|
75,769
|
51,078
|
29,685
|
|||||||||
|
Realized and unrealized gains on interest rate swaptions
|
(1,038
|
)
|
(36
|
)
|
1,648
|
|||||||
|
Realized and unrealized gains on interest rate swaps
|
(4,030
|
)
|
(9,499
|
)
|
-
|
|||||||
|
Realized losses on forward settling to-be-announced securities
|
5,938
|
2,518
|
(386
|
)
|
||||||||
|
Changes in operating assets and liabilities:
|
||||||||||||
|
Accrued interest receivable
|
(2,932
|
)
|
(3,022
|
)
|
(2,279
|
)
|
||||||
|
Other assets
|
(3
|
)
|
80
|
(19
|
)
|
|||||||
|
Accrued interest payable
|
4,690
|
963
|
235
|
|||||||||
|
Other liabilities
|
3,841
|
2,279
|
184
|
|||||||||
|
Due to affiliates
|
231
|
101
|
135
|
|||||||||
|
NET CASH PROVIDED BY OPERATING ACTIVITIES
|
85,008
|
47,046
|
30,705
|
|||||||||
|
CASH FLOWS FROM INVESTING ACTIVITIES:
|
||||||||||||
|
From mortgage-backed securities investments:
|
||||||||||||
|
Purchases
|
(6,499,153
|
)
|
(3,172,001
|
)
|
(2,687,031
|
)
|
||||||
|
Sales
|
5,335,583
|
2,002,813
|
1,832,194
|
|||||||||
|
Principal repayments
|
365,166
|
254,607
|
215,658
|
|||||||||
|
Redemption of FHLB stock
|
3
|
3,750
|
(3,753
|
)
|
||||||||
|
Payments on net settlement of to-be-announced securities
|
(5,242
|
)
|
(1,401
|
)
|
386
|
|||||||
|
Purchase of interest rate swaptions, net of margin cash received
|
1,138
|
704
|
(2,464
|
)
|
||||||||
|
NET CASH USED IN INVESTING ACTIVITIES
|
(802,505
|
)
|
(911,528
|
)
|
(645,010
|
)
|
||||||
|
CASH FLOWS FROM FINANCING ACTIVITIES:
|
||||||||||||
|
Proceeds from repurchase agreements
|
54,481,746
|
32,375,195
|
18,867,303
|
|||||||||
|
Principal payments on repurchase agreements
|
(53,741,665
|
)
|
(31,380,303
|
)
|
(18,505,141
|
)
|
||||||
|
Proceeds from FHLB advances
|
-
|
-
|
187,500
|
|||||||||
|
Principal payments on FHLB advances
|
-
|
(187,500
|
)
|
-
|
||||||||
|
Cash dividends
|
(67,904
|
)
|
(36,772
|
)
|
(38,748
|
)
|
||||||
|
Proceeds from issuance of common stock, net of issuance costs
|
197,607
|
118,328
|
83,275
|
|||||||||
|
Common stock repurchases
|
-
|
-
|
(10,852
|
)
|
||||||||
|
NET CASH PROVIDED BY FINANCING ACTIVITIES
|
869,784
|
888,948
|
583,337
|
|||||||||
|
NET INCREASE IN CASH, CASH EQUIVALENTS AND RESTRICTED CASH
|
152,287
|
24,466
|
(30,968
|
)
|
||||||||
|
CASH, CASH EQUIVALENTS AND RESTRICTED CASH, beginning of the period
|
94,425
|
69,959
|
100,927
|
|||||||||
|
CASH, CASH EQUIVALENTS AND RESTRICTED CASH, end of the period
|
$
|
246,712
|
$
|
94,425
|
$
|
69,959
|
||||||
|
SUPPLEMENTAL DISCLOSURE OF CASH FLOW INFORMATION:
|
||||||||||||
|
Cash paid during the period for:
|
||||||||||||
|
Interest
|
$
|
36,981
|
$
|
14,641
|
$
|
7,036
|
||||||
|
See Notes to Consolidated Financial Statements
|
||||||||||||
80
ORCHID ISLAND CAPITAL, INC.
NOTES TO CONSOLIDATED FINANCIAL STATEMENTS
DECEMBER 31, 2017
NOTE 1. ORGANIZATION AND SIGNIFICANT ACCOUNTING POLICIES
Organization and Business Description
Orchid Island Capital, Inc. ("Orchid"
or the "Company"), was incorporated in Maryland on August 17, 2010 for the purpose of creating and managing a leveraged investment portfolio consisting of residential mortgage-backed securities ("RMBS"). From incorporation to February 20, 2013 Orchid was a wholly owned subsidiary of Bimini Capital Management, Inc. ("Bimini"). Orchid began operations on November 24, 2010 (the date of commencement of operations). From incorporation through November 24, 2010, Orchid's only activity was the issuance of common stock to Bimini.
On February 20, 2013, Orchid completed the initial public offering ("IPO") of its common stock in which it sold approximately 2.4 million shares of its common stock and raised gross proceeds of $35.4 million, which were invested in RMBS that were issued and the principal and interest of which were guaranteed by a federally chartered corporation or agency ("Agency RMBS") on a leveraged basis. Orchid is an "emerging growth company" as defined in the Jumpstart Our Business Startups Act of 2012 (the "JOBS Act").
On March 2, 2015, Orchid entered into an equity distribution agreement (the "March 2015 Equity Distribution Agreement") with two sales agents pursuant to which the Company could offer and sell, from time to time, up to an aggregate amount of $100,000,000 of shares of the Company's common stock in transactions that were deemed to be "at the market" offerings and privately negotiated transactions. The March 2015 Equity Distribution Agreement replaced the September 2014 Equity Distribution Agreement. The Company issued a total of 7,218,766 shares under the March 2015 Equity Distribution Agreement for aggregate gross proceeds of approximately $95.4 million, and net proceeds of approximately $93.2 million, net of commissions and fees, prior to its termination in July 2016.
On July 29, 2015 the Company's Board of Directors authorized the repurchase of up to 2,000,000 shares of the Company's common stock. The timing, manner, price and amount of any repurchases will be determined by the Company in its discretion and will be subject to economic and market conditions, stock price, applicable legal requirements and other factors. The authorization does not obligate the Company to acquire any particular amount of common stock and the program may be suspended or discontinued at the Company's discretion without prior notice. From the inception of the share repurchase program through December 31, 2015, the Company repurchased a total of 1,216,243 shares at an aggregate cost of approximately $10.8 million, including commissions and fees. The Company did not repurchase any shares of its common stock during the years ended December 31, 2017 and 2016.
On July 29, 2016, Orchid entered into another equity distribution agreement (the "July 2016 Equity Distribution Agreement") with two sales agents pursuant to which the Company could offer and sell, from time to time, up to an aggregate amount of $125,000,000 of shares of the Company's common stock in transactions that were deemed to be "at the market" offerings and privately negotiated transactions. The Company issued a total of 10,174,992 shares under the July 2016 Equity Distribution Agreement for aggregate gross proceeds of $110.0 million, and net proceeds of approximately $108.2 million, net of commissions and fees, prior to its termination in February 2017.
On February 23, 2017, Orchid entered into another equity distribution agreement, as amended and restated on May 10, 2017 (the "May 2017 Equity Distribution Agreement"), with two sales agents pursuant to which the Company could offer and sell, from time to time, up to an aggregate amount of $125,000,000 of shares of the Company's common stock in transactions that are deemed to be "at the market" offerings and privately negotiated transactions. The Company issued a total of 12,299,032 shares under the May 2017 Equity Distribution Agreement for aggregate gross proceeds of $125.0 million, and net proceeds of approximately $122.9 million, net of commissions and fees, prior to its termination in August 2017.
81
On August 2, 2017, Orchid entered into another equity distribution agreement (the "August 2017 Equity Distribution Agreement") with two sales agents pursuant to which the Company may offer and sell, from time to time, up to an aggregate amount of $125,000,000 of shares of the Company's common stock in transactions that are deemed to be "at the market" offerings and privately negotiated transactions. The August 2017 Equity Distribution Agreement replaced the May 2017 Equity Distribution Agreement. Through December 31, 2017, the Company issued a total of 7,746,052 shares under the August 2017 Equity Distribution Agreement for aggregate gross proceeds of approximately $76.0 million, and net proceeds of approximately $74.7 million, net of commissions and fees.
Basis of Presentation, Consolidation and Use of Estimates
The accompanying consolidated financial statements have been prepared on the accrual basis of accounting in accordance with accounting principles generally accepted in the United States ("GAAP"). The consolidated financial statements include the accounts of our wholly-owned subsidiary, Orchid Island Casualty, LLC. Significant intercompany accounts and transactions have been eliminated. The preparation of financial statements in conformity with GAAP requires management to make estimates and assumptions that affect the reported amounts of assets and liabilities and disclosure of contingent assets and liabilities at the date of the financial statements and the reported amounts of revenues and expenses during the reporting period. Actual results could differ from those estimates. The significant estimates affecting the accompanying financial statements are the fair values of RMBS and derivatives.
Statement of Comprehensive Income (Loss)
In accordance with the Financial Accounting Standards Board (the "FASB") Accounting Standards Codification ("ASC") Topic 220,
Comprehensive Income
, a statement of comprehensive income (loss) has not been included as the Company has no items of other comprehensive income (loss). Comprehensive income (loss) is the same as net income (loss) for the periods presented.
Cash and Cash Equivalents and Restricted Cash
Cash and cash equivalents include cash on deposit with financial institutions and highly liquid investments with original maturities of three months or less at the time of purchase. Restricted cash includes cash pledged as collateral for repurchase agreements and other borrowings, and interest rate swaps and other derivative instruments.
The following table provides a reconciliation of cash, cash equivalents and restricted cash reported within the statement of financial position that sum to the total of the same such amounts shown in the statement of cash flows.
|
(in thousands)
|
||||||||
|
2017
|
2016
|
|||||||
|
Cash and cash equivalents
|
$
|
214,363
|
$
|
73,475
|
||||
|
Restricted cash
|
32,349
|
20,950
|
||||||
|
Total cash, cash equivalents and restricted cash
|
$
|
246,712
|
$
|
94,425
|
||||
The Company maintains cash balances at four banks and excess margin at derivative exchanges, and, at times, balances may exceed federally insured limits. The Company has not experienced any losses related to these balances. The Federal Deposit Insurance Corporation insures eligible accounts up to $250,000 per depositor at each financial institution. At December 31, 2017, the Company's cash deposits exceeded federally insured limits by approximately $213.3 million. Restricted cash balances are uninsured, but are held in separate customer accounts that are segregated from the general funds of the counterparty. The Company limits uninsured balances to only large, well-known bank and derivative exchanges and believes that it is not exposed to any significant credit risk on cash and cash equivalents or restricted cash balances.
82
Mortgage-Backed Securities
The Company invests primarily in mortgage pass-through ("PT") certificates, collateralized mortgage obligations, and interest-only ("IO") securities and inverse interest-only ("IIO") securities
representing interest in or obligations backed by pools of RMBS.
The Company has elected to account for its investment in RMBS under the fair value option. Electing the fair value option requires the Company to record changes in fair value in the consolidated statement of operations, which, in management's view, more appropriately reflects the results of our operations for a particular reporting period and is consistent with the underlying economics and how the portfolio is managed.
The Company records RMBS transactions on the trade date. Security purchases that have not settled as of the balance sheet date are included in the RMBS balance with an offsetting liability recorded, whereas securities sold that have not settled as of the balance sheet date are removed from the RMBS balance with an offsetting receivable recorded.
The fair value of the Company's investments in RMBS is governed by FASB ASC 820,
Fair Value Measurement
. The definition of fair value in FASB ASC 820 focuses on the price that would be received to sell the asset or paid to transfer the liability in an orderly transaction between market participants at the measurement date. The fair value measurement assumes that the transaction to sell the asset or transfer the liability either occurs in the principal market for the asset or liability, or in the absence of a principal market, occurs in the most advantageous market for the asset or liability. Estimated fair values for RMBS are based on independent pricing sources and/or third party broker quotes, when available.
Income on PT RMBS securities is based on the stated interest rate of the security. Premiums or discounts present at the date of purchase are not amortized. Premium lost and discount accretion resulting from monthly principal repayments are reflected in unrealized gains (losses) on RMBS in the consolidated statements of operations. For IO securities, the income is accrued based on the carrying value and the effective yield. The difference between income accrued and the interest received on the security is characterized as a return of investment and serves to reduce the asset's carrying value. At each reporting date, the effective yield is adjusted prospectively from the reporting period based on the new estimate of prepayments and the contractual terms of the security. For IIO securities, effective yield and income recognition calculations also take into account the index value applicable to the security. Changes in fair value of RMBS during each reporting period are recorded in earnings and reported as unrealized gains or losses on mortgage-backed securities in the accompanying consolidated statements of operations.
Derivative Financial Instruments
The Company uses derivative instruments to manage interest rate risk, facilitate asset/liability strategies and manage other exposures, and it may continue to do so in the future. The principal instruments that the Company has used to date are Treasury Note ("T-Note") and Eurodollar futures contracts, interest rate swaps, options to enter in interest rate swaps ("interest rate swaptions") and "to-be-announced" ("TBA") securities transactions, but may enter into other derivatives in the future.
The Company purchases a portion of its Agency RMBS through forward settling transactions, including TBA securities transactions. At times when market conditions are conducive, the Company may choose to move the settlement of these TBA securities transactions out to a later date by entering into an offsetting short position, which is then net settled for cash, and simultaneously entering into a substantially similar TBA securities trade for a later settlement date. Such a set of transactions is referred to as a TBA "dollar roll" transaction. The TBA securities purchased at the later settlement date are typically priced at a discount to securities for settlement in the current month. This difference is referred to as the "price drop." The price drop represents compensation to the Company for foregoing net interest margin and is referred to as TBA "dollar roll income."
83
The Company accounts for TBA securities as derivative instruments if either the TBA securities do not settle in the shortest period of time possible or if the Company cannot assert that it is probable at inception of the TBA transaction, or throughout its term, that it will take physical delivery
of the Agency RMBS for a long position, or make delivery of the Agency RMBS for a short position, upon settlement of the trade. The Company accounts for TBA dollar roll transactions as a series of derivative transactions. Gains, losses and dollar roll income associated with TBA securities transactions and dollar roll transactions are reported in gain (loss) on derivative instruments in the accompanying consolidated statements of operations. The fair value of TBA securities is estimated based on similar methods used to value RMBS securities.
The Company has elected not to treat any of its derivative financial instruments as hedges in order to align the accounting treatment of its derivative instruments with the treatment of its portfolio assets under the fair value option election. FASB ASC Topic 815,
Derivatives and Hedging
, requires that all derivative instruments be carried at fair value. Changes in fair value are recorded in earnings for each period.
Holding derivatives creates exposure to credit risk related to the potential for failure on the part of counterparties and exchanges to honor their commitments. In addition, the Company may be required to post collateral based on any declines in the market value of the derivatives. In the event of default by a counterparty, the Company may have difficulty recovering its collateral and may not receive payments provided for under the terms of the agreement. To mitigate this risk, the Company uses only well-established commercial banks and exchanges as counterparties.
Financial Instruments
FASB ASC 825,
Financial Instruments
, requires disclosure of the fair value of financial instruments for which it is practicable to estimate that value, either in the body of the financial statements or in the accompanying notes. RMBS, Eurodollar and T-Note futures contracts, interest rate swaps, interest rate swaptions and TBA securities are accounted for at fair value in the consolidated balance sheets. The methods and assumptions used to estimate fair value for these instruments are presented in Note 12 of the consolidated financial statements.
The estimated fair value of cash and cash equivalents, restricted cash, accrued interest receivable, receivable for securities sold, other assets, due to affiliates, repurchase agreements, payable for unsettled securities purchased, accrued interest payable and other liabilities generally approximates their carrying values as of December 31, 2017 and December 31, 2016 due to the short-term nature of these financial instruments.
Repurchase Agreements
The Company finances the acquisition of the majority of its RMBS through the use of repurchase agreements under master repurchase agreements. Pursuant to ASC Topic 860,
Transfers and Servicing
, the Company accounts for repurchase transactions as collateralized financing transactions, which are carried at their contractual amounts, including accrued interest, as specified in the respective agreements.
Manager Compensation
The Company is externally managed by Bimini Advisors, LLC (the "Manager" or "Bimini Advisors"), a Maryland limited liability company and wholly-owned subsidiary of Bimini. The Company's management agreement with the Manager provides for payment to the Manager of a management fee and reimbursement of certain operating expenses, which are accrued and expensed during the period for which they are earned or incurred. Refer to Note 13 for the terms of the management agreement.
84
Earnings Per Share
The Company follows the provisions of FASB ASC 260,
Earnings Per Share
. Basic earnings per share ("EPS") is calculated as net income or loss attributable to common stockholders divided by the weighted average number of shares of common stock outstanding or subscribed during the period. Diluted EPS is calculated using the treasury stock or two-class method, as applicable, for common stock equivalents, if any. However, the common stock equivalents are not included in computing diluted EPS if the result is anti-dilutive.
Income Taxes
Orchid has qualified and elected to be taxed as a real estate investment trust ("REIT") under the Internal Revenue Code of 1986, as amended (the "Code"). REITs are generally not subject to federal income tax on their REIT taxable income provided that they distribute to their stockholders at least 90% of their REIT taxable income on an annual basis. In addition, a REIT must meet other provisions of the Code to retain its tax status.
Orchid measures, recognizes and presents its uncertain tax positions in accordance with FASB ASC 740,
Income Taxes
. Under that guidance, Orchid assesses the likelihood, based on their technical merit, that tax positions will be sustained upon examination based on the facts, circumstances and information available at the end of each period. All of Orchid's tax positions are categorized as highly certain. There is no accrual for any tax, interest or penalties related to Orchid's tax position assessment. The measurement of uncertain tax positions is adjusted when new information is available, or when an event occurs that requires a change.
Recent Accounting Pronouncements
In November 2016, the FASB issued Accounting Standards Update ("ASU") 2016-18,
Statement of Cash Flows – (Topic 230): Restricted Cash.
ASU 2016-18 requires that restricted cash and restricted cash equivalents be included as components of total cash and cash equivalents as presented on the statement of cash flows. ASU 2016-18 is effective for fiscal years, and for interim periods within those years, beginning after December 15, 2017. Early application is permitted. The Company adopted the ASU beginning with the first quarter of 2017. The prior period consolidated statement of cash flows has been retrospectively adjusted to conform to this presentation.
In August 2016, the FASB issued ASU 2016-15,
Statement of Cash Flows – (Topic 230): Classification of Certain Cash Receipts and Cash Payments.
ASU 2016-15 addresses eight specific cash flow issues with the objective of reducing the existing diversity in practice. ASU 2016-15 is effective for fiscal years, and for interim periods within those years, beginning after December 15, 2017. Early application is permitted. The Company does not believe the adoption of this ASU will have a material impact on its consolidated financial statements.
In June 2016, the FASB issued ASU 2016-13,
Financial Instruments – Credit Losses (Topic 326): Measurement of Credit Losses on Financial Instruments.
ASU 2016-13 requires credit losses on most financial assets measured at amortized cost and certain other instruments to be measured using an expected credit loss model (referred to as the current expected credit loss model). ASU 2016-13 is effective for fiscal years, and for interim periods within those years, beginning after December 15, 2019. Early application is permitted for fiscal periods beginning after December 15, 2018. The Company is currently evaluating the potential effect of this ASU on its consolidated financial statements.
In January 2016, the FASB issued ASU 2016-01,
Financial Instruments-Overall (Subtopic 825-10): Recognition and Measurement of Financial Assets and Financial Liabilities
. ASU 2016-01 provides guidance for the recognition, measurement, presentation and disclosure of financial assets and financial liabilities. ASU 2016-01 is effective for fiscal years, and for interim periods within those years, beginning after December 15, 2017 and, for most provisions, is effective using the cumulative-effect transition approach. Early application is permitted for certain provisions. The Company does not believe the adoption of this ASU will have a material impact on its consolidated financial statements.
85
NOTE 2. MORTGAGE-BACKED SECURITIES
The following table presents the Company's RMBS portfolio as of December 31, 2017 and 2016:
|
(in thousands)
|
||||||||
|
2017
|
2016
|
|||||||
|
Pass-Through RMBS Certificates:
|
||||||||
|
Hybrid Adjustable-rate Mortgages
|
$
|
27,398
|
$
|
45,459
|
||||
|
Adjustable-rate Mortgages
|
1,754
|
2,062
|
||||||
|
Fixed-rate Mortgages
|
3,594,533
|
2,826,694
|
||||||
|
Total Pass-Through Certificates
|
3,623,685
|
2,874,215
|
||||||
|
Structured RMBS Certificates:
|
||||||||
|
Interest-Only Securities
|
86,918
|
69,726
|
||||||
|
Inverse Interest-Only Securities
|
34,208
|
78,233
|
||||||
|
Total Structured RMBS Certificates
|
121,126
|
147,959
|
||||||
|
Total
|
$
|
3,744,811
|
$
|
3,022,174
|
||||
The following table summarizes the Company's RMBS portfolio as of December 31, 2017 and 2016, according to the contractual maturities of the securities in the portfolio. Actual maturities of RMBS investments are generally shorter than stated contractual maturities and are affected by the contractual lives of the underlying mortgages, periodic payments of principal, and prepayments of principal.
|
(in thousands)
|
||||||||
|
December 31, 2017
|
December 31, 2016
|
|||||||
|
Greater than one year and less than five years
|
$
|
29
|
$
|
157
|
||||
|
Greater than five years and less than ten years
|
3,281
|
277
|
||||||
|
Greater than or equal to ten years
|
3,741,501
|
3,021,740
|
||||||
|
Total
|
$
|
3,744,811
|
$
|
3,022,174
|
||||
NOTE 3. REPURCHASE AGREEMENTS AND OTHER BORROWINGS
The Company pledges certain of its RMBS as collateral under repurchase agreements with financial institutions. Interest rates are generally fixed based on prevailing rates corresponding to the terms of the borrowings, and interest is generally paid at the termination of a borrowing. If the fair value of the pledged securities declines, lenders will typically require the Company to post additional collateral or pay down borrowings to re-establish agreed upon collateral requirements, referred to as "margin calls." Similarly, if the fair value of the pledged securities increases, lenders may release collateral back to the Company. As of December 31, 2017, the Company had met all margin call requirements.
As of December 31, 2017, the Company had outstanding repurchase obligations of approximately $3,533.8 million with a net weighted average borrowing rate of 1.54%. These agreements were collateralized by RMBS with a fair value, including accrued interest, of approximately $3,726.5 million, and cash pledged to the counterparties of approximately $25.3 million. As of December 31, 2016, the Company had outstanding repurchase obligations of approximately $2,793.7 million with a net weighted average borrowing rate of 1.00%. These agreements were collateralized by RMBS with a fair value, including accrued interest, of approximately $2,970.9 million, and cash pledged to the counterparties of approximately $10.8 million.
86
As of December 31, 2017 and 2016, the Company's repurchase agreements had remaining maturities as summarized below:
|
($ in thousands)
|
||||||||||||||||||||
|
OVERNIGHT
|
BETWEEN 2
|
BETWEEN 31
|
GREATER
|
|||||||||||||||||
|
(1 DAY OR
|
AND
|
AND
|
THAN
|
|||||||||||||||||
|
LESS)
|
30 DAYS
|
90 DAYS
|
90 DAYS
|
TOTAL
|
||||||||||||||||
|
December 31, 2017
|
||||||||||||||||||||
|
Fair market value of securities pledged, including
|
||||||||||||||||||||
|
accrued interest receivable
|
$
|
-
|
$
|
1,983,958
|
$
|
1,266,590
|
$
|
475,975
|
$
|
3,726,523
|
||||||||||
|
Repurchase agreement liabilities associated with
|
||||||||||||||||||||
|
these securities
|
$
|
-
|
$
|
1,871,833
|
$
|
1,208,518
|
$
|
453,435
|
$
|
3,533,786
|
||||||||||
|
Net weighted average borrowing rate
|
-
|
1.53
|
%
|
1.53
|
%
|
1.57
|
%
|
1.54
|
%
|
|||||||||||
|
December 31, 2016
|
||||||||||||||||||||
|
Fair market value of securities pledged, including
|
||||||||||||||||||||
|
accrued interest receivable
|
$
|
-
|
$
|
2,284,815
|
$
|
686,065
|
$
|
-
|
$
|
2,970,880
|
||||||||||
|
Repurchase agreement liabilities associated with
|
||||||||||||||||||||
|
these securities
|
$
|
-
|
$
|
2,154,766
|
$
|
638,939
|
$
|
-
|
$
|
2,793,705
|
||||||||||
|
Net weighted average borrowing rate
|
-
|
1.01
|
%
|
0.96
|
%
|
-
|
1.00
|
%
|
||||||||||||
If, during the term of a repurchase agreement, a lender files for bankruptcy, the Company might experience difficulty recovering its pledged assets
,
which could result in an unsecured claim against the lender for the difference between the amount loaned to the Company plus interest due to the counterparty and the fair value of the collateral pledged to such lender
, including the accrued interest receivable and cash posted by the Company as collateral.
At December 31, 2017, the Company had an aggregate amount at risk (the difference between the amount loaned to the Company, including interest payable and securities posted by the counterparty (if any), and the fair value of securities and cash pledged (if any), including accrued interest on such securities) with all counterparties of approximately $213.4 million. The Company did not have an amount at risk with any individual counterparty greater than 10% of the Company's equity at December 31, 2017 and December 31, 2016.
NOTE 4. DERIVATIVE FINANCIAL INSTRUMENTS
In connection with its interest rate risk management strategy, the Company economically hedges a portion of the cost of its repurchase agreement funding by entering into derivatives and other hedging contracts. To date, the Company has entered into Eurodollar and T-Note futures contracts, interest rate swaps, and interest rate swaptions, but may enter into other contracts in the future. The Company has not elected hedging treatment under GAAP, and as such all gains or losses (realized and unrealized) on these instruments are reflected in earnings for all periods presented.
In addition, the Company utilizes TBA securities as a means of investing in and financing Agency RMBS or as a means of reducing its exposure to Agency RMBS.
The Company accounts for TBA securities as derivative instruments if either the TBA securities do not settle in the shortest period of time possible or if the Company cannot assert that it is probable at inception and throughout the term of the TBA securities that it will take physical delivery
of the Agency RMBS for a long position, or make delivery of the Agency RMBS for a short position, upon settlement of the trade.
87
Derivative Assets (Liabilities), at Fair Value
The table below summarizes fair value information about our derivative assets and liabilities as of December 31, 2017 and 2016.
|
(in thousands)
|
|||||||||
|
Derivative Instruments and Related Accounts
|
Balance Sheet Location
|
2017
|
2016
|
||||||
|
Assets
|
|||||||||
|
Interest rate swaps
|
Derivative assets, at fair value
|
$
|
13,745
|
$
|
10,302
|
||||
|
Payer swaptions
|
Derivative assets, at fair value
|
3,405
|
-
|
||||||
|
TBA securities
|
Derivative assets, at fair value
|
10
|
63
|
||||||
|
Total derivative assets, at fair value
|
$
|
17,160
|
$
|
10,365
|
|||||
|
Liabilities
|
|||||||||
|
Interest rate swaps
|
Derivative liabilities, at fair value
|
$
|
215
|
$
|
802
|
||||
|
TBA securities
|
Derivative liabilities, at fair value
|
1,823
|
1,180
|
||||||
|
Total derivative liabilities, at fair value
|
$
|
2,038
|
$
|
1,982
|
|||||
|
Margin Balances Posted to (from) Counterparties
|
|||||||||
|
Futures contracts
|
Restricted cash
|
$
|
5,545
|
$
|
9,419
|
||||
|
TBA securities
|
Restricted cash
|
1,508
|
446
|
||||||
|
TBA securities
|
Other liabilities
|
(59
|
)
|
-
|
|||||
|
Interest rate swaption contracts
|
Other liabilities
|
(3,505
|
)
|
-
|
|||||
|
Total margin balances on derivative contracts
|
$
|
3,489
|
$
|
9,865
|
|||||
Eurodollar and T-Note futures are cash settled futures contracts on an interest rate, with gains and losses credited or charged to the Company's cash accounts on a daily basis. A minimum balance, or "margin", is required to be maintained in the account on a daily basis. The tables below present information related to the Company's Eurodollar and T-Note futures positions at December 31, 2017 and 2016.
|
($ in thousands)
|
||||||||||||||||
|
December 31, 2017
|
||||||||||||||||
|
Average
|
Weighted
|
Weighted
|
||||||||||||||
|
Contract
|
Average
|
Average
|
||||||||||||||
|
Notional
|
Entry
|
Effective
|
Open
|
|||||||||||||
|
Expiration Year
|
Amount
|
Rate
|
Rate
|
Equity
(1)
|
||||||||||||
|
Eurodollar Futures Contracts (Short Positions)
|
||||||||||||||||
|
2018
|
$
|
1,212,500
|
1.86
|
%
|
1.98
|
%
|
$
|
1,418
|
||||||||
|
2019
|
1,350,000
|
2.11
|
%
|
2.27
|
%
|
2,152
|
||||||||||
|
2020
|
987,500
|
2.59
|
%
|
2.36
|
%
|
(2,360
|
)
|
|||||||||
|
Total / Weighted Average
|
$
|
1,183,333
|
2.16
|
%
|
2.20
|
%
|
$
|
1,210
|
||||||||
|
Treasury Note Futures Contracts (Short Position)
(2)
|
||||||||||||||||
|
March 2018 10-year T-Note futures
|
||||||||||||||||
|
(Mar 2018 - Mar 2028 Hedge Period)
|
$
|
140,000
|
2.23
|
%
|
2.33
|
%
|
$
|
755
|
||||||||
88
|
($ in thousands)
|
||||||||||||||||
|
December 31, 2016
|
||||||||||||||||
|
Average
|
Weighted
|
Weighted
|
||||||||||||||
|
Contract
|
Average
|
Average
|
||||||||||||||
|
Notional
|
Entry
|
Effective
|
Open
|
|||||||||||||
|
Expiration Year
|
Amount
|
Rate
|
Rate
|
Equity
(1)
|
||||||||||||
|
Eurodollar Futures Contracts (Short Positions)
|
||||||||||||||||
|
2017
|
$
|
600,000
|
1.48
|
%
|
1.28
|
%
|
$
|
(1,206
|
)
|
|||||||
|
2018
|
600,000
|
1.81
|
%
|
1.82
|
%
|
76
|
||||||||||
|
2019
|
675,000
|
2.00
|
%
|
2.21
|
%
|
1,429
|
||||||||||
|
2020
|
700,000
|
2.65
|
%
|
2.45
|
%
|
(1,394
|
)
|
|||||||||
|
Total / Weighted Average
|
$
|
643,750
|
2.01
|
%
|
1.97
|
%
|
$
|
(1,095
|
)
|
|||||||
|
Treasury Note Futures Contracts (Short Position)
(2)
|
||||||||||||||||
|
March 2017 10 year T-Note futures
|
||||||||||||||||
|
(Mar 2017 - Mar 2027 Hedge Period)
|
$
|
465,000
|
2.27
|
%
|
2.24
|
%
|
$
|
(3,134
|
)
|
|||||||
|
(1)
|
Open equity represents the cumulative gains (losses) recorded on open futures positions from inception.
|
|
(2)
|
T-Note futures contracts were valued at a price of $124.05 at December 31, 2017 and $124.28 at December 31, 2016. The notional contract values of the short positions were $173.7 million and $577.9 million at December 31, 2017 and December 31, 2016, respectively.
|
Under our interest rate swap agreements, we typically pay a fixed rate and receive a floating rate based on the London Interbank Offered Rate ("LIBOR") ("payer swaps"). The floating rate we receive under our swap agreements has the effect of offsetting the repricing characteristics of our repurchase agreements and cash flows on such liabilities. We are typically required to post collateral on our interest rate swap agreements. The table below presents information related to the Company's interest rate swap positions at December 31, 2017 and 2016.
|
($ in thousands)
|
||||||||||||||||||||
|
Average
|
Net
|
|||||||||||||||||||
|
Fixed
|
Average
|
Estimated
|
Average
|
|||||||||||||||||
|
Notional
|
Pay
|
Receive
|
Fair
|
Maturity
|
||||||||||||||||
|
Amount
|
Rate
|
Rate
|
Value
|
(Years)
|
||||||||||||||||
|
December 31, 2017
|
||||||||||||||||||||
|
Expiration > 1 to ≤ 3 years
|
$
|
650,000
|
1.09
|
%
|
1.41
|
%
|
$
|
11,828
|
2.1
|
|||||||||||
|
Expiration > 3 to ≤ 5 years
|
360,000
|
2.05
|
%
|
1.53
|
%
|
1,702
|
4.3
|
|||||||||||||
|
$
|
1,010,000
|
1.43
|
%
|
1.45
|
%
|
$
|
13,530
|
2.8
|
||||||||||||
|
December 31, 2016
|
||||||||||||||||||||
|
Expiration > 3 to ≤ 5 years
|
$
|
700,000
|
1.20
|
%
|
0.91
|
%
|
$
|
9,500
|
3.4
|
|||||||||||
The table below presents information related to the Company's interest rate swaption positions at December 31, 2017.
|
($ in thousands)
|
|||||||
|
Option
|
Underlying Swap
|
||||||
|
Weighted
|
Weighted
|
||||||
|
Average
|
Fixed
|
Receive
|
Average
|
||||
|
Fair
|
Months to
|
Notional
|
Pay
|
Rate
|
Term
|
||
|
Expiration
|
Cost
|
Value
|
Expiration
|
Amount
|
Rate
|
(LIBOR)
|
(Years)
|
|
Payer Swaptions
|
|||||||
|
≤ 1 year
|
$2,367
|
$3,405
|
8.0
|
$200,000
|
2.16%
|
3 Month
|
6.0
|
89
The following table summarizes our contracts to purchase and sell TBA securities as of December 31, 2017 and 2016.
|
($ in thousands)
|
|||||||||
|
Notional
|
Net
|
||||||||
|
Amount
|
Cost
|
Market
|
Carrying
|
||||||
|
Long (Short)
(1)
|
Basis
(2)
|
Value
(3)
|
Value
(4)
|
||||||
|
December 31, 2017
|
|||||||||
|
30-Year TBA securities:
|
|||||||||
|
3.0%
|
$
|
(300,000)
|
$
|
(299,371)
|
$
|
(300,153)
|
$
|
(782)
|
|
|
4.0%
|
(357,000)
|
(373,403)
|
(373,477)
|
(74)
|
|||||
|
4.5%
|
356,556
|
380,371
|
379,414
|
(957)
|
|||||
|
Total
|
$
|
(300,444)
|
$
|
(292,403)
|
$
|
(294,216)
|
$
|
(1,813)
|
|
|
December 31, 2016
|
|||||||||
|
30-Year TBA securities:
|
|||||||||
|
3.0%
|
$
|
(100,000)
|
$
|
(99,406)
|
$
|
(99,344)
|
$
|
62
|
|
|
4.0%
|
(100,000)
|
(103,898)
|
(105,078)
|
(1,180)
|
|||||
|
Total
|
$
|
(200,000)
|
$
|
(203,304)
|
$
|
(204,422)
|
$
|
(1,118)
|
|
|
(1)
|
Notional amount represents the par value (or principal balance) of the underlying Agency RMBS
.
|
|
(2)
|
Cost basis represents the forward price to be paid (received) for the underlying Agency RMBS
.
|
|
(3)
|
Market value represents the current market value of the TBA securities (or of the underlying Agency RMBS) as of period-end.
|
|
(4)
|
Net carrying value represents the difference between the market value and the cost basis of the TBA securities as of period-end and is reported in derivative assets (liabilities) at fair value in our consolidated balance sheets.
|
Gain (Loss) From Derivative Instruments, Net
The table below presents the effect of the Company's derivative financial instruments on the consolidated statements of operations for the years ended December 31, 2017, 2016 and 2015.
|
(in thousands)
|
||||||||||||
|
2017
|
2016
|
2015
|
||||||||||
|
Eurodollar futures contracts (short positions)
|
$
|
1,257
|
$
|
(12,808
|
)
|
$
|
(17,741
|
)
|
||||
|
T-Note futures contracts (short position)
|
(14,922
|
)
|
(3,600
|
)
|
(3,887
|
)
|
||||||
|
Interest rate swaps
|
3,216
|
9,503
|
-
|
|||||||||
|
Receiver swaptions
|
-
|
36
|
(431
|
)
|
||||||||
|
Payer swaptions
|
1,038
|
-
|
(1,217
|
)
|
||||||||
|
Net TBA securities
|
(5,938
|
)
|
(2,518
|
)
|
386
|
|||||||
|
Total
|
$
|
(15,349
|
)
|
$
|
(9,387
|
)
|
$
|
(22,890
|
)
|
|||
Credit Risk-Related Contingent Features
The use of derivatives creates exposure to credit risk relating to potential losses that could be recognized in the event that the counterparties to these instruments fail to perform their obligations under the contracts. We minimize this risk by limiting our counterparties for instruments which are not centrally cleared on a registered exchange to major financial institutions with acceptable credit ratings and monitoring positions with individual counterparties. In addition, we may be required to pledge assets as collateral for our derivatives, whose amounts vary over time based on the market value, notional amount and remaining term of the derivative contract. In the event of a default by a counterparty
,
we may not receive payments provided for under the terms of our derivative agreements, and may have difficulty obtaining our assets pledged as collateral for our derivatives. The cash and cash equivalents pledged as collateral for our derivative instruments are included in restricted cash on our consolidated balance sheets.
90
NOTE 5. PLEDGED ASSETS
Assets Pledged to Counterparties
The table below summarizes our assets pledged as collateral under our repurchase agreements, prime brokerage clearing accounts, derivative agreements and insurance capital by type, including securities pledged related to securities sold but not yet settled, as of December 31, 2017 and 2016.
|
(in thousands)
|
||||||||||||
|
December 31, 2017
|
||||||||||||
|
Repurchase
|
Derivative
|
|||||||||||
|
Assets Pledged to Counterparties
|
Agreements
|
Agreements
|
Total
|
|||||||||
|
PT RMBS - fair value
|
$
|
3,612,244
|
$
|
-
|
$
|
3,612,244
|
||||||
|
Structured RMBS - fair value
|
100,317
|
-
|
100,317
|
|||||||||
|
Accrued interest on pledged securities
|
13,962
|
-
|
13,962
|
|||||||||
|
Restricted cash
|
25,296
|
7,053
|
32,349
|
|||||||||
|
Total
|
$
|
3,751,819
|
$
|
7,053
|
$
|
3,758,872
|
||||||
|
(in thousands)
|
||||||||||||||||||||
|
December 31, 2016
|
||||||||||||||||||||
|
Repurchase
|
Clearing
|
Derivative
|
Insurance
|
|||||||||||||||||
|
Assets Pledged to Counterparties
|
Agreements
|
Margin
|
Agreements
|
Capital
(1)
|
Total
|
|||||||||||||||
|
PT RMBS - fair value
|
$
|
2,854,062
|
$
|
-
|
$
|
-
|
$
|
1,065
|
$
|
2,855,127
|
||||||||||
|
Structured RMBS - fair value
|
106,195
|
10,968
|
-
|
-
|
117,163
|
|||||||||||||||
|
Accrued interest on pledged securities
|
10,623
|
266
|
-
|
4
|
10,893
|
|||||||||||||||
|
Restricted cash
|
10,835
|
-
|
9,865
|
250
|
20,950
|
|||||||||||||||
|
Total
|
$
|
2,981,715
|
$
|
11,234
|
$
|
9,865
|
$
|
1,319
|
$
|
3,004,133
|
||||||||||
|
(1)
|
Orchid Island Casualty, Inc. was required to maintain sufficient capital in the form of cash and securities to protect it against losses.
|
Assets Pledged from Counterparties
The table below summarizes our assets pledged to us from counterparties under our repurchase agreements as of December 31, 2017 and 2016.
|
(in thousands)
|
||||||||||||||||||||||||
|
December 31, 2017
|
December 31, 2016
|
|||||||||||||||||||||||
|
Repurchase
|
Derivative
|
Repurchase
|
Derivative
|
|||||||||||||||||||||
|
Assets Pledged to Orchid
|
Agreements
|
Agreements
|
Total
|
Agreements
|
Agreements
|
Total
|
||||||||||||||||||
|
Cash
|
$
|
67
|
$
|
3,564
|
$
|
3,631
|
$
|
1,029
|
$
|
-
|
$
|
1,029
|
||||||||||||
|
U.S. Treasury securities - fair value
|
-
|
-
|
-
|
3,438
|
-
|
3,438
|
||||||||||||||||||
|
Total
|
$
|
67
|
$
|
3,564
|
$
|
3,631
|
$
|
4,467
|
$
|
-
|
$
|
4,467
|
||||||||||||
PT RMBS and U.S. Treasury securities received as margin under our repurchase agreements are not recorded in the consolidated balance sheets because the counterparty retains ownership of the security. Cash received as margin is recognized in cash and cash equivalents with a corresponding amount recognized as an increase in repurchase agreements or other liabilities in the consolidated balance sheets.
91
NOTE 6. OFFSETTING ASSETS AND LIABILITIES
The Company's derivatives and repurchase agreements are subject to underlying agreements with master netting or similar arrangements, which provide for the right of offset in the event of default or in the event of bankruptcy of either party to the transactions. The Company reports its assets and liabilities subject to these arrangements on a gross basis.
The following table presents information regarding those assets and liabilities subject to such arrangements as if the Company had presented them on a net basis as of December 31, 2017 and 2016.
|
(in thousands)
|
||||||||||||||||||||||||
|
Offsetting of Assets
|
||||||||||||||||||||||||
|
Net Amount
|
Gross Amount Not Offset in the
|
|||||||||||||||||||||||
|
of Assets
|
Consolidated Balance Sheet
|
|||||||||||||||||||||||
|
Gross Amount
|
Presented
|
Financial
|
||||||||||||||||||||||
|
Gross Amount
|
Offset in the
|
in the
|
Instruments
|
Cash
|
||||||||||||||||||||
|
of Recognized
|
Consolidated
|
Consolidated
|
Received as
|
Received as
|
Net
|
|||||||||||||||||||
|
Assets
|
Balance Sheet
|
Balance Sheet
|
Collateral
|
Collateral
|
Amount
|
|||||||||||||||||||
|
December 31, 2017
|
||||||||||||||||||||||||
|
Interest rate swaps
|
$
|
13,745
|
$
|
-
|
$
|
13,745
|
$
|
-
|
$
|
-
|
$
|
13,745
|
||||||||||||
|
Interest rate swaptions
|
3,405
|
-
|
3,405
|
-
|
(3,405
|
)
|
-
|
|||||||||||||||||
|
TBA securities
|
10
|
-
|
10
|
-
|
(10
|
)
|
-
|
|||||||||||||||||
|
$
|
17,160
|
$
|
-
|
$
|
17,160
|
$
|
-
|
$
|
(3,415
|
)
|
$
|
13,745
|
||||||||||||
|
December 31, 2016
|
||||||||||||||||||||||||
|
Interest rate swaps
|
$
|
10,302
|
$
|
-
|
$
|
10,302
|
$
|
-
|
$
|
-
|
$
|
10,302
|
||||||||||||
|
TBA securities
|
63
|
-
|
63
|
-
|
(63
|
)
|
-
|
|||||||||||||||||
|
$
|
10,365
|
$
|
-
|
$
|
10,365
|
$
|
-
|
$
|
(63
|
)
|
$
|
10,302
|
||||||||||||
|
(in thousands)
|
||||||||||||||||||||||||
|
Offsetting of Liabilities
|
||||||||||||||||||||||||
|
Net Amount
|
Gross Amount Not Offset in the
|
|||||||||||||||||||||||
|
of Assets
|
Consolidated Balance Sheet
|
|||||||||||||||||||||||
|
Gross Amount
|
Presented
|
Financial
|
||||||||||||||||||||||
|
Gross Amount
|
Offset in the
|
in the
|
Instruments
|
|||||||||||||||||||||
|
of Recognized
|
Consolidated
|
Consolidated
|
Posted as
|
Cash Posted
|
Net
|
|||||||||||||||||||
|
Liabilities
|
Balance Sheet
|
Balance Sheet
|
Collateral
|
Collateral
|
Amount
|
|||||||||||||||||||
|
December 31, 2017
|
||||||||||||||||||||||||
|
Repurchase Agreements
|
$
|
3,533,786
|
$
|
-
|
$
|
3,533,786
|
$
|
(3,508,490
|
)
|
$
|
(25,296
|
)
|
$
|
-
|
||||||||||
|
Interest rate swaps
|
215
|
-
|
215
|
-
|
-
|
215
|
||||||||||||||||||
|
TBA securities
|
1,823
|
-
|
1,823
|
-
|
(1,508
|
)
|
315
|
|||||||||||||||||
|
$
|
3,535,824
|
$
|
-
|
$
|
3,535,824
|
$
|
(3,508,490
|
)
|
$
|
(26,804
|
)
|
$
|
530
|
|||||||||||
|
December 31, 2016
|
||||||||||||||||||||||||
|
Repurchase Agreements
|
$
|
2,793,705
|
$
|
-
|
$
|
2,793,705
|
$
|
(2,782,870
|
)
|
$
|
(10,835
|
)
|
$
|
-
|
||||||||||
|
Interest rate swaps
|
802
|
-
|
802
|
-
|
(802
|
)
|
-
|
|||||||||||||||||
|
TBA securities
|
1,180
|
-
|
1,180
|
-
|
(848
|
)
|
332
|
|||||||||||||||||
|
$
|
2,795,687
|
$
|
-
|
$
|
2,795,687
|
$
|
(2,782,870
|
)
|
$
|
(12,485
|
)
|
$
|
332
|
|||||||||||
The amounts disclosed for collateral received by or posted to the same counterparty up to and not exceeding the net amount of the asset or liability presented in the consolidated balance sheets. The fair value of the actual collateral received by or posted to the same counterparty typically exceeds the amounts presented. See Note 5 for a discussion of collateral posted or received against or for repurchase obligations and derivative instruments.
92
NOTE 7. CAPITAL STOCK
Common Stock Issuances
During 2017 and 2016, the Company completed the following public offerings of shares of its common stock. There were no common stock issuances through public offerings during the three months ended March 31, 2016 and September 30, 2017.
|
($ in thousands, except per share amounts)
|
|||||||||||||||||||||
|
Weighted
|
|||||||||||||||||||||
|
Average
|
|||||||||||||||||||||
|
Price
|
|||||||||||||||||||||
|
Book Value Per Share
|
Received
|
Net
|
|||||||||||||||||||
|
Type of Offering
|
Period
|
Beginning
|
Ending
|
Per Share
(1)
|
Shares
|
Proceeds
(2)
|
|||||||||||||||
|
2017
|
|||||||||||||||||||||
|
At the Market Offering Program
(3)
|
First Quarter
|
$
|
10.10
|
$
|
9.75
|
$
|
10.13
|
1,286,196
|
$
|
12,792
|
|||||||||||
|
At the Market Offering Program
(3)
|
Second Quarter
|
9.75
|
9.23
|
10.17
|
11,012,836
|
110,065
|
|||||||||||||||
|
At the Market Offering Program
(3)
|
Fourth Quarter
|
9.15
|
8.71
|
9.81
|
7,746,052
|
74,750
|
|||||||||||||||
|
20,045,084
|
$
|
197,607
|
|||||||||||||||||||
|
2016
|
|||||||||||||||||||||
|
At the Market Offering Program
(3)
|
Second Quarter
|
$
|
11.01
|
$
|
10.86
|
$
|
10.48
|
646,753
|
$
|
6,591
|
|||||||||||
|
At the Market Offering Program
(3)
|
Third Quarter
|
10.86
|
11.21
|
10.80
|
3,818,802
|
40,525
|
|||||||||||||||
|
At the Market Offering Program
(3)
|
Fourth Quarter
|
11.21
|
10.10
|
10.79
|
6,707,101
|
71,212
|
|||||||||||||||
|
11,172,656
|
$
|
118,328
|
|||||||||||||||||||
|
(1)
|
Weighted average price received per share is gross of underwriters' discount, if applicable, and other offering costs.
|
|
(2)
|
Net proceeds are net of the underwriters' discount, if applicable, and other offering costs.
|
|
(3)
|
The Company has entered into six equity distribution agreements, five of which have either been terminated because all shares were sold or were replaced with a subsequent agreement.
|
Share Repurchase Program
On July 29, 2015, the Company's Board of Directors authorized the repurchase of up to 2,000,000 shares of the Company's common stock. As part of the share repurchase program, shares may be purchased in open market transactions, including through block purchases, through privately negotiated transactions, or pursuant to any trading plan that may be adopted in accordance with Rule 10b5-1 of the Securities Exchange Act of 1934, as amended (the "Exchange Act"). Open market repurchases will be made in accordance with Exchange Act Rule 10b-18, which sets certain restrictions on the method, timing, price and volume of open market stock repurchases. The timing, manner, price and amount of any repurchases will be determined by the Company in its discretion and will be subject to economic and market conditions, stock price, applicable legal requirements and other factors. The authorization does not obligate the Company to acquire any particular amount of common stock and the program may be suspended or discontinued at the Company's discretion without prior notice.
From the inception of the share repurchase program through December 31, 2017, the Company repurchased a total of 1,216,243 shares at an aggregate cost of approximately $10.8 million, including commissions and fees, for a weighted average price of $8.92 per share. No shares were repurchased during the years ended December 31, 2017 or 2016.
On February 8, 2018, the Board of Directors approved an increase in the stock repurchase program for up to an additional
4,522,822
shares of the Company's common stock, which results in a total authorization under the repurchase program for up to
5,306,579
shares of our common stock.
93
Cash Dividends
The table below presents the cash dividends declared on the Company's common stock.
|
(in thousands, except per share amounts)
|
||||||||
|
Year
|
Per Share Amount
|
Total
|
||||||
|
2013
|
$
|
1.395
|
$
|
4,662
|
||||
|
2014
|
2.160
|
22,643
|
||||||
|
2015
|
1.920
|
38,748
|
||||||
|
2016
|
1.680
|
41,388
|
||||||
|
2017
|
1.680
|
70,717
|
||||||
|
2018 - YTD
(1)
|
0.110
|
5,842
|
||||||
|
Totals
|
$
|
8.945
|
$
|
184,000
|
||||
|
(1)
|
On January 10, 2018, the Company declared a dividend of $0.11 per share to be paid on February 9, 2018. The effect of this dividend is included in the table above, but is not reflected in the Company's financial statements as of December 31, 2017.
|
NOTE 8. STOCK INCENTIVE PLAN
In October 2012, the Company's Board of Directors adopted and Bimini, then the Company's sole stockholder, approved, the Orchid Island Capital, Inc. 2012 Equity Incentive Plan (the "Incentive Plan") to recruit and retain employees, directors and other service providers, including employees of the Manager and other affiliates. The Incentive Plan provides for the award of stock options, stock appreciation rights, stock award, performance units, other equity-based awards (and dividend equivalents with respect to awards of performance units and other equity-based awards) and incentive awards. The Incentive Plan is administered by the Compensation Committee of the Company's Board of Directors except that the Company's full Board of Directors will administer awards made to directors who are not employees of the Company or its affiliates. The Incentive Plan provides for awards of up to an aggregate of 10% of the issued and outstanding shares of our common stock (on a fully diluted basis) at the time of the awards, subject to a maximum aggregate 4,000,000 shares of the Company's common stock that may be issued under the Incentive Plan.
Restricted Stock Awards
The table below presents information related to the Company's restricted common stock at December 31, 2017 and 2016.
|
($ in thousands, except per share data)
|
||||||||||||||||
|
2017
|
2016
|
|||||||||||||||
|
Weighted
|
Weighted
|
|||||||||||||||
|
Average
|
Average
|
|||||||||||||||
|
Grant Date
|
Grant Date
|
|||||||||||||||
|
Shares
|
Fair Value
|
Shares
|
Fair Value
|
|||||||||||||
|
Unvested, beginning of period
|
8,000
|
$
|
12.23
|
16,000
|
$
|
12.23
|
||||||||||
|
Granted
|
-
|
-
|
-
|
-
|
||||||||||||
|
Vested and issued
|
(8,000
|
)
|
12.23
|
(8,000
|
)
|
12.23
|
||||||||||
|
Unvested, end of period
|
-
|
$
|
-
|
8,000
|
$
|
12.23
|
||||||||||
|
Compensation expense during period
|
$
|
33
|
$
|
98
|
||||||||||||
|
Unrecognized compensation expense, end of period
|
$
|
-
|
$
|
33
|
||||||||||||
|
Intrinsic value, end of period
|
$
|
-
|
$
|
87
|
||||||||||||
|
Weighted-average remaining vesting term (in years)
|
-
|
0.3
|
||||||||||||||
94
Stock Awards
The Company issues immediately vested common stock under the Incentive Plan to certain executive officers, employees and directors. The following table presents information related to fully vested common stock issued during the years ended December 31, 2017 and 2016.
|
($ in thousands, except per share data)
|
||||||||
|
2017
|
2016
|
|||||||
|
Fully vested shares granted
(1)
|
29,160
|
40,571
|
||||||
|
Weighted average grant date price per share
|
$
|
9.80
|
$
|
10.08
|
||||
|
Compensation expense related to fully vested shares of common stock awards
(2)
|
$
|
286
|
$
|
409
|
||||
|
(1)
|
The table above includes 17,335 fully vested shares of common stock which were granted in January and March 2017 with respect to service performed during 2016 and 33,019 fully vested shares of common stock which were granted in January and March 2016 with respect to service performed during 2015.
|
|
(2)
|
Approximately $168,000 of compensation expense related to the 2017 share awards was accrued and recognized in 2016. Approximately $330,000 of compensation expense related to the 2016 share awards was accrued and recognized in 2015.
|
Performance Units
The Company may issue performance units under the Incentive Plan to certain executive officers and employees. "Performance Units" vest after the end of a defined performance period, based on satisfaction of the performance conditions set forth in the performance unit agreement.
When earned, each Performance Unit will be settled by the issuance of one share of the Company's common stock, at which time the Performance Unit will be cancelled. The Performance Units contain dividend equivalent rights which entitle the Participants to receive distributions declared by the Company on common stock, but do not include the right to vote the shares. Performance Units are subject to forfeiture should the participant no longer serve as an executive officer or employee for the Company. Compensation expense for the Performance Units are recognized over the remaining vesting period once it becomes probable that the performance conditions will be achieved.
The following table presents information related to Performance Units outstanding during the years ended December 31, 2017.
|
($ in thousands, except per share data)
|
||||||||||||||||
|
2017
|
2016
|
|||||||||||||||
|
Weighted
|
Weighted
|
|||||||||||||||
|
Average
|
Average
|
|||||||||||||||
|
Grant Date
|
Grant Date
|
|||||||||||||||
|
Shares
|
Fair Value
|
Shares
|
Fair Value
|
|||||||||||||
|
Unvested, beginning of period
|
45,305
|
$
|
10.33
|
7,508
|
$
|
13.32
|
||||||||||
|
Granted
|
15,707
|
9.55
|
41,500
|
10.00
|
||||||||||||
|
Forfeited
|
-
|
-
|
(700
|
)
|
10.00
|
|||||||||||
|
Vested and issued
|
(19,319
|
)
|
10.52
|
(3,003
|
)
|
13.32
|
||||||||||
|
Unvested, end of period
|
41,693
|
$
|
9.95
|
45,305
|
$
|
10.33
|
||||||||||
|
Compensation expense during period
|
$
|
240
|
$
|
206
|
||||||||||||
|
Unrecognized compensation expense, end of period
|
$
|
165
|
$
|
256
|
||||||||||||
|
Intrinsic value, end of period
|
$
|
387
|
$
|
491
|
||||||||||||
|
Weighted-average remaining vesting term (in years)
|
1.0
|
1.3
|
||||||||||||||
95
NOTE 9. COMMITMENTS AND CONTINGENCIES
From time to time, the Company may become involved in various claims and legal actions arising in the ordinary course of business. Management is not aware of any reported or unreported contingencies at December 31, 2017.
NOTE 10. INCOME TAXES
The Company will generally not be subject to federal income tax on its REIT taxable income to the extent that it distributes its REIT taxable income to its stockholders and satisfies the ongoing REIT requirements, including meeting certain asset, income and stock ownership tests. A REIT must generally distribute at least 90% of its REIT taxable income to its stockholders, of which 85% generally must be distributed within the taxable year, in order to avoid the imposition of an excise tax. The remaining balance may be distributed up to the end of the following taxable year, provided the REIT elects to treat such amount as a prior year distribution and meets certain other requirements.
REIT taxable income (loss) is computed in accordance with the Code, which is different than the Company's financial statement net income (loss) computed in accordance with GAAP. Book to tax differences primarily relate to the recognition of interest income on RMBS, unrealized gains and losses on RMBS, and the amortization of losses on derivative instruments that are treated as hedges for tax purposes.
Generally, the Company's dividend distributions are characterized as ordinary income or nontaxable return of capital based on the relative amounts of its earnings and profits (taxable income, with certain prescribed adjustments) to total distributions applicable for a given tax year.
In determining total distributions, consideration is given to the spillover distribution provisions of section 857(b)(9) of the Code. Under section 857(b)(9), of the Code, REIT common dividends declared in the fourth quarter of a calendar year with a record date prior to year-end and a payable date in January of the following year will be included in total distributions in the year declared only to the extent of available earnings and profits. As a result, such fourth quarter common dividends may be pro-rated between tax years or may not be taxable until the following year. In accordance with section 857(b)(9) of the Code, the Company's December 2017 dividend of $0.14 paid in January 2018 is subject to tax in 2018. The remaining dividend distributions declared in 2017 of $1.54, plus the dividend declared in December 2016 and paid in January 2017 of $0.14, are taxable in 2017.
The 2017 dividend distribution described above exceeded 2017 earnings and profits by $0.71, representing 42% of the total 2017 distributions of $1.68. This nondividend distribution is characterized as return of capital and has been allocated on a pro rata basis to each 2017 dividend distribution. Nondividend distributions characterized as return of capital reduce the tax basis of related shares and are nontaxable to the recipient unless return of capital distributions in aggregate exceed tax basis, in which case the excess is reportable as capital gain. The remaining 2017 common dividend distributions have been characterized as ordinary income of $0.97, or 58% of the total distributions.
As of December 31, 2017, we had distributed all of our estimated REIT taxable income through fiscal year 2017. Accordingly, no income tax provision was recorded for 2017, 2016 and 2015.
96
NOTE 11. EARNINGS PER SHARE (EPS)
The Company had dividend eligible shares of restricted common stock and Performance Units that were outstanding during years ended December 31, 2017, 2016 and 2015. The basic and diluted per share computations include these unvested shares of restricted common stock and Performance Units if there is income available to common stock, as they have dividend participation rights. The shares of restricted common stock and Performance Units have no contractual obligation to share in losses. Because there is no such obligation, the shares of restricted common stock and Performance Units are not included in the basic and diluted EPS computations when no income is available to common stock even though they are considered participating securities.
The table below reconciles the numerator and denominator of EPS for the years ended December 31, 2017, 2016 and 2015.
|
(in thousands, except per-share information)
|
||||||||||||
|
2017
|
2016
|
2015
|
||||||||||
|
Basic and diluted EPS per common share:
|
||||||||||||
|
Numerator for basic and diluted EPS per share of common stock:
|
||||||||||||
|
Net income - Basic and diluted
|
$
|
2,007
|
$
|
1,979
|
$
|
1,071
|
||||||
|
Weighted average shares of common stock:
|
||||||||||||
|
Shares of common stock outstanding at the balance sheet date
|
53,062
|
32,963
|
21,749
|
|||||||||
|
Unvested dividend eligible share based compensation
|
||||||||||||
|
outstanding at the balance sheet date
|
42
|
53
|
24
|
|||||||||
|
Effect of weighting
|
(12,042
|
)
|
(8,916
|
)
|
(1,506
|
)
|
||||||
|
Weighted average shares-basic and diluted
|
41,062
|
24,100
|
20,267
|
|||||||||
|
Net Income per share of common stock:
|
||||||||||||
|
Basic and diluted
|
$
|
0.05
|
$
|
0.08
|
$
|
0.05
|
||||||
NOTE 12. FAIR VALUE
Authoritative accounting literature establishes a framework for using fair value to measure assets and liabilities and defines fair value as the price that would be received to sell an asset or paid to transfer a liability (an exit price) as opposed to the price that would be paid to acquire the asset or received to assume the liability (an entry price). A fair value measure should reflect the assumptions that market participants would use in pricing the asset or liability, including the assumptions about the risk inherent in a particular valuation technique, the effect of a restriction on the sale or use of an asset and the risk of non-performance. Required disclosures include stratification of balance sheet amounts measured at fair value based on inputs the Company uses to derive fair value measurements. These stratifications are:
|
·
|
Level 1 valuations, where the valuation is based on quoted market prices for identical assets or liabilities traded in active markets (which include exchanges and over-the-counter markets with sufficient volume),
|
|
·
|
Level 2 valuations, where the valuation is based on quoted market prices for similar instruments traded in active markets, quoted prices for identical or similar instruments in markets that are not active and model-based valuation techniques for which all significant assumptions are observable in the market, and
|
|
·
|
Level 3 valuations, where the valuation is generated from model-based techniques that use significant assumptions not observable in the market, but observable based on Company-specific data. These unobservable assumptions reflect the Company's own estimates for assumptions that market participants would use in pricing the asset or liability. Valuation techniques typically include option pricing models, discounted cash flow models and similar techniques, but may also include the use of market prices of assets or liabilities that are not directly comparable to the subject asset or liability.
|
97
The Company's RMBS, interest rate swaptions and TBA securities are valued using Level 2 valuations, and such valuations currently are determined by the Company based on independent pricing sources and/or third party broker quotes, when available. Because the price estimates may vary, the Company must make certain judgments and assumptions about the appropriate price to use to calculate the fair values. Alternatively, the Company could opt to have the value of all of its positions in RMBS, interest rate swaptions and TBA securities determined by either an independent third-party or could do so internally.
RMBS (based on the fair value option), interest rate swaps, interest rate swaptions, TBA securities and futures contracts were recorded at fair value on a recurring basis during the years ended December 31, 2017 and 2016. When determining fair value measurements, the Company considers the principal or most advantageous market in which it would transact and considers assumptions that market participants would use when pricing the asset. When possible, the Company looks to active and observable markets to price identical assets. When identical assets are not traded in active markets, the Company looks to market observable data for similar assets.
The following table presents financial assets (liabilities) measured at fair value on a recurring basis as of December 31, 2017 and 2016:
|
(in thousands)
|
||||||||||||||||
|
Quoted Prices
|
||||||||||||||||
|
in Active
|
Significant
|
|||||||||||||||
|
Markets for
|
Other
|
Significant
|
||||||||||||||
|
Identical
|
Observable
|
Unobservable
|
||||||||||||||
|
Fair Value
|
Assets
|
Inputs
|
Inputs
|
|||||||||||||
|
Measurements
|
(Level 1)
|
(Level 2)
|
(Level 3)
|
|||||||||||||
|
December 31, 2017
|
||||||||||||||||
|
Mortgage-backed securities
|
$
|
3,744,811
|
$
|
-
|
$
|
3,744,811
|
$
|
-
|
||||||||
|
Interest rate swaps
|
13,530
|
-
|
13,530
|
-
|
||||||||||||
|
Interest rate swaptions
|
3,405
|
-
|
3,405
|
-
|
||||||||||||
|
TBA securities
|
(1,813
|
)
|
-
|
(1,813
|
)
|
-
|
||||||||||
|
December 31, 2016
|
||||||||||||||||
|
Mortgage-backed securities
|
$
|
3,022,174
|
$
|
-
|
$
|
3,022,174
|
$
|
-
|
||||||||
|
Interest rate swaps
|
9,500
|
-
|
9,500
|
-
|
||||||||||||
|
TBA securities
|
(1,117
|
)
|
-
|
(1,117
|
)
|
-
|
||||||||||
During the years ended December 31, 2017, 2016 and 2015, there were no transfers of financial assets or liabilities between levels 1, 2 or 3.
NOTE 13. RELATED PARTY TRANSACTIONS
Management Agreement
The Company is externally managed and advised by Bimini Advisors, LLC (the "Manager") pursuant to the terms of a management agreement. The management agreement has been renewed through February 20, 2018 and provides for automatic one-year extension options thereafter and is subject to certain termination rights. Under the terms of the management agreement, the Manager is responsible for administering the business activities and day-to-day operations of the Company. The Manager receives a monthly management fee in the amount of:
|
·
|
One-twelfth of 1.5% of the first $250 million of the Company's equity, as defined in the management agreement,
|
|
·
|
One-twelfth of 1.25% of the Company's equity that is greater than $250 million and less than or equal to $500 million, and
|
|
·
|
One-twelfth of 1.00% of the Company's equity that is greater than $500 million.
|
98
The Company is obligated to reimburse the Manager for any direct expenses incurred on its behalf and to pay the Manager the Company's pro rata portion of certain overhead costs set forth in the management agreement. Should the Company terminate the management agreement without cause, it will pay to the Manager a termination fee equal to three times the average annual management fee, as defined in the management agreement, before or on the last day of the term of the agreement.
Total expenses recorded for the management fee and costs incurred were approximately $7.4 million, $5.5 million and $5.0 million for the years ended December 31, 2017, 2016 and 2015, respectively. At December 31, 2017 and 2016, the net amount due to affiliates was approximately $0.8 million and $0.6 million, respectively.
Other Relationships with Bimini
Robert Cauley, our Chief Executive Officer and Chairman of our Board of Directors, also serves as Chief Executive Officer and Chairman of the Board of Directors of Bimini and owns shares of common stock of Bimini. Hunter Haas, our Chief Financial Officer, Chief Investment Officer, Secretary and a member of our Board of Directors, also serves as the Chief Financial Officer, Chief Investment Officer and Treasurer of Bimini and owns shares of common stock of Bimini. In addition, as of December 31, 2017, Bimini owned 1,520,036 shares, or 2.9%, of the Company's common stock.
NOTE 14. QUARTERLY RESULTS (UNAUDITED)
The following is a presentation of the quarterly results of operations for the years ended December 31, 2017 and 2016.
|
(in thousands, except per share information)
|
||||||||||||||||
|
Quarter Ended
|
||||||||||||||||
|
March 31, 2017
|
June 30, 2017
|
September 30, 2017
|
December 31, 2017
|
|||||||||||||
|
Interest income
|
$
|
32,311
|
$
|
34,579
|
$
|
38,974
|
$
|
40,098
|
||||||||
|
Interest expense
|
(6,715
|
)
|
(8,763
|
)
|
(12,638
|
)
|
(13,555
|
)
|
||||||||
|
Net interest income
|
25,596
|
25,816
|
26,336
|
26,543
|
||||||||||||
|
Losses
|
(20,727
|
)
|
(32,597
|
)
|
(8,254
|
)
|
(29,540
|
)
|
||||||||
|
Net portfolio income (loss)
|
4,869
|
(6,781
|
)
|
18,082
|
(2,997
|
)
|
||||||||||
|
Expenses:
|
||||||||||||||||
|
Management fees and overhead expenses
|
1,670
|
1,788
|
1,940
|
2,033
|
||||||||||||
|
Other expenses
|
750
|
1,074
|
959
|
952
|
||||||||||||
|
Total expenses
|
2,420
|
2,862
|
2,899
|
2,985
|
||||||||||||
|
Net income (loss)
|
$
|
2,449
|
$
|
(9,643
|
)
|
$
|
15,183
|
$
|
(5,982
|
)
|
||||||
|
Basic and diluted net income (loss) per share
|
$
|
0.07
|
$
|
(0.26
|
)
|
$
|
0.33
|
$
|
(0.12
|
)
|
||||||
|
Weighted Average Shares Outstanding
|
33,069
|
37,211
|
45,355
|
48,310
|
||||||||||||
|
Dividends declared per share
|
$
|
0.42
|
$
|
0.42
|
$
|
0.42
|
$
|
0.42
|
||||||||
99
|
Quarter Ended
|
||||||||||||||||
|
March 31, 2016
|
June 30, 2016
|
September 30, 2016
|
December 31, 2016
|
|||||||||||||
|
Interest income
|
$
|
20,466
|
$
|
19,235
|
$
|
22,358
|
$
|
25,068
|
||||||||
|
Interest expense
|
(3,319
|
)
|
(3,330
|
)
|
(3,979
|
)
|
(4,976
|
)
|
||||||||
|
Net interest income
|
17,147
|
15,905
|
18,379
|
20,092
|
||||||||||||
|
(Losses) gains
|
(19,558
|
)
|
(7,308
|
)
|
4,418
|
(38,003
|
)
|
|||||||||
|
Net portfolio (loss) income
|
(2,411
|
)
|
8,597
|
22,797
|
(17,911
|
)
|
||||||||||
|
Expenses:
|
||||||||||||||||
|
Management fees and overhead expenses
|
1,269
|
1,274
|
1,388
|
1,557
|
||||||||||||
|
Other expenses
|
911
|
860
|
883
|
951
|
||||||||||||
|
Total expenses
|
2,180
|
2,134
|
2,271
|
2,508
|
||||||||||||
|
Net (loss) income
|
$
|
(4,591
|
)
|
$
|
6,463
|
$
|
20,526
|
$
|
(20,419
|
)
|
||||||
|
Basic and diluted net (loss) income per share
|
$
|
(0.21
|
)
|
$
|
0.29
|
$
|
0.85
|
$
|
(0.72
|
)
|
||||||
|
Weighted Average Shares Outstanding
|
$
|
21,756
|
$
|
21,921
|
$
|
24,133
|
$
|
28,495
|
||||||||
|
Dividends declared per share
|
$
|
0.42
|
$
|
0.42
|
$
|
0.42
|
$
|
0.42
|
||||||||
Earnings per share (EPS) in each quarter is computed using the weighted-average number of shares outstanding during that quarter while EPS for the full year is computed using the weighted-average number of shares outstanding during the year. The sum of the four quarters' EPS may not equal the full year EPS.
100
ITEM 9. CHANGES IN AND DISAGREEMENTS WITH ACCOUNTANTS ON ACCOUNTING AND FINANCIAL DISCLOSURE
We had no disagreements with our Independent Registered Public Accounting Firm on any matter of accounting principles or practices or financial statement disclosure
.
ITEM 9A. CONTROLS AND PROCEDURES
Evaluation of Disclosure Controls and Procedures
As of the end of the period covered by this report (the "evaluation date"), we carried out an evaluation, under the supervision and with the participation of our management, including our Chief Executive Officer (the "CEO") and Chief Financial Officer (the "CFO"), of the effectiveness of the design and operation of our disclosure controls and procedures, as defined in Rule 13a-15(e) under the Securities Exchange Act of 1934, as amended ("Exchange Act"). Based on this evaluation, the CEO and CFO concluded our disclosure controls and procedures, as designed and implemented, were effective as of the evaluation date (1) in ensuring that information regarding the Company and its subsidiary is accumulated and communicated to our management, including our CEO and CFO, by our employees, as appropriate to allow timely decisions regarding required disclosure and (2) in providing reasonable assurance that information we must disclose in its periodic reports under the Exchange Act is recorded, processed, summarized and reported within the time periods prescribed by the SEC's rules and forms.
Changes in Internal Controls over Financial Reporting
There were no significant changes in the Company's internal control over financial reporting that occurred during the Company's most recent fiscal quarter that have materially affected, or are reasonably likely to materially affect, the Company's internal control over financial reporting.
Management's Report of Internal Control over Financial Reporting
Management of the Company is responsible for establishing and maintaining adequate internal control over financial reporting. Internal control over financial reporting is defined in Rules 13a-15(f) under the Securities Exchange Act as a process designed by, or under the supervision of, the Company's principal executive and principal financial officers and effected by the Company's board of directors, management and other personnel to provide reasonable assurance regarding the reliability of financial reporting and the preparation of consolidated financial statements for external purposes in accordance with generally accepted accounting principles and includes those policies and procedures that:
|
·
|
pertain to the maintenance of records that in reasonable detail accurately and fairly reflect the transactions and dispositions of the assets of the Company;
|
|
·
|
provide reasonable assurance that transactions are recorded as necessary to permit preparation of consolidated financial statements in accordance with generally accepted accounting principles, and that receipts and expenditures of the Company are being made only in accordance with authorizations of management and directors of the Company; and
|
|
·
|
provide reasonable assurance regarding prevention or timely detection of unauthorized acquisition, use or disposition of the Company's assets that could have a material effect on the consolidated financial statements.
|
Because of its inherent limitations, internal control over financial reporting may not prevent or detect misstatements. As a result, even systems determined to be effective can provide only reasonable assurance regarding the preparation and presentation of consolidated financial statements. Moreover, projections of any evaluation of effectiveness to future periods are subject to the risks that controls may become inadequate because of changes in conditions or that the degree of compliance with the policies or procedures may deteriorate.
101
The Company's management assessed the effectiveness of the Company's internal control over financial reporting as of December 31, 2017. In making this assessment, the Company's management used criteria set forth
Internal Control—Integrated Framework (2013)
issued by the Committee of Sponsoring Organizations of the Treadway Commission.
Based on management's assessment, the Company's management believes that, as of December 31, 2017, the Company's internal control over financial reporting was effective based on those criteria.
ITEM 9B. OTHER INFORMATION
ADDITIONAL MATERIAL U.S. FEDERAL INCOME TAX CONSIDERATIONS
The following is a summary of additional material U.S. federal income tax considerations with respect to the ownership of our stock. This summary supplements and should be read together with the discussions under "Material U.S. Federal Income Tax Considerations" in the prospectus dated April 28, 2017 and filed as part of our Registration Statement on Form S-3 (No. 333-217558).
The Tax Cuts and Jobs Act
Enactment of the TCJA
On December 22, 2017, President Trump signed into law H.R. 1, informally titled the Tax Cuts and Jobs Act (the "TCJA" or the "Act"). The TCJA makes major changes to the Internal Revenue Code of 1986, as amended (the "Code"), including several provisions of the Code that may affect the taxation of REITs and their security holders. The most significant of these provisions are described below. The individual and collective impact of these changes on REITs and their security holders is uncertain, and may not become evident for some period. Prospective investors should consult their tax advisors regarding the implications of the TCJA on their investment.
Revised Individual Tax Rates and Deductions
The TCJA creates seven income tax brackets for individuals ranging from 10% to 37% that generally apply at higher thresholds than current law. For example, the highest 37% rate applies to joint return filer incomes above $600,000, instead of the highest 39.6% rate that applies to incomes above $470,700 under pre-TCJA law. The maximum 20% rate that applies to long-term capital gains and qualified dividend income is unchanged, as is the 3.8% Medicare tax on net investment income (see "Material U.S. Federal Income Tax Considerations - Taxation of Taxable U.S. Stockholders" in the applicable prospectus).
The TCJA also eliminates personal exemptions, but nearly doubles the standard deduction for most individuals (for example, the standard deduction for joint return filers rises from $12,700 in 2017 to $24,000 upon the TCJA's effectiveness). The TCJA also eliminates many itemized deductions, limits individual deductions for state and local income, property and sales taxes (other than those paid in a trade or business) to $10,000 collectively for joint return filers (with a special provision to prevent 2017 deductions for prepayment of 2018 taxes), and limits the amount of new acquisition indebtedness on principal or second residences for which mortgage interest deductions are available to $750,000. Interest deductions for new home equity debt are eliminated. Charitable deductions are generally preserved. The phaseout of itemized deductions based on income is eliminated.
The TCJA does not eliminate the individual alternative minimum tax, but it raises the exemption and exemption phaseout threshold for application of the tax.
These individual income tax changes are generally effective beginning in 2018, but without further legislation, they will sunset after 2025.
102
Pass-Through Business Income Tax Rate Lowered through Deduction
Under the TCJA, individuals, trusts, and estates generally may deduct 20% of "qualified business income" (generally, domestic trade or business income other than certain investment items) of a partnership, S corporation, or sole proprietorship. In addition, "qualified REIT dividends" (i.e., REIT dividends other than capital gain dividends and portions of REIT dividends designated as qualified dividend income, which in each case are already eligible for capital gain tax rates) and certain other income items are eligible for the deduction by the taxpayer. The overall deduction is limited to 20% of the sum of the taxpayer's taxable income (less net capital gain) and certain cooperative dividends, subject to further limitations based on taxable income. In addition, for taxpayers with income above a certain threshold (e.g., $315,000 for joint return filers), the deduction for each trade or business is generally limited to no more than the greater of (i) 50% of the taxpayer's proportionate share of total wages from a partnership, S corporation or sole proprietorship, or (ii) 25% of the taxpayer's proportionate share of such total wages plus 2.5% of the unadjusted basis of acquired tangible depreciable property that is used to produce qualified business income and satisfies certain other requirements. The deduction for qualified REIT dividends is not subject to these wage and property basis limits. Consequently, the deduction equates to a maximum 29.6% tax rate on REIT dividends. As with the other individual income tax changes, the deduction provisions are effective beginning in 2018. Without further legislation, the deduction would sunset after 2025.
Net Operating Loss Modifications
Net operating loss ("NOL") provisions are modified by the TCJA. The TCJA limits the NOL deduction to 80% of taxable income (before the deduction). It also generally eliminates NOL carrybacks for individuals and non-REIT corporations (NOL carrybacks did not apply to REITs under prior law), but allows indefinite NOL carryforwards. The new NOL rules apply to losses arising in taxable years beginning in 2018.
Maximum Corporate Tax Rate Lowered to 21%; Elimination of Corporate Alternative Minimum Tax
The TCJA reduces the 35% maximum corporate income tax rate to a maximum 21% corporate rate, and reduces the dividends-received deduction for certain corporate subsidiaries. The reduction of the corporate tax rate to 21% also results in the reduction of the maximum rate of withholding with respect to our distributions to non-U.S. stockholders that are treated as attributable to gains from the sale or exchange of U.S. real property interests from 35% to 21%. The TCJA also permanently eliminates the corporate alternative minimum tax. These provisions are effective beginning in 2018.
Limitations on Interest Deductibility; Real Property Trades or Businesses Can Elect Out Subject to Longer Asset Cost Recovery Periods
The TCJA limits a taxpayer's net interest expense deduction to 30% of the sum of adjusted taxable income, business interest, and certain other amounts. Adjusted taxable income does not include items of income or expense not allocable to a trade or business, business interest or expense, the new deduction for qualified business income, NOLs, and for years prior to 2022, deductions for depreciation, amortization, or depletion. For partnerships, the interest deduction limit is applied at the partnership level, subject to certain adjustments to the partners for unused deduction limitations at the partnership level. The TCJA allows a real property trade or business to elect out of this interest limit so long as it uses a 40-year recovery period for nonresidential real property, a 30-year recovery period for residential rental property, and a 20-year recovery period for related improvements. For this purpose, a real property trade or business is any real property development, redevelopment, construction, reconstruction, acquisition, conversion, rental, operating, management, leasing, or brokerage trade or business. As a mortgage REIT, we do not believe that our business constitutes a "real property trade or business" within the meaning of the TCJA. However, as a mortgage REIT, we do not believe we will be negatively impacted by the 30% limitation on the deductibility of interest imposed by the TCJA because interest expense may be fully deducted to the extent of interest income under the TCJA. Disallowed interest expense is carried forward indefinitely (subject to special rules for partnerships). The interest deduction limit applies beginning in 2018.
103
Phantom Income
Under the TCJA, we generally will be required to take certain amounts in income no later than the time such amounts are reflected on certain financial statements. The application of this rule may require the accrual of income with respect to our debt instruments or mortgage-backed securities, such as original issue discount or market discount, earlier than would be the case under the general tax rules, although the precise application of this rule is unclear at this time. This rule generally will be effective for tax years beginning after December 31, 2017 or, for debt instruments or mortgage-backed securities issued with original issue discount, for tax years beginning after December 31, 2018. To the extent that this rule requires the accrual of income earlier than under the general tax rules, it could increase our "phantom income," which may make it more likely that we could be required to borrow funds or take other action to satisfy the REIT distribution requirements for the taxable year in which this "phantom income" is recognized. We currently do not expect that this rule will have a material impact on the timing of accrual of our income or on the amount of our distribution requirement.
International Provisions: Modified Territorial Tax Regime
The TCJA moves the United States from a worldwide to a modified territorial tax system, with provisions included to prevent corporate base erosion. We currently do not have any foreign subsidiaries or properties, but these provisions could affect any such future subsidiaries or properties.
Other Provisions
The TCJA makes other significant changes to the Code. These changes include provisions limiting the ability to offset dividend and interest income with partnership or S corporation net active business losses. These provisions are effective beginning in 2018, but without further legislation, will sunset after 2025.
104
PART III
ITEM 10. DIRECTORS, EXECUTIVE OFFICERS AND CORPORATE GOVERNANCE
The information required by this Item 10 and not otherwise set forth below is incorporated herein by reference to the Company's definitive Proxy Statement relating to the Company's 2018 Annual Meeting of Stockholders (the "Proxy Statement"), which the Company expects to file with the U.S. Securities and Exchange Commission, pursuant to Regulation 14A, not later than 120 days after December 31, 2017.
ITEM 11. EXECUTIVE COMPENSATION
The information required by this Item 11 is incorporated herein by reference to the Proxy Statement.
ITEM 12. SECURITY OWNERSHIP OF CERTAIN BENEFICIAL OWNERS AND MANAGEMENT AND RELATED STOCKHOLDER MATTERS
The information required by this Item 12 is incorporated herein by reference to the Proxy Statement and to Part II, Item 5 of this Form 10-K.
ITEM 13. CERTAIN RELATIONSHIPS AND RELATED TRANSACTIONS, AND DIRECTOR INDEPENDENCE
The information required by this Item 13 is incorporated herein by reference to the Proxy Statement.
ITEM 14. PRINCIPAL ACCOUNTANT FEES AND SERVICES
The information required by this Item 14 is incorporated herein by reference to the Proxy Statement.
105
PART IV
ITEM 15. EXHIBITS, FINANCIAL STATEMENT SCHEDULES
|
a.
|
Financial Statements. The financial statements of the Company, together with the report of Independent Registered Public Accounting Firm thereon, are set forth in Part II-Item 8 of this Form 10-K and are incorporated herein by reference.
|
The following information is filed as part of this Form 10-K:
|
Page
|
||||
|
Report of Independent Registered Public Accounting Firm
|
76
|
|||
|
Consolidated Balance Sheets
|
77
|
|||
|
Consolidated Statements of Operations
|
78
|
|||
|
Consolidated Statements of Stockholders' Equity
|
79
|
|||
|
Consolidated Statements of Cash Flows
|
80
|
|||
|
Notes to Consolidated Financial Statements
|
81
|
|||
|
b.
|
Financial Statement Schedules.
|
Not applicable.
|
c.
|
Exhibits.
|
|
Exhibit No.
|
Description
|
|
106
| 21.1 | Subsidiaries of the Company** | |
|
Exhibit 101.INS XBRL
|
Instance Document ****
|
|
|
Exhibit 101.SCH XBRL
|
Taxonomy Extension Schema Document ****
|
|
|
Exhibit 101.CAL XBRL
|
Taxonomy Extension Calculation Linkbase Document****
|
|
|
Exhibit 101.DEF XBRL
|
Additional Taxonomy Extension Definition Linkbase Document Created****
|
|
|
Exhibit 101.LAB XBRL
|
Taxonomy Extension Label Linkbase Document ****
|
|
|
Exhibit 101.PRE XBRL
|
Taxonomy Extension Presentation Linkbase Document ****
|
*
Represents a management contract or compensatory plan or arrangement.
**
Filed herewith.
***
Furnished herewith.
****
Submitted electronically herewith.
ITEM 16.
Form 10-K Summary.
None.
107
Signatures
Pursuant to the requirements of Section 13 or 15(d) of the Securities Exchange Act of 1934, as amended, the registrant has duly caused this report to be signed on its behalf by the undersigned, thereunto duly authorized.
|
Orchid Island Capital, Inc
.
|
||||
|
Registrant
|
||||
|
Date:
February 14, 2018
|
By:
|
/s/ Robert E. Cauley
|
||
|
Robert E. Cauley
Chief Executive Officer, President and Chairman of the Board
|
||||
|
Date:
February 14, 2018
|
By:
|
/s/ G. Hunter Haas, IV
|
||
|
G. Hunter Haas, IV
Secretary, Chief Financial Officer, Chief Investment Officer and Director (Principal Financial and Accounting Officer)
|
||||
Pursuant to the requirements of the Securities Exchange Act of 1934, this report has been signed below by the following persons on behalf of the Company and in the capacities and on the dates indicated.
|
/s/ Robert E. Cauley
|
Chairman of the Board, Director, Chief
|
February 14, 2018
|
||
|
Robert E. Cauley
|
Executive Officer, and President
|
|||
|
(Principal Executive Officer)
|
||||
|
/s/ G. Hunter Haas, IV
|
Chief Financial Officer, Chief
|
February 14, 2018
|
||
|
G. Hunter Haas, IV
|
Investment Officer, and Director
|
|||
|
(Principal Financial and Accounting Officer)
|
||||
|
/s/ W Coleman Bitting
|
Independent Director
|
February 14, 2018
|
||
|
W Coleman Bitting
|
||||
|
/s/ Frank P. Filipps
|
Independent Director
|
February 14, 2018
|
||
|
Frank P. Filipps
|
||||
|
/s/ Ava L. Parker
|
Independent Director
|
February 14, 2018
|
||
|
Ava L. Parker
|
||||
|
/s/ Paula Morabito
|
Independent Director
|
February 14, 2018
|
||
|
Paula Morabito
|
108
INDEX TO EXHIBITS
|
Exhibit 101.INS XBRL
|
Instance Document ****
|
|
|
Exhibit 101.SCH XBRL
|
Taxonomy Extension Schema Document ****
|
|
|
Exhibit 101.CAL XBRL
|
Taxonomy Extension Calculation Linkbase Document****
|
|
|
Exhibit 101.DEF XBRL
|
Additional Taxonomy Extension Definition Linkbase Document Created****
|
|
|
Exhibit 101.LAB XBRL
|
Taxonomy Extension Label Linkbase Document ****
|
|
|
Exhibit 101.PRE XBRL
|
Taxonomy Extension Presentation Linkbase Document ****
|
*
Represents a management contract or compensatory plan or arrangement.
**
Filed herewith.
***
Furnished herewith.
****
Submitted electronically herewith.
110
TABLE OF CONTENTS
Part IItem 1. BusinessItem 1A. Risk FactorsItem 1B. Unresolved Staff CommentsItem 2. PropertiesItem 3. Legal ProceedingsItem 4. Mine Safety DisclosuresPart IIItem 5. Market For Registrant's Common Equity, Related Stockholder Matters and Issuer Purchases Of Equity SecuritiesItem 6. Selected Financial DataItem 7. Management's Discussion and Analysis Of Financial Condition and Results Of OperationsItem 7A. Quantitative and Qualitative Disclosures About Market RiskItem 8. Financial Statements and Supplementary DataNote 1. Organization and Significant Accounting PoliciesNote 2. Mortgage-backed SecuritiesNote 3. Repurchase Agreements and Other BorrowingsNote 4. Derivative Financial InstrumentsNote 5. Pledged AssetsNote 6. Offsetting Assets and LiabilitiesNote 7. Capital StockNote 8. Stock Incentive PlanNote 9. Commitments and ContingenciesNote 10. Income TaxesNote 11. Earnings Per Share (eps)Note 12. Fair ValueNote 13. Related Party TransactionsNote 14. Quarterly Results (unaudited)Item 9. Changes in and Disagreements with Accountants on Accounting and Financial DisclosureItem 9A. Controls and ProceduresItem 9B. Other InformationPart IIIItem 10. Directors, Executive Officers and Corporate GovernanceItem 11. Executive CompensationItem 12. Security Ownership Of Certain Beneficial Owners and Management and Related Stockholder MattersItem 13. Certain Relationships and Related Transactions, and Director IndependenceItem 14. Principal Accountant Fees and ServicesPart IVItem 15. Exhibits, Financial Statement SchedulesItem 16. Form 10-k Summary