OLD REPUBLIC INTERNATIONAL CORP
10-Ks and 10-Qs
|
|
|
|
|
|
|
|
|
|
|
|
|
|
|
|
|
|
|
|
|
|
|
|
|
|
|
|
|
|
|
|
|
|
|
|
|
|
|
|
|
|
|
|
|
|
|
|
|
|
|
|
|
|
|
|
UNITED STATES
SECURITIES AND EXCHANGE COMMISSION
Washington, D.C. 20549
FORM 10-K
X
ANNUAL REPORT
PURSUANT TO SECTION 13 OR 15(d) OF THE SECURITIES EXCHANGE ACT OF 1934
(FEE REQUIRED)
For the fiscal year ended:
December 31, 2016
OR
_
TRANSITION REPORT PURSUANT TO SECTION 13 OR 15(d) OF THE SECURITIES EXCHANGE ACT OF 1934
(NO FEE REQUIRED)
For the transition period from _____________________________ to ______________________________
Commission File Number:
001-10607
OLD REPUBLIC INTERNATIONAL CORPORATION
(Exact name of registrant as specified in its charter)
|
Delaware
|
No. 36-2678171
|
|
|
(State or other jurisdiction of
|
(IRS Employer Identification No.)
|
|
|
incorporation or organization)
|
||
|
307 North Michigan Avenue, Chicago, Illinois
|
60601
|
|
|
(Address of principal executive office)
|
(Zip Code)
|
|
|
Registrant's telephone number, including area code:
312‑346‑8100
|
|
Securities registered pursuant to Section 12(b) of the Act:
|
|
Title of each class
|
Name of Each Exchange on Which Registered
|
|
Common Stock/$1 par value
|
New York Stock Exchange
|
Indicate by check mark if the registrant is a well-known seasoned issuer, as defined in Rule 405 of the Securities Act.
Yes: X/ No:
Indicate by check mark if the registrant is not required to file reports pursuant to Section 13 or Section 15(d) of the Act.
Yes: / No:X
Indicate by check mark whether the registrant (1) has filed all reports required to be filed by Section 13 or 15(d) of the Securities Exchange Act of 1934 during the preceding 12 months (or for such shorter period that the registrant was required to file such reports) and (2) has been subject to such filing requirements for the past 90 days.
Yes: X/ No:
Indicate by check mark whether the registrant has submitted electronically and posted on its corporate Web site, if any, every Interactive Data File required to be submitted and posted pursuant to Rule 405 of Regulation S-T during the preceding
12
months
(or
for
such
shorter
period
that
the
registrant
was
required
to
submit
and
post
such
files).
Yes: X/No:
Indicate by check mark if disclosure of delinquent filers pursuant to Item 405 of Regulation S‑K is not contained herein, and will not be contained, to the best of registrant's knowledge, in definitive proxy or information statements incorporated by reference in Part III of this Form 10-K or any amendment to this Form 10-K.
o
Indicate by check mark whether the registrant is a large accelerated filer, an accelerated filer, or a non-accelerated filer. See definition of "accelerated filer and large accelerated filer" in Rule 12b-2 of the Exchange Act. (Check one).
Large accelerated filer
x
Accelerated filer
o
Non-accelerated filer
o
Smaller reporting company
o
Indicate by check mark whether the registrant is a shell company (as defined in Exchange Act Rule 12b-2).
Yes: / No:X
The aggregate fair value of the registrant's voting Common Stock held by non-affiliates of the registrant (assuming, for purposes of this calculation only, that the registrant's directors and executive officers, the registrant's various employee benefit plans and American Business & Mercantile Insurance Mutual, Inc. and its subsidiaries are all affiliates of the registrant), based on the closing sale price of the registrant's common stock on
June 30, 2016
, the last day of the registrant's most recently completed second fiscal quarter, was
$4,626,660,050
.
The registrant had
262,813,179
shares of Common Stock outstanding as of
January 31, 2017
.
Documents incorporated by reference:
The following documents are incorporated by reference into that part of this Form 10-K designated to the right of the document title.
|
Title
|
Part
|
|
Proxy statement for the 2017 Annual Meeting of Shareholders
Exhibits as specified in exhibit index (page 113) |
III, Items 10, 11, 12, 13 and 14
IV, Item 15 |
______________________________________
There are
114
pages in this report
(a) General Description of Business.
Old Republic International Corporation is a Chicago based holding company engaged in the single business of insurance underwriting and related services. It conducts its operations principally through a number of regulated insurance company subsidiaries organized into three major segments, namely, it's General Insurance Group (property and liability insurance), Title Insurance Group, and the Republic Financial Indemnity Group ("RFIG") (mortgage guaranty ("MI") and consumer credit indemnity ("CCI")) Run-off Business. References herein to such groups apply to the Company's subsidiaries engaged in these respective segments of business. The results of a small life and accident insurance business are included within the corporate and other caption of this report. "Old Republic" or "the Company" refers to Old Republic International Corporation and its subsidiaries as the context requires.
The insurance business is distinguished from most others in that the prices (premiums) charged for various insurance products are set without certainty of the ultimate benefit and claim costs that will emerge or be incurred, often many years after issuance and expiration of a policy. This basic fact casts Old Republic as a risk-taking enterprise managed for the long run. Management therefore conducts the business with a primary focus on achieving favorable underwriting results over cycles, and on the maintenance of financial soundness in support of the insurance subsidiaries' long-term obligations to insurance beneficiaries. To achieve these objectives, adherence to insurance risk management principles is stressed, and asset diversification and quality are emphasized. The underwriting principles encompass:
|
•
|
Disciplined risk selection, evaluation, and pricing to reduce uncertainty and adverse selection;
|
|
•
|
Enhancing the predictability of expected outcomes through insurance of the largest number of homogeneous risks as to each type of coverage;
|
|
•
|
Reducing the insurance portfolio risk profile through:
|
|
•
|
diversification and spread of insured risks; and
|
|
•
|
assimilation of uncorrelated asset and liability exposures across economic sectors that tend to offset or counterbalance one another; and
|
|
•
|
Effective management of gross and net limits of liability through appropriate use of reinsurance.
|
In addition to income arising from Old Republic's basic underwriting and related services functions, significant investment income is earned from invested funds generated by those functions and from shareholders' capital. Investment management aims for stability of income from interest and dividends, protection of capital, and for sufficiency of liquidity to meet insurance underwriting and other obligations as they become payable in the future. Securities trading and the realization of capital gains are not objectives. The investment philosophy is therefore best characterized as emphasizing value, credit quality, and relatively long-term holding periods. The Company's ability to hold both fixed maturity and equity securities for long periods of time is in turn enabled by the scheduling of maturities in contemplation of an appropriate matching of assets and liabilities, and by investments in large capitalization, highly liquid equity securities.
In light of the above factors, the Company's affairs are managed for the long-run and without significant regard to the arbitrary strictures of quarterly or even annual reporting periods that American industry must observe. In Old Republic's view, such short reporting time frames do not comport well with the long-term nature of much of its business. Management therefore believes that the Company's operating results and financial condition can best be evaluated by observing underwriting and overall operating performance trends over succeeding five- or preferably ten-year intervals. A ten-year period in particular can likely encompass at least one economic and/or underwriting cycle and thereby provide an appropriate time frame for such cycle to run its course, and for premium rate changes and reserved claim costs to be quantified and emerge in financial results with greater finality and effect.
The contributions to consolidated net revenues and income before taxes, and the assets and shareholders' equity of each Old Republic segment are set forth in the following table. This information should be read in conjunction with the consolidated financial statements, the notes thereto, and the "Management Analysis of Financial Position and Results of Operations" appearing elsewhere in this report.
2
|
Financial Information Relating to Segments of Business (a)
|
|||||||||||
|
Net Revenues (b)
|
($ in Millions)
|
||||||||||
|
Years Ended December 31:
|
2016
|
2015
|
2014
|
||||||||
|
General
|
$
|
3,354.7
|
|
$
|
3,313.3
|
|
$
|
3,113.5
|
|
||
|
Title
|
2,244.1
|
|
2,080.7
|
|
1,791.6
|
|
|||||
|
Corporate & Other - net (c)
|
35.4
|
|
35.8
|
|
70.0
|
|
|||||
|
Subtotal
|
5,634.3
|
|
5,429.8
|
|
4,975.3
|
|
|||||
|
RFIG Run-off
|
193.2
|
|
245.0
|
|
282.9
|
|
|||||
|
Subtotal
|
5,827.6
|
|
5,674.8
|
|
5,258.3
|
|
|||||
|
Consolidated realized investment gains (losses)
|
72.8
|
|
91.3
|
|
272.3
|
|
|||||
|
Consolidated
|
$
|
5,900.5
|
|
$
|
5,766.1
|
|
$
|
5,530.7
|
|
||
|
Income (Loss) Before Taxes
|
|||||||||||
|
Years Ended December 31:
|
2016
|
2015
|
2014
|
||||||||
|
General
|
$
|
319.9
|
|
$
|
336.4
|
|
$
|
221.3
|
|
||
|
Title
|
210.2
|
|
166.8
|
|
99.5
|
|
|||||
|
Corporate & Other - net (c)
|
13.0
|
|
7.6
|
|
5.7
|
|
|||||
|
Subtotal
|
543.3
|
|
511.0
|
|
326.7
|
|
|||||
|
RFIG Run-off
|
69.8
|
|
29.4
|
|
10.3
|
|
|||||
|
Subtotal
|
613.1
|
|
540.4
|
|
337.1
|
|
|||||
|
Consolidated realized investment gains (losses)
|
72.8
|
|
91.3
|
|
272.3
|
|
|||||
|
Consolidated
|
$
|
686.0
|
|
$
|
631.8
|
|
$
|
609.4
|
|
||
|
Assets
|
|||||||||||
|
As of December 31:
|
2016
|
2015
|
2014
|
||||||||
|
General
|
$
|
15,305.7
|
|
$
|
14,523.0
|
|
$
|
14,251.8
|
|
||
|
Title
|
1,423.0
|
|
1,314.3
|
|
1,243.0
|
|
|||||
|
Corporate & Other - net (c)(e)
|
957.9
|
|
285.5
|
|
373.6
|
|
|||||
|
Subtotal
|
17,686.7
|
|
16,122.8
|
|
15,868.4
|
|
|||||
|
RFIG Run-off
|
904.8
|
|
978.7
|
|
1,108.4
|
|
|||||
|
Consolidated
|
$
|
18,591.6
|
|
$
|
17,101.6
|
|
$
|
16,976.9
|
|
||
|
Shareholders' Equity
|
|||||||||||
|
As of December 31:
|
2016
|
2015
|
2014
|
||||||||
|
General (d)
|
$
|
2,963.1
|
|
$
|
2,736.7
|
|
$
|
2,963.0
|
|
||
|
Title (d)
|
558.9
|
|
476.0
|
|
463.4
|
|
|||||
|
Corporate & Other - net (c)
|
618.9
|
|
420.7
|
|
291.5
|
|
|||||
|
Subtotal
|
4,141.0
|
|
3,633.6
|
|
3,718.0
|
|
|||||
|
RFIG Run-off
|
330.6
|
|
247.2
|
|
206.0
|
|
|||||
|
Consolidated
|
$
|
4,471.6
|
|
$
|
3,880.8
|
|
$
|
3,924.0
|
|
||
|
(a)
|
Reference is made to the table in Note 6 of the Notes to Consolidated Financial Statements, incorporated herein by reference, which shows the contribution of each subcategory to the consolidated net revenues and income or loss before income taxes of Old Republic's insurance industry segments.
|
|
(b)
|
Revenues consist of net premiums, fees, net investment and other income earned. Realized investment gains (losses) are shown in total for all groups combined since the investment portfolio is managed as a whole.
|
|
(c)
|
Represents amounts for Old Republic's holding company parent, minor corporate services subsidiaries, a small life and accident insurance operation and consolidation elimination adjustments.
|
|
(d)
|
Shareholders' equity excludes intercompany financing arrangements for the following segments: General -
$1,007.1
,
$912.6
, and
$740.6
as of
December 31, 2016
,
2015
, and
2014
, respectively; Title -
$143.9
,
$159.9
, and
$173.9
as of
December 31, 2016
,
2015
, and
2014
, respectively.
|
|
(e)
|
Certain balances have been reduced due to the reclassification of relatively immaterial debt issuance costs previously classified as deferred assets in order to comply with a 2015 pronouncement by the Financial Accounting Standards Board (FASB).
|
3
|
General Insurance Group
|
Old Republic's General Insurance segment is best characterized as a commercial lines insurance business with a strong focus on liability insurance coverages. Most of these coverages are provided to businesses, government, and other institutions. The Company does not have a meaningful exposure to personal lines insurance such as homeowners and private automobile coverages, nor does it insure significant amounts of commercial or other real property. In continuance of its commercial lines orientation, Old Republic also focuses on specific sectors of the North American economy, most prominently the transportation (trucking and general aviation), commercial construction, healthcare, education, retail and wholesale trade, forest products, energy, general manufacturing, and financial services industries. In managing the insurance risks it undertakes, the Company employs various underwriting and loss mitigation techniques such as utilization of policy deductibles, captive insurance risk-sharing arrangements, and retrospective rating and policyholder dividend plans. These underwriting techniques are intended to better correlate premium charges with the ultimate claims experience of individual or groups of assureds.
Over the years, the General Insurance Group's operations have been developed steadily through a combination of internal growth, the establishment of additional subsidiaries focused on new types of coverages and/or industry sectors, and through several mergers of smaller companies. As a result, this segment has become widely diversified with a business base encompassing the following major coverages:
Automobile Extended Warranty Insurance (1992):
Coverage is provided to the vehicle owner for certain mechanical or electrical repair or replacement costs after the manufacturer's warranty has expired.
Aviation (1983):
Insurance policies protect the value of aircraft hulls and afford liability coverage for acts that result in injury, loss of life, and property damage to passengers and others on the ground or in the air.
Commercial Automobile Insurance (1930's):
Covers vehicles (mostly trucks) used principally in commercial pursuits. Policies cover damage to insured vehicles and liabilities incurred by an assured for bodily injury and property damage sustained by third parties.
Commercial Multi-Peril ("CMP")(1920's):
Policies afford liability coverage for claims arising from the acts of owners or employees, and protection for the physical assets of businesses.
Financial Indemnity:
Multiple types of specialty coverages, including most prominently the following four, are underwritten by Old Republic within this financial indemnity products classification.
Errors & Omissions("E&O")/Directors & Officers ("D&O")(1983):
E&O
liability policies are written for non-medical professional service providers such as lawyers, architects, and consultants, and provide coverage for legal expenses, and indemnity settlements for claims alleging breaches of professional standards. D&O coverage provides for the payment of legal expenses, and indemnity settlements for claims made against the directors and officers of corporations from a variety of sources, most typically shareholders.
Fidelity (1981):
Bonds cover the exposures of financial institutions and commercial and other enterprises for losses of monies or debt and equity securities due to acts of employee dishonesty.
Guaranteed Asset Protection ("GAP")(2003):
This
insurance indemnifies an automobile loan borrower for the dollar value difference between an insurance company's liability for the total loss (remaining cash value) of an insured vehicle and the amount still owed on an automobile loan.
Surety (1981):
Bonds are insurance company guarantees of performance by a corporate principal or individual such as for the completion of a building or road project, or payment on various types of contracts.
General Liability (1920's):
Protects against liability of an assured which stems from carelessness, negligence, or failure to act, and results in property damage or personal injury to others.
Home Warranty Insurance (1981):
This product provides repair and/or replacement coverage for home systems (e.g. plumbing, heating, and electrical) and designated appliances.
Inland Marine (1920's):
Coverage pertains to the insurance of property in transit over land and of property which is mobile by nature.
Travel Accident (1970):
Coverages provided under these policies, some of which are also underwritten by the Company's Canadian life insurance affiliate, cover monetary losses arising from trip delay and cancellation for individual insureds.
Workers' Compensation (1910's):
This coverage is purchased by employers to provide insurance for employees' lost wages and medical benefits in the event of work-related injury, disability, or death.
______
(Parenthetical dates refer to the year(s) when Old Republic's Companies began underwriting the coverages)
______
4
Commercial automobile, general liability and workers' compensation insurance policy coverages are typically produced in tandem for many assureds. For
2016
, production of workers' compensation direct insurance premiums accounted for approximately
35.4%
of consolidated General Insurance Group direct premiums written, while commercial automobile and general liability direct premium production amounted to approximately
28.7%
and
11.4%
, respectively, of such consolidated totals.
Approximately
91%
of general insurance premiums are produced through independent agency or brokerage channels, while the remaining
9%
is obtained through direct production facilities.
|
Title Insurance Group
|
Old Republic's flagship title insurance company was founded in 1907. The Title Insurance Group's business consists primarily of the issuance of policies to real estate purchasers and investors based upon searches of the public records which contain information concerning interests in real property. The policies insure against losses arising out of defects, liens and encumbrances affecting the insured title and not excluded or excepted from the coverage of the policy. For the year ended
December 31, 2016
, approximately
28%
of the Company's consolidated title premium and related fee income stemmed from direct operations (which include branch offices of its title insurers and wholly owned agency and service subsidiaries of the Company), while the remaining
72%
emanated from independent title agents and underwritten title companies.
There are two basic types of title insurance policies: lenders' policies and owners' policies. Both are issued for a one-time premium. Most mortgages made in the United States are extended by mortgage bankers, savings and commercial banks, state and federal agencies, and life insurance companies. These financial institutions secure title insurance policies to protect their mortgagees' interest in the real property. This protection remains in effect for as long as the mortgagee has an interest in the property. A separate title insurance policy may be issued to the owner of the real estate. An owner's policy of title insurance protects an owner's interest in the title to the property.
The premiums charged for the issuance of title insurance policies vary with the policy amount and the type of policy issued. The premium is collected in full when the real estate transaction is closed, there being no recurring fee thereafter. In many areas, premiums charged on subsequent policies on the same property may be reduced depending generally upon the time elapsed between issuance of the previous policies and the nature of the transactions for which the policies are issued. Most of the charge to the customer relates to title services rendered in conjunction with the issuance of a policy rather than to the possibility of loss due to risks insured against. Accordingly, the cost of services performed by a title insurer relates for the most part to the prevention of loss rather than to the assumption of the risk of loss. Claim losses that do occur result primarily from title search and examination mistakes, fraud, forgery, incapacity, missing heirs and escrow processing errors.
In connection with its title insurance operations, Old Republic also provides escrow closing and construction disbursement services, as well as real estate information products, national default management services, and a variety of other services pertaining to real estate transfers and loan transactions.
|
Republic Financial Indemnity Group (RFIG) Run-off Business
|
Old Republic's RFIG run-off business consists of its mortgage guaranty and CCI operations.
Private mortgage insurance protects mortgage lenders and investors from default related losses on residential mortgage loans made primarily to homebuyers who make down payments of less than 20% of the home's purchase price. The mortgage guaranty operation insures only first mortgage loans, primarily on residential properties incorporating one-to-four family dwelling units. Old Republic's mortgage guaranty business was started in 1973.
There are two principal types of private mortgage insurance coverage: "primary" and "pool". Primary mortgage insurance provides mortgage default protection on individual loans and covers a stated percentage of the unpaid loan principal, delinquent interest, and certain expenses associated with the default and subsequent foreclosure. In lieu of paying the stated coverage percentage, the Company may pay the entire claim amount, take title to the mortgaged property, and subsequently sell the property to mitigate its loss. Pool insurance, which is written on a group of loans in negotiated transactions, provides coverage that ranges up to 100% of the net loss on each individual loan included in the pool, subject to provisions regarding deductibles, caps on individual exposures, and aggregate stop loss provisions which limit aggregate losses to a specified percentage of the total original balances of all loans in the pool.
Traditional primary insurance was issued on an individual loan basis to mortgage bankers, brokers, commercial banks and savings institutions through a network of Company-managed underwriting sites located throughout the country. Traditional primary loans were individually reviewed (except for loans insured under delegated underwriting programs) and priced according to filed premium rates. In underwriting traditional primary business, the Company generally adhered to the underwriting guidelines published by Fannie Mae or Freddie Mac both of which were purchasers of many of the loans the Company insured. Delegated underwriting programs allowed approved lenders to commit the Company to insure loans provided they adhered to predetermined underwriting guidelines.
Bulk and other insurance was issued on groups of loans to mortgage banking customers through a centralized risk assessment and underwriting department. These groups of loans were priced in the aggregate on a bid or negotiated basis. Coverage for insurance issued in this manner was provided through primary insurance policies (loan level
5
coverage) or pool insurance policies (aggregate coverage). The Company considers transactions designated as bulk insurance to be exposed to higher risk (as determined by such characteristics as origination channel, loan amount, credit quality, and extent of loan documentation) than those designated as other insurance.
Before insuring any loans, the Company issued to each approved customer a master policy outlining the terms and conditions under which coverage would be provided. Primary business was then produced via the issuance of a commitment/certificate for each loan submitted and approved for insurance. In the case of business providing pool coverage, a separate pool insurance policy was issued covering the particular loans applicable to each transaction.
As to all types of mortgage insurance products, the amount of premium charge depended on various underwriting criteria such as loan-to-value ratios, the level of coverage being provided, the borrower's credit history, the type of loan instrument (whether fixed rate/fixed payment or an adjustable rate/adjustable payment), documentation type, and whether or not the insured property is categorized as an investment or owner occupied property. Coverage is non-cancelable by the Company (except in the case of non-payment of premium or certain master policy violations) and premiums are paid under single, annual, or monthly payment plans. Single premiums are paid at the inception of coverage and provide coverage for the entire policy term. Annual and monthly premiums are renewable on their anniversary dates with the premium charge determined on the basis of the original or outstanding loan amount. The majority of the Company's direct premiums were written under monthly premium plans. Premiums may be paid by borrowers as part of their monthly mortgage payment and passed through to the Company by the servicer of the loan, or paid directly by the originator of, or investor in the mortgage loan.
As reported in earlier periods, the Company's flagship mortgage guaranty insurance carrier, Republic Mortgage Insurance Company ("RMIC"), had been operating pursuant to a waiver of minimum state regulatory capital requirements since late 2009. This waiver expired on August 31, 2011 and, as a consequence, RMIC and its sister company Republic Insurance Company of North Carolina ("RMICNC"), discontinued writing new business in all states and limited themselves to servicing the run-off of their existing business. They were placed under administrative supervision by the North Carolina Department of Insurance ("NCDOI") the following year and ultimately ordered to defer the payment of
40%
of all settled claims as a deferred payment obligation ("DPO").
On July 1, 2014, the NCDOI issued a Final Order approving an Amended and Restated Corrective Plan (the "Amended Plan") submitted jointly on April 16, 2014, by RMIC and RMICNC. Under the Amended Plan, RMIC and RMICNC were authorized to pay
100%
of their DPOs accrued as of June 30, 2014, and to settle all subsequent valid claims entirely in cash, without establishing any DPOs. In anticipation of receiving this Final Order, ORI invested
$125.0 million
in cash and securities to RMIC in June 2014. In mid-July 2014, in furtherance of the Final Order, RMIC and RMICNC processed payments of their accumulated DPO balances of approximately
$657.0
million relating to fully settled claims charged to periods extending between January 19, 2012 and June 30, 2014. Both subsidiaries remain under the supervision of the NCDOI as they continue to operate in run-off mode. The approval of the Amended Plan notwithstanding, the NCDOI retains its regulatory supervisory powers to review and amend the terms of the Amended Plan in the future as circumstances may warrant.
RMIC has continually evaluated the potential long-term underwriting performance of the run-off book of business based on various modeling techniques. The resulting models take into account actual premium and paid claim experience of prior periods, together with a large number of assumptions and judgments about future outcomes that are highly sensitive to a wide range of estimates. Many of these estimates and underlying assumptions relate to matters over which the Company has no control, including: 1) The conflicted interests, as well as the varying mortgage servicing and foreclosure practices of a large number of insured lending institutions; 2) General economic and industry-specific trends and events; and 3) The evolving or future social and economic policies of the U.S. Government vis-à-vis such critical sectors as the banking, mortgage lending, and housing industries, as well as its policies for resolving the insolvencies and assigning a possible future role to Fannie Mae and Freddie Mac. These matters notwithstanding, RMIC's standard model of forecasted results extending through 2022 continues to reflect ultimate profitability for the book of business. In this regard a long-used RMIC standard model indicates that underwriting performance of the book of business should, in the aggregate, be positive over the extended ten year run-off period assumed to end on or about December 31, 2022. As of
December 31, 2016
, it is nonetheless possible that MI operating results could be negative in the near term.
As of
December 31, 2016
, RFIG's mortgage insurance subsidiaries were statutorily solvent. Their total statutory capital, inclusive of a contingency reserve of
$340.9 million
, was
$420.6 million
. As of the same date, RFIG's consolidated GAAP capitalization amounted to
$330.6 million
.
CCI policies, which have been issued by the Company since 1954, provide limited indemnity coverage to lenders and other financial intermediaries. The coverage is for the risk of non-payment of loan balances by individual buyers and borrowers. Claim costs are typically affected by unemployment, bankruptcy, and other issues leading to failures to pay. During 2008, the Company ceased the underwriting of new policies and the existing book of business was placed in run-off operating mode. During 2016, 2015 and 2014 in particular, CCI underwriting performance was affected negatively by significant litigation costs arising from claims by and against one of the nation's major banking institutions.
|
Corporate and Other Operations
|
Corporate and other operations include the accounts of a small life and accident insurance business as well as those of the parent holding company and several minor corporate services subsidiaries that perform investment management,
6
payroll, administrative and minor marketing services. The life and accident business registered net premium revenues of
$20.1
million,
$19.4
million, and
$60.7 million
in
2016
,
2015
and
2014
, respectively. This business is conducted in both the United States and Canada and consists mostly of limited product offerings sold through financial intermediaries such as automobile dealers, travel agents, and marketing channels that are also utilized in some of Old Republic's general insurance operations. The much lower life and accident premium volume for 2016 and 2015 reflects the transfer of accident insurance premiums from a life and accident subsidiary to a general insurance group affiliate in 2015. Production of term life insurance, accounting for net premiums earned of
$10.3
million,
$10.3
million, and
$11.9 million
in
2016
,
2015
and
2014
, respectively, was terminated and placed in run off as of year end 2004.
|
Consolidated Underwriting Statistics
|
The following table reflects underwriting statistics covering premiums and related loss, expense, and policyholders' dividend ratios for the major coverages underwritten in the Company's insurance segments.
7
|
($ in Millions)
|
|||||||||||||||
|
Years Ended December 31:
|
2016
|
|
2015
|
|
2014
|
||||||||||
|
General Insurance Group:
|
|||||||||||||||
|
Overall Experience: (d)
|
|||||||||||||||
|
Net Premiums Earned
|
$
|
2,936.3
|
|
$
|
2,894.7
|
|
$
|
2,735.6
|
|
||||||
|
Benefits and Claim Ratio
|
73.0
|
%
|
74.1
|
%
|
77.9
|
%
|
|||||||||
|
Expense Ratio
|
24.8
|
|
23.5
|
|
22.9
|
|
|||||||||
|
Composite Ratio
|
97.8
|
%
|
97.6
|
%
|
100.8
|
%
|
|||||||||
|
Experience by Major Coverages:
|
|||||||||||||||
|
Commercial Automobile (Principally Trucking):
|
|||||||||||||||
|
Net Premiums Earned
|
$
|
988.6
|
|
$
|
929.9
|
|
$
|
873.5
|
|
||||||
|
Benefits and Claim Ratio
|
79.4
|
%
|
77.8
|
%
|
74.0
|
%
|
|||||||||
|
Workers' Compensation:
|
|||||||||||||||
|
Net Premiums Earned
|
$
|
1,072.5
|
|
$
|
1,128.7
|
|
$
|
1,109.6
|
|
||||||
|
Benefits and Claim Ratio
|
76.1
|
%
|
80.7
|
%
|
89.2
|
%
|
|||||||||
|
General Liability:
|
|||||||||||||||
|
Net Premiums Earned
|
$
|
163.3
|
|
$
|
171.2
|
|
$
|
170.0
|
|
||||||
|
Benefits and Claim Ratio
|
77.5
|
%
|
76.8
|
%
|
88.2
|
%
|
|||||||||
|
Three Above Coverages Combined:
|
|||||||||||||||
|
Net Premiums Earned
|
$
|
2,224.5
|
|
$
|
2,230.0
|
|
$
|
2,153.2
|
|
||||||
|
Benefits and Claim Ratio
|
77.6
|
%
|
79.2
|
%
|
82.9
|
%
|
|||||||||
|
Financial Indemnity: (a)(d)
|
|||||||||||||||
|
Net Premiums Earned
|
$
|
125.0
|
|
$
|
117.4
|
|
$
|
105.9
|
|
||||||
|
Benefits and Claim Ratio
|
45.5
|
%
|
39.1
|
%
|
25.6
|
%
|
|||||||||
|
Inland Marine and Commercial Multi-Peril:
|
|||||||||||||||
|
Net Premiums Earned
|
$
|
217.9
|
|
$
|
214.3
|
|
$
|
206.3
|
|
||||||
|
Benefits and Claim Ratio
|
60.9
|
%
|
57.0
|
%
|
65.7
|
%
|
|||||||||
|
Home and Automobile Warranty:
|
|||||||||||||||
|
Net Premiums Earned
|
$
|
274.6
|
|
$
|
242.4
|
|
$
|
213.1
|
|
||||||
|
Benefits and Claim Ratio
|
65.3
|
%
|
65.0
|
%
|
65.1
|
%
|
|||||||||
|
Other Coverages: (b)
|
|||||||||||||||
|
Net Premiums Earned
|
$
|
95.2
|
|
$
|
92.8
|
|
$
|
57.1
|
|
||||||
|
Benefits and Claim Ratio
|
53.4
|
%
|
48.3
|
%
|
77.9
|
%
|
|||||||||
|
Title Insurance Group: (c)
|
|||||||||||||||
|
Net Premiums Earned
|
$
|
1,742.4
|
|
$
|
1,624.7
|
|
$
|
1,394.4
|
|
||||||
|
Combined Net Premiums & Fees Earned
|
$
|
2,206.6
|
|
$
|
2,045.3
|
|
$
|
1,759.2
|
|
||||||
|
Claim Ratio
|
3.8
|
%
|
4.9
|
%
|
5.2
|
%
|
|||||||||
|
Expense Ratio
|
87.9
|
|
88.3
|
|
90.4
|
|
|||||||||
|
Composite Ratio
|
91.7
|
%
|
93.2
|
%
|
95.6
|
%
|
|||||||||
|
RFIG Run-off Business: (d)
|
|||||||||||||||
|
Net Premiums Earned
|
$
|
170.0
|
|
$
|
219.9
|
|
$
|
255.4
|
|
||||||
|
Claim Ratio
|
60.4
|
%
|
88.0
|
%
|
97.2
|
%
|
|||||||||
|
Expense Ratio
|
12.2
|
|
10.0
|
|
9.5
|
|
|||||||||
|
Composite Ratio
|
72.6
|
%
|
98.0
|
%
|
106.7
|
%
|
|||||||||
|
All Coverages Consolidated:
|
|||||||||||||||
|
Net Premiums & Fees Earned
|
$
|
5,333.2
|
|
$
|
5,179.4
|
|
$
|
4,811.1
|
|
||||||
|
Benefits and Claim Ratio
|
44.0
|
%
|
47.5
|
%
|
52.3
|
%
|
|||||||||
|
Expense Ratio
|
50.6
|
|
48.5
|
|
47.1
|
|
|||||||||
|
Composite Ratio
|
94.6
|
%
|
96.0
|
%
|
99.4
|
%
|
|||||||||
Any necessary reclassifications of prior years' data are reflected in the above table to conform to current presentation.
|
(a)
|
Consists principally of fidelity, surety, executive indemnity (directors & officers and errors & omissions), and GAP coverages.
|
|
(b)
|
Consists principally of aviation and travel accident coverages.
|
|
(c)
|
Title claim, expense, and composite ratios are calculated on the basis of combined net premiums and fees earned.
|
(d) Consumer credit indemnity coverages are reported within the RFIG Run-off segment and have been excluded from the General Insurance Group.
The effect of the reclassified CCI coverage from the General Insurance Group's overall and financial indemnity underwriting statistics to the RFIG Run-off Business were as follows:
8
|
($ in Millions)
|
|||||||||||||||
|
Years Ended December 31:
|
2016
|
2015
|
2014
|
||||||||||||
|
General insurance overall experience:
|
|||||||||||||||
|
Increase (decrease) in net premiums earned
|
$
|
(15.8
|
)
|
$
|
(23.9
|
)
|
$
|
(27.7
|
)
|
||||||
|
Percentage point increase (decrease) in claim ratio
|
(1.3
|
)%
|
(2.2
|
)%
|
(4.2
|
)%
|
|||||||||
|
Percentage point increase (decrease) in expense ratio
|
.1
|
|
.1
|
|
.1
|
|
|||||||||
|
Percentage point increase (decrease) in composite ratio
|
(1.2
|
)%
|
(2.1
|
)%
|
(4.1
|
)%
|
|||||||||
|
Financial Indemnity coverages:
|
|||||||||||||||
|
Increase (decrease) in net premiums earned
|
$
|
(15.8
|
)
|
$
|
(23.9
|
)
|
$
|
(27.7
|
)
|
||||||
|
Percentage point increase (decrease) in claim ratio
|
(30.4
|
)%
|
(52.1
|
)%
|
(97.3
|
)%
|
|||||||||
|
RFIG Run-off Business:
|
|||||||||||||||
|
Increase (decrease) in net premiums earned
|
$
|
15.8
|
|
$
|
23.9
|
|
$
|
27.7
|
|
||||||
|
Percentage point increase (decrease) in claim ratio
|
26.3
|
%
|
31.6
|
%
|
48.4
|
%
|
|||||||||
|
Percentage point increase (decrease) in expense ratio
|
.2
|
|
(.1
|
)
|
(.2
|
)
|
|||||||||
|
Percentage point increase (decrease) in composite ratio
|
26.5
|
%
|
31.5
|
%
|
48.2
|
%
|
|||||||||
Net Premiums Earned
General insurance
2016 earned premiums were basically level with the preceding year's production with trends unevenly distributed among various insurance coverages. Low to mid-single digit gains were experienced in commercial automobile (trucking) and national accounts, as well as other coverages such as home warranty. Premium volume from a new underwriting facility established in early 2015 also added measurably to earned premiums in 2016. In other regards, 2016 premium levels were hindered by lower volume in a large account contractors book of business operating in a particularly competitive environment, and by reduced production in the energy services field. 2015 and 2014 earned premium revenues rose for most insurance coverages with production spurred by both new business and a continuation of strong renewal rates for existing business. The Company's targeted insurance underwriting services in such fields as aviation, construction, energy, home warranty, trucking, and large account risk management provided the main impetus to this growth. The combination of a generally improving rate environment for most coverages and the slowly strengthening pace of U.S. economic activity were major contributing factors in these regards.
Title insurance
premiums and fees reflect the continuation of a favorable mortgage rate environment and generally improving housing and commercial property markets which have led to higher revenues from title premiums and fees in 2016. This was achieved in spite of the adverse effects that government-imposed mortgage disclosure rules, implemented during the last quarter of 2015, have had on the consummation of real estate transactions nationally. The 2015 increase was due to stronger housing and commercial property transactions and the segment's expanded market share. The premium and fees in 2014 reflect a significant drop in refinance transactions from higher levels reached in 2013.
RFIG Run-off
earned premium volume has reflected a continuing decline since 2012 due to the natural outcome of a run-off book of business devoid of new premium production since at least 2011.
Claim Ratios
Variations in claim ratios are typically caused by changes in the frequency and severity of claims incurred, changes in premium rates and the level of premium refunds, and periodic changes in claim and claim expense reserve estimates resulting from ongoing reevaluations of reported and incurred but not reported claims and claim expenses. As demonstrated in the preceding table, the Company can therefore experience period-to-period volatility in the underwriting results posted for individual coverages. In light of Old Republic's basic underwriting focus in managing its business, a long-term objective has been to dampen this volatility by diversifying coverages offered and industries served.
The claim ratios include loss adjustment expenses where appropriate. Policyholders' dividends, which apply principally to workers' compensation insurance, are a reflection of changes in loss experience for individual or groups of policies, rather than overall results, and should be viewed in conjunction with loss ratio trends.
The overall
general insurance
2016 benefit and claim costs were reasonably stable. Unfavorable developments of reserves established in prior years nonetheless added 0.3 percentage points to the benefit and claim ratio. By comparison to 2014, the 2015 claim ratio reflects lower expense provisions for current and prior year's claim occurrences. Claim ratios for 2015 and 2014 were inclusive of 1.5 and 3.9 percentage point additions arising from unfavorable developments, respectively. Adverse developments have been concentrated in workers' compensation and general liability case reserves and resulted from settlements or reserve additions exceeding the previously established indemnity and/or allocated loss adjustment expense provisions. The Company generally underwrites concurrently workers' compensation, commercial automobile (liability and physical damage), and general liability insurance coverages for a large number of customers. Given this concurrent underwriting approach, an evaluation of trends in premiums, claim and dividend ratios for these individual coverages is more appropriately considered for the aggregate of these coverages.
Claims are a major cost factor and changes in them reflect continually evolving pricing and risk selection together with variability in loss severity and frequency trends caused by fortuitous and other events. Changes in commercial automobile claim ratios are primarily due to fluctuations in claim severity. Loss ratios for workers' compensation and
9
liability insurance can reflect greater variability due to chance events in any one year, changes in loss costs emanating from participation in involuntary markets (i.e. insurance assigned risk pools and associations in which participation is basically mandatory), and added provisions for loss costs not recoverable from assuming reinsurers which may experience financial difficulties from time to time. Additionally, workers' compensation claim costs in particular are affected by a variety of underwriting techniques such as the use of captive reinsurance retentions, retrospective premium plans, and self-insured or deductible insurance programs that are intended to mitigate claim costs over time. Claim ratios for a relatively small book of general liability coverages tend to be highly volatile year to year due to the impact of changes in claim emergence and severity of legacy asbestos and environmental claims exposures.
Title insurance
loss ratios have trended down in the face of declining claims activity since the Great Recession years and from favorable developments of reserves established in prior years. These developments lowered the reported claims ratios by 1.1, .6 and .8 percentage points for the years ended December 31, 2016, 2015, and 2014, respectively.
The
RFIG Run-off - mortgage guaranty
2016 claim ratio was less affected by litigation expense provisions that impacted adversely the 2015 claim ratio. Excluding the affects of the litigation expense provisions, continued declines in reported delinquencies and the higher rates at which reported mortgage loan defaults are cured or otherwise resolved without payment have led to generally declining claim costs and the related ratios to earned premiums for the past four years. These factors led to highly favorable developments of prior year-end claim reserves during 2016, 2015, and 2014. Setting aside the aforementioned litigation expense provisions in 2015, these favorable reserve developments accounted for reductions of 39.8, 65.0, and 69.3 percentage points in the reported claim ratio for the years ended December 31, 2016, 2015, and 2014, respectively.
RFIG Run-off - CCI
results reflect greater volatility in claim costs and related ratios. In 2016 and several prior years, claim costs have been particularly impacted by ongoing costs of a near-eight-year long commercial dispute being litigated with Bank of America and its acquired Countrywide mortgage banking subsidiaries.
The
consolidated
claim, expense, and composite ratios reflect all the above factors and the changing period-to-period contributions of each segment to consolidated results.
General Insurance Claim Reserves
The Company's property and liability insurance subsidiaries establish claim reserves which consist of estimates to settle: a) reported claims; b) claims which have been incurred as of each balance sheet date but have not as yet been reported ("IBNR") to the insurance subsidiaries; and c) the direct costs, (fees and costs which are allocable to individual claims) and indirect costs (such as salaries and rent applicable to the overall management of claim departments) to administer known and IBNR claims. Such claim reserves, except as to classification in the Consolidated Balance Sheets as to gross and reinsured portions and purchase accounting adjustments, are reported for financial and regulatory reporting purposes at amounts that are substantially the same.
The establishment of claim reserves by the Company's insurance subsidiaries is a reasonably complex and dynamic process influenced by a large variety of factors. These factors principally include past experience applicable to the anticipated costs of various types of claims, continually evolving and changing legal theories emanating from the judicial system, recurring accounting, statistical, and actuarial studies, the professional experience and expertise of the Company's claim departments' personnel or attorneys and independent claim adjusters, ongoing changes in claim frequency or severity patterns such as those caused by natural disasters, illnesses, accidents, work-related injuries, and changes in general and industry-specific economic conditions. Consequently, the reserves established are a reflection of the opinions of a large number of persons, of the application and interpretation of historical precedent and trends, of expectations as to future developments, and of management's judgment in interpreting all such factors. At any point in time, the Company is exposed to the risk of possibly higher or lower than anticipated claim costs due to all of these factors, and to the evolution, interpretation, and expansion of tort law, as well as the effects of unexpected jury verdicts.
In establishing claim reserves, the possible increase in future loss settlement costs caused by inflation is considered implicitly, along with the many other factors cited above. Reserves are generally set to provide for the ultimate cost of all claims. With regard to workers' compensation reserves, however, the ultimate cost of long-term disability or pension type claims is discounted to present value based on interest rates ranging from
3.5%
to
4.0%
. Where applicable, the Company uses only such discounted reserves in evaluating the results of its operations, in pricing its products and settling retrospective and reinsured accounts, in evaluating policy terms and experience, and for other general business purposes. Solely to comply with reporting rules mandated by the Securities and Exchange Commission, however, Old Republic has made statistical studies of applicable workers' compensation reserves to obtain estimates of the amounts by which claim and claim adjustment expense reserves, net of reinsurance, have been discounted. These studies have resulted in estimates of such amounts at
$231.9
million,
$228.6
million and
$240.7
million, as of
December 31, 2016
,
2015
and
2014
, respectively. It should be noted, however, that these differences between discounted and non-discounted (terminal) reserves are fundamentally of an informational nature, and are not indicative of an effect on operating results for any one or series of years for the above noted reasons.
Early in 2001, the Federal Department of Labor revised the Federal Black Lung Program regulations. The revisions basically require a reevaluation of previously settled, denied, or new occupational disease claims in the context of newly devised, more lenient standards when such claims are resubmitted. Following a number of challenges and appeals by the insurance and coal mining industries, the revised regulations were, for the most part, upheld in June, 2002 and are to be applied prospectively. Since the final quarter of 2001, black lung claims filed or refiled pursuant to these revised regulations have increased, though the volume of new claim reports has abated in recent years.
10
In March 2010, federal regulations were revised once again as part of the Patient Protection and Affordability Act that reinstates two provisions that can potentially benefit claimants. In response to this most recent legislation and the above noted 2001 change, black lung claims filed or refiled have risen once again. The vast majority of claims filed to date against Old Republic pertain to business underwritten through loss sensitive programs that permit the charge of additional or refund of return premiums to wholly or partially offset changes in estimated claim costs, or to business underwritten as a service carrier on behalf of various industry-wide involuntary market (i.e. assigned risk) pools. A much smaller portion pertains to business produced on a traditional risk transfer basis. The Company has established applicable reserves for claims as they have been reported and for claims not as yet reported on the basis of its historical experience as well as assumptions relative to the effect of the revised regulations. The potential impact on reserves, gross and net of reinsurance or retrospective premium adjustments, resulting from such regulations cannot be estimated with reasonable certainty.
Old Republic's reserve estimates also include provisions for indemnity and settlement costs for various asbestosis and environmental impairment ("A&E") claims that have been filed in the normal course of business against a number of its insurance subsidiaries. Many such claims relate to policies issued prior to 1985, including many issued during a short period between 1981 and 1982 pursuant to an agency agreement canceled in 1982. Over the years, the Company's property and liability insurance subsidiaries have typically issued general liability insurance policies with face amounts ranging between
$1.0
million and
$2.0
million and rarely exceeding
$10.0
million. Such policies have, in turn, been subject to reinsurance cessions which have typically reduced the subsidiaries' net retentions to
$.5
million or less as to each claim. Old Republic's exposure to A&E claims cannot, however, be calculated by conventional insurance reserving methods for a variety of reasons, including: a) the absence of statistically valid data inasmuch as such claims typically involve long reporting delays and very often uncertainty as to the number and identity of insureds against whom such claims have arisen or will arise; and b) the litigation history of such or similar claims for insurance industry members which has produced inconsistent court decisions with regard to such questions as to when an alleged loss occurred, which policies provide coverage, how a loss is to be allocated among potentially responsible insureds and/or their insurance carriers, how policy coverage exclusions are to be interpreted, what types of environmental impairment or toxic tort claims are covered, when the insurer's duty to defend is triggered, how policy limits are to be calculated, and whether clean-up costs constitute property damage. Over time, the Executive Branch and/or the Congress of the United States have proposed or considered changes in the legislation and rules affecting the determination of liability for environmental and asbestosis claims. As of
December 31, 2016
, however, there is no solid evidence to suggest that possible future changes might mitigate or reduce some or all of these claim exposures. Because of the above issues and uncertainties, estimation of reserves for losses and allocated loss adjustment expenses for A&E claims in particular is much more difficult or impossible to quantify with a high degree of precision. Accordingly, no representation can be made that the Company's reserves for such claims and related costs will not prove to be overstated or understated in the future. At
December 31, 2016
and
2015
, Old Republic's aggregate indemnity and loss adjustment expense reserves specifically identified with A&E exposures amounted to approximately
$121.2
million and
$130.9
million gross, respectively, and
$97.1
million and
$100.6
million net of reinsurance, respectively. Based on average annual claims payments during the five most recent calendar years, such reserves represented a paid loss survival ratio of
4.3
years (gross) and
6.3
years (net of reinsurance) as of
December 31, 2016
and
4.7
years (gross) and
6.2
years (net of reinsurance) as of
December 31, 2015
. Fluctuations in this ratio between years can be caused by the inconsistent pay out patterns associated with these types of claims. For the five years ended
December 31, 2016
, incurred A&E claim and related loss settlement costs have averaged
.4%
of average annual General Insurance Group claims and related settlement costs.
Over the years, the subject of property and liability insurance claim reserves has been written about and analyzed extensively by a large number of professionals and regulators. Accordingly, the above discussion summary should be regarded as a basic outline of the subject and not as a definitive presentation. The Company believes that its overall reserving practices have been consistently applied over many years, and that its aggregate reserves have generally resulted in reasonable approximations of the ultimate net costs of claims incurred. However, no representation is made nor is any guaranty given that ultimate net claim and related costs will not develop in future years to be greater or lower than currently established reserve estimates.
The following table shows the evolving redundancies or deficiencies for reserves established as of December 31, of each of the years
2006
through
2016
.
11
|
($ in Millions)
|
|||||||||||||||||||||||||||||||||||
|
(a)
|
As of December 31(6)(7):
|
2016
|
2015
|
2014
|
2013
|
2012
|
2011
|
2010
|
2009
|
2008
|
2007
|
2006
|
|||||||||||||||||||||||
|
(b)
|
Liability (1) for unpaid claims
and claim adjustment
expenses(2):
|
$
|
5,097
|
|
$
|
4,908
|
|
$
|
4,597
|
|
$
|
4,197
|
|
$
|
3,936
|
|
$
|
3,769
|
|
$
|
3,779
|
|
$
|
3,229
|
|
$
|
3,222
|
|
$
|
3,175
|
|
$
|
2,924
|
|
|
|
(c)
|
Paid (cumulative) as of (3):
|
|||||||||||||||||||||||
|
One year later
|
—
|
%
|
23.5
|
%
|
23.5
|
%
|
24.9
|
%
|
22.5
|
%
|
24.4
|
%
|
24.6
|
%
|
26.8
|
%
|
28.4
|
%
|
29.2
|
%
|
25.5
|
%
|
||
|
Two years later
|
—
|
|
—
|
|
39.7
|
|
40.5
|
|
40.2
|
|
38.9
|
|
40.1
|
|
39.8
|
|
42.2
|
|
44.0
|
|
41.5
|
|
||
|
Three years later
|
—
|
|
—
|
|
—
|
|
51.9
|
|
50.8
|
|
52.0
|
|
49.8
|
|
48.9
|
|
51.3
|
|
52.5
|
|
51.6
|
|
||
|
Four years later
|
—
|
|
—
|
|
—
|
|
—
|
|
58.7
|
|
58.9
|
|
59.5
|
|
56.2
|
|
57.4
|
|
58.5
|
|
57.1
|
|
||
|
Five years later
|
—
|
|
—
|
|
—
|
|
—
|
|
—
|
|
64.6
|
|
64.1
|
|
63.2
|
|
63.3
|
|
63.1
|
|
61.6
|
|
||
|
Six years later
|
—
|
|
—
|
|
—
|
|
—
|
|
—
|
|
—
|
|
68.4
|
|
66.9
|
|
67.8
|
|
67.3
|
|
65.5
|
|
||
|
Seven years later
|
—
|
|
—
|
|
—
|
|
—
|
|
—
|
|
—
|
|
—
|
|
69.7
|
|
70.6
|
|
70.5
|
|
68.5
|
|
||
|
Eight years later
|
—
|
|
—
|
|
—
|
|
—
|
|
—
|
|
—
|
|
—
|
|
—
|
|
73.0
|
|
72.9
|
|
71.2
|
|
||
|
Nine years later
|
—
|
|
—
|
|
—
|
|
—
|
|
—
|
|
—
|
|
—
|
|
—
|
|
—
|
|
75.0
|
|
73.5
|
|
||
|
Ten years later
|
—
|
%
|
—
|
%
|
—
|
%
|
—
|
%
|
—
|
%
|
—
|
%
|
—
|
%
|
—
|
%
|
—
|
%
|
—
|
%
|
75.6
|
%
|
||
|
(d)
|
Liability reestimated (i.e.,
cumulative payments plus
reestimated ending liability)
|
|||||||||||||||||||||||
|
As of (4):
|
||||||||||||||||||||||||
|
One year later
|
—
|
%
|
100.1
|
%
|
100.9
|
%
|
104.5
|
%
|
99.0
|
%
|
99.5
|
%
|
96.1
|
%
|
97.6
|
%
|
98.2
|
%
|
97.4
|
%
|
96.2
|
%
|
||
|
Two years later
|
—
|
|
—
|
|
101.0
|
|
105.0
|
|
103.7
|
|
98.5
|
|
96.3
|
|
94.6
|
|
95.1
|
|
94.9
|
|
94.3
|
|
||
|
Three years later
|
—
|
|
—
|
|
—
|
|
105.0
|
|
103.4
|
|
103.6
|
|
95.5
|
|
93.3
|
|
93.1
|
|
92.5
|
|
92.4
|
|
||
|
Four years later
|
—
|
|
—
|
|
—
|
|
—
|
|
102.7
|
|
102.9
|
|
99.7
|
|
91.8
|
|
91.8
|
|
90.9
|
|
90.2
|
|
||
|
Five years later
|
—
|
|
—
|
|
—
|
|
—
|
|
—
|
|
102.2
|
|
98.0
|
|
93.6
|
|
91.1
|
|
89.9
|
|
89.0
|
|
||
|
Six years later
|
—
|
|
—
|
|
—
|
|
—
|
|
—
|
|
—
|
|
97.5
|
|
91.0
|
|
91.2
|
|
89.3
|
|
87.7
|
|
||
|
Seven years later
|
—
|
|
—
|
|
—
|
|
—
|
|
—
|
|
—
|
|
—
|
|
90.7
|
|
89.3
|
|
89.2
|
|
87.5
|
|
||
|
Eight years later
|
—
|
|
—
|
|
—
|
|
—
|
|
—
|
|
—
|
|
—
|
|
—
|
|
89.5
|
|
88.0
|
|
87.5
|
|
||
|
Nine years later
|
—
|
|
—
|
|
—
|
|
—
|
|
—
|
|
—
|
|
—
|
|
—
|
|
—
|
|
88.4
|
|
86.8
|
|
||
|
Ten years later
|
—
|
%
|
—
|
%
|
—
|
%
|
—
|
%
|
—
|
%
|
—
|
%
|
—
|
%
|
—
|
%
|
—
|
%
|
—
|
%
|
87.3
|
%
|
||
|
(e)
|
Redundancy (deficiency)(5)
for each year-end
|
—
|
%
|
(.1
|
)%
|
(1.0
|
)%
|
(5.0
|
)%
|
(2.7
|
)%
|
(2.2
|
)%
|
2.5
|
%
|
9.3
|
%
|
10.5
|
%
|
11.6
|
%
|
12.7
|
%
|
|
|
Average redundancy
(deficiency) for all year-ends
|
2.7
|
%
|
||||||||||||||||||||||
__________
|
(1)
|
Amounts are reported net of reinsurance.
|
|
(2)
|
Excluding unallocated loss adjustment expense reserves.
|
|
(3)
|
Percent of most recent reestimated liability (line d). Decreases in paid loss percentages may at times reflect the reassumption by the Company of certain previously ceded loss reserves from assuming reinsurers through commutations of then existing reserves.
|
|
(4)
|
Percent of beginning liability (line b) for unpaid claims and claim adjustment expenses.
|
|
(5)
|
Beginning liability less the most current liability reestimated (line d) as a percent of beginning liability (line b).
|
|
(6)
|
Historical data in the above table excludes amounts pertaining to PMA whose merger with Old Republic became effective October 1, 2010. Such PMA reserves have therefore been reflected from December 31, 2010 forward.
|
|
(7)
|
CCI coverages have been fully retained in this historical table for all years presented. In connection with the previously noted MI/CCI combination, certain General Insurance Group companies retain losses pursuant to various quota share and stop loss reinsurance agreements.
|
In reviewing the preceding tabular data, it should be noted that prior periods' loss payment and development trends may not be repeated in the future due to the large variety of factors influencing the reserving and settlement processes outlined herein above. The reserve redundancies or deficiencies shown for all years are not necessarily indicative of the effect on reported results of any one or series of years since cumulative retrospective premium and commission adjustments employed in various parts of the Company's business may partially offset such effects. (See "Consolidated Underwriting Statistics" above, and "Reserves, Reinsurance, and Retrospective Adjustments" elsewhere herein).
In 2016, 2015 and 2014, the Company experienced unfavorable developments of previously established reserves for accidents or events which occurred in 2014 and prior years in particular. These adverse developments were concentrated in workers' compensation and general liability case reserves and resulted from settlements or reserve additions exceeding the previously established indemnity and/or allocated loss adjustment expense provisions. These adverse developments are reflected in the percentage deficiencies shown in the columns for 2011 to 2015 and in the lower redundancy shown in the column for 2010 by comparison to 2009 and prior years.
12
The following table shows an analysis of changes in aggregate reserves for the Company's property and liability insurance claims and allocated claim adjustment expenses for each of the years shown:
|
($ in Millions)
|
||||||||||||||||||||||||||||||||||||
|
Years Ended December 31: (1)
|
2016
|
2015
|
2014
|
2013
|
2012
|
2011
|
2010
|
2009
|
2008
|
2007
|
2006
|
|||||||||||||||||||||||||
|
(a)
|
Beginning net reserves
|
$
|
4,908
|
|
$
|
4,597
|
|
$
|
4,197
|
|
$
|
3,936
|
|
$
|
3,769
|
|
$
|
3,779
|
|
$
|
3,819
|
|
*
|
$
|
3,222
|
|
$
|
3,175
|
|
$
|
2,924
|
|
$
|
2,414
|
|
|
|
Incurred claims and claim expenses:
|
||||||||||||||||||||||||||||||||||||
|
(b)
|
Current year provision
|
1,982
|
|
1,960
|
|
1,897
|
|
1,762
|
|
1,652
|
|
1,582
|
|
1,351
|
|
1,343
|
|
1,452
|
|
1,490
|
|
1,295
|
|
|||||||||||||
|
(c)
|
Change in prior years' provision
|
2
|
|
41
|
|
190
|
|
(40
|
)
|
(19
|
)
|
(149
|
)
|
(76
|
)
|
(56
|
)
|
(83
|
)
|
(110
|
)
|
(116
|
)
|
|||||||||||||
|
(d)
|
Total incurred
|
1,984
|
|
2,001
|
|
2,088
|
|
1,722
|
|
1,632
|
|
1,432
|
|
1,275
|
|
1,287
|
|
1,369
|
|
1,379
|
|
1,179
|
|
|||||||||||||
|
Claim payments on:
|
||||||||||||||||||||||||||||||||||||
|
(e)
|
Current years' events
|
641
|
|
600
|
|
588
|
|
552
|
|
524
|
|
537
|
|
529
|
|
460
|
|
502
|
|
476
|
|
342
|
|
|||||||||||||
|
(f)
|
Prior years' events
|
1,154
|
|
1,090
|
|
1,099
|
|
907
|
|
941
|
|
905
|
|
786
|
|
818
|
|
820
|
|
652
|
|
326
|
|
|||||||||||||
|
(g)
|
Total payments
|
1,796
|
|
1,690
|
|
1,688
|
|
1,460
|
|
1,465
|
|
1,442
|
|
1,315
|
|
1,279
|
|
1,323
|
|
1,128
|
|
668
|
|
|||||||||||||
|
|
||||||||||||||||||||||||||||||||||||
|
(h)
|
Ending net reserves (a + d - g)
|
5,097
|
|
4,908
|
|
4,597
|
|
4,197
|
|
3,936
|
|
3,769
|
|
3,779
|
|
3,229
|
|
3,222
|
|
3,175
|
|
2,924
|
|
|||||||||||||
|
(i)
|
Unallocated loss adjustment
|
|||||||||||||||||||||||||||||||||||
|
expense reserves
|
345
|
|
299
|
|
231
|
|
202
|
|
183
|
|
137
|
|
149
|
|
104
|
|
104
|
|
103
|
|
97
|
|
||||||||||||||
|
(j)
|
Reinsurance recoverable on
|
|||||||||||||||||||||||||||||||||||
|
claims reserves
|
2,759
|
|
2,722
|
|
2,992
|
|
2,801
|
|
2,787
|
|
2,827
|
|
2,825
|
|
2,046
|
|
2,020
|
|
1,976
|
|
1,929
|
|
||||||||||||||
|
(k)
|
Gross claims reserves (h + i + j)
|
$
|
8,203
|
|
$
|
7,931
|
|
$
|
7,821
|
|
$
|
7,201
|
|
$
|
6,907
|
|
$
|
6,733
|
|
$
|
6,753
|
|
$
|
5,380
|
|
$
|
5,346
|
|
$
|
5,256
|
|
$
|
4,951
|
|
||
__________
(*) Includes reserves acquired through the PMA merger.
(1) CCI coverages have been fully retained in this historical table for all years presented. For segment reporting purposes, $193.5 million, $155.1 million, and $107.7 million of ending net reserves reported in the above table are reported as part of the RFIG Run-off Business segment as of December 31, 2016, 2015, and 2014, respectively. In connection with the previously noted MI/CCI combination, certain General Insurance Group companies retain losses pursuant to various quota share and stop loss reinsurance agreements.
(b) Investments.
In common with other insurance organizations, Old Republic invests most capital and operating funds in income producing securities. Investments must comply with applicable insurance laws and regulations which prescribe the nature, form, quality, and relative amounts of investments which may be made by insurance companies. Generally, these laws and regulations permit insurance companies to invest within varying limitations in state, municipal and federal government obligations, corporate debt, preferred and common stocks, certain types of real estate, and first mortgage loans. For many years, Old Republic's investment policy has therefore been to acquire and retain primarily investment grade, publicly traded, fixed maturity securities, and in more recent years, high yielding publicly traded large capitalization common shares. The investment policy is also influenced by the terms of the insurance coverages written, by its expectations as to the timing of claim and benefit payments, and by income tax considerations. As a consequence of all these factors, the Company's invested assets are managed in consideration of enterprise-wide risk management objectives. Most importantly, these are intended to ensure solid funding of insurance subsidiaries' long-term obligations to policyholders and other beneficiaries, as well as the long-term stability of the subsidiaries' capital accounts. To this end, the investment portfolio contains no significant insurance risk-correlated asset exposures to real estate, mortgage-backed securities, collateralized debt obligations ("CDO's"), derivatives, hybrid securities, or illiquid private equity investments. Moreover, the Company does not engage in hedging or securities lending transactions, nor does it invest in securities whose values are predicated on non-regulated financial instruments exhibiting amorphous or unfunded counter-party risk attributes.
Management considers investment grade fixed maturity securities to be those rated by major credit rating agencies that fall within the top four rating categories, or securities which are not rated but have characteristics similar to securities so rated. The Company had no fixed maturity investments in default as to principal and/or interest at
December 31, 2016
and
2015
. The status and fair value changes of each investment is reviewed on at least a quarterly basis, and estimates of other-than-temporary impairments in the portfolio's value are evaluated and established at each quarterly balance sheet date. The majority of the Company's invested assets as of
December 31, 2016
have been classified as "available for sale" pursuant to the existing investment policy.
The Company's investment policies are not designed to maximize or emphasize the realization of investment gains. The combination of gains and losses from sales or impairments of securities is reflected as realized gains and losses in the income statement. Dispositions of securities result principally from scheduled maturities of bonds and notes and sales of fixed income and equity securities available for sale. Dispositions of securities at a realized gain or loss reflect such factors as ongoing assessments of issuers' business prospects, allocation to industry sectors, changes in credit quality, and tax planning considerations.
13
The following tables show invested assets at the end of the last two years, together with investment income for each of the last three years:
|
Consolidated Investments
|
|||||||||||
|
($ in Millions)
|
|||||||||||
|
December 31:
|
2016
|
2015
|
|||||||||
|
Available for Sale
|
|||||||||||
|
Fixed Maturity Securities:
|
|||||||||||
|
U.S. & Canadian Governments
|
$
|
1,426.8
|
|
$
|
1,284.9
|
|
|||||
|
Corporate
|
6,744.1
|
|
6,896.5
|
|
|||||||
|
8,170.9
|
|
8,181.5
|
|
||||||||
|
Equity Securities
|
2,896.1
|
|
1,987.8
|
|
|||||||
|
Short-term Investments
|
681.6
|
|
669.4
|
|
|||||||
|
Miscellaneous Investments
|
31.2
|
|
27.2
|
|
|||||||
|
Total available for sale
|
11,780.0
|
|
10,866.1
|
|
|||||||
|
Held to Maturity
|
|||||||||||
|
Fixed Maturity Securities:
|
|||||||||||
|
Tax-Exempt
|
974.8
|
|
355.8
|
|
|||||||
|
Other Investments
|
2.9
|
|
3.5
|
|
|||||||
|
Total Investments
|
$
|
12,757.7
|
|
$
|
11,225.5
|
|
|||||
|
Sources of Consolidated Investment Income
|
|||||||||||||||
|
($ in Millions)
|
|||||||||||||||
|
Years Ended December 31:
|
2016
|
2015
|
2014
|
||||||||||||
|
Fixed Maturity Securities:
|
|||||||||||||||
|
Taxable Interest
|
$
|
285.0
|
|
$
|
294.0
|
|
$
|
292.7
|
|
||||||
|
Tax-Exempt Interest
|
11.5
|
|
2.3
|
|
3.2
|
|
|||||||||
|
296.6
|
|
296.4
|
|
296.0
|
|
||||||||||
|
Equity Securities Dividends
|
88.2
|
|
91.0
|
|
49.3
|
|
|||||||||
|
Other Investment Income:
|
|||||||||||||||
|
Interest on Short-term Investments
|
2.1
|
|
.8
|
|
.8
|
|
|||||||||
|
Other Sources
|
3.9
|
|
3.7
|
|
3.0
|
|
|||||||||
|
6.0
|
|
4.5
|
|
3.9
|
|
||||||||||
|
Gross Investment Income
|
390.9
|
|
392.1
|
|
349.2
|
|
|||||||||
|
Less: Investment Expenses (a)
|
3.8
|
|
3.4
|
|
3.7
|
|
|||||||||
|
Net Investment Income
|
$
|
387.0
|
|
$
|
388.6
|
|
$
|
345.5
|
|
||||||
__________
|
(a)
|
Investment expenses consist of personnel costs and investment management and custody service fees, as well as interest incurred on funds held of
$.4 million
,
$.3 million
and
$.4 million
for the years ended
December 31, 2016
,
2015
and
2014
, respectively.
|
The independent credit quality ratings and maturity distribution for Old Republic's consolidated fixed maturity investments, excluding short-term investments, at the end of the last two years are shown in the following tables. These investments,
$9.1
billion and
$8.5
billion at
December 31, 2016
and
2015
, respectively, represented approximately
49%
and
50%
of consolidated assets, respectively, and
65%
of consolidated liabilities as of both
December 31, 2016
and
2015
.
14
|
Credit Quality Ratings of Fixed Maturity Securities (b)
|
|||||||||
|
December 31:
|
2016
|
2015
|
|||||||
|
(% of total portfolio)
|
|||||||||
|
Aaa
|
20.1
|
%
|
17.2
|
%
|
|||||
|
Aa
|
12.1
|
|
9.6
|
|
|||||
|
A
|
30.9
|
|
32.3
|
|
|||||
|
Baa
|
28.9
|
|
34.7
|
|
|||||
|
Total investment grade
|
92.0
|
|
93.8
|
|
|||||
|
All other (c)
|
8.0
|
|
6.2
|
|
|||||
|
Total
|
100.0
|
%
|
100.0
|
%
|
|||||
__________
|
(b)
|
Credit quality ratings referred to herein are a blend of those assigned by the major credit rating agencies for U.S. and Canadian Governments, Agencies, Corporates and Municipal issuers, which are converted to the above ratings classifications.
|
|
(c)
|
"All other" includes non-investment grade or non-rated issuers.
|
|
Age Distribution of Fixed Maturity Securities
|
|||||||||
|
December 31:
|
2016
|
2015
|
|||||||
|
(% of total portfolio)
|
|||||||||
|
Maturity Ranges:
|
|||||||||
|
Due in one year or less
|
9.2
|
%
|
9.9
|
%
|
|||||
|
Due after one year through five years
|
45.0
|
|
40.8
|
|
|||||
|
Due after five years through ten years
|
43.9
|
|
47.0
|
|
|||||
|
Due after ten years through fifteen years
|
1.6
|
|
1.9
|
|
|||||
|
Due after fifteen years
|
.3
|
|
.4
|
|
|||||
|
100.0
|
%
|
100.0
|
%
|
||||||
|
Average Maturity in Years
|
4.8
|
4.9
|
|
||||||
(c) Marketing.
Commercial automobile (trucking), workers' compensation and general liability insurance underwritten for business enterprises and public entities is marketed primarily through independent insurance agents and brokers with the assistance of Old Republic's trained sales, underwriting, actuarial, and loss control personnel. The remaining property and liability commercial insurance written by Old Republic is obtained through insurance agents or brokers who are independent contractors and generally represent other insurance companies, and by direct sales. No single source accounted for over 10% of Old Republic's premium volume in
2016
.
A substantial portion of the Company's title insurance business is referred to it by title insurance agents, builders, lending institutions, real estate developers, realtors, and lawyers. Title insurance and related real estate settlement products are sold through
266
Company offices and through agencies and underwritten title companies in the District of Columbia and all 50 states. The issuing agents are authorized to issue commitments and title insurance policies based on their own search and examination, or on the basis of abstracts and opinions of approved attorneys. Policies are also issued through independent title companies (not themselves title insurers) pursuant to underwriting agreements. These agreements generally provide that the agency or underwritten company may cause title policies of the Company to be issued, and the latter is responsible under such policies for any payments to the insured. Typically, the agency or underwritten title company deducts the major portion of the title insurance charge to the customer as its commission for services. During
2016
, approximately
72%
of title insurance premiums and fees were accounted for by policies issued by agents and underwritten title companies.
Title insurance premium and fee revenue is closely related to the level of activity in the real estate market. The volume of real estate activity is affected by the availability and cost of financing, population growth, family movements and other socio-economic factors. Also, the title insurance business is seasonal. During the winter months, new building activity is reduced and, accordingly, the Company produces less title insurance business relative to new construction during such months than during the rest of the year. The most important factors, insofar as Old Republic's title business is concerned, however, are the rates of activity in the resale and refinance markets for residential properties.
As previously noted, the Company's flagship mortgage guaranty insurance carrier had been operating pursuant to a waiver of minimum state regulatory capital requirements since late 2009. This waiver expired on August 31, 2011. As a consequence, the underwriting of new policies ceased and the existing book of business was placed in run-off operating mode. Prior to August 31, 2011, traditional primary mortgage insurance was marketed principally through a direct sales force which called on mortgage bankers, brokers, commercial banks, savings institutions and other mortgage originators. No sales commissions or other forms of remuneration were paid to the lending institutions or others for the procurement or development of business.
The personal contacts, relationships, reputations, and intellectual capital of Old Republic's key executives and other associates responsible for the production of business are a vital element in obtaining and retaining much of its business. Many of the Company's customers produce large amounts of premiums and fees and therefore warrant substantial levels
15
of attention and involvement by these persons. In this respect, Old Republic's mode of operation is similar to that of professional reinsurers and commercial insurance brokers, and relies on the marketing, underwriting, and management skills of relatively few key people for large parts of its business.
Historically, several types of insurance coverages underwritten by Old Republic, such as consumer credit indemnity, title, and mortgage guaranty insurance, have been affected in varying degrees by changes in national economic conditions. During periods when housing activity or mortgage lending are constrained by any combination of rising interest rates, tighter mortgage underwriting guidelines, falling home prices, excess housing supply and/or economic recession, operating and/or claim costs pertaining to such coverages tend to rise disproportionately to revenues and can result in underwriting losses and reduced levels of profitability.
At least one Old Republic general insurance subsidiary is licensed to do business in each of the 50 states, the District of Columbia, Puerto Rico, Virgin Islands, Guam, and each of the Canadian provinces. Title insurance operations are licensed to do business in 50 states, the District of Columbia and Guam. Mortgage insurance subsidiaries are licensed in 50 states and the District of Columbia. Consolidated direct premium volume distributed among the various geographical regions shown was as follows for the past three years:
|
Geographical Distribution of Consolidated Direct Premiums Written
|
|||||||||||
|
2016
|
2015
|
2014
|
|||||||||
|
United States:
|
|||||||||||
|
Northeast
|
12.3
|
%
|
12.5
|
%
|
12.6
|
%
|
|||||
|
Mid-Atlantic
|
7.9
|
|
7.9
|
|
8.5
|
|
|||||
|
Southeast
|
20.2
|
|
20.0
|
|
19.1
|
|
|||||
|
Southwest
|
11.3
|
|
11.8
|
|
12.4
|
|
|||||
|
East North Central
|
12.1
|
|
12.1
|
|
12.3
|
|
|||||
|
West North Central
|
10.6
|
|
10.7
|
|
10.8
|
|
|||||
|
Mountain
|
7.4
|
|
7.2
|
|
6.9
|
|
|||||
|
Western
|
16.4
|
|
16.0
|
|
15.4
|
|
|||||
|
Foreign (Principally Canada)
|
1.8
|
|
1.8
|
|
2.0
|
|
|||||
|
Total
|
100.0
|
%
|
100.0
|
%
|
100.0
|
%
|
|||||
(d) Reserves, Reinsurance, and Retrospective Adjustments.
Old Republic's insurance subsidiaries establish reserves for unearned premiums, reported claims, claims incurred but not reported, and claim adjustment expenses, as required in the circumstances. Such reserves are based on regulatory accounting requirements and generally accepted accounting principles. Claim reserves are based on estimates of the amounts that will be paid over a period of time and changes in such estimates are reflected in the financial statements of the periods during which they occur. See "General Insurance Claim Reserves" herein.
To maintain premium production within its capacity and limit maximum losses and risks for which it might become liable under its policies, Old Republic, as is the practice in the insurance industry, may cede a portion or all of its premiums and liabilities on certain classes of insurance, individual policies, or blocks of business to other insurers and reinsurers. Although the ceding of insurance does not generally discharge an insurer from its direct liability to a policyholder, it is industry practice to establish the reinsured part of risks as the liability of the reinsurer. Old Republic also employs retrospective premium adjustments and risk sharing arrangements for parts of its business in order to minimize losses for which it might become liable under its insurance policies, and to afford its customers or producers a degree of participation in the risks and rewards associated with such business. Under retrospective arrangements, Old Republic collects additional premiums if losses are greater than originally anticipated and refunds a portion of original premiums if loss costs are lower. Pursuant to risk sharing arrangements, the Company adjusts production costs or premiums retroactively to likewise reflect deviations from originally expected loss costs. The amount of premium, production costs and other retrospective adjustments which may be made is either limited or unlimited depending on the Company's evaluation of risks and related contractual arrangements. To the extent that any reinsurance companies, retrospectively rated risks, or producers might be unable to meet their obligations under existing reinsurance, retrospective insurance and production agreements, Old Republic would be liable for the defaulted amounts. In these regards, however, the Company generally protects itself by withholding funds, by securing indemnity agreements, by obtaining surety bonds, or by otherwise collateralizing such obligations through irrevocable letters of credit, cash, or securities.
The following table displays the Company's General Insurance liabilities reinsured by its ten largest reinsurers as of
December 31, 2016
.
16
|
Major General Insurance Balances Due from Reinsurers
|
||||||||||||||||||||
|
($ in Millions)
|
% of Total
|
|||||||||||||||||||
|
A.M.
|
Reinsurance Recoverable
|
Total
|
Consolidated
|
|||||||||||||||||
|
Best
|
on Paid
|
on Claim
|
Exposure
|
Reinsured
|
||||||||||||||||
|
Reinsurer
|
Rating
|
Claims
|
Reserves
|
to Reinsurer
|
Liabilities
|
|||||||||||||||
|
Munich Re America, Inc.
|
A+
|
$
|
21.0
|
|
$
|
382.5
|
|
$
|
403.6
|
|
14.5
|
%
|
||||||||
|
Swiss Reinsurance America Corporation
|
A+
|
4.6
|
|
206.8
|
|
211.5
|
|
7.6
|
|
|||||||||||
|
Archway Insurance, Ltd.
|
Unrated
|
—
|
|
177.7
|
|
177.7
|
|
6.4
|
|
|||||||||||
|
Hannover Ruckversicherungs
|
A+
|
2.1
|
|
169.8
|
|
171.9
|
|
6.2
|
|
|||||||||||
|
National WC Reinsurance Pool
|
Unrated
|
1.9
|
|
100.1
|
|
102.0
|
|
3.7
|
|
|||||||||||
|
AXIS Reinsurance Company
|
A+
|
—
|
|
95.6
|
|
95.6
|
|
3.4
|
|
|||||||||||
|
Trabaja Reinsurance Company
|
Unrated
|
1.7
|
|
93.3
|
|
95.0
|
|
3.4
|
|
|||||||||||
|
Summit Insurance Company, Ltd.
|
Unrated
|
—
|
|
81.5
|
|
81.6
|
|
2.9
|
|
|||||||||||
|
Global Vision II
|
Unrated
|
—
|
|
68.1
|
|
68.1
|
|
2.4
|
|
|||||||||||
|
Endurance Assurance Corporation
|
A
|
.3
|
|
64.7
|
|
65.0
|
|
2.3
|
|
|||||||||||
|
$
|
31.8
|
|
$
|
1,440.6
|
|
$
|
1,472.5
|
|
52.8
|
%
|
||||||||||
Reinsured liabilities of the RFIG Run-off Business, Title Insurance Group and small life and accident insurance operations are not material.
Reinsurance recoverable asset balances represent amounts due from or credited by assuming reinsurers for paid and unpaid claims and policy reserves. Such reinsurance balances that are recoverable from non-admitted foreign and certain other reinsurers such as captive insurance companies owned by assureds or business producers, as well as similar balances or credits arising from policies that are retrospectively rated or subject to assureds' high deductible retentions are substantially collateralized by letters of credit, securities, and other financial instruments. Old Republic evaluates on a regular basis the financial condition of its assuming reinsurers and assureds who purchase its retrospectively rated or high deductible policies. Estimates of unrecoverable amounts are included in the Company's net claim and claim expense reserves since reinsurance, retrospectively rated and self-insured deductible policies and contracts do not relieve Old Republic from its direct obligations to assureds or their beneficiaries.
Old Republic's reinsurance practices with respect to portions of its business also result from its desire to bring its sponsoring organizations and customers into some degree of joint venture or risk sharing relationship. The Company may, in exchange for a ceding commission, reinsure up to 100% of the underwriting risk, and the premium applicable to such risk, to insurers owned by or affiliated with lending institutions, financial and other intermediaries, and commercial institutions generally whose customers are insured by Old Republic, or individual customers who have formed captive insurance companies. The ceding commissions received compensate Old Republic for performing the direct insurer's functions of underwriting, actuarial, claim settlement, loss control, legal, reinsurance, and administrative services to comply with local and federal regulations, and for providing appropriate risk management services.
Remaining portions of Old Republic's business are reinsured in most instances with independent insurance or reinsurance companies pursuant to excess of loss agreements. Except as noted in the following paragraph, reinsurance protection on property and liability coverages generally limits the net loss on most individual claims to a maximum of:
$5.2 million
for workers' compensation;
$5.0 million
for commercial auto liability;
$5.0 million
for general liability;
$12.0 million
for executive protection (directors & officers and errors & omissions);
$2.0 million
for aviation; and
$5.0 million
for property coverages. Title insurance risk assumptions are generally limited to a maximum of
$500.0 million
as to any one policy. The vast majority of title policies issued, however, carry exposures of less than
$1.0 million
. An immaterial amount of the mortgage guaranty traditional primary risk in force is subject to lender sponsored captive reinsurance arrangements structured primarily on an excess of loss basis. All bulk and other mortgage guaranty insurance risk in force is retained. Exclusive of reinsurance, the average direct primary mortgage guaranty exposure is (in whole dollars)
$38,200
per insured loan.
Since January 1, 2005, the Company has had maximum reinsurance coverage of up to $200.0 million for its workers' compensation exposures. Pursuant to regulatory requirements, however, all workers' compensation primary insurers such as the Company remain liable for unlimited amounts in excess of reinsured limits. Other than the substantial concentration of workers' compensation losses caused by the September 11, 2001 terrorist attack on America, to the best of the Company's knowledge there had not been a similar accumulation of claims in a single location from a single occurrence prior to that event. Nevertheless, the possibility continues to exist that non-reinsured losses could, depending on a wide range of severity and frequency assumptions, aggregate several hundred million dollars to an insurer such as the Company. Such aggregation of losses could occur in the event of a catastrophe such as an earthquake that could lead to the death or injury of a large number of persons concentrated in a single facility such as a high rise building.
As a result of the September 11, 2001 terrorist attack on America, the reinsurance industry eliminated coverage from substantially all contracts for claims arising from acts of terrorism. Primary insurers like the Company thus became fully exposed to such claims. Late in 2002, the Terrorism Risk Insurance Act of 2002 (the "TRIA") was signed into law, immediately establishing a temporary federal reinsurance program administered by the Secretary of the Treasury. The program applied to insured commercial property and casualty losses resulting from an act of terrorism, as defined in the TRIA. Congress extended and modified the program in late 2005 through the Terrorism Risk Insurance Revision and
17
Extension Act of 2005 (the "TRIREA"). TRIREA expired on December 31, 2007. Congress enacted a revised program in December 2007 through the Terrorism Risk Insurance Program Reauthorization Act (the "TRIPRA") of 2007, a seven year extension that expired in December 2014. In January 2015, Congress passed the TRIPRA of 2015 that extended TRIPRA through 2020.
The TRIA automatically voided all policy exclusions which were in effect for terrorism related losses and obligated insurers to offer terrorism coverage with most commercial property and casualty insurance lines. The TRIREA revised the definition of "property and casualty insurance" to exclude commercial automobile, burglary and theft, surety, professional liability and farm owners multi-peril insurance. TRIPRA did not make any further changes to the definition of property and casualty insurance, however, it did include domestic acts of terrorism within the scope of the program. Although insurers are permitted to charge an additional premium for terrorism coverage, insureds may reject the coverage. Under TRIPRA, the program's protection is not triggered for losses arising from an act of terrorism until the industry first suffers losses in excess of a prescribed aggregate deductible during any one year. The program deductible trigger is $140 million, $160 million, $180 million, and $200 million for 2017, 2018, 2019, and 2020, respectively. Once the program trigger is met, TRIPRA will be responsible for a fixed percentage of the Company's terrorism losses that exceed its deductible which ranges from 85% for 2015 and declines by one percentage point per year until it reaches 80% in 2020. The Company's deductible amounts to 20% of direct earned premium on eligible property and casualty insurance coverages. The Company currently reinsures limits on a treaty basis of $195.0 million in excess of $5.0 million for claims arising from certain acts of terrorism for casualty clash and catastrophe workers' compensation liability insurance coverages. The Company also purchases facultative reinsurance on certain accounts in excess of $200.0 million to manage the Company's net exposures.
(e) Competition.
The insurance business is highly competitive and Old Republic competes with many stockholder-owned and mutual insurance companies. Many of these competitors offer more insurance coverages and have substantially greater financial resources than the Company. The rates charged for many of the insurance coverages in which the Company specializes, such as workers' compensation insurance, other property and liability insurance and title insurance, are primarily regulated by the states. The basic methods of competition available to Old Republic, aside from rates, are service to customers, expertise in tailoring insurance programs to the specific needs of its clients, efficiency and flexibility of operations, personal involvement by its key executives, and, as to title insurance, accuracy and timely delivery of evidences of title issued.
For certain types of coverages, including loan credit indemnity and mortgage guaranty insurance, the Company has historically competed in varying degrees with the Federal Housing Administration ("FHA") and the Veterans Administration ("VA"). Mortgage insurance companies also compete by providing contract underwriting services to lenders, enabling the latter to improve the efficiency of their operations by outsourcing all or part of their mortgage loan underwriting processes. As already noted, the Company ceased underwriting new mortgage guaranty insurance effective August 31, 2011. The underwriting of new CCI business ceased during 2008.
The Company believes its experience and expertise have enabled it to develop a variety of specialized insurance programs and related services for its customers, and to secure state insurance departments' approval of these programs.
(f) Government Regulation.
In common with all insurance companies, Old Republic's insurance subsidiaries are subject to the regulation and supervision of the jurisdictions in which they do business. The method of such regulation varies, but, generally, regulation has been delegated to state insurance commissioners who are granted broad administrative powers relating to: the licensing of insurers and their agents; the nature of and limitations on investments; approval of policy forms; reserve requirements; and trade practices. In addition to these types of regulation, many classes of insurance, including most of the Company's insurance coverages, are subject to rate regulations which require that rates be reasonable, adequate, and not unfairly discriminatory.
The majority of states have also enacted insurance holding company laws which require registration and periodic reporting by insurance companies controlled by other corporations licensed to transact business within their respective jurisdictions. Old Republic's insurance subsidiaries are subject to such legislation and are registered as controlled insurers in those jurisdictions in which such registration is required. Such legislation varies from state to state but typically requires periodic disclosure concerning the corporation which controls the registered insurers, or ultimate holding company, and all subsidiaries of the ultimate holding company, and prior approval of certain intercorporate transfers of assets (including payments of dividends in excess of specified amounts by the insurance subsidiary) within the holding company system. Each state has established minimum capital and surplus requirements to conduct an insurance business. At
December 31, 2016
each of the Company
’
s General, Title, and Life and Accident insurance subsidiaries exceeded the minimum statutory capital and surplus requirements. With regards to the mortgage guaranty insurance subsidiaries, refer to the discussion of the RFIG Run-off business in Item 1 (a).
(g) Employees.
As of
December 31, 2016
, Old Republic and its subsidiaries employed approximately
8,500
persons on a full time basis. Approximately
50%
of this total was represented by employees associated with the Company's title insurance segment. A majority of eligible full time employees participate in various pension plans (all of which are frozen) or other plans which provide benefits payable upon retirement. Eligible employees are also covered by hospitalization and major medical insurance, group life insurance, and various savings, profit sharing, and deferred compensation plans. The Company considers its employee relations to be good.
(h) Website access.
The Company files various reports with the U.S. Securities and Exchange Commission ("SEC"), including its annual report on Form 10-K, quarterly reports on Form 10-Q, current reports on Form 8-K, proxy statements, and amendments to those reports filed or furnished pursuant to Section 13(a) or 15(d) of the Exchange Act. The Company's filings are available for viewing and/or copying at the SEC's Public Reference Room located at 450 Fifth Street, NW.,
18
Washington, DC 20549. Information regarding the operation of the Public Reference Room can be obtained by calling 1-800-SEC-0330. The Company's reports are also available by visiting the SEC's internet website (http://www.sec.gov) and accessing its EDGAR database to view or print copies of the electronic versions of the Company's reports. Additionally, the Company's reports can be obtained, free of charge, by visiting its internet website (http://www.oldrepublic.com), selecting
Investors
then
SEC Filings
to view or print copies of the electronic versions of the Company's reports. The contents of the Company's internet website are not intended to be, nor should they be considered incorporated by reference in any of the reports the Company files with the SEC.
Risk factors are uncertainties and events over which the Company has limited or no control, and which can have a materially adverse effect on its business, results of operations or financial condition. The Company and its business segments are subject to a variety of such risk factors and, within individual segments, each type of insurance coverage may be exposed to risk factors specific to them. The following sections set forth management's evaluation of material risk factors for the Company as a whole and for each business segment. There may be risks which management does not presently consider to be material that may later prove to be material risk factors as well.
|
Parent Company
|
Dividend Dependence and Liquidity
The Company is an insurance holding company with no operations of its own. Substantially all of its assets consist of the business conducted by its insurance subsidiaries. It relies upon dividends from such subsidiaries in order to pay the interest and principal on its debt obligations, dividends to its shareholders, and corporate expenses. The extent to which the insurance subsidiaries are able to declare and pay dividends is subject to regulations under the laws of their states or foreign jurisdictions of domicile. The regulations limit dividends based on the amount of statutory adjusted unassigned surplus or statutory earnings, and require the insurance subsidiaries to maintain minimum amounts of capital, surplus and reserves. Dividends in excess of the ordinary limitations can only be declared and paid with prior regulatory approval, of which there can be no assurance. The inability of the insurance subsidiaries to pay dividends in an amount sufficient to meet the Company's debt service and cash dividends on stock, as well as other cash requirements could result in liquidity issues.
Capitalization
Apart from dividends and interest on intercompany financing arrangements from its subsidiaries, the Company has access to various capital and liquidity resources including holding company investments and the public debt and equity capital markets. The availability of all such capital sources cannot, however, be assured and its cost could be significant at the time capital is raised. At
December 31, 2016
, the Company's consolidated debt to equity ratio was
34.2%
.
Convertible Senior Notes and Senior Notes
Old Republic's
3.75%
Convertible Senior Notes, 4.875% Senior Notes, and 3.875% Senior Notes ("the Notes") contain provisions defining certain events of default, among them a court ordered proceeding due to the insolvency of a Significant Subsidiary. The Notes define Significant Subsidiary in accordance with paragraph (w) of Rule 1-02 of the SEC's Regulation S-X. The Company's flagship mortgage guaranty insurance carrier, RMIC qualifies as a Significant Subsidiary for purposes of the Notes. If RMIC were to become statutorily impaired, its insolvency could trigger a receivership proceeding which, in turn could ultimately result in an event of default. If this were to occur, the outstanding principal of the Notes could become immediately due and payable. Management believes the Final Order by the North Carolina Department of Insurance to RMIC has precluded such an event of default from occurring in the foreseeable future. Moreover, RMIC was statutorily solvent at
December 31, 2016
, and management has every expectation that its solvent state is likely to prevail. RMIC is expected to be an increasingly less significant subsidiary over time as its in force business declines.
|
Risk Factors Common to the Company and its Insurance Subsidiaries
|
Investment Risks
The Company’s investment portfolio consists primarily of highly rated debt securities and large capitalization common stocks. Its investments are subject to market-wide risks and fluctuations, as well as to risks inherent in particular securities. Changing or unprecedented market conditions could materially impact the future valuation of securities in its investment portfolio. This could cause the Company to impair the carrying value of some portion of those securities in the future. Volatility or illiquidity in the markets in which the Company holds positions may cause certain other-than-temporary impairments within its portfolio and thus lead to potentially significant adverse effects on the Company’s liquidity, financial condition and operating results.
Income from the Company’s investment portfolio is one of its primary sources of cash flow to support operations and claim payments. Should the Company improperly structure its investment portfolio to meet those future liabilities or should it have unexpected losses, including losses resulting from the forced liquidation of investments before their maturity or under adverse securities markets conditions, the Company could be unable to meet those obligations. The Company’s
19
investments and investment policies are subject to the provisions of state insurance laws, which results in its portfolio being predominantly limited to highly rated fixed income securities. Interest rates on fixed income securities are near historical lows. In the event that interest rates should rise above those of the Company’s fixed income securities, the market value of the Company’s investment portfolio would decline. Any significant decrease in the value of the Company’s investment portfolio could adversely impact its GAAP financial condition, but not necessarily the statutory financial condition of its insurance subsidiaries since their fixed maturities portfolio is generally stated at amortized cost from a regulatory standpoint.
Compared to historical averages, interest rates and investment yields on highly rated investments have generally declined, which has the effect of limiting the investment income the Company can generate. The Company depends on its investments as a source of revenue, and a prolonged period of low investment yields would have an adverse impact on its revenues and could potentially adversely affect its operating results.
The Company may be forced to change its investments or investment policies depending upon regulatory, economic and market conditions, thus affecting the existing or anticipated financial condition and operating needs, including the tax position, of its business. In such circumstances, the Company’s investment objectives may not be achieved. While the Company’s portfolio consists mostly of highly-rated investments and complies with applicable regulatory requirements, the success of its investment activity is affected by general economic conditions, which may adversely affect the markets for credit and interest-rate-sensitive securities, including the extent and timing of investor participation in these markets, the level and volatility of interest rates and, consequently, the value of fixed-income securities.
Excessive Losses and Loss Expenses
Although the Company's business segments encompass different types of insurance, the greatest risk factor common to all insurance coverages is excessive losses due to unanticipated claims frequency, severity or a combination of both. Many of the factors affecting the frequency and severity of claims depend upon the type of insurance coverage, but others are shared in common. Severity and frequency can be affected by changes in national economic conditions, unexpectedly adverse outcomes in claims litigation, often as a result of unanticipated jury verdicts, changes in court made law, adverse court interpretations of insurance policy provisions resulting in increased liability or new judicial theories of liability, together with unexpectedly high costs of defending claims.
Inadequate Reserves
Reserves are the amounts that an insurance company sets aside for its anticipated policy liabilities. Claim reserves are an estimate of liability for unpaid claims and claims defense and adjustment expenses, and cover both reported as well as incurred but not reported ("IBNR") claims. It is not possible to calculate precisely what these liabilities will amount to in advance and, therefore, the reserves represent a best estimate at any point in time. Such estimates are based upon known historical loss data, certain assumptions and expectations of future trends in claim frequency and severity, inflation and other economic considerations. The latter are affected by a variety of factors over which insurers have little or no control and which can be quite volatile.
Reserve estimates are periodically reviewed in light of known developments and, where necessary, they are adjusted and refined as circumstances may warrant. Nevertheless, the reserve setting process is inherently uncertain. If for any of these reasons reserve estimates prove to be inadequate, the Company's subsidiaries can be forced to increase their reported liabilities; such an occurrence could result in a materially adverse impact on their results of operations and financial condition.
Inadequate Pricing
Premium rates are generally determined on the basis of historical data for claim frequency and severity as well as related production and other expense patterns. In the event ultimate claims and expenses exceed historically projected levels, premium rates are likely to prove insufficient. Premium rate inadequacy may not become evident quickly, may require time to correct, and, much like excessive losses can affect adversely the Company's business, operating results and financial condition.
Liquidity Risk
As indicated above, the Company manages its fixed-maturity investments with a view toward matching the maturities of those investments with the anticipated liquidity needs of its subsidiaries for the payment of claims and expenses. If a subsidiary suddenly experienced greater-than-anticipated liquidity needs for any reason, it could require an injection of funds that might not necessarily be available to meet its obligations at a point in time. Alternatively, invested securities may need to be sold at a loss and thus impact adversely both financial condition and operating results.
Regulatory Environment
The Company's insurance businesses are subject to extensive governmental regulation under state laws in the U.S. and the laws of each of the few other jurisdictions outside the U.S. in which they operate. These regulations relate to such matters as licensing requirements, types of insurance products that may be sold, premium rates, marketing practices, capital and surplus requirements, investment limitations, underwriting limitations, dividend payment limitations, transactions with affiliates, accounting practices, taxation and other matters. While most of the regulation is at the state level in the U.S., the federal government has increasingly expressed an interest in regulating the insurance business and has injected itself through the Graham-Leach-Bliley Act, the Patriot Act, the Dodd-Frank Wall Street Reform and
20
Consumer Protection Act of 2009. Likewise, changes in the Internal Revenue Code and other regulations bear directly on the costs of conducting an insurance business through increased compliance expenses.
Apart from the rising costs of compliance, as existing regulations evolve through administrative and court interpretations, and as new regulations are adopted, there is no basis for predicting the impact that changes could have on the Company's businesses in the future. The impact could have a material adverse effect on the manner in which the company's subsidiaries do business, and or their ability to compete, to continue offering their existing products, or to pursue acquisitions and growth opportunities.
Competition
Each of the Company's lines of continuing insurance business is highly competitive and is likely to remain so for the foreseeable future. Moreover, existing competitors and the capital markets have from time to time brought an influx of capital and newly-organized entrants into the industry, and changes in laws have enabled financial institutions, like banks and savings and loans, to sell insurance products. Increases in competition threaten to reduce demand for the Company's insurance products, reduce its market share and growth prospects, and potentially reduce its profitability.
Exposure to Independent Rating Downgrades
The competitive positions of insurance companies in general have come to depend increasingly on independent ratings of their financial strength and claims-paying ability. The rating agencies base their ratings on criteria they establish regarding an insurer's financial strength, operating performance, strategic position and ability to meet its obligations to policyholders. A significant downgrade in the ratings of any of the Company's major policy-issuing subsidiaries could have a materially adverse effect on their ability to compete for new business and retain existing business and, as a result, their operating results and financial condition.
Financial Institutions Risk
The Company's subsidiaries have significant business relationships with financial institutions, particularly national banks. The subsidiaries are the beneficiaries of a considerable amount of security in the form of letters of credit and trusteed funds and investments which they hold as collateral securing the obligations of insureds and certain reinsurers. Some of the banks themselves have subsidiaries that reinsure the Company's business. Other banks are depositories holding large sums of money in escrow accounts established by the Company's title subsidiaries. There is thus a risk of concentrated financial exposures in one or more such banking institutions. If any of these institutions fail or are unable to honor their credit obligations, or if escrowed funds become lost or tied up due to the failure of a bank, the result could have a materially adverse effect on the Company's business, results of operations and financial condition.
Risk Management
The Company has established processes and procedures designed to identify, measure, analyze, monitor and report the types of risk the Company and its subsidiaries are subject to, including operational risk, market risk, credit risk, liquidity risk, investment risk, interest rate risk, legal risk and reputational risk, among others. There are inherent limitations in such processes and procedures, and as a result, there is always the possibility that the Company has not adequately identified or anticipated risks. Such inadequacies could lead to future unexpected losses or expenses.
Legal Risks
The Company and certain of its subsidiaries are from time to time named defendants or otherwise involved in various legal proceedings, including class actions and other litigation or arbitration proceedings with third parties, as well as proceedings by regulatory agencies. Any of these actions could result in judgments, settlements, fines or penalties which could materially adversely affect the Company's or its subsidiaries' business, financial condition or results of operations.
Acquisition Integration Risk
The Company has from time to time grown its business by acquisition and is likely to consider acquisitions in the future. There can never be any assurance that such acquisitions will have positive accretive results. Integration of an acquired business can be costly and complex. The integration of acquisitions already completed, as well as any that may be completed in the future could result in significant unanticipated costs or losses of one sort or another.
Attracting and Retaining Qualified Employees
The Company's and its subsidiaries' employees at all levels are among their most important assets. Should the Company and its subsidiaries for any reason be unable to attract and retain qualified employees, their performance could be materially adversely affected.
Information Technology Systems
The Company is dependent to a large degree on the successful functioning and security of its information technology systems to conduct its varied business operations. These systems are relied upon to communicate with producers and insureds, underwrite business, issue policies and process premiums, adjust and pay claims, and prepare financial analysis and reporting. A significant interruption or inability to access these systems or corruption of the data they house due to,
21
among other events, system failure, natural disaster, or cyber-attack could have a material effect on the Company's business and expose it to significant monetary and reputational damages.
In addition to the foregoing, the following are risk factors that are particular to each of the Company's three major business segments.
|
General Insurance Group
|
Catastrophic Losses
While the Company limits the property exposures it assumes, the casualty or liability insurance it underwrites creates an exposure to claims arising out of catastrophes. The two principal catastrophe exposures are earthquakes and acts of terrorism in areas where there are large concentrations of employees of an insured employer or other individuals who could potentially be injured and assert claims against an insured under workers' compensation policies. Collateral damage to property or persons from acts of terrorism and other calamities could also expose general liability policies.
Following the September 11, 2001 terrorist attack, the reinsurance industry eliminated coverage from substantially all reinsurance contracts for claims arising from acts of terrorism. As discussed elsewhere in this report, the U.S. Congress subsequently passed TRIA, TRIREA, and TRIPRA legislation that required primary insurers to offer coverage for certified acts of terrorism under most commercial property and casualty insurance policies. Although these programs established a temporary federal reinsurance program through December 31, 2020, primary insurers like the Company's general insurance subsidiaries retain significant exposure for terrorist act-related losses.
Long-Tailed Losses
Coverage for general liability is considered long-tailed coverage. Written in most cases on an "occurrence" basis, it often takes longer for covered claims to be reported and become known, adjusted and settled than it does for property claims, for example, which are generally considered short-tailed. The extremely long-tailed aspect of such claims as pollution, asbestos, silicosis, manganism (welding rod fume exposure), black lung, lead paint and other toxic tort claims, coupled with uncertain and sometimes variable judicial rulings on coverage and policy allocation issues along with the possibility of legislative actions, makes reserving for these exposures highly uncertain. While the Company believes that it has reasonably estimated its liabilities for such exposures to date, and that its exposures are relatively modest, there is a risk of materially adverse developments in both known and as-yet-unknown claims.
Workers' Compensation Coverage
Workers' compensation coverage is the largest line of insurance written by the Company's insurance subsidiaries. The frequency and severity of claims, and the adequacy of reserves for workers' compensation claims and expenses can all be significantly influenced by such risk factors as future wage inflation in states that index benefits, the speed with which injured employees are able to return to work in some capacity, the cost and rate of inflation in medical treatments, the types of medical procedures and treatments, the cost of prescription medications, the frequency with which closed claims reopen for additional or related medical issues, the mortality of injured workers with lifetime benefits and medical treatments, the use of health insurance to cover some of the expenses, the assumption of some of the expenses by states' second injury funds, the use of cost containment practices like preferred provider networks, and the opportunities to recover against third parties through subrogation. Adverse developments in any of these factors, if significant, could have a materially adverse effect on the Company's operating results and financial condition.
Reinsurance
Reinsurance is a contractual arrangement whereby one insurer (the reinsurer) assumes some or all of the risk exposure written by another insurer (the reinsured). The Company depends on reinsurance to manage its risks both in terms of the amount of coverage it is able to write, the amount it is able to retain for its own account, and the price at which it is able to write it. The availability of reinsurance and its price, however, are generally determined in the reinsurance market by conditions beyond the Company's control.
Reinsurance does not relieve the reinsured company of its primary liability to its insureds in the event of a loss. It merely reimburses the reinsured company. The ability and willingness of reinsurers to honor their counterparty obligations to the Company represent credit risks. Old Republic has no practical basis for evaluating the risks assumed by a reinsurer from sources other than its own. Those risks could result in a significant deterioration of the reinsurer's ability to honor its obligations to the Company, thereby exacerbating credit risk exposure.
Old Republic addresses these risks by limiting its reinsurance placements to those reinsurers it considers the best credit risks. In recent years, however, there has been an ever decreasing number of reinsurers so considered. There can be no assurance that the Company will be able to find the desired or even adequate amounts of reinsurance at favorable rates from acceptable reinsurers in the future. If unable to do so, the Company would be forced to reduce the volume of business it writes or retain increased amounts of liability exposure. Because of the declining number of acceptable reinsurers, there is a risk that too much reinsurance risk may become concentrated in too few reinsurers. These concentrations of risk could adversely affect the Company's business, results of operations, and financial condition.
22
Insureds as Credit Risks
A significant amount of Old Republic's liability and workers' compensation business, particularly for large commercial insureds, is written on the basis of risk sharing underwriting methods utilizing large deductibles, captive insurance risk retentions, or other arrangements whereby the insureds effectively retain and fund varying and at times significant amounts of their losses. Their financial strength and ability to pay are carefully evaluated as part of the underwriting process and monitored periodically thereafter, and their retained exposures are estimated and collateralized based on pertinent credit analysis and evaluation. Because the Company is primarily liable for losses incurred under its policies, the possible failure or inability of insureds to honor their retained liability represents a credit risk. Any subsequently developing shortage in the amount of collateral held would also be a risk, as would the failure or inability of a bank to honor a draw on a collateral trust or a letter of credit issued as collateral. These risk factors could have a materially adverse impact on the Company's results of operations and financial condition.
Guaranty Funds and Residual Markets
In nearly all states, licensed property and casualty insurers are required to participate in guaranty funds through assessments covering a portion of insurance claims against impaired or insolvent property and casualty insurers. Any increase in the number or size of impaired companies would likely result in an increase in the Company's share of such assessments.
Many states have established second injury funds that compensate injured employees for aggravation of prior injuries or conditions. These second injury funds are funded by assessments or premium surcharges.
Residual market or pooling arrangements exist in many states to provide various types of insurance coverage to those that are otherwise unable to find private insurers willing to insure them. All licensed property and casualty insurers writing such coverage voluntarily are required to participate in these residual market or pooling mechanisms.
A material increase in any of these assessments or charges could adversely affect the Company's results of operations and financial condition.
Prior Approval of Rates
Most of the lines of insurance underwritten by the Company are subject to prior regulatory approval of premium rates in a majority of the states. The process of securing regulatory approval can be time consuming and can impair the Company's ability to effect necessary rate increases in an expeditious manner. Furthermore, there is a risk that the regulators will not approve a requested increase, particularly in regard to workers' compensation insurance with respect to which rate increases often confront strong opposition from local business, organized labor, and political interests.
|
Title Insurance Group
|
Housing and Mortgage Lending Markets
The tightening and collapse of credit markets, the collapse of the housing market, the general decline in the value of real property, the rise in unemployment, and the uncertainty and negative trends in general economic conditions that began in 2006 created a difficult operating environment for the Company's title insurance subsidiaries. While these conditions have since improved to varying degrees, any return of these recessionary conditions could have a materially adverse effect on these subsidiaries' financial condition and results of operation over the near and longer terms. The impact of these conditions was somewhat mitigated both by lower mortgage interest rates, which lead to an increase in mortgage refinancings and by a rise in the number of agents producing business for the Companies' title insurance subsidiaries. Future rises in mortgage interest rates, however, could result in a decline in refinancing activity which, in turn, may result in reduced title insurance business.
Competition
Business comes to title insurers primarily by referral from real estate agents, lenders, developers and other settlement providers. The sources of business lead to a great deal of competition among title insurers. Although the top four title insurance companies during
2016
accounted for about
86%
of industry-wide premium volume, there are numerous smaller companies representing the remainder at the regional and local levels. The smaller companies are an ever-present competitive risk in the regional and local markets where their business connections can give them a competitive edge. Moreover, there is always competition among the major companies for key employees, especially those engaged in business production. Among the four largest national title insurers, the Company’s title insurance subsidiaries rely upon independent agencies to produce most of their business, whereas the other title insurers rely more on owned agencies. Independent agencies can direct business to any title insurer, whereas owned agencies will only direct business to their parent or affiliated title insurers. The Company’s title subsidiaries are therefore more vulnerable to a loss of business than are the other largest title companies.
Regulation and Litigation
Regulation is also a risk factor for title insurers. The title insurance industry has recently been, and continues to be, under regulatory scrutiny in a number of states with respect to pricing practices, and alleged RESPA violations and
23
unlawful rebating practices. The regulatory investigations could lead to industry-wide reductions in premium rates and escrow fees, the inability to get rate increases when necessary, as well as to changes that could adversely affect the Company's ability to compete for or retain business or raise the costs of additional regulatory compliance.
From time to time the Company's title insurance subsidiaries are named as defendants or are otherwise involved in various legal proceedings, including class actions and other litigated disputes with third parties, and proceedings or civil investigations brought by regulatory agencies. Any resulting adverse judgments, settlements, fines, penalties or other rulings could have, directly or indirectly, a material adverse effect on the Company's financial condition, results of operations or business reputation. Litigation or other disputes between the Company’s mortgage insurance subsidiaries and insured mortgage lenders could also have an adverse effect on the Company’s title insurance subsidiaries if, as a result, the lenders threatened to or discontinued accepting title insurance or title related services from the Company’s title insurers.
Other Risks
Inadequate title searches are among the risk factors faced by the entire industry. When the search is less than thorough or complete, title defects can go undetected and claims result.
Fraud is also a risk factor for all title companies -- sometimes in the form of an agent's or an employee's defalcation of escrowed funds, sometimes in the form of fraudulently issued title insurance policies.
|
RFIG Run-off Business
|
Mortgage Guaranty Business in Run-off; Possible Material Losses, Statutory Capital Impairment, and Receivership
The material increases in mortgage guaranty insurance claims and loss payments that began in 2007 gradually depleted RMIC's statutory capital base and forced it to discontinue writing new business in 2011. The insurance laws of
16
jurisdictions, including RMIC and RMICNC’s domiciliary state of North Carolina, require a mortgage insurer to maintain a minimum amount of statutory capital relative to risk in force (or a similar measure) in order to continue to write new business. The formulations currently allow for a maximum risk-to-capital ratio of
25
to
1
, or alternatively stated, a “minimum policyholder position” (“MPP”) of one-twenty-fifth of the total risk in force. The failure to maintain the prescribed minimum capital level in a particular state generally requires a mortgage insurer to immediately stop writing new business until it reestablishes the required level of capital or receives a waiver of the requirement from a state's insurance regulatory authority. RMIC breached the minimum capital requirement during the third quarter of 2010. RMIC had previously requested and, subsequently received waivers or forbearance of the minimum policyholder position requirements from the regulatory authorities in substantially all affected states. Following several brief extensions, the waiver from its domiciliary state of North Carolina expired on August 31, 2011, and RMIC and its sister company, RMICNC, discontinued writing new business in all states and limited themselves to servicing the run-off of their existing business. They were placed under administrative supervision by the North Carolina Department of Insurance ("NCDOI") the following year and ultimately ordered to defer the payment of
40%
of all settled claims as a deferred payment obligation ("DPO").
On July 1, 2014, the NCDOI issued a Final Order approving an Amended and Restated Corrective Plan (the "Amended Plan") submitted jointly on April 16, 2014, by RMIC and RMICNC. Under the Amended Plan, RMIC and RMICNC were authorized to pay
100%
of their DPOs accrued as of June 30, 2014, and to settle all subsequent valid claims entirely in cash, without establishing any DPOs. In anticipation of receiving this Final Order, ORI invested
$125.0 million
in cash and securities to RMIC in June 2014. In mid-July 2014, in furtherance of the Final Order, RMIC and RMICNC processed payments of their accumulated DPO balances of approximately
$657.0 million
relating to fully settled claims charged to periods extending between January 19, 2012 and June 30, 2014. Both subsidiaries remain under the supervision of the NCDOI as they continue to operate in run-off mode. The approval of the Amended Plan notwithstanding, the NCDOI retains its regulatory supervisory powers to review and amend the terms of the Amended Plan in the future as circumstances may warrant.
RMIC has continually evaluated the potential long-term underwriting performance of the run-off book of business based on various modeling techniques. The resulting models take into account actual premium and paid claim experience of prior periods, together with a large number of assumptions and judgments about future outcomes that are highly sensitive to a wide range of estimates. Many of these estimates and underlying assumptions relate to matters over which the Company has no control, including: 1) The conflicted interests, as well as the varying mortgage servicing and foreclosure practices of a large number of insured lending institutions; 2) General economic and industry-specific trends and events; and 3) The evolving or future social and economic policies of the U.S. Government vis-à-vis such critical sectors as the banking, mortgage lending, and housing industries, as well as its policies for resolving the insolvencies and assigning a possible future role to Fannie Mae and Freddie Mac.
There can be no assurance that RMIC and RMICNC will emerge from the run-off as solvent companies or that the conditions or the duration of the run-off of their business will remain unchanged or that they will remain under supervision.
Premium Income and Long-Term Claim Exposures
Mortgage insurers such as the Company issue long duration, guaranteed renewable policies covering multi-year periods during which exposure to loss exists. Loss exposures typically manifest themselves as recurring losses usually concentrated between the second and fifth year following issuance of any one year's new policies. Additionally, the
24
policies cover catastrophic aggregations of claims such as those that occurred during the Great Recession of 2007 to 2012 which was engendered by substantial market dislocations in the housing and mortgage lending industries.
The Company's mortgage guaranty premiums stem principally from monthly installment policies. Substantially all such premiums are generally written and earned in the month coverage is effective. Recognition of claim costs, however, occurs only after an insured mortgage loan has missed two or more consecutive monthly payments. Accordingly, GAAP revenue recognition is not appropriately matched to the risk exposure and the consequent recognition of both normal and, most significantly, future catastrophic loss occurrences. As a result, mortgage guaranty GAAP earnings for any individual year or series of years may be materially adversely affected, particularly by cyclical catastrophic loss events such as the mortgage insurance industry experienced between 2007 and 2012. Reported GAAP earnings and financial condition form, in part, the basis for significant judgments and strategic evaluations made by management, analysts, investors, and other users of the financial statements issued by mortgage guaranty companies. The risk exists that such judgments and evaluations are at least partially based on GAAP financial information that does not match revenues and expenses and is not reflective of the long-term normal and catastrophic risk exposures assumed by mortgage guaranty insurers at any point in time. This risk is inherent in the models on which the run-off of RMIC's and RMICNC's business is based.
Inadequate Loss Reserves
The Company establishes reserves for losses and loss adjustment expenses for its mortgage and consumer credit indemnity insurance coverages based upon loans reported to be in default, as well as estimates of those in default but not yet reported. The reserves are best estimates by management and take into consideration its judgments and assumptions regarding the housing and mortgage markets, unemployment rates and economic trends in general. During the ongoing sustained economic downturn, loss reserve estimates have become subject to even greater uncertainty and volatility. The rate and severity of actual losses could prove to be greater than expected and require the Company to effect substantial increases in its loss reserves. Depending upon the magnitude, such increases could have a materially adverse impact on the Company's mortgage insurance and consumer credit indemnity insurance run-off business and the Company's consolidated results of operations and financial condition. There can be no assurance that the actual losses for the mortgage insurance and consumer credit indemnity coverages will not be materially greater than previously established loss reserves.
Fewer Coverage Rescissions
The Company may rescind its mortgage guaranty and consumer credit indemnity coverages whenever it finds evidence that a loan did not qualify for insurance coverage in the first instance, or that a material misrepresentation had been made in the loan application by the borrower, the lender, and/or its agent. Between 2008 and 2010 the number and rate of coverage rescissions and claim denials rose dramatically. As a result, rescissions reduced materially the percentage of approved claims, and loss reserving estimates have reflected assumptions about the levels of rescission activity. Since 2010 the number and rate of rescissions and denials has continued to decline.
Certain policyholders who have experienced high rates of coverage rescission instituted litigation or arbitration proceedings challenging the Company's position on rescissions. Whether the current rescission rates continue or decline, it is possible that further litigation or arbitral challenges to the Company's rescissions of coverage could arise. If any of the challenges are successful, they could have a materially adverse effect on the Company's mortgage guaranty and/or consumer credit indemnity run-off insurance business and consolidated operating results and financial position. Even if such challenges should prove unsuccessful, the costs of addressing them through litigation could be substantial.
None
The principal executive offices of the Company are located in the Old Republic Building in Chicago, Illinois. This Company-owned building contains 151,000 square feet of floor space of which approximately
47%
is occupied by Old Republic, and the remainder is leased to others. In addition to its Chicago building, the Company owns one other major office building. A subsidiary of the Title Insurance Group partially occupies its owned operations headquarters building in Minneapolis, Minnesota. This building contains 110,000 square feet of floor space of which approximately
91%
is occupied by the Title Insurance Group, and the remainder is leased to others.
Six
smaller buildings are owned by Old Republic and its subsidiaries in various parts of the nation and are primarily used for its business. The carrying value of all owned buildings and related land at
December 31, 2016
was
$49.2
million.
Certain other operations of the Company and its subsidiaries are directed from leased premises. See Note 4(b) of the Notes to Consolidated Financial Statements for a summary of all material lease obligations.
Legal proceedings against the Company and its subsidiaries routinely arise in the normal course of business and usually pertain to claim matters related to insurance policies and contracts issued by its insurance subsidiaries. Other, non-routine legal proceedings which may prove to be material to the Company or a subsidiary are discussed below.
25
On December 19, 2008, Old Republic Insurance Company and Republic Insured Credit Services, Inc., ("Old Republic") filed suit against Countrywide Bank FSB, Countrywide Home Loans, Inc. ("Countrywide") and Bank of New York Mellon, BNY Mellon Trust of Delaware ("BNYM") in the Circuit Court, Cook County, Illinois (
Old Republic Insurance Company, et al.
v.
Countrywide Bank FSB, et al.
) seeking rescission of various credit indemnity policies issued to insure home equity loans and home equity lines of credit which Countrywide had securitized or held for its own account, a declaratory judgment and money damages based upon systemic material misrepresentations and fraud by Countrywide as to the credit characteristics of the loans or by the borrowers in their loan applications. Countrywide filed a counterclaim alleging a breach of contract, bad faith and seeking a declaratory judgment challenging the factual and procedural bases that Old Republic had relied upon to deny or rescind coverage for individual defaulted loans under those policies, as well as unspecified compensatory and punitive damages. The Court ruled that Countrywide does not have standing to counterclaim with respect to the policies insuring the securitized loans because those policies were issued to BNYM. In response, Countrywide and BNYM jointly filed a motion asking the Court to allow an amended counterclaim in which BNYM would raise substantially similar allegations as those raised by Countrywide and make substantially similar requests but with respect to the policies issued to BNYM. The Court dismissed their motion, with leave to re-plead the counterclaim. BNYM's subsequent attempt to re-plead was granted by the Court and BNYM has re-pleaded its counterclaim. Pursuant to a revised case management order, a multi-phase trial is set to begin September 25, 2017.
On December 30, 2011 and on January 4, 2013, purported class action suits alleging RESPA violations were filed in the Federal District Court, for the Eastern District of Pennsylvania targeting RMIC, other mortgage guaranty insurance companies, PNC Financial Services Group (as successor to National City Bank) and HSBC Bank USA, N.A., and their wholly-owned captive insurance subsidiaries. (
White, Hightower, et al.
v.
PNC Financial Services Group (as successor to National City Bank) et al.
), (
Ba, Chip, et al.
v.
HSBC Bank USA, N.A., et al.
). The lawsuits are two of twelve against various lenders, their captive reinsurers and the mortgage insurers, filed by the same law firms. All of these lawsuits were substantially identical in alleging that the mortgage guaranty insurers had reinsurance arrangements with the defendant banks' captive insurance subsidiaries under which payments were made in violation of the anti-kickback and fee splitting prohibitions of Sections 8(a) and 8(b) of RESPA. Ten of the twelve suits have been dismissed. A class has not been certified in either remaining suit. Those two remaining suits seeking unspecified damages, costs, fees and the return of the allegedly improper payments were settled with an agreement to make nominal payments.
Ba
has been dismissed with prejudice and
White
is awaiting the Court's dismissal.
On October 9, 2014, Intellectual Ventures I LLC and Intellectual Ventures II LLC (collectively, "IV") served a complaint naming as defendants Old Republic National Title Insurance Company, Old Republic Title Insurance Group, Inc., Old Republic Insurance Company and Old Republic General Insurance Group, Inc. (collectively, "Old Republic")(
Intellectual Ventures I LLC et al.
v.
Old Republic General Insurance Group, Inc. et al
.). The lawsuit was brought in the United States District Court for the Western District of Pennsylvania. IV alleged that Old Republic has infringed three patents and sought damages, costs, expenses, and pre-judgment and post-judgment interest for the alleged infringement, in addition to injunctive relief. On October 14, 2014, Old Republic filed a motion to dismiss each count of the complaint on the grounds that the patents fail to meet the patentability test established by the United States Supreme Court in
Alice Corp. Pty. Ltd.
v.
CLS Bank
, 134 S.Ct. 2347 (2014). The Court granted Old Republic’s motion to dismiss on all three patents on September 25, 2015. Concurrently, Old Republic filed
inter partes
review petitions challenging validity of the patents before the United States Patent & Trademark Office ("USPTO") in late September and early October, 2015. In late October, 2015, IV filed notice of its appeal of the District Court’s dismissal of its claims. The appeal has been argued before the United States Court of Appeal for the Federal Circuit and a decision is pending. The Patent Trial and Appeal Board ("PTAB") of the USPTO has accepted the petitions challenging the validity of all three patents and has until early April, 2017, to rule.
On January 20, 2015, Intellectual Ventures II LLC filed two complaints in the United States District Court for the Eastern District of Texas naming as defendants Great West Casualty Company and BITCO General Insurance Corporation and BITCO National Insurance Company. (
Intellectual Ventures II LLC
v.
Great West Casualty Company
) and (
Intellectual Ventures II LLC
v.
BITCO General Insurance Corporation et al.
) The plaintiff alleges a single patent infringement and seeks damages, costs, expenses, and pre-judgment and post-judgment interest in addition to injunctive relief. On April 9, 2015, plaintiff amended each complaint to allege a second patent infringement claim. The District Court set a trial date in September, 2016. In August and September, 2015, Great West and BITCO filed
inter partes
review petitions challenging the validity of claims under the patents before the PTAB. Both petitions were accepted for review. On May 11, 2016, the parties filed a stipulation of dismissal on one of the patent infringement claims in the District Court. On June 29, 2016, IV disclaimed all claims it asserted against Great West and BITCO on that patent and, accordingly, the
inter partes
review was terminated by the PTAB. With respect to the remaining single patent infringement claim, on May 12, 2016, the District Court issued a stay on the suit until such time as the PTAB issues its ruling on the
inter partes
review. On January 17, 2017, the PTAB issued its ruling, finding all but one claim under the patent to be unpatentable. Further, on February 6, 2017, noting that a separate
inter partes
review for all claims under the patent, including the single claim remaining in the BITCO and Great West lawsuits, is ongoing between IV and another party, the District Court extended the stay until January 20, 2018.
On July 5, 2016, Ocwen Loan Servicing, LLC and Homeward Residential, Inc. (collectively, "Ocwen") filed an amendment to an initial complaint against Republic Mortgage Insurance Company and Republic Mortgage Insurance Company of North Carolina (collectively, "RMIC"). The suit, which is captioned
Ocwen et al. v. RMIC et al.,
is pending in the General Court of Justice, Superior Court Division for Forsyth County, North Carolina. The amendment for the first time identifies specific mortgage insurance certificates as to which Ocwen alleges breaches of contract, bad faith and violations of certain fair claims settlement practices laws and seeks declaratory relief in regard to certain claims handling practices on future claims. RMIC believes the suit is without merit and intends to defend vigorously.
Under GAAP, an estimated loss is accrued only if the loss is probable and reasonably estimable. The Company and its subsidiaries have defended and intend to continue defending vigorously against each of the aforementioned actions.
26
The Company does not believe it probable that any of these actions will have a material adverse effect on its consolidated financial position, results of operations or cash flows, though there can be no assurance in those regards. The Company has made an estimate of its potential liability under certain of these lawsuits and the counterclaim, all of which seek unquantified damages, attorneys' fees and expenses. Because of the uncertainty of the ultimate outcomes of the aforementioned disputes, additional costs may arise in future periods beyond the Company's current reserves. It is also unclear what effect, if any, the run-off operations of RMIC and its limited capital will have in the actions against it.
Not applicable.
The Company's common stock is traded on the New York Stock Exchange under the symbol "ORI". The high and low sales prices as reported on the New York Stock Exchange and cash dividends declared for each quarterly period during the past two years were as follows:
|
Sales Price
|
Cash
|
|||||||||||
|
High
|
Low
|
Dividends
|
||||||||||
|
1st quarter
|
2015
|
$
|
15.30
|
|
$
|
13.59
|
|
$
|
.1850
|
|
||
|
2nd quarter
|
2015
|
16.24
|
|
14.75
|
|
.1850
|
|
|||||
|
3rd quarter
|
2015
|
16.90
|
|
14.86
|
|
.1850
|
|
|||||
|
4th quarter
|
2015
|
$
|
19.11
|
|
$
|
15.24
|
|
$
|
.1850
|
|
||
|
1st quarter
|
2016
|
$
|
18.74
|
|
$
|
17.09
|
|
$
|
.1875
|
|
||
|
2nd quarter
|
2016
|
19.36
|
|
17.75
|
|
.1875
|
|
|||||
|
3rd quarter
|
2016
|
20.00
|
|
17.55
|
|
.1875
|
|
|||||
|
4th quarter
|
2016
|
$
|
19.22
|
|
$
|
16.51
|
|
$
|
.1875
|
|
||
As of
January 31, 2017
, there were
2,180
registered holders of the Company's Common Stock. See Note 3(c) of the Notes to Consolidated Financial Statements for a description of certain regulatory restrictions on the payment of dividends by Old Republic's insurance subsidiaries.
Comparative Five Year Performance Graphs for Common Stock
The following tables, prepared on the basis of market and related data furnished by Standard & Poor's Total Return Service, reflects total market return data for the most recent five calendar years ended
December 31, 2016
. For purposes of the presentation, the information is shown in terms of $100 invested at the close of trading on the last trading day preceding the first day of the fifth preceding year. The $100 investment is deemed to have been made either in Old Republic Common Stock, in the S&P 500 Index of common stocks, or in an aggregate of the common shares of the Peer Group of publicly held insurance businesses selected by Old Republic. The cumulative total return assumes reinvestment of cash dividends on a pretax basis. The information utilized to prepare the following tables has been obtained from sources believed to be reliable, but no representation is made that it is accurate or complete in all respects.
Total return data is shown in two tables. The table for Peer Group 1 consists of the following publicly held corporations selected by the Company for its 2011 to 2016 comparison: American Financial Group, Inc., American International Group, Inc., Chubb Limited, Cincinnati Financial Corporation, Fidelity National Financial, Inc., First American Financial Corporation, Markel Corporation, Stewart Information Services Corporation, Travelers Companies, Inc., and XL Group Plc.
The Peer Group 2 table is included for comparative purposes. It consists of the following publicly held corporations selected by the Company for its 2010 to 2015 comparison as included in its 2015 Annual Report on Form 10-K: American Financial Group, Inc., Chubb Limited, (formally Ace Ltd., which changed its name to Chubb Limited upon completion of its acquisition of the Chubb Corporation), Cincinnati Financial Corporation, Fidelity National Financial, Inc., First American Financial Corporation, Markel Corporation, Stewart Information Services Corporation, Travelers Companies, Inc., and XL Group Plc. Peer Group 2 is comprised of the same companies as in Peer Group 1 except that American International Group, Inc. replaced The Chubb Corporation.
The composition of the Peer Group companies has been approved by the Compensation Committee.
27
Comparison of Five Year Total Market Return
OLD REPUBLIC INTERNATIONAL CORPORATION vs. S&P 500 vs. Peer Group 1
(For the five years ended
December 31, 2016
)
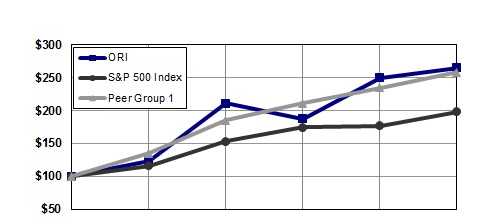
|
Dec 11
|
Dec 12
|
Dec 13
|
Dec 14
|
Dec 15
|
Dec 16
|
||||||||||||||||||
|
ORI
|
$
|
100.00
|
|
$
|
123.84
|
|
$
|
210.94
|
|
$
|
187.43
|
|
$
|
249.84
|
|
$
|
265.04
|
|
|||||
|
S&P 500
|
100.00
|
|
116.00
|
|
153.57
|
|
174.60
|
|
177.01
|
|
198.18
|
|
|||||||||||
|
Peer Group
|
100.00
|
|
134.96
|
|
185.19
|
|
211.08
|
|
234.55
|
|
258.43
|
|
|||||||||||
Comparison of Five Year Total Market Return
OLD REPUBLIC INTERNATIONAL CORPORATION vs. S&P 500 vs. Peer Group 2
(For the five years ended
December 31, 2016
)
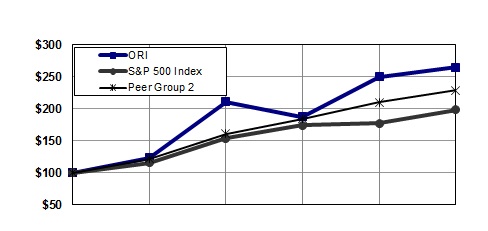
|
Dec 11
|
Dec 12
|
Dec 13
|
Dec 14
|
Dec 15
|
Dec 16
|
||||||||||||||||||
|
ORI
|
$
|
100.00
|
|
$
|
123.84
|
|
$
|
210.94
|
|
$
|
187.43
|
|
$
|
249.84
|
|
$
|
265.04
|
|
|||||
|
S&P 500
|
100.00
|
|
116.00
|
|
153.57
|
|
174.60
|
|
177.01
|
|
198.18
|
|
|||||||||||
|
Peer Group
|
100.00
|
|
121.67
|
|
160.62
|
|
184.64
|
|
210.29
|
|
229.20
|
|
|||||||||||
28
|
|
||||||||||||||||||||||||
|
December 31:
|
2016
|
2015
|
2014
|
2013
|
2012
|
|||||||||||||||||||
|
FINANCIAL POSITION:
|
||||||||||||||||||||||||
|
Cash and Invested Assets (a)
|
$
|
12,995.8
|
|
$
|
11,475.5
|
|
$
|
11,291.6
|
|
$
|
11,109.1
|
|
$
|
10,800.6
|
|
|||||||||
|
Other Assets (c)
|
5,595.7
|
|
5,626.1
|
|
5,685.2
|
|
5,417.5
|
|
5,416.6
|
|
||||||||||||||
|
Total Assets
|
$
|
18,591.6
|
|
$
|
17,101.6
|
|
$
|
16,976.9
|
|
$
|
16,526.7
|
|
$
|
16,217.3
|
|
|||||||||
|
Liabilities, Other than Debt
|
$
|
12,591.1
|
|
$
|
12,267.8
|
|
$
|
12,099.0
|
|
$
|
12,190.1
|
|
$
|
12,057.6
|
|
|||||||||
|
Debt (c)
|
1,528.7
|
|
952.8
|
|
953.7
|
|
561.6
|
|
563.4
|
|
||||||||||||||
|
Total Liabilities
|
14,119.9
|
|
13,220.7
|
|
13,052.8
|
|
12,751.7
|
|
12,621.0
|
|
||||||||||||||
|
Preferred Stock
|
—
|
|
—
|
|
—
|
|
—
|
|
—
|
|
||||||||||||||
|
Common Shareholders' Equity
|
4,471.6
|
|
3,880.8
|
|
3,924.0
|
|
3,775.0
|
|
3,596.2
|
|
||||||||||||||
|
Total Liabilities and Shareholders' Equity
|
$
|
18,591.6
|
|
$
|
17,101.6
|
|
$
|
16,976.9
|
|
$
|
16,526.7
|
|
$
|
16,217.3
|
|
|||||||||
|
Total Capitalization (b)
|
$
|
6,000.4
|
|
$
|
4,833.7
|
|
$
|
4,877.8
|
|
$
|
4,336.6
|
|
$
|
4,159.6
|
|
|||||||||
|
Years Ended December 31:
|
2016
|
2015
|
2014
|
2013
|
2012
|
|||||||||||||||||||
|
RESULTS OF OPERATIONS:
|
||||||||||||||||||||||||
|
Net Premiums and Fees Earned
|
$
|
5,333.2
|
|
$
|
5,179.4
|
|
$
|
4,811.1
|
|
$
|
4,885.6
|
|
$
|
4,471.0
|
|
|||||||||
|
Net Investment and Other Income
|
494.3
|
|
495.4
|
|
447.1
|
|
408.9
|
|
451.1
|
|
||||||||||||||
|
Realized Investment Gains (Losses)
|
72.8
|
|
91.3
|
|
272.3
|
|
148.1
|
|
47.8
|
|
||||||||||||||
|
Net Revenues
|
5,900.5
|
|
5,766.1
|
|
5,530.7
|
|
5,442.7
|
|
4,970.1
|
|
||||||||||||||
|
Benefits, Claims, and
|
||||||||||||||||||||||||
|
Settlement Expenses
|
2,347.9
|
|
2,459.3
|
|
2,514.5
|
|
2,238.3
|
|
2,765.3
|
|
||||||||||||||
|
Underwriting and Other Expenses
|
2,866.5
|
|
2,675.0
|
|
2,406.6
|
|
2,531.3
|
|
2,333.3
|
|
||||||||||||||
|
Pretax Income (Loss)
|
686.0
|
|
631.8
|
|
609.4
|
|
672.9
|
|
(128.5
|
)
|
||||||||||||||
|
Income Taxes (Credits)
|
219.0
|
|
209.6
|
|
199.7
|
|
225.0
|
|
(59.8
|
)
|
||||||||||||||
|
Net Income (Loss)
|
$
|
466.9
|
|
$
|
422.1
|
|
$
|
409.7
|
|
$
|
447.8
|
|
$
|
(68.6
|
)
|
|||||||||
|
COMMON SHARE DATA:
|
||||||||||||||||||||||||
|
Net Income (Loss):
|
||||||||||||||||||||||||
|
Basic
|
$
|
1.80
|
|
$
|
1.63
|
|
$
|
1.58
|
|
$
|
1.74
|
|
$
|
(.27
|
)
|
|||||||||
|
Diluted
|
$
|
1.62
|
|
$
|
1.48
|
|
$
|
1.44
|
|
$
|
1.57
|
|
$
|
(.27
|
)
|
|||||||||
|
Dividends:
Cash
|
$
|
.75
|
|
$
|
.74
|
|
$
|
.73
|
|
$
|
.72
|
|
$
|
.71
|
|
|||||||||
|
Book Value
|
$
|
17.20
|
|
$
|
15.02
|
|
$
|
15.15
|
|
$
|
14.64
|
|
$
|
14.03
|
|
|||||||||
|
Common Shares (thousands):
|
||||||||||||||||||||||||
|
Outstanding
|
259,906
|
258,459
|
259,012
|
257,937
|
256,392
|
|||||||||||||||||||
|
Average: Basic
|
259,429
|
259,502
|
258,553
|
257,443
|
255,812
|
|||||||||||||||||||
|
Diluted
|
296,379
|
296,088
|
295,073
|
293,684
|
255,812
|
|||||||||||||||||||
__________
|
(a)
|
Consists of cash, investments and accrued investment income.
|
|
(b)
|
Total capitalization consists of debt, preferred stock, and common shareholders' equity.
|
|
(c)
|
Certain debt amounts have been reduced due to the reclassification of relatively immaterial debt issuance costs previously classified as deferred assets, in order to comply with a 2015 pronouncement by the Financial Accounting Standards Board (FASB).
|
29
($ in Millions, Except Share Data)
|
OVERVIEW
|
This management analysis of financial position and results of operations pertains to the consolidated accounts of Old Republic International Corporation ("Old Republic", "ORI" or "the Company"). The Company conducts its operations principally through three major regulatory segments, namely, its General (property and liability), Title, and the RFIG (mortgage guaranty and consumer credit indemnity) Run-off Business. A small life and accident insurance business, accounting for
.4%
of consolidated operating revenues for the year ended
December 31, 2016
and
.9%
of consolidated assets as of that date, is included within the corporate and other caption of this report.
The consolidated accounts are presented in conformity with the Financial Accounting Standards Board's ("FASB") Accounting Standards Codification ("ASC") of accounting principles generally accepted in the United States of America ("GAAP"). As a publicly held company, Old Republic utilizes GAAP largely to comply with the financial reporting requirements of the Securities and Exchange Commission ("SEC"). From time to time the FASB and the SEC issue various releases, most of which require additional financial statement disclosures and provide related application guidance. Of particular relevance to the Company's financial statements is guidance recently issued by the FASB relative to short-duration insurance contracts, revenue recognition, recognition and measurement of financial instruments, lease accounting, simplification of certain aspects of accounting for share-based payment award transactions, and accounting for credit losses on financial instruments, all of which are discussed further in the Notes to Consolidated Financial Statements.
As a state regulated financial institution vested with the public interest, however, business of the Company's insurance subsidiaries is managed pursuant to the laws, regulations, and accounting practices of the various states in the U.S. and those of a small number of other jurisdictions outside the U.S. in which they operate. In comparison with GAAP, the statutory accounting practices reflect greater conservatism and comparability among insurers, and are intended to address the primary financial security interests of policyholders and their beneficiaries. Additionally, these practices also affect a significant number of important factors such as product pricing, risk bearing capacity and capital adequacy, the determination of Federal income taxes payable currently among ORI's tax-consolidated entities, and the upstreaming of dividends by insurance subsidiaries to the parent holding company. The major differences between these statutory financial accounting practices and GAAP are summarized in Note 1(a) to the consolidated financial statements included elsewhere in this report.
The insurance business is distinguished from most others in that the prices (premiums) charged for various insurance products are set without certainty of the ultimate benefit and claim costs that will emerge or be incurred, often many years after issuance and expiration of a policy. This basic fact casts Old Republic as a risk-taking enterprise managed for the long run. Management therefore conducts the business with a primary focus on achieving favorable underwriting results over cycles, and on the maintenance of financial soundness in support of the insurance subsidiaries' long-term obligations to insurance beneficiaries. To achieve these objectives, adherence to insurance risk management principles is stressed, and asset diversification and quality are emphasized.
In addition to income arising from Old Republic's basic underwriting and related services functions, significant investment income is earned from invested funds generated by those functions and from shareholders' capital. Investment management aims for stability of income from interest and dividends, protection of capital, and for sufficiency of liquidity to meet insurance underwriting and other obligations as they become payable in the future. Securities trading and the realization of capital gains are not objectives. The investment philosophy is therefore best characterized as emphasizing value, credit quality, and relatively long-term holding periods. The Company's ability to hold both fixed maturity and equity securities for long periods of time is in turn enabled by the scheduling of maturities in contemplation of an appropriate matching of assets and liabilities, and by investments in large capitalization, highly liquid equity securities.
In light of the above factors, the Company's affairs are managed for the long run and without significant regard to the arbitrary strictures of quarterly or even annual reporting periods that American industry must observe. In Old Republic's view, such short reporting time frames do not comport well with the long-term nature of much of its business. Management therefore believes that the Company's operating results and financial condition can best be evaluated by observing underwriting and overall operating performance trends over succeeding five- or preferably ten-year intervals. A ten-year period in particular can likely encompass at least one economic and/or underwriting cycle and thereby provide an appropriate time frame for such cycle to run its course, and for premium rate changes and reserved claim costs to be quantified and emerge in financial results with greater finality and effect.
This management analysis should be read in conjunction with the consolidated financial statements and the footnotes appended to them.
30
|
EXECUTIVE SUMMARY
|
Pretax operating income comparisons with 2015 were marked by relatively stable general insurance performance, by record-setting title insurance earnings, and by better underwriting results in the RFIG run-off segment. 2016 consolidated net income, however, grew at a slower pace as realized investment gains were lower than prior year levels. 2015's pretax operating income, by comparison to 2014, was enhanced by greater General Insurance underwriting and investment income, and by the then record-setting full year performance of Old Republic’s Title Insurance business. 2015 consolidated net income, however, was affected by lower realized gains from sales of investment securities in comparison with the substantial gains registered in 2014. The segmented components of consolidated results and related data are summarized in the following table.
|
Financial Highlights
|
||||||||||||||||||||
|
% Change
|
||||||||||||||||||||
|
2016
|
2015
|
|||||||||||||||||||
|
Years Ended December 31:
|
2016
|
2015
|
2014
|
vs. 2015
|
vs. 2014
|
|||||||||||||||
|
Operating revenues:
|
||||||||||||||||||||
|
General insurance
|
$
|
3,354.7
|
|
$
|
3,313.3
|
|
$
|
3,113.5
|
|
1.3
|
%
|
6.4
|
%
|
|||||||
|
Title insurance
|
2,244.1
|
|
2,080.7
|
|
1,791.6
|
|
7.9
|
|
16.1
|
|
||||||||||
|
Corporate and other
|
35.4
|
|
35.8
|
|
(a)
|
70.0
|
|
(0.9
|
)
|
(48.9
|
)
|
|||||||||
|
Subtotal
|
5,634.3
|
|
5,429.8
|
|
4,975.3
|
|
3.8
|
|
9.1
|
|
||||||||||
|
RFIG run-off business
|
193.2
|
|
245.0
|
|
282.9
|
|
(21.1
|
)
|
(13.4
|
)
|
||||||||||
|
Total
|
$
|
5,827.6
|
|
$
|
5,674.8
|
|
$
|
5,258.3
|
|
2.7
|
%
|
7.9
|
%
|
|||||||
|
Pretax operating income (loss):
|
||||||||||||||||||||
|
General insurance
|
$
|
319.9
|
|
$
|
336.4
|
|
$
|
221.3
|
|
(4.9
|
)%
|
52.0
|
%
|
|||||||
|
Title insurance
|
210.2
|
|
166.8
|
|
99.5
|
|
26.0
|
|
67.6
|
|
||||||||||
|
Corporate and other
|
13.0
|
|
7.6
|
|
5.7
|
|
69.6
|
|
32.7
|
|
||||||||||
|
Subtotal
|
543.3
|
|
511.0
|
|
326.7
|
|
6.3
|
|
56.4
|
|
||||||||||
|
RFIG run-off business
|
69.8
|
|
29.4
|
|
10.3
|
|
136.9
|
|
183.6
|
|
||||||||||
|
Total
|
613.1
|
|
540.4
|
|
337.1
|
|
13.4
|
|
60.3
|
|
||||||||||
|
Realized investment gains (losses):
|
||||||||||||||||||||
|
From sales
|
77.8
|
|
91.3
|
|
272.3
|
|
(14.8
|
)
|
(66.5
|
)
|
||||||||||
|
From impairments
|
(4.9
|
)
|
—
|
|
—
|
|
N/M
|
—
|
|
|||||||||||
|
Net realized investment gains (losses)
|
72.8
|
|
91.3
|
|
272.3
|
|
(20.2
|
)
|
(66.5
|
)
|
||||||||||
|
Consolidated pretax income
(loss)
|
686.0
|
|
631.8
|
|
609.4
|
|
8.6
|
|
3.7
|
|
||||||||||
|
Income taxes (credits)
|
219.0
|
|
209.6
|
|
199.7
|
|
4.5
|
|
5.0
|
|
||||||||||
|
Net income (loss)
|
$
|
466.9
|
|
$
|
422.1
|
|
$
|
409.7
|
|
10.6
|
%
|
3.0
|
%
|
|||||||
|
Components of diluted earnings per share:
|
||||||||||||||||||||
|
Net operating income (loss):
|
||||||||||||||||||||
|
General insurance
|
$
|
0.76
|
|
$
|
0.76
|
|
$
|
0.52
|
|
|||||||||||
|
Title insurance
|
0.46
|
|
0.37
|
|
0.22
|
|
||||||||||||||
|
Corporate and other
|
0.09
|
|
0.08
|
|
0.08
|
|
||||||||||||||
|
Subtotal
|
1.31
|
|
1.21
|
|
0.82
|
|
||||||||||||||
|
RFIG run-off business
|
0.15
|
|
0.07
|
|
0.02
|
|
||||||||||||||
|
Total
|
1.46
|
|
1.28
|
|
0.84
|
|
||||||||||||||
|
Net realized investment gains (losses)
|
0.16
|
|
0.20
|
|
0.60
|
|
||||||||||||||
|
Net income (loss)
|
$
|
1.62
|
|
$
|
1.48
|
|
$
|
1.44
|
|
|||||||||||
|
Cash dividends paid per share
|
$
|
0.75
|
|
$
|
0.74
|
|
$
|
0.73
|
|
|||||||||||
|
Ending book value per share
|
$
|
17.20
|
|
$
|
15.02
|
|
$
|
15.15
|
|
|||||||||||
|
(a)
|
Reflects the transfer of accident insurance business from a life and accident subsidiary to a general insurance affiliate resulting in a $26.4 reduction in premiums during 2015.
|
The preceding table shows both operating and net income to highlight the effects of realized investment gains or losses on period-to-period earnings comparisons. Management uses operating income, a non-GAAP financial measure, to evaluate and better explain operating performance, believing that the measure enhances an understanding of Old Republic's core business results. Operating income, however, does not replace net income determined in accordance with GAAP as a measure of total profitability.
The recognition of realized investment gains or losses can be highly discretionary due to such factors as the timing of individual securities sales, the recording of estimated losses from write-downs of impaired securities, tax-planning considerations, and changes in investment management judgments regarding the direction of securities markets or the future prospects of individual investees or industry sectors. In recent years, asset management operations have in part been reoriented toward an enhancement of income from interest and dividends. This strategy has led to a minimization of non-income producing or low-yielding securities. Proceeds from such securities' sales and maturities, as well as newly
31
investable funds have largely been directed to purchases of higher yielding common shares of U.S. companies with distinguished long-term records of earnings and dividend growth. More recently the Company has allotted greater investable funds to tax exempt issues which tend to generate pretax yields lower than those of fully taxable corporate or U.S. Government fixed maturity securities.
|
General Insurance Results -
The table below shows the major elements effecting general insurance performance for the periods reported upon.
|
|
General Insurance Group
|
||||||||||||||||||
|
% Change
|
||||||||||||||||||
|
2016
|
2015
|
|||||||||||||||||
|
Years Ended December 31:
|
2016
|
2015
|
2014
|
vs. 2015
|
vs. 2014
|
|||||||||||||
|
Net premiums earned
|
$
|
2,936.3
|
|
$
|
2,894.7
|
|
$
|
2,735.6
|
|
1.4
|
%
|
5.8
|
%
|
|||||
|
Net investment income
|
312.1
|
|
312.1
|
|
278.8
|
|
—
|
|
12.0
|
|
||||||||
|
Other income
|
106.2
|
|
106.3
|
|
99.0
|
|
(0.1
|
)
|
7.4
|
|
||||||||
|
Operating revenues
|
3,354.7
|
|
3,313.3
|
|
3,113.5
|
|
1.3
|
|
6.4
|
|
||||||||
|
Benefits and claim costs
|
2,143.1
|
|
2,143.5
|
|
2,132.3
|
|
—
|
|
0.5
|
|
||||||||
|
Sales and general expenses
|
833.9
|
|
786.6
|
|
726.3
|
|
6.0
|
|
8.3
|
|
||||||||
|
Interest and other costs
|
57.6
|
|
46.6
|
|
33.5
|
|
23.7
|
|
39.0
|
|
||||||||
|
Total operating expenses
|
3,034.7
|
|
2,976.8
|
|
2,892.2
|
|
1.9
|
|
2.9
|
|
||||||||
|
Pretax operating income (loss)(*)
|
$
|
319.9
|
|
$
|
336.4
|
|
$
|
221.3
|
|
(4.9
|
)%
|
52.0
|
%
|
|||||
|
Benefit and claim ratio
|
73.0
|
%
|
74.1
|
%
|
77.9
|
%
|
(1.5
|
)%
|
(4.9
|
)%
|
||||||||
|
Expense ratio
|
24.8
|
|
23.5
|
|
22.9
|
|
5.5
|
|
2.6
|
|
||||||||
|
Composite underwriting ratio
|
97.8
|
%
|
97.6
|
%
|
100.8
|
%
|
0.2
|
%
|
(3.2
|
)%
|
||||||||
(*) In connection with the run-off mortgage guaranty ("MI") and consumer credit indemnity ("CCI") combination, $33.8, $58.6, and $108.8 of pretax operating losses for 2016, 2015, and 2014, respectively, are retained by certain general insurance companies pursuant to various quota share and stop loss reinsurance agreements. All of these amounts, however, have been reclassified such that 100% of the CCI run-off business is reported in the RFIG run-off segment.
General insurance pretax operating earnings for 2016 were marked by reasonably stable underwriting and investment income contributions, whereas 2015 general operating earnings benefitted from more positive underwriting performance as compared to 2014.
2016 earned premiums were basically level with the preceding year’s production with trends unevenly distributed among various insurance coverages. Low to mid-single digit gains were experienced in commercial automobile (trucking) and national accounts, as well as other coverages such as home warranty. Premium volume from a new underwriting facility established in early 2015 also added measurably to earned premiums in 2016. In other regards, 2016 premium levels were hindered by lower volume in a large account contractors book of business operating in a particularly competitive environment, and by reduced production in the energy services field. 2015 earned premium revenues rose for most insurance coverages with production spurred by both new business and a continuation of strong renewal rates for existing business. Net investment income advanced in 2015 and 2014. In the most recent years, this revenue source has generally trended higher due to a rising invested asset base and enhanced yields largely obtained from a greater, high quality common stock portfolio. 2015 investment income also benefitted from the receipt of two special common stock dividends.
Consolidated general insurance benefit and claim costs were reasonably stable during 2016. Unfavorable developments of reserves established in prior years nonetheless added 0.3 percentage points to the benefit and claim ratio. By comparison to 2014, the 2015 claim ratio reflects lower expense provisions for current and prior years' claim occurrences. Claim ratios for 2015 and 2014 were inclusive of 1.5 and 3.9 percentage point additions arising from unfavorable developments, respectively. The slightly higher sales and general expense ratio in 2016 resulted mostly from greater costs incurred in the above-noted underwriting facility, additional litigation cost provisions in the year's second quarter, and by a slightly different premium mix and attendant production costs associated with the business’ responses to recurring changes in insurance market conditions and opportunities. 2015 production and general operating expenses held fairly steady in context of revenue trends by comparison to 2014.
In management’s opinion, year-to-date fluctuations in reported benefit and claim ratios are not particularly meaningful in evaluating trends in Old Republic's long-term liability-oriented mix of insurance business. Absent significant economic and insurance industry dislocations in the foreseeable future, management currently anticipates that recent years' uptrends in these ratios should abate and revert gradually to long-term targeted annual averages in the high 60%s to low 70%s.
32
|
Title Insurance Results -
The table below shows the major operating elements effecting this segment’s posting of all-time earnings records in 2016.
|
|
Title Insurance Group
|
||||||||||||||||||
|
% Change
|
||||||||||||||||||
|
2016
|
2015
|
|||||||||||||||||
|
Years Ended December 31:
|
2016
|
2015
|
2014
|
vs. 2015
|
vs. 2014
|
|||||||||||||
|
Net premiums and fees earned
|
$
|
2,206.6
|
|
$
|
2,045.3
|
|
$
|
1,759.2
|
|
7.9
|
%
|
16.3
|
%
|
|||||
|
Net investment income
|
36.2
|
|
34.0
|
|
29.9
|
|
6.3
|
|
13.9
|
|
||||||||
|
Other income
|
1.2
|
|
1.3
|
|
2.4
|
|
(7.8
|
)
|
(45.8
|
)
|
||||||||
|
Operating revenues
|
2,244.1
|
|
2,080.7
|
|
1,791.6
|
|
7.9
|
|
16.1
|
|
||||||||
|
Claim costs
|
84.3
|
|
99.2
|
|
91.9
|
|
(15.0
|
)
|
8.0
|
|
||||||||
|
Sales and general expenses
|
1,941.8
|
|
1,807.0
|
|
1,592.3
|
|
7.5
|
|
13.5
|
|
||||||||
|
Interest and other costs
|
7.6
|
|
7.5
|
|
7.8
|
|
1.8
|
|
(4.7
|
)
|
||||||||
|
Total operating expenses
|
2,033.8
|
|
1,913.8
|
|
1,692.0
|
|
6.3
|
|
13.1
|
|
||||||||
|
Pretax operating income (loss)
|
$
|
210.2
|
|
$
|
166.8
|
|
$
|
99.5
|
|
26.0
|
%
|
67.6
|
%
|
|||||
|
Claim ratio
|
3.8
|
%
|
4.9
|
%
|
5.2
|
%
|
(22.4
|
)%
|
(5.8
|
)%
|
||||||||
|
Expense ratio
|
87.9
|
|
88.3
|
|
90.4
|
|
(0.5
|
)
|
(2.3
|
)
|
||||||||
|
Composite underwriting ratio
|
91.7
|
%
|
93.2
|
%
|
95.6
|
%
|
(1.6
|
)%
|
(2.5
|
)%
|
||||||||
The continuation of a favorable mortgage rate environment and generally improving housing and commercial property markets led to higher revenues from title premiums and fees in 2016. This was achieved in spite of the adverse effects that government-imposed mortgage disclosure rules, implemented during the last quarter of 2015, have had on the consummation of real estate transactions nationally. Significant premiums and fees growth in 2015 benefitted from stronger housing and commercial property transactions and the segment’s expanded market share. Premiums and fees in 2014 reflect a significant drop in refinance transactions from higher levels reached in 2013.
As the above table shows, 2016 operations registered a further expansion of underwriting margins. Claim ratios trended down in the face of declining claims activity since the Great Recession years and from favorable developments of reserves established in prior years. These developments lowered the claim ratios by 1.1, 0.6, and .08 percentage points for the years ended December 31, 2016, 2015, and 2014, respectively. The operating expense ratio for these periods remained generally aligned with premiums and fees levels.
|
Please see next page for the continuing report
|
33
|
RFIG Run-off Business Results -
The table below shows the key operating elements of this run-off book of business and their contributions to combined MI and CCI results.
|
|
RFIG Run-off Business
|
||||||||||||||||||
|
% Change
|
||||||||||||||||||
|
2016
|
2015
|
|||||||||||||||||
|
Years Ended December 31:
|
2016
|
2015
|
2014
|
vs. 2015
|
vs. 2014
|
|||||||||||||
|
A. Mortgage Insurance (MI):
|
||||||||||||||||||
|
Net premiums earned
|
$
|
154.1
|
|
$
|
195.9
|
|
$
|
227.6
|
|
(21.3
|
)%
|
(13.9
|
)%
|
|||||
|
Net investment income
|
22.0
|
|
24.2
|
|
26.9
|
|
(8.9
|
)
|
(10.1
|
)
|
||||||||
|
Claim costs
|
52.5
|
|
110.5
|
|
111.0
|
|
(52.4
|
)
|
(0.5
|
)
|
||||||||
|
Pretax operating income (loss)
|
$
|
105.0
|
|
$
|
89.9
|
|
$
|
121.6
|
|
16.8
|
%
|
(26.0
|
)%
|
|||||
|
Claim ratio
|
34.1
|
%
|
56.4
|
%
|
48.8
|
%
|
(39.5
|
)%
|
15.6
|
%
|
||||||||
|
Expense ratio
|
12.0
|
|
10.1
|
|
9.7
|
|
18.8
|
|
4.1
|
|
||||||||
|
Composite underwriting ratio
|
46.1
|
%
|
66.5
|
%
|
58.5
|
%
|
(30.7
|
)%
|
13.7
|
%
|
||||||||
|
B. Consumer Credit Insurance (CCI):
|
||||||||||||||||||
|
Net premiums earned
|
$
|
15.8
|
|
$
|
23.9
|
|
$
|
27.7
|
|
(33.8
|
)%
|
(13.7
|
)%
|
|||||
|
Net investment income
|
1.1
|
|
0.8
|
|
0.5
|
|
31.3
|
|
47.7
|
|
||||||||
|
Benefits and claim costs
|
50.0
|
|
83.0
|
|
137.2
|
|
(39.8
|
)
|
(39.4
|
)
|
||||||||
|
Pretax operating income (loss)(*)
|
$
|
(35.2
|
)
|
$
|
(60.4
|
)
|
$
|
(111.2
|
)
|
41.7
|
%
|
45.6
|
%
|
|||||
|
Claim ratio
|
315.9
|
%
|
346.9
|
%
|
494.4
|
%
|
(8.9
|
)%
|
(29.8
|
)%
|
||||||||
|
Expense ratio
|
13.9
|
|
9.2
|
|
8.5
|
|
51.1
|
|
8.2
|
|
||||||||
|
Composite underwriting ratio
|
329.8
|
%
|
356.1
|
%
|
502.9
|
%
|
(7.4
|
)%
|
(29.2
|
)%
|
||||||||
|
C. Total MI and CCI run-off business:
|
||||||||||||||||||
|
Net premiums earned
|
$
|
170.0
|
|
$
|
219.9
|
|
$
|
255.4
|
|
(22.7
|
)%
|
(13.9
|
)%
|
|||||
|
Net investment income
|
23.2
|
|
25.1
|
|
27.5
|
|
(7.5
|
)
|
(8.9
|
)
|
||||||||
|
Benefits and claim costs
|
102.6
|
|
193.6
|
|
248.2
|
|
(47.0
|
)
|
(22.0
|
)
|
||||||||
|
Pretax operating income (loss)
|
$
|
69.8
|
|
$
|
29.4
|
|
$
|
10.3
|
|
136.9
|
%
|
183.6
|
%
|
|||||
|
Claim ratio
|
60.4
|
%
|
88.0
|
%
|
97.2
|
%
|
(31.4
|
)%
|
(9.5
|
)%
|
||||||||
|
Expense ratio
|
12.2
|
|
10.0
|
|
9.5
|
|
22.0
|
|
5.3
|
|
||||||||
|
Composite underwriting ratio
|
72.6
|
%
|
98.0
|
%
|
106.7
|
%
|
(25.9
|
)%
|
(8.2
|
)%
|
||||||||
(*) In connection with the run-off mortgage guaranty ("MI") and consumer credit indemnity ("CCI") combination, $33.8, $58.6, and $108.8 of pretax operating losses for 2016, 2015, and 2014, respectively, are retained by certain general insurance companies pursuant to various quota share and stop loss reinsurance agreements. All of these amounts, however, have been reclassified and are included for segment reporting purposes such that section (B) in the above table incorporates 100% of the CCI run-off business results.
Consistent with a run-off operating mode, further declines of earned premiums were posted by the MI and CCI lines. MI investment income was also lower as reduced premium volumes and ongoing claim payments affected downward pressures on the invested asset base.
Continued declines in reported delinquencies and the higher rates at which reported mortgage loan defaults are cured or otherwise resolved without payment have led to generally declining claim costs and the related ratios to earned premiums for the past four years. Furthermore, the 2016 claim ratio was less affected by litigation expense provisions that impacted adversely the 2015 ratio. Favorable developments of previously established claim reserves lowered claim ratios by 39.8, 65.0, and 69.3 percentage points in 2016, 2015 and 2014, respectively.
In addition to a quickly declining premium base, operating results for the much smaller CCI run-off line portray greater annual volatility in claim costs and related ratios. In 2016 and several prior years, the latter have been particularly impacted by ongoing costs of a near-eight-year long commercial dispute being litigated with Bank of America and its acquired Countrywide mortgage banking subsidiaries.
34
|
Corporate and Other Operations -
The combination of a small life and accident insurance business and the net costs associated with operations of the parent holding company and its internal services subsidiaries usually produce highly variable results. Earnings variations posted by these relatively minor elements of Old Republic's business stem from volatility inherent to the small scale of life and accident insurance operations, and net interest costs pertaining to external and intra-system financing arrangements. The interplay of these various operating elements is summarized in the following table:
|
|
Corporate and Other Operations
|
||||||||||||||||||
|
% Change
|
||||||||||||||||||
|
2016
|
2015
|
|||||||||||||||||
|
Years Ended December 31:
|
2016
|
2015
|
2014
|
vs. 2015
|
vs. 2014
|
|||||||||||||
|
Net premiums earned
|
$
|
20.1
|
|
$
|
19.4
|
|
$
|
60.7
|
|
3.7
|
%
|
(67.9
|
)%
|
|||||
|
Net investment income
|
15.4
|
|
17.2
|
|
9.2
|
|
(10.6
|
)
|
87.0
|
|
||||||||
|
Other income
|
(0.1
|
)
|
(0.9
|
)
|
—
|
|
82.4
|
|
N/M
|
|||||||||
|
Operating revenues
|
35.4
|
|
35.8
|
|
70.0
|
|
(0.9
|
)
|
(48.9
|
)
|
||||||||
|
Benefits and claim costs
|
17.7
|
|
22.8
|
|
42.0
|
|
(22.4
|
)
|
(45.6
|
)
|
||||||||
|
Insurance expenses
|
7.8
|
|
6.3
|
|
26.5
|
|
24.0
|
|
(76.1
|
)
|
||||||||
|
Corporate, interest and other expenses-net
|
(3.2
|
)
|
(1.1
|
)
|
(4.3
|
)
|
(188.0
|
)
|
74.4
|
|
||||||||
|
Total operating expenses
|
22.4
|
|
28.1
|
|
64.2
|
|
(20.2
|
)
|
(56.3
|
)
|
||||||||
|
Pretax operating income (loss)
|
$
|
13.0
|
|
$
|
7.6
|
|
$
|
5.7
|
|
69.6
|
%
|
32.7
|
%
|
|||||
|
Consolidated Results -
The consolidated changes and occurrences in Old Republic’s segmented business for the periods reported upon are shown below:
|
|
ORI Consolidated
|
||||||||||||||||||
|
% Change
|
||||||||||||||||||
|
2016
|
2015
|
|||||||||||||||||
|
Years Ended December 31:
|
2016
|
2015
|
2014
|
vs. 2015
|
vs. 2014
|
|||||||||||||
|
Net premiums and fees earned
|
$
|
5,333.2
|
|
$
|
5,179.4
|
|
$
|
4,811.1
|
|
3.0
|
%
|
7.7
|
%
|
|||||
|
Net investment income
|
387.0
|
|
388.6
|
|
345.5
|
|
(0.4
|
)
|
12.5
|
|
||||||||
|
Other income
|
107.3
|
|
106.7
|
|
101.6
|
|
0.5
|
|
5.1
|
|
||||||||
|
Operating revenues
|
5,827.6
|
|
5,674.8
|
|
5,258.3
|
|
2.7
|
|
7.9
|
|
||||||||
|
Benefits and claim costs
|
2,347.9
|
|
2,459.3
|
|
2,514.5
|
|
(4.5
|
)
|
(2.2
|
)
|
||||||||
|
Sales and general expenses
|
2,816.3
|
|
2,633.0
|
|
2,381.0
|
|
7.0
|
|
10.6
|
|
||||||||
|
Interest and other costs
|
50.2
|
|
41.9
|
|
25.6
|
|
19.8
|
|
63.4
|
|
||||||||
|
Total operating expenses
|
5,214.5
|
|
5,134.3
|
|
4,921.2
|
|
1.6
|
|
4.3
|
|
||||||||
|
Pretax operating income (loss)
|
613.1
|
|
540.4
|
|
337.1
|
|
13.4
|
|
60.3
|
|
||||||||
|
Income taxes (credits)
|
193.5
|
|
177.7
|
|
104.3
|
|
8.9
|
|
70.3
|
|
||||||||
|
Net operating income (loss)
|
419.6
|
|
362.7
|
|
232.7
|
|
15.7
|
|
55.9
|
|
||||||||
|
Realized investment gains (losses)
|
72.8
|
|
91.3
|
|
272.3
|
|
(20.2
|
)
|
(66.5
|
)
|
||||||||
|
Income taxes (credits) on realized
|
||||||||||||||||||
|
investment gains (losses)
|
25.5
|
|
31.9
|
|
95.3
|
|
(20.2
|
)
|
(66.5
|
)
|
||||||||
|
Net realized investment gains (losses)
|
47.3
|
|
59.3
|
|
177.0
|
|
(20.2
|
)
|
(66.5
|
)
|
||||||||
|
Net income (loss)
|
$
|
466.9
|
|
$
|
422.1
|
|
$
|
409.7
|
|
10.6
|
%
|
3.0
|
%
|
|||||
|
Benefit and claim ratio
|
44.0
|
%
|
47.5
|
%
|
52.3
|
%
|
(7.4
|
)%
|
(9.2
|
)%
|
||||||||
|
Expense ratio
|
50.6
|
|
48.5
|
|
47.1
|
|
4.3
|
|
3.0
|
|
||||||||
|
Composite underwriting ratio
|
94.6
|
%
|
96.0
|
%
|
99.4
|
%
|
(1.5
|
)%
|
(3.4
|
)%
|
||||||||
|
Consolidated operating cash flow (deficit)
|
$
|
637.3
|
|
$
|
688.2
|
|
$
|
(181.2
|
)
|
(7.4
|
)%
|
N/M
|
||||||
Consolidated operating cash flow was additive to investable funds and operating needs in the amount of $637.3 and $688.2 for the years ended December 31, 2016 and 2015, respectively, while 2014 registered a deficit of $181.2. Excluding inherently negative operating cash flows in the MI and CCI run-off business, these amounts would be $739.8, $812.8, and $702.8 in 2016, 2015 and 2014, respectively.
35
The sum-total of Old Republic's segmented results is represented by the following major components of pretax consolidated income:
|
% Change
|
||||||||||||||||||||
|
2016
|
2015
|
|||||||||||||||||||
|
Years Ended December 31:
|
2016
|
2015
|
2014
|
vs. 2015
|
vs. 2014
|
|||||||||||||||
|
Pretax operating income:
|
||||||||||||||||||||
|
Underwriting and related services:
|
||||||||||||||||||||
|
All segments except RFIG
|
$
|
229.7
|
|
$
|
189.4
|
|
$
|
34.4
|
|
21.3
|
%
|
N/M
|
||||||||
|
RFIG run-off
|
46.6
|
|
4.3
|
|
(17.1
|
)
|
N/M
|
125.4
|
%
|
|||||||||||
|
Subtotal
|
276.3
|
|
193.7
|
|
17.2
|
|
42.6
|
|
N/M
|
|||||||||||
|
Net investment income
|
387.0
|
|
388.6
|
|
345.5
|
|
(0.4
|
)
|
12.5
|
|
||||||||||
|
Interest and other costs
|
(50.2
|
)
|
(41.9
|
)
|
(25.6
|
)
|
(19.8
|
)
|
(63.4
|
)
|
||||||||||
|
Total
|
613.1
|
|
540.4
|
|
337.1
|
|
13.4
|
|
60.3
|
|
||||||||||
|
Realized investment gains (losses)
|
72.8
|
|
91.3
|
|
272.3
|
|
(20.2
|
)
|
(66.5
|
)
|
||||||||||
|
Consolidated pretax income (loss)
|
$
|
686.0
|
|
$
|
631.8
|
|
$
|
609.4
|
|
8.6
|
%
|
3.7
|
%
|
|||||||
|
Cash, Invested Assets, and Shareholders' Equity -
The table below shows Old Republic’s consolidated cash and invested asset balances as well as the shareholders’ equity account at the dates shown:
|
|
Cash, Invested Assets, and Shareholders' Equity
|
||||||||||||||||||||
|
% Change
|
||||||||||||||||||||
|
2016
|
2015
|
|||||||||||||||||||
|
As of December 31:
|
2016
|
2015
|
2014
|
vs. 2015
|
vs. 2014
|
|||||||||||||||
|
Cash and invested assets:
|
||||||||||||||||||||
|
Available for sale carried at fair value
|
$
|
12,021.0
|
|
$
|
11,119.6
|
|
$
|
11,291.6
|
|
8.1
|
%
|
(1.5
|
)%
|
|||||||
|
Held to maturity carried at amortized cost
|
974.8
|
|
355.8
|
|
—
|
|
173.9
|
|
N/A
|
|||||||||||
|
Total per balance sheet
|
$
|
12,995.8
|
|
$
|
11,475.5
|
|
$
|
11,291.6
|
|
13.2
|
%
|
1.6
|
%
|
|||||||
|
Original cost basis of all
|
$
|
12,360.3
|
|
$
|
11,284.5
|
|
$
|
10,717.9
|
|
9.5
|
%
|
5.3
|
%
|
|||||||
|
Shareholders' equity:
Total
|
$
|
4,471.6
|
|
$
|
3,880.8
|
|
$
|
3,924.0
|
|
15.2
|
%
|
(1.1
|
)%
|
|||||||
|
Per common share
|
$
|
17.20
|
|
$
|
15.02
|
|
$
|
15.15
|
|
14.5
|
%
|
(0.9
|
)%
|
|||||||
|
Composition of shareholders' equity per share:
|
||||||||||||||||||||
|
Equity before items below
|
$
|
15.96
|
|
$
|
14.91
|
|
$
|
14.02
|
|
7.0
|
%
|
6.3
|
%
|
|||||||
|
Unrealized investment gains (losses) and other
|
||||||||||||||||||||
|
accumulated comprehensive income (loss)
|
1.24
|
|
0.11
|
|
1.13
|
|
|
|
||||||||||||
|
Total
|
$
|
17.20
|
|
$
|
15.02
|
|
$
|
15.15
|
|
14.5
|
%
|
(0.9
|
)%
|
|||||||
|
Segmented composition of
|
||||||||||||||||||||
|
shareholders' equity per share:
|
||||||||||||||||||||
|
Excluding run-off segment
|
$
|
15.93
|
|
$
|
14.06
|
|
$
|
14.35
|
|
13.3
|
%
|
(2.0
|
)%
|
|||||||
|
RFIG run-off segment
|
1.27
|
|
0.96
|
|
0.80
|
|
|
|
|
|
||||||||||
|
Consolidated total
|
$
|
17.20
|
|
$
|
15.02
|
|
$
|
15.15
|
|
14.5
|
%
|
(0.9
|
)%
|
|||||||
Old Republic's invested assets are managed in consideration of enterprise-wide risk management objectives. Most importantly, these are intended to ensure solid funding of the insurance subsidiaries' long-term obligations to policyholders and other beneficiaries, as well as the long-term stability of the subsidiaries’ capital accounts. To this end, the investment portfolio contains no significant insurance risk-correlated asset exposures to real estate, mortgage-backed securities, collateralized debt obligations ("CDO's"), derivatives, hybrid securities, or illiquid private equity investments. Moreover, the Company does not engage in hedging or securities lending transactions, nor does it invest in securities whose values are predicated on non-regulated financial instruments exhibiting amorphous or unfunded counter-party risk attributes.
As of December 31, 2016, the consolidated investment portfolio reflected an allocation of approximately 77 percent to fixed-maturity and short-term investments, and 23 percent to equities. Investments in high quality, dividend-paying equity securities have been singularly emphasized since 2013, and the asset quality of the fixed maturity portfolio has remained at high levels.
Changes in shareholders' equity per share are shown in the following table. As indicated, these resulted mostly from net income, dividend payments to shareholders, and changes in the value of invested assets carried at fair value in the periods reported upon.
36
|
Shareholders' Equity Per Share
|
||||||||||||||
|
Years Ended December 31:
|
2016
|
2015
|
2014
|
|||||||||||
|
Beginning balance
|
$
|
15.02
|
|
$
|
15.15
|
|
$
|
14.64
|
|
|||||
|
Changes in shareholders' equity:
|
||||||||||||||
|
Net operating income (loss)
|
1.62
|
|
1.40
|
|
0.90
|
|
||||||||
|
Net realized investment gains (losses):
|
||||||||||||||
|
From sales
|
0.19
|
|
0.23
|
|
0.68
|
|
||||||||
|
From impairments
|
(0.01
|
)
|
—
|
|
—
|
|
||||||||
|
Subtotal
|
0.18
|
|
0.23
|
|
0.68
|
|
||||||||
|
Net unrealized investment gains (losses)
|
1.12
|
|
(0.96
|
)
|
(0.08
|
)
|
||||||||
|
Total realized and unrealized investment gains (losses)
|
1.30
|
|
(0.73
|
)
|
0.60
|
|
||||||||
|
Cash dividends
|
(0.75
|
)
|
(0.74
|
)
|
(0.73
|
)
|
||||||||
|
Stock issuance, foreign exchange, and other transactions
|
0.01
|
|
(0.06
|
)
|
(0.26
|
)
|
||||||||
|
Net change
|
2.18
|
|
(0.13
|
)
|
0.51
|
|
||||||||
|
Ending balance
|
$
|
17.20
|
|
$
|
15.02
|
|
$
|
15.15
|
|
|||||
|
Percentage change for the period
|
14.5
|
%
|
(0.9
|
)%
|
3.5
|
%
|
||||||||
|
Capitalization -
As shown in the following table, Old Republic’s capitalization rose in 2016 as a result of a new debt issue and a greater shareholders’ equity balance.
|
|
Capitalization (*)
|
||||||||||||
|
As of December 31:
|
2016
|
2015
|
2014
|
|||||||||
|
Debt:
|
||||||||||||
|
3.75% Convertible Senior Notes due 2018
|
$
|
547.8
|
|
$
|
546.0
|
|
$
|
544.1
|
|
|||
|
4.875% Senior Notes due 2024
|
395.6
|
|
395.1
|
|
394.5
|
|
||||||
|
3.875% Senior Notes due 2026
|
544.6
|
|
—
|
|
—
|
|
||||||
|
ESSOP debt with an average yield of 4.0%, 3.7%,
|
||||||||||||
|
and 3.7%, respectively
|
8.1
|
|
11.7
|
|
15.0
|
|
||||||
|
Other miscellaneous debt with an average yield of 1.9%
|
32.4
|
|
—
|
|
—
|
|
||||||
|
Total debt
|
1,528.7
|
|
952.8
|
|
953.7
|
|
||||||
|
Common shareholders' equity
|
4,471.6
|
|
3,880.8
|
|
3,924.0
|
|
||||||
|
Total capitalization
|
$
|
6,000.4
|
|
$
|
4,833.7
|
|
$
|
4,877.8
|
|
|||
|
Capitalization ratios:
|
||||||||||||
|
Debt
|
25.5
|
%
|
19.7
|
%
|
19.7
|
%
|
||||||
|
Common shareholders' equity
|
74.5
|
|
80.3
|
|
80.3
|
|
||||||
|
Total
|
100.0
|
%
|
100.0
|
%
|
100.0
|
%
|
||||||
(*) Certain debt amounts have been reduced due to the reclassification of relatively immaterial debt issuance costs previously classified as deferred assets, in order to comply with a 2015 pronouncement by the Financial Accounting Standards Board.
37
|
DETAILED MANAGEMENT ANALYSIS
|
This section of the Management Analysis of Financial Position and Results of Operations is additive to and should be read in conjunction with the Executive Summary which precedes it.
|
CRITICAL ACCOUNTING ESTIMATES
|
The Company's annual financial statements incorporate a large number and types of estimates relative to matters which are highly uncertain at the time the estimates are made. The estimation process required of an insurance enterprise such as Old Republic is by its very nature highly dynamic inasmuch as it necessitates a continuous evaluation, analysis, and quantification of factual data as it becomes known to the Company. As a result, actual experienced outcomes can differ from the estimates made at any point in time and thus affect future periods' reported revenues, expenses, net income or loss, and financial condition.
Old Republic believes that its most critical accounting estimates relate to: a) the determination of other-than-temporary impairments ("OTTI") in the value of fixed maturity and equity investments; b) the valuation of deferred income tax assets; c) the establishment and recoverability of deferred acquisition costs; d) the recoverability of reinsured paid and/or outstanding losses; and e) the establishment of reserves for losses and loss adjustment expenses. The major assumptions and methods used in setting these estimates are discussed in the pertinent sections of this Management Analysis and are summarized as follows:
(a) Other-than-temporary impairments in the value of investments:
The Company completes a detailed analysis each quarter to assess whether the decline in the value of any investment below its cost basis is deemed other-than-temporary. All securities in an unrealized loss position are reviewed. Absent issuer-specific circumstances that would result in a contrary conclusion, any equity security with any unrealized investment loss amounting to a 20% or greater decline consecutively during a six month period is considered OTTI. The decline in value of a security deemed OTTI is included in the determination of net income and a new cost basis is established for financial reporting purposes.
The Company recognized
$4.9
of OTTI adjustments for the year ended
December 31, 2016
and no adjustments for the same periods of
2015
and
2014
.
(b) The valuation of deferred income tax assets
The Company uses the asset and liability method of calculating deferred income taxes. This method results in the establishment of deferred tax assets and liabilities, calculated at currently enacted tax rates that are applicable to the cumulative temporary differences between financial statement and tax bases of assets and liabilities. Deferred income tax assets are reduced by a valuation allowance when management determines that it is more likely than not that some, or all, of the deferred tax assets will not be realized. At
December 31, 2016
,
2015
and
2014
, the net deferred tax asset (liability) was
$(42.6)
,
$154.5
, and
$37.0
, respectively. The Company held a valuation allowance against deferred tax assets of
$(9.6)
as of December 31, 2014 and released it in 2015. In valuing the deferred tax assets, Old Republic considered certain factors including primarily the scheduled reversals of certain deferred tax liabilities, the impact of available carry back and carry forward periods, estimates of future taxable income, and its ability to exercise prudent and feasible tax planning strategies. See Note 1(j) of the Notes to Consolidated Financial Statements for further discussion of the Company's consolidated income tax balances.
(c) Establishment of deferred acquisition costs ("DAC")
The eligibility for deferral and the recoverability of DAC is based on the successful acquisition of new or renewal contracts and estimated profitability of the insurance contracts to which it relates. As of the three most recent year ends, consolidated DAC balances ranged between
1.4%
and
1.5%
and averaged
1.4%
of consolidated assets. The annual change in DAC balances for the three-year period affected underwriting, acquisition and other expenses within a range of
(1.6)%
and
(.7)%
, and averaged
(1.1)%
of such expenses.
(d) The recoverability of reinsured paid and/or outstanding losses
Assets consisting of gross paid losses recoverable from assuming reinsurers, and balance sheet date reserves similarly recoverable in future periods as gross losses are settled and paid, are established at the same time as the gross losses are paid or recorded as reserves. Accordingly, these assets are subject to the same estimation processes and valuations as the related gross amounts that are discussed below. As of the three most recent year ends, paid and outstanding reinsurance recoverable balances ranged between
30.6%
and
33.7%
and averaged
31.7%
of the related gross reserves. See Part I, Item 1(d) for further discussion regarding recoverability of the Company's reinsurance balances.
38
(e) The reserves for losses and loss adjustment expenses
As discussed in pertinent sections of this management analysis, the reserves for losses and related loss adjustment expenses are based on a wide variety of factors and calculations. Among these the Company believes the most critical are:
|
•
|
The establishment of expected loss ratios for at least the two to three most recent accident years, particularly for so-called long-tail coverages as to which information about covered losses emerges and becomes more accurately quantifiable over long periods of time. Long-tail lines of business generally include workers' compensation, auto liability, general liability, errors and omissions and directors and officers' liability, as well as title insurance. Gross loss reserves related to such long-tail coverages ranged between
87.3%
and
91.1%
, and averaged
89.1%
of gross consolidated claim reserves as of the three most recent year ends. Net of reinsurance recoverables, such reserves ranged between
83.4%
and
89.0%
and averaged
86.2%
as of the same dates.
|
|
•
|
Loss trend factors that are used to establish the above noted expected loss ratios. These factors take into account such variables as judgments and estimates relative to premium rate trends and adequacy, current and expected interest rates, current and expected social and economic inflation trends, and insurance industry statistical claim trends.
|
|
•
|
Loss development factors, expected claim rates and average claim costs, all of which are based on Company and/or industry statistics may also be used to project reported and unreported losses for each accounting period.
|
For the most recent calendar year and first preceding year, prior accident years' consolidated claim costs developed favorably while the second preceding year developed unfavorably. This development had the consequent effect of (increasing) or reducing consolidated annual loss costs for the three most recent years within a range of
(.7)%
and
3.9%
, or by an average of approximately
2.3%
per annum. As a percentage of each of these years' consolidated earned premiums and fees, the (unfavorable) favorable developments have ranged between
(.4)%
and
1.9%
, and have averaged
1.1%
. The variances in prior years' positive or negative claim developments are further discussed within the Incurred Loss Experience section of this document.
In all the above regards the Company anticipates that future periods' financial statements will continue to reflect changes in estimates. As in the past such changes generally result from altered circumstances, the continuum of newly emerging information and its effect on past assumptions and judgments, the effects of securities markets valuations, and changes in inflation rates and future economic conditions beyond the Company's control. As a result, Old Republic cannot predict, quantify, or guaranty the likely impact that probable changes in estimates will have on its future financial condition or results of operations.
|
FINANCIAL POSITION
|
The Company's financial position at
December 31, 2016
reflected increases in assets, liabilities, and common shareholders' equity of
8.7%
,
6.8%
, and
15.2%
, respectively, when compared to the immediately preceding year-end. Cash and invested assets represented
69.9%
and
67.1%
of consolidated assets as of
December 31, 2016
and
2015
, respectively. As of year-end
2016
, the cash and invested asset base rose by
13.2%
to
$12,995.8
.
Investments
- During
2016
and
2015
, the Company committed the majority of investable funds to short to intermediate-term fixed maturity securities and higher yielding publicly traded large capitalization common shares. At both
December 31, 2016
and
2015
, approximately
99%
of the Company's investments consisted of marketable securities. Old Republic continues to adhere to its long-term policy of investing primarily in investment grade, marketable securities. The investment portfolio contains no significant insurance risk-correlated asset exposures to real estate, mortgage-backed securities, collateralized debt obligations ("CDO's"), derivatives, hybrid securities, or illiquid private equity investments. Moreover, the Company does not engage in hedging or securities lending transactions, nor does it invest in securities whose values are predicated on non-regulated financial instruments exhibiting amorphous or unfunded counter-party risk attributes. At
December 31, 2016
, the Company had no fixed maturity investments in default as to principal and/or interest.
Short-term maturity investment positions reflect a large variety of seasonal and intermediate-term factors including current operating needs, expected operating cash flows, seasonality of quarterly cash flow, debt maturities, and investment strategy considerations. Accordingly, the future level of short-term investments will vary and respond to the interplay of these factors and may, as a result, increase or decrease from current levels.
The Company does not own or utilize derivative financial instruments for the purpose of hedging, enhancing the overall return of its investment portfolio, or reducing the cost of its debt obligations. With regard to its equity portfolio, the Company does not own any options nor does it engage in any type of option writing. Traditional investment management tools and techniques are employed to address the yield and valuation exposures of the invested assets base. The long-term fixed maturity investment portfolio is managed so as to limit various risks inherent in the bond market. Credit risk is addressed through asset diversification and the purchase of investment grade securities. Reinvestment rate risk is reduced by concentrating on non-callable issues, and by taking asset-liability matching considerations into account.
39
Purchases of mortgage and asset backed securities, which have variable principal prepayment options, are generally avoided. Market value risk is limited through the purchase of bonds of intermediate maturity. The combination of these investment management practices is expected to produce a more stable long-term fixed maturity investment portfolio that is not subject to extreme interest rate sensitivity and principal deterioration.
The fair value of the Company's long-term fixed maturity investment portfolio is sensitive, however, to fluctuations in the level of interest rates, but not materially affected by changes in anticipated cash flows caused by any prepayments. The impact of interest rate movements on the long-term fixed maturity investment portfolio generally affects net unrealized gains or losses. As a general rule, rising interest rates enhance currently available yields but typically lead to a reduction in the fair value of existing fixed maturity investments. By contrast, a decline in such rates reduces currently available yields but usually serves to increase the fair value of the existing fixed maturity investment portfolio. All such changes in fair value of available for sale securities are reflected, net of deferred income taxes, directly in the shareholders' equity account, and as a separate component of the statement of comprehensive income. Fixed maturity securities classified as held to maturity are carried at amortized cost, and therefore, fluctuations in unrealized gains and losses do not impact shareholders' equity. Given the Company's inability to forecast or control the movement of interest rates, Old Republic sets the maturity spectrum of its fixed maturity securities portfolio within parameters of estimated liability payouts, and focuses the overall portfolio on high quality investments. By so doing, Old Republic believes it is reasonably assured of its ability to hold securities to maturity as it may deem necessary in changing environments, and of ultimately recovering their aggregate cost.
Possible future declines in fair values for Old Republic's available for sale bond and equity portfolios would negatively affect the common shareholders' equity account at any point in time, but would not necessarily result in the recognition of realized investment losses. The Company reviews the status and fair value changes of each of its investments on at least a quarterly basis during the year, and estimates of other-than-temporary impairments in the portfolio's value are evaluated and established at each quarterly balance sheet date. In reviewing investments for other-than-temporary impairment, the Company, in addition to a security's market price history, considers the totality of such factors as the issuer's operating results, financial condition and liquidity, its ability to access capital markets, credit rating trends, most current audit opinion, industry and securities markets conditions, and analyst expectations to reach its conclusions. Sudden fair value declines caused by such adverse developments as newly emerged or imminent bankruptcy filings, issuer default on significant obligations, or reports of financial accounting developments that bring into question the validity of the issuer's previously reported earnings or financial condition, are recognized as realized losses as soon as credible publicly available information emerges to confirm such developments. Absent issuer-specific circumstances that would result in a contrary conclusion, any equity security with an unrealized investment loss amounting to a 20% or greater decline consecutively during a six month period is considered other-than-temporarily-impaired. In the event the Company's estimate of other-than-temporary impairments is insufficient at any point in time, future periods' net income (loss) would be affected adversely by the recognition of additional realized or impairment losses, but its financial condition would not necessarily be affected adversely inasmuch as such losses, or a portion of them, could have been recognized previously as unrealized losses in shareholders' equity.
The following tables show certain information relating to the Company's available for sale and held to maturity fixed maturity and equity portfolios as of the dates shown:
|
Credit Quality Ratings of Fixed Maturity Securities (a)
|
||||||
|
December 31:
|
2016
|
2015
|
||||
|
Aaa
|
20.1
|
%
|
17.2
|
%
|
||
|
Aa
|
12.1
|
|
9.6
|
|
||
|
A
|
30.9
|
|
32.3
|
|
||
|
Baa
|
28.9
|
|
34.7
|
|
||
|
Total investment grade
|
92.0
|
|
93.8
|
|
||
|
All other (b)
|
8.0
|
|
6.2
|
|
||
|
Total
|
100.0
|
%
|
100.0
|
%
|
||
__________
|
(a)
|
Credit quality ratings referred to herein are a blend of those assigned by the major credit rating agencies for U.S. and Canadian Governments, Agencies, Corporates and Municipal issuers, which are converted to the above ratings classifications.
|
|
(b)
|
"All other" includes non-investment grade or non-rated issuers.
|
40
|
Gross Unrealized Losses Stratified by Industry Concentration for Non-Investment Grade Fixed Maturity Securities
|
|||||||||||
|
December 31, 2016
|
Amortized
Cost
|
Gross
Unrealized
Losses
|
|||||||||
|
Fixed Maturity Securities by Industry Concentration:
|
|||||||||||
|
Energy
|
$
|
96.1
|
|
$
|
3.8
|
|
|||||
|
Telecom
|
23.7
|
|
3.5
|
|
|||||||
|
Basic Industry
|
33.6
|
|
1.7
|
|
|||||||
|
Industrial
|
55.2
|
|
1.2
|
|
|||||||
|
Other (includes 4 industry groups)
|
44.5
|
|
.6
|
|
|||||||
|
Total
|
$
|
253.3
|
|
(c)
|
$
|
11.0
|
|
||||
__________
|
(c)
|
Represents 2.8% of the total fixed maturity securities portfolio.
|
|
Gross Unrealized Losses Stratified by Industry Concentration for Investment Grade Fixed Maturity Securities
|
|||||||||||
|
December 31, 2016
|
Amortized
Cost
|
Gross
Unrealized
Losses
|
|||||||||
|
Fixed Maturity Securities by Industry Concentration:
|
|||||||||||
|
Municipals
|
$
|
842.4
|
|
$
|
28.0
|
|
|||||
|
U.S. Government & Agencies
|
648.7
|
|
4.7
|
|
|||||||
|
Utilities
|
283.1
|
|
4.2
|
|
|||||||
|
Natural Gas
|
111.7
|
|
2.2
|
|
|||||||
|
Other (includes 16 industry groups)
|
936.4
|
|
13.8
|
|
|||||||
|
Total
|
$
|
2,822.7
|
|
(d)
|
$
|
53.3
|
|
||||
__________
|
(d)
|
Represents 31.4% of the total fixed maturity securities portfolio.
|
|
Gross Unrealized Losses Stratified by Industry Concentration for Equity Securities
|
|||||||||||
|
December 31, 2016
|
Cost
|
Gross
Unrealized
Losses
|
|||||||||
|
Equity Securities by Industry Concentration:
|
|||||||||||
|
Energy
|
$
|
134.5
|
|
$
|
12.4
|
|
|||||
|
Health Care
|
89.0
|
|
12.2
|
|
|||||||
|
Utilities
|
3.2
|
|
.2
|
|
|||||||
|
Telecom
|
2.9
|
|
.1
|
|
|||||||
|
Total
|
$
|
229.8
|
|
(e)
|
$
|
25.0
|
|
(f)
|
|||
__________
|
(e)
|
Represents 9.6% of the total equity securities portfolio.
|
|
(f)
|
Represents 1.0% of the cost of the total equity securities portfolio, while gross unrealized gains represent 21.5% of the portfolio.
|
41
|
Gross Unrealized Losses Stratified by Maturity Ranges for All Fixed Maturity Securities
|
||||||||||||||||||
|
Amortized Cost
of Fixed Maturity Securities
|
Gross Unrealized Losses
|
|||||||||||||||||
|
December 31, 2016
|
All
|
Non-Investment Grade Only
|
All
|
Non-
Investment
Grade Only
|
||||||||||||||
|
Maturity Ranges:
|
||||||||||||||||||
|
Due in one year or less
|
$
|
147.8
|
|
$
|
9.9
|
|
$
|
.3
|
|
$
|
—
|
|
||||||
|
Due after one year through five years
|
878.8
|
|
63.5
|
|
8.1
|
|
1.4
|
|
||||||||||
|
Due after five years through ten years
|
1,980.1
|
|
160.4
|
|
50.7
|
|
6.0
|
|
||||||||||
|
Due after ten years
|
69.2
|
|
19.3
|
|
5.1
|
|
3.5
|
|
||||||||||
|
Total
|
$
|
3,076.0
|
|
$
|
253.3
|
|
$
|
64.3
|
|
$
|
11.0
|
|
||||||
|
Gross Unrealized Losses Stratified by Duration and Amount of Unrealized Losses
|
||||||||||||||||||||
|
Amount of Gross Unrealized Losses
|
||||||||||||||||||||
|
December 31, 2016
|
Less than
20% of
Cost
|
20% to
50%
of Cost
|
More than
50% of Cost
|
Total Gross
Unrealized
Loss
|
||||||||||||||||
|
Number of Months in Loss Position:
|
||||||||||||||||||||
|
Fixed Maturity Securities:
|
||||||||||||||||||||
|
One to six months
|
$
|
53.7
|
|
$
|
—
|
|
$
|
—
|
|
$
|
53.7
|
|
||||||||
|
Seven to twelve months
|
.2
|
|
—
|
|
—
|
|
.2
|
|
||||||||||||
|
More than twelve months
|
7.6
|
|
2.7
|
|
—
|
|
10.4
|
|
||||||||||||
|
Total
|
$
|
61.6
|
|
$
|
2.7
|
|
$
|
—
|
|
$
|
64.3
|
|
||||||||
|
Equity Securities:
|
||||||||||||||||||||
|
One to six months
|
$
|
12.5
|
|
$
|
—
|
|
$
|
—
|
|
$
|
12.5
|
|
||||||||
|
Seven to twelve months
|
—
|
|
—
|
|
—
|
|
—
|
|
||||||||||||
|
More than twelve months
|
12.4
|
|
—
|
|
—
|
|
12.4
|
|
||||||||||||
|
Total
|
$
|
25.0
|
|
$
|
—
|
|
$
|
—
|
|
$
|
25.0
|
|
||||||||
|
Number of Issues in Loss Position:
|
||||||||||||||||||||
|
Fixed Maturity Securities:
|
||||||||||||||||||||
|
One to six months
|
667
|
|
—
|
|
—
|
|
667
|
|
||||||||||||
|
Seven to twelve months
|
5
|
|
—
|
|
—
|
|
5
|
|
||||||||||||
|
More than twelve months
|
45
|
|
1
|
|
—
|
|
46
|
|
||||||||||||
|
Total
|
717
|
|
1
|
|
—
|
|
718
|
|
(g)
|
|||||||||||
|
Equity Securities:
|
||||||||||||||||||||
|
One to six months
|
6
|
|
—
|
|
—
|
|
6
|
|
||||||||||||
|
Seven to twelve months
|
—
|
|
—
|
|
—
|
|
—
|
|
||||||||||||
|
More than twelve months
|
2
|
|
—
|
|
—
|
|
2
|
|
||||||||||||
|
Total
|
8
|
|
—
|
|
—
|
|
8
|
|
(g)
|
|||||||||||
__________
|
(g)
|
At
December 31, 2016
the number of issues in an unrealized loss position represent 37.0% as to fixed maturities, and 7.7% as to equity securities of the total number of such issues held by the Company.
|
The aging of issues with unrealized losses employs balance sheet date fair value comparisons with an issue's original cost. The percentage reduction from such cost reflects the decline as of a specific point in time (
December 31, 2016
in the above table) and, accordingly, is not indicative of a security's value having been consistently below its cost at the percentages shown nor throughout the periods shown.
42
|
Age Distribution of Fixed Maturity Securities
|
||||||||||
|
December 31:
|
2016
|
2015
|
||||||||
|
Maturity Ranges:
|
||||||||||
|
Due in one year or less
|
9.2
|
%
|
9.9
|
%
|
||||||
|
Due after one year through five years
|
45.0
|
|
40.8
|
|
||||||
|
Due after five years through ten years
|
43.9
|
|
47.0
|
|
||||||
|
Due after ten years through fifteen years
|
1.6
|
|
1.9
|
|
||||||
|
Due after fifteen years
|
.3
|
|
.4
|
|
||||||
|
Total
|
100.0
|
%
|
100.0
|
%
|
||||||
|
|
||||||||||
|
Average Maturity in Years
|
4.8
|
|
4.9
|
|
||||||
|
Duration (h)
|
4.2
|
|
4.3
|
|
||||||
___________
|
(h)
|
Duration is used as a measure of bond price sensitivity to interest rate changes. A duration of
4.2
as of
December 31, 2016
implies that a 100 basis point parallel increase in interest rates from current levels would result in a possible decline in the fair value of the long-term fixed maturity investment portfolio of approximately
4.2%
.
|
|
Composition of Unrealized Gains (Losses)
|
|||||||||||||
|
December 31:
|
2016
|
2015
|
|||||||||||
|
Available for Sale:
|
|||||||||||||
|
Fixed Maturity Securities:
|
|||||||||||||
|
Amortized cost
|
$
|
8,019.6
|
|
$
|
8,149.4
|
|
|||||||
|
Estimated fair value
|
8,170.9
|
|
8,181.5
|
|
|||||||||
|
Gross unrealized gains
|
187.6
|
|
185.8
|
|
|||||||||
|
Gross unrealized losses
|
(36.3
|
)
|
(153.8
|
)
|
|||||||||
|
Net unrealized gains (losses)
|
$
|
151.3
|
|
$
|
32.0
|
|
|||||||
|
Equity Securities:
|
|||||||||||||
|
Original cost
|
$
|
2,404.9
|
|
$
|
1,826.4
|
|
|||||||
|
Estimated fair value
|
2,896.1
|
|
1,987.8
|
|
|||||||||
|
Gross unrealized gains
|
516.2
|
|
266.7
|
|
|||||||||
|
Gross unrealized losses
|
(25.0
|
)
|
(105.3
|
)
|
|||||||||
|
Net unrealized gains (losses)
|
$
|
491.2
|
|
$
|
161.4
|
|
|||||||
Other Assets
- Among other major assets, substantially all of the Company's receivables are not past due. Reinsurance recoverable balances on paid or estimated unpaid losses are deemed recoverable from solvent reinsurers or have otherwise been reduced by allowances for estimated amounts unrecoverable. Deferred policy acquisition costs are estimated by taking into account the direct costs relating to the successful acquisition of new or renewal insurance contracts and evaluating their recoverability on the basis of recent trends in claims costs. The Company's deferred policy acquisition cost balances have not fluctuated substantially from period-to-period, and do not represent significant percentages of assets or shareholders' equity.
Liquidity
-
The parent holding company meets its liquidity and capital needs principally through dividends and interest on intercompany financing arrangements paid by its subsidiaries. The insurance subsidiaries' ability to pay cash dividends to the parent company is generally restricted by law or subject to approval of the insurance regulatory authorities of the states in which they are domiciled. The Company can receive up to
$473.3
in dividends from its subsidiaries in
2017
without the prior approval of regulatory authorities. The liquidity achievable through such permitted dividend payments is considered sufficient to cover the parent holding company's currently expected cash outflows represented mostly by interest and scheduled repayments on outstanding debt, reasonably anticipated cash dividend payments to shareholders, modest operating expenses, and the near-term capital needs of its operating subsidiaries.
Old Republic's 3.75% Convertible Senior Notes, 4.875% Senior Notes, and 3.875% Senior Notes ("the Notes") contain provisions defining certain events of default, among them a court ordered proceeding due to the insolvency of a Significant Subsidiary. The Notes define Significant Subsidiary in accordance with paragraph (w) of Rule 1-02 of the SEC's Regulation S-X. The Company's flagship mortgage guaranty insurance carrier, Republic Mortgage Insurance Company, ("RMIC") qualifies as a Significant Subsidiary for purposes of the Notes. If RMIC were to become statutorily impaired, its insolvency could trigger a receivership proceeding which, in turn could ultimately result in an event of default. If this were to occur, the outstanding principal of the Notes could become immediately due and payable. As of
December 31, 2016
, RMIC was statutorily solvent and management has every expectation that its solvent state is likely to prevail.
See Item 1 - Business for a discussion of regulatory matters affecting RMIC. Management believes these current events have precluded the aforementioned potential for an event of default from occurring in the foreseeable future.
43
Capitalization
-
Old Republic's total capitalization of
$6,000.4
at
December 31, 2016
consisted of debt of
$1,528.7
and common shareholders' equity of
$4,471.6
. Changes in the common shareholders' equity account reflect primarily net income for the year then ended, changes in the fair value of invested assets, and dividend payments.
Old Republic has paid cash dividends to its shareholders without interruption since 1942, and has increased the annual rate in each of the past 35 calendar years. The dividend rate is reviewed and approved by the Board of Directors on a quarterly basis each year. In establishing each year's cash dividend rate the Company does not follow a strict formulaic approach. Rather, it favors a gradual rise in the annual dividend rate that is largely reflective of long-term consolidated operating earnings trends. Accordingly, each year's dividend rate is set judgmentally in consideration of such key factors as the dividend paying capacity of the Company's insurance subsidiaries, the trends in average annual statutory and GAAP earnings for the five to ten most recent calendar years, and management's long-term expectations for the Company's consolidated business and its individual operating subsidiaries.
Under state insurance regulations, the Company's three mortgage guaranty insurance subsidiaries are required to operate at a maximum risk to capital ratio of 25:1 or otherwise hold minimum amounts of capital based on specified formulas. As noted in prior periods' reports, the Company's flagship mortgage guaranty insurance carrier had been operating pursuant to a waiver of minimum state regulatory capital requirements since late 2009. This waiver expired on August 31, 2011. The Company's mortgage insurance subsidiaries therefore discontinued writing new business in all states and limited themselves to servicing the run-off of their existing business. As noted elsewhere herein, RMIC and RMICNC have been operating pursuant to a Summary Order since January 19, 2012 and December 3, 2012, respectively, and the risk-to-capital ratio considerations are therefore no longer of consequence.
Contractual Obligations
-
The following table shows certain information relating to the Company's contractual obligations as of
December 31, 2016
:
|
2017
|
2018 and
2019
|
2020 and
2021
|
2022 and
After
|
Total
|
|||||||||||||||
|
Contractual Obligations
:
|
|||||||||||||||||||
|
Debt
|
$
|
3.9
|
|
$
|
560.6
|
|
$
|
26.0
|
|
$
|
950.0
|
|
$
|
1,540.6
|
|
||||
|
Interest on Debt
|
62.2
|
|
93.1
|
|
82.1
|
|
165.0
|
|
402.6
|
|
|||||||||
|
Operating Leases
|
56.3
|
|
90.8
|
|
52.0
|
|
114.7
|
|
313.9
|
|
|||||||||
|
Pension Benefits Contributions (a)
|
2.8
|
|
17.8
|
|
15.1
|
|
15.1
|
|
50.8
|
|
|||||||||
|
Claim & Claim Expense Reserves (b)
|
2,296.7
|
|
2,365.0
|
|
1,141.9
|
|
3,402.2
|
|
9,206.0
|
|
|||||||||
|
Total
|
$
|
2,422.1
|
|
$
|
3,127.5
|
|
$
|
1,317.3
|
|
$
|
4,647.1
|
|
$
|
11,514.1
|
|
||||
__________
|
(a)
|
Represents estimated minimum funding of contributions for the Old Republic International Salaried Employees Retirement Plan. Funding of the plan is dependent on a number of factors including actual performance versus actuarial assumptions made at the time of the actuarial valuation, as well as the maintenance of certain funding levels relative to regulatory requirements.
|
|
(b)
|
Amounts are reported gross of reinsurance. As discussed herein with respect to the nature of loss reserves and the estimating process utilized in their establishment, the Company's loss reserves do not have a contractual maturity date. Estimated gross loss payments are based primarily on historical claim payment patterns, are subject to change due to a wide variety of factors, do not reflect anticipated recoveries under the terms of reinsurance contracts, and cannot be predicted with certainty. Actual future loss payments may differ materially from the current estimates shown in the table above.
|
|
RESULTS OF OPERATIONS
|
|
Revenues: Premiums & Fees
|
Pursuant to GAAP applicable to the insurance industry, revenues are recognized as follows:
Substantially all general insurance premiums pertain to annual policies and are reflected in income on a pro-rata basis in association with the related benefits, claims and expenses. Earned but unbilled premiums are generally taken into income on the billing date, while adjustments for retrospective premiums, commissions and similar charges or credits are accrued on the basis of periodic evaluations of current underwriting experience and contractual obligations.
Title premium and fee revenues stemming from the Company's direct operations (which include branch offices of its title insurers and wholly owned agency subsidiaries) represent approximately
28%
of
2016
consolidated title business revenues. Such premiums are generally recognized as income at the escrow closing date which approximates the policy effective date. Fee income related to escrow and other closing services is recognized when the related services have been performed and completed. The remaining
72%
of consolidated title premium and fee revenues is produced by independent title agents and underwritten title companies. Rather than making estimates that could be subject to significant variance from actual premium and fee production, the Company recognizes revenues from those sources
44
upon receipt. Such receipts can reflect a three to four month lag relative to the effective date of the underlying title policy, and are offset concurrently by production expenses and claim reserve provisions.
The Company's mortgage guaranty premiums primarily stem from monthly installments paid on long-duration, guaranteed renewable insurance policies. Substantially all such premiums are written and earned in the month coverage is effective. With respect to relatively few annual or single premium policies, earned premiums are largely recognized on a pro-rata basis over the terms of the policies. As described more fully in the RFIG Run-off Business' Risk Factors for premium income and long-term claim exposures, revenue recognition for insured loans is not appropriately matched to the risk exposure and the consequent recognition of both normal and catastrophic loss occurrences.
The major sources of Old Republic's consolidated earned premiums and fees for the periods shown were as follows:
|
Earned Premiums and Fees
|
||||||||||||||||||||||
|
General
|
Title
|
RFIG Run-off
|
Other
|
Total
|
% Change
from prior
period
|
|||||||||||||||||
|
Years Ended December 31:
|
||||||||||||||||||||||
|
2014
|
$
|
2,735.6
|
|
$
|
1,759.2
|
|
$
|
255.4
|
|
$
|
60.7
|
|
$
|
4,811.1
|
|
(1.5
|
)%
|
|||||
|
2015
|
2,894.7
|
|
2,045.3
|
|
219.9
|
|
19.4
|
|
5,179.4
|
|
7.7
|
|
||||||||||
|
2016
|
$
|
2,936.3
|
|
$
|
2,206.6
|
|
$
|
170.0
|
|
$
|
20.1
|
|
$
|
5,333.2
|
|
3.0
|
%
|
|||||
General insurance 2016 earned premiums were basically level with the preceding year's production with trends unevenly distributed among various insurance coverages. Low to mid-single digit gains were experienced in commercial automobile (trucking) and national accounts, as well as other coverages such as home warranty. Premium volume from a new underwriting facility established in early 2015 also added measurably to earned premiums in 2016. In other regards, 2016 premium levels were hindered by lower volume in a large account contractors book of business operating in a particularly competitive environment, and by reduced production in the energy services field. 2015 earned premium revenues rose for most insurance coverages with production spurred by both new business and a continuation of strong renewal rates for existing business.
Title Group premium and fee revenues grew by
7.9%
and
16.3%
in
2016
and
2015
, respectively. The continuation of a favorable mortgage rate environment and generally improving housing and commercial property markets led to higher revenues from title premiums and fees in 2016. This was achieved in spite of the adverse effects that government-imposed mortgage disclosure rules, implemented during the last quarter of 2015, have had on the consummation of real estate transactions nationally. The 2015 increase was due to stronger housing and commercial property transactions and the segment's expanded market share. The premium and fees in 2014 reflect a significant drop in refinance transactions from higher levels reached in 2013.
Consistent with a run-off operating mode, the MI and CCI lines posted further declines in earned premiums for all periods presented.
The percentage allocation of net premiums earned for major insurance coverages in the General Insurance Group was as follows:
|
General Insurance Earned Premiums by Type of Coverage
|
|||||||||||||||||
|
Workers' Compensation
|
Commercial
Automobile
(mostly
trucking)
|
Financial
Indemnity
|
Inland
Marine
and
Property
|
General
Liability
|
Other
|
||||||||||||
|
Years Ended December 31:
|
|||||||||||||||||
|
2014
|
40.6
|
%
|
31.9
|
%
|
3.9
|
%
|
7.5
|
%
|
6.2
|
%
|
9.9
|
%
|
|||||
|
2015
|
39.0
|
|
32.1
|
|
4.1
|
|
7.4
|
|
5.9
|
|
11.5
|
|
|||||
|
2016
|
36.5
|
%
|
33.7
|
%
|
4.3
|
%
|
7.4
|
%
|
5.6
|
%
|
12.5
|
%
|
|||||
The following table shows the percentage distribution of Title Group premium and fee revenues by production sources:
|
Title Premium and Fee Production by Source
|
|||||
|
Direct
Operations
|
Independent
Title
Agents &
Other
|
||||
|
Years Ended December 31:
|
|||||
|
2014
|
27.1
|
%
|
72.9
|
%
|
|
|
2015
|
27.2
|
|
72.8
|
|
|
|
2016
|
27.9
|
%
|
72.1
|
%
|
|
45
The following tables provide information on production and related risk exposure trends for Old Republic's mortgage guaranty insurance operation:
|
Earned Premiums
|
Persistency
|
||||||||||||
|
Premium and Persistency Trends by Type:
|
Direct
|
Net
|
Traditional
Primary
|
Bulk
|
|||||||||
|
Years Ended December 31:
|
|||||||||||||
|
2014
|
$
|
234.6
|
|
$
|
227.6
|
|
82.2
|
%
|
66.9
|
%
|
|||
|
2015
|
201.1
|
|
195.9
|
|
79.9
|
|
56.1
|
|
|||||
|
2016
|
$
|
157.1
|
|
$
|
154.1
|
|
77.7
|
%
|
72.8
|
%
|
|||
As previously discussed, the Company's flagship mortgage guaranty insurance carrier ceased the underwriting of new policies effective August 31, 2011 and the existing book of business was placed in run-off operating mode.
While there is no consensus in the marketplace as to the precise definition of "sub-prime", Old Republic generally views loans with credit (FICO) scores less than 620, loans underwritten with reduced levels of documentation and loans with loan to value ratios in excess of 95% as having a higher risk of default. Risk in force concentrations by these attributes are disclosed in the following tables for both traditional primary and bulk production. Premium rates for loans exhibiting greater risk attributes are typically higher in anticipation of potentially greater defaults and claim costs. Additionally, bulk insurance policies, which represent
6.7%
of total net risk in force as of year end
2016
, are frequently subject to deductibles and aggregate stop losses which serve to limit the overall risk on a pool of insured loans.
|
Net Risk in Force
|
|||||||||||||||
|
Net Risk in Force By Type:
|
Traditional
Primary
|
Bulk
|
Other
|
Total
|
|||||||||||
|
As of December 31:
|
|||||||||||||||
|
2014
|
$
|
7,984.8
|
|
$
|
549.6
|
|
$
|
31.8
|
|
$
|
8,566.2
|
|
|||
|
2015
|
6,414.9
|
|
428.2
|
|
24.1
|
|
6,867.3
|
|
|||||||
|
2016
|
$
|
4,987.9
|
|
$
|
359.5
|
|
$
|
20.5
|
|
$
|
5,367.9
|
|
|||
|
Analysis of Risk in Force
|
|||||||||||
|
Risk in Force Distribution By FICO Scores:
|
FICO less
than 620
|
FICO 620
to 680
|
FICO
Greater
than 680
|
Unscored/
Unavailable
|
|||||||
|
Traditional Primary:
|
|||||||||||
|
As of December 31:
|
|||||||||||
|
2014
|
6.6
|
%
|
28.5
|
%
|
64.0
|
%
|
.9
|
%
|
|||
|
2015
|
6.8
|
|
29.3
|
|
63.0
|
|
.9
|
|
|||
|
2016
|
7.2
|
%
|
30.5
|
%
|
61.5
|
%
|
.8
|
%
|
|||
|
Bulk(a):
|
|||||||||||
|
As of December 31:
|
|||||||||||
|
2014
|
26.1
|
%
|
33.1
|
%
|
40.7
|
%
|
.1
|
%
|
|||
|
2015
|
28.4
|
|
32.2
|
|
39.2
|
|
.2
|
|
|||
|
2016
|
29.9
|
%
|
32.0
|
%
|
38.0
|
%
|
.1
|
%
|
|||
46
|
Risk in Force Distribution By Loan to Value ("LTV") Ratio:
|
LTV
85.0
and below
|
LTV
85.01
to 90.0
|
LTV
90.01
to 95.0
|
LTV
Greater
than 95.0
|
|||||||
|
Traditional Primary(b):
|
|||||||||||
|
As of December 31:
|
|||||||||||
|
2014
|
3.9
|
%
|
34.2
|
%
|
31.5
|
%
|
30.4
|
%
|
|||
|
2015
|
3.8
|
|
33.5
|
|
30.9
|
|
31.8
|
|
|||
|
2016
|
3.8
|
%
|
32.1
|
%
|
30.6
|
%
|
33.5
|
%
|
|||
|
Bulk(a):
|
|||||||||||
|
As of December 31:
|
|||||||||||
|
2014
|
52.5
|
%
|
25.8
|
%
|
11.1
|
%
|
10.6
|
%
|
|||
|
2015
|
48.3
|
|
28.0
|
|
11.9
|
|
11.8
|
|
|||
|
2016
|
46.5
|
%
|
29.0
|
%
|
12.3
|
%
|
12.2
|
%
|
|||
__________
|
(a)
|
Bulk pool risk in-force, which represented
13.9%
of total bulk risk in-force at
December 31, 2016
, has been allocated pro-rata based on insurance in-force.
|
|
(b)
|
The LTV distribution reflects base LTV ratios which are determined prior to the impact of single premiums financed and paid at the time of loan origination.
|
Risk in Force Distribution By Top Ten States:
|
Traditional Primary
|
|||||||||||||||||||||||||||||
|
TX
|
FL
|
GA
|
IL
|
CA
|
NC
|
PA
|
NJ
|
VA
|
MD
|
||||||||||||||||||||
|
As of December 31:
|
|||||||||||||||||||||||||||||
|
2014
|
7.8
|
%
|
7.3
|
%
|
5.7
|
%
|
5.3
|
%
|
4.9
|
%
|
4.8
|
%
|
4.3
|
%
|
4.0
|
%
|
3.4
|
%
|
3.0
|
%
|
|||||||||
|
2015
|
7.1
|
|
7.5
|
|
5.9
|
|
5.5
|
|
4.9
|
|
4.7
|
|
4.3
|
|
4.2
|
|
3.4
|
|
3.4
|
|
|||||||||
|
2016
|
6.4
|
%
|
7.8
|
%
|
6.0
|
%
|
5.8
|
%
|
4.8
|
%
|
4.6
|
%
|
4.4
|
%
|
4.4
|
%
|
3.6
|
%
|
3.8
|
%
|
|||||||||
|
Bulk (a)
|
|||||||||||||||||||||||||||||
|
TX
|
FL
|
GA
|
IL
|
CA
|
AZ
|
PA
|
NJ
|
OH
|
NY
|
||||||||||||||||||||
|
As of December 31:
|
|||||||||||||||||||||||||||||
|
2014
|
5.3
|
%
|
9.3
|
%
|
4.6
|
%
|
4.0
|
%
|
13.0
|
%
|
2.7
|
%
|
3.5
|
%
|
4.4
|
%
|
4.0
|
%
|
7.6
|
%
|
|||||||||
|
2015
|
5.1
|
|
8.9
|
|
4.7
|
|
4.0
|
|
12.8
|
|
2.8
|
|
3.6
|
|
4.4
|
|
4.2
|
|
7.4
|
|
|||||||||
|
2016
|
5.3
|
%
|
8.6
|
%
|
4.9
|
%
|
4.2
|
%
|
12.4
|
%
|
2.9
|
%
|
3.7
|
%
|
4.1
|
%
|
4.2
|
%
|
7.4
|
%
|
|||||||||
|
Risk in Force Distribution By Level of Documentation:
|
Full
Documentation
|
Reduced
Documentation
|
|||
|
Traditional Primary:
|
|||||
|
As of December 31:
|
|||||
|
2014
|
92.7
|
%
|
7.3
|
%
|
|
|
2015
|
92.6
|
|
7.4
|
|
|
|
2016
|
92.4
|
%
|
7.6
|
%
|
|
|
Bulk (a):
|
|||||
|
As of December 31:
|
|||||
|
2014
|
62.3
|
%
|
37.7
|
%
|
|
|
2015
|
66.6
|
|
33.4
|
|
|
|
2016
|
68.0
|
%
|
32.0
|
%
|
|
47
|
Risk in Force Distribution By Loan Type:
|
Fixed Rate
& ARMs
with Resets
>=5 Years
|
ARMs with
Resets <5
years
|
|||
|
Traditional Primary:
|
|||||
|
As of December 31:
|
|||||
|
2014
|
97.2
|
%
|
2.8
|
%
|
|
|
2015
|
97.3
|
|
2.7
|
|
|
|
2016
|
97.2
|
%
|
2.8
|
%
|
|
|
Bulk (a):
|
|||||
|
As of December 31:
|
|||||
|
2014
|
72.4
|
%
|
27.6
|
%
|
|
|
2015
|
71.8
|
|
28.2
|
|
|
|
2016
|
71.3
|
%
|
28.7
|
%
|
|
__________
|
(a)
|
Bulk pool risk in-force, which represented
13.9%
of total bulk risk in-force at
December 31, 2016
, has been allocated pro-rata based on insurance in-force.
|
The Company's consumer credit indemnity ("CCI") earned premiums and related risk in force included in the table below have reflected a generally declining trend. The decline is largely due to a discontinuation of active sales efforts since 2008. The following table shows CCI net premiums earned during the indicated periods and the maximum calculated risk in force at the end of the respective periods. Net earned premiums include additional premium adjustments arising from the variable claim experience of individual policies subject to retrospective rating plans. Risk in force reflects estimates of the maximum risk exposures at the inception of individual policies adjusted for cumulative claim costs and the lower outstanding loan balances attributed to such policies through the end of the periods shown below.
|
Net CCI Earned Premiums
|
Risk in
Force
|
||||||
|
Years Ended December 31:
|
|||||||
|
2014
|
$
|
27.7
|
|
$
|
858.5
|
|
|
|
2015
|
23.9
|
|
776.9
|
|
|||
|
2016
|
$
|
15.8
|
|
$
|
699.7
|
|
|
|
Revenues: Net Investment Income
|
Net investment income is affected by trends in interest and dividend yields for the types of securities in which the Company's funds are invested during each reporting period. The following tables reflect the segmented and consolidated invested asset bases as of the indicated dates, and the investment income earned and resulting yields on such assets. Since the Company can exercise little control over fair values, yields are evaluated on the basis of investment income earned in relation to the cost of the underlying invested assets, though yields based on the fair values of such assets are also shown in the statistics below.
|
Invested Assets at Adjusted Cost
|
Fair
Value
Adjust-
ment
|
Invested
Assets at
Fair
Value (a)
|
|||||||||||||||||||||||||
|
General
|
Title
|
RGIG Run-off
|
Corporate
and Other
|
Total
|
|||||||||||||||||||||||
|
As of December 31:
|
|||||||||||||||||||||||||||
|
2015
|
$
|
8,667.4
|
|
$
|
1,010.5
|
|
$
|
792.0
|
|
$
|
562.3
|
|
$
|
11,032.4
|
|
$
|
193.0
|
|
$
|
11,225.5
|
|
||||||
|
2016
|
$
|
9,255.8
|
|
$
|
1,100.2
|
|
$
|
685.3
|
|
$
|
1,073.6
|
|
$
|
12,115.1
|
|
$
|
642.5
|
|
$
|
12,757.7
|
|
||||||
__________
(a) The
December 31, 2016
and
2015
amounts include
$947.4
and
$359.7
, respectively, (fair value) fixed maturity securities classified as held to maturity which are reported and reflected herein at amortized cost of
$974.8
and
$355.8
, respectively.
48
|
Net Investment Income
|
Yield at
|
||||||||||||||||||||||||
|
General
|
Title
|
RFIG Run-off
|
Corporate
and Other
|
Total
|
Original
Cost
|
Fair
Value
|
|||||||||||||||||||
|
Years Ended
|
|||||||||||||||||||||||||
|
December 31:
|
|||||||||||||||||||||||||
|
2014
|
$
|
278.8
|
|
$
|
29.9
|
|
$
|
27.5
|
|
$
|
9.2
|
|
$
|
345.5
|
|
3.33
|
%
|
3.15
|
%
|
||||||
|
2015
|
312.1
|
|
34.0
|
|
25.1
|
|
17.2
|
|
388.6
|
|
3.61
|
|
3.49
|
|
|||||||||||
|
2016
|
$
|
312.1
|
|
$
|
36.2
|
|
$
|
23.2
|
|
$
|
15.4
|
|
$
|
387.0
|
|
3.34
|
%
|
3.23
|
%
|
||||||
Consolidated net investment income increased by
12.5%
and
8.4%
in
2015
and
2014
, respectively, and declined by
.4%
in
2016
. This revenue source is affected by changes in the invested asset base which are mainly driven by consolidated operating cash flows, by a concentration of investable assets in interest-bearing securities, and by changes in market rates of return. The yields for the periods presented reflect an increasingly greater commitment to high quality dividend paying common stocks. In addition, 2015 yields benefitted from the receipt of two special common stock dividends.
|
Revenues: Net Realized Gains (Losses)
|
The Company's investment policies are not designed to maximize or emphasize the realization of investment gains. Rather, these policies aim for a stable source of income from interest and dividends, protection of capital, and the providing of sufficient liquidity to meet insurance underwriting and other obligations as they become payable in the future. Dispositions of fixed maturity securities generally arise from scheduled maturities and early calls; in
2016
,
2015
, and
2014
,
76.0%
,
74.6%
and
50.2%
, respectively, of all such dispositions resulted from these occurrences. Dispositions of securities at a realized gain or loss reflect such factors as ongoing assessments of issuers' business prospects, allocation to industry sectors, changes in credit quality, and tax planning considerations. Additionally, the amount of net realized gains and losses registered in any one accounting period are affected by the aforementioned assessments of securities' values for other-than-temporary impairment. As a result of the interaction of all these factors and considerations, net realized investment gains or losses can vary significantly from period-to-period, and, in the Company's view, are not indicative of any particular trend or result in the basics of its insurance business.
The following table reflects the composition of net realized gains or losses for the periods shown. Gains realized in 2014 reflect sales of non-income producing or low yielding securities, the proceeds of which have largely been reinvested in higher yielding common shares of U.S. companies with distinguished long-term records of earnings and dividend growth.
|
Realized Gains (Losses) on
Disposition of Securities
|
Impairment Losses on Securities
|
||||||||||||||||||||||||||
|
Fixed
maturity
securities
|
Equity
securities
and miscel-
laneous
investments
|
Total
|
Fixed
maturity
securities
|
Equity
securities
and miscel-
laneous
investments
|
Total
|
Net
realized
gains
(losses)
|
|||||||||||||||||||||
|
Years Ended
|
|||||||||||||||||||||||||||
|
December 31:
|
|
||||||||||||||||||||||||||
|
2014
|
$
|
27.0
|
|
$
|
245.2
|
|
$
|
272.3
|
|
$
|
—
|
|
$
|
—
|
|
$
|
—
|
|
$
|
272.3
|
|
||||||
|
2015
|
16.3
|
|
75.0
|
|
91.3
|
|
—
|
|
—
|
|
—
|
|
91.3
|
|
|||||||||||||
|
2016
|
$
|
7.8
|
|
$
|
69.9
|
|
$
|
77.8
|
|
$
|
(4.9
|
)
|
$
|
—
|
|
$
|
(4.9
|
)
|
$
|
72.8
|
|
||||||
|
Expenses: Benefits and Claims
|
The Company records the benefits, claims and related settlement costs that have been incurred during each accounting period. Total claim costs are affected by the amount of paid claims and the adequacy of reserve estimates established for current and prior years' claim occurrences at each balance sheet date.
The following table shows a breakdown of gross and net of reinsurance claim reserve estimates for major types of insurance coverages as of
December 31, 2016
and
2015
:
49
|
Claim and Loss Adjustment Expense Reserves
|
|||||||||||||||||||
|
December 31:
|
2016
|
2015
|
|||||||||||||||||
|
Gross
|
Net
|
Gross
|
Net
|
||||||||||||||||
|
Workers' compensation
|
$
|
4,587.0
|
|
$
|
2,883.3
|
|
$
|
4,410.6
|
|
$
|
2,750.1
|
|
|||||||
|
General liability
|
1,064.0
|
|
550.3
|
|
1,097.7
|
|
549.4
|
|
|||||||||||
|
Commercial automobile (mostly trucking)
|
1,380.8
|
|
1,090.8
|
|
1,288.4
|
|
1,046.6
|
|
|||||||||||
|
Other coverages
|
769.5
|
|
539.3
|
|
785.9
|
|
532.8
|
|
|||||||||||
|
Unallocated loss adjustment expense reserves
|
206.9
|
|
186.0
|
|
191.4
|
|
174.0
|
|
|||||||||||
|
Total general insurance reserves
|
8,008.3
|
|
5,249.9
|
|
7,774.3
|
|
5,053.1
|
|
|||||||||||
|
Title
|
602.0
|
|
602.0
|
|
580.8
|
|
580.8
|
|
|||||||||||
|
RFIG Run-off
|
574.0
|
|
574.0
|
|
737.9
|
|
736.7
|
|
|||||||||||
|
Life and accident
|
21.5
|
|
13.8
|
|
27.0
|
|
16.9
|
|
|||||||||||
|
Total claim and loss adjustment expense reserves
|
$
|
9,206.0
|
|
$
|
6,439.8
|
|
$
|
9,120.1
|
|
$
|
6,387.6
|
|
|||||||
|
Asbestosis and environmental claim reserves included
|
|||||||||||||||||||
|
in the above general insurance reserves:
|
|||||||||||||||||||
|
Amount
|
$
|
121.2
|
|
$
|
97.1
|
|
$
|
130.9
|
|
$
|
100.6
|
|
|||||||
|
% of total general insurance reserves
|
1.5
|
%
|
1.9
|
%
|
1.7
|
%
|
2.0
|
%
|
|||||||||||
The Company's reserve for loss and loss adjustment expenses represents the accumulation of estimates of ultimate losses payable, including incurred but not reported losses and loss adjustment expenses. The establishment of claim reserves by the Company's insurance subsidiaries is a reasonably complex and dynamic process influenced by a large variety of factors as further discussed below. Consequently, reserves established are a reflection of the opinions of a large number of persons, of the application and interpretation of historical precedent and trends, of expectations as to future developments, and of management's judgment in interpreting all such factors. At any point in time, the Company is exposed to the risk of possibly higher or lower than anticipated claim costs and the resulting changes in estimates are recorded in operations of the periods during which they are made. Increases to prior reserve estimates are often referred to as unfavorable development whereas any changes that decrease previous estimates of the Company's ultimate liability are referred to as favorable development.
Overview of Loss Reserving Process
Most of Old Republic's consolidated claim and related expense reserves stem from its
general insurance
business. At
December 31, 2016
, such reserves accounted for
87.0%
and
81.5%
of consolidated gross and net of reinsurance reserves, respectively, while similar reserves at
December 31, 2015
represented
85.2%
and
79.1%
of the respective consolidated amounts.
The Company's reserve setting process reflects the nature of its insurance business and the operationally decentralized basis upon which it is conducted. Old Republic's
general insurance
operations encompasses a large variety of lines or classes of commercial insurance; it has negligible exposure to personal lines such as homeowners or private passenger automobile insurance that exhibit wide diversification of risks, significant frequency of claim occurrences, and high degrees of statistical credibility. Additionally, the Company's insurance subsidiaries do not provide significant amounts of insurance protection for premises; most of its property insurance exposures relate to cargo, incidental property, and insureds' inland marine assets. Consequently, the wide variety of policies issued and commercial insurance customers served require that loss reserves be analyzed and established in the context of the unique or different attributes of each block or class of business produced by the Company. For example, accident liability claims emanating from insured trucking companies or from general aviation customers become known relatively quickly, whereas claims of a general liability nature arising from the building activities of a construction company may emerge over extended periods of time. Similarly, claims filed pursuant to errors and omissions or directors and officers' liability coverages are usually not prone to immediate evaluation or quantification inasmuch as many such claims may be litigated over several years and their ultimate costs may be affected by the vagaries of judged or jury verdicts. Approximately
93%
of the
general insurance
group's claim reserves stem from liability insurance coverages for commercial customers which typically require more extended periods of investigation and at times protracted litigation before they are finally settled. As a consequence of these and other factors, Old Republic does not utilize a single, overarching loss reserving approach.
The Company prepares periodic analyses of its loss reserve estimates for its significant insurance coverages. It establishes point estimates for most losses on an insurance coverage line-by-line basis for individual subsidiaries, sub-classes, individual accounts, blocks of business or other unique concentrations of insurance risks such as directors and officers' liability, that have similar attributes. Actuarially or otherwise derived ranges of reserve levels are not utilized as such in setting these reserves. Instead the reported reserves encompass the Company's best point estimates at each reporting date and the overall reserve level at any point in time therefore represents the compilation of a very large number of reported reserve estimates and the results of a variety of formula calculations largely driven by analysis of historical data. Reserve releases or additions are implicitly covered by the point estimates incorporated in total reserves at each balance sheet date. The Company does not project future variability or make an explicit provision for uncertainty when determining its best estimate of loss reserves. Over the most recent decade actual incurred losses have developed within a reasonable range of their original estimates.
Aggregate loss reserves consist of liability estimates for claims that have been reported ("case") to the Company's insurance subsidiaries and reserves for claims that have been incurred but not yet reported or whose ultimate costs may
50
not become fully apparent until a future time. Additionally, the Company establishes unallocated loss adjustment expense reserves for loss settlement costs that are not directly related to individual claims. Such reserves are based on prior years' cost experience and trends, and are intended to cover the unallocated costs of claim departments' administration of case and IBNR claims over time. Long-term, disability-type workers' compensation reserves are discounted to present value based on interest rates that range from 3.5% to 4.0%. The amount of discount reflected in the year end net reserves totaled
$231.9
,
$228.6
and
$240.7
as of
December 31, 2016
,
2015
, and
2014
, respectively. Interest accretion of
$24.2
,
$36.7
, and
$26.2
for the years ended
December 31, 2016
,
2015
, and
2014
, respectively, was recognized within benefits, claims and settlement expenses in the consolidated statements of income.
A large variety of statistical analyses and formula calculations are utilized to provide for IBNR claim costs as well as additional costs that can arise from such factors as monetary and social inflation, changes in claims administration processes, changes in reinsurance ceded and recoverability levels, and expected trends in claim costs and related ratios. Typically, such formulas take into account so-called link ratios that represent prior years' patterns of incurred or paid loss trends between succeeding years, or past experience relative to progressions of the number of claims reported over time and ultimate average costs per claim.
Overall, reserves pertaining to several hundred large individual commercial insurance accounts that exhibit sufficient statistical credibility, and at times may be subject to retrospective premium rating plans or the utilization of varying levels or types of self-insured retentions through captive insurers and similar risk management mechanisms are established on an account by account basis using case reserves and applicable formula-driven methods. Large account reserves are usually set and analyzed for groups of coverages such as workers' compensation, commercial auto and general liability that are typically underwritten jointly for many customers. For certain so-called long-tail categories of insurance such as retained or assumed excess liability or excess workers' compensation, officers and directors' liability, and commercial umbrella liability relative to which claim development patterns are particularly long, more volatile, and immature in their early stages of development, the Company judgmentally establishes the most current accident years' loss reserves on the basis of expected loss ratios. Such expected loss ratios typically reflect currently estimated loss ratios from prior accident years, adjusted for the effect of actual and anticipated rate changes, actual and anticipated changes in coverage, reinsurance, mix of business, and other anticipated changes in external factors such as trends in loss costs or the legal and claims environment. Expected loss ratios are generally used for at least the two to three most recent accident years depending on the individual class or category of business. As actual claims data emerges in succeeding interim and annual periods, the original accident year loss ratio assumptions are validated or otherwise adjusted sequentially through the application of statistical projection techniques such as the Bornhuetter/Ferguson method which utilizes data from the more mature experience of prior years to arrive at a likely indication of more recent years' loss trends and costs.
Title insurance
and related escrow services loss and loss adjustment expense reserves are established as point estimates to cover the projected settlement costs of known as well as IBNR losses related to premium and escrow service revenues of each reporting period. Reserves for known claims are based on an assessment of the facts available to the Company during the settlement process. The point estimates covering all claim reserves inherently take into account IBNR claims based on past experience and evaluations of such variables as changing trends in the types of policies issued, changes in real estate markets and interest rate environments, and changing levels of loan refinancing, all of which can have a bearing on the emergence, number, and ultimate costs of claims.
RFIG Run-off mortgage guaranty
insurance
reserves for unpaid claims and claim adjustment expenses are recognized only upon an instance of default, defined as an insured mortgage loan for which two or more consecutive monthly payments have been missed. Loss reserves are based on statistical calculations that take into account the number of reported insured mortgage loan defaults as of each balance sheet date, as well as experience-based estimates of loan defaults that have occurred but have not as yet been reported. Further, the loss reserve estimating process takes into account a large number of variables including trends in claim severity, potential salvage recoveries, expected cure rates for reported loan delinquencies at various stages of default, the level of coverage rescissions and claims denials due to material misrepresentation in key underwriting information or non-compliance with prescribed underwriting guidelines, and management judgments relative to future employment levels, housing market activity, and mortgage loan interest costs, demand, and extensions.
The Company has the legal right to rescind mortgage insurance coverage unilaterally as expressly stated in its policy. Moreover, two federal courts that have considered that policy wording have each affirmed that right (See
First Tennessee Bank N.A.
v.
Republic Mortg. Ins. Co.
, Case No. 2:10-cv-02513-JPM-cgc (W.D. Tenn., Feb. 25, 2011) and
JPMorgan Chase Bank N.A.
v.
Republic Mortg. Ins. Co.
, Civil Action No. 10-06141 (SRC) (D. NJ, May 4, 2011), each decision citing supporting state law legal precedent). RMIC's mortgage insurance policy provides that
the insured represents that
a
ll statements made and information provided to it in an application for coverage for a loan, without regard to who made the statements or provided the information, have been made and presented for and on behalf of the insured; and that
s
uch statements and information are neither false nor misleading in any material respect, nor omit any fact necessary to make such statements and information not false or misleading in any material respect. According to the policy, if any of those representations are materially false or misleading with respect to a loan, the Company has the right to cancel or rescind coverage for that loan retroactively to commencement of the coverage. Whenever the Company determines that an application contains a material misrepresentation, it either advises the insured in writing of its findings prior to rescinding coverage or exercises its unilateral right to rescind coverage for that loan, stating the reasons for that action in writing and returning the applicable premium. The rescission of coverage in instances of materially faulty representations or warranties provided in applications
for insurance is a necessary and prevailing practice throughout the insurance industry. In the case of mortgage guaranty insurance, rescissions have occurred regularly over the years but have been generally immaterial. Since 2008, however, the Company has experienced a much greater incidence of rescissions due to increased levels of observed fraud and misrepresentations in insurance applications pertaining to business underwritten
51
between 2004 and the first half of 2008. As a result, the Company has incorporated certain assumptions regarding the expected levels of coverage rescissions and claim denials in its reserving methodology since 2008. Such estimates, which are evaluated at each balance sheet date, take into account observed as well as historical trends in rescission and denial rates. The table below shows the estimated effects of coverage rescissions and claim denials on loss reserves and settled and incurred losses.
|
2016
|
2015
|
2014
|
|||||||||
|
Estimated reduction in beginning reserve
|
$
|
47.5
|
|
$
|
79.3
|
|
$
|
115.2
|
|
||
|
Total incurred claims and settlement expenses reduced
|
|||||||||||
|
(increased) by changes in estimated rescissions:
|
|||||||||||
|
Current year
|
8.3
|
|
18.8
|
|
47.1
|
|
|||||
|
Prior year
|
(24.8
|
)
|
(17.6
|
)
|
10.4
|
|
|||||
|
Sub-total
|
(16.5
|
)
|
1.2
|
|
57.6
|
|
|||||
|
Estimated rescission reduction in paid claims
|
(1.4
|
)
|
(33.0
|
)
|
(93.5
|
)
|
|||||
|
Estimated reduction in ending reserve
|
$
|
29.6
|
|
$
|
47.5
|
|
$
|
79.3
|
|
||
As noted above, the estimated reduction in ending loss reserves reflects, in large measure, a variety of judgments relative to the level of expected coverage rescissions and claim denials on loans that are in default as of each balance sheet date. The provision for insured events of the current year resulted from actual and anticipated rescissions and claim denials attributable to newly reported delinquencies in each respective year. The provision for insured events of prior years resulted from actual rescission and claim denial activity, reinstatement of previously rescinded or denied claims, or revisions in assumptions regarding expected rescission or claim denial rates on outstanding prior year delinquencies. The trends since 2010 reflect a continuing reduction in the level of actual and anticipated rescission and claim denial rates on total outstanding delinquencies. Claims not paid by virtue of rescission or denial represent the Company's estimated contractual risk, before consideration of the impacts of any reinsurance and deductibles or aggregate loss limits, on cases that are settled by the issuance of a rescission or denial notification. Variances between the estimated rescission and actual claim denial rate are reflected in the periods during which they occur.
Although the insured has no right under the policy to appeal a Company claim decision, the insured may, at any time, contest in writing the Company's findings or action with respect to a loan or a claim. In such cases, the Company considers any additional information supplied by the insured. This consideration may lead to further investigation, retraction or confirmation of the initial determination. If the Company concludes that it will reinstate coverage, it advises the insured in writing that it will do so immediately upon receipt of the premium previously returned. Reserves are not adjusted for potential reversals of rescissions or adverse rulings for loans under dispute since such reversals of claim rescissions and denials have historically been immaterial to the reserve estimation process.
Incurred Loss Experience
Management believes that the Company's overall reserving practices have been consistently applied over many years. For at least the past ten years, previously established aggregate reserves have produced reasonable estimates of the cumulative ultimate net costs of claims incurred. However, there are no guarantees that such outcomes will continue, and, accordingly, no representation is made that ultimate net claim and related costs will not develop in future years to be greater or lower than currently established reserve estimates. In management's opinion, however, such potential development is not likely to have a material effect on the Company's consolidated financial position, although it could affect materially its consolidated results of operations for any one annual or interim reporting period. See further discussion in this Annual Report on Form 10-K under Item 1A - Risk Factors.
The following table shows an analysis of changes in aggregate reserves for the Company's losses, claims, and settlement expenses for each of the years shown.
52
|
Years Ended December 31:
|
2016
|
2015
|
2014
|
||||||||||||
|
Gross reserves at beginning of year
|
$
|
9,120.1
|
|
$
|
9,122.0
|
|
$
|
9,433.5
|
|
||||||
|
Less: reinsurance losses recoverable
|
2,732.5
|
|
3,006.6
|
|
2,836.7
|
|
|||||||||
|
Net reserves at beginning of year:
|
|||||||||||||||
|
General Insurance
|
5,053.1
|
|
4,722.0
|
|
4,334.1
|
|
|||||||||
|
Title Insurance
|
580.8
|
|
505.4
|
|
471.5
|
|
|||||||||
|
RFIG Run-off
|
736.7
|
|
870.2
|
|
1,774.2
|
|
|||||||||
|
Other
|
16.9
|
|
17.5
|
|
16.8
|
|
|||||||||
|
Sub-total
|
6,387.6
|
|
6,115.3
|
|
6,596.8
|
|
|||||||||
|
Incurred claims and claim adjustment expenses:
|
|||||||||||||||
|
Provisions for insured events of the current year:
|
|||||||||||||||
|
General Insurance
|
2,115.1
|
|
2,081.6
|
|
2,009.8
|
|
|||||||||
|
Title Insurance
|
107.7
|
|
112.1
|
|
105.5
|
|
|||||||||
|
RFIG Run-off (a)
|
171.3
|
|
323.7
|
|
323.1
|
|
|||||||||
|
Other
|
21.7
|
|
25.2
|
|
44.5
|
|
|||||||||
|
Sub-total
|
2,416.0
|
|
2,542.8
|
|
2,483.0
|
|
|||||||||
|
Change in provision for insured events of prior years:
|
|||||||||||||||
|
General Insurance
|
9.9
|
|
43.9
|
|
107.9
|
|
|||||||||
|
Title Insurance
|
(23.4
|
)
|
(12.8
|
)
|
(13.6
|
)
|
|||||||||
|
RFIG Run-off (a)
|
(68.7
|
)
|
(130.1
|
)
|
(74.8
|
)
|
|||||||||
|
Other
|
(3.8
|
)
|
(.6
|
)
|
(1.5
|
)
|
|||||||||
|
Sub-total
|
(86.1
|
)
|
(99.7
|
)
|
17.8
|
|
|||||||||
|
Total incurred claims and claim adjustment expenses (a)
|
2,329.9
|
|
2,443.0
|
|
2,500.9
|
|
|||||||||
|
Payments:
|
|||||||||||||||
|
Claims and claim adjustment expenses attributable to
|
|||||||||||||||
|
insured events of the current year:
|
|||||||||||||||
|
General Insurance
|
723.5
|
|
671.5
|
|
657.0
|
|
|||||||||
|
Title Insurance
|
4.4
|
|
(39.9
|
)
|
4.7
|
|
|||||||||
|
RFIG Run-off (b)
|
14.5
|
|
29.1
|
|
40.6
|
|
|||||||||
|
Other
|
14.8
|
|
16.9
|
|
33.4
|
|
|||||||||
|
Sub-total
|
757.4
|
|
677.6
|
|
735.9
|
|
|||||||||
|
Claims and claim adjustment expenses attributable to
|
|||||||||||||||
|
insured events of prior years:
|
|||||||||||||||
|
General Insurance
|
1,204.5
|
|
1,123.0
|
|
1,072.8
|
|
|||||||||
|
Title Insurance
|
58.6
|
|
63.8
|
|
53.2
|
|
|||||||||
|
RFIG Run-off (b)
|
250.8
|
|
297.9
|
|
1,111.6
|
|
|||||||||
|
Other
|
6.1
|
|
8.3
|
|
8.7
|
|
|||||||||
|
Sub-total
|
1,520.2
|
|
1,493.1
|
|
2,246.5
|
|
|||||||||
|
Total payments (b)
|
2,277.6
|
|
2,170.7
|
|
2,982.4
|
|
|||||||||
|
Amount of reserves for unpaid claims and claim adjustment expenses
|
|||||||||||||||
|
at the end of each year, net of reinsurance losses recoverable: (c)
|
|||||||||||||||
|
General Insurance
|
5,249.9
|
|
5,053.1
|
|
4,722.0
|
|
|||||||||
|
Title Insurance
|
602.0
|
|
580.8
|
|
505.4
|
|
|||||||||
|
RFIG Run-off
|
574.0
|
|
736.7
|
|
870.2
|
|
|||||||||
|
Other
|
13.8
|
|
16.9
|
|
17.5
|
|
|||||||||
|
Sub-total
|
6,439.8
|
|
6,387.6
|
|
6,115.3
|
|
|||||||||
|
Reinsurance losses recoverable
|
2,766.1
|
|
2,732.5
|
|
3,006.6
|
|
|||||||||
|
Gross reserves at end of year
|
$
|
9,206.0
|
|
$
|
9,120.1
|
|
$
|
9,122.0
|
|
||||||
__________
53
Excluding the reclassification of CCI from the General Insurance to the RFIG Run-off Business segment, certain elements shown in the preceding table would have been as follows:
|
2016
|
2015
|
2014
|
||||||||||
|
Change in provision for incurred events of prior years:
|
||||||||||||
|
General Insurance
|
$
|
2.5
|
|
$
|
41.2
|
|
$
|
190.8
|
|
|||
|
RFIG Run-off (a)
|
(61.3
|
)
|
(127.4
|
)
|
(157.8
|
)
|
||||||
|
Payment of claim and claim adjustment expenses attributable to
|
||||||||||||
|
incurred events of the current and prior years:
|
||||||||||||
|
General Insurance
|
1,939.9
|
|
1,830.1
|
|
1,825.5
|
|
||||||
|
RFIG Run-off (b)
|
$
|
253.6
|
|
$
|
291.4
|
|
$
|
1,056.5
|
|
|||
|
(a)
|
In common with all other insurance lines, RFIG Run-off mortgage guaranty settled and incurred claim and claim adjustment expenses include only those costs actually or expected to be paid by the Company. As previously noted, changes in mortgage guaranty aggregate case, IBNR, and loss adjustment expense reserves shown below and entering into the determination of incurred claim costs, take into account, among a large number of variables, claim cost reductions for anticipated coverage rescissions and claims denials.
|
The RFIG Run-off mortgage guaranty provision for insured events of the current year was reduced by estimated coverage rescissions and claim denials of
$8.3
,
$18.8
and
$47.1
, respectively, for
2016
,
2015
and
2014
. The provision for insured events of prior years in
2016
,
2015
and
2014
was (increased) reduced by estimated coverage rescissions and claims denials of
$(24.8)
,
$(17.6)
and
$10.4
, respectively. Prior year development was also affected in varying degrees by differences between actual claim settlements relative to expected experience, by reinstatement of previously rescinded or denied claims, and by subsequent revisions of assumptions in regards to claim frequency, severity or levels of associated claim settlement costs which result from consideration of underlying trends and expectations.
The following table reflects the changes in net reserves between succeeding balance sheet dates.
|
2016
|
2015
|
2014
|
||||||||||
|
Net reserve increase(decrease):
|
||||||||||||
|
General Insurance
|
$
|
196.8
|
|
$
|
331.0
|
|
$
|
387.9
|
|
|||
|
Title Insurance
|
21.2
|
|
75.3
|
|
33.8
|
|
||||||
|
RFIG Run-off
|
(162.7
|
)
|
(133.4
|
)
|
(904.0
|
)
|
||||||
|
Other
|
(3.0
|
)
|
(.6
|
)
|
.7
|
|
||||||
|
Total
|
$
|
52.2
|
|
$
|
272.2
|
|
$
|
(481.5
|
)
|
|||
|
(b)
|
Rescissions reduced the Company's paid losses by an estimated
$1.4
,
$33.0
, and
$93.5
for
2016
,
2015
, and
2014
, respectively. In mid July 2014, in furtherance of a Final Order received from the NCDOI, RMIC and RMICNC processed payments of their accumulated DPO balances of approximately $657.0. Refer to Note 1(s).
|
|
(c)
|
Year end net IBNR reserves for each segment were as follows:
|
|
2016
|
2015
|
2014
|
||||||||||
|
General Insurance
|
$
|
2,431.2
|
|
$
|
2,324.3
|
|
$
|
2,266.2
|
|
|||
|
Title Insurance
|
517.5
|
|
503.8
|
|
432.2
|
|
||||||
|
RFIG Run-off
|
206.3
|
|
180.7
|
|
138.7
|
|
||||||
|
Other
|
5.4
|
|
6.4
|
|
5.7
|
|
||||||
|
Total
|
$
|
3,160.5
|
|
$
|
3,015.3
|
|
$
|
2,843.0
|
|
|||
The percentage of net claims, benefits and related settlement expenses incurred as a percentage of premiums and related fee revenues of the Company's three major operating segments and for consolidated operations were as follows:
54
|
Years Ended December 31:
|
2016
|
2015
|
2014
|
||||||
|
General
|
73.0
|
%
|
74.1
|
%
|
77.9
|
%
|
|||
|
Title
|
3.8
|
|
4.9
|
|
5.2
|
|
|||
|
RFIG Run-off
|
60.4
|
|
88.0
|
|
97.2
|
|
|||
|
Consolidated benefits and claim ratio
|
44.0
|
%
|
47.5
|
%
|
52.3
|
%
|
|||
|
Reconciliation of consolidated ratio:
|
|||||||||
|
Provision for insured events of the current year
|
45.6
|
%
|
49.4
|
%
|
51.9
|
%
|
|||
|
Change in provision for insured events of prior years:
|
|||||||||
|
net (favorable) unfavorable development
|
(1.6
|
)
|
(1.9
|
)
|
.4
|
|
|||
|
Consolidated benefits and claim ratio
|
44.0
|
%
|
47.5
|
%
|
52.3
|
%
|
|||
The consolidated benefits and claim ratio reflects the changing effects of period-to-period contributions of each segment to consolidated results, and this ratio's variances within each segment. For the three most recent calendar years, the above table indicates that the one-year development of consolidated reserves at the beginning of each year produced favorable developments in 2016 and 2015, and unfavorable development in 2014 which on average decreased the consolidated loss ratio by 1.1%.
The percentage of net claims, benefits and related settlement expenses measured against premiums earned by major types of
general insurance
coverage were as follows:
|
General Insurance Claim Ratios by Type of Coverage
|
||||||||||||||||||||
|
All
Coverages
|
Commercial
Automobile
(mostly
trucking)
|
Workers'
Compen-sation
|
Financial
Indemnity
|
Inland
Marine
and
Property
|
General
Liability
|
Other
|
||||||||||||||
|
Years Ended
|
||||||||||||||||||||
|
December 31:
|
||||||||||||||||||||
|
2014
|
77.9
|
%
|
74.0
|
%
|
89.2
|
%
|
25.6
|
%
|
65.7
|
%
|
88.2
|
%
|
67.8
|
%
|
||||||
|
2015
|
74.1
|
|
77.8
|
|
80.7
|
|
39.1
|
|
57.0
|
|
76.8
|
|
60.4
|
|
||||||
|
2016
|
73.0
|
%
|
79.4
|
%
|
76.1
|
%
|
45.5
|
%
|
60.9
|
%
|
77.5
|
%
|
62.2
|
%
|
||||||
The overall
general insurance
2016, 2015 and 2014 claim ratio remained at relatively high levels as workers' compensation and general liability loss costs continued to reflect greater-than-expected severity. For 2016 and 2015, commercial automobile insurance experienced greater frequency and severity of claims while workers' compensation and general liability insurance loss costs subsided somewhat from 2014's higher levels. Claims are a major cost factor and changes in them reflect continually evolving pricing and risk selection together with changes in loss severity and frequency.
During the three most recent calendar years, the
general insurance
group experienced unfavorable developments of prior year loss reserves for 2016, 2015 and 2014. The effect was to increase the claim ratio by .3, 1.5 and 3.9 percentage points in 2016, 2015, and 2014, respectively. During 2016, 2015, and 2014, the General Insurance Group experienced unfavorable developments of previously established reserves for accidents or events which occurred in 2014 and prior years in particular. These adverse developments were concentrated in workers' compensation and general liability case reserves and resulted from settlements or reserve additions exceeding the previously established indemnity and/or allocated loss adjustment expense provisions.
Unfavorable A&E claim developments, although not material in any of the periods presented, are typically attributable to A&E claim reserves due to periodic re-evaluations of such reserves as well as subsequent reclassifications of other coverages' reserves, most often workers' compensation, deemed assignable to A&E category of losses. Except for a small portion that emanates from ongoing primary insurance operations, a large majority of the A&E claim reserves posted by Old Republic stem mainly from its participations in assumed reinsurance treaties and insurance pools which were discontinued during the 1980's and have since been in run-off status. With respect to the primary portion of gross A&E reserves, Old Republic administers the related claims through its claims personnel as well as outside attorneys, and posted reserves reflect its best estimates of ultimate claim costs. Claims administration for the assumed portion of the Company's A&E exposures is handled by the claims departments of unrelated primary or ceding reinsurance companies. While the Company performs periodic reviews of certain claim files managed by third parties, the overall A&E reserves it establishes respond to the paid claim and case reserve activity reported to the Company as well as available industry statistical data such as so-called survival ratios. Such ratios represent the number of years' average paid losses for the three or five most recent calendar years that are encompassed by an insurer's A&E reserve level at any point in time. According to this simplistic appraisal of an insurer's A&E loss reserve level, Old Republic's average five year paid loss survival ratios stood at
4.3
years (gross) and
6.3
years (net of reinsurance) as of
December 31, 2016
and
4.7
years (gross) and
6.2
years (net of reinsurance) as of
December 31, 2015
. Fluctuations in this ratio between years can be caused by the inconsistent pay out patterns associated with these types of claims. Incurred net losses for A&E claims have averaged
.4%
of
general insurance
group net incurred losses for the five years ended
December 31, 2016
.
55
A summary of reserve activity, including estimates for IBNR, relating to A&E claims at
December 31, 2016
and
2015
is as follows:
|
December 31:
|
2016
|
2015
|
||||||||||||||
|
Gross
|
Net
|
Gross
|
Net
|
|||||||||||||
|
Asbestos:
|
||||||||||||||||
|
Reserves at beginning of year
|
$
|
97.4
|
|
$
|
79.3
|
|
$
|
98.7
|
|
$
|
85.3
|
|
||||
|
Loss and loss expenses incurred
|
16.9
|
|
9.4
|
|
13.4
|
|
1.8
|
|
||||||||
|
Claims and claim adjustment expenses paid
|
24.8
|
|
11.9
|
|
14.7
|
|
7.9
|
|
||||||||
|
Reserves at end of year
|
89.6
|
|
76.7
|
|
97.4
|
|
79.3
|
|
||||||||
|
Environmental:
|
||||||||||||||||
|
Reserves at beginning of year
|
33.4
|
|
21.2
|
|
30.1
|
|
20.9
|
|
||||||||
|
Loss and loss expenses incurred
|
.8
|
|
.9
|
|
6.9
|
|
3.1
|
|
||||||||
|
Claims and claim adjustment expenses paid
|
2.6
|
|
1.8
|
|
3.6
|
|
2.7
|
|
||||||||
|
Reserves at end of year
|
31.6
|
|
20.4
|
|
33.4
|
|
21.2
|
|
||||||||
|
Total asbestos and environmental reserves
|
$
|
121.2
|
|
$
|
97.1
|
|
$
|
130.9
|
|
$
|
100.6
|
|
||||
Title insurance
loss ratios have remained in the low single digits for a number of years due to a continuation of favorable trends in claims frequency and severity.
The
RFIG Run-off mortgage guaranty
2016 claim ratio was less affected by litigation expense provisions that impacted adversely the 2015 claim ratio. Excluding the affects of the litigation expense provisions, the claim ratios continue to decline due to the combined effects of further reductions in newly reported defaults and a rising rate at which previously reported defaults have cured or otherwise been resolved without payment. These factors led to highly favorable developments of prior year-end claim reserves during 2016, 2015, and 2014. Setting aside the aforementioned litigation expense provisions in 2015, these favorable reserve developments accounted for reductions of 39.8, 65.0, and 69.3 percentage points in the reported claim ratio for the years ended December 31, 2016, 2015, and 2014, respectively.
The
RFIG Run-off CCI
business loss costs and resultant claim ratios reflect greater volatility due to the impact of ongoing litigation costs. In 2016 and several prior years, the latter have been particularly impacted by ongoing costs of a near-eight-year long commercial dispute being litigated with Bank of America and its acquired Countrywide mortgage banking subsidiaries.
Certain
mortgage guaranty
average claim-related trends are listed below:
|
Average Settled Claim
Amount (a)
|
Reported Delinquency
Ratio at End of Period
|
Claims
Rescissions
and
Denials
|
|||||||||||||||
|
Traditional
Primary
|
Bulk
|
Traditional
Primary
|
Bulk
|
||||||||||||||
|
Years Ended December 31:
|
|||||||||||||||||
|
2014
|
$
|
45,607
|
|
$
|
44,465
|
|
10.93
|
%
|
23.01
|
%
|
$
|
93.5
|
|
||||
|
2015
|
45,745
|
|
46,669
|
|
10.45
|
|
26.74
|
|
33.0
|
|
|||||||
|
2016
|
$
|
45,478
|
|
$
|
48,158
|
|
10.53
|
%
|
25.78
|
%
|
$
|
1.4
|
|
||||
__________
|
(a)
|
Amounts are in whole dollars.
|
|
Traditional Primary Delinquency Ratios for Top Ten States (b):
|
|||||||||||||||||||||||||||||
|
TX
|
FL
|
GA
|
IL
|
CA
|
NC
|
PA
|
MD
|
NJ
|
VA
|
||||||||||||||||||||
|
As of December 31:
|
|||||||||||||||||||||||||||||
|
2014
|
7.1
|
%
|
17.6
|
%
|
8.8
|
%
|
12.9
|
%
|
7.3
|
%
|
8.7
|
%
|
12.8
|
%
|
15.6
|
%
|
25.6
|
%
|
8.2
|
%
|
|||||||||
|
2015
|
7.7
|
|
13.5
|
|
8.4
|
|
10.8
|
|
6.1
|
|
8.6
|
|
12.2
|
|
13.3
|
|
25.0
|
|
8.5
|
|
|||||||||
|
2016
|
9.1
|
%
|
11.8
|
%
|
8.7
|
%
|
10.7
|
%
|
6.1
|
%
|
8.3
|
%
|
12.7
|
%
|
12.8
|
%
|
23.5
|
%
|
8.6
|
%
|
|||||||||
|
Bulk Delinquency Ratios for Top Ten States (b):
|
|||||||||||||||||||||||||||||
|
TX
|
FL
|
GA
|
IL
|
CA
|
AZ
|
PA
|
OH
|
NJ
|
NY
|
||||||||||||||||||||
|
As of December 31:
|
|||||||||||||||||||||||||||||
|
2014
|
15.9
|
%
|
30.0
|
%
|
16.5
|
%
|
25.0
|
%
|
18.1
|
%
|
13.3
|
%
|
25.8
|
%
|
16.0
|
%
|
46.5
|
%
|
43.4
|
%
|
|||||||||
|
2015
|
19.0
|
|
38.9
|
|
17.6
|
|
25.7
|
|
26.0
|
|
22.4
|
|
26.9
|
|
16.3
|
|
59.0
|
|
52.1
|
|
|||||||||
|
2016
|
20.3
|
%
|
33.7
|
%
|
19.6
|
%
|
23.6
|
%
|
29.1
|
%
|
24.4
|
%
|
28.1
|
%
|
14.1
|
%
|
61.0
|
%
|
53.3
|
%
|
|||||||||
56
|
Total Delinquency Ratios for Top Ten States (includes "other" business) (b):
|
|||||||||||||||||||||||||||||
|
TX
|
FL
|
GA
|
IL
|
CA
|
NC
|
PA
|
MD
|
NJ
|
NY
|
||||||||||||||||||||
|
As of December 31:
|
|||||||||||||||||||||||||||||
|
2014
|
7.7
|
%
|
19.5
|
%
|
9.4
|
%
|
13.8
|
%
|
9.9
|
%
|
9.4
|
%
|
13.7
|
%
|
16.1
|
%
|
28.0
|
%
|
26.8
|
%
|
|||||||||
|
2015
|
8.3
|
|
15.9
|
|
8.8
|
|
11.5
|
|
9.3
|
|
9.0
|
|
13.0
|
|
14.2
|
|
27.4
|
|
28.4
|
|
|||||||||
|
2016
|
9.8
|
%
|
13.4
|
%
|
9.1
|
%
|
11.3
|
%
|
9.3
|
%
|
8.5
|
%
|
13.5
|
%
|
13.5
|
%
|
25.6
|
%
|
27.7
|
%
|
|||||||||
__________
|
(b)
|
As determined by risk in force as of
December 31, 2016
, these 10 states represent approximately 51.5%, 57.8%, and 51.5%, of traditional primary, bulk, and total risk in force, respectively.
|
The following table shows CCI claim-related trends for the periods shown:
|
Reported
Delinquency
Ratio at End
of Period
|
Claim
Rescissions
and Denials
|
|||||||||||||||||||
|
CCI Claim Costs
|
||||||||||||||||||||
|
Paid
|
Incurred
|
|||||||||||||||||||
|
Amount
|
Ratio (a)
|
Amount
|
Ratio (a)
|
|||||||||||||||||
|
Years Ended
|
||||||||||||||||||||
|
December 31:
|
||||||||||||||||||||
|
2014
|
$
|
95.7
|
|
344.9
|
%
|
$
|
137.2
|
|
494.4
|
%
|
2.1
|
%
|
$
|
25.2
|
|
|||||
|
2015
|
35.6
|
|
148.8
|
|
83.0
|
|
346.9
|
|
2.1
|
|
19.1
|
|
||||||||
|
2016
|
$
|
11.7
|
|
74.0
|
%
|
$
|
50.0
|
|
315.9
|
%
|
2.0
|
%
|
$
|
10.1
|
|
|||||
__________
|
(a)
|
Percent of net CCI earned premiums. CCI claim ratios include only those costs actually or expected to be paid by the Company and exclude claims not paid by virtue of coverage rescissions and claim denials as well as unsubstantiated claim submissions. Certain claim rescissions and denials may from time to time become the subject of disagreements between the Company and certain individual insureds. Possible future reversals of such rescissions and denials, however, may not necessarily affect the adequacy of previously established claim reserve levels nor fully impact operating results. These effects could be fully or partially negated by the imposition of additional retrospective premiums and/or the limiting effects of maximum policy limits.
|
Volatility of Reserve Estimates and Sensitivity
There is a great deal of uncertainty in the estimates of loss and loss adjustment expense reserves, and unanticipated events can have both a favorable or unfavorable impact on such estimates. The Company believes that the factors most responsible, in varying and continually changing degrees, for such favorable or unfavorable development are as follows:
General insurance
net claim reserves can be affected by lower than expected frequencies of claims incurred but not reported, the effect of reserve discounts applicable to workers' compensation claims, higher than expected severity of litigated claims in particular, governmental or judicially imposed retroactive conditions in the settlement of claims such as noted elsewhere in this document in regard to black lung disease claims, greater than anticipated inflation rates applicable to repairs and the medical benefits portion of claims, and higher than expected IBNR due to the slower and highly volatile emergence patterns applicable to certain types of claims such as those stemming from litigated, assumed reinsurance, or the A&E types of claims noted above.
Title insurance
loss reserve levels can be impacted adversely by such developments as reduced loan refinancing activity, the effect of which can be to lengthen the period during which title policies remain exposed to loss emergence. Such reserve levels can also be affected by reductions in either property values or the volume of transactions which, by virtue of the speculative nature of some real estate developments, can lead to increased occurrences of fraud, defalcations or mechanics' liens.
RFIG Run-off mortgage guaranty
net claim reserve levels can be influenced adversely by several factors. These include changes in the mix of insured business toward loans that have a higher probability of default, increases in the average risk per insured loan, the levels of estimated rescission and claim denial activity, the deterioration of regional or national economic conditions leading to a reduction in borrowers' income and thus their ability to make payments on outstanding loans, and reductions in housing values and/or increases in housing supply that can raise the rate at which defaults evolve into claims and affect their overall severity.
With respect to Old Republic's small
life and accident
insurance operations, reserve adequacy may be impacted adversely by greater than anticipated medical care cost inflation as well as greater than expected frequency and severity of claims. In life insurance, as in general insurance, concentrations of insured lives coupled with a catastrophic event would represent the Company's largest exposure.
57
Loss reserve uncertainty is illustrated by the variability in loss reserve development presented in the schedule which appears under Item 1 of this Annual Report. That schedule shows the cumulative loss reserve development for each of the past ten years through
December 31, 2016
for the Company's property and liability business which currently represents
84.5%
of Old Republic's total loss and loss adjustment expense reserves, net of reinsurance credits. Through
December 31, 2016
, ending claim reserves for the past ten year-ends have developed favorably, as a percentage of the original estimates, within a range of (5.0)% unfavorable in 2013 to 12.7% favorable in 2006. For the aggregate of ten year-ends, the net development has averaged 2.7% favorable.
On a consolidated basis, which includes all coverages provided by the Company, the cumulative development on prior year loss reserves over the same ten year period has ranged from (7.8)% unfavorable in 2010 to 7.3% favorable in 2006 and averaged .5% favorable for the ten years. Although management does not have a practical business reason for making projections of likely outcomes of future loss developments, its analysis and evaluation of Old Republic's existing business mix, current aggregate loss reserve levels, and loss development patterns suggests a reasonable likelihood that
2016
year-end loss reserves could ultimately develop within a range of +/- 5%. The most significant factors impacting the potential reserve development for each of the Company's insurance segments is discussed above. While Old Republic has generally experienced favorable overall loss developments for the latest ten year period, the current analysis of loss development factors and economic conditions influencing the Company's insurance coverages point to a gradual downward trend in favorable development during the most recent three years with respect to general insurance. In management's opinion, the other segments' loss reserve development patterns (most notably those associated with mortgage insurance) show greater variability due to changes in economic conditions which cannot be reasonably anticipated. Consequently, management believes that using a 5% potential range of reserve development provides a reasonable benchmark for a sensitivity analysis of the Company's consolidated reserves as of
December 31, 2016
.
Reinsurance Programs
To maintain premium production within its capacity and limit maximum losses and risks for which it might become liable under its policies, Old Republic may cede a portion or all of its premiums and liabilities on certain classes of insurance, individual policies, or blocks of business to other insurers and reinsurers. Further discussion of the Company's reinsurance programs can be found in Part 1 of this Annual Report on Form 10-K.
Subsidiaries within the
general insurance
segment have generally obtained reinsurance coverage from independent insurance or reinsurance companies pursuant to excess of loss agreements. Under excess of loss reinsurance agreements the Company is generally reimbursed for claim costs exceeding contractually agreed-upon levels. During the three year period ended
December 31, 2016
, the Company's net retentions have risen gradually within the general insurance segment; however, such changes have not had a material impact on the Company's consolidated financial statements.
Except for relatively few facultative reinsurance cessions covering large risks, the
title insurance
segment does not utilize a significant amount of reinsurance to manage its insurance risk.
Generally, the
RFIG Run-off mortgage guaranty
insurance risk has historically been reinsured through excess of loss contracts with insurers owned by or affiliated with lending institutions and financial and other intermediaries whose customers are insured by Old Republic's mortgage insurance subsidiaries. Effective December 31, 2008, the Company discontinued excess of loss reinsurance cessions to lenders' captive insurance companies for all new production originated subsequent to the effective date.
The Company does not anticipate any significant changes in its reinsurance programs during
2017
.
|
Expenses: Underwriting Acquisition and Other Expenses
|
The following table sets forth the expense ratios registered by each major business segment and in consolidation for the periods shown:
|
General
|
Title
|
RFIG Run-off
|
Consolidated
|
||||||||
|
Years Ended December 31:
|
|||||||||||
|
2014
|
22.9
|
%
|
90.4
|
%
|
9.5
|
%
|
47.1
|
%
|
|||
|
2015
|
23.5
|
|
88.3
|
|
10.0
|
|
48.5
|
|
|||
|
2016
|
24.8
|
%
|
87.9
|
%
|
12.2
|
%
|
50.6
|
%
|
|||
Variations in the Company's consolidated expense ratios reflect a continually changing mix of coverages sold and attendant costs of producing business in the Company's three largest operating segments. To a significant degree, expense ratios for both the general and title insurance segments are mostly reflective of variable costs, such as commissions or similar charges, that rise or decline along with corresponding changes in premium and fee income. Moreover, general operating expenses can contract or expand in differing proportions due to varying levels of operating efficiencies and expense management opportunities in the face of changing market conditions. Relatively higher expense ratios in 2016 resulted mostly from greater costs incurred for a start-up business, additional litigation cost provisions, and by a slightly different premium mix and attendant production costs associated with the business’ responses to recurring changes in insurance market conditions and opportunities. The title insurance expense ratio for 2014 rose as
58
operating costs contracted by a relatively lower percentage than the reduction in revenues. RFIG Run-off operating expense ratios reflect ongoing cost control geared to a run-off operation.
|
Expenses: Total
|
The composite ratios of the above summarized net claims, benefits and underwriting expenses that reflect the sum total of all the factors enumerated above have been as follows:
|
General
|
Title
|
RFIG Run-off
|
Consolidated
|
||||||||
|
Years Ended December 31:
|
|||||||||||
|
2014
|
100.8
|
%
|
95.6
|
%
|
106.7
|
%
|
99.4
|
%
|
|||
|
2015
|
97.6
|
|
93.2
|
|
98.0
|
|
96.0
|
|
|||
|
2016
|
97.8
|
%
|
91.7
|
%
|
72.6
|
%
|
94.6
|
%
|
|||
|
Expenses: Income Taxes
|
The effective consolidated income tax rates were
31.9%
,
33.2%
, and
32.8%
in
2016
,
2015
, and
2014
, respectively. The rates for each year reflect primarily the varying proportions of pretax operating income (loss) derived from partially tax sheltered investment income (principally tax-exempt interest and dividend income), the combination of fully taxable investment income, realized investment gains or losses, underwriting and service income, and judgments about the recoverability of deferred tax assets. A valuation allowance was held against deferred tax assets as of December 31, 2014 related to certain tax credit carryforwards which the Company did not expect to realize. In 2015, the Company released the valuation allowance previously established.
|
OTHER INFORMATION
|
Reference is here made to "Information About Segments of Business" appearing elsewhere herein.
Historical data pertaining to the operating results, liquidity, and other performance indicators applicable to an insurance enterprise such as Old Republic are not necessarily indicative of results to be achieved in succeeding years. In addition to the factors cited below, the long-term nature of the insurance business, seasonal and annual patterns in premium production and incidence of claims, changes in yields obtained on invested assets, changes in government policies and free markets affecting inflation rates and general economic conditions, and changes in legal precedents or the application of law affecting the settlement of disputed and other claims can have a bearing on period-to-period comparisons and future operating results.
Some of the oral or written statements made in the Company's reports, press releases, and conference calls following earnings releases, can constitute "forward-looking statements" within the meaning of the Private Securities Litigation Reform Act of 1995. Of necessity, any such forward-looking statements involve assumptions, uncertainties, and risks that may affect the Company's future performance. With regard to Old Republic's General Insurance segment, its results can be affected, in particular, by the level of market competition, which is typically a function of available capital and expected returns on such capital among competitors, the levels of interest and inflation rates, and periodic changes in claim frequency and severity patterns caused by natural disasters, weather conditions, accidents, illnesses, work-related injuries, and unanticipated external events. Title Insurance and RFIG Run-off results can be affected by similar factors and by changes in national and regional housing demand and values, the availability and cost of mortgage loans, employment trends, and default rates on mortgage loans. Life and accident insurance earnings can be affected by the levels of employment and consumer spending, variations in mortality and health trends, and changes in policy lapsation rates. At the parent holding company level, operating earnings or losses are generally reflective of the amount of debt outstanding and its cost, interest income on temporary holdings of short-term investments, and period-to-period variations in the costs of administering the Company's widespread operations.
A more detailed listing and discussion of the risks and other factors which affect the Company's risk-taking insurance business are included in Part I, Item 1A - Risk Factors, of this Annual Report to the Securities and Exchange Commission, which Item is specifically incorporated herein by reference.
Any forward-looking statements or commentaries speak only as of their dates. Old Republic undertakes no obligation to publicly update or revise any and all such comments, whether as a result of new information, future events or otherwise, and accordingly they may not be unduly relied upon.
59
|
($ in Millions)
|
Market risk represents the potential for loss due to adverse changes in the fair value of financial instruments as a result of changes in interest rates, equity prices, foreign exchange rates and commodity prices. Old Republic's primary market risks consist of interest rate risk associated with investments in fixed maturities and equity price risk associated with investments in equity securities. The Company has no material foreign exchange or commodity risk.
The Company does not own or utilize derivative financial instruments for the purpose of hedging, enhancing the overall return of its investment portfolio, or reducing the cost of its debt obligations. With regard to its equity portfolio, the Company does not own any options nor does it engage in any type of option writing. Traditional investment management tools and techniques are employed to address the yield and valuation exposures of the invested assets base. The long-term fixed maturity investment portfolio is managed so as to limit various risks inherent in the bond market. Credit risk is addressed through asset diversification and the purchase of investment grade securities. Reinvestment rate risk is reduced by concentrating on non-callable issues, and by taking asset-liability matching considerations into account. Purchases of mortgage and asset backed securities, which have variable principal prepayment options, are generally avoided. Market value risk is limited through the purchase of bonds of intermediate maturity. The combination of these investment management practices is expected to produce a more stable long-term fixed maturity investment portfolio that is not subject to extreme interest rate sensitivity and principal deterioration.
The fair value of the Company's long-term fixed maturity investment portfolio is sensitive, however, to fluctuations in the level of interest rates, but not materially affected by changes in anticipated cash flows caused by any prepayments. The impact of interest rate movements on the long-term fixed maturity investment portfolio generally affects net unrealized gains or losses. As a general rule, rising interest rates enhance currently available yields but typically lead to a reduction in the fair value of existing fixed maturity investments. By contrast, a decline in such rates reduces currently available yields but usually serves to increase the fair value of the existing fixed maturity investment portfolio. All such changes in fair value of available for sale securities are reflected, net of deferred income taxes, directly in the shareholders' equity account, and as a separate component of the statement of comprehensive income. Fixed maturity securities classified as held to maturity are carried at amortized cost, and therefore, fluctuations in unrealized gains and losses do not impact shareholders' equity. Given the Company's inability to forecast or control the movement of interest rates, Old Republic sets the maturity spectrum of its fixed maturity securities portfolio within parameters of estimated liability payouts, and focuses the overall portfolio on high quality investments. By so doing, Old Republic believes it is reasonably assured of its ability to hold securities to maturity as it may deem necessary in changing environments, and of ultimately recovering their aggregate cost.
The following table illustrates the hypothetical effect on the fixed income and equity investment portfolios resulting from movements in interest rates and fluctuations in the equity securities markets, using the S&P 500 index as a proxy, at
December 31, 2016
:
|
Estimated
Fair Value
|
Hypothetical Change in
Interest Rates or S&P 500
|
Estimated Fair Value
After Hypothetical Change in
Interest Rates or S&P 500
|
|||||||||
|
Interest Rate Risk:
|
|||||||||||
|
Fixed Maturities
|
$
|
9,118.4
|
|
100
|
|
basis point rate increase
|
$
|
8,732.7
|
|
||
|
200
|
|
basis point rate increase
|
8,347.0
|
|
|||||||
|
100
|
|
basis point rate decrease
|
9,504.1
|
|
|||||||
|
200
|
|
basis point rate decrease
|
$
|
9,889.8
|
|
||||||
|
Equity Price Risk:
|
|||||||||||
|
Equity Securities
|
$
|
2,896.1
|
|
10
|
%
|
increase in the S&P 500
|
$
|
3,165.4
|
|
||
|
20
|
%
|
increase in the S&P 500
|
3,434.8
|
|
|||||||
|
10
|
%
|
decline in the S&P 500
|
2,626.8
|
|
|||||||
|
20
|
%
|
decline in the S&P 500
|
$
|
2,357.4
|
|
||||||
|
|
Listed below are the consolidated financial statements included herein for Old Republic International Corporation and Subsidiaries:
|
Page No.
|
|
|
Consolidated Balance Sheets
|
61
|
|
Consolidated Statements of Income
|
62
|
|
Consolidated Statements of Comprehensive Income
|
63
|
|
Consolidated Statements of Preferred Stock and Common Shareholders' Equity
|
64
|
|
Consolidated Statements of Cash Flows
|
65
|
|
Notes to Consolidated Financial Statements
|
66 - 95
|
|
Report of Independent Registered Public Accounting Firm
|
96
|
60
|
Old Republic International Corporation and Subsidiaries
|
|||||||
|
Consolidated Balance Sheets
|
|||||||
|
($ in Millions, Except Share Data)
|
|||||||
|
December 31,
|
|||||||
|
2016
|
2015
|
||||||
|
Assets
|
|||||||
|
Investments:
|
|||||||
|
Available for sale:
|
|||||||
|
Fixed maturity securities (at fair value) (amortized cost: $8,019.6 and $8,149.4)
|
$
|
8,170.9
|
|
$
|
8,181.5
|
|
|
|
Equity securities (at fair value) (cost: $2,404.9 and $1,826.4)
|
2,896.1
|
|
1,987.8
|
|
|||
|
Short-term investments (at fair value which approximates cost)
|
681.6
|
|
669.4
|
|
|||
|
Miscellaneous investments
|
31.2
|
|
27.2
|
|
|||
|
Total
|
11,780.0
|
|
10,866.1
|
|
|||
|
Held to maturity:
|
|||||||
|
Fixed maturity securities (at amortized cost) (fair value: $947.4 and $359.7)
|
974.8
|
|
355.8
|
|
|||
|
Other investments
|
2.9
|
|
3.5
|
|
|||
|
Total investments
|
12,757.7
|
|
11,225.5
|
|
|||
|
Other Assets:
|
|||||||
|
Cash
|
145.7
|
|
159.8
|
|
|||
|
Securities and indebtedness of related parties
|
17.6
|
|
27.7
|
|
|||
|
Accrued investment income
|
92.3
|
|
90.1
|
|
|||
|
Accounts and notes receivable
|
1,390.2
|
|
1,310.2
|
|
|||
|
Federal income tax recoverable: Current
|
14.9
|
|
26.5
|
|
|||
|
Deferred
|
—
|
|
154.5
|
|
|||
|
Prepaid federal income taxes
|
82.4
|
|
63.3
|
|
|||
|
Reinsurance balances and funds held
|
127.7
|
|
129.0
|
|
|||
|
Reinsurance recoverable: Paid losses
|
63.4
|
|
61.1
|
|
|||
|
Policy and claim reserves
|
3,168.1
|
|
3,122.5
|
|
|||
|
Deferred policy acquisition costs
|
274.0
|
|
255.4
|
|
|||
|
Sundry assets
|
457.1
|
|
475.6
|
|
|||
|
Total Other Assets
|
5,833.8
|
|
5,876.1
|
|
|||
|
Total Assets
|
$
|
18,591.6
|
|
$
|
17,101.6
|
|
|
|
Liabilities, Preferred Stock, and Common Shareholders' Equity
|
|||||||
|
Liabilities:
|
|||||||
|
Losses, claims, and settlement expenses
|
$
|
9,206.0
|
|
$
|
9,120.1
|
|
|
|
Unearned premiums
|
1,842.9
|
|
1,748.7
|
|
|||
|
Other policyholders' benefits and funds
|
192.0
|
|
196.4
|
|
|||
|
Total policy liabilities and accruals
|
11,241.0
|
|
11,065.3
|
|
|||
|
Commissions, expenses, fees, and taxes
|
474.4
|
|
452.3
|
|
|||
|
Reinsurance balances and funds
|
530.3
|
|
496.1
|
|
|||
|
Federal income tax payable: Deferred
|
42.6
|
|
—
|
|
|||
|
Debt
|
1,528.7
|
|
952.8
|
|
|||
|
Sundry liabilities
|
302.6
|
|
253.9
|
|
|||
|
Commitments and contingent liabilities
|
|
|
|||||
|
Total Liabilities
|
14,119.9
|
|
13,220.7
|
|
|||
|
Preferred Stock
(1)
|
—
|
|
—
|
|
|||
|
Common Shareholders' Equity:
|
|||||||
|
Common stock (1)
|
262.7
|
|
261.9
|
|
|||
|
Additional paid-in capital
|
713.8
|
|
698.0
|
|
|||
|
Retained earnings
|
3,210.6
|
|
2,937.5
|
|
|||
|
Accumulated other comprehensive income (loss)
|
323.6
|
|
29.2
|
|
|||
|
Unallocated ESSOP shares (at cost)
|
(39.2
|
)
|
(45.8
|
)
|
|||
|
Total Common Shareholders' Equity
|
4,471.6
|
|
3,880.8
|
|
|||
|
Total Liabilities, Preferred Stock and Common Shareholders' Equity
|
$
|
18,591.6
|
|
$
|
17,101.6
|
|
|
________
|
(1)
|
At
December 31, 2016
and
2015
, there were
75,000,000
shares of
$0.01
par value preferred stock authorized, of which no shares were outstanding. As of the same dates, there were
500,000,000
shares of common stock,
$1.00
par value, authorized, of which
262,719,660
and
261,968,328
were issued as of
December 31, 2016
and
2015
, respectively. At
December 31, 2016
and
2015
, there were
100,000,000
shares of Class B Common Stock,
$1.00
par value, authorized, of which no shares were issued.
|
See accompanying Notes to Consolidated Financial Statements.
61
|
Old Republic International Corporation and Subsidiaries
|
|||||||||||
|
Consolidated Statements of Income
|
|||||||||||
|
($ in Millions, Except Share Data)
|
|||||||||||
|
Years Ended December 31,
|
|||||||||||
|
2016
|
2015
|
2014
|
|||||||||
|
Revenues:
|
|||||||||||
|
Net premiums earned
|
$
|
4,868.9
|
|
$
|
4,758.8
|
|
$
|
4,446.3
|
|
||
|
Title, escrow, and other fees
|
464.2
|
|
420.5
|
|
364.8
|
|
|||||
|
Total premiums and fees
|
5,333.2
|
|
5,179.4
|
|
4,811.1
|
|
|||||
|
Net investment income
|
387.0
|
|
388.6
|
|
345.5
|
|
|||||
|
Other income
|
107.3
|
|
106.7
|
|
101.6
|
|
|||||
|
Total operating revenues
|
5,827.6
|
|
5,674.8
|
|
5,258.3
|
|
|||||
|
Realized investment gains (losses):
|
|||||||||||
|
From sales
|
77.8
|
|
91.3
|
|
272.3
|
|
|||||
|
From impairments
|
(4.9
|
)
|
—
|
|
—
|
|
|||||
|
Total realized investment gains (losses)
|
72.8
|
|
91.3
|
|
272.3
|
|
|||||
|
Total revenues
|
5,900.5
|
|
5,766.1
|
|
5,530.7
|
|
|||||
|
Benefits, Claims and Expenses:
|
|||||||||||
|
Benefits, claims and settlement expenses
|
2,329.8
|
|
2,441.3
|
|
2,500.0
|
|
|||||
|
Dividends to policyholders
|
18.1
|
|
17.9
|
|
14.4
|
|
|||||
|
Underwriting, acquisition, and other expenses
|
2,816.3
|
|
2,633.0
|
|
2,381.0
|
|
|||||
|
Interest and other charges
|
50.2
|
|
41.9
|
|
25.6
|
|
|||||
|
Total expenses
|
5,214.5
|
|
5,134.3
|
|
4,921.2
|
|
|||||
|
Income (loss) before income taxes (credits)
|
686.0
|
|
631.8
|
|
609.4
|
|
|||||
|
Income Taxes (Credits):
|
|||||||||||
|
Current
|
190.1
|
|
201.0
|
|
152.4
|
|
|||||
|
Deferred
|
28.8
|
|
8.6
|
|
47.3
|
|
|||||
|
Total
|
219.0
|
|
209.6
|
|
199.7
|
|
|||||
|
Net Income (Loss)
|
$
|
466.9
|
|
$
|
422.1
|
|
$
|
409.7
|
|
||
|
Net Income (Loss) Per Share:
|
|||||||||||
|
Basic
|
$
|
1.80
|
|
$
|
1.63
|
|
$
|
1.58
|
|
||
|
Diluted
|
$
|
1.62
|
|
$
|
1.48
|
|
$
|
1.44
|
|
||
|
Average shares outstanding: Basic
|
259,429,298
|
|
259,502,067
|
|
258,553,662
|
|
|||||
|
Diluted
|
296,379,251
|
|
296,088,963
|
|
295,073,206
|
|
|||||
|
Dividends Per Common Share:
|
|||||||||||
|
Cash
|
$
|
.75
|
|
$
|
.74
|
|
$
|
.73
|
|
||
See accompanying Notes to Consolidated Financial Statements.
62
|
Old Republic International Corporation and Subsidiaries
|
|||||||||||
|
Consolidated Statements of Comprehensive Income
|
|||||||||||
|
($ in Millions)
|
|||||||||||
|
Years Ended December 31,
|
|||||||||||
|
2016
|
2015
|
2014
|
|||||||||
|
Net Income (Loss) As Reported
|
$
|
466.9
|
|
$
|
422.1
|
|
$
|
409.7
|
|
||
|
Other comprehensive income (loss):
|
|||||||||||
|
Unrealized gains (losses) on securities:
|
|||||||||||
|
Unrealized gains (losses) on securities before
|
|||||||||||
|
reclassifications
|
522.3
|
|
(291.4
|
)
|
240.7
|
|
|||||
|
Amounts reclassified as realized investment
|
|||||||||||
|
gains from sales in the statements of income
|
72.8
|
|
(91.3
|
)
|
(272.3
|
)
|
|||||
|
Pretax unrealized gains (losses) on securities
|
449.4
|
|
(382.7
|
)
|
(31.6
|
)
|
|||||
|
Deferred income taxes (credits)
|
157.2
|
|
(133.8
|
)
|
(11.1
|
)
|
|||||
|
Net unrealized gains (losses) on securities, net of tax
|
292.1
|
|
(248.9
|
)
|
(20.4
|
)
|
|||||
|
Defined benefit pension plans:
|
|||||||||||
|
Net pension adjustment before reclassifications
|
(1.3
|
)
|
8.1
|
|
(79.6
|
)
|
|||||
|
Amounts reclassified as underwriting, acquisition,
|
|||||||||||
|
and other expenses in the statements of income
|
.6
|
|
1.0
|
|
(1.9
|
)
|
|||||
|
Net adjustment related to defined benefit
|
|||||||||||
|
pension plans
|
(.7
|
)
|
9.1
|
|
(81.6
|
)
|
|||||
|
Deferred income taxes (credits)
|
(.2
|
)
|
3.2
|
|
(28.5
|
)
|
|||||
|
Net adjustment related to defined benefit pension
|
|||||||||||
|
plans, net of tax
|
(.4
|
)
|
5.9
|
|
(53.0
|
)
|
|||||
|
Foreign currency translation and other adjustments
|
2.6
|
|
(20.1
|
)
|
(12.2
|
)
|
|||||
|
Net adjustments
|
294.4
|
|
(263.1
|
)
|
(85.8
|
)
|
|||||
|
Comprehensive Income (Loss)
|
$
|
761.4
|
|
$
|
159.0
|
|
$
|
323.9
|
|
||
See accompanying Notes to Consolidated Financial Statements.
63
|
Old Republic International Corporation and Subsidiaries
|
|||||||||||
|
Consolidated Statements of Preferred Stock
|
|||||||||||
|
and Common Shareholders' Equity
|
|||||||||||
|
($ in Millions)
|
|||||||||||
|
Years Ended December 31,
|
|||||||||||
|
2016
|
2015
|
2014
|
|||||||||
|
Convertible Preferred Stock:
|
|||||||||||
|
Balance, beginning and end of year
|
$
|
—
|
|
$
|
—
|
|
$
|
—
|
|
||
|
Common Stock:
|
|||||||||||
|
Balance, beginning of year
|
$
|
261.9
|
|
$
|
260.9
|
|
$
|
260.4
|
|
||
|
Dividend reinvestment plan
|
—
|
|
—
|
|
—
|
|
|||||
|
Net issuance of shares under stock based compensation plans
|
.6
|
|
.9
|
|
.4
|
|
|||||
|
Issuance of shares
|
—
|
|
—
|
|
—
|
|
|||||
|
Balance, end of year
|
$
|
262.7
|
|
$
|
261.9
|
|
$
|
260.9
|
|
||
|
Additional Paid-in Capital:
|
|||||||||||
|
Balance, beginning of year
|
$
|
698.0
|
|
$
|
681.6
|
|
$
|
673.9
|
|
||
|
Dividend reinvestment plan
|
.8
|
|
.8
|
|
.8
|
|
|||||
|
Net issuance of shares under stock based compensation plans
|
6.7
|
|
9.8
|
|
4.0
|
|
|||||
|
Issuance of shares
|
1.2
|
|
—
|
|
—
|
|
|||||
|
Stock based compensation
|
.7
|
|
1.8
|
|
.5
|
|
|||||
|
ESSOP shares released
|
6.2
|
|
4.2
|
|
3.8
|
|
|||||
|
Acquisition of non-controlling interest
|
—
|
|
(.2
|
)
|
(1.6
|
)
|
|||||
|
Balance, end of year
|
$
|
713.8
|
|
$
|
698.0
|
|
$
|
681.6
|
|
||
|
Retained Earnings:
|
|||||||||||
|
Balance, beginning of year
|
$
|
2,937.5
|
|
$
|
2,706.7
|
|
$
|
2,485.3
|
|
||
|
Net income (loss)
|
466.9
|
|
422.1
|
|
409.7
|
|
|||||
|
Dividends on common stock: cash
|
(193.8
|
)
|
(191.3
|
)
|
(188.3
|
)
|
|||||
|
Balance, end of year
|
$
|
3,210.6
|
|
$
|
2,937.5
|
|
$
|
2,706.7
|
|
||
|
Accumulated Other Comprehensive Income (Loss):
|
|||||||||||
|
Balance, beginning of year
|
$
|
29.2
|
|
$
|
292.3
|
|
$
|
378.2
|
|
||
|
Net unrealized gains (losses) on securities, net of tax
|
292.1
|
|
(248.9
|
)
|
(20.4
|
)
|
|||||
|
Net adjustment related to defined benefit pension plans,
|
|||||||||||
|
net of tax
|
(.4
|
)
|
5.9
|
|
(53.0
|
)
|
|||||
|
Foreign currency translation and other adjustments
|
2.6
|
|
(20.1
|
)
|
(12.2
|
)
|
|||||
|
Balance, end of year
|
$
|
323.6
|
|
$
|
29.2
|
|
$
|
292.3
|
|
||
|
Unallocated ESSOP Shares:
|
|||||||||||
|
Balance, beginning of year
|
$
|
(45.8
|
)
|
$
|
(17.6
|
)
|
$
|
(23.0
|
)
|
||
|
ESSOP shares released
|
6.6
|
|
5.7
|
|
5.3
|
|
|||||
|
Purchase of unallocated ESSOP shares
|
—
|
|
(34.0
|
)
|
—
|
|
|||||
|
Balance, end of year
|
$
|
(39.2
|
)
|
$
|
(45.8
|
)
|
$
|
(17.6
|
)
|
||
See accompanying Notes to Consolidated Financial Statements.
64
|
Old Republic International Corporation and Subsidiaries
|
|||||||||||
|
Consolidated Statements of Cash Flows
|
|||||||||||
|
($ in Millions)
|
|||||||||||
|
Years Ended December 31,
|
|||||||||||
|
2016
|
2015
|
2014
|
|||||||||
|
Cash flows from operating activities:
|
|||||||||||
|
Net income (loss)
|
$
|
466.9
|
|
$
|
422.1
|
|
$
|
409.7
|
|
||
|
Adjustments to reconcile net income (loss) to
|
|||||||||||
|
net cash provided by operating activities:
|
|||||||||||
|
Deferred policy acquisition costs
|
(18.3
|
)
|
(24.1
|
)
|
(39.0
|
)
|
|||||
|
Premiums and other receivables
|
(59.2
|
)
|
(22.6
|
)
|
(97.2
|
)
|
|||||
|
Unpaid claims and related items
|
31.4
|
|
214.4
|
|
(480.6
|
)
|
|||||
|
Unearned premiums and other policyholders' liabilities
|
77.6
|
|
69.6
|
|
104.4
|
|
|||||
|
Income taxes
|
40.6
|
|
13.4
|
|
132.7
|
|
|||||
|
Prepaid federal income taxes
|
(19.1
|
)
|
(17.5
|
)
|
(45.7
|
)
|
|||||
|
Reinsurance balances and funds
|
33.1
|
|
27.3
|
|
70.6
|
|
|||||
|
Realized investment (gains) losses
|
(72.8
|
)
|
(91.3
|
)
|
(272.3
|
)
|
|||||
|
Accounts payable, accrued expenses and other
|
157.0
|
|
96.8
|
|
36.1
|
|
|||||
|
Total
|
637.3
|
|
688.2
|
|
(181.2
|
)
|
|||||
|
Cash flows from investing activities:
|
|||||||||||
|
Fixed maturity securities:
|
|||||||||||
|
Available for sale:
|
|||||||||||
|
Maturities and early calls
|
967.9
|
|
764.1
|
|
854.2
|
|
|||||
|
Sales
|
306.2
|
|
259.5
|
|
847.5
|
|
|||||
|
Sales of:
|
|||||||||||
|
Equity securities
|
419.1
|
|
462.4
|
|
617.0
|
|
|||||
|
Other - net
|
56.6
|
|
32.8
|
|
17.4
|
|
|||||
|
Purchases of:
|
|||||||||||
|
Fixed maturity securities:
|
|||||||||||
|
Available for sale
|
(1,166.2
|
)
|
(1,023.0
|
)
|
(1,373.2
|
)
|
|||||
|
Held to Maturity
|
(632.1
|
)
|
(357.9
|
)
|
—
|
|
|||||
|
Equity securities
|
(928.4
|
)
|
(486.9
|
)
|
(1,466.6
|
)
|
|||||
|
Other - net
|
(47.5
|
)
|
(46.6
|
)
|
(47.6
|
)
|
|||||
|
Purchase of a business
|
—
|
|
—
|
|
(2.8
|
)
|
|||||
|
Net decrease (increase) in short-term investments
|
(12.1
|
)
|
(55.5
|
)
|
513.0
|
|
|||||
|
Other - net
|
—
|
|
1.3
|
|
(2.2
|
)
|
|||||
|
Total
|
(1,036.4
|
)
|
(449.8
|
)
|
(43.3
|
)
|
|||||
|
Cash flows from financing activities:
|
|||||||||||
|
Issuance of debentures and notes
|
576.8
|
|
—
|
|
394.4
|
|
|||||
|
Issuance of common shares
|
8.4
|
|
12.0
|
|
5.7
|
|
|||||
|
Redemption of debentures and notes
|
(3.5
|
)
|
(3.3
|
)
|
(4.2
|
)
|
|||||
|
Purchase of unallocated ESSOP shares
|
—
|
|
(34.0
|
)
|
—
|
|
|||||
|
Dividends on common shares
|
(193.8
|
)
|
(191.3
|
)
|
(188.3
|
)
|
|||||
|
Other - net
|
(2.8
|
)
|
1.3
|
|
.4
|
|
|||||
|
Total
|
385.0
|
|
(215.2
|
)
|
207.9
|
|
|||||
|
Increase (decrease) in cash:
|
(14.1
|
)
|
23.0
|
|
(16.6
|
)
|
|||||
|
Cash, beginning of year
|
159.8
|
|
136.7
|
|
153.3
|
|
|||||
|
Cash, end of year
|
$
|
145.7
|
|
$
|
159.8
|
|
$
|
136.7
|
|
||
|
Supplemental cash flow information:
|
|||||||||||
|
Cash paid (received) during the period for: Interest
|
$
|
40.9
|
|
$
|
40.8
|
|
$
|
21.2
|
|
||
|
Income taxes
|
$
|
178.6
|
|
$
|
198.5
|
|
$
|
67.3
|
|
||
See accompanying Notes to Consolidated Financial Statements.
65
|
Old Republic International Corporation and Subsidiaries
|
|
Notes to Consolidated Financial Statements
|
|
($ in Millions, Except as Otherwise Indicated)
|
Old Republic International Corporation is a Chicago-based insurance holding company with subsidiaries engaged mainly in the general (property and liability), title, and mortgage guaranty ("MI") and consumer credit indemnity ("CCI") run-off businesses. These insurance subsidiaries are organized as the Old Republic General Insurance, Title Insurance and RFIG Run-off Business Groups, and references herein to such groups apply to the Company's subsidiaries engaged in the respective segments of business. As more fully disclosed in Note 1(s), RFIG's flagship mortgage guaranty insurance carrier, Republic Mortgage Insurance Company ("RMIC") and its affiliate Republic Mortgage Insurance Company of North Carolina ("RMICNC") have been operating in run-off pursuant to Summary Orders received from the North Carolina Department of Insurance ("NCDOI") which placed these companies under its supervision in 2012. A small life and accident insurance business is included in the corporate and other caption of this report. In this report, "Old Republic", or "the Company" refers to Old Republic International Corporation and its subsidiaries as the context requires.
(a) Accounting Principles
-
The Company's insurance subsidiaries are managed pursuant to the laws and regulations of the various states in which they operate. As a result, the subsidiaries operate their business in the context of such laws and regulation, and maintain their accounts in conformity with accounting practices prescribed or permitted by various states' insurance regulatory authorities. Federal income taxes and dividends to shareholders are based on financial statements and reports complying with such practices. The statutory accounting requirements vary from the Financial Accounting Standards Board's ("FASB") Accounting Standards Codification ("ASC") of accounting principles generally accepted in the United States of America ("GAAP") in the following major respects: (1) the costs of selling insurance policies are charged to operations immediately, while the related premiums are recognized as income over the terms of the policies; (2) investments in fixed maturity securities designated as available for sale are generally carried at amortized cost rather than their estimated fair value; (3) certain assets classified as "non-admitted assets" are excluded from the balance sheet through a direct charge to earned surplus; (4) changes in deferred income tax assets or liabilities are recorded directly in earned surplus and not through the income statement; (5) mortgage guaranty contingency reserves intended to provide for future catastrophic losses are established as a liability through a charge to earned surplus whereas, GAAP does not allow provisions for future catastrophic losses; (6) title insurance premium reserves, which are intended to cover losses that will be reported at a future date are based on statutory formulas, and changes therein are charged in the income statement against each year's premiums written; (7) certain required formula-derived reserves for general insurance in particular are established for claim reserves in excess of amounts considered adequate by the Company as well as for credits taken relative to reinsurance placed with other insurance companies not licensed in the respective states, all of which are charged directly against earned surplus; and (8) surplus notes are classified as surplus rather than a liability. In consolidating the statutory financial statements of its insurance subsidiaries, the Company has therefore made necessary adjustments to conform their accounts with GAAP. The following table reflects a summary of all such adjustments:
|
Shareholders' Equity
|
Net Income (Loss)
|
||||||||||||||||||
|
December 31,
|
Years Ended December 31,
|
||||||||||||||||||
|
2016
|
2015
|
2016
|
2015
|
2014
|
|||||||||||||||
|
Statutory totals of insurance
|
|||||||||||||||||||
|
company subsidiaries (a):
|
|||||||||||||||||||
|
General
|
$
|
3,698.1
|
|
$
|
3,345.4
|
|
$
|
270.3
|
|
$
|
245.1
|
|
$
|
304.5
|
|
||||
|
Title
|
545.7
|
|
481.4
|
|
113.1
|
|
117.7
|
|
89.1
|
|
|||||||||
|
RFIG Run-off
|
86.9
|
|
53.2
|
|
100.9
|
|
89.9
|
|
127.4
|
|
|||||||||
|
Life & Accident
|
40.3
|
|
35.6
|
|
2.3
|
|
(.2
|
)
|
(.1
|
)
|
|||||||||
|
Sub-total
|
4,371.0
|
|
3,915.6
|
|
486.6
|
|
452.5
|
|
520.9
|
|
|||||||||
|
GAAP totals of non-insurance company
|
|||||||||||||||||||
|
subsidiaries and consolidation adjustments
|
306.2
|
|
153.9
|
|
(0.9
|
)
|
12.2
|
|
(66.4
|
)
|
|||||||||
|
Unadjusted totals
|
4,677.3
|
|
4,069.5
|
|
485.7
|
|
464.6
|
|
454.4
|
|
|||||||||
|
Adjustments to conform to GAAP statements:
|
|||||||||||||||||||
|
Deferred policy acquisition costs
|
165.8
|
|
163.6
|
|
2.0
|
|
3.3
|
|
1.4
|
|
|||||||||
|
Fair value of fixed maturity securities
|
163.0
|
|
95.5
|
|
—
|
|
—
|
|
—
|
|
|||||||||
|
Non-admitted assets
|
79.6
|
|
77.9
|
|
—
|
|
—
|
|
—
|
|
|||||||||
|
Deferred income taxes
|
(153.4
|
)
|
(41.6
|
)
|
(34.0
|
)
|
(22.4
|
)
|
(39.3
|
)
|
|||||||||
|
Mortgage contingency reserves
|
340.9
|
|
265.8
|
|
—
|
|
—
|
|
—
|
|
|||||||||
|
Title insurance premium reserves
|
495.3
|
|
468.2
|
|
27.0
|
|
26.6
|
|
8.9
|
|
|||||||||
|
Loss reserves
|
(519.3
|
)
|
(504.3
|
)
|
(15.0
|
)
|
(50.3
|
)
|
(21.3
|
)
|
|||||||||
|
Surplus notes
|
(779.5
|
)
|
(732.5
|
)
|
—
|
|
—
|
|
—
|
|
|||||||||
|
Sundry adjustments
|
1.6
|
|
18.1
|
|
1.2
|
|
.2
|
|
5.1
|
|
|||||||||
|
Total adjustments
|
(206.0
|
)
|
(189.0
|
)
|
(19.0
|
)
|
(42.4
|
)
|
(44.9
|
)
|
|||||||||
|
Consolidated GAAP totals
|
$
|
4,471.6
|
|
$
|
3,880.8
|
|
$
|
466.9
|
|
$
|
422.1
|
|
$
|
409.7
|
|
||||
66
|
(a)
|
The insurance laws of the respective states in which the Company
’
s insurance subsidiaries are incorporated prescribe minimum capital and surplus requirements for the lines of business they are licensed to write. For domestic property and casualty and life and accident insurance companies the National Association of Insurance Commissioners also prescribes risk-based capital ("RBC") requirements. The RBC is a measure of statutory capital in relationship to a formula-driven definition of risk relative to a company
’
s balance sheet and mix of business. The combined RBC ratio of our primary General insurance subsidiaries was
665%
and
636%
of the company action level RBC at
December 31, 2016
and
2015
, respectively. The minimum capital requirements for the Company
’
s Title Insurance subsidiaries are established by statute in the respective states of domicile. The minimum regulatory capital requirements are not significant in relationship to the recorded statutory capital of the Company
’
s Title and Life & Accident insurance subsidiaries. At
December 31, 2016
and
2015
each of the Company
’
s General, Title, and Life and Accident insurance subsidiaries exceeded the minimum statutory capital and surplus requirements. Refer to Note 1(s) - Regulatory Matters for a discussion regarding the RFIG Run-off group.
|
The preparation of financial statements in conformity with either statutory practices or GAAP requires management to make estimates and assumptions that affect the reported amounts of assets and liabilities, the disclosure of contingent assets and liabilities at the date of the financial statements, and the reported amounts of revenues and expenses during the reporting period. Accordingly, actual results could differ from those estimates.
(b) Consolidation Practices
- The consolidated financial statements include the accounts of the Company and those of all of its majority owned insurance underwriting and service subsidiaries. All significant intercompany accounts and transactions have been eliminated in consolidation.
(c) Statement Presentation
- Amounts shown in the consolidated financial statements and applicable notes are stated (except as otherwise indicated and as to share data) in millions, which amounts may not add to totals shown due to truncation. Necessary reclassifications are made in prior periods' financial statements whenever appropriate to conform to the most current presentation.
(d) Investments
- The Company may classify its invested assets in terms of those assets relative to which it either (1) has the positive intent and ability to hold until maturity, (2) has available for sale or (3) has the intention of trading. As of
December 31, 2016
and
2015
, the majority of the Company's invested assets were classified as "available for sale."
Fixed maturity securities and other preferred and common stocks (equity securities) classified as "available for sale" are included at fair value with changes in such values, net of deferred income taxes, reflected directly in shareholders' equity while fixed maturity securities classified as "held to maturity" are carried at amortized cost. Fair values for fixed maturity securities and equity securities are based on quoted market prices or estimates using values obtained from independent pricing services as applicable.
The Company reviews the status and fair value changes of each of its investments on at least a quarterly basis during the year, and estimates of other-than-temporary impairments ("OTTI") in the portfolio's value are evaluated and established at each quarterly balance sheet date. In reviewing investments for OTTI, the Company, in addition to a security's market price history, considers the totality of such factors as the issuer's operating results, financial condition and liquidity, its ability to access capital markets, credit rating trends, most current audit opinion, industry and securities markets conditions, and analyst expectations to reach its conclusions. Sudden fair value declines caused by such adverse developments as newly emerged or imminent bankruptcy filings, issuer default on significant obligations, or reports of financial accounting developments that bring into question the validity of the issuer's previously reported earnings or financial condition, are recognized as realized losses as soon as credible publicly available information emerges to confirm such developments. Absent issuer-specific circumstances that would result in a contrary conclusion, any equity security with an unrealized investment loss amounting to a
20%
or greater decline consecutively during a six month period is considered OTTI. In the event the Company's estimate of OTTI is insufficient at any point in time, future periods' net income (loss) would be adversely affected by the recognition of additional realized or impairment losses, but its financial position would not necessarily be affected adversely inasmuch as such losses, or a portion of them, could have been recognized previously as unrealized losses in shareholders' equity. The Company recognized
$4.9
of OTTI adjustments for the year ended
December 31, 2016
and no adjustments for the same periods of
2015
and
2014
.
The amortized cost and estimated fair values by type and contractual maturity of fixed maturity securities are shown in the following tables. Expected maturities will differ from contractual maturities since borrowers may have the right to call or repay obligations with or without call or prepayment penalties.
67
|
Amortized
Cost
|
Gross
Unrealized
Gains
|
Gross
Unrealized
Losses
|
Estimated
Fair
Value
|
||||||||||||
|
Fixed Maturity Securities by Type:
|
|||||||||||||||
|
December 31, 2016:
|
|||||||||||||||
|
Available for sale:
|
|||||||||||||||
|
U.S. & Canadian Governments
|
$
|
1,419.7
|
|
$
|
12.6
|
|
$
|
5.5
|
|
$
|
1,426.8
|
|
|||
|
Corporate
|
6,599.8
|
|
175.0
|
|
30.7
|
|
6,744.1
|
|
|||||||
|
$
|
8,019.6
|
|
$
|
187.6
|
|
$
|
36.3
|
|
$
|
8,170.9
|
|
||||
|
Held to maturity:
|
|||||||||||||||
|
Tax-exempt
|
$
|
974.8
|
|
$
|
.7
|
|
$
|
28.0
|
|
$
|
947.4
|
|
|||
|
December 31, 2015:
|
|||||||||||||||
|
Available for sale:
|
|||||||||||||||
|
U.S. & Canadian Governments
|
$
|
1,269.5
|
|
$
|
18.9
|
|
$
|
3.6
|
|
$
|
1,284.9
|
|
|||
|
Corporate
|
6,879.9
|
|
166.8
|
|
150.2
|
|
6,896.5
|
|
|||||||
|
$
|
8,149.4
|
|
$
|
185.8
|
|
$
|
153.8
|
|
$
|
8,181.5
|
|
||||
|
Held to maturity:
|
|||||||||||||||
|
Tax-exempt
|
$
|
355.8
|
|
$
|
4.0
|
|
$
|
.1
|
|
$
|
359.7
|
|
|||
|
Amortized
Cost
|
Estimated
Fair
Value
|
||||||
|
Fixed Maturity Securities Stratified by Contractual Maturity at December 31, 2016:
|
|||||||
|
Available for sale:
|
|||||||
|
Due in one year or less
|
$
|
829.6
|
|
$
|
837.3
|
|
|
|
Due after one year through five years
|
4,013.8
|
|
4,128.2
|
|
|||
|
Due after five years through ten years
|
3,043.9
|
|
3,068.8
|
|
|||
|
Due after ten years
|
132.0
|
|
136.5
|
|
|||
|
$
|
8,019.6
|
|
$
|
8,170.9
|
|
||
|
Held to maturity:
|
|||||||
|
Due in one year or less
|
$
|
—
|
|
$
|
—
|
|
|
|
Due after one year through five years
|
30.9
|
|
30.0
|
|
|||
|
Due after five years through ten years
|
907.1
|
|
882.0
|
|
|||
|
Due after ten years
|
36.6
|
|
35.4
|
|
|||
|
$
|
974.8
|
|
$
|
947.4
|
|
||
Bonds and other investments with a statutory carrying value of
$750.7
as of
December 31, 2016
were on deposit with governmental authorities by the Company's insurance subsidiaries to comply with insurance laws.
A summary of the Company's equity securities follows:
|
Equity Securities:
|
Adjusted
Cost
|
Gross
Unrealized
Gains
|
Gross
Unrealized
Losses
|
Estimated
Fair
Value
|
|||||||||||
|
December 31, 2016
|
$
|
2,404.9
|
|
$
|
516.2
|
|
$
|
25.0
|
|
$
|
2,896.1
|
|
|||
|
December 31, 2015
|
$
|
1,826.4
|
|
$
|
266.7
|
|
$
|
105.3
|
|
$
|
1,987.8
|
|
|||
The following table reflects the Company's gross unrealized losses and fair value, aggregated by category and the length of time that individual available for sale and held to maturity securities have been in an unrealized loss position. Fair value and issuer's cost comparisons follow:
68
|
12 Months or Less
|
Greater than 12 Months
|
Total
|
|||||||||||||||||||||
|
Fair
Value
|
Unrealized Losses
|
Fair
Value
|
Unrealized Losses
|
Fair
Value
|
Unrealized Losses
|
||||||||||||||||||
|
December 31, 2016:
|
|||||||||||||||||||||||
|
Fixed Maturity Securities:
|
|||||||||||||||||||||||
|
U.S. & Canadian Governments
|
$
|
699.0
|
|
$
|
5.5
|
|
$
|
1.3
|
|
$
|
—
|
|
$
|
700.4
|
|
$
|
5.5
|
|
|||||
|
Tax-exempt
|
814.4
|
|
28.0
|
|
—
|
|
—
|
|
814.4
|
|
28.0
|
|
|||||||||||
|
Corporate
|
1,250.5
|
|
20.3
|
|
246.2
|
|
10.3
|
|
1,496.8
|
|
30.7
|
|
|||||||||||
|
Subtotal
|
2,764.0
|
|
53.9
|
|
247.5
|
|
10.4
|
|
3,011.6
|
|
64.3
|
|
|||||||||||
|
Equity Securities
|
82.6
|
|
12.5
|
|
122.1
|
|
12.4
|
|
204.8
|
|
25.0
|
|
|||||||||||
|
Total
|
$
|
2,846.7
|
|
$
|
66.5
|
|
$
|
369.7
|
|
$
|
22.8
|
|
$
|
3,216.5
|
|
$
|
89.4
|
|
|||||
|
December 31, 2015:
|
|||||||||||||||||||||||
|
Fixed Maturity Securities:
|
|||||||||||||||||||||||
|
U.S. & Canadian Governments
|
$
|
363.3
|
|
$
|
2.8
|
|
$
|
59.2
|
|
$
|
.7
|
|
$
|
422.6
|
|
$
|
3.6
|
|
|||||
|
Tax-exempt
|
49.5
|
|
.1
|
|
—
|
|
—
|
|
49.5
|
|
.1
|
|
|||||||||||
|
Corporate
|
2,214.5
|
|
100.0
|
|
336.4
|
|
50.2
|
|
2,550.9
|
|
150.2
|
|
|||||||||||
|
Subtotal
|
2,627.4
|
|
103.0
|
|
395.7
|
|
50.9
|
|
3,023.1
|
|
154.0
|
|
|||||||||||
|
Equity Securities
|
502.1
|
|
87.3
|
|
31.3
|
|
17.9
|
|
533.4
|
|
105.3
|
|
|||||||||||
|
Total
|
$
|
3,129.5
|
|
$
|
190.4
|
|
$
|
427.0
|
|
$
|
68.9
|
|
$
|
3,556.6
|
|
$
|
259.3
|
|
|||||
At
December 31, 2016
, the Company held
718
fixed maturity and
8
equity securities in an unrealized loss position, representing
37.0%
(as to fixed maturities) and
7.7%
(as to equity securities) of the total number of such issues it held. At
December 31, 2015
, the Company held
709
fixed maturity and
22
equity securities in an unrealized loss position, representing
39.2%
(as to fixed maturities) and
23.9%
(as to equity securities) of the total number of such issues it held. Of the securities in an unrealized loss position,
46
and
79
fixed maturity securities and
2
and
1
equity securities, had been in a continuous unrealized loss position for more than 12 months as of
December 31, 2016
and
2015
, respectively. The unrealized losses on these securities are primarily deemed to reflect changes in the interest rate environment and changes in fair values of fixed income and equity securities issued by participants in the extractive industries in particular. As part of its assessment of other-than-temporary impairments, the Company considers its intent to continue to hold, and the likelihood that it will not be required to sell investment securities in an unrealized loss position until cost recovery, principally on the basis of its asset and liability maturity matching procedures.
Fair Value Measurements -
Fair value is defined as the estimated price that is likely to be received to sell an asset or paid to transfer a liability in an orderly transaction between market participants (an exit price) at the measurement date. A fair value hierarchy is established that prioritizes the sources ("inputs") used to measure fair value into three broad levels: inputs based on quoted market prices in active markets (Level 1); observable inputs based on corroboration with available market data (Level 2); and unobservable inputs based on uncorroborated market data or a reporting entity's own assumptions (Level 3). Following is a description of the valuation methodologies and general classification used for financial instruments measured at fair value.
The Company uses quoted values and other data provided by a nationally recognized independent pricing source as inputs into its quarterly process for determining fair values of its fixed maturity and equity securities. To validate the techniques or models used by pricing sources, the Company's review process includes, but is not limited to: (i) initial and ongoing evaluation of methodologies used by outside parties to calculate fair value; and (ii) comparing other sources including the fair value estimates to its knowledge of the current market and to independent fair value estimates provided by the investment custodian. The independent pricing source obtains market quotations and actual transaction prices for securities that have quoted prices in active markets and uses its own proprietary method for determining the fair value of securities that are not actively traded. In general, these methods involve the use of "matrix pricing" in which the independent pricing source uses observable market inputs including, but not limited to, investment yields, credit risks and spreads, benchmarking of like securities, broker-dealer quotes, reported trades and sector groupings to determine a reasonable fair value.
Level 1 securities include U.S. and Canadian Treasury notes, publicly traded common stocks, the quoted net asset value ("NAV") mutual funds, and most short-term investments in highly liquid money market instruments. Level 2 securities generally include corporate bonds, municipal bonds, and certain U.S. and Canadian government agency securities. Securities classified within Level 3 include non-publicly traded bonds and equity securities. There were no significant changes in the fair value of assets measured with the use of significant unobservable inputs as of
December 31, 2016
and
December 31, 2015
.
The following tables show a summary of the fair value of financial assets segregated among the various input levels described above:
69
|
Fair Value Measurements
|
||||||||||||||||
|
As of December 31, 2016:
|
Level 1
|
Level 2
|
Level 3
|
Total
|
||||||||||||
|
Available for sale:
|
||||||||||||||||
|
Fixed maturity securities:
|
||||||||||||||||
|
U.S. & Canadian Governments
|
$
|
772.1
|
|
$
|
654.7
|
|
$
|
—
|
|
$
|
1,426.8
|
|
||||
|
Corporate
|
—
|
|
6,733.6
|
|
10.5
|
|
6,744.1
|
|
||||||||
|
Equity securities
|
2,895.2
|
|
—
|
|
.9
|
|
2,896.1
|
|
||||||||
|
Short-term investments
|
681.6
|
|
—
|
|
—
|
|
681.6
|
|
||||||||
|
Held to maturity:
|
||||||||||||||||
|
Fixed maturity securities:
|
||||||||||||||||
|
Tax-exempt
|
$
|
—
|
|
$
|
947.4
|
|
$
|
—
|
|
$
|
947.4
|
|
||||
|
As of December 31, 2015:
|
||||||||||||||||
|
Available for sale:
|
||||||||||||||||
|
Fixed maturity securities:
|
||||||||||||||||
|
U.S. & Canadian Governments
|
$
|
606.6
|
|
$
|
678.2
|
|
$
|
—
|
|
$
|
1,284.9
|
|
||||
|
Corporate
|
—
|
|
6,886.0
|
|
10.5
|
|
6,896.5
|
|
||||||||
|
Equity securities
|
1,985.8
|
|
—
|
|
2.0
|
|
1,987.8
|
|
||||||||
|
Short-term investments
|
669.4
|
|
—
|
|
—
|
|
669.4
|
|
||||||||
|
Held to maturity:
|
||||||||||||||||
|
Fixed maturity securities:
|
||||||||||||||||
|
Tax-exempt
|
$
|
—
|
|
$
|
359.7
|
|
$
|
—
|
|
$
|
359.7
|
|
||||
There were no transfers between Levels 1, 2 or 3 during
2016
or
2015
.
Investment income
is reported net of allocated expenses and includes appropriate adjustments for amortization of premium and accretion of discount on fixed maturity securities acquired at other than par value. Dividends on equity securities are credited to income on the ex-dividend date. Realized investment gains and losses, which result from sales or write-downs of securities, are reflected as revenues in the income statement and are determined on the basis of amortized value at date of sale for fixed maturity securities, and cost in regard to equity securities; such bases apply to the specific securities sold. Unrealized investment gains and losses, net of any deferred income taxes, are recorded directly as a component of accumulated other comprehensive income in shareholders' equity. At
December 31, 2016
, the Company and its subsidiaries had no non-income producing fixed maturity securities.
The following table reflects the composition of net investment income, net realized gains or losses, and the net change in unrealized investment gains or losses for each of the years shown.
70
|
Years Ended December 31:
|
2016
|
2015
|
2014
|
|||||||||
|
Investment income from:
|
||||||||||||
|
Fixed maturity securities
|
$
|
296.6
|
|
$
|
296.4
|
|
$
|
296.0
|
|
|||
|
Equity securities
|
88.2
|
|
91.0
|
|
49.3
|
|
||||||
|
Short-term investments
|
2.1
|
|
.8
|
|
.8
|
|
||||||
|
Other sources
|
3.9
|
|
3.7
|
|
3.0
|
|
||||||
|
Gross investment income
|
390.9
|
|
392.1
|
|
349.2
|
|
||||||
|
Investment expenses (a)
|
3.8
|
|
3.4
|
|
3.7
|
|
||||||
|
Net investment income
|
$
|
387.0
|
|
$
|
388.6
|
|
$
|
345.5
|
|
|||
|
Realized gains (losses) on:
|
||||||||||||
|
Fixed maturity securities:
|
||||||||||||
|
Gains
|
$
|
15.3
|
|
$
|
17.2
|
|
$
|
32.1
|
|
|||
|
Losses
|
(12.5
|
)
|
(.9
|
)
|
(5.0
|
)
|
||||||
|
Net
|
2.8
|
|
16.3
|
|
27.0
|
|
||||||
|
Equity securities:
|
||||||||||||
|
Gains
|
95.1
|
|
96.2
|
|
247.2
|
|
||||||
|
Losses
|
(25.4
|
)
|
(20.9
|
)
|
(2.3
|
)
|
||||||
|
Net
|
69.7
|
|
75.3
|
|
244.9
|
|
||||||
|
Other long-term investments, net
|
.2
|
|
(.3
|
)
|
.3
|
|
||||||
|
Total realized gains (losses)
|
72.8
|
|
91.3
|
|
272.3
|
|
||||||
|
Income taxes (credits)(b)
|
25.5
|
|
31.9
|
|
95.3
|
|
||||||
|
Net realized gains (losses)
|
$
|
47.3
|
|
$
|
59.3
|
|
$
|
177.0
|
|
|||
|
Changes in unrealized investment gains (losses) on:
|
||||||||||||
|
Fixed maturity securities
|
$
|
119.4
|
|
$
|
(256.1
|
)
|
$
|
55.1
|
|
|||
|
Less: Deferred income taxes (credits)
|
41.9
|
|
(89.5
|
)
|
19.2
|
|
||||||
|
77.5
|
|
(166.6
|
)
|
35.9
|
|
|||||||
|
Equity securities & other long-term investments
|
330.0
|
|
(126.5
|
)
|
(86.8
|
)
|
||||||
|
Less: Deferred income taxes (credits)
|
115.3
|
|
(44.2
|
)
|
(30.3
|
)
|
||||||
|
214.6
|
|
(82.2
|
)
|
(56.4
|
)
|
|||||||
|
Net changes in unrealized investment gains (losses)
|
$
|
292.1
|
|
$
|
(248.9
|
)
|
$
|
(20.4
|
)
|
|||
__________
|
(a)
|
Investment expenses consist of personnel costs and investment management and custody service fees, as well as interest incurred on funds held of
$.4
,
$.3
and
$.4
for the years ended
December 31, 2016
,
2015
and
2014
, respectively.
|
|
(b)
|
Reflects primarily the combination of fully taxable realized investment gains or losses and judgments about the recoverability of deferred tax assets.
|
In January 2016, the FASB issued guidance on the recognition and measurement of financial instruments. Among other changes, the standard will require equity investments to be measured at fair value with changes in fair value recognized in the consolidated statement of income. The new accounting standard will be effective in 2018.
In June 2016, the FASB issued guidance on accounting for credit losses on financial instruments which will be effective in 2020. The guidance will require immediate recognition of expected credit losses for certain financial instruments such as reinsurance recoverables and held to maturity securities and also modifies the impairment model for available for sale debt securities.
(e) Revenue Recognition
- Pursuant to GAAP applicable to the insurance industry, revenues are recognized as follows:
Substantially all general insurance premiums pertain to annual policies and are reflected in income on a pro-rata basis in general association with the related benefits, claims, and expenses. Earned but unbilled premiums are generally taken into income on the billing date, while adjustments for retrospective premiums, commissions and similar charges or credits are accrued on the basis of periodic evaluations of current underwriting experience and contractual obligations.
Title premium and fee revenues stemming from the Company's direct operations (which include branch offices of its title insurers and wholly owned agency subsidiaries) represent
28%
of
2016
,
27%
of
2015
and
27%
of
2014
consolidated title business revenues. Such premiums are generally recognized as income at the escrow closing date which approximates the policy effective date. Fee income related to escrow and other closing services is recognized when the related services have been performed and completed. The remaining title premium and fee revenues are produced by independent title agents and underwritten title companies. Rather than making estimates that could be subject to significant variance from actual premium and fee production, the Company recognizes revenues from those sources upon receipt.
71
Such receipts can reflect a three to four month lag relative to the effective date of the underlying title policy, and are offset concurrently by production expenses and claim reserve provisions.
The Company's mortgage guaranty premiums principally stem from monthly installments paid on long-duration, guaranteed renewable insurance policies. Substantially all such premiums are written and earned in the month coverage is effective. With respect to relatively few annual or single premium policies, earned premiums are largely recognized on a pro-rata basis over the terms of the policies. Recognition of normal or catastrophic claim costs, however, occurs only upon an instance of default, defined as the occurrence of two or more consecutively missed monthly payments. Accordingly, GAAP revenue recognition for insured loans is not appropriately matched to the risk exposure and the consequent recognition of both normal and most significantly, future catastrophic loss occurrences for which current reserve provisions are not permitted. As a result, mortgage guaranty GAAP earnings for any individual year or series of years may be materially adversely affected, particularly by cyclical catastrophic loss events such as the mortgage insurance industry experienced between 2007 and 2012. Reported GAAP earnings and financial condition form, in part, the basis for significant judgments and strategic evaluations made by management, analysts, investors, and other users of the financial statements issued by mortgage guaranty companies. The risk exists that such judgments and evaluations are at least partially based on GAAP financial information that does not match revenues and expenses and is therefore not reflective of the long-term normal and catastrophic risk exposures assumed by mortgage guaranty insurers at any point in time.
In May 2014, the FASB issued a comprehensive revenue recognition standard which is effective in 2018 and applies to all entities that have contracts with customers, except for those that fall within the scope of other standards, such as insurance contracts. The Company is currently evaluating the guidance, however, it does not expect that its adoption will have a material impact on the consolidated financial statements.
(f) Deferred Policy Acquisition Costs
- Various insurance subsidiaries of the Company defer direct costs related to the successful production of business. Deferred costs consist principally of commissions, premium taxes, marketing, and policy issuance expenses.
With respect to most coverages, deferred acquisition costs are amortized on the same basis as the related premiums are earned or, alternatively, over the periods during which premiums will be paid. To the extent that future revenues on existing policies are not adequate to cover related costs and expenses, deferred policy acquisition costs are charged to earnings.
The following table shows a reconciliation of deferred acquisition costs between succeeding balance sheet dates.
|
Years Ended December 31:
|
2016
|
2015
|
2014
|
|||||||||
|
Deferred, beginning of year
|
$
|
255.4
|
|
$
|
230.8
|
|
$
|
192.6
|
|
|||
|
Acquisition costs deferred:
|
||||||||||||
|
Commissions - net of reinsurance
|
253.0
|
|
267.3
|
|
258.9
|
|
||||||
|
Premium taxes
|
107.8
|
|
107.3
|
|
102.3
|
|
||||||
|
Salaries and other marketing expenses
|
51.4
|
|
46.0
|
|
41.4
|
|
||||||
|
Sub-total
|
412.3
|
|
420.7
|
|
402.7
|
|
||||||
|
Amortization charged to income
|
(393.7
|
)
|
(396.1
|
)
|
(364.6
|
)
|
||||||
|
Change for the year
|
18.6
|
|
24.6
|
|
38.1
|
|
||||||
|
Deferred, end of year
|
$
|
274.0
|
|
$
|
255.4
|
|
$
|
230.8
|
|
|||
(g) Unearned Premiums
- Unearned premium reserves are generally calculated by application of pro-rata factors to premiums in force. At
December 31, 2016
and
2015
, unearned premiums consisted of the following:
|
As of December 31:
|
2016
|
2015
|
||||||
|
General Insurance Group
|
$
|
1,834.3
|
|
$
|
1,735.0
|
|
||
|
RFIG Run-off Business
|
8.6
|
|
13.7
|
|
||||
|
Total
|
$
|
1,842.9
|
|
$
|
1,748.7
|
|
||
(h) Losses, Claims and Settlement Expenses
-
The establishment of claim reserves by the Company's insurance subsidiaries is a reasonably complex and dynamic process influenced by a large variety of factors. These factors principally include past experience applicable to the anticipated costs of various types of claims, continually evolving and changing legal theories emanating from the judicial system, recurring accounting, statistical, and actuarial studies, the professional experience and expertise of the Company's claim departments' personnel or attorneys and independent claim adjusters, ongoing changes in claim frequency or severity patterns such as those caused by natural disasters, illnesses, accidents, work‑related injuries, and changes in general and industry-specific economic conditions. Consequently, the reserves established are a reflection of the opinions of a large number of persons, of the application and interpretation of historical precedent and trends, of expectations as to future developments, and of management's judgment in interpreting all such factors. At any point in time, the Company is exposed to the risk of possibly higher or lower than anticipated claim costs due to all of these factors, and to the evolution, interpretation, and expansion of tort law, as well as the effects of unexpected jury verdicts.
72
All reserves are therefore based on estimates which are periodically reviewed and evaluated in the light of emerging claim experience and changing circumstances. The resulting changes in estimates are recorded in operations of the periods during which they are made. Return and additional premiums and policyholders' dividends, all of which tend to be affected by development of claims in future years, may offset, in whole or in part, developed claim redundancies or deficiencies for certain coverages such as workers' compensation, portions of which are written under loss sensitive programs that provide for such adjustments. The Company believes that its overall reserving practices have been consistently applied over many years, and that its aggregate net reserves have generally resulted in reasonable approximations of the ultimate net costs of claims incurred. However, no representation is made nor is any guaranty given that ultimate net claim and related costs will not develop in future years to be greater or lower than currently established reserve estimates.
General Insurance
reserves are established to provide for the ultimate expected cost of settling unpaid losses and claims reported at each balance sheet date. Such reserves are based on continually evolving assessments of the facts available to the Company during the settlement process which may stretch over long periods of time. Long-term disability or pension type workers' compensation reserves are discounted to present value based on interest rates ranging from
3.5%
to
4.0%
. The amount of discount reflected in the year end net reserves totaled
$231.9
,
$228.6
, and
$240.7
as of
December 31, 2016
,
2015
, and
2014
, respectively. Interest accretion of
$24.2
,
$36.7
and
$26.2
for the years ended
December 31, 2016
,
2015
, and
2014
, respectively, was recognized within benefits, claims and settlement expenses in the consolidated statements of income. Losses and claims incurred but not reported ("IBNR"), as well as expenses required to settle losses and claims are established on the basis of a large number of formulas that take into account various criteria, including historical cost experience and anticipated costs of servicing reinsured and other risks. As applicable, estimates of possible recoveries from salvage or subrogation opportunities are considered in the establishment of such reserves. Overall claim and claim expense reserves incorporate amounts covering net estimates of unusual claims such as those emanating from asbestosis and environmental ("A&E") exposures as discussed below. Such reserves can affect claim costs and related loss ratios for such insurance coverages as general liability, commercial automobile (truck), workers' compensation, and property.
Early in 2001, the Federal Department of Labor revised the Federal Black Lung Program regulations. The revisions basically require a reevaluation of previously settled, denied, or new occupational disease claims in the context of newly devised, more lenient standards when such claims are resubmitted. Following a number of challenges and appeals by the insurance and coal mining industries, the revised regulations were, for the most part, upheld in June, 2002 and are to be applied prospectively. Since the final quarter of 2001 black lung claims filed or refiled pursuant to these revised regulations have increased, though the volume of new claim reports has abated in recent years.
In March 2010, federal regulations were revised once again as part of the Patient Protection and Affordability Act that reinstates two provisions that can potentially benefit claimants. In response to this most recent legislation and the above noted 2001 change, black lung claims filed or refiled have risen once increased. The vast majority of claims filed to date against Old Republic pertain to business underwritten through loss sensitive programs that permit the charge of additional or refund of return premiums to wholly or partially offset changes in estimated claim costs, or to business underwritten as a service carrier on behalf of various industry-wide involuntary market (i.e. assigned risk) pools. A much smaller portion pertains to business produced on a traditional risk transfer basis. The Company has established applicable reserves for claims as they have been reported and for claims not as yet reported on the basis of its historical experience as well as assumptions relative to the effect of the revised regulations. The potential impact on reserves, gross and net of reinsurance or retrospective premium adjustments, resulting from such regulations cannot be estimated with reasonable certainty.
Old Republic's reserve estimates also include provisions for indemnity and settlement costs for various asbestosis and environmental impairment ("A&E") claims that have been filed in the normal course of business against a number of its insurance subsidiaries. Many such claims relate to policies incepting prior to 1985, including many issued during a short period between 1981 and 1982 pursuant to an agency agreement canceled in 1982. Over the years, the Company's property and liability insurance subsidiaries have typically issued general liability insurance policies with face amounts ranging between
$1.0
and
$2.0
and rarely exceeding
$10.0
. Such policies have, in turn, been subject to reinsurance cessions which have typically reduced the subsidiaries' net retentions to
$.5
or less as to each claim. Old Republic's exposure to A&E claims cannot, however, be calculated by conventional insurance reserving methods for a variety of reasons, including: a) the absence of statistically valid data inasmuch as such claims generally involve long reporting delays and very often uncertainty as to the number and identity of insureds against whom such claims have arisen or will arise; and b) the litigation history of such or similar claims for insurance industry members which has produced inconsistent court decisions with regard to such questions as when an alleged loss occurred, which policies provide coverage, how a loss is to be allocated among potentially responsible insureds and/or their insurance carriers, how policy coverage exclusions are to be interpreted, what types of environmental impairment or toxic tort claims are covered, when the insurer's duty to defend is triggered, how policy limits are to be calculated, and whether clean-up costs constitute property damage. Over time, the Executive Branch and/or the Congress of the United States have proposed or considered changes in the legislation and rules affecting the determination of liability for environmental and asbestosis claims. As of
December 31, 2016
, however, there is no solid evidence to suggest that possible future changes might mitigate or reduce some or all of these claim exposures. Because of the above issues and uncertainties, estimation of reserves for losses and allocated loss adjustment expenses for A&E claims in particular is much more difficult or impossible to quantify with a high degree of precision. Accordingly, no representation can be made that the Company's reserves for such claims and related costs will not prove to be overstated or understated in the future. At
December 31, 2016
and
2015
, Old Republic's aggregate indemnity and loss adjustment expense reserves specifically identified with A&E exposures amounted to
$121.2
and
$130.9
gross, respectively, and
$97.1
and
$100.6
net of reinsurance, respectively. Old Republic's average five year paid loss survival ratios stood at
4.3
years (gross) and
6.3
years (net of reinsurance) as of
December 31,
73
2016
and
4.7
years (gross) and
6.2
years (net of reinsurance) as of
December 31, 2015
. Fluctuations in this ratio between years can be caused by the inconsistent pay out patterns associated with these types of claims.
Title insurance
and related escrow services loss and loss adjustment expense reserves are established as point estimates to cover the projected settlement costs of known as well as IBNR losses related to premium and escrow service revenues of each reporting period. Reserves for known claims are based on an assessment of the facts available to the Company during the settlement process. The point estimates covering all claim reserves inherently take into account IBNR claims based on past experience and evaluations of such variables as changing trends in the types of policies issued, changes in real estate markets and interest rate environments, and changing levels of loan refinancing, all of which can have a bearing on the emergence, number, and ultimate cost of claims.
RFIG Run-off mortgage guaranty
insurance reserves for unpaid claims and claim adjustment expenses are recognized only upon an instance of default, defined as an insured mortgage loan for which two or more consecutive monthly payments have been missed. Loss reserves are based on statistical calculations that take into account the number of reported insured mortgage loan defaults as of each balance sheet date, as well as experience-based estimates of loan defaults that have occurred but have not as yet been reported. Further, the loss reserve estimating process takes into account a large number of variables including trends in claim severity, potential salvage recoveries, expected cure rates for reported loan delinquencies at various stages of default, the level of coverage rescissions and claims denials due to material misrepresentation in key underwriting information or non-compliance with prescribed underwriting guidelines, and management judgments relative to future employment levels, housing market activity, and mortgage loan interest costs, demand, and extensions.
The Company has the legal right to rescind mortgage insurance coverage unilaterally as expressly stated in its policy. Moreover, two federal courts that have considered that policy wording have each affirmed that right (See
First Tennessee Bank N.A.
v.
Republic Mortg. Ins. Co.
, Case No. 2:10-cv-02513-JPM-cgc (W.D. Tenn., Feb. 25, 2011) and
JPMorgan Chase Bank N.A.
v.
Republic Mortg. Ins. Co.
, Civil Action No. 10-06141 (SRC) (D. NJ, May 4, 2011), each decision citing supporting state law legal precedent). RMIC's mortgage insurance policy provides that
the insured represents that
a
ll statements made and information provided to it in an application for coverage for a loan, without regard to who made the statements or provided the information, have been made and presented for and on behalf of the insured; and that
s
uch statements and information are neither false nor misleading in any material respect, nor omit any fact necessary to make such statements and information not false or misleading in any material respect. According to the policy, if any of those representations are materially false or misleading with respect to a loan, the Company has the right to cancel or rescind coverage for that loan retroactively to commencement of the coverage. Whenever the Company determines that an application contains a material misrepresentation, it either advises the insured in writing of its findings prior to rescinding coverage or exercises its unilateral right to rescind coverage for that loan, stating the reasons for that action in writing and returning the applicable premium. The rescission of coverage in instances of materially faulty representations or warranties provided in applications
for insurance is a necessary and prevailing practice throughout the insurance industry. In the case of mortgage guaranty insurance, rescissions have occurred regularly over the years but have been generally immaterial. Since 2008, however, the Company has experienced a much greater incidence of rescissions due to increased levels of observed fraud and misrepresentations in insurance applications pertaining to business underwritten between 2004 and the first half of 2008. As a result, the Company has incorporated certain assumptions regarding the expected levels of coverage rescissions and claim denials in its reserving methodology since 2008. Such estimates, which are evaluated at each balance sheet date, take into account observed as well as historical trends in rescission and denial rates. The table below shows the estimated effects of coverage rescissions and claim denials on loss reserves and settled and incurred losses.
|
2016
|
2015
|
2014
|
|||||||||
|
Estimated reduction in beginning reserve
|
$
|
47.5
|
|
$
|
79.3
|
|
$
|
115.2
|
|
||
|
Total incurred claims and settlement expenses reduced
|
|||||||||||
|
(increased) by changes in estimated rescissions:
|
|||||||||||
|
Current year
|
8.3
|
|
18.8
|
|
47.1
|
|
|||||
|
Prior year
|
(24.8
|
)
|
(17.6
|
)
|
10.4
|
|
|||||
|
Sub-total
|
(16.5
|
)
|
1.2
|
|
57.6
|
|
|||||
|
Estimated rescission reduction in paid claims
|
(1.4
|
)
|
(33.0
|
)
|
(93.5
|
)
|
|||||
|
Estimated reduction in ending reserve
|
$
|
29.6
|
|
$
|
47.5
|
|
$
|
79.3
|
|
||
As above-noted, the estimated reduction in ending loss reserves reflects, in large measure, a variety of judgments relative to the level of expected coverage rescissions and claim denials on loans that are in default as of each balance sheet date. The provision for insured events of the current year resulted from actual and anticipated rescissions and claim denials attributable to newly reported delinquencies in each respective year. The provision for insured events of prior years resulted from actual rescission and claim denial activity, reinstatement of previously rescinded or denied claims, or revisions in assumptions regarding expected rescission or claim denial rates on outstanding prior year delinquencies. The trends since 2010 reflect a continuing reduction in the level of actual and anticipated rescission and claim denial rates on total outstanding delinquencies. Claims not paid by virtue of rescission or denial represent the Company's estimated contractual risk, before consideration of the impacts of any reinsurance and deductibles or aggregate loss limits, on cases that are settled by the issuance of a rescission or denial notification. Variances between the estimated rescission and actual claim denial rate are reflected in the periods during which they occur.
Although the insured has no right under the policy to appeal a Company claim decision, the insured may, at any time, contest in writing the Company's findings or action with respect to a loan or a claim. In such cases, the Company
74
considers any additional information supplied by the insured. This consideration may lead to further investigation, retraction or confirmation of the initial determination. If the Company concludes that it will reinstate coverage, it advises the insured in writing that it will do so immediately upon receipt of the premium previously returned. Reserves are not adjusted for potential reversals of rescissions or adverse rulings for loans under dispute since such reversals of claim rescissions and denials have historically been immaterial to the reserve estimation process.
In addition to the above reserve elements, the Company establishes reserves for loss settlement costs that are not directly related to individual claims. Such reserves are based on prior years' cost experience and trends, and are intended to cover the unallocated costs of claim departments' administration of known and IBNR claims.
The following table shows an analysis of changes in aggregate reserves for the Company's losses, claims and settlement expenses for each of the years shown.
|
Years Ended December 31:
|
2016
|
2015
|
2014
|
||||||||
|
Gross reserves at beginning of year
|
$
|
9,120.1
|
|
$
|
9,122.0
|
|
$
|
9,433.5
|
|
||
|
Less: reinsurance losses recoverable
|
2,732.5
|
|
3,006.6
|
|
2,836.7
|
|
|||||
|
Net reserves at beginning of year:
|
|||||||||||
|
General Insurance
|
5,053.1
|
|
4,722.0
|
|
4,334.1
|
|
|||||
|
Title Insurance
|
580.8
|
|
505.4
|
|
471.5
|
|
|||||
|
RFIG Run-off
|
736.7
|
|
870.2
|
|
1,774.2
|
|
|||||
|
Other
|
16.9
|
|
17.5
|
|
16.8
|
|
|||||
|
Sub-total
|
6,387.6
|
|
6,115.3
|
|
6,596.8
|
|
|||||
|
Incurred claims and claim adjustment expenses:
|
|||||||||||
|
Provisions for insured events of the current year:
|
|||||||||||
|
General Insurance
|
2,115.1
|
|
2,081.6
|
|
2,009.8
|
|
|||||
|
Title Insurance
|
107.7
|
|
112.1
|
|
105.5
|
|
|||||
|
RFIG Run-off (a)
|
171.3
|
|
323.7
|
|
323.1
|
|
|||||
|
Other
|
21.7
|
|
25.2
|
|
44.5
|
|
|||||
|
Sub-total
|
2,416.0
|
|
2,542.8
|
|
2,483.0
|
|
|||||
|
Change in provision for insured events of prior years:
|
|||||||||||
|
General Insurance
|
9.9
|
|
43.9
|
|
107.9
|
|
|||||
|
Title Insurance
|
(23.4
|
)
|
(12.8
|
)
|
(13.6
|
)
|
|||||
|
RFIG Run-off (a)
|
(68.7
|
)
|
(130.1
|
)
|
(74.8
|
)
|
|||||
|
Other
|
(3.8
|
)
|
(.6
|
)
|
(1.5
|
)
|
|||||
|
Sub-total
|
(86.1
|
)
|
(99.7
|
)
|
17.8
|
|
|||||
|
Total incurred claims and claim adjustment expenses (a)
|
2,329.9
|
|
2,443.0
|
|
2,500.9
|
|
|||||
|
Payments:
|
|||||||||||
|
Claims and claim adjustment expenses attributable to
|
|||||||||||
|
insured events of the current year:
|
|||||||||||
|
General Insurance
|
723.5
|
|
671.5
|
|
657.0
|
|
|||||
|
Title Insurance
|
4.4
|
|
(39.9
|
)
|
4.7
|
|
|||||
|
RFIG Run-off (b)
|
14.5
|
|
29.1
|
|
40.6
|
|
|||||
|
Other
|
14.8
|
|
16.9
|
|
33.4
|
|
|||||
|
Sub-total
|
757.4
|
|
677.6
|
|
735.9
|
|
|||||
|
Claims and claim adjustment expenses attributable to
|
|||||||||||
|
insured events of prior years:
|
|||||||||||
|
General Insurance
|
1,204.5
|
|
1,123.0
|
|
1,072.8
|
|
|||||
|
Title Insurance
|
58.6
|
|
63.8
|
|
53.2
|
|
|||||
|
RFIG Run-off (b)
|
250.8
|
|
297.9
|
|
1,111.6
|
|
|||||
|
Other
|
6.1
|
|
8.3
|
|
8.7
|
|
|||||
|
Sub-total
|
1,520.2
|
|
1,493.1
|
|
2,246.5
|
|
|||||
|
Total payments (b)
|
2,277.6
|
|
2,170.7
|
|
2,982.4
|
|
|||||
|
Amount of reserves for unpaid claims and claim adjustment expenses
|
|||||||||||
|
at the end of each year, net of reinsurance losses recoverable: (c)
|
|||||||||||
|
General Insurance
|
5,249.9
|
|
5,053.1
|
|
4,722.0
|
|
|||||
|
Title Insurance
|
602.0
|
|
580.8
|
|
505.4
|
|
|||||
|
RFIG Run-off
|
574.0
|
|
736.7
|
|
870.2
|
|
|||||
|
Other
|
13.8
|
|
16.9
|
|
17.5
|
|
|||||
|
Sub-total
|
6,439.8
|
|
6,387.6
|
|
6,115.3
|
|
|||||
|
Reinsurance losses recoverable
|
2,766.1
|
|
2,732.5
|
|
3,006.6
|
|
|||||
|
Gross reserves at end of year
|
$
|
9,206.0
|
|
$
|
9,120.1
|
|
$
|
9,122.0
|
|
||
__________
75
Excluding the reclassification of CCI from the General Insurance to the RFIG Run-off Business segment, certain elements shown in the preceding table would have been as follows:
|
2016
|
2015
|
2014
|
||||||||||
|
Change in provision for incurred events of prior years:
|
||||||||||||
|
General Insurance
|
$
|
2.5
|
|
$
|
41.2
|
|
$
|
190.8
|
|
|||
|
RFIG Run-off (a)
|
(61.3
|
)
|
(127.4
|
)
|
(157.8
|
)
|
||||||
|
Payment of claim and claim adjustment expenses attributable to
|
||||||||||||
|
incurred events of the current and prior years:
|
||||||||||||
|
General Insurance
|
1,939.9
|
|
1,830.1
|
|
1,825.5
|
|
||||||
|
RFIG Run-off (b)
|
$
|
253.6
|
|
$
|
291.4
|
|
$
|
1,056.5
|
|
|||
|
(a)
|
In common with all other insurance lines, RFIG Run-off mortgage guaranty settled and incurred claim and claim adjustment expenses include only those costs actually or expected to be paid by the Company. As previously noted, changes in mortgage guaranty aggregate case, IBNR, and loss adjustment expense reserves shown below and entering into the determination of incurred claim costs, take into account, among a large number of variables, claim cost reductions for anticipated coverage rescissions and claims denials.
|
The RFIG Run-off mortgage guaranty provision for insured events of the current year was reduced by estimated coverage rescissions and claims denials of
$8.3
,
$18.8
and
$47.1
, respectively, for
2016
,
2015
and
2014
. The provision for insured events of prior years in
2016
,
2015
and
2014
was (increased) reduced by estimated coverage rescissions and claims denials of
$(24.8)
,
$(17.6)
and
$10.4
, respectively. Prior year development was also affected in varying degrees by differences between actual claim settlements relative to expected experience, by reinstatement of previously rescinded or denied claims, and by subsequent revisions of assumptions in regards to claim frequency, severity or levels of associated claim settlement costs which result from consideration of underlying trends and expectations.
The following table reflects the changes in net reserves between succeeding balance sheet dates.
|
2016
|
2015
|
2014
|
||||||||||
|
Net reserve increase(decrease):
|
||||||||||||
|
General Insurance
|
$
|
196.8
|
|
$
|
331.0
|
|
$
|
387.9
|
|
|||
|
Title Insurance
|
21.2
|
|
75.3
|
|
33.8
|
|
||||||
|
RFIG Run-off
|
(162.7
|
)
|
(133.4
|
)
|
(904.0
|
)
|
||||||
|
Other
|
(3.0
|
)
|
(.6
|
)
|
.7
|
|
||||||
|
Total
|
$
|
52.2
|
|
$
|
272.2
|
|
$
|
(481.5
|
)
|
|||
|
(b)
|
Rescissions reduced the Company's paid losses by an estimated
$1.4
,
$33.0
, and
$93.5
for
2016
,
2015
, and
2014
, respectively. In mid July 2014, in furtherance of a Final Order received from the NCDOI, RMIC and RMICNC processed payments of their accumulated deferred payment obligation balances of approximately
$657.0
. Refer to Note 1(s).
|
|
(c)
|
Year end net IBNR reserves for each segment were as follows:
|
|
2016
|
2015
|
2014
|
||||||||||
|
General Insurance
|
$
|
2,431.2
|
|
$
|
2,324.3
|
|
$
|
2,266.2
|
|
|||
|
Title Insurance
|
517.5
|
|
503.8
|
|
432.2
|
|
||||||
|
RFIG Run-off
|
206.3
|
|
180.7
|
|
138.7
|
|
||||||
|
Other
|
5.4
|
|
6.4
|
|
5.7
|
|
||||||
|
Total
|
$
|
3,160.5
|
|
$
|
3,015.3
|
|
$
|
2,843.0
|
|
|||
For the three most recent calendar years, the above table indicates that the one-year development of consolidated reserves at the beginning of each year produced favorable developments of
1.3%
and
1.6%
for 2016 and 2015, respectively, and unfavorable development of
(.3)%
for 2014, with average favorable annual developments of
.8%
. The Company believes that the factors most responsible, in varying and continually changing degrees, for reserve redundancies or deficiencies include, as to many general insurance coverages, the effect of reserve discounts applicable to workers' compensation claims, higher than expected severity of litigated claims in particular, governmental or judicially imposed retroactive conditions in the settlement of claims such as noted above in regard to black lung disease claims, greater than anticipated inflation rates applicable to repairs and the medical portion of claims in particular, and higher than expected claims incurred but not reported due to the slower and highly volatile emergence patterns applicable to certain types of claims such as those stemming from litigated, assumed reinsurance, or the A&E types of claims noted above. In 2016, 2015 and 2014, the Company experienced unfavorable developments of previously established reserves for accidents or events which occurred in 2014 and prior years in particular. These adverse developments were concentrated in workers' compensation and general liability case reserves and resulted from settlements or reserve additions exceeding the previously established indemnity and/or allocated loss adjustment expense provisions. As to
76
mortgage guaranty and the CCI coverage, changes in reserve adequacy or deficiency result from differences in originally estimated salvage and subrogation recoveries, sales and prices of homes that can impact claim costs upon the disposition of foreclosed properties, changes in regional or local economic conditions and employment levels, greater numbers of coverage rescissions and claims denials due to material misrepresentation in key underwriting information or non-compliance with prescribed underwriting guidelines, the extent of loan refinancing activity that can reduce the period of time over which a policy remains at risk, and lower than expected frequencies of claims incurred but not reported.
In May 2015, the FASB issued guidance requiring additional disclosures about short-duration insurance contracts which the Company has adopted for purposes of its 2016 Annual Report on Form 10-K. The new disclosures, which are included below, are intended to provide additional information about insurance liabilities including the nature, amount, timing, and uncertainty of future cash flows related to those liabilities.
The information about incurred and paid claims development for the years ended December 31, 2007 to 2015 is presented as supplementary information.
The following represents the Company's incurred and paid loss development tables for the major types of insurance coverages as of
December 31, 2016
.
|
Workers' Compensation
|
|||||||||||||||||||||||||||||||||||
|
Incurred Claims and Allocated Claim Adjustment Expenses, Net of Reinsurance (Undiscounted)
|
As of December 31, 2016
|
||||||||||||||||||||||||||||||||||
|
Total of Incurred-but-Not-Reported Liabilities Plus Expected Development on Reported Claims
|
Cumulative Number of Reported Claims*
|
||||||||||||||||||||||||||||||||||
|
For the Years Ended December 31,
|
|||||||||||||||||||||||||||||||||||
|
Accident
|
Supplementary Information (Unaudited)
|
||||||||||||||||||||||||||||||||||
|
Year
|
2007
|
2008
|
2009
|
2010
|
2011
|
2012
|
2013
|
2014
|
2015
|
2016
|
|||||||||||||||||||||||||
|
2007
|
$
|
562.5
|
|
$
|
542.3
|
|
$
|
542.6
|
|
$
|
546.2
|
|
$
|
544.3
|
|
$
|
537.6
|
|
$
|
532.6
|
|
$
|
535.3
|
|
$
|
537.5
|
|
$
|
535.1
|
|
$
|
23.2
|
|
69,162
|
|
|
2008
|
513.4
|
|
515.1
|
|
509.5
|
|
511.6
|
|
507.2
|
|
505.4
|
|
509.4
|
|
508.8
|
|
511.3
|
|
21.2
|
|
63,658
|
||||||||||||||
|
2009
|
520.7
|
|
516.9
|
|
534.7
|
|
544.4
|
|
542.9
|
|
559.8
|
|
564.6
|
|
563.8
|
|
32.0
|
|
55,919
|
||||||||||||||||
|
2010
|
485.1
|
|
480.0
|
|
521.5
|
|
545.3
|
|
569.1
|
|
563.1
|
|
564.0
|
|
35.1
|
|
57,714
|
||||||||||||||||||
|
2011
|
558.6
|
|
567.3
|
|
595.3
|
|
622.5
|
|
643.0
|
|
641.7
|
|
80.5
|
|
53,259
|
||||||||||||||||||||
|
2012
|
629.3
|
|
647.2
|
|
670.6
|
|
678.1
|
|
676.4
|
|
118.0
|
|
49,826
|
||||||||||||||||||||||
|
2013
|
700.9
|
|
705.3
|
|
716.9
|
|
722.7
|
|
149.6
|
|
48,709
|
||||||||||||||||||||||||
|
2014
|
780.9
|
|
792.8
|
|
786.4
|
|
229.5
|
|
53,860
|
||||||||||||||||||||||||||
|
2015
|
794.3
|
|
792.6
|
|
319.4
|
|
54,535
|
||||||||||||||||||||||||||||
|
2016
|
756.1
|
|
449.5
|
|
41,331
|
||||||||||||||||||||||||||||||
|
Total
|
|
$
|
6,550.6
|
|
(A)
|
||||||||||||||||||||||||||||||
|
* Reported claims are accumulated on an individual claimant basis and exclude external reinsurance assumed and participation in residual market pools as claim frequency information is not available.
|
|||||||||||||||||||||||||||||||||||
|
Cumulative Paid Claims and Allocated Claim Adjustment Expenses, Net of Reinsurance
|
|||||||||||||||||||||||||||||||||
|
For the Years Ended December 31,
|
|||||||||||||||||||||||||||||||||
|
Accident
|
Supplementary Information (Unaudited)
|
||||||||||||||||||||||||||||||||
|
Year
|
2007
|
2008
|
2009
|
2010
|
2011
|
2012
|
2013
|
2014
|
2015
|
2016
|
|||||||||||||||||||||||
|
2007
|
$
|
103.5
|
|
$
|
241.4
|
|
$
|
337.1
|
|
$
|
384.0
|
|
$
|
414.4
|
|
$
|
437.6
|
|
$
|
434.0
|
|
$
|
449.2
|
|
$
|
458.7
|
|
$
|
465.5
|
|
|||
|
2008
|
110.3
|
|
246.1
|
|
326.2
|
|
377.9
|
|
412.9
|
|
431.7
|
|
428.4
|
|
440.6
|
|
450.5
|
|
|||||||||||||||
|
2009
|
113.8
|
|
263.6
|
|
351.4
|
|
404.2
|
|
440.2
|
|
469.4
|
|
468.1
|
|
478.8
|
|
|||||||||||||||||
|
2010
|
118.9
|
|
279.8
|
|
370.1
|
|
427.9
|
|
464.0
|
|
466.5
|
|
482.8
|
|
|||||||||||||||||||
|
2011
|
112.6
|
|
266.7
|
|
361.4
|
|
424.0
|
|
469.8
|
|
503.4
|
|
|||||||||||||||||||||
|
2012
|
113.1
|
|
265.8
|
|
361.8
|
|
426.7
|
|
469.5
|
|
|||||||||||||||||||||||
|
2013
|
107.6
|
|
274.3
|
|
381.2
|
|
449.8
|
|
|||||||||||||||||||||||||
|
2014
|
116.9
|
|
293.7
|
|
397.1
|
|
|||||||||||||||||||||||||||
|
2015
|
109.0
|
|
274.9
|
|
|||||||||||||||||||||||||||||
|
2016
|
102.5
|
|
|||||||||||||||||||||||||||||||
|
Total
|
|
$
|
4,075.4
|
|
(B)
|
||||||||||||||||||||||||||||
|
Net incurred claims and allocated claim adjustment expenses (A)
|
$
|
6,550.6
|
|
||||||||||||||||||||||||||||||
|
Less: net paid claims and allocated claim adjustment expenses (B)
|
4,075.4
|
|
|||||||||||||||||||||||||||||||
|
Sub-total
|
2,475.1
|
|
|||||||||||||||||||||||||||||||
|
All outstanding liabilities before 2007, net of reinsurance
|
640.1
|
|
|||||||||||||||||||||||||||||||
|
Liabilities for claims and allocated claim adjustment expenses, net of reinsurance
|
$
|
3,115.3
|
|
||||||||||||||||||||||||||||||
77
|
General Liability
|
|||||||||||||||||||||||||||||||||||
|
Incurred Claims and Allocated Claim Adjustment Expenses, Net of Reinsurance (Undiscounted)
|
As of December 31, 2016
|
||||||||||||||||||||||||||||||||||
|
Total of Incurred-but-Not-Reported Liabilities Plus Expected Development on Reported Claims
|
Cumulative Number of Reported Claims*
|
||||||||||||||||||||||||||||||||||
|
For the Years Ended December 31,
|
|||||||||||||||||||||||||||||||||||
|
Accident
|
Supplementary Information (Unaudited)
|
||||||||||||||||||||||||||||||||||
|
Year
|
2007
|
2008
|
2009
|
2010
|
2011
|
2012
|
2013
|
2014
|
2015
|
2016
|
|||||||||||||||||||||||||
|
2007
|
$
|
109.7
|
|
$
|
102.6
|
|
$
|
103.7
|
|
$
|
104.7
|
|
$
|
107.3
|
|
$
|
116.3
|
|
$
|
113.0
|
|
$
|
113.3
|
|
$
|
112.2
|
|
$
|
117.6
|
|
$
|
8.8
|
|
7,468
|
|
|
2008
|
87.4
|
|
91.8
|
|
95.4
|
|
93.0
|
|
93.1
|
|
91.9
|
|
102.2
|
|
101.9
|
|
102.7
|
|
12.6
|
|
5,063
|
||||||||||||||
|
2009
|
88.6
|
|
87.9
|
|
88.2
|
|
83.1
|
|
89.7
|
|
107.6
|
|
107.4
|
|
105.3
|
|
8.9
|
|
6,057
|
||||||||||||||||
|
2010
|
68.4
|
|
67.8
|
|
66.6
|
|
64.7
|
|
70.4
|
|
69.6
|
|
68.6
|
|
7.8
|
|
5,318
|
||||||||||||||||||
|
2011
|
72.5
|
|
71.5
|
|
72.9
|
|
80.0
|
|
95.8
|
|
96.0
|
|
11.7
|
|
4,667
|
||||||||||||||||||||
|
2012
|
95.0
|
|
91.2
|
|
89.2
|
|
100.9
|
|
107.2
|
|
19.8
|
|
5,168
|
||||||||||||||||||||||
|
2013
|
95.7
|
|
96.7
|
|
96.5
|
|
107.8
|
|
21.9
|
|
5,357
|
||||||||||||||||||||||||
|
2014
|
107.0
|
|
110.4
|
|
109.3
|
|
41.7
|
|
5,671
|
||||||||||||||||||||||||||
|
2015
|
96.0
|
|
96.3
|
|
54.5
|
|
4,826
|
||||||||||||||||||||||||||||
|
2016
|
92.4
|
|
60.6
|
|
3,650
|
||||||||||||||||||||||||||||||
|
1,003.6
|
|
(A)
|
|||||||||||||||||||||||||||||||||
|
* Reported claims are accumulated on an individual claimant basis and exclude external reinsurance assumed and participation in residual market pools as claim frequency information is not available.
|
|||||||||||||||||||||||||||||||||||
|
Cumulative Paid Claims and Allocated Claim Adjustment Expenses, Net of Reinsurance
|
|||||||||||||||||||||||||||||||||
|
For the Years Ended December 31,
|
|||||||||||||||||||||||||||||||||
|
Accident
|
Supplementary Information (Unaudited)
|
||||||||||||||||||||||||||||||||
|
Year
|
2007
|
2008
|
2009
|
2010
|
2011
|
2012
|
2013
|
2014
|
2015
|
2016
|
|||||||||||||||||||||||
|
2007
|
$
|
14.6
|
|
$
|
25.6
|
|
$
|
38.4
|
|
$
|
56.5
|
|
$
|
72.0
|
|
$
|
84.1
|
|
$
|
93.3
|
|
$
|
99.9
|
|
$
|
101.0
|
|
$
|
101.9
|
|
|||
|
2008
|
3.9
|
|
15.1
|
|
28.6
|
|
46.0
|
|
56.0
|
|
66.7
|
|
72.2
|
|
75.6
|
|
79.8
|
|
|||||||||||||||
|
2009
|
2.4
|
|
7.8
|
|
25.5
|
|
37.0
|
|
50.3
|
|
67.8
|
|
77.1
|
|
85.3
|
|
|||||||||||||||||
|
2010
|
3.9
|
|
10.8
|
|
20.8
|
|
31.1
|
|
44.3
|
|
52.1
|
|
55.5
|
|
|||||||||||||||||||
|
2011
|
2.5
|
|
12.1
|
|
26.0
|
|
43.6
|
|
58.6
|
|
68.9
|
|
|||||||||||||||||||||
|
2012
|
5.5
|
|
18.8
|
|
36.0
|
|
50.8
|
|
67.4
|
|
|||||||||||||||||||||||
|
2013
|
4.0
|
|
13.6
|
|
34.3
|
|
58.4
|
|
|||||||||||||||||||||||||
|
2014
|
5.8
|
|
15.8
|
|
31.9
|
|
|||||||||||||||||||||||||||
|
2015
|
6.3
|
|
16.0
|
|
|||||||||||||||||||||||||||||
|
2016
|
7.1
|
|
|||||||||||||||||||||||||||||||
|
$
|
572.7
|
|
(B)
|
||||||||||||||||||||||||||||||
|
Net incurred claims and allocated claim adjustment expenses (A)
|
$
|
1,003.6
|
|
||||||||||||||||||||||||||||||
|
Less: net paid claims and allocated claim adjustment expenses (B)
|
572.7
|
|
|||||||||||||||||||||||||||||||
|
Sub-total
|
430.8
|
|
|||||||||||||||||||||||||||||||
|
All outstanding liabilities before 2007, net of reinsurance
|
119.4
|
|
|||||||||||||||||||||||||||||||
|
Liabilities for claims and allocated claim adjustment expenses, net of reinsurance
|
$
|
550.3
|
|
||||||||||||||||||||||||||||||
78
|
Commercial Automobile
|
|||||||||||||||||||||||||||||||||||
|
Incurred Claims and Allocated Claim Adjustment Expenses, Net of Reinsurance (Undiscounted)
|
As of December 31, 2016
|
||||||||||||||||||||||||||||||||||
|
Total of Incurred-but-Not-Reported Liabilities Plus Expected Development on Reported Claims
|
Cumulative Number of Reported Claims*
|
||||||||||||||||||||||||||||||||||
|
For the Years Ended December 31,
|
|||||||||||||||||||||||||||||||||||
|
Accident
|
Supplementary Information (Unaudited)
|
||||||||||||||||||||||||||||||||||
|
Year
|
2007
|
2008
|
2009
|
2010
|
2011
|
2012
|
2013
|
2014
|
2015
|
2016
|
|||||||||||||||||||||||||
|
2007
|
$
|
601.5
|
|
$
|
565.0
|
|
$
|
529.8
|
|
$
|
513.3
|
|
$
|
509.1
|
|
$
|
506.7
|
|
$
|
495.9
|
|
$
|
493.0
|
|
$
|
476.6
|
|
$
|
474.6
|
|
$
|
4.2
|
|
94,462
|
|
|
2008
|
572.8
|
|
546.4
|
|
516.4
|
|
502.5
|
|
497.8
|
|
495.7
|
|
480.7
|
|
462.8
|
|
460.6
|
|
3.3
|
|
87,247
|
||||||||||||||
|
2009
|
538.0
|
|
491.0
|
|
459.2
|
|
437.9
|
|
434.1
|
|
424.9
|
|
407.0
|
|
402.7
|
|
4.9
|
|
79,178
|
||||||||||||||||
|
2010
|
578.8
|
|
531.6
|
|
506.7
|
|
500.1
|
|
496.6
|
|
494.9
|
|
479.9
|
|
12.1
|
|
92,134
|
||||||||||||||||||
|
2011
|
584.2
|
|
575.5
|
|
551.4
|
|
543.8
|
|
549.9
|
|
549.0
|
|
17.3
|
|
96,702
|
||||||||||||||||||||
|
2012
|
617.0
|
|
605.1
|
|
579.6
|
|
575.0
|
|
573.1
|
|
25.8
|
|
97,962
|
||||||||||||||||||||||
|
2013
|
654.6
|
|
649.8
|
|
668.5
|
|
669.6
|
|
37.7
|
|
96,810
|
||||||||||||||||||||||||
|
2014
|
678.9
|
|
689.2
|
|
691.7
|
|
33.7
|
|
102,857
|
||||||||||||||||||||||||||
|
2015
|
712.4
|
|
710.5
|
|
36.9
|
|
103,767
|
||||||||||||||||||||||||||||
|
2016
|
755.9
|
|
31.8
|
|
100,806
|
||||||||||||||||||||||||||||||
|
$
|
5,768.1
|
|
(A)
|
||||||||||||||||||||||||||||||||
|
* Reported claims are accumulated on an individual claimant basis and exclude external reinsurance assumed and participation in residual market pools as claim frequency information is not available.
|
|||||||||||||||||||||||||||||||||||
|
Cumulative Paid Claims and Allocated Claim Adjustment Expenses, Net of Reinsurance
|
|||||||||||||||||||||||||||||||||
|
For the Years Ended December 31,
|
|||||||||||||||||||||||||||||||||
|
Accident
|
Supplementary Information (Unaudited)
|
||||||||||||||||||||||||||||||||
|
Year
|
2007
|
2008
|
2009
|
2010
|
2011
|
2012
|
2013
|
2014
|
2015
|
2016
|
|||||||||||||||||||||||
|
2007
|
$
|
206.6
|
|
$
|
322.8
|
|
$
|
399.3
|
|
$
|
438.1
|
|
$
|
454.5
|
|
$
|
463.4
|
|
$
|
467.4
|
|
$
|
469.1
|
|
$
|
469.4
|
|
$
|
469.6
|
|
|||
|
2008
|
208.6
|
|
306.8
|
|
368.5
|
|
417.3
|
|
436.9
|
|
447.3
|
|
453.7
|
|
455.7
|
|
456.0
|
|
|||||||||||||||
|
2009
|
177.8
|
|
269.2
|
|
325.1
|
|
358.6
|
|
377.0
|
|
386.8
|
|
394.0
|
|
396.6
|
|
|||||||||||||||||
|
2010
|
200.0
|
|
305.8
|
|
372.7
|
|
423.8
|
|
449.4
|
|
460.0
|
|
465.7
|
|
|||||||||||||||||||
|
2011
|
223.1
|
|
352.7
|
|
436.2
|
|
483.2
|
|
511.6
|
|
523.0
|
|
|||||||||||||||||||||
|
2012
|
229.0
|
|
351.4
|
|
442.9
|
|
498.6
|
|
525.9
|
|
|||||||||||||||||||||||
|
2013
|
248.3
|
|
398.1
|
|
511.0
|
|
578.1
|
|
|||||||||||||||||||||||||
|
2014
|
267.4
|
|
430.5
|
|
536.9
|
|
|||||||||||||||||||||||||||
|
2015
|
265.1
|
|
438.9
|
|
|||||||||||||||||||||||||||||
|
2016
|
290.2
|
|
|||||||||||||||||||||||||||||||
|
$
|
4,681.3
|
|
(B)
|
||||||||||||||||||||||||||||||
|
Net incurred claims and allocated claim adjustment expenses (A)
|
$
|
5,768.1
|
|
||||||||||||||||||||||||||||||
|
Less: net paid claims and allocated claim adjustment expenses (B)
|
4,681.3
|
|
|||||||||||||||||||||||||||||||
|
Sub-total
|
1,086.8
|
|
|||||||||||||||||||||||||||||||
|
All outstanding liabilities before 2007, net of reinsurance
|
3.9
|
|
|||||||||||||||||||||||||||||||
|
Liabilities for claims and allocated claim adjustment expenses, net of reinsurance
|
$
|
1,090.8
|
|
||||||||||||||||||||||||||||||
79
The following represents a reconciliation of the incurred and paid loss development tables to total claim and loss adjustment expense reserves as reported in the consolidated balance sheet.
|
December 31, 2016
|
|||
|
Net claim and allocated loss adjustment expense reserves:
|
|||
|
Workers' compensation (a)
|
$
|
2,883.3
|
|
|
General liability
|
550.3
|
|
|
|
Commercial automobile
|
1,090.8
|
|
|
|
Three above coverages combined
|
4,524.5
|
|
|
|
Other short-duration insurance lines
|
539.3
|
|
|
|
Subtotal
|
5,063.8
|
|
|
|
Reinsurance recoverable on claim reserves:
|
|||
|
Workers' compensation
|
1,703.6
|
|
|
|
General liability
|
513.7
|
|
|
|
Commercial automobile
|
289.9
|
|
|
|
Three above coverages combined
|
2,507.3
|
|
|
|
Other short-duration insurance lines
|
230.1
|
|
|
|
Subtotal
|
2,737.5
|
|
|
|
Insurance lines other than short-duration
|
985.7
|
|
|
|
Unallocated loss adjustment expense reserves
|
418.8
|
|
|
|
1,404.6
|
|
||
|
Gross claim and loss adjustment expense reserves
|
$
|
9,206.0
|
|
__________
(a) The amount of discount reflected in the year end net reserves totaled
$231.9
as of
December 31, 2016
.
The table below is supplementary information and presents the historical average annual percentage payout of incurred claims by age, net of reinsurance.
|
Supplementary Information (Unaudited)
|
||||||||||||||||||||
|
Year 1
|
Year 2
|
Year 3
|
Year 4
|
Year 5
|
Year 6
|
Year 7
|
Year 8
|
Year 9
|
Year 10
|
|||||||||||
|
Workers' compensation
|
17.4
|
%
|
24.5
|
%
|
15.3
|
%
|
9.6
|
%
|
6.5
|
%
|
3.8
|
%
|
.3
|
%
|
2.4
|
%
|
1.9
|
%
|
1.3
|
%
|
|
General liability
|
5.6
|
%
|
9.5
|
%
|
15.0
|
%
|
16.1
|
%
|
14.3
|
%
|
11.9
|
%
|
6.7
|
%
|
5.6
|
%
|
2.5
|
%
|
.7
|
%
|
|
Commercial automobile
|
40.7
|
%
|
22.9
|
%
|
15.1
|
%
|
9.4
|
%
|
4.6
|
%
|
2.2
|
%
|
1.3
|
%
|
.5
|
%
|
.1
|
%
|
—
|
%
|
(i) Reinsurance
- The cost of reinsurance is recognized over the terms of reinsurance contracts. Amounts recoverable from reinsurers for loss and loss adjustment expenses are estimated in a manner consistent with the claim liability associated with the reinsured business. The Company evaluates the financial condition of its reinsurers on a regular basis. Allowances are established for amounts deemed uncollectible and are included in the Company's net claim and claim expense reserves.
(j) Income Taxes
- The Company and most of its subsidiaries file a consolidated tax return and provide for income taxes payable currently. Deferred income taxes included in the accompanying consolidated financial statements will not necessarily become payable or recoverable in the future. The Company uses the asset and liability method of calculating deferred income taxes. This method results in the establishment of deferred tax assets and liabilities, calculated at currently enacted tax rates that are applied to the cumulative temporary differences between financial statement and tax bases of assets and liabilities.
The provision for combined current and deferred income taxes (credits) reflected in the consolidated statements of income does not bear the usual relationship to income before income taxes (credits) as the result of permanent and other differences between pretax income or loss and taxable income or loss determined under existing tax regulations. The more significant differences, their effect on the statutory income tax rate (credit), and the resulting effective income tax rates (credits) are summarized below:
80
|
Years Ended December 31:
|
2016
|
2015
|
2014
|
||||||
|
Statutory tax rate (credit)
|
35.0
|
%
|
35.0
|
%
|
35.0
|
%
|
|||
|
Tax rate increases (decreases):
|
|||||||||
|
Tax-exempt interest
|
(.5
|
)
|
(.1
|
)
|
(.2
|
)
|
|||
|
Dividends received exclusion
|
(2.6
|
)
|
(3.0
|
)
|
(1.5
|
)
|
|||
|
Valuation allowance
|
—
|
|
1.1
|
|
—
|
|
|||
|
Foreign income (loss) reattribution
|
(.1
|
)
|
(.2
|
)
|
(.2
|
)
|
|||
|
Other items - net
|
.1
|
|
.4
|
|
(.3
|
)
|
|||
|
Effective tax rate (credit)
|
31.9
|
%
|
33.2
|
%
|
32.8
|
%
|
|||
The tax effects of temporary differences that give rise to significant portions of the Company's net deferred tax assets (liabilities) are as follows at the dates shown:
|
December 31:
|
2016
|
2015
|
2014
|
|||||||||
|
Deferred Tax Assets:
|
||||||||||||
|
Losses, claims, and settlement expenses
|
$
|
337.7
|
|
$
|
330.2
|
|
$
|
299.9
|
|
|||
|
Pension and deferred compensation plans
|
71.5
|
|
71.1
|
|
75.8
|
|
||||||
|
Impairment losses on investments
|
1.7
|
|
—
|
|
3.2
|
|
||||||
|
Net operating loss carryforward
|
33.3
|
|
36.8
|
|
40.2
|
|
||||||
|
AMT credit carryforward
|
9.6
|
|
9.6
|
|
9.6
|
|
||||||
|
Other temporary differences
|
33.6
|
|
35.5
|
|
38.4
|
|
||||||
|
Total deferred tax assets before valuation allowance
|
487.5
|
|
483.3
|
|
467.2
|
|
||||||
|
Valuation allowance
|
—
|
|
—
|
|
(9.6
|
)
|
||||||
|
Total deferred tax assets
|
487.5
|
|
483.3
|
|
457.6
|
|
||||||
|
Deferred Tax Liabilities:
|
||||||||||||
|
Unearned premium reserves
|
48.5
|
|
44.4
|
|
39.6
|
|
||||||
|
Deferred policy acquisition costs
|
91.7
|
|
84.8
|
|
76.6
|
|
||||||
|
Mortgage guaranty insurers' contingency reserves
|
114.3
|
|
82.4
|
|
53.5
|
|
||||||
|
Amortization of fixed maturity securities
|
5.8
|
|
5.6
|
|
5.1
|
|
||||||
|
Net unrealized investment gains
|
232.6
|
|
74.9
|
|
208.7
|
|
||||||
|
Title plants and records
|
4.9
|
|
4.9
|
|
5.0
|
|
||||||
|
Other temporary differences
|
31.9
|
|
31.9
|
|
31.9
|
|
||||||
|
Total deferred tax liabilities
|
529.9
|
|
328.9
|
|
420.6
|
|
||||||
|
Net deferred tax assets (liabilities)
|
$
|
(42.6
|
)
|
$
|
154.5
|
|
$
|
37.0
|
|
|||
At
December 31, 2016
, the Company had available net operating loss ("NOL") carryforwards of
$95.3
which will expire in years
2021
through
2029
, and a
$9.6
alternative minimum tax ("AMT") credit carryforward which does not expire. The NOL carryforward is subject to the limitations set by Section 382 of the Internal Revenue Code and is available to reduce future years' taxable income by a maximum of
$9.8
each year until expiration.
A valuation allowance was held against deferred tax assets as of
December 31, 2014
related to certain tax credit carryforwards which the Company did not expect to realize. In
2015
, the Company released the valuation allowance previously established. In valuing the deferred tax assets, the Company considered certain factors including primarily the scheduled reversals of certain deferred tax liabilities, estimates of future taxable income, the impact of available carryback and carryforward periods, as well as the availability of certain tax planning strategies. The Company estimates that all gross deferred tax assets at year end
2016
will more likely than not be fully realized.
Pursuant to special provisions of the Internal Revenue Code pertaining to mortgage guaranty insurers, a contingency reserve (established in accordance with insurance regulations designed to protect policyholders against extraordinary volumes of claims) is deductible from gross income. The deduction is allowed only to the extent that U.S. government non-interest bearing tax and loss bonds are purchased and held in an amount equal to the tax benefit attributable to such deduction. For Federal income tax purposes, amounts deducted from the contingency reserve are taken into gross statutory taxable income in the period in which they are released. Contingency reserves may be released when incurred losses exceed thresholds established under state law or regulation, upon special request and approval by state insurance regulators, or in any event, upon the expiration of ten years. For
2016
tax purposes, the Company recognized a contingency reserve deduction of
$91.0
. Consequently,
$31.8
of U.S. Treasury Tax and Loss Bonds will be acquired during the first quarter of
2017
.
Tax positions taken or expected to be taken in a tax return by the Company are recognized in the financial statements when it is more likely than not that the position would be sustained upon examination by tax authorities. To the best of management's knowledge there are no tax uncertainties that are expected to result in significant increases or decreases to unrecognized tax benefits within the next twelve month period. The Company views its income tax exposures as primarily consisting of timing differences whereby the ultimate deductibility of a taxable amount is highly certain but the timing of its deductibility is uncertain. Such differences relate principally to the timing of deductions for loss and premium reserves. As in prior examinations, the Internal Revenue Service (IRS) could assert that claim reserve deductions were
81
overstated thereby reducing the Company's statutory taxable income in any particular year. The Company believes that it establishes its reserves fairly and consistently at each balance sheet date, and that it would succeed in defending its tax position in these regards. Because of the impact of deferred tax accounting, the possible accelerated payment of tax to the IRS would not necessarily affect the annual effective tax rate. The Company classifies interest and penalties as income tax expense in the consolidated statement of income. During 2016, the IRS completed an examination of the Company's consolidated Federal income tax returns for the years 2011 through 2013, which produced no material change to the Company's net income.
(k) Property and Equipment
- Property and equipment is generally depreciated or amortized over the estimated useful lives of the assets, (2 to 27 years), substantially by the straight-line method. Depreciation and amortization expenses related to property and equipment were
$29.6
,
$26.6
and
$26.1
in
2016
,
2015
, and
2014
, respectively. Expenditures for maintenance and repairs are charged to income as incurred, and expenditures for major renewals and additions are capitalized.
(l) Title Plants and Records
- Title plants and records are carried at original cost or appraised value at the date of purchase. Such values represent the cost of producing or acquiring interests in title records and indexes and the appraised value of purchased subsidiaries' title records and indexes at dates of acquisition. The cost of maintaining, updating, and operating title records is charged to income as incurred. Title records and indexes are ordinarily not amortized unless events or circumstances indicate that the carrying amount of the capitalized costs may not be recoverable.
(m) Goodwill and Intangible Assets
- The following table presents the components of the Company's goodwill balance:
|
General
|
Title
|
RFIG Run-off
|
Other
|
Total
|
|||||||||||||||
|
January 1, 2015
|
$
|
116.2
|
|
$
|
44.3
|
|
$
|
—
|
|
$
|
.1
|
|
$
|
160.7
|
|
||||
|
Acquisitions
|
—
|
|
—
|
|
—
|
|
—
|
|
—
|
|
|||||||||
|
Impairments
|
—
|
|
—
|
|
—
|
|
—
|
|
—
|
|
|||||||||
|
December 31, 2015
|
116.2
|
|
44.3
|
|
—
|
|
.1
|
|
160.7
|
|
|||||||||
|
Acquisitions
|
—
|
|
—
|
|
—
|
|
—
|
|
—
|
|
|||||||||
|
Impairments
|
—
|
|
—
|
|
—
|
|
—
|
|
—
|
|
|||||||||
|
December 31, 2016
|
$
|
116.2
|
|
$
|
44.3
|
|
$
|
—
|
|
$
|
.1
|
|
$
|
160.7
|
|
||||
Goodwill resulting from business combinations is not amortizable against operations but must be tested annually for possible impairment of its continued value. Intangible assets with definitive lives are amortized against future operating results; whereas indefinite-lived intangibles are tested annually for impairment.
There are no significant goodwill balances within reporting units with estimated fair values not significantly in excess of their carrying values.
(n) Employee Benefit Plans
- The Company has a pension plan (the "Plan") covering a portion of its work force. The Plan is a defined benefit plan pursuant to which pension payments are based primarily on years of service and employee compensation near retirement. It is the Company's policy to fund the Plan's costs as they accrue. The Plan is closed to new participants and benefits were frozen as of
December 31, 2013
. As a result, eligible employees retain all of the vested rights as of the effective date of the freeze, while additional benefits no longer accrue.
The funded status of a pension plan is measured as of December 31 of each year, as the difference between the fair value of plan assets and the projected benefit obligation. The underfunded status of the Plan is recognized as a net pension liability; offsetting entries are reflected as a component of shareholders' equity in accumulated other comprehensive income, net of deferred taxes. The effects of these measurements and the resulting funded status of the Plan are reflected below.
|
Years Ended December 31:
|
2016
|
2015
|
2014
|
|||||||||
|
Projected Benefit Obligation
|
||||||||||||
|
Projected benefit obligation at beginning of year
|
$
|
523.7
|
|
$
|
552.9
|
|
$
|
479.3
|
|
|||
|
Increases (decreases) during the year attributable to:
|
||||||||||||
|
Interest cost
|
23.2
|
|
22.1
|
|
23.4
|
|
||||||
|
Actuarial (gains) losses
|
12.5
|
|
(31.0
|
)
|
68.9
|
|
||||||
|
Benefits paid
|
(21.9
|
)
|
(20.2
|
)
|
(18.7
|
)
|
||||||
|
Net increase (decrease) for the year
|
13.7
|
|
(29.1
|
)
|
73.5
|
|
||||||
|
Projected benefit obligation at end of year
|
$
|
537.5
|
|
$
|
523.7
|
|
$
|
552.9
|
|
|||
|
Accumulated benefit obligation at end of year
|
$
|
537.5
|
|
$
|
523.7
|
|
$
|
552.9
|
|
|||
82
|
Fair Value of Net Assets Available for Plan Benefits
|
||||||||||||
|
Fair value of net assets available for plan benefits
|
||||||||||||
|
At beginning of the year
|
$
|
409.2
|
|
$
|
419.2
|
|
$
|
408.8
|
|
|||
|
Increases (decreases) during the year attributable to:
|
||||||||||||
|
Actual return on plan assets
|
39.9
|
|
4.7
|
|
19.8
|
|
||||||
|
Sponsor contributions
|
—
|
|
5.5
|
|
9.2
|
|
||||||
|
Benefits paid
|
(21.9
|
)
|
(20.2
|
)
|
(18.7
|
)
|
||||||
|
Net increase (decrease) for year
|
17.9
|
|
(9.9
|
)
|
10.3
|
|
||||||
|
Fair value of net assets available for plan benefits
|
||||||||||||
|
At end of the year
|
$
|
427.1
|
|
$
|
409.2
|
|
$
|
419.2
|
|
|||
|
Funded Status
|
$
|
(110.3
|
)
|
$
|
(114.5
|
)
|
$
|
(133.6
|
)
|
|||
|
Amounts recognized in accumulated other comprehensive income
|
$
|
(117.0
|
)
|
$
|
(118.2
|
)
|
$
|
(126.9
|
)
|
|||
The Company expects to make cash contributions of
$2.8
in calendar year
2017
.
The components of aggregate annual net periodic pension costs consisted of the following:
|
Years Ended December 31:
|
2016
|
2015
|
2014
|
|||||||||
|
Interest cost
|
$
|
23.2
|
|
$
|
22.1
|
|
$
|
23.4
|
|
|||
|
Expected return on plan assets
|
(28.6
|
)
|
(29.8
|
)
|
(29.4
|
)
|
||||||
|
Recognized loss
|
2.5
|
|
2.6
|
|
—
|
|
||||||
|
Net cost
|
$
|
(2.9
|
)
|
$
|
(4.9
|
)
|
$
|
(6.0
|
)
|
|||
The projected benefit obligation and net periodic benefit cost for the Plan were determined using the following weighted-average assumptions:
|
Projected Benefit Obligation
|
Net Periodic Benefit Cost
|
||||||||||||||
|
As of December 31:
|
2016
|
2015
|
2016
|
2015
|
2014
|
||||||||||
|
Settlement discount rates
|
4.30
|
%
|
4.55
|
%
|
4.55
|
%
|
4.10
|
%
|
5.00
|
%
|
|||||
|
Long-term rates of return on plans' assets
|
N/A
|
|
N/A
|
|
7.25
|
%
|
7.25
|
%
|
7.25
|
%
|
|||||
The assumed settlement discount rates were determined by matching the current estimate of the Plan's projected cash outflows against spot rate yields on a portfolio of high quality bonds as of the measurement date. To develop the expected long-term rate of return on assets assumption, historical returns and the future return expectations for each asset class, as well as the target asset allocation of the pension portfolio were considered. The investment policy of the Plan takes into account the matching of assets and liabilities, appropriate risk aversion, liquidity needs, the preservation of capital, and the attainment of modest growth. The weighted-average asset allocations of the Plan were as follows:
|
Investment Policy Asset
Allocation % Range Target
|
||||||||
|
As of December 31:
|
2016
|
2015
|
||||||
|
Equity securities:
|
||||||||
|
Common shares of Company stock
|
12.6
|
%
|
12.9
|
%
|
||||
|
Other
|
68.2
|
|
61.1
|
|
||||
|
Sub-total
|
80.8
|
|
74.0
|
|
40% to 80%
|
|||
|
Fixed maturity securities
|
15.4
|
|
21.4
|
|
15% to 60%
|
|||
|
Other
|
3.8
|
|
4.6
|
|
1% to 10%
|
|||
|
Total
|
100.0
|
%
|
100.0
|
%
|
||||
Quoted values and other data provided by the respective investment custodians are used as inputs for determining fair value of the Plan's debt and equity securities. The custodians are understood to obtain market quotations and actual transaction prices for securities that have quoted prices in active markets and use their own proprietary method for determining the fair value of securities that are not actively traded. In general, these methods involve the use of "matrix pricing" in which the investment custodian uses observable inputs, including, but not limited to, investment yields, credit risks and spreads, benchmarking of like securities, broker-dealer quotes, reported trades and sector groupings to determine a reasonable fair value.
The following tables present a summary of the Plan's assets segregated among the various input levels described in Note 1(d).
83
|
Fair Value Measurements
|
||||||||||||||||
|
As of December 31, 2016:
|
Level 1
|
Level 2
|
Level 3
|
Total
|
||||||||||||
|
Equity securities:
|
||||||||||||||||
|
Common shares of Company stock
|
$
|
53.7
|
|
$
|
—
|
|
$
|
—
|
|
$
|
53.7
|
|
||||
|
Other
|
272.2
|
|
19.1
|
|
—
|
|
291.3
|
|
||||||||
|
Sub-total
|
325.9
|
|
19.1
|
|
—
|
|
345.1
|
|
||||||||
|
Fixed maturity securities
|
4.1
|
|
61.7
|
|
—
|
|
65.9
|
|
||||||||
|
Other
|
5.9
|
|
5.1
|
|
5.0
|
|
16.1
|
|
||||||||
|
Total
|
$
|
336.1
|
|
$
|
86.0
|
|
$
|
5.0
|
|
$
|
427.1
|
|
||||
|
As of December 31, 2015:
|
||||||||||||||||
|
Equity securities:
|
||||||||||||||||
|
Common shares of Company stock
|
$
|
52.7
|
|
$
|
—
|
|
$
|
—
|
|
$
|
52.7
|
|
||||
|
Other
|
231.9
|
|
18.2
|
|
—
|
|
250.2
|
|
||||||||
|
Sub-total
|
284.6
|
|
18.2
|
|
—
|
|
302.9
|
|
||||||||
|
Fixed maturity securities
|
—
|
|
87.5
|
|
—
|
|
87.5
|
|
||||||||
|
Other
|
8.7
|
|
4.5
|
|
5.5
|
|
18.7
|
|
||||||||
|
Total
|
$
|
293.3
|
|
$
|
110.2
|
|
$
|
5.5
|
|
$
|
409.2
|
|
||||
Level 1 assets include U.S. Treasury notes, publicly traded common stocks, mutual funds and certain short-term investments. Level 2 assets generally include corporate and government agency bonds, common collective trusts, and a limited partnership investment. Level 3 assets primarily consist of an immediate participation guaranteed fund.
The benefits expected to be paid as of
December 31, 2016
for the next 10 years are as follows:
2017
:
$25.5
;
2018
:
$26.9
;
2019
:
$28.5
;
2020
$29.7
;
2021
:
$30.8
and for the five years after
2021
:
$163.5
.
The Company has a number of profit sharing and other incentive compensation programs for the benefit of a substantial number of its employees. The costs related to such programs are summarized below:
|
Years Ended December 31:
|
2016
|
2015
|
2014
|
|||||||||
|
Employees Savings and Stock Ownership Plan "ESSOP"
|
$
|
12.8
|
|
$
|
9.9
|
|
$
|
9.3
|
|
|||
|
Other profit sharing plans
|
12.2
|
|
10.6
|
|
10.9
|
|
||||||
|
Cash and deferred incentive compensation
|
$
|
36.8
|
|
$
|
26.6
|
|
$
|
21.4
|
|
|||
A majority of the Company's employees participate in the ESSOP. Company contributions are provided in the form of Old Republic common stock. Dividends on shares are allocated to participants as earnings, and likewise invested in Company stock; dividends on unallocated shares are used to pay debt service costs. The Company's annual contributions are based on a formula that takes the growth in net operating income per share over consecutive five year periods into account. During
2015
, the Employee Savings and Stock Ownership Plan purchased
2,200,000
shares of Old Republic common stock for
$34.0
. The purchases were financed by a loan from the Company. As of
December 31, 2016
, there were
13,975,662
Old Republic common shares owned by the ESSOP, of which
10,467,158
were allocated to employees' account balances. There are no repurchase obligations in existence. See Note 3(b).
(o) Escrow Funds
- Segregated cash deposit accounts and the offsetting liabilities for escrow deposits in connection with Title Insurance Group real estate transactions in the same amounts (
$1,447.0
and
$1,570.7
at
December 31, 2016
and
2015
, respectively) are not included as assets or liabilities in the accompanying consolidated balance sheets as the escrow funds are not available for regular operations.
(p) Earnings Per Share
-
Consolidated basic earnings per share excludes the dilutive effect of common stock equivalents and is computed by dividing income (loss) available to common stockholders by the weighted-average number of common shares actually outstanding for the year. Diluted earnings per share are similarly calculated with the inclusion of dilutive common stock equivalents. The following table provides a reconciliation of net income (loss) and the number of shares used in basic and diluted earnings per share calculations.
84
|
Years Ended December 31:
|
2016
|
2015
|
2014
|
|||||||||
|
Numerator:
|
||||||||||||
|
Net income (loss)
|
$
|
466.9
|
|
$
|
422.1
|
|
$
|
409.7
|
|
|||
|
Numerator for basic earnings per share -
|
||||||||||||
|
income (loss) available to common stockholders
|
466.9
|
|
422.1
|
|
409.7
|
|
||||||
|
Adjustment for interest expense incurred on
|
||||||||||||
|
assumed conversion of convertible senior notes
|
14.6
|
|
14.6
|
|
14.6
|
|
||||||
|
Numerator for diluted earnings per share -
|
||||||||||||
|
income (loss) available to common stockholders
|
||||||||||||
|
after assumed conversion of convertible senior notes
|
$
|
481.5
|
|
$
|
436.7
|
|
$
|
424.3
|
|
|||
|
Denominator:
|
||||||||||||
|
Denominator for basic earnings per share -
|
||||||||||||
|
weighted-average shares (a)
|
259,429,298
|
|
259,502,067
|
|
258,553,662
|
|
||||||
|
Effect of dilutive securities - stock based compensation awards
|
1,260,094
|
|
988,091
|
|
1,004,518
|
|
||||||
|
Effect of dilutive securities - convertible senior notes
|
35,689,859
|
|
35,598,805
|
|
35,515,026
|
|
||||||
|
Denominator for diluted earnings per share -
|
||||||||||||
|
adjusted weighted-average shares
|
||||||||||||
|
and assumed conversion of convertible senior notes (a)
|
296,379,251
|
296,088,963
|
|
295,073,206
|
|
|||||||
|
Earnings per share: Basic
|
$
|
1.80
|
|
$
|
1.63
|
|
$
|
1.58
|
|
|||
|
Diluted
|
$
|
1.62
|
|
$
|
1.48
|
|
$
|
1.44
|
|
|||
|
Anti-dilutive common stock equivalents
|
||||||||||||
|
excluded from earning per share computations:
|
||||||||||||
|
Stock based compensation awards
|
1,676,175
|
|
4,933,490
|
|
6,631,196
|
|
||||||
|
Convertible senior notes
|
—
|
|
—
|
|
—
|
|
||||||
|
Total
|
1,676,175
|
|
4,933,490
|
|
6,631,196
|
|
||||||
__________
(a) In calculating earnings per share, pertinent accounting rules require that common shares owned by the Company's Employee Savings and Stock Ownership Plan that are as yet unallocated to participants in the plan be excluded from the calculation. Such shares are issued and outstanding, and have the same voting and other rights applicable to all other common shares.
(q) Concentration of Credit Risk
- The Company is not exposed to material concentrations of credit risks as to any one issuer of investment securities.
(r) Stock Based Compensation
-
As periodically amended, the Company has had a stock option plan in effect for certain eligible key employees since 1978. Under the plan amended in 2010, the maximum number of common shares available for 2010 and future years' grants was originally set at
14.5
million shares through February 2016. The 2016 Incentive Compensation Plan (the "2016 Plan") was approved by shareholders in 2015 and became effective on February 24, 2016. On the effective date of the 2016 Plan,
15.0
million shares became available for future awards. The maximum number of options available as of
December 31, 2016
for future issuance under this amended plan was approximately
13.7
million shares.
The exercise price of stock options is equal to the closing market price of the Company's common stock on the date of grant, and the contractual life of the grant is generally
ten
years from the date of the grant. Options granted may be exercised to the extent of
10%
of the number of shares covered thereby as of December 31st of the year of the grant and, cumulatively, to the extent of an additional
15%
,
20%
,
25%
and
30%
on and after the second through fifth calendar years, respectively. Effective in 2014, options granted to employees who meet certain retirement eligibility provisions are fully vested on the date of grant.
The following table presents the stock based compensation expense and income tax benefit recognized in the financial statements:
|
Years Ended December 31:
|
2016
|
2015
|
2014
|
|||||||||
|
Stock based compensation expense
|
$
|
3.1
|
|
$
|
2.3
|
|
$
|
2.7
|
|
|||
|
Income tax benefit
|
$
|
1.0
|
|
$
|
.8
|
|
$
|
.9
|
|
|||
The fair value of each stock option award is estimated on the date of grant using the Black-Scholes-Merton Model. The following table presents the key assumptions used to value the awards granted during the periods presented. Expected volatilities are based on the historical experience of Old Republic's common stock. The expected term of stock options represents the period of time that stock options granted are assumed to be outstanding. The Company uses historical data to estimate the effect of stock option exercise and employee departure behavior; groups of employees that have similar historical behavior are considered separately for valuation purposes. The risk-free rate of return for periods within the contractual term of the share option is based on the U.S. Treasury rate in effect at the time of the grant.
85
|
2016
|
2015
|
2014
|
||||||
|
Expected volatility
|
.26
|
|
.28
|
|
.33
|
|
||
|
Expected dividends
|
4.32
|
%
|
5.06
|
%
|
4.75
|
%
|
||
|
Expected term (in years)
|
7
|
|
7
|
|
7
|
|
||
|
Risk-free rate
|
1.77
|
%
|
1.70
|
%
|
2.10
|
%
|
||
A summary of stock option activity under the plan as of December 31,
2016
,
2015
and
2014
, and changes in outstanding options during the years then ended is presented below:
|
As of and for the Years Ended December 31,
|
|||||||||||||||||||||||
|
2016
|
2015
|
2014
|
|||||||||||||||||||||
|
Shares
|
Weighted
Average
Exercise
Price
|
Shares
|
Weighted
Average
Exercise
Price
|
Shares
|
Weighted
Average
Exercise
Price
|
||||||||||||||||||
|
Outstanding at beginning of year
|
9,875,574
|
|
$
|
16.60
|
|
11,510,433
|
|
$
|
16.67
|
|
12,807,272
|
|
$
|
16.97
|
|
||||||||
|
Granted
|
1,230,050
|
|
18.14
|
|
991,750
|
|
15.26
|
|
1,085,000
|
|
16.06
|
|
|||||||||||
|
Exercised
|
619,874
|
|
12.18
|
|
920,350
|
|
12.14
|
|
409,229
|
|
11.85
|
|
|||||||||||
|
Forfeited and expired
|
2,242,725
|
|
21.71
|
|
1,706,259
|
|
18.69
|
|
1,972,610
|
|
19.26
|
|
|||||||||||
|
Outstanding at end of year
|
8,243,025
|
|
15.77
|
|
9,875,574
|
|
16.60
|
|
11,510,433
|
|
16.67
|
|
|||||||||||
|
Exercisable at end of year
|
6,095,111
|
|
$
|
15.59
|
|
7,870,396
|
|
$
|
17.17
|
|
9,349,180
|
|
$
|
17.44
|
|
||||||||
|
Weighted average fair value of
|
|||||||||||||||||||||||
|
options granted during the year (a)
|
$
|
2.77
|
|
per share
|
$
|
2.25
|
|
per share
|
$
|
3.15
|
|
per share
|
|||||||||||
__________
(a) Based on the Black-Scholes option pricing model and the assumptions outlined above.
A summary of stock options outstanding and exercisable at
December 31, 2016
follows:
|
Options Outstanding
|
Options Exercisable
|
||||||||||||||||||||
|
Weighted - Average
|
Weighted
Average
Exercise
Price
|
||||||||||||||||||||
|
Ranges of Exercise Prices
|
Year(s)
Of
Grant
|
Number
Out-
Standing
|
Remaining
Contractual
Life
|
Exercise
Price
|
Number
Exercisable
|
||||||||||||||||
|
$21.78
|
to
|
$23.16
|
2007
|
1,676,175
|
|
0.25
|
$
|
21.77
|
|
1,676,175
|
|
$
|
21.77
|
|
|||||||
|
$7.73
|
to
|
$12.95
|
2008
|
451,450
|
|
1.25
|
12.91
|
|
451,450
|
|
12.91
|
|
|||||||||
|
$10.48
|
|
2009
|
298,505
|
|
2.25
|
10.48
|
|
298,505
|
|
10.48
|
|
||||||||||
|
$12.08
|
|
2010
|
355,745
|
|
3.25
|
12.08
|
|
355,745
|
|
12.08
|
|
||||||||||
|
$12.33
|
|
2011
|
637,592
|
|
4.25
|
12.33
|
|
637,592
|
|
12.33
|
|
||||||||||
|
$10.80
|
|
2012
|
760,237
|
|
5.25
|
10.80
|
|
760,237
|
|
10.80
|
|
||||||||||
|
$12.57
|
|
2013
|
811,720
|
|
6.25
|
12.57
|
|
569,292
|
|
12.57
|
|
||||||||||
|
$16.06
|
|
2014
|
1,045,461
|
|
7.25
|
16.06
|
|
607,102
|
|
16.06
|
|
||||||||||
|
$15.26
|
|
2015
|
978,640
|
|
8.25
|
15.26
|
|
391,137
|
|
15.26
|
|
||||||||||
|
$18.14
|
|
2016
|
1,227,500
|
|
9.25
|
18.14
|
|
347,876
|
|
18.14
|
|
||||||||||
|
Total
|
8,243,025
|
|
$
|
15.77
|
|
6,095,111
|
|
$
|
15.59
|
|
|||||||||||
As of
December 31, 2016
, there was
$2.4
of total unrecognized compensation cost related to nonvested stock-based compensation arrangements granted under the plan. That cost is expected to be recognized over a weighted average period of approximately
3
years.
The cash received from stock option exercises, the total intrinsic value of stock options exercised, and the actual tax benefit realized for the tax deductions from option exercises are as follows:
|
2016
|
2015
|
2014
|
|||||||||
|
Cash received from stock option exercise
|
$
|
7.5
|
|
$
|
11.1
|
|
$
|
4.8
|
|
||
|
Intrinsic value of stock options exercised
|
3.9
|
|
4.2
|
|
1.7
|
|
|||||
|
Actual tax benefit realized for tax deductions
from stock options exercised
|
$
|
1.3
|
|
$
|
1.4
|
|
$
|
.6
|
|
||
At
December 31, 2016
, the Company had restricted common stock issued to certain employees which are expected to vest over the next
3
years. During the vesting period, restricted shares are nontransferable and subject to forfeiture. Compensation expense for the restricted stock award is recognized over the vesting period of the award and was immaterial for the years ended
December 31, 2016
,
2015
and
2014
.
86
In March 2016, the FASB issued guidance intended to simplify certain aspects of accounting for share-based payment award transactions which will be effective beginning in 2017. The Company's adoption of this guidance is not expected to have a material impact on the consolidated financial statements.
(s) Regulatory Matters
-
The material increases in mortgage guaranty insurance claims and loss payments that began in 2007 gradually depleted RMIC's statutory capital base and forced it to discontinue writing new business in 2011. The insurance laws of
16
jurisdictions, including RMIC and RMICNC’s domiciliary state of North Carolina, require a mortgage insurer to maintain a minimum amount of statutory capital relative to risk in force (or a similar measure) in order to continue to write new business. The formulations currently allow for a maximum risk-to-capital ratio of
25
to
1
, or alternatively stated, a “minimum policyholder position” (“MPP”) of one-twenty-fifth of the total risk in force. The failure to maintain the prescribed minimum capital level in a particular state generally requires a mortgage insurer to immediately stop writing new business until it reestablishes the required level of capital or receives a waiver of the requirement from a state's insurance regulatory authority. RMIC breached the minimum capital requirement during the third quarter of 2010. RMIC had previously requested and, subsequently received waivers or forbearance of the minimum policyholder position requirements from the regulatory authorities in substantially all affected states. Following several brief extensions, the waiver from its domiciliary state of North Carolina expired on August 31, 2011, and RMIC and its sister company, RMICNC, discontinued writing new business in all states and limited themselves to servicing the run-off of their existing business. They were placed under administrative supervision by the North Carolina Department of Insurance ("NCDOI") the following year and ultimately ordered to defer the payment of
40%
of all settled claims as a deferred payment obligation ("DPO").
On July 1, 2014, the NCDOI issued a Final Order approving an Amended and Restated Corrective Plan (the "Amended Plan") submitted jointly on April 16, 2014, by RMIC and RMICNC. Under the Amended Plan, RMIC and RMICNC were authorized to pay
100%
of their DPOs accrued as of June 30, 2014, and to settle all subsequent valid claims entirely in cash, without establishing any DPOs. In anticipation of receiving this Final Order, ORI invested
$125.0
in cash and securities to RMIC in June 2014. In mid-July 2014, in furtherance of the Final Order, RMIC and RMICNC processed payments of their accumulated DPO balances of approximately
$657.0
relating to fully settled claims charged to periods extending between January 19, 2012 and June 30, 2014. Both subsidiaries remain under the supervision of the NCDOI as they continue to operate in run-off mode. The approval of the Amended Plan notwithstanding, the NCDOI retains its regulatory supervisory powers to review and amend the terms of the Amended Plan in the future as circumstances may warrant.
RMIC has continually evaluated the potential long-term underwriting performance of the run-off book of business based on various modeling techniques. The resulting models take into account actual premium and paid claim experience of prior periods, together with a large number of assumptions and judgments about future outcomes that are highly sensitive to a wide range of estimates. Many of these estimates and underlying assumptions relate to matters over which the Company has no control, including: 1) The conflicted interests, as well as the varying mortgage servicing and foreclosure practices of a large number of insured lending institutions; 2) General economic and industry-specific trends and events; and 3) The evolving or future social and economic policies of the U.S. Government vis-à-vis such critical sectors as the banking, mortgage lending, and housing industries, as well as its policies for resolving the insolvencies and assigning a possible future role to Fannie Mae and Freddie Mac. These matters notwithstanding, RMIC's analysis did not indicate that the establishment of a premium deficiency was warranted as of
December 31, 2016
,
2015
, or
2014
. In this regard, a long-used RMIC standard model indicates that underwriting performance of the book of business should, in the aggregate be positive over the extended ten year run-off period assumed to end on or about December 31, 2022. As of
December 31, 2016
, it is nonetheless possible that MI operating results could be negative in the near term.
As of
December 31, 2016
, RFIG's mortgage insurance subsidiaries were statutorily solvent. The total statutory capital, inclusive of a contingency reserve of
$340.9
, was
$420.6
, which was
$231.9
above the required MPP of
$188.7
. As of the same date, RFIG's consolidated GAAP capitalization amounted to
$330.6
.
|
December 31:
|
2016
|
2015
|
||||||||||||||
|
Carrying
Amount
|
Fair
Value
|
Carrying
Amount
|
Fair
Value
|
|||||||||||||
|
3.75% Convertible Senior Notes due 2018
|
$
|
547.8
|
|
$
|
689.5
|
|
$
|
546.0
|
|
$
|
709.5
|
|
||||
|
4.875% Senior Notes due 2024
|
395.6
|
|
417.4
|
|
395.1
|
|
404.6
|
|
||||||||
|
3.875% Senior Notes due 2026
|
544.6
|
|
531.9
|
|
—
|
|
—
|
|
||||||||
|
ESSOP debt with an average yield of 3.98%
|
||||||||||||||||
|
and 3.69%, respectively
|
8.1
|
|
8.1
|
|
11.7
|
|
11.7
|
|
||||||||
|
Other miscellaneous debt with an average yield of 1.9%
|
32.4
|
|
32.5
|
|
—
|
|
—
|
|
||||||||
|
Total debt
|
$
|
1,528.7
|
|
$
|
1,679.7
|
|
$
|
952.8
|
|
$
|
1,125.8
|
|
||||
On
August 26, 2016
, the Company completed a public offering of
$550.0
aggregate principal amount of Senior Notes. The notes bear interest at a rate of
3.875%
per year and mature on
August 26, 2026
.
On
September 23, 2014
, the Company completed a public offering of
$400.0
aggregate principal amount of Senior Notes. The notes bear interest at a rate of
4.875%
per year and mature on
October 1, 2024
.
87
The Company completed a public offering of
$550.0
aggregate principal amount of Convertible Senior Notes in early
March, 2011
. The notes bear interest at a rate of
3.75%
per year, mature on
March 15, 2018
, and are convertible at any time prior to maturity by the holder into
64.3407
shares (subject to periodic adjustment under certain circumstances) of common stock per
one thousand
dollar note.
Scheduled maturities of the above debt at the respective year ends are as follows:
2017
:
$3.9
;
2018
:
$554.1
;
2019
:
$6.5
;
2020
:
$6.5
;
2021 and after
:
$969.5
. During
2016
,
2015
and
2014
,
$50.9
,
$42.9
and
$28.3
, respectively, of interest expense on debt was charged to consolidated operations.
Old Republic's
3.75%
Convertible Senior Notes,
4.875%
Senior Notes, and
3.875%
Senior Notes ("the Notes") contain provisions defining certain events of default, among them a court ordered proceeding due to the insolvency of a Significant Subsidiary. The Notes define Significant Subsidiary in accordance with the paragraph (w) of Rule 1-02 of the SEC's Regulation S-X. The Company's flagship mortgage guaranty insurance carrier, RMIC qualifies as a Significant Subsidiary for purposes of the Notes. If RMIC were to become statutorily impaired, its insolvency could trigger a receivership proceeding which, in turn could ultimately result in an event of default. If this were to occur, the outstanding principal of the Notes could become immediately due and payable. Management believes the Final Order by the North Carolina Department of Insurance to RMIC has precluded such an event of default from occurring in the foreseeable future. Moreover, RMIC was statutorily solvent at
December 31, 2016
and management has every expectation that its solvent state is likely to prevail. RMIC is expected to be an increasingly less significant subsidiary over time as its in force business declines.
Fair Value Measurements -
The Company utilizes indicative market prices, which incorporate recent actual market transactions and current bid/ask quotations to estimate the fair value of outstanding debt securities that are classified within Level 2 of the fair value hierarchy as presented below. The Company uses an internally generated interest yield market matrix table, which incorporates maturity, coupon rate, credit quality, structure and current market conditions to estimate the fair value of its outstanding debt securities that are classified within Level 3.
The following table shows a summary of financial liabilities disclosed, but not carried, at fair value, segregated among the various input levels described in Note 1(d) above:
|
Carrying
|
Fair
|
|||||||||||||||||||
|
Value
|
Value
|
Level 1
|
Level 2
|
Level 3
|
||||||||||||||||
|
Financial Liabilities:
|
||||||||||||||||||||
|
Debt:
|
||||||||||||||||||||
|
December 31, 2016
|
$
|
1,528.7
|
|
$
|
1,679.7
|
|
$
|
—
|
|
$
|
1,639.0
|
|
$
|
40.6
|
|
|||||
|
December 31, 2015
|
$
|
952.8
|
|
$
|
1,125.8
|
|
$
|
—
|
|
$
|
1,114.1
|
|
$
|
11.7
|
|
|||||
(a) Preferred Stock
- At
December 31, 2016
, there were
75,000,000
shares of preferred stock authorized. The Company has designated
one
series of preferred stock:
10,000,000
shares of Series A Junior Participating Preferred Stock (Series A). No shares have been issued or are outstanding. The Series A Stock, if and when issued, shall pay a dividend of the greater of
$1.00
or
100
times (subject to adjustment) the aggregate per share amount (payable in kind) of all non-cash dividend or other distributions, other than a dividend payable in shares of common stock declared on the common stock of the Company. Each share of Series A stock shall have
100
votes on each matter submitted to a vote of the shareholders.
(b) Common Stock
- At
December 31, 2016
, there were
500,000,000
shares of common stock authorized. At the same date, there were
100,000,000
shares of Class "B" common stock authorized, though none were issued or outstanding. Class "B" common shares have the same rights as common shares except for being entitled to 1/10th of a vote per share. During 2008, the Company issued
5,488,475
shares to the ESSOP for consideration of
$50.0
. The ESSOP's common stock purchases were financed by a
$30.0
bank loan and by
$20.0
of pre-fundings from ESSOP participating subsidiaries. During 2015, the ESSOP purchased
2,200,000
shares of Old Republic common stock for
$34.0
. The purchases were financed by a loan from the Company. Common stock held by the ESSOP is classified as a charge to the common shareholders' equity account until it is allocated to participating employees' accounts contemporaneously with the repayment of the ESSOP debt incurred for its acquisition. Such unallocated shares are not considered outstanding for purposes of calculating earnings per share. Dividends on unallocated shares are used to pay debt service costs. Dividends on allocated shares are credited to participants' accounts.
(c) Cash Dividend Restrictions
- The payment of cash dividends by the Company is principally dependent upon the amount of its insurance subsidiaries' statutory policyholders' surplus available for dividend distribution. The insurance subsidiaries' ability to pay cash dividends to the Company is in turn generally restricted by law or subject to approval of the insurance regulatory authorities of the states in which they are domiciled. These authorities recognize only statutory accounting practices for determining financial position, results of operations, and the ability of an insurer to pay dividends to its shareholders. Based on year end
2016
data, the maximum amount of dividends payable to the Company by its insurance and a small number of non-insurance company subsidiaries during
2017
without the prior approval of appropriate regulatory authorities is approximately
$473.3
. Cash dividends declared during
2016
,
2015
and
2014
to the Company by its subsidiaries amounted to
$317.6
,
$326.0
and
$281.1
, respectively.
88
(a) Reinsurance and Retention Limits
- In order to maintain premium production within their capacity and to limit maximum losses for which they might become liable under policies they've underwritten, Old Republic's insurance subsidiaries, as is the common practice in the insurance industry, may cede all or a portion of their premiums and related liabilities on certain classes of business to other insurers and reinsurers. Although the ceding of insurance does not ordinarily discharge an insurer from liability to a policyholder, it is industry practice to establish the reinsured part of risks as the liability of the reinsurer. Old Republic also employs retrospective premium and a large variety of risk-sharing procedures and arrangements for parts of its business in order to reduce underwriting losses for which it might become liable under insurance policies it issues. To the extent that any reinsurance companies, assured or producer might be unable to meet their obligations under existing reinsurance, retrospective insurance and production agreements, Old Republic would be liable for the defaulted amounts. As deemed necessary, reinsurance ceded to other companies is secured by letters of credit, cash, and/or securities.
Except as noted in the following paragraph, reinsurance protection on property and liability coverages generally limits the net loss on most individual claims to a maximum of:
$5.2
for workers' compensation;
$5.0
for commercial auto liability;
$5.0
for general liability;
$12.0
for executive protection (directors & officers and errors & omissions);
$2.0
for aviation; and
$5.0
for property coverages. Title insurance risk assumptions are generally limited to a maximum of
$500.0
as to any one policy. The vast majority of title policies issued, however, carry exposures of less than
$1.0
. An immaterial amount of the mortgage guaranty traditional primary risk in force is subject to lender sponsored captive reinsurance arrangements structured primarily on an excess of loss basis. All bulk and other insurance risk in force is retained. Exclusive of reinsurance, the average direct primary mortgage guaranty exposure is (in whole dollars)
$38,200
per insured loan.
Since January 1, 2005, the Company has had maximum reinsurance coverage of up to
$200.0
for its workers' compensation exposures. Pursuant to regulatory requirements, however, all workers' compensation primary insurers such as the Company remain liable for unlimited amounts in excess of reinsured limits. Other than the substantial concentration of workers' compensation losses caused by the September 11, 2001 terrorist attack on America, to the best of the Company's knowledge there had not been a similar accumulation of claims in a single location from a single occurrence prior to that event. Nevertheless, the possibility continues to exist that non-reinsured losses could, depending on a wide range of severity and frequency assumptions, aggregate several hundred million dollars to an insurer such as the Company. Such aggregation of losses could occur in the event of a catastrophe such as an earthquake that could lead to the death or injury of a large number of persons concentrated in a single facility such as a high rise building.
As a result of the September 11, 2001 terrorist attack on America, the reinsurance industry eliminated coverage from substantially all contracts for claims arising from acts of terrorism. Primary insurers like the Company thus became fully exposed to such claims. Late in 2002, the Terrorism Risk Insurance Act of 2002 (the "TRIA") was signed into law, immediately establishing a temporary federal reinsurance program administered by the Secretary of the Treasury. The program applied to insured commercial property and casualty losses resulting from an act of terrorism, as defined in the TRIA. Congress extended and modified the program in late 2005 through the Terrorism Risk Insurance Revision and Extension Act of 2005 (the "TRIREA"). TRIREA expired on December 31, 2007. Congress enacted a revised program in December 2007 through the Terrorism Risk Insurance Program Reauthorization Act (the "TRIPRA") of 2007, a seven year extension that expired December 2014. In January 2015, Congress passed the TRIPRA of 2015 that extended TRIPRA through 2020.
The TRIA automatically voided all policy exclusions which were in effect for terrorism related losses and obligated insurers to offer terrorism coverage with most commercial property and casualty insurance lines. The TRIREA revised the definition of "property and casualty insurance" to exclude commercial automobile, burglary and theft, surety, professional liability and farm owners multi-peril insurance. TRIPRA did not make any further changes to the definition of property and casualty insurance, however, it did include domestic acts of terrorism within the scope of the program. Although insurers are permitted to charge an additional premium for terrorism coverage, insureds may reject the coverage. Under TRIPRA, the program's protection is not triggered for losses arising from an act of terrorism until the industry first suffers losses in excess of a prescribed aggregate deductible during any one year. The program deductible trigger is $140, $160, $180, and $200 for 2017, 2018, 2019, and 2020, respectively. Once the program trigger is met, TRIPRA will be responsible for a fixed percentage of the Company's terrorism losses that exceed its deductible which ranges from 85% in 2015 and declines by one percentage point per year until it reaches 80% in 2020. The Company's deductible amounts to 20% of direct earned premium on eligible property and casualty insurance coverages. The Company currently reinsures limits on a treaty basis of
$195.0
in excess of
$5.0
for claims arising from certain acts of terrorism for casualty clash and catastrophe workers' compensation liability insurance coverages. The Company also purchases facultative reinsurance on certain accounts in excess of
$200.0
to manage the Company's net exposure.
Reinsurance ceded by the Company's insurance subsidiaries in the ordinary course of business is typically placed on an excess of loss basis. Under excess of loss reinsurance agreements, the companies are generally reimbursed for losses exceeding contractually agreed‑upon levels. Quota share reinsurance is most often effected between the Company's insurance subsidiaries and industry-wide assigned risk plans or captive insurers owned by assureds. Under quota share reinsurance, the Company remits to the assuming entity an agreed-upon percentage of premiums written and is reimbursed for underwriting expenses and proportionately related claims costs.
Reinsurance recoverable asset balances represent amounts due from or credited by assuming reinsurers for paid and unpaid claims and premium reserves. Such reinsurance balances are recoverable from non-admitted foreign and certain other reinsurers such as captive insurance companies owned by assureds, as well as similar balances or credits arising from policies that are retrospectively rated or subject to assureds' high deductible retentions, are substantially
89
collateralized by letters of credit, securities, and other financial instruments. Old Republic evaluates on a regular basis the financial condition of its assuming reinsurers and assureds who purchase its retrospectively rated or self-insured deductible policies. Estimates of unrecoverable amounts totaling
$15.9
at both
December 31, 2016
and
2015
are included in the Company's net claim and claim expense reserves since reinsurance, retrospectively rated, and self-insured deductible policies and contracts do not relieve Old Republic from its direct obligations to assureds or their beneficiaries.
At
December 31, 2016
, the Company's General Insurance Group's ten largest reinsurers represented approximately
53%
of the total consolidated reinsurance recoverable on paid and unpaid losses, with
Munich Re America, Inc.
the largest reinsurer representing
14.5%
of the total recoverable balance. Of the balances due from these ten reinsurers,
64.4%
was recoverable from A or better rated reinsurance companies,
6.9%
from an industry-wide insurance assigned risk pool,
24.1%
from foreign unrated companies, and
4.6%
from domestic unrated companies.
The following information relates to reinsurance and related data for the General Insurance and RFIG Run-off Groups for the three years ended
December 31, 2016
. Reinsurance transactions of the Title Insurance Group and small life and accident insurance operation are not material.
|
Years Ended December 31:
|
2016
|
2015
|
2014
|
||||||||||
|
General Insurance Group
|
|||||||||||||
|
Written premiums:
|
Direct
|
$
|
4,091.6
|
|
$
|
3,964.3
|
|
$
|
3,750.4
|
|
|||
|
Assumed
|
48.4
|
|
73.8
|
|
36.1
|
|
|||||||
|
Ceded
|
$
|
1,134.7
|
|
$
|
1,052.6
|
|
$
|
939.7
|
|
||||
|
Earned premiums:
|
Direct
|
$
|
4,005.3
|
|
$
|
3,839.2
|
|
$
|
3,607.5
|
|
|||
|
Assumed
|
50.8
|
|
64.3
|
|
31.1
|
|
|||||||
|
Ceded
|
$
|
1,119.8
|
|
$
|
1,008.8
|
|
$
|
902.9
|
|
||||
|
Claims ceded
|
$
|
620.6
|
|
$
|
341.1
|
|
$
|
602.2
|
|
||||
|
RFIG Run-off Business
|
|||||||||||||
|
Written premiums:
|
Direct
|
$
|
168.6
|
|
$
|
214.0
|
|
$
|
255.0
|
|
|||
|
Assumed
|
—
|
|
—
|
|
—
|
|
|||||||
|
Ceded
|
$
|
2.9
|
|
$
|
5.1
|
|
$
|
7.0
|
|
||||
|
Earned premiums:
|
Direct
|
$
|
173.0
|
|
$
|
225.0
|
|
$
|
262.4
|
|
|||
|
Assumed
|
—
|
|
—
|
|
—
|
|
|||||||
|
Ceded
|
$
|
2.9
|
|
$
|
5.1
|
|
$
|
7.0
|
|
||||
|
Claims ceded
|
$
|
.1
|
|
$
|
.6
|
|
$
|
1.1
|
|
||||
|
Mortgage Guaranty Insurance in force as of December 31:
|
|||||||||||||
|
Direct
|
$
|
21,370.9
|
|
$
|
27,561.7
|
|
$
|
35,414.8
|
|
||||
|
Assumed
|
—
|
|
—
|
|
—
|
|
|||||||
|
Ceded
|
$
|
14.3
|
|
$
|
27.2
|
|
$
|
116.4
|
|
||||
(b) Leases
- Some of the Company's subsidiaries maintain their offices in leased premises. Some of these leases provide for the payment of real estate taxes, insurance, and other operating expenses. Rental expenses for operating leases amounted to
$55.7
,
$54.7
and
$51.4
in
2016
,
2015
and
2014
, respectively. These expenses relate primarily to building leases of the Company. A number of the Company's subsidiaries also lease other equipment for use in their businesses. At
December 31, 2016
, aggregate minimum rental commitments (net of expected sub-lease receipts) under noncancellable operating leases are summarized as follows:
2017
:
$56.3
;
2018
:
$49.7
;
2019
:
$41.0
;
2020
:
$29.8
;
2021
:
$22.2
;
2022
and after:
$114.7
.
In February 2016, the FASB issued guidance on lease accounting. Among other changes, the new standard requires balance sheet recognition of all leases with a term of greater than 12 months. The new accounting standard will be effective in 2019.
(c) General
- In the normal course of business, the Company and its subsidiaries are subject to various contingent liabilities, including possible income tax assessments resulting from tax law interpretations or issues raised by taxing or regulatory authorities in their regular examinations, catastrophic claim occurrences not indemnified by reinsurers such as noted at 4(a) above, or failure to collect all amounts on its investments or balances due from assureds and reinsurers. The Company does not have a basis for anticipating any significant losses or costs that could result from any known or existing contingencies.
From time to time, in order to assure possible liquidity needs, the Company may guaranty the timely payment of principal and/or interest on certain intercompany balances, debt, or other securities held by some of its insurance, non-insurance, and ESSOP affiliates. At
December 31, 2016
, the aggregate principal amount of such guaranties was
$117.9
.
90
(d) Legal Proceedings
-
Legal proceedings against the Company and its subsidiaries routinely arise in the normal course of business and usually pertain to claim matters related to insurance policies and contracts issued by its insurance subsidiaries. Other, non-routine legal proceedings which may prove to be material to the Company or a subsidiary are discussed below.
On December 19, 2008, Old Republic Insurance Company and Republic Insured Credit Services, Inc., ("Old Republic") filed suit against Countrywide Bank FSB, Countrywide Home Loans, Inc. ("Countrywide") and Bank of New York Mellon, BNY Mellon Trust of Delaware ("BNYM") in the Circuit Court, Cook County, Illinois (
Old Republic Insurance Company, et al.
v.
Countrywide Bank FSB, et al.
) seeking rescission of various credit indemnity policies issued to insure home equity loans and home equity lines of credit which Countrywide had securitized or held for its own account, a declaratory judgment and money damages based upon systemic material misrepresentations and fraud by Countrywide as to the credit characteristics of the loans or by the borrowers in their loan applications. Countrywide filed a counterclaim alleging a breach of contract, bad faith and seeking a declaratory judgment challenging the factual and procedural bases that Old Republic had relied upon to deny or rescind coverage for individual defaulted loans under those policies, as well as unspecified compensatory and punitive damages. The Court ruled that Countrywide does not have standing to counterclaim with respect to the policies insuring the securitized loans because those policies were issued to BNYM. In response, Countrywide and BNYM jointly filed a motion asking the Court to allow an amended counterclaim in which BNYM would raise substantially similar allegations as those raised by Countrywide and make substantially similar requests but with respect to the policies issued to BNYM. The Court dismissed their motion, with leave to re-plead the counterclaim. BNYM's subsequent attempt to re-plead was granted by the Court and BNYM has re-pleaded its counterclaim. Pursuant to a revised case management order, a multi-phase trial is set to begin September 25, 2017.
On December 30, 2011 and on January 4, 2013, purported class action suits alleging RESPA violations were filed in the Federal District Court, for the Eastern District of Pennsylvania targeting RMIC, other mortgage guaranty insurance companies, PNC Financial Services Group (as successor to National City Bank) and HSBC Bank USA, N.A., and their wholly-owned captive insurance subsidiaries. (
White, Hightower, et al.
v.
PNC Financial Services Group (as successor to National City Bank) et al.
), (
Ba, Chip, et al.
v.
HSBC Bank USA, N.A., et al.
). The lawsuits are two of twelve against various lenders, their captive reinsurers and the mortgage insurers, filed by the same law firms. All of these lawsuits were substantially identical in alleging that the mortgage guaranty insurers had reinsurance arrangements with the defendant banks' captive insurance subsidiaries under which payments were made in violation of the anti-kickback and fee splitting prohibitions of Sections 8(a) and 8(b) of RESPA. Ten of the twelve suits have been dismissed. A class has not been certified in either remaining suit. Those two remaining suits seeking unspecified damages, costs, fees and the return of the allegedly improper payments were settled with an agreement to make nominal payments.
Ba
has been dismissed with prejudice and
White
is awaiting the Court's dismissal.
On October 9, 2014, Intellectual Ventures I LLC and Intellectual Ventures II LLC (collectively, "IV") served a complaint naming as defendants Old Republic National Title Insurance Company, Old Republic Title Insurance Group, Inc., Old Republic Insurance Company and Old Republic General Insurance Group, Inc. (collectively, "Old Republic")(
Intellectual Ventures I LLC et al.
v.
Old Republic General Insurance Group, Inc. et al
.). The lawsuit was brought in the United States District Court for the Western District of Pennsylvania. IV alleged that Old Republic has infringed three patents and sought damages, costs, expenses, and pre-judgment and post-judgment interest for the alleged infringement, in addition to injunctive relief. On October 14, 2014, Old Republic filed a motion to dismiss each count of the complaint on the grounds that the patents fail to meet the patentability test established by the United States Supreme Court in
Alice Corp. Pty. Ltd.
v.
CLS Bank
, 134 S.Ct. 2347 (2014). The Court granted Old Republic’s motion to dismiss on all three patents on September 25, 2015. Concurrently, Old Republic filed
inter partes
review petitions challenging validity of the patents before the United States Patent & Trademark Office ("USPTO") in late September and early October, 2015. In late October, 2015, IV filed notice of its appeal of the District Court’s dismissal of its claims. The appeal has been argued before the United States Court of Appeal for the Federal Circuit and a decision is pending. The Patent Trial and Appeal Board ("PTAB") of the USPTO has accepted the petitions challenging the validity of all three patents and has until early April, 2017, to rule.
On January 20, 2015, Intellectual Ventures II LLC filed two complaints in the United States District Court for the Eastern District of Texas naming as defendants Great West Casualty Company and BITCO General Insurance Corporation and BITCO National Insurance Company. (
Intellectual Ventures II LLC
v.
Great West Casualty Company
) and (
Intellectual Ventures II LLC
v.
BITCO General Insurance Corporation et al.
) The plaintiff alleges a single patent infringement and seeks damages, costs, expenses, and pre-judgment and post-judgment interest in addition to injunctive relief. On April 9, 2015, plaintiff amended each complaint to allege a second patent infringement claim. The District Court set a trial date in September, 2016. In August and September, 2015, Great West and BITCO filed
inter partes
review petitions challenging the validity of claims under the patents before the PTAB. Both petitions were accepted for review. On May 11, 2016, the parties filed a stipulation of dismissal on one of the patent infringement claims in the District Court. On June 29, 2016, IV disclaimed all claims it asserted against Great West and BITCO on that patent and, accordingly, the
inter partes
review was terminated by the PTAB. With respect to the remaining single patent infringement claim, on May 12, 2016, the District Court issued a stay on the suit until such time as the PTAB issues its ruling on the
inter partes
review. On January 17, 2017, the PTAB issued its ruling, finding all but one claim under the patent to be unpatentable. Further, on February 6, 2017, noting that a separate
inter partes
review for all claims under the patent, including the single claim remaining in the BITCO and Great West lawsuits, is ongoing between IV and another party, the District Court extended the stay until January 20, 2018.
On July 5, 2016, Ocwen Loan Servicing, LLC and Homeward Residential, Inc. (collectively, "Ocwen") filed an amendment to an initial complaint against Republic Mortgage Insurance Company and Republic Mortgage Insurance Company of North Carolina (collectively, "RMIC"). The suit, which is captioned
Ocwen et al. v. RMIC et al.,
is pending
91
in the General Court of Justice, Superior Court Division for Forsyth County, North Carolina. The amendment for the first time identifies specific mortgage insurance certificates as to which Ocwen alleges breaches of contract, bad faith and violations of certain fair claims settlement practices laws and seeks declaratory relief in regard to certain claims handling practices on future claims. RMIC believes the suit is without merit and intends to defend vigorously.
Under GAAP, an estimated loss is accrued only if the loss is probable and reasonably estimable. The Company and its subsidiaries have defended and intend to continue defending vigorously against each of the aforementioned actions. The Company does not believe it probable that any of these actions will have a material adverse effect on its consolidated financial position, results of operations, or cash flows, though there can be no assurance in those regards. The Company has made an estimate of its potential liability under certain of these lawsuits and the counterclaim, all of which seek unquantified damages, attorneys' fees, and expenses. Because of the uncertainty of the ultimate outcomes of the aforementioned disputes, additional costs may arise in future periods beyond the Company's current reserves. It is also unclear what effect, if any, the run-off operations of RMIC and its limited capital will have in the actions against it.
In management's opinion, all adjustments consisting of normal recurring adjustments necessary for a fair statement of quarterly results have been reflected in the data which follows.
|
1st
Quarter
|
2nd
Quarter
|
3rd
Quarter
|
4th
Quarter
|
||||||||||||
|
Year Ended December 31, 2016:
|
|||||||||||||||
|
Operating Summary:
|
|||||||||||||||
|
Net premiums, fees, and other income
|
$
|
1,273.0
|
|
$
|
1,340.5
|
|
$
|
1,392.9
|
|
$
|
1,433.9
|
|
|||
|
Net investment income and realized gains (losses)
|
140.4
|
|
101.5
|
|
102.9
|
|
114.7
|
|
|||||||
|
Total revenues
|
1,413.5
|
|
1,442.2
|
|
1,496.0
|
|
1,548.7
|
|
|||||||
|
Benefits, claims, and expenses
|
1,231.1
|
|
1,293.4
|
|
1,331.9
|
|
1,357.9
|
|
|||||||
|
Net income (loss)
|
$
|
122.9
|
|
$
|
101.0
|
|
$
|
110.9
|
|
$
|
131.9
|
|
|||
|
Net income (loss) per share:
Basic
|
$
|
.48
|
|
$
|
.39
|
|
$
|
.43
|
|
$
|
.51
|
|
|||
|
Diluted
|
$
|
.43
|
|
$
|
.35
|
|
$
|
.39
|
|
$
|
.46
|
|
|||
|
Average shares outstanding:
|
|||||||||||||||
|
Basic
|
258,657,939
|
259,093,314
|
259,414,230
|
259,711,126
|
|||||||||||
|
Diluted
|
295,543,808
|
296,069,028
|
296,444,432
|
296,583,195
|
|||||||||||
|
Year Ended December 31, 2015:
|
|||||||||||||||
|
Operating Summary:
|
|||||||||||||||
|
Net premiums, fees, and other income
|
$
|
1,219.8
|
|
$
|
1,300.0
|
|
$
|
1,399.9
|
|
$
|
1,366.0
|
|
|||
|
Net investment income and realized gains (losses)
|
110.2
|
|
109.7
|
|
145.6
|
|
113.9
|
|
|||||||
|
Total revenues
|
1,330.2
|
|
1,410.0
|
|
1,545.7
|
|
1,480.2
|
|
|||||||
|
Benefits, claims, and expenses
|
1,176.4
|
|
1,258.1
|
|
1,360.9
|
|
1,338.7
|
|
|||||||
|
Net income (loss)
|
$
|
103.4
|
|
$
|
102.0
|
|
$
|
125.9
|
|
$
|
90.6
|
|
|||
|
Net income (loss) per share:
Basic
|
$
|
.40
|
|
$
|
.39
|
|
$
|
.48
|
|
$
|
.35
|
|
|||
|
Diluted
|
$
|
.36
|
|
$
|
.36
|
|
$
|
.44
|
|
$
|
.32
|
|
|||
|
Average shares outstanding:
|
|||||||||||||||
|
Basic
|
259,118,634
|
|
259,468,711
|
|
259,266,696
|
|
258,257,224
|
|
|||||||
|
Diluted
|
295,547,223
|
|
295,987,501
|
|
295,868,117
|
|
295,206,909
|
|
|||||||
The Company does not derive over
10%
of its consolidated revenues from any
one
customer. Revenues and assets connected with foreign operations are not significant in relation to consolidated totals.
92
The General Insurance Group provides property and liability insurance primarily to commercial clients. Old Republic does not have a meaningful participation in personal lines of insurance. Workers' compensation is the largest type of coverage underwritten by the General Insurance Group, accounting for
35.4%
of the Group's direct premiums written in
2016
. The remaining premiums written by the General Insurance Group are derived largely from a wide variety of coverages, including commercial automobile (principally trucking), general liability, general aviation, directors and officers indemnity, fidelity and surety indemnities, and home and auto warranties.
The title insurance business consists primarily of the issuance of policies to real estate purchasers and investors based upon searches of the public records which contain information concerning interests in real property. The policy insures against losses arising out of defects, loans and encumbrances affecting the insured title and not excluded or excepted from the coverage of the policy.
Private mortgage insurance produced by the RFIG Run-off Business protects mortgage lenders and investors from default related losses on residential mortgage loans made primarily to homebuyers who make down payments of less than 20% of the home's purchase price. The RFIG Run-off mortgage guaranty operations insures only first mortgage loans, primarily on residential properties having one-to-four family dwelling units. CCI policies provide limited indemnity coverage to lenders and other financial intermediaries. The coverage is for the risk of non-payment of loan balances by individual buyers and borrowers.
The accounting policies of the segments parallel those described in the summary of significant accounting policies pertinent thereto.
93
|
Segment Reporting
|
||||||||||||
|
Years Ended December 31:
|
2016
|
2015
|
2014
|
|||||||||
|
General Insurance:
|
||||||||||||
|
Net premiums earned
|
$
|
2,936.3
|
|
$
|
2,894.7
|
|
$
|
2,735.6
|
|
|||
|
Net investment income and other income
|
418.4
|
|
418.5
|
|
377.8
|
|
||||||
|
Total revenues before realized gains or losses
|
$
|
3,354.7
|
|
$
|
3,313.3
|
|
$
|
3,113.5
|
|
|||
|
Income (loss) before taxes (credits) and
|
||||||||||||
|
realized investment gains or losses (a)
|
$
|
319.9
|
|
$
|
336.4
|
|
$
|
221.3
|
|
|||
|
Income tax expense (credits) on above
|
$
|
94.6
|
|
$
|
111.6
|
|
$
|
68.8
|
|
|||
|
Title Insurance:
|
||||||||||||
|
Net premiums earned
|
$
|
1,742.4
|
|
$
|
1,624.7
|
|
$
|
1,394.4
|
|
|||
|
Title, escrow and other fees
|
464.2
|
|
420.5
|
|
364.8
|
|
||||||
|
Sub-total
|
2,206.6
|
|
2,045.3
|
|
1,759.2
|
|
||||||
|
Net investment income and other income
|
37.4
|
|
35.3
|
|
32.3
|
|
||||||
|
Total revenues before realized gains or losses
|
$
|
2,244.1
|
|
$
|
2,080.7
|
|
$
|
1,791.6
|
|
|||
|
Income (loss) before taxes (credits) and
|
||||||||||||
|
realized investment gains or losses (a)
|
$
|
210.2
|
|
$
|
166.8
|
|
$
|
99.5
|
|
|||
|
Income tax expense (credits) on above
|
$
|
74.3
|
|
$
|
58.2
|
|
$
|
35.4
|
|
|||
|
RFIG Run-off Business:
|
||||||||||||
|
Net premiums earned
|
$
|
170.0
|
|
$
|
219.9
|
|
$
|
255.4
|
|
|||
|
Net investment income and other income
|
23.2
|
|
25.1
|
|
27.5
|
|
||||||
|
Total revenues before realized gains or losses
|
$
|
193.2
|
|
$
|
245.0
|
|
$
|
282.9
|
|
|||
|
Income (loss) before taxes (credits) and
|
||||||||||||
|
realized investment gains or losses
|
$
|
69.8
|
|
$
|
29.4
|
|
$
|
10.3
|
|
|||
|
Income tax expense (credits) on above
|
$
|
24.0
|
|
$
|
9.9
|
|
$
|
3.3
|
|
|||
|
Consolidated Revenues:
|
||||||||||||
|
Total revenues of above Company segments
|
$
|
5,792.1
|
|
$
|
5,639.0
|
|
$
|
5,188.2
|
|
|||
|
Other sources (b)
|
130.4
|
|
118.1
|
|
135.1
|
|
||||||
|
Consolidated net realized investment gains (losses)
|
72.8
|
|
91.3
|
|
272.3
|
|
||||||
|
Consolidation elimination adjustments
|
(94.9
|
)
|
(82.3
|
)
|
(65.0
|
)
|
||||||
|
Consolidated revenues
|
$
|
5,900.5
|
|
$
|
5,766.1
|
|
$
|
5,530.7
|
|
|||
|
Consolidated Income (Loss) Before Taxes (Credits):
|
||||||||||||
|
Total income (loss) before income taxes (credits)
|
||||||||||||
|
and realized investment gains or losses of
|
||||||||||||
|
above Company segments
|
$
|
600.0
|
|
$
|
532.8
|
|
$
|
331.3
|
|
|||
|
Other sources - net (b)
|
13.0
|
|
7.6
|
|
5.7
|
|
||||||
|
Consolidated net realized investment gains (losses)
|
72.8
|
|
91.3
|
|
272.3
|
|
||||||
|
Consolidated income (loss) before income taxes (credits)
|
$
|
686.0
|
|
$
|
631.8
|
|
$
|
609.4
|
|
|||
|
Consolidated Income Tax Expense (Credits):
|
||||||||||||
|
Total income tax expense (credits)
|
||||||||||||
|
for above Company segments
|
$
|
193.0
|
|
$
|
179.8
|
|
$
|
107.6
|
|
|||
|
Other sources - net (b)
|
.4
|
|
(2.1
|
)
|
(3.2
|
)
|
||||||
|
Income tax expense (credits) on
|
||||||||||||
|
consolidated net realized investment gains (losses)
|
25.5
|
|
31.9
|
|
95.3
|
|
||||||
|
Consolidated income tax expense (credits)
|
$
|
219.0
|
|
$
|
209.6
|
|
$
|
199.7
|
|
|||
|
December 31:
|
2016
|
2015
|
||||||||
|
Consolidated Assets:
|
||||||||||
|
General Insurance
|
$
|
15,305.7
|
|
$
|
14,523.0
|
|
||||
|
Title Insurance
|
1,423.0
|
|
1,314.3
|
|
||||||
|
RFIG Run-off Business
|
904.8
|
|
978.7
|
|
||||||
|
Total assets for above company segments
|
17,633.6
|
|
16,816.1
|
|
||||||
|
Other assets (b)
|
1,301.8
|
|
760.5
|
|
||||||
|
Consolidation elimination adjustments
|
(343.9
|
)
|
(475.0
|
)
|
||||||
|
Consolidated assets
|
$
|
18,591.6
|
|
$
|
17,101.6
|
|
||||
__________
94
In the above tables, net premiums earned on a GAAP basis differ slightly from statutory amounts due to certain differences in calculations of unearned premium reserves under each accounting method.
|
(a)
|
Income (loss) before taxes (credits) is reported net of interest charges on intercompany financing arrangements with Old Republic's holding company parent for the following segments: General -
$51.9
,
$41.6
and
$32.0
for the years ended
December 31, 2016
,
2015
, and
2014
, respectively; Title -
$8.4
,
$8.1
and
$7.9
for the years ended
December 31, 2016
,
2015
, and
2014
, respectively.
|
|
(b)
|
Represents amounts for Old Republic's holding company parent, minor corporate services subsidiaries, and a small life and accident insurance operation.
|
The Company is affiliated with a policyholder owned mutual insurer, American Business & Mercantile Insurance Mutual, Inc. ("AB&M" or "the Mutual") whose formation it sponsored in 1981. The Mutual is managed through a service agreement with several Old Republic subsidiaries. AB&M's underwriting operations are limited to certain types of coverages not provided by Old Republic, and to a small amount of intercompany reinsurance placements. The following table shows certain unaudited information reflective of such business:
|
Assumed from Old Republic
|
Ceded to Old Republic
|
|||||||||||||||||||||||
|
Years Ended December 31:
|
2016
|
2015
|
2014
|
2016
|
2015
|
2014
|
||||||||||||||||||
|
Premiums earned
|
$
|
3.8
|
|
$
|
3.3
|
|
$
|
3.5
|
|
$
|
.6
|
|
$
|
.6
|
|
$
|
.7
|
|
||||||
|
Commissions and fees
|
1.0
|
|
.9
|
|
.6
|
|
—
|
|
—
|
|
.1
|
|
||||||||||||
|
Losses and loss expenses
|
4.5
|
|
2.6
|
|
3.8
|
|
.8
|
|
.9
|
|
.5
|
|
||||||||||||
|
Loss and loss expense reserves
|
15.3
|
|
12.7
|
|
11.1
|
|
5.2
|
|
4.7
|
|
4.0
|
|
||||||||||||
|
Unearned premiums
|
$
|
1.4
|
|
$
|
1.5
|
|
$
|
1.3
|
|
$
|
.1
|
|
$
|
.1
|
|
$
|
—
|
|
||||||
As of
December 31, 2016
and
2015
, the Mutual's statutory capital included surplus notes due to Old Republic of
$10.5
out of total statutory capital of
$30.6
and
$29.9
, respectively. AB&M's accounts are not consolidated with Old Republic's since it is owned by its policyholders and, in any event, their inclusion would not have a significant effect on Old Republic's consolidated financial statements.
95
|
REPORT OF INDEPENDENT REGISTERED PUBLIC ACCOUNTING FIRM
|
To the Board of Directors and Shareholders of
Old Republic International Corporation:
We have audited the accompanying balance sheets of Old Republic International Corporation and subsidiaries (the Company) as of December 31, 2016 and 2015, and the related consolidated statements of income, comprehensive income, preferred stock and common shareholders’ equity, and cash flows for each of the years in the three-year period ended December 31, 2016. We also have audited the Company’s internal control over financial reporting as of December 31, 2016, based on criteria established in
Internal Control - Integrated Framework
issued by the Committee of Sponsoring Organizations of the Treadway Commission (COSO). The Company’s management is responsible for these consolidated financial statements, for maintaining effective internal control over financial reporting, and for its assessment of the effectiveness of internal control over financial reporting, included in the accompanying Management’s Report on Internal Control Over Financial Reporting under Item 9A of the 2016 Annual Report on Form 10-K. Our responsibility is to express an opinion on these consolidated financial statements and an opinion on the Company’s internal control over financial reporting based on our audits.
We conducted our audits in accordance with the standards of the Public Company Accounting Oversight Board (United States). Those standards require that we plan and perform the audits to obtain reasonable assurance about whether the financial statements are free of material misstatement and whether effective internal control over financial reporting was maintained in all material respects. Our audits of the consolidated financial statements included examining, on a test basis, evidence supporting the amounts and disclosures in the financial statements, assessing the accounting principles used and significant estimates made by management, and evaluating the overall financial statement presentation. Our audit of internal control over financial reporting included obtaining an understanding of internal control over financial reporting, assessing the risk that a material weakness exists, and testing and evaluating the design and operating effectiveness of internal control based on the assessed risk. Our audits also included performing such other procedures as we considered necessary in the circumstances. We believe that our audits provide a reasonable basis for our opinions.
A company’s internal control over financial reporting is a process designed to provide reasonable assurance regarding the reliability of financial reporting and the preparation of financial statements for external purposes in accordance with generally accepted accounting principles. A company’s internal control over financial reporting includes those policies and procedures that (1) pertain to the maintenance of records that, in reasonable detail, accurately and fairly reflect the transactions and dispositions of the assets of the company; (2) provide reasonable assurance that transactions are recorded as necessary to permit preparation of financial statements in accordance with generally accepted accounting principles, and that receipts and expenditures of the company are being made only in accordance with authorizations of management and directors of the company; and (3) provide reasonable assurance regarding prevention or timely detection of unauthorized acquisition, use, or disposition of the company’s assets that could have a material effect on the financial statements.
Because of its inherent limitations, internal control over financial reporting may not prevent or detect misstatements. Also, projections of any evaluation of effectiveness to future periods are subject to the risk that controls may become inadequate because of changes in conditions, or that the degree of compliance with the policies or procedures may deteriorate.
In our opinion, the consolidated financial statements referred to above present fairly, in all material respects, the financial position of Old Republic International Corporation and subsidiaries as of December 31, 2016 and 2015, and the results of its operations and its cash flows for each of the years in the three-year period ended December 31, 2016, in conformity with U.S. generally accepted accounting principles. Also in our opinion, Old Republic International Corporation maintained, in all material respects, effective internal control over financial reporting as of December 31, 2016, based on criteria established in
Internal Control - Integrated Framework
issued by the Committee of Sponsoring Organizations of the Treadway Commission (COSO)
.
/s/ KPMG LLP
Chicago, Illinois
February 28, 2017
96
Management's Responsibility for Financial Statements
Management is responsible for the preparation of the Company's consolidated financial statements and related information appearing in this report. Management believes that the consolidated financial statements fairly reflect the form and substance of transactions and that the financial statements reasonably present the Company's financial position and results of operations in conformity with generally accepted accounting principles. Management also has included in the Company's financial statement amounts that are based on estimates and judgments which it believes are reasonable under the circumstances.
The independent registered public accounting firm has advised that they audit the Company's consolidated financial statements in accordance with the standards of the Public Company Accounting Oversight Board, as stated in its reports, included herein.
The Board of Directors of the Company has an Audit Committee composed of five non-management Directors. The committee meets periodically with financial management, the internal auditors and the independent registered public accounting firm to review accounting, control, auditing and financial reporting matters.
None.
Evaluation of Disclosure Controls and Procedures
The Company's principal executive officer and its principal accounting officer have evaluated the Company's disclosure controls and procedures as of the end of the period covered by this annual report. Based upon their evaluation, the principal executive officer and principal accounting officer have concluded that the Company's disclosure controls and procedures (as defined in Rules 13a-15(e) and 15d-15(e) under the Securities Exchange Act of 1934) are effective for the above referenced evaluation period.
Changes in Internal Control
During the three month period ended
December 31, 2016
, there were no changes in internal control over financial reporting that have materially affected, or are reasonably likely to materially affect, the Company's internal control over financial reporting.
Management's Report on Internal Control Over Financial Reporting
Our management is responsible for establishing and maintaining adequate internal control over financial reporting, as such term is defined in Exchange Act Rules 13a-15(f) and 15d-15(f). Under the supervision and with the participation of our management, including our principal executive officer and principal accounting officer, we conducted an evaluation of the effectiveness of our internal control over financial reporting based on the framework in
Internal Control - Integrated Framework (2013)
issued by the Committee of Sponsoring Organizations of the Treadway Commission.
The Company's internal control over financial reporting is a process designed to provide reasonable assurance regarding the reliability of financial reporting and the preparation of financial statements for external purposes in accordance with generally accepted accounting principles. The Company's internal control over financial reporting includes those policies and procedures that (i) pertain to the maintenance of records that, in reasonable detail, accurately and fairly reflect the transactions and dispositions of the assets of the Company; (ii) provide reasonable assurance that transactions are recorded as necessary to permit preparation of financial statements in accordance with generally accepted accounting principles, and that receipts and expenditures of the Company are being made only in accordance with authorizations of management and directors of the Company; and (iii) provide reasonable assurance regarding prevention or timely detection of unauthorized acquisition, use or disposition of the Company's assets that could have a material effect on the financial statements.
Because of its inherent limitations, internal control over financial reporting may not prevent or detect misstatements. Also, projections of any evaluation of effectiveness to future periods are subject to the risk that controls may become inadequate because of changes in conditions, or that the degree of compliance with the policies or procedures may deteriorate.
Based on our evaluation under the framework in
Internal Control - Integrated Framework (2013),
our management concluded that our internal control over financial reporting was effective as of
December 31, 2016
. KPMG LLP, an independent registered public accounting firm, has audited the effectiveness of our internal control over financial reporting as of
December 31, 2016
. Their report is shown on page
96
in this Annual Report.
Pursuant to the requirements of Section 303A.12(a) of the New York Stock Exchange Listed Company Manual, the Company has filed the Annual CEO Certification with the New York Stock Exchange on
June 17, 2016
.
97
Executive Officers of the Registrant
The following table sets forth certain information as of
December 31, 2016
, regarding the senior officers of the Company:
|
Name
|
Age
|
Position
|
|
Charles S. Boone
|
63
|
Senior Vice President - Investments and Treasurer since August, 2001.
|
|
W. Todd Gray
|
48
|
Senior Vice President - Operations and Finance of Old Republic General Insurance Companies since August 2015. Prior to joining Old Republic, Mr. Gray was an executive of Midland Company.
|
|
John R. Heitkamp, Jr.
|
62
|
Senior Vice President, Secretary and General Counsel since July, 2014.
|
|
Karl W. Mueller
|
57
|
Senior Vice President and Chief Financial Officer since October, 2004.
|
|
R. Scott Rager
|
68
|
President and Chief Operating Officer since June 2012; Senior Vice President - General Insurance since July, 2006.
|
|
Craig R. Smiddy
|
52
|
President and Chief Operating Officer of Old Republic General Insurance Companies since August 2015 and August, 2013, respectively. Prior to joining Old Republic, Mr. Smiddy was President of the Specialty Markets Division of Munich Reinsurance America, Inc.
|
|
Rande K. Yeager
|
68
|
Senior Vice President - Title Insurance since March, 2003; Chairman and Chief Executive Officer of Old Republic Title Insurance Companies since July, 2010 and March, 2002, respectively.
|
|
Aldo C. Zucaro
|
77
|
Chairman of the Board, Chief Executive Officer, and Director since 1993, 1990 and 1976, respectively; Chairman and Chief Executive Officer of Republic Financial Indemnity Group, Inc. since December, 2013.
|
The term of office of each officer of the Company expires on the date of the annual meeting of the board of directors, which is generally held in May of each year. There is no family relationship between any of the executive officers named above. Each of these named officers, except for Craig R. Smiddy and W. Todd Gray, have been employed in senior capacities with the Company and/or its subsidiaries for the past five years. Mr. Heitkamp has been determined by the Company to not be an executive officer under Rule 3b-7 of the Exchange Act.
The Company will file with the Commission a definitive proxy statement pursuant to Regulation 14a in connection with its Annual Meeting of Shareholders to be held on
May 26, 2017
. A list of Directors appears on the "Signature" page of this report. Information about the Company's directors is contained in the Company's definitive proxy statement for the
2016
Annual Meeting of shareholders, which is incorporated herein by reference.
The Company has adopted a code of ethics that applies to its principal executive officer and principal financial officer. A copy has been filed with the Commission and appears as Exhibit (14) in the exhibit index under item 15. The Company has also posted the text of its code of ethics on its internet website at www.oldrepublic.com.
Information with respect to this Item is incorporated herein by reference to the section entitled "Executive Compensation" in the Company's proxy statement in connection with the Annual Meeting of Shareholders to be held on
May 26, 2017
, which will be on file with the Commission.
Item 12
-
Security Ownership of Certain Beneficial Owners and Management and Related Stockholder Matters
Information with respect to this Item is incorporated herein by reference to the sections entitled "General Information" and "Principal Holders of Securities" in the Company's proxy statement to be filed with the Commission in connection with the Annual Meeting of Shareholders to be held on
May 26, 2017
.
98
Information with respect to this Item is incorporated herein by reference to the sections entitled "Procedures for the Approval of Related Person Transactions" and "The Board of Directors Responsibilities and Independence" contained in the Company's Proxy Statement in connection with the Annual Meeting of Shareholders to be held on
May 26, 2017
, which will be on file with the Commission.
Information with respect to this Item is incorporated herein by reference to the paragraphs following Item 2 concerning the "Ratification of the Selection of an Independent Registered Public Accounting Firm" contained in the Company's Proxy Statement in connection with the Annual Meeting of Shareholders to be held on
May 26, 2017
, which will be on file with the Commission.
Documents filed as a part of this report:
1. Financial statements: See Item 8, Index to Financial Statements.
2. See exhibit index on page
113
of this report.
3. Financial Statement Schedules.
99
SIGNATURES
Pursuant to the requirements of Section 13 or 15(d) of the Securities Exchange Act of 1934, the registrant has duly caused this report to be signed on its behalf by the undersigned, thereunto duly authorized (Name, Title or Principal Capacity, and Date).
(Registrant):
Old Republic International Corporation
|
By:
|
/s/ Aldo C. Zucaro
|
02/28/17
|
|
Aldo C. Zucaro, Chairman of the Board,
|
Date
|
|
|
Chief Executive Officer and Director
|
||
|
By:
|
/s/ Karl W. Mueller
|
02/28/17
|
|
Karl W. Mueller, Senior Vice President,
|
Date
|
|
|
Chief Financial Officer, and
|
||
|
Principal Accounting Officer
|
||
_____________________________________________________________________________________________
Pursuant to the requirements of the Securities Exchange Act of 1934, this report has been signed below by the following persons on behalf of the registrant and in the capacities and on the dates indicated (Name, Title or Principal Capacity, and Date).
|
/s/ Harrington Bischof
|
/s/ Arnold L. Steiner
|
|
|
Harrington Bischof, Director*
|
Arnold L. Steiner, Director*
|
|
|
/s/ Jimmy A. Dew
|
/s/ Fredricka Taubitz
|
|
|
Jimmy A. Dew, Director*
|
Fredricka Taubitz, Director*
|
|
|
/s/ John M. Dixon
|
/s/ Charles F. Titterton
|
|
|
John M. Dixon, Director*
|
Charles F. Titterton, Director*
|
|
|
/s/ James C. Hellauer
|
/s/ Dennis P. Van Mieghem
|
|
|
James C. Hellauer, Director*
|
Dennis P. Van Mieghem, Director*
|
|
|
/s/ Spencer LeRoy, III
|
/s/ Steven Walker
|
|
|
Spencer LeRoy, III, Director*
|
Steven Walker, Director*
|
|
* By /s/ Aldo C. Zucaro
Attorney-in-fact
Date: February 28, 2017
100
|
INDEX TO FINANCIAL STATEMENT SCHEDULES
|
||
|
Report of Independent Registered Public Accounting Firm
|
||
|
OLD REPUBLIC INTERNATIONAL CORPORATION AND SUBSIDIARIES
|
||
|
Schedule
|
I -
|
Summary of Investments - Other than Investments in Related Parties as of December 31, 2016
|
|
Schedule
|
II -
|
Condensed Financial Information of Registrant as of December 31, 2016 and 2015 and for the years ended December 31, 2016, 2015 and 2014
|
|
Schedule
|
III -
|
Supplementary Insurance Information for the years ended December 31, 2016, 2015 and 2014
|
|
Schedule
|
IV -
|
Reinsurance for the years ended December 31, 2016, 2015 and 2014
|
|
Schedule
|
V -
|
Valuation and Qualifying Accounts for the years ended December 31, 2016, 2015 and 2014
|
|
Schedule
|
VI -
|
Supplemental Information Concerning Property - Casualty Insurance Operations for the years ended December 31, 2016, 2015 and 2014
|
|
Schedules other than those listed are omitted for the reason that they are not required, are not applicable or that equivalent information has been included in the financial statements, notes thereto, or elsewhere herein.
|
||
101
|
REPORT OF INDEPENDENT REGISTERED PUBLIC ACCOUNTING FIRM ON
FINANCIAL STATEMENT SCHEDULES
|
To the Board of Directors and Shareholders of
Old Republic International Corporation:
Under date of February 28, 2017, we reported on the consolidated balance sheets of Old Republic International Corporation and subsidiaries as of December 31, 2016 and 2015, and the related consolidated statements of income, comprehensive income, preferred stock and common shareholders’ equity, and cash flows for each of the years in the three-year period ended December 31, 2016, as contained in the annual report on Form 10-K for the year 2016.
In connection with our audits of the aforementioned consolidated financial statements, we also audited the related consolidated financial statement schedules as listed in the accompanying index. These financial statement schedules are the responsibility of the Company’s management. Our responsibility is to express an opinion on these financial statement schedules based on our audits.
In our opinion, such financial statement schedules, when considered in relation to the basic consolidated financial statements taken as a whole, present fairly, in all material respects, the information set forth therein.
/s/ KPMG LLP
Chicago, Illinois
February 28, 2017
102
|
OLD REPUBLIC INTERNATIONAL CORPORATION AND SUBSIDIARIES
|
||||||||||||
|
SCHEDULE I - SUMMARY OF INVESTMENTS - OTHER THAN INVESTMENTS IN RELATED PARTIES
|
||||||||||||
|
As of December 31, 2016
|
||||||||||||
|
($ in Millions)
|
||||||||||||
|
Column A
|
Column B
|
Column C
|
Column D
|
|||||||||
|
Type of investment
|
Cost (1)
|
Fair
Value
|
Amount at
which shown
in balance
sheet
|
|||||||||
|
|
|
|
||||||||||
|
Available for sale:
|
||||||||||||
|
Fixed maturity securities:
|
||||||||||||
|
United States Government and
|
||||||||||||
|
government agencies and authorities
|
$
|
1,301.8
|
|
$
|
1,307.3
|
|
$
|
1,307.3
|
|
|||
|
Foreign government
|
117.9
|
|
119.5
|
|
119.5
|
|
||||||
|
Corporate, industrial and all other
|
6,599.8
|
|
6,744.1
|
|
6,744.1
|
|
||||||
|
8,019.6
|
|
$
|
8,170.9
|
|
8,170.9
|
|
||||||
|
Equity securities:
|
||||||||||||
|
Non-redeemable preferred stocks
|
.6
|
|
$
|
.9
|
|
.9
|
|
|||||
|
Common stocks:
|
||||||||||||
|
Banks, trusts and insurance companies
|
180.9
|
|
241.3
|
|
241.3
|
|
||||||
|
Industrial, miscellaneous and all other
|
2,156.0
|
|
2,567.3
|
|
2,567.3
|
|
||||||
|
Indexed mutual funds
|
67.2
|
|
86.5
|
|
86.5
|
|
||||||
|
2,404.9
|
|
$
|
2,896.1
|
|
2,896.1
|
|
||||||
|
Short-term investments
|
681.6
|
|
|
|
681.6
|
|
||||||
|
Miscellaneous investments
|
31.2
|
|
31.2
|
|
||||||||
|
Total
|
11,137.4
|
|
11,780.0
|
|
||||||||
|
Held to maturity:
|
||||||||||||
|
Fixed maturity securities:
|
||||||||||||
|
States, municipalities and political subdivisions
|
974.8
|
|
974.8
|
|
||||||||
|
Other investments
|
2.9
|
|
2.9
|
|
||||||||
|
Total Investments
|
$
|
12,115.1
|
|
$
|
12,757.7
|
|
||||||
__________
|
(1)
|
Represents original cost of equity securities, and as to fixed maturities, original cost net of other-than-temporary impairment adjustments of
$4.9
and reduced by repayments and adjusted for amortization of premium or accrual of discount.
|
103
|
OLD REPUBLIC INTERNATIONAL CORPORATION AND SUBSIDIARIES
|
|||||||
|
SCHEDULE II - CONDENSED FINANCIAL INFORMATION OF REGISTRANT
|
|||||||
|
BALANCE SHEETS
|
|||||||
|
OLD REPUBLIC INTERNATIONAL CORPORATION (PARENT COMPANY)
|
|||||||
|
($ in Millions)
|
|||||||
|
|
|||||||
|
December 31,
|
|||||||
|
2016
|
2015
|
||||||
|
Assets:
|
|
|
|
|
|||
|
Bonds and notes
|
$
|
10.5
|
|
$
|
10.5
|
|
|
|
Short-term investments
|
203.8
|
|
148.9
|
|
|||
|
Cash
|
19.9
|
|
21.4
|
|
|||
|
Investments in, and indebtedness of related parties
|
5,841.1
|
|
4,875.8
|
|
|||
|
Other assets
|
103.3
|
|
103.2
|
|
|||
|
Total Assets
|
$
|
6,178.8
|
|
$
|
5,159.9
|
|
|
|
Liabilities and Common Shareholders' Equity:
|
|||||||
|
Liabilities:
|
|||||||
|
Accounts payable and accrued expenses
|
$
|
168.9
|
|
$
|
173.8
|
|
|
|
Debt and debt equivalents
|
1,528.7
|
|
952.8
|
|
|||
|
Indebtedness to affiliates and subsidiaries
|
9.4
|
|
152.3
|
|
|||
|
Commitments and contingent liabilities
|
|
|
|||||
|
Total Liabilities
|
1,707.2
|
|
1,279.0
|
|
|||
|
Common Shareholders' Equity:
|
|||||||
|
Common stock
|
262.7
|
|
261.9
|
|
|||
|
Additional paid-in capital
|
713.8
|
|
698.0
|
|
|||
|
Retained earnings
|
3,210.6
|
|
2,937.5
|
|
|||
|
Accumulated other comprehensive income (loss)
|
323.6
|
|
29.2
|
|
|||
|
Unallocated ESSOP shares (at cost)
|
(39.2
|
)
|
(45.8
|
)
|
|||
|
Total Common Shareholders' Equity
|
4,471.6
|
|
3,880.8
|
|
|||
|
Total Liabilities and Common Shareholders' Equity
|
$
|
6,178.8
|
|
$
|
5,159.9
|
|
|
|
See accompanying Notes to Condensed Financial Statements.
|
||
104
|
OLD REPUBLIC INTERNATIONAL CORPORATION AND SUBSIDIARIES
|
|||||||||||
|
SCHEDULE II - CONDENSED FINANCIAL INFORMATION OF REGISTRANT
|
|||||||||||
|
STATEMENTS OF INCOME
|
|||||||||||
|
OLD REPUBLIC INTERNATIONAL CORPORATION (PARENT COMPANY)
|
|||||||||||
|
($ in Millions)
|
|||||||||||
|
Years Ended December 31,
|
|||||||||||
|
2016
|
2015
|
2014
|
|||||||||
|
Revenues:
|
|||||||||||
|
Investment income from subsidiaries
|
$
|
76.3
|
|
$
|
61.2
|
|
$
|
44.7
|
|
||
|
Real estate and other income
|
4.7
|
|
4.6
|
|
4.5
|
|
|||||
|
Other investment income
|
.7
|
|
.4
|
|
.3
|
|
|||||
|
Total revenues
|
81.7
|
|
66.3
|
|
49.6
|
|
|||||
|
Expenses:
|
|||||||||||
|
Interest - subsidiaries
|
.3
|
|
.4
|
|
.8
|
|
|||||
|
Interest - other
|
50.9
|
|
42.9
|
|
28.3
|
|
|||||
|
Real estate and other expenses
|
4.1
|
|
3.7
|
|
4.3
|
|
|||||
|
General expenses, taxes and fees
|
11.5
|
|
10.1
|
|
9.3
|
|
|||||
|
Total expenses
|
66.9
|
|
57.3
|
|
42.9
|
|
|||||
|
Revenues, net of expenses
|
14.8
|
|
8.9
|
|
6.6
|
|
|||||
|
Federal income taxes (credits)
|
4.4
|
|
2.7
|
|
(1.3
|
)
|
|||||
|
Income (loss) before equity in earnings (losses) of subsidiaries
|
10.4
|
|
6.2
|
|
8.0
|
|
|||||
|
Equity in Earnings (Losses) of Subsidiaries:
|
|||||||||||
|
Dividends received
|
317.6
|
|
326.0
|
|
281.1
|
|
|||||
|
Earnings (losses) in excess of dividends
|
138.9
|
|
89.8
|
|
120.5
|
|
|||||
|
Net Income (Loss)
|
$
|
466.9
|
|
$
|
422.1
|
|
$
|
409.7
|
|
||
|
See accompanying Notes to Condensed Financial Statements.
|
||
105
|
OLD REPUBLIC INTERNATIONAL CORPORATION AND SUBSIDIARIES
|
|||||||||||
|
SCHEDULE II - CONDENSED FINANCIAL INFORMATION OF REGISTRANT
|
|||||||||||
|
STATEMENTS OF CASH FLOWS
|
|||||||||||
|
OLD REPUBLIC INTERNATIONAL CORPORATION (PARENT COMPANY)
|
|||||||||||
|
($ in Millions)
|
|||||||||||
|
Years Ended December 31,
|
|||||||||||
|
2016
|
2015
|
2014
|
|||||||||
|
Cash flows from operating activities:
|
|||||||||||
|
Net income (loss)
|
$
|
466.9
|
|
$
|
422.1
|
|
$
|
409.7
|
|
||
|
Adjustments to reconcile net income (loss) to
|
|||||||||||
|
net cash provided by operating activities:
|
|||||||||||
|
Accounts receivable
|
.2
|
|
(.2
|
)
|
—
|
|
|||||
|
Income taxes - net
|
(8.5
|
)
|
(18.0
|
)
|
(1.7
|
)
|
|||||
|
Excess of equity in net (income) loss
|
|||||||||||
|
of subsidiaries over cash dividends received
|
(138.9
|
)
|
(89.8
|
)
|
(120.5
|
)
|
|||||
|
Accounts payable, accrued expenses and other
|
12.3
|
|
3.9
|
|
18.6
|
|
|||||
|
Total
|
332.1
|
|
317.8
|
|
306.1
|
|
|||||
|
Cash flows from investing activities:
|
|||||||||||
|
Sale of fixed assets for company use
|
.3
|
|
.4
|
|
.1
|
|
|||||
|
Net repayment (issuance) of notes to related parties
|
(665.2
|
)
|
(6.5
|
)
|
(452.2
|
)
|
|||||
|
Net decrease (increase) in short-term investments
|
(54.9
|
)
|
(24.5
|
)
|
13.6
|
|
|||||
|
Investment in, and indebtedness of related parties-net
|
2.6
|
|
7.5
|
|
(75.0
|
)
|
|||||
|
Total
|
(717.1
|
)
|
(23.1
|
)
|
(513.3
|
)
|
|||||
|
Cash flows from financing activities:
|
|||||||||||
|
Issuance of debentures and notes
|
576.8
|
|
—
|
|
394.4
|
|
|||||
|
Net receipt (repayment) of notes and loans from related parties
|
(2.7
|
)
|
(75.2
|
)
|
(2.3
|
)
|
|||||
|
Issuance of common shares
|
8.4
|
|
12.0
|
|
5.7
|
|
|||||
|
Redemption of debentures and notes
|
(3.5
|
)
|
(3.3
|
)
|
(3.0
|
)
|
|||||
|
Purchase of unallocated ESSOP shares
|
—
|
|
(34.0
|
)
|
—
|
|
|||||
|
Dividends on common shares
|
(193.8
|
)
|
(191.3
|
)
|
(188.3
|
)
|
|||||
|
Other - net
|
(1.5
|
)
|
(.4
|
)
|
(.2
|
)
|
|||||
|
Total
|
383.5
|
|
(292.2
|
)
|
206.2
|
|
|||||
|
Increase (decrease) in cash
|
(1.5
|
)
|
2.3
|
|
(1.0
|
)
|
|||||
|
Cash, beginning of year
|
21.4
|
|
19.0
|
|
20.1
|
|
|||||
|
Cash, end of year
|
$
|
19.9
|
|
$
|
21.4
|
|
$
|
19.0
|
|
||
|
See accompanying Notes to Condensed Financial Statements.
|
||
106
|
OLD REPUBLIC INTERNATIONAL CORPORATION AND SUBSIDIARIES
|
|
SCHEDULE II - CONDENSED FINANCIAL INFORMATION OF REGISTRANT
|
|
NOTES TO CONDENSED FINANCIAL STATEMENTS
|
|
($ in Millions)
|
Old Republic International Corporation's ("the Company" or "Old Republic") condensed financial statements are presented in accordance with the Financial Accounting Standards Board's ("FASB") Accounting Standards Codification ("ASC") of accounting principles generally accepted in the United States of America ("GAAP") and should be read in conjunction with the consolidated financial statements and notes thereto of Old Republic International Corporation and Subsidiaries included in its Annual Report on Form 10-K.
Old Republic International Corporation's investments in consolidated subsidiaries are reflected in the condensed financial statements in accordance with the equity method of accounting. Undistributed earnings in excess of dividends received are recorded as separate line items in the condensed statements of income.
On
August 26, 2016
, the Company completed a public offering of
$550.0
aggregate principal amount of Senior Notes. The notes bear interest at a rate of
3.875%
per year and mature on
August 26, 2026
.
On
September 23, 2014
, the Company completed a public offering of
$400.0
aggregate principal amount of Senior Notes. The notes bear interest at a rate of
4.875%
per year and mature on
October 1, 2024
.
The Company completed a public offering of
$550.0
aggregate principal amount of Convertible Senior Notes in early
March, 2011
. The notes bear interest at a rate of
3.75%
per year, mature on
March 15, 2018
, and are convertible at any time prior to maturity by the holder into
64.3407
shares (subject to periodic adjustment under certain circumstances) of common stock per one thousand dollar note.
In 2008, the Company secured a ten year
$30.0
bank loan to enable its Employees Savings and Stock Ownership Plan ("ESSOP") to purchase Old Republic common stock. Principal amounts of
$8.1
and
$11.7
were outstanding as of
December 31, 2016
and
2015
, respectively. The average yield of the ESSOP bank loan was
3.98%
and
3.69%
at
December 31, 2016
and
2015
, respectively.
Old Republic's
3.75%
Convertible Senior Notes,
4.875%
Senior Notes, and
3.875%
Senior Notes ("the Notes") contain provisions defining certain events of default, among them a court ordered proceeding due to the insolvency of a Significant Subsidiary. The Notes define Significant Subsidiary in accordance with the paragraph (w) of Rule 1-02 of the SEC's Regulation S-X. The Company's flagship mortgage guaranty insurance carrier, Republic Mortgage Insurance Company, ("RMIC") qualifies as a Significant Subsidiary for purposes of the Notes. If RMIC were to become statutorily impaired, its insolvency could trigger a receivership proceeding which, in turn could ultimately result in an event of default. If this were to occur, the outstanding principal of the Notes could become immediately due and payable. Management believes the Final Order by the North Carolina Department of Insurance to RMIC has precluded such an event of default from occurring in the foreseeable future. Moreover, RMIC was statutorily solvent at
December 31, 2016
and management has every expectation that its solvent state is likely to prevail. RMIC is expected to be an increasingly less significant subsidiary over time as its in force business declines.
107
|
OLD REPUBLIC INTERNATIONAL CORPORATION AND SUBSIDIARIES
|
||||||||||||||||||||
|
SCHEDULE III - SUPPLEMENTARY INSURANCE INFORMATION
|
||||||||||||||||||||
|
For the Years Ended December 31, 2016, 2015 and 2014
|
||||||||||||||||||||
|
($ in Millions)
|
||||||||||||||||||||
|
Column A
|
Column B
|
Column C
|
Column D
|
Column E
|
Column F
|
|||||||||||||||
|
Segment
|
Deferred
Policy
Acquisition
Costs
|
Losses,
Claims and
Settlement
Expenses
|
Unearned
Premiums
|
Other
Policyholders'
Benefits and
Funds
|
Premium
Revenue
|
|||||||||||||||
|
Year Ended December 31, 2016:
|
||||||||||||||||||||
|
Insurance Underwriting:
|
||||||||||||||||||||
|
General Insurance Group
|
$
|
266.4
|
|
$
|
5,249.9
|
|
$
|
1,455.8
|
|
$
|
123.1
|
|
$
|
2,936.3
|
|
|||||
|
Title Insurance Group
|
—
|
|
602.0
|
|
—
|
|
7.3
|
|
1,742.4
|
|
||||||||||
|
RFIG Run-off Business
|
—
|
|
574.0
|
|
8.6
|
|
—
|
|
170.0
|
|
||||||||||
|
Corporate & Other (1)
|
7.5
|
|
13.8
|
|
—
|
|
37.9
|
|
20.1
|
|
||||||||||
|
Reinsurance Recoverable (2)
|
—
|
|
2,766.1
|
|
378.4
|
|
23.5
|
|
—
|
|
||||||||||
|
Consolidated
|
$
|
274.0
|
|
$
|
9,206.0
|
|
$
|
1,842.9
|
|
$
|
192.0
|
|
$
|
4,868.9
|
|
|||||
|
Year Ended December 31, 2015:
|
||||||||||||||||||||
|
Insurance Underwriting:
|
||||||||||||||||||||
|
General Insurance Group
|
$
|
243.4
|
|
$
|
5,053.1
|
|
$
|
1,374.5
|
|
$
|
121.9
|
|
$
|
2,894.7
|
|
|||||
|
Title Insurance Group
|
—
|
|
580.8
|
|
—
|
|
7.3
|
|
1,624.7
|
|
||||||||||
|
RFIG Run-off Business
|
—
|
|
736.7
|
|
13.7
|
|
—
|
|
219.9
|
|
||||||||||
|
Corporate & Other (1)
|
11.9
|
|
16.9
|
|
—
|
|
37.6
|
|
19.4
|
|
||||||||||
|
Reinsurance Recoverable (2)
|
—
|
|
2,732.5
|
|
360.5
|
|
29.4
|
|
—
|
|
||||||||||
|
Consolidated
|
$
|
255.4
|
|
$
|
9,120.1
|
|
$
|
1,748.7
|
|
$
|
196.4
|
|
$
|
4,758.8
|
|
|||||
|
Year Ended December 31, 2014:
|
||||||||||||||||||||
|
Insurance Underwriting:
|
||||||||||||||||||||
|
General Insurance Group
|
$
|
211.1
|
|
$
|
4,722.0
|
|
$
|
1,285.2
|
|
$
|
115.5
|
|
$
|
2,735.6
|
|
|||||
|
Title Insurance Group
|
—
|
|
505.4
|
|
—
|
|
6.3
|
|
1,394.4
|
|
||||||||||
|
RFIG Run-off Business
|
—
|
|
870.2
|
|
21.1
|
|
—
|
|
255.4
|
|
||||||||||
|
Corporate & Other (1)
|
19.6
|
|
17.5
|
|
—
|
|
55.4
|
|
60.7
|
|
||||||||||
|
Reinsurance Recoverable (2)
|
—
|
|
3,006.6
|
|
321.3
|
|
27.5
|
|
—
|
|
||||||||||
|
Consolidated
|
$
|
230.8
|
|
$
|
9,122.0
|
|
$
|
1,627.7
|
|
$
|
205.0
|
|
$
|
4,446.3
|
|
|||||
__________
|
(1)
|
Represents amounts for Old Republic's holding company parent, minor corporate services subsidiaries, a small life & accident insurance operation and consolidation elimination adjustments.
|
(2) In accordance with GAAP, reinsured losses and unearned premiums are to be reported as assets. Assets and liabilities were, as a result, increased by corresponding amounts of approximately
$3.1 billion
,
$3.1 billion
, and
$3.3 billion
at
December 31, 2016
,
2015
and
2014
, respectively. This accounting treatment does not have any effect on the Company's results of operations.
108
|
OLD REPUBLIC INTERNATIONAL CORPORATION AND SUBSIDIARIES
|
||||||||||||||||||||
|
SCHEDULE III - SUPPLEMENTARY INSURANCE INFORMATION
|
||||||||||||||||||||
|
For the Years Ended December 31, 2016, 2015 and 2014
|
||||||||||||||||||||
|
($ in Millions)
|
||||||||||||||||||||
|
Column A
|
Column G
|
Column H
|
Column I
|
Column J
|
Column K
|
|||||||||||||||
|
Segment
|
Net
Investment
Income
|
Benefits,
Claims,
Losses and
Settlement
Expenses
|
Amortization
of Deferred
Policy
Acquisition
Costs
|
Other
Operating
Expenses
|
Premiums
Written
|
|||||||||||||||
|
Year Ended December 31, 2016:
|
||||||||||||||||||||
|
Insurance Underwriting:
|
||||||||||||||||||||
|
General Insurance Group
|
$
|
312.1
|
|
$
|
2,143.1
|
|
$
|
389.1
|
|
$
|
502.4
|
|
$
|
3,005.3
|
|
|||||
|
Title Insurance Group
|
36.2
|
|
84.3
|
|
—
|
|
1,949.4
|
|
1,742.4
|
|
||||||||||
|
RFIG Run-off Business
|
23.2
|
|
102.6
|
|
—
|
|
20.8
|
|
165.6
|
|
||||||||||
|
Corporate & Other (1)
|
15.4
|
|
17.7
|
|
4.6
|
|
—
|
|
20.1
|
|
||||||||||
|
Reinsurance Recoverable (2)
|
—
|
|
—
|
|
—
|
|
—
|
|
—
|
|
||||||||||
|
Consolidated
|
$
|
387.0
|
|
$
|
2,347.9
|
|
$
|
393.7
|
|
$
|
2,472.8
|
|
$
|
4,933.6
|
|
|||||
|
Year Ended December 31, 2015:
|
||||||||||||||||||||
|
Insurance Underwriting:
|
||||||||||||||||||||
|
General Insurance Group
|
$
|
312.1
|
|
$
|
2,143.5
|
|
$
|
388.3
|
|
$
|
444.9
|
|
$
|
2,985.5
|
|
|||||
|
Title Insurance Group
|
34.0
|
|
99.2
|
|
—
|
|
1,814.5
|
|
1,624.7
|
|
||||||||||
|
RFIG Run-off Business
|
25.1
|
|
193.6
|
|
—
|
|
21.9
|
|
208.8
|
|
||||||||||
|
Corporate & Other (1)
|
17.2
|
|
22.8
|
|
7.8
|
|
(2.6
|
)
|
5.0
|
|
||||||||||
|
Reinsurance Recoverable (2)
|
—
|
|
—
|
|
—
|
|
—
|
|
—
|
|
||||||||||
|
Consolidated
|
$
|
388.6
|
|
$
|
2,459.3
|
|
$
|
396.1
|
|
$
|
2,278.9
|
|
$
|
4,824.1
|
|
|||||
|
Year Ended December 31, 2014:
|
||||||||||||||||||||
|
Insurance Underwriting:
|
||||||||||||||||||||
|
General Insurance Group
|
$
|
278.8
|
|
$
|
2,132.3
|
|
$
|
345.0
|
|
$
|
414.8
|
|
$
|
2,846.8
|
|
|||||
|
Title Insurance Group
|
29.9
|
|
91.9
|
|
—
|
|
1,600.1
|
|
1,394.4
|
|
||||||||||
|
RFIG Run-off Business
|
27.5
|
|
248.2
|
|
—
|
|
24.3
|
|
248.0
|
|
||||||||||
|
Corporate & Other (1)
|
9.2
|
|
42.0
|
|
19.5
|
|
2.6
|
|
63.8
|
|
||||||||||
|
Reinsurance Recoverable (2)
|
—
|
|
—
|
|
—
|
|
—
|
|
—
|
|
||||||||||
|
Consolidated
|
$
|
345.5
|
|
$
|
2,514.5
|
|
$
|
364.6
|
|
$
|
2,042.0
|
|
$
|
4,553.1
|
|
|||||
__________
|
(1)
|
Represents amounts for Old Republic's holding company parent, minor corporate services subsidiaries, a small life & accident insurance operation and consolidation elimination adjustments.
|
|
(2)
|
In accordance with GAAP, reinsured losses and unearned premiums are to be reported as assets. Assets and liabilities were, as a result, increased by corresponding amounts of approximately
$3.1 billion
,
$3.1 billion
, and
$3.3 billion
at
December 31, 2016
,
2015
and
2014
, respectively. This accounting treatment does not have any effect on the Company's results of operations.
|
109
|
OLD REPUBLIC INTERNATIONAL CORPORATION AND SUBSIDIARIES
|
||||||||||||||||||
|
SCHEDULE IV - REINSURANCE
|
||||||||||||||||||
|
For the years ended December 31, 2016, 2015 and 2014
|
||||||||||||||||||
|
($ in Millions)
|
||||||||||||||||||
|
Column A
|
Column B
|
Column C
|
Column D
|
Column E
|
Column F
|
|||||||||||||
|
Gross
amount
|
Ceded
to other
companies
|
Assumed
from other
companies
|
Net
amount
|
Percentage
of amount
assumed
to net
|
||||||||||||||
|
Year Ended December 31, 2016:
|
||||||||||||||||||
|
Life insurance in force
|
$
|
5,825.9
|
|
$
|
3,005.6
|
|
$
|
—
|
|
$
|
2,820.3
|
|
—
|
%
|
||||
|
Premium Revenues:
|
||||||||||||||||||
|
General Insurance
|
$
|
4,005.3
|
|
$
|
1,119.8
|
|
$
|
50.8
|
|
$
|
2,936.3
|
|
1.7
|
%
|
||||
|
Title Insurance
|
1,740.5
|
|
—
|
|
1.9
|
|
1,742.4
|
|
.1
|
|
||||||||
|
RFIG Run-off
|
173.0
|
|
2.9
|
|
—
|
|
170.0
|
|
—
|
|
||||||||
|
Life and Health Insurance:
|
||||||||||||||||||
|
Life insurance
|
15.8
|
|
5.0
|
|
—
|
|
10.8
|
|
—
|
|
||||||||
|
Accident and health insurance
|
31.9
|
|
22.5
|
|
—
|
|
9.3
|
|
—
|
|
||||||||
|
Total Life & Health Insurance
|
47.7
|
|
27.5
|
|
—
|
|
20.1
|
|
—
|
|
||||||||
|
Consolidating adjustments
|
—
|
|
(7.0
|
)
|
(7.0
|
)
|
—
|
|
—
|
|
||||||||
|
Consolidated
|
$
|
5,966.7
|
|
$
|
1,143.4
|
|
$
|
45.7
|
|
$
|
4,868.9
|
|
.9
|
%
|
||||
|
Year Ended December 31, 2015:
|
||||||||||||||||||
|
Life insurance in force
|
$
|
6,490.0
|
|
$
|
3,226.3
|
|
$
|
—
|
|
$
|
3,263.7
|
|
—
|
%
|
||||
|
Premium Revenues:
|
||||||||||||||||||
|
General Insurance
|
$
|
3,839.2
|
|
$
|
1,008.8
|
|
$
|
64.3
|
|
$
|
2,894.7
|
|
2.2
|
%
|
||||
|
Title Insurance
|
1,623.3
|
|
—
|
|
1.4
|
|
1,624.7
|
|
.1
|
|
||||||||
|
RFIG Run-off
|
225.0
|
|
5.1
|
|
—
|
|
219.9
|
|
—
|
|
||||||||
|
Life and Health Insurance:
|
||||||||||||||||||
|
Life insurance
|
16.9
|
|
6.5
|
|
—
|
|
10.4
|
|
—
|
|
||||||||
|
Accident and health insurance
|
51.8
|
|
42.7
|
|
—
|
|
9.0
|
|
—
|
|
||||||||
|
Total Life & Health Insurance
|
68.8
|
|
49.3
|
|
—
|
|
19.4
|
|
—
|
|
||||||||
|
Consolidating adjustments
|
—
|
|
(26.4
|
)
|
(26.4
|
)
|
—
|
|
—
|
|
||||||||
|
Consolidated
|
$
|
5,756.4
|
|
$
|
1,036.9
|
|
$
|
39.3
|
|
$
|
4,758.8
|
|
.8
|
%
|
||||
|
|
|
|
|
|||||||||||||||
|
Year Ended December 31, 2014:
|
||||||||||||||||||
|
Life insurance in force
|
$
|
7,083.4
|
|
$
|
3,469.9
|
|
$
|
—
|
|
$
|
3,613.5
|
|
—
|
%
|
||||
|
Premium Revenues:
|
||||||||||||||||||
|
General Insurance
|
$
|
3,607.5
|
|
$
|
902.9
|
|
$
|
31.1
|
|
$
|
2,735.6
|
|
1.1
|
%
|
||||
|
Title Insurance
|
1,392.9
|
|
.1
|
|
1.5
|
|
1,394.4
|
|
.1
|
|
||||||||
|
RFIG Run-off
|
262.4
|
|
7.0
|
|
—
|
|
255.4
|
|
—
|
|
||||||||
|
Life and Health Insurance:
|
||||||||||||||||||
|
Life insurance
|
18.8
|
|
6.9
|
|
—
|
|
11.9
|
|
—
|
|
||||||||
|
Accident and health insurance
|
65.0
|
|
16.2
|
|
—
|
|
48.8
|
|
—
|
|
||||||||
|
Total Life & Health Insurance
|
83.9
|
|
23.1
|
|
—
|
|
60.7
|
|
—
|
|
||||||||
|
Consolidating adjustments
|
—
|
|
—
|
|
—
|
|
—
|
|
—
|
|
||||||||
|
Consolidated
|
$
|
5,346.8
|
|
$
|
933.2
|
|
$
|
32.7
|
|
$
|
4,446.3
|
|
.7
|
%
|
||||
110
|
OLD REPUBLIC INTERNATIONAL CORPORATION AND SUBSIDIARIES
|
||||||||||||||||||||
|
SCHEDULE V - VALUATION AND QUALIFYING ACCOUNTS
|
||||||||||||||||||||
|
For the years ended December 31, 2016, 2015 and 2014
|
||||||||||||||||||||
|
($ in Millions)
|
||||||||||||||||||||
|
Column A
|
Column B
|
Column C
|
Column D
|
Column E
|
||||||||||||||||
|
|
Additions
|
|||||||||||||||||||
|
Description
|
Balance at
Beginning of
Period
|
Charged to
Costs and
Expenses
|
Charged
to Other
Accounts -
Describe
|
Deductions -
Describe
|
Balance at
End of
Period
|
|||||||||||||||
|
Year Ended December 31, 2016:
|
||||||||||||||||||||
|
Deducted from Asset Accounts:
|
||||||||||||||||||||
|
Reserve for unrecoverable
|
||||||||||||||||||||
|
reinsurance
|
$
|
15.9
|
|
$
|
—
|
|
$
|
—
|
|
$
|
—
|
|
$
|
15.9
|
|
|||||
|
Deferred tax asset valuation
|
||||||||||||||||||||
|
Allowance (1)
|
$
|
—
|
|
$
|
—
|
|
$
|
—
|
|
$
|
—
|
|
$
|
—
|
|
|||||
|
Year Ended December 31, 2015:
|
||||||||||||||||||||
|
Deducted from Asset Accounts:
|
||||||||||||||||||||
|
Reserve for unrecoverable
|
||||||||||||||||||||
|
reinsurance
|
$
|
21.2
|
|
$
|
—
|
|
$
|
—
|
|
$
|
(5.3
|
)
|
$
|
15.9
|
|
|||||
|
Deferred tax asset valuation
|
||||||||||||||||||||
|
Allowance (1)
|
$
|
9.6
|
|
$
|
—
|
|
$
|
—
|
|
$
|
(9.6
|
)
|
$
|
—
|
|
|||||
|
Year Ended December 31, 2014:
|
||||||||||||||||||||
|
Deducted from Asset Accounts:
|
||||||||||||||||||||
|
Reserve for unrecoverable
|
||||||||||||||||||||
|
reinsurance
|
$
|
21.2
|
|
$
|
—
|
|
$
|
—
|
|
$
|
—
|
|
$
|
21.2
|
|
|||||
|
Deferred tax asset valuation
|
||||||||||||||||||||
|
Allowance (1)
|
$
|
9.6
|
|
$
|
—
|
|
$
|
—
|
|
$
|
—
|
|
$
|
9.6
|
|
|||||
__________
|
(1)
|
A valuation allowance was held against deferred tax assets as of
December 31, 2014
related to certain tax credit carryforwards which the Company did not expect to realize. In
2015
, the Company released the valuation allowance previously established. In valuing the deferred tax assets, the Company considered certain factors including primarily the scheduled reversals of certain deferred tax liabilities, estimates of future taxable income, the impact of available carryback and carryforward periods, as well as the availability of certain tax planning strategies. The Company estimates that all remaining deferred tax assets at year end
2016
will more likely than not be fully realized.
|
111
|
OLD REPUBLIC INTERNATIONAL CORPORATION AND SUBSIDIARIES
|
|
SCHEDULE VI - SUPPLEMENTAL INFORMATION CONCERNING
|
|
PROPERTY-CASUALTY INSURANCE OPERATIONS
|
|
For the years ended December 31, 2016, 2015 and 2014
|
|
($ in Millions)
|
|
Column A
|
Column B
|
Column C
|
Column D
|
Column E
|
||||||||||||
|
Affiliation With Registrant (1)
|
Deferred
Policy
Acquisition
Costs
|
Reserves
for Unpaid
Claims
and Claim
Adjustment
Expenses (2)
|
Discount,
If Any,
Deducted in
Column C
|
Unearned
Premiums (2)
|
||||||||||||
|
Year Ended December 31:
|
||||||||||||||||
|
2016
|
$
|
266.4
|
|
$
|
5,443.4
|
|
$
|
231.9
|
|
$
|
1,455.8
|
|
||||
|
2015
|
243.4
|
|
5,208.2
|
|
228.6
|
|
1,374.5
|
|
||||||||
|
2014
|
211.1
|
|
4,829.7
|
|
240.7
|
|
1,285.2
|
|
||||||||
|
Column A
|
Column F
|
Column G
|
Column H
|
|||||||||||||
|
Net
Investment
Income
|
Claims and Claim
Adjustment Expenses
Incurred Related to
|
|||||||||||||||
|
Affiliation With Registrant (1)
|
Earned
Premiums
|
Current
Year
|
Prior
Years
|
|||||||||||||
|
Year Ended December 31:
|
||||||||||||||||
|
2016
|
$
|
2,952.1
|
|
$
|
313.3
|
|
$
|
2,172.5
|
|
$
|
2.5
|
|
||||
|
2015
|
2,918.6
|
|
313.0
|
|
2,167.4
|
|
41.2
|
|
||||||||
|
2014
|
2,763.4
|
|
279.3
|
|
2,064.1
|
|
190.8
|
|
||||||||
|
Column A
|
Column I
|
Column J
|
Column K
|
|||||||||||||
|
Affiliation With Registrant (1)
|
Amortization
of Deferred
Policy
Acquisition
Costs
|
Paid
Claims
and Claim
Adjustment
Expenses
|
Premiums
Written
|
|||||||||||||
|
Year Ended December 31:
|
||||||||||||||||
|
2016
|
$
|
389.1
|
|
$
|
1,939.9
|
|
$
|
3,021.8
|
|
|||||||
|
2015
|
388.3
|
|
1,830.1
|
|
3,005.8
|
|
||||||||||
|
2014
|
345.0
|
|
1,825.5
|
|
2,874.9
|
|
||||||||||
__________
|
(1)
|
Includes consolidated property-casualty entities. The amounts relating to the Company's unconsolidated property-casualty subsidiaries and the proportionate share of the registrant's and its subsidiaries' 50%-or-less owned property-casualty equity investees are immaterial and have, therefore, been omitted from this schedule.
|
|
(2)
|
See note (2) to Schedule III.
|
112
|
EXHIBIT INDEX
|
|||
|
An index of exhibits required by Item 601 of Regulation S-K follows:
|
|||
|
(3)
|
Articles of incorporation and by-laws.
|
||
|
(A)
|
*
|
Restated Certificate of Incorporation. (Exhibit 3(A) to Registrant's June 30, 2014 report on Form 10-Q).
|
|
|
(B)
|
*
|
By-laws, as amended. (Exhibit 99.2 to Form 8-K filed August 23, 2013).
|
|
|
(4)
|
Instruments defining the rights of security holders, including indentures.
|
||
|
(A)
|
*
|
Amended and Restated Rights Agreement dated as of November 19, 2007 between Old Republic International Corporation and Wells Fargo Bank, NA. (Exhibit 4.1 to Registrant's Form 8-A/A filed November 19, 2007).
|
|
|
(B)
|
*
|
Agreement to furnish certain long-term debt instruments to the Securities & Exchange Commission upon request. (Exhibit 4(D) to Registrant's Form 8 dated August 28, 1987).
|
|
|
(C)
|
*
|
Form of Indenture dated as of August 15, 1992 between Old Republic International Corporation and the Wilmington Trust Company, as Trustee (refiled as Exhibit 4.1 to Registrant's Form 8-K filed April 22, 2009).
|
|
|
(D)
|
*
|
Supplemental Indenture No. 1 dated as of June 15, 1997, supplementing the Indenture. (Exhibit 4.3 to the Registrant's Form 8-A filed June 16, 1997).
|
|
|
(E)
|
*
|
Supplemental Indenture No. 2 dated as of December 31, 1997 supplementing the Indenture. (Exhibit 4.3 to the Registrant's Form S-3 filed January 7, 1998).
|
|
|
(F)
|
*
|
Fourth Supplemental Indenture dated as of March 8, 2011 between Old Republic International Corporation and the Wilmington Trust Company, as Trustee. (Exhibit 4.1 to Registrant's Form 8-K filed March 8, 2011).
|
|
|
(G)
|
*
|
Fifth Supplemental Indenture dated as of September 25, 2014 between Old Republic International Corporation and the Wilmington Trust Company, as Trustee. (Exhibit 4.1 to Registrant's Form 8-K filed September 25, 2014).
|
|
|
(H)
|
*
|
Sixth Supplemental Indenture dated as of August 26, 2016 between Old Republic International Corporation and the Wilmington Trust Company, as Trustee. (Exhibit 4.1 to Registrant's Form 8-K filed August 26, 2016).
|
|
|
(10)
|
Material contracts.
|
||
|
**
|
(A)
|
*
|
Old Republic International Corporation 2005 Key Employees Performance Recognition Plan. (Exhibit 10(B) to Registrant's Annual Report on Form 10-K for 2006).
|
|
**
|
(B)
|
*
|
Amended and Restated Old Republic International Corporation 2006 Incentive Compensation Plan. (Exhibit 10(a) to Registrant's March 31, 2014 report on From 10-Q).
|
|
**
|
(C)
|
*
|
Amended and Restated Old Republic International Corporation Executives Excess Benefits Pension Plan. (Exhibit 10(F) to Registrant's Annual Report on Form 10-K for 2008).
|
|
**
|
(D)
|
*
|
Old Republic International Corporation 2016 Incentive Compensation Plan. (Exhibit 99.1 to Registrant's Form 8-K filed May 28, 2015).
|
|
**
|
(E)
|
*
|
Form of Indemnity Agreement between Old Republic International Corporation and each of its directors and certain officers. (Exhibit 10 to Form S-3 Registration Statement No. 33-16836).
|
|
**
|
(F)
|
*
|
ORI Great West Holdings, Inc. 2005 Key Employees Performance Recognition Plan. (Exhibit 10(P) to Registrant's Annual Report on Form 10-K for 2006).
|
|
(G)
|
*
|
Form of Tax Sharing Agreement between Old Republic International Corporation and each of its subsidiary companies. (Exhibit 10(a) to Registrant's March 31, 2013 report on Form 10-Q).
|
|
|
(21)
|
Subsidiaries of the registrant.
|
||
|
(23.1)
|
Consent of KPMG LLP.
|
||
113
(Exhibit Index, Continued)
|
(24)
|
Powers of attorney.
|
||
|
(31.1)
|
Certification by Aldo C. Zucaro, Chief Executive Officer, pursuant to Rule 13a-14(a) and 15d-14(a), as adopted pursuant to Section 302 of the Sarbannes-Oxley Act of 2002.
|
||
|
(31.2)
|
Certification by Karl W. Mueller, Chief Financial Officer, pursuant to Rule 13a-14(a) and 15d-14(a), as adopted pursuant to Section 302 of the Sarbannes-Oxley Act of 2002.
|
||
|
(32.1)
|
Certification by Aldo C. Zucaro, Chief Executive Officer, pursuant to Section 1350, Chapter 63 of Title 18, United States Code, as adopted pursuant to Section 906 of the Sarbannes-Oxley Act of 2002.
|
||
|
(32.2)
|
Certification by Karl W. Mueller, Chief Financial Officer, pursuant to Section 1350, Chapter 63 of Title 18, United States Code, as adopted pursuant to Section 906 of the Sarbannes-Oxley Act of 2002.
|
||
|
(101.INS)
|
XBRL Instance Document
|
||
|
(101.SCH)
|
XBRL Taxonomy Extension Schema
|
||
|
(101.CAL)
|
XBRL Taxonomy Extension Calculation Linkbase
|
||
|
(101.DEF)
|
XBRL Taxonomy Extension Definition Linkbase
|
||
|
(101.LAB)
|
XBRL Taxonomy Extension Label Linkbase
|
||
|
(101.PRE)
|
XBRL Taxonomy Extension Presentation Linkbase
|
||
|
*
|
Exhibit incorporated herein by reference.
|
|
**
|
Denotes a management or compensatory plan or arrangement required to be filed as an exhibit pursuant to Item 601 of Regulation S-K.
|
114
TABLE OF CONTENTS
Part IItem 1 - BusinessItem 1A - Risk FactorsItem 1B - Unresolved Staff CommentsItem 2 - PropertiesItem 3 - Legal ProceedingsItem 4 - Mine Safety DisclosuresPart IIItem 5 - Market For The Registrant's Common Equity, Related Security Holder Matters and Issuer Purchases Of Equity SecuritiesItem 5 - Market For The Registrant's Common Equity, Related Security Holder Matters and Issuer Purchases Of EquityItem 6 - Selected Financial Data ($ in Millions, Except Share Data)Item 6 - Selected Financial DataItem 7 - Management Analysis Of Financial Position and Results Of OperationsItem 7A - Quantitative and Qualitative Disclosure About Market Risk($ in Millions)Item 7A - Quantitative and Qualitative Disclosure About Market RiskItem 8 - Financial Statements and Supplementary DataNote 1 - Summary Of Significant Accounting Policies -Note 2 - Debt - Consolidated Debt Of Old Republic and Its Subsidiaries Is Summarized Below:Note 2 - Debt -Note 3 - Shareholders' EquityNote 4 - Commitments and Contingent Liabilities:Note 5 - Consolidated Quarterly Results - Unaudited -Note 6 - Information About Segments Of Business -Note 7 - Transactions with Affiliates:Item 9 - Changes in and Disagreements with Accountants on Accounting and Financial DisclosureItem 9A - Controls and ProceduresItem 9B - Other InformationPart IIIItem 10 - Directors, Executive Officers, and Corporate GovernanceItem 11 - Executive CompensationItem 12 - Security Ownership Of Certain Beneficial Owners and Management and Related Stockholder MattersItem 13 - Certain Relationships and Related TransactionsItem 14 - Principal Accountant Fees and ServicesPart IVItem 15 - ExhibitsNote 1 - Summary Of Significant Accounting PoliciesNote 2 - Investments in Consolidated SubsidiariesNote 3 - Debt