ORRSTOWN FINANCIAL SERVICES INC
10-Ks and 10-Qs
|
|
|
|
|
|
|
|
|
|
|
|
|
|
|
|
|
|
|
|
|
|
|
|
|
|
|
|
|
|
|
|
|
|
|
|
|
|
|
|
|
|
|
|
|
|
|
|
|
|
UNITED STATES
SECURITIES AND EXCHANGE COMMISSION
Washington, D.C. 20549
FORM 10-K
|
x
|
ANNUAL REPORT PURSUANT TO SECTION 13 OR 15(d) OF THE SECURITIES EXCHANGE ACT OF 1934
|
For the fiscal year ended
December 31, 2015
or
|
¨
|
TRANSITION REPORT PURSUANT TO SECTION 13 OR 15(d) OF THE SECURITIES EXCHANGE ACT OF 1934
|
For the transition period from to
Commission file number: 001-34292
ORRSTOWN FINANCIAL SERVICES, INC.
(Exact Name of Registrant as Specified in its Charter)
|
Pennsylvania
(State or Other Jurisdiction of
Incorporation or Organization)
|
|
23-2530374
(I.R.S. Employer
Identification No.)
|
|
77 East King Street, P. O. Box 250,
Shippensburg, Pennsylvania
(Address of Principal Executive Offices)
|
|
17257
(Zip Code)
|
Registrant’s Telephone Number, Including Area Code: (717) 532-6114
Securities registered pursuant to Section 12(b) of the Act:
|
Title of Each Class
|
|
Name of Each Exchange on Which Registered
|
|
Common Stock, No Par Value
|
|
The NASDAQ Capital Market
|
Securities registered pursuant to Section 12(g) of the Act: None
Indicate by check mark if the registrant is a well-known seasoned issuer, as defined in Rule 405 of the Securities Act. Yes
¨
No
x
Indicate by check mark if the registrant is not required to file reports pursuant to Section 13 or Section 15(d) of the Act. Yes
¨
No
x
Indicate by check mark whether the registrant (1) has filed all reports required to be filed by Section 13 or 15(d) of the Securities Exchange Act of 1934 during the preceding 12 months (or for such shorter period that the registrant was required to file such reports), and (2) has been subject to such filing requirements for the past 90 days. Yes
x
No
¨
Indicate by check mark whether the registrant has submitted electronically and posted on its corporate Website, if any, every Interactive Data File required to be submitted and posted pursuant to Rule 405 of Regulation S-T (§232,405 of this chapter) during the preceding 12 months (or for such shorter period that the registrant was required to submit and post such files). Yes
x
No
¨
Indicate by check mark if disclosure of delinquent filers pursuant to Item 405 of Regulation S-K (§229.405 of this chapter) is not contained herein and will not be contained, to the best of registrant’s knowledge, in definitive proxy or information statements incorporated by reference in Part III of this Form 10-K or any amendment to this Form 10-K.
¨
Indicate by check mark whether the registrant is a large accelerated filer, an accelerated filer, a non-accelerated filer, or a smaller reporting company. See the definitions of “accelerated filer,” “large accelerated filer” and “smaller reporting company” in Rule 12b-2 of the Exchange Act.
|
Large accelerated filer
|
|
¨
|
|
Accelerated filer
|
|
x
|
|
Non-accelerated filer
|
|
¨
(Do not check if a smaller reporting company)
|
|
Smaller reporting company
|
|
¨
|
Indicate by check mark whether the registrant is a shell company (as defined in Rule 12b-2 of the Act.). Yes
¨
No
x
The aggregate market value of the voting stock held by non-affiliates computed by reference to the price at which the common stock was last sold as of the last business day of the Registrant’s most recently completed second fiscal quarter, was approximately
$115.6 million
. For purposes of this calculation, the term “affiliate” refers to all directors and executive officers of the registrant, and all persons beneficially owning more than 5% of the registrant’s common stock.
Number of shares outstanding of the registrant’s Common Stock as of
March 7, 2016
:
8,295,092
.
DOCUMENTS INCORPORATED BY REFERENCE
Portions of the Proxy Statement for the
2016
Annual Meeting of Shareholders are incorporated by reference in Part III of this Form 10-K.
ORRSTOWN FINANCIAL SERVICES, INC.
FORM 10-K
INDEX
|
|
|
Page
|
1
Orrstown Financial Services, Inc. (the “Company”), a Pennsylvania corporation, is the holding company for Orrstown Bank (the “Bank”). The Company’s executive offices are located at 77 East King Street, Shippensburg, Pennsylvania, 17257. The Company was organized on November 17, 1987, for the purpose of acquiring the Bank and such other banks and bank related activities as are permitted by law and desirable. The Bank provides banking and bank related services through
22
offices, located in South Central Pennsylvania, principally in Cumberland, Franklin, Lancaster and Perry Counties and in Washington County, Maryland.
The Company files periodic reports with the Securities and Exchange Commission (“SEC”) in the form of quarterly reports on Form 10-Q, annual reports on Form 10-K, annual proxy statements and current reports on Form 8-K for any significant events that may arise during the year. Copies of these reports, and any amendments to such reports filed or furnished pursuant to Section 13(a) or 15(d) of the Securities Exchange Act of 1934, as amended (the “Exchange Act”), may be obtained free of charge through the SEC’s internet site at
www.sec.gov
or by accessing the Company’s website at
www.orrstown.com
as soon as reasonably practicable after such reports are electronically filed with, or furnished to, the SEC. Information on our website shall not be considered a part of this Form 10-K.
Business
The Bank was originally organized in 1919 as a state-chartered bank. On March 8, 1988, in a bank holding company reorganization transaction, the Company acquired 100% ownership of the Bank, issuing 131,455 shares of the Company’s common stock to the former shareholders of the Bank.
The Company’s primary activity consists of owning and supervising its subsidiary, the Bank. The day-to-day management of the Company is conducted by its officers, who are also Bank officers. The Company has historically derived most of its income through dividends from the Bank. As of
December 31, 2015
, the Company, on a consolidated basis, had total assets of
$1,292,816,000
, total shareholders’ equity of
$133,061,000
and total deposits of
$1,032,167,000
.
The Company has no employees. Its
seven
officers are employees of the Bank. On
December 31, 2015
, the Bank had
294
full-time and
12
part-time employees.
The Bank is engaged in commercial banking and trust business as authorized by the Pennsylvania Banking Code of 1965. This involves accepting demand, time and savings deposits, and granting loans. The Bank grants commercial, residential, consumer and agribusiness loans in its market areas of Cumberland, Franklin, Lancaster and Perry Counties in Pennsylvania, Washington County, Maryland, and in contiguous counties. The concentrations of credit by type of loan are set forth in Note 4, “Loans Receivable and Allowance for Loan Losses” filed herewith in Part II, Item 8, “Financial Statements and Supplementary Data.” The Bank maintains a diversified loan portfolio and evaluates each customer’s credit worthiness on a case-by-case basis. The amount of collateral obtained, if deemed necessary by the Bank upon the extension of credit, is based on management’s credit evaluation of the customer pursuant to collateral standards established in the Bank’s credit policies and procedures.
Lending
All secured loans are supported with appraisals or evaluations of collateral. Business equipment and machinery, inventories, accounts receivable, and farm equipment are considered appropriate security, provided they meet acceptable standards for liquidity and marketability. Loans secured by real estate generally do not exceed 90% of the appraised value of the property. Loan to collateral values are monitored as part of the loan review process, and appraisals are updated as deemed appropriate under the circumstances.
Commercial Lending
A majority of the Company’s loan assets are loans for business purposes. Approximately 59% of the loan portfolio is comprised of commercial loans. The Bank makes commercial real estate, equipment, working capital and other commercial purpose loans as required by the broad range of borrowers across the Bank’s various markets.
The Bank’s credit policy dictates the underwriting requirements for the various types of loans the Bank would extend to borrowers. The policy covers such requirements as debt coverage ratios, advance rate against different forms of collateral, loan-to-value ratios (“LTV”) and maximum term.
2
Consumer Lending
The Bank provides home equity loans, home equity lines of credit and other consumer loans primarily through its branch network and customer call center. A large majority of the consumer loans are secured by either a first or second lien position on the borrower’s primary residential real estate. The Bank requires a LTV of no greater than 90% of the value of the real estate being taken as collateral. The Bank’s underwriting standards typically require that a borrower’s debt to income ratio generally cannot exceed 43%.
Residential Lending
The Bank provides residential mortgages throughout its various markets through a network of mortgage loan officers. A majority of the residential mortgages originated are sold to secondary market investors, primarily Wells Fargo, Fannie Mae and the Federal Home Loan Bank of Pittsburgh. All mortgages, regardless of being sold or held in the Bank’s portfolio, are generally underwritten to secondary market industry standards for prime mortgages. The Bank generally requires a LTV of no greater than 80% of the value of the real estate being taken as collateral, without the borrower obtaining private mortgage insurance.
Loan Review
The Bank has a loan review policy and program which is designed to identify and mitigate risk in the lending function. The Enterprise Risk Management (“ERM”) Committee, comprised of executive officers and loan department personnel, is charged with the oversight of overall credit quality and risk exposure of the Bank’s loan portfolio. This includes the monitoring of the lending activities of all Bank personnel with respect to underwriting and processing new loans and the timely follow-up and corrective action for loans showing signs of deterioration in quality. The loan review program provides the Bank with an independent review of the Bank’s loan portfolio on an ongoing basis. Generally, consumer and residential mortgage loans are included in the Pass categories unless a specific action, such as extended delinquencies, bankruptcy, repossession, or death of the borrower occurs, which heightens awareness as to a possible negative credit event.
Internal loan relationship reviews are completed annually on all commercial relationships with a committed loan balance in excess of $500,000, which include a confirmation of the risk rating by the appropriate credit authority, including Credit Administration for loans in excess of $1,000,000. In addition, all relationships greater than $250,000 rated Substandard, Doubtful or Loss are reviewed by the ERM Committee on a quarterly basis, with reaffirmation of the rating as approved by the Bank’s Loan Work Out Committee.
The Bank outsources its independent loan review to a third-party provider, which monitors and evaluates loan customers on a quarterly basis utilizing risk-rating criteria established in the credit policy in order to identify deteriorating trends and detect conditions which might indicate potential problem loans. The third-party loan review firm reports the results of the loan reviews quarterly to the ERM Committee for approval. The loan ratings provide the basis for evaluating the adequacy of the allowance for loan losses.
Orrstown Financial Advisors (“OFA”)
Through its trust department, the Bank renders services as trustee, executor, administrator, guardian, managing agent, custodian, investment advisor, and other fiduciary activities authorized by law under the trade name “Orrstown Financial Advisors.” OFA offers retail brokerage services through a third-party broker/dealer arrangement with Cetera Advisor Networks LLC. As of
December 31, 2015
, trust assets under management were
$966,362,000
.
Regulation and Supervision
The Company is a bank holding company registered with the Board of Governors of the Federal Reserve System (the “FRB”) and has elected status as a financial holding company. As a registered bank holding company and financial holding company, the Company is subject to regulation under the Bank Holding Company Act of 1956 (the “BHC Act”) and to inspection, examination, and supervision by the Federal Reserve Bank of Philadelphia (the “Federal Reserve Bank”).
The Bank is a Pennsylvania-chartered commercial bank and a member of the FRB. As such, the operations of the Bank are subject to federal and state statutes applicable to banks chartered under Pennsylvania law, to FRB member banks and to banks whose deposits are insured by the Federal Deposit Insurance Corporation (“FDIC”). The Bank’s operations are also subject to regulations of the Pennsylvania Department of Banking and Securities (“PDB”), the FRB and the FDIC.
3
Several of the more significant regulatory provisions applicable to banks and bank holding companies to which the Company and the Bank are subject are discussed below, along with certain regulatory matters concerning the Company and the Bank. To the extent that the following information describes statutory or regulatory provisions, such information is qualified in its entirety by reference to the particular statutes or regulations. Any change in applicable law or regulation may have a material effect on the business and prospects of the Company and the Bank.
Financial and Bank Holding Company Activities
In general, the BHC Act and the FRB’s regulations limit the nonbanking activities permissible for bank holding companies to those activities that the FRB has determined to be so closely related to banking or managing or controlling banks to be a proper incident thereto. A bank holding company that elects to be treated as a financial holding company, such as the Company, however, may engage in, and acquire companies engaged in, activities that are considered “financial in nature,” as defined by the Gramm-Leach-Bliley Act and FRB regulations. For a bank holding company to be eligible to elect financial holding company status, the holding company must be both “well capitalized” and “well managed” under applicable regulatory standards and all of its subsidiary banks must be “well-capitalized” and “well-managed” and must have received at least a satisfactory rating on such institution’s most recent examination under the Community Reinvestment Act of 1977 (the “CRA”). A financial holding company that continues to meet all of such requirements may engage directly or indirectly in activities considered financial in nature, either de novo or by acquisition, as long as it gives the FRB after-the-fact notice of the new activities. If a financial holding company fails to continue to meet any of the prerequisites for financial holding company status after engaging in activities not permissible for bank holding companies that have not elected to be treated as financial holding companies, the company must enter into an agreement with the FRB that it will comply with all applicable capital and management requirements. If the financial holding company does not return to compliance within 180 days, or such longer period as agreed to by the FRB, the FRB may order the company to discontinue existing activities that are not generally permissible for bank holding companies or divest the company’s investments in companies engaged in such activities. In addition, if any banking subsidiary of a financial holding company receives a CRA rating of less than satisfactory, the company would be prohibited from engaging in any additional activities other than those permissible for bank holding companies that are not financial holding companies.
FDIC Insurance and Assessments
The Bank’s deposits are insured to applicable limits by the FDIC. Under the Dodd-Frank Wall Street Reform and Consumer Protection Act (the “Dodd-Frank Act”), the maximum deposit insurance amount is $250,000.
The FDIC has adopted a risk-based premium system that provides for quarterly assessments based on an insured institution’s ranking in one of four risk categories based on their examination ratings and capital ratios. Within its risk category, an institution is assigned an initial base assessment which is then adjusted to determine its final assessment rate based on its level of brokered deposits, secured liabilities and unsecured debt.
The Dodd-Frank Act required the FDIC to take such steps as necessary to increase the reserve ratio of the Deposit Insurance Fund from 1.15% to 1.35% of insured deposits by 2020. In setting the assessments, the FDIC is required to offset the effect of the higher reserve ratio against insured depository institutions with total consolidated assets of less than $10 billion. The Dodd-Frank Act also broadened the base for FDIC insurance assessments so that assessments will be based on the average consolidated total assets less average tangible equity capital of a financial institution rather than on its insured deposits. The FDIC has adopted a restoration plan to increase the reserve ratio to 1.15% by September 30, 2020 with additional rulemaking scheduled regarding the method to be used to achieve a 1.35% reserve ratio by that date and offset the effect on institutions with less than $10 billion in assets.
Pursuant to these requirements, the FDIC adopted new assessment regulations effective April 1, 2011 that redefined the assessment base as average consolidated assets less average tangible equity. Insured banks with more than $1.0 billion in assets must calculate quarterly average assets based on daily balances while smaller banks and newly chartered banks may use weekly averages. Average assets would be reduced by goodwill and other intangibles. Average tangible equity equals Tier 1 capital. For institutions with more than $1.0 billion in assets, average tangible equity is calculated on a weekly basis while smaller institutions may use the quarter-end balance. The base assessment rate for insured institutions in Risk Category I will range from 5 to 9 basis points and for institutions in Risk Categories II, III, and IV will be 14, 23 and 35 basis points. An institution’s assessment rate will be reduced based on the amount of its outstanding unsecured long-term debt and for institutions in Risk Categories II, III and IV may be increased based on their brokered deposits. In addition, under the FDIC’s 2011 insurance assessment regulation, a schedule of lower assessment rates will go into effect the quarter after the Deposit Insurance Fund reserve ratio reaches 1.15%, which the FDIC projects will be the first or second quarter of 2016.
4
The FDIC has proposed to amend its assessment regulations for established banks (generally, an institution that has been federally insured for at least five years as of the last day of any quarter for which it is being assessed) with less than $10 billion in assets to replace the current risk categories with updated financial ratios that are designed to better predict the risk of failure of insured institutions. The proposed rules would not become effective until the designated reserve ratio of the Deposit Insurance Fund reaches 1.15% and would remain in effect until the designated reserve ratio reaches 2.0%. The proposed regulations would set a maximum rate that banks rated CAMELS 1 or 2 could be charged and a minimum rate that CAMELS 3, 4 and 5 banks would be charged. Under the proposal, the FDIC would use a bank’s weighted average CAMELS component ratings and the following financial measures to determine assessments: Tier 1 leverage ratio; ratio of net income before taxes to total assets; ratio of non-performing loans to gross assets; and ratio of other real estate owned to gross assets. In addition, assessments would take into consideration core deposits to total assets, one-year asset growth and a loan mix index. The loan mix index would measure the extent to which a bank’s total assets include higher risk loans. To calculate the loan mix index, each category of loans in the bank’s portfolio (other than credit card loans) would be divided by the bank’s total assets to determine the percentage of assets represented by that loan category. Each percentage would then be multiplied by that loan category’s historical weighted average industry-wide charge-off rate. The sum of these numbers would determine the loan mix index value for that bank. The FDIC proposal is intended to be revenue neutral to the FDIC but to shift premium payments to higher risk institutions. Most institutions are expected to see lower premiums. A companion proposal would assess banks over $10 billion in assets at higher rates for two years in accordance with the requirements of the Dodd-Frank Act.
Liability for Banking Subsidiaries
Under the Dodd-Frank Act and applicable FRB policy, a bank holding company such as the Company is expected to act as a source of financial and managerial strength to each of its subsidiary banks and to commit resources to their support. This support may be required at times when the bank holding company may not have the resources to provide it. Similarly, under the cross-guarantee provisions of the Federal Deposit Insurance Act (the “FDIA”), the FDIC can hold any FDIC-insured depository institution liable for any loss suffered or anticipated by the FDIC in connection with (1) the “default” of a commonly controlled FDIC-insured depository institution; or (2) any assistance provided by the FDIC to a commonly controlled FDIC-insured depository institution “in danger of default.”
Pennsylvania Banking Law
The Pennsylvania Banking Code (“Banking Code”) contains detailed provisions governing the organization, location of offices, rights and responsibilities of directors, officers, and employees, as well as corporate powers, savings and investment operations and other aspects of the Bank and its affairs. The Banking Code delegates extensive rule-making power and administrative discretion to the PDB so that the supervision and regulation of state chartered banks may be flexible and readily responsive to changes in economic conditions and in savings and lending practices.
The FDIA, however, prohibits state chartered banks from making new investments, loans, or becoming involved in activities as principal and equity investments which are not permitted for national banks unless (1) the FDIC determines the activity or investment does not pose a significant risk of loss to the Deposit Insurance Fund and (2) the bank meets all applicable capital requirements. Accordingly, the additional operating authority provided to the Bank by the Banking Code is significantly restricted by the FDIA.
Dividend Restrictions
The Company’s funding for cash distributions to its shareholders is derived from a variety of sources, including cash and temporary investments. One of the principal sources of those funds has historically been dividends received from the Bank. Various federal and state laws limit the amount of dividends the Bank can pay to the Company without regulatory approval. In addition, federal bank regulatory agencies have authority to prohibit the Bank from engaging in an unsafe or unsound practice in conducting its business. The payment of dividends, depending upon the financial condition of the bank in question, could be deemed to constitute an unsafe or unsound practice. The ability of the Bank to pay dividends in the future may be influenced by bank regulatory policies and capital guidelines.
Regulatory Capital Requirements
Information concerning the compliance of the Company and the Bank with respect to capital requirements is incorporated by reference from Note 14, “Shareholders’ Equity and Regulatory Capital,” of the “Notes to Consolidated Financial Statements” included under Item 8 of this report, and from the “Capital Adequacy and Regulatory Matters” section of the “Management’s Discussion and Analysis of Consolidated Financial Condition and Results of Operations,” included under Item 7 of this report.
5
Basel III Capital Rules
Effective January 1, 2015, the Company and the Bank became subject to the Basel III Capital Rules, which substantially revised the risk-based capital requirements in comparison to the previously effective U.S. risk-based capital rules. The Basel III Capital Rules, among other things, (i) introduced a new capital measure called “Common Equity Tier 1” (“CET1”), (ii) increased the minimum requirements for Tier 1 Capital ratio as well as the minimum levels to be considered well capitalized under prompt corrective action; (iii) and introduced the "capital conservation buffer”, designed to absorb losses during periods of economic stress. Institutions with a ratio of CET1 to risk-weighted assets above the minimum but below the conservation buffer are subject to constraints on dividends, equity repurchases and discretionary bonuses to executive officers based on the amount of the shortfall.
Under the previously effective capital standards, the effects of accumulated other comprehensive income (“AOCI”) items included in capital were excluded for the purposes of determining regulatory capital ratios. Under the Basel III Capital Rules, the effects of certain accumulated other comprehensive items are generally included in the calculation of CET1 and thus of Tier 1 capital. However, banking organizations were given a one-time option to permanently opt out of the requirement to include most components of AOCI, including unrealized gains or losses on certain securities available for sale, in CET1. The Company and Bank made the one-time permanent election to opt out, with the result that most AOCI items will be treated for regulatory capital purposes in the same manner in which they were under the previously effective capital rules.
The Basel III Capital Rules provide for a number of deductions from and adjustments to CET1. These include, for example, the requirement that mortgage servicing rights, deferred tax assets dependent upon future taxable income and significant investments in non-consolidated financial entities be deducted from CET1 to the extent that any one such category exceeds 10% of CET1 or all such categories in the aggregate exceed 15% of CET1.
Implementation of the deductions and other adjustments to CET1 began on January 1, 2015 and will be phased-in over a 4-year period (beginning at 40% on January 1, 2015 and an additional 20% per year thereafter until fully phased-in at January 1, 2018). The implementation of the capital conservation buffer will begin on January 1, 2016 at the 0.625% level and be phased in over a four-year period (increasing by that amount on each subsequent January 1, until it reaches 2.5% on January 1, 2019).
When fully phased in on January 1, 2019, the Basel III Capital Rules will require the Company and Bank to maintain (i) a minimum ratio of CET1 to risk-weighted assets of at least 4.5%, plus a 2.5% “capital conservation buffer” (which is added to the 4.5% CET1 ratio as that buffer is phased in, effectively resulting in a minimum ratio of CET1 to risk-weighted assets of at least 7% upon full implementation), (ii) a minimum ratio of Tier 1 capital to risk-weighted assets of at least 6.0%, plus the capital conservation buffer (which is added to the 6.0% Tier 1 capital ratio as that buffer is phased in, effectively resulting in a minimum Tier 1 capital ratio of 8.5% upon full implementation), (iii) a minimum ratio of Total capital (that is, Tier 1 plus Tier 2) to risk-weighted assets of at least 8.0%, plus the capital conservation buffer (which is added to the 8.0% total capital ratio as that buffer is phased in, effectively resulting in a minimum total capital ratio of 10.5% upon full implementation) and (iv) a minimum leverage ratio of 4%, calculated as the ratio of Tier 1 capital to average assets.
The aforementioned capital conservation buffer is designed to absorb losses during periods of economic stress. Banking institutions with a ratio of CET1 to risk-weighted assets above the minimum but below the conservation buffer are subject to constraints on dividends, equity repurchases and discretionary bonuses to executive officers based on the amount of the shortfall.
Under the Basel III Capital Rules, the minimum capital ratios effective as of January 1, 2015 are as follows:
|
•
|
4.5% CET1 to risk-weighted assets;
|
|
•
|
6.0% Tier 1 capital to risk-weighted assets;
|
|
•
|
8.0% Total capital to risk-weighted assets; and
|
|
•
|
4.0% Tier 1 capital to average assets.
|
With respect to the Bank, the Basel III Capital Rules also revise the “prompt corrective action” regulations pursuant to Section 38 of the FDIA, by (i) introducing a CET1 ratio requirement at each level (other than critically undercapitalized), with the required CET1 ratio being 6.5% for well-capitalized status; (ii) increasing the minimum Tier 1 capital ratio requirement for each category (other than critically undercapitalized), with the minimum Tier 1 capital ratio for well-capitalized status being 8% (as compared to the previous 6%), and (iii) eliminating the provision of the former regulation that provides that a bank with a composite supervisory rating of 1 may have a 3% leverage ratio and still be adequately capitalized. The Basel III Capital Rules do not change the total risk-based capital requirement for any prompt corrective action category.
6
The Basel III Capital Rules prescribe a standardized approach for risk weightings that expands the risk-weighting categories from the four categories of the previous capital standards (0%, 20%, 50% and 100%) to a much larger and more risk-sensitive number of categories, depending on the nature of the assets, generally ranging from 0% for U.S. government and agency securities, to 600% for certain equity exposures, and resulting in higher risk weights for a variety of asset categories. Significant changes to the previously effective capital rules that will impact the Company’s determination of risk-weighted assets include, among other things:
|
•
|
Greater restrictions on the amount of deferred tax assets that can be included in CET1 capital with assets relating to net operating loss and credit carry forwards being excluded, and a 10% - 15% limitation on deferred tax assets arising from temporary differences that cannot be realized through net operating loss carry backs.
|
|
•
|
Applying a 150% risk weight for certain high volatility commercial real estate acquisition, development and construction loans, compared to 100% risk weight previously in place;
|
|
•
|
Assigning a 150% risk weight to exposures (other than residential mortgage exposures) that are 90 days past due or in nonaccrual status, compared to 100% risk weight previously in place; and
|
|
•
|
Providing for a 20% credit conversion factor for the unused portion of a commitment with an original maturity of one year or less that is not unconditionally cancellable, compared to 0% previously in place.
|
Consumer Financial Protection Bureau
The Dodd-Frank Act created an independent regulatory body, the Consumer Financial Protection Bureau (“Bureau”), with authority and responsibility to set rules and regulations for most consumer protection laws applicable to all banks, including the Company. The Bureau has responsibility for mortgage reform and enforcement, as well as broad new powers over consumer financial activities which could impact what consumer financial services would be available and how they are provided.
In late 2012, the Bureau formed a Community Bank Advisory Council. Representatives were drawn from small-to-medium-sized community banks to engage in discussions on how smaller institutions help level the playing field for consumers experiencing difficulty in managing their money and what opportunities and challenges exist in mortgage lending for small institutions. The Bureau has developed prototype designs for various disclosures and agreements and invited the public and financial industry to review and comment on what works. Their website (www.consumerfinance.gov) serves as a public information resource on laws and regulations, provides assistance with financial questions, invites participation with projects or initiatives, and serves as a resource for submission of complaints. The Bureau has positioned itself to serve as a resource for submission of complaints and to provide help to consumers with complaints regarding credit cards, mortgages, student loans, checking accounts, savings accounts, credit reporting, bank services, and other consumer loans. Guidance and consumer tips on various financial topics have been issued since 2012 in blogs on the Bureau’s website.
Significant final mortgage rules were issued by the Bureau in January 2013, most with mandatory effective dates in January 2014. These rules were mandated by the Dodd-Frank Act provisions enacted in response to the breakdown in the mortgage lending markets and to provide for consumer protections. The following rules are intended to address problems consumers face in the three major steps in buying a home – shopping for a mortgage, closing on a mortgage, and paying off a mortgage.
Ability-to-Repay (“ATR”) and Qualified Mortgage (“QM”) rules were designed to address concerns that residential mortgage borrowers received loans for which they had no ability to repay. The ATR final rule requires a creditor to make “a reasonable and good faith determination at or before closing that the consumer will have a reasonable ability, at the time of consummation, to repay the loan, according to its terms, including any mortgage-related obligations.” The ATR standards require consideration of eight specific underwriting factors. Information used must be documented and verified using reasonably reliable third-party records. The ATR rule provides for a wide variety of documents and sources of information that can be used and relied on to determine ATR. In addition, the ATR rules included provisions that create a legal advantage for lenders for loans that are qualified mortgages. A QM must have a fully amortizing payment, have a term of 30 years or less, and not have points and fees that exceed certain thresholds depending on the total loan amount. Safe Harbor QM loans are lower priced loans that meet QM requirements. Loans satisfying the QM requirements will be entitled to liability protection from damage claims and defenses by borrowers based on an asserted failure to meet ATR requirements. Rebuttable Presumption QM loans are higher-priced loans that meet QM requirements and provide liability protection to a lesser degree from damage claims and defense by borrowers based on asserted failure to meet ATR requirements.
In November 2013, the Bureau issued a final rule on integrated mortgage disclosures under the Truth in Lending Act and the Real Estate Settlement Procedures Act, compliance with which was required by October 3, 2015. The Bank has devoted significant resources to implement the changes required to comply with the new disclosure requirements.
7
Loan servicing has become a key focus, especially when loan workouts and modifications are involved. New mortgage servicing rules effective in January 2014 implement new provisions regarding servicing standards. These new standards seek to ensure similar borrowers who default or become delinquent are treated in a similar, consistent manner. The Bank presently services 5,000 or fewer mortgage loans which it owns or originated, so it is considered a “Small Servicer” and is exempt from certain parts of the Mortgage Servicing Rules. The mortgage servicing requirements applicable to the Bank’s servicing operations under the new mortgage servicing rules are as follows: 1) adjustable rate mortgage interest rate adjustment notices; 2) prompt payment crediting and payoff statements; 3) limits on force-placed insurance; 4) responses to written information requests and complaints of errors; and 5) loss mitigation with regard to the first notice or filing for a foreclosure and no foreclosure proceedings if a borrower is performing pursuant to the terms of a loss mitigation agreement.
Other Federal Laws and Regulations
The Company’s operations are subject to additional federal laws and regulations applicable to financial institutions, including, without limitation:
|
•
|
Privacy provisions of the Gramm-Leach-Bliley Act and related regulations, which require us to maintain privacy policies intended to safeguard customer financial information, to disclose the policies to our customers and to allow customers to “opt out” of having their financial service providers disclose their confidential financial information to non-affiliated third parties, subject to certain exceptions;
|
|
•
|
Right to Financial Privacy Act, which imposes a duty to maintain confidentiality of consumer financial records and prescribes procedures for complying with administrative subpoenas of financial records;
|
|
•
|
Consumer protection rules for the sale of insurance products by depository institutions, adopted pursuant to the requirements of the Gramm-Leach-Bliley Act; and the
|
|
•
|
USA PATRIOT Act, which requires financial institutions to take certain actions to help prevent, detect and prosecute international money laundering and the financing of terrorism.
|
Future Legislation and Regulation
Changes to the laws and regulations in the states where the Company and the Bank do business can affect the operating environment of both the Company and the Bank in substantial and unpredictable ways. The Company cannot accurately predict whether those changes in laws and regulations will occur, and, if those changes occur, the ultimate effect they would have upon the financial condition or results of operations of the Company. This is also true of federal legislation.
NASDAQ Capital Market
The Company’s common stock is listed on The NASDAQ Capital Market under the trading symbol “ORRF” and is subject to NASDAQ’s rules for listed companies.
Forward Looking Statements
Additional information concerning the Company and the Bank with respect to forward looking statements is incorporated by reference from the “Caution About Forward Looking Statements” section of the “Management’s Discussion and Analysis of Financial Condition and Results of Operations,” included in this report under Item 7.
Competition
The Bank’s principal market area consists of Cumberland County, Franklin County, Lancaster County, and Perry County, Pennsylvania, and Washington County, Maryland. The Bank services a substantial number of depositors in this market area and contiguous counties, with the greatest concentration in Chambersburg, Shippensburg, and Carlisle, Pennsylvania and the surrounding areas.
The Bank, like other depository institutions, has been subjected to competition from less heavily regulated entities such as credit unions, brokerage firms, money market funds, consumer finance and credit card companies, and other commercial banks, many of which are larger than the Bank. The principal methods of competing effectively in the financial services industry include improving customer service through the quality and range of services provided, improving efficiencies and pricing services competitively. The Bank is competitive with the financial institutions in its service areas with respect to interest rates paid on time and savings deposits, service charges on deposit accounts and interest rates charged on loans.
8
The Bank continues to implement strategic initiatives focused on expanding our core businesses and to explore, on an ongoing basis, acquisition, divestiture, and joint venture opportunities to the extent permitted by our regulators. We analyze each of our products and businesses in the context of shareholder return, customer demands, competitive advantages, industry dynamics, and growth potential.
Our financial condition and results of operations may be adversely affected by various factors, many of which are beyond our control. These risk factors include, but are not limited to, the following:
Risks Related to Credit
The Company may be required to make further increases in the provisions for loan losses and to charge off additional loans in the future, which could materially adversely affect it.
There is no precise method of predicting loan losses and the required level of reserves, and related provision for loan losses, can fluctuate from year to year, based on charge-offs and/or recoveries, loan volume, credit administration practices, and local and national economic conditions, among other factors. For
2015
, we recorded a negative provision for loan losses of
$603,000
. The Company recorded net charge-offs of
$576,000
in
2015
compared to net charge-offs of
$2,318,000
in
2014
. Risk elements, including nonperforming loans, troubled debt restructurings still accruing, loans greater than 90 days past due still accruing, and other real estate owned totaled
$18,084,000
at
December 31, 2015
. The allowance for loan losses, which is a reserve established through a provision for loan losses charged to expense, represents management’s best estimate of probable incurred losses within the existing portfolio of loans. The level of the allowance reflects management’s evaluation of, among other factors, the status of specific impaired loans, trends in historical loss experience, delinquency, credit concentrations and economic conditions within our market area. The determination of the appropriate level of the allowance for loan losses inherently involves a high degree of subjectivity and judgment and requires us to make significant estimates of current credit risks and future trends, all of which may undergo material changes. Changes in economic conditions affecting borrowers, new information regarding existing loans, identification of additional problem loans and other factors, both within and outside of our control, may require us to increase our allowance for loan losses.
In addition, bank regulatory agencies periodically review our allowance for loan losses and may require us to increase the provision for loan losses or to recognize further loan charge-offs, based on judgments that differ from those of management. If loan charge-offs in future periods exceed the allowance for loan losses, there could be a need to record additional provisions to increase our allowance for loan losses. Furthermore, growth in the loan portfolio would generally lead to an increase in the provision for loan losses. Generally, increases in our allowance for loan losses will result in a decrease in net income and stockholders’ equity, and may have a material adverse effect on the financial condition of the Company, results of operations and cash flows.
The allowance for loan losses was
1.74%
of total loans and
78%
of nonaccrual and restructured loans still accruing at
December 31, 2015
, compared to
2.09%
of total loans and
95%
of nonaccrual and restructured loans still accruing at
December 31, 2014
. Material additions to the allowance could materially decrease our net income. In addition, at
December 31, 2015
, the top 25 lending relationships individually had commitments of approximately
$356,300,000
, and an aggregate total outstanding loan balance of
$298,427,000
, or
38%
of the loan portfolio. The deterioration of one or more of these loans could result in a significant increase in the nonperforming loans and the provisions for loan losses, which would negatively impact our results of operations.
Commercial real estate lending may expose us to a greater risk of loss and impact our earnings and profitability.
Our business strategy involves making loans secured by commercial real estate. These types of loans generally have higher risk-adjusted returns and shorter maturities than other loans. Loans secured by commercial real estate properties are generally for larger amounts and may involve a greater degree of risk than other loans. Payments on loans secured by these properties are often dependent on the income produced by the underlying properties which, in turn, depends on the successful operation and management of the properties. Accordingly, repayment of these loans is subject to conditions in the real estate market or the local economy. Because of the current challenging economic environment, these loans represent higher risk, could result in an increase in our total net-charge offs and could require us to increase our allowance for loan losses, which could have a material adverse effect on our financial condition or results of operations. While we seek to minimize these risks in a variety of ways, there can be no assurance that these measures will protect against credit-related losses.
9
Almost 10% of our loan portfolio consists of commercial and industrial loans. The credit risk related to these types of loans is greater than the risk related to residential loans.
Our commercial and industrial loan portfolio grew by $24.6 million, or approximately 50%, during the year ended December 31, 2015 to $73.6 million at December 31, 2015. Commercial and industrial loans generally carry larger loan balances and involve a greater degree of risk of nonpayment or late payment than home equity loans or residential mortgage loans.
Commercial and industrial loans include advances to local and regional businesses for general commercial purposes and include permanent and short-term working capital, machinery and equipment financing, and may be either in the form of lines of credit or term loans. Although commercial and industrial loans may be unsecured to our highest rated borrowers, the majority of these loans are secured by the borrower’s accounts receivable, inventory and machinery and equipment. In a significant number of these loans, the collateral also includes the business real estate or the business owner’s personal real estate or assets. Commercial and industrial loans present credit exposure to the Company, as they are more susceptible to risk of loss during a downturn in the economy, as borrowers may have greater difficulty in meeting their debt service requirements and the value of the collateral may decline. The Company attempts to mitigate this risk through its underwriting standards, including evaluating the credit worthiness of the borrower and to the extent available, credit ratings on the business. Additionally, monitoring of the loans through annual renewals and meetings with the borrowers are typical. However, these procedures cannot eliminate the risk of loss associated with commercial and industrial lending.
Our commercial and industrial lending operations are located primarily in South Central Pennsylvania and in Washington County, Maryland. Our borrowers’ ability to repay these loans depend largely on economic conditions in these and surrounding areas. A deterioration in the economic conditions in these market areas could materially adversely affect our operations and increase loan delinquencies, increase problem assets and foreclosures, increase claims and lawsuits, decrease the demand for our products and services and decrease the value of collateral securing loans.
Risks Related to Interest Rates and Investments
Changes in interest rates could adversely impact the Company’s financial condition and results of operations.
Operating income, net income and liquidity depend to a great extent on our net interest margin, i.e., the difference between the interest yields we receive on loans, securities and other interest earning assets and the interest rates we pay on interest-bearing deposits, borrowings and other liabilities. These rates are highly sensitive to many factors beyond our control, including competition, general economic conditions and monetary and fiscal policies of various governmental and regulatory authorities, including the FRB. If the rate of interest we pay on our interest-bearing deposits, borrowings and other liabilities increases more than the rate of interest we receive on loans, securities and other interest earning assets, our net interest income, and therefore our earnings, and liquidity could be materially adversely affected. Our earnings and liquidity could also be materially adversely affected if the rates on our loans, securities and other investments fall more quickly than those on our deposits, borrowings and other liabilities. Our operations are subject to risks and uncertainties surrounding our exposure to changes in the interest rate environment.
Additionally, based on an analysis of the interest rate sensitivity of the Company’s assets, an increase in the general level of interest rates will negatively affect the market value of the investment portfolio because of the relatively long duration of certain securities included in the investment portfolio.
Changes in interest rates also can affect: (1) the ability to originate loans; (2) the value of interest-earning assets, which would negatively impact stockholders’ equity, and the ability to realize gains from the sale of such assets; (3) the ability to obtain and retain deposits in competition with other available investment alternatives; and (4) the ability of borrowers to repay adjustable or variable rate loans.
Risks Related to Competition and to Our Business Strategy
Difficult economic and market conditions have adversely affected the financial services industry and may continue to materially and adversely affect the Company.
We are operating in a volatile economic environment, including generally uncertain global, national and local conditions. Additional concerns from some of the countries in the European Union, Russian Federation, China and elsewhere have also strained the financial markets both abroad and domestically. Although there has been some improvement in the overall global macroeconomic conditions in
2015
, financial institutions continue to be affected by conditions in the real estate market and the constrained financial markets. In recent years, declines in the housing market, increases in unemployment and under-employment have negatively impacted the credit performance of loans and resulted in significant write-downs of asset values by financial institutions, including the Bank. While the Company saw continued improvement in
2015
, a worsening of
10
economic conditions, or a prolonged inconsistent recovery, may further impact the Bank’s results of operations and financial condition. In particular, we may face the following risks in connection with these events:
|
•
|
Loan delinquencies could increase further;
|
|
•
|
Problem assets and foreclosures could increase further;
|
|
•
|
Demand for our products and services could decline;
|
|
•
|
Collateral for loans made by us, especially real estate, could decline further in value, in turn reducing a customer’s borrowing power, and reducing the value of assets and collateral associated with our loans.
|
As these conditions or similar ones continue to exist or worsen, we may experience continuing or increased adverse effects on our financial condition and results of operations.
Because our business is concentrated in South Central Pennsylvania and Washington County, Maryland, our financial performance could be materially adversely affected by economic conditions and real estate values in these market areas.
Our operations and the properties securing our loans are primarily located in South Central Pennsylvania and in Washington County, Maryland. Our operating results depend largely on economic conditions and real estate valuations in these and surrounding areas. A deterioration in the economic conditions in these market areas could materially adversely affect our operations and increase loan delinquencies, increase problem assets and foreclosures, increase claims and lawsuits, decrease the demand for our products and services and decrease the value of collateral securing loans, especially real estate, in turn reducing customers’ borrowing power, the value of assets associated with nonperforming loans and collateral coverage.
Competition from other banks and financial institutions in originating loans, attracting deposits and providing various financial services may adversely affect profitability and liquidity.
We experience substantial competition in originating loans, both commercial and consumer loans, in our market area. This competition comes principally from other banks, savings institutions, credit unions, mortgage banking companies and other lenders. Some of our competitors enjoy advantages, including greater financial resources, and higher lending limits, a wider geographic presence, more accessible branch office locations, the ability to offer a wider array of services or more favorable pricing alternatives, as well as lower origination and operating costs. This competition could reduce our net income and liquidity by decreasing the number and size of loans that we originate and the interest rates we are able to charge on these loans.
In attracting business and consumer deposits, we face substantial competition from other insured depository institutions such as banks, savings institutions and credit unions, as well as institutions offering uninsured investment alternatives, including money market funds. Some of our competitors enjoy advantages, including more aggressive marketing campaigns, better brand recognition and more branch locations. These competitors may offer higher interest rates than we do, which could decrease the deposits that we attract or require us to increase our rates to retain existing deposits or attract new deposits. Increased deposit competition could materially adversely affect our ability to generate the funds necessary for lending operations. As a result, we may need to seek other sources of funds that may be more expensive to obtain and could increase our cost of funds.
The Company’s business strategy includes the continuation of moderate growth plans, and our financial condition and results of operations could be negatively affected if we fail to grow or fail to manage our growth effectively.
In 2015, loans grew $76,767,000, or 10.9% from $704,946,000 at January 1, 2015, to $781,713,000 at December 31, 2015, due to organic growth through increases in consumer, commercial and commercial real estate loans. Over the long term, we expect to continue to experience growth in loans and total assets, the level of our deposits and the scale of our operations. Achieving our growth targets requires us to successfully execute our business strategies, which include continuing to grow our loan portfolio. Our ability to successfully grow will also depend on the continued availability of loan opportunities that meet underwriting standards. In addition, since our asset quality metrics have returned closer to historical levels, we may consider the acquisition of other financial institutions and branches within or outside of our market area to the extent permitted by our regulators, the success of which will depend on a number of factors, including our ability to integrate the acquired institutions or branches into the current operations of the Company, our ability to limit the outflow of deposits held by customers of the acquired institution or branch locations, our ability to control the incremental increase in non-interest expense arising from any acquisition and our ability to retain and integrate the appropriate personnel of the acquired institution or branches. We believe we have the resources and internal systems in place to successfully achieve and manage our future growth. If we do not manage our growth effectively, we may not be able to achieve our business plan, and our business and prospects could be harmed.
11
The Company may be adversely affected by technological advances.
Technological advances impact our business. The banking industry is undergoing technological changes with frequent introductions of new technology-driven products and services. In addition to improving customer services, the effective use of technology increases efficiency and enables financial institutions to reduce costs. Our future success may depend, in part, on our ability to address the needs of our current and prospective customers by using technology to provide products and services that will satisfy demands for convenience as well as to create additional efficiencies in operations.
The Company may not be able to attract and retain skilled people.
The Company’s success depends, in large part, on our ability to attract and retain skilled people. We have experienced turnover among our senior officers. Competition for the best people in most activities engaged in by us can be intense, and we may not be able to attract and hire sufficiently skilled people to fill open and newly created positions or to retain current or future employees. An inability to attract and retain individuals with the necessary skills to fill open positions, or the unexpected loss of services of one or more of our key personnel, could have a material adverse impact on our business due to the loss of their skills, knowledge of our markets, years of industry experience or the difficulty of promptly finding qualified replacement personnel.
An interruption or breach in security with respect to our information system, or our outsourced service providers, could adversely impact the Company’s reputation and have an adverse impact on our financial condition or results of operations.
Information systems are critical to our business. We use various technological systems to manage our customer relationships, general ledger, securities investments, deposits and loans. We rely on software, communication, and information exchange on a variety of computing platforms and networks and over the internet. We have established policies and procedures in place to prevent or limit the effect of system failures, interruptions and security breaches, but we cannot be certain that all of our systems are entirely free from vulnerability to attack or other technological difficulties or failures. In addition, any compromise of our systems could deter customers from using our products and services. Although we rely on security systems to provide security and authentication necessary to effect the secure transmission of data, these precautions may not protect our systems from security breaches.
We rely on the services of a variety of vendors to meet our data processing and communication needs. If these third-party providers encounter difficulties, or if we have difficulty communicating with them, our ability to adequately process and account for transactions could be affected, and our business operations could be adversely affected. Threats to information security also exist in the processing of customer information through various other vendors and their personnel.
If information security is breached or other technology difficulties or failures occur, information may be lost or misappropriated, services and operations may be interrupted and we could be exposed to claims from customers. Any of these results could have a material adverse effect on our financial condition, results of operations or liquidity.
We could be adversely affected by failure in our internal controls
.
A failure in our internal controls could have a significant negative impact not only on our earnings, but also on the perception that customers, regulators and investors may have of us. We continue to devote a significant amount of effort and resources to continually strengthening our controls and ensuring compliance with complex accounting standards and banking regulations.
Risks Related to Regulatory Compliance and Legal Matters
Governmental regulation and regulatory actions against us may impair our operations or restrict our growth.
The Company is subject to regulation and supervision under federal and state laws and regulations. The requirements and limitations imposed by such laws and regulations limit the manner in which we conduct our business, undertake new investments and activities and obtain financing. These regulations are designed primarily for the protection of the deposit insurance funds and consumers and not to benefit our shareholders. Financial institution regulation has been the subject of significant legislation in recent years and may be the subject of further significant legislation in the future, none of which is within our control. Federal and state regulatory agencies also frequently adopt changes to their regulations or change the manner in which existing regulations are applied or enforced. The Company cannot predict the substance or impact of pending or future legislation, regulation or the application thereof. Compliance with such current and potential regulation and scrutiny may significantly increase our costs, impede the efficiency of our internal business processes, require us to increase our regulatory capital and limit our ability to pursue business opportunities in an efficient manner. Bank regulations can hinder our ability to compete with financial services companies that are not regulated in the same manner or are subject to less regulation.
12
The Dodd-Frank Wall Street Reform and Consumer Protection Act may affect the Company’s financial condition, results of operations, liquidity and stock price.
On July 21, 2010, the Dodd-Frank Act was signed into law. The Dodd-Frank Act includes provisions affecting large and small financial institutions, including several provisions that will profoundly affect how community banks and bank holding companies will be regulated in the future. Among other things, these provisions relax rules regarding interstate branching, allow financial institutions to pay interest on business checking accounts, change the scope of federal deposit insurance coverage and impose new capital requirements on bank holding companies. Many of the requirements called for in the Dodd-Frank Act will be implemented over time and most will be subject to implementing regulations over the course of several years. Given the uncertainty associated with the manner in which the provisions of the Dodd-Frank Act will be implemented by the various regulatory agencies and through regulations, the full extent of the impact such requirements will have on our operations is unclear.
The Dodd-Frank Act also created the Consumer Financial Protection Bureau with broad powers to supervise and enforce consumer protection laws. The Consumer Financial Protection Bureau has broad rule-making authority for a wide range of consumer protection laws that apply to all banks and savings institutions including the authority to prohibit “unfair, deceptive or abusive” acts and practices. The Consumer Financial Protection Bureau has examination and enforcement authority over all banks and savings institutions with more than $10 billion in assets. Banks and savings institutions with $10 billion or less in assets will be examined by their applicable bank regulators.
The Company may be required to invest significant management attention and resources to evaluate and make any changes necessary to comply with new statutory and regulatory requirements under the Dodd-Frank Act. Failure to comply with the new requirements may negatively impact our results of operations and financial condition. While the Company cannot predict what effect any presently contemplated or future changes in the laws or regulations or their interpretations would have on us, these changes could be materially adverse to our investors.
Increases in FDIC insurance premiums may have a material adverse effect on our results of operations.
Market developments significantly depleted the insurance fund of the FDIC and reduced the ratio of reserves to insured deposits. As a result, the Company may be required to pay significantly higher premiums or additional special assessments or taxes that could adversely affect earnings. We are generally unable to control the amount of premiums that are required to be paid for FDIC insurance. If there are additional bank or financial institution failures, the Company may be required to pay even higher FDIC premiums than the levels currently imposed. Any future increases or required prepayments in FDIC insurance premiums may materially adversely affect the results of operations.
Changes in assessment rates of the Pennsylvania Bank Shares Tax, a tax calculated on the outstanding equity of the Bank, may have a material adverse effect on our results of operations.
The Government of the Commonwealth of Pennsylvania has yet to agree on a budget for the fiscal year 2015-2016, and forecast revenues generated are not sufficient to meet forecast expenditures. One tax subject to continue deliberation, which the Bank is currently subject to, is the Pennsylvania Bank Shares Tax. This tax is currently assessed at 0.89% of eligible capital. As part of the budget negotiation, the assessment rate has been discussed as one which may be increased to cover the deficiency in the Commonwealth's budget. If this assessment rate on the Pennsylvania Bank Shares tax is increased, including possible retroactive assessments, it may materially adversely affect the results of operations.
The Company is required to make a number of judgments in applying accounting policies and different estimates and assumptions in the application of these policies could result in a decrease in capital and/or other material changes to the reports of financial condition and results of operations.
Material estimates that are particularly susceptible to significant change relate to the determination of the allowance for loan losses, accounting for income taxes and the ability to recognize the deferred tax asset, and the fair value of certain financial instruments, in particular securities. While we have identified those accounting policies that are considered critical and have procedures in place to facilitate the associated judgments, different assumptions in the application of these policies could result in a decrease to net income and, possibly, capital and may have a material adverse effect on our financial condition and results of operations.
Changes in accounting standards could impact the Company's financial condition and results of operations.
The accounting standard setters, including the Financial Accounting Standards Board ("FASB"), the SEC and other regulatory bodies, periodically change the financial accounting and reporting standards that govern the preparation of the Company’s consolidated financial statements. These changes, including a significant proposal which would change the accounting for the determination of the allowance for loan losses from a probable loss to an expected loss model, can be hard to predict and can materially impact how the Company records and reports its financial condition and results of operations. In
13
some cases, the Company could be required to apply a new or revised standard retroactively, which would result in the restating of the Company’s prior period financial statements.
The short-term and long-term impact of the changing regulatory capital requirements and new capital rules is uncertain.
The Basel III Capital Rules which became effective for the Company and Bank on January 1, 2016, established a new comprehensive capital framework for U.S. banking organizations, including community banks, which also incorporate provisions of the Dodd-Frank Act. The Basel III Capital Rules substantially revised the risk-based capital requirements applicable to bank holding companies and depository institutions, compared to the previously effective U.S. risk-based capital rules. The Basel III Capital Rules define the components of capital and address other issues affecting the numerator in banking institutions’ regulatory capital ratios, address risk weights and other issues affecting the denominator in banking institutions’ regulatory capital ratios and replace the current risk-weighting approach.
The application of more stringent capital requirements to the Company and the Bank could, among other things, result in lower returns on invested capital, result in the need for additional capital, and result in regulatory actions if we were to be unable to comply with such requirements. Furthermore, the imposition of liquidity requirements in connection with the implementation of Basel III could result in our having to lengthen the term of our funding, restructure our business models, and/or increase our holdings of liquid assets. Implementation of changes to asset risk weightings for risk based capital calculations, items included or deducted in calculating regulatory capital and/or additional capital conservation buffers could result in management modifying its business strategy and could limit our ability to make distributions, including paying out dividends or buying back shares.
Pending litigation and legal proceedings and the impact of any finding of liability or damages could adversely impact the Company and its financial condition and results of operations.
As set forth in Part I, Item 3 - Legal Proceedings, of this Annual Report on Form 10-K, the allegations of Southeastern Pennsylvania Transportation Authority's ("SEPTA") proposed second amended complaint disclosed the existence of a confidential, non-public, fact-finding inquiry regarding the Company being conducted by the SEC. In cooperating fully with the SEC in connection with the inquiry, the Company has incurred, and will continue to incur, significant additional noninterest expenses for professional services such as legal fees. See “Noninterest Expenses" in Management’s Discussion and Analysis of Financial Condition and Results of Operations - Results of Operations" as discussed in Part II, Item 7. The SEC’s inquiry is not an indication that the SEC believes the Company or anyone else has violated federal securities laws or regulations. Nor does it mean that the SEC has a negative opinion of any person, entity, or security. If the SEC determines that there were violations of federal securities laws, the SEC could bring enforcement actions and/or monetary fines against the Company or certain individual former or current employees or directors of the Company, or administrative proceedings against the Company or its former or current employees or directors.
Risks Related to Liquidity
The Company is a holding company dependent for liquidity on payments from the Bank, its sole subsidiary, which is subject to restrictions.
The Company is a holding company and depends on dividends, distributions and other payments from the Bank to fund dividend payments and stock repurchases, if permitted, and to fund all payments on obligations. The Bank is subject to laws that restrict dividend payments or authorize regulatory bodies to block or reduce the flow of funds from it to us. In addition, our right to participate in a distribution of assets upon the Bank’s liquidation or reorganization is subject to the prior claims of the Bank’s creditors.
The soundness of other financial institutions could adversely affect the Company.
Our ability to engage in routine funding and other transactions could be adversely affected by the actions and commercial soundness of other financial institutions. Financial services institutions are interrelated as a result of trading, clearing, counterparty or other relationships. As a result, defaults by, or even rumors or questions about, one or more financial services institutions, or the financial services industry generally, have historically led to market-wide liquidity problems, losses of depositor, creditor and counterparty confidence and could lead to losses or defaults by us or by other institutions. We could experience increases in deposits and assets as a result of other banks’ difficulties or failure, which would increase the capital we need to support such growth.
14
Risks Related to Owning our Stock
If the Company wants to, or is compelled to, raise additional capital in the future, that capital may not be available when it is needed and on terms favorable to current shareholders.
Federal banking regulators require us and our banking subsidiary to maintain adequate levels of capital to support our operations. These capital levels are determined and dictated by law, regulation and banking regulatory agencies. In addition, capital levels are also determined by our management and board of directors based on capital levels that, they believe, are necessary to support our business operations. At
December 31, 2015
, all four capital ratios for us and our banking subsidiary were above regulatory minimum levels to be deemed “well capitalized” under current bank regulatory guidelines. To be “well capitalized,” banking companies generally must maintain a tier 1 leverage ratio of at least 5.0%, CET1 capital ratio of 6.5%, Tier 1 risk-based capital ratio of at least 8.0%, and a total risk-based capital ratio of at least 10.0%. In addition, beginning January 1, 2016, the implementation of the capital conservation buffer included in the Basel III capital rules will begin at the 0.625% level and will be phased in over a four-year period (increasing by that amount on each January 1, until it reaches 2.5% on January 1, 2019), resulting in additional capital that will be required of the Bank.
The Company’s ability to raise additional capital will depend on conditions in the capital markets at that time, which are outside of our control, and on our financial performance. Accordingly, we cannot assure you of our ability to raise additional capital on terms and time frames acceptable to us or to raise additional capital at all. Additionally, the inability to raise capital in sufficient amounts may adversely affect our operations, financial condition and results of operations. Our ability to borrow could also be impaired by factors that are nonspecific to us, such as severe disruption of the financial markets or negative news and expectations about the prospects for the financial services industry as a whole as evidenced by recent turmoil in the domestic and worldwide credit markets. If we raise capital through the issuance of additional shares of our common stock or other securities, we would likely dilute the ownership interests of current investors and the price at which we issue additional shares of stock could be less than the current market price of our common stock and, thus, could dilute the per share book value and earnings per share of our common stock. Furthermore, a capital raise through the issuance of additional shares may have an adverse impact on our stock price.
The market price of our common stock has been subject to volatility.
The market price of the Company’s common stock has been subject to fluctuations in response to numerous factors, many of which are beyond our control. These factors include actual or anticipated variations in our operational results and cash flows, changes in financial estimates by securities analysts, trading volume, large purchases or sales of our common stock, market conditions within the banking industry, the general state of the securities markets and the market for stocks of financial institutions, as well as general economic conditions.
None.
15
The Bank owns and leases properties in Cumberland, Franklin, Lancaster and Perry Counties, Pennsylvania and Washington County, Maryland as branch banking offices and an operations center. The Company and the Bank maintain headquarters at the Bank’s King Street Office in Shippensburg, Pennsylvania. A summary of these properties is as follows:
|
Office and Address
|
Acquired/Built
|
Office and Address
|
Acquired/Built
|
|
|
Properties Owned
|
Properties Owned (continued)
|
|||
|
Orrstown Office
|
1919
|
Lincoln Way East Office
|
2004
|
|
|
3580 Orrstown Road
|
1725 Lincoln Way East
|
|||
|
Orrstown, PA 17244
|
Chambersburg, PA 17202
|
|||
|
Lurgan Avenue Office
|
1981
|
Duncannon Office
|
2006
|
|
|
121 Lurgan Avenue
|
403 North Market Street
|
|||
|
Shippensburg, PA 17257
|
Duncannon, PA 17020
|
|||
|
King Street Office
|
1986
|
Greencastle Office
|
2006
|
|
|
77 E. King Street
|
308 Carolle Street
|
|||
|
Shippensburg, PA 17257
|
Greencastle, PA 17225
|
|||
|
Stonehedge Office
|
1994
|
New Bloomfield Office
|
2006
|
|
|
427 Village Drive
|
1 South Carlisle Street
|
|||
|
Carlisle, PA 17015
|
New Bloomfield, PA 17068
|
|||
|
Path Valley Office
|
1995
|
Newport Office
|
2006
|
|
|
16400 Path Valley Road
|
Center Square
|
|||
|
Spring Run, PA 17262
|
Newport, PA 17074
|
|||
|
Norland Avenue Office
|
1997
|
Red Hill Office
|
2006
|
|
|
625 Norland Avenue
|
18 Newport Plaza
|
|||
|
Chambersburg, PA 17201
|
Newport, PA 17074
|
|||
|
Silver Spring Office
|
2000
|
Simpson Street Office
|
2006
|
|
|
3 Baden Powell Lane
|
1110 East Simpson Street
|
|||
|
Mechanicsburg, PA 17050
|
Mechanicsburg, PA 17055
|
|||
|
North Middleton Office (land lease)
|
2002
|
North Pointe Operations Center
|
2007
|
|
|
2250 Spring Road
|
Orrstown Operations Center
|
|||
|
Carlisle, PA 17013
|
2695 Philadelphia Avenue
|
|||
|
Chambersburg, PA 17201
|
||||
|
Orchard Drive Office (land lease)
|
2003
|
Eastern Blvd. Office
|
2008
|
|
|
1355 Orchard Drive
|
1020 Professional Court
|
|||
|
Chambersburg, PA 17201
|
Hagerstown, MD 21740
|
|||
|
Seven Gables Office
|
2003
|
|||
|
1 Giant Lane
|
||||
|
Carlisle, PA 17013
|
||||
16
|
Office and Address
|
Acquired/Built
|
Office and Address
|
Acquired/Built
|
|
|
Properties Leased
|
Properties Leased (continued)
|
|||
|
Hanover Street
|
1997
|
Rohrerstown
|
2013
|
|
|
22 S. Hanover St.
|
2098 Spring Valley Road
|
|||
|
Carlisle, PA 17013
|
Lancaster, PA 17601
|
|||
|
Camp Hill
|
2005
|
Commerce Drive
|
2015
|
|
|
3045 Market St.
|
1589 Commerce Drive
|
|||
|
Camp Hill, PA 17011
|
Lancaster, PA 17605
|
|||
|
Carlisle Fairgrounds
|
2011
|
|||
|
1000 Bryn Mawr Road
|
||||
|
Carlisle, PA 17103
|
||||
The nature of the Company’s business generates a certain amount of litigation involving matters arising out of the ordinary course of business. Except as described below, in the opinion of management, there are no legal proceedings that might have a material effect on the results of operations, liquidity, or the financial position of the Company at this time.
On May 25, 2012, SEPTA filed a putative class action complaint in the United States District Court for the Middle District of Pennsylvania against the Company, the Bank and certain current and former directors and executive officers (collectively, the “Defendants”). The complaint alleges, among other things, that (i) in connection with the Company’s Registration Statement on Form S-3 dated February 23, 2010 and its Prospectus Supplement dated March 23, 2010, and (ii) during the purported class period of March 24, 2010 through October 27, 2011, the Company issued materially false and misleading statements regarding the Company’s lending practices and financial results, including misleading statements concerning the stringent nature of the Bank’s credit practices and underwriting standards, the quality of its loan portfolio, and the intended use of the proceeds from the Company’s March 2010 public offering of common stock. The complaint asserts claims under Sections 11, 12(a) and 15 of the Securities Act of 1933, Sections 10(b) and 20(a) of the Securities Exchange Act of 1934 and Rule 10b-5 promulgated thereunder, and seeks class certification, unspecified money damages, interest, costs, fees and equitable or injunctive relief. Under the Private Securities Litigation Reform Act of 1995 (“PSLRA”), motions for appointment of Lead Plaintiff in this case were due by July 24, 2012. SEPTA was the sole movant and the Court appointed SEPTA Lead Plaintiff on August 20, 2012.
Pursuant to the PSLRA and the Court’s September 27, 2012 Order, SEPTA was given until October 26, 2012 to file an amended complaint and the Defendants until December 7, 2012 to file a motion to dismiss the amended complaint. SEPTA’s opposition to the Defendant’s motion to dismiss was originally due January 11, 2013. Under the PSLRA, discovery and all other proceedings in the case were stayed pending the Court’s ruling on the motion to dismiss. The September 27, 2012 Order specified that if the motion to dismiss were denied, the Court would schedule a conference to address discovery and the filing of a motion for class certification. On October 26, 2012, SEPTA filed an unopposed motion for enlargement of time to file its amended complaint in order to permit the parties and new defendants to be named in the amended complaint time to discuss plaintiff’s claims and defendants’ defenses. On October 26, 2012, the Court granted SEPTA’s motion, mooting its September 27, 2012 scheduling Order, and requiring SEPTA to file its amended complaint on or before January 16, 2013 or otherwise advise the Court of circumstances that require a further enlargement of time. On January 14, 2013, the Court granted SEPTA’s second unopposed motion for enlargement of time to file an amended complaint on or before March 22, 2013.
On March 4, 2013, SEPTA filed an amended complaint. The amended complaint expands the list of defendants in the action to include the Company’s independent registered public accounting firm and the underwriters of the Company’s March 2010 public offering of common stock. In addition, among other things, the amended complaint extends the purported 1934 Exchange Act class period from March 15, 2010 through April 5, 2012. Pursuant to the Court’s March 28, 2013 Second Scheduling Order, on May 28, 2013 all defendants filed their motions to dismiss the amended complaint, and on July 22, 2013 SEPTA filed its “omnibus” opposition to all of the defendants’ motions to dismiss. On August 23, 2013, all defendants filed reply briefs in further support of their motions to dismiss. On December 5, 2013, the Court ordered oral argument on the
17
Orrstown Defendants’ motion to dismiss the amended complaint to be heard on February 7, 2014. Oral argument on the pending motions to dismiss SEPTA’s amended complaint was held on April 29, 2014.
The Second Scheduling Order stayed all discovery in the case pending the outcome of the motions to dismiss, and informed the parties that, if required, a telephonic conference to address discovery and the filing of SEPTA’s motion for class certification would be scheduled after the Court’s ruling on the motions to dismiss.
On April 10, 2015, pursuant to Court order, all parties filed supplemental briefs addressing the impact of the United States Supreme Court’s March 24, 2015 decision in Omnicare, Inc. v. Laborers District Council Construction Industry Pension Fund on defendants’ motions to dismiss the amended complaint.
On June 22, 2015, in a 96-page Memorandum, the Court dismissed without prejudice SEPTA’s amended complaint against all defendants, finding that SEPTA failed to state a claim under either the Securities Act of 1933, as amended, or the Securities Exchange Act of 1934, as amended. The Court ordered that, within 30 days, SEPTA either seek leave to amend its amended complaint, accompanied by the proposed amendment, or file a notice of its intention to stand on the amended complaint.
On July 22, 2015, SEPTA filed a motion for leave to amend under Local Rule 15.1, and attached a copy of its proposed second amended complaint to its motion. Many of the allegations of the proposed second amended complaint are essentially the same or similar to the allegations of the dismissed amended complaint. The proposed second amended complaint also alleges that the Orrstown Defendants did not publicly disclose certain alleged failures of internal controls over loan underwriting, risk management, and financial reporting during the period 2009 to 2012, in violation of the federal securities laws. On February 8, 2016, the Court granted SEPTA’s motion for leave to amend and SEPTA filed its second amended complaint that same day.
The allegations of SEPTA’s proposed second amended complaint disclosed the existence of a confidential, non-public, fact-finding inquiry regarding the Company being conducted by the Commission. The Commission inquiry is not an indication that the Commission believes the Company or anyone else has violated federal securities laws or regulations. Nor does it mean that the Commission has a negative opinion of any person, entity, or security. The investigation is ongoing and the Company has been cooperating fully with the Commission.
On February 25, 2016, the Court issued a scheduling Order directing: all defendants to file any motions to dismiss by March 18, 2016; SEPTA to file an omnibus opposition to defendants’ motions to dismiss by April 8, 2016; and all defendants to file reply briefs in support of their motions to dismiss by April 22, 2016. The Order stays all discovery and other deadlines in the case (including the filing of SEPTA’s motion for class certification) pending the outcome of the motions to dismiss.
The Company believes that the allegations of SEPTA’s second amended complaint are without merit and intends to vigorously defend itself against those claims.
Given that the litigation is still in the pleading stage, it is not possible at this time to estimate reasonably possible losses, or even a range of reasonably possible losses, in connection with the litigation.
Not applicable.
18
Market Information
Our common stock began trading on the NASDAQ Capital Market under the symbol “ORRF” as of April 28, 2009, and continues to be listed there as of the date hereof. At the close of business on
March 7, 2016
, there were approximately
2,975
shareholders of record.
The following table sets forth, for the fiscal periods indicated, the high and low sales prices of our common stock for the two most recent fiscal years. Trading prices are based on published financial sources.
|
|
2015
|
2014
|
|||||||||||||||||||||
|
|
Market Price
|
Quarterly
Dividend
|
Market Price
|
Quarterly
Dividend
|
|||||||||||||||||||
|
|
High
|
Low
|
High
|
Low
|
|||||||||||||||||||
|
First quarter
|
$
|
17.50
|
|
$
|
16.31
|
|
$
|
0.00
|
|
$
|
17.50
|
|
$
|
15.35
|
|
$
|
0.00
|
|
|||||
|
Second quarter
|
18.00
|
|
16.02
|
|
0.07
|
|
16.95
|
|
15.85
|
|
0.00
|
|
|||||||||||
|
Third quarter
|
18.00
|
|
15.10
|
|
0.07
|
|
17.00
|
|
15.33
|
|
0.00
|
|
|||||||||||
|
Fourth quarter
|
18.45
|
|
16.24
|
|
0.08
|
|
17.21
|
|
15.50
|
|
0.00
|
|
|||||||||||
|
$
|
0.22
|
|
$
|
0.00
|
|
||||||||||||||||||
In October 2011, the Company announced that it had discontinued its quarterly dividend. On April 21, 2015, the Company resumed its declaration of a quarterly dividend, once enforcement actions against the Company and the Bank were lifted. The Company expects to continue its policy of paying regular cash dividends declared from time to time by the Board of Directors, although there is no assurance as to future dividends because they depend on future earnings, capital requirements, financial conditions and other factors deemed relevant by the Board of Directors. See Note 15, "Restrictions on Dividends, Loans, and Advances," in the "Notes to Consolidated Financial Statements" included in Item 8 for the year ended December 31, 2015 for restrictions on the payment of dividends.
Issuer Purchases of Equity Securities
The following table presents the Company's monthly repurchases of its common stock during the quarter ended
December 31, 2015
. The maximum number of shares that may yet be purchased under the plan is
368,923
shares at
December 31, 2015
.
|
Total Number of Shares Repurchased
|
Average Price Per Share
|
Total Number of Shares Purchased as Part of Publicly Announced Plans or Programs
|
Maximum Number of Shares That May Yet Be Purchased Under the Plans or Programs
|
|||||||||
|
October 1, 2015 to October 31, 2015
|
33,818
|
|
$
|
17.21
|
|
33,818
|
|
373,369
|
|
|||
|
November 1, 2015 to November 30, 2015
|
0
|
|
0.00
|
|
0
|
|
373,369
|
|
||||
|
December 1, 2015 to December 31, 2015
|
4,446
|
|
17.48
|
|
4,446
|
|
368,923
|
|
||||
On September 14, 2015, the Board of Directors of the Company authorized a stock repurchase program under which the Company may repurchase up to 5% of the Company's outstanding shares of common stock, or approximately
416,000
shares, in the open market, in accordance with all applicable securities laws and regulations, including Rule 10b-18 of the Securities Exchange Act of 1934, as amended.
The extent to which the Company repurchases its shares, and the timing of such repurchases, will depend upon a variety of factors, including market conditions, regulatory requirements and other corporate considerations, as determined by
19
management. Purchases may be made from time to time on open market or privately negotiated transactions. The repurchase program may be suspended or discontinued at any time. As of
December 31, 2015
,
47,077
shares had been repurchased under the program at a total cost of
$808,680
, or
$17.18
per share.
PERFORMANCE GRAPH
The following graph shows a five-year comparison of the cumulative total return on the Company’s common stock as compared to other indexes: the SNL index of banks with assets between $1 billion and $5 billion, the S&P 500 Index, and the NASDAQ Composite index. Shareholder returns on the Company’s common stock are based upon trades on the NASDAQ Stock Market. The shareholder returns shown in the graph are not necessarily indicative of future performance.
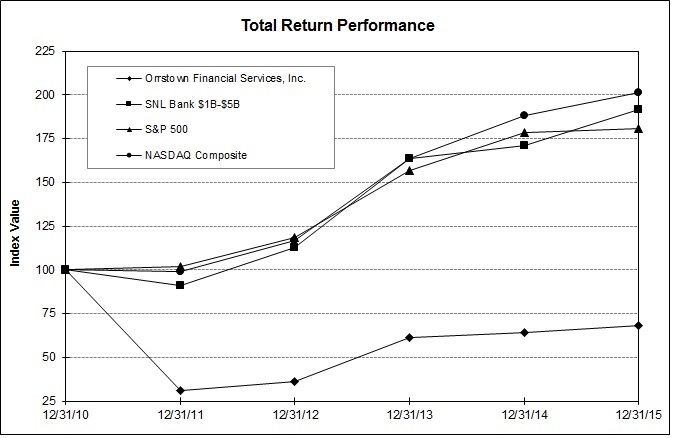
|
|
Period Ending
|
||||||||||||||||
|
Index
|
12/31/10
|
12/31/11
|
12/31/12
|
12/31/13
|
12/31/14
|
12/31/15
|
|||||||||||
|
Orrstown Financial Services, Inc.
|
100.00
|
|
31.06
|
|
36.30
|
|
61.56
|
|
64.01
|
|
68.03
|
|
|||||
|
SNL Bank $1B-$5B
|
100.00
|
|
91.20
|
|
112.45
|
|
163.52
|
|
170.98
|
|
191.39
|
|
|||||
|
S&P 500
|
100.00
|
|
102.11
|
|
118.45
|
|
156.82
|
|
178.28
|
|
180.75
|
|
|||||
|
NASDAQ Composite
|
100.00
|
|
99.21
|
|
116.82
|
|
163.75
|
|
188.03
|
|
201.40
|
|
|||||
In accordance with the rules of the SEC, this section captioned “Performance Graph” shall not be incorporated by reference into any of our future filings made under the Exchange Act or the Securities Act of 1933, as amended (the “Securities Act”). The Performance Graph and its accompanying table are not deemed to be soliciting material or to be filed under the Exchange Act or the Securities Act.
Recent Sales of Unregistered Securities
The Company has not sold any securities within the past three years which were not registered under the Securities Act.
20
|
|
Year Ended December 31,
|
||||||||||||||||||
|
(Dollars in thousands)
|
2015
|
2014
|
2013
|
2012
|
2011
|
||||||||||||||
|
Summary of Operations
|
|||||||||||||||||||
|
Interest income
|
$
|
38,635
|
|
$
|
38,183
|
|
$
|
37,098
|
|
$
|
45,436
|
|
$
|
60,361
|
|
||||
|
Interest expense
|
4,301
|
|
4,159
|
|
5,011
|
|
7,548
|
|
10,754
|
|
|||||||||
|
Net interest income
|
34,334
|
|
34,024
|
|
32,087
|
|
37,888
|
|
49,607
|
|
|||||||||
|
Provision for loan losses
|
(603
|
)
|
(3,900
|
)
|
(3,150
|
)
|
48,300
|
|
58,575
|
|
|||||||||
|
Net interest income after provision for loan losses
|
34,937
|
|
37,924
|
|
35,237
|
|
(10,412
|
)
|
(8,968
|
)
|
|||||||||
|
Securities gains
|
1,924
|
|
1,935
|
|
332
|
|
4,824
|
|
6,224
|
|
|||||||||
|
Other noninterest income
|
17,254
|
|
16,919
|
|
17,476
|
|
18,438
|
|
20,396
|
|
|||||||||
|
Goodwill impairment charge
|
0
|
|
0
|
|
0
|
|
0
|
|
19,447
|
|
|||||||||
|
Other noninterest expenses (excluding goodwill impairment charge)
|
44,607
|
|
43,768
|
|
43,247
|
|
43,349
|
|
41,032
|
|
|||||||||
|
Income (loss) before income taxes (benefit)
|
9,508
|
|
13,010
|
|
9,798
|
|
(30,499
|
)
|
(42,827
|
)
|
|||||||||
|
Income tax expense (benefit)
|
1,634
|
|
(16,132
|
)
|
(206
|
)
|
7,955
|
|
(10,863
|
)
|
|||||||||
|
Net income (loss)
|
$
|
7,874
|
|
$
|
29,142
|
|
$
|
10,004
|
|
$
|
(38,454
|
)
|
$
|
(31,964
|
)
|
||||
|
Per Common Share Data
|
|||||||||||||||||||
|
Net income (loss)
|
$
|
0.97
|
|
$
|
3.59
|
|
$
|
1.24
|
|
$
|
(4.77
|
)
|
$
|
(3.98
|
)
|
||||
|
Diluted net income (loss)
|
0.97
|
|
3.59
|
|
1.24
|
|
(4.77
|
)
|
(3.98
|
)
|
|||||||||
|
Cash dividend paid
|
0.22
|
|
0.00
|
|
0.00
|
|
0.00
|
|
0.69
|
|
|||||||||
|
Book value at December 31
|
16.08
|
|
15.40
|
|
11.28
|
|
10.85
|
|
15.92
|
|
|||||||||
|
Tangible book value at December 31
|
16.06
|
|
15.35
|
|
11.20
|
|
10.75
|
|
15.79
|
|
|||||||||
|
Average shares outstanding – basic
|
8,106,438
|
|
8,110,344
|
|
8,093,306
|
|
8,066,148
|
|
8,017,307
|
|
|||||||||
|
Average shares outstanding – diluted
|
8,141,600
|
|
8,116,054
|
|
8,093,306
|
|
8,066,148
|
|
8,026,726
|
|
|||||||||
|
Stock Price Statistics
|
|||||||||||||||||||
|
Close
|
$
|
17.84
|
|
$
|
17.00
|
|
$
|
16.35
|
|
$
|
9.64
|
|
$
|
8.25
|
|
||||
|
High
|
18.45
|
|
17.50
|
|
18.00
|
|
11.29
|
|
29.50
|
|
|||||||||
|
Low
|
15.10
|
|
15.33
|
|
9.49
|
|
7.45
|
|
7.90
|
|
|||||||||
|
Price earnings ratio at close
|
18.4
|
|
4.7
|
|
13.2
|
|
(2.0
|
)
|
(2.1
|
)
|
|||||||||
|
Diluted price earnings ratio at close
|
18.4
|
|
4.7
|
|
13.2
|
|
(2.0
|
)
|
(2.1
|
)
|
|||||||||
|
Price to book at close
|
1.1
|
|
1.1
|
|
1.4
|
|
0.9
|
|
0.5
|
|
|||||||||
|
Price to tangible book at close
|
1.1
|
|
1.1
|
|
1.5
|
|
0.9
|
|
0.5
|
|
|||||||||
|
Year-End Balance Sheet Data
|
|||||||||||||||||||
|
Total assets
|
$
|
1,292,816
|
|
$
|
1,190,443
|
|
$
|
1,177,812
|
|
$
|
1,232,668
|
|
$
|
1,444,097
|
|
||||
|
Loans
|
781,713
|
|
704,946
|
|
671,037
|
|
703,739
|
|
965,440
|
|
|||||||||
|
Total investment securities
|
402,844
|
|
384,549
|
|
416,864
|
|
311,774
|
|
322,123
|
|
|||||||||
|
Deposits – noninterest bearing
|
131,390
|
|
116,302
|
|
116,371
|
|
121,090
|
|
111,930
|
|
|||||||||
|
Deposits – interest bearing
|
900,777
|
|
833,402
|
|
884,019
|
|
963,949
|
|
1,104,972
|
|
|||||||||
|
Total deposits
|
1,032,167
|
|
949,704
|
|
1,000,390
|
|
1,085,039
|
|
1,216,902
|
|
|||||||||
|
Repurchase agreements
|
29,156
|
|
21,742
|
|
9,032
|
|
9,650
|
|
15,013
|
|
|||||||||
|
Borrowed money
|
84,495
|
|
79,812
|
|
66,077
|
|
37,470
|
|
73,798
|
|
|||||||||
|
Total shareholders’ equity
|
133,061
|
|
127,265
|
|
91,439
|
|
87,694
|
|
128,197
|
|
|||||||||
|
Trust assets under management – market value
|
966,362
|
|
1,017,013
|
|
1,085,216
|
|
992,378
|
|
947,273
|
|
|||||||||
|
Performance Statistics
|
|||||||||||||||||||
|
Average equity / average assets
|
10.66
|
%
|
8.63
|
%
|
7.45
|
%
|
8.07
|
%
|
10.36
|
%
|
|||||||||
|
Return on average equity
|
5.99
|
%
|
28.78
|
%
|
11.30
|
%
|
(35.22
|
)%
|
(20.33
|
)%
|
|||||||||
|
Return on average assets
|
0.64
|
%
|
2.48
|
%
|
0.84
|
%
|
(2.84
|
)%
|
(2.11
|
)%
|
|||||||||
21
Supplemental Reporting of Non-GAAP-Based Financial Measures
Tangible book value per share is computed by dividing shares outstanding into tangible common equity. Management uses tangible book value per share because it believes such ratio is useful in understanding the Company's capital position and ratios. A reconciliation of book value per share to tangible book value per share is set forth below.
|
Year Ended December 31,
|
|||||||||||||||||||
|
(Dollars in thousands, except per share data)
|
2015
|
2014
|
2013
|
2012
|
2011
|
||||||||||||||
|
Shareholders’ equity
|
$
|
133,061
|
|
$
|
127,265
|
|
$
|
91,439
|
|
$
|
87,694
|
|
$
|
128,197
|
|
||||
|
Less: Intangible assets
|
207
|
|
414
|
|
622
|
|
832
|
|
1,041
|
|
|||||||||
|
Tangible equity
|
$
|
132,854
|
|
$
|
126,851
|
|
$
|
90,817
|
|
$
|
86,862
|
|
$
|
127,156
|
|
||||
|
Book value per share
|
$
|
16.08
|
|
$
|
15.40
|
|
$
|
11.28
|
|
$
|
10.85
|
|
$
|
15.92
|
|
||||
|
Less: Intangible assets per share
|
0.02
|
|
0.05
|
|
0.08
|
|
0.10
|
|
0.13
|
|
|||||||||
|
Tangible book value per share
|
$
|
16.06
|
|
$
|
15.35
|
|
$
|
11.20
|
|
$
|
10.75
|
|
$
|
15.79
|
|
||||
22
The following is a discussion of the consolidated financial condition and results of operations for each of the three years ended
December 31, 2015
,
2014
and
2013
. The following discussion and analysis should be read in conjunction with our Consolidated Financial Statements and Notes to Consolidated Financial Statements presented in this report to assist in the evaluation of the Company’s
2015
performance. Certain prior period amounts presented in this discussion and analysis have been reclassified to conform to current period classifications. It should also be read in conjunction with the “Caution About Forward Looking Statements” section at the end of this discussion.
Overview
The U.S. economy is in its sixth year of recovery from one of its longest and most severe economic recessions in recent history. The strength of the recovery has been modest by historical standards with GDP growth struggling to sustain momentum above 2.0%. Unemployment had been slow to decline until 2014, when it experienced its best employment growth in more than a decade adding over three million new jobs, and this favorable momentum in employment gains has continued in 2015. With continued improvement in the economic outlook, the FRB began its long awaited rise in interest rates, when it raised the short-term rate by 25 basis points in December 2015. Many of the world's economies appear to be in recession or experiencing decelerating growth, and as a result, the dollar has strengthened significantly and commodity prices have fallen precipitously. It is not certain that the U.S. economy will remain strong enough to allow the FRB to continue to raise interest rates while the rest of the world's major economies struggle.
The Company was profitable in 2015. Net income for the years ended December 31, 2015, 2014 and 2013 was $7,874,000, $29,142,000 and $10,004,000 after posting losses in the two previous years. The Company was able to return to profitability as asset quality issues have improved significantly in the past three years, from their elevated levels, allowing for significant reductions in the provision for loan losses in 2015, 2014 and 2013. The provision for loan losses was a negative $603,000, $3,900,000, and $3,150,000 for the years ended December 31, 2015, 2014 and 2013.
The results of operations of the Company in 2014 were also influenced by the establishment of a deferred tax asset valuation allowance reserve totaling $20,235,000 in 2012 due primarily to the cumulative losses posted in 2011 and 2012. As a result of sustained profitability for the prior nine quarters, strengthened asset quality metrics and regulatory capital, the valuation allowance was recaptured in the fourth quarter of 2014, and an income tax benefit of $16,204,000 was recorded.
Critical Accounting Policies
The Company’s consolidated financial statements are prepared in accordance with accounting principles generally accepted in the United States (“GAAP”) and follow general practices within the financial services industry in which it operates. Management, in order to prepare the Company’s consolidated financial statements, is required to make estimates, assumptions and judgments that affect the amounts reported in the financial statements and accompanying notes. These estimates, assumptions, and judgments are based on information available as of the balance sheet date through the date the financial statements are filed with the Commission. As this information changes, the consolidated financial statements could reflect different estimates, assumptions, and judgments. Certain policies inherently have a greater reliance on the use of estimates, assumptions, and judgments and as such have a greater possibility of producing results that could be materially different than originally reported. Estimates, assumptions, and judgments are necessary when assets and liabilities are required to be recorded at fair value, when a decline in the value of an asset not carried on the financial statements at fair value warrants an impairment write-down or valuation reserve to be established, or when an asset or liability needs to be recorded contingent upon a future event. Carrying assets and liabilities at fair value inherently results in more financial statement volatility. The fair values and the information used to record valuation adjustments for certain assets and liabilities are based either on quoted market prices or are provided by other third-party sources.
The most significant accounting policies followed by the Company are presented in Note 1 to the consolidated financial statements. These policies, along with the disclosures presented in the other financial statement notes, provide information on how significant assets and liabilities are valued in the financial statements and how those values are determined. Based on the valuation techniques used and the sensitivity of financial statement amounts to the methods, assumptions, and estimates underlying those amounts, the Company has identified the adequacy of the allowance for loan losses and accounting for income taxes as critical accounting policies.
The allowance for loan losses represents management’s estimate of probable incurred credit losses inherent in the loan portfolio. Determining the amount of the allowance for loan losses is considered a critical accounting estimate because it requires significant judgment and the use of estimates related to the amount and timing of expected future cash flows on impaired loans, estimated losses on pools of homogeneous loans based on historical loss experience, and consideration of
23
current economic trends and conditions, all of which may be susceptible to significant change. The loan portfolio also represents the largest asset type on the consolidated balance sheet.
The Company recognizes deferred tax assets and liabilities for the future effects of temporary differences and tax credits. Enacted tax rates are applied to cumulative temporary differences based on expected taxable income in the periods in which the deferred tax asset or liability is anticipated to be realized. Future tax rate changes could occur that would require the recognition of income or expense in the statement of operations in the period in which they are enacted. Deferred tax assets must be reduced by a valuation allowance if in management’s judgment it is “more likely than not” that some portion of the asset will not be realized. Management may need to modify their judgments in this regard, from one period to another, should a material change occur in the business environment, tax legislation, or in any other business factor that could impair the Company’s ability to benefit from the asset in the future. Based upon the Company’s prior cumulative taxable losses, projections for future taxable income and other available evidence, management determined that there was not sufficient positive evidence to outweigh the cumulative loss, and concluded it was not more likely than not that the net deferred tax asset would be realized for the quarters ended September 30, 2012 through September 30, 2014. Accordingly a full valuation allowance was recorded for each of these quarters in 2012. At December 31, 2014, management analyzed the Company’s profitable operations over the prior nine quarters, improvements in asset quality, strengthened capital position, reduced regulatory risk, as well as improvement in economic conditions, and determined that a full valuation allowance was no longer necessary, and the full amount was recaptured as of December 31, 2014. The ultimate realization of deferred tax assets is dependent upon existence, or generation, of taxable income in the periods when those temporary differences and net operating loss and credit carryforwards are deductible. Management considered projected future taxable income, length of time needed for carryforwards to reverse, available tax planning strategies, and other factors in making its assessment that it was more likely than not the net deferred tax assets would be realized.
Readers of the consolidated financial statements should be aware that the estimates and assumptions used in the Company’s current financial statements may need to be updated in future financial presentations for changes in circumstances, business or economic conditions in order to fairly represent the condition of the Company at that time.
Corporate Profile and Significant Developments
The Company is a bank holding company (that has elected status as a financial holding company with the FRB) headquartered in Shippensburg, Pennsylvania with consolidated assets of
$1,292,816,000
at
December 31, 2015
. The consolidated financial information presented herein reflects the Company and its wholly-owned commercial bank subsidiary, the Bank.
The Bank, with total assets of
$1,292,178,000
at
December 31, 2015
, is a Pennsylvania chartered commercial bank with
22
offices. The Bank’s deposit services include a variety of checking, savings, time and money market deposits along with related debit card and merchant services. Lending services include commercial loans, residential loans, commercial mortgages and various forms of consumer lending. Orrstown Financial Advisors, a division of the Bank, offers a diverse line of financial services to our customers, including, but not limited to, brokerage, mutual funds, trusts, estate planning, investments and insurance products. At
December 31, 2015
, Orrstown Financial Advisors had approximately
$966,362,000
of assets under management.
Economic Climate, Inflation and Interest Rates
The U.S. economy is in the sixth year of modest expansion following one of its longest and most severe economic recessions in history. The modest strength of the expansion has resulted in strong competition for quality lending opportunities, which together with a relatively flat yield curve, has pressured net interest margin and the ability to leverage our overhead expenses.
The majority of the assets and liabilities of a financial institution are monetary in nature, and therefore, differ greatly from most commercial and industrial companies that have significant investments in fixed assets or inventories. However, inflation does have an impact on the growth of total assets and on noninterest expenses, which tend to rise during periods of general inflation. Inflationary pressures over the last three years have been modest and the outlook for inflation appears modest for the foreseeable future.
As the Company’s balance sheet consists primarily of financial instruments, interest income and interest expense is greatly influenced by the level of interest rates and the slope of the interest rate curve. During the three years presented in this financial statement review, interest rates have remained near all-time lows. In December 2015, the FRB raised short term interest rates by 25 basis points, the first increase in rates in ten years. Because of the low level of interest rates, we have not been able to lower the rate we pay for interest bearing non-maturity deposits to the same extent that has been experienced in the
24
rates we have been able to earn on our interest earning assets. As a result, the Company’s net interest margin has been negatively impacted.
Management believes that the Company is positioned to withstand the challenging economic conditions because of the steps it has taken to improve its capital, liquidity position, and asset quality.
Results of Operations
Summary
For the years ended
December 31, 2015
,
2014
and
2013
, the Company recorded net income of
$7,874,000
,
$29,142,000
and
$10,004,000
. Diluted earnings per share were
$0.97
,
$3.59
and
$1.24
for the years ended
December 31, 2015
,
2014
and
2013
.
Each of the three years had events and circumstances that affect the comparability of the information for the periods presented, and reflects the impact that asset quality had on the results of our operations. In 2013 and 2014, improvements were noted in asset quality due to some success in remediation and workout efforts. As a result, it was determined that no provision for loan losses was needed for
2013
,
2014
and
2015
, and that a recovery of amounts previously provided for or charged off would be recognized. This resulted in a negative provision of
$603,000
,
$3,900,000
and
$3,150,000
for the years ended
December 31, 2015
,
2014
and
2013
.
Noninterest expenses, in total, remained relatively consistent, and totaled
$44,607,000
,
$43,768,000
and
$43,247,000
for the years ended
December 31, 2015
,
2014
and
2013
. Although the total was relatively flat, the changes in certain components of noninterest expenses between the three periods are reflective of the Company's asset quality remediation efforts, focus on investing in additional talent and technology to better serve the needs of our customers, and efforts to develop new relationships. Data processing costs increased from $682,000 for the year ended December 31, 2013 to $1,866,000 and $2,026,000 for the years ended
December 31, 2014
and
2015
. Salaries and employee benefits increased from $22,954,000 for
the year ended December 31, 2013 to $23,658,000 and $24,056,000 for the years ended
December 31, 2014
and
2015
.
For the year ended
December 31, 2015
, net income included income tax expense of $1,634,000, or an effective tax rate 17.2%, whereas results for the years ended December 31, 2014 and 2013 were favorably impacted by issues surrounding a valuation allowance on deferred tax assets. The 2014 results benefited from the recapture of the valuation allowance on deferred tax assets of $16,204,000, and 2013 benefited from the valuation allowance and the fact no federal income tax expense was recorded, despite pre-tax income, due to the valuation allowance on deferred tax that was previously established and charged to income tax expense in 2012.
Net Interest Income
Net interest income, which is the difference between interest income and fees on interest-earning assets and interest expense on interest-bearing liabilities, is the primary component of the Company’s revenue. Interest-earning assets include loans, securities and federal funds sold. Interest bearing liabilities include deposits and borrowed funds. To compare the tax-exempt yields to taxable yields, amounts are adjusted to pretax equivalents based on a 35% federal corporate tax rate.
Net interest income is affected by changes in interest rates, volumes of interest-earning assets and interest-bearing liabilities and the composition of those assets and liabilities. The “net interest spread” and “net interest margin” are two common statistics related to changes in net interest income. The net interest spread represents the difference between the yields earned on interest-earning assets and the rates paid for interest-bearing liabilities. The net interest margin is defined as the ratio of net interest income to average earning assets. Through the use of non-interest bearing demand deposits and shareholders' equity, the net interest margin exceeds the net interest spread, as these funding sources are non-interest bearing.
The “Analysis of Net Interest Income” table presents net interest income on a fully taxable equivalent basis, net interest spread and net interest margin for the years ending
December 31, 2015
,
2014
and
2013
. The “Changes in Taxable Equivalent Net Interest Income” table below analyzes the changes in net interest income for the same periods broken down by their rate and volume components.
25
2015 versus 2014
For the year ended
December 31, 2015
, net interest income, measured on a fully tax equivalent basis, increased
$493,000
, or
1.4%
, to
$35,987,000
from
$35,494,000
for the same period in
2014
. The primary reason for the increase in net interest income was higher average balances in loans during 2015 as compared to 2014. However, net interest margin compressed from
3.20%
for the year ended
December 31, 2014
to
3.14%
for the same period in
2015
, due to the effects of the flattening yield curve throughout 2015 that negatively impacted the yields on interest-earning assets, and caused funding costs to increase.
Interest income on tax equivalent basis on loans increased from $30,719,000 for the year ended
December 31, 2014
to $31,881,000 for the year ended
December 31, 2015
, for an increase of $1,162,000. The increase in interest income on loans was primarily a result of an increase in average loan volume, offset partially by a decrease in yield. The average loans balance increased to $746,679,000 for the year ended
December 31, 2015
, compared to $683,878,000 for the same period in
2014
, and was the result of successful sales efforts across all loan segments. The average yield on the loan portfolio decreased 22 basis points from 4.49% for the year ended
December 31, 2014
to 4.27% for the same period in
2015
, which partially offset the income generated from higher average loan balances. During 2015, competition for loans remained strong, which resulted in competitive pricing in order to grow loan balances. Additionally, the proceeds from loan repayments were invested in new loans, generally at lower rates than those loans in which repayments were received.
Interest income earned on a tax equivalent basis on securities decreased in
2015
and totaled $8,326,000 for the year ended
December 31, 2015
, a decrease of $573,000 compared to the $8,899,000 for the same period in
2014
. The average balance of securities has decreased from $413,072,000 for the year ended
December 31, 2014
to $381,668,000 for the same period in
2015
, with funds obtained from the maturing and prepaying securities used to fund a portion of the Company's loan growth, which resulted in a decline in the average balance of securities available for sale from 2014 to 2015. Partially offsetting the decrease in interest income on securities that resulted from lower average balances, was an increase in rates earned on securities, which increased from an average tax equivalent yield of 2.15% in
2014
to 2.18% in
2015
. As a result of a greater composition of tax-exempt securities in the total securities portfolio, the overall yield increased slightly, as tax-exempt securities continued to provide attractive yields.
Interest expense on deposits and borrowings for the year ended
December 31, 2015
was
$4,301,000
, an
increase
of
$142,000
, from
$4,159,000
for the same period in
2014
. The average balance of interest bearing liabilities
increased
2.13%
from
$936,831,000
for the year ended
December 31, 2014
to
$956,740,000
for the same period in
2015
. In addition, the Company’s cost of funds on interest bearing liabilities increased to
0.45%
for the year ended
December 31, 2015
from
0.44%
for the same period in
2014
. Interest expense on time deposits decreased for the year ended December 31, 2015 to $2,562,000, from $2,720,000 for the same period in 2014, due to a decrease in average balances. During the first six months of 2015, the Company was allowing its time deposits to run off which contributed greatly to the decline in average time deposits in comparison to 2014, as there were cheaper funding alternatives available. As opportunities to deploy funds at more favorable returns for the risk taken became available, the Company increased its time deposits resulting in an increase in the average rates paid for time deposits from 0.93% for the year ended December 31, 2014 to 0.97% in 2015. The Company replaced short term borrowings with callable brokered time deposits to fund loan and securities growth during the last six months of 2015. The Company made this choice because the call option gave the Company the flexibility to reduce its cost of funds if interest rates fall while protecting its net interest margin if rates should rise.
In addition, the increased use of short-term borrowings for temporary funding sources, and additional long-term borrowings, which generally have higher interest rates associated with them, also resulted in the increase in the cost of funds. The average balance of short-term borrowings increased $33,340,000 during the year ended December 31, 2015 to $85,262,000. The average rate paid on short-term borrowings for 2015 was 0.35%, an increase of 6 basis points from that paid in 2014. The increase in average balances and rates paid resulted in an increase in interest expense on short-term borrowings from $148,000 for the year ended December 31, 2014 to $295,000 in 2015. Additionally, the Company added to its long-term borrowings, resulting in a higher average balance of $22,522,000 for the year ended December 31, 2015 compared to $17,773,000 in 2014, and was the primary reason for the increase in expense of $67,000, from $333,000 for the year ended December 31, 2014 to $400,000 for the year end December 31, 2015.
The Company’s net interest spread of
3.06%
decreased
7
basis points for the year ended
December 31, 2015
as compared to the same period in
2014
. Net interest margin for the year ended
December 31, 2015
was
3.14%
, a
6
basis point
decrease
from
3.20%
for the year ended
December 31, 2014
, and is reflective of a flattening yield curve.
26
2014 versus 2013
For the year ended December 31, 2014, net interest income, measured on a fully tax equivalent basis, increased $1,612,000, or 4.8%, to $35,494,000 from $33,882,000 for the same period in 2013. The primary reason for the increase in net interest income was the investment of excess liquidity, previously kept in interest bearing bank balances, into higher yielding securities and the loan portfolio. Expansion in net interest margin from 3.03% for the year ended December 31, 2013 to 3.20% for the same period in 2014 reflects the investments in the higher yielding securities and loans. This shift in investment philosophy was made possible as a result of the sustained improvement in the Company's asset quality and earnings performance, which allowed for increased liquidity available at our correspondent banks, and decreasing the amount of liquidity we needed on hand. Average earning assets decreased nominally from $1,118,612,000 for the year ended December 31, 2013 to $1,111,087,000 for the same period in 2014.
The largest contributor to the increase in net interest income was the investment of excess liquidity into the securities portfolio. Interest income on securities increased from $5,940,000 for the year ended December 31, 2013 to $8,899,000 for the year ended December 31, 2014. The average securities balance increased to $413,072,000 for the year ended December 31, 2014, compared to $368,208,000 for the same period in 2013. The average yield on the securities portfolio improved from 1.61% for the year ended December 31, 2013 to 2.15% for the same period in 2014. The change in interest income due to the increase in the average yield on investment securities resulted in additional interest income of $3,039,000, partially offset by an $80,000 decrease due to a decrease in the average rate received.
Interest income earned on a tax equivalent basis on loans decreased in 2014 to $30,719,000 for the year ended December 31, 2014, a decrease of $2,060,000 compared to the $32,779,000 for 2013. Although the average balance of loans has increased marginally from $683,272,000 for the year ended December 31, 2013 to $683,878,000 for 2014, the volume increase was not enough to offset the decrease in rates earned on loans, which declined from an average tax equivalent yield of 4.80% in 2013 to 4.49% in 2014.
Interest expense on deposits and borrowings for the year ended December 31, 2014 was $4,159,000, a decrease of $852,000, from $5,011,000 for the same period in 2013. The average balance of interest bearing liabilities decreased 3.30% from $968,797,000 for the year ended December 31, 2013 to $936,831,000 for the same period in 2014. In addition, the Company’s cost of funds on interest bearing liabilities declined to 0.44% for the year ended December 31, 2014 from 0.52% for the same period in 2013. As time deposits matured, we have been able to replace the funds at lower rates.
During the year ended December 31, 2014, the Company utilized short-term borrowings as a temporary funding source of funds, rather than utilizing more expensive time deposits and long-term borrowings. As a result, the average balance of short-term borrowings increased $27,610,000 during the year, and averaged $51,922,000. In addition, the average rate paid on short-term borrowings for 2014 was 0.29% an increase of 4 basis points from that paid in 2013. The increase in average balances and rates paid resulted in an increase in interest expense on short-term borrowings from $61,000 for the year ended December 31, 2013 to $148,000 in 2014. Conversely, the Company allowed its long-term borrowings to run off without full replacement, resulting in a lower average balance of $17,773,000 for the year ended December 31, 2014 compared to $28,752,000 in 2013. This was a reason that interest expense on long-term debt decreased by $172,000, from $505,000 for the year ended December 31, 2013 to $333,000. Offsetting the lower average balances were higher average rates paid, which increased from 1.76% in 2013 to 1.87% in 2014, as some of the maturing long-term debt had rates below the average of the total.
The Company’s net interest spread of 3.13% increased 17 basis points for the year ended December 31, 2014 as compared to 2013. Net interest margin for the year ended December 31, 2014 was 3.20%, a 17 basis point improvement from 3.03% for the year ended December 31, 2013.
27
ANALYSIS OF NET INTEREST INCOME
The following table presents interest income on a fully taxable equivalent basis, net-interest spread and net interest margin for the years ended December 31:
|
|
2015
|
2014
|
2013
|
|||||||||||||||||||||||||||||
|
(Dollars in thousands)
|
Average
Balance
|
Tax
Equivalent
Interest
|
Tax
Equivalent
Rate
|
Average
Balance
|
Tax
Equivalent
Interest
|
Tax
Equivalent
Rate
|
Average
Balance
|
Tax
Equivalent
Interest
|
Tax
Equivalent
Rate
|
|||||||||||||||||||||||
|
Assets
|
||||||||||||||||||||||||||||||||
|
Federal funds sold and interest bearing bank balances
|
$
|
18,901
|
|
$
|
81
|
|
0.43
|
%
|
$
|
14,137
|
|
$
|
35
|
|
0.25
|
%
|
$
|
67,132
|
|
$
|
174
|
|
0.26
|
%
|
||||||||
|
Taxable securities
|
348,613
|
|
6,697
|
|
1.92
|
|
399,014
|
|
8,051
|
|
2.02
|
|
339,750
|
|
4,300
|
|
1.27
|
|
||||||||||||||
|
Tax-exempt securities
|
33,055
|
|
1,629
|
|
4.93
|
|
14,058
|
|
848
|
|
6.03
|
|
28,458
|
|
1,640
|
|
5.76
|
|
||||||||||||||
|
Total securities
|
381,668
|
|
8,326
|
|
2.18
|
|
413,072
|
|
8,899
|
|
2.15
|
|
368,208
|
|
5,940
|
|
1.61
|
|
||||||||||||||
|
Taxable loans
|
687,079
|
|
28,787
|
|
4.19
|
|
620,701
|
|
27,368
|
|
4.41
|
|
619,929
|
|
29,290
|
|
4.72
|
%
|
||||||||||||||
|
Tax-exempt loans
|
59,600
|
|
3,094
|
|
5.19
|
|
63,177
|
|
3,351
|
|
5.30
|
|
63,343
|
|
3,489
|
|
5.51
|
|
||||||||||||||
|
Total loans
|
746,679
|
|
31,881
|
|
4.27
|
|
683,878
|
|
30,719
|
|
4.49
|
|
683,272
|
|
32,779
|
|
4.80
|
|
||||||||||||||
|
Total interest-earning assets
|
1,147,248
|
|
40,288
|
|
3.51
|
|
1,111,087
|
|
39,653
|
|
3.57
|
|
1,118,612
|
|
38,893
|
|
3.48
|
|
||||||||||||||
|
Cash and due from banks
|
19,155
|
|
14,161
|
|
13,166
|
|
||||||||||||||||||||||||||
|
Bank premises and equipment
|
24,386
|
|
25,921
|
|
26,496
|
|
||||||||||||||||||||||||||
|
Other assets
|
56,894
|
|
41,499
|
|
52,179
|
|
||||||||||||||||||||||||||
|
Allowance for loan losses
|
(14,134
|
)
|
(19,268
|
)
|
(21,912
|
)
|
||||||||||||||||||||||||||
|
Total
|
$
|
1,233,549
|
|
$
|
1,173,400
|
|
$
|
1,188,541
|
|
|||||||||||||||||||||||
|
Liabilities and Shareholders’ Equity
|
||||||||||||||||||||||||||||||||
|
Interest bearing demand deposits
|
$
|
500,474
|
|
908
|
|
0.18
|
|
$
|
491,046
|
|
823
|
|
0.17
|
|
$
|
484,114
|
|
785
|
|
0.16
|
|
|||||||||||
|
Savings deposits
|
85,068
|
|
136
|
|
0.16
|
|
83,941
|
|
135
|
|
0.16
|
|
78,714
|
|
129
|
|
0.16
|
|
||||||||||||||
|
Time deposits
|
263,414
|
|
2,562
|
|
0.97
|
|
292,149
|
|
2,720
|
|
0.93
|
|
352,905
|
|
3,531
|
|
1.00
|
|
||||||||||||||
|
Short-term borrowings
|
85,262
|
|
295
|
|
0.35
|
|
51,922
|
|
148
|
|
0.29
|
|
24,312
|
|
61
|
|
0.25
|
|
||||||||||||||
|
Long-term debt
|
22,522
|
|
400
|
|
1.78
|
|
17,773
|
|
333
|
|
1.87
|
|
28,752
|
|
505
|
|
1.76
|
|
||||||||||||||
|
Total interest bearing liabilities
|
956,740
|
|
4,301
|
|
0.45
|
|
936,831
|
|
4,159
|
|
0.44
|
|
968,797
|
|
5,011
|
|
0.52
|
|
||||||||||||||
|
Demand deposits
|
134,040
|
|
123,224
|
|
119,146
|
|
||||||||||||||||||||||||||
|
Other
|
11,316
|
|
12,095
|
|
12,051
|
|
||||||||||||||||||||||||||
|
Total Liabilities
|
1,102,096
|
|
1,072,150
|
|
1,099,994
|
|
||||||||||||||||||||||||||
|
Shareholders’ Equity
|
131,453
|
|
101,250
|
|
88,547
|
|
||||||||||||||||||||||||||
|
Total
|
$
|
1,233,549
|
|
$
|
1,173,400
|
|
$
|
1,188,541
|
|
|||||||||||||||||||||||
|
Net interest income (FTE)/net interest spread
|
35,987
|
|
3.06
|
%
|
35,494
|
|
3.13
|
%
|
33,882
|
|
2.96
|
%
|
||||||||||||||||||||
|
Net interest margin
|
3.14
|
%
|
3.20
|
%
|
3.03
|
%
|
||||||||||||||||||||||||||
|
Tax-equivalent adjustment
|
(1,653
|
)
|
(1,470
|
)
|
(1,795
|
)
|
||||||||||||||||||||||||||
|
Net interest income
|
$
|
34,334
|
|
$
|
34,024
|
|
$
|
32,087
|
|
|||||||||||||||||||||||
|
Note:
|
Yields and interest income on tax-exempt assets have been computed on a fully taxable equivalent basis assuming a
|
|
35% tax rate. For yield comparison purposes, nonaccruing loans are included in the average loan balance.
|
|
28
CHANGES IN TAXABLE EQUIVALENT NET INTEREST INCOME
The following table analyzes the changes in tax equivalent net interest income for the periods presented, broken down by their rate and volume components:
|
|
2015 Versus 2014 Increase (Decrease)
Due to Change in |
2014 Versus 2013 Increase (Decrease)
Due to Change in |
|||||||||||||||||||||
|
(Dollars in thousands)
|
Average
Volume
|
Average
Rate
|
Total
Increase
(Decrease)
|
Average
Volume
|
Average
Rate
|
Total
Increase
(Decrease)
|
|||||||||||||||||
|
Interest Income
|
|||||||||||||||||||||||
|
Federal funds sold & interest bearing deposits
|
$
|
12
|
|
$
|
34
|
|
$
|
46
|
|
$
|
(137
|
)
|
$
|
(2
|
)
|
$
|
(139
|
)
|
|||||
|
Taxable securities
|
(1,017
|
)
|
(337
|
)
|
(1,354
|
)
|
750
|
|
3,001
|
|
3,751
|
|
|||||||||||
|
Tax-exempt securities
|
1,146
|
|
(365
|
)
|
781
|
|
(830
|
)
|
38
|
|
(792
|
)
|
|||||||||||
|
Taxable loans
|
2,927
|
|
(1,508
|
)
|
1,419
|
|
36
|
|
(1,958
|
)
|
(1,922
|
)
|
|||||||||||
|
Tax-exempt loans
|
(190
|
)
|
(67
|
)
|
(257
|
)
|
(9
|
)
|
(129
|
)
|
(138
|
)
|
|||||||||||
|
Total interest income
|
2,878
|
|
(2,243
|
)
|
635
|
|
(190
|
)
|
950
|
|
760
|
|
|||||||||||
|
Interest Expense
|
|||||||||||||||||||||||
|
Interest bearing demand deposits
|
16
|
|
69
|
|
85
|
|
11
|
|
27
|
|
38
|
|
|||||||||||
|
Savings deposits
|
2
|
|
(1
|
)
|
1
|
|
9
|
|
(3
|
)
|
6
|
|
|||||||||||
|
Time deposits
|
(268
|
)
|
110
|
|
(158
|
)
|
(608
|
)
|
(203
|
)
|
(811
|
)
|
|||||||||||
|
Short-term borrowings
|
95
|
|
52
|
|
147
|
|
69
|
|
18
|
|
87
|
|
|||||||||||
|
Long-term debt
|
89
|
|
(22
|
)
|
67
|
|
(193
|
)
|
21
|
|
(172
|
)
|
|||||||||||
|
Total interest expense
|
(66
|
)
|
208
|
|
142
|
|
(712
|
)
|
(140
|
)
|
(852
|
)
|
|||||||||||
|
Net Interest Income
|
$
|
2,944
|
|
$
|
(2,451
|
)
|
$
|
493
|
|
$
|
522
|
|
$
|
1,090
|
|
$
|
1,612
|
|
|||||
|
Note:
|
The change attributed to volume is calculated by taking the average change in average balance times the prior year's
|
|
average rate and the remainder is attributable to rate.
|
|
Provision for Loan Losses
The Company recorded a negative provision for loan losses, or a reversal of amounts previously provided, of
$603,000
,
$3,900,000
and
$3,150,000
for the years ended
December 31, 2015
,
2014
and
2013
. The negative provision in 2015 is the result of a recovery on a loan with prior charge-offs totaling this amount. The negative provision recorded in
2014
was the result of several factors, including: 1) favorable recoveries of loan amounts previously charged off; 2) successful resolution of a loan in workout with a smaller charge-off than the reserve established for it; and 3) significant improvement in asset quality metrics. Recent favorable charge-off data, combined with relatively stable economic and market conditions, resulted in the determination that a negative provision could be recorded in
2015
and 2014 despite net charge-offs for the periods, as allowance for loan losses coverage metrics remain strong.
During 2013, or the first year that improvements were noted in asset quality since the recession, the Company received payments on classified loans with partial charge-offs previously recorded. As payments received on these classified loans exceeded the carrying value of these loans, the excess was included in recoveries of loan amounts previously charged off. In connection with the quarterly evaluation of the adequacy of the allowance for loan losses during 2013, it was determined that large recoveries specific to loans in one customer relationship were not needed to replenish the reserve, and were taken as a negative provision for loan losses.
See further discussion in the “Asset Quality” and “Credit Risk Management” sections of this Management’s Discussion and Analysis of Financial Condition and Results of Operations.
29
Noninterest Income
The following provides information regarding noninterest income changes over the past three years.
|
(Dollars in thousands)
|
2015
|
2014
|
2013
|
% Change
|
|||||||||||||
|
2015-2014
|
2014-2013
|
||||||||||||||||
|
Service charges on deposit accounts
|
$
|
5,226
|
|
$
|
5,415
|
|
$
|
5,716
|
|
(3.5
|
)%
|
(5.3
|
)%
|
||||
|
Other service charges, commissions and fees
|
1,223
|
|
1,033
|
|
1,070
|
|
18.4
|
%
|
(3.5
|
)%
|
|||||||
|
Trust department income
|
4,598
|
|
4,687
|
|
4,770
|
|
(1.9
|
)%
|
(1.7
|
)%
|
|||||||
|
Brokerage income
|
2,025
|
|
2,150
|
|
1,911
|
|
(5.8
|
)%
|
12.5
|
%
|
|||||||
|
Mortgage banking activities
|
2,747
|
|
2,207
|
|
3,053
|
|
24.5
|
%
|
(27.7
|
)%
|
|||||||
|
Earnings on life insurance
|
1,025
|
|
950
|
|
963
|
|
7.9
|
%
|
(1.3
|
)%
|
|||||||
|
Other income (loss)
|
410
|
|
477
|
|
(7
|
)
|
(14.0
|
)%
|
(6,914.3
|
)%
|
|||||||
|
Subtotal before securities gains
|
17,254
|
|
16,919
|
|
17,476
|
|
2.0
|
%
|
(3.2
|
)%
|
|||||||
|
Investment securities gains
|
1,924
|
|
1,935
|
|
332
|
|
(0.6
|
)%
|
482.8
|
%
|
|||||||
|
Total noninterest income
|
$
|
19,178
|
|
$
|
18,854
|
|
$
|
17,808
|
|
1.7
|
%
|
5.9
|
%
|
||||
2015 v. 2014’s Results
Noninterest income increased to
$19,178,000
for the year ended
December 31, 2015
, as compared to
$18,854,000
for the year ended
December 31, 2014
, an increase of 1.7%.
Service charges on deposit accounts totaled
$5,226,000
for the year ended December 31, 2015, compared to $5,415,000 for the year ended December 31, 2014, continuing the declining trend noted in 2014. The Company has experienced a decline in overdraft charges as consumers have greater awareness of their available balances given new technology, and are less likely to incur charges.
Other service charges, commissions and fees increased $190,000, or 18.4%, from $1,033,000 for the year ended December 31, 2014, to
$1,223,000
for the corresponding period in 2015. In 2015, the Company's revenues were favorably impacted by $205,000 on the gain on sale of Small Business Administration (SBA) and U.S. Department of Agriculture (USDA) loans, with no similar gains in 2014.
Trust department and brokerage income totaled
$6,623,000
for the year ended
December 31, 2015
compared to
$6,837,000
earned for the year ended December 31,
2014
, a decline of $214,000, or 3.1%. Unfavorable market conditions, in which declines in the stock market were experienced, negatively impacted revenues.
Mortgage banking revenue for the year ended
December 31, 2015
totaled
$2,747,000
, a
24.5%
increase
from the
$2,207,000
earned for the year ended
December 31, 2014
. Favorable real estate and interest rate market conditions led to the increase in 2015, as the Company was able to enhance its new home purchase mortgage revenues, and relied less on mortgage loan refinancings.
Other income of
$410,000
for the year ended
December 31, 2015
was a
$67,000
decrease
compared to the
$477,000
reported for
2014
. The primary reason for the decrease was due to $234,000 in gains on sales of other real estate owned for the year ended December 31, 2015, compared to $299,000 in gains on sales recorded in 2014.
Security gains totaled
$1,924,000
for the year ended
December 31, 2015
, which was relatively comparable to
$1,935,000
in
2014
. For both years, asset/liability management strategies and interest rate conditions resulted in gains on sales of securities, as market conditions presented opportunities to realize earnings on securities through gains, while funding the cash requirements of lending activity.
30
2014 v. 2013’s Results
Noninterest income increased to $18,854,000 for the year ended December 31, 2014, as compared to $17,808,000 for the year ended December 31, 2013. Excluding the increase in securities gains of $1,603,000 in 2014 compared to 2013, noninterest income decreased $557,000 or 3.2%.
Service charges on deposit accounts and other services charges, commissions and fees totaled $5,415,000 and $1,033,000 for the year ended December 31, 2014, declines of 5.3% and 3.5% from 2013’s totals, and continued trends noted in prior years. The Company has experienced a decline in overdraft charges and other fee related charges, as consumers have been more conservative in their spending habits.
Trust department and brokerage income, in total, increased $156,000, or 2.3%, to $6,837,000 for the year ended December 31, 2014 compared to $6,681,000 earned in 2013. Favorable market conditions and new brokerage accounts led to an increase in brokerage income. Also, the Company’s ability to promote new products and attract accounts and customers contributed to the increase.
Mortgage banking revenue for the year ended December 31, 2014 totaled $2,207,000, a 27.7% decline from the $3,053,000 earned for the year ended December 31, 2013. During 2014 there was a reduction in the number of customers refinancing their residential mortgages and new home sale mortgage opportunities remained flat. These events resulted in an $846,000 decline in mortgage banking revenues to $2,207,000 for the year ended December 31, 2014 compared to 2013. The generally higher interest rates in 2013 slowed pre-payment speeds on loans serviced for others. This rate environment positively impacted 2013's results as the fair value of our mortgage servicing rights improved and allowed for the recovery of $638,000 of the impairment reserve during 2013, compared to a slight charge of $22,000 in 2014.
Security gains totaled $1,935,000 for the year ended December 31, 2014 compared to $332,000 in 2013. For both years, asset/liability management strategies and interest rate conditions resulted in gains on sales of securities, as market conditions presented opportunities to reduce interest rate risk while maintaining earnings for our securities portfolio.
Noninterest Expenses
The following provides information regarding noninterest expense over the past three years.
|
|
|
|
|
% Change
|
|||||||||||||
|
(Dollars in thousands)
|
2015
|
2014
|
2013
|
2015-2014
|
2014-2013
|
||||||||||||
|
Salaries and employee benefits
|
$
|
24,056
|
|
$
|
23,658
|
|
$
|
22,954
|
|
1.7
|
%
|
3.1
|
%
|
||||
|
Occupancy
|
2,221
|
|
2,251
|
|
2,055
|
|
(1.3
|
)%
|
9.5
|
%
|
|||||||
|
Furniture and equipment
|
3,061
|
|
3,328
|
|
3,446
|
|
(8.0
|
)%
|
(3.4
|
)%
|
|||||||
|
Data processing
|
2,026
|
|
1,866
|
|
682
|
|
8.6
|
%
|
173.6
|
%
|
|||||||
|
Telephone and communication
|
692
|
|
569
|
|
451
|
|
21.6
|
%
|
26.2
|
%
|
|||||||
|
Automated teller machine and interchange fees
|
798
|
|
865
|
|
1,054
|
|
(7.7
|
)%
|
(17.9
|
)%
|
|||||||
|
Advertising and bank promotions
|
1,564
|
|
1,195
|
|
1,251
|
|
30.9
|
%
|
(4.5
|
)%
|
|||||||
|
FDIC insurance
|
859
|
|
1,621
|
|
2,577
|
|
(47.0
|
)%
|
(37.1
|
)%
|
|||||||
|
Legal
|
1,440
|
|
705
|
|
793
|
|
104.3
|
%
|
(11.1
|
)%
|
|||||||
|
Other professional services
|
1,262
|
|
1,580
|
|
1,462
|
|
(20.1
|
)%
|
8.1
|
%
|
|||||||
|
Directors' compensation
|
737
|
|
624
|
|
622
|
|
18.1
|
%
|
0.3
|
%
|
|||||||
|
Collection and problem loan
|
447
|
|
729
|
|
674
|
|
(38.7
|
)%
|
8.2
|
%
|
|||||||
|
Real estate owned
|
162
|
|
300
|
|
137
|
|
(46.0
|
)%
|
119.0
|
%
|
|||||||
|
Taxes other than income
|
916
|
|
562
|
|
939
|
|
63.0
|
%
|
(40.1
|
)%
|
|||||||
|
Intangible asset amortization
|
207
|
|
208
|
|
210
|
|
(0.5
|
)%
|
(1.0
|
)%
|
|||||||
|
Other operating expenses
|
4,159
|
|
3,707
|
|
3,940
|
|
12.2
|
%
|
(5.9
|
)%
|
|||||||
|
Total noninterest expenses
|
$
|
44,607
|
|
$
|
43,768
|
|
$
|
43,247
|
|
1.9
|
%
|
1.2
|
%
|
||||
31
2015 v. 2014’s Results
Noninterest expenses amounted to
$44,607,000
for the year ended
December 31, 2015
compared to
$43,768,000
for the prior year, an increase of
$839,000
, or
1.9%
. The following factors contributed to the net increase in noninterest expenses.
|
•
|
Salaries and employee benefits totaled
$24,056,000
for the year ended
December 31, 2015
, compared to
$23,658,000
in
2014
, an increase of $398,000, or 1.7%. The 2015 results were impacted by merit increases to employees, incentive compensation including incremental share-based compensation expense of $449,000, and severance costs that totaled approximately $446,000 that were recognized during the year ended December 31, 2015.
|
|
•
|
Furniture and equipment expense of $3,061,000 for the year ended December 31, 2015 represented a decrease of $267,000, or 8.0% from $3,328,000 in 2014. The decrease was due principally to lower depreciation charges and the absence of any losses on disposal of equipment, which totaled $41,000 for the year ended December 31, 2014.
|
|
•
|
Data processing charges were
$2,026,000
for the year ended
December 31, 2015
, an 8.6% increase from
2014
. Similarly, telephone and communication charges totaled $692,000 for the year ended December 31, 2015, compared to $569,000 for the same period in 2014. The annual increases are reflective of overall higher volumes and costs associated with more sophisticated product and service offerings.
|
|
•
|
Advertising and bank promotion increased from $1,195,000 for the year ended December 31, 2014 to $1,564,000 for the same period in 2015, and reflects the timing and advertising associated with the opening of our new full service branch in Lancaster, increased promotion of several of our products and general brand awareness.
|
|
•
|
FDIC insurance expenses totaled
$859,000
for the year ended
December 31, 2015
, a 47.0% reduction from the
$1,621,000
incurred in
2014
. The decrease was the result of a lower assessment rate, as the Company’s risk profile improved.
|
|
•
|
Legal fees totaled $1,440,000 for the year ended December 31, 2015, compared to $705,000 in 2014. The increase in legal fees is primarily the result of costs associated with certain legal matters, including outstanding litigation against the Company and an ongoing confidential investigation being conducted by the Commission as well as general corporate matters. It is anticipated that legal fees will continue to be at elevated levels until the litigation and the confidential investigation is completed.
|
|
•
|
Other professional services, which includes accounting and consulting, totaled $1,262,000 for the year ended December 31, 2015, compared to $1,580,000 in 2014. The decrease is principally the result of less reliance on outside consulting firms, as some work previously handled by consultants was assumed by employees.
|
|
•
|
Directors' compensation totaled $737,000 for the year ended December 31, 2015, a $113,000, or 18.1% increase from $624,000 for the same period in 2014. The increase was primarily attributed to share based compensation awarded to the directors in May 2015, with a one year vesting period, which resulted in seven months of expense in 2015 with no similar charge in 2014.
|
|
•
|
Collection and problem loan expense totaled $447,000 in 2015, representing a decrease of $282,000 from 2014. Similarly, real estate owned expenses also declined from $300,000 for the year ended December 31, 2015 to $162,000 for the same period in 2014. The declines in collection and problem loan and real estate owned expenses reflect improvement in the level of classified assets between the two periods.
|
|
•
|
Taxes, other than income, totaled $916,000 for the year ended December 31, 2015, an approximate 63.0% increase compared to 2014 as Pennsylvania’s Bank Shares tax is based on shareholders’ equity at the beginning of the year. A combination of 2014’s earnings and other comprehensive income, resulted in the increase in this equity-based tax, assessed each year on January 1.
|
|
•
|
Other operating expenses increased $452,000, or 12.2%, for the year ended
December 31, 2015
, from
$3,707,000
in
2014
to
$4,159,000
in
2015
. In 2015, incremental charges of $384,000 were incurred associated with the Company's investment in low-income housing projects compared to $150,000 in 2014, an increase of $234,000 or 156.0%. The prior year's results were positively impacted by favorable operating results of the partnerships, which resulted in less expense in 2014.
|
32
In order to better understand how noninterest expenses change in relation to related changes in revenue, operating expense levels are often measured in the financial services industry by the efficiency ratio, which expresses non-interest expense as a percentage of tax-equivalent net interest income and noninterest income, excluding securities gains, intangible asset amortization and other real estate income and expenses. The Company’s efficiency ratio for the twelve months ended
December 31, 2015
was
83.5%
, compared to
83.0%
in
2014
. The higher, or less favorable, ratio between the two years was primarily the result of higher noninterest expenses, which outpaced growth in revenues.
2014 v. 2013’s Results
Noninterest expenses amounted to $43,768,000 for the year ended December 31, 2014 compared to $43,247,000 for the prior year, an increase of $521,000, or 1.2%. The following factors contributed to the net increase in noninterest expenses.
|
•
|
Salaries and employee benefits totaled $23,658,000 for the year ended December 31, 2014, compared to $22,954,000 in 2013, an increase of $704,000, or 3.1%. The net increase is the result of several factors. Staff were hired in the latter part of 2013, which supported enhanced risk management processes and practices and greater depth in information technology. The outsourcing of the core processing led to a reduction in work force, which partially offset the increase for the additional risk management and information technology employees. Additionally, as the Company returned to sustained profitability, incentive based compensation awards were earned and awarded to employees.
|
|
•
|
Occupancy expense totaled $2,251,000 for the year ended December 31, 2014, an increase of $196,000, or 9.5%, compared to $2,055,000 in 2013. In the fourth quarter of 2013, the Company opened its financial services facility office in Lancaster, Pennsylvania, resulting in a full twelve months of occupancy charges in 2014, with only three months of expense in 2013.
|
|
•
|
Data processing charges were $1,866,000 for the year ended December 31, 2014, a 273.6% increase from 2013. In December 2013, the Company outsourced its core processing system to a third-party provider, to capitalize on additional products and services that the outsourced solution offered.
|
|
•
|
FDIC insurance expenses totaled $1,621,000 for the year ended December 31, 2014, a 37.1% reduction, from the $2,577,000 incurred in 2013, primarily because of a lower assessment rate, as the Company’s risk profile improved.
|
|
•
|
Real estate owned expenses totaled $300,000 for the year ended December 31, 2014, compared to $137,000 in 2013. This unfavorable variance was principally related to obtaining updated appraisals on several properties, and the resulting $170,000 in write downs that were required based on this updated information, for the year ended December 31, 2014 compared to $46,000 in 2013.
|
|
•
|
Taxes, other than income, decreased from $939,000 for the year ended December 31, 2013 to $562,000 in 2014, due to a change in the assessment rate and methodology for state bank shares tax.
|
|
•
|
Other operating expenses decreased $233,000, or 5.9%, for the year ended December 31, 2014, from $3,940,000 in 2013 to $3,707,000 in 2014.
|
The Company’s efficiency ratio for the twelve months ended
December 31, 2014
was
83.0%
, compared to
83.3%
in
December 31, 2013
.
Federal Income Taxes
The Company recorded an income tax expense of
$1,634,000
for the year ended
December 31, 2015
, compared to an income tax benefit of
$16,132,000
and
$206,000
for the years ended
December 31, 2014
and
2013
. The income tax expense, or benefit, recorded during the year was impacted by the reversal of the valuation allowance on the Company's net deferred tax asset in 2014, which resulted in expense occurring in 2015.
In assessing whether or not some or all of our deferred tax asset is more likely than not to be realized in the future, management considers all positive and negative evidence, including projected future taxable income, tax planning strategies and recent financial operating results. Based upon our evaluation of both positive and negative evidence, a full valuation on the net deferred tax assets was established as of September 30, 2012, totaling $20,235,000. Specifically, it was determined that the negative evidence, which included recent cumulative history of operating losses, deterioration in asset quality and resulting impact on profitability, and that we had exhausted our carryback availability, outweighed the positive evidence, and the reserve was established.
33
Each subsequent quarter-end, the Company continued to weigh both positive and negative evidence and re-analyzed its position that a valuation allowance was required. At
December 31, 2014
, management concluded that based on the Company’s profitable operations over the prior nine quarters, improvements in asset quality, strengthened capital position, reduced regulatory risk, and improvement in economic conditions, a full valuation allowance was no longer necessary. The full amount was recaptured as of
December 31, 2014
, and resulted in income tax benefit for the year ended December 31, 2014 of $16,132,000, after recording a minimal benefit of $206,000 in 2013, which related to state income taxes. The ultimate realization of deferred tax assets is dependent upon existence, or generation, of taxable income in the periods when those temporary differences and net operating loss and credit carryforwards are deductible. Management considered projected future taxable income, length of time needed for carryforwards to reverse, available tax planning strategies, and other factors in making its assessment that it was more likely than not the deferred tax assets would be realized and recaptured the full valuation allowance at
December 31, 2014
.
For the year ended December 31, 2015, the Company began recording income tax expense which totaled $1,634,000. A meaningful comparison is the effective tax rate, a measurement of income tax expense as a percent of pretax income, which totaled 17.2% for the year ended December 31, 2015, and is less than the 35% federal statutory rate, primarily due to tax-exempt loan and security income, life insurance earnings and tax credits associated with low-income housing and historic projects, offset by certain non-deductible expenses and state income taxes. See “Note 8 – Income Taxes” in the Notes to the Consolidated Financial Statements for a reconciliation of the federal statutory rate of 35% to the effective tax rate for each of the years ended
December 31, 2015
,
2014
and
2013
.
Financial Condition
A substantial amount of time is devoted by management to overseeing the investment of funds in loans and securities and the formulation of policies directed toward the profitability and minimization of risk associated with such investments.
Securities Available for Sale
The Company utilizes securities available for sale as a tool for managing interest rate risk, enhancing income through interest and dividend income, to provide liquidity and to provide collateral for certain deposits and borrowings. As of
December 31, 2015
, securities available for sale were
$394,124,000
, a
$17,925,000
increase
from the
December 31, 2014
balance of
$376,199,000
. Despite higher end of year balances, the average balance of securities declined from
$413,072,000
for the year ended
December 31, 2014
to
$381,668,000
for the year ended
December 31, 2015
, and reflects proceeds from repayments used to partially fund loan growth.
The Company has established investment policies and an asset management policy to assist in administering its investment portfolio. Decisions to purchase or sell these securities are based on economic conditions and management’s strategy to respond to changes in interest rates, liquidity, pledges to secure deposits and Repurchase Agreements and other factors while trying to maximize return on the investments. Under GAAP, the Company may segregate its investment portfolio into three categories: “securities held to maturity”, “trading securities” and “securities available for sale.” Management has classified the entire securities portfolio as available for sale. Securities available for sale are to be accounted for at their current market value with unrealized gains and losses on such securities to be excluded from earnings and reported as a net amount in other comprehensive income.
The Company’s securities available for sale include debt and equity instruments that are subject to varying degrees of credit and market risk. This risk arises from general market conditions, factors impacting specific industries, as well as news that may impact specific issues. Management continuously monitors its debt securities, including updates of credit ratings, monitoring market, industry and segment news, as well as volatility in market prices. The Company uses various indicators in determining whether a debt security is other-than- temporarily-impaired, including the extent of time the security has been in an unrealized loss position, and the extent of the unrealized loss. In addition, management assesses whether it is likely the Company will have to sell the security prior to recovery, or if it is able to hold the security until the price recovers. For those debt securities in which management concludes the security is other than temporarily impaired, it will recognize the credit component of an other-than-temporary impairment in earnings and the remaining portion in other comprehensive income. Given the strong asset quality of the debt security portfolio, management has not had to take an other-than-temporary impairment charge in
2015
,
2014
or
2013
.
For equity securities, when the Company has decided to sell an impaired available-for-sale security and does not expect the fair value of the security to fully recover before the expected time of sale, the security is deemed other-than-temporarily impaired in the period in which the decision to sell is made. The Company recognizes an impairment loss when the impairment is deemed other than temporary even if a decision to sell has not been made. The Company recorded no other than temporary impairment expense on equity securities for the years ended
December 31, 2015
,
2014
and
2013
.
34
The following table shows the fair value of securities available for sale at December 31:
|
(Dollars in thousands)
|
2015
|
2014
|
2013
|
||||||||
|
U.S. Government Agencies
|
$
|
47,227
|
|
$
|
23,958
|
|
$
|
25,451
|
|
||
|
U.S. Government Sponsored Enterprises (GSE)
|
0
|
|
0
|
|
13,714
|
|
|||||
|
States and political subdivisions
|
125,961
|
|
52,401
|
|
71,544
|
|
|||||
|
GSE residential mortgage-backed securities
|
132,349
|
|
175,596
|
|
198,619
|
|
|||||
|
GSE residential collateralized mortgage obligations (CMOs)
|
15,843
|
|
58,705
|
|
40,532
|
|
|||||
|
GSE commercial CMOs
|
63,770
|
|
65,472
|
|
57,014
|
|
|||||
|
Private label CMOs
|
8,901
|
|
0
|
|
0
|
|
|||||
|
Total debt securities
|
394,051
|
|
376,132
|
|
406,874
|
|
|||||
|
Equity securities
|
73
|
|
67
|
|
69
|
|
|||||
|
Totals
|
$
|
394,124
|
|
$
|
376,199
|
|
$
|
406,943
|
|
||
The securities available for sale portfolio
increase
$17,925,000
, or
4.8%
, from
$376,199,000
at
December 31, 2014
to
$394,124,000
at
December 31, 2015
. The increase in the securities portfolio during
2015
was consistent with the Company's intention to increase the size of the balance sheet to enhance interest income. During
2015
and
2014
, the Company’s access to off-balance sheet liquidity improved as substantial progress was made in addressing loan quality issues. As the Company’s access to off-balance sheet liquidity improved, it allowed for the investment of funds previously held at the Federal Reserve Bank and included in interest bearing deposits with banks, into higher yielding, longer duration, securities available for sale.
As it is anticipated the loan portfolio will grow in 2016, repayments from mortgage-backed securities or collateralized mortgage-backed obligations will be used to partially meet this loan demand, as these instruments provide monthly cash flows that may be reinvested in the loan portfolio. Despite the Company having a net operating loss for tax purposes, the yields available on state and political subdivision securities were attractive during 2015, and this factored into our consideration to increase holdings in state and political subdivisions, while decreasing our investment in GSE residential mortgage-backed and CMO securities. The Company also invested in private label CMOs in the fourth quarter of 2015 as they too provided attractive yields, and may continue to represent a larger portion of the securities available for sale portfolio going forward.
As a result of changes in interest rate and economic market conditions, in the first quarter of 2016, the Company evaluated its GSE commercial CMO security portfolio and elected to liquidate this entire portfolio, which had a book value of $63,598,000 at December 31, 2015, at a net gain of $1,419,000. The proceeds from the sales will be used to pay down maturing debt, meet loan demand, or be reinvested in the securities portfolio.
35
The following table shows the maturities of investment securities at book value as of
December 31, 2015
, and weighted average yields of such securities. Yields are shown on a tax equivalent basis, assuming a 35% federal income tax rate.
|
(Dollars in thousands)
|
Within 1
year
|
After 1 year
but within 5
years
|
After 5 years
but within
10 years
|
After 10
years
|
Total
|
||||||||||||||
|
U. S. Government Agencies
|
|||||||||||||||||||
|
Book value
|
$
|
0
|
|
$
|
0
|
|
$
|
1,071
|
|
$
|
46,138
|
|
$
|
47,209
|
|
||||
|
Yield
|
0.00
|
%
|
0.00
|
%
|
1.04
|
%
|
1.30
|
%
|
1.30
|
%
|
|||||||||
|
Average maturity (years)
|
0.0
|
|
0.0
|
|
7.7
|
|
22.9
|
|
22.6
|
|
|||||||||
|
States and political subdivisions
|
|||||||||||||||||||
|
Book value
|
365
|
|
3,244
|
|
61,844
|
|
58,968
|
|
124,421
|
|
|||||||||
|
Yield
|
4.88
|
%
|
3.38
|
%
|
3.06
|
%
|
4.41
|
%
|
3.72
|
%
|
|||||||||
|
Average maturity (years)
|
0.4
|
|
4.8
|
|
7.9
|
|
17.2
|
|
12.2
|
|
|||||||||
|
GSE residential mortgage-backed securities
|
|||||||||||||||||||
|
Book value
|
0
|
|
0
|
|
0
|
|
132,389
|
|
132,389
|
|
|||||||||
|
Yield
|
0.00
|
%
|
0.00
|
%
|
0.00
|
%
|
1.79
|
%
|
1.79
|
%
|
|||||||||
|
Average maturity (years)
|
0.0
|
|
0.0
|
|
0.0
|
|
45.4
|
|
45.4
|
|
|||||||||
|
GSE residential collateralized mortgage obligations (CMO)
|
|||||||||||||||||||
|
Book value
|
0
|
|
0
|
|
0
|
|
15,668
|
|
15,668
|
|
|||||||||
|
Yield
|
0.00
|
%
|
0.00
|
%
|
0.00
|
%
|
2.57
|
%
|
2.57
|
%
|
|||||||||
|
Average maturity (years)
|
0.0
|
|
0.0
|
|
0.0
|
|
20.8
|
|
20.8
|
|
|||||||||
|
GSE commercial CMOs
|
|||||||||||||||||||
|
Book value
|
0
|
|
13,843
|
|
40,069
|
|
9,686
|
|
63,598
|
|
|||||||||
|
Yield
|
0.00
|
%
|
1.69
|
%
|
2.68
|
%
|
2.00
|
%
|
2.36
|
%
|
|||||||||
|
Average maturity (years)
|
0.0
|
|
3.7
|
|
6.8
|
|
29.6
|
|
9.6
|
|
|||||||||
|
Private label CMOs
|
|||||||||||||||||||
|
Book value
|
0
|
|
0
|
|
0
|
|
8,944
|
|
8,944
|
|
|||||||||
|
Yield
|
0.00
|
%
|
0.00
|
%
|
0.00
|
%
|
1.35
|
%
|
1.35
|
%
|
|||||||||
|
Average maturity (years)
|
0.0
|
|
0.0
|
|
0.0
|
|
20.6
|
|
20.6
|
|
|||||||||
|
Total
|
|||||||||||||||||||
|
Book value
|
$
|
365
|
|
$
|
17,087
|
|
$
|
102,984
|
|
$
|
271,793
|
|
$
|
392,229
|
|
||||
|
Yield
|
4.88
|
%
|
2.01
|
%
|
2.89
|
%
|
2.31
|
%
|
2.45
|
%
|
|||||||||
|
Average maturity (years)
|
0.4
|
|
3.9
|
|
7.5
|
|
32.7
|
|
24.8
|
|
|||||||||
The average maturity is based on the contractual terms of the debt or mortgage-backed securities, and does not factor into required repayments or anticipated prepayments that may exist. As of
December 31, 2015
, the weighted average estimated life of the mortgage-backed and collateralized mortgage obligation securities is less than 4.3 years based on current interest rates and anticipated prepayment speeds.
Loan Portfolio
The Company offers various products to meet the credit needs of our borrowers, principally consisting of commercial real estate loans, commercial and industrial loans, and retail loans consisting of loans secured by residential properties, and to a lesser extent, installment loans. No loans are extended to non-domestic borrowers or governments.
With certain exceptions, we are permitted under applicable law to make loans to single borrowers (including certain related persons and entities) in aggregate amounts of up to 15% of the sum of total capital and the allowance for loan losses. The Company’s legal lending limit to one borrower was approximately $18,700,000 at
December 31, 2015
. As of December 31, 2015, the Company had one relationship with an outstanding exposure totaling $19,076,000; however this relationship's total outstanding did not exceed the legal lending limit at the time of loan origination and, therefore, was legal when made.
36
The risks associated with lending activities differ among the various loan classes, and are subject to the impact of changes in interest rates, market conditions of collateral securing the loans, and general economic conditions. All of these factors may adversely impact the borrower’s ability to repay its loans, and impact the associated collateral. For a further discussion on the types of loans the Company makes and related risks, please see Note 4 – “Loans Receivable and Allowance for Loan Losses” in the Notes to the Consolidated Financial Statements, which is incorporated herein by reference.
The loan portfolio, excluding residential loans held for sale, broken out by classes as of December 31 is as follows:
|
(Dollars in thousands)
|
December 31, 2015
|
December 31, 2014
|
December 31, 2013
|
December 31, 2012
|
December 31, 2011
|
||||||||||||||
|
Commercial real estate:
|
|||||||||||||||||||
|
Owner-occupied
|
$
|
103,578
|
|
$
|
100,859
|
|
$
|
111,290
|
|
$
|
144,290
|
|
$
|
199,646
|
|
||||
|
Non-owner occupied
|
145,401
|
|
144,301
|
|
135,953
|
|
120,930
|
|
141,037
|
|
|||||||||
|
Multi-family
|
35,109
|
|
27,531
|
|
22,882
|
|
21,745
|
|
27,327
|
|
|||||||||
|
Non-owner occupied residential
|
54,175
|
|
49,315
|
|
55,272
|
|
66,381
|
|
147,027
|
|
|||||||||
|
Acquisition and development:
|
|||||||||||||||||||
|
1-4 family residential construction
|
9,364
|
|
5,924
|
|
3,338
|
|
2,850
|
|
7,098
|
|
|||||||||
|
Commercial and land development
|
41,339
|
|
24,237
|
|
19,440
|
|
30,375
|
|
77,564
|
|
|||||||||
|
Commercial and industrial
|
73,625
|
|
48,995
|
|
33,446
|
|
39,340
|
|
71,084
|
|
|||||||||
|
Municipal
|
57,511
|
|
61,191
|
|
60,996
|
|
68,018
|
|
59,789
|
|
|||||||||
|
Residential mortgage:
|
|||||||||||||||||||
|
First lien
|
126,022
|
|
126,491
|
|
124,728
|
|
108,601
|
|
104,327
|
|
|||||||||
|
Home equity – term
|
17,337
|
|
20,845
|
|
20,131
|
|
14,747
|
|
37,513
|
|
|||||||||
|
Home equity – lines of credit
|
110,731
|
|
89,366
|
|
77,377
|
|
79,448
|
|
80,951
|
|
|||||||||
|
Installment and other loans
|
7,521
|
|
5,891
|
|
6,184
|
|
7,014
|
|
12,077
|
|
|||||||||
|
$
|
781,713
|
|
$
|
704,946
|
|
$
|
671,037
|
|
$
|
703,739
|
|
$
|
965,440
|
|
|||||
In addition to the Company monitoring its loan portfolio as segregated by loan class noted above, it also monitors concentrations by industry. The Bank’s lending policy defines an industry concentration as one that exceeds 25% of the Bank’s total risk-based capital (RBC). The following industries meet the concentration criteria defined by the Bank’s Lending Policy at
December 31, 2015
:
|
(Dollars in thousands)
|
Balance
|
% of Total Loans
|
% of Total RBC
|
||
|
Office space
|
$60,300
|
7.7%
|
50.8%
|
||
|
Hotels (except casinos)
|
30,900
|
4.0%
|
26.0%
|
||
The loan portfolio at
December 31, 2015
of
$781,713,000
increased
$76,767,000
, or 10.9%, from
$704,946,000
at
December 31, 2014
. In 2015, loan growth was experienced in all loan segments, with the exception of municipal loans, as our sales and market efforts have increased after our regulatory issues were resolved, and asset quality improved. The largest increase was in the commercial and industrial loan segment, which grew by $24,630,000, or nearly one-third of the total growth, as our sales efforts focused on expanding this portfolio.
Despite the increase in loans in 2015, the total loan portfolio remains below the
$965,440,000
at December 31, 2011 that represented the Company’s highest balance for the five years presented. The Company’s desire to improve its asset quality during 2012 and 2013 resulted in its disposal of a portion of its distressed asset portfolio, with an aggregate carrying balance of $73,820,000 during 2012. In addition, elevated charge-off levels were experienced in the commercial loan portfolio during 2012, primarily in the non-owner occupied, owner-occupied and commercial and land development portfolios. Given the softness in the economy within the Company’s market area, management felt this was a prudent course of action in order to rehabilitate its loan portfolio during these years. As a result of improved asset quality in 2013, the Company, in the second half of the year, again solicited current customers for new lending opportunities, as well as broadened its relationships within existing markets, and entered new markets. In 2014, growth was achieved in the loan portfolio despite active loan collection
37
efforts, in which the Company collected approximately $21,800,000 in pay downs/payoffs, charge-offs, loan sales or foreclosure on nonaccrual loans.
Growth was experienced in the residential mortgage portfolio segment, which totaled
$254,090,000
at
December 31, 2015
, a
7.3%
increase over
$236,702,000
at
December 31, 2014
, with the majority of the growth achieved in the home equity lines of credit class. This trend has developed over the past two years, as the Company continues to market this residential mortgage product as it provides attractive yields and shorter durations than first lien residential mortgages.
Competition for new business opportunities remains strong, which may temper loan growth in future quarters. However, we anticipate hiring additional lenders in order to capitalize on disruptions that has been caused by the acquisition of some of the competitors in the markets served by larger institutions.
Presented below are the expected maturities of certain loans by type, and whether they are fixed-rate or adjustable rate loans as of
December 31, 2015
.
|
|
Due In
|
|
|||||||||||||
|
(Dollars in thousands)
|
One Year
or Less
|
One
Year Through
Five Years
|
After Five
Years
|
Total
|
|||||||||||
|
Acquisition and development:
|
|||||||||||||||
|
1-4 family residential construction
|
|||||||||||||||
|
Fixed rate
|
$
|
1,002
|
|
$
|
0
|
|
$
|
3,749
|
|
$
|
4,751
|
|
|||
|
Adjustable and floating rate
|
419
|
|
733
|
|
3,461
|
|
4,613
|
|
|||||||
|
1,421
|
|
733
|
|
7,210
|
|
9,364
|
|
||||||||
|
Commercial and land development
|
|||||||||||||||
|
Fixed rate
|
1,353
|
|
861
|
|
12,263
|
|
14,477
|
|
|||||||
|
Adjustable and floating rate
|
367
|
|
5,589
|
|
20,906
|
|
26,862
|
|
|||||||
|
1,720
|
|
6,450
|
|
33,169
|
|
41,339
|
|
||||||||
|
Commercial and industrial
|
|||||||||||||||
|
Fixed rate
|
197
|
|
8,008
|
|
13,656
|
|
21,861
|
|
|||||||
|
Adjustable and floating rate
|
33,423
|
|
4,834
|
|
13,507
|
|
51,764
|
|
|||||||
|
33,620
|
|
12,842
|
|
27,163
|
|
73,625
|
|
||||||||
|
$
|
36,761
|
|
$
|
20,025
|
|
$
|
67,542
|
|
$
|
124,328
|
|
||||
The final maturity is used in the determination of maturity of acquisition and development loans that convert from construction to permanent status. Variable rate loans shown above include semi-fixed loans that contractually will adjust with prime or LIBOR after the interest lock period which may be up to 10 years. At
December 31, 2015
, there were approximately $17,175,000 of such loans.
Asset Quality
Risk Elements
The Company’s loan portfolios are subject to varying degrees of credit risk. Credit risk is mitigated through the Company’s underwriting standards, on-going credit reviews, and monitoring asset quality measures. Additionally, loan portfolio diversification, limiting exposure to a single industry or borrower, and requiring collateral also mitigate the Company’s risk of credit loss.
The Company’s loan portfolio is principally to borrowers in south central Pennsylvania and Washington County, Maryland. As the majority of loans are concentrated in this geographic region, a substantial portion of the debtor’s ability to honor their obligations may be affected by the level of economic activity in the market area.
Nonperforming assets include nonaccrual loans and foreclosed real estate. In addition, restructured loans still accruing and loans past due 90 days or more and still accruing are also deemed to be risk assets. For all loan classes, generally the accrual of interest income ceases when principal or interest is past due 90 days or more and collateral is inadequate to cover principal and interest or immediately if, in the opinion of management, full collection is unlikely. Interest will continue to accrue on loans past due 90 days or more if the collateral is adequate to cover principal and interest, and the loan is in the process of collection. Interest accrued, but not collected, as of the date of placement on nonaccrual status, is generally reversed and charged against interest income, unless fully collateralized. Subsequent payments received are either applied to the outstanding principal
38
balance or recorded as interest income, depending on management’s assessment of the ultimate collectability of principal. Loans are returned to accrual status, for all loan classes, when all the principal and interest amounts contractually due are brought current, the loans have performed in accordance with the contractual terms of the note for a reasonable period of time, generally six months, and the ultimate collectability of the total contractual principal and interest is reasonably assured. Past due status is based on contract terms of the loan.
Loans, the terms of which are modified, are classified as troubled debt restructurings ("TDRs") if, in connection with the modification, a concession was granted, for legal or economic reasons, related to a debtor’s financial difficulties. Concessions granted under a TDR typically involve a temporary deferral of scheduled loan payments, an extension of a loan’s stated maturity date, temporary reduction in interest rates, or below market rates given the risk of the transaction. If a modification occurs while the loan is on accruing status, it will continue to accrue interest under the modified terms. Nonaccrual TDRs may be restored to accrual status if scheduled principal and interest payments, under the modified terms, are current for six months after modification, and the borrower continues to demonstrate its ability to meet the modified terms. TDRs are evaluated individually for impairment if they have been restructured during the most recent calendar year, or if they are not performing according to their modified terms.
The following table presents the Company’s risk elements, including information concerning the aggregate balances of nonaccrual, restructured, loans past due 90 days or more, and foreclosed real estate as of December 31. Relevant asset quality ratios are also presented.
|
(Dollars in thousands)
|
2015
|
2014
|
2013
|
2012
|
2011
|
||||||||||||||
|
Nonaccrual loans (cash basis)
|
$
|
16,557
|
|
$
|
14,432
|
|
$
|
19,347
|
|
$
|
17,943
|
|
$
|
83,697
|
|
||||
|
Other real estate owned (OREO)
|
710
|
|
932
|
|
987
|
|
1,876
|
|
2,165
|
|
|||||||||
|
Total nonperforming assets
|
17,267
|
|
15,364
|
|
20,334
|
|
19,819
|
|
85,862
|
|
|||||||||
|
Restructured loans still accruing
|
793
|
|
1,100
|
|
5,988
|
|
3,092
|
|
27,917
|
|
|||||||||
|
Loans past due 90 days or more and still accruing
|
24
|
|
0
|
|
0
|
|
0
|
|
0
|
|
|||||||||
|
Total nonperforming and other risk assets
|
$
|
18,084
|
|
$
|
16,464
|
|
$
|
26,322
|
|
$
|
22,911
|
|
$
|
113,779
|
|
||||
|
Loans 30-89 days past due
|
$
|
2,532
|
|
$
|
1,612
|
|
$
|
3,963
|
|
$
|
3,578
|
|
$
|
6,723
|
|
||||
|
Ratio of:
|
|||||||||||||||||||
|
Total nonperforming loans to loans
|
2.12
|
%
|
2.05
|
%
|
2.88
|
%
|
2.55
|
%
|
8.67
|
%
|
|||||||||
|
Total nonperforming assets to assets
|
1.34
|
%
|
1.29
|
%
|
1.73
|
%
|
1.61
|
%
|
5.95
|
%
|
|||||||||
|
Total nonperforming assets to total loans and OREO
|
2.21
|
%
|
2.18
|
%
|
3.03
|
%
|
2.81
|
%
|
8.87
|
%
|
|||||||||
|
Total risk assets to total loans and OREO
|
2.31
|
%
|
2.33
|
%
|
3.92
|
%
|
3.25
|
%
|
11.76
|
%
|
|||||||||
|
Total risk assets to total assets
|
1.40
|
%
|
1.38
|
%
|
2.23
|
%
|
1.86
|
%
|
7.88
|
%
|
|||||||||
|
Allowance for loan losses to total loans
|
1.74
|
%
|
2.09
|
%
|
3.12
|
%
|
3.29
|
%
|
4.53
|
%
|
|||||||||
|
Allowance for loan losses to nonperforming loans
|
81.95
|
%
|
102.18
|
%
|
108.36
|
%
|
129.11
|
%
|
52.23
|
%
|
|||||||||
|
Allowance for loan losses to nonperforming loans and restructured loans still accruing
|
78.20
|
%
|
94.95
|
%
|
82.75
|
%
|
110.13
|
%
|
39.17
|
%
|
|||||||||
39
A further breakdown of impaired loans at
December 31, 2015
and
2014
is as follows:
|
|
2015
|
2014
|
|||||||||||||||||||||
|
(Dollars in thousands)
|
Nonaccrual
Loans
|
Restructured
Loans Still
Accruing
|
Total
|
Nonaccrual
Loans
|
Restructured
Loans Still
Accruing
|
Total
|
|||||||||||||||||
|
Commercial real estate:
|
|||||||||||||||||||||||
|
Owner occupied
|
$
|
2,109
|
|
$
|
0
|
|
$
|
2,109
|
|
$
|
3,288
|
|
$
|
0
|
|
$
|
3,288
|
|
|||||
|
Non-owner occupied
|
7,856
|
|
0
|
|
7,856
|
|
1,680
|
|
0
|
|
1,680
|
|
|||||||||||
|
Multi-family
|
233
|
|
0
|
|
233
|
|
320
|
|
0
|
|
320
|
|
|||||||||||
|
Non-owner occupied residential
|
895
|
|
0
|
|
895
|
|
1,500
|
|
0
|
|
1,500
|
|
|||||||||||
|
Acquisition and development
|
|||||||||||||||||||||||
|
Commercial and land development
|
5
|
|
0
|
|
5
|
|
123
|
|
287
|
|
410
|
|
|||||||||||
|
Commercial and industrial
|
734
|
|
0
|
|
734
|
|
2,437
|
|
0
|
|
2,437
|
|
|||||||||||
|
Residential mortgage:
|
|||||||||||||||||||||||
|
First lien
|
4,015
|
|
793
|
|
4,808
|
|
4,509
|
|
813
|
|
5,322
|
|
|||||||||||
|
Home equity – term
|
103
|
|
0
|
|
103
|
|
70
|
|
0
|
|
70
|
|
|||||||||||
|
Home equity – lines of credit
|
590
|
|
0
|
|
590
|
|
479
|
|
0
|
|
479
|
|
|||||||||||
|
Installment and other loans
|
17
|
|
0
|
|
17
|
|
26
|
|
0
|
|
26
|
|
|||||||||||
|
$
|
16,557
|
|
$
|
793
|
|
$
|
17,350
|
|
$
|
14,432
|
|
$
|
1,100
|
|
$
|
15,532
|
|
||||||
In the second quarter of 2011, the Company began to experience deterioration in asset quality as a result of the continued softness in economic conditions and collateral values. Subsequent to the highs levels of nonperforming assets and restructured loans recorded in 2011, the Company continued to actively identify and monitor nonperforming assets and other risk assets, and has acted aggressively to address the credit quality issues. Risk assets, defined as nonaccrual loans, restructured and loans past due 90 days or more and still accruing, and real estate owned, declined from the high of $113,779,000 at December 31, 2011, to
$18,084,000
at
December 31, 2015
. One strategy employed by the Company in 2012 to reduce its level of non-performing loans included two bulk sales of distressed assets. The bulk sales allowed the Company to sell nearly 240 loans with an aggregate carrying balance of $73,820,000 to third parties, which netted the Company $51,753,000 in cash proceeds. The difference between the carrying balance of the loans sold and the cash received, or $22,067,000, was recorded as a charge to the allowance for loan losses.
Risk assets at
December 31, 2015
totaled
$18,084,000
, an increase of $1,620,000, or
9.8%
, from
December 31, 2014
’s balance of
$16,464,000
. Efforts have been made by Company personnel to work through risk assets in order to reduce the risk of future credit losses in the portfolio, and resulted in a decline in the number of risk assets. However, one relationship with potential weaknesses totaling $6,542,000 was identified in 2015 and was moved to nonaccrual status, and resulted in a net increase in nonaccrual loans of $2,125,000 between December 31, 2014 to December 31, 2015. Restructured loans still accruing were
$793,000
at
December 31, 2015
, a decrease of
$307,000
, from the prior year end, which was primarily the result of the full payoff of one restructured loan totaling $287,000.
The allowance for loan losses totaled
$13,568,000
at
December 31, 2015
, a
$1,179,000
decrease from
$14,747,000
at
December 31, 2014
, due to a negative provision for loan losses of
$603,000
recorded in
2015
, combined with net charge-offs of
$576,000
for the year. As a result of the migration of one large relationship to nonaccrual status during 2015 and the decrease in the allowance for loan losses, the Company's allowance coverage ratios declined. The allowance for loan losses to nonperforming loans totaled 82.0% at December 31, 2015 compared to 102.2% at December 31, 2014, and the allowance for loan losses to nonperforming loans and restructured loans still accruing totaled 78.2% at December 31, 2015 compared to 95.0% at December 31, 2014. Management believes the allowance for loan losses to total loans ratio remains strong at
1.74%
at
December 31, 2015
. The Company's ratio of classified loans to Tier 1 capital and the allowance for loans losses totaled 18.9%, the lowest this key ratio has been for the five years presented. The Company continues to work through its nonaccrual loans and other risk elements, in an attempt to reduce the levels of these under-performing assets, and to the extent possible, recover amounts previously charged-off. As new information is learned about borrowers or updated appraisals on real estate with lower fair values are obtained, the Company may continue to experience additional impaired loans.
For the years ended December 31, 2015, 2014, and 2013 recoveries of $926,000, $1,423,0000 and $6,676,000 have been credited to the allowance for loan losses, with recoveries on two large relationships contributing $5,639,000 to the 2013 total.
40
These recoveries on previously charged-off relationships are the result of successful loan monitoring and workout solutions. Although recoveries are difficult to predict, additional recoveries that the Company receives will be used to replenish the allowance for loan losses. These recoveries favorably impacted historical charge-off factors, which contributed to changes in quantitative and qualitative factors used during 2015, 2014 and 2013 and the negative provisions for loan losses that were recorded. Future negative provisions could result if it is determined that the reserve is adequate at the time of recovery. However, as charge-offs stabilize, and the loan portfolio continues to grow, future provisions for loan losses may result and be charged to operations in subsequent periods.
As of
December 31, 2015
, the Company had
84
lending relationships that had loans that were considered impaired, and were included in the impaired loan balance of
$17,350,000
, compared to 94 lending relationships with an impaired loan balance of $15,532,000 at
December 31, 2014
. The exposure to these borrowers with impaired loans is summarized in the following table, along with the partial charge-offs taken to date and the specific reserves established on the relationships at
December 31, 2015
and
2014
.
|
(Dollars in thousands)
|
# of
Relationships
|
Recorded
Investment
|
Partial
Charge-offs
to Date
|
Specific
Reserves
|
||||||||||
|
December 31, 2015
|
||||||||||||||
|
Relationships greater than $1,000,000
|
1
|
|
$
|
6,542
|
|
$
|
0
|
|
$
|
0
|
|
|||
|
Relationships greater than $500,000 but less than $1,000,000
|
2
|
|
1,578
|
|
475
|
|
164
|
|
||||||
|
Relationships greater than $250,000 but less than $500,000
|
7
|
|
2,659
|
|
188
|
|
0
|
|
||||||
|
Relationships less than $250,000
|
74
|
|
6,571
|
|
1,294
|
|
125
|
|
||||||
|
84
|
|
$
|
17,350
|
|
$
|
1,957
|
|
$
|
289
|
|
||||
|
December 31, 2014
|
||||||||||||||
|
Relationships greater than $1,000,000
|
2
|
|
$
|
3,687
|
|
$
|
0
|
|
$
|
0
|
|
|||
|
Relationships greater than $500,000 but less than $1,000,000
|
2
|
|
1,156
|
|
0
|
|
0
|
|
||||||
|
Relationships greater than $250,000 but less than $500,000
|
11
|
|
3,558
|
|
804
|
|
0
|
|
||||||
|
Relationships less than $250,000
|
79
|
|
7,131
|
|
3,421
|
|
188
|
|
||||||
|
94
|
|
$
|
15,532
|
|
$
|
4,225
|
|
$
|
188
|
|
||||
The Company takes partial charge-offs on collateral dependent loans whose carrying value exceeded their estimated fair value, as determined by the most recent appraisal adjusted for current (within the quarter) conditions, less costs to dispose. ASC 310 impairment reserves remain in those situations in which updated appraisals are pending, and represent management’s estimate of potential loss.
Of the relationships deemed to be impaired at
December 31, 2015
, one had an outstanding book balance in excess of $1,000,000, totaling $6,542,000 or 37.7% of the total impaired loan balance. Seventy-four of the relationships, or 88.1% of the total number of impaired relationships, had recorded balances less than $250,000.
The largest impaired loan relationship, with an outstanding balance of $6,542,000 migrated to impaired status during the third quarter of 2015. Despite the loan being current as to both principal and interest, the Company moved this loan, which is secured by non-owner occupied commercial property, to impaired status as the long-term revenue stream and the guarantors' ability to keep the loan current have weakened. The Company believes the loan is well secured, and no loss is anticipated at this time.
In its individual loan impairment analysis, the Company determines the extent of any full or partial charge-offs that may be required, or any ASC 310 reserves that may be needed. The determination of the Company’s charge-offs or impairment reserve determination included an evaluation of the outstanding loan balance, and the related collateral securing the credit. Through a combination of collateral securing the loans and partial charge-offs taken to date, the Company believes that it has adequately provided for the potential losses that it may incur on these relationships as of December 31, 2015. However, over time, additional information may become known that could result in increased reserve allocations or, alternatively, it may be deemed that the reserve allocations exceed those that are needed.
41
The Company’s foreclosed real estate balance of $710,000 at December 31, 2015 consisted of 11 properties, eight of which were commercial properties and totaled $405,000, and three residential properties that totaled $305,000. All properties have carrying values less than $165,000 and are carried at the lower of cost or fair value, less costs to dispose.
As of
December 31, 2015
, the Company believes the value of foreclosed assets represents their fair values, but if the real estate market remains challenging, additional charges may be needed. During 2015, writedown of other real estate owned properties totaled $46,000.
Credit Risk Management
Allowance for Loan Losses
The Company maintains the allowance for loan losses at a level believed adequate by management for probable incurred credit losses. The allowance is established and maintained through a provision for loan losses charged to earnings. Quarterly, management assesses the adequacy of the allowance for loan losses utilizing a defined methodology, which considers specific credit evaluation of impaired loans, past loan loss historical experience, and qualitative factors. Management believes the approach properly addresses the requirements of ASC Section 310-10-35 for loans individually identified as impaired, and ASC Subtopic 450-20 for loans collectively evaluated for impairment, and other bank regulatory guidance.
The allowance for loan losses is evaluated on a regular basis by management and is based upon management’s periodic review of the collectability of the loans in light of historical experience, the nature and volume of the loan portfolio, adverse situations that may affect the borrower’s ability to repay, estimated value of any underlying collateral and prevailing economic conditions. This evaluation is inherently subjective as it requires estimates that are susceptible to significant revision as more information becomes available. See Note 4, “Loans Receivable and Allowance for Loan Losses” in the Notes to the Consolidated Financial Statements for a description of the methodology for establishing the allowance and provision for loan losses and related procedures in establishing the appropriate level of reserve, which information is incorporated herein by reference.
Prior to December 31, 2015, the look back period for historical losses was 12 quarters, weighted one-half for the most recent four quarters, and one-quarter for each of the two previous four quarter periods in order to appropriately capture the loss history in the loan segment. Effective December 31, 2015, the Company extended the look back period to 16 quarters on a prospective basis, weighted four-tenths to the most recent four quarters, and then declining by one-tenth for each of the remaining annual periods. The look back period was extended as it was determined that a longer look back period is more consistent with the duration of an economic cycle. Management considers current economic and real estate conditions, and the trends in historical charge-off percentages that resulted from applying partial charge-offs to impaired loans, and the impact of distressed loan sales during the year in determining the look back period.
42
The following summarizes the Bank’s ratings based on its internal risk rating system as of December 31:
|
(Dollars in thousands)
|
Pass
|
Special
Mention
|
Non-Impaired
Substandard
|
Impaired -
Substandard
|
Doubtful
|
Total
|
|||||||||||||||||
|
December 31, 2015
|
|||||||||||||||||||||||
|
Commercial real estate:
|
|||||||||||||||||||||||
|
Owner-occupied
|
$
|
96,715
|
|
$
|
1,124
|
|
$
|
3,630
|
|
$
|
2,109
|
|
$
|
0
|
|
$
|
103,578
|
|
|||||
|
Non-owner occupied
|
125,043
|
|
12,394
|
|
108
|
|
7,856
|
|
0
|
|
145,401
|
|
|||||||||||
|
Multi-family
|
31,957
|
|
1,779
|
|
1,140
|
|
233
|
|
0
|
|
35,109
|
|
|||||||||||
|
Non-owner occupied residential
|
50,601
|
|
1,305
|
|
1,374
|
|
895
|
|
0
|
|
54,175
|
|
|||||||||||
|
Acquisition and development:
|
|||||||||||||||||||||||
|
1-4 family residential construction
|
9,364
|
|
0
|
|
0
|
|
0
|
|
0
|
|
9,364
|
|
|||||||||||
|
Commercial and land development
|
40,181
|
|
219
|
|
934
|
|
5
|
|
0
|
|
41,339
|
|
|||||||||||
|
Commercial and industrial
|
70,967
|
|
1,380
|
|
544
|
|
734
|
|
0
|
|
73,625
|
|
|||||||||||
|
Municipal
|
57,511
|
|
0
|
|
0
|
|
0
|
|
0
|
|
57,511
|
|
|||||||||||
|
Residential mortgage:
|
|||||||||||||||||||||||
|
First lien
|
121,214
|
|
0
|
|
0
|
|
4,808
|
|
0
|
|
126,022
|
|
|||||||||||
|
Home equity – term
|
17,234
|
|
0
|
|
0
|
|
103
|
|
0
|
|
17,337
|
|
|||||||||||
|
Home equity – lines of credit
|
109,731
|
|
230
|
|
180
|
|
590
|
|
0
|
|
110,731
|
|
|||||||||||
|
Installment and other loans
|
7,504
|
|
0
|
|
0
|
|
17
|
|
0
|
|
7,521
|
|
|||||||||||
|
$
|
738,022
|
|
$
|
18,431
|
|
$
|
7,910
|
|
$
|
17,350
|
|
$
|
0
|
|
$
|
781,713
|
|
||||||
|
December 31, 2014
|
|||||||||||||||||||||||
|
Commercial real estate:
|
|||||||||||||||||||||||
|
Owner-occupied
|
$
|
89,815
|
|
$
|
2,686
|
|
$
|
5,070
|
|
$
|
3,288
|
|
$
|
0
|
|
$
|
100,859
|
|
|||||
|
Non-owner occupied
|
120,829
|
|
20,661
|
|
1,131
|
|
1,680
|
|
0
|
|
144,301
|
|
|||||||||||
|
Multi-family
|
24,803
|
|
1,086
|
|
1,322
|
|
320
|
|
0
|
|
27,531
|
|
|||||||||||
|
Non-owner occupied residential
|
43,020
|
|
2,968
|
|
1,827
|
|
1,500
|
|
0
|
|
49,315
|
|
|||||||||||
|
Acquisition and development:
|
|||||||||||||||||||||||
|
1-4 family residential construction
|
5,924
|
|
0
|
|
0
|
|
0
|
|
0
|
|
5,924
|
|
|||||||||||
|
Commercial and land development
|
22,261
|
|
233
|
|
1,333
|
|
410
|
|
0
|
|
24,237
|
|
|||||||||||
|
Commercial and industrial
|
43,794
|
|
850
|
|
1,914
|
|
2,437
|
|
0
|
|
48,995
|
|
|||||||||||
|
Municipal
|
61,191
|
|
0
|
|
0
|
|
0
|
|
0
|
|
61,191
|
|
|||||||||||
|
Residential mortgage:
|
|||||||||||||||||||||||
|
First lien
|
121,160
|
|
9
|
|
0
|
|
5,290
|
|
32
|
|
126,491
|
|
|||||||||||
|
Home equity – term
|
20,775
|
|
0
|
|
0
|
|
70
|
|
0
|
|
20,845
|
|
|||||||||||
|
Home equity – lines of credit
|
88,164
|
|
630
|
|
93
|
|
479
|
|
0
|
|
89,366
|
|
|||||||||||
|
Installment and other loans
|
5,865
|
|
0
|
|
0
|
|
26
|
|
0
|
|
5,891
|
|
|||||||||||
|
$
|
647,601
|
|
$
|
29,123
|
|
$
|
12,690
|
|
$
|
15,500
|
|
$
|
32
|
|
$
|
704,946
|
|
||||||
Potential problem loans are defined as performing loans, which have characteristics that cause management to have concerns as to the ability of the borrower to perform under present loan repayment terms and which may result in the reporting of these loans as non-performing loans in the future. Generally, management feels that “Substandard” loans that are currently performing and not considered impaired, result in some doubt as to the borrower’s ability to continue to perform under the terms of the loan, and represent potential problem loans. Additionally, the “Special Mention” classification is intended to be a temporary classification, and is reflective of loans that have potential weaknesses that may, if not monitored or corrected, weaken the asset or inadequately protect the Bank’s position at some future date. “Special Mention” loans represent an elevated risk, but their weakness does not yet justify a more severe, or classified rating. These loans require follow-up by lenders on the information that may cause the potential weakness, and once resolved, the loan classification may be downgraded to “Substandard,” or alternatively, could be upgraded to “Pass.”
43
The following summarizes the average recorded investment in impaired loans and related interest income recognized, on loans deemed impaired on a cash basis, and interest income earned but not recognized for the years ended
December 31, 2015
,
2014
,
2013
,
2012
and
2011
:
|
(Dollars in thousands)
|
Average
Impaired
Balance
|
Interest
Income
Recognized
|
Interest
Earned
But Not
Recognized
|
||||||||
|
December 31, 2015
|
|||||||||||
|
Commercial real estate:
|
|||||||||||
|
Owner-occupied
|
$
|
2,613
|
|
$
|
0
|
|
$
|
177
|
|
||
|
Non-owner occupied
|
3,470
|
|
0
|
|
256
|
|
|||||
|
Multi-family
|
402
|
|
0
|
|
15
|
|
|||||
|
Non-owner occupied residential
|
1,020
|
|
0
|
|
56
|
|
|||||
|
Acquisition and development:
|
|||||||||||
|
Commercial and land development
|
266
|
|
137
|
|
2
|
|
|||||
|
Commercial and industrial
|
1,208
|
|
0
|
|
28
|
|
|||||
|
Residential mortgage:
|
|||||||||||
|
First lien
|
4,644
|
|
37
|
|
167
|
|
|||||
|
Home equity – term
|
130
|
|
0
|
|
3
|
|
|||||
|
Home equity – lines of credit
|
571
|
|
0
|
|
29
|
|
|||||
|
Installment and other loans
|
22
|
|
0
|
|
3
|
|
|||||
|
$
|
14,346
|
|
$
|
174
|
|
$
|
736
|
|
|||
|
December 31, 2014
|
|||||||||||
|
Commercial real estate:
|
|||||||||||
|
Owner-occupied
|
$
|
3,740
|
|
$
|
20
|
|
$
|
179
|
|
||
|
Non-owner occupied
|
6,711
|
|
143
|
|
156
|
|
|||||
|
Multi-family
|
274
|
|
2
|
|
6
|
|
|||||
|
Non-owner occupied residential
|
2,095
|
|
13
|
|
62
|
|
|||||
|
Acquisition and development:
|
|||||||||||
|
Commercial and land development
|
1,250
|
|
34
|
|
59
|
|
|||||
|
Commercial and industrial
|
1,700
|
|
5
|
|
19
|
|
|||||
|
Residential mortgage:
|
|||||||||||
|
First lien
|
4,226
|
|
53
|
|
196
|
|
|||||
|
Home equity – term
|
85
|
|
0
|
|
5
|
|
|||||
|
Home equity – lines of credit
|
111
|
|
3
|
|
25
|
|
|||||
|
Installment and other loans
|
9
|
|
1
|
|
1
|
|
|||||
|
$
|
20,201
|
|
$
|
274
|
|
$
|
708
|
|
|||
|
December 31, 2013
|
|||||||||||
|
Commercial real estate:
|
|||||||||||
|
Owner-occupied
|
$
|
3,528
|
|
$
|
147
|
|
$
|
192
|
|
||
|
Non-owner occupied
|
4,307
|
|
145
|
|
44
|
|
|||||
|
Multi-family
|
135
|
|
16
|
|
6
|
|
|||||
|
Non-owner occupied residential
|
4,799
|
|
77
|
|
180
|
|
|||||
|
Acquisition and development:
|
|||||||||||
|
1-4 family residential construction
|
481
|
|
0
|
|
0
|
|
|||||
|
Commercial and land development
|
3,009
|
|
49
|
|
127
|
|
|||||
|
Commercial and industrial
|
1,780
|
|
45
|
|
46
|
|
|||||
|
Residential mortgage:
|
|||||||||||
|
First lien
|
2,697
|
|
140
|
|
103
|
|
|||||
|
Home equity – term
|
59
|
|
8
|
|
2
|
|
|||||
|
Home equity – lines of credit
|
305
|
|
6
|
|
2
|
|
|||||
|
Installment and other loans
|
1
|
|
0
|
|
0
|
|
|||||
|
$
|
21,101
|
|
$
|
633
|
|
$
|
702
|
|
|||
44
|
(Dollars in thousands)
|
Average
Impaired
Balance
|
Interest
Income
Recognized
|
Interest
Earned
But Not
Recognized
|
||||||||
|
December 31, 2012
|
|||||||||||
|
Commercial real estate:
|
|||||||||||
|
Owner-occupied
|
$
|
8,374
|
|
$
|
20
|
|
$
|
131
|
|
||
|
Non-owner occupied
|
14,372
|
|
69
|
|
260
|
|
|||||
|
Multi-family
|
3,940
|
|
0
|
|
10
|
|
|||||
|
Non-owner occupied residential
|
20,284
|
|
61
|
|
288
|
|
|||||
|
Acquisition and development:
|
|||||||||||
|
1-4 family residential construction
|
1,542
|
|
26
|
|
16
|
|
|||||
|
Commercial and land development
|
12,652
|
|
252
|
|
168
|
|
|||||
|
Commercial and industrial
|
2,691
|
|
43
|
|
55
|
|
|||||
|
Residential mortgage:
|
|||||||||||
|
First lien
|
2,700
|
|
61
|
|
73
|
|
|||||
|
Home equity – term
|
156
|
|
2
|
|
4
|
|
|||||
|
Home equity – lines of credit
|
467
|
|
15
|
|
5
|
|
|||||
|
Installment and other loans
|
8
|
|
0
|
|
0
|
|
|||||
|
$
|
67,186
|
|
$
|
549
|
|
$
|
1,010
|
|
|||
|
December 31, 2011
|
|||||||||||
|
Commercial real estate:
|
|||||||||||
|
Owner-occupied
|
$
|
4,530
|
|
$
|
369
|
|
$
|
187
|
|
||
|
Non-owner occupied
|
6,820
|
|
702
|
|
297
|
|
|||||
|
Multi-family
|
2,080
|
|
125
|
|
103
|
|
|||||
|
Non-owner occupied residential
|
22,820
|
|
1,559
|
|
267
|
|
|||||
|
Acquisition and development:
|
|||||||||||
|
1-4 family residential construction
|
489
|
|
102
|
|
1
|
|
|||||
|
Commercial and land development
|
7,456
|
|
617
|
|
375
|
|
|||||
|
Commercial and industrial
|
5,355
|
|
75
|
|
82
|
|
|||||
|
Residential mortgage:
|
|||||||||||
|
First lien
|
639
|
|
19
|
|
15
|
|
|||||
|
Home equity – term
|
685
|
|
69
|
|
1
|
|
|||||
|
Home equity – lines of credit
|
0
|
|
0
|
|
0
|
|
|||||
|
Installment and other loans
|
0
|
|
0
|
|
0
|
|
|||||
|
$
|
50,874
|
|
$
|
3,637
|
|
$
|
1,328
|
|
|||
45
Activity in the allowance for loan losses for the years ended
December 31, 2015
,
2014
,
2013
,
2012
and
2011
is as follows:
|
|
Commercial
|
Consumer
|
|
|
|||||||||||||||||||||||||||||||||||
|
(Dollars in thousands)
|
Commercial
Real Estate
|
Acquisition
and
Development
|
Commercial
and
Industrial
|
Municipal
|
Total
|
Residential
Mortgage
|
Installment
and Other
|
Total
|
Unallocated
|
Total
|
|||||||||||||||||||||||||||||
|
December 31, 2015
|
|||||||||||||||||||||||||||||||||||||||
|
Balance, beginning of year
|
$
|
9,462
|
|
$
|
697
|
|
$
|
806
|
|
$
|
183
|
|
$
|
11,148
|
|
$
|
2,262
|
|
$
|
119
|
|
$
|
2,381
|
|
$
|
1,218
|
|
$
|
14,747
|
|
|||||||||
|
Provision for loan losses
|
(1,020
|
)
|
(440
|
)
|
249
|
|
(125
|
)
|
(1,336
|
)
|
1,122
|
|
55
|
|
1,177
|
|
(444
|
)
|
(603
|
)
|
|||||||||||||||||||
|
Charge-offs
|
(711
|
)
|
(22
|
)
|
(115
|
)
|
0
|
|
(848
|
)
|
(592
|
)
|
(62
|
)
|
(654
|
)
|
0
|
|
(1,502
|
)
|
|||||||||||||||||||
|
Recoveries
|
152
|
|
615
|
|
72
|
|
0
|
|
839
|
|
78
|
|
9
|
|
87
|
|
0
|
|
926
|
|
|||||||||||||||||||
|
Balance, end of year
|
$
|
7,883
|
|
$
|
850
|
|
$
|
1,012
|
|
$
|
58
|
|
$
|
9,803
|
|
$
|
2,870
|
|
$
|
121
|
|
$
|
2,991
|
|
$
|
774
|
|
$
|
13,568
|
|
|||||||||
|
December 31, 2014
|
|||||||||||||||||||||||||||||||||||||||
|
Balance, beginning of year
|
$
|
13,215
|
|
$
|
670
|
|
$
|
864
|
|
$
|
244
|
|
$
|
14,993
|
|
$
|
3,780
|
|
$
|
124
|
|
$
|
3,904
|
|
$
|
2,068
|
|
$
|
20,965
|
|
|||||||||
|
Provision for loan losses
|
(1,674
|
)
|
92
|
|
(554
|
)
|
(61
|
)
|
(2,197
|
)
|
(960
|
)
|
107
|
|
(853
|
)
|
(850
|
)
|
(3,900
|
)
|
|||||||||||||||||||
|
Charge-offs
|
(2,637
|
)
|
(70
|
)
|
(270
|
)
|
0
|
|
(2,977
|
)
|
(587
|
)
|
(177
|
)
|
(764
|
)
|
0
|
|
(3,741
|
)
|
|||||||||||||||||||
|
Recoveries
|
558
|
|
5
|
|
766
|
|
0
|
|
1,329
|
|
29
|
|
65
|
|
94
|
|
0
|
|
1,423
|
|
|||||||||||||||||||
|
Balance, end of year
|
$
|
9,462
|
|
$
|
697
|
|
$
|
806
|
|
$
|
183
|
|
$
|
11,148
|
|
$
|
2,262
|
|
$
|
119
|
|
$
|
2,381
|
|
$
|
1,218
|
|
$
|
14,747
|
|
|||||||||
|
December 31, 2013
|
|||||||||||||||||||||||||||||||||||||||
|
Balance, beginning of year
|
$
|
13,719
|
|
$
|
3,502
|
|
$
|
1,635
|
|
$
|
223
|
|
$
|
19,079
|
|
$
|
2,275
|
|
$
|
85
|
|
$
|
2,360
|
|
$
|
1,727
|
|
$
|
23,166
|
|
|||||||||
|
Provision for loan losses
|
4,109
|
|
(6,087
|
)
|
(3,478
|
)
|
21
|
|
(5,435
|
)
|
1,845
|
|
99
|
|
1,944
|
|
341
|
|
(3,150
|
)
|
|||||||||||||||||||
|
Charge-offs
|
(4,767
|
)
|
(193
|
)
|
(132
|
)
|
0
|
|
(5,092
|
)
|
(491
|
)
|
(144
|
)
|
(635
|
)
|
0
|
|
(5,727
|
)
|
|||||||||||||||||||
|
Recoveries
|
154
|
|
3,448
|
|
2,839
|
|
0
|
|
6,441
|
|
151
|
|
84
|
|
235
|
|
0
|
|
6,676
|
|
|||||||||||||||||||
|
Balance, end of year
|
$
|
13,215
|
|
$
|
670
|
|
$
|
864
|
|
$
|
244
|
|
$
|
14,993
|
|
$
|
3,780
|
|
$
|
124
|
|
$
|
3,904
|
|
$
|
2,068
|
|
$
|
20,965
|
|
|||||||||
|
December 31, 2012
|
|||||||||||||||||||||||||||||||||||||||
|
Balance, beginning of year
|
$
|
29,559
|
|
$
|
9,708
|
|
$
|
1,085
|
|
$
|
789
|
|
$
|
41,141
|
|
$
|
933
|
|
$
|
75
|
|
$
|
1,008
|
|
$
|
1,566
|
|
$
|
43,715
|
|
|||||||||
|
Provision for loan losses
|
34,681
|
|
9,408
|
|
1,879
|
|
(566
|
)
|
45,402
|
|
2,602
|
|
135
|
|
2,737
|
|
161
|
|
48,300
|
|
|||||||||||||||||||
|
Charge-offs
|
(53,492
|
)
|
(17,721
|
)
|
(1,624
|
)
|
0
|
|
(72,837
|
)
|
(1,279
|
)
|
(143
|
)
|
(1,422
|
)
|
0
|
|
(74,259
|
)
|
|||||||||||||||||||
|
Recoveries
|
2,971
|
|
2,107
|
|
295
|
|
0
|
|
5,373
|
|
19
|
|
18
|
|
37
|
|
0
|
|
5,410
|
|
|||||||||||||||||||
|
Balance, end of year
|
$
|
13,719
|
|
$
|
3,502
|
|
$
|
1,635
|
|
$
|
223
|
|
$
|
19,079
|
|
$
|
2,275
|
|
$
|
85
|
|
$
|
2,360
|
|
$
|
1,727
|
|
$
|
23,166
|
|
|||||||||
|
December 31, 2011
|
|||||||||||||||||||||||||||||||||||||||
|
Balance, beginning of year
|
$
|
7,875
|
|
$
|
1,766
|
|
$
|
3,870
|
|
$
|
374
|
|
$
|
13,885
|
|
$
|
1,864
|
|
$
|
106
|
|
$
|
1,970
|
|
$
|
165
|
|
$
|
16,020
|
|
|||||||||
|
Provision for loan losses
|
31,407
|
|
18,557
|
|
7,037
|
|
415
|
|
57,416
|
|
(254
|
)
|
12
|
|
(242
|
)
|
1,401
|
|
58,575
|
|
|||||||||||||||||||
|
Charge-offs
|
(9,748
|
)
|
(10,615
|
)
|
(9,827
|
)
|
0
|
|
(30,190
|
)
|
(680
|
)
|
(62
|
)
|
(742
|
)
|
0
|
|
(30,932
|
)
|
|||||||||||||||||||
|
Recoveries
|
25
|
|
0
|
|
5
|
|
0
|
|
30
|
|
3
|
|
19
|
|
22
|
|
0
|
|
52
|
|
|||||||||||||||||||
|
Balance, end of year
|
$
|
29,559
|
|
$
|
9,708
|
|
$
|
1,085
|
|
$
|
789
|
|
$
|
41,141
|
|
$
|
933
|
|
$
|
75
|
|
$
|
1,008
|
|
$
|
1,566
|
|
$
|
43,715
|
|
|||||||||
46
A summary of relevant asset quality ratios for the five years ended
December 31, 2015
is as follows:
|
2015
|
2014
|
2013
|
2012
|
2011
|
||||||||||
|
Ratio of net charge-offs (recoveries) to average loans outstanding
|
0.08
|
%
|
0.34
|
%
|
(0.14
|
)%
|
8.01
|
%
|
3.11
|
%
|
||||
|
Provision for loan losses to net charge-offs (recoveries)
|
(104.69
|
)%
|
(168.25
|
)%
|
331.93
|
%
|
70.15
|
%
|
189.69
|
%
|
||||
|
Ratio of reserve to gross loans outstanding at December 31
|
1.74
|
%
|
2.09
|
%
|
3.12
|
%
|
3.29
|
%
|
4.53
|
%
|
||||
Due to the trends in the national and local economies, as well as declines in real estate values in the Company’s market area, the allowance for loan losses grew for the period from 2010 through 2011, consistent with the increase in the ratio of net charge-offs to average loans outstanding. As the Company worked through its risk assets, including the two loan sales in 2012, the allowance for loan losses decreased from $43,715,000 at December 31, 2011 to $23,166,000 at December 31, 2012. The Company continued to focus on working through its risk assets, and based on favorable trends in net charge-offs and improving asset quality ratios, it was able to further reduce the allowance for loan losses over the next three years to $13,568,000 at December 31, 2015. The significant variations in net charge-offs for the five years presented, with a high of $68,849,000 for the year ended December 31, 2012 to a low of $949,000 in net recoveries for the year ended December 31, 2013 has resulted in similar variances in the ratios presented.
The Company recorded negative provisions for loan losses, or reversals of amounts previously provided, of $603,000, $3,900,000 and $3,150,000 for the years ended December 31, 2015, 2014 and 2013, compared to expense of $48,300,000 and $58,575,000 for the years ended December 31, 2012 and 2011. For each of the years in which a negative provision for loan losses was recorded, it was due to recovery of loans with prior charge-offs, allowing for the recovery. In addition, in certain cases, the loans were successfully worked out with smaller charge-offs than the reserve established on them. Lastly, significant improvements were noted in asset quality metrics. Both quantitative and qualitative factors are considered in the determination of the adequacy of the allowance for loan losses. For the most recent three years presented, the favorable historical charge-off data combined with relatively stable economic and market conditions resulted in the conclusion that a negative provision could be recorded despite net charge-offs recorded. Further the allowance for loan losses did not need to be replenished for impaired loans or for the loan growth experienced during the periods.
See further discussion in the “Provision for Loan Losses” section of this Management’s Discussion and Analysis of Financial Condition and Results of Operations.
47
The allocation of the allowance for loan losses, as well as the percent of each loan type in relation to the total loan balance as of December 31, is as follows:
|
|
2015
|
2014
|
2013
|
2012
|
2011
|
|||||||||||||||||||||||||||||
|
|
Amount
|
% of
Loan
Type to
Total
Loans
|
Amount
|
% of
Loan
Type to
Total
Loans
|
Amount
|
% of
Loan
Type to
Total
Loans
|
Amount
|
% of
Loan
Type to
Total
Loans
|
Amount
|
% of
Loan
Type to
Total
Loans
|
||||||||||||||||||||||||
|
Commercial real estate:
|
||||||||||||||||||||||||||||||||||
|
Owner-occupied
|
$
|
1,998
|
|
13
|
%
|
$
|
2,059
|
|
14
|
%
|
$
|
3,583
|
|
17
|
%
|
$
|
2,504
|
|
21
|
%
|
$
|
3,063
|
|
21
|
%
|
|||||||||
|
Non-owner occupied
|
4,033
|
|
19
|
%
|
4,887
|
|
20
|
%
|
6,024
|
|
20
|
%
|
5,022
|
|
17
|
%
|
8,579
|
|
14
|
%
|
||||||||||||||
|
Multi-family
|
709
|
|
5
|
%
|
1,231
|
|
4
|
%
|
1,699
|
|
3
|
%
|
2,944
|
|
3
|
%
|
2,222
|
|
3
|
%
|
||||||||||||||
|
Non-owner occupied residential
|
1,143
|
|
7
|
%
|
1,285
|
|
7
|
%
|
1,909
|
|
8
|
%
|
3,249
|
|
9
|
%
|
15,695
|
|
15
|
%
|
||||||||||||||
|
Acquisition and development:
|
||||||||||||||||||||||||||||||||||
|
1-4 family residential construction
|
236
|
|
1
|
%
|
222
|
|
1
|
%
|
196
|
|
0
|
%
|
198
|
|
0
|
%
|
1,404
|
|
1
|
%
|
||||||||||||||
|
Commercial and land development
|
614
|
|
5
|
%
|
475
|
|
3
|
%
|
474
|
|
3
|
%
|
3,304
|
|
4
|
%
|
8,304
|
|
8
|
%
|
||||||||||||||
|
Commercial and industrial
|
1,012
|
|
10
|
%
|
806
|
|
7
|
%
|
864
|
|
5
|
%
|
1,635
|
|
6
|
%
|
1,085
|
|
8
|
%
|
||||||||||||||
|
Municipal
|
58
|
|
7
|
%
|
183
|
|
9
|
%
|
244
|
|
9
|
%
|
223
|
|
10
|
%
|
789
|
|
6
|
%
|
||||||||||||||
|
Residential mortgage:
|
||||||||||||||||||||||||||||||||||
|
First lien
|
1,667
|
|
16
|
%
|
1,295
|
|
18
|
%
|
1,682
|
|
19
|
%
|
957
|
|
16
|
%
|
317
|
|
11
|
%
|
||||||||||||||
|
Home equity - term
|
184
|
|
2
|
%
|
206
|
|
3
|
%
|
465
|
|
3
|
%
|
252
|
|
2
|
%
|
335
|
|
4
|
%
|
||||||||||||||
|
Home equity - lines of credit
|
1,019
|
|
14
|
%
|
761
|
|
13
|
%
|
1,633
|
|
12
|
%
|
1,066
|
|
11
|
%
|
281
|
|
8
|
%
|
||||||||||||||
|
Installment and other loans
|
121
|
|
1
|
%
|
119
|
|
1
|
%
|
124
|
|
1
|
%
|
85
|
|
1
|
%
|
75
|
|
1
|
%
|
||||||||||||||
|
Unallocated
|
774
|
|
1,218
|
|
2,068
|
|
1,727
|
|
1,566
|
|
||||||||||||||||||||||||
|
$
|
13,568
|
|
100
|
%
|
$
|
14,747
|
|
100
|
%
|
$
|
20,965
|
|
100
|
%
|
$
|
23,166
|
|
100
|
%
|
$
|
43,715
|
|
100
|
%
|
||||||||||
48
The following table summarizes the ending loan balance individually or collectively evaluated for impairment based upon loan type, as well as the allowance for loan loss allocation for each at December 31.
|
|
Commercial
|
Consumer
|
|
|
|||||||||||||||||||||||||||||||||||
|
(Dollars in thousands)
|
Commercial
Real Estate
|
Acquisition
and
Development
|
Commercial
and
Industrial
|
Municipal
|
Total
|
Residential
Mortgage
|
Installment
and Other
|
Total
|
Unallocated
|
Total
|
|||||||||||||||||||||||||||||
|
December 31, 2015
|
|||||||||||||||||||||||||||||||||||||||
|
Loans allocated by:
|
|||||||||||||||||||||||||||||||||||||||
|
Individually evaluated for impairment
|
$
|
11,093
|
|
$
|
5
|
|
$
|
734
|
|
$
|
0
|
|
$
|
11,832
|
|
$
|
5,501
|
|
$
|
17
|
|
$
|
5,518
|
|
$
|
0
|
|
$
|
17,350
|
|
|||||||||
|
Collectively evaluated for impairment
|
327,170
|
|
50,698
|
|
72,891
|
|
57,511
|
|
508,270
|
|
248,589
|
|
7,504
|
|
256,093
|
|
0
|
|
764,363
|
|
|||||||||||||||||||
|
$
|
338,263
|
|
$
|
50,703
|
|
$
|
73,625
|
|
$
|
57,511
|
|
$
|
520,102
|
|
$
|
254,090
|
|
$
|
7,521
|
|
$
|
261,611
|
|
$
|
0
|
|
$
|
781,713
|
|
||||||||||
|
Allowance for loan losses allocated by:
|
|||||||||||||||||||||||||||||||||||||||
|
Individually evaluated for impairment
|
$
|
0
|
|
$
|
0
|
|
$
|
0
|
|
$
|
0
|
|
$
|
0
|
|
$
|
281
|
|
$
|
8
|
|
$
|
289
|
|
$
|
0
|
|
$
|
289
|
|
|||||||||
|
Collectively evaluated for impairment
|
7,883
|
|
850
|
|
1,012
|
|
58
|
|
9,803
|
|
2,589
|
|
113
|
|
2,702
|
|
774
|
|
13,279
|
|
|||||||||||||||||||
|
$
|
7,883
|
|
$
|
850
|
|
$
|
1,012
|
|
$
|
58
|
|
$
|
9,803
|
|
$
|
2,870
|
|
$
|
121
|
|
$
|
2,991
|
|
$
|
774
|
|
$
|
13,568
|
|
||||||||||
|
December 31, 2014
|
|||||||||||||||||||||||||||||||||||||||
|
Loans allocated by:
|
|||||||||||||||||||||||||||||||||||||||
|
Individually evaluated for impairment
|
$
|
6,788
|
|
$
|
410
|
|
$
|
2,437
|
|
$
|
0
|
|
$
|
9,635
|
|
$
|
5,871
|
|
$
|
26
|
|
$
|
5,897
|
|
$
|
0
|
|
$
|
15,532
|
|
|||||||||
|
Collectively evaluated for impairment
|
315,218
|
|
29,751
|
|
46,558
|
|
61,191
|
|
452,718
|
|
230,831
|
|
5,865
|
|
236,696
|
|
0
|
|
689,414
|
|
|||||||||||||||||||
|
$
|
322,006
|
|
$
|
30,161
|
|
$
|
48,995
|
|
$
|
61,191
|
|
$
|
462,353
|
|
$
|
236,702
|
|
$
|
5,891
|
|
$
|
242,593
|
|
$
|
0
|
|
$
|
704,946
|
|
||||||||||
|
Allowance for loan losses allocated by:
|
|||||||||||||||||||||||||||||||||||||||
|
Individually evaluated for impairment
|
$
|
2
|
|
$
|
0
|
|
$
|
0
|
|
$
|
0
|
|
$
|
2
|
|
$
|
173
|
|
$
|
13
|
|
$
|
186
|
|
$
|
0
|
|
$
|
188
|
|
|||||||||
|
Collectively evaluated for impairment
|
9,460
|
|
697
|
|
806
|
|
183
|
|
11,146
|
|
2,089
|
|
106
|
|
2,195
|
|
1,218
|
|
14,559
|
|
|||||||||||||||||||
|
$
|
9,462
|
|
$
|
697
|
|
$
|
806
|
|
$
|
183
|
|
$
|
11,148
|
|
$
|
2,262
|
|
$
|
119
|
|
$
|
2,381
|
|
$
|
1,218
|
|
$
|
14,747
|
|
||||||||||
The allowance for loan losses allocations presented above represent the reserve allocations on loan balances outstanding at December 31 of the respective years. In addition to the reserve allocations on impaired loans noted above, 21 loans, with outstanding general ledger principal balances of $3,313,000, have had cumulative partial charge-offs to the allowance for loan losses recorded totaling $1,957,000. As updated appraisals were received on collateral-dependent loans, partial charge-offs were taken to the extent the loans’ principal balance exceeded their fair value.
Management believes the allocation of the allowance for loan losses between the various loan segments adequately reflects the probable incurred credit losses in each portfolio, and is based on the methodology outlined in “Note 4 – Loans Receivable and Allowance for Loan Losses” included in the Notes to the Consolidated Financial Statements. Management re-evaluates and makes certain enhancements to its methodology used to establish a reserve to better reflect the risks inherent in the different segments of the portfolio, particularly in light of increased charge-offs, with noticeable differences between the different loan segments. Management believes these enhancements to the allowance for loan losses methodology improve the accuracy of quantifying probable incurred credit losses presently inherent in the portfolio. Management charges actual loan losses to the reserve and bases the provision for loan losses on the overall analysis taking the methodology into account.
The largest component of the reserve for the years presented has been allocated to the commercial real estate segment, and in particular the non-owner occupied loan classes. The higher allocations in these loans classes as compared to the other loan classes, which was as high as $29,559,000 at December 31, 2011, is consistent with the inherent risk associated with the loans, as well as generally higher levels of impaired and criticized loans for the periods presented. Since December 31, 2011, there has been a steady decrease in the reserves allocated to the commercial real estate portfolio, as generally, the level of classified assets has declined, and historical loss rates have improved as a result of improving economic and market conditions. At December 31, 2014, the total reserve allocated to the commercial real estate segment was $7,883,000, a decrease of $1,579,000, or 16.7%, despite an increase in classified loans. One large relationship totaling $6,542,000 is the primary reason for the increase in classified loans, however management does not presently feel there will be a loss on this impaired loan.
The reserve allocation on the residential mortgage portfolio segment, in total, has increased from $2,381,000 at December 31, 2014 to $2,991,000 at December 31, 2015. This increase in the reserve allocation is the result of a specific
49
reserve established on one relationship totaling $164,000, as well as reserves required for an increasing loan portfolio is consistent with improving residential real estate market conditions and stabilized historical charge-offs.
The unallocated portion of the allowance for loan losses reflects estimated inherent losses within the portfolio that have not been detected. This reserve results due to risk of error in the specific and general reserve allocation, other potential exposure in the loan portfolio, variances in management’s assessment of national and local economic conditions and other factors management believes appropriate at the time. The unallocated portion of the allowance has decreased in 2015 from $1,218,000 at December 31, 2014 to $774,000 at December 31, 2015 and represents 5.7% of the entire allowance for loan losses balance at December 31, 2015, compared to 8.3% at December 31, 2014. The Company monitors the unallocated portion of the allowance for loan losses, and by policy, has determined it cannot exceed 15% of the total reserve. Future negative provisions for loan losses may result if the unallocated portion was to increase, and management determined the reserves were not required for the anticipated risk in the portfolio. As asset quality continued to improve the last few years, management has determined that it has reduced the risk of loss associated with the portfolio, as evidenced by lower classified loans and sustainable improvements in delinquencies, management determined that a lower unallocated reserve was justified, both in dollars and as a percent of the total allowance for loan losses balance.
While management believes the Company’s allowance for loan losses is adequate based on information currently available, future adjustments to the reserve and enhancements to the methodology may be necessary due to changes in economic conditions, regulatory guidance, or management’s assumptions as to future delinquencies or loss rates.
Deposit Products
On an average daily basis, total deposits were
$982,996,000
in
2015
, a decrease of
0.7%
, or
$7,364,000
, from
2014
. In
2014
, the average daily balance decreased
4.3%
compared to
2013
. Despite a decline in total average deposits during these two periods, the Company experienced growth in its core funding sources, including non-interest and interest bearing demand deposits, and savings deposits. Interest bearing demand deposit account balances averaged
$500,474,000
for the year ended
December 31, 2015
, an increase of
1.9%
from the average balance of
$491,046,000
in
2014
, despite a decline in brokered money market accounts, which decreased $29,990,000. The Company has been able to grow its core funding deposits through marketing campaigns and improvement in the delivery of our products with investments in technology. In addition, the Company has been able to increase its interest free funds, as it expands its commercial and commercial real estate portfolios.
Average time deposits were
$263,414,000
in
2015
, a decrease of
9.8%
, or
$28,735,000
, compared to the average balance of
$292,149,000
in
2014
. This follows a
17.2%
reduction in average time deposits that took place in
2014
, from the
$352,905,000
average balance in
2013
. The Company chose to fund its loan growth through sales and paydowns of securities available for sale and additional short-term borrowings, rather than maintain its balances in time deposits. In particular, the Company decreased its average balance in retail time deposits of less than $100,000 and institutional time deposits in excess of $100,000. Average retail time deposits less than $100,000 and institution time deposits in excess of $100,000 were $83,444,000 and $84,894,000 for the year ended December 31, 2015, compared to $96,436,000 and $97,394,000 for year ended 2014. The Company chose not to pay up on the interest rate on these deposit types, but rather use alternate funding sources to meet loan demand. One funding source the Company chose to use, particularly in the fourth quarter of 2015, was brokered deposits which averaged $68,069,000 for the three months ended December 31, 2015 compared to $19,305,000 for the corresponding period in 2014. At December 31, 2015 brokered time deposits totaled $80,905,000 compared to $17,108,000 at December 31, 2014. Given interest rate conditions and asset/liability strategies, the Company elected to extend its maturity on deposits, principally through increasing its brokered time deposits, which have options that enable the Company to pay them off early. Although brokered time deposits increased, the Company reduced its position in brokered money market accounts as discussed above.
Management continually evaluates its utilization of brokered deposits, and considers the interest rate curve and regulatory views on non-core funding sources, and balances this funding source with its funding needs based on growth initiatives. The Company anticipates that as loan growth increases, it will be able to generate core deposit funding by offering competitive rates.
50
The average amounts of deposits are summarized below for the years ended December 31:
|
(Dollars in thousands)
|
2015
|
2014
|
2013
|
||||||||
|
Demand deposits
|
$
|
134,040
|
|
$
|
123,224
|
|
$
|
119,146
|
|
||
|
Interest bearing demand deposits
|
500,474
|
|
491,046
|
|
484,114
|
|
|||||
|
Savings deposits
|
85,068
|
|
83,941
|
|
78,714
|
|
|||||
|
Time deposits
|
263,414
|
|
292,149
|
|
352,905
|
|
|||||
|
Total deposits
|
$
|
982,996
|
|
$
|
990,360
|
|
$
|
1,034,879
|
|
||
The following is a breakdown of maturities of time deposits of $100,000 or more as of
December 31, 2015
.
|
(Dollars in thousands)
|
Total
|
||
|
Three months or less
|
$
|
41,611
|
|
|
Over three months through six months
|
23,371
|
|
|
|
Over six months through one year
|
22,851
|
|
|
|
Over one year
|
31,871
|
|
|
|
Total
|
$
|
119,704
|
|
Short Term Borrowings
In addition to deposit products, the Company also uses short term borrowings as a funding source. A component of short-term borrowings include securities sold under agreements to repurchase with deposit customers, in which the customer sweeps a portion of its deposit balance into a Repurchase Agreement, which is a secured borrowing as a pool of securities are pledged against the balances.
Information concerning securities sold under agreements to repurchase as of and for the years ended December 31 is as follows:
|
(Dollars in thousands)
|
2015
|
2014
|
2013
|
||||||||
|
Balance at year end
|
$
|
29,156
|
|
$
|
21,742
|
|
$
|
9,032
|
|
||
|
Weighted average interest rate at year-end
|
0.20
|
%
|
0.20
|
%
|
0.20
|
%
|
|||||
|
Average balance during the year
|
30,156
|
|
19,186
|
|
13,772
|
|
|||||
|
Average interest rate during the year
|
0.20
|
%
|
0.20
|
%
|
0.20
|
%
|
|||||
|
Maximum month-end balance during the year
|
$
|
37,558
|
|
$
|
32,861
|
|
$
|
19,105
|
|
||
|
Fair value of securities underlying the agreements at year-end
|
35,470
|
|
38,337
|
|
52,024
|
|
|||||
Additional short-term borrowing sources include borrowings from the Federal Home Loan Bank of Pittsburgh, federal funds purchased, and to a lesser extent, the FRB discount window.
51
Information concerning the use of these other short term borrowings as of and for the years ended December 31 is summarized as follows:
|
(Dollars in thousands)
|
2015
|
2014
|
2013
|
||||||||
|
Balance at year end
|
$
|
60,000
|
|
$
|
65,000
|
|
$
|
50,000
|
|
||
|
Weighted average interest rate at year-end
|
0.53
|
%
|
0.36
|
%
|
0.28
|
%
|
|||||
|
Average balance during the year
|
55,106
|
|
32,736
|
|
10,540
|
|
|||||
|
Average interest rate during the year
|
0.43
|
%
|
0.34
|
%
|
0.31
|
%
|
|||||
|
Maximum month-end balance during the year
|
$
|
83,500
|
|
$
|
65,000
|
|
$
|
50,000
|
|
||
In
2015
and
2014
, the Company used short-term borrowings to meet the Company’s liquidity needs, and allowed for the temporary funding of the growth experienced in the loan portfolio.
The Company also utilizes long-term debt, consisting principally of Federal Home Loan Bank fixed and amortizing advances to fund its balance sheet with original maturities greater than one year. As of
December 31, 2015
, long-term debt totaled
$24,575,000
which was
$9,763,000
higher
than
2014
’s year-end balance of
$14,812,000
. The net increase in long-term debt was the result of $20,000,000 in additional advances and pay downs of $10,237,000. At
December 31, 2014
, long-term debt
declined
by
$1,265,000
from
$16,077,000
at
December 31, 2013
. During the past year, the Company elected to lock in $20,000,000 of long term debt with an extended maturity (2017), as management expected rates to increase at the time the advance was taken. In 2014, given interest rate conditions, the Company allowed its short-term borrowings to increase modestly, and elected not to take out longer term borrowings at that time. The Company will continue to evaluate its funding needs, interest rate movements, the cost of options, and the availability of attractive structures in its evaluation as to the timing and extent of when it enters into long-term borrowings.
Capital Adequacy and Regulatory Matters
Capital Resources.
The management of capital in a regulated financial services industry must properly balance return on equity to its stockholders while maintaining sufficient levels of capital and related risk-based regulatory capital ratios to satisfy statutory regulatory requirements. The Company’s capital management strategies have historically been developed to provide attractive rates of returns to its shareholders, while maintaining a “well capitalized” position of regulatory strength.
Total shareholders’ equity increased
$5,796,000
from
$127,265,000
at
December 31, 2014
to
$133,061,000
at
December 31, 2015
. The primary reason for the net increase in shareholders’ equity was the
$7,874,000
net income recorded for the year ended
December 31, 2015
, offset by dividends declared on common stock of $1,822,000 and acquisition of treasury stock of $809,000.
Capital Adequacy
. The Company (on a consolidated basis) and the Bank are subject to various regulatory capital requirements administered by the federal banking agencies. Failure to meet minimum capital requirements can initiate certain mandatory and possibly additional discretionary actions by regulators that, if undertaken, could have a direct material effect on the Company’s and Bank’s financial statements. Under capital adequacy guidelines and the regulatory framework for prompt corrective action, the Company and the Bank must meet specific guidelines that involve quantitative measures of assets, liabilities and certain off-balance sheet items as calculated under regulatory accounting practices. Although applicable to the Bank, prompt corrective action provisions are not applicable to bank holding companies, including financial holding companies.
Quantitative measures established by regulators to ensure capital adequacy require the Company and the Bank to maintain minimum amounts and ratios (as set forth in the following table) of total and Tier 1 capital (as defined in regulations) to risk-weighted assets (as defined), common equity Tier 1 capital (as defined) to risk weighted assets, and of Tier 1 capital (as defined) to average assets (as defined). Management believes, as of
December 31, 2015
and
December 31, 2014
, the Company and the Bank met all capital adequacy requirements to which they are subject.
Effective January 1, 2015, the Company and the Bank became subject to the Basel III Capital Rules, which substantially revised the risk-based capital requirements in comparison to the previously effective U.S. risk-based capital rules. The Basel III Capital Rules, among other things, (i) introduced a new capital measure called “Common Equity Tier 1” (“CET1”), (ii) increased the minimum requirements for Tier 1 Capital ratio as well as the minimum levels to be considered well capitalized
52
under prompt corrective action; (iii) and introduced the “capital conservation buffer”, designed to absorb losses during periods of economic stress. Institutions with a ratio of CET1 to risk-weighted assets above the minimum but below the conservation buffer are subject to constraints on dividends, equity repurchases and discretionary bonuses to executive officers based on the amount of the shortfall.
Under the previously effective capital standards, the effects of accumulated other comprehensive income (AOCI) items included in capital were excluded for the purposes of determining regulatory capital ratios. Under the Basel III Capital Rules, the effects of certain accumulated other comprehensive items are generally included in regulatory capital. However, banking organizations were given a one-time option to permanently opt out of the requirement to include most components of AOCI, including unrealized gains or losses on certain securities available for sale, in regulatory capital. The Company and Bank made the one-time permanent election to opt out, with the result that most AOCI items will be treated for regulatory capital purposes in the same manner in which they were under the previously effective capital rules.
The Basel III Capital Rules provide for a number of deductions from and adjustments to CET1. These include, for example, the requirement that mortgage servicing rights, deferred tax assets dependent upon future taxable income and significant investments in non-consolidated financial entities be deducted from CET1 to the extent that any one such category exceeds 10% of CET1 or all such categories in the aggregate exceed 15% of CET1. As of
December 31, 2015
, $7,838,000 of the Company's deferred tax asset was disallowed for Tier 1, CET1 and Total risk based capital, as it relates to operating loss and tax credit carryfowards which are not permissible as capital under Basel III Capital Rules.
Implementation of the deductions and other adjustments to CET1 began on January 1, 2015 and will be phased-in over a 4-year period (beginning at 40% on January 1, 2015 and an additional 20% per year thereafter until fully phased-in at January 1, 2018). The implementation of the capital conservation buffer will begin on January 1, 2016 at the 0.625% level and be phased in over a four-year period (increasing by that amount on each subsequent January 1, until it reaches 2.5% on January 1, 2019).
The Basel III Capital Rules prescribe a standardized approach for risk weightings that expands the risk-weighting categories from the four categories of the previous capital standards (0%, 20%, 50% and 100%) to a much larger and more risk-sensitive number of categories, depending on the nature of the assets, generally ranging from 0% for U.S. government and agency securities, to 600% for certain equity exposures, and resulting in higher risk weights for a variety of asset categories. Significant changes to the previously effective capital rules that will impact the Company’s determination of risk-weighted assets include, among other things:
|
•
|
Greater restrictions on the amount of deferred tax assets that can be included in CET1 capital with assets relating to net operating loss and credit carry forwards being excluded, and a 10% - 15% limitation on deferred tax assets arising from temporary differences that cannot be realized through net operating loss carry backs.
|
|
•
|
Applying a 150% risk weight for certain high volatility commercial real estate acquisition, development and construction loans, compared to 100% risk weight previously in place;
|
|
•
|
Assigning a 150% risk weight to exposures (other than residential mortgage exposures) that are 90 days past due or in nonaccrual status, compared to 100% risk weight previously in place; and
|
|
•
|
Providing for a 20% credit conversion factor for the unused portion of a commitment with an original maturity of one year or less that is not unconditionally cancelable, compared to 0% previously in place.
|
The allowance for credit losses, including the allowance for loan losses and reserve for off-balance sheet credit commitments, is included as Tier 2 capital to the extent it does not exceed 1.25% of risk weighted assets. The amount that exceeds 1.25% of risk weighted assets, is disallowed as Tier 2 capital, but also reduces the Company’s risk weighted assets. As of
December 31, 2015
and
2014
, $3,303,000 and $6,269,000 of the allowance for credit losses was excluded from Tier 2 capital. The lower disallowed amount in
2015
was the result of the lower balance in the allowance for loan losses, and higher balance of risk-weighted assets.
The Company and Bank's capital ratios as of December 31, 2015 have declined since December 31, 2014, despite an increase in consolidated capital, due primarily to the consolidated risk-weighted assets increasing from $710,723,000 at December 31, 2014 to $850,974,000 at December 31, 2015. The increase in risk-weighted assets is partly due to the new definitions in Basel III, the growth experienced in the Company's loan portfolio, as well as a change in the security portfolio composition, from lower risk-weighted securities to higher risk-weighted securities to capture additional interest income. Further impacting the Bank's specific ratios was a $12,500,000 dividend paid from the Bank to the Company in the fourth quarter of 2015. The Bank elected to distribute some of its excess capital, as a tax planning strategy and for other general corporate matters.
53
Regulatory Capital
. As of
December 31, 2015
, the Bank was considered well capitalized under applicable banking regulations. The Company’s and the Bank’s capital ratios as of
December 31, 2015
and
2014
were as follows:
|
|
Actual
|
Minimum Capital
Requirement
|
Minimum to Be Well
Capitalized Under
Prompt Corrective
Action Provisions
|
|||||||||||||||||
|
(Dollars in thousands)
|
Amount
|
Ratio
|
Amount
|
Ratio
|
Amount
|
Ratio
|
||||||||||||||
|
December 31, 2015
|
||||||||||||||||||||
|
Total capital to risk weighted assets
|
||||||||||||||||||||
|
Orrstown Financial Services, Inc.
|
$
|
134,562
|
|
15.8
|
%
|
$
|
68,078
|
|
8.0
|
%
|
n/a
|
|
n/a
|
|
||||||
|
Orrstown Bank
|
118,671
|
|
14.0
|
%
|
68,027
|
|
8.0
|
%
|
$
|
85,034
|
|
10.0
|
%
|
|||||||
|
Tier 1 capital to risk weighted assets
|
||||||||||||||||||||
|
Orrstown Financial Services, Inc.
|
123,825
|
|
14.6
|
%
|
51,058
|
|
6.0
|
%
|
n/a
|
|
n/a
|
|
||||||||
|
Orrstown Bank
|
107,942
|
|
12.7
|
%
|
51,021
|
|
6.0
|
%
|
68,027
|
|
8.0
|
%
|
||||||||
|
CET1 to risk weighted assets
|
||||||||||||||||||||
|
Orrstown Financial Services, Inc.
|
123,825
|
|
14.6
|
%
|
38,294
|
|
4.5
|
%
|
n/a
|
|
n/a
|
|
||||||||
|
Orrstown Bank
|
107,942
|
|
12.7
|
%
|
38,265
|
|
4.5
|
%
|
55,272
|
|
6.5
|
%
|
||||||||
|
Tier 1 capital to average assets
|
||||||||||||||||||||
|
Orrstown Financial Services, Inc.
|
123,825
|
|
9.8
|
%
|
50,684
|
|
4.0
|
%
|
n/a
|
|
n/a
|
|
||||||||
|
Orrstown Bank
|
107,942
|
|
8.5
|
%
|
50,695
|
|
4.0
|
%
|
63,368
|
|
5.0
|
%
|
||||||||
|
December 31, 2014
|
||||||||||||||||||||
|
Total capital to risk weighted assets
|
||||||||||||||||||||
|
Orrstown Financial Services, Inc.
|
$
|
119,713
|
|
16.8
|
%
|
$
|
56,859
|
|
8.0
|
%
|
n/a
|
|
n/a
|
|
||||||
|
Orrstown Bank
|
118,540
|
|
16.7
|
%
|
56,835
|
|
8.0
|
%
|
$
|
71,043
|
|
10.0
|
%
|
|||||||
|
Tier 1 capital to risk weighted assets
|
||||||||||||||||||||
|
Orrstown Financial Services, Inc.
|
110,750
|
|
15.6
|
%
|
28,429
|
|
4.0
|
%
|
n/a
|
|
n/a
|
|
||||||||
|
Orrstown Bank
|
109,581
|
|
15.4
|
%
|
28,417
|
|
4.0
|
%
|
42,626
|
|
6.0
|
%
|
||||||||
|
Tier 1 capital to average assets
|
||||||||||||||||||||
|
Orrstown Financial Services, Inc.
|
110,750
|
|
9.5
|
%
|
46,496
|
|
4.0
|
%
|
n/a
|
|
n/a
|
|
||||||||
|
Orrstown Bank
|
109,581
|
|
9.4
|
%
|
46,518
|
|
4.0
|
%
|
58,148
|
|
5.0
|
%
|
||||||||
As noted above, the Bank’s capital ratios exceed the regulatory minimums to be considered well capitalized under applicable banking regulations. The Company routinely evaluates its capital levels in light of its risk profile to assess its capital needs.
On January 19, 2016, the Company filed a shelf registration statement on Form S-3 with the SEC, covering up to an aggregate of $100,000,000 of securities, through the sale of common stock, preferred stock, warrants, debt securities, and units. To date, the Company has not issued any securities under this shelf registration.
In October 2011, the Company announced it had discontinued its quarterly dividend, which was the result of regulatory guidance from the Federal Reserve Bank. Under the Written Agreement entered into with the Federal Reserve Bank in March 2012, the Company was restricted from paying any dividends or repurchasing any stock without prior regulatory approval. The Written Agreement was terminated by the Federal Reserve Bank on April 1, 2015, and the Company resumed its quarterly dividend to common stockholders in April 2015.
On September 14, 2015, the Board of Directors of the Company authorized a stock repurchase program under which Orrstown Financial Services, Inc. may repurchase up to 5% of the Company's outstanding shares of common stock, or approximately 416,000 shares, in the open market, in accordance with all applicable securities laws and regulations, including Rule 10b-18 of the Securities Exchange Act of 1934, as amended. The extent to which the Company repurchases its shares, and the timing of such repurchases, will depend upon a variety of factors, including market conditions, regulatory requirements and other corporate considerations, as determined by management. Purchases may be made from time to time through open market or privately negotiated transactions. The repurchase program may be suspended or discontinued at any time. As of
December 31, 2015
,
47,077
shares had been repurchased under the program at a total cost of
$808,680
, or
$17.18
per share.
54
Additional relevant financial information pertaining to shareholders’ equity for the years ended December 31 is as follows:
|
(Dollars in thousands)
|
2015
|
2014
|
2013
|
||||||||
|
Average shareholders’ equity
|
$
|
131,453
|
|
$
|
101,250
|
|
$
|
88,547
|
|
||
|
Net income
|
7,874
|
|
29,142
|
|
10,004
|
|
|||||
|
Cash dividends paid
|
1,822
|
|
0
|
|
0
|
|
|||||
|
Equity to asset ratio
|
10.29
|
%
|
10.69
|
%
|
7.76
|
%
|
|||||
|
Dividend payout ratio
|
22.68
|
%
|
0.00
|
%
|
0.00
|
%
|
|||||
|
Return on average equity
|
5.99
|
%
|
28.78
|
%
|
11.30
|
%
|
|||||
Liquidity and Rate Sensitivity
Liquidity
. The primary function of asset/liability management is to ensure adequate liquidity and manage the Company’s sensitivity to changing interest rates. Liquidity management involves the ability to meet the cash flow requirements of customers who may be either depositors wanting to withdraw funds or borrowers needing assurance that sufficient funds will be available to meet their credit needs. Our primary sources of funds consist of deposit inflows, loan repayments, maturities and sales of investment securities, the sale of mortgage loans and borrowings from the Federal Home Loan Bank of Pittsburgh. While maturities and scheduled amortization of loans and securities are predictable sources of funds, deposit flows and mortgage prepayments are greatly influenced by general interest rates, economic conditions and competition.
We regularly adjust our investments in liquid assets based upon our assessment of (1) expected loan demand, (2) expected deposit flows, (3) yields available on interest-earning deposits and securities and (4) the objectives of our asset/liability management policy.
At
December 31, 2015
, we had
$221,790,000
in loan commitments outstanding, which included
$20,327,000
in undisbursed loans,
$110,743,000
in unused home equity lines of credit,
$84,480,000
in commercial lines of credit, and
$6,510,000
in standby letters of credit. Time deposits due within one year of
December 31, 2015
totaled
$147,831,000
, or
48%
of time deposits. The large percentage of time deposits that mature within one year reflects customers’ hesitancy to invest their funds for long periods in the current low interest rate environment. If these maturing deposits do not remain with us, we will be required to seek other sources of funds, including other time deposits and lines of credit. Depending on market conditions, we may be required to pay higher rates on such deposits or other borrowings than we currently pay on time deposits due on or before December 31, 2015. We believe, however, based on past experience that a significant portion of our time deposit will remain with us. We have the ability to attract and retain deposits by adjusting the interest rates offered.
Our most liquid assets are cash and cash equivalents. The levels of these assets depend on our operating, financing, lending and investing activities during any given period. At
December 31, 2015
, cash and cash equivalents totaled
$28,340,000
, which decreased from
$31,409,000
at
December 31, 2014
. The lower levels of cash and cash equivalents is due to the Company investing these funds in securities available-for-sale in order to earn a higher rate of interest than that earned on short-term investments. Securities classified as available-for-sale, net of pledging requirements, which provide additional sources of liquidity, totaled
$143,727,000
at
December 31, 2015
. In addition, at
December 31, 2015
, we had the ability to borrow a total of approximately
$378,848,000
from the Federal Home Loan Bank of Pittsburgh (FHLB), of which we had
$84,495,000
in advances and
$10,150,000
in letters of credit outstanding. The Company’s ability to borrow from the FHLB is dependent on having sufficient qualifying collateral, generally consisting of mortgage loans. In addition, the Company has
$30,000,000
in two available unsecured lines of credit with its correspondent banks.
The Company is a separate legal entity from the Bank and must provide for its own liquidity. In addition to its operating expenses, the Company is responsible for paying any dividends declared to its shareholders. The Company also has repurchased shares of its common stock. The Company’s primary source of income is dividends received from the Bank. For restrictions on the Bank’s ability to dividend funds to the Company, see Note 15, “Restrictions on Dividends, Loans and Advances,” to the Consolidated Financial Statements included in Item 8.
Interest Rate Sensitivity
. Interest rate sensitivity management requires the maintenance of an appropriate balance between interest sensitive assets and liabilities. Management, through its asset/liability management process, attempts to manage the level of repricing and maturity mismatch so that fluctuations in net interest income are maintained within policy limits in current and expected market conditions. For further discussion, see Item 7A - Quantitative and Qualitative Disclosures About Market Risk.
55
Contractual Obligations
The Company enters into contractual obligations in its normal course of business to fund loan growth, for asset/liability management purposes, to meet required capital needs and for other corporate purposes. The following table presents significant fixed and determinable contractual obligations of principal by payment date as of
December 31, 2015
. Further discussion of the nature of each obligation is included in the referenced Note to the Consolidated Financial Statements, under Item 8.
|
|
|
Payments Due
|
|
||||||||||||||||||
|
(Dollars in thousands)
|
Note
Reference
|
Less than 1
year
|
2-3 years
|
4-5 years
|
More than
5 years
|
Total
|
|||||||||||||||
|
Time deposits
|
11
|
$
|
147,831
|
|
$
|
84,835
|
|
$
|
69,471
|
|
$
|
2,821
|
|
$
|
304,958
|
|
|||||
|
Short-term borrowings
|
12
|
60,000
|
|
0
|
|
0
|
|
0
|
|
60,000
|
|
||||||||||
|
Long-term debt
|
13
|
332
|
|
20,713
|
|
1,134
|
|
2,316
|
|
24,495
|
|
||||||||||
|
Operating lease obligations
|
6
|
397
|
|
310
|
|
103
|
|
79
|
|
889
|
|
||||||||||
|
Total
|
$
|
208,560
|
|
$
|
105,858
|
|
$
|
70,708
|
|
$
|
5,216
|
|
$
|
390,342
|
|
||||||
The following discussion of off-balance sheet commitments to extend credit is included in Note 17 to the Consolidated Financial Statements, under Item 8. Because these commitments generally have fixed expiration dates and many will expire without being drawn upon, the total commitment does not necessarily represent future cash requirements, and are therefore excluded from the contractual obligations table discussed above.
Off-Balance Sheet Arrangements
The Company is party to financial instruments with off-balance sheet risk in the normal course of business to meet the financing needs of its customers. These financial instruments include commitments to extend credit and to a lesser extent, letters of credit.
A schedule of significant commitments at
December 31, 2015
is as follows:
|
(Dollars in thousands)
|
Contract or Notional
Amount
|
||
|
Commitments to fund:
|
|||
|
Revolving, open ended home equity loans
|
$
|
110,743
|
|
|
1-4 family residential construction loans
|
6,153
|
|
|
|
Commercial real estate, construction and land development loans
|
14,174
|
|
|
|
Commercial, industrial and other loans
|
84,480
|
|
|
|
Standby letters of credit
|
6,510
|
|
|
Please see Note 17 – “Financial Instruments with Off-Balance Sheet Risk” in the Notes to the Consolidated Financial Statements for a discussion of the nature, business purpose, and guarantees that result from the Company’s off-balance sheet arrangements.
New Financial Accounting Standards
Note 1 to the Consolidated Financial Statements under Item 8 discusses the expected impact on the Company’s financial condition or results of operations for recently issued or proposed accounting standards that have not been adopted as of
December 31, 2015
. To the extent we anticipate significant impact to the Company’s financial condition or results of operations appropriate discussion is included in the disclosure.
Caution About Forward Looking Statements
This report contains statements that are considered “forward-looking statements” as defined in the Private Securities Litigation Reform Act of 1995. In addition, the Company may make other written and oral communications, from time to time, that contain such statements. Forward-looking statements, including statements that include projections, predictions, expectations or beliefs as to industry trends, future expectations and other matters that do not relate strictly to historical facts,
56
are based on certain assumptions by management, and are often identified by words or phrases such as "may," “anticipate,” “believe,” “expect,” "estimate," “intend,” “seek,” “plan,” “objective,” “trend,” “goal.” and other similar terms. Forward-looking statements are subject to various assumptions, risks, and uncertainties, which change over time, and speak only as of the date they are made.
In addition to factors mentioned elsewhere in this Annual Report on Form 10-K or previously disclosed in our SEC reports (accessible on the SEC’s website at www.sec.gov or on our website at www.orrstown.com), the following factors, among others, could cause actual results to differ materially from forward-looking statements and future results could differ materially from historical performance:
|
•
|
We may be required to make further increases in our provisions for loan losses and to charge off additional loans in the future, which could materially adversely affect us.
|
|
•
|
Our commercial real estate lending may expose us to a greater risk of loss and impact our earnings and profitability.
|
|
•
|
Almost 10% of our loan portfolio consists of commercial and industrial loans. The credit risk related to these types of loans is greater than the risk related to residential loans.
|
|
•
|
Changes in interest rates could adversely impact our financial condition and results of operations.
|
|
•
|
Difficult economic and market conditions have adversely affected our industry and may continue to materially and adversely affect us.
|
|
•
|
Because our business is concentrated in South Central Pennsylvania and Washington County, Maryland, our financial performance could be materially adversely affected by economic conditions and real estate values in these market areas.
|
|
•
|
Competition from other banks and financial institutions in originating loans, attracting deposits and providing various financial services may adversely affect our profitability and liquidity.
|
|
•
|
Our business strategy includes the continuation of moderate growth plans, and our financial condition and results of operations could be negatively affected if we fail to grow or fail to manage our growth effectively.
|
|
•
|
We may be adversely affected by technological advances.
|
|
•
|
We may not be able to attract and retain skilled people.
|
|
•
|
An interruption or breach in security with respect to our information systems, or our outsourced service providers, could adversely impact our reputation and have an adverse impact on our financial condition or results of operations.
|
|
•
|
We could be adversely affected by failure in our internal controls
|
|
•
|
Governmental regulation and regulatory actions against us may impair our operations or restrict our growth.
|
|
•
|
The Dodd-Frank Wall Street Reform and Consumer Protection Act may affect our financial condition, results of operations, liquidity and stock price.
|
|
•
|
Increases in FDIC insurance premiums may have a material adverse effect on our results of operations.
|
|
•
|
The repeal of federal prohibitions on the payment of interest on demand deposits could increase our interest expense and reduce our net interest margin.
|
|
•
|
Changes in assessment rates of the Pennsylvania Bank Shares Tax, a tax calculated on the outstanding equity of the Bank, may have a material adverse effect on our results of operations.
|
|
•
|
We are required to make a number of judgments in applying accounting policies and different estimates and assumptions in the application of these policies could result in a decrease in capital and/or other material changes to our reports of financial condition and results of operations.
|
|
•
|
Changes in accounting standards could impact the Company’s financial condition and results of operations.
|
|
•
|
The short-term and long-term impact of the changing regulatory capital requirements and anticipated new capital rules is uncertain.
|
57
|
•
|
Pending litigation and legal or administrative proceedings or the impact of any finding of liability or damages could adversely impact the Company and its financial condition and results of operations.
|
|
•
|
We are a holding company dependent for liquidity on payments from the Bank, our sole subsidiary, which are subject to restrictions.
|
|
•
|
The soundness of other financial institutions could adversely affect us.
|
|
•
|
If we want to, or are compelled to, raise additional capital in the future, that capital may not be available when it is needed and on terms favorable to current shareholders.
|
|
•
|
The market price of our common stock has been subject to extreme volatility.
|
|
•
|
Other risks and uncertainties.
|
Market risk is defined as the exposure to interest rate risk, foreign currency exchange rate risk, commodity price risk, and other relevant market rate or price risks. For domestic banks, including the Company, the majority of market risk is related to interest rate risk. Interest rate sensitivity management requires the maintenance of an appropriate balance between reward, in the form of net interest margin, and risk as measured by the amount of earnings and value at risk.
Interest Rate Risk
Interest rate risk is the exposure to fluctuations in the Company’s future earnings (earnings at risk) and value (value at risk) resulting from changes in interest rates. This exposure results from differences between the amounts of interest earning assets and interest bearing liabilities that reprice within a specified time period as a result of scheduled maturities, scheduled and unscheduled repayments, the propensity of borrowers and depositors to react to changes in their economic interests, and security and contractual interest rate changes.
Management, through its asset/liability management process, attempts to manage the level of repricing and maturity mismatch so that fluctuations in net interest income is maintained within policy limits across a range of market conditions while satisfying liquidity and capital requirements. Management recognizes that a certain amount of interest rate risk is inherent, appropriate and necessary to ensure the Company’s profitability. Thus, the goal of interest rate risk management is to evaluate the amount of reward for taking risk and adjusting both the size and composition of the balance sheet relative to the level of reward available for taking risk.
Management endeavors to control the exposure to changes in interest rates by understanding, reviewing and making decisions based on its risk position. The Company primarily uses the securities portfolio, FHLB advances, and brokered deposits to manage its interest rate risk position. Additionally, pricing, promotion and product development activities are directed in an effort to emphasize the loan and deposit term or repricing characteristics that best meet current interest rate risk objectives. At present, there is no use of hedging instruments.
The asset/liability committee operates under management policies defining guidelines and limits on the level of risk. These policies are approved by the Board of Directors.
The Company uses simulation analysis to assess earnings at risk and net present value analysis to assess value at risk. These methods allow management to regularly monitor both the direction and magnitude of the Company’s interest rate risk exposure. These modeling techniques involve assumptions and estimates that inherently cannot be measured with complete precision. Key assumptions in the analyses include maturity and repricing characteristics of assets and liabilities, prepayments on amortizing assets, non-maturity deposit sensitivity, and loan and deposit pricing. These assumptions are inherently uncertain due to the timing, magnitude and frequency of rate changes and changes in market conditions and management strategies, among other factors. However, the analyses are useful in quantifying risk and provide a relative gauge of the Company’s interest rate risk position over time.
Earnings at Risk
Simulation analysis evaluates the effect of upward and downward changes in market interest rates on future net interest income. The analysis involves changing the interest rates used in determining net interest income over the next twelve months. The resulting percentage change in net interest income in various rate scenarios is an indication of the Company’s short-term interest rate risk. The analysis assumes recent trends in new loan and deposit volumes will continue while the amount of investment securities remains constant. Additional assumptions are applied to modify volumes and pricing under the various
58
rate scenarios. These include prepayment assumptions on mortgage assets, sensitivity of non-maturity deposit rates, and other factors deemed significant.
The simulation analysis results are presented in Table 3a. These results, as of
December 31, 2015
, indicate that the Company would expect net interest income to decrease over the next twelve months by
1.4%
assuming a downward shock in market interest rates of 1.00%, and to decrease by
1.8%
assuming an upward shock of 2.00%. This profile reflects an acceptable short-term interest rate risk position. However, a decrease in interest rates of 1.00% would create an environment in which deposit rates could not practically decline further, thus decreasing net interest income.
Earnings at risk simulations for
December 31, 2014
, exhibited greater sensitivity to rising interest rates and similar sensitivity in a declining rate environment, and asset/liability management strategies were taken in 2015 to reduce the Company's risk in an upward interest rate environment.
Value at Risk
The net present value analysis provides information on the risk inherent in the balance sheet that might not be taken into account in the simulation analysis due to the short time horizon used in that analysis. The net present value of the balance sheet is defined as the discounted present value of expected asset cash flows minus the discounted present value of the expected liability cash flows. The analysis involves changing the interest rates used in determining the expected cash flows and in discounting the cash flows. The resulting percentage change in net present value in various rate scenarios is an indication of the longer term repricing risk and options embedded in the balance sheet.
The net present value analysis results are presented in Table 3b. These results, as of
December 31, 2015
, indicate that the net present value would increase
1.8%
assuming a downward shift in market interest rates of 1.00% and demonstrates virtually no impact in change in market value in an upward shift in market rates.
|
Table 3a - Earnings at Risk
|
Table 3b - Value at Risk
|
|||||||||||||||
|
% Change in Net Interest Income
|
% Change in Market Value
|
|||||||||||||||
|
Change in Market Interest Rates
|
December 31, 2015
|
December 31, 2014
|
Change in Market Interest Rates
|
December 31, 2015
|
December 31, 2014
|
|||||||||||
|
(100
|
)
|
(1.4
|
%)
|
(1.5
|
%)
|
(100
|
)
|
1.8
|
%
|
2.2
|
%
|
|||||
|
100
|
|
(1.2
|
%)
|
(3.2
|
%)
|
100
|
|
0.5
|
%
|
(4.3
|
%)
|
|||||
|
200
|
|
(1.8
|
%)
|
(6.1
|
%)
|
200
|
|
0.0
|
%
|
(6.8
|
%)
|
|||||
Further discussion related to the quantitative and qualitative disclosures about market risk is included under the heading of Liquidity and Rate Sensitivity in Item 7 of Management's Discussion and Analysis of Financial Condition and Results of Operations.
59
SUMMARY OF QUARTERLY FINANCIAL DATA
The unaudited quarterly results of operations for the years ended December 31, are as follows:
|
|
2015
Quarter Ended |
2014
Quarter Ended |
|||||||||||||||||||||||||||||
|
(Dollars in thousands, except per
share data)
|
December
|
September
|
June
|
March
|
December
|
September
|
June
|
March
|
|||||||||||||||||||||||
|
Interest income
|
$
|
9,954
|
|
$
|
9,885
|
|
$
|
9,568
|
|
$
|
9,228
|
|
$
|
9,520
|
|
$
|
9,477
|
|
$
|
9,585
|
|
$
|
9,601
|
|
|||||||
|
Interest expense
|
(1,246
|
)
|
(1,172
|
)
|
(970
|
)
|
(913
|
)
|
(959
|
)
|
(1,030
|
)
|
(1,085
|
)
|
(1,085
|
)
|
|||||||||||||||
|
Net interest income
|
8,708
|
|
8,713
|
|
8,598
|
|
8,315
|
|
8,561
|
|
8,447
|
|
8,500
|
|
8,516
|
|
|||||||||||||||
|
Provision for loan losses
|
0
|
|
(603
|
)
|
0
|
|
0
|
|
(1,000
|
)
|
(2,900
|
)
|
0
|
|
0
|
|
|||||||||||||||
|
Net interest income after provision for loan losses
|
8,708
|
|
9,316
|
|
8,598
|
|
8,315
|
|
9,561
|
|
11,347
|
|
8,500
|
|
8,516
|
|
|||||||||||||||
|
Securities gains
|
13
|
|
29
|
|
353
|
|
1,529
|
|
267
|
|
469
|
|
602
|
|
597
|
|
|||||||||||||||
|
Noninterest income
|
4,083
|
|
4,802
|
|
4,530
|
|
3,839
|
|
4,259
|
|
4,283
|
|
4,536
|
|
3,841
|
|
|||||||||||||||
|
Noninterest expenses
|
(11,219
|
)
|
(11,224
|
)
|
(11,658
|
)
|
(10,506
|
)
|
(11,129
|
)
|
(10,898
|
)
|
(10,765
|
)
|
(10,976
|
)
|
|||||||||||||||
|
Income before income taxes
|
1,585
|
|
2,923
|
|
1,823
|
|
3,177
|
|
2,958
|
|
5,201
|
|
2,873
|
|
1,978
|
|
|||||||||||||||
|
Applicable (income taxes) benefit
|
(136
|
)
|
(462
|
)
|
(321
|
)
|
(715
|
)
|
16,156
|
|
(24
|
)
|
0
|
|
0
|
|
|||||||||||||||
|
Net income
|
$
|
1,449
|
|
$
|
2,461
|
|
$
|
1,502
|
|
$
|
2,462
|
|
$
|
19,114
|
|
$
|
5,177
|
|
$
|
2,873
|
|
$
|
1,978
|
|
|||||||
|
Per Common Share Data
|
|||||||||||||||||||||||||||||||
|
Net income
|
$
|
0.18
|
|
$
|
0.30
|
|
$
|
0.19
|
|
$
|
0.30
|
|
$
|
2.36
|
|
$
|
0.64
|
|
$
|
0.35
|
|
$
|
0.24
|
|
|||||||
|
Diluted net income
|
0.18
|
|
0.30
|
|
0.18
|
|
0.30
|
|
2.36
|
|
0.64
|
|
0.35
|
|
0.24
|
|
|||||||||||||||
|
Dividends
|
0.08
|
|
0.07
|
|
0.07
|
|
0.00
|
|
0.00
|
|
0.00
|
|
0.00
|
|
0.00
|
|
|||||||||||||||
60
Index to Financial Statements and Supplementary Data
|
|
Page
|
61
Management’s Report on Internal Control Over Financial Reporting
The management of Orrstown Financial Services, Inc. and its wholly-owned subsidiary has the responsibility for establishing and maintaining an adequate internal control structure and procedures for financial reporting. Management maintains a comprehensive system of internal control to provide reasonable assurance of the proper authorization of transactions, the safeguarding of assets and the reliability of the financial records. The system of internal control provides for appropriate division of responsibility and is documented by written policies and procedures that are communicated to employees. Orrstown Financial Services, Inc. and its wholly-owned subsidiary maintains an internal auditing program, under the supervision of the Audit Committee of the Board of Directors, which independently assesses the effectiveness of the system of internal control and recommends possible improvements.
Under the supervision and with the participation of the Company’s management, including its Chief Executive Officer and Chief Financial Officer, the Company has evaluated the effectiveness of its internal control over financial reporting as of
December 31, 2015
, using the
Internal Control – Integrated Framework (2013)
issued by the Committee of Sponsoring Organizations of the Treadway Commission. Based upon this evaluation, management has concluded that, at
December 31, 2015
, the Company’s internal control over financial reporting is effective based on the criteria established in
Internal Control-Integrated Framework (2013)
.
The independent registered public accounting firm, Crowe Horwath, LLP, has issued an audit report on the Company’s internal control over financial reporting as of
December 31, 2015
. The accounting firm’s audit report on internal control over financial reporting is included in this financial report.
|
/s/ Thomas R. Quinn, Jr.
|
|
/s/ David P. Boyle
|
|
Thomas R. Quinn, Jr.
|
|
David P. Boyle
|
|
President and Chief Executive Officer
|
|
Executive Vice President and Chief Financial Officer
|
|
March 11, 2016
|
||
62

REPORT OF INDEPENDENT REGISTERED PUBLIC ACCOUNTING FIRM
Board of Directors
Orrstown Financial Services, Inc. and its wholly-owned subsidiary
Shippensburg, Pennsylvania
We have audited the accompanying consolidated balance sheets of Orrstown Financial Services, Inc. and its wholly-owned subsidiary as of December 31, 2015 and 2014 and the related consolidated statements of income, comprehensive income, changes in shareholders’ equity, and cash flows for the years then ended. We also have audited Orrstown Financial Services, Inc. and its wholly-owned subsidiary’s internal control over financial reporting as of December 31, 2015, based on criteria established in the 2013 Internal Control - Integrated Framework issued by the Committee of Sponsoring Organizations of the Treadway Commission (COSO). Orrstown Financial Services, Inc. and its wholly-owned subsidiary’s management is responsible for these financial statements, for maintaining effective internal control over financial reporting, and for its assessment of the effectiveness of internal control over financial reporting, included in the accompanying Management’s Report on Internal Control over Financial Reporting. Our responsibility is to express an opinion on these financial statements and an opinion on the company’s internal control over financial reporting based on our audits.
We conducted our audits in accordance with the standards of the Public Company Accounting Oversight Board (United States). Those standards require that we plan and perform the audits to obtain reasonable assurance about whether the consolidated financial statements are free of material misstatement and whether effective internal control over financial reporting was maintained in all material respects. Our audits of the consolidated financial statements included examining, on a test basis, evidence supporting the amounts and disclosures in the financial statements, assessing the accounting principles used and significant estimates made by management, and evaluating the overall financial statement presentation. Our audit of internal control over financial reporting included obtaining an understanding of internal control over financial reporting, assessing the risk that a material weakness exists, and testing and evaluating the design and operating effectiveness of internal control based on the assessed risk. Our audits also included performing such other procedures as we considered necessary in the circumstances. We believe that our audits provide a reasonable basis for our opinions.
A company’s internal control over financial reporting is a process designed to provide reasonable assurance regarding the reliability of financial reporting and the preparation of financial statements for external purposes in accordance with generally accepted accounting principles. A company’s internal control over financial reporting includes those policies and procedures that (1) pertain to the maintenance of records that, in reasonable detail, accurately and fairly reflect the transactions and dispositions of the assets of the company; (2) provide reasonable assurance that transactions are recorded as necessary to permit preparation of financial statements in accordance with generally accepted accounting principles, and that receipts and expenditures of the company are being made only in accordance with authorizations of management and directors of the company; and (3) provide reasonable assurance regarding prevention or timely detection of unauthorized acquisition, use, or disposition of the company’s assets that could have a material effect on the financial statements.
Because of its inherent limitations, internal control over financial reporting may not prevent or detect misstatements. Also, projections of any evaluation of effectiveness to future periods are subject to the risk that controls may become inadequate because of changes in conditions, or that the degree of compliance with the policies or procedures may deteriorate.
63
In our opinion, the consolidated financial statements referred to above present fairly, in all material respects, the financial position of Orrstown Financial Services, Inc. and its wholly-owned subsidiary as of December 31, 2015 and 2014, and the results of their operations and their cash flows for the years then ended, in conformity with accounting principles generally accepted in the United States of America. Also in our opinion, Orrstown Financial Services, Inc. and its wholly-owned subsidiary maintained, in all material respects, effective internal control over financial reporting as of December 31, 2015, based on criteria established in the 2013 Internal Control - Integrated Framework issued by the COSO.
/s/ Crowe Horwath LLP
Cleveland, Ohio
March 11, 2016
64

Report of Independent Registered Public Accounting Firm
To the Board of Directors and Shareholders of
Orrstown Financial Services, Inc.
We have audited the accompanying consolidated statements of income, comprehensive income, changes in shareholders’ equity, and cash flows of Orrstown Financial Services, Inc. and its wholly-owned subsidiary (“the Company”) for the year ended December 31, 2013. Orrstown Financial Services, Inc. and its wholly-owned subsidiary’s management is responsible for these financial statements. Our responsibility is to express an opinion on these financial statements based on our audit.
We conducted our audit in accordance with the standards of the Public Company Accounting Oversight Board (United States). Those standards require that we plan and perform the audit to obtain reasonable assurance about whether the financial statements are free of material misstatement. An audit includes examining, on a test basis, evidence supporting the amounts and disclosures in the financial statements. An audit also includes assessing the accounting principles used and significant estimates made by management, as well as evaluating the overall financial statement presentation. We believe that our audit provides a reasonable basis for our opinion.
In our opinion, the consolidated financial statements referred to above present fairly, in all material respects, the results of Orrstown Financial Services, Inc. and its wholly-owned subsidiary's operations and their cash flows for the year ended December 31, 2013 in conformity with accounting principles generally accepted in the United States of America.
/s/ Smith Elliott Kearns & Company, LLC
Chambersburg, Pennsylvania
March 14, 2014
65
ORRSTOWN FINANCIAL SERVICES, INC. AND ITS WHOLLY-OWNED SUBSIDIARY
|
|
December 31,
|
||||||
|
(Dollars in thousands, except per share data)
|
2015
|
2014
|
|||||
|
Assets
|
|||||||
|
Cash and due from banks
|
$
|
11,412
|
|
$
|
18,174
|
|
|
|
Interest bearing deposits with banks
|
16,928
|
|
13,235
|
|
|||
|
Cash and cash equivalents
|
28,340
|
|
31,409
|
|
|||
|
Restricted investments in bank stocks
|
8,720
|
|
8,350
|
|
|||
|
Securities available for sale
|
394,124
|
|
376,199
|
|
|||
|
Loans held for sale
|
5,917
|
|
3,159
|
|
|||
|
Loans
|
781,713
|
|
704,946
|
|
|||
|
Less: Allowance for loan losses
|
(13,568
|
)
|
(14,747
|
)
|
|||
|
Net loans
|
768,145
|
|
690,199
|
|
|||
|
Premises and equipment, net
|
23,960
|
|
24,800
|
|
|||
|
Cash surrender value of life insurance
|
31,224
|
|
26,645
|
|
|||
|
Intangible assets
|
207
|
|
414
|
|
|||
|
Accrued interest receivable
|
3,845
|
|
3,097
|
|
|||
|
Other assets
|
28,334
|
|
26,171
|
|
|||
|
Total assets
|
$
|
1,292,816
|
|
$
|
1,190,443
|
|
|
|
Liabilities
|
|||||||
|
Deposits:
|
|||||||
|
Non-interest bearing
|
$
|
131,390
|
|
$
|
116,302
|
|
|
|
Interest bearing
|
900,777
|
|
833,402
|
|
|||
|
Total deposits
|
1,032,167
|
|
949,704
|
|
|||
|
Short-term borrowings
|
89,156
|
|
86,742
|
|
|||
|
Long-term debt
|
24,495
|
|
14,812
|
|
|||
|
Accrued interest and other liabilities
|
13,937
|
|
11,920
|
|
|||
|
Total liabilities
|
1,159,755
|
|
1,063,178
|
|
|||
|
Shareholders’ Equity
|
|||||||
|
Preferred stock, $1.25 par value per share; 500,000 shares authorized; no shares issued or outstanding
|
0
|
|
0
|
|
|||
|
Common stock, no par value—$0.05205 stated value per share 50,000,000 shares authorized; 8,320,479 and 8,264,554 shares issued; 8,272,591 and 8,263,743 shares outstanding
|
435
|
|
430
|
|
|||
|
Additional paid—in capital
|
124,317
|
|
123,392
|
|
|||
|
Retained earnings
|
7,939
|
|
1,887
|
|
|||
|
Accumulated other comprehensive income
|
1,199
|
|
1,576
|
|
|||
|
Treasury stock—common, 47,888 and 811 shares, at cost
|
(829
|
)
|
(20
|
)
|
|||
|
Total shareholders’ equity
|
133,061
|
|
127,265
|
|
|||
|
Total liabilities and shareholders’ equity
|
$
|
1,292,816
|
|
$
|
1,190,443
|
|
|
The Notes to Consolidated Financial Statements are an integral part of these statements.
66
ORRSTOWN FINANCIAL SERVICES, INC. AND ITS WHOLLY-OWNED SUBSIDIARY
|
|
Years Ended December 31,
|
||||||||||
|
(Dollars in thousands, except per share data)
|
2015
|
2014
|
2013
|
||||||||
|
Interest and dividend income
|
|||||||||||
|
Interest and fees on loans
|
$
|
30,798
|
|
$
|
29,546
|
|
$
|
31,558
|
|
||
|
Interest and dividends on investment securities
|
|||||||||||
|
Taxable
|
6,697
|
|
8,052
|
|
4,300
|
|
|||||
|
Tax-exempt
|
1,059
|
|
550
|
|
1,066
|
|
|||||
|
Short term investments
|
81
|
|
35
|
|
174
|
|
|||||
|
Total interest and dividend income
|
38,635
|
|
38,183
|
|
37,098
|
|
|||||
|
Interest expense
|
|||||||||||
|
Interest on deposits
|
3,606
|
|
3,678
|
|
4,445
|
|
|||||
|
Interest on short-term borrowings
|
295
|
|
148
|
|
61
|
|
|||||
|
Interest on long-term debt
|
400
|
|
333
|
|
505
|
|
|||||
|
Total interest expense
|
4,301
|
|
4,159
|
|
5,011
|
|
|||||
|
Net interest income
|
34,334
|
|
34,024
|
|
32,087
|
|
|||||
|
Provision for loan losses
|
(603
|
)
|
(3,900
|
)
|
(3,150
|
)
|
|||||
|
Net interest income after provision for loan losses
|
34,937
|
|
37,924
|
|
35,237
|
|
|||||
|
Noninterest income
|
|||||||||||
|
Service charges on deposit accounts
|
5,226
|
|
5,415
|
|
5,716
|
|
|||||
|
Other service charges, commissions and fees
|
1,223
|
|
1,033
|
|
1,070
|
|
|||||
|
Trust department income
|
4,598
|
|
4,687
|
|
4,770
|
|
|||||
|
Brokerage income
|
2,025
|
|
2,150
|
|
1,911
|
|
|||||
|
Mortgage banking activities
|
2,747
|
|
2,207
|
|
3,053
|
|
|||||
|
Earnings on life insurance
|
1,025
|
|
950
|
|
963
|
|
|||||
|
Other income (loss)
|
410
|
|
477
|
|
(7
|
)
|
|||||
|
Investment securities gains
|
1,924
|
|
1,935
|
|
332
|
|
|||||
|
Total noninterest income
|
19,178
|
|
18,854
|
|
17,808
|
|
|||||
|
Noninterest expenses
|
|||||||||||
|
Salaries and employee benefits
|
24,056
|
|
23,658
|
|
22,954
|
|
|||||
|
Occupancy
|
2,221
|
|
2,251
|
|
2,055
|
|
|||||
|
Furniture and equipment
|
3,061
|
|
3,328
|
|
3,446
|
|
|||||
|
Data processing
|
2,026
|
|
1,866
|
|
682
|
|
|||||
|
Telephone and communication
|
692
|
|
569
|
|
451
|
|
|||||
|
Automated teller and interchange fees
|
798
|
|
865
|
|
1,054
|
|
|||||
|
Advertising and bank promotions
|
1,564
|
|
1,195
|
|
1,251
|
|
|||||
|
FDIC insurance
|
859
|
|
1,621
|
|
2,577
|
|
|||||
|
Legal
|
1,440
|
|
705
|
|
793
|
|
|||||
|
Other professional services
|
1,262
|
|
1,580
|
|
1,462
|
|
|||||
|
Directors' compensation
|
737
|
|
624
|
|
622
|
|
|||||
|
Collection and problem loan
|
447
|
|
729
|
|
674
|
|
|||||
|
Real estate owned
|
162
|
|
300
|
|
137
|
|
|||||
|
Taxes other than income
|
916
|
|
562
|
|
939
|
|
|||||
|
Intangible asset amortization
|
207
|
|
208
|
|
210
|
|
|||||
|
Other operating expenses
|
4,159
|
|
3,707
|
|
3,940
|
|
|||||
|
Total noninterest expenses
|
44,607
|
|
43,768
|
|
43,247
|
|
|||||
|
Income before income tax expense (benefit)
|
9,508
|
|
13,010
|
|
9,798
|
|
|||||
|
Income tax expense (benefit)
|
1,634
|
|
(16,132
|
)
|
(206
|
)
|
|||||
|
Net income
|
$
|
7,874
|
|
$
|
29,142
|
|
$
|
10,004
|
|
||
|
Per share information:
|
|||||||||||
|
Basic earnings per share
|
$
|
0.97
|
|
$
|
3.59
|
|
$
|
1.24
|
|
||
|
Diluted earnings per share
|
0.97
|
|
3.59
|
|
1.24
|
|
|||||
|
Dividends per share
|
0.22
|
|
0.00
|
|
0.00
|
|
|||||
The Notes to Consolidated Financial Statements are an integral part of these statements.
67
Consolidated Statements of Comprehensive Income
ORRSTOWN FINANCIAL SERVICES, INC. AND ITS WHOLLY-OWNED SUBSIDIARY
|
|
Years Ended December 31,
|
||||||||||
|
(Dollars in thousands)
|
2015
|
2014
|
2013
|
||||||||
|
Net income
|
$
|
7,874
|
|
$
|
29,142
|
|
$
|
10,004
|
|
||
|
Other comprehensive income (loss), net of tax:
|
|||||||||||
|
Unrealized holding gains (losses) on securities available for sale arising during the period
|
1,345
|
|
11,764
|
|
(9,885
|
)
|
|||||
|
Reclassification adjustment for gains realized in net income
|
(1,924
|
)
|
(1,935
|
)
|
(332
|
)
|
|||||
|
Net unrealized gains (losses)
|
(579
|
)
|
9,829
|
|
(10,217
|
)
|
|||||
|
Tax effect
|
202
|
|
(3,440
|
)
|
3,576
|
|
|||||
|
Total other comprehensive income (loss), net of tax and reclassification adjustments
|
(377
|
)
|
6,389
|
|
(6,641
|
)
|
|||||
|
Total comprehensive income
|
$
|
7,497
|
|
$
|
35,531
|
|
$
|
3,363
|
|
||
The Notes to Consolidated Financial Statements are an integral part of these statements.
68
Consolidated Statements of Changes in Shareholders’ Equity
ORRSTOWN FINANCIAL SERVICES, INC. AND ITS WHOLLY-OWNED SUBSIDIARY
|
|
Years Ended December 31, 2015, 2014, and 2013
|
||||||||||||||||||||||
|
(Dollars in thousands, except per share data)
|
Common
Stock
|
Additional
Paid-In
Capital
|
Retained
Earnings
|
Accumulated
Other
Comprehensive
Income (Loss)
|
Treasury
Stock
|
Total
Shareholders’
Equity
|
|||||||||||||||||
|
Balance, January 1, 2013
|
$
|
421
|
|
$
|
122,724
|
|
$
|
(37,259
|
)
|
$
|
1,828
|
|
$
|
(20
|
)
|
$
|
87,694
|
|
|||||
|
Net income
|
0
|
|
0
|
|
10,004
|
|
0
|
|
0
|
|
10,004
|
|
|||||||||||
|
Total other comprehensive income (loss), net of taxes
|
0
|
|
0
|
|
0
|
|
(6,641
|
)
|
0
|
|
(6,641
|
)
|
|||||||||||
|
Stock-based compensation plans:
|
|||||||||||||||||||||||
|
Issuance of stock (26,610 shares, including 1 treasury), including compensation expense of $129
|
1
|
|
377
|
|
0
|
|
0
|
|
0
|
|
378
|
|
|||||||||||
|
Issuance of stock through dividend reinvestment plan (254 shares)
|
0
|
|
4
|
|
0
|
|
0
|
|
0
|
|
4
|
|
|||||||||||
|
Balance, December 31, 2013
|
422
|
|
123,105
|
|
(27,255
|
)
|
(4,813
|
)
|
(20
|
)
|
91,439
|
|
|||||||||||
|
Net income
|
0
|
|
0
|
|
29,142
|
|
0
|
|
0
|
|
29,142
|
|
|||||||||||
|
Total other comprehensive income, net of taxes
|
0
|
|
0
|
|
0
|
|
6,389
|
|
0
|
|
6,389
|
|
|||||||||||
|
Stock-based compensation plans:
|
|||||||||||||||||||||||
|
Issuance of stock (157,207 shares), including compensation expense of $190
|
8
|
|
286
|
|
0
|
|
0
|
|
0
|
|
294
|
|
|||||||||||
|
Issuance of stock through dividend reinvestment plan (73 shares)
|
0
|
|
1
|
|
0
|
|
0
|
|
0
|
|
1
|
|
|||||||||||
|
Balance, December 31, 2014
|
430
|
|
123,392
|
|
1,887
|
|
1,576
|
|
(20
|
)
|
127,265
|
|
|||||||||||
|
Net income
|
0
|
|
0
|
|
7,874
|
|
0
|
|
0
|
|
7,874
|
|
|||||||||||
|
Total other comprehensive income (loss), net of taxes
|
0
|
|
0
|
|
0
|
|
(377
|
)
|
0
|
|
(377
|
)
|
|||||||||||
|
Cash dividends ($0.22 per share)
|
0
|
|
0
|
|
(1,822
|
)
|
0
|
|
0
|
|
(1,822
|
)
|
|||||||||||
|
Stock-based compensation plans:
|
|||||||||||||||||||||||
|
Issuance of stock (50,686 shares), including compensation expense of $740
|
5
|
|
835
|
|
0
|
|
0
|
|
0
|
|
840
|
|
|||||||||||
|
Issuance of stock through dividend reinvestment plan (5,239 shares)
|
0
|
|
90
|
|
0
|
|
0
|
|
0
|
|
90
|
|
|||||||||||
|
Acquisition of treasury stock (47,077 shares)
|
0
|
|
0
|
|
0
|
|
0
|
|
(809
|
)
|
(809
|
)
|
|||||||||||
|
Balance, December 31, 2015
|
$
|
435
|
|
$
|
124,317
|
|
$
|
7,939
|
|
$
|
1,199
|
|
$
|
(829
|
)
|
$
|
133,061
|
|
|||||
The Notes to Consolidated Financial Statements are an integral part of these statements.
69
ORRSTOWN FINANCIAL SERVICES, INC. AND ITS WHOLLY-OWNED SUBSIDIARY
|
|
Years Ended December 31,
|
||||||||||
|
(Dollars in thousands)
|
2015
|
2014
|
2013
|
||||||||
|
Cash flows from operating activities
|
|||||||||||
|
Net income
|
$
|
7,874
|
|
$
|
29,142
|
|
$
|
10,004
|
|
||
|
Adjustments to reconcile net income to net cash provided by operating activities:
|
|||||||||||
|
Amortization of premiums on securities available for sale
|
6,033
|
|
6,429
|
|
7,147
|
|
|||||
|
Depreciation and amortization
|
2,907
|
|
2,838
|
|
2,817
|
|
|||||
|
Provision for loan losses
|
(603
|
)
|
(3,900
|
)
|
(3,150
|
)
|
|||||
|
Stock based compensation
|
740
|
|
190
|
|
129
|
|
|||||
|
Net change in loans held for sale
|
(2,758
|
)
|
(1,223
|
)
|
5,926
|
|
|||||
|
Net (gain) loss on disposal of other real estate owned
|
(234
|
)
|
(299
|
)
|
149
|
|
|||||
|
Writedown of other real estate owned
|
45
|
|
170
|
|
46
|
|
|||||
|
Net loss on disposal of premises and equipment
|
0
|
|
41
|
|
0
|
|
|||||
|
Deferred income taxes, including valuation allowance
|
797
|
|
(16,223
|
)
|
0
|
|
|||||
|
Investment securities gains
|
(1,924
|
)
|
(1,935
|
)
|
(332
|
)
|
|||||
|
Earnings on cash surrender value of life insurance
|
(1,025
|
)
|
(950
|
)
|
(963
|
)
|
|||||
|
(Increase) decrease in accrued interest receivable
|
(748
|
)
|
303
|
|
(212
|
)
|
|||||
|
Increase (decrease) in accrued interest payable and other liabilities
|
2,017
|
|
1,046
|
|
(957
|
)
|
|||||
|
Other, net
|
(963
|
)
|
1,629
|
|
12,356
|
|
|||||
|
Net cash provided by operating activities
|
12,158
|
|
17,258
|
|
32,960
|
|
|||||
|
Cash flows from investing activities
|
|||||||||||
|
Proceeds from sales of available for sale securities
|
65,611
|
|
169,573
|
|
74,273
|
|
|||||
|
Maturities, repayments and calls of available for sale securities
|
32,251
|
|
41,520
|
|
86,581
|
|
|||||
|
Purchases of available for sale securities
|
(120,475
|
)
|
(175,014
|
)
|
(282,859
|
)
|
|||||
|
Net (purchases) redemptions of restricted investments in bank stocks
|
(370
|
)
|
1,571
|
|
(117
|
)
|
|||||
|
Net (increase) decrease in loans
|
(78,776
|
)
|
(44,222
|
)
|
30,682
|
|
|||||
|
Proceeds from sales of portfolio loans
|
0
|
|
5,743
|
|
2,439
|
|
|||||
|
Investment in limited partnerships
|
(2,205
|
)
|
0
|
|
0
|
|
|||||
|
Purchases of bank premises and equipment
|
(1,471
|
)
|
(859
|
)
|
(1,868
|
)
|
|||||
|
Proceeds from disposal of other real estate owned
|
1,839
|
|
2,415
|
|
1,188
|
|
|||||
|
Purchases of bank owned life insurance
|
(3,750
|
)
|
0
|
|
0
|
|
|||||
|
Net cash provided by (used in) investing activities
|
(107,346
|
)
|
727
|
|
(89,681
|
)
|
|||||
|
Cash flows from financing activities
|
|||||||||||
|
Net increase (decrease) in deposits
|
82,463
|
|
(50,686
|
)
|
(84,649
|
)
|
|||||
|
Net increase in short term borrowings
|
2,414
|
|
27,710
|
|
49,382
|
|
|||||
|
Proceeds from long-term debt
|
20,000
|
|
10,000
|
|
0
|
|
|||||
|
Payments on long-term debt
|
(10,317
|
)
|
(11,265
|
)
|
(21,393
|
)
|
|||||
|
Dividends paid
|
(1,822
|
)
|
0
|
|
0
|
|
|||||
|
Net proceeds from issuance of common stock
|
190
|
|
105
|
|
253
|
|
|||||
|
Acquisition of treasury stock
|
(809
|
)
|
0
|
|
0
|
|
|||||
|
Net cash provided by (used in) financing activities
|
92,119
|
|
(24,136
|
)
|
(56,407
|
)
|
|||||
|
Net decrease in cash and cash equivalents
|
(3,069
|
)
|
(6,151
|
)
|
(113,128
|
)
|
|||||
|
Cash and cash equivalents at beginning of year
|
31,409
|
|
37,560
|
|
150,688
|
|
|||||
|
Cash and cash equivalents at end of year
|
$
|
28,340
|
|
$
|
31,409
|
|
$
|
37,560
|
|
||
|
Supplemental disclosure of cash flow information:
|
|||||||||||
|
Cash paid during the year for:
|
|||||||||||
|
Interest
|
$
|
4,208
|
|
$
|
4,219
|
|
$
|
5,102
|
|
||
|
Income taxes
|
800
|
|
0
|
|
0
|
|
|||||
|
Supplemental schedule of noncash investing and financing activities:
|
|||||||||||
|
Other real estate acquired in settlement of loans
|
1,428
|
|
2,231
|
|
494
|
|
|||||
The Notes to Consolidated Financial Statements are an integral part of these statements.
70
Notes to Consolidated Financial Statements
Nature of Operations
– Orrstown Financial Services, Inc. (the “Company”) is a bank holding company (that has elected status as a financial holding company with the Board of Governors of the Federal Reserve System (the “FRB”)) whose primary activity consists of supervising its wholly-owned subsidiary, Orrstown Bank (the “Bank”). The Company operates through its office in Shippensburg, Pennsylvania. The Bank provides services through its network of
21
offices in Cumberland, Franklin, Lancaster, and Perry Counties of Pennsylvania and in Washington County, Maryland. The Bank engages in lending services for commercial, residential, commercial mortgages, construction, municipal, and various forms of consumer lending. Deposit services include checking, savings, time, and money market deposits. The Bank also provides investment and brokerage services through its Orrstown Financial Advisors division. The Company and the Bank are subject to the regulation of certain federal and state agencies and undergo periodic examinations by such regulatory authorities.
Basis of Presentation
– The consolidated financial statements of the Company are prepared in accordance with accounting principles generally accepted in the United States (“GAAP”). The consolidated financial statements include the accounts of the Company and the Bank. All significant intercompany transactions and accounts have been eliminated.
Use of Estimates –
The preparation of financial statements in conformity with GAAP requires management to make estimates and assumptions based on available information. These estimates and assumptions affect the amounts reported in the financial statements and the disclosures provided, and actual results could differ.
Subsequent Events –
GAAP establishes standards for accounting for and disclosure of events that occur after the balance sheet date but before financial statements are issued. The subsequent events principle sets forth the period after the balance sheet date during which management of a reporting entity should evaluate events or transactions that may occur for potential recognition in the financial statements, identifies the circumstances under which an entity should recognize events or transactions occurring after the balance sheet date in its financial statements, and specifies the disclosures that should be made about events or transactions that occur after the balance sheet date.
Concentration of Credit Risk
– The Company grants commercial, residential, construction, municipal, and various forms of consumer lending to customers in its market area. Although the Company maintains a diversified loan portfolio, a significant portion of its customers’ ability to honor their contracts is dependent upon economic sectors for commercial real estate, including office space, retail strip centers, multi-family and hospitality, residential building operators, sales finance, sub-dividers and developers. Management evaluates each customer’s creditworthiness on a case-by-case basis. The amount of collateral obtained, if collateral is deemed necessary by the Company upon the extension of credit, is based on management’s credit evaluation of the customer. Collateral held varies, but generally includes real estate and equipment.
The types of securities the Company invests in are included in Note 3, “Securities Available for Sale” and the type of lending the Company engages in are included in Note 4, “Loans Receivable and Allowance for Loan Losses.”
Cash and Cash Equivalents –
For purposes of the consolidated statements of cash flows, cash and cash equivalents include cash, balances due from banks, federal funds sold and interest bearing deposits due on demand, all of which have original maturities of
90
days or less. Net cash flows are reported for customer loan and deposit transactions, loans held for sale, redemption (purchases) of restricted investments in bank stocks, and short-term borrowings.
Restricted Investments in Bank Stocks –
Restricted investments in bank stocks, which represents required investments in the common stock of correspondent banks, is carried at cost as of
December 31, 2015
and
2014
, and consists of common stock of the Federal Reserve Bank of Philadelphia (“Federal Reserve Bank”), Atlantic Community Bankers Bank and the Federal Home Loan Bank of Pittsburgh (“FHLB”) stocks.
Management evaluates the restricted investment in bank stocks for impairment in accordance with Accounting Standard Codification (ASC) Topic 942,
Accounting by Certain Entities (Including Entities with Trade Receivables) That Lend to or Finance the Activities of Others.
Management’s determination of whether these investments are impaired is based on their assessment of the ultimate recoverability of their cost rather than by recognizing temporary declines in value. The determination of whether a decline affects the ultimate recoverability of their cost is influenced by criteria such as (1) the significance of the decline in net assets of the correspondent bank as compared to the capital stock amount for the correspondent bank and the length of time this situation has persisted, (2) commitments by the correspondent bank to make payments required by law or regulation and the level of such payments in relation to the operating performance of the correspondent bank, and (3) the impact of legislative and regulatory changes on institutions and, accordingly, on the customer base of the correspondent bank.
Management believes
no
impairment charge is necessary related to the restricted investments in bank stocks as of
December 31, 2015
. However, security impairment analysis is completed quarterly and the determination that no impairment had occurred as of
December 31, 2015
is no assurance that impairment may not occur in the future.
71
Securities –
Certain debt securities that management has the positive intent and ability to hold to maturity are classified as “held to maturity” and recorded at amortized cost. “Trading” securities are recorded at fair value with changes in fair value included in earnings. As of
December 31, 2015
and
2014
the Company had
no
held to maturity or trading securities. Securities not classified as held to maturity or trading, including equity securities with readily determinable fair values, are classified as “available for sale” and recorded at fair value, with unrealized gains and losses excluded from earnings and reported in other comprehensive income, net of tax. Purchase premiums and discounts are recognized in interest income using the interest method over the terms of the securities and approximate the level yield method. Gains and losses on the sale of securities are recorded on the trade date and are determined using the specific identification method.
Management evaluates securities for other-than-temporary impairment (“OTTI”) on at least a quarterly basis, and more frequently when economic or market conditions warrant such an evaluation. For securities in an unrealized loss position, management considers the extent and duration of the unrealized loss, and the financial condition and near-term prospects of the issuer. Management also assesses whether it intends to sell, or it is more likely than not that it will be required to sell, a security in an unrealized loss position before recovery of its amortized cost basis. If either of the criteria regarding intent or requirement to sell is met, the entire difference between amortized cost and fair value is recognized as impairment through earnings. For debt securities that do not meet the aforementioned criteria, the amount of impairment is split into
two
components as follows: 1) OTTI related to credit loss, which must be recognized in the income statement and 2) OTTI related to other factors, which is recognized in other comprehensive income. The credit loss is defined as the difference between the present value of the cash flows expected to be collected and the amortized cost basis. For equity securities, the entire amount of impairment is recognized through earnings.
The Company had
no
debt securities it deemed to be other than temporarily impaired for the years ended
December 31, 2015
,
2014
or
2013
.
The Company’s securities are exposed to various risks, such as interest rate risk, market risk, and credit risks. Due to the level of risk associated with certain investments and the level of uncertainty related to changes in the value of investments, it is at least reasonably possible that changes in risks in the near term would materially affect investment assets reported in the consolidated financial statements.
Loans Held for Sale –
Loans originated and intended for sale in the secondary market are carried at the lower of aggregate cost or fair value (LOCM). Gains and losses on loan sales (sales proceeds minus carrying value) are recorded in non-interest income.
Loans –
The Company grants commercial, residential, commercial mortgage, construction, mortgage and various forms of consumer loans to its customers located principally in south-central Pennsylvania and northern Maryland. The ability of the Company’s debtors to honor their contracts is dependent largely upon the real estate and general economic conditions in this area.
Loans that management has the intent and ability to hold for the foreseeable future or until maturity or pay-off generally are reported at their outstanding unpaid principal balances adjusted for charge-offs, the allowance for loan losses, and any deferred fees or costs on originated loans. Interest income is accrued on the unpaid principal balance. Loan origination fees, net of certain direct origination costs, are deferred and amortized as a yield adjustment over the respective term of the loan.
For all classes of loans, the accrual of interest income on loans, including impaired loans, ceases when principal or interest is past due
90
days or more or immediately if, in the opinion of management, full collection is unlikely. Interest will continue to accrue on loans past due 90 days or more if the collateral is adequate to cover principal and interest, and the loan is in the process of collection. Interest accrued, but not collected, as of the date of placement on nonaccrual status, is reversed and charged against current interest income, unless fully collateralized. Subsequent payments received are either applied to the outstanding principal balance or recorded as interest income, depending upon management’s assessment of the ultimate collectability of principal. Loans are returned to accrual status, for all loan classes, when all the principal and interest amounts contractually due are brought current, the loan has performed in accordance with the contractual terms of the note for a reasonable period of time, generally
six months
, and the ultimate collectability of the total contractual principal and interest is reasonably assured. Past due status is based on contractual terms of the loan.
Loans, the terms of which are modified, are classified as troubled debt restructurings if, in connection with the modification, a concession was granted, for legal or economic reasons, related to a debtor’s financial difficulties. Concessions granted under a troubled debt restructuring typically involve a temporary deferral of scheduled loan payments, an extension of a loan’s stated maturity date, temporary reduction in interest rates, or granting of an interest rate below market rates given the risk of the transaction. If a modification occurs while the loan is on accruing status, it will continue to accrue interest under the modified terms. Nonaccrual troubled debt restructurings may be restored to accrual status if scheduled principal and interest payments, under the modified terms, are current for six months after modification, and the borrower continues to demonstrate
72
its ability to meet the modified terms. Troubled debt restructurings are evaluated individually for impairment if they have been restructured during the most recent calendar year, or if they are not performing according to their modified terms.
Allowance for Loan Losses –
The allowance for loan losses is a valuation allowance for probable incurred credit losses. Loan losses are charged against the allowance when management believes the uncollectability of a loan balance is confirmed. Subsequent recoveries, if any, are credited to the allowance.
The allowance for loan losses is evaluated on a regular basis by management and is based upon management’s periodic review of the collectability of the loans in light of historical experience, the nature and volume of the loan portfolio, adverse situations that may affect the borrower’s ability to repay, estimated value of any underlying collateral and prevailing economic conditions. This evaluation is inherently subjective as it requires estimates that are susceptible to significant revision as more information becomes available.
See Note 4, “Loans Receivable and Allowance for Loan Losses,” for additional details.
Loan Commitments and Related Financial Instruments –
Financial instruments include off-balance sheet credit instruments, such as commitments to make loans and commercial letters of credit, issued to meet customer financing needs. The face amount for these items represents the exposure to loss, before considering customer collateral or ability to repay. Such financial instruments are recorded when they are funded.
Loans Serviced –
The Bank administers secondary market mortgage programs available through the FHLB and the Federal National Mortgage Association and offers residential mortgage products and services to customers. The Bank originates single-family residential mortgage loans for immediate sale in the secondary market, and retains the servicing of those loans. At
December 31, 2015
and
2014
, the balance of loans serviced for others was
$317,793,000
and
$315,239,000
.
Transfers of Financial Assets –
Transfers of financial assets are accounted for as sales when control over the assets has been surrendered. Control over transferred assets is deemed to be surrendered when (1) the assets have been isolated from the Company, (2) the transferee obtains the right (free of conditions that constrain it from taking advantage of that right) to pledge or exchange the transferred assets, and (3) the Company does not maintain effective control over the transferred assets through an agreement to repurchase them before their maturity.
Cash Surrender Value of Life Insurance –
The Company has purchased life insurance policies on certain employees. Company owned life insurance is recorded at the amount that can be realized under the insurance contract at the balance sheet date, which is the cash surrender value adjusted for other charges or other amounts due that are probable at settlement.
Premises and Equipment –
Buildings, improvements, equipment, furniture and fixtures are carried at cost less accumulated depreciation and amortization. Land is carried at cost. Depreciation and amortization has been provided generally on the straight-line method and is computed over the estimated useful lives of the various assets as follows: buildings and improvements, including leasehold improvements –
10
to
40
years; and furniture and equipment –
3
to
15
years. Repairs and maintenance are charged to operations as incurred, while major additions and improvements are capitalized. Gain or loss on retirement or disposal of individual assets is recorded as income or expense in the period of retirement or disposal.
Intangible Assets –
Intangible assets represent purchased assets that lack physical substance but can be distinguished from goodwill because of contractual or other legal rights. The Company’s intangible assets have finite lives and are amortized, on a straight line basis, over their estimated lives, generally
10
years for deposit premiums and
15
years for customer lists.
Mortgage Servicing Rights –
The estimated fair value of mortgage servicing rights (MSRs) related to loans sold and serviced by the Company is recorded as an asset upon the sale of such loan. MSRs are amortized as a reduction to servicing income over the estimated lives of the underlying loans. MSRs are evaluated periodically for impairment, by comparing the carrying amount to estimated fair value. Fair value is determined periodically through a discounted cash flows valuation performed by a third party. Significant inputs to the valuation include expected servicing income, net of expense, the discount rate and the expected life of the underlying loans. To the extent the amortized cost of the MSRs exceeds their estimated fair values, a valuation allowance is established for such impairment through a charge against servicing income on the consolidated statement of operations. If the Company determines, based on subsequent valuations, that impairment no longer exists or is reduced, the valuation allowance is reduced through a credit to earnings.
Foreclosed Real Estate –
Real estate properties acquired through, or in lieu of, loan foreclosure are held for sale and are initially recorded at fair value less estimated costs to sell the underlying collateral. Capitalized costs include any costs that significantly improve the value of the properties. After foreclosure, valuations are periodically performed by management and the real estate is carried at the lower of carrying amount or fair value less estimated costs to sell. Foreclosed real estate totaled
$710,000
and
$932,000
as of
December 31, 2015
and
2014
and is included in other assets.
73
Investments in Real Estate Partnerships –
The Company currently has a
99%
limited partner interest in several real estate partnerships in central Pennsylvania. These investments are affordable housing projects which entitle the Company to tax deductions and credits that expire through 2021. The Company accounts for its investments in affordable housing projects under the proportional amortization method when the criteria is met. However, investments entered into prior to January 1, 2015 did not meet the criteria, and are accounted for under the equity method of accounting, and recognizes tax credits when they become available. The recorded investment in these real estate partnerships totaled
$5,450,000
and
$3,629,000
as of
December 31, 2015
and
2014
and are included in other assets in the balance sheet, of which
$2,205,000
was invested in 2015 and will be accounted for under the proportional amortization method, when federal income tax benefits are available. Losses of
$384,000
,
$150,000
and
$361,000
were recorded for the years ended
December 31, 2015
,
2014
and
2013
and are included in other operating expenses. During
2015
,
2014
and
2013
, the Company recognized federal tax credits from the projects totaling
$475,000
,
$475,000
and
$475,000
, which is included in income tax expense.
Advertising –
The Company follows the policy of charging costs of advertising to expense as incurred. Advertising expense was
$723,000
,
$540,000
and
$489,000
, for the years ended
December 31, 2015
,
2014
and
2013
.
Securities Sold Under Agreements to Repurchase
(“Repurchase Agreements”)
–
The Company enters into agreements under which it sells securities subject to an obligation to repurchase the same or similar securities which are included in short-term borrowings. Under these agreements, the Company may transfer legal control over the assets but still retain effective control through an agreement that both entitles and obligates the Company to repurchase the assets. As a result, these Repurchase Agreements are accounted for as collateralized financing arrangements (i.e., secured borrowings) and not as a sale and subsequent repurchase of securities. The obligation to repurchase the securities is reflected as a liability in the Company’s consolidated balance sheet, while the securities underlying the Repurchase Agreements remain in the respective investment securities asset accounts. In other words, there is no offsetting or netting of the investment securities assets with the Repurchase Agreement liabilities. In addition, as the Company does not enter into reverse Repurchase Agreements, there is no such offsetting to be done with the Repurchase Agreements.
The right of setoff for a Repurchase Agreement resembles a secured borrowing, whereby the collateral would be used to settle the fair value of the Repurchase Agreement should the Company be in default (e.g., fails to make an interest payment to the counterparty). For the Repurchase Agreements, the collateral is held by the Company in a segregated custodial account under a third party agreement. Repurchase agreements are secured by U.S. Government Sponsored Enterprises mortgage-backed securities and mature overnight.
Stock Compensation Plans – The Company has stock compensation plans that cover employees and non-employee directors. Stock compensation accounting guidance (FASB ASC 718, Compensation – Stock Compensation) requires that the compensation cost relating to share-based payment transactions be recognized in financial statements. That cost is measured based on the grant date fair value of the stock award, including a Black-Scholes model for stock options. Compensation cost for all stock awards are calculated and recognized over the employees’ service period, generally defined as the vesting period.
Income Taxes –
The Company accounts for income taxes in accordance with income tax accounting guidance (FASB ASC 740,
Income Taxes
). The income tax accounting guidance results in two components of income tax expense: current and deferred. Current income tax expense reflects taxes to be paid or refunded for the current period by applying the provisions of the enacted tax law to the taxable income or excess of deductions over revenues. The Company determines deferred income taxes using the liability (or balance sheet) method. Under this method, the net deferred tax asset or liability is based on the tax effects of the differences between the book and tax bases of assets and liabilities, and enacted changes in tax rates and laws are recognized in the period in which they occur.
Deferred income tax expense results from changes in deferred tax assets and liabilities between periods. Deferred tax assets are recognized if it is more likely than not, based on the technical merits, that the tax position will be realized or sustained upon examination. The term more likely than not means a likelihood of more than
50
percent; the terms examined and upon examination also include resolution of the related appeals or litigation processes, if any. A tax position that meets the more-likely-than-not recognition threshold is initially and subsequently measured as the largest amount of tax benefit that has a greater than 50 percent likelihood of being realized upon settlement with a taxing authority that has full knowledge of all relevant information. The determination of whether or not a tax position has met the more-likely-than-not recognition threshold considers the facts, circumstances, and information available at the reporting date and is subject to management’s judgment. Deferred tax assets are reduced by a valuation allowance if, based on the weight of evidence available, it is more likely than not that some portion or all of a deferred tax asset will not be realized. The Company recognizes interest and penalties, if any, on income taxes as a component of income tax expense.
Loss Contingencies –
Loss contingencies, including claims and legal actions arising in the ordinary course of business, are recorded as liabilities when the likelihood of loss is probable and an amount or range of loss can be reasonably estimated.
Treasury Stock –
Common stock shares repurchased are recorded as treasury stock at cost.
74
Earnings Per Share –
Basic earnings per share represent net income available to common stockholders divided by the weighted-average number of common shares outstanding during the period. Restricted stock awards are included in weighted average common shares outstanding as they are earned. Diluted earnings per share reflect the additional common shares that would have been outstanding if dilutive potential common shares had been issued. Potential common shares that may be issued by the Company related solely to outstanding stock options and restricted stock awards.
Treasury shares are not deemed outstanding for earnings per share calculations.
Comprehensive Income –
Comprehensive income consists of net income and other comprehensive income. Other comprehensive income is limited to unrealized gains (losses) on securities available for sale for all years presented. The component of accumulated other comprehensive income, net of taxes, at
December 31, 2015
and
2014
consisted of unrealized gains on securities available for sale and totaled
$1,199,000
and
$1,576,000
.
Fair Value of Financial Instruments –
Fair values of financial instruments are estimated using relevant market information and other assumptions, as more fully disclosed in Note 18. Fair value estimates involve uncertainties and matters of significant judgment. Changes in assumptions or in market conditions could significantly affect the estimates.
Segment Reporting
– The Company only operates in
one
significant segment – Community Banking. The Company’s non-banking activities are insignificant to the consolidated financial statements.
Reclassifications –
Certain amounts in the
2013
and
2014
consolidated financial statements have been reclassified to conform to the
2015
presentation. Reclassifications had no effect on prior year net income or shareholders' equity.
Recent Accounting Pronouncements
– In January 2014, the FASB issued ASU 2014-1,
Investments – Equity Method and Joint Ventures (Topic 323): Accounting for Investments in Qualified Affordable Housing Projects.
ASU 2014-1 permits reporting entities to make an accounting policy election to account for their investments in qualified affordable housing projects using the proportional amortization method if certain conditions are met. Under the proportional amortization method, an entity amortizes the initial cost of the investment in proportion to the tax credits and other tax benefits received and recognizes the net investment performance in the income statement as a component of income tax expense (benefit). The amendments in ASU 2014-1 should be applied retrospectively to all periods presented. A reporting entity that uses the effective yield method to account for its investments in qualified affordable housing projects before the date of adoption may continue to apply the effective yield method for those pre-existing investments. ASU 2014-1 is effective for public business entities for annual periods and interim reporting periods within those annual periods, beginning after December 15, 2014. The Company anticipates it will use the proportional amortization in future projects it enters into. However, projects entered into prior to January 1, 2015 did not qualify for this approach, and as such, the adoption of this ASU did not have a significant impact on the Company’s financial statements.
In January 2014, the FASB issued ASU 2014-4,
Receivables – Troubled Debt Restructurings by Creditors (Subtopic 310-40): Reclassification of Residential Real Estate Collateralized Consumer Mortgage Loans upon Foreclosure.
ASU 2014-4 clarifies that an in substance repossession or foreclosure occurs, and a creditor is considered to have received physical possession of residential real estate property collateralizing a consumer mortgage loan, upon either (1) the creditor obtaining legal title to the residential real estate property upon completion of a foreclosure or (2) the borrower conveying all interest in the residential real estate property to the creditor to satisfy that loan through completion of a deed in lieu of foreclosure or through a similar legal agreement. Additionally, the amendments require interim and annual disclosure of both (1) the amount of foreclosed residential real estate property held by the creditor and (2) the recorded investment in consumer mortgage loans collateralized by residential real estate property that are in the process of foreclosure according to local requirements of the applicable jurisdiction. ASU 2014-4 is effective for annual periods, and interim periods within those annual periods, beginning after December 15, 2014. An entity could elect to adopt the amendments in ASU 2014-4 using either a modified retrospective transition method or a prospective transition method. The adoption of ASU 2014-4 did not have a significant impact on the Company’s operating results or financial condition.
In May 2014, the FASB issued ASU 2014-9,
Revenue from Contracts with Customers (Topic 606)
. ASU 2014-9, as amended, creates a new topic, Topic 606, to provide guidance on revenue recognition for entities that enter into contracts with customers to transfer goods or services or enter into contracts for the transfer of nonfinancial assets. The core principle of the guidance is that an entity should recognize revenue to depict the transfer of promised goods or services to customers in an amount that reflects the consideration to which the entity expects to be entitled in exchange for those goods or services. Additional disclosures are required to provide quantitative and qualitative information regarding the nature, amount, timing, and uncertainty of revenue and cash flows arising from contracts with customers. These amendments are effective for annual reporting periods beginning after December 15, 2017, including interim periods within that reporting period. Early application is permitted only as of annual reporting periods beginning after December 15, 2016, including interim reporting periods within that period.
75
In June 2014, the FASB issued ASU 2014-11,
Transfers and Servicing (Topic 860): Repurchase-to-Maturity Transactions, Repurchase Financings, and Disclosures
. ASU 2014-11 changes the accounting for repurchase-to-maturity transactions and linked repurchase financings to secured borrowing accounting, which is consistent with the accounting for other repurchase agreements. The pronouncement also requires two new disclosures. The first disclosure requires an entity to disclose information on transfers accounted for as sales in transactions that are economically similar to repurchase agreements. The second disclosure provides increased transparency about the types of collateral pledged in repurchase agreements and similar transactions accounted for as secured borrowings. ASU 2014-11 is effective for public business entities for annual periods, and interim periods within those annual periods, beginning after December 15, 2014. The adoption of this ASU did not have a significant impact on the Company’s operating results or financial condition.
In August 2014, FASB issued ASU 2014-14,
Receivables - Troubled Debt Restructurings by Creditors (Subtopic 310-40): Classification of Certain Government-Guaranteed Mortgage Loans Upon Foreclosure.
ASU 2014-14 amended previous guidance related to the classification of certain government-guaranteed mortgage loans, including those guaranteed by the FHA and the VA, upon foreclosure. It requires that a mortgage loan be derecognized and a separate other receivable be recognized upon foreclosure if the following conditions are met: 1) The loan has a government guarantee that is not separable from the loan before the foreclosure; 2) at the time of foreclosure, the creditor has the intent to convey the real estate property to the guarantor and make a claim on the guarantee, and the creditor has the ability to recover under that claim; and 3) at the time of foreclosure, any amount of the claim that is determined on the basis of the fair value of the real estate is fixed. Upon foreclosure, the separate other receivable should be measured based on the amount of the loan balance, including principal and interest, expected to be recovered from the guarantor. These amendments were effective for annual periods, and interim periods within those annual periods, beginning after December 15, 2014. The Company’s adoption of this standard on January 1, 2015 did not have a significant impact on the Company’s operating results or financial condition.
In April 2015, the FASB issued ASU No. 2015-03,
Interest-Imputation of Interest (Subtopic 835-30): Simplifying the Presentation of Debt Issuance Costs,
as subsequently amended by ASU No. 2015-15,
Presentation and Subsequent Measurement of Debt Issuance Costs Associated with Line-of-Credit Arrangements.
The update simplifies the presentation of debt issuance costs by requiring that debt issuance costs be presented in the balance sheet as a direct deduction from the carrying amount of debt liability, consistent with debt discounts or premiums. The recognition and measurement guidance for debt issuance costs are not affected by the amendments in this update. Further, the amendment indicates the SEC would not object to a ratable amortization of debt issuance costs on line-of-credit arrangements. This update will be effective for interim and annual periods beginning after December 15, 2015, and is to be applied retrospectively. Early adoption is permitted. The Company has determined that this guidance will not have a material impact on the Company's consolidated financial statements.
In January 2016, the FASB issued ASU No. 2016-01,
Recognition and Measurement of Financial Assets and Financial Liabilities.
The update provides updated accounting and reporting requirements for both public and non-public entities. The most significant provisions that will impact the Company is: 1) equity securities available for sale will be measured at fair value, with the changes in fair value recognized in the income statement;
2) eliminate the requirement to disclose the method(s) and significant assumptions used to estimate the fair value that is required to be disclosed for financial instruments at amortized cost on the balance sheet; 3) utilization of the exit price notion when measuring the fair value of financial instruments for disclosure purposes; 4) require separate presentation of both financial assets and liabilities by measurement category and form of financial asset on the balance sheet or accompanying notes to the financial statements. The update will be effective for interim and annual periods beginning after December 15, 2017, using a cumulative-effect adjustment to the balance sheet as of the beginning of the year of adoption. Early adoption is not permitted.
The Company maintains deposit balances at
two
correspondent banks which provide check collection and item processing services for the Company. The average balances that are to be maintained either on hand or with the correspondent banks amounted to
$1,265,000
and
$600,000
at
December 31, 2015
and
2014
.
The balances with these correspondent banks, at times, exceed federally insured limits; however management considers this to be a normal business risk. Management reviews the correspondent banks' financial condition on a quarterly basis.
76
At
December 31, 2015
and
2014
the investment securities portfolio was comprised of securities classified as available for sale, resulting in investment securities being carried at fair value. The amortized cost and fair values of investment securities available for sale at December 31, were:
|
(Dollars in thousands)
|
Amortized
Cost
|
Gross
Unrealized
Gains
|
Gross
Unrealized
Losses
|
Fair Value
|
|||||||||||
|
December 31, 2015
|
|||||||||||||||
|
U.S. Government Agencies
|
$
|
47,209
|
|
$
|
200
|
|
$
|
182
|
|
$
|
47,227
|
|
|||
|
States and political subdivisions
|
124,421
|
|
2,483
|
|
943
|
|
125,961
|
|
|||||||
|
U.S. Government Sponsored Enterprises (GSE) residential mortgage-backed securities
|
132,389
|
|
229
|
|
269
|
|
132,349
|
|
|||||||
|
GSE residential collateralized mortgage obligations (CMOs)
|
15,668
|
|
215
|
|
40
|
|
15,843
|
|
|||||||
|
GSE commercial CMOs
|
63,598
|
|
735
|
|
563
|
|
63,770
|
|
|||||||
|
Private label CMOs
|
8,944
|
|
0
|
|
43
|
|
8,901
|
|
|||||||
|
Total debt securities
|
392,229
|
|
3,862
|
|
2,040
|
|
394,051
|
|
|||||||
|
Equity securities
|
50
|
|
23
|
|
0
|
|
73
|
|
|||||||
|
Totals
|
$
|
392,279
|
|
$
|
3,885
|
|
$
|
2,040
|
|
$
|
394,124
|
|
|||
|
December 31, 2014
|
|||||||||||||||
|
U.S. Government Agencies
|
$
|
23,910
|
|
$
|
71
|
|
$
|
23
|
|
$
|
23,958
|
|
|||
|
States and political subdivisions
|
52,578
|
|
819
|
|
996
|
|
52,401
|
|
|||||||
|
GSE residential mortgage-backed securities
|
174,220
|
|
1,573
|
|
197
|
|
175,596
|
|
|||||||
|
GSE residential CMOs
|
57,976
|
|
857
|
|
128
|
|
58,705
|
|
|||||||
|
GSE commercial CMOs
|
65,041
|
|
1,017
|
|
586
|
|
65,472
|
|
|||||||
|
Total debt securities
|
373,725
|
|
4,337
|
|
1,930
|
|
376,132
|
|
|||||||
|
Equity securities
|
50
|
|
17
|
|
0
|
|
67
|
|
|||||||
|
Totals
|
$
|
373,775
|
|
$
|
4,354
|
|
$
|
1,930
|
|
$
|
376,199
|
|
|||
77
The following table shows gross unrealized losses and fair value of the Company’s available for sale securities that are not deemed to be other-than-temporarily impaired, aggregated by investment category and length of time that individual securities have been in a continuous unrealized loss position at December 31:
|
|
Less Than 12 Months
|
12 Months or More
|
Total
|
||||||||||||||||||||
|
(Dollars in thousands)
|
Fair
Value
|
Unrealized
Losses
|
Fair
Value
|
Unrealized
Losses
|
Fair
Value
|
Unrealized
Losses
|
|||||||||||||||||
|
December 31, 2015
|
|||||||||||||||||||||||
|
U.S. Government Agencies
|
$
|
27,640
|
|
$
|
182
|
|
$
|
0
|
|
$
|
0
|
|
$
|
27,640
|
|
$
|
182
|
|
|||||
|
States and political subdivisions
|
30,252
|
|
373
|
|
14,139
|
|
570
|
|
44,391
|
|
943
|
|
|||||||||||
|
U.S. Government Sponsored Enterprises (GSE) residential mortgage-backed securities
|
82,911
|
|
269
|
|
0
|
|
0
|
|
82,911
|
|
269
|
|
|||||||||||
|
GSE residential collateralized mortgage obligations (CMOs)
|
0
|
|
0
|
|
4,237
|
|
40
|
|
4,237
|
|
40
|
|
|||||||||||
|
GSE commercial CMOs
|
33,606
|
|
563
|
|
0
|
|
0
|
|
33,606
|
|
563
|
|
|||||||||||
|
Private label CMOs
|
8,901
|
|
43
|
|
0
|
|
0
|
|
8,901
|
|
43
|
|
|||||||||||
|
Total temporarily impaired securities
|
$
|
183,310
|
|
$
|
1,430
|
|
$
|
18,376
|
|
$
|
610
|
|
$
|
201,686
|
|
$
|
2,040
|
|
|||||
|
December 31, 2014
|
|||||||||||||||||||||||
|
U.S. Government Agencies
|
$
|
0
|
|
$
|
0
|
|
$
|
9,012
|
|
$
|
23
|
|
$
|
9,012
|
|
$
|
23
|
|
|||||
|
States and political subdivisions
|
0
|
|
0
|
|
35,833
|
|
996
|
|
35,833
|
|
996
|
|
|||||||||||
|
GSE residential mortgage-backed securities
|
65,474
|
|
197
|
|
0
|
|
0
|
|
65,474
|
|
197
|
|
|||||||||||
|
GSE residential CMOs
|
11,930
|
|
128
|
|
0
|
|
0
|
|
11,930
|
|
128
|
|
|||||||||||
|
GSE commercial CMOs
|
0
|
|
0
|
|
29,969
|
|
586
|
|
29,969
|
|
586
|
|
|||||||||||
|
Total temporarily impaired securities
|
$
|
77,404
|
|
$
|
325
|
|
$
|
74,814
|
|
$
|
1,605
|
|
$
|
152,218
|
|
$
|
1,930
|
|
|||||
The Company has
53
securities and
37
securities at
December 31, 2015
and
2014
in which the amortized cost exceeds their values, as discussed below.
U.S. Government Agencies and U.S. Government Sponsored Enterprises (GSE).
Twenty-nine
U.S. Government Agencies and GSE securities, including mortgage-backed and collateralized mortgage obligations have unrealized losses,
25
of which have amortized costs which exceed their fair values for
less than 12 months
, and
four
have amortized costs which exceed their fair values for
more than 12 months
at
December 31, 2015
. At
December 31, 2014
, the Company had
21
GSE securities with unrealized losses,
13
of which were in the
less than 12 months
category, and
eight
have amortized costs which exceed their fair values for more than 12 months. These unrealized losses have been caused by a rise in interest rates from the time the securities were purchased. The contractual terms of those investments do not permit the issuer to settle the securities at a price less than the par value basis of the investments. Because the Company does not intend to sell the investments and it is not more likely than not that the Company will be required to sell the investments before recovery of their amortized cost basis, which may be maturity, the Company does not consider these investments to be other-than-temporarily impaired at
December 31, 2015
or
2014
.
State and Political Subdivisions.
Twenty-one
state and political subdivision securities have an amortized cost which exceeds its fair value,
16
of which were in the
less than 12 months
category, and
five
for
more than 12 months
at
December 31, 2015
. At
December 31, 2014
,
16
state and political subdivision security had unrealized losses for
more than 12 months
. These unrealized losses have been caused by a rise in interest rates from the time the securities were purchased. Management considers the investment rating, the state of the issuer of the security and other credit support in determining whether the security is other-than-temporarily impaired. Because the Company does not intend to sell the investments and it is not more likely than not that the Company will be required to sell the investments before recovery of their amortized cost basis, which may be maturity, the Company does not consider these investments to be other-than-temporarily impaired at
December 31, 2015
or
2014
.
Private Label.
three
Private Label collateralized mortgage obligations have unrealized losses,
three
of which were in the
less than 12 months
category. These unrealized losses have been caused by a rise in interest rates from the time the securities were purchased. Because the Company does not intend to sell the investments and it is not more likely than not that the
78
Company will be required to sell the investments before recovery of their amortized cost basis, which may be maturity, the Company does not consider these investments to be other-than-temporarily impaired at
December 31, 2015
.
The amortized cost and fair values of securities available for sale at
December 31, 2015
by contractual maturity are shown below. Contractual maturities will differ from expected maturities because borrowers may have the right to call or prepay obligations with or without call or prepayment penalties.
INVESTMENT PORTFOLIO
|
|
Available for Sale
|
||||||
|
(Dollars in thousands)
|
Amortized Cost
|
Fair Value
|
|||||
|
Due in one year or less
|
$
|
365
|
|
$
|
366
|
|
|
|
Due after one year through five years
|
3,244
|
|
3,319
|
|
|||
|
Due after five years through ten years
|
62,915
|
|
63,194
|
|
|||
|
Due after ten years
|
105,106
|
|
106,309
|
|
|||
|
Mortgage-backed securities and collateralized mortgage obligations
|
220,599
|
|
220,863
|
|
|||
|
Total debt securities
|
392,229
|
|
394,051
|
|
|||
|
Equity securities
|
50
|
|
73
|
|
|||
|
$
|
392,279
|
|
$
|
394,124
|
|
||
Proceeds from sales of securities available for sale for the years ended
December 31, 2015
,
2014
and
2013
were
$65,611,000
,
$169,573,000
and
$74,273,000
. Gross gains on the sales of securities were
$1,948,000
,
$2,301,000
and
$473,000
for the years ended
December 31, 2015
,
2014
and
2013
. Gross losses on securities available for sale were
$24,000
,
$366,000
and
$141,000
for the years ended
December 31, 2015
,
2014
and
2013
.
Securities with a fair value of
$250,397,000
and
$261,034,000
at
December 31, 2015
and
2014
were pledged to secure public funds and for other purposes as required or permitted by law.
As a result of changes in interest rate and economic market conditions, in the first quarter of 2016 the Company evaluated its GSE commercial CMO security portfolio and elected to liquidate this entire portfolio, which had an amortized cost of
$63,598,000
, and fair value of
$63,770,000
at December 31, 2015, at a net gain of
$1,420,000
(unaudited). The proceeds from the sales will be used to pay down maturing debt, meet loan demand, or be reinvested in the securities portfolio.
The Company’s loan portfolio is broken down into segments to an appropriate level of disaggregation to allow management to monitor the performance by the borrower and to monitor the yield on the portfolio. Consistent with ASU 2010-20,
Disclosures about the Credit Quality of Financing Receivables and the Allowance for Loan Losses,
the segments were further broken down into classes, to allow for differing risk characteristics within a segment.
The risks associated with lending activities differ among the various loan classes, and are subject to the impact of changes in interest rates, market conditions of collateral securing the loans, and general economic conditions. All of these factors may adversely impact the borrower’s ability to repay its loans, and impact the associated collateral.
The Company has various types of commercial real estate loans which have differing levels of credit risk associated with them. Owner-occupied commercial real estate loans are generally dependent upon the successful operation of the borrower’s business, with the cash flows generated from the business being the primary source of repayment of the loan. If the business suffers a downturn in sales or profitability, the borrower’s ability to repay the loan could be in jeopardy.
Non-owner occupied and multi-family commercial real estate loans and non-owner occupied residential loans present a different credit risk to the Company than owner-occupied commercial real estate loans, as the repayment of the loan is dependent upon the borrower’s ability to generate a sufficient level of occupancy to produce rental income that exceeds debt service requirements and operating expenses. Lower occupancy or lease rates may result in a reduction in cash flows, which hinders the ability of the borrower to meet debt service requirements, and may result in lower collateral values. The Company generally recognizes that greater risk is inherent in these credit relationships as compared to owner occupied loans mentioned above.
79
Acquisition and development loans consist of 1-4 family residential construction and commercial and land development loans. The risk of loss on these loans is largely dependent on the Company’s ability to assess the property’s value at the completion of the project, which should exceed the property’s construction costs. During the construction phase, a number of factors could potentially negatively impact the collateral value, including cost overruns, delays in completing the project, competition, and real estate market conditions which may change based on the supply of similar properties in the area. In the event the collateral value at the completion of the project is not sufficient to cover the outstanding loan balance, the Company must rely upon other repayment sources, including the guarantors of the project or other collateral securing the loan.
Commercial and industrial loans include advances to local and regional businesses for general commercial purposes and include permanent and short-term working capital, machinery and equipment financing, and may be either in the form of lines of credit or term loans. Although commercial and industrial loans may be unsecured to our highest rated borrowers, the majority of these loans are secured by the borrower’s accounts receivable, inventory and machinery and equipment. In a significant number of these loans, the collateral also includes the business real estate or the business owner’s personal real estate or assets. Commercial and industrial loans present credit exposure to the Company, as they are more susceptible to risk of loss during a downturn in the economy, as borrowers may have greater difficulty in meeting their debt service requirements and the value of the collateral may decline. The Company attempts to mitigate this risk through its underwriting standards, including evaluating the credit worthiness of the borrower and to the extent available, credit ratings on the business. Additionally, monitoring of the loans through annual renewals and meetings with the borrowers are typical. However, these procedures cannot eliminate the risk of loss associated with commercial and industrial lending.
Municipal loans consist of extensions of credit to municipalities and school districts within the Company’s market area. These loans generally present a lower risk than commercial and industrial loans, as they are generally secured by the municipality’s full taxing authority, by revenue obligations, or by its ability to raise assessments on its customers for a specific utility.
The Company originates loans to its retail customers, including fixed-rate and adjustable first lien mortgage loans with the underlying 1-4 family owner-occupied residential property securing the loan. The Company’s risk exposure is minimized in these types of loans through the evaluation of the credit worthiness of the borrower, including credit scores and debt-to-income ratios, and underwriting standards which limit the loan-to-value ratio to generally no more than
80%
upon loan origination, unless the borrower obtains private mortgage insurance.
Home equity loans, including term loans and lines of credit, present a slightly higher risk to the Company than 1-4 family first liens, as these loans can be first or second liens on 1-4 family owner occupied residential property, but can have loan-to-value ratios of no greater than
90%
of the value of the real estate taken as collateral. The credit worthiness of the borrower is considered including credit scores and debt-to-income ratios, which generally cannot exceed
43%
.
Installment and other loans’ credit risk are mitigated through conservative underwriting standards, including the evaluation of the credit worthiness of the borrower through credit scores and debt-to-income ratios, and if secured, the collateral value of the assets. As these loans can be unsecured or secured by assets the value of which may depreciate quickly or may fluctuate, they typically present a greater risk to the Company than 1-4 family residential loans.
80
The loan portfolio, excluding residential loans held for sale, broken out by classes as of December 31 was as follows:
|
(Dollars in thousands)
|
2015
|
2014
|
|||||
|
Commercial real estate:
|
|||||||
|
Owner-occupied
|
$
|
103,578
|
|
$
|
100,859
|
|
|
|
Non-owner occupied
|
145,401
|
|
144,301
|
|
|||
|
Multi-family
|
35,109
|
|
27,531
|
|
|||
|
Non-owner occupied residential
|
54,175
|
|
49,315
|
|
|||
|
Acquisition and development:
|
|||||||
|
1-4 family residential construction
|
9,364
|
|
5,924
|
|
|||
|
Commercial and land development
|
41,339
|
|
24,237
|
|
|||
|
Commercial and industrial
|
73,625
|
|
48,995
|
|
|||
|
Municipal
|
57,511
|
|
61,191
|
|
|||
|
Residential mortgage:
|
|||||||
|
First lien
|
126,022
|
|
126,491
|
|
|||
|
Home equity – term
|
17,337
|
|
20,845
|
|
|||
|
Home equity – lines of credit
|
110,731
|
|
89,366
|
|
|||
|
Installment and other loans
|
7,521
|
|
5,891
|
|
|||
|
$
|
781,713
|
|
$
|
704,946
|
|
||
In order to monitor ongoing risk associated with its loan portfolio and specific loans within the segments, management uses an internal grading system. The first several rating categories, representing the lowest risk to the Bank, are combined and given a “Pass” rating. Management generally follows regulatory definitions in assigning criticized ratings to loans, including special mention, substandard, doubtful or loss. The “Special Mention” category includes loans that have potential weaknesses that may, if not monitored or corrected, weaken the asset or inadequately protect the Bank’s position at some future date. These assets pose elevated risk, but their weakness does not yet justify a more severe, or classified rating. “Substandard” loans are classified as they have a well-defined weakness, or weaknesses that jeopardize liquidation of the debt. These loans are characterized by the distinct possibility that the Bank will sustain some loss if the deficiencies are not corrected. “Substandard” loans include loans that management has determined not to be impaired, as well as loans considered to be impaired. A “Doubtful” loan has a high probability of total or substantial loss, but because of specific pending events that may strengthen the asset, its classification of loss is deferred. “Loss” assets are considered uncollectible, as the underlying borrowers are often in bankruptcy, have suspended debt repayments, or ceased business operations. Once a loan is classified as “Loss,” there is little prospect of collecting the loan’s principal or interest and it is generally written off.
The Bank has a loan review policy and program which is designed to identify and mitigate risk in the lending function. The Enterprise Risk Management (“ERM”) Committee, comprised of executive officers and loan department personnel, is charged with the oversight of overall credit quality and risk exposure of the Bank’s loan portfolio. This includes the monitoring of the lending activities of all Bank personnel with respect to underwriting and processing new loans and the timely follow-up and corrective action for loans showing signs of deterioration in quality. The loan review program provides the Bank with an independent review of the Bank’s loan portfolio on an ongoing basis. Generally, consumer and residential mortgage loans are included in the "Pass" categories unless a specific action, such as extended delinquencies, bankruptcy, repossession or death of the borrower occurs, which heightens awareness as to a possible credit event.
Internal loan relationship reviews are completed annually on all commercial relationships with a committed loan balance in excess of
$500,000
, which includes confirmation of risk rating by the appropriate credit authority, including Credit Administration for loans in excess of $1,000,000. In addition, all relationships greater than
$250,000
rated Substandard, Doubtful or Loss are reviewed by the ERM Committee on a quarterly basis, with reaffirmation of the rating as approved by the Bank’s Loan Work Out Committee.
81
The following summarizes the Bank’s ratings based on its internal risk rating system as of
December 31, 2015
and
2014
:
|
(Dollars in thousands)
|
Pass
|
Special
Mention
|
Non-Impaired
Substandard
|
Impaired -
Substandard
|
Doubtful
|
Total
|
|||||||||||||||||
|
December 31, 2015
|
|||||||||||||||||||||||
|
Commercial real estate:
|
|||||||||||||||||||||||
|
Owner-occupied
|
$
|
96,715
|
|
$
|
1,124
|
|
$
|
3,630
|
|
$
|
2,109
|
|
$
|
0
|
|
$
|
103,578
|
|
|||||
|
Non-owner occupied
|
125,043
|
|
12,394
|
|
108
|
|
7,856
|
|
0
|
|
145,401
|
|
|||||||||||
|
Multi-family
|
31,957
|
|
1,779
|
|
1,140
|
|
233
|
|
0
|
|
35,109
|
|
|||||||||||
|
Non-owner occupied residential
|
50,601
|
|
1,305
|
|
1,374
|
|
895
|
|
0
|
|
54,175
|
|
|||||||||||
|
Acquisition and development:
|
|||||||||||||||||||||||
|
1-4 family residential construction
|
9,364
|
|
0
|
|
0
|
|
0
|
|
0
|
|
9,364
|
|
|||||||||||
|
Commercial and land development
|
40,181
|
|
219
|
|
934
|
|
5
|
|
0
|
|
41,339
|
|
|||||||||||
|
Commercial and industrial
|
70,967
|
|
1,380
|
|
544
|
|
734
|
|
0
|
|
73,625
|
|
|||||||||||
|
Municipal
|
57,511
|
|
0
|
|
0
|
|
0
|
|
0
|
|
57,511
|
|
|||||||||||
|
Residential mortgage:
|
|||||||||||||||||||||||
|
First lien
|
121,214
|
|
0
|
|
0
|
|
4,808
|
|
0
|
|
126,022
|
|
|||||||||||
|
Home equity – term
|
17,234
|
|
0
|
|
0
|
|
103
|
|
0
|
|
17,337
|
|
|||||||||||
|
Home equity – lines of credit
|
109,731
|
|
230
|
|
180
|
|
590
|
|
0
|
|
110,731
|
|
|||||||||||
|
Installment and other loans
|
7,504
|
|
0
|
|
0
|
|
17
|
|
0
|
|
7,521
|
|
|||||||||||
|
$
|
738,022
|
|
$
|
18,431
|
|
$
|
7,910
|
|
$
|
17,350
|
|
$
|
0
|
|
$
|
781,713
|
|
||||||
|
December 31, 2014
|
|||||||||||||||||||||||
|
Commercial real estate:
|
|||||||||||||||||||||||
|
Owner-occupied
|
$
|
89,815
|
|
$
|
2,686
|
|
$
|
5,070
|
|
$
|
3,288
|
|
$
|
0
|
|
$
|
100,859
|
|
|||||
|
Non-owner occupied
|
120,829
|
|
20,661
|
|
1,131
|
|
1,680
|
|
0
|
|
144,301
|
|
|||||||||||
|
Multi-family
|
24,803
|
|
1,086
|
|
1,322
|
|
320
|
|
0
|
|
27,531
|
|
|||||||||||
|
Non-owner occupied residential
|
43,020
|
|
2,968
|
|
1,827
|
|
1,500
|
|
0
|
|
49,315
|
|
|||||||||||
|
Acquisition and development:
|
|||||||||||||||||||||||
|
1-4 family residential construction
|
5,924
|
|
0
|
|
0
|
|
0
|
|
0
|
|
5,924
|
|
|||||||||||
|
Commercial and land development
|
22,261
|
|
233
|
|
1,333
|
|
410
|
|
0
|
|
24,237
|
|
|||||||||||
|
Commercial and industrial
|
43,794
|
|
850
|
|
1,914
|
|
2,437
|
|
0
|
|
48,995
|
|
|||||||||||
|
Municipal
|
61,191
|
|
0
|
|
0
|
|
0
|
|
0
|
|
61,191
|
|
|||||||||||
|
Residential mortgage:
|
|||||||||||||||||||||||
|
First lien
|
121,160
|
|
9
|
|
0
|
|
5,290
|
|
32
|
|
126,491
|
|
|||||||||||
|
Home equity – term
|
20,775
|
|
0
|
|
0
|
|
70
|
|
0
|
|
20,845
|
|
|||||||||||
|
Home equity – lines of credit
|
88,164
|
|
630
|
|
93
|
|
479
|
|
0
|
|
89,366
|
|
|||||||||||
|
Installment and other loans
|
5,865
|
|
0
|
|
0
|
|
26
|
|
0
|
|
5,891
|
|
|||||||||||
|
$
|
647,601
|
|
$
|
29,123
|
|
$
|
12,690
|
|
$
|
15,500
|
|
$
|
32
|
|
$
|
704,946
|
|
||||||
Classified loans may also be evaluated for impairment. For commercial real estate, acquisition and development and commercial and industrial loans, a loan is considered impaired when, based on current information and events, it is probable that the Bank will be unable to collect the scheduled payments of principal or interest when due according to the contractual terms of the loan agreement. Factors considered by management in determining impairment include payment status, collateral value, and the probability of collecting scheduled principal and interest payments when due. Loans that experience insignificant payment delays and payment shortfalls generally are not classified as impaired. Generally, loans that are more than
90
days past due are deemed impaired. Management determines the significance of payment delays and payment shortfalls on a case-by-case basis, taking into consideration all of the circumstances surrounding the loan and the borrower, including the length of the delay, the reasons for the delay, the borrower’s prior payment record, and the amount of the shortfall in relation to the principal and interest owed to determine if the loan should be placed on nonaccrual status. Nonaccrual loans in the commercial and
82
commercial real estate portfolios and any TDRs are, by definition, deemed to be impaired. Impairment is measured on a loan-by-loan basis for commercial, construction and restructured loans by either the present value of the expected future cash flows discounted at the loan’s effective interest rate, the loan’s obtainable market price, or the fair value of the collateral if the loan is collateral dependent. A loan is collateral dependent if the repayment of the loan is expected to be provided solely by the underlying collateral. For loans that are deemed to be impaired for extended periods of time, periodic updates on fair values are obtained, which may include updated appraisals. The updated fair values will be incorporated into the impairment analysis as of the next reporting period.
Loan charge-offs, which may include partial charge-offs, are taken on an impaired loan that is collateral dependent if the loan’s carrying balance exceeds its collateral’s appraised value; the loan has been identified as uncollectible; and it is deemed to be a confirmed loss. Typically, impaired loans with a charge-off or partial charge-off will continue to be considered impaired, unless the note is split into
two
, and management expects the performing note to continue to perform and is adequately secured. The second, or non-performing note, would be charged-off. Generally, an impaired loan with a partial charge-off may continue to have an impairment reserve on it after the partial charge-off, if factors warrant.
As of
December 31, 2015
and
2014
, nearly all of the Company’s impaired loans’ extent of impairment were measured based on the estimated fair value of the collateral securing the loan, except for TDRs. By definition, TDRs are considered impaired. All restructured loans’ impairment were determined based on discounted cash flows for those loans classified as TDRs but are still accruing interest. For real estate loans, collateral generally consists of commercial real estate, but in the case of commercial and industrial loans, it would also consist of accounts receivable, inventory, equipment or other business assets. Commercial and industrial loans may also have real estate collateral.
According to policy, updated appraisals are generally required every
18 months
for classified loans in excess of
$250,000
. The “as is value” provided in the appraisal is often used as the fair value of the collateral in determining impairment, unless circumstances, such as subsequent improvements, approvals, or other circumstances dictate that another value provided by the appraiser is more appropriate.
Generally, impaired loans secured by real estate were measured at fair value using certified real estate appraisals that had been completed within the last year. Appraised values are further discounted for estimated costs to sell the property and other selling considerations to arrive at the property’s fair value. In those situations in which it is determined an updated appraisal is not required for loans individually evaluated for impairment, fair values are based on one or a combination of the following approaches. In those situations in which a combination of approaches is considered, the factor that carries the most consideration will be the one management believes is warranted. The approaches are as follows:
|
•
|
Original appraisal – if the original appraisal provides a strong loan-to-value ratio (generally
70%
or lower) and, after consideration of market conditions and knowledge of the property and area, it is determined by the Credit Administration staff that there has not been a significant deterioration in the collateral value, the original certified appraised value may be used. Discounts as deemed appropriate for selling costs are factored into the appraised value in arriving at fair value.
|
|
•
|
Discounted cash flows – in limited cases, discounted cash flows may be used on projects in which the collateral is liquidated to reduce the borrowings outstanding, and is used to validate collateral values derived from other approaches.
|
Collateral on certain impaired loans is not limited to real estate, and may consist of accounts receivable, inventory, equipment or other business assets. Estimated fair values are determined based on borrowers’ financial statements, inventory ledgers, accounts receivable agings or appraisals from individuals with knowledge in the business. Stated balances are generally discounted for the age of the financial information or the quality of the assets. In determining fair value, liquidation discounts are applied to this collateral based on existing loan evaluation policies.
The Company distinguishes Substandard loans on both an impaired and non-impaired basis, as it places less emphasis on a loan’s classification, and increased reliance on whether the loan was performing in accordance with the contractual terms. A “Substandard” classification does not automatically meet the definition of “impaired.” A "Substandard" loan is one that is inadequately protected by current sound worth and paying capacity of the obligor or the collateral pledged, if any. Extensions of credit so classified have well-defined weaknesses which may jeopardize the liquidation of the debt. They are characterized by the distinct possibility that the Bank will sustain some loss if the deficiencies are not corrected. Loss potential, while existing in the aggregate amount of substandard loans, does not have to exist in individual extensions of credit classified "Substandard." As a result, the Company’s methodology includes an evaluation of certain accruing commercial real estate, acquisition and development and commercial and industrial loans rated “Substandard” to be collectively evaluated for impairment as opposed to evaluating these loans individually for impairment. Although we believe these loans have well defined weaknesses and meet
83
the definition of “Substandard,” they are generally performing and management has concluded that it is likely it will be able to collect the scheduled payments of principal and interest when due according to the contractual terms of the loan agreement.
Larger groups of smaller balance homogeneous loans are collectively evaluated for impairment. Generally, the Bank does not separately identify individual consumer and residential loans for impairment disclosures, unless such loans are the subject of a restructuring agreement due to financial difficulties of the borrower.
The following summarizes impaired loans by class, segregated by those for which a specific allowance was required and those for which a specific allowance was not required as of
December 31, 2015
and
2014
. The recorded investment in loans excludes accrued interest receivable due to insignificance. Allowances established generally pertain to those loans in which loan forbearance agreements were in the process of being negotiated or updated appraisals were pending, and the partial charge-off will be recorded when final information is received.
|
|
Impaired Loans with a Specific Allowance
|
Impaired Loans with No Specific Allowance
|
|||||||||||||||||
|
(Dollars in thousands)
|
Recorded
Investment
(Book Balance)
|
Unpaid
Principal Balance
(Legal Balance)
|
Related
Allowance
|
Recorded
Investment
(Book Balance)
|
Unpaid
Principal Balance
(Legal Balance)
|
||||||||||||||
|
December 31, 2015
|
|||||||||||||||||||
|
Commercial real estate:
|
|||||||||||||||||||
|
Owner-occupied
|
$
|
0
|
|
$
|
0
|
|
$
|
0
|
|
$
|
2,109
|
|
$
|
3,344
|
|
||||
|
Non-owner occupied
|
0
|
|
0
|
|
0
|
|
7,856
|
|
8,600
|
|
|||||||||
|
Multi-family
|
0
|
|
0
|
|
0
|
|
233
|
|
385
|
|
|||||||||
|
Non-owner occupied residential
|
0
|
|
0
|
|
0
|
|
895
|
|
1,211
|
|
|||||||||
|
Acquisition and development:
|
|||||||||||||||||||
|
Commercial and land development
|
0
|
|
0
|
|
0
|
|
5
|
|
19
|
|
|||||||||
|
Commercial and industrial
|
0
|
|
0
|
|
0
|
|
734
|
|
780
|
|
|||||||||
|
Residential mortgage:
|
|||||||||||||||||||
|
First lien
|
1,952
|
|
1,984
|
|
271
|
|
2,856
|
|
3,369
|
|
|||||||||
|
Home equity—term
|
0
|
|
0
|
|
0
|
|
103
|
|
110
|
|
|||||||||
|
Home equity—lines of credit
|
22
|
|
23
|
|
10
|
|
568
|
|
688
|
|
|||||||||
|
Installment and other loans
|
8
|
|
9
|
|
8
|
|
9
|
|
35
|
|
|||||||||
|
$
|
1,982
|
|
$
|
2,016
|
|
$
|
289
|
|
$
|
15,368
|
|
$
|
18,541
|
|
|||||
|
December 31, 2014
|
|||||||||||||||||||
|
Commercial real estate:
|
|||||||||||||||||||
|
Owner-occupied
|
$
|
0
|
|
$
|
0
|
|
$
|
0
|
|
$
|
3,288
|
|
$
|
4,558
|
|
||||
|
Non-owner occupied
|
0
|
|
0
|
|
0
|
|
1,680
|
|
3,420
|
|
|||||||||
|
Multi-family
|
0
|
|
0
|
|
0
|
|
320
|
|
356
|
|
|||||||||
|
Non-owner occupied residential
|
198
|
|
203
|
|
2
|
|
1,302
|
|
1,570
|
|
|||||||||
|
Acquisition and development:
|
|||||||||||||||||||
|
Commercial and land development
|
0
|
|
0
|
|
0
|
|
410
|
|
1,077
|
|
|||||||||
|
Commercial and industrial
|
0
|
|
0
|
|
0
|
|
2,437
|
|
2,500
|
|
|||||||||
|
Residential mortgage:
|
|||||||||||||||||||
|
First lien
|
982
|
|
982
|
|
149
|
|
4,340
|
|
4,968
|
|
|||||||||
|
Home equity—term
|
0
|
|
0
|
|
0
|
|
70
|
|
71
|
|
|||||||||
|
Home equity—lines of credit
|
24
|
|
40
|
|
24
|
|
455
|
|
655
|
|
|||||||||
|
Installment and other loans
|
13
|
|
13
|
|
13
|
|
13
|
|
36
|
|
|||||||||
|
$
|
1,217
|
|
$
|
1,238
|
|
$
|
188
|
|
$
|
14,315
|
|
$
|
19,211
|
|
|||||
84
The following summarizes the average recorded investment in impaired loans and related interest income recognized on loans deemed impaired for the year ended
December 31, 2015
,
2014
and
2013
:
|
|
2015
|
2014
|
2013
|
||||||||||||||||||||
|
(Dollars in thousands)
|
Average
Impaired
Balance
|
Interest
Income
Recognized
|
Average
Impaired
Balance
|
Interest
Income
Recognized
|
Average
Impaired
Balance
|
Interest
Income
Recognized
|
|||||||||||||||||
|
Commercial real estate:
|
|||||||||||||||||||||||
|
Owner-occupied
|
$
|
2,613
|
|
$
|
0
|
|
$
|
3,740
|
|
$
|
20
|
|
$
|
3,528
|
|
$
|
147
|
|
|||||
|
Non-owner occupied
|
3,470
|
|
0
|
|
6,711
|
|
143
|
|
4,307
|
|
145
|
|
|||||||||||
|
Multi-family
|
402
|
|
0
|
|
274
|
|
2
|
|
135
|
|
16
|
|
|||||||||||
|
Non-owner occupied residential
|
1,020
|
|
0
|
|
2,095
|
|
13
|
|
4,799
|
|
77
|
|
|||||||||||
|
Acquisition and development:
|
|||||||||||||||||||||||
|
1-4 family residential construction
|
0
|
|
0
|
|
0
|
|
0
|
|
481
|
|
0
|
|
|||||||||||
|
Commercial and land development
|
266
|
|
137
|
|
1,250
|
|
34
|
|
3,009
|
|
49
|
|
|||||||||||
|
Commercial and industrial
|
1,208
|
|
0
|
|
1,700
|
|
5
|
|
1,780
|
|
45
|
|
|||||||||||
|
Residential mortgage:
|
|||||||||||||||||||||||
|
First lien
|
4,644
|
|
37
|
|
4,226
|
|
53
|
|
2,697
|
|
140
|
|
|||||||||||
|
Home equity – term
|
130
|
|
0
|
|
85
|
|
0
|
|
59
|
|
8
|
|
|||||||||||
|
Home equity – lines of credit
|
571
|
|
0
|
|
111
|
|
3
|
|
305
|
|
6
|
|
|||||||||||
|
Installment and other loans
|
22
|
|
0
|
|
9
|
|
1
|
|
1
|
|
0
|
|
|||||||||||
|
$
|
14,346
|
|
$
|
174
|
|
$
|
20,201
|
|
$
|
274
|
|
$
|
21,101
|
|
$
|
633
|
|
||||||
The following table presents impaired loans that are troubled debt restructurings, with the recorded investment as of
December 31, 2015
and
December 31, 2014
.
|
|
2015
|
2014
|
|||||||||||
|
(Dollars in thousands)
|
Number of
Contracts
|
Recorded
Investment
|
Number of
Contracts
|
Recorded
Investment
|
|||||||||
|
Accruing:
|
|||||||||||||
|
Acquisition and development:
|
|||||||||||||
|
Commercial and land development
|
0
|
|
$
|
0
|
|
1
|
|
$
|
287
|
|
|||
|
Residential mortgage:
|
|||||||||||||
|
First lien
|
8
|
|
793
|
|
8
|
|
813
|
|
|||||
|
Total accruing
|
8
|
|
793
|
|
9
|
|
1,100
|
|
|||||
|
Nonaccruing:
|
|||||||||||||
|
Residential mortgage:
|
|||||||||||||
|
First lien
|
12
|
|
1,153
|
|
13
|
|
1,715
|
|
|||||
|
Consumer
|
1
|
|
10
|
|
1
|
|
13
|
|
|||||
|
13
|
|
1,163
|
|
14
|
|
1,728
|
|
||||||
|
21
|
|
$
|
1,956
|
|
23
|
|
$
|
2,828
|
|
||||
85
The following table presents restructured loans, included in nonaccrual status, that were modified as troubled debt restructurings within the previous 12 months and for which there was a payment default subsequent to the modification for the years ended
December 31, 2015
,
2014
, and
2013
.
|
2015
|
2014
|
2013
|
||||||||||||||||||
|
(Dollars in thousands)
|
Number of
Contracts
|
Recorded
Investment
|
Number of
Contracts
|
Recorded
Investment
|
Number of
Contracts
|
Recorded
Investment
|
||||||||||||||
|
Commercial real estate:
|
||||||||||||||||||||
|
Non-owner occupied
|
0
|
|
$
|
0
|
|
1
|
|
$
|
3,495
|
|
0
|
|
$
|
0
|
|
|||||
|
Acquisition and development:
|
||||||||||||||||||||
|
Commercial and land development
|
0
|
|
0
|
|
1
|
|
544
|
|
0
|
|
0
|
|
||||||||
|
Commercial and industrial
|
0
|
|
0
|
|
0
|
|
0
|
|
1
|
|
199
|
|
||||||||
|
Residential mortgage:
|
||||||||||||||||||||
|
First lien
|
0
|
|
0
|
|
2
|
|
177
|
|
0
|
|
0
|
|
||||||||
|
0
|
|
$
|
0
|
|
4
|
|
$
|
4,216
|
|
1
|
|
$
|
199
|
|
||||||
The following presents the number of loans modified, and their pre-modification and post-modification investment balances for the twelve months ended
December 31, 2015
,
2014
, and
2013
:
|
(Dollars in thousands)
|
Number of
Contracts
|
Pre-
Modification
Investment
Balance
|
Post-
Modification
Investment
Balance
|
|||||||
|
December 31, 2015
|
||||||||||
|
Residential mortgage:
|
||||||||||
|
First lien
|
1
|
|
$
|
59
|
|
$
|
59
|
|
||
|
1
|
|
$
|
59
|
|
$
|
59
|
|
|||
|
December 31, 2014
|
||||||||||
|
Residential mortgage:
|
||||||||||
|
First lien
|
19
|
|
$
|
1,876
|
|
$
|
1,810
|
|
||
|
Installment and other loans
|
1
|
|
36
|
|
14
|
|
||||
|
20
|
|
$
|
1,912
|
|
$
|
1,824
|
|
|||
|
December 31, 2013
|
||||||||||
|
Commercial real estate:
|
||||||||||
|
Owner-occupied
|
4
|
|
$
|
421
|
|
$
|
421
|
|
||
|
Non-owner occupied
|
2
|
|
3,457
|
|
3,457
|
|
||||
|
Acquisition and development:
|
||||||||||
|
Commercial and land development
|
2
|
|
1,081
|
|
1,081
|
|
||||
|
Commercial
|
1
|
|
217
|
|
199
|
|
||||
|
9
|
|
$
|
5,176
|
|
$
|
5,158
|
|
|||
The loans presented in the tables above were considered TDRs a result of the Company agreeing to below market interest rates for the risk of the transaction, allowing the loan to remain on interest only status, or a reduction in interest rates, in order to give the borrowers an opportunity to improve their cash flows. For TDRs in default of their modified terms, impairment is generally determined on a collateral dependent approach, except for accruing residential mortgage TDRs, which are generally on the discounted cash flow approach. Certain loans modified during a period may no longer be outstanding at the end of the period if the loan was paid off.
No additional commitments have been made to borrowers whose loans are considered TDRs.
86
Management further monitors the performance and credit quality of the loan portfolio by analyzing the length of time a portfolio is past due, by aggregating loans based on its delinquencies. The following table presents the classes of loan portfolio summarized by aging categories of performing loans and nonaccrual loans as of
December 31, 2015
and
2014
:
|
|
|
Days Past Due
|
|
|
|
||||||||||||||||||||||
|
Current
|
30-59
|
60-89
|
90+
(still accruing)
|
Total
Past Due
|
Non-
Accrual
|
Total
Loans
|
|||||||||||||||||||||
|
December 31, 2015
|
|||||||||||||||||||||||||||
|
Commercial real estate:
|
|||||||||||||||||||||||||||
|
Owner-occupied
|
$
|
101,395
|
|
$
|
74
|
|
$
|
0
|
|
$
|
0
|
|
$
|
74
|
|
$
|
2,109
|
|
$
|
103,578
|
|
||||||
|
Non-owner occupied
|
137,545
|
|
0
|
|
0
|
|
0
|
|
0
|
|
7,856
|
|
145,401
|
|
|||||||||||||
|
Multi-family
|
34,876
|
|
0
|
|
0
|
|
0
|
|
0
|
|
233
|
|
35,109
|
|
|||||||||||||
|
Non-owner occupied residential
|
53,280
|
|
0
|
|
0
|
|
0
|
|
0
|
|
895
|
|
54,175
|
|
|||||||||||||
|
Acquisition and development:
|
|||||||||||||||||||||||||||
|
1-4 family residential construction
|
9,364
|
|
0
|
|
0
|
|
0
|
|
0
|
|
0
|
|
9,364
|
|
|||||||||||||
|
Commercial and land development
|
41,236
|
|
0
|
|
98
|
|
0
|
|
98
|
|
5
|
|
41,339
|
|
|||||||||||||
|
Commercial and industrial
|
72,846
|
|
24
|
|
21
|
|
0
|
|
45
|
|
734
|
|
73,625
|
|
|||||||||||||
|
Municipal
|
57,511
|
|
0
|
|
0
|
|
0
|
|
0
|
|
0
|
|
57,511
|
|
|||||||||||||
|
Residential mortgage:
|
|||||||||||||||||||||||||||
|
First lien
|
120,119
|
|
1,844
|
|
44
|
|
0
|
|
1,888
|
|
4,015
|
|
126,022
|
|
|||||||||||||
|
Home equity – term
|
17,200
|
|
34
|
|
0
|
|
0
|
|
34
|
|
103
|
|
17,337
|
|
|||||||||||||
|
Home equity – lines of credit
|
109,740
|
|
286
|
|
91
|
|
24
|
|
401
|
|
590
|
|
110,731
|
|
|||||||||||||
|
Installment and other loans
|
7,488
|
|
16
|
|
0
|
|
0
|
|
16
|
|
17
|
|
7,521
|
|
|||||||||||||
|
$
|
762,600
|
|
$
|
2,278
|
|
$
|
254
|
|
$
|
24
|
|
$
|
2,556
|
|
$
|
16,557
|
|
$
|
781,713
|
|
|||||||
|
December 31, 2014
|
|||||||||||||||||||||||||||
|
Commercial real estate:
|
|||||||||||||||||||||||||||
|
Owner-occupied
|
$
|
97,571
|
|
$
|
0
|
|
$
|
0
|
|
$
|
0
|
|
$
|
0
|
|
$
|
3,288
|
|
$
|
100,859
|
|
||||||
|
Non-owner occupied
|
142,621
|
|
0
|
|
0
|
|
0
|
|
0
|
|
1,680
|
|
144,301
|
|
|||||||||||||
|
Multi-family
|
27,211
|
|
0
|
|
0
|
|
0
|
|
0
|
|
320
|
|
27,531
|
|
|||||||||||||
|
Non-owner occupied residential
|
47,706
|
|
109
|
|
0
|
|
0
|
|
109
|
|
1,500
|
|
49,315
|
|
|||||||||||||
|
Acquisition and development:
|
|||||||||||||||||||||||||||
|
1-4 family residential construction
|
5,924
|
|
0
|
|
0
|
|
0
|
|
0
|
|
0
|
|
5,924
|
|
|||||||||||||
|
Commercial and land development
|
24,114
|
|
0
|
|
0
|
|
0
|
|
0
|
|
123
|
|
24,237
|
|
|||||||||||||
|
Commercial and industrial
|
46,558
|
|
0
|
|
0
|
|
0
|
|
0
|
|
2,437
|
|
48,995
|
|
|||||||||||||
|
Municipal
|
61,191
|
|
0
|
|
0
|
|
0
|
|
0
|
|
0
|
|
61,191
|
|
|||||||||||||
|
Residential mortgage:
|
|||||||||||||||||||||||||||
|
First lien
|
120,806
|
|
776
|
|
400
|
|
0
|
|
1,176
|
|
4,509
|
|
126,491
|
|
|||||||||||||
|
Home equity – term
|
20,640
|
|
135
|
|
0
|
|
0
|
|
135
|
|
70
|
|
20,845
|
|
|||||||||||||
|
Home equity – lines of credit
|
88,745
|
|
142
|
|
0
|
|
0
|
|
142
|
|
479
|
|
89,366
|
|
|||||||||||||
|
Installment and other loans
|
5,815
|
|
41
|
|
9
|
|
0
|
|
50
|
|
26
|
|
5,891
|
|
|||||||||||||
|
$
|
688,902
|
|
$
|
1,203
|
|
$
|
409
|
|
$
|
0
|
|
$
|
1,612
|
|
$
|
14,432
|
|
$
|
704,946
|
|
|||||||
87
The Company maintains the allowance for loan losses at a level believed adequate by management for probable incurred credit losses. The allowance is established and maintained through a provision for loan losses charged to earnings. Quarterly, management assesses the adequacy of the allowance for loan losses utilizing a defined methodology, which considers specific credit evaluation of impaired loans as discussed above, past loan loss historical experience, and qualitative factors. Management believes the approach properly addresses the requirements of ASC Section 310-10-35 for loans individually identified as impaired, and ASC Subtopic 450-20 for loans collectively evaluated for impairment, and other bank regulatory guidance.
In connection with its quarterly evaluation of the adequacy of the allowance for loan losses, management continually reviews its methodology to determine if it continues to properly address the risk in the loan portfolio. For each loan class presented above, general allowances are provided for loans that are collectively evaluated for impairment, which is based on quantitative factors, principally historical loss trends for the respective loan class, adjusted for qualitative factors. In addition, an additional adjustment to the historical loss factors is made to account for delinquency and other potential risk not elsewhere defined within the Allowance for Loan and Lease Loss methodology.
Prior to December 31, 2015, the look back period for historical losses was 12 quarters, weighted one-half for the most recent four quarters, and one-quarter for each of the two previous four quarter periods in order to appropriately capture the loss history in the loan segment. Effective December 31, 2015, the Company extended the look back period to 16 quarters on a prospective basis, weighted four-tenths to the most recent four quarters, and then declining by one-tenth for each of the remaining annual periods. The look back period was extended as it was determined that a longer look back period is more consistent with the duration of an economic cycle. Management considers current economic and real estate conditions, and the trends in historical charge-off percentages that resulted from applying partial charge-offs to impaired loans, and the impact of distressed loan sales during the year in determining the look back period.
In addition to the quantitative analysis, adjustments to the reserve requirements are allocated on loans collectively evaluated for impairment based on additional qualitative factors. As of
December 31, 2015
, and
2014
the qualitative factors used by management to adjust the historical loss percentage to the anticipated loss allocation, which may range from a minus
150 basis points
to a positive
150 basis points
per factor, include:
Nature and Volume of Loans
– Loan growth in the current and subsequent quarters based on the Bank’s targeted growth and strategic plan, coupled with the types of loans booked based on risk management and credit culture, and number of exceptions to loan policy; supervisory loan to value exceptions etc.
Concentrations of Credit and Changes within Credit Concentrations
– Factors considered include the composition of the Bank’s overall portfolio makeup and management's evaluation related to concentration risk management and the inherent risk associated with the concentrations identified.
Underwriting Standards and Recovery Practices
– Factors considered include changes to underwriting standards and perceived impact on anticipated losses, trends in the number of exceptions to loan policy; supervisory loan to value exceptions; and administration of loan recovery practices.
Delinquency Trends
– Factors considered include the delinquency percentages noted in the portfolio relative to economic conditions, severity of the delinquencies, and whether the ratios are trending upwards or downwards.
Classified Loans Trends
– Factors considered include the internal loan ratings of the portfolio, the severity of the ratings, and whether the loan segment’s ratings show a more favorable or less favorable trend, and underlying market conditions and its impact on the collateral values securing the loans.
Experience, Ability and Depth of Management/Lending staff
– Factors considered include the years’ experience of senior and middle management and the lending staff and turnover of the staff, and instances of repeat criticisms of ratings.
Quality of Loan Review
– Factors include the years of experience of the loan review staff, in-house versus outsourced provider of review, turnover of staff and the perceived quality of their work in relation to other external information.
National and Local Economic Conditions
– Ratios and factors considered include trends in the consumer price index (CPI), unemployment rates, housing price index, housing statistics compared to the prior year, bankruptcy rates, regulatory and legal environment risks and competition.
88
Activity in the allowance for loan losses for the years ended
December 31, 2015
,
2014
and
2013
is as follows:
|
|
Commercial
|
Consumer
|
|
|
|||||||||||||||||||||||||||||||||||
|
(Dollars in thousands)
|
Commercial
Real Estate
|
Acquisition
and
Development
|
Commercial
and
Industrial
|
Municipal
|
Total
|
Residential
Mortgage
|
Installment
and Other
|
Total
|
Unallocated
|
Total
|
|||||||||||||||||||||||||||||
|
December 31, 2015
|
|||||||||||||||||||||||||||||||||||||||
|
Balance, beginning of year
|
$
|
9,462
|
|
$
|
697
|
|
$
|
806
|
|
$
|
183
|
|
$
|
11,148
|
|
$
|
2,262
|
|
$
|
119
|
|
$
|
2,381
|
|
$
|
1,218
|
|
$
|
14,747
|
|
|||||||||
|
Provision for loan losses
|
(1,020
|
)
|
(440
|
)
|
249
|
|
(125
|
)
|
(1,336
|
)
|
1,122
|
|
55
|
|
1,177
|
|
(444
|
)
|
(603
|
)
|
|||||||||||||||||||
|
Charge-offs
|
(711
|
)
|
(22
|
)
|
(115
|
)
|
0
|
|
(848
|
)
|
(592
|
)
|
(62
|
)
|
(654
|
)
|
0
|
|
(1,502
|
)
|
|||||||||||||||||||
|
Recoveries
|
152
|
|
615
|
|
72
|
|
0
|
|
839
|
|
78
|
|
9
|
|
87
|
|
0
|
|
926
|
|
|||||||||||||||||||
|
Balance, end of year
|
$
|
7,883
|
|
$
|
850
|
|
$
|
1,012
|
|
$
|
58
|
|
$
|
9,803
|
|
$
|
2,870
|
|
$
|
121
|
|
$
|
2,991
|
|
$
|
774
|
|
$
|
13,568
|
|
|||||||||
|
December 31, 2014
|
|||||||||||||||||||||||||||||||||||||||
|
Balance, beginning of year
|
$
|
13,215
|
|
$
|
670
|
|
$
|
864
|
|
$
|
244
|
|
$
|
14,993
|
|
$
|
3,780
|
|
$
|
124
|
|
$
|
3,904
|
|
$
|
2,068
|
|
$
|
20,965
|
|
|||||||||
|
Provision for loan losses
|
(1,674
|
)
|
92
|
|
(554
|
)
|
(61
|
)
|
(2,197
|
)
|
(960
|
)
|
107
|
|
(853
|
)
|
(850
|
)
|
(3,900
|
)
|
|||||||||||||||||||
|
Charge-offs
|
(2,637
|
)
|
(70
|
)
|
(270
|
)
|
0
|
|
(2,977
|
)
|
(587
|
)
|
(177
|
)
|
(764
|
)
|
0
|
|
(3,741
|
)
|
|||||||||||||||||||
|
Recoveries
|
558
|
|
5
|
|
766
|
|
0
|
|
1,329
|
|
29
|
|
65
|
|
94
|
|
0
|
|
1,423
|
|
|||||||||||||||||||
|
Balance, end of year
|
$
|
9,462
|
|
$
|
697
|
|
$
|
806
|
|
$
|
183
|
|
$
|
11,148
|
|
$
|
2,262
|
|
$
|
119
|
|
$
|
2,381
|
|
$
|
1,218
|
|
$
|
14,747
|
|
|||||||||
|
December 31, 2013
|
|||||||||||||||||||||||||||||||||||||||
|
Balance, beginning of year
|
$
|
13,719
|
|
$
|
3,502
|
|
$
|
1,635
|
|
$
|
223
|
|
$
|
19,079
|
|
$
|
2,275
|
|
$
|
85
|
|
$
|
2,360
|
|
$
|
1,727
|
|
$
|
23,166
|
|
|||||||||
|
Provision for loan losses
|
4,109
|
|
(6,087
|
)
|
(3,478
|
)
|
21
|
|
(5,435
|
)
|
1,845
|
|
99
|
|
1,944
|
|
341
|
|
(3,150
|
)
|
|||||||||||||||||||
|
Charge-offs
|
(4,767
|
)
|
(193
|
)
|
(132
|
)
|
0
|
|
(5,092
|
)
|
(491
|
)
|
(144
|
)
|
(635
|
)
|
0
|
|
(5,727
|
)
|
|||||||||||||||||||
|
Recoveries
|
154
|
|
3,448
|
|
2,839
|
|
0
|
|
6,441
|
|
151
|
|
84
|
|
235
|
|
0
|
|
6,676
|
|
|||||||||||||||||||
|
Balance, end of year
|
$
|
13,215
|
|
$
|
670
|
|
$
|
864
|
|
$
|
244
|
|
$
|
14,993
|
|
$
|
3,780
|
|
$
|
124
|
|
$
|
3,904
|
|
$
|
2,068
|
|
$
|
20,965
|
|
|||||||||
89
The following summarizes the ending loan balance individually evaluated for impairment based upon loan segment, as well as the related allowance for loan loss allocation for each at
December 31, 2015
and
2014
:
|
|
Commercial
|
Consumer
|
|
|
|||||||||||||||||||||||||||||||||||
|
(Dollars in thousands)
|
Commercial
Real Estate
|
Acquisition
and
Development
|
Commercial
and
Industrial
|
Municipal
|
Total
|
Residential
Mortgage
|
Installment
and Other
|
Total
|
Unallocated
|
Total
|
|||||||||||||||||||||||||||||
|
December 31, 2015
|
|||||||||||||||||||||||||||||||||||||||
|
Loans allocated by:
|
|||||||||||||||||||||||||||||||||||||||
|
Individually evaluated for impairment
|
$
|
11,093
|
|
$
|
5
|
|
$
|
734
|
|
$
|
0
|
|
$
|
11,832
|
|
$
|
5,501
|
|
$
|
17
|
|
$
|
5,518
|
|
$
|
0
|
|
$
|
17,350
|
|
|||||||||
|
Collectively evaluated for impairment
|
327,170
|
|
50,698
|
|
72,891
|
|
57,511
|
|
508,270
|
|
248,589
|
|
7,504
|
|
256,093
|
|
0
|
|
764,363
|
|
|||||||||||||||||||
|
$
|
338,263
|
|
$
|
50,703
|
|
$
|
73,625
|
|
$
|
57,511
|
|
$
|
520,102
|
|
$
|
254,090
|
|
$
|
7,521
|
|
$
|
261,611
|
|
$
|
0
|
|
$
|
781,713
|
|
||||||||||
|
Allowance for loan losses allocated by:
|
|||||||||||||||||||||||||||||||||||||||
|
Individually evaluated for impairment
|
$
|
0
|
|
$
|
0
|
|
$
|
0
|
|
$
|
0
|
|
$
|
0
|
|
$
|
281
|
|
$
|
8
|
|
$
|
289
|
|
$
|
0
|
|
$
|
289
|
|
|||||||||
|
Collectively evaluated for impairment
|
7,883
|
|
850
|
|
1,012
|
|
58
|
|
9,803
|
|
2,589
|
|
113
|
|
2,702
|
|
774
|
|
13,279
|
|
|||||||||||||||||||
|
$
|
7,883
|
|
$
|
850
|
|
$
|
1,012
|
|
$
|
58
|
|
$
|
9,803
|
|
$
|
2,870
|
|
$
|
121
|
|
$
|
2,991
|
|
$
|
774
|
|
$
|
13,568
|
|
||||||||||
|
December 31, 2014
|
|||||||||||||||||||||||||||||||||||||||
|
Loans allocated by:
|
|||||||||||||||||||||||||||||||||||||||
|
Individually evaluated for impairment
|
$
|
6,788
|
|
$
|
410
|
|
$
|
2,437
|
|
$
|
0
|
|
$
|
9,635
|
|
$
|
5,871
|
|
$
|
26
|
|
$
|
5,897
|
|
$
|
0
|
|
$
|
15,532
|
|
|||||||||
|
Collectively evaluated for impairment
|
315,218
|
|
29,751
|
|
46,558
|
|
61,191
|
|
452,718
|
|
230,831
|
|
5,865
|
|
236,696
|
|
0
|
|
689,414
|
|
|||||||||||||||||||
|
$
|
322,006
|
|
$
|
30,161
|
|
$
|
48,995
|
|
$
|
61,191
|
|
$
|
462,353
|
|
$
|
236,702
|
|
$
|
5,891
|
|
$
|
242,593
|
|
$
|
0
|
|
$
|
704,946
|
|
||||||||||
|
Allowance for loan losses allocated by:
|
|||||||||||||||||||||||||||||||||||||||
|
Individually evaluated for impairment
|
$
|
2
|
|
$
|
0
|
|
$
|
0
|
|
$
|
0
|
|
$
|
2
|
|
$
|
173
|
|
$
|
13
|
|
$
|
186
|
|
$
|
0
|
|
$
|
188
|
|
|||||||||
|
Collectively evaluated for impairment
|
9,460
|
|
697
|
|
806
|
|
183
|
|
11,146
|
|
2,089
|
|
106
|
|
2,195
|
|
1,218
|
|
14,559
|
|
|||||||||||||||||||
|
$
|
9,462
|
|
$
|
697
|
|
$
|
806
|
|
$
|
183
|
|
$
|
11,148
|
|
$
|
2,262
|
|
$
|
119
|
|
$
|
2,381
|
|
$
|
1,218
|
|
$
|
14,747
|
|
||||||||||
During the year ended
December 31, 2014
, the Company sold
six
notes of classified loan relationships with an aggregate carrying balance of
$5,407,000
to third parties, which netted the Company
$5,743,000
in cash proceeds. The difference between the carrying balances of the notes sold and the cash received, or
$336,000
, was recorded as a net recovery to the allowance for loan losses.
During the year ended
December 31, 2013
, the Company sold
eight
notes of classified loan relationships with an aggregate carrying balance of
$2,576,000
to third parties, which netted the Company
$2,439,000
in cash proceeds. The difference between the carrying balances of the notes sold and the cash received, or
$137,000
, was recorded as a net charge-off to the allowance for loan losses.
The Company has granted loans to the officers and directors of the Company and its subsidiary and to their associates. The aggregate dollar amount of these loans was
$647,000
at
December 31, 2015
, and
$597,000
at
December 31, 2014
. During
2015
,
$675,000
of new loans were granted and repayments totaled
$625,000
.
90
A summary of bank premises and equipment at December 31 is as follows:
|
(Dollars in thousands)
|
2015
|
2014
|
|||||
|
Land
|
$
|
5,182
|
|
$
|
5,182
|
|
|
|
Buildings and improvements
|
23,367
|
|
23,333
|
|
|||
|
Leasehold improvements
|
651
|
|
511
|
|
|||
|
Furniture and equipment
|
24,086
|
|
22,799
|
|
|||
|
Construction in progress
|
125
|
|
140
|
|
|||
|
53,411
|
|
51,965
|
|
||||
|
Less accumulated depreciation and amortization
|
29,451
|
|
27,165
|
|
|||
|
$
|
23,960
|
|
$
|
24,800
|
|
||
Depreciation expense amounted to
$2,310,000
,
$2,459,000
, and
$2,208,000
for the years ended
December 31, 2015
,
2014
and
2013
.
The Company leases land and building space associated with certain branch offices, remote automated teller machines, and certain equipment under agreements which expire at various times through 2023. Total rent expense charged to operations in connection with these leases was
$435,000
,
$427,000
and
$307,000
for the years ended
December 31, 2015
,
2014
and
2013
.
The total minimum rental commitments under operating leases with maturities in excess of one year at
December 31, 2015
are as follows:
|
Due in the Years Ending December 31
|
|||
|
(Dollars in thousands)
|
|
||
|
2016
|
$
|
397
|
|
|
2017
|
185
|
|
|
|
2018
|
125
|
|
|
|
2019
|
63
|
|
|
|
2020
|
40
|
|
|
|
Thereafter
|
79
|
|
|
|
$
|
889
|
|
|
On February 8, 2016, the Bank purchased an office building located in Dauphin County, Pennsylvania, at a purchase price of
$4,275,000
(unaudited). The new regional facility will be used to support the Bank's expansion. The Bank has entered into a lease with the former owner of the building which allows them to continue to lease their existing space through July 2016. Additionally, the Bank has assumed the leases that the previous owner had entered into, as lessor, that expire through the year 2020.
91
The following table shows the components of identifiable intangible assets at December 31:
|
(Dollars in thousands)
|
Gross Amount
|
Accumulated
Amortization
|
Net Amount
|
||||||||
|
December 31, 2015
|
|||||||||||
|
Deposit premiums
|
$
|
2,348
|
|
$
|
2,293
|
|
$
|
55
|
|
||
|
Customer list
|
581
|
|
429
|
|
152
|
|
|||||
|
$
|
2,929
|
|
$
|
2,722
|
|
$
|
207
|
|
|||
|
December 31, 2014
|
|||||||||||
|
Deposit premiums
|
$
|
2,348
|
|
$
|
2,126
|
|
$
|
222
|
|
||
|
Customer list
|
581
|
|
389
|
|
192
|
|
|||||
|
$
|
2,929
|
|
$
|
2,515
|
|
$
|
414
|
|
|||
Amortization expense was
$207,000
,
$208,000
and
$210,000
for the years ended
December 31, 2015
,
2014
and
2013
, respectively.
The estimated aggregate amortization expense for the next five years is as follows:
|
Years Ending December 31,
|
|||
|
(Dollars in thousands)
|
|
||
|
2016
|
$
|
94
|
|
|
2017
|
39
|
|
|
|
2018
|
39
|
|
|
|
2019
|
25
|
|
|
|
2020
|
7
|
|
|
|
Thereafter
|
3
|
|
|
|
$
|
207
|
|
|
The Company files income tax returns in the U.S. federal jurisdiction and the Commonwealth of Pennsylvania. The Bank also files an income tax return in the State of Maryland. The Company is no longer subject to U.S. federal, state or local income tax examination by tax authorities for years before
2012
.
The components of federal income tax expense for the years ended December 31 are summarized as follows:
|
(Dollars in thousands)
|
2015
|
2014
|
2013
|
||||||||
|
Current year provision (benefit):
|
|||||||||||
|
Federal
|
$
|
844
|
|
$
|
81
|
|
$
|
60
|
|
||
|
State
|
(7
|
)
|
10
|
|
(266
|
)
|
|||||
|
837
|
|
91
|
|
(206
|
)
|
||||||
|
Deferred tax expense
|
|||||||||||
|
Federal
|
779
|
|
2,723
|
|
1,253
|
|
|||||
|
State
|
18
|
|
18
|
|
18
|
|
|||||
|
797
|
|
2,741
|
|
1,271
|
|
||||||
|
Change in valuation allowance on deferred taxes
|
0
|
|
(18,964
|
)
|
(1,271
|
)
|
|||||
|
Net federal income tax expense (benefit)
|
$
|
1,634
|
|
$
|
(16,132
|
)
|
$
|
(206
|
)
|
||
92
A reconciliation of the effective applicable income tax rate to the federal statutory rate for the years ended December 31, is as follows:
|
2015
|
2014
|
2013
|
||||||
|
Statutory federal tax rate
|
35.0
|
%
|
35.0
|
%
|
35.0
|
%
|
||
|
Increase/(decrease) resulting from:
|
||||||||
|
State taxes, net of federal benefit
|
0.1
|
%
|
0.1
|
%
|
(1.8
|
)%
|
||
|
Tax exempt interest income
|
(11.3
|
)%
|
(7.3
|
)%
|
(11.9
|
)%
|
||
|
Valuation allowance on deferred tax assets
|
0.0
|
%
|
(145.8
|
)%
|
(13.0
|
)%
|
||
|
Earnings from life insurance
|
(3.8
|
)%
|
(2.6
|
)%
|
(3.4
|
)%
|
||
|
Disallowed interest
|
0.4
|
%
|
0.2
|
%
|
0.3
|
%
|
||
|
Low-income housing credits
|
(5.0
|
)%
|
(3.7
|
)%
|
(2.2
|
)%
|
||
|
Benefit of operating loss carryforward
|
0.0
|
%
|
0.0
|
%
|
(3.8
|
)%
|
||
|
Other
|
1.8
|
%
|
0.1
|
%
|
(1.3
|
)%
|
||
|
Effective income tax rate
|
17.2
|
%
|
(124.0
|
)%
|
(2.1
|
)%
|
||
The provision for income taxes includes
$673,000
,
$677,000
and
$116,000
of applicable income tax expense related to net security gains for the years ended
December 31, 2015
,
2014
, and
2013
.
The components of the net deferred tax asset, included in other assets, at December 31, are as follows:
|
(Dollars in thousands)
|
2015
|
2014
|
|||||
|
Deferred tax assets:
|
|||||||
|
Allowance for loan losses
|
$
|
5,111
|
|
$
|
5,424
|
|
|
|
Deferred compensation
|
547
|
|
528
|
|
|||
|
Retirement plans and salary continuation
|
1,824
|
|
1,695
|
|
|||
|
Share-based compensation
|
343
|
|
102
|
|
|||
|
Off-balance sheet commitment reserves
|
218
|
|
205
|
|
|||
|
Nonaccrual loan interest
|
246
|
|
210
|
|
|||
|
Goodwill
|
124
|
|
154
|
|
|||
|
Bonus accrual
|
359
|
|
396
|
|
|||
|
Low income housing credit carryforward
|
1,652
|
|
1,322
|
|
|||
|
Alternative minimum tax credit carryforward
|
2,195
|
|
1,291
|
|
|||
|
Charitable contribution carryforward
|
211
|
|
209
|
|
|||
|
Net operating loss carryforward
|
4,431
|
|
6,606
|
|
|||
|
Other
|
182
|
|
237
|
|
|||
|
Total deferred tax assets
|
17,443
|
|
18,379
|
|
|||
|
Deferred tax liabilities:
|
|||||||
|
Depreciation
|
815
|
|
955
|
|
|||
|
Net unrealized gains on securities available for sale
|
646
|
|
848
|
|
|||
|
Mortgage servicing rights
|
669
|
|
606
|
|
|||
|
Purchase accounting adjustments
|
352
|
|
421
|
|
|||
|
Other
|
181
|
|
174
|
|
|||
|
Total deferred tax liabilities
|
2,663
|
|
3,004
|
|
|||
|
Net deferred tax asset
|
$
|
14,780
|
|
$
|
15,375
|
|
|
As of
December 31, 2015
, the Company has charitable contribution, low-income housing, and net operating loss carryforwards that expire through
2019
,
2035
, and
2032
, respectively.
93
In assessing whether or not some or all of our deferred tax asset is more likely than not to be realized in the future, management considers all positive and negative evidence, including projected future taxable income, tax planning strategies and recent financial operating results. Based upon our evaluation of both positive and negative evidence, a full valuation on the net deferred tax assets was established as of September 30, 2012. Specifically, it was felt that the negative evidence, which included recent cumulative history of operating losses, deterioration in asset quality and resulting impact on profitability, and that we had exhausted our carryback availability, outweighed the positive evidence, and the reserve was established.
Each subsequent quarter-end, the Company continued to weigh both positive and negative evidence and re-analyzed its position that a valuation allowance was required. At December 31, 2014, management concluded based on the Company’s profitable operations over the prior nine quarters, improvements in asset quality, strengthened capital position, reduced regulatory risk, and the improvement in economic conditions, that a full valuation allowance was no longer necessary. The full amount was recaptured as of December 31, 2014. The ultimate realization of deferred tax assets is dependent upon existence, or generation, of taxable income in the periods when those temporary differences and net operating loss and credit carryforwards are deductible. Management considered projected future taxable income, length of time needed for carryforwards to reverse, available tax planning strategies, and other factors in making its assessment that it was more likely than not the net deferred tax assets would be realized, and recaptured the full valuation allowance at December 31, 2014. As a result of the recapture of the valuation allowance at December 31, 2014, the Company began recording income tax expense.
The Company maintains a 401(k) profit-sharing plan for those employees who meet the eligibility requirements set forth in the plan. Employer contributions to the plan are based on performance of the Company and are at the discretion of the Bank’s Board of Directors. The plan contains limited match or safe harbor provisions. Substantially all of the Company’s employees are covered by the plan and the contributions charged to operations were
$361,000
,
$357,000
and
$311,000
for the years ended
December 31, 2015
,
2014
, and
2013
.
The Company has a deferred compensation arrangement with certain present and former directors, whereby a director or his beneficiaries will receive a monthly retirement benefit at age
65
. The arrangement is funded by an amount of life insurance on the participating director calculated to meet the Company’s obligations under the compensation agreement. The cash value of the life insurance policies is an unrestricted asset of the Company. The estimated present value of future benefits to be paid, which is included in other liabilities, amounted to
$115,000
and
$125,000
at
December 31, 2015
and
2014
. Total annual expense for this deferred compensation plan was
$12,000
,
$13,000
and
$1,000
for the years ended
December 31, 2015
,
2014
and
2013
.
The Company also has supplemental discretionary deferred compensation plans for directors and executive officers. The plans are funded annually with director fees and salary reductions which are either placed in a trust account invested by the Company’s Orrstown Financial Advisors division or recognized as a liability. The trust account balance was
$1,449,000
and
$1,385,000
at
December 31, 2015
and
2014
, respectively, and is included in other assets on the balance sheets, offset by other liabilities in the same amount. Total amounts contributed to these plans were
$30,000
,
$25,000
and
$10,000
, for the years ended
December 31, 2015
,
2014
, and
2013
.
In addition, the Company has
two
supplemental retirement and salary continuation plans for directors and executive officers. These plans are funded with single premium life insurance on the plan participants. The cash value of the life insurance policies is an unrestricted asset of the Company. The estimated present value of future benefits to be paid totaled
$5,211,000
and
$4,844,000
at
December 31, 2015
and
2014
, which is included in other liabilities. Total annual expense for these plans amounted to
$626,000
,
$575,000
and
$549,000
, for the years ended
December 31, 2015
,
2014
, and
2013
.
The Company has promised a continuation of life insurance coverage to certain persons post-retirement. GAAP requires the recording of post-retirement costs and a liability equal to the present value of the cost of post retirement insurance during the insured employee’s term of service. The estimated present value of future benefits to be paid totaled
$799,000
and
$670,000
at
December 31, 2015
and
2014
which is included in other liabilities. Total annual expense for this plan amounted to
$129,000
,
$104,000
and
$42,000
for the years ended
December 31, 2015
,
2014
and
2013
.
The Company maintains share-based compensation plans, the purpose of which is to provide officers, employees, and non-employee members of the board of directors of the Company and the Bank, with additional incentive to further the success of the Company. In May 2011, the shareholders of the Company approved the 2011 Orrstown Financial Services, Inc. Incentive Stock Plan (the “Plan”). Under the Plan,
381,920
shares of the common stock of the Company were reserved to be issued. As of
December 31, 2015
,
179,407
shares were available to be issued under the Plan.
94
Incentive awards under the Plan may consist of grants of incentive stock options, nonqualified stock options, stock appreciation rights, restricted stock, deferred stock units and performance shares. All employees of the Company and its present or future subsidiaries, and members of the board of directors of the Company or any subsidiary of the Company, are eligible to participate in the Plan. The Plan allows for the Compensation Committee of the Board of Directors to determine the type of incentive to be awarded, its term, manner of exercise, vesting of awards and restrictions on shares. Generally, awards are nonqualified under the IRS code, unless the awards are deemed to be incentive awards to employees, at the Compensation Committee’s discretion.
A roll forward of the Company’s nonvested restricted shares for the year ended
December 31, 2015
is presented below:
|
Shares
|
Weighted Average Exercise Price
|
|||||
|
Nonvested shares, beginning of year
|
155,500
|
|
$
|
15.52
|
|
|
|
Granted
|
71,561
|
|
17.29
|
|
||
|
Forfeited
|
(27,180
|
)
|
15.93
|
|
||
|
Vested
|
(2,500
|
)
|
10.43
|
|
||
|
Nonvested shares, at end of year
|
197,381
|
|
$
|
16.17
|
|
|
For
December 31, 2015
,
2014
, and
2013
,
$732,000
,
$178,000
, and
$17,000
was recognized as expense on the restricted stock awards, with tax benefits recorded of
$256,000
,
$62,000
, and
$6,000
for the respective year. The total fair value of shares vested during the year ended
December 31, 2015
was
$43,000
.
No
shares vested during
2014
and
2013
. As of
December 31, 2015
and
2014
, the unrecognized compensation expense related to the stock awards was
$2,293,000
, and
$1,982,000
. The unrecognized compensation expense is expected to be recognized over a weighted-average period of
4.5 years
.
A roll forward of the Company’s outstanding stock options for the year ended
December 31, 2015
is presented below:
|
Shares
|
Weighted Average
Exercise Price
|
|||||
|
Outstanding at beginning of year
|
148,193
|
|
$
|
31.18
|
|
|
|
Forfeited
|
(19,133
|
)
|
31.62
|
|
||
|
Expired
|
(27,600
|
)
|
39.93
|
|
||
|
Options outstanding and exercisable, at year end
|
101,460
|
|
$
|
28.72
|
|
|
The exercise price of each option equals the market price of the Company’s stock on the date of grant and an option’s maximum term is
ten
years. All options are fully vested upon issuance. Information pertaining to options outstanding and exercisable at
December 31, 2015
is as follows:
|
Range of
Exercise Prices
|
Number
Outstanding and Exercisable
|
Weighted Average
Remaining Contractual
Life (Years)
|
Weighted
Average
Exercise Price
|
||||||
|
$21.14 - $24.99
|
36,724
|
|
4.43
|
$
|
21.46
|
|
|||
|
$25.00 - $29.99
|
2,792
|
|
4.25
|
25.76
|
|
||||
|
$30.00 - $34.99
|
39,440
|
|
1.78
|
31.28
|
|
||||
|
$35.00 - $37.58
|
22,504
|
|
1.52
|
36.44
|
|
||||
|
$21.14 - $37.58
|
101,460
|
|
2.99
|
$
|
28.72
|
|
|||
The options outstanding and exercisable had
no
intrinsic value at
December 31, 2015
and
2014
as each exercise price exceeded the market value.
The Company also maintains an employee stock purchase plan, in order to provide employees of the Company and its subsidiaries an opportunity to purchase stock of the Company. Under the plan, eligible employees may purchase shares in an amount that does not exceed
10%
of their annual salary at the lower of
95%
(
85%
prior to August 31, 2014) of the fair market
95
value of the shares on the semi-annual offering date, or related purchase date. The Company reserved
350,000
shares of its common stock, after making adjustments for stock dividends and a stock split, to be issued under the employee stock purchase plan. As of
December 31, 2015
,
192,338
shares were available to be issued under the plan. Employees purchased
6,305
,
6,707
and
21,609
shares at a weighted average price of
$15.83
,
$14.88
and
$11.52
per share in
2015
,
2014
and
2013
. Compensation expense recognized on the employee stock purchase plan totaled
$8,000
,
$12,000
, and
$112,000
for the years ended
December 31, 2015
,
2014
and
2013
, with tax benefits recorded of
$3,000
,
$4,000
, and
$39,000
recorded for the respective years.
The Company uses a combination of issuing new shares or treasury shares to meet stock compensation exercises depending on market conditions.
The composition of deposits at December 31 is as follows:
|
2015
|
2014
|
||||||
|
(Dollars in thousands)
|
|
|
|||||
|
Non-interest bearing
|
$
|
131,390
|
|
$
|
116,302
|
|
|
|
Now and money market
|
510,758
|
|
503,818
|
|
|||
|
Savings
|
85,061
|
|
86,351
|
|
|||
|
Time – less than $100,000
|
185,254
|
|
128,065
|
|
|||
|
Time – greater than $100,000
|
119,704
|
|
115,168
|
|
|||
|
Total
|
$
|
1,032,167
|
|
$
|
949,704
|
|
|
The scheduled maturities of time deposits for the years ending December 31 are as follows:
|
(Dollars in thousands)
|
|
||
|
2016
|
$
|
147,831
|
|
|
2017
|
52,083
|
|
|
|
2018
|
32,752
|
|
|
|
2019
|
13,966
|
|
|
|
2020
|
55,505
|
|
|
|
Thereafter
|
2,821
|
|
|
|
$
|
304,958
|
|
|
Brokered time deposits totaled
$80,905,000
and
$17,108,000
at
December 31, 2015
and
2014
. Management continues to evaluate brokered deposits as a funding option, and considers regulatory views on non-core funding sources. Time deposits that meet or exceed the FDIC limit of $250,000 at December 31, 2015 were
$19,668,000
.
The Company accepts deposits of the officers and directors of the Company and the Bank on the same terms, including interest rates, as those prevailing at the time for comparable transactions with unrelated persons. The aggregate dollar amount of deposits of officers and directors and related interests totaled
$2,575,000
and
$5,036,000
at
December 31, 2015
and
2014
, respectively.
The Company has several short-term borrowings available to it, including short-term borrowings from the FHLB, federal funds purchased, and the FRB discount window.
96
Information concerning the use of these short-term borrowings as of and for the years ended December 31, is summarized as follows:
|
(Dollars in thousands)
|
2015
|
2014
|
2013
|
||||||||
|
Balance at year end
|
$
|
60,000
|
|
$
|
65,000
|
|
$
|
50,000
|
|
||
|
Weighted average interest rate at year-end
|
0.53
|
%
|
0.36
|
%
|
0.28
|
%
|
|||||
|
Average balance during the year
|
$
|
55,106
|
|
$
|
32,736
|
|
$
|
10,540
|
|
||
|
Average interest rate during the year
|
0.43
|
%
|
0.34
|
%
|
0.31
|
%
|
|||||
|
Maximum month-end balance during the year
|
$
|
83,500
|
|
$
|
65,000
|
|
$
|
50,000
|
|
||
In addition, the Company has repurchase agreements with certain of its deposit customers. The Company is required to hold U.S. Treasury, or U.S. Agency, or U.S. Government Sponsored Enterprise securities to be held as underlying securities for Repurchase Agreements. Information concerning securities sold under agreements to repurchase for the years ended December 31 is summarized as follows:
|
(Dollars in thousands)
|
2015
|
2014
|
2013
|
||||||||
|
Balance at year end
|
$
|
29,156
|
|
$
|
21,742
|
|
$
|
9,032
|
|
||
|
Weighted average interest rate at year-end
|
0.20
|
%
|
0.20
|
%
|
0.20
|
%
|
|||||
|
Average balance during the year
|
$
|
30,156
|
|
$
|
19,186
|
|
$
|
13,772
|
|
||
|
Average interest rate during the year
|
0.20
|
%
|
0.20
|
%
|
0.20
|
%
|
|||||
|
Maximum month-end balance during the year
|
$
|
37,558
|
|
$
|
32,861
|
|
$
|
19,105
|
|
||
|
Fair value of securities underlying the agreements at year-end
|
35,470
|
|
38,337
|
|
52,024
|
|
|||||
Federal funds purchased and securities sold under agreements to repurchase generally mature within one day from the transaction date.
At December 31, the Company’s long-term debt consisted of the following:
|
|
Amount
|
Weighted Average rate
|
|||||||||||
|
(Dollars in thousands)
|
2015
|
2014
|
2015
|
2014
|
|||||||||
|
FHLB fixed rate advances maturing:
|
|||||||||||||
|
2015
|
$
|
0
|
|
$
|
10,000
|
|
0.00
|
%
|
0.35
|
%
|
|||
|
2017
|
20,000
|
|
0
|
|
1.00
|
%
|
0.00
|
%
|
|||||
|
2020
|
350
|
|
350
|
|
7.40
|
%
|
7.40
|
%
|
|||||
|
20,350
|
|
10,350
|
|
1.11
|
%
|
0.59
|
%
|
||||||
|
FHLB amortizing advance requiring monthly principal and interest payments, maturing:
|
|||||||||||||
|
2025
|
4,145
|
|
4,462
|
|
4.74
|
%
|
4.74
|
%
|
|||||
|
Total FHLB Advances
|
$
|
24,495
|
|
$
|
14,812
|
|
1.73
|
%
|
1.84
|
%
|
|||
Except for amortizing loans, interest only is paid on a quarterly basis.
97
The aggregate amount of future principal payments required on these borrowings at
December 31, 2015
is as follows:
|
Years Ending December 31,
|
|||
|
(Dollars in thousands)
|
|
||
|
2016
|
$
|
332
|
|
|
2017
|
20,348
|
|
|
|
2018
|
365
|
|
|
|
2019
|
383
|
|
|
|
2020
|
751
|
|
|
|
Thereafter
|
2,316
|
|
|
|
$
|
24,495
|
|
|
The Bank is a member of the FHLB of Pittsburgh and, as such, can take advantage of the FHLB program of overnight and term advances. Under terms of a blanket collateral agreement, advances, lines and letters of credit from the FHLB are collateralized by first mortgage loans and securities. Collateral for all outstanding advances, lines and letters of credit consisted of certain securities, 1-4 family mortgage loans and other real estate secured loans totaling
$558,908,000
at
December 31, 2015
. The Bank had additional availability of
$284,203,000
at the FHLB on
December 31, 2015
based on qualifying collateral.
The Bank has available lines of credit with
two
correspondent banks totaling
$30,000,000
, at
December 31, 2015
. The lines of credit are unsecured and the rate is based on the daily Federal Funds rate. There were
no
borrowings under these lines of credit at
December 31, 2015
and
2014
.
The Company has
$10,150,000
in letters of credit outstanding with the FHLB in favor of third parties utilized for general banking purposes.
The Company maintains a stockholder dividend reinvestment and stock purchase plan. Under the plan, shareholders may purchase additional shares of the Company’s common stock at the prevailing market prices with reinvestment dividends and voluntary cash payments. The Company reserved
1,045,000
shares of its common stock to be issued under the dividend reinvestment and stock purchase plan. As of
December 31, 2015
, approximately
665,000
shares were available to be issued under the plan.
On January 19, 2016, the Company filed a shelf registration statement on Form S-3 with the SEC that provides for up to an aggregate of
$100,000,000
, through the sale of common stock, preferred stock, warrants, debt securities, and units. To date, the Company has not issued any securities under this shelf registration.
The Company (on a consolidated basis) and the Bank are subject to various regulatory capital requirements administered by the federal banking agencies. Failure to meet minimum capital requirements can initiate certain mandatory and possibly additional discretionary actions by regulators that, if undertaken, could have a direct material effect on the Company’s and Bank’s financial statements. Under capital adequacy guidelines and the regulatory framework for prompt corrective action, the Company and the Bank must meet specific guidelines that involve quantitative measures of assets, liabilities and certain off-balance sheet items as calculated under regulatory accounting practices. The capital amounts and classification are also subject to qualitative judgments by the regulators about components, risk weightings, and other factors. Although applicable to the Bank, prompt corrective action provisions are not applicable to bank holding companies, including financial holding companies.
Quantitative measures established by regulators to ensure capital adequacy require the Company and the Bank to maintain minimum amounts and ratios (as set forth in the following table) of total and Tier 1 capital (as defined in regulations) to risk-weighted assets (as defined), common equity and Tier 1 capital (as defined) to risk weighted assets, and of Tier 1 capital (as defined) to average assets (as defined). Management believes, as of
December 31, 2015
and
2014
, the Company and the Bank met all capital adequacy requirements to which they are subject.
Effective January 1, 2015, the Company and Bank became subject to final rules establishing a new comprehensive capital framework for U.S. banking organizations, including community banks (the "Basel III Capital Rules"), which substantially revised the risk-based capital requirements in comparison to the previously existing U.S. risk-based capital rules. The Basel III Capital Rules, among other things, (i) introduced a new capital measure called “Common Equity Tier 1” (“CET1”), (ii) increased the minimum requirements for Tier 1 Capital ratio as well as the minimum levels to be considered well capitalized
98
under prompt corrective action; (iii) and introduced the "capital conservation buffer”, designed to absorb losses during periods of economic stress. Institutions with a ratio of CET1 to risk-weighted assets above the minimum but below the conservation buffer are subject to constraints on dividends, equity repurchases and discretionary bonuses to executive officers based on the amount of the shortfall. The implementation of the capital conservation buffer will begin on January 1, 2016 at the 0.625% level and be phased in over a four-year period (increasing by that amount on each subsequent January 1, until it reaches 2.5% on January 1, 2019).
As of
December 31, 2015
the most recent notification from the Federal Deposit Insurance Corporation categorized the Bank as well capitalized under the regulatory framework for prompt corrective action. To be categorized as well capitalized, an institution must maintain minimum total risk-based, Tier 1 risk-based and Tier 1 leverage ratios as set forth in the following table. There are no conditions or events since the notification that management believes have changed the Bank’s category.
The Company and the Bank’s actual capital ratios as of
December 31, 2015
and
December 31, 2014
are also presented in the table.
|
|
Actual
|
Minimum Capital
Requirement
|
Minimum to Be Well
Capitalized Under
Prompt Corrective
Action Provisions
|
|||||||||||||||||
|
(Dollars in thousands)
|
Amount
|
Ratio
|
Amount
|
Ratio
|
Amount
|
Ratio
|
||||||||||||||
|
December 31, 2015
|
||||||||||||||||||||
|
Total capital to risk weighted assets
|
||||||||||||||||||||
|
Orrstown Financial Services, Inc.
|
$
|
134,562
|
|
15.8
|
%
|
$
|
68,078
|
|
8.0
|
%
|
n/a
|
|
n/a
|
|
||||||
|
Orrstown Bank
|
118,671
|
|
14.0
|
%
|
68,027
|
|
8.0
|
%
|
$
|
85,034
|
|
10.0
|
%
|
|||||||
|
Tier 1 capital to risk weighted assets
|
||||||||||||||||||||
|
Orrstown Financial Services, Inc.
|
123,825
|
|
14.6
|
%
|
51,058
|
|
6.0
|
%
|
n/a
|
|
n/a
|
|
||||||||
|
Orrstown Bank
|
107,942
|
|
12.7
|
%
|
51,021
|
|
6.0
|
%
|
68,027
|
|
8.0
|
%
|
||||||||
|
CET1 to risk weighted assets
|
||||||||||||||||||||
|
Orrstown Financial Services, Inc.
|
123,825
|
|
14.6
|
%
|
38,294
|
|
4.5
|
%
|
n/a
|
|
n/a
|
|
||||||||
|
Orrstown Bank
|
107,942
|
|
12.7
|
%
|
38,265
|
|
4.5
|
%
|
55,272
|
|
6.5
|
%
|
||||||||
|
Tier 1 capital to average assets
|
||||||||||||||||||||
|
Orrstown Financial Services, Inc.
|
123,825
|
|
9.8
|
%
|
50,684
|
|
4.0
|
%
|
n/a
|
|
n/a
|
|
||||||||
|
Orrstown Bank
|
107,942
|
|
8.5
|
%
|
50,695
|
|
4.0
|
%
|
63,368
|
|
5.0
|
%
|
||||||||
|
December 31, 2014
|
||||||||||||||||||||
|
Total capital to risk weighted assets
|
||||||||||||||||||||
|
Orrstown Financial Services, Inc.
|
$
|
119,713
|
|
16.8
|
%
|
$
|
56,859
|
|
8.0
|
%
|
n/a
|
|
n/a
|
|
||||||
|
Orrstown Bank
|
118,540
|
|
16.7
|
%
|
56,835
|
|
8.0
|
%
|
$
|
71,043
|
|
10.0
|
%
|
|||||||
|
Tier 1 capital to risk weighted assets
|
||||||||||||||||||||
|
Orrstown Financial Services, Inc.
|
110,750
|
|
15.6
|
%
|
28,429
|
|
4.0
|
%
|
n/a
|
|
n/a
|
|
||||||||
|
Orrstown Bank
|
109,581
|
|
15.4
|
%
|
28,417
|
|
4.0
|
%
|
42,626
|
|
6.0
|
%
|
||||||||
|
Tier 1 capital to average assets
|
||||||||||||||||||||
|
Orrstown Financial Services, Inc.
|
110,750
|
|
9.5
|
%
|
46,496
|
|
4.0
|
%
|
n/a
|
|
n/a
|
|
||||||||
|
Orrstown Bank
|
109,581
|
|
9.4
|
%
|
46,518
|
|
4.0
|
%
|
58,148
|
|
5.0
|
%
|
||||||||
On September 14, 2015, the Board of Directors of the Company authorized a stock repurchase program under which the Company may repurchase up to
5%
of the Company's outstanding shares of common stock, or approximately
416,000
shares, in the open market, in accordance with all applicable securities laws and regulations, including Rule 10b-18 of the Securities Exchange Act of 1934, as amended. The extent to which the Company repurchases its shares, and the timing of such repurchases, will depend upon a variety of factors, including market conditions, regulatory requirements and other corporate considerations, as determined by management. Purchases may be made from time to time on open market or privately negotiated transactions. The repurchase program may be suspended or discontinued at any time. As of
December 31, 2015
,
47,077
shares had been repurchased under the program at a total cost of
$808,680
, or
$17.18
per share.
99
Federal and state banking regulations place certain restrictions on dividends paid and loans or advances made by the Bank to the Company. Further, regulatory mandates may impose more stringent restrictions on the extent of dividends that may be paid by the Bank to the Company. As the Company is a bank holding company (that has elected status as a financial holding company with the FRB), the Bank may not declare a dividend to the Company if the results of such dividend would drop the Bank below the minimum capital required in order to be classified as “well capitalized.” In addition, as a Federal member bank, the Bank may not declare or pay a dividend if the total of all dividends declared during the calendar year, including the proposed dividend, exceeds the sum of the Bank's undistributed net income during the calendar year and prior two calendar years. During 2016,
$21,392,000
of undistributed earnings of the Bank, plus any 2016 net profits retained to the date of the dividend, are available for dividends to the Company without prior regulatory authority.
Under current FRB regulations, the Bank is limited to the amounts it may loan to its affiliates, including the Company. Covered transactions, including loans, with a single affiliate, may not exceed
10%
of the Bank’s total capital plus its excess allowance for loan losses, and the aggregate of all covered transactions with all affiliates may not exceed
20%
, of the Bank’s subsidiary and surplus (as defined by regulation). At
December 31, 2015
, the maximum amount the Bank has available to loan the Company is approximately
$12,198,000
.
Earnings per share for the years ended December 31, were as follows:
|
(In thousands, except per share data)
|
2015
|
2014
|
2013
|
||||||||
|
Net income
|
$
|
7,874
|
|
$
|
29,142
|
|
$
|
10,004
|
|
||
|
Weighted average shares outstanding
|
8,107
|
|
8,110
|
|
8,093
|
|
|||||
|
Impact of common stock equivalents
|
35
|
|
6
|
|
0
|
|
|||||
|
Weighted average shares outstanding (diluted)
|
8,142
|
|
8,116
|
|
8,093
|
|
|||||
|
Per share information:
|
|||||||||||
|
Basic earnings per share
|
$
|
0.97
|
|
$
|
3.59
|
|
$
|
1.24
|
|
||
|
Diluted earnings per share
|
0.97
|
|
3.59
|
|
1.24
|
|
|||||
Stock options of
109,000
,
178,000
and
207,000
for the years ended
December 31, 2015
,
2014
and
2013
have been excluded from diluted earnings per share calculations, as their exercise would have been anti-dilutive, as the exercise price exceeded the average market price. The common stock equivalents in
2015
and
2014
are related to restricted stock awards.
The Company is a party to financial instruments with off-balance-sheet risk in the normal course of business to meet the financial needs of its customers and to reduce its own exposure to fluctuations in interest rates. These financial instruments include commitments to extend credit and standby letters of credit. Those instruments involve, to varying degrees, elements of credit and interest rate risk in excess of the amount recognized in the balance sheets. The contract amounts of those instruments reflect the extent of involvement the Company has in particular classes of financial instruments.
The Company’s exposure to credit loss in the event of nonperformance by the other party to the financial instrument for commitments to extend credit and standby letters of credit and financial guarantees written is represented by the contractual amount of those instruments. The Company uses the same credit policies in making commitments and conditional obligations as it does for on-balance-sheet instruments.
100
|
|
Contract or Notional Amount
|
||||||
|
(Dollars in thousands)
|
2015
|
2014
|
|||||
|
Commitments to fund:
|
|||||||
|
Revolving, open ended home equity loans
|
$
|
110,473
|
|
$
|
100,897
|
|
|
|
1-4 family residential construction loans
|
6,153
|
|
2,463
|
|
|||
|
Commercial real estate, construction and land development loans
|
14,174
|
|
11,682
|
|
|||
|
Commercial, industrial and other loans
|
84,480
|
|
71,483
|
|
|||
|
Standby letters of credit
|
6,510
|
|
7,309
|
|
|||
Commitments to extend credit are agreements to lend to a customer as long as there is no violation of any condition established in the contract. Commitments generally have fixed expiration dates or other termination clauses and may require payment of a fee. Since many of the commitments are expected to expire without being drawn upon, the total commitment amounts do not necessarily represent future cash requirements. The Company evaluates each customer’s credit-worthiness on a case-by-case basis. The amount of collateral obtained, if deemed necessary by the Company upon extension of credit, is based on management’s credit evaluation of the customer. Collateral held varies but may include accounts receivable, inventory, equipment, residential real estate, and income-producing commercial properties.
Standby letters of credit and financial guarantees written are conditional commitments issued by the Company to guarantee the performance of a customer to a third party. Those guarantees are primarily issued to support public and private borrowing arrangements. The credit risk involved in issuing letters of credit is essentially the same as that involved in extending loans to customers. The Company holds collateral supporting those commitments when deemed necessary by management. The current amount of liability, as of
December 31, 2015
and
2014
, for guarantees under standby letters of credit issued was not material.
The Company currently maintains a reserve in other liabilities totaling
$472,000
and
$485,000
at
December 31, 2015
and
2014
for off-balance sheet credit exposures that currently are not funded, based on historical loss experience of the related loan class. For the years ended
December 31, 2015
,
2014
and
2013
,
($13,000)
,
($44,000)
and
$(54,000)
was charged to other noninterest expense for this exposure.
The Company has sold loans to the Federal Home Loan Bank of Chicago as part of its Mortgage Partnership Finance Program (“MPF Program”). Under the terms of the MPF Program, there is limited recourse back to the Company for loans that do not perform in accordance with the terms of the loan agreement. Each loan that is sold under the program is “credit enhanced” such that the individual loan’s rating is raised to “AA,” as determined by the Federal Home Loan Bank of Chicago. The total outstanding balance of loans sold under the MPF Program was
$44,124,000
and
$51,773,000
at
December 31, 2015
and
2014
, with limited recourse back to the Company on these loans of
$8,230,000
and
$8,508,000
at
December 31, 2015
and
2014
. Many of the loans sold under the MPF Program have primary mortgage insurance, which reduces the Company’s overall exposure. For the years ended
December 31, 2015
,
2014
, and
2013
, the Company foreclosed or is in the process of foreclosing on loans sold under the MPF program, with a resulting charge of
$127,000
,
$71,000
and
$20,000
to other expenses representing an estimate of the Company’s losses under its recourse exposure.
The Company meets the requirements for disclosure of fair value information about financial instruments, whether or not recognized in the balance sheet. In cases where quoted market prices are not available, fair values are based on estimates using present value or other valuation techniques. Those techniques are significantly affected by the assumptions used, including the discount rate and estimates of future cash flows. In that regard, the derived fair value estimates cannot be substantiated by comparison to independent markets and, in many cases, could not be realized in immediate settlement of the instruments. Certain financial instruments and all non-financial instruments are excluded from disclosure requirements. Accordingly, the aggregate fair value amounts presented do not represent the underlying value of the Company.
Fair value measurements under GAAP defines fair value, describes a framework for measuring fair value and requires disclosures about fair value measurements by establishing a three-level hierarchy that prioritizes the inputs to valuation techniques used to measure fair value. The fair value hierarchy gives the highest priority to quoted prices in active markets for identical assets or liabilities (Level 1) and the lowest priority to valuation techniques that employ unobservable inputs (Level 3). If the inputs used to measure the assets or liabilities fall within different levels of the hierarchy, the classification is based on the lowest level input that is significant to the fair value measurement of the asset or liability. Classification of assets and liabilities within the hierarchy considers the markets in which the assets and liabilities are traded and the reliability and transparency of the assumptions used to determine fair value.
101
The three levels are defined as follows: Level 1 – inputs to the valuation methodology are quoted prices (unadjusted) for identical assets or liabilities in active markets. Level 2 – inputs to the valuation methodology include quoted prices for similar assets and liabilities in active markets, quoted prices for identical or similar instruments in markets that are not active or by model-based techniques in which all significant inputs are observable in the market for the asset or liability, for substantially the full term of the financial instrument. Level 3 – the valuation methodology is derived from model-based techniques in which at least one significant input is unobservable to the fair value measurement and based on the Company’s own assumptions about market participants’ assumptions.
Following is a description of the valuation methodologies used for instruments measured on a recurring basis at estimated fair value, as well as the general classification of such instruments pursuant to the valuation hierarchy:
Securities
Where quoted prices are available in an active market, securities are classified within Level 1 of the valuation hierarchy. Level 1 securities would include highly liquid government bonds, mortgage products and exchange traded equities. If quoted market prices are not available, securities are classified within Level 2 and fair values are estimated by using pricing models, quoted prices of securities with similar characteristics or discounted cash flow. Level 2 securities would include U.S. agency securities, mortgage-backed securities, obligations of states and political subdivisions and certain corporate, asset backed and other securities. In certain cases where there is limited activity or less transparency around inputs to the valuation, securities are classified within Level 3 of the valuation hierarchy. All of the Company’s securities are classified as available for sale.
The Company had
no
fair value liabilities measured on a recurring basis at
December 31, 2015
or
2014
. A summary of assets at
December 31, 2015
and
2014
, measured at estimated fair value on a recurring basis were as follows:
|
(Dollars in Thousands)
|
Level 1
|
Level 2
|
Level 3
|
Total Fair
Value
Measurements
|
|||||||||||
|
December 31, 2015
|
|||||||||||||||
|
Securities available for sale:
|
|||||||||||||||
|
U.S. Government Agencies
|
$
|
0
|
|
$
|
47,227
|
|
$
|
0
|
|
$
|
47,227
|
|
|||
|
States and political subdivisions
|
0
|
|
125,961
|
|
0
|
|
125,961
|
|
|||||||
|
GSE residential mortgage-backed securities
|
0
|
|
132,349
|
|
0
|
|
132,349
|
|
|||||||
|
GSE residential collateralized mortgage obligations (CMOs)
|
0
|
|
15,843
|
|
0
|
|
15,843
|
|
|||||||
|
GSE commercial CMOs
|
0
|
|
63,770
|
|
0
|
|
63,770
|
|
|||||||
|
Private label CMOs
|
0
|
|
8,901
|
|
0
|
|
8,901
|
|
|||||||
|
Total debt securities
|
0
|
|
394,051
|
|
0
|
|
394,051
|
|
|||||||
|
Equity securities – financial services
|
0
|
|
73
|
|
0
|
|
73
|
|
|||||||
|
Total securities
|
$
|
0
|
|
$
|
394,124
|
|
$
|
0
|
|
$
|
394,124
|
|
|||
|
December 31, 2014
|
|||||||||||||||
|
Securities available for sale:
|
|||||||||||||||
|
U.S. Government Agencies
|
$
|
0
|
|
$
|
23,958
|
|
$
|
0
|
|
$
|
23,958
|
|
|||
|
States and political subdivisions
|
0
|
|
52,401
|
|
0
|
|
52,401
|
|
|||||||
|
GSE residential mortgage-backed securities
|
0
|
|
175,596
|
|
0
|
|
175,596
|
|
|||||||
|
GSE residential collateralized mortgage obligations (CMOs)
|
0
|
|
58,705
|
|
0
|
|
58,705
|
|
|||||||
|
GSE commercial CMOs
|
0
|
|
65,472
|
|
0
|
|
65,472
|
|
|||||||
|
Total debt securities
|
0
|
|
376,132
|
|
0
|
|
376,132
|
|
|||||||
|
Equity securities – financial services
|
0
|
|
67
|
|
0
|
|
67
|
|
|||||||
|
Total securities
|
$
|
0
|
|
$
|
376,199
|
|
$
|
0
|
|
$
|
376,199
|
|
|||
Certain financial assets are measured at fair value on a nonrecurring basis in accordance with GAAP. Adjustments to the fair value of these assets usually result from the application of lower-of-cost-or-market accounting or write-downs of individual assets.
102
The following describes the valuation techniques used by the Company to measure certain financial assets recorded at fair value on a nonrecurring basis in the financial statements:
Impaired Loans
Loans are designated as impaired when, in the judgment of management based on current information and events, it is probable that all amounts due, according to the contractual terms of the loan agreement, will not be collected. The measurement of loss associated with impaired loans for all loan classes can be based on either the observable market price of the loan, the fair value of the collateral, or discounted cash flows based on a market rate of interest for performing troubled debt restructurings. For collateral dependent loans, fair value is measured based on the value of the collateral securing the loan, less estimated costs to sell. Collateral may be in the form of real estate or business assets including equipment, inventory, and accounts receivable. The value of the real estate collateral is determined utilizing an income or market valuation approach based on an appraisal conducted by an independent, licensed appraiser outside of the Company using observable market data (Level 2). However, if the collateral is a house or building in the process of construction, or if management adjusts the appraisal value, then the fair value is considered Level 3. The value of business equipment is based upon an outside appraisal, if deemed significant, or the net book value on the applicable business’ financial statements if not considered significant using observable market data. Likewise, values for inventory and accounts receivable collateral are based on financial statement balances or aging reports (Level 3). For discounted cash flow impairment measurement on residential mortgage loans, the Company discounts cash flows on a particular credit, utilizing a market rate of interest that adequately reflects the terms and conditions of the note, and the credit risk associated with it. Impaired loans with an allocation to the allowance for loan losses are measured at fair value on a nonrecurring basis. Any fair value adjustments are recorded in the period incurred as provision for loan losses on the consolidated statement of operations. Specific allocations to the allowance for loan losses or partial charge-offs were
$2,246,000
and
$4,352,000
at
December 31, 2015
and
2014
. Changes in the fair value of impaired loans for those still held at December 31 considered in the determination as to the provision for loan losses, totaled
$888,000
,
$2,441,000
and
$722,000
for the years ended
December 31, 2015
,
2014
, and
2013
.
Foreclosed Real Estate
Other real estate property acquired through foreclosure is initially recorded at fair value of the property at the transfer date less estimated selling cost. Subsequently, other real estate owned is carried at the lower of its carrying value or the fair value less estimated selling cost. Fair value is usually determined based upon an independent third-party appraisal of the property or occasionally upon a recent sales offer. Specific charges to value the real estate owned at the lower of cost or fair value on properties held at
December 31, 2015
and
2014
were
$129,000
and
$581,000
. Changes in the fair value of foreclosed real estate for those still held at December 31 charged to other real estate expenses totaled
$32,000
,
$170,000
, and
$34,000
for the years ending
December 31, 2015
,
2014
, and
2013
.
103
A summary of assets at December 31 measured at fair value on a nonrecurring basis is as follows:
|
(Dollars in thousands)
|
Level 1
|
Level 2
|
Level 3
|
Total
Fair Value
Measurements
|
|||||||||||
|
December 31, 2015
|
|||||||||||||||
|
Impaired Loans
|
|||||||||||||||
|
Commercial real estate:
|
|||||||||||||||
|
Owner-occupied
|
$
|
0
|
|
$
|
0
|
|
$
|
881
|
|
$
|
881
|
|
|||
|
Non-owner occupied
|
0
|
|
0
|
|
736
|
|
736
|
|
|||||||
|
Multi-family
|
0
|
|
0
|
|
233
|
|
233
|
|
|||||||
|
Non-owner occupied residential
|
0
|
|
0
|
|
570
|
|
570
|
|
|||||||
|
Acquisition and development:
|
|||||||||||||||
|
Commercial and land development
|
0
|
|
0
|
|
5
|
|
5
|
|
|||||||
|
Residential mortgage:
|
|||||||||||||||
|
First lien
|
0
|
|
0
|
|
2,094
|
|
2,094
|
|
|||||||
|
Home equity - lines of credit
|
0
|
|
0
|
|
229
|
|
229
|
|
|||||||
|
Installment and other loans
|
0
|
|
0
|
|
9
|
|
9
|
|
|||||||
|
Total impaired loans
|
$
|
0
|
|
$
|
0
|
|
$
|
4,757
|
|
$
|
4,757
|
|
|||
|
Foreclosed real estate
|
|||||||||||||||
|
Residential
|
$
|
0
|
|
$
|
0
|
|
$
|
101
|
|
$
|
101
|
|
|||
|
Commercial and land development
|
0
|
|
0
|
|
74
|
|
74
|
|
|||||||
|
Total foreclosed real estate
|
$
|
0
|
|
$
|
0
|
|
$
|
175
|
|
$
|
175
|
|
|||
|
December 31, 2014
|
|||||||||||||||
|
Impaired loans
|
|||||||||||||||
|
Commercial real estate:
|
|||||||||||||||
|
Owner-occupied
|
$
|
0
|
|
$
|
0
|
|
$
|
1,228
|
|
$
|
1,228
|
|
|||
|
Non-owner occupied
|
0
|
|
0
|
|
192
|
|
192
|
|
|||||||
|
Multi-family
|
0
|
|
0
|
|
92
|
|
92
|
|
|||||||
|
Non-owner occupied residential
|
0
|
|
0
|
|
937
|
|
937
|
|
|||||||
|
Acquisition and development:
|
|||||||||||||||
|
Commercial and land development
|
0
|
|
0
|
|
117
|
|
117
|
|
|||||||
|
Commercial and industrial
|
0
|
|
0
|
|
29
|
|
29
|
|
|||||||
|
Residential mortgage:
|
|||||||||||||||
|
First lien
|
0
|
|
0
|
|
2,022
|
|
2,022
|
|
|||||||
|
Home equity - lines of credit
|
0
|
|
0
|
|
229
|
|
229
|
|
|||||||
|
Installment and other loans
|
0
|
|
0
|
|
13
|
|
13
|
|
|||||||
|
Total impaired loans
|
$
|
0
|
|
$
|
0
|
|
$
|
4,859
|
|
$
|
4,859
|
|
|||
|
Foreclosed real estate
|
|||||||||||||||
|
Residential
|
$
|
0
|
|
$
|
0
|
|
$
|
217
|
|
$
|
217
|
|
|||
|
Commercial and land development
|
0
|
|
0
|
|
569
|
|
569
|
|
|||||||
|
Total foreclosed real estate
|
$
|
0
|
|
$
|
0
|
|
$
|
786
|
|
$
|
786
|
|
|||
104
The following table presents additional qualitative information about assets measured on a nonrecurring basis and for which the Company has utilized Level 3 inputs to determine fair value:
|
Fair Value
Estimate
|
Valuation Techniques
|
Unobservable Input
|
Range
|
||||||
|
December 31, 2015
|
|||||||||
|
Impaired loans
|
$
|
4,757
|
|
Appraisal of collateral
|
Management adjustments on appraisals for property type and recent activity
|
0% - 70% discount
|
|||
|
Management adjustments for liquidation expenses
|
6% - 44% discount
|
||||||||
|
Foreclosed real estate
|
175
|
|
Appraisal of collateral
|
Management adjustments on appraisals for property type and recent activity
|
10% - 20% discount
|
||||
|
Management adjustments for liquidation expenses
|
5% - 6% discount
|
||||||||
|
December 31, 2014
|
|||||||||
|
Impaired loans
|
$
|
4,859
|
|
Appraisal of collateral
|
Management adjustments on appraisals for property type and recent activity
|
0% - 30% discount
|
|||
|
Management adjustments for liquidation expenses
|
5% - 10% discount
|
||||||||
|
Foreclosed real estate
|
786
|
|
Appraisal of collateral
|
Management adjustments on appraisals for property type and recent activity
|
0% - 5% discount
|
||||
|
Management adjustments for liquidation expenses
|
6% - 18% discount
|
||||||||
Fair values of financial instruments
In addition to those disclosed above, the following methods and assumptions were used by the Company in estimating fair values of financial instruments as disclosed herein:
Cash and Due from Banks and Interest Bearing Deposits with Banks
The carrying amounts of cash and due from banks and interest bearing deposits with banks approximate their fair value.
Loans Held for Sale
Loans held for sale are carried at the lower of cost or fair value. These loans typically consist of one-to-four family residential loans originated for sale in the secondary market. Fair value is based on the price secondary markets are currently offering for similar loans using observable market data which is not materially different than cost due to the short duration between origination and sale.
Loans Receivable
For variable-rate loans that reprice frequently and have no significant change in credit risk, fair values are based on carrying values. Fair values for fixed rate loans are estimated using discounted cash flow analyses, using interest rates currently being offered in the market for loans with similar terms to borrowers of similar credit quality.
Restricted Investments in Bank Stocks
These investments are carried at cost. The Company is required to maintain minimum investment balances in these stocks, which are not actively traded and therefore have no readily determinable market value.
105
Deposits
The fair values disclosed for demand deposits are, by definition, equal to the amount payable on demand at the reporting date (that is, their carrying amounts). The carrying amounts of variable-rate, fixed-term money market accounts and certificates of deposit approximate their fair values at the reporting date. Fair values for fixed-rate certificates of deposits and IRAs are estimated using a discounted cash flow calculation that applies interest rates currently being offered in the market to a schedule of aggregated expected maturities on time deposits.
Short-Term Borrowings
The carrying amounts of federal funds purchased, borrowings under Repurchase Agreements, and other short-term borrowings maturing within
90 days
approximate their fair values. Fair values of other short-term borrowings are estimated using discounted cash flow analyses based on the Company’s current borrowing rates for similar types of borrowing arrangements.
Long-Term Debt
The fair value of the Company’s fixed rate long-term borrowings is estimated using a discounted cash flow analysis based on the Company’s current incremental borrowing rate for similar types of borrowing arrangements. The carrying amounts of variable-rate long-term borrowings approximate their fair values at the reporting date.
Accrued Interest
The carrying amounts of accrued interest receivable and payable approximate their fair values.
Off-Balance-Sheet Instruments
The Company generally does not charge commitment fees. Fees for standby letters of credit and other off-balance-sheet instruments are not significant.
106
The estimated fair values of the Company’s financial instruments were as follows at December 31:
|
(Dollars in thousands)
|
Carrying
Amount
|
Fair Value
|
Level 1
|
Level 2
|
Level 3
|
||||||||||||||
|
December 31, 2015
|
|||||||||||||||||||
|
Financial Assets
|
|||||||||||||||||||
|
Cash and due from banks
|
$
|
11,412
|
|
$
|
11,412
|
|
$
|
11,412
|
|
$
|
0
|
|
$
|
0
|
|
||||
|
Interest bearing deposits with banks
|
16,928
|
|
16,928
|
|
16,928
|
|
0
|
|
0
|
|
|||||||||
|
Restricted investments in bank stock
|
8,720
|
|
n/a
|
|
n/a
|
|
n/a
|
|
n/a
|
|
|||||||||
|
Securities available for sale
|
394,124
|
|
394,124
|
|
0
|
|
394,124
|
|
0
|
|
|||||||||
|
Loans held for sale
|
5,917
|
|
6,045
|
|
0
|
|
6,045
|
|
0
|
|
|||||||||
|
Loans, net of allowance for loan losses
|
768,145
|
|
776,067
|
|
0
|
|
0
|
|
776,067
|
|
|||||||||
|
Accrued interest receivable
|
3,845
|
|
3,845
|
|
0
|
|
2,257
|
|
1,588
|
|
|||||||||
|
Financial Liabilities
|
|||||||||||||||||||
|
Deposits
|
1,032,167
|
|
1,032,265
|
|
0
|
|
1,032,265
|
|
0
|
|
|||||||||
|
Short-term borrowings
|
89,156
|
|
89,156
|
|
0
|
|
89,156
|
|
0
|
|
|||||||||
|
Long-term debt
|
24,495
|
|
25,357
|
|
0
|
|
25,357
|
|
0
|
|
|||||||||
|
Accrued interest payable
|
366
|
|
366
|
|
0
|
|
366
|
|
0
|
|
|||||||||
|
Off-balance sheet instruments
|
0
|
|
0
|
|
0
|
|
0
|
|
0
|
|
|||||||||
|
December 31, 2014
|
|||||||||||||||||||
|
Financial Assets
|
|||||||||||||||||||
|
Cash and due from banks
|
$
|
18,174
|
|
$
|
18,174
|
|
$
|
18,174
|
|
$
|
0
|
|
$
|
0
|
|
||||
|
Interest bearing deposits with banks
|
13,235
|
|
13,235
|
|
13,235
|
|
0
|
|
0
|
|
|||||||||
|
Restricted investments in bank stock
|
8,350
|
|
n/a
|
|
n/a
|
|
n/a
|
|
n/a
|
|
|||||||||
|
Securities available for sale
|
376,199
|
|
376,199
|
|
0
|
|
376,199
|
|
0
|
|
|||||||||
|
Loans held for sale
|
3,159
|
|
3,249
|
|
0
|
|
3,249
|
|
0
|
|
|||||||||
|
Loans, net of allowance for loan losses
|
690,199
|
|
697,506
|
|
0
|
|
0
|
|
697,506
|
|
|||||||||
|
Accrued interest receivable
|
3,097
|
|
3,097
|
|
0
|
|
1,593
|
|
1,504
|
|
|||||||||
|
Financial Liabilities
|
|||||||||||||||||||
|
Deposits
|
949,704
|
|
950,667
|
|
0
|
|
950,667
|
|
0
|
|
|||||||||
|
Short-term borrowings
|
86,742
|
|
86,742
|
|
0
|
|
86,742
|
|
0
|
|
|||||||||
|
Long-term debt
|
14,812
|
|
15,610
|
|
0
|
|
15,610
|
|
0
|
|
|||||||||
|
Accrued interest payable
|
273
|
|
273
|
|
0
|
|
273
|
|
0
|
|
|||||||||
|
Off-balance sheet instruments
|
0
|
|
0
|
|
0
|
|
0
|
|
0
|
|
|||||||||
107
The following are the condensed balance sheets, statements of income, statements of comprehensive income (loss) and statements of cash flows for the parent company, as of or for the years ended December 31:
Balance Sheet
|
(Dollars in thousands)
|
2015
|
2014
|
|||||
|
Assets
|
|||||||
|
Cash in Orrstown Bank
|
$
|
14,032
|
|
$
|
389
|
|
|
|
Deposits with other banks
|
321
|
|
0
|
|
|||
|
Securities available for sale
|
73
|
|
67
|
|
|||
|
Investment in Orrstown Bank
|
117,163
|
|
126,084
|
|
|||
|
Other assets
|
1,561
|
|
797
|
|
|||
|
Total assets
|
$
|
133,150
|
|
$
|
127,337
|
|
|
|
Liabilities
|
$
|
89
|
|
$
|
72
|
|
|
|
Shareholders’ Equity
|
|||||||
|
Common stock
|
435
|
|
430
|
|
|||
|
Additional paid-in capital
|
124,317
|
|
123,392
|
|
|||
|
Retained earnings
|
7,939
|
|
1,887
|
|
|||
|
Accumulated other comprehensive income
|
1,199
|
|
1,576
|
|
|||
|
Treasury stock
|
(829
|
)
|
(20
|
)
|
|||
|
Total shareholders’ equity
|
133,061
|
|
127,265
|
|
|||
|
Total liabilities and shareholders’ equity
|
$
|
133,150
|
|
$
|
127,337
|
|
|
Statements of Income
|
(Dollars in thousands)
|
2015
|
2014
|
2013
|
||||||||
|
Income
|
|||||||||||
|
Dividends from bank subsidiary
|
$
|
17,900
|
|
$
|
0
|
|
$
|
0
|
|
||
|
Other interest and dividend income
|
3
|
|
2
|
|
5
|
|
|||||
|
Other income
|
35
|
|
70
|
|
46
|
|
|||||
|
Total income
|
17,938
|
|
72
|
|
51
|
|
|||||
|
Expenses
|
|||||||||||
|
Share-based compensation
|
34
|
|
17
|
|
129
|
|
|||||
|
Management fee to Bank
|
500
|
|
277
|
|
173
|
|
|||||
|
Other expenses
|
1,821
|
|
1,042
|
|
1,241
|
|
|||||
|
Total expenses
|
2,355
|
|
1,336
|
|
1,543
|
|
|||||
|
Income (loss) before income taxes and equity in undistributed income or distributions in excess of income of bank subsidiary
|
15,583
|
|
(1,264
|
)
|
(1,492
|
)
|
|||||
|
Income tax benefit
|
(831
|
)
|
(474
|
)
|
(477
|
)
|
|||||
|
Income (loss) before equity in undistributed income (distributions in excess of income) of bank subsidiary
|
16,414
|
|
(790
|
)
|
(1,015
|
)
|
|||||
|
Equity in undistributed income (distributions in excess of income) of bank subsidiary
|
(8,540
|
)
|
29,932
|
|
11,019
|
|
|||||
|
Net income
|
$
|
7,874
|
|
$
|
29,142
|
|
$
|
10,004
|
|
||
108
Statements of Comprehensive Income
|
(Dollars in thousands)
|
2015
|
2014
|
2013
|
||||||||
|
Income (loss) before equity in undistributed income of subsidiary
|
$
|
16,414
|
|
$
|
(790
|
)
|
$
|
(1,015
|
)
|
||
|
Unrealized holding gains (losses) on securities available for sale arising during the period, net of tax
|
4
|
|
(1
|
)
|
0
|
|
|||||
|
Total other comprehensive income (loss)
|
4
|
|
(1
|
)
|
0
|
|
|||||
|
Comprehensive income (loss) before equity in undistributed income and other comprehensive income of subsidiary
|
16,418
|
|
(791
|
)
|
(1,015
|
)
|
|||||
|
Equity in undistributed income and other comprehensive income of subsidiary
|
(8,921
|
)
|
36,322
|
|
4,378
|
|
|||||
|
Total comprehensive income
|
$
|
7,497
|
|
$
|
35,531
|
|
$
|
3,363
|
|
||
Statements of Cash Flows
|
(Dollars in thousands)
|
2015
|
2014
|
2013
|
||||||||
|
Cash flows from operating activities:
|
|||||||||||
|
Net income
|
$
|
7,874
|
|
$
|
29,142
|
|
$
|
10,004
|
|
||
|
Adjustments to reconcile net income to cash used in operating activities:
|
|||||||||||
|
Deferred income taxes
|
(53
|
)
|
(25
|
)
|
0
|
|
|||||
|
Gains on affiliate dissolution
|
0
|
|
(54
|
)
|
0
|
|
|||||
|
Equity in (undistributed income) distributions in excess of income of bank subsidiary
|
8,540
|
|
(29,932
|
)
|
(11,019
|
)
|
|||||
|
Share-based compensation
|
34
|
|
17
|
|
129
|
|
|||||
|
Net change in other liabilities
|
17
|
|
(26
|
)
|
62
|
|
|||||
|
Other, net
|
(611
|
)
|
(270
|
)
|
(182
|
)
|
|||||
|
Net cash provided by (used in) operating activities
|
15,801
|
|
(1,148
|
)
|
(1,006
|
)
|
|||||
|
Cash flows from investing activities:
|
|||||||||||
|
Investment in bank subsidiary
|
0
|
|
(161
|
)
|
0
|
|
|||||
|
Other
|
0
|
|
89
|
|
0
|
|
|||||
|
Net cash used in investing activities
|
0
|
|
(72
|
)
|
0
|
|
|||||
|
Cash flows from financing activities:
|
|||||||||||
|
Dividends paid
|
(1,822
|
)
|
0
|
|
0
|
|
|||||
|
Proceeds from issuance of common stock
|
794
|
|
105
|
|
253
|
|
|||||
|
Payments to repurchase common stock
|
(809
|
)
|
0
|
|
0
|
|
|||||
|
Net cash provided by (used in) financing activities
|
(1,837
|
)
|
105
|
|
253
|
|
|||||
|
Net increase (decrease) in cash
|
13,964
|
|
(1,115
|
)
|
(753
|
)
|
|||||
|
Cash, beginning balance
|
389
|
|
1,504
|
|
2,257
|
|
|||||
|
Cash, ending balance
|
$
|
14,353
|
|
$
|
389
|
|
$
|
1,504
|
|
||
109
The nature of the Company’s business generates a certain amount of litigation involving matters arising out of the ordinary course of business. Except as described below, in the opinion of management, there are
no
legal proceedings that might have a material effect on the results of operations, liquidity, or the financial position of the Company at this time.
The Company, the Bank and certain current and former directors and executive officers (collectively, “Orrstown Defendants”) are defendants in a putative class action filed by Southeastern Pennsylvania Transportation Authority (“SEPTA”) on May 25, 2012, in the United States District Court for the Middle District of Pennsylvania. In a later amended complaint, the list of defendants was expanded to include the Company’s independent registered public accounting firm and the underwriters of the Company’s March 2010 public offering of common stock. The complaint, as amended, alleges among other things that (i) in connection with the Company’s Registration Statement on Form S-3 dated February 23, 2010 and its Prospectus Supplement dated March 23, 2010, and (ii) during the purported class period of March 15, 2010 through April 5, 2012, the Company issued materially false and misleading statements regarding the Company’s lending practices and financial results, including misleading statements concerning the stringent nature of the Bank’s credit practices and underwriting standards, the quality of its loan portfolio, and the intended use of the proceeds from the Company’s March 2010 public offering of common stock. The complaint asserts claims under Sections 11, 12(a) and 15 of the Securities Act of 1933, Sections 10(b) and 20(a) of the Securities Exchange Act of 1934 and Rule 10b-5 promulgated thereunder, and seeks class certification, unspecified money damages, interest, costs, fees and equitable or injunctive relief.
On June 22, 2015, the Court dismissed without prejudice SEPTA’s amended complaint against all defendants, finding that SEPTA failed to state a claim under either the Securities Act of 1933, as amended, or the Securities Exchange Act of 1934, as amended. The Court ordered that, within
30
days, SEPTA either seek leave to amend its amended complaint, accompanied by the proposed amendment, or file a notice of its intention to stand on the amended complaint.
On July 22, 2015, SEPTA filed a motion for leave to amend under Local Rule 15.1, as allowed by the Court’s ruling on June 22, 2015. Many of the allegations of the proposed second amended complaint are essentially the same or similar to the allegations of the dismissed amended complaint. The proposed second amended complaint also alleges that the Orrstown Defendants did not publicly disclose certain alleged failures of internal controls over loan underwriting, risk management, and financial reporting during the period 2009 to 2012, in violation of the federal securities laws. On February 8, 2016, the Court granted SEPTA’s motion for leave to amend and SEPTA filed its second amended complaint that same day.
On February 25, 2016, the Court issued a scheduling Order directing: all defendants to file any motions to dismiss by March 18, 2016; SEPTA to file an omnibus opposition to defendants’ motions to dismiss by April 8, 2016; and all defendants to file reply briefs in support of their motions to dismiss by April 22, 2016. The Order stays all discovery and other deadlines in the case (including the filing of SEPTA’s motion for class certification) pending the outcome of the motions to dismiss.
The Company believes that the allegations of SEPTA’s second amended complaint are without merit and intends to vigorously defend itself against those claims.
Given the litigation is still in the pleading stage, it is not possible at this time to estimate reasonably possible losses, or even a range of reasonably possible losses, in connection with the litigation.
110
Not applicable.
Evaluation of Disclosure Controls and Procedures
The Company’s Chief Executive Officer and Chief Financial Officer have evaluated the effectiveness of the Company’s disclosure controls and procedures (as such term is defined in Rule 13a-15(e) under the Securities Exchange Act of 1934, as amended (the “Exchange Act”)) as of
December 31, 2015
. Based on such evaluation, such officers have concluded that the Company’s disclosure controls and procedures were designed and functioning effectively, as of
December 31, 2015
, to provide reasonable assurance that the information required to be disclosed by the Company in reports filed under the Securities Exchange Act of 1934, as amended, is (i) recorded, processed, summarized and reported within the time periods specified in the SEC’s rules and forms and (ii) accumulated and communicated to our management, including the Chief Executive Officer and Chief Financial Officer, as appropriate to allow timely decisions regarding disclosure.
(a) Management’s Report on Internal Control Over Financial Reporting
Management’s Report on Internal Control Over Financial Reporting for
December 31, 2015
, is included in Item 8 of this Form 10-K and is incorporated by reference into this Item 9A. The audit report of the registered public accounting firm on internal control over financial reporting is included in Item 8 of this 10-K report and is incorporated by reference into this Item 9A.
(b) Changes in Internal Controls Over Financial Reporting:
During the three months ended
December 31, 2015
, there were no changes in our internal control over financial reporting that have materially affected or are reasonably likely to materially affect, our internal control over financial reporting.
The Company had no other events that should have been disclosed on Form 8-K that were not already disclosed on such forms.
111
The Company has adopted a code of ethics that applies to all senior financial officers (including its chief executive officer, chief financial officer, chief accounting officer, and any person performing similar functions). The Company’s Code of Ethics for Senior Financial Officers is available on the Bank’s website at
http://www.orrstown.com
. Any amendments or waivers to the Company’s Code of Ethics for Senior Financial Officers will be posted to the website in a timely manner.
All other information required by Item 10, is incorporated, by reference, from the Company’s definitive proxy statement for the
2016
Annual Meeting of Shareholders filed pursuant to Regulation 14A, under Section 16(a) Beneficial Ownership Reporting Compliance and Proposal 1 – Election of Directors – Biographical Summaries of Nominees and Directors; Information About Executive Officers; and Proposal 1 – Election of Directors – Nomination of Directors, and Board Structure, Committees and Meeting Attendance.
The information required by Item 11 is incorporated by reference from the Company’s definitive proxy statement for the
2016
Annual Meeting of Shareholders filed pursuant to Regulation 14A, under Proposal 1 – Election of Directors – Compensation of Directors, Compensation Discussion and Analysis, Compensation Committee Report, Executive Compensation Tables, Potential Payments Upon Termination or Change in Control and Compensation Committee Interlocks and Insider Participation.
Equity Compensation Plan Information as of
December 31, 2015
|
Plan Category
|
Number of securities to be
issued upon exercise of
outstanding options,
warrants and rights
|
Weighted-
average exercise
price of outstanding
options, warrants and
rights
|
Number of securities
remaining available for
future issuance under
equity compensation
plans (excluding
securities reflected in
column (a))
|
||||||
|
|
(a)
|
(b)
|
(c)
|
||||||
|
Equity compensation plan approved by security holders
|
84,976
|
|
$
|
28.67
|
|
179,407
|
|
||
|
Equity compensation plan not approved by security holders (1)
|
16,484
|
|
28.96
|
|
0
|
|
|||
|
Total
|
101,460
|
|
$
|
28.72
|
|
179,407
|
|
||
|
(1)
|
Awards from the Non-Employee Director Stock Option Plan of 2000. Certain options granted remain outstanding from this plan, however no additional options will be granted under this plan.
|
All other information required by Item 12 is incorporated, by reference, from the Company’s definitive proxy statement for the
2016
Annual Meeting of Shareholders filed pursuant to Regulation 14A, under Share Ownership of Management.
The information required by Item 13 is incorporated by reference from the Company’s definitive proxy statement for the
2016
Annual Meeting of Shareholders filed pursuant to Regulation 14A, under Proposal 1 – Election of Directors – Director Independence, and Transactions with Related Persons, Promoters and Certain Control Persons.
The information required by Item 14 is incorporated by reference from the Company’s definitive proxy statement for the
2016
Annual Meeting of Shareholders filed pursuant to Regulation 14A, under Proposal 3 – Ratification of the Audit Committee’s Selection of Crowe Horwath, LLP as the Company’s Independent Registered Public Accounting Firm for the Fiscal Year Ending December 31, 2016 – Relationship with Independent Registered Public Accounting Firm.
112
|
(a)
|
The following documents are filed as part of this report:
|
(1) – Financial Statements
Consolidated financial statements of the Company and its subsidiary required in response to this Item are incorporated by reference from Item 8 of this report.
(2) – Financial Statement Schedules
All financial statement schedules for which provision is made in the applicable accounting regulations of the Securities and Exchange Commission are not required under the related instructions or are inapplicable and therefore have been omitted.
(3) – Exhibits
|
3.1
|
|
Articles of Incorporation as amended, incorporated by reference to Exhibit 3.1 of the Registrant’s Report on Form 8-K filed on January 29, 2010.
|
|
3.2
|
|
By-laws as amended, incorporated by reference to Exhibit 3.1 to the Registrant’s Report on Form 8-K filed March 1, 2013.
|
|
4.1
|
|
Specimen Common Stock Certificate, incorporated by reference to the Registrant’s Registration Statement on Form S-3 filed February 8, 2010 (File No. 333-164780).
|
|
10.1(a)
|
|
Form of Change in Control Agreement for selected officers – incorporated by reference to Exhibit 10.1 of the Registrant’s Form 8-K filed May 14, 2008.
|
|
10.1(b)
|
|
Change in Control Agreement between Orrstown Financial Services, Inc., Orrstown Bank and Thomas R. Quinn, Jr. incorporated by reference to Exhibit 10.2 of the Registrant’s Form 8-K filed June 8, 2015.
|
|
10.1(c)
|
Change in Control Agreement between Orrstown Financial Services, Inc., Orrstown Bank and David Boyle, incorporated by reference to Exhibit 10.2 to the Registrant's Form 8-K filed June 2, 2015.
|
|
|
10.1(d)
|
Change in Control Agreement between Orrstown Financial Services, Inc., Orrstown Bank and Philip E. Fague, incorporated by reference to Exhibit 10.4 to the Registrant's Form 8-K filed June 2, 2015.
|
|
|
10.1(e)
|
Change in Control Agreement between Orrstown Financial Services, Inc., Orrstown Bank and Benjamin W. Wallace, incorporated by reference to Exhibit 10.6 to the Registrant's Form 8-K filed June 2, 2015.
|
|
|
10.1(f)
|
Change in Control Agreement between Orrstown Financial Services, Inc., Orrstown Bank and Robert G. Coradi, incorporated by reference to Exhibit 10.8 to the Registrant's Form 8-K filed June 2, 2015.
|
|
|
10.1(g)
|
Change in Control Agreement between Orrstown Financial Services, Inc., Orrstown Bank and Barbara E. Brobst, incorporated by reference to Exhibit 10.10 to the Registrant's Form 8-K filed June 2, 2015.
|
|
|
10.2(a)
|
|
Amended and Restated Salary Continuation Agreement between Orrstown Bank and Kenneth R. Shoemaker, incorporated by reference to Exhibit 10.2 (a) of the Registrant’s Form 10-K filed March 15, 2010.
|
|
10.2(b)
|
|
Amended and Restated Salary Continuation Agreement between Orrstown Bank and Phillip E. Fague, incorporated by reference to Exhibit 10.2 (b) of the Registrant’s Form 10-K filed March 15, 2010.
|
|
10.2(c)
|
|
Salary Continuation Agreement between Orrstown Bank and Thomas R. Quinn, Jr. – incorporated by reference to Exhibit 10.1 to the Registrant’s Form 8-K filed January 8, 2010.
|
|
10.2(d)
|
Salary Continuation Agreement between Orrstown Bank and David P. Boyle – incorporated by reference to Exhibit 10.1 to the Registrant’s Form 8-K filed July 17, 2015.
|
|
|
10.3
|
|
Officer group term replacement plan for selected officers – incorporated by reference to Exhibit 10.2 to Registrant’s Form 10-K for the year ended December 31, 1999 filed March 26, 2000.
|
|
10.4(a)
|
|
Director Retirement Agreement, as amended, between Orrstown Bank and Anthony F. Ceddia, incorporated by reference to Exhibit 10.4(a) to the Registrant’s Form 10-K filed March 15, 2010.
|
|
10.4(b)
|
|
Director Retirement Agreement, as amended, between Orrstown Bank and Jeffrey W. Coy, incorporated by reference to Exhibit 10.4(b) to the Registrant’s Form 10-K filed March 15, 2010.
|
|
10.4(c)
|
|
Director Retirement Agreement, as amended, between Orrstown Bank and Andrea Pugh, incorporated by reference to Exhibit 10.4(c) to the Registrant’s Form 10-K filed March 15, 2010.
|
113
|
10.4(d)
|
|
Director Retirement Agreement, as amended, between Orrstown Bank and Gregory A. Rosenberry, incorporated by reference to Exhibit 10.4(d) to the Registrant’s Form 10-K filed March 15, 2010.
|
|
10.4(e)
|
|
Director Retirement Agreement, as amended, between Orrstown Bank and Kenneth R. Shoemaker, incorporated by reference to Exhibit 10.4(e) to the Registrant’s Form 10-K filed March 15, 2010.
|
|
10.4(f)
|
|
Director Retirement Agreement, as amended, between Orrstown Bank and Glenn W. Snoke, incorporated by reference to Exhibit 10.4(f) to the Registrant’s Form 10-K filed March 15, 2010.
|
|
10.4(g)
|
|
Director Retirement Agreement, as amended, between Orrstown Bank and John S. Ward, incorporated by reference to Exhibit 10.4(g) to the Registrant’s Form 10-K filed March 15, 2010.
|
|
10.4(h)
|
|
Director Retirement Agreement, as amended, between Orrstown Bank and Joel R. Zullinger, incorporated by reference to Exhibit 10.4(h) to the Registrant’s Form 10-K filed March 15, 2010.
|
|
10.5
|
|
Revenue neutral retirement plan – incorporated by reference to Exhibit 10.4 to the Registrant’s Form 10-K for the year ended December 31, 1999 filed March 28, 2000.
|
|
10.6
|
|
Non-employee director stock option plan of 2000 – incorporated by reference to the Registrant’s registration statement on Form S-8 filed March 31, 2000.
|
|
10.7
|
|
Employee stock option plan of 2000 – incorporated by reference to the Registrant’s registration statement on Form S-8 filed March 31, 2000.
|
|
10.8
|
|
2011 Orrstown Financial Services, Inc. Stock Incentive Plan – incorporated by reference to Exhibit 10.1 of the Registrant’s registration statement on Form S-8 filed June 6, 2011.
|
|
10.9(a)
|
|
Employment Agreement between Orrstown Financial Services, Inc., Orrstown Bank and Thomas R. Quinn, Jr. incorporated by reference to Exhibit 10.1 to Registrant’s Form 8-K filed June 8, 2015.
|
|
10.9(b)
|
Employment Agreement between Orrstown Financial Services, Inc., Orrstown Bank and David Boyle, incorporated by reference to Exhibit 10.1 to the Registrant's Form 8-K filed June 2, 2015.
|
|
|
10.9(c)
|
Employment Agreement between Orrstown Financial Services, Inc., Orrstown Bank and Philip E. Fague, incorporated by reference to Exhibit 10.3 to the Registrant's Form 8-K filed June 2, 2015.
|
|
|
10.9(d)
|
Employment Agreement between Orrstown Financial Services, Inc., Orrstown Bank and Benjamin W. Wallace, incorporated by reference to Exhibit 10.5 to the Registrant's Form 8-K filed June 2, 2015.
|
|
|
10.9(e)
|
Employment Agreement between Orrstown Financial Services, Inc., Orrstown Bank and Robert G. Coradi, incorporated by reference to Exhibit 10.7 to the Registrant's Form 8-K filed June 2, 2015.
|
|
|
10.9(f)
|
Employment Agreement between Orrstown Financial Services, Inc., Orrstown Bank and Barbara E. Brobst, incorporated by reference to Exhibit 10.9 to the Registrant's Form 8-K filed June 2, 2015.
|
|
|
10.10
|
|
Brick Plan – Deferred Income Agreement between Orrstown Bank and Joel R. Zullinger, incorporated by reference to Exhibit 10.11 to the Registrant’s Form 10-K filed March 15, 2010.
|
|
10.11
|
|
Form of Executive Employment Agreement for selected officers – incorporated by reference to Exhibit 10.1 to Registrant’s Form 8-K filed January 22, 2010.
|
|
10.12(a)
|
|
Director/Executive Officer Deferred Compensation Plan, incorporated by reference to Exhibit 10.13(a) to the Registrant’s Form 10-K filed March 15, 2010.
|
|
10.12(b)
|
|
Trust Agreement for Director/Executive Officer Deferred Compensation Plan, incorporated by reference to Exhibit 10.13(b) to the Registrant’s Form 10-K filed March 15, 2010.
|
|
10.14
|
|
Form of Restricted Share Grant Agreement, issued to certain employees on August 15, 2014, incorporated by reference to Exhibit 10.1 to the Registrant's Form 10-Q filed November 7, 2014.
|
|
14
|
|
Code of Ethics Policy for Senior Financial Officers posted on Registrant’s website.
|
|
21
|
|
Subsidiaries of the registrant
|
|
23.1
|
|
Consent of Crowe Horwath LLP, Independent Registered Public Accounting Firm
|
|
23.2
|
|
Consent of Smith Elliott Kearns & Company, LLC, Independent Registered Public Accounting Firm
|
|
31.1
|
|
Rule 13a – 14(a)/15d-14(a) Certification (Chief Executive Officer)
|
|
31.2
|
|
Rule 13a – 14(a)/15d-14(a) Certifications (Chief Financial Officer)
|
|
32.1
|
|
Section 1350 Certifications (Chief Executive Officer)
|
|
32.2
|
|
Section 1350 Certifications (Chief Financial Officer)
|
114
|
101.LAB
|
|
XBRL Taxonomy Extension Label Linkbase
|
|
101.PRE
|
|
XBRL Taxonomy Extension Presentation Linkbase
|
|
101.INS
|
|
XBRL Instance Document
|
|
101.SCH
|
|
XBRL Taxonomy Extension Schema
|
|
101.CAL
|
|
XBRL Taxonomy Extension Calculation Linkbase
|
|
101.DEF
|
|
XBRL Taxonomy Extension Definition Linkbase
|
All other exhibits for which provision is made in the applicable accounting regulations of the Securities and Exchange Commission are not required under the related instructions or are inapplicable and therefore have been omitted.
|
(b)
|
Exhibits – The exhibits to this Form 10-K begin after the signature page.
|
|
(c)
|
Financial statement schedules – None required.
|
115
SIGNATURES
Pursuant to the requirements of Section 13 or 15(d) of the Securities Exchange Act of 1934, the registrant has duly caused this report to be signed on its behalf by the undersigned, thereunto duly authorized.
|
|
ORRSTOWN FINANCIAL SERVICES, INC.
(Registrant)
|
||
|
Dated: March 11, 2016
|
|
By:
|
/s/ Thomas R. Quinn, Jr.
|
|
|
Thomas R. Quinn, Jr., President and Chief Executive Officer
|
||
116
Pursuant to the requirements of Section 13 or 15(d) of the Securities Exchange Act of 1934, this report has been signed below by the following persons on behalf of the registrant and in the capacities and on the dates indicated.
|
Signature
|
|
Title
|
|
Date
|
|
/s/ Thomas R. Quinn, Jr.
|
|
President and Chief Executive Officer (Principal Executive Officer) and Director
|
|
March 11, 2016
|
|
Thomas R. Quinn, Jr.
|
||||
|
/s/ David P. Boyle
|
|
Executive Vice President and Chief Financial Officer (Principal Financial Officer)
|
|
March 11, 2016
|
|
David P. Boyle
|
||||
|
/s/ Douglas P. Barton
|
|
Senior Vice President and Chief Accounting Officer (Principal Accounting Officer)
|
|
March 11, 2016
|
|
Douglas P. Barton
|
||||
|
/s/ Joel R. Zullinger
|
|
Chairman of the Board and Director
|
|
March 11, 2016
|
|
Joel R. Zullinger
|
||||
|
/s/ Jeffrey W. Coy
|
|
Vice Chairman of the Board and Director
|
|
March 11, 2016
|
|
Jeffrey W. Coy
|
||||
|
/s/ Dr. Anthony F. Ceddia
|
|
Secretary of the Board and Director
|
|
March 11, 2016
|
|
Dr. Anthony F. Ceddia
|
||||
|
/s/ Cindy J. Joiner
|
|
Director
|
March 11, 2016
|
|
|
Cindy J. Joiner
|
||||
|
/s/ Mark K. Keller
|
|
Director
|
|
March 11, 2016
|
|
Mark K. Keller
|
||||
|
/s/ Thomas D. Longenecker
|
|
Director
|
March 11, 2016
|
|
|
Thomas D. Longenecker
|
||||
|
/s/ Andrea Pugh
|
|
Director
|
|
March 11, 2016
|
|
Andrea Pugh
|
||||
|
/s/ Gregory A. Rosenberry
|
|
Director
|
|
March 11, 2016
|
|
Gregory A. Rosenberry
|
||||
|
/s/ Eric A. Segal
|
|
Director
|
|
March 11, 2016
|
|
Eric A. Segal
|
||||
|
/s/ Glenn W. Snoke
|
|
Director
|
|
March 11, 2016
|
|
Glenn W. Snoke
|
||||
|
/s/ Floyd E. Stoner
|
|
Director
|
|
March 11, 2016
|
|
Floyd E. Stoner
|
||||
117
TABLE OF CONTENTS
Part IItem 1 BusinessItem 1A Risk FactorsItem 1B Unresolved Staff CommentsItem 2 PropertiesItem 3 Legal ProceedingsItem 4 Mine Safety DisclosuresPart IIItem 5 Market For Registrant S Common Equity, Related Stockholder Matters and Issuer Purchases Of Equity SecuritiesItem 6 Selected Financial DataItem 7 Management S Discussion and Analysis Of Financial Condition and Results Of OperationsItem 7A Quantitative and Qualitative Disclosures About Market RiskItem 8 Financial Statements and Supplementary DataNote 1. Summary Of Significant Accounting PoliciesNote 2. Restrictions on Cash and Due From BanksNote 3. Securities Available For SaleNote 4. Loans Receivable and Allowance For Loan LossesNote 5. Loans To Related PartiesNote 6. Premises and EquipmentNote 7. Intangible AssetsNote 8. Income TaxesNote 9. Retirement PlansNote 10. Share Based Compensation PlansNote 11. DepositsNote 12. Short-term BorrowingsNote 13. Long-term DebtNote 14. Shareholders Equity and Regulatory CapitalNote 15. Restrictions on Dividends, Loans and AdvancesNote 16. Earnings Per ShareNote 17. Financial Instruments with Off-balance-sheet RiskNote 18. Fair Value DisclosuresNote 19. Orrstown Financial Services, Inc. (parent Company Only) Financial InformationNote 20 ContingenciesItem 9 Changes in and Disagreements with Accountants on Accounting and Financial DisclosureItem 9A Controls and ProceduresItem 9B Other InformationPart IIIItem 10 Directors, Executive Officers and Corporate GovernanceItem 11 Executive CompensationItem 12 Security Ownership Of Certain Beneficial Owners and Management and Related Stockholder MattersItem 13 Certain Relationships and Related Transactions, and Director IndependenceItem 14 Principal Accountant Fees and ServicesPart IVItem 15 Exhibits and Financial Statement Schedules