OPEN TEXT CORP
10-Ks and 10-Qs
UNITED STATES
SECURITIES AND EXCHANGE COMMISSION
Washington, DC 20549
______________________
FORM 10-K
______________________
|
ý
|
ANNUAL REPORT PURSUANT TO SECTION 13 OR 15(d) OF THE SECURITIES EXCHANGE ACT OF 1934
|
For the fiscal year ended
June 30, 2015
.
OR
|
¨
|
TRANSITION REPORT PURSUANT TO SECTION 13 OR 15(d) OF THE SECURITIES EXCHANGE ACT OF 1934
|
For the transition period from to
Commission file number: 0-27544
______________________________________
OPEN TEXT CORPORATION
(Exact name of Registrant as specified in its charter)
|
Canada
|
98-0154400
|
|
(State or other jurisdiction
of incorporation or organization)
|
(IRS Employer
Identification No.)
|
|
275 Frank Tompa Drive,
Waterloo, Ontario, Canada
|
N2L 0A1
|
|
(Address of principal executive offices)
|
(Zip code)
|
Registrant's telephone number, including area code: (519) 888-7111
Securities registered pursuant to Section 12(b) of the Act:
|
Title of each class
|
Name of each exchange on which registered
|
|
Common stock without par value
|
NASDAQ Global Select Market
|
Securities registered pursuant to Section 12(g) of the Act:
None
(Title of Class)
______________________________________
Indicate by check mark if the registrant is a well-known seasoned issuer, as defined in Rule 405 of the Securities Act. Yes
ý
No
¨
Indicate by check mark if the registrant is not required to file reports pursuant to Section 13 or Section 15(d) of the Act. Yes
¨
No
ý
Indicate by check mark whether the registrant: (1) has filed all reports required to be filed by Section 13 or 15(d) of the Securities Exchange Act of 1934 during the preceding 12 months (or for such shorter period that the registrant was required to file such reports), and (2) has been subject to such filing requirements for the past 90 days. Yes
ý
No
¨
Indicate by check mark whether the registrant has submitted electronically and posted on its corporate Web site, if any, every Interactive Data File required to be submitted and posted pursuant to Rule 405 of Regulations S-T (§232.405 of this chapter) during the preceding 12 months (or for such shorter period that the registrant was required to submit and post such files). Yes
ý
No
¨
Indicate by check mark if disclosure of delinquent filers pursuant to item 405 of Regulations S-K (§229.405 of this chapter) is not contained herein, and will not be contained, to the best of registrant's knowledge, in definitive proxy or information statements incorporated by reference in Part III of this Form 10-K or any amendment to this Form 10-K.
ý
Indicate by check mark whether the registrant is a large accelerated filer, an accelerated filer, a non-accelerated filer or a smaller reporting company. See definition of “large accelerated filer”, “accelerated filer” and “smaller reporting company” in Rule 12b-2 of the Exchange Act.
Large accelerated filer
ý
Accelerated filer
¨
Non-accelerated filer
¨
(Do not check if smaller reporting company) Smaller reporting company
¨
Indicate by check mark whether the registrant is a shell company (as defined in Rule 12b-2 of the Exchange Act). Yes
¨
No
x
Aggregate market value of the Registrant's Common Shares held by non-affiliates, based on the closing price of the Common Shares as reported by the NASDAQ Global Select Market (“NASDAQ”) on December 31, 2014, the end of the registrant's most recently completed second fiscal quarter, was approximately $7.0 billion. The number of the Registrant's Common Shares outstanding as of July 27, 2015 was 122,337,654.
DOCUMENTS INCORPORATED BY REFERENCE
None.
1
OPEN TEXT CORPORATION
TABLE OF CONTENTS
|
Page No
|
||
|
Part I
|
||
|
Item 1
|
Business
|
|
|
Item 1A
|
Risk Factors
|
|
|
Item 1B
|
Unresolved Staff Comments
|
|
|
Item 2
|
Properties
|
|
|
Item 3
|
Legal Proceedings
|
|
|
Item 4
|
Mine Safety Disclosures
|
|
|
Part II
|
||
|
Item 5
|
Market for Registrant's Common Equity, Related Stockholder Matters and Issuer Purchases of Equity Securities
|
|
|
Item 6
|
Selected Financial Data
|
|
|
Item 7
|
Management's Discussion and Analysis of Financial Condition and Results of Operation
|
|
|
Item 7A
|
Quantitative and Qualitative Disclosures about Market Risk
|
|
|
Item 8
|
Financial Statements and Supplementary Data
|
|
|
Item 9
|
Changes in and Disagreements With Accountants on Accounting and Financial Disclosure
|
|
|
Item 9A
|
Controls and Procedures
|
|
|
Part III
|
||
|
Item 10
|
Directors, Executive Officers and Corporate Governance
|
|
|
Item 11
|
Executive Compensation
|
|
|
Item 12
|
Security Ownership of Certain Beneficial Owners and Management and Related Stockholder Matters
|
|
|
Item 13
|
Certain Relationships and Related Transactions, and Director Independence
|
|
|
Item 14
|
Principal Accounting Fees and Services
|
|
|
Part IV
|
||
|
Item 15
|
Exhibits and Financial Statement Schedules
|
|
|
Signatures
|
||
2
Forward-Looking Statements
In addition to historical information, this Annual Report on Form 10-K contains forward-looking statements within the meaning of the Private Securities Litigation Reform Act of 1995, Section 21E of the U.S. Securities Exchange Act of 1934, as amended (the Exchange Act), and Section 27A of the U.S. Securities Act of 1933, as amended (the Securities Act), and is subject to the safe harbours created by those sections. Words such as “anticipates”, “expects”, “intends”, “plans”, “believes”, “seeks”, “estimates”, “may”, “could”, “would”, “might”, “will” and variations of these words or similar expressions are intended to identify forward-looking statements. In addition, any statements that refer to expectations, beliefs, plans, projections, objectives, performance or other characterizations of future events or circumstances, including any underlying assumptions, are forward-looking statements. These forward-looking statements involve known and unknown risks as well as uncertainties, including those discussed herein and in the Notes to Consolidated Financial Statements for the year ended June 30, 2015, which are set forth in Part II, Item 8 of this Annual Report. The actual results that we achieve may differ materially from any forward-looking statements, which reflect management's current expectations and projections about future results only as of the date hereof. We undertake no obligation to revise or publicly release the results of any revisions to these forward-looking statements. A number of factors may materially affect our business, financial condition, operating results and prospects. These factors include, but are not limited to, those set forth in Part I, Item 1A “Risk Factors” and elsewhere in this Annual Report as well as other documents we file from time to time with the United States Securities and Exchange Commission (the SEC). Any one of these factors may cause our actual results to differ materially from recent results or from our anticipated future results. You should not rely too heavily on the forward-looking statements contained in this Annual Report on Form 10-K because these forward-looking statements are relevant only as of the date they were made.
Open Text Corporation was incorporated on June 26, 1991. References herein to the “Company”, “OpenText”, “we” or “us” refer to Open Text Corporation and, unless context requires otherwise, its subsidiaries. Our principal office is located at 275 Frank Tompa Drive, Waterloo, Ontario, Canada N2L 0A1, and our telephone number at that location is (519) 888-7111. Our internet address is www.opentext.com. Our website is included in this Annual Report on Form 10-K as an inactive textual reference only. Except for the documents specifically incorporated by reference into this Annual Report, information contained on our website is not incorporated by reference in this Annual Report on Form 10-K and should not be considered to be a part of this Annual Report. Throughout this Annual Report on Form 10-K: (i) the term “Fiscal 2015” means our fiscal year beginning on July 1, 2014 and ending June 30, 2015; (ii) the term “Fiscal 2014” means our fiscal year beginning on July 1, 2013 and ending June 30, 2014; and (iii) the term “Fiscal 2013” means our fiscal year beginning on July 1, 2012 and ending June 30, 2013. Our Consolidated Financial Statements are presented in U.S. dollars and, unless otherwise indicated, all amounts included in this Annual Report on Form 10-K are expressed in U.S. dollars.
Business Overview and Strategy
We are an independent company providing a comprehensive suite of software products and services that assist organizations in finding, utilizing, and sharing business information from any device in ways which are intuitive, efficient and productive. Our technologies and business solutions address one of the biggest problems encountered by enterprises today: the explosive growth of information volume and formats. Our software and services allow organizations to manage the information that flows into, out of, and throughout the enterprise as part of daily operations. Our solutions help to increase customer satisfaction, improve collaboration with partners, address the legal and business requirements associated with information governance, and aim to ensure that information remains secure and private, as demanded in today's highly regulated climate.
Enterprise Information Management
There are two main information management pillars: Enterprise Resource Planning (ERP), which typically contains structured data, and Enterprise Information Management (EIM), which typically contains unstructured data. EIM is the moniker given to the discipline of handling all unstructured data within and between an enterprise and other organizations. Unstructured data typically represents a significant amount of an organization's data. However, until recently the practice of managing unstructured data has garnered less focus than managing structured data, such as with an ERP system. It is estimated that the rate at which information is generated and captured is doubling faster than it ever has in the past. Without the ability to capture, preserve, and make this information usable, we believe businesses will place themselves in an untenable situation for the future.
Unstructured data encompasses everything from email and business processes to the handling of office and PDF documents, and even communicative, transient data like fax transfers, collaborative communications, and large managed files.
3
This type of data composes the preponderance of information amassed and managed by today's enterprise systems. It holds huge volumes of unlocked value for organizations poised to capitalize on their enterprise information strategy.
We envisage a future where this information is easily and seamlessly discovered, captured, managed, governed, secured, leveraged, and transformed into great value using information based applications. We call this discipline EIM. EIM data is by its nature unstructured and follows the required EIM functional technologies of Enterprise Content Management (ECM), Business Process Management (BPM), Customer Experience Management (CEM), Information Exchange (iX), Discovery and Analytics. EIM can be deployed on its own to capture, manage, and store enterprise information and integrates with ERP and additional information management systems to provide a "single version of the truth" for the enterprise.
Strategy
Over the last ten years, we have primarily been a market-leading consolidator of "on premises" EIM. As we and our customers transition to the cloud, our strategic focus is to be a market leading consolidator for cloud-based EIM solutions. We began executing on our cloud consolidation strategy with the acquisitions of EasyLink Services International Corporation, GXS Group Inc, and Actuate Corporation. This strategy is supported by robust institutional experience with consolidation and integration of assets, as well as strong "recurring revenues", which we define as the sum of our “
Cloud services and subscriptions
revenue”, “Customer support revenue” and “Professional Services revenue”. In May 2015 we announced a simplification of our business structure around Enterprise, Information Exchange and Analytics, as well as a new Global Technical Services organization to support our cloud consolidation strategy. This structure will allow us to scale as we continue to acquire complementary business over time, and provide additional focus on winning the customer and the lifetime value of the customer relationship.
We look to grow our cloud-based EIM strategy through acquisitions, innovation and with new ways for customers to purchase our solutions, such as our recently announced subscription pricing and managed service offerings. While we continue to offer on-premises solutions, we realize the EIM market is broad and we are agnostic to whether a customer prefers an on-premises solution, cloud solution, or combination of both (hybrid). We believe giving the customer choice and flexibility with their payment option will help us to strive to obtain long-term customer value. We measure long-term value by looking at our recurring revenue, earnings and operating cash flow. In Fiscal 2015 recurring revenue was
$1,557.7 million
, up
18.1%
compared to Fiscal 2014, and represented
84%
of our total revenues. Our
Cloud services and subscriptions
revenues are also growing, up
62%
in Fiscal 2015 compared to Fiscal 2014. We believe this shows customers are indeed looking for more choice and flexibility on how they consume technology. We are committed to delivering our products and services to customers via a hybrid delivery model.
We see an opportunity to help our customers become “digital businesses” and with our recent acquisition of Actuate Corporation (Actuate) in Fiscal 2015, we have acquired a strong platform to integrate personalized analytics and insights onto our OpenText EIM suites of products, which we believe will further our vision to enable a “digital first world” and strengthen our position among leaders in EIM.
In Fiscal 2016 we will continue to implement strategies that will:
Broaden Reach into EIM, B2B Integration, and Analytics.
As technologies and customers become more sophisticated, we intend to be a leader in expanding the definition of traditional market sectors. We have been a leader in investing in adjacent markets through acquisitions which have provided us with the technology to accelerate our time to market and increase our scale. We have also invested in technologies to address the growing influence of analytics and social, mobile, and cloud platforms on corporate information.
Deepen Customer Penetration
. We intend to leverage our comprehensive solution set to deepen our existing customer relationships. We have significant expertise in a number of industry sectors and aim to increase our customer penetration based on our strong credentials. We are particularly focused on circumstances where the customer is looking to consolidate multiple vendors with solutions from a single source while addressing a broader spectrum of business problems.
Invest in Technology Leadership.
We believe we are well-positioned to develop additional innovative solutions to address the evolving market. We plan to continue investing in technology innovation by funding internal development as well as collaborating with third-parties.
Deepen Strategic Partnerships.
Our partnerships with companies such as Microsoft, SAP and Oracle serve as an example of how we are working together with our partners to create next-generation EIM solutions. We will continue to look for ways to create more customer value from our strategic partnerships.
Broaden Global Presence
. As customers become increasingly multi-national and as international markets continue to adopt EIM, we plan to further grow our brand and presence in these new markets. We are focused on using our direct sales for targeting existing customers and plan to address new geographies jointly with our partners.
4
Selectively Pursue Acquisitions.
In light of the continually evolving marketplace in which we operate, we regularly evaluate acquisition opportunities within the EIM market. We plan to continue to pursue acquisitions that complement our existing business, represent a strong strategic fit and are consistent with our overall growth strategy and disciplined financial management. We may also target future acquisitions to expand or add functionality and capabilities to our existing portfolio of solutions, as well as add new solutions to our portfolio.
Products and Services Overview
Our products and services are designed to provide the benefits of maximizing the value of enterprise information while largely minimizing its risks. Our solutions incorporate social and mobile technologies and are delivered for on-premises deployment as well as through cloud and managed hosted services models to provide the flexibility and cost efficiencies demanded by the market. In addition, we provide solutions that facilitate the exchange of information and transactions that occur between supply chain participants, such as manufacturers, retailers, distributors and financial institutions, and are central to a company’s ability to effectively collaborate with its partners.
At its core, EIM is about helping organizations get the most out of information. Our EIM offerings include Enterprise Content Management, Business Process Management, Customer Experience Management, Information Exchange, Discovery and Analytics, and are designed to deliver to our customers:
|
(i)
|
Increased compliance and information governance resulting in reduced exposure to risk of regulatory sanctions related to how information is handled and protected;
|
|
(ii)
|
Lower cost of storage and management of information through improved classification and archiving strategies;
|
|
(iii)
|
Reduced infrastructure costs due to, among other factors, legacy decommissioning capabilities of EIM and cloud and hosted services deployment models;
|
|
(iv)
|
Improved innovation, productivity and time-to-market as a result of letting employees, trading partners and customers work with information and collaborate in ways which are intuitive, automated, and flexible; and
|
|
(v)
|
Increased revenue streams with the enablement of easy expansion across new channels and, ultimately, new markets.
|

Our portfolio is comprised of capabilities in the following areas:
5
Enterprise Content Management
We facilitate ECM with an integrated set of technologies that manage information throughout its lifecycle and improve business productivity, all while mitigating the risk and controlling the costs of growing volumes of content. Our ECM solutions, which are available on-premises and increasingly in the cloud, include:
|
•
|
Content Management
provides a repository for business documents (such as those created with Microsoft Office, AutoCAD and Adobe Acrobat/PDF) and allows for the organizing, displaying, classifying, access control, version control, event auditing, rendition, and search of documents and other content types.
|
|
•
|
Records Management
enables control of the complete lifecycle of content management by associating retention and disposition rules to control if and when content can or must be deleted or archived on storage media.
|
|
•
|
Archiving
helps reduce storage expenses through optimization of storage use. It manages content storage policies according to business context, optimizes storage use, and provides high-end storage services to reduce future storage demands.
|
|
•
|
Email Management Solutions
enable the archiving, control and monitoring of email, regardless of platform, to reduce the size of the email database, improve email server performance, control the lifecycle of email content, and monitor email content to improve compliance.
|
|
•
|
Capture
solutions help bridge the gap between structured and unstructured data by providing the ability to capture and image paper content while applying metadata and applicable policies and schedules. By transforming the information contained in these documents, it can then be used effectively to automate or streamline business processes while being governed consistently alongside digital content.
|
|
•
|
Core
is a software as a service (SaaS)-based, multi-tenant cloud solution that provides efficient ways to share documents and collaborate for teams of any size, from small groups to large enterprises. Core is available through an online self-service purchase with subscription-based pricing.
|
Business Process Management
BPM provides the software capabilities for analyzing, automating, monitoring and optimizing structured business processes that typically fall outside the scope of existing enterprise systems. BPM solutions help empower employees, customers and partners. Our BPM solutions include:
|
•
|
Process suite platform
puts the business in direct control of its processes and fosters alignment between business and IT, resulting in tangible benefits for both. OpenText Process Suite Platform offers one platform that can be accessed simply through a web browser and is built from the ground up to be truly multi-tenant and to support all of the deployment models required for on-premise, private or public clouds.
|
|
•
|
Capture and recognition
systems convert documents from analog sources, such as paper or facsimile (fax), to electronic documents and apply value-added functions, such as optical / intelligent character recognition (OCR/ICR) and barcode scanning, and then releases these documents into repositories where they can be stored, managed, and searched.
|
|
•
|
Process suite solutions
are packaged applications built on the Process Suite and address specific business problems. This includes Contract Management, Cloud Brokerage Services, Digital Media Supply Chain, and Enterprise App Store, to name a few.
|
Customer Experience Management
CEM generates improved time-to-market by giving customers, employees, and channel partners personalized and engaging experiences. Our CEM solutions include:
|
•
|
Web Content Management
provides software for authoring, maintaining, and administering websites designed to offer a “visitor experience” that integrates content from internal and external sources.
|
|
•
|
Digital Asset Management
provides a set of content management services for browsing, searching, viewing, assembling, and delivering rich media content such as images, audio and video.
|
|
•
|
Customer Communications Management
software makes it possible for organizations to process and deliver highly personalized documents in paper or electronic format rather than a “one message fits all” approach.
|
|
•
|
Social Software
helps companies “socialize” their web presence by adding blogs, wikis, ratings and reviews, and build communities for public websites and employee intranets.
|
|
•
|
Portal
enables organizations to aggregate, integrate and personalize corporate information and applications and provide a central, contextualized, and personalized view of information for executives, departments, partners, and customers.
|
6
Information Exchange
iX is a set of offerings that facilitate efficient, secure, and compliant exchange of information inside and outside the enterprise. iX solutions include:
|
•
|
Business-to-Business (B2B) Integration
services help optimize the reliability, reach, and cost efficiency of an enterprise's electronic supply chain while reducing costs, infrastructure and overhead.
|
|
•
|
Fax Solutions
automate business fax and electronic document distribution to improve the business impact of company information, increase employee productivity and decrease paper-based operational costs.
|
|
•
|
Secure Messaging
helps to share and synchronize files across an organization, across teams and with business partners, while leveraging the latest smartphones and tablets to provide information on the go without sacrificing information governance or security.
|
Discovery
Discovery solutions organize and visualize all relevant content and make it possible for business users to quickly locate information and make better informed decisions based on timely, contextualized information. Discovery solutions include:
|
•
|
Search
addresses information security and productivity requirements by securely indexing all information for fast retrieval and real-time monitoring.
|
|
•
|
Semantic Navigation
improves the end-user experience of websites by enabling intuitive visual exploration of site content through contextual navigation.
|
|
•
|
Auto-Classification
improves the quality of information governance through intelligent metadata extraction and accurate classification of information.
|
|
•
|
InfoFusion
makes it possible for organizations to deal with the issue of so-called “information silos” resulting from, for instance, numerous disconnected information sources across the enterprise. Using a framework of adapters, an information access platform allows organizations to consolidate, decommission, archive and migrate content from virtually any system or information repository.
|
Analytics and Reporting
OpenText provides powerful analytics and reporting products that enable customers to gain greater insight from their enterprise information. The solutions include:
|
•
|
Embedded Analytics and Reporting
which is a technology for software application developers that can be embedded into their applications to add functionality such as business intelligence and reporting.
|
|
•
|
Advanced Analytics
is designed to make predictions based on algorithmic analysis of enterprise data. This technology is particularly effective for "Big Data" and the resulting insights help enable customers to make better business decisions.
|
OpenText Revenues
Our business consists of four revenue streams: license, cloud services and subscriptions, customer support, and professional service and other. For information regarding our revenues and assets by geography for Fiscal 2015, Fiscal 2014 and Fiscal 2013, see note 19 “Segment Information” in the Notes to Consolidated Financial Statements included in Item 8 to this Annual Report on Form 10-K.
License
License revenues consist of fees earned from the licensing of software products to our customers. Our license revenues are impacted by the strength of general economic and industry conditions, the competitive strength of our software products, and our acquisitions. The decision by a customer to license our software products often involves a comprehensive implementation process across the customer’s network or networks and the licensing and implementation of our software products may entail a significant commitment of resources by prospective customers. As revenue from cloud services and subscriptions has increased in recent years, license revenues have decreased as a proportion of our total revenues.
Cloud services and subscriptions
Cloud services and subscription revenues consist of (i) software as a service offerings (ii) managed service arrangements and (iii) subscription revenues relating to on premise offerings. These offerings allow customers to transmit a variety of content between various mediums and to securely manage enterprise information without the commitment of investing in related hardware infrastructure. Revenues are generated on several transactional usage-based models, are typically billed monthly in arrears, and can therefore fluctuate from period to period.
7
In addition, we offer B2B integration solutions, such as messaging services, and managed services. Messaging services allow for the automated and reliable exchange of electronic transaction information, such as purchase orders, invoices, shipment notices and other business documents, among businesses worldwide. Managed services provide an end-to-end fully outsourced B2B integration solution to our customers, including program implementation, operational management, and customer support. These services enable customers to effectively manage the flow of electronic transaction information with their trading partners and reduce the complexity of disparate standards and communication protocols.
Customer Support
The first year of our customer support offering is usually purchased by customers together with the license of our EIM software products. Customer support is typically renewed on an annual basis and historically customer support revenues have been a significant portion of our total revenue. Through our OpenText customer support programs, customers receive access to software upgrades, a knowledge base, discussions, product information, and an online mechanism to post and review “trouble tickets”. Additionally, our customer support teams handle questions on the use, configuration, and functionality of OpenText products and can help identify software issues, develop solutions, and document enhancement requests for consideration in future product releases.
Professional Service and Other
We provide consulting and learning services to customers and generally these services relate to the implementation, training and integration of our licensed product offerings into the customer's systems.
Our consulting services help customers build solutions that enable them to leverage their investments in our technology and in existing enterprise systems. The implementation of these services can range from simple modifications to meet specific departmental needs to enterprise applications that integrate with multiple existing systems.
Our learning services consultants analyze our customers' education and training needs, focusing on key learning outcomes and timelines, with a view to creating an appropriate education plan for the employees of our customers who work with our products. Education plans are designed to be flexible and can be applied to any phase of implementation: pilot, roll-out, upgrade or refresher. OpenText learning services employ a blended approach by combining mentoring, instructor-led courses, webinars, eLearning and focused workshops.
Marketing and Sales
Customers
Our customer base consists of a number of Global 10,000 organizations, some mid-market companies and government agencies. Historically, including Fiscal 2015, no single customer has accounted for 10% or more of our total revenues.
Global Distribution Channels
We operate on a global basis and in Fiscal 2015 we generated approximately
56%
of our revenues from our “Americas” region, which consists of countries in North, Central, and South America, approximately
34%
from our "EMEA" region, which primarily consists of countries in Europe, Africa, and the United Arab Emirates, and approximately
10%
from our "Asia Pacific" region, which primarily consists of Japan, Australia, Hong Kong, Korea, Philippines, Singapore, and New Zealand. We make direct sales of products and services through our global network of subsidiaries. Generally, each of our subsidiaries license our software and then makes license sales and provides services to customers in its local country as well as in foreign countries where we do not have a local subsidiary.
Partners and Alliances
We also market our products and services worldwide through indirect channels. We partner with prominent organizations in the enterprise software and hardware industries in an effort to enhance the value of our solutions and the investments our customers have made in their existing systems. We strive to create mutually beneficial relationships with systems integrators, consultants, and software and hardware developers that augment and extend our products and services. Through these relationships, we and our partners are better able to fulfill key market objectives, drive new business, establish a competitive advantage, and create demonstrable business value.
8
Our strategic partners are:
OpenText and SAP AG (SAP)
OpenText and SAP have shared many years of partnership and close collaboration. Our solutions help customers improve the way they manage content from SAP systems in order to assist them to improve efficiency in key processes, manage compliance and reduce costs. Our targeted solutions let customers create, access, manage and securely archive content for SAP systems, including data, multimedia content, and documents. In addition, our solutions for SAP allow customers to address stringent requirements for risk reduction, operational efficiency and information technology consolidation. OpenText products are typically used by SAP customers as part of their key business processes.
OpenText and Microsoft Corporation
(Microsoft)
Our strategic alliance with Microsoft offers integration between our EIM solutions and Microsoft's desktop and server products, such as Microsoft SharePoint and Exchange, as well as Office 365 and SharePoint online. Microsoft and OpenText have partnered to drive the creation of comprehensive business and industry-specific EIM solutions leveraging customers' significant investments in the Microsoft platform and productivity applications. We provide support for Microsoft platforms such as Windows and SQL Server and integration with many Microsoft products such as Exchange, Rights Management and Windows Azure. The integration of our solutions with Microsoft Office and SharePoint allows an OpenText customer to work with information from Enterprise Resource Planning, Customer Relationship Management, EIM and other enterprise applications from within the Microsoft SharePoint or Microsoft Office interface.
OpenText and Oracle Corporation (Oracle)
For more than ten years, OpenText has developed innovative solutions for Oracle applications that enhance the experience and productivity of users working with these tools. OpenText is committed to continued development that extends and enhances the Oracle application and technology portfolio. Our partnership extends our enterprise solutions framework with integration between OpenText and Oracle eBusiness Suite, analogous to our integration with SAP.
Our global systems integrators are:
Accenture plc (Accenture)
Accenture, a global management consulting, technology services and outsourcing company, is one of our systems integrator partners. Together we provide strategic EIM solutions. Accenture's extensive experience with enterprise-rollout planning and design, combined with our EIM technology, provides solutions designed to address an organization's EIM requirements.
Deloitte Consulting LLP (Deloitte)
Deloitte is also one of our systems integrator partners. Together, we help organizations build value through improved ECM performance. Deloitte's services provide value across human capital, strategy and operations, and technology within multiple industries.
Other System Integrators
Other OpenText systems integrator partners include Cap Gemini Inc., CGI Group Inc. (through its acquisition of Logica plc), ATOS SE, and Raytheon Company.
International Markets
We provide our product offerings worldwide.
Our geographic coverage allows us to draw on business and technical expertise from a geographically diverse workforce, providing greater stability to our operations and revenue streams by diversifying our portfolio to better mitigate against the risks of a single geographically focused business.
There are inherent risks to conducting operations internationally. For more information about these risks, see “Risk Factors” included in Item 1A of this Annual Report on Form 10-K.
Competition
The market for our products and services is highly competitive, subject to rapid technological change and shifting customer needs and economic pressures. We compete with multiple companies, some that have single or narrow solutions and some that have a range of information management solutions, like ourselves. Our competitors include International Business Machines Corporation (IBM), EMC Corporation (EMC), Hewlett-Packard Company (HP) and Adobe Inc. In certain markets, OpenText competes with Oracle and Microsoft, who are also our partners. In addition there are numerous, other niche software
9
vendors in the Information Management sector, such as j2 Inc. and Pegasystems Inc., that compete with OpenText in certain segments of the EIM market. We also face competition from systems integrators that configure hardware and software into customized systems. Additionally, new competitors or alliances among existing competitors may emerge and could rapidly acquire additional market share. We also expect that competition will increase as a result of ongoing software industry consolidation.
We believe that the principal competitive factors affecting the market for our software products and services include: (i) vendor and product reputation; (ii) product quality, performance and price; (iii) the availability of software products on multiple platforms; (iv) product scalability; (v) product integration with other enterprise applications; (vi) software functionality and features; (vii) software ease of use; (viii) the quality of professional services, customer support services and training; and (ix) the ability to address specific customer business problems. We believe the relative importance of each of these factors depends upon the concerns and needs of each specific customer.
Research and Development
The industry in which we compete is subject to rapid technological developments, evolving industry standards, changes in customer requirements and competitive new products and features. As a result, our success, in part, depends on our ability to continue to enhance our existing products in a timely and efficient manner and to develop and introduce new products that meet customer needs while reducing total cost of ownership. To achieve these objectives, we have made and expect to continue to make investments in research and development, through internal and third-party development activities, third-party licensing agreements and potentially through technology acquisitions. Our research and development expenses were
$196.5 million
for Fiscal 2015,
$176.8 million
for Fiscal 2014, and
$164.0 million
for Fiscal 2013. We believe our spending on research and development is an appropriate balance between managing our organic growth and results of operation. We expect to continue to invest in research and development to maintain and improve our products and services offerings.
Acquisitions During the Last Five Fiscal Years
Our competitive position in the marketplace requires us to maintain a complex and evolving array of technologies, products, services and capabilities. In light of the continually evolving marketplace in which we operate, we regularly evaluate various acquisition opportunities within the marketplace and elsewhere in the high technology industry. Below is a summary of the more material acquisitions we have made over the last five fiscal years.
In Fiscal 2015, we completed the following acquisitions:
|
•
|
On January 16, 2015, we acquired Actuate Corporation (Actuate), based in San Francisco, California, United States, for $332.0 million, comprised of approximately
$322.4 million
in cash and shares we purchased of Actuate in the open market with a fair value of approximately $9.5 million as of the date of acquisition. Actuate was a leader in personalized analytics and insights.
|
|
•
|
On January 2, 2015, we acquired Informative Graphics Corporation (IGC), based in Scottsdale, Arizona, United States, for approximately
$40 million
. IGC was a leading developer of viewing, annotation, redaction and publishing commercial software.
|
Prior to Fiscal 2015, we completed the following acquisitions:
|
•
|
On January 16, 2014, we acquired GXS, a Delaware corporation and leader in cloud-based B2B integration services for $1.2 billion, inclusive of the issuance of 2,595,042 OpenText Common Shares.
|
|
•
|
On August 15, 2013, we acquired Cordys Holding B.V. (Cordys), a leading provider of BPM and case management solutions, offered on one platform with cloud, mobile, and social capabilities, based in Putten, the Netherlands for $33.2 million.
|
|
•
|
On May 23, 2013, we acquired ICCM Professional Services Limited (ICCM), a company based in Malmesbury, United Kingdom, for $18.9 million. ICCM is a provider of IT service management software solutions.
|
|
•
|
On March 5, 2013, we acquired Resonate KT Limited (RKT), a company based in Cardiff, United Kingdom, for $20.0 million. RKT was a leading provider of software that enables organizations to visualize unstructured data, create new user experiences for ECM and xECM for SAP, as well as build industry-based applications that maximize unstructured data residing within Content Server, a key component of the OpenText ECM suite.
|
|
•
|
On July 2, 2012, we acquired EasyLink Services International Corporation (EasyLink), a company based in Georgia, United States and a global provider of cloud-based electronic messaging and business integration services for $342.3 million.
|
|
•
|
On July 13, 2011, we acquired Global 360 Holding Corp. (Global 360), a software company based in Dallas, Texas, United States, for $256.6 million. Global 360 offers case management and document-centric BPM solutions. The acquisition continued our expansion into the BPM market and added to our technology, talent, services, partner and geographical strengths.
|
10
|
•
|
On March 15, 2011, we acquired weComm Limited (weComm), based in London, United Kingdom, for $20.5 million. weComm's software platform offers deployment of media rich applications for mobile devices, including smart phones and tablets.
|
|
•
|
On February 18, 2011, we acquired Metastorm Inc. (Metastorm) for $182.0 million. Based in Baltimore, Maryland, United States, Metastorm provides BPM, Business Process Analysis (BPA), and Enterprise Architecture (EA) software that helps enterprises align their strategies with execution.
|
|
•
|
On October 27, 2010, we acquired StreamServe Inc. (StreamServe), a software company based in Burlington, Massachusetts, United States, for $70.5 million. StreamServe offers enterprise business communication solutions that help organizations process and deliver highly personalized documents in paper or electronic format.
|
We believe our acquisitions support our long-term strategic direction, strengthen our competitive position, expand our customer base and provide greater scale to accelerate innovation, grow our earnings and increase shareholder value. We expect to continue to strategically acquire companies, products, services and technologies to augment our existing business.
Intellectual Property Rights
Our success and ability to compete depends on our ability to develop and maintain our intellectual property and proprietary technology and to operate without infringing on the proprietary rights of others. Our software products are generally licensed to our customers on a non-exclusive basis for internal use in a customer's organization. We also grant rights in our intellectual property to third parties that allow them to market certain of our products on a non-exclusive or limited-scope exclusive basis for a particular application of the product(s) or to a particular geographic area.
We rely on a combination of copyright, patent, trademark and trade secret laws, non-disclosure agreements and other contractual provisions to establish and maintain our proprietary rights. We have obtained or applied for trademark registration for most strategic product names in most major markets. We have a number of U.S. and foreign patents and pending applications, including patents and rights to patent applications acquired through strategic transactions, which relate to various aspects of our products and technology. The duration of our patents is determined by the laws of the country of issuance and for the U.S. is typically 17 years from the date of issuance of the patent or 20 years from the date of filing of the patent application resulting in the patent. While we believe our intellectual property is valuable and our ability to maintain and protect our intellectual property rights is important to our success, we also believe that our business as a whole is not materially dependent on any particular patent, trademark, license, or other intellectual property right.
For more information on the risks related to our intellectual property rights, see "Risk Factors" included in Item 1A of this Annual Report on Form 10-K.
Employees
As of June 30, 2015, we employed a total of approximately
8,500
individuals. The approximate composition of our employee base is as follows: (i)
1,500
employees in sales and marketing, (ii)
2,100
employees in product development, (iii)
2,100
employees in cloud services, (iv)
1,000
employees in professional services, (v)
700
employees in customer support, and (vi)
1,100
employees in general and administrative roles. We believe that relations with our employees are strong. None of our employees are represented by a labour union, nor do we have collective bargaining arrangements with any of our employees. However, in certain international jurisdictions in which we operate, a “Workers' Council” represents our employees.
Available Information
Access to our Annual Report on Form 10-K, Quarterly Reports on Form 10-Q, Current Reports on Form 8-K and amendments to these reports filed with or furnished to the SEC may be obtained free of charge through the Investors section of our website at
www.opentext.com
as soon as is reasonably practical after we electronically file or furnish these reports. Our website is included in this Annual Report on Form 10-K as an inactive textual reference only. Except for the documents specifically incorporated by reference into this Annual Report, information contained on our website is not incorporated by reference in this Annual Report and should not be considered to be a part of this Annual Report. In addition, our filings with the SEC may be accessed through the SEC's website at
www.sec.gov
. All statements made in any of our securities filings, including all forward-looking statements or information, are made as of the date of the document in which the statement is included, and we do not assume or undertake any obligation to update any of those statements or documents unless we are required to do so by law.
The following important factors could cause our actual business and financial results to differ materially from our current expectations, estimates, forecasts and projections. These forward-looking statements contained in this Annual Report on Form
11
10-K or made elsewhere by management from time to time are subject to important risks, uncertainties and assumptions which are difficult to predict. The risks and uncertainties described below are not the only risks and uncertainties facing us. Additional risks not currently known to us or that we currently believe are immaterial may also impair our operating results, financial condition and liquidity. Our business is also subject to general risks and uncertainties that affect many other companies. These risks discussed below are not presented in order of importance or probability of occurrence.
The length of our sales cycle can fluctuate significantly which could result in significant fluctuations in license revenues being recognized from quarter to quarter
The decision by a customer to license our software products or purchase our services often involves a comprehensive implementation process across the customer's network or networks. As a result, the licensing and implementation of our software products and any related services may entail a significant commitment of resources by prospective customers, accompanied by the attendant risks and delays frequently associated with significant technology implementation projects. Given the significant investment and commitment of resources required by an organization to implement our software products, our sales cycle may be longer compared to other companies within our own industry, as well as companies in other industries. Also because of changes in customer spending habits, it may be difficult for us to budget, forecast and allocate our resources properly. In weak economic environments, it is not uncommon to see reduced information technology spending. It may take several months, or even several quarters, for marketing opportunities to materialize. If a customer's decision to license our software is delayed or if the implementation of these software products takes longer than originally anticipated, the date on which we may recognize revenues from these licenses would be delayed. Such delays and fluctuations could cause our revenues to be lower than expected in a particular period and we may not be able to adjust our costs quickly enough to offset such lower revenues, potentially negatively impacting our business, operating results and financial condition.
Our success depends on our relationships with strategic partners, distributors, and third party service providers and any reduction in the sales efforts by distributors, or cooperative efforts from our partners, or service from third party providers could materially impact our revenues
We rely on close cooperation with strategic partners for sales and software product development as well as for the optimization of opportunities that arise in our competitive environment. A portion of our license revenues is derived from the licensing of our software products through third parties. Also, a portion of our service revenues may be impacted by the level of service provided by third party service providers relating to internet, telecommunications and power services. Our success will depend, in part, upon our ability to maintain access to existing channels of distribution and to gain access to new channels if and when they develop. We may not be able to retain a sufficient number of our existing distributors or develop a sufficient number of future distributors. Distributors may also give higher priority to the licensing of software products other than ours (which could include competitors' products) or may not devote sufficient resources to marketing our software products. The performance of third party distributors and third party service providers is largely outside of our control, and we are unable to predict the extent to which these distributors and service providers will be successful in either marketing and licensing our software products or providing adequate internet, telecommunication and power services so that disruptions and outages are not experienced by our customers. A reduction in strategic partner cooperation or sales efforts, a decline in the number of distributors, a decision by our distributors to discontinue the licensing of our software products or a decline or disruption in third party services could cause users and the general public to perceive our software products and services as inferior and could materially reduce revenues.
If we do not continue to develop technologically advanced products that successfully integrate with the software products and enhancements used by our customers, future revenues and our operating results may be negatively affected
Our success depends upon our ability to design, develop, test, market, license and support new software products, services, and enhancements of current products and services on a timely basis in response to both competitive threats and marketplace demands. Examples of significant trends in the software industry include cloud computing, mobility, social media and software as a service (SaaS). In addition, our software products, services, and enhancements must remain compatible with standard platforms and file formats. Often, we must integrate software licensed or acquired from third parties with our proprietary software to create or improve our products. If we are unable to achieve a successful integration with third party software, we may not be successful in developing and marketing our new software products, services, and enhancements. If we are unable to successfully integrate third party software to develop new software products, services, and enhancements to existing software products and services, or to complete the development of new software products and services which we license or acquire from third parties, our operating results will materially suffer. In addition, if the integrated or new products or enhancements do not achieve acceptance by the marketplace, our operating results will materially suffer. Moreover, if new industry standards emerge that we do not anticipate or adapt to, or with rapid technological change occurring, if alternatives to our services and solutions are developed by our competitors, our software products and services could be rendered obsolete,
12
causing us to lose market share and, as a result, harm our business and operating results, and our ability to compete in the marketplace.
If our software products and services do not gain market acceptance, our operating results may be negatively affected
We intend to pursue our strategy of being a market leading consolidator for cloud-based EIM solutions, and growing the capabilities of our EIM software offerings through our proprietary research and the development of new software product and service offerings, as well as through acquisitions. In response to customer demand, it is important to our success that we continue to enhance our software products and services and to seek to set the standard for EIM capabilities. The primary market for our software products and services is rapidly evolving which means that the level of acceptance of products and services that have been released recently or that are planned for future release by the marketplace is not certain. If the markets for our software products and services fail to develop, develop more slowly than expected or become subject to increased competition, our business may suffer. As a result, we may be unable to: (i) successfully market our current products and services, (ii) develop new software products and services and enhancements to current software products and services, (iii) complete customer implementations on a timely basis, or (iv) complete software products and services currently under development. In addition, increased competition could put significant pricing pressures on our products which could negatively impact our margins and profitability. If our software products and services are not accepted by our customers or by other businesses in the marketplace, our business, operating results and financial condition will be materially affected.
Our investment in our current research and development efforts may not provide a sufficient, timely return
The development of EIM software products is a costly, complex and time-consuming process, and the investment in EIM software product development often involves a long wait until a return is achieved on such an investment. We are making, and will continue to make, significant investments in software research and development and related product opportunities. Investments in new technology and processes are inherently speculative. Commercial success depends on many factors, including the degree of innovation of the software products and services developed through our research and development efforts, sufficient support from our strategic partners, and effective distribution and marketing. Accelerated software product introductions and short product life cycles require high levels of expenditures for research and development. These expenditures may adversely affect our operating results if they are not offset by revenue increases. We believe that we must continue to dedicate a significant amount of resources to our research and development efforts in order to maintain our competitive position. However, significant revenues from new software product and service investments may not be achieved for a number of years, if at all. Moreover, new software products and services may not be profitable, and even if they are profitable, operating margins for new software products and services may not be as high as the margins we have experienced for our current or historical software products and services.
Product development is a long, expensive and uncertain process, and we may terminate one or more of our development programs
We may determine that certain software product candidates or programs do not have sufficient potential to warrant the continued allocation of resources. Accordingly, we may elect to terminate one or more of our programs for such product candidates. If we terminate a software product in development in which we have invested significant resources, our prospects may suffer, as we will have expended resources on a project that does not provide a return on our investment and we may have missed the opportunity to have allocated those resources to potentially more productive uses and this may negatively impact our business, operating results and financial condition.
Failure to protect our intellectual property could harm our ability to compete effectively
We are highly dependent on our ability to protect our proprietary technology. We rely on a combination of copyright, patent, trademark and trade secret laws, as well as non-disclosure agreements and other contractual provisions to establish and maintain our proprietary rights. We intend to protect our intellectual property rights vigorously; however, there can be no assurance that these measures will, in all cases, be successful. Enforcement of our intellectual property rights may be difficult, particularly in some countries outside of North America in which we seek to market our software products and services. While U.S. and Canadian copyright laws, international conventions and international treaties may provide meaningful protection against unauthorized duplication of software, the laws of some foreign jurisdictions may not protect proprietary rights to the same extent as the laws of Canada or the United States. The absence of internationally harmonized intellectual property laws makes it more difficult to ensure consistent protection of our proprietary rights. Software piracy has been, and is expected to be, a persistent problem for the software industry, and piracy of our software products represents a loss of revenue to us. Where applicable, certain of our license arrangements have required us to make a limited confidential disclosure of portions of the source code for our software products, or to place such source code into escrow for the protection of another party. Despite the precautions we have taken, unauthorized third parties, including our competitors, may be able to copy certain portions of our
13
software products or reverse engineer or obtain and use information that we regard as proprietary. Also, our competitors could independently develop technologies that are perceived to be substantially equivalent or superior to our technologies. Our competitive position may be adversely affected by our possible inability to effectively protect our intellectual property. In addition, certain of our products contain open source software. Licensees of open source software may be required to make public certain source code or to make certain derivative works available to others. While we monitor and control the use of open source software in our products and in any third party software that is incorporated into our products, and we try to ensure that no open source software is used in such a way as to require us to disclose the source code to the related product or service, there can be no guarantee that such use could not inadvertently occur. If this happened it could harm our intellectual property position and have a material adverse effect on our business, results of operations and financial condition.
Other companies may claim that we infringe their intellectual property, which could materially increase costs and materially harm our ability to generate future revenues and profits
Claims of infringement are becoming increasingly common as the software industry develops and as related legal protections, including patents, are applied to software products. Although we do not believe that our products infringe on the rights of third parties, third parties have and will continue to assert infringement claims against us in the future. Although most of our technology is proprietary in nature, we do include certain third party and open source software in our software products. In the case of third party software, we believe this software is licensed from the entity holding the intellectual property rights. Although we believe that we have secured proper licenses for all third-party intellectual property that is integrated into our products, third parties may continue to assert infringement claims against us in the future, including the sometimes aggressive and opportunistic actions of non-practicing entities whose business model is to obtain patent-licensing revenues from operating companies such as us. Any such assertion, regardless of merit, may result in litigation or may require us to obtain a license for the intellectual property rights of third parties. Such licenses may not be available or they may not be available on commercially reasonable terms. In addition, as we continue to develop software products and expand our portfolio using new technology and innovation, our exposure to threats of infringement may increase. Any infringement claims and related litigation could be time-consuming, disruptive to our ability to generate revenues or enter into new market opportunities and may result in significantly increased costs as a result of our defense against those claims or our attempt to license the intellectual property rights or rework our products to avoid infringement of third party rights. Typically our agreements with our partners and customers contain provisions which require us to indemnify them for damages sustained by them as a result of any infringement claims involving our products. Any of the foregoing infringement claims and related litigation could have a significant adverse impact on our business and operating results as well as our ability to generate future revenues and profits.
The loss of licenses to use third-party software or the lack of support or enhancement of such software could adversely affect our business
We currently depend upon a limited number of third-party software products. If such software products were not available, we might experience delays or increased costs in the development of our software products. For a limited number of our product modules, we rely on software products that we license from third-parties, including software that is integrated with internally developed software and which is used in our products to perform key functions. These third-party software licenses may not continue to be available to us on commercially reasonable terms and the related software may not continue to be appropriately supported, maintained, or enhanced by the licensors. The loss by us of the license to use, or the inability by licensors to support, maintain, or enhance any of such software, could result in increased costs, lost revenues or delays until equivalent software is internally developed or licensed from another third party and integrated with our software. Such increased costs, lost revenues or delays could adversely affect our business.
Current and future competitors could have a significant impact on our ability to generate future revenues and profits
The markets for our software products and services are intensely competitive and are subject to rapid technological change and other pressures created by changes in our industry. The convergence of many technologies has resulted in unforeseen competitors arising from companies that were traditionally not viewed as threats to our marketplace. We expect competition to increase and intensify in the future as the pace of technological change and adaptation quickens and as additional companies enter our markets, including those competitors who offer similar solutions as we do, but offer it through a different form of delivery. Numerous releases of competitive products have occurred in recent history and are expected to continue in the future. We may not be able to compete effectively with current competitors and potential entrants into our marketplace. We could lose market share if our current or prospective competitors: (i) introduce new competitive products or services, (ii) add new functionality to existing products and services, (iii) acquire competitive products and services, (iv) reduce prices, or (v) form strategic alliances with other companies. If other businesses were to engage in aggressive pricing policies with respect to competing products, or if the dynamics in our marketplace resulted in increasing bargaining power by the consumers of our software products and services, we would need to lower the prices we charge for the products and services we offer. This could result in lower revenues or reduced margins, either of which may materially and adversely affect our business
14
and operating results. Additionally, if prospective consumers choose other methods of EIM delivery, different from that which we offer, our business and operating results could also be materially and adversely affected.
Consolidation in the industry, particularly by large, well-capitalized companies, could place pressure on our operating margins which could, in turn, have a material adverse affect on our business
Acquisitions by large, well-capitalized technology companies have changed the marketplace for our software products and services by replacing competitors which are comparable in size to our Company with companies that have more resources at their disposal to compete with us in the marketplace. In addition, other large corporations with considerable financial resources either have products and/or services that compete with our software products and services or have the ability to encroach on our competitive position within our marketplace. These companies have considerable financial resources, channel influence, and broad geographic reach; thus, they can engage in competition with our software products and services on the basis of price, marketing, services or support. They also have the ability to introduce items that compete with our maturing software products and services. The threat posed by larger competitors and their ability to use their better economies of scale to sell competing products and services at a lower cost may materially reduce the profit margins we earn on the software products and services we provide to the marketplace. Any material reduction in our profit margin may have an adverse material effect on the operations or finances of our business, which could hinder our ability to raise capital in the public markets at opportune times for strategic acquisitions or general operational purposes, which may prevent effective strategic growth, improved economies of scale or put us at a disadvantage to our better capitalized competitors.
We must continue to manage our internal resources during periods of company growth or our operating results could be adversely affected
The EIM market in which we compete continues to evolve at a rapid pace. Moreover, we have grown significantly through acquisitions in the past and expect to continue to review acquisition opportunities as a means of increasing the size and scope of our business. Our growth, coupled with the rapid evolution of our markets, has placed, and will continue to place, significant strains on our administrative and operational resources and increased demands on our internal systems, procedures and controls. Our administrative infrastructure, systems, procedures and controls may not adequately support our operations. In addition, our management may not be able to achieve the rapid, effective execution of the product and business initiatives necessary to successfully implement our operational and competitive strategy. If we are unable to manage growth effectively, our operating results will likely suffer which may, in turn, adversely affect our business.
If we lose the services of our executive officers or other key employees or if we are not able to attract or retain top employees, our business could be significantly harmed.
Our performance is substantially dependent on the performance of our executive officers and key employees. We do not maintain “key person” life insurance policies on any of our employees. Our success is also highly dependent on our continuing ability to identify, hire, train, retain and motivate highly qualified management, technical, sales and marketing personnel. In particular, the recruitment of top research developers and experienced salespeople remains critical to our success. Competition for such people is intense, substantial and continuous, and we may not be able to attract, integrate or retain highly qualified technical, sales or managerial personnel in the future. In addition, in our effort to attract and retain critical personnel, we may experience increased compensation costs that are not offset by either improved productivity or higher prices for our software products or services.
Mr. Barrenechea, our President and Chief Executive Officer, recently returned to full involvement in our day-to-day operations following a diagnosis of leukemia. The loss of the services of Mr. Barrenechea or any of our other executive officers or other key employees, for health reasons or otherwise, could significantly harm our business.
Loss of key personnel could impair the integration of acquired businesses, lead to loss of customers and a decline in revenues, or otherwise could have an adverse effect on our operations.
Our success as a combined business with any prior or future acquired businesses will depend, in part, upon our ability to retain key employees, especially during the integration phase of the businesses. It is possible that the integration process could result in current and prospective employees of ours and the acquired business to experience uncertainty about their future roles with us, which could have an adverse effect on our ability to retain key managers and other employees. If, despite our retention and recruiting efforts, key employees depart or fail to continue employment with us, the loss of their services and their experience and knowledge regarding our business could have an adverse effect on our future operating results and the successful ongoing operation of our businesses.
Our compensation structure may hinder our efforts to attract and retain vital employees
15
A portion of our total compensation program for our executive officers and key personnel includes the award of options to buy our Common Shares. If the market price of our Common Shares performs poorly, such performance may adversely affect our ability to retain or attract critical personnel. In addition, any changes made to our stock option policies, or to any other of our compensation practices, which are made necessary by governmental regulations or competitive pressures could adversely affect our ability to retain and motivate existing personnel and recruit new personnel. For example, any limit to total compensation which may be prescribed by the government or any significant increases in personal income tax levels levied in countries where we have a significant operational presence may hurt our ability to attract or retain our executive officers or other employees whose efforts are vital to our success. Additionally, payments under our long-term incentive plan (the details of which are described in Item 11 of this Annual Report on Form 10-K) are dependent to a significant extent upon the future performance of our Company both in absolute terms and in comparison to similarly situated companies. Any failure to achieve the targets set under our long-term incentive plan could significantly reduce or eliminate payments made under this plan, which may, in turn, materially and adversely affect our ability to retain the key personnel who are subject to this plan.
We may not generate sufficient cash flow to satisfy our unfunded pension obligations
Through our acquisitions, we have assumed certain unfunded pension plan liabilities. We will be required to use the operating cash flow that we generate in the future to meet these obligations. As a result, our future net pension liability and cost may be materially affected by the discount rate used to measure these pension obligations and by the longevity and actuarial profile of the relevant workforce. A change in the discount rate may result in a significant increase or decrease in the valuation of these pension obligations, and these changes may affect the net periodic pension cost in the year the change is made and in subsequent years. We cannot assure that we will generate sufficient cash flow to satisfy these obligations. Any inability to satisfy these pension obligations may have a material adverse effect on the operational and financial health of our business.
For more details see note 11 "Pension Plans and Other Post Retirement Benefits" to the Consolidated Financial Statements included in this Annual Report on Form 10-K.
Unexpected events may materially harm our ability to align when we incur expenses with when we recognize revenues
We incur operating expenses based upon anticipated revenue trends. Since a high percentage of these expenses are relatively fixed, a delay in recognizing revenues from transactions related to these expenses (such a delay may be due to the factors described elsewhere in this risk factor section or it may be due to other factors) could cause significant variations in operating results from quarter to quarter, and such a delay could materially reduce operating income. If these expenses are not subsequently matched by revenues, our business, financial condition, or results of operations could be materially and adversely affected.
We may fail to achieve our financial forecasts due to inaccurate sales forecasts or other factors
Our revenues and particularly our new software license revenues are difficult to forecast, and, as a result, our quarterly operating results can fluctuate substantially. We use a “pipeline” system, a common industry practice, to forecast sales and trends in our business. By reviewing the status of outstanding sales proposals to our customers and potential customers, we make an estimate as to when a customer will make a purchasing decision involving our software products. These estimates are aggregated periodically to make an estimate of our sales pipeline, which we use as a guide to plan our activities and make financial forecasts. Our sales pipeline is only an estimate and may be an unreliable predictor of actual sales activity, both in a particular quarter and over a longer period of time. Many factors may affect actual sales activity, such as weakened economic conditions, which may cause our customers and potential customers to delay, reduce or cancel IT related purchasing decisions and the tendency of some of our customers to wait until the end of a fiscal period in the hope of obtaining more favourable terms from us. If actual sales activity differs from our pipeline estimate, then we may have planned our activities and budgeted incorrectly and this may adversely affect our business, operating results and financial condition. In addition, for newly acquired companies, we have limited ability to immediately predict how their pipelines will convert into sales or revenues following the acquisition and their conversion rate post-acquisition may be quite different from their historical conversion rate.
Our revenue and operating cash flows could be adversely affected in the short term as we continue to see more customers transition to our cloud offerings
Should we continue to see more of our customers selecting our subscription pricing and managed service offerings, with payments made over time rather than a perpetual license with upfront fees, this could, in some cases, result in instances where reported revenue and cash flow could be lower in the short term when compared to our historical perpetual license model, as well as varying between periods depending on our customers' preference to license our products or subscribe to our subscription-based or managed service offerings. While we expect that over time the transition to a cloud and subscription model will help our business to generate revenue growth by attracting new users, keeping our user base current as subscriptions
16
allow users to receive the latest product updates and thereby increase recurring revenue per user, there is no guarantee that our short term revenue and operating cash will not be adversely affected during the transition period.
The restructuring of our operations may adversely affect our business or our finances and we may incur restructuring charges in connection with such actions
We often undertake initiatives to restructure or streamline our operations. We may incur costs associated with implementing a restructuring initiative beyond the amount contemplated when we first developed the initiative and these increased costs may be substantial. As well, such costs would adversely impact our results of operations for the periods in which those adjustments are made. We will continue to evaluate our operations, and may propose future restructuring actions as a result of changes in the marketplace, including the exit from less profitable operations or the decision to terminate products or services which are not valued by our customers. Any failure to successfully execute these initiatives on a timely basis may have a material adverse effect on our business, operating results and financial condition.
Fluctuations in foreign currency exchange rates could materially affect our financial results
Our Consolidated Financial Statements are presented in U.S. dollars. In general, the functional currency of our subsidiaries is the local currency. For each subsidiary, assets and liabilities denominated in foreign currencies are translated into U.S dollars at the exchange rates in effect at the balance sheet dates and revenues and expenses are translated at the average exchange rates prevailing during the month of the transaction. Therefore, increases or decreases in the value of the U.S. dollar against other major currencies affect our net operating revenues, operating income and the value of balance sheet items denominated in foreign currencies. In addition, unexpected and dramatic devaluations of currencies in developing, as well as developed, markets could negatively affect our revenues from, and the value of the assets located in, those markets. Transactional foreign currency gains (losses) included in the Consolidated Statements of Income under the line item “Other income (expense) net” for Fiscal 2015, Fiscal 2014 and Fiscal 2013 were
$(31.0) million
,
$4.0 million
, and
$(2.6) million
, respectively. While we use derivative financial instruments to attempt to reduce our net exposure to currency exchange rate fluctuations, fluctuations in foreign currency exchange rates, particularly the strengthening of the U.S. dollar against major currencies or the currencies of large developing countries, could continue to materially affect our financial results.
Our international operations expose us to business risks that could cause our operating results to suffer
We intend to continue to make efforts to increase our international operations and anticipate that international sales will continue to account for a significant portion of our revenues. These international operations are subject to certain risks and costs, including the difficulty and expense of administering business and compliance abroad, differences in business practices, compliance with domestic and foreign laws (including without limitation domestic and international import and export laws and regulations), costs related to localizing products for foreign markets, and costs related to translating and distributing software products in a timely manner. International operations also tend to be subject to a longer sales and collection cycle. In addition, regulatory limitations regarding the repatriation of earnings may adversely affect the transfer of cash earned from foreign operations. Significant international sales may also expose us to greater risk from political and economic instability, unexpected changes in Canadian, United States or other governmental policies concerning import and export of goods and technology, regulatory requirements, tariffs and other trade barriers. Additionally, international earnings may be subject to taxation by more than one jurisdiction, which may materially adversely affect our effective tax rate. Also, international expansion may be difficult, time consuming, and costly. As a result, if revenues from international operations do not offset the expenses of establishing and maintaining foreign operations, our business, operating results and financial condition will suffer.
Our software products and services may contain defects that could harm our reputation, be costly to correct, delay revenues, and expose us to litigation
Our software products and services are highly complex and sophisticated and, from time to time, may contain design defects, software errors, hardware failures or other computer system failures that are difficult to detect and correct. Errors may be found in new software products or services or improvements to existing products or services after delivery to our customers. If these defects are discovered, we may not be able to successfully correct such errors in a timely manner. In addition, despite the extensive tests we conduct on all our software products or services, we may not be able to fully simulate the environment in which our products or services will operate and, as a result, we may be unable to adequately detect the design defects or software or hardware errors which may become apparent only after the products are installed in an end-user's network, and users have transitioned to our services. The occurrence of errors and failures in our software products or services could result in the delay or the denial of market acceptance of our products and alleviating such errors and failures may require us to make significant expenditure of our resources. Customers often use our services and solutions for critical business processes and as a result, any defect or disruption in our solutions, any data breaches or misappropriation of proprietary information, or any error in execution, including human error or intentional third-party activity such as denial of service attacks or hacking, may cause
17
customers to reconsider renewing their contract with us. The errors in or failure of our software products and services could also result in us losing customer transaction documents and other customer files, causing significant customer dissatisfaction and possibly giving rise to claims for monetary damages. The harm to our reputation resulting from product and service errors and failures may be materially damaging. Since we regularly provide a warranty with our software products, the financial impact of fulfilling warranty obligations may be significant in the future. Our agreements with our strategic partners and end-users typically contain provisions designed to limit our exposure to claims. These agreements regularly contain terms such as the exclusion of all implied warranties and the limitation of the availability of consequential or incidental damages. However, such provisions may not effectively protect us against claims and the attendant liabilities and costs associated with such claims. Any claims for actual or alleged losses to our customers’ businesses may require us to spend significant time and money in litigation or arbitration or to pay significant settlements or damages. Defending a lawsuit, regardless of merit, can be costly and would divert management’s attention and resources. Although we maintain errors and omissions insurance coverage and comprehensive liability insurance coverage, such coverage may not be adequate to cover all such claims. Accordingly, any such claim could negatively affect our business, operating results or financial condition.
Our software products rely on the stability of infrastructure software that, if not stable, could negatively impact the effectiveness of our products, resulting in harm to our reputation and business
Our developments of Internet and intranet applications depend on the stability, functionality and scalability of the infrastructure software of the underlying intranet, such as the infrastructure software produced by Hewlett-Packard, Oracle, Microsoft and others. If weaknesses in such infrastructure software exist, we may not be able to correct or compensate for such weaknesses. If we are unable to address weaknesses resulting from problems in the infrastructure software such that our software products do not meet customer needs or expectations, our reputation, and consequently, our business may be significantly harmed.
Risks associated with the evolving use of the Internet, including changing standards, competition, regulation and associated compliance efforts, may adversely impact our business.
The use of the Internet as a vehicle for electronic data interchange (EDI), and related services currently raises numerous issues, including reliability, data security, data integrity and rapidly evolving standards. New competitors, which may include media, software vendors and telecommunications companies, offer products and services that utilize the Internet in competition with our products and services and may be less expensive or process transactions and data faster and more efficiently. Internet-based commerce is subject to increasing regulation by Canadian, U.S. federal and state and foreign governments, including in the areas of data privacy and breaches, and taxation. Laws and regulations relating to the solicitation, collection, processing or use of personal or consumer information could affect our customers’ ability to use and share data, potentially reducing demand for Internet-based solutions and restricting our ability to store, process, analyze and share data through the Internet. Although we believe that the Internet will continue to provide opportunities to expand the use of our products and services, we cannot ensure that our efforts to exploit these opportunities will be successful or that increased usage of the Internet for business integration products and services or increased competition, and regulation will not adversely affect our business, results of operations and financial condition.
Business disruptions, including those related to data security breaches, may adversely affect our operations
Our business and operations are highly automated and a disruption or failure of our systems may delay our ability to complete sales and to provide services. Business disruptions can be caused by several factors, including natural disasters, terrorist attacks, power loss, telecommunication and system failures, computer viruses, physical attacks and cyber-attacks. A major disaster or other catastrophic event that results in the destruction or disruption of any of our critical business or information technology systems, including our cloud services, could severely affect our ability to conduct normal business operations. We operate data centres in various locations around the world and although we have redundancy capability built into our disaster recovery plan, we cannot ensure our systems and data centres will remain fully operational during and immediately after a disaster or disruption. We also rely on third parties that provide critical services in our operations and despite our diligence around their disaster recovery processes, we cannot provide assurances as to whether these third party service providers can maintain operations during a disaster or disruption. Any business disruption could negatively affect our business, operating results or financial condition.
In addition, if data security is compromised, this could materially and adversely affect our future operating results given that we have customers that use our systems to store and exchange large volumes of proprietary and confidential information and the security and reliability of our services are significant to these customers. If our systems, or the systems of third-party service providers on whom we rely, are attacked or accessed by unauthorized parties, it could lead to major disruption and loss of our and our customers' data which may involve us having to spend material resources on correcting the breach and
18
indemnifying the relevant parties which could have adverse effects on our reputation, future business, operating results and financial condition.
Unauthorized disclosures and breaches of security data may adversely affect our operations
Most of the jurisdictions in which we operate have laws and regulations relating to data privacy, security and protection of information. We have certain measures to protect our information systems against unauthorized access and disclosure of personal information and of our confidential information and confidential information belonging to our customers. We have policies and procedures in place dealing with data security and records retention. However, there is no assurance that the security measures we have put in place will be effective in every case. Breaches in security could result in a negative impact for us and for our customers, affecting our and our customers' businesses, assets, revenues, brands and reputations and resulting in penalties, fines, litigation and other potential liabilities, in each case depending on the nature of the information disclosed. Security breaches could also affect our relations with our customers, injure our reputation and harm our ability to keep existing customers and to attract new customers. These risks to our business may increase as we expand the number of web-based and cloud-based products and services we offer and as we increase the number of countries in which we operate.
Our revenues and operating results are likely to fluctuate, which could materially impact the market price of our Common Shares
We experience significant fluctuations in revenues and operating results caused by many factors, including:
|
•
|
Changes in the demand for our software products and services and for the products and services of our competitors;
|
|
•
|
The introduction or enhancement of software products and services by us and by our competitors;
|
|
•
|
Market acceptance of our software products, enhancements and/or services;
|
|
•
|
Delays in the introduction of software products, enhancements and/or services by us or by our competitors;
|
|
•
|
Customer order deferrals in anticipation of upgrades and new software products;
|
|
•
|
Changes in the lengths of sales cycles;
|
|
•
|
Changes in our pricing policies or those of our competitors;
|
|
•
|
Delays in software product implementation with customers;
|
|
•
|
Change in the mix of distribution channels through which our software products are licensed;
|
|
•
|
Change in the mix of software products and services sold;
|
|
•
|
Change in the mix of international and North American revenues;
|
|
•
|
Changes in foreign currency exchange rates and LIBOR and other applicable interest rates;
|
|
•
|
Acquisitions and the integration of acquired businesses;
|
|
•
|
Restructuring charges taken in connection with any completed acquisition or otherwise;
|
|
•
|
Outcome and impact of tax audits and other contingencies;
|
|
•
|
Changes in general economic and business conditions; and
|
|
•
|
Changes in general political developments, such as international trade policies and policies taken to stimulate or to preserve national economies.
|
A general weakening of the global economy or a continued weakening of the economy in a particular region or economic or business uncertainty could result in the cancellation of or delay in customer purchases. A cancellation or deferral of even a small number of license sales or services or delays in the implementation of our software products could have a material adverse effect on our business, operating results and financial condition. As a result of the timing of software product and service introductions and the rapid evolution of our business as well as of the markets we serve, we cannot predict whether patterns or trends experienced in the past will continue. For these reasons, you should not rely upon period-to-period comparisons of our financial results to forecast future performance. Our revenues and operating results may vary significantly and this possible variance could materially reduce the market price of our Common Shares.
Changes in our stock price could lead to losses for shareholders
The market price of our Common Shares is subject to fluctuations. Such fluctuations in market price may continue in response to: (i) quarterly and annual variations in operating results; (ii) announcements of technological innovations or new products or services that are relevant to our industry; (iii) changes in financial estimates by securities analysts; or (iv) other events or factors. In addition, financial markets experience significant price and volume fluctuations that particularly affect the market prices of equity securities of many technology companies. These fluctuations have often resulted from the failure of such companies to meet market expectations in a particular quarter, and thus such fluctuations may or may not be related to the underlying operating performance of such companies. Broad market fluctuations or any failure of our operating results in a particular quarter to meet market expectations may adversely affect the market price of our Common Shares. Occasionally, periods of volatility in the market price of a company's securities may lead to the institution of securities class action litigation against a company. If we are subject to such volatility in our stock price, we may be the target of such securities litigation in the
19
future. Such legal action could result in substantial costs to defend our interests and a diversion of management's attention and resources, each of which would have a material adverse effect on our business and operating results.
We may become involved in litigation that may materially adversely affect us
From time to time in the ordinary course of our business, we may become involved in various legal proceedings, including commercial, product liability, employment, class action and other litigation and claims, as well as governmental and other regulatory investigations and proceedings. Such matters can be time-consuming, divert management's attention and resources and cause us to incur significant expenses. Furthermore, because litigation is inherently unpredictable, the results of any such actions may have a material adverse effect on our business, operating results or financial condition.
Our provision for income taxes and effective income tax rate may vary significantly and may adversely affect our results of operations and cash resources
Significant judgment is required in determining our provision for income taxes. Various internal and external factors may have favorable or unfavorable effects on our future provision for income taxes, income taxes receivable, and our effective income tax rate. These factors include, but are not limited to, changes in tax laws, regulations and/or rates, results of audits by tax authorities, changing interpretations of existing tax laws or regulations, changes in estimates of prior years' items, the impact of transactions we complete, future levels of research and development spending, changes in the valuation of our deferred tax assets and liabilities, transfer pricing adjustments, changes in the overall mix of income among the different jurisdictions in which we operate, and changes in overall levels of income before taxes. Changes in the tax laws of various jurisdictions in which we do business could result from the base erosion and profit shifting (BEPS) project being undertaken by the Organization for Economic Co-operation and Development (OECD). The OECD, a coalition of member countries, is developing recommendations for international tax rules to address different types of BEPS, including situations in which profits are shifted (or payments are made) from higher tax jurisdictions to lower tax jurisdictions. If these contemplated recommendations (or other changes in law) were to be adopted by the countries in which we do business, this could adversely affect our provision for income taxes and our effective tax rate. Furthermore, new accounting pronouncements or new interpretations of existing accounting pronouncements (such as those that may be described in note 2 “Significant Accounting Policies” in our notes to the Consolidated Financial Statements included in this Annual Report on Form 10-K), and/or any internal restructuring initiatives we may implement from time to time to streamline our operations, can have a material impact on our effective income tax rate.
Tax examinations are often complex as tax authorities may disagree with the treatment of items reported by us and our
transfer pricing methodology based upon our limited risk distributor model, the result of which could have a material adverse effect on our financial condition and results of operations. Although we believe our estimates are reasonable, the ultimate outcome with respect to the taxes we owe may differ from the amounts recorded in our financial statements, and this difference may materially affect our financial results in the period or periods for which such determination is made.
For more details of tax audits to which we are subject see notes 13 "Guarantees and Contingencies" and 14 "Income Taxes" to the Consolidated Financial Statements included in this Annual Report on Form 10-K.
As part of a tax examination by the United States Internal Revenue Service (“IRS”), we have received a Notice of Proposed Adjustment (“NOPA”) in draft form proposing a material increase to our taxes arising from the reorganization in Fiscal 2010. Based on our discussions with the IRS, we expect to receive an additional NOPA that will propose a material increase to our taxes arising in connection with our integration of Global 360 into the structure that resulted from our reorganization. An adverse outcome of these tax examinations could have a material adverse effect on our financial position and results of operations.
As we have previously disclosed, the IRS is examining certain of our tax returns for Fiscal 2010 through Fiscal 2012, and in connection with those examinations is reviewing our internal reorganization in Fiscal 2010 to consolidate certain intellectual property ownership in Luxembourg and Canada and our integration of certain acquisitions into the resulting structure. We also previously disclosed that the examinations may lead to proposed adjustments to our taxes that may be material, individually or in the aggregate, and that we have not recorded any material accruals for any such potential adjustments in our Consolidated Financial Statements.
As part of these examinations, on July 17, 2015 we received from the IRS a NOPA in draft form proposing a one-time approximately $280 million increase to our U.S. federal taxes arising from the reorganization in Fiscal 2010 and proposing penalties equal to 20% of the additional taxes, plus interest at the applicable statutory rate (which will continue to accrue until the matter is resolved and may be substantial). A NOPA is an IRS position and does not impose an obligation to pay tax. The draft NOPA may be changed before the final NOPA is issued, including because the IRS reserved the right in the draft NOPA to increase the adjustment. Based on our discussions with the IRS, we expect we will receive an additional NOPA proposing an approximately $80 million increase to our U.S. federal taxes for Fiscal 2012 arising from the integration of Global 360 into the
20
structure that resulted from the reorganization, accompanied by proposed penalties and interest (although there can be no assurance that this will be the amount reflected in the NOPA when received). Depending upon the outcome of these matters, additional state income taxes plus penalties and interest may be due.
We strongly disagree with the IRS’ position and intend to vigorously contest the proposed adjustments to our taxable income. We are examining various alternatives available to taxpayers to contest the proposed adjustments. Any such alternatives could involve a lengthy process and result in the incurrence of significant expenses. As of the date of this Annual Report on Form 10-K, we have not recorded any material accruals in respect of these examinations in our Consolidated Financial Statements. An adverse outcome of these tax examinations could have a material adverse effect on our financial position and results of operations.
The declaration, payment and amount of dividends will be made at the discretion of our Board of Directors and will depend on a number of factors
We have adopted a policy to declare non-cumulative quarterly dividends on our Common Shares. The declaration, payment and amount of any dividends will be made pursuant to our dividend policy and is subject to final determination each quarter by our Board of Directors in its discretion based on a number of factors that it deems relevant, including our financial position, results of operations, available cash resources, cash requirements and alternative uses of cash that our Board of Directors may conclude would be in the best interest of our shareholders. Our dividend payments are subject to relevant contractual limitations, including those in our existing credit agreements. Accordingly, there can be no assurance that any future dividends will be equal or similar in amount to any dividends previously paid or that our Board of Directors will not decide to reduce, suspend or discontinue the payment of dividends in the future.
Our operating results could be adversely affected by any weakening of economic conditions
Our overall performance depends in part on worldwide economic conditions. Certain economies have experienced periods of downturn as a result of a multitude of factors, including, but not limited to, turmoil in the credit and financial markets, concerns regarding the stability and viability of major financial institutions, declines in gross domestic product, increases in unemployment and volatility in commodity prices and worldwide stock markets, and excessive government debt. The severity and length of time that a downturn in economic and financial market conditions may persist, as well as the timing, strength and sustainability of any recovery, are unknown and are beyond our control. Moreover, any instability in the global economy affects countries in different ways, at different times and with varying severity, which makes the impact to our business complex and unpredictable. During such downturns, many customers may delay or reduce technology purchases. Contract negotiations may become more protracted or conditions could result in reductions in the licensing of our software products and the sale of cloud and other services, longer sales cycles, pressure on our margins, difficulties in collection of accounts receivable or delayed payments, increased default risks associated with our accounts receivables, slower adoption of new technologies and increased price competition. In addition, deterioration of the global credit markets could adversely impact our ability to complete licensing transactions and services transactions, including maintenance and support renewals. Any of these events, as well as a general weakening of, or declining corporate confidence in, the global economy, or a curtailment in government or corporate spending could delay or decrease our revenues and therefore have a material adverse effect on our business, operating results and financial condition.
Stress in the global financial system may adversely affect our finances and operations in ways that may be hard to predict or to defend against
Financial developments seemingly unrelated to us or to our industry may adversely affect us over the course of time. For example, material increases in LIBOR or other applicable interest rate benchmarks may increase the debt payment costs for our credit facilities. Credit contraction in financial markets may hurt our ability to access credit in the event that we identify an acquisition opportunity or require significant access to credit for other reasons. Similarly, volatility in our stock price due to seemingly unrelated financial developments could hurt our ability to raise capital for the financing of acquisitions or other reasons. Potential price inflation caused by an excess of liquidity in countries where we conduct business may increase the cost we incur to provide our solutions and may reduce profit margins on agreements that govern the licensing of our software products and/or the sale of our services to customers over a multi-year period. A reduction in credit, combined with reduced economic activity, may adversely affect businesses and industries that collectively constitute a significant portion of our customer base such as the public sector. As a result, these customers may need to reduce their licensing of our software products or their purchases of our services, or we may experience greater difficulty in receiving payment for the licenses and services that these customers purchase from us. Any of these events, or any other events caused by turmoil in world financial markets, may have a material adverse effect on our business, operating results, and financial condition.
21
Acquisitions, investments, joint ventures and other business initiatives may negatively affect our operating results
The growth of our Company through the successful acquisition and integration of complementary businesses is a critical component of our corporate strategy. Thus, we continue to seek opportunities to acquire or invest in businesses, products and technologies that expand, complement or otherwise relate to our current or future business. We may also consider, from time to time, opportunities to engage in joint ventures or other business collaborations with third parties to address particular market segments. These activities create risks such as: (i) the need to integrate and manage the businesses and products acquired with our own business and products; (ii) additional demands on our resources, systems, procedures and controls; (iii) disruption of our ongoing business; and (iv) diversion of management's attention from other business concerns. Moreover, these transactions could involve: (a) substantial investment of funds or financings by issuance of debt or equity securities; (b) substantial investment with respect to technology transfers and operational integration; and (c) the acquisition or disposition of product lines or businesses. Also, such activities could result in one-time charges and expenses and have the potential to either dilute the interests of existing shareholders or result in the issuance or assumption of debt. Such acquisitions, investments, joint ventures or other business collaborations may involve significant commitments of financial and other resources of our Company. Any such activity may not be successful in generating revenues, income or other returns to us, and the resources committed to such activities will not be available to us for other purposes. Moreover, if we are unable to access capital markets on acceptable terms or at all, we may not be able to consummate acquisitions, or may have to do so on the basis of a less than optimal capital structure. Our inability (i) to take advantage of growth opportunities for our business or for our products and services, or (ii) to address risks associated with acquisitions or investments in businesses, may negatively affect our operating results. Additionally, any impairment of goodwill or other intangible assets acquired in an acquisition or in an investment, or charges associated with any acquisition or investment activity, may materially impact our results of operations which, in turn, may have an adverse material effect on the price of our Common Shares.
Businesses we acquire may have disclosure controls and procedures and internal controls over financial reporting that are weaker than or otherwise not in conformity with ours
We have a history of acquiring complementary businesses of varying size and organizational complexity. Upon consummating an acquisition, we seek to implement our disclosure controls and procedures as well as our internal controls over financial reporting at the acquired company as promptly as possible. Depending upon the nature of the business acquired, the implementation of our disclosure controls and procedures as well as the implementation of our internal controls over financial reporting at an acquired company may be a lengthy process. We conduct due diligence prior to consummating an acquisition; however, such diligence may not identify all material issues and our integration efforts may periodically expose deficiencies in the disclosure controls and procedures as well as in internal controls over financial reporting of an acquired company. If such deficiencies exist, we may not be in a position to comply with our periodic reporting requirements and, as a result, our business and financial condition may be materially harmed.
We may be unable to successfully integrate acquired businesses or do so within the intended timeframes,
which could have an adverse effect on our financial condition, results of operations and business prospects.
Our ability to realize the anticipated benefits of acquired businesses will depend, in part, on our ability to successfully and efficiently integrate acquired businesses and operations with our own. The integration of acquired operations with our existing business will be complex, costly and time-consuming, and may result in additional demands on our resources, systems, procedures and controls, disruption of our ongoing business, and diversion of management’s attention from other business concerns. Although we cannot be certain of the degree and scope of operational and integration problems that may arise, the difficulties and risks associated with the integration of acquired businesses may include, among others:
|
•
|
the increased scope and complexity of our operations;
|
|
•
|
coordinating geographically separate organizations, operations, relationships and facilities;
|
|
•
|
integrating (i) personnel with diverse business backgrounds, corporate cultures and management philosophies, and (ii) the standards, policies and compensation structures, as well as the complex systems, technology, networks and other assets, of the companies;
|
|
•
|
preserving important strategic and customer relationships;
|
|
•
|
the possibility that we may have failed to discover liabilities of acquired businesses during our due diligence investigations as part of the acquisition for which we, as a successor owner, may be responsible; and
|
|
•
|
provisions in contracts with third parties that may limit flexibility to take certain actions.
|
As a result of these difficulties and risks, we may not accomplish the integration of acquired businesses smoothly, successfully or within our budgetary expectations and anticipated timetables, which may result in a failure to realize some or all of the anticipated benefits of our acquisitions.
22
Our indebtedness could limit our operations and opportunities.
Our debt service obligations could have an adverse effect on our earnings and cash flows for as long as the indebtedness is outstanding, which could reduce the availability of our cash flow to fund working capital, capital expenditures, acquisitions and other general corporate purposes.
As of June 30, 2015, our credit facilities consisted of a $800 million term loan facility (Term Loan B) and a $300 million committed revolving credit facility (the Revolver). Borrowings under Term Loan B and the Revolver, if any, are or will be secured by a first charge over substantially all of our assets.
Repayments made under Term Loan B are equal to 0.25% of the original principal amount in equal quarterly installments for the life of Term Loan B, with the remainder due at maturity. The terms of Term Loan B (and to the extent there are outstanding amounts thereunder, the Revolver) include customary restrictive covenants that impose operating and financial restrictions on us, including restrictions on our ability to take actions that could be in our best interests. These restrictive covenants include certain limitations on our ability to make investments, loans and acquisitions, incur additional debt, incur liens and encumbrances, consolidate, amalgamate or merge with any other person, dispose of assets, make certain restricted payments, including a limit on dividends on equity securities or payments to redeem, repurchase or retire equity securities or other indebtedness, engage in transactions with affiliates, materially alter the business we conduct, and enter into certain restrictive agreements. Term Loan B (and to the extent there are outstanding amounts thereunder, the Revolver) includes a financial covenant relating to a maximum consolidated net leverage ratio, which could restrict our operations, particularly our ability to respond to changes in our business or to take specified actions. Our failure to comply with any of the covenants that are included in Term Loan B (and to the extent there are outstanding amounts thereunder, the Revolver) could result in a default under the terms thereof, which could permit the lenders thereunder to declare all or part of any outstanding borrowings to be immediately due and payable.
On January 15, 2015, we issued $800.0 million in aggregate principal amount of our 5.625% senior unsecured notes due 2023 (Senior Notes) in a private placement to qualified institutional buyers pursuant to Rule 144A under the Securities Act and to certain persons in offshore transactions pursuant to Regulation S under the Securities Act. The Senior Notes bear interest at a rate of 5.625% per annum, are payable semi-annually in arrears on January 15 and July 15 and will mature on January 15, 2023, unless earlier redeemed, in accordance with their terms, or repurchased. Our failure to comply with any of the covenants that are included in the indenture governing the Senior Notes could result in a default under the terms thereof, which could result in all or part of any outstanding borrowings to be immediately due and payable.
The risks discussed above would be increased to the extent that we engage in acquisitions that involve the incurrence of material debt.
For more details see note 10 "Long-Term Debt" to the Consolidated Financial Statements included in this Annual Report on Form 10-K.
None.
Our properties consist of owned and leased office facilities for sales, support, research and development, consulting and administrative personnel, totaling approximately 336,000 square feet of owned facilities and approximately
1,795,000
square feet of leased facilities.
Owned Facilities
Waterloo, Ontario, Canada
Our headquarters is located in Waterloo, Ontario, Canada, and it consists of approximately 232,000 square feet. The land upon which the buildings stand is leased from the University of Waterloo for a period of 49 years beginning in December 2005, with an option to renew for an additional term of 49 years. The option to renew is exercisable by us upon providing written notice to the University of Waterloo not earlier than the 40th anniversary and not later than the 45th anniversary of the lease commencement date.
Brook Park, Ohio, United States
We own land and a building located in Brook Park, Ohio, that consists of approximately 104,000 square feet. This building is used primarily as a data center.
23
Leased Facilities
We lease approximately
1,795,000
square feet both domestically and internationally. Our significant leased facilities include the following facilities:
|
•
|
Hyderabad facility, located in India, totaling approximately 147,000 square feet;
|
|
•
|
Grasbrunn facility, located in Germany, totaling approximately 123,000 square feet of office and storage;
|
|
•
|
Richmond Hill facility, located in Ontario, Canada, totaling approximately 101,000 square feet;
|
|
•
|
Tinton Falls facility, located in New Jersey, United States, totaling approximately 90,000 square feet;
|
|
•
|
Gaithersburg facility, located in Maryland, United States, totaling approximately 84,000 square feet;
|
|
•
|
Makati City facility, located in Manila, Philippines, totaling approximately 79,000 square feet;
|
|
•
|
San Mateo facility, located in California, United States, totaling approximately 54,000 square feet; and
|
|
•
|
Alpharetta facility, located in Georgia, United States, totaling approximately 54,000 square feet;
|
Due to restructuring and merger integration initiatives, we have vacated approximately 202,000 square feet of our leased properties. The vacated space has either been sublet or is being actively marketed for sublease or disposition.
In addition we also maintain a customer briefing centre and management office in Toronto, Ontario, Canada.
In the normal course of business, we are subject to various legal claims, as well as potential legal claims. While the results of litigation and claims cannot be predicted with certainty, we believe that the final outcome of these matters will not have a materially adverse effect on our consolidated results of operations or financial conditions.
For more information regarding litigation and the status of certain regulatory and tax proceedings, please refer to Part I, Item 1A "Risk Factors" and to note 13 “Guarantees and Contingencies” to our Consolidated Financial Statements, which are set forth in Part II, under Item 8 of this Annual Report on Form 10-K.
Not applicable.
|
Item 5.
|
Market for Registrant's Common Equity, Related Stockholder Matters and Issuer Purchases of Equity Securities
|
Our Common Shares have traded on the NASDAQ stock market since 1996 under the symbol “OTEX” and our Common Shares have traded on the Toronto Stock Exchange (TSX) since 1998 under the symbol “OTC”.
The following table sets forth the high and low sales prices for our Common Shares, as reported by the TSX and NASDAQ, respectively, for the periods indicated below.
|
|
NASDAQ
(in USD)
|
TSX
(in CAD)
|
||
|
|
High
|
Low
|
High
|
Low
|
|
Fiscal Year Ended June 30, 2015:
|
||||
|
Fourth Quarter
|
$58.43
|
$39.93
|
$71.66
|
$49.46
|
|
Third Quarter
|
$61.74
|
$52.38
|
$76.71
|
$64.50
|
|
Second Quarter
|
$60.44
|
$51.00
|
$69.39
|
$57.29
|
|
First Quarter
|
$58.71
|
$46.85
|
$64.72
|
$50.10
|
|
Fiscal Year Ended June 30, 2014:
|
||||
|
Fourth Quarter
|
$49.97
|
$44.76
|
$55.16
|
$49.23
|
|
Third Quarter
|
$52.86
|
$44.05
|
$58.03
|
$48.20
|
|
Second Quarter
|
$46.65
|
$35.05
|
$49.66
|
$36.63
|
|
First Quarter
|
$37.95
|
$32.24
|
$39.09
|
$33.53
|
24
On July 27, 2015, the closing price of our Common Shares on the NASDAQ was $36.90 per share, and on the TSX was Canadian $48.11 per share.
As at July 27, 2015, we had 353 shareholders of record holding our Common Shares of which 306 were U.S. shareholders.
Unregistered Sales of Equity Securities
None.
Dividend Policy
Pursuant to a policy adopted by our Board of Directors in April 2013 to pay non-cumulative quarterly dividends, we paid our first quarterly cash dividend in June 2013. We currently expect to continue paying comparable cash dividends on a quarterly basis. However, future declarations of dividends are subject to the final determination of our Board of Directors, in its discretion, based on a number of factors that it deems relevant, including our financial position, results of operations, available cash resources, cash requirements and alternative uses of cash that our Board of Directors may conclude would be in the best interest of our shareholders. Our dividend payments are subject to relevant contractual limitations, including those in our existing credit agreements. We have historically declared dividends in U.S. dollars, but registered shareholders can elect to receive dividiends in U.S. dollars or Canadian dollars by contacting the Company's transfer agent.
In Fiscal 2015, our Board of Directors declared the following dividends:
|
Declaration Date
|
Dividend per Share
|
Record Date
|
Total amount (in thousands of U.S. dollars)
|
Payment Date
|
||||||||
|
4/27/2015
|
$
|
0.2000
|
|
5/29/2015
|
$
|
24,455
|
|
6/19/2015
|
||||
|
1/26/2015
|
$
|
0.1725
|
|
2/26/2015
|
$
|
21,075
|
|
3/19/2015
|
||||
|
10/22/2014
|
$
|
0.1725
|
|
11/21/2014
|
$
|
21,054
|
|
12/12/2014
|
||||
|
7/30/2014
|
$
|
0.1725
|
|
8/29/2014
|
$
|
21,045
|
|
9/19/2014
|
||||
In Fiscal 2014, our Board of Directors declared the following dividends:
|
Declaration Date
|
Dividend per Share
|
Record Date
|
Total amount (in thousands of U.S. dollars)
|
Payment Date
|
||||||||
|
4/24/2014
|
$
|
0.1725
|
|
5/23/2014
|
$
|
21,001
|
|
6/13/2014
|
||||
|
1/23/2014
|
$
|
0.1500
|
|
2/25/2014
|
$
|
18,224
|
|
3/14/2014
|
||||
|
10/30/2013
|
$
|
0.1500
|
|
11/29/2013
|
$
|
17,747
|
|
12/20/2013
|
||||
|
7/31/2013
|
$
|
0.1500
|
|
8/30/2013
|
$
|
17,721
|
|
9/20/2013
|
||||
Stock Purchases
PURCHASE OF EQUITY SECURITIES OF THE COMPANY
FOR THE THREE MONTHS ENDED JUNE 30, 2015
|
Period
|
(a) Total
Number of Shares (or Units) Purchased |
(b)
Average Price Paid per Share (or Unit) |
(c) Total
Number of Shares (or Units) Purchased as Part of Publicly Announced Plans or Programs |
(d) Maximum
Number of Shares (or Units) that May Yet Be Purchased Under the Plans or Programs |
|||||||||
|
04/01/15 to 04/31/15
|
—
|
|
$
|
—
|
|
—
|
|
—
|
|
||||
|
05/01/15 to 05/31/15
|
—
|
|
$
|
—
|
|
—
|
|
—
|
|
||||
|
06/01/15 to 06/30/15
|
218,000
|
|
$
|
42.69
|
|
—
|
|
17,845
|
|
||||
|
Total
|
218,000
|
|
$
|
42.69
|
|
—
|
|
17,845
|
|
||||
25
The above represents Common Shares repurchased for potential reissuance under our Long Term Incentive Plans (LTIP) or otherwise. For more details of this repurchase, please see “Treasury Stock” under note 12 “Share Capital, Option Plans and Share-based Payments” to our Consolidated Financial Statements.
Normal Course Issuer Bid
On July 28, 2015, our board of directors authorized the repurchase of up to
$200 million
of our Common Shares. Shares may be repurchased from time to time in the open market, private purchases through forward, derivative, accelerated repurchase or automatic repurchase transactions or otherwise. Certain of our share repurchases may from time to time be effected through repurchase plans. The timing of any repurchases will depend on market conditions, our financial condition, results of operations, liquidity and other factors.
Stock Performance Graph and Cumulative Total Return
The following graph compares for each of the five fiscal years ended June 30, 2015 the yearly percentage change in the cumulative total shareholder return on our Common Shares with the cumulative total return on:
|
•
|
an index of companies in the software application industry (Morningstar Application-Software Index);
|
|
•
|
the NASDAQ Composite Index; and
|
|
•
|
the S&P/TSX Composite Index.
|
The graph illustrates the cumulative return on a $100 investment in our Common Shares made on June 30, 2010, as compared with the cumulative return on a $100 investment in the Morningstar Application-Software Index, the NASDAQ Composite Index and the S&P/TSX Composite Index (the Indices) made on the same day. Dividends declared on securities comprising the respective Indices and declared on our Common Shares are assumed to be reinvested. The performance of our Common Shares as set out in the graph is based upon historical data and is not indicative of, nor intended to forecast, future performance of our Common Shares. The graph lines merely connect measurement dates and do not reflect fluctuations between those dates.
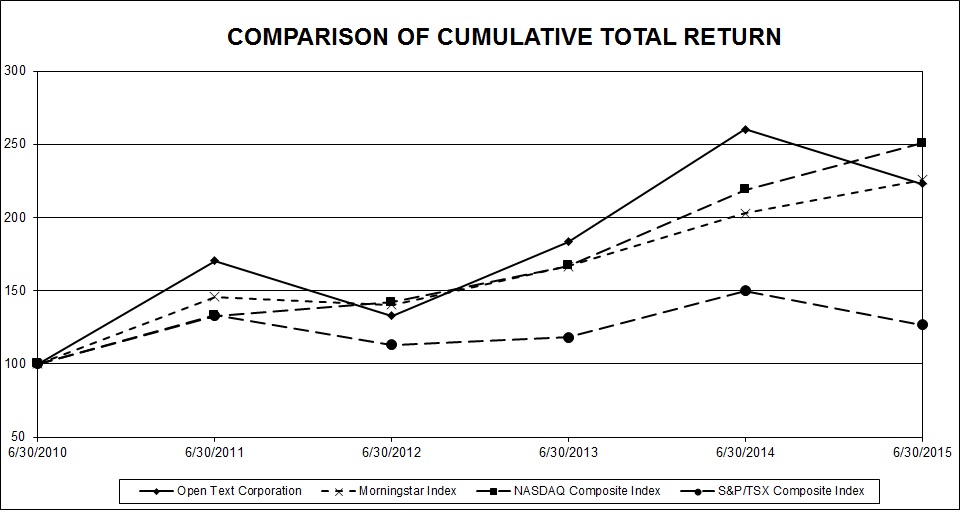
The chart below provides information with respect to the value of $100 invested on June 30, 2010 in our Common Shares as well as in the other Indices, assuming dividend reinvestment when applicable:
26
|
|
June 30,
2010 |
June 30,
2011 |
June 30,
2012 |
June 30,
2013 |
June 30,
2014 |
June 30,
2015 |
|
Open Text Corporation
|
$100.00
|
$170.54
|
$132.92
|
$183.22
|
$260.24
|
$223.01
|
|
Morningstar Application-Software Index
|
$100.00
|
$145.70
|
$140.40
|
$166.60
|
$202.78
|
$225.57
|
|
NASDAQ Composite
|
$100.00
|
$132.73
|
$142.01
|
$167.01
|
$219.06
|
$250.68
|
|
S&P/TSX Composite
|
$100.00
|
$133.09
|
$113.06
|
$118.03
|
$149.86
|
$126.56
|
To the extent that this Annual Report on Form 10-K has been or will be specifically incorporated by reference into any filing by us under the Securities Act or the Exchange Act, the foregoing “Stock Performance Graph and Cumulative Total Return” shall not be deemed to be “soliciting materials” or to be so incorporated, unless specifically otherwise provided in any such filing.
For information relating to our various stock compensation plans, see Item 12 of this Annual Report on Form 10-K.
Canadian Tax Matters
Dividends
Since June 21, 2013 and unless stated otherwise, dividends paid by the Company to Canadian residents are eligible dividends as per the Income Tax Act (Canada).
Non-residents of Canada
Dividends paid or credited to non-residents of Canada are subject to a 25% withholding tax unless reduced by treaty. Under current tax treaties, U.S. residents are subject to a 15% withholding tax.
Beginning in calendar year 2012, the Canada Revenue Agency has introduced new rules requiring residents of any country with which Canada has a tax treaty to certify that they reside in that country and are eligible to have Canadian non-resident tax withheld on the payment of dividends at the tax treaty rate. Registered shareholders should have completed the Declaration of Eligibility for Benefits under a Tax Treaty for a Non-Resident Taxpayer and returned it to our transfer agent, ComputerShare Investor Services Inc.
United States Tax Matters
U.S. residents
T
he following discussion summarizes certain U.S. federal income tax considerations relevant to an investment in the Common Shares by a U.S. holder. For purposes of this summary, a “U.S. holder” is a beneficial owner of Common Shares that holds such shares as capital assets under the U.S. Internal Revenue Code of 1986, as amended (the Code) and is a citizen or resident of the United States and not of Canada, a corporation organized under the laws of the United States or any political subdivision thereof, or a person that is otherwise subject to U.S. federal income tax on a net income basis in respect of Common Shares. It does not address any aspect of U.S. federal gift or estate tax, or of state, local or non-U.S. tax laws and does not address aspects of U.S. federal income taxation applicable to U.S. holders holding options, warrants or other rights to acquire Common Shares. Further, this discussion does not address the U.S. federal income tax consequences to U.S. holders that are subject to special treatment under U.S. federal income tax laws, including, but not limited to U.S. holders owning directly, indirectly or by attribution 10% or more of the Company’s voting power; broker-dealers; banks or insurance companies; financial institutions; regulated investment companies; taxpayers who have elected mark-to-market accounting; tax-exempt organizations; taxpayers who hold Common Shares as part of a “straddle,” “hedge,” or “conversion transaction” with other investments; individual retirement or other tax-deferred accounts; taxpayers whose functional currency is not the U.S. dollar; partnerships or the partners therein; S corporations; or U.S. expatriates.
The discussion is based upon the provisions of the Code, the Treasury regulations promulgated thereunder, the Convention Between the United States and Canada with Respect to Taxes on Income and Capital, together with related Protocols and Competent Authority Agreements (the Convention), the administrative practices published by the U.S. Internal Revenue Service (the IRS) and U.S. judicial decisions, all of which are subject to change. This discussion does not consider the potential effects, both adverse and beneficial, of any recently proposed legislation which, if enacted, could be applied, possibly on a retroactive basis, at any time.
Distributions on the Common Shares
27
Subject to the discussion below under “Passive Foreign Investment Company Rules,” U.S. holders generally will treat the gross amount of distributions paid by the Company equal to the U.S. dollar value of such dividends on the date the dividends are received or treated as received (based on the exchange rate on such date), without reduction for Canadian withholding tax (see “Canadian Tax Matters - Dividends - Non-residents of Canada”), as dividend income for U.S. federal income tax purposes to the extent of the Company’s current and accumulated earnings and profits. Because the Company does not expect to maintain calculations of its earnings and profits under U.S. federal income tax principles, it is expected that distributions paid to U.S. holders generally will be reported as dividends.
Individual U.S. holders will generally be eligible to treat dividends as “qualified dividend income” taxable at preferential rates with certain exceptions for short-term and hedged positions, and provided that the Company is not during the taxable year in which the dividends are paid (and was not in the preceding taxable year) classified as a “passive foreign investment company” (PFIC) as described below under “Passive Foreign Investment Company Rules.” Dividends paid on the Common Shares generally will not be eligible for the “dividends received” deduction allowed to corporate U.S. holders in respect of dividends from U.S. corporations.
If a U.S. holder receives foreign currency on a distribution that is not converted into U.S. dollars on the date of receipt, the U.S. holder will have a tax basis in the foreign currency equal to its U.S. dollar value on the date the dividends are received or treated as received. Any gain or loss recognized upon a subsequent sale or other disposition of the foreign currency, including an exchange for U.S. dollars, will be U.S. source ordinary income or loss.
The amount of Canadian tax withheld generally will give rise to a foreign tax credit or deduction for U.S. federal income tax purposes (see “Canadian Tax Matters - Dividends - Non-residents of Canada”). Dividends paid by the Company generally will constitute “passive category income” for purposes of the foreign tax credit (or in the case of certain U.S. holders, “general category income”). The Code, as modified by the Convention, applies various limitations on the amount of foreign tax credit that may be available to a U.S. taxpayer. The Common Shares are currently traded on both the NASDAQ and TSX. Dividends paid by a foreign corporation that is at least 50% owned by U.S. persons may be treated as U.S. source income (rather than foreign source income) for foreign tax credit purposes to the extent they are attributable to earnings and profits of the foreign corporation from sources within the United States, if the foreign corporation has more than an insignificant amount of U.S. source earnings and profits. Although this rule does not appear to be intended to apply in the context of a public company such as the Company, we are not aware of any authority that would render it inapplicable. In part because the Company does not expect to calculate its earnings and profits for U.S. federal income tax purposes, the effect of this rule may be to treat all or a portion of any dividends paid by the Company as U.S. source income, which in turn may limit a U.S. holder’s ability to claim a foreign tax credit for the Canadian withholding taxes payable in respect of the dividends. Subject to limitations, the Code permits a U.S. holder entitled to benefits under the Convention to elect to treat any dividends paid by the Company as foreign-source income for foreign tax credit purposes. The foreign tax credit rules are complex. U.S. holders should consult their own tax advisors with respect to the implications of those rules for their investments in the Common Shares.
Sale, Exchange, Redemption or Other Disposition of Common Shares
Subject to the discussion below under “Passive Foreign Investment Company Rules,” the sale of Common Shares generally will result in the recognition of gain or loss to a U.S. holder in an amount equal to the difference between the amount realized and the U.S. holder’s adjusted basis in the Common Shares. A U.S. holder’s tax basis in a Common Share will generally equal the price it paid for the Common Share. Any capital gain or loss will be long-term if the Common Shares have been held for more than one year. The deductibility of capital losses is subject to limitations.
Passive Foreign Investment Company Rules
Special U.S. federal income tax rules apply to U.S. persons owning shares of a PFIC. The Company will be classified as a PFIC in a particular taxable year if either: (i) 75 percent or more of the Company’s gross income for the taxable year is passive income, or (ii) the average percentage of the value of the Company’s assets that produce or are held for the production of passive income is at least 50 percent. If the Company is treated as a PFIC for any year, U.S. holders may be subject to adverse tax consequences upon a sale, exchange, or other disposition of the Common Shares, or upon the receipt of certain “excess distributions” in respect of the Common Shares. Dividends paid by a PFIC are not qualified dividends eligible for taxation at preferential rates. Based on audited consolidated financial statements, we believe that the Company was not treated as a PFIC for U.S. federal income tax purposes with respect to its 2014 or 2015 taxable years. In addition, based on a review of the Company’s audited consolidated financial statements and its current expectations regarding the value and nature of its assets and the sources and nature of its income, the Company does not anticipate becoming a PFIC for the 2016 taxable year.
28
Information Reporting and Backup Withholding
Except in the case of corporations or other exempt holders, dividends paid to a U.S. holder may be subject to U.S. information reporting requirements and may be subject to backup withholding unless the U.S. holder provides an accurate taxpayer identification number on a properly completed IRS Form W-9 and certifies that no loss of exemption from backup withholding has occurred. The amount of any backup withholding will be allowed as a credit against the U.S. holder’s U.S. federal income tax liability and may entitle the U.S. holder to a refund, provided that certain required information is timely furnished to the IRS.
|
Item 6.
|
Selected Financial Data
|
The following table summarizes our selected consolidated financial data for the periods indicated. The selected consolidated financial data should be read in conjunction with our Consolidated Financial Statements and related notes and “Management's Discussion and Analysis of Financial Condition and Results of Operations” appearing elsewhere in this Annual Report on Form 10-K. The selected consolidated statement of income and balance sheet data for each of the five fiscal years indicated below has been derived from our audited Consolidated Financial Statements. Over the last five fiscal years we have acquired a number of companies including, but not limited to, Actuate Corporation, GXS Group, Inc., EasyLink Services International Corp., Global 360 Holding Corp. and Metastorm Inc. The results of these companies and all of our previously acquired companies have been included herein and have contributed to the growth in our revenues, net income and net income per share and such acquisitions affect period-to-period comparability.
|
Fiscal Year Ended June 30,
|
|||||||||||||||
|
2015
|
2014
|
2013
|
2012
|
2011
|
|||||||||||
|
(In thousands, except per share data)
|
|||||||||||||||
|
Statement of Income Data:
|
|||||||||||||||
|
Revenues
|
$
|
1,851,917
|
|
$
|
1,624,699
|
|
$
|
1,363,336
|
|
$
|
1,207,473
|
|
$
|
1,033,303
|
|
|
Net income, attributable to OpenText
|
$
|
234,327
|
|
$
|
218,125
|
|
$
|
148,520
|
|
$
|
125,174
|
|
$
|
123,203
|
|
|
Net income per share, basic, attributable to OpenText
|
$
|
1.92
|
|
$
|
1.82
|
|
$
|
1.27
|
|
$
|
1.08
|
|
$
|
1.08
|
|
|
Net income per share, diluted, attributable to OpenText
|
$
|
1.91
|
|
$
|
1.81
|
|
$
|
1.26
|
|
$
|
1.07
|
|
$
|
1.06
|
|
|
Weighted average number of Common Shares outstanding, basic
|
122,092
|
|
119,674
|
|
117,208
|
|
115,780
|
|
114,154
|
|
|||||
|
Weighted average number of Common Shares outstanding, diluted
|
122,957
|
|
120,576
|
|
118,124
|
|
117,468
|
|
116,520
|
|
|||||
|
As of June 30,
|
||||||||||||||||
|
2015
|
2014
|
2013
|
2012
|
2011
|
||||||||||||
|
Balance Sheet Data:
|
||||||||||||||||
|
Total assets
|
$
|
4,388,495
|
|
$
|
3,899,698
|
|
$
|
2,654,817
|
|
$
|
2,444,293
|
|
$
|
1,932,363
|
|
|
|
Long-term liabilities *
|
$
|
1,933,254
|
|
$
|
1,616,330
|
|
$
|
789,726
|
|
$
|
788,107
|
|
$
|
477,545
|
|
|
|
Cash dividends per Common Share
|
$
|
0.7175
|
|
$
|
0.6225
|
|
$
|
0.1500
|
|
**
|
$
|
—
|
|
$
|
—
|
|
* includes long term debt
** We paid our first dividend in June 2013.
This
Annual Report
on Form
10-K
, including this Management's Discussion and Analysis of Financial Condition and Results of Operations (MD&A), contains forward-looking statements within the meaning of the Private Securities Litigation Reform Act of 1995, Section 21E of the U.S. Securities Exchange Act of 1934, as amended (the Exchange Act), and Section 27A of the U.S. Securities Act of 1933, as amended (the Securitie
s
Act
),
and is subject to the safe harbours created by those sections. All statements other than statements of historical facts are statements that could be deemed forward-looking statements.
When used in this report, the words “anticipates”, “expects”, “intends”, “plans”, “believes”, “seeks”, “estimates”, “may”, “could”, “would”, "might", "will" and other similar language, as they relate to Open Text Corporation (“OpenText” or the “Company”), are intended to identify forward-looking statements under applicable securities laws. Specific forward-looking
29
statements in this report include, but are not limited to: (i) statements about our focus in the fiscal year beginning July 1, 2015 and ending June 30, 2016 (Fiscal 2016) on growth in earnings and cash flows; (ii) creating value through investments in broader Enterprise Information Management (EIM) capabilities; (iii) our future business plans and business planning process; (iv) statements relating to business trends; (v) statements relating to distribution; (vi) the Company’s presence in the cloud and in growth markets; (vii) product and solution developments, enhancements and releases and the timing thereof; (viii) the Company’s financial conditions, results of operations and earnings; (ix) the basis for any future growth and for our financial performance; (x) declaration of quarterly dividends; (xi) the changing regulatory environment and its impact on our business; (xii) recurring revenues; (xiii) research and development and related expenditures; (xiv) our building, development and consolidation of our network infrastructure; (xv) competition and changes in the competitive landscape; (xvi) our management and protection of intellectual property and other proprietary rights; (xvii) foreign sales and exchange rate fluctuations; (xviii) cyclical or seasonal aspects of our business; (xix) capital expenditures; (xx) potential legal and/or regulatory proceedings; and (xxi) other matters.
In addition, any statements or information that refer to expectations, beliefs, plans, projections, objectives, performance or other characterizations of future events or circumstances, including any underlying assumptions, are forward-looking, and based on our current expectations, forecasts and projections about the operating environment, economies and markets in which we operate. Forward-looking statements reflect our current estimates, beliefs and assumptions, which are based on management’s perception of historic trends, current conditions and expected future developments, as well as other factors it believes are appropriate in the circumstances. The forward-looking statements contained in this report are based on certain assumptions including the following: (i) countries continuing to implement and enforce existing and additional customs and security regulations relating to the provision of electronic information for imports and exports; (ii) our continued operation of a secure and reliable business network; (iii) the stability of general economic and market conditions, currency exchange rates, and interest rates; (iv) equity and debt markets continuing to provide us with access to capital; (v) our continued ability to identify and source attractive and executable business combination opportunities; and (vi) our continued compliance with third party intellectual property rights. Management’s estimates, beliefs and assumptions are inherently subject to significant business, economic, competitive and other uncertainties and contingencies regarding future events and, as such, are subject to change. We can give no assurance that such estimates, beliefs and assumptions will prove to be correct.
Forward-looking statements involve known and unknown risks, uncertainties and other factors that may cause our actual results, performance or achievements to differ materially from the anticipated results, performance or achievements expressed or implied by such forward-looking statements. The risks and uncertainties that may affect forward-looking statements include, but are not limited to: (i) integration of acquisitions and related restructuring efforts, including the quantum of restructuring charges and the timing thereof; (ii) the possibility that the Company may be unable to meet its future reporting requirements under the Exchange Act, and the rules promulgated thereunder; (iii) the risks associated with bringing new products and services to market; (iv) fluctuations in currency exchange rates; (v) delays in the purchasing decisions of the Company’s customers; (vi) the competition the Company faces in its industry and/or marketplace; (vii) the final determination of litigation, tax audits (including tax examinations in the United States or elsewhere) and other legal proceedings; (viii) potential exposure to greater than anticipated tax liabilities or expenses, including with respect to changes in Canadian, U.S. or international tax regimes; (ix) the possibility of technical, logistical or planning issues in connection with the deployment of the Company’s products or services; (x) the continuous commitment of the Company’s customers; (xi) demand for the Company’s products and services; (xii) increase in exposure to international business risks as we continue to increase our international operations; (xiii) inability to raise capital at all or on not unfavorable terms in the future; and (xiv) downward pressure on our share price and dilutive effect of future sales or issuances of equity securities. Other factors that may affect forward-looking statements include, but are not limited to: (i) the future performance, financial and otherwise, of the Company; (ii) the ability of the Company to bring new products and services to market and to increase sales; (iii) the strength of the Company’s product development pipeline; (iv) failure to secure and protect patents, trademarks and other proprietary rights; (v) infringement of third-party proprietary rights triggering indemnification obligations and resulting in significant expenses or restrictions on our ability to provide our products or services; (vi) failure to comply with privacy laws and regulations that are extensive, open to various interpretations and complex to implement; (vii) the Company’s growth and profitability prospects; (viii) the estimated size and growth prospects of the EIM market; (ix) the Company’s competitive position in the EIM market and its ability to take advantage of future opportunities in this market; (x) the benefits of the Company’s products and services to be realized by customers; (xi) the demand for the Company’s products and services and the extent of deployment of the Company’s products and services in the EIM marketplace; (xii) the Company’s financial condition and capital requirements; (xiii) system or network failures or information security breaches in connection with our services and products; and (xiv) failure to attract and retain key personnel to develop and effectively manage our business.
Readers should carefully review Part I, Item 1A “Risk Factors” and other documents we file from time to time with the Securities and Exchange Commission and other applicable securities regulators. A number of factors may materially affect our business, financial condition, operating results and prospects. These factors include but are not limited to those set forth in Part I, Item 1A “Risk Factors” and elsewhere in this Annual Report on Form 10-K. Any one of these factors, and other factors that we are unaware of, or currently deem immaterial, may cause our actual results to differ materially from recent results or from our anticipated future results.
30
The following MD&A is intended to help readers understand our results of operations and financial condition, and is provided as a supplement to, and should be read in conjunction with, our
Consolidated Financial Statements
and the accompanying Notes to our
Consolidated Financial Statements
under Part II, Item 8 of this
Annual Report
on Form
10-K
.
All dollar and percentage comparisons made herein under the sections titled “Fiscal 2015 Compared to Fiscal 2014” refer to Fiscal 2015 compared with the twelve months ended June 30, 2014 (Fiscal 2014). All dollar and percentage comparisons made herein under the sections titled “Fiscal 2014 Compared to Fiscal 2013” refer to Fiscal 2014 compared with the twelve months ended June 30, 2013 (Fiscal 2013).
Where we say “we”, “us”, “our”, “OpenText” or “the Company”, we mean Open Text Corporation or Open Text Corporation and its subsidiaries, as applicable.
EXECUTIVE OVERVIEW
We operate in the Enterprise Information Market (EIM). We are an independent company providing a comprehensive suite of software products and services that assist organizations in finding, utilizing, and sharing business information from any device in ways which are intuitive, efficient and productive. Our technologies and business solutions address one of the biggest problems encountered by enterprises today: the explosive growth of information volume and formats. Our software and services allow organizations to manage the information that flows into, out of, and throughout the enterprise as part of daily operations. Our solutions help to increase customer satisfaction, improve collaboration with partners, address the legal and business requirements associated with information governance, and aim to ensure that information remains secure and private, as demanded in today's highly regulated climate.
Our products and services provide the benefits of maximizing the value of enterprise information while minimizing its risks. Our solutions incorporate social and mobile technologies and are delivered for on-premises deployment as well as through cloud and managed hosted services models to provide the flexibility and cost efficiencies demanded by the market. In addition, we provide solutions that facilitate the exchange of transactions that occur between supply chain participants, such as manufacturers, retailers, distributors and financial institutions, and are central to a company’s ability to effectively collaborate with its partners.
Our initial public offering was on the NASDAQ in 1996 and we were subsequently listed on the Toronto Stock Exchange in 1998. We are a multinational company and as of
June 30, 2015
, employed approximately
8,500
people worldwide.
Fiscal 2015 Summary:
During Fiscal 2015 we saw the following activity:
|
•
|
Total revenue was
$1,851.9 million
, up
14.0%
over the prior fiscal year.
|
|
•
|
Total recurring revenue was
$1,557.7 million
, up
18.1%
over the prior fiscal year.
|
|
•
|
Cloud services and subscription revenue was
$605.3 million
, up
62.1%
over the prior fiscal year.
|
|
•
|
License revenue was
$294.3 million
, down
3.8%
over the prior fiscal year.
|
|
•
|
GAAP-based EPS, diluted, was
$1.91
compared to
$1.81
in the prior fiscal year.
|
|
•
|
Non-GAAP-based EPS, diluted, was
$3.46
compared to
$3.37
in the prior fiscal year.
|
|
•
|
GAAP-based gross margin was
67.5%
compared to
68.5%
in the prior fiscal year.
|
|
•
|
GAAP-based operating margin was
18.8%
compared to
18.5%
in the prior fiscal year.
|
|
•
|
Non-GAAP-based operating margin was
30.9%
, stable year over year.
|
|
•
|
Operating cash flow was
$523.0 million
, up
25.4%
from the prior fiscal year.
|
|
•
|
Cash and cash equivalents was
$700.0 million
as of
June 30, 2015
, compared to
$427.9 million
as of
June 30, 2014
.
|
See "Use of Non-GAAP Financial Measures" below for a reconciliation of non-GAAP-based measures to GAAP-based measures.
See "Acquisitions" below for the impact of acquisitions on the period-to-period comparability of results.
Acquisitions
Our competitive position in the marketplace requires us to maintain a complex and evolving array of technologies, products, services and capabilities. In light of the continually evolving marketplace in which we operate, we regularly evaluate various acquisition opportunities within the EIM market. During Fiscal 2015, the following acquisitions were made:
Acquisition of Actuate Corporation
31
On January 16, 2015, we acquired Actuate Corporation (Actuate), based in San Francisco, California, United States, for $332.0 million, comprised of approximately
$322.4 million
in cash and certain shares we previously purchased of Actuate in the open market with a fair value of approximately $9.5 million as of the date of acquisition. Actuate was a leader in personalized analytics and insights and we believe the acquisition will complement our OpenText EIM Suite. The results of operations of Actuate have been consolidated with OpenText during the third quarter of Fiscal 2015, beginning on January 16, 2015.
Acquisition of Informative Graphics Corporation
On January 2, 2015, we acquired Informative Graphics Corporation (IGC), based in Scottsdale, Arizona, United States, for approximately
$40 million
. IGC was a leading developer of viewing, annotation, redaction and publishing commercial software. We believe this acquisition will enable OpenText to engineer solutions that further increase a user's experience within our OpenText EIM Suite. The financial results of operations of IGC have been consolidated with Open Text's financial results during the third quarter of Fiscal 2015, beginning on January 2, 2015.
We believe our acquisitions support our long-term strategic direction, strengthen our competitive position, expand our customer base, provide greater scale to accelerate innovation, grow our earnings and increase shareholder value. We expect to continue to strategically acquire companies, products, services and technologies to augment our existing business. Our acquisitions, particularly significant ones such as GXS Group, Inc. (GXS) in January 2014, affect the period-to-period comparability of our results. See note 18 "Acquisitions" to our
Consolidated Financial Statements
for more details.
Outlook for Fiscal 2016
We believe we have a strong position in the EIM market. We look to grow our Cloud-based EIM strategy through acquisitions, innovation and with new ways to purchase our solutions, such as our recently announced subscription pricing and managed service offerings. While we continue to offer on-premises solutions, we realize the EIM market is broad and we are agnostic to whether a customer prefers an on-premises solution, cloud solution, or combination of both (hybrid). We believe giving the customer choice and flexibility with their payment option will help us to strive to obtain long-term customer value. In addition to reviewing our earnings and cash flows, we measure long-term value by looking at our "recurring revenue", which we define as revenue from
Cloud services and subscriptions
,
Customer support
and
Professional service and other
. In Fiscal 2015, recurring revenue was
$1,557.7 million
, up
18.1%
compared to Fiscal 2014, and represented
84%
of our total revenues.
Our
Cloud services and subscriptions
revenues are growing, up
62%
in Fiscal 2015 compared to Fiscal 2014. We believe this shows customers are indeed looking for more choice and flexibility on how they consume technology. We are committed to delivering our products and services to customers via a hybrid delivery model.
Additionally,
Customer support
revenues, which are generally a recurring source of income for us, make up a significant portion of our revenue mix. Our management reviews our Customer support renewal rates on a quarterly basis and we use these rates as a method of monitoring our customer service performance. For the three months ended
June 30, 2015
, our Customer support renewal rate was 90%, consistent with the customer support renewal rate during the three months ended June 30, 2014.
We see an opportunity to help our customers become “digital businesses” and with our recent acquisition of Actuate in Fiscal 2015, we have acquired a strong platform to integrate personalized analytics and insights onto our OpenText EIM suites of products, which we believe will further our vision to enable a “digital first world” and strengthen our position among leaders in EIM.
We also believe our diversified geographic profile helps strengthen our position and helps to reduce the impact of a downturn in the economy that may occur in any one specific region.
CRITICAL ACCOUNTING POLICIES AND ESTIMATES
The preparation of financial statements in conformity with U.S. GAAP requires us to make estimates, judgments and assumptions that affect the amounts reported in the
Consolidated Financial Statements
. These estimates, judgments and assumptions are evaluated on an ongoing basis. We base our estimates on historical experience and on various other assumptions that we believe are reasonable at that time, the results of which form the basis for making judgments about the carrying values of assets and liabilities that are not readily apparent from other sources. Actual results may differ materially from those estimates. The accounting policies that reflect our more significant estimates, judgments and assumptions and which we believe are the most critical to aid in fully understanding and evaluating our reported financial results include the following:
|
(i)
|
Revenue recognition,
|
|
(ii)
|
Capitalized software,
|
|
(iii)
|
Goodwill,
|
|
(iv)
|
Acquired intangibles,
|
|
(v)
|
Restructuring charges,
|
|
(vi)
|
Business combinations,
|
32
|
(vii)
|
Foreign currency, and
|
|
(viii)
|
Income taxes.
|
Revenue recognition
We recognize revenues in accordance with Accounting Standard Codification (ASC) Topic 985-605, “Software Revenue Recognition” (Topic 985-605).
We record product revenues from software licenses and products when persuasive evidence of an arrangement exists, the software product has been shipped, there are no significant uncertainties surrounding product acceptance by the customer, the fees are fixed and determinable, and collection is considered probable. We use the residual method to recognize revenues on delivered elements when a license agreement includes one or more elements to be delivered at a future date if evidence of the fair value of all undelivered elements exists. If an undelivered element for the arrangement exists under the license arrangement, revenues related to the undelivered element is deferred based on vendor-specific objective evidence (VSOE) of the fair value of the undelivered element.
Our multiple-element sales arrangements include arrangements where software licenses and the associated post contract customer support (PCS) are sold together. We have established VSOE of the fair value of the undelivered PCS element based on the contracted price for renewal PCS included in the original multiple element sales arrangement, as substantiated by contractual terms and our significant PCS renewal experience, from our existing worldwide base. Our multiple element sales arrangements generally include irrevocable rights for the customer to renew PCS after the bundled term ends. The customer is not subject to any economic or other penalty for failure to renew. It is our experience that customers generally exercise their renewal PCS option. In the renewal transaction, PCS is sold on a stand-alone basis to the licensees one year or more after the original multiple element sales arrangement. The exercised renewal PCS price is consistent with the renewal price in the original multiple element sales arrangement, although an adjustment to reflect consumer price changes is common.
If VSOE of fair value does not exist for all undelivered elements, all revenues are deferred until sufficient evidence exists or all elements have been delivered.
Cloud services and subscription revenues consist of (i) software as a service offerings (ii) managed service arrangements and (iii) subscription revenues relating to on premise offerings. The customer contracts for each of these three offerings are long term contracts (greater than twelve months) and are based on the customer’s usage over the contract period. The revenue associated with such contracts is recognized once usage has been measured, the fee fixed and determinable and collection is probable.
In certain managed services arrangements, we sell transaction processing along with implementation and start-up services. The implementation and start-up services do not have stand-alone value and, therefore, they do not qualify as separate units of accounting and are not separated. We believe these services do not have stand-alone value as (i) the customer only receives value from these services in conjunction with the use of the related transaction processing service, (ii) we do not sell such services separately, and (iii) the output of such services cannot be re-sold by the customer. Revenues related to implementation and start-up services are recognized over the longer of the contract term or the estimated customer life. In some arrangements, we also sell professional services which do have stand-alone value and can be separated from other elements in the arrangement, in which case the revenue related to these services is recognized as the service is performed. In some arrangements, we also sell professional services as a separate single element arrangement. The revenue related to these services is recognized as the service is performed. We defer all direct and relevant costs associated with implementation of long-term customer contracts to the extent such costs can be recovered through guaranteed contract revenues.
Service revenues consist of revenues from consulting, implementation, training and integration services. These services are set forth separately in the contractual arrangements such that the total price of the customer arrangement is expected to vary as a result of the inclusion or exclusion of these services. For those contracts where the services are not essential to the functionality of any other element of the transaction, we determine VSOE of fair value for these services based upon normal pricing and discounting practices for these services when sold separately. These consulting and implementation services contracts are primarily time and materials based contracts that are, on average, less than six months in length. Revenues from these services are recognized at the time such services are performed.
Revenue for contracts that are primarily fixed fee arrangements, wherein the services are not essential to the functionality of a software element, are recognized using the proportional performance method.
Revenues from training and integration services are recognized in the period in which these services are performed.
We entered into certain long-term sales contracts involving the sale of integrated solutions that include the modification and customization of software and the provision of services that are essential to the functionality of the other elements in this arrangement. As prescribed by ASC Topic 985-605, we recognize revenues from such arrangements in accordance with the contract accounting guidelines in ASC Topic 605-35, “Construction-Type and Production-Type Contracts” (Topic 605-35), after
33
evaluating for separation of any non-Topic 605-35 elements in accordance with the provisions of ASC Topic 605-25, “Multiple-Element Arrangements” (Topic 605-25).
When circumstances exist that allow us to make reasonably dependable estimates of contract revenues, contract costs and the progress of the contract to completion, we account for sales under such long-term contracts using the percentage-of-completion (POC) method of accounting. Under the POC method, progress towards completion of the contract is measured based upon either input measures or output measures. We measure progress towards completion based upon an input measure and calculate this as the proportion of the actual hours incurred compared to the total estimated hours. For training and integration services rendered under such contracts, revenues are recognized as the services are rendered. We will review, on a quarterly basis, the total estimated remaining costs to completion for each of these contracts and apply the impact of any changes on the POC prospectively. If at any time we anticipate that the estimated remaining costs to completion will exceed the value of the contract, the resulting loss will be recognized immediately.
When circumstances exist that prevent us from making reasonably dependable estimates of contract revenues, we account for sales under such long-term contracts using the completed contract method.
We execute certain sales contracts through resellers and distributors (collectively, resellers) and also large, well-capitalized partners such as SAP AG and Accenture plc. (collectively, channel partners).
Revenues relating to sales through resellers and channel partners are recognized when all the recognition criteria have been met, in other words, persuasive evidence of an arrangement exists, delivery has occurred in the reporting period, the fee is fixed and determinable, and collectability is probable. In addition we assess the creditworthiness of each reseller and if the reseller is newly formed, undercapitalized or in financial difficulty any revenues expected to emanate from such resellers are deferred and recognized only when cash is received and all other revenue recognition criteria are met.
Capitalized Software
We capitalize software development costs in accordance with ASC Topic 350-40 – "Accounting for the Costs of Computer Software Developed or Obtained for Internal-Use". We capitalize costs for software to be used internally when we enter the application development stage. This occurs when we complete the preliminary project stage, management authorizes and commits to funding the project, and it is feasible that the project will be completed and the software will perform the intended function. We cease to capitalize costs related to a software project when it enters the post implementation and operation stage. If different determinations are made with respect to the state of development of a software project, then the amount capitalized and the amount charged to expense for that project could differ materially.
Costs capitalized during the application development stage consist of payroll and related costs for employees who are directly associated with, and who devote time directly to, a project to develop software for internal use. We also capitalize the direct costs of materials and services, which generally includes outside contractors, and interest. We do not capitalize any general and administrative or overhead costs or costs incurred during the application development stage related to training or data conversion costs. Costs related to upgrades and enhancements to internal-use software, if those upgrades and enhancements result in additional functionality, are capitalized. If upgrades and enhancements do not result in additional functionality, those costs are expensed as incurred. If different determinations are made with respect to whether upgrades or enhancements to software projects would result in additional functionality, then the amount capitalized and the amount charged to expense for that project could differ materially.
We amortize capitalized costs with respect to development projects for internal-use software when the software is ready for use. The capitalized software development costs are generally amortized using the straight-line method over a 5-year period. In determining and reassessing the estimated useful life over which the cost incurred for the software should be amortized, we consider the effects of obsolescence, technology, competition and other economic factors. If different determinations are made with respect to the estimated useful life of the software, the amount of amortization charged in a particular period could differ materially.
Goodwill
Goodwill represents the excess of the purchase price in a business combination over the fair value of net tangible and intangible assets acquired. The carrying amount of goodwill is periodically reviewed for impairment (at a minimum annually) and whenever events or changes in circumstances indicate that the carrying value of this asset may not be recoverable.
Our operations are analyzed by management and our chief operating decision maker (CODM) as being part of a single industry segment: the design, development, marketing and sales of Enterprise Information Management software and solutions. Therefore, our goodwill impairment assessment is based on the allocation of goodwill to a single reporting unit.
We perform a qualitative assessment to test our reporting unit's goodwill for impairment. Based on our qualitative assessment, if we determine that the fair value of our reporting unit is more likely than not (i.e., a likelihood of more than 50
34
percent) to be less than its carrying amount, the two step impairment test is performed. In the first step, we compare the fair value of our reporting unit to its carrying value. If the fair value of the reporting unit exceeds its carrying value, goodwill is not considered impaired and we are not required to perform further testing. If the carrying value of the net assets of our reporting unit exceeds its fair value, then we must perform the second step of the two step impairment test in order to determine the implied fair value of our reporting unit's goodwill. If the carrying value our reporting unit's goodwill exceeds its implied fair value, then an impairment loss equal to the difference would be recorded.
Acquired intangibles
Acquired intangibles consist of acquired technology and customer relationships associated with various acquisitions.
Acquired technology is initially recorded at fair value based on the present value of the estimated net future income-producing capabilities of software products acquired on acquisitions. We amortize acquired technology over its estimated useful life on a straight-line basis.
Customer relationships represent relationships that we have with customers of the acquired companies and are either based upon contractual or legal rights or are considered separable; that is, capable of being separated from the acquired entity and being sold, transferred, licensed, rented or exchanged. These customer relationships are initially recorded at their fair value based on the present value of expected future cash flows. We amortize customer relationships on a straight-line basis over their estimated useful lives.
We continually evaluate the remaining estimated useful life of our intangible assets being amortized to determine whether events and circumstances warrant a revision to the remaining period of amortization.
Restructuring charges
We record restructuring charges relating to contractual lease obligations and other exit costs in accordance with ASC Topic 420, “Exit or Disposal Cost Obligations” (Topic 420). Topic 420 requires that a liability for a cost associated with an exit or disposal activity be recognized and measured initially at its fair value in the period in which the liability is incurred. In order to incur a liability pursuant to Topic 420, our management must have established and approved a plan of restructuring in sufficient detail. A liability for a cost associated with involuntary termination benefits is recorded when benefits have been communicated and a liability for a cost to terminate an operating lease or other contract is incurred when the contract has been terminated in accordance with the contract terms or we have ceased using the right conveyed by the contract, such as vacating a leased facility.
The recognition of restructuring charges requires us to make certain judgments regarding the nature, timing and amount associated with the planned restructuring activities, including estimating sub-lease income and the net recoverable amount of equipment to be disposed of. At the end of each reporting period, we evaluate the appropriateness of the remaining accrued balances.
Business combinations
We apply the provisions of ASC Topic 805, “Business Combinations” (Topic 805), in the accounting for our acquisitions. It requires us to recognize separately from goodwill the assets acquired and the liabilities assumed at their acquisition date fair values. Goodwill as of the acquisition date is measured as the excess of consideration transferred over the net of the acquisition date fair values of the assets acquired and the liabilities assumed. While we use our best estimates and assumptions to accurately value assets acquired and liabilities assumed at the acquisition date as well as contingent consideration, where applicable, our estimates are inherently uncertain and subject to refinement. As a result, during the measurement period, which may be up to one year from the acquisition date, we may record adjustments to the assets acquired and liabilities assumed with the corresponding offset to goodwill. Upon the conclusion of the measurement period or final determination of the values of assets acquired or liabilities assumed, whichever comes first, any subsequent adjustments would be recorded to our consolidated statements of operations.
Costs to exit or restructure certain activities of an acquired company or our internal operations are accounted for as one-time termination and exit costs pursuant to Topic 420 and are accounted for separately from the business combination.
For a given acquisition, we generally identify certain pre-acquisition contingencies as of the acquisition date and may extend our review and evaluation of these pre-acquisition contingencies throughout the measurement period in order to obtain sufficient information to assess whether we include these contingencies as a part of the purchase price allocation and, if so, to determine the estimated amounts.
If we determine that a pre-acquisition contingency (non-income tax related) is probable in nature and estimable as of the acquisition date, we record our best estimate for such a contingency as a part of the preliminary purchase price allocation. We often continue to gather information and evaluate our pre-acquisition contingencies throughout the measurement period and if
35
we make changes to the amounts recorded or if we identify additional pre-acquisition contingencies during the measurement period, such amounts will be included in the purchase price allocation during the measurement period and, subsequently, in our results of operations.
Uncertain tax positions and tax related valuation allowances assumed in connection with a business combination are initially estimated as of the acquisition date. We review these items during the measurement period as we continue to actively seek and collect information relating to facts and circumstances that existed at the acquisition date. Changes to these uncertain tax positions and tax related valuation allowances made subsequent to the measurement period, or if they relate to facts and circumstances that did not exist at the acquisition date, are recorded in our provision for income taxes in our Consolidated Statement of Income.
Foreign currency
Our Consolidated Financial Statements are presented in U.S. dollars. In general, the functional currency of our subsidiaries is the local currency. For each subsidiary, assets and liabilities denominated in foreign currencies are translated into U.S dollars at the exchange rates in effect at the balance sheet dates and revenues and expenses are translated at the average exchange rates prevailing during the month of the transaction. The effect of foreign currency translation adjustments not affecting net income are included in Shareholders' equity under the “Cumulative translation adjustment” account as a component of “Accumulated other comprehensive income”. Transactional foreign currency gains (losses) included in the Consolidated Statements of Income under the line item “Other income (expense) net” for Fiscal 2015, Fiscal 2014 and Fiscal 2013 were
$(31.0) million
,
$4.0 million
and
$(2.6) million
, respectively.
Income taxes
We account for income taxes in accordance with ASC Topic 740, “Income Taxes” (Topic 740). Deferred tax assets and liabilities arise from temporary differences between the tax bases of assets and liabilities and their reported amounts in the Consolidated Financial Statements that will result in taxable or deductible amounts in future years. These temporary differences are measured using enacted tax rates. A valuation allowance is recorded to reduce deferred tax assets to the extent that we consider it is more likely than not that a deferred tax asset will not be realized. In determining the valuation allowance, we consider factors such as the reversal of deferred income tax liabilities, projected taxable income, and the character of income tax assets and tax planning strategies. A change to these factors could impact the estimated valuation allowance and income tax expense.
We account for our uncertain tax provisions by using a two-step approach to recognizing and measuring uncertain tax positions. The first step is to evaluate the tax position for recognition by determining if the weight of available evidence indicates it is more likely than not, based solely on the technical merits, that the position will be sustained on audit, including resolution of related appeals or litigation processes, if any. The second step is to measure the appropriate amount of the benefit to recognize. The amount of benefit to recognize is measured as the maximum amount which is more likely than not to be realized. The tax position is derecognized when it is no longer more likely than not that the position will be sustained on audit. On subsequent recognition and measurement the maximum amount which is more likely than not to be recognized at each reporting date will represent the Company's best estimate, given the information available at the reporting date, although the outcome of the tax position is not absolute or final. We recognize both accrued interest and penalties related to liabilities for income taxes within the "Provision for Income Taxes" line of our Consolidated Statements of Income.
RESULTS OF OPERATIONS
The following tables provide a detailed analysis of our results of operations and financial condition. For each of the periods indicated below, we present our revenues by product, revenues by major geography, cost of revenues by product, total gross margin, total operating margin, gross margin by product, and their corresponding percentage of total revenue. In addition, we provide Non-GAAP measures for the periods discussed in order to provide additional information to investors that we believe will be useful as this presentation is in line with how our management assesses our Company's performance. See "Use of Non-GAAP Financial Measures" below for a reconciliation of Non-GAAP-based measures to GAAP-based measures.
36
Summary of Results of Operations
|
Year Ended June 30,
|
||||||||||||||||||||
|
(In thousands)
|
2015
|
Change increase (decrease)
|
2014
|
Change increase (decrease)
|
2013
|
|||||||||||||||
|
Total Revenues by Product Type:
|
||||||||||||||||||||
|
License
|
$
|
294,266
|
|
$
|
(11,580
|
)
|
$
|
305,846
|
|
$
|
32,861
|
|
$
|
272,985
|
|
|||||
|
Cloud services and subscriptions
|
605,309
|
|
231,909
|
|
373,400
|
|
192,988
|
|
180,412
|
|
||||||||||
|
Customer support
|
731,797
|
|
24,773
|
|
707,024
|
|
48,808
|
|
658,216
|
|
||||||||||
|
Professional service and other
|
220,545
|
|
(17,884
|
)
|
238,429
|
|
(13,294
|
)
|
251,723
|
|
||||||||||
|
Total revenues
|
1,851,917
|
|
227,218
|
|
1,624,699
|
|
261,363
|
|
1,363,336
|
|
||||||||||
|
Total Cost of Revenues
|
601,785
|
|
90,115
|
|
511,670
|
|
25,766
|
|
485,904
|
|
||||||||||
|
Total GAAP-based Gross Profit
|
1,250,132
|
|
137,103
|
|
1,113,029
|
|
235,597
|
|
877,432
|
|
||||||||||
|
Total GAAP-based Gross Margin %
|
67.5
|
%
|
68.5
|
%
|
64.4
|
%
|
||||||||||||||
|
Total GAAP-based Operating Expenses
|
901,421
|
|
88,920
|
|
812,501
|
|
132,734
|
|
679,767
|
|
||||||||||
|
Total GAAP-based Income from Operations
|
$
|
348,711
|
|
$
|
48,183
|
|
$
|
300,528
|
|
$
|
102,863
|
|
$
|
197,665
|
|
|||||
|
% Revenues by Product Type:
|
||||||||||||||||||||
|
License
|
15.9
|
%
|
18.8
|
%
|
20.0
|
%
|
||||||||||||||
|
Cloud services and subscriptions
|
32.7
|
%
|
23.0
|
%
|
13.2
|
%
|
||||||||||||||
|
Customer support
|
39.5
|
%
|
43.5
|
%
|
48.3
|
%
|
||||||||||||||
|
Professional service and other
|
11.9
|
%
|
14.7
|
%
|
18.5
|
%
|
||||||||||||||
|
Total Cost of Revenues by Product Type:
|
||||||||||||||||||||
|
License
|
$
|
12,899
|
|
$
|
(262
|
)
|
$
|
13,161
|
|
$
|
(2,834
|
)
|
15,995
|
|
||||||
|
Cloud services and subscriptions
|
239,719
|
|
97,053
|
|
142,666
|
|
69,202
|
|
73,464
|
|
||||||||||
|
Customer support
|
94,766
|
|
(1,213
|
)
|
95,979
|
|
(10,193
|
)
|
106,172
|
|
||||||||||
|
Professional service and other
|
173,399
|
|
(16,548
|
)
|
189,947
|
|
(6,716
|
)
|
196,663
|
|
||||||||||
|
Amortization of acquired technology-based intangible assets
|
81,002
|
|
11,085
|
|
69,917
|
|
(23,693
|
)
|
93,610
|
|
||||||||||
|
Total cost of revenues
|
$
|
601,785
|
|
$
|
90,115
|
|
$
|
511,670
|
|
$
|
25,766
|
|
$
|
485,904
|
|
|||||
|
% GAAP-based Gross Margin by Product Type:
|
||||||||||||||||||||
|
License
|
95.6
|
%
|
95.7
|
%
|
94.1
|
%
|
||||||||||||||
|
Cloud services and subscriptions
|
60.4
|
%
|
61.8
|
%
|
59.3
|
%
|
||||||||||||||
|
Customer support
|
87.1
|
%
|
86.4
|
%
|
83.9
|
%
|
||||||||||||||
|
Professional service and other
|
21.4
|
%
|
20.3
|
%
|
21.9
|
%
|
||||||||||||||
|
Total Revenues by Geography:
|
||||||||||||||||||||
|
Americas (1)
|
$
|
1,035,305
|
|
$
|
161,885
|
|
$
|
873,420
|
|
$
|
138,834
|
|
$
|
734,586
|
|
|||||
|
EMEA (2)
|
638,298
|
|
50,402
|
|
587,896
|
|
94,990
|
|
492,906
|
|
||||||||||
|
Asia Pacific (3)
|
178,314
|
|
14,931
|
|
163,383
|
|
27,539
|
|
135,844
|
|
||||||||||
|
Total revenues
|
$
|
1,851,917
|
|
$
|
227,218
|
|
$
|
1,624,699
|
|
$
|
261,363
|
|
$
|
1,363,336
|
|
|||||
|
% Revenues by Geography:
|
||||||||||||||||||||
|
Americas (1)
|
55.9
|
%
|
53.8
|
%
|
53.9
|
%
|
||||||||||||||
|
EMEA (2)
|
34.5
|
%
|
36.2
|
%
|
36.1
|
%
|
||||||||||||||
|
Asia Pacific (3)
|
9.6
|
%
|
10.0
|
%
|
10.0
|
%
|
||||||||||||||
37
|
Year Ended June 30,
|
||||||||||||||||
|
(In thousands)
|
2015
|
2014
|
2013
|
|||||||||||||
|
GAAP-based gross margin
|
67.5
|
%
|
68.5
|
%
|
64.4
|
%
|
||||||||||
|
GAAP-based operating margin
|
18.8
|
%
|
18.5
|
%
|
14.5
|
%
|
||||||||||
|
GAAP-based EPS, diluted
|
$
|
1.91
|
|
$
|
1.81
|
|
$
|
1.26
|
|
|||||||
|
Non-GAAP-based gross margin (4)
|
72.0
|
%
|
72.9
|
%
|
71.3
|
%
|
||||||||||
|
Non-GAAP-based operating margin (4)
|
30.9
|
%
|
30.9
|
%
|
29.3
|
%
|
||||||||||
|
Non-GAAP-based EPS, diluted (4)
|
$
|
3.46
|
|
$
|
3.37
|
|
$
|
2.79
|
|
|||||||
|
(1)
|
Americas consists of countries in North, Central and South America.
|
|
(2)
|
EMEA primarily consists of countries in Europe, Africa and the United Arab Emirates.
|
|
(3)
|
Asia Pacific primarily consists of the countries Japan, Australia, Hong Kong, Korea, Philippines, Singapore and New Zealand.
|
|
(4)
|
See "Use of Non-GAAP Financial Measures" (discussed later in the MD&A) for a reconciliation of Non-GAAP-based measures to GAAP-based measures.
|
Revenues, Cost of Revenues and Gross Margin by Product Type
1) License Revenues:
License revenues consist of fees earned from the licensing of software products to customers. Our license revenues are impacted by the strength of general economic and industry conditions, the competitive strength of our software products, and our acquisitions. Cost of license revenues consists primarily of royalties payable to third parties.
|
Year Ended June 30,
|
||||||||||||||||||||
|
(In thousands)
|
2015
|
Change increase (decrease)
|
2014
|
Change increase (decrease)
|
2013
|
|||||||||||||||
|
License Revenues:
|
||||||||||||||||||||
|
Americas
|
$
|
135,262
|
|
$
|
(6,302
|
)
|
$
|
141,564
|
|
$
|
12,001
|
|
$
|
129,563
|
|
|||||
|
EMEA
|
126,650
|
|
1,385
|
|
125,265
|
|
11,229
|
|
114,036
|
|
||||||||||
|
Asia Pacific
|
32,354
|
|
(6,663
|
)
|
39,017
|
|
9,631
|
|
29,386
|
|
||||||||||
|
Total License Revenues
|
294,266
|
|
(11,580
|
)
|
305,846
|
|
32,861
|
|
272,985
|
|
||||||||||
|
Cost of License Revenues
|
12,899
|
|
(262
|
)
|
13,161
|
|
(2,834
|
)
|
15,995
|
|
||||||||||
|
GAAP-based License Gross Profit
|
$
|
281,367
|
|
$
|
(11,318
|
)
|
$
|
292,685
|
|
$
|
35,695
|
|
$
|
256,990
|
|
|||||
|
GAAP-based License Gross Margin %
|
95.6
|
%
|
95.7
|
%
|
94.1
|
%
|
||||||||||||||
|
% License Revenues by Geography:
|
||||||||||||||||||||
|
Americas
|
46.0
|
%
|
46.3
|
%
|
47.5
|
%
|
||||||||||||||
|
EMEA
|
43.0
|
%
|
41.0
|
%
|
41.8
|
%
|
||||||||||||||
|
Asia Pacific
|
11.0
|
%
|
12.7
|
%
|
10.7
|
%
|
||||||||||||||
Fiscal 2015 Compared to Fiscal 2014
License revenues decreased by
$11.6 million
inclusive of a negative impact of approximately $20.2 million relating to foreign exchange. Geographically, the overall decrease was attributable to a decrease in Asia Pacific of
$6.7 million
, a decrease in Americas of
$6.3 million
, offset by an increase in EMEA of
$1.4 million
. The number of license deals greater than $0.5 million that closed during Fiscal 2015 was 78 deals, compared to 77 deals in Fiscal 2014. License revenue, as a proportion of our total revenues, decreased from
18.8%
in Fiscal 2014 to
15.9%
in Fiscal 2015 primarily as a result of an increasing proportion in cloud services and subscriptions revenues.
Cost of license revenues were relatively stable, with gross margin percentage remaining at approximately 96%.
Fiscal 2014 Compared to Fiscal 2013:
License revenues increased by
$32.9 million
, which was geographically attributable to an increase in Americas of
$12.0 million
, an increase in EMEA of
$11.2 million
, and an increase in Asia Pacific of
$9.6 million
. The number of license deals
38
greater than $0.5 million that closed during Fiscal 2014 increased as compared to the prior fiscal year (77 deals in Fiscal 2014 compared to 68 deals in Fiscal 2013).
The acquisition of GXS contributed approximately $2.6 million of license revenues during Fiscal 2014.
Cost of license revenues decreased by
$2.8 million
due to lower third party technology costs. As a result, the gross margin percentage on cost of license revenues increased to approximately
96%
from approximately
94%
.
2) Cloud Services and Subscriptions:
Cloud services and subscription revenues consist of (i) software as a service offerings (ii) managed service arrangements and (iii) subscription revenues relating to on premise offerings. These offerings allow our customers to make use of OpenText software, services and content over Internet enabled networks supported by OpenText data centers. These web applications allow customers to transmit a variety of content between various mediums and to securely manage enterprise information without the commitment of investing in related hardware infrastructure. Revenues are generated on several transactional usage-based models, are typically billed monthly in arrears, and can therefore fluctuate from period to period. Certain service fees are occasionally charged to customize hosted software for some customers and are either amortized over the estimated customer life, in the case of setup fees, or recognized in the period they are provided.
In addition, we offer business-to-business (B2B) integration solutions, such as messaging services, and managed services. Messaging services allow for the automated and reliable exchange of electronic transaction information, such as purchase orders, invoices, shipment notices and other business documents, among businesses worldwide. Managed services provide an end-to-end fully outsourced B2B integration solution to our customers, including program implementation, operational management, and customer support. These services enable customers to effectively manage the flow of electronic transaction information with their trading partners and reduce the complexity of disparate standards and communication protocols. Revenues are primarily generated through transaction processing. Transaction processing fees are recurring in nature and are recognized on a per transaction basis in the period in which the related transactions are processed. Revenues from contracts with monthly, quarterly or annual minimum transaction levels are recognized based on the greater of the actual transactions or the specified contract minimum amounts during the relevant period. Customers who are not committed to multi-year contracts generally are under contracts for transaction processing solutions that automatically renew every month or year, depending on the terms of the specific contracts.
Cost of cloud services and subscriptions revenues is comprised primarily of third party network usage fees, maintenance of in-house data hardware centers, technical support personnel-related costs, amortization of customer set up and implementation costs, and some third party royalty costs.
|
Year Ended June 30,
|
||||||||||||||||||||
|
(In thousands)
|
2015
|
Change increase (decrease)
|
2014
|
Change increase (decrease)
|
2013
|
|||||||||||||||
|
Cloud Services and Subscriptions:
|
||||||||||||||||||||
|
Americas
|
$
|
394,471
|
|
$
|
146,716
|
|
$
|
247,755
|
|
$
|
130,665
|
|
$
|
117,090
|
|
|||||
|
EMEA
|
141,473
|
|
66,388
|
|
75,085
|
|
46,657
|
|
28,428
|
|
||||||||||
|
Asia Pacific
|
69,365
|
|
18,805
|
|
50,560
|
|
15,666
|
|
34,894
|
|
||||||||||
|
Total Cloud Services and Subscriptions Revenues
|
605,309
|
|
231,909
|
|
373,400
|
|
192,988
|
|
180,412
|
|
||||||||||
|
Cost of Cloud Services and Subscriptions Revenues
|
239,719
|
|
97,053
|
|
142,666
|
|
69,202
|
|
73,464
|
|
||||||||||
|
GAAP-based Cloud Services and Subscriptions Gross Profit
|
$
|
365,590
|
|
$
|
134,856
|
|
$
|
230,734
|
|
$
|
123,786
|
|
$
|
106,948
|
|
|||||
|
GAAP-based Cloud Services and Subscriptions Gross Margin %
|
60.4
|
%
|
61.8
|
%
|
59.3
|
%
|
||||||||||||||
|
% Cloud Services and Subscriptions Revenues by Geography:
|
||||||||||||||||||||
|
Americas
|
65.2
|
%
|
66.4
|
%
|
64.9
|
%
|
||||||||||||||
|
EMEA
|
23.4
|
%
|
20.1
|
%
|
15.8
|
%
|
||||||||||||||
|
Asia Pacific
|
11.5
|
%
|
13.5
|
%
|
19.3
|
%
|
||||||||||||||
Fiscal 2015 Compared to Fiscal 2014:
Cloud services and subscriptions revenues increased by
$231.9 million
, which is inclusive of the full year impact of our acquisition of GXS and a negative impact of $18.0 million of foreign exchange. Geographically, the overall increase was attributable to an increase in Americas of
$146.7 million
, an increase in EMEA of
$66.4 million
, and an increase in Asia Pacific of
$18.8 million
. There were 31 Cloud services deals greater than $1.0 million that closed during Fiscal 2015.
39
Cost of cloud services and subscriptions revenues increased by
$97.1 million
, primarily due to the full year impact from our acquisition of GXS and higher revenue attainment and increased bad debt expense, partially offset by a reduction in sales tax liabilities. As a result, the gross margin percentage on cloud services and subscriptions revenue decreased slightly to approximately
60%
from approximately
62%
.
Fiscal 2014 Compared to Fiscal 2013:
Cloud services and subscriptions revenues increased by
$193.0 million
, primarily due to the acquisition of GXS. Geographically, this was attributable to an increase in Americas of
$130.7 million
, an increase in EMEA of
$46.7 million
, and an increase in Asia Pacific of
$15.7 million
.
Cost of cloud services and subscriptions revenues increased by
$69.2 million
in tandem with increased revenues. However, the gross margin percentage on cloud services revenue increased to approximately
62%
from approximately
59%
as a result of a reduction in third party technology costs associated with lower revenue from legacy cloud services and the impact of certain one-time adjustments related to sales tax liabilities.
3) Customer Support Revenues:
Customer support revenues consist of revenues from our customer support and maintenance agreements. These agreements allow our customers to receive technical support, enhancements and upgrades to new versions of our software products when and if available. Customer support revenues are generated from support and maintenance relating to current year sales of software products and from the renewal of existing maintenance agreements for software licenses sold in prior periods. Therefore, changes in customer support revenues do not always correlate directly to the changes in license revenues from period to period. The terms of support and maintenance agreements are typically twelve months, with customer renewal options. Cost of customer support revenues is comprised primarily of technical support personnel and related costs, as well as third party royalty costs.
|
Year Ended June 30,
|
||||||||||||||||||||
|
(In thousands)
|
2015
|
Change increase (decrease)
|
2014
|
Change increase (decrease)
|
2013
|
|||||||||||||||
|
Customer Support Revenues:
|
||||||||||||||||||||
|
Americas
|
$
|
403,189
|
|
$
|
29,658
|
|
$
|
373,531
|
|
$
|
18,672
|
|
$
|
354,859
|
|
|||||
|
EMEA
|
270,822
|
|
(9,035
|
)
|
279,857
|
|
28,314
|
|
251,543
|
|
||||||||||
|
Asia Pacific
|
57,786
|
|
4,150
|
|
53,636
|
|
1,822
|
|
51,814
|
|
||||||||||
|
Total Customer Support Revenues
|
731,797
|
|
24,773
|
|
707,024
|
|
48,808
|
|
658,216
|
|
||||||||||
|
Cost of Customer Support Revenues
|
94,766
|
|
(1,213
|
)
|
95,979
|
|
(10,193
|
)
|
106,172
|
|
||||||||||
|
GAAP-based Customer Support Gross Profit
|
$
|
637,031
|
|
$
|
25,986
|
|
$
|
611,045
|
|
$
|
59,001
|
|
$
|
552,044
|
|
|||||
|
GAAP-based Customer Support Gross Margin %
|
87.1
|
%
|
86.4
|
%
|
83.9
|
%
|
||||||||||||||
|
% Customer Support Revenues by Geography:
|
||||||||||||||||||||
|
Americas
|
55.1
|
%
|
52.8
|
%
|
53.9
|
%
|
||||||||||||||
|
EMEA
|
37.0
|
%
|
39.6
|
%
|
38.2
|
%
|
||||||||||||||
|
Asia Pacific
|
7.9
|
%
|
7.6
|
%
|
7.9
|
%
|
||||||||||||||
Fiscal 2015 Compared to Fiscal 2014:
Customer support revenues increased by
$24.8 million
, which is inclusive of the negative impact of foreign exchange of approximately $33.7 million. Geographically, the overall increase was attributable to an increase in Americas of
$29.7 million
, and an increase in Asia Pacific of
$4.2 million
, offset by a decrease in EMEA of
$9.0 million
.
Cost of customer support revenues were relatively stable during Fiscal 2015. However, as a result of a reduction in technical support personnel related costs, the gross margin percentage on customer support revenues increased slightly to approximately
87%
from approximately
86%
in Fiscal 2014.
40
Fiscal 2014 Compared to Fiscal 2013:
Customer support revenues increased by
$48.8 million
, which was geographically attributable to an increase in EMEA of
$28.3 million
, an increase in Americas of
$18.7 million
, and an increase in Asia Pacific of
$1.8 million
.
The acquisition of GXS contributed approximately $13.1 million of customer support revenues during Fiscal 2014.
Cost of customer support revenues decreased by
$10.2 million
. This was primarily due to a reduction in the installed base of third party products and a reduction in technical support personnel related costs. As a result, the gross margin percentage on customer support revenues increased to approximately
86%
from approximately
84%
.
4) Professional Service and Other Revenues:
Professional service and other revenues consist of revenues from consulting contracts and contracts to provide implementation, training and integration services (professional services). “Other” revenues consist of hardware revenues. These revenues are grouped within the “Professional service and other” category because they are relatively immaterial to our service revenues. Professional services are typically performed after the purchase of new software licenses. Cost of professional service and other revenues consists primarily of the costs of providing integration, configuration and training with respect to our various software products. The most significant components of these costs are personnel-related expenses, travel costs and third party subcontracting.
|
Year Ended June 30,
|
||||||||||||||||||||
|
(In thousands)
|
2015
|
Change increase (decrease)
|
2014
|
Change increase (decrease)
|
2013
|
|||||||||||||||
|
Professional Service and Other Revenues:
|
||||||||||||||||||||
|
Americas
|
$
|
102,384
|
|
$
|
(8,184
|
)
|
$
|
110,568
|
|
$
|
(22,506
|
)
|
$
|
133,074
|
|
|||||
|
EMEA
|
99,353
|
|
(8,338
|
)
|
107,691
|
|
8,792
|
|
98,899
|
|
||||||||||
|
Asia Pacific
|
18,808
|
|
(1,362
|
)
|
20,170
|
|
420
|
|
19,750
|
|
||||||||||
|
Total Professional Service and Other Revenues
|
220,545
|
|
(17,884
|
)
|
238,429
|
|
$
|
(13,294
|
)
|
251,723
|
|
|||||||||
|
Cost of Professional Service and Other Revenues
|
173,399
|
|
(16,548
|
)
|
189,947
|
|
(6,716
|
)
|
196,663
|
|
||||||||||
|
GAAP-based Professional Service and Other Gross Profit
|
$
|
47,146
|
|
$
|
(1,336
|
)
|
$
|
48,482
|
|
$
|
(6,578
|
)
|
$
|
55,060
|
|
|||||
|
GAAP-based Professional Service and Other Gross Margin %
|
21.4
|
%
|
20.3
|
%
|
21.9
|
%
|
||||||||||||||
|
% Professional Service and Other Revenues by Geography:
|
||||||||||||||||||||
|
Americas
|
46.4
|
%
|
46.4
|
%
|
52.9
|
%
|
||||||||||||||
|
EMEA
|
45.0
|
%
|
45.2
|
%
|
39.3
|
%
|
||||||||||||||
|
Asia Pacific
|
8.5
|
%
|
8.5
|
%
|
7.8
|
%
|
||||||||||||||
Fiscal 2015 Compared to Fiscal 2014:
Professional service and other revenues decreased by
$17.9 million
, of which approximately $12.2 million was due to the negative impact of foreign exchange. Geographically, the overall decrease was attributable to a decrease in EMEA of
$8.3 million
, a decrease in Americas of
$8.2 million
, and a decrease in Asia Pacific of
$1.4 million
.
Cost of professional service and other revenues decreased by
$16.5 million
. This was primarily due to lower labour related expenses associated with lower revenue attainment and a reduction in the use of subcontractors. As a result, the gross margin percentage on professional service and other revenues has increased to approximately
21%
from approximately
20%
.
Fiscal 2014 Compared to Fiscal 2013:
Professional service and other revenues decreased by
$13.3 million
, which was geographically attributable to a decrease in Americas of
$22.5 million
, offset by an increase in EMEA of
$8.8 million
, and an increase in Asia Pacific of
$0.4 million
.
Cost of professional service and other revenues decreased by
$6.7 million
. This was primarily due to lower labour related expenses associated with lower revenue, offset by an increase in the use of subcontractors. As a result the gross margin percentage on professional service and other revenues decreased to approximately
20%
from approximately
22%
.
41
Amortization of Acquired Technology-based Intangible Assets
|
Year Ended June 30,
|
||||||||||||||||||||
|
(In thousands)
|
2015
|
Change increase (decrease)
|
2014
|
Change increase (decrease)
|
2013
|
|||||||||||||||
|
Amortization of acquired technology-based intangible assets
|
$
|
81,002
|
|
$
|
11,085
|
|
$
|
69,917
|
|
$
|
(23,693
|
)
|
$
|
93,610
|
|
|||||
Fiscal 2015 Compared to Fiscal 2014:
Amortization of acquired technology-based intangible assets increased by
$11.1 million
, primarily due to the addition of new acquired technology-based intangible assets from our acquisitions of Actuate, IGC, and GXS. This was partially offset by the intangible assets pertaining to our acquisitions of Vignette Corporation (Vignette), Hummingbird Corporation (Hummingbird), and Captaris Inc. becoming fully amortized.
Fiscal 2014 Compared to Fiscal 2013:
Amortization of acquired technology-based intangible assets decreased by
$23.7 million
as compared to Fiscal 2013. This is due to the intangible assets pertaining to our acquisitions of Vignette, Hummingbird, and Captaris Inc. becoming fully amortized, offset in part by the addition of new acquired technology-based intangible assets resulting from our acquisition of GXS in the third quarter of Fiscal 2014.
Operating Expenses
|
Year Ended June 30,
|
||||||||||||||||||||
|
(In thousands)
|
2015
|
Change increase (decrease)
|
2014
|
Change increase (decrease)
|
2013
|
|||||||||||||||
|
Research and development
|
$
|
196,491
|
|
$
|
19,657
|
|
$
|
176,834
|
|
$
|
12,824
|
|
$
|
164,010
|
|
|||||
|
Sales and marketing
|
369,920
|
|
24,277
|
|
345,643
|
|
56,486
|
|
289,157
|
|
||||||||||
|
General and administrative
|
163,042
|
|
20,592
|
|
142,450
|
|
33,125
|
|
109,325
|
|
||||||||||
|
Depreciation
|
50,906
|
|
15,669
|
|
35,237
|
|
10,741
|
|
24,496
|
|
||||||||||
|
Amortization of acquired customer-based intangible assets
|
108,239
|
|
27,216
|
|
81,023
|
|
12,278
|
|
68,745
|
|
||||||||||
|
Special charges
|
12,823
|
|
(18,491
|
)
|
31,314
|
|
7,280
|
|
24,034
|
|
||||||||||
|
Total operating expenses
|
$
|
901,421
|
|
$
|
88,920
|
|
$
|
812,501
|
|
$
|
132,734
|
|
$
|
679,767
|
|
|||||
|
% of Total Revenues:
|
||||||||||||||||||||
|
Research and development
|
10.6
|
%
|
10.9
|
%
|
12.0
|
%
|
||||||||||||||
|
Sales and marketing
|
20.0
|
%
|
21.3
|
%
|
21.2
|
%
|
||||||||||||||
|
General and administrative
|
8.8
|
%
|
8.8
|
%
|
8.0
|
%
|
||||||||||||||
|
Depreciation
|
2.7
|
%
|
2.2
|
%
|
1.8
|
%
|
||||||||||||||
|
Amortization of acquired customer-based intangible assets
|
5.8
|
%
|
5.0
|
%
|
5.0
|
%
|
||||||||||||||
|
Special charges
|
0.7
|
%
|
1.9
|
%
|
1.8
|
%
|
||||||||||||||
Research and development expenses
consist primarily of payroll and payroll-related benefits expenses, contracted research and development expenses, and facility costs. Research and development assists with organic growth, improves product stability and functionality, and as such we dedicate extensive efforts to update and upgrade our product offerings. The primary driver is typically budgeted software upgrades and software development.
42
|
YTD-over-YTD Change between Fiscal
|
||||||||
|
(In thousands)
|
2015 and 2014
|
2014 and 2013
|
||||||
|
Payroll and payroll-related benefits
|
$
|
19,828
|
|
$
|
12,552
|
|
||
|
Contract labour and consulting
|
(2,485
|
)
|
(6,272
|
)
|
||||
|
Share-based compensation
|
100
|
|
784
|
|
||||
|
Travel and communication
|
(1,459
|
)
|
513
|
|
||||
|
Facilities
|
3,883
|
|
3,752
|
|
||||
|
Other miscellaneous
|
(210
|
)
|
1,495
|
|
||||
|
Total year-over-year change in research and development expenses
|
$
|
19,657
|
|
$
|
12,824
|
|
||
Fiscal 2015 Compared to Fiscal 2014:
Research and development expenses increased by
$19.7 million
. Payroll and payroll-related benefits increased by
$19.8 million
and the use of facility and related resources increased by
$3.9 million
, primarily as a result of the acquisitions of GXS in the third quarter of Fiscal 2014 and Actuate in the third quarter of Fiscal 2015. These increases were partially offset by a decrease in contract labour and consulting expenses of
$2.5 million
, resulting from continued efforts to reduce the usage of external services and replace them with internal resources, and a
$1.5 million
reduction in travel and communication expenses. Overall, our research and development expenses, as a percentage of total revenues, have remained relatively stable at approximately
11%
.
Our research and development labour resources increased by 203 employees, from 1,872 employees at June 30, 2014 to 2,075 employees at June 30, 2015.
Fiscal 2014 Compared to Fiscal 2013:
Research and development expenses increased by
$12.8 million
. This was primarily due to a $12.6 million increase in payroll and payroll-related benefits, partly contributed by acquisitions made in Fiscal 2014, offset by a $6.3 million decrease in contract labour and consulting, resulting from continued efforts to reduce the usage of external services and replace them with internal resources. During Fiscal 2014 our research and development labour resources increased by 535 employees, from 1,337 employees at June 30, 2013 to 1,872 employees at June 30, 2014. This increase in labour resources resulted in a $3.8 million increase in the use of facility and related resources. Overall, our research and development expenses, as a percentage of total revenues, have decreased slightly to 11% from 12%.
Sales and marketing expenses
consist primarily of personnel expenses and costs associated with advertising, marketing and trade shows.
|
YTD-over-YTD Change between Fiscal
|
||||||||
|
(In thousands)
|
2015 and 2014
|
2014 and 2013
|
||||||
|
Payroll and payroll-related benefits
|
$
|
10,550
|
|
$
|
26,932
|
|
||
|
Commissions
|
9,802
|
|
21,435
|
|
||||
|
Contract labour and consulting
|
(196
|
)
|
(2,290
|
)
|
||||
|
Share-based compensation
|
2,676
|
|
(1,239
|
)
|
||||
|
Travel and communication
|
(2,727
|
)
|
1,297
|
|
||||
|
Marketing expenses
|
2,290
|
|
4,240
|
|
||||
|
Facilities
|
124
|
|
4,943
|
|
||||
|
Other miscellaneous
|
1,758
|
|
1,168
|
|
||||
|
Total year-over-year change in sales and marketing expenses
|
$
|
24,277
|
|
$
|
56,486
|
|
||
Fiscal 2015 Compared to Fiscal 2014:
Sales and marketing expenses increased by
$24.3 million
. This was due to a
$10.6 million
increase in payroll and payroll-related benefits, primarily as a result of our acquisitions of GXS and Actuate, and a
$9.8 million
increase in commission benefits resulting from the increase in total revenues. Additionally, marketing expenses increased by
$2.3 million
, primarily on account of promotional activity for our global "sales kick off" event held during the first quarter of Fiscal 2015 and our annual user conference held during the second quarter of Fiscal 2015. These increases were partially offset by a
$2.7 million
decrease
43
in travel and communication expenses. Overall, our sales and marketing expenses, as a percentage of total revenues, decreased to approximately
20%
from approximately
21%
in Fiscal 2014.
Our sales and marketing labour resources increased by 83 employees, from 1,395 employees at June 30, 2014 to 1,478 employees at June 30, 2015.
Fiscal 2014 Compared to Fiscal 2013:
Sales and marketing expenses increased by
$56.5 million
. This is primarily due to a $26.9 million increase in payroll and payroll-related benefits, partly contributed by acquisitions made in Fiscal 2014, and a $21.4 million increase in commission benefits resulting from the increase in total revenues. During Fiscal 2014 our sales and marketing labour resources increased by 251 employees, from 1,144 employees at June 30, 2013 to 1,395 employees at June 30, 2014. In addition, marketing expenses increased by $4.2 million, primarily on account of our "Innovation Tour", which was a series of user conferences held in various countries during Fiscal 2014. Overall, our sales and marketing expenses, as a percentage of total revenues, have remained stable at approximately 21%.
General and administrative expenses
consist primarily of payroll and payroll related benefits expenses, related overhead, audit fees, other professional fees, consulting expenses and public company costs.
|
YTD-over-YTD Change between Fiscal
|
||||||||
|
(In thousands)
|
2015 and 2014
|
2014 and 2013
|
||||||
|
Payroll and payroll-related benefits
|
$
|
11,952
|
|
9,418
|
|
|||
|
Contract labour and consulting
|
(495
|
)
|
1,204
|
|
||||
|
Share-based compensation
|
(1,802
|
)
|
4,311
|
|
||||
|
Travel and communication
|
1,941
|
|
701
|
|
||||
|
Facilities
|
(635
|
)
|
1,331
|
|
||||
|
Other miscellaneous
|
9,631
|
|
16,160
|
|
||||
|
Total year-over-year change in general and administrative expenses
|
$
|
20,592
|
|
$
|
33,125
|
|
||
Fiscal 2015 Compared to Fiscal 2014:
General and administrative expenses increased by
$20.6 million
. Payroll and payroll-related benefits increased by
$12.0 million
and travel and communication expenses increased by
$1.9 million
, primarily as a result of our acquisitions of GXS and Actuate. Additionally, other miscellaneous expenses, which includes professional fees such as legal, audit and tax related expenses, increased by $
9.6 million
primarily on account of litigation. Overall, general and administrative expenses, as a percentage of total revenue, remained stable at approximately
9%
.
Our general and administrative labour resources increased by 80 employees, from 984 employees at June 30, 2014 to 1,064 employees at June 30, 2015.
Fiscal 2014 Compared to Fiscal 2013:
General and administrative expenses increased by
$33.1 million
. This is primarily due to a $16.2 million increase in other miscellaneous expenses, which includes professional fees such as legal, audit, and tax related expenses. Legal fees have increased primarily on account of litigation that we are pursuing with respect to amounts potentially recoverable by us. Audit and tax fees have increased due to our increased acquisition related activities. Additionally, payroll and payroll-related benefits increased by $9.4 million, primarily as a result of acquisitions made in Fiscal 2014. During Fiscal 2014 our general and administrative labour resources increased by 257 employees, from 727 employees at June 30, 2013 to 984 employees at June 30, 2014. As a result, general and administrative expenses, as a percentage of total revenue, have increased to 9% from 8% in the same period in the prior fiscal year.
Depreciation expenses:
|
Year Ended June 30,
|
||||||||||||||||||||
|
(In thousands)
|
2015
|
Change increase (decrease)
|
2014
|
Change increase (decrease)
|
2013
|
|||||||||||||||
|
Depreciation
|
$
|
50,906
|
|
$
|
15,669
|
|
$
|
35,237
|
|
$
|
10,741
|
|
$
|
24,496
|
|
|||||
44
Fiscal 2015 Compared to Fiscal 2014:
Depreciation expenses increased by
$15.7 million
. This is primarily due to an increase in capital expenditures and the acquisitions of GXS, and Actuate.
Fiscal 2014 Compared to Fiscal 2013:
Depreciation expenses increased by
$10.7 million
. This is due to an increase in capital expenditures and the acquisitions of Cordys and GXS during Fiscal 2014.
Amortization of acquired customer-based intangible
assets:
|
Year Ended June 30,
|
||||||||||||||||||||
|
(In thousands)
|
2015
|
Change increase (decrease)
|
2014
|
Change increase (decrease)
|
2013
|
|||||||||||||||
|
Amortization of acquired customer-based intangible assets
|
$
|
108,239
|
|
$
|
27,216
|
|
$
|
81,023
|
|
$
|
12,278
|
|
$
|
68,745
|
|
|||||
Fiscal 2015 Compared to Fiscal 2014:
Acquired customer-based intangible assets amortization expense increased by
$27.2 million
. This is primarily due to our acquisitions of Actuate and IGC during the third quarter of Fiscal 2015 and GXS during the third quarter of Fiscal 2014, offset by the intangible assets pertaining to our acquisitions of Hummingbird, IXOS, and Vignette becoming fully amortized.
Fiscal 2014 Compared to Fiscal 2013:
Acquired customer-based intangible assets amortization expense increased by
$12.3 million
. This is primarily due to the acquisition of GXS during the third quarter of Fiscal 2014, offset by the intangible assets pertaining to our acquisition of Hummingbird and IXOS becoming fully amortized.
Special charges (recoveries):
Special charges
typically relate to amounts that we expect to pay in connection with restructuring plans relating to employee workforce reduction and abandonment of excess facilities, acquisition-related costs and other similar charges. Generally, we implement such plans in the context of integrating existing OpenText operations with that of acquired entities. Actions related to such restructuring plans are typically completed within a period of one year. In certain limited situations, if the planned activity does not need to be implemented, or an expense lower than anticipated is paid out, we record a recovery of the originally recorded expense to Special charges.
|
Year Ended June 30,
|
||||||||||||||||||||
|
(In thousands)
|
2015
|
Change increase (decrease)
|
2014
|
Change increase (decrease)
|
2013
|
|||||||||||||||
|
Special charges (recoveries)
|
$
|
12,823
|
|
$
|
(18,491
|
)
|
$
|
31,314
|
|
$
|
7,280
|
|
$
|
24,034
|
|
|||||
Fiscal 2015 Compared to Fiscal 2014:
Special charges decreased by
$18.5 million
. This was due to a $12.2 million decrease in restructuring activities, a $5.6 million decrease in acquisition related costs, and a $0.6 million decrease in other miscellaneous charges.
Fiscal 2014 Compared to Fiscal 2013:
Special charges increased by
$7.3 million
. This was due to a $10.5 million increase on account of restructuring activities and a $5.1 million increase in acquisition related costs, offset by a $8.3 million decrease on account of other miscellaneous charges.
For more details on Special charges (recoveries), see note 17 "Special Charges (Recoveries)" to our
Consolidated Financial Statements
.
45
Net Other Income (Expense)
Net other income (expense) relates to certain non-operational charges consisting primarily of transactional foreign exchange gains (losses). This income (expense) is dependent upon the change in foreign currency exchange rates vis-à-vis the functional currency of the legal entity.
|
Year Ended June 30,
|
||||||||||||||||||||
|
(In thousands)
|
2015
|
Change increase (decrease)
|
2014
|
Change increase (decrease)
|
2013
|
|||||||||||||||
|
Other income (expense), net
|
$
|
(28,047
|
)
|
$
|
(31,988
|
)
|
$
|
3,941
|
|
$
|
6,414
|
|
$
|
(2,473
|
)
|
|||||
Other income in Fiscal 2015 included a gain of
$3.1 million
, resulting from remeasuring to fair value our investment in Actuate shares held before the date of acquisition. For more details see note 18 "Acquisitions" to our
Consolidated Financial Statements
.
Other expense included transactional foreign exchange losses of approximately $31.0 million, primarily on account of foreign exchange on our inter-company exposures.
Net Interest and Other Related Expense
Net interest and other related expense
is primarily comprised of cash interest paid and accrued on our debt facilities, offset by interest income earned on our cash and cash equivalents.
|
Year Ended June 30,
|
||||||||||||||||||||
|
(In thousands)
|
2015
|
Change increase (decrease)
|
2014
|
Change increase (decrease)
|
2013
|
|||||||||||||||
|
Interest and other related expense, net
|
$
|
54,620
|
|
$
|
26,686
|
|
$
|
27,934
|
|
$
|
10,952
|
|
$
|
16,982
|
|
|||||
Fiscal 2015 Compared to Fiscal 2014:
Net interest and other related expense increased by
$26.7 million
. This was primarily the result of additional interest expense incurred relating to Senior Notes and our Term Loan B, offset by a reduction in interest expense resulting from the repayment of our Term Loan A (each as defined below). Additionally, we received investment income of $2.3 million as part of income distributions made from our cost basis investments. We receive such income distributions periodically and do not expect such income distributions to be made regularly.
Fiscal 2014 Compared to Fiscal 2013:
Net interest and other related expense increased by
$11.0 million
, as a result of additional interest expense incurred relating to our Term Loan B, partially offset by income of approximately $0.7 million that we received in the second quarter of Fiscal 2014 as part of an income distribution made from one of our cost basis investments. We do not expect such income distributions to be made regularly. In addition, interest expense related to Term Loan A decreased by approximately $1.8 million as a result of changing interest rates.
For more details see note 10 "Long-Term Debt" to our
Consolidated Financial Statements
.
Provision for Income Taxes
We initiated an internal reorganization of our international subsidiaries in our fiscal year which began on July 1, 2009 and ended June 30, 2010 and integrated certain acquisitions into the resulting organizational structure for the following reasons: 1) to consolidate our intellectual property within certain jurisdictions, 2) to effect an operational reduction of our global subsidiaries with a view to, eventually, having a single operating legal entity in each jurisdiction, 3) to better safeguard our intellectual property in jurisdictions with well established legal regimes and protections and 4) to simplify the management of our intellectual property ownership.
We operate in several tax jurisdictions and are exposed to various foreign tax rates. We also note that we are subject to tax rate discrepancies between our domestic tax rate and foreign tax rates that are significant and these discrepancies are primarily related to earnings in Luxembourg.
Please also see "Risk Factors" elsewhere in this Annual Report on Form 10-K.
46
|
Year Ended June 30,
|
||||||||||||||||||||
|
(In thousands)
|
2015
|
Change increase (decrease)
|
2014
|
Change increase (decrease)
|
2013
|
|||||||||||||||
|
Provision for income taxes
|
$
|
31,638
|
|
$
|
(26,823
|
)
|
$
|
58,461
|
|
$
|
28,771
|
|
$
|
29,690
|
|
|||||
Fiscal 2015 Compared to Fiscal 2014:
The effective GAAP tax rate (which is the provision for taxes expressed as a percentage of income before taxes) decreased to
11.9%
for Fiscal 2015, from
21.1%
for Fiscal 2014, resulting in a reduction of tax expense in the amount of $26.8 million. This decrease is primarily the result of (i) a decrease in the net expense of unrecognized tax benefits with related interest and penalties in the amount of $15.0 million, (ii) a decrease of $6.3 million in expenses not deductible for tax purposes, and (iii) lower net income, having an impact of $7.2 million. The remainder of the differences are due to normal course movements and non-material items.
Fiscal 2014 Compared to Fiscal 2013:
The effective GAAP tax rate (which is the provision for taxes expressed as a percentage of net income before taxes) increased to 21.1% for Fiscal 2014, from 16.6% for Fiscal 2013, primarily due to an increase in the net expense of unrecognized tax benefits with related interest and penalties in the amount of $26.3 million, and a decrease of $7.4 million in the benefit of the impact of internal reorganizations, offset by a decrease of $6.2 million related to the impact of adjustments in the United States, Germany and Australia upon filing of tax returns in Fiscal 2014 compared to Fiscal 2013. The remainder of the differences are due to normal course movements and non-material items.
For information with regards to certain potential tax contingencies, see note 13 "Guarantees and Contingencies" to our
Consolidated Financial Statements
and Part I, Item 1A "Risk Factors".
47
Use of Non-GAAP Financial Measures
In addition to reporting financial results in accordance with U.S. GAAP, the Company provides certain financial measures that are not in accordance with U.S. GAAP (Non-GAAP).These Non-GAAP financial measures have certain limitations in that they do not have a standardized meaning and thus the Company's definition may be different from similar Non-GAAP financial measures used by other companies and/or analysts and may differ from period to period. Thus it may be more difficult to compare the Company's financial performance to that of other companies. However, the Company's management compensates for these limitations by providing the relevant disclosure of the items excluded in the calculation of these Non-GAAP financial measures both in its reconciliation to the U.S. GAAP financial measures and its
Consolidated Financial Statements
, all of which should be considered when evaluating the Company's results.
The Company uses these Non-GAAP financial measures to supplement the information provided in its
Consolidated Financial Statements
, which are presented in accordance with U.S. GAAP. The presentation of Non-GAAP financial measures are not meant to be a substitute for financial measures presented in accordance with U.S. GAAP, but rather should be evaluated in conjunction with and as a supplement to such U.S. GAAP measures. OpenText strongly encourages investors to review its financial information in its entirety and not to rely on a single financial measure. The Company therefore believes that despite these limitations, it is appropriate to supplement the disclosure of the U.S. GAAP measures with certain Non-GAAP measures defined below.
Non-GAAP-based net income and Non-GAAP-based EPS are calculated as net income or earnings per share on a diluted basis, excluding the amortization of acquired intangible assets, other income (expense), share-based compensation, and special charges, all net of tax. Non-GAAP-based gross profit is the arithmetical sum of GAAP-based gross profit and the amortization of acquired technology-based intangible assets. Non-GAAP-based gross margin is calculated as Non-GAAP-based gross profit expressed as a percentage of revenue. Non-GAAP-based income from operations is calculated as income from operations, excluding the amortization of acquired intangible assets, special charges (recoveries), and share-based compensation expense. Non-GAAP-based operating margin is calculated as Non-GAAP-based income from operations expressed as a percentage of revenue.
The Company's management believes that the presentation of the above defined Non-GAAP financial measures provides useful information to investors because they portray the financial results of the Company before the impact of certain non-operational charges. The use of the term “non-operational charge” is defined for this purpose as an expense that does not impact the ongoing operating decisions taken by the Company's management and is based upon the way the Company's management evaluates the performance of the Company's business for use in the Company's internal reports. In the course of such evaluation and for the purpose of making operating decisions, the Company's management excludes certain items from its analysis, including amortization of acquired intangible assets, special charges (recoveries), share-based compensation, other income (expense), and the taxation impact of these items. These items are excluded based upon the manner in which management evaluates the business of the Company and are not excluded in the sense that they may be used under U.S. GAAP.
The Company believes the provision of supplemental Non-GAAP measures allow investors to evaluate the operational and financial performance of the Company's core business using the same evaluation measures that management uses, and is therefore a useful indication of OpenText's performance or expected performance of future operations and facilitates period-to-period comparison of operating performance (although prior performance is not necessarily indicative of future performance). As a result, the Company considers it appropriate and reasonable to provide, in addition to U.S. GAAP measures, supplementary Non-GAAP financial measures that exclude certain items from the presentation of its financial results.
The following charts provide unaudited reconciliations of U.S. GAAP-based financial measures to Non-GAAP-based financial measures for the following periods presented:
48
Reconciliation of selected GAAP-based measures to Non-GAAP-based measures for the year ended
June 30, 2015
(in thousands except for per share data)
|
Year Ended June 30, 2015
|
||||||||||||
|
GAAP-based Measures
|
GAAP-based Measures % of Revenue
|
Adjustments
|
Note
|
Non-GAAP-based Measures
|
Non-GAAP-based Measures % of Revenue
|
|||||||
|
Cost of revenues
|
||||||||||||
|
Cloud services and subscriptions
|
$
|
239,719
|
|
$
|
(833
|
)
|
(1)
|
$
|
238,886
|
|
||
|
Customer support
|
94,766
|
|
(832
|
)
|
(1)
|
93,934
|
|
|||||
|
Professional service and other
|
173,399
|
|
(1,335
|
)
|
(1)
|
172,064
|
|
|||||
|
Amortization of acquired technology-based intangible assets
|
81,002
|
|
(81,002
|
)
|
(2)
|
—
|
|
|||||
|
GAAP-based gross profit and gross margin (%) /
Non-GAAP-based gross profit and gross margin (%) |
1,250,132
|
|
67.5%
|
84,002
|
|
(3)
|
1,334,134
|
|
72.0%
|
|||
|
Operating expenses
|
||||||||||||
|
Research and development
|
196,491
|
|
(2,496
|
)
|
(1)
|
193,995
|
|
|||||
|
Sales and marketing
|
369,920
|
|
(9,095
|
)
|
(1)
|
360,825
|
|
|||||
|
General and administrative
|
163,042
|
|
(7,456
|
)
|
(1)
|
155,586
|
|
|||||
|
Amortization of acquired customer-based intangible assets
|
108,239
|
|
(108,239
|
)
|
(2)
|
—
|
|
|||||
|
Special charges (recoveries)
|
12,823
|
|
(12,823
|
)
|
(4)
|
—
|
|
|||||
|
GAAP-based income from operations and operating margin (%) / Non-GAAP-based income from operations and operating margin (%)
|
348,711
|
|
18.8%
|
224,111
|
|
(5)
|
572,822
|
|
30.9%
|
|||
|
Other income (expense), net
|
(28,047
|
)
|
28,047
|
|
(6)
|
—
|
|
|||||
|
Provision for (recovery of) income taxes
|
31,638
|
|
61,559
|
|
(7)
|
93,197
|
|
|||||
|
GAAP-based net income / Non-GAAP-based net income, attributable to OpenText
|
234,327
|
|
190,599
|
|
(8)
|
424,926
|
|
|||||
|
GAAP-based earnings per share / Non GAAP-based earnings per share-diluted, attributable to OpenText
|
$
|
1.91
|
|
$
|
1.55
|
|
(8)
|
$
|
3.46
|
|
||
|
(1)
|
Adjustment relates to the exclusion of share based compensation expense from our Non-GAAP-based operating expenses as this expense is excluded from our internal analysis of operating results.
|
|
(2)
|
Adjustment relates to the exclusion of amortization expense from our Non-GAAP-based operating expenses as the timing and frequency of amortization expense is dependent on our acquisitions and is hence excluded from our internal analysis of operating results.
|
|
(3)
|
GAAP-based and Non-GAAP-based gross profit stated in dollars and gross margin stated as a percentage of revenue.
|
|
(4)
|
Adjustment relates to the exclusion of Special charges (recoveries) from our Non-GAAP-based operating expenses as Special charges are generally incurred in the periods following the relevant acquisitions and are not indicative or related to continuing operations and are therefore excluded from our internal analysis of operating results.
|
|
(5)
|
GAAP-based and Non-GAAP-based income from operations stated in dollars and operating margin stated as a percentage of revenue.
|
|
(6)
|
Adjustment relates to the exclusion of Other income (expense) from our Non-GAAP-based operating expenses as Other income (expense) relates primarily to the transactional impact of foreign exchange and is generally not indicative or related to continuing operations and is therefore excluded from our internal analysis of operating results.
|
|
(7)
|
Adjustment relates to differences between the GAAP-based tax provision rate of approximately 12% and a non-GAAP-based tax rate of 18%; these rate differences are due to the income tax effects of expenses that are excluded for the purpose of calculating non-GAAP-based adjusted net income. Such excluded expenses include amortization, share-based compensation, special charges and other income (expense), net. Also excluded are tax expense items unrelated to current period income such as changes in reserves for tax uncertainties and valuation allowance reserves, tax arising on internal reorganizations, and “book to return” adjustments for tax return filings and tax assessments (in total “adjusted expenses”). In arriving at our non-GAAP-based tax rate of 18%, we analyzed the individual adjusted expenses and took into consideration the impact of statutory tax rates from local jurisdictions incurring the expense.
|
49
|
(8)
|
Reconciliation of Non-GAAP-based adjusted net income to GAAP-based net income:
|
|
Year Ended June 30, 2015
|
||||||
|
Per share diluted
|
|
|||||
|
Non-GAAP-based net income, attributable to OpenText
|
$
|
424,926
|
|
$
|
3.46
|
|
|
Less:
|
||||||
|
Amortization
|
189,241
|
|
1.54
|
|
||
|
Share-based compensation
|
22,047
|
|
0.18
|
|
||
|
Special charges (recoveries)
|
12,823
|
|
0.10
|
|
||
|
Other (income) expense, net
|
28,047
|
|
0.23
|
|
||
|
GAAP-based provision for (recovery of) income taxes
|
31,638
|
|
0.26
|
|
||
|
Non-GAAP based provision for income taxes
|
(93,197
|
)
|
(0.76
|
)
|
||
|
GAAP-based net income, attributable to OpenText
|
$
|
234,327
|
|
$
|
1.91
|
|
50
Reconciliation of selected GAAP-based measures to Non-GAAP-based measures for the year ended
June 30, 2014
(in thousands except for per share data)
|
Year Ended June 30, 2014
|
||||||||||||
|
GAAP-based Measures
|
GAAP-based Measures % of Revenue
|
Adjustments
|
Note
|
Non-GAAP-based Measures
|
Non-GAAP-based Measures % of Revenue
|
|||||||
|
Cost of revenues
|
||||||||||||
|
Cloud services and subscriptions
|
$
|
142,666
|
|
$
|
(342
|
)
|
(1)
|
$
|
142,324
|
|
||
|
Customer support
|
95,979
|
|
(754
|
)
|
(1)
|
95,225
|
|
|||||
|
Professional service and other
|
189,947
|
|
(855
|
)
|
(1)
|
189,092
|
|
|||||
|
Amortization of acquired technology-based intangible assets
|
69,917
|
|
(69,917
|
)
|
(2)
|
—
|
|
|||||
|
GAAP-based gross profit and gross margin (%) /
Non-GAAP-based gross profit and gross margin (%) |
1,113,029
|
|
68.5%
|
71,868
|
|
(3)
|
1,184,897
|
|
72.9%
|
|||
|
Operating expenses
|
||||||||||||
|
Research and development
|
176,834
|
|
(2,356
|
)
|
(1)
|
174,478
|
|
|||||
|
Sales and marketing
|
345,643
|
|
(7,312
|
)
|
(1)
|
338,331
|
|
|||||
|
General and administrative
|
142,450
|
|
(8,287
|
)
|
(1)
|
134,163
|
|
|||||
|
Amortization of acquired customer-based intangible assets
|
81,023
|
|
(81,023
|
)
|
(2)
|
—
|
|
|||||
|
Special charges (recoveries)
|
31,314
|
|
(31,314
|
)
|
(4)
|
—
|
|
|||||
|
GAAP-based income from operations and operating margin (%) / Non-GAAP-based income from operations and operating margin (%)
|
300,528
|
|
18.5%
|
202,160
|
|
(5)
|
502,688
|
|
30.9%
|
|||
|
Other income (expense), net
|
3,941
|
|
(3,941
|
)
|
(6)
|
—
|
|
|||||
|
Provision for (recovery of) income taxes
|
58,461
|
|
9,569
|
|
(7)
|
68,030
|
|
|||||
|
GAAP-based net income / Non-GAAP-based net income, attributable to OpenText
|
218,125
|
|
188,650
|
|
(8)
|
406,775
|
|
|||||
|
GAAP-based earnings per share / Non GAAP-based earnings per share-diluted, attributable to OpenText
|
$
|
1.81
|
|
$
|
1.56
|
|
(8)
|
$
|
3.37
|
|
||
|
(1)
|
Adjustment relates to the exclusion of share based compensation expense from our Non-GAAP-based operating expenses as this expense is excluded from our internal analysis of operating results.
|
|
(2)
|
Adjustment relates to the exclusion of amortization expense from our Non-GAAP-based operating expenses as the timing and frequency of amortization expense is dependent on our acquisitions and is hence excluded from our internal analysis of operating results.
|
|
(3)
|
GAAP-based and Non-GAAP-based gross profit stated in dollars and gross margin stated as a percentage of revenue.
|
|
(4)
|
Adjustment relates to the exclusion of Special charges (recoveries) from our Non-GAAP-based operating expenses as Special charges are generally incurred in the periods following the relevant acquisitions and are not indicative or related to continuing operations and are therefore excluded from our internal analysis of operating results.
|
|
(5)
|
GAAP-based and Non-GAAP-based income from operations stated in dollars and operating margin stated as a percentage of revenue.
|
|
(6)
|
Adjustment relates to the exclusion of Other income (expense) from our Non-GAAP-based operating expenses as Other income (expense) relates primarily to the transactional impact of foreign exchange and is generally not indicative or related to continuing operations and is therefore excluded from our internal analysis of operating results.
|
|
(7)
|
Adjustment relates to differences between the GAAP-based tax provision rate of approximately 21% and a non-GAAP-based tax rate of 14.3%; these rate differences are due to the income tax effects of expenses that are excluded for the purpose of calculating non-GAAP-based adjusted net income. Such excluded expenses include amortization, share-based compensation, special charges and other income (expense), net. Also excluded are tax expense items unrelated to current period income such as changes in reserves for tax uncertainties and valuation allowance reserves, tax arising on internal reorganizations, and “book to return” adjustments for tax return filings and tax assessments (in total “adjusted expenses”). In arriving at our non-GAAP-based tax rate of 14.3%, we analyzed the individual adjusted expenses and took into consideration the impact of statutory tax rates from local jurisdictions incurring the expense.
|
51
|
(8)
|
Reconciliation of Non-GAAP-based adjusted net income to GAAP-based net income:
|
|
Year Ended June 30, 2014
|
||||||
|
Per share diluted
|
|
|||||
|
Non-GAAP-based net income, attributable to OpenText
|
$
|
406,775
|
|
$
|
3.37
|
|
|
Less:
|
||||||
|
Amortization
|
150,940
|
|
1.25
|
|
||
|
Share-based compensation
|
19,906
|
|
0.17
|
|
||
|
Special charges (recoveries)
|
31,314
|
|
0.26
|
|
||
|
Other (income) expense, net
|
(3,941
|
)
|
(0.03
|
)
|
||
|
GAAP-based provision for (recovery of) income taxes
|
58,461
|
|
0.48
|
|
||
|
Non-GAAP based provision for income taxes
|
(68,030
|
)
|
(0.57
|
)
|
||
|
GAAP-based net income, attributable to OpenText
|
$
|
218,125
|
|
$
|
1.81
|
|
52
Reconciliation of selected GAAP-based measures to Non-GAAP-based measures for the year ended
June 30, 2013
(in thousands except for per share data)
|
Year Ended June 30, 2013
|
||||||||||||
|
GAAP-based Measures
|
GAAP-based Measures % of Revenue
|
Adjustments
|
Note
|
Non-GAAP-based Measures
|
Non-GAAP-based Measures % of Revenue
|
|||||||
|
Cost of revenues
|
||||||||||||
|
Cloud services and subscriptions
|
$
|
73,464
|
|
$
|
(128
|
)
|
(1)
|
$
|
73,336
|
|
||
|
Customer support
|
106,172
|
|
(434
|
)
|
(1)
|
$
|
105,738
|
|
||||
|
Professional service and other
|
196,663
|
|
(915
|
)
|
(1)
|
$
|
195,748
|
|
||||
|
Amortization of acquired technology-based intangible assets
|
93,610
|
|
(93,610
|
)
|
(2)
|
$
|
—
|
|
||||
|
GAAP-based gross profit and gross margin (%) /
Non-GAAP-based gross profit and gross margin (%) |
877,432
|
|
64.4%
|
95,087
|
|
(3)
|
$
|
972,519
|
|
71.3%
|
||
|
Operating expenses
|
||||||||||||
|
Research and development
|
164,010
|
|
(1,693
|
)
|
(1)
|
162,317
|
|
|||||
|
Sales and marketing
|
289,157
|
|
(8,429
|
)
|
(1)
|
280,728
|
|
|||||
|
General and administrative
|
109,325
|
|
(3,976
|
)
|
(1)
|
105,349
|
|
|||||
|
Amortization of acquired customer-based intangible assets
|
68,745
|
|
(68,745
|
)
|
(2)
|
—
|
|
|||||
|
Special charges (recoveries)
|
24,034
|
|
(24,034
|
)
|
(4)
|
—
|
|
|||||
|
GAAP-based income from operations and operating margin (%) / Non-GAAP-based income from operations and operating margin (%)
|
197,665
|
|
14.5%
|
201,964
|
|
(5)
|
399,629
|
|
29.3%
|
|||
|
Other income (expense), net
|
(2,473
|
)
|
2,473
|
|
(6)
|
—
|
|
|||||
|
Provision for (recovery of) income taxes
|
29,690
|
|
23,881
|
|
(7)
|
53,571
|
|
|||||
|
GAAP-based net income / Non-GAAP-based net income, attributable to OpenText
|
148,520
|
|
180,556
|
|
(8)
|
329,076
|
|
|||||
|
GAAP-based earnings per share / Non GAAP-based earnings per share-diluted, attributable to OpenText
|
$
|
1.26
|
|
$
|
1.53
|
|
(8)
|
$
|
2.79
|
|
||
|
(1)
|
Adjustment relates to the exclusion of share based compensation expense from our Non-GAAP-based operating expenses as this expense is excluded from our internal analysis of operating results.
|
|
(2)
|
Adjustment relates to the exclusion of amortization expense from our Non-GAAP-based operating expenses as the timing and frequency of amortization expense is dependent on our acquisitions and is hence excluded from our internal analysis of operating results.
|
|
(3)
|
GAAP-based and Non-GAAP-based gross profit stated in dollars and gross margin stated as a percentage of revenue.
|
|
(4)
|
Adjustment relates to the exclusion of Special charges (recoveries) from our Non-GAAP-based operating expenses as Special charges are generally incurred in the periods following the relevant acquisitions and are not indicative or related to continuing operations and are therefore excluded from our internal analysis of operating results.
|
|
(5)
|
GAAP-based and Non-GAAP-based income from operations stated in dollars and operating margin stated as a percentage of revenue.
|
|
(6)
|
Adjustment relates to the exclusion of Other income (expense) from our Non-GAAP-based operating expenses as Other income (expense) relates primarily to the transactional impact of foreign exchange and is generally not indicative or related to continuing operations and is therefore excluded from our internal analysis of operating results.
|
|
(7)
|
Adjustment relates to differences between the GAAP-based tax provision rate of approximately 17% and a non-GAAP-based tax rate of 14%; these rate differences are due to the income tax effects of expenses that are excluded for the purpose of calculating non-GAAP-based adjusted net income. Such excluded expenses include amortization, share-based compensation, special charges and other income (expense), net. Also excluded are tax expense items unrelated to current period income such as movements in FIN48 and valuation allowance reserves, tax arising on internal reorganizations, and “book to return” adjustments for tax return filings and tax assessments (in total “adjusted expenses”). In arriving at our non-GAAP-based tax rate of 14%, we analyzed the individual adjusted expenses and took into consideration the impact of statutory tax rates from local jurisdictions incurring the expense.
|
53
|
(8)
|
Reconciliation of Non-GAAP-based adjusted net income to GAAP-based net income:
|
|
Year Ended June 30, 2013
|
||||||
|
Per share diluted
|
|
|||||
|
Non-GAAP-based net income, attributable to OpenText
|
$
|
329,076
|
|
$
|
2.79
|
|
|
Less:
|
||||||
|
Amortization
|
162,355
|
|
1.37
|
|
||
|
Share-based compensation
|
15,575
|
|
0.13
|
|
||
|
Special charges (recoveries)
|
24,034
|
|
0.20
|
|
||
|
Other (income) expense, net
|
2,473
|
|
0.02
|
|
||
|
GAAP-based provision for (recovery of) income taxes
|
29,690
|
|
0.25
|
|
||
|
Non-GAAP based provision for income taxes
|
(53,571
|
)
|
(0.44
|
)
|
||
|
GAAP-based net income, attributable to OpenText
|
$
|
148,520
|
|
$
|
1.26
|
|
54
LIQUIDITY AND CAPITAL RESOURCES
The following tables set forth changes in cash flows from operating, investing and financing activities for the periods indicated:
|
As of June 30,
|
||||||||||||||||||||
|
(In thousands)
|
2015
|
Change increase (decrease)
|
2014
|
Change increase (decrease)
|
2013
|
|||||||||||||||
|
Cash and cash equivalents
|
$
|
699,999
|
|
$
|
272,109
|
|
$
|
427,890
|
|
$
|
(42,555
|
)
|
$
|
470,445
|
|
|||||
|
Marketable Securities*
|
$
|
20,274
|
|
$
|
20,274
|
|
$
|
—
|
|
$
|
—
|
|
$
|
—
|
|
|||||
*The long-term portion of the marketable securities are included within "Other Assets" in the
Consolidated Balance Sheets
|
Year Ended June 30,
|
||||||||||||||||||||
|
(In thousands)
|
2015
|
Change
|
2014
|
Change
|
2013
|
|||||||||||||||
|
Cash provided by operating activities
|
$
|
523,031
|
|
$
|
105,904
|
|
$
|
417,127
|
|
$
|
98,625
|
|
$
|
318,502
|
|
|||||
|
Cash used in investing activities
|
$
|
(398,395
|
)
|
$
|
754,973
|
|
$
|
(1,153,368
|
)
|
$
|
(778,974
|
)
|
$
|
(374,394
|
)
|
|||||
|
Cash provided by (used in) financing activities
|
$
|
170,605
|
|
$
|
(517,339
|
)
|
$
|
687,944
|
|
$
|
719,062
|
|
$
|
(31,118
|
)
|
|||||
Cash and cash equivalents
Cash and cash equivalents primarily consist of deposits held at major banks with original maturities of 90 days or less.
We anticipate that our cash and cash equivalents, as well as available credit facilities, will be sufficient to fund our anticipated cash requirements for working capital, contractual commitments, capital expenditures, dividends, potential acquisitions under our normal course issuer bid, and operating needs for the next 12 months. However, any further material or acquisition-related activities may require additional sources of financing and would be subject to the financial covenants established under our credit facilities. For more details, see "Long-term Debt and Credit Facilities" below.
We do not have any material restrictions on repatriation of cash from foreign subsidiaries nor do we expect taxes on repatriation of cash held in foreign subsidiaries to have a material effect on our overall liquidity, financial condition or results of operations. As at June 30, 2015, we have provided $12.1 million (June 30, 2014—$7.6 million) in respect of both additional foreign withholding taxes or deferred income tax liabilities for temporary differences related to the undistributed earnings of certain non-United States subsidiaries, and planned periodic repatriations from certain United States and Luxembourg subsidiaries, that will be subject to withholding taxes upon distribution.
Cash flows provided by operating activities
Fiscal 2015 Compared to Fiscal 2014:
Cash flows from operating activities increased by
$105.9 million
due to an increase in net income before the impact of non-cash items of $73.7 million and an increase in changes from working capital of $32.2 million. The increase in operating cash flow from changes in working capital of $32.2 million is primarily due to the net impact of the following changes: (i) $60.4 million relating to a lower accounts receivable balance, (ii) $13.8 million relating to a higher accounts payable and accrued liabilities balance and (iii) $0.8 million relating to a higher balance in other assets. These increases were offset by the net impact of the following changes: (i) $18.2 million relating to the net impact of changes in income taxes and deferred charges and credits, (ii) $14.7 million due to a higher prepaid and other current assets balance and (iii) $9.9 million relating to a higher deferred revenue balance. The changes in working capital were largely due to the increased scale of operations resulting from our GXS acquisition.
During the fourth quarter of Fiscal 2015 our Days Sales Outstanding (DSO) was 53 days the same as DSO of 53 days during the fourth quarter of Fiscal 2014 and the per day impact of our DSO in the fourth quarters of Fiscal 2015 and Fiscal 2014 on our cash flows was $3.2 million and $3.3 million, respectively.
Fiscal 2014 Compared to Fiscal 2013:
Cash flows from operating activities increased by
$98.6 million
due to an increase in net income before the impact of non-cash items of $68.1 million and an increase in changes from working capital of $30.5 million. The increase in operating cash flow from changes in working capital of $30.5 million is primarily due to the net impact of the following changes: (i) $47.5
55
million relating to the net impact of changes in income taxes and deferred charges and credits, (ii) $11.2 million relating to a higher deferred revenue balance, (iii) $6.9 million relating to a lower prepaid and other current assets balance, and (iv) $5.5 million relating to a higher accounts payable and accrued liabilities balance. These increases were offset by the net impact of the following changes: (i) $35.2 million relating to a higher accounts receivable balance, and (ii) $5.4 million relating to a higher other assets balance. The changes in working capital were largely due to the increased scale of operations resulting from our GXS acquisition.
During the fourth quarter of Fiscal 2014 our DSO was 53 days compared to a DSO of 45 days during the fourth quarter of Fiscal 2013 and the per day impact of our DSO in the fourth quarters of Fiscal 2014 and Fiscal 2013 on our cash flows was $3.2 million and $1.9 million, respectively.
Cash flows used in investing activities
Our cash flows used in investing activities is primarily on account of acquisitions and additions of property and equipment.
Fiscal 2015 Compared to Fiscal 2014:
Cash flows used in investing activities decreased by
$755.0 million
. This is primarily due to lower consideration for our acquisitions made during Fiscal 2015 than for our acquisitions made during Fiscal 2014, and proceeds of $17.0 million received from the maturity of short-term investments. These were partially offset by incremental additions to property and equipment of $34.8 million, and a $8.1 million increase in other investing activities.
Fiscal 2014 Compared to Fiscal 2013:
Cash flows used in investing activities increased by
$779.0 million
. This is primarily due to the higher consideration for our acquisitions made during Fiscal 2014 than for our acquisitions made during Fiscal 2013. Additionally, we invested $19.2 million in incremental additions to property and equipment.
Cash flows from financing activities
Our cash flows from financing activities consist of long-term debt financing and amounts received from stock options exercised by our employees. These inflows are typically offset by scheduled and non-scheduled repayments of our long-term debt financing and, when applicable, the payment of dividends and/or the repurchases of our Common Shares.
Fiscal 2015 Compared to Fiscal 2014:
Cash flows provided by financing activities decreased by
$517.3 million
. This is primarily due to the repayment of the outstanding balances of our Term Loan A during the third quarter of Fiscal 2015 and of our mortgage during the fourth quarter of Fiscal 2015. Additionally, we increased dividend payments to our shareholders by $12.9 million, we purchased Treasury stock for potential reissuance under our current LTIP plans for $8.9 million, and we incurred approximately $2.0 million in additional debt issuance costs (see note 7 "Other Assets", and note 10 "Long-term Debt" to our
Consolidated Financial Statements
).
Fiscal 2014 Compared to Fiscal 2013:
Cash flows used in financing activities increased by
$719.1 million
. This is primarily the result of the receipt of a net amount of approximately $783.3 million under our new term loan facility (Term Loan B) which was used, in part, to fund our acquisition of GXS. Additionally, cash collected from the issuance of Common Shares increased by $8.5 million. The increases in cash proceeds were offset by an increase in principal payments on our debt facilities of $15.2 million, and an increase in dividend payments made to our shareholders of $57.0 million.
Cash Dividends
In Fiscal 2015, we declared and paid cash dividends that totaled
$87.6 million
. Future declarations of dividends and the establishment of future record and payment dates are subject to the final determination and discretion of our Board of Directors. See Item 5. "Dividend Policy" for more information.
In Fiscal 2014, we declared and paid cash dividends that totaled $74.7 million.
In Fiscal 2013, we declared and paid cash dividends that totaled $17.7 million.
56
Senior Unsecured Fixed Rate Notes
On January 15, 2015, we issued $800 million in aggregate principal amount of our 5.625% Senior Notes due 2023 (Senior Notes) in a private placement to qualified institutional buyers pursuant to Rule 144A under the Securities Act and to certain persons in offshore transactions pursuant to Regulation S under the Securities Act. Senior Notes bear interest at a rate of 5.625% per annum, payable semi-annually in arrears on January 15 and July 15, commencing on July 15, 2015. Senior Notes will mature on January 15, 2023, unless earlier redeemed in accordance with their terms, or repurchased.
We may redeem all or a portion of the Senior Notes at any time prior to January 15, 2018 at a redemption price equal to 100% of the principal amount of the Senior Notes plus an applicable premium, plus accrued and unpaid interest, if any, to the redemption date. In addition, we may also redeem up to 40% of the aggregate principal amount of the Senior Notes, on one or more occasions, prior to January 15, 2018, using the net proceeds from certain qualified equity offerings at a redemption price of 105.625% of the principal amount, plus accrued and unpaid interest, if any, to the redemption date, subject to compliance with certain conditions. We may, on one or more occasion, redeem Senior Notes, in whole or in part, at any time on and after January 15, 2018 at the applicable redemption prices set forth in the indenture, dated as of January 15, 2015, among the Company, the subsidiary guarantors party thereto, Citibank, N.A., as U.S. trustee, and Citi Trust Company Canada, as Canadian Trustee (the Indenture), plus accrued and unpaid interest, if any, to the redemption date.
If we experience one of the kinds of changes of control triggering events specified in the Indenture, we will be required to make an offer to repurchase Senior Notes at a price equal to 101% of the principal amount of the Senior Notes, plus accrued and unpaid interest, if any, to the date of purchase.
The Indenture contains covenants that limit our and certain of our subsidiaries’ ability to, among other things: (i) create certain liens and enter into sale and lease-back transactions; (ii) create, assume, incur or guarantee additional indebtedness of the Company or the subsidiary guarantors without such subsidiary becoming a subsidiary guarantor of the Senior Notes; and (iii) consolidate, amalgamate or merge with, or convey, transfer, lease or otherwise dispose of its property and assets substantially as an entirety to, another person. These covenants are subject to a number of important limitations and exceptions as set forth in the Indenture. The Indenture also provides for events of default, which, if any of them occurs, may permit or, in certain circumstances, require the principal, premium, if any, interest and any other monetary obligations on all the then-outstanding notes to be due and payable immediately.
Senior Notes are initially guaranteed on a senior unsecured basis by our existing and future wholly-owned subsidiaries that borrow or guarantee the obligations under the Revolver and Term Loan B (each defined below). Senior Notes and the guarantees rank equally in right of payment with all of our and our subsidiary guarantors’ existing and future senior unsubordinated debt and will rank senior in right of payment to all of our and our subsidiary guarantors’ future subordinated debt. Senior Notes and the guarantees will be effectively subordinated to all of ours and our guarantors’ existing and future secured debt, including the obligations under the Revolver and Term Loan B, to the extent of the value of the assets securing such secured debt.
On January 15, 2015, we used a portion of the net proceeds of the offering of Senior Notes to repay in full the outstanding Term Loan A (as defined below). We have added the remaining net proceeds of the offering to our cash balances for general corporate purposes, including potential future acquisitions.
The foregoing description of the Indenture does not purport to be complete and is qualified in its entirety by reference to the full text of the Indenture, which is filed as an exhibit to the Company’s Current Report on Form 8-K filed with the SEC on January 15, 2015.
Term Loan A and Revolver
Prior to January 15, 2015, one of our credit facilities consisted of a $600 million term loan facility (Term Loan A) and a $300 million committed revolving credit facility (the Revolver and, together with Term Loan A, the 2011 Credit Agreement).
On January 15, 2015, concurrently with the closing of the offering of Senior Notes, we used a portion of the net proceeds from the offering of Senior Notes to repay in full the outstanding balance of our Term Loan A.
On January 15, 2015, concurrently with the closing of the offering of Senior Notes and effective upon the repayment in full of Term Loan A with a portion of the net proceeds of the Senior Notes offering, the 2011 Credit Agreement was amended and restated as described in the second amendment to the 2011 Credit Agreement to, among other things, remove the provisions related to Term Loan A and modify certain provisions related to the incurrence of debt and liens and the making of acquisitions, investments and restricted payments, replace the covenants to maintain a “consolidated leverage” ratio of no more than 3:1 and a “consolidated interest coverage” ratio of 3:1 or more with a covenant to maintain a “consolidated net leverage” ratio of no more than 4:1, and make other changes, in each case, generally to conform with Term Loan B, as further described below.
57
Borrowings under the Revolver are secured by a first charge over substantially all of our assets, and as of January 16, 2014, on a pari passu basis with Term Loan B (as defined below). As part of the second amendment to the 2011 Credit Agreement, the commitments available under the Revolver was increased to
$300 million
from
$100 million
. The Revolver will mature on December 22, 2019 with no fixed repayment date prior to the end of the term. As of
June 30, 2015
, we have not drawn any amounts on the Revolver.
Term Loan B
In connection with the acquisition of GXS, on
January 16, 2014
, we entered into a second credit facility, which provides for a $800 million term loan facility with certain lenders named therein, Barclays Bank PLC (Barclays), as sole administrative agent and collateral agent, and with Barclays and RBC Capital Markets as lead arrangers and joint bookrunners (Term Loan B). Repayments made under Term Loan B are equal to 0.25% of the original principal amount in equal quarterly installments for the life of Term Loan B, with the remainder due at maturity.
Borrowings under Term Loan B are secured by a first charge over substantially all of our assets on a pari passu basis with Term Loan A (prior to the repayment of Term Loan A) and the Revolver. We entered into Term Loan B and borrowed the full amount of $800 million on
January 16, 2014
. Term Loan B has a seven year term.
Borrowings under Term Loan B bear interest at a rate per annum equal to an applicable margin plus, at the borrower’s option, either (1) the eurodollar rate for the interest period relevant to such borrowing or (2) an ABR rate determined by reference to the greatest of (i) the prime rate of Barclays, (ii) the federal funds rate plus 0.50% per annum and (iii) the one month eurodollar rate plus 1.00% per annum. The applicable margin for borrowings under Term Loan B will be 2.5% with respect to LIBOR borrowings and 1.5% with respect to ABR rate borrowings.
Currently we have chosen for our borrowings under Term Loan B to bear a floating rate of interest at a rate per annum equal to 2.5% plus the higher of LIBOR or 0.75%. As of
June 30, 2015
, the interest rate was 3.25%.
Term Loan B has incremental facility capacity of (i) $250 million plus (ii) additional amounts, subject to meeting a “consolidated senior secured net leverage” ratio not exceeding 2.75:1.00, in each case subject to certain conditions. Consolidated senior secured net leverage ratio is defined for this purpose as the proportion of our total debt reduced by unrestricted cash, including guarantees and letters of credit, that is secured by our or any of our subsidiaries’ assets, over our trailing twelve months net income before interest, taxes, depreciation, amortization, restructuring, share-based compensation and other miscellaneous charges.
Under Term Loan B, we must maintain a “consolidated net leverage” ratio of no more than 4:1 at the end of each financial quarter. Consolidated net leverage ratio is defined for this purpose as the proportion of our total debt reduced by unrestricted cash, including guarantees and letters of credit, over our trailing twelve months net income before interest, taxes, depreciation, amortization, restructuring, share-based compensation and other miscellaneous charges. As of
June 30, 2015
, our consolidated net leverage ratio was 1.5:1.
For further details relating to our Term Loan B, please see note 10 "Long-Term Debt" to our
Consolidated Financial Statements
.
Mortgage
During the fourth quarter of Fiscal 2015 we repaid in full the outstanding balance of our mortgage of $7.8 million. The original principal amount of the mortgage was Canadian
$15.0 million
and interest accrued monthly at a variable rate of Canadian prime plus
0.50%
.
Normal Course Issuer Bid
On July 28, 2015, our board of directors authorized the repurchase of up to
$200 million
of our Common Shares. Shares may be repurchased from time to time in the open market, private purchases through forward, derivative, accelerated repurchase or automatic repurchase transactions or otherwise. Certain of our share repurchases may from time to time be effected through repurchase plans. The timing of any repurchases will depend on market conditions, our financial condition, results of operations, liquidity and other factors.
Shelf Registration Statement
In response to the demand and piggyback registration requests we received pursuant to the registration rights agreement entered into in connection with the acquisition of GXS, we filed a universal shelf registration statement on Form S-3 (the Shelf Registration Statement) with the SEC, which became effective automatically. The Shelf Registration Statement allows for primary and secondary offering from time to time of equity, debt and other securities, including Common Shares, Preference
58
Shares, debt securities, depositary shares, warrants, purchase contracts, units and subscription receipts. A base shelf prospectus qualifying the distribution of such securities was also filed with certain Canadian securities regulators. The type of securities and the specific terms thereof will be determined at the time of any offering and will be described in the applicable prospectus supplement to be filed separately with the SEC and such Canadian securities regulators.
Pensions
As of
June 30, 2015
, our total unfunded pension plan obligations were
$58.3 million
, of which
$1.6 million
is payable within the next 12 months. We expect to be able to make the long-term and short-term payments related to these obligations in the normal course of operations.
Our anticipated payments under our most significant plans for the fiscal years indicated below are as follows:
|
|
Fiscal years ending June 30,
|
||||||||||
|
|
CDT
|
GXS GER
|
GXS PHP
|
||||||||
|
2016
|
$
|
575
|
|
$
|
774
|
|
$
|
26
|
|
||
|
2017
|
629
|
|
788
|
|
35
|
|
|||||
|
2018
|
672
|
|
877
|
|
43
|
|
|||||
|
2019
|
754
|
|
937
|
|
105
|
|
|||||
|
2020
|
821
|
|
989
|
|
69
|
|
|||||
|
2021 to 2025
|
5,039
|
|
5,373
|
|
1,203
|
|
|||||
|
Total
|
$
|
8,490
|
|
$
|
9,738
|
|
$
|
1,481
|
|
||
For a detailed discussion on all pensions, see note 11 "Pension Plans and Other Post Retirement Benefits" to our
Consolidated Financial Statements
.
Commitments and Contractual Obligations
As of
June 30, 2015
, we have entered into the following contractual obligations with minimum payments for the indicated fiscal periods as follows:
|
|
Payments due between
|
||||||||||||||||||
|
(In thousands)
|
Total
|
July 1, 2015—
June 30, 2016 |
July 1, 2016—
June 30, 2018 |
July 1, 2018—
June 30, 2020 |
July 1, 2020
and beyond |
||||||||||||||
|
Long-term debt obligations*
|
$
|
2,088,255
|
|
$
|
78,938
|
|
$
|
156,944
|
|
$
|
155,957
|
|
$
|
1,696,416
|
|
||||
|
Operating lease obligations**
|
200,984
|
|
47,642
|
|
69,155
|
|
44,253
|
|
39,934
|
|
|||||||||
|
Purchase obligations
|
15,457
|
|
9,707
|
|
5,505
|
|
245
|
|
—
|
|
|||||||||
|
$
|
2,304,696
|
|
$
|
136,287
|
|
$
|
231,604
|
|
$
|
200,455
|
|
$
|
1,736,350
|
|
|||||
*Long-term debt obligations include the Senior Notes issued on January 15, 2015.
**Net of
$2.8 million
of sublease income to be received from properties which we have subleased to third parties.
The long-term debt obligations are comprised of interest and principal payments on the Senior Notes, and credit facilities. See note 10 "Long-Term Debt" to our
Consolidated Financial Statements
.
We have entered into customer agreements which may include provisions to indemnify our customers against third party claims that our software products or services infringe certain third party intellectual property rights and for liabilities related to a breach of our confidentiality obligations. We have not made any material payments in relation to such indemnification provisions and have not accrued any liabilities related to these indemnification provisions in our
Consolidated Financial Statements
.
Litigation
We are currently involved in various claims and legal proceedings.
Quarterly, we review the status of each significant legal matter and evaluate such matters to determine how they should be treated for accounting and disclosure purposes in accordance with the requirements of ASC Topic 450-20 "Loss Contingencies" (Topic 450-20). Specifically, this evaluation process includes the centralized tracking and itemization of the status of all our disputes and litigation items, discussing the nature of any litigation and claim, including any dispute or claim
59
that is reasonably likely to result in litigation, with relevant internal and external counsel, and assessing the progress of each matter in light of its merits and our experience with similar proceedings under similar circumstances.
If the potential loss from any claim or legal proceeding is considered probable and the amount can be reasonably estimated, we accrue a liability for the estimated loss in accordance with Topic 450-20. As of the date of this
Annual Report
on Form
10-K
, such aggregated losses were not material to our consolidated financial position or result of operations and we do not believe as of the date of this filing that it is reasonably possible that a loss exceeding the amounts already recognized will be incurred that would be material to our consolidated financial position or results of operations.
Contingencies
As we have previously disclosed, the IRS is examining certain of our tax returns for Fiscal 2010 through Fiscal 2012, and in connection with those examinations is reviewing our internal reorganization in Fiscal 2010 to consolidate certain intellectual property ownership in Luxembourg and Canada and our integration of certain acquisitions into the resulting structure. We also previously disclosed that the examinations may lead to proposed adjustments to our taxes that may be material, individually or in the aggregate, and that we have not recorded any material accruals for any such potential adjustments in our Consolidated Financial Statements.
As part of these examinations, on July 17, 2015 we received from the IRS a Notice of Proposed Adjustment (“NOPA”) in draft form proposing a one-time approximately $280 million increase to our U.S. federal taxes arising from the reorganization in Fiscal 2010 and proposing penalties equal to 20% of the additional taxes, plus interest at the applicable statutory rate (which will continue to accrue until the matter is resolved and may be substantial). A NOPA is an IRS position and does not impose an obligation to pay tax. The draft NOPA may be changed before the final NOPA is issued, including because the IRS reserved the right in the draft NOPA to increase the adjustment. Based on our discussions with the IRS, we expect we will receive an additional NOPA proposing an approximately $80 million increase to our U.S. federal taxes for Fiscal 2012 arising from the integration of Global 360 into the structure that resulted from the reorganization, accompanied by proposed penalties and interest (although there can be no assurance that this will be the amount reflected in the NOPA when received). Depending upon the outcome of these matters, additional state income taxes plus penalties and interest may be due.
We strongly disagree with the IRS’ position and intend to vigorously contest the proposed adjustments to our taxable income. We are examining various alternatives available to taxpayers to contest the proposed adjustments. Any such alternatives could involve a lengthy process and result in the incurrence of significant expenses. As of the date of this Annual Report on Form 10-K, we have not recorded any material accruals in respect of these examinations in our Consolidated Financial Statements. An adverse outcome of these tax examinations could have a material adverse effect on our financial position and results of operations.
As part of our acquisition of GXS, we have inherited a tax dispute in Brazil between the Company’s subsidiary, GXS Tecnologia da Informação (Brasil) Ltda. (GXS Brazil), and the municipality of São Paulo, in connection with GXS Brazil’s judicial appeal of a tax claim in the amount of
$2.3 million
as of
June 30, 2015
. We currently have in place a bank guarantee in the amount of
$3.6 million
in recognition of this dispute. However, we believe that the position of the São Paulo tax authorities is not consistent with the relevant facts and based on information available on the case and other similar matters provided by local counsel, we believe that we can defend our position and that no tax is owed. Although we believe that the facts support our position, the ultimate outcome of this matter could result in a loss of up to the claim amount discussed above, plus future interest or penalties that may accrue.
Historically, prior to our acquisition of GXS, GXS would charge certain costs to its subsidiaries, including GXS Brazil, primarily based on historical transfer pricing studies that were intended to reflect the costs incurred by subsidiaries in relation to services provided by the parent company to the subject subsidiary. GXS recorded taxes on amounts billed, that were considered to be due based on the intercompany charges. GXS subsequently re-evaluated its intercompany charges to GXS Brazil and related taxes and, upon taking into consideration the current environment and judicial proceedings in Brazil, concluded that it was probable that certain indirect taxes would be assessable and payable based upon the accrual of such intercompany charges and has approximately
$6.1 million
accrued for the probable amount of a settlement related to the indirect taxes, interest and penalties.
Our Indian subsidiary, GXS India Technology Centre Private Limited (GXS India), is subject to potential assessments by Indian tax authorities in the city of Bangalore. GXS India has received assessment orders from the Indian tax authorities alleging that the transfer price applied to intercompany transactions was not appropriate. Based on advice from our tax advisors, we believe that the facts that the Indian tax authorities are using to support their assessment are incorrect. We have filed appeals and anticipate an eventual settlement with the Indian tax authorities. We have accrued
$1.4 million
to cover our anticipated financial exposure in this matter.
Please also see "Risk Factors" elsewhere in this Annual Report on Form 10-K.
60
Off-Balance Sheet Arrangements
We do not enter into off-balance sheet financing as a matter of practice except for the use of operating leases for office space, computer equipment, and vehicles. None of the operating leases described in the previous sentence has, and we currently do not believe that they potentially may have, a material effect on our financial condition, revenues, expenses, results of operations, liquidity, capital expenditures or capital resources. In accordance with U.S. GAAP, neither the lease liability nor the underlying asset is carried on the balance sheet, as the terms of the leases do not meet the criteria for capitalization.
61
|
Item 7A.
|
Quantitative and Qualitative Disclosures About Market Risk
|
We are primarily exposed to market risks associated with fluctuations in interest rates on our term loans and foreign currency exchange rates.
Interest rate risk
Our exposure to interest rate fluctuations relate primarily to our Term Loan B.
As of
June 30, 2015
, we had an outstanding balance of
$788.0 million
on Term Loan B. Term Loan B bears a floating interest rate of
2.5%
plus the higher of LIBOR or 0.75%. As of
June 30, 2015
, an adverse change of one percent on the interest rate would have the effect of increasing our annual interest payment on Term Loan B by approximately
$7.9 million
, assuming that the loan balance as of
June 30, 2015
is outstanding for the entire period.
At
June 30, 2014
, an adverse change of one percent would have had the effect of increasing our annual interest payments on Term Loan B by approximately $8.0 million, assuming that the loan balance was outstanding for the entire period.
Foreign currency risk
Foreign currency transaction risk
We transact business in various foreign currencies. Our foreign currency exposures typically arise from intercompany fees, intercompany loans and other intercompany transactions that are expected to be cash settled in the near term. We expect that we will continue to realize gains or losses with respect to our foreign currency exposures. Our ultimate realized gain or loss with respect to foreign currency exposures will generally depend on the size and type of cross-currency transactions that we enter into, the currency exchange rates associated with these exposures and changes in those rates. Additionally, we have hedged certain of our Canadian dollar foreign currency exposures relating to our payroll expenses in Canada.
Based on the foreign exchange forward contracts outstanding as at
June 30, 2015
, a one cent change in the Canadian dollar to U.S. dollar exchange rate would have caused a change of approximately
$0.8 million
in the mark to market on our existing foreign exchange forward contracts.
At
June 30, 2014
, a one cent change in the Canadian dollar to U.S. dollar exchange rate would have caused a change of approximately
$1.1 million
in the mark to market on our existing foreign exchange forward contracts.
Foreign currency translation risk
Our reporting currency is the U.S. dollar. Fluctuations in foreign currencies impact the amount of total assets and liabilities that we report for our foreign subsidiaries upon the translation of these amounts into U.S. dollars. In particular, the amount of cash and cash equivalents that we report in U.S. dollars for a significant portion of the cash held by these subsidiaries is subject to translation variance caused by changes in foreign currency exchange rates as of the end of each respective reporting period (the offset to which is recorded to accumulated other comprehensive income on our
Consolidated Balance Sheets
).
The following table shows our cash and cash equivalents denominated in certain major foreign currencies as of
June 30, 2015
(equivalent in U.S. dollar):
|
(In thousands)
|
U.S. Dollar
Equivalent at June 30, |
|||||||
|
2015
|
2014
|
|||||||
|
Euro
|
$
|
125,411
|
|
$
|
85,729
|
|
||
|
British Pound
|
28,634
|
|
24,552
|
|
||||
|
Canadian Dollar
|
21,358
|
|
6,182
|
|
||||
|
Swiss Franc
|
12,364
|
|
11,735
|
|
||||
|
Other foreign currencies
|
55,996
|
|
60,791
|
|
||||
|
Total cash and cash equivalents denominated in foreign currencies
|
243,763
|
|
188,989
|
|
||||
|
U.S. dollar
|
456,236
|
|
238,901
|
|
||||
|
Total cash and cash equivalents
|
$
|
699,999
|
|
$
|
427,890
|
|
||
If overall foreign currency exchange rates in comparison to the U.S. dollar uniformly weakened by 10%, the amount of cash and cash equivalents we would report in equivalent U.S. dollars would decrease by approximately
$24.4 million
(June 30, 2014—
$18.9 million
).
62
The response to this Item 8 is submitted as a separate section of this Annual Report on Form 10-K. See Part IV, Item 15.
None.
(A) Evaluation of Disclosure Controls and Procedures
As of the end of the period covered by this
Annual Report
on Form
10-K
, our management, with the participation of the Chief Executive Officer and Chief Financial Officer, performed an evaluation of the effectiveness of the design and operation of our disclosure controls and procedures as defined in Rule 13a-15(e) promulgated under the Securities Exchange Act of 1934, as amended (the Exchange Act). Based upon that evaluation, the Chief Executive Officer and Chief Financial Officer concluded that as of
June 30, 2015
, our disclosure controls and procedures were effective to provide reasonable assurance that information required to be disclosed in our reports filed or submitted under the Exchange Act were recorded, processed, summarized and reported within the time periods specified in the Securities and Exchange Commission’s rules and forms, and that information required to be disclosed by us in the reports we file under the Exchange Act (according to Rule 13(a)-15(e)) is accumulated and communicated to our management, including the Chief Executive Officer and Chief Financial Officer, as appropriate, to allow timely decisions regarding required disclosure.
(B) Management's Annual Report on Internal Control over Financial Reporting
Our management is responsible for establishing and maintaining adequate internal control over financial reporting (ICFR), as such term is defined in Exchange Act Rule 13a-15(f). ICFR is a process designed by, or under the supervision of, our Chief Executive Officer and Chief Financial Officer and effected by our Board of Directors, management and other personnel, to provide reasonable assurance regarding the reliability of our financial reporting and the preparation of our financial statements for external purposes in accordance with generally accepted accounting principles. ICFR includes those policies and procedures that (i) pertain to the maintenance of records that in reasonable detail accurately and fairly reflect the transactions and dispositions of assets; (ii) provide reasonable assurance that transactions are recorded as necessary to permit preparation of financial statements in accordance with generally accepted accounting principles, and that our receipts and expenditures are being made only in accordance with the authorizations of our management and our directors; and (iii) provide reasonable assurance regarding prevention or timely detection of unauthorized acquisition, use, or disposition of our assets that could have a material effect on our financial statements.
Our management assessed our ICFR as of June 30, 2015, the end of our most recent fiscal year. In making our assessment, our management used the criteria established in Internal Control-Integrated Framework (2013) issued by the Committee of Sponsoring Organizations of the Treadway Commission.
Our management has excluded from our evaluation the ICFR of Actuate, which we acquired on January 16, 2015, as discussed in note 18 "Acquisitions" to the Consolidated Financial Statements included elsewhere in this Annual Report on Form 10-K. Total revenues subject to Actuate's ICFR represented 2% of our consolidated total revenues for the fiscal year ended June 30, 2015. Total assets subject to Actuate's ICFR represented 9% of our consolidated total assets as of June 30, 2015.
Based on the results of our evaluation, our management, including the Chief Executive Officer and Chief Financial Officer, concluded that our ICFR was effective as of June 30, 2015.
The results of our management’s assessment was reviewed with our Audit Committee and the conclusion that our ICFR was effective as of
June 30, 2015
has been audited by KPMG LLP, an independent registered public accounting firm, as stated in their report which is included in Part IV, Item 15 of this Annual Report.
Our management, including the Chief Executive Officer and Chief Financial Officer, do not expect that our disclosure controls or our ICFR will prevent or detect all error or all fraud. A control system, no matter how well designed and operated, can provide only reasonable, not absolute, assurance that the control system's objectives will be met. The design of a control system must reflect the fact that there are resource constraints, and the benefits of controls must be considered relative to their costs. Further, because of the inherent limitations in all control systems, no evaluation of controls can provide absolute assurance that misstatements due to error or fraud will not occur or that all control issues and instances of fraud, if any, have been detected. These inherent limitations include the realities that judgments in decision-making can be faulty and that breakdowns can occur because of simple error. Controls can also be circumvented by the individual acts of some persons, by collusion of two or more people, or by management override of the controls. The design of any system of controls is based in part on certain assumptions about the likelihood of future events, and there can be no assurance that any design will succeed in
63
achieving its stated goals under all potential future conditions. Any evaluation of prospective control effectiveness, with respect to future periods, is subject to risks. Over time, controls may become inadequate because of changes in conditions or deterioration in the degree of compliance with policies or procedures.
(C) Attestation Report of the Independent Registered Public Accounting Firm
KPMG LLP, our independent registered public accounting firm, has issued a report under Public Company Accounting Oversight Board Auditing Standard No. 5 on the effectiveness of our ICFR. See Item 8 of this Annual Report on Form 10-K.
(D) Changes in Internal Control over Financial Reporting (ICFR)
Based on the evaluation completed by our management, in which our Chief Executive Officer and Chief Financial Officer participated, our management has concluded that there were no changes in our internal control over financial reporting (as defined in Rule 13a-15(f) under the Exchange Act) during the fiscal quarter ended
June 30, 2015
that have materially affected, or are reasonably likely to materially affect, our internal control over financial reporting.
64
Item 10.
Directors, Executive Officers and Corporate Governance
The following table sets forth certain information as to our directors and executive officers as of July 27, 2015.
|
Name
|
Age
|
Office and Position Currently Held With Company
|
|
Mark J. Barrenechea
|
50
|
President and Chief Executive Officer, Director
|
|
John Doolittle
|
51
|
Chief Financial Officer
|
|
Gordon A. Davies
|
53
|
Chief Legal Officer and Corporate Secretary
|
|
Adam Howatson
|
33
|
Chief Marketing Officer
|
|
David Jamieson
|
50
|
Chief Information Officer
|
|
Sujeet Kini
|
53
|
Chief Accounting Officer
|
|
Muhi Majzoub
|
55
|
Senior Vice President, Engineering
|
|
James McGourlay
|
46
|
Senior Vice President, Worldwide Customer Services
|
|
Lisa Zangari
|
46
|
Chief Human Resources Officer
|
|
Gary Weiss
|
48
|
Senior Vice President, Cloud Services
|
|
P. Thomas Jenkins
|
55
|
Chairman of the Board
|
|
Randy Fowlie (2)(3)
|
55
|
Director
|
|
Gail E. Hamilton (2)
|
65
|
Director
|
|
Brian J. Jackman (1)
|
74
|
Director
|
|
Stephen J. Sadler
|
64
|
Director
|
|
Michael Slaunwhite (1)(3)
|
54
|
Director
|
|
Katharine B. Stevenson (2)
|
53
|
Director
|
|
Deborah Weinstein (1)(3)
|
55
|
Director
|
|
(1)
|
Member of the Compensation Committee.
|
|
(2)
|
Member of the Audit Committee.
|
|
(3)
|
Member of the Corporate Governance and Nominating Committee.
|
Mark J. Barrenechea
Mr. Barrenechea joined OpenText as President and Chief Executive Officer in January 2012. Prior to joining OpenText, Mr. Barrenechea was President and Chief Executive Officer of Silicon Graphics International Corporation (SGI). During Mr. Barrenechea's tenure at SGI, he led strategy and execution, which included transformative acquisition of assets, as well as penetrating diverse new markets and geographic regions. Mr. Barrenechea also served as director of SGI from 2006 to 2012.
Previously, Mr. Barrenechea served as Executive Vice President and CTO for CA, Inc. (CA) (formerly Computer Associates International, Inc.) from 2003 to 2006 and was a member of the executive management team. Before going to CA, Mr. Barrenechea served as Senior Vice President of Applications Development at Oracle Corporation, from 1997 to 2003, managing a multi-thousand person global team while serving as a member of the executive management team. From 1994 to 1997, Mr. Barrenechea served as Vice President of Development at Scopus, a software applications company. Prior to Scopus, Mr. Barrenechea was with Tesseract, where he was responsible for reshaping the company's line of human capital management software as Vice President of Development. Mr. Barrenechea is currently a member of the board and audit committee of Dick's Sporting Goods. Mr. Barrenechea holds a Bachelor of Science degree in computer science from Saint Michael's College. Mr. Barrenechea is the author of two books about the evolution of the enterprise software industry: “
ebusiness or Out of Business: Oracle's Roadmap for Profiting in the New Economy
”, and “
Software Rules: How the Next Generation of Enterprise Applications Will Increase Strategic Effectiveness
”.
65
John Doolittle
Mr. Doolittle joined OpenText as Chief Financial Officer in September 2014. Mr. Doolittle has experience in taxation, financial planning and analysis, treasury, and mergers and acquisitions. With more than 20 years of financial experience, Mr. Doolittle was most recently the Chief Financial Officer of Mattamy Homes from 2012 to 2014. Prior to joining Mattamy, Mr. Doolittle held senior financial roles with Nortel Networks Corporation, including serving as its Chief Financial Officer from 2009 to 2012. In the past, Mr. Doolittle has also served as the Vice-President of Finance for the Bank of Montreal’s Global Treasury Group from 1997 to 1999. Mr. Doolittle holds a Bachelor of Commerce degree from McMaster University and is a Chartered Professional Accountant (Ontario) (1988).
Gordon A. Davies
Mr. Davies has been the Company's Chief Legal Officer and Corporate Secretary since September 2009. He also serves as the Corporation's Compliance Officer. Prior to joining OpenText, Mr. Davies was the Chief Legal Officer and Corporate Secretary of Nortel Networks Corporation. During his sixteen years at Nortel, Mr. Davies acted as Deputy General Counsel and Corporate Secretary during 2008, and as interim Chief Legal Officer and Corporate Secretary in 2005 and again in 2007. He led the Corporate Securities legal team as General Counsel-Corporate from 2003, with responsibility for providing legal support on all corporate and securities law matters, and spent five years in Europe supporting all aspects of the Europe, Middle East and Africa (EMEA) business, ultimately as General Counsel, EMEA. Prior to joining Nortel, Mr. Davies practiced securities law at a major Toronto law firm. Mr. Davies holds an LL.B and an MBA from the University of Ottawa, and a B.A. from the University of British Columbia. He is a member of the Law Society of Upper Canada, the Canadian Bar Association, the Association of Canadian General Counsel and the Society of Corporate Secretaries and Governance Professionals.
Adam Howatson
Mr. Howatson has served as the Company's Chief Marketing Officer (CMO) since October 2014. Prior to becoming CMO, Mr. Howatson held a number of positions at OpenText, which include serving in Engineering from March 2013 to September 2014, Office of The President/PMO during 2012, and Product Management from 2006 to 2012. Prior to that he also held roles in Technical Marketing, Mergers & Acquisitions, and Information Technology. Mr. Howatson also served on the national board of directors for the Information Technology Association of Canada (ITAC) from June 2013 to September 2014. Mr. Howatson holds certifications from the University of Waterloo and the Canadian Forces College.
David Jamieson
Mr. Jamieson joined OpenText as the Chief Information Officer in November 2014. He brings over 25 years of experience in leading Information Technology organizations through the ever-changing technology landscape. Prior to joining OpenText, Mr. Jamieson worked at Barrick Gold Corporation, where he served as Director of Information Technology for four years before being appointed as the Vice President of Information Management and Technology in 2005. Mr. Jamieson has held senior positions with companies, such as Universal Studios Canada from 1999 to 2001, EDS/SHL Systemhouse from 1996 to 1999, and Canadian Pacific Railway from 1988 to 1996. Mr. Jamieson holds a Bachelor of Applied Science, Mechanical Engineering from the University of Toronto and received his Professional Engineer designation in 1990.
Sujeet Kini
Mr. Kini joined OpenText in August 2004 as Director, External Reporting. In January 2007, Mr. Kini was appointed to the position of Vice President, External Reporting, in December 2009 to the position of Vice President, Controller and in February 2013 to the position of Chief Accounting Officer. Prior to joining OpenText, Mr. Kini was the Controller of Financial Reporting and Technical Accounting for Direct Energy Marketing Limited (Direct Energy), a supplier of electricity and natural gas products from March 2003 until August 2004. From March 2001 until March 2003, Mr. Kini was Senior Manager, External Reporting at GT Group Telecom Inc. (GT), a company which marketed and sold telecommunication products and services in fibre-optic infrastructure. Prior to working with GT, Mr. Kini worked with PricewaterhouseCoopers LLP at their Toronto office from October 1997 to March 2001. Mr. Kini is a Chartered Professional Accountant (Ontario) and a Certified Public Accountant (Colorado). He is also a member of the Financial Executive International Canada's (FEI Canada) Committee for Corporate Reporting. This is a committee that formulates FEI Canada statements and positions on matters pertaining to financial accounting, auditing and corporate reporting.
Muhi Majzoub
Mr. Majzoub joined OpenText in June 2012 as Senior Vice President, Engineering and is responsible for managing product development cycles, global development organization and driving internal operations and development processes. Mr. Majzoub is a seasoned enterprise software technology executive having recently served as Head of Products for
66
NorthgateArinso, a private company, that provides global Human Resources software and services. Prior to this, Mr. Majzoub was Senior Vice President of Product Development for CA, Technologies from June 2004 to July 2010. Mr. Majzoub also worked for several years as Vice President for Product Development at Oracle Corporation from January 1989 to June 2004. Mr. Majzoub attended San Francisco State University.
James McGourlay
Mr. McGourlay has served as the Senior Vice President of Global Technical Services since May 2015. Prior to this, Mr. McGourlay was the Company's Senior Vice President of Worldwide Customer Service from February 2012 to May 2015. Mr. McGourlay joined OpenText in 1997 and held progressive positions in information technology, technical support, product support and special projects, including, Director, Customer Service and Vice President, Customer Service in 2005.
Lisa Zangari
Ms. Zangari joined OpenText in September 2014 as Chief Human Resources Officer and is accountable for shaping and driving OpenText's culture and talent management strategies. Prior to OpenText, Ms. Zangari held the role of Senior Vice President, Human Resources at IAMGOLD Corporation from 2009 to 2014. Prior to IAMGOLD, Ms. Zangari held a variety of executive roles in strategic human resources with companies in the gold sector, including Kinross Gold Corporation from 2005 to 2009 and the former Placer Dome Group from 1993 to 2005. Ms. Zangari holds a Bachelor of Science degree in Business Administration, Human Resources Management.
Gary Weiss
Mr. Weiss was appointed to Senior Vice President, Cloud Services in September 2014. Mr. Weiss joined OpenText in 2012 as the SVP of the Information Exchange business unit. Prior to joining OpenText, Mr. Weiss worked at CA, Inc. (formerly Computer Associates International, Inc.) from 2003 to 2011. During his tenure at CA, Mr. Weiss held various executive level positions, including SVP of Sales for the Security business, SVP, Business Development and Alliances, and was a member of the Senior Leadership team at CA from 2009 to 2011. Mr. Weiss has also worked as an independent consultant to small- to mid-size security organizations for many years. He began his career in Information Technology in 1993 as one of the first sales executives at Security Dynamics (later renamed RSA Security) before joining e-Security in 2001 to lead the North American Sales, Channel, and Technology Services. Mr. Weiss holds a B.A. from Tulane University.
P. Thomas Jenkins
Mr. Jenkins is Chairman of the Board of OpenText. From 1994 to 2005, Mr. Jenkins was President, then Chief Executive Officer and then from 2005 to 2013, Chief Strategy Officer of OpenText. Mr. Jenkins has served as a Director of OpenText since 1994 and as its Chairman since 1998. In addition to his OpenText responsibilities, Mr. Jenkins is Executive Fellow at the School of Public Policy at the University of Calgary. Currently, Mr. Jenkins is also a member of the board of Thomson Reuters Inc., Manulife Financial Corporation, and TransAlta Corporation. He is the Chair of the National Research Council of Canada (NRC) and Canadian Chair of the Atlantik Brueke, a director of the C.D. Howe Institute, and a director of the Canadian Council of Chief Executives (CCCE). Mr. Jenkins received an M.B.A. from Schulich School of Business at York University, an M.A.Sc. from the University of Toronto and a B.Eng. & Mgt. from McMaster University. Mr. Jenkins received an honorary doctorate of laws from the University of Waterloo and an honorary doctorate of Military Science from the Royal Military College of Canada. He is a recipient of the 2009 Ontario Entrepreneur of the Year, the 2010 McMaster Engineering L.W. Shemilt Distinguished Alumni Award and the Schulich School of Business 2012 Outstanding Executive Leadership award. He is a Fellow of the Canadian Academy of Engineering (FCAE). Mr. Jenkins was awarded the Canadian Forces Decoration (CD) and the Queen's Diamond Jubilee Medal (QJDM). Mr. Jenkins is an Officer of the Order of Canada (OC).
Randy Fowlie
Mr. Fowlie has served as a director of OpenText since March 1998. Mr. Fowlie is currently the President and CEO of RDM Corporation, a leading provider of specialized hardware and software solutions in the electronic payment industry. RDM Corporation trades on the Toronto Stock Exchange (TSX). Mr. Fowlie operated a consulting practice from July 2006 to December 2010. From January 2005 until July 2006, Mr. Fowlie held the position of Vice President and General Manager, Digital Media, of Harris Corporation, formerly Leitch Technology Corporation (Leitch), a company that was engaged in the design, development, and distribution of audio and video infrastructure to the professional video industry. Leitch was acquired in August 2005 by Harris Corporation. From June 1999 to January 2005, Mr. Fowlie held the position of Chief Operating Officer and Chief Financial Officer of Inscriber Technology Corporation (Inscriber), a computer software company and from February 1998 to June 1999 Mr. Fowlie was the Chief Financial Officer of Inscriber. Inscriber was acquired by Leitch in January 2005. Prior to working at Inscriber Mr. Fowlie was a partner with KPMG LLP, Chartered Accountants, where he worked from 1984 to February 1998. Currently, Mr. Fowlie is also a director at RDM Corporation. Mr. Fowlie received a
67
B.B.A. (Honours) from Wilfrid Laurier University and is a Chartered Professional Accountant. In the last five years, Mr. Fowlie also served as a director of DALSA Corporation and Semcan Inc.
Gail E. Hamilton
Ms. Hamilton has served as a director of OpenText since December 2006. For the five years prior thereto, Ms. Hamilton led a team of over 2,000 employees worldwide as Executive Vice President at Symantec Corp (Symantec), an infrastructure software company, and most recently had “P&L” responsibility for their global services and support business. During her five years at Symantec, Ms. Hamilton helped steer the company through an aggressive acquisition strategy. In 2003, Information Security magazine recognized Ms. Hamilton as one of the “20 Women Luminaries” shaping the security industry. Ms. Hamilton has over 20 years of experience growing leading technology and services businesses in the enterprise market. She has extensive management experience at Compaq and Hewlett Packard, as well as Microtec Research. Ms. Hamilton received both a BSEE from the University of Colorado and an MSEE from Stanford University. Currently, Ms. Hamilton is also a director of the following public companies: Ixia, a provider of application performance and security solutions, Westmoreland Coal Company and Arrow Electronics, Inc, a distributor of components and computer systems. In the last five years, Ms. Hamilton also served as a director of Surgient, Inc., which was acquired by Quest Software.
Brian J. Jackman
Mr. Jackman has served as a director of OpenText since December 2002. Mr. Jackman is the President of the Jackman Group Inc., a private consulting firm he founded in 2005. From 1982 until his retirement in September 2001, Mr. Jackman held various positions with Tellabs Inc., a U.S. based manufacturer of telecommunications equipment, most recently as Executive Vice President of the company, and President, Global Systems and Technologies division, and as a member of the board of directors of the company. Prior to joining Tellabs Inc., Mr. Jackman worked for IBM Corporation from 1965 to 1982, in a variety of systems, sales and marketing positions. Mr. Jackman also serves as a director of PC-TEL, Incorporated. In the last five years, he was a director of Keithley Instruments, Incorporated until it was acquired in December 2010. Mr. Jackman received a B.A from Gannon University and an M.B.A from The Pennsylvania State University.
Stephen J. Sadler
Mr. Sadler has served as a director of OpenText since September 1997. From April 2000 to present, Mr. Sadler has served as the Chairman and CEO of Enghouse Systems Limited, a publicly traded software engineering company that develops geographic information systems as well as contact center systems. Mr. Sadler was previously Chief Financial Officer, President and Chief Executive Officer of GEAC Computer Corporation Ltd. (GEAC). Prior to Mr. Sadler's involvement with GEAC, he held executive positions with Phillips Electronics Limited and Loblaws Companies Limited, and was Chairman of Helix Investments (Canada) Inc. Currently, Mr. Sadler is a director of Enghouse Systems Limited. Mr. Sadler holds a B.A. Sc. (Honours) in Industrial Engineering and an M.B.A. (Dean's List) and he is a Chartered Professional Accountant. In the past five years, Mr. Sadler also served as a director of Frontline Technologies Inc. (formerly Belzberg Technologies Inc.).
Michael Slaunwhite
Mr. Slaunwhite has served as a director of OpenText since March 1998. Mr. Slaunwhite is presently the Executive Chairman of Halogen Software Inc. Mr. Slaunwhite had served as CEO and Chairman of Halogen Software Inc., a provider of talent management software, from 2000 to August 2006, and as President and Chairman from 1995 to 2000. From 1994 to 1995, Mr. Slaunwhite was an independent consultant to a number of companies, assisting them with strategic and financing plans. Mr. Slaunwhite was the Chief Financial Officer of Corel Corporation from 1988 to 1993. Mr. Slaunwhite holds B.A. Commerce (Honours) from Carleton University.
Katharine B. Stevenson
Ms. Stevenson has served as a director of OpenText since December of 2008. Since 2011, she has been a director of the Canadian Imperial Bank of Commerce (CIBC) and currently serves as a member of the CIBC Audit and Governance Committees. She has been a director of Valeant Pharmaceuticals International Inc. since 2010, serving on its Audit and Risk and Special Finance Committees, and since 1997 a director of CAE Inc., currently serving as Chairman of its Audit Committee. Valeant, CIBC and CAE Inc. are publicly listed companies. Ms. Stevenson also served as a director and Chairman of the Audit Committee of OSI Pharmaceuticals Inc, until its sale to Astellas Pharma Inc. in 2010. She was formerly a senior finance executive of Nortel Networks Corporation from 1995 to 2007, serving as global treasurer from 2000 to 2007. From 1984 to 1995, she held a variety of positions in investment and corporate banking at JP Morgan Chase & Co. Ms. Stevenson holds a B.A. (Magna Cum Laude) from Harvard University. She is certified with the professional designation ICD.D, granted by the Institute of Corporate Directors (ICD).
68
Deborah Weinstein
Ms. Weinstein has served as a director of OpenText since December 2009. Ms. Weinstein is a co-founder and partner of LaBarge Weinstein LLP, a business law firm based in Ottawa, Ontario, since 1997. Ms. Weinstein's legal practice specializes in corporate finance, securities law, mergers and acquisitions and business law representation of public and private companies, primarily in knowledge-based growth industries. Prior to founding LaBarge Weinstein LLP, Ms. Weinstein was a partner of the law firm Blake, Cassels & Graydon LLP, where she practiced from 1990 to 1997 in Ottawa, and in Toronto from 1985 to 1987. Ms. Weinstein also serves as a director of Dynex Power Inc., a manufacturer of power semiconductors, and on a number of not-for-profit boards. Ms. Weinstein holds an LL.B. from Osgoode Hall Law School of York University. In the last five years, Ms. Weinstein also served as a director of LW Capital Pool Inc. and Standard Innovation Corporation, a private company.
Involvement in Certain Legal Proceedings
Ms. Stevenson served as the Treasurer of Nortel Networks Corporation (Nortel) from 2000 to August 2007. Mr. Doolittle served as the Chief Financial Officer of Nortel from 2009 to 2012. Mr. Davies served as the Chief Legal Officer and Corporate Secretary of Nortel during 2007 and from January to September 2009. In January 2009, Nortel filed petitions under applicable bankruptcy and insolvency laws of the United States, Canada and the United Kingdom.
Mr. Fowlie was a director of Meikle Group Inc. (Meikle Group), a private company, from June 2009 to April 2010. Subsequent to Mr. Fowlie's resignation, as part of a restructuring, creditors appointed a receiver to sell the business assets and transfer employees of Meikle Group, as a going concern, to a newly financed company.
Mr. Sadler was a director of Frontline Technologies Inc. (formerly Belzberg Technologies Inc.) from October 1997 to April 2012. Subsequent to Mr. Sadler's resignation, Frontline Technologies Inc. filed an assignment into bankruptcy under applicable bankruptcy and insolvency laws of Canada.
Audit Committee
The Audit Committee currently consists of three directors, Mr. Fowlie (Chair) and Mses. Hamilton and Stevenson, all of whom have been determined by the Board of Directors to be independent as that term is defined in NASDAQ Rule 5605(a)(2) and in Rule 10A-3 promulgated by the SEC under the Exchange Act, and within the meaning of our director independence standards and those of any exchange, quotation system or market upon which our securities are traded.
The responsibilities, mandate and operation of the Audit Committee are set out in the Audit Committee Charter, a copy of which is available on the Company's website,
www.opentext.com
under the Company/Investors section.
The Board of Directors has determined that Mr. Fowlie qualifies as an “audit committee financial expert” as such term is defined in SEC Regulation S-K, Item 407(d)(5)(ii).
Code of Business Conduct and Ethics
We have a Code of Business Conduct and Ethics (the Ethics Code) that applies to all of our directors, officers and employees. The Ethics Code incorporates our guidelines designed to deter wrongdoing and to promote honest and ethical conduct, including the ethical handling of actual or apparent conflicts of interest between personal and professional relationships, and compliance with all applicable laws and regulations. The Ethics Code also incorporates our expectations of our employees that enable us to provide full, fair, accurate, timely and understandable disclosure in our filings with the SEC and other public communications.
The full text of the Ethics Code is published on our web site at
www.opentext.com
under the Investors section.
If we make any substantive amendments to the Ethics Code or grant any waiver, including any implicit waiver, from a provision of the Ethics Code to our Chief Executive Officer, Chief Financial Officer or Chief Accounting Officer, we will disclose the nature of the amendment or waiver on our website at
www.opentext.com
under the Investors section or on a Current Report on Form 8-K.
Board Diversity and Term Limits
The Company, including the Corporate Governance and Nominating Committee, views diversity in a broad context and considers a variety of factors when assessing nominees for the Board. The Company has established a Board Diversity Policy recognizing that a Board made up of highly qualified directors from diverse backgrounds, including diversity of gender, age, race, sexual orientation, religion, ethnicity and geographic representation, is important. The Company has not established a specific target number or date by which to achieve a specific number of women on the Board, as we consider a multitude of factors, including skills, experience, expertise and character, in determining the best nominee at the time and consider the
69
Company’s objectives and challenges at such time. There are currently three women on the Board which represents approximately 33% of the current Board and of the director nominees, and 50% of the current independent Board members.
The Company has not set term limits for independent directors because it values the cumulative experience and comprehensive knowledge of the Company that long serving directors possess. The Company does not have a director retirement policy, however the Corporate Governance and Nominating Committee considers the results of its director assessment process in determining the nominees to be put forward. In conducting director evaluations and nominations, the Corporate Governance and Nominating Committee considers the composition of the Board and whether there is a need to include nominees with different skills, experiences and perspectives on the Board. This flexible approach allows the Company to consider each director individually as well as the Board composition generally to determine if the appropriate balance is being achieved.
Diversity in Executive Officer Positions
The Company is committed to a diverse and inclusive workplace, including advancing women to executive officer positions. The Company has not adopted specific objectives or targets regarding women at the executive officer level; however, the Company has adopted a formal written Global Diversity and Inclusion Policy which expresses its commitment to fostering a diverse and inclusive workplace for all employees. The Company currently only has one woman (11%) on the executive leadership team (ELT), our Chief Human Resources Officer, while 18% of existing positions on the senior leadership team (SLT), exclusive of our ELT, are held by women. A principal objective of our Global Diversity and Inclusion Policy is to support and monitor the identification, development and retention of diverse employees, including gender diversity at executive and leadership positions. We will continue to develop a sustainable culture of diversity and inclusion that provides all employees an opportunity to excel.
COMPENSATION COMMITTEE REPORT
Our Compensation Committee has reviewed and discussed with our management the following Compensation Discussion and Analysis (CD&A). Based on this review and discussion, our Compensation Committee has recommended to the Board of Directors (Board) that the following CD&A be included in our Annual Report on Form 10-K for the year ended June 30, 2015.
This report is provided by the following independent directors, who comprise our Compensation Committee:
Michael Slaunwhite (Chair), Brian J. Jackman, Deborah Weinstein.
To the extent that this Annual Report on Form 10-K has been or will be specifically incorporated by reference into any filing by us under the Securities Act of 1933, as amended, or the Exchange Act, this “Compensation Committee Report” shall not be deemed “soliciting materials”, unless specifically otherwise provided in any such filing.
COMPENSATION DISCUSSION AND ANALYSIS
The following discussion and analysis of compensation arrangements of the following individuals for the year which ended on June 30, 2015 (Fiscal 2015), should be read together with the compensation tables and related disclosures set forth below: (i) our principal executive officer, (ii) our current and former principal financial officer, (iii) our three most highly compensated executive officers, other than our principal executive officer and principal financial officer, and (iv) one additional individual for whom disclosure would have been provided but for the fact that such individual was not serving as an executive officer on June 30, 2015 (collectively, the Named Executive Officers). This discussion contains forward-looking statements that are based on our current plans, considerations, expectations and projections regarding future compensation programs. Actual compensation programs that we adopt in the future may differ materially from the various planned programs summarized in this discussion.
Payments in Canadian dollars included herein, unless otherwise specified, are converted to U.S. dollars using an average annual exchange rate of 0.862713
.
Overview of Compensation Program
The compensation of our Named Executive Officers is the responsibility of the Compensation Committee of OpenText's board of directors (the Compensation Committee or the Committee), either alone or in certain circumstances, in consultation with the Board. The Compensation Committee ensures compensation decisions are in line with our goal to provide total compensation to our Named Executive Officers that (i) is fair, reasonable and consistent with our compensation philosophy to
70
achieve our short-term and long-term business goals, and (ii) provides market competitive compensation. The Named Executive Officers who are the subject of this CD&A are:
|
•
|
Mark J. Barrenechea - President and Chief Executive Officer (CEO)
|
|
•
|
John M. Doolittle - Chief Financial Officer (CFO)
|
|
•
|
Paul McFeeters - Former Chief Financial Officer and Chief Administrative Officer (Former CFO)
|
|
•
|
David Jamieson - Chief Information Officer
|
|
•
|
Gordon A. Davies - Chief Legal Officer and Corporate Secretary
|
|
•
|
Lisa Zangari - Chief Human Resources Officer
|
|
•
|
Jonathan Hunter - Former Executive Vice President, Worldwide Field Operations
|
During Fiscal 2015, Mr. McFeeters served as our Chief Financial Officer and Chief Administrative Office until his retirement from such office, effective September 8, 2014, and Mr. Hunter served as Executive Vice President, Worldwide Field Operations until his departure from such office, effective May 20, 2015.
Where relevant, we have included Messrs. McFeeters and Hunter in the discussion under this CD&A and provided appropriate disclosure related to them. However, we have omitted a discussion of Messrs. McFeeters and Hunter where, as a result of their departure from the Company as an employee, such disclosure would not be meaningful. Mr. McFeeters did not participate in our short-term incentive plan for Fiscal 2015. For details of amounts paid to Mr. McFeeters for Fiscal 2015, see “Summary Compensation Table” below.
Compensation Oversight Process
Role of Compensation Committee
The Compensation Committee has responsibility for the oversight of executive compensation within the terms and conditions of our various compensation plans. The Compensation Committee approves the compensation of our executive officers, including all Named Executive Officers with the exception of our CEO.
In making compensation decisions relating to, among other things, performance targets, base salary, short-term incentives and long-term incentives, the Compensation Committee considers the input of the CEO. With respect to the compensation of our CEO, the Compensation Committee makes recommendations to the Board for approval. The Compensation Committee reviews and approves all equity awards related to executive compensation, which are granted by the Board.
The Board, the Compensation Committee, and our management have instituted a set of detailed policies and procedures to evaluate the performance of each of our Named Executive Officers which help determine the amount of the short-term incentives and long-term incentives to award to each Named Executive Officer.
The Compensation Committee considers previous compensation awards, the impact of tax, accounting treatments and applicable regulatory requirements when approving compensation programs.
During Fiscal 2015, the Committee’s work included the following:
|
•
|
Executive Compensation Review
- The Committee reviewed compensation practices and policies with respect to our ten most senior positions against similar-sized global technology companies, in order to allow us to place our compensation practices for these positions in a market context. This benchmarking included a review of base salary, total cash compensation and total direct compensation. In Fiscal 2015 the Committee referred to a recent benchmarking analysis that had been prepared in January 2014, in light of the Company’s then recent acquisition of GXS Inc, which had significantly increased the Company’s size and scope of operations. This benchmarking analysis was prepared by Radford, an AON Hewitt Company (Radford), which was engaged by management, with the approval of the Compensation Committee. See below for a more detailed discussion of the peer group used for this benchmarking.
|
|
•
|
CEO Compensation
- The Committee initiated a review of CEO compensation in consultation with its independent compensation consultant and recommended to the Board changes to such compensation.
|
|
•
|
Long-Term Incentive Plan
- The Compensation Committee reviewed quarterly analysis provided by Mercer Canada Limited (Mercer) related to performance under all outstanding Performance Share Unit Programs (for details on the programs, refer to the section titled “Long Term Incentives”).
|
71
In reaching its decisions, the Compensation Committee considered input from management, analysis provided from the compensation consultants, as well as other factors the Committee considered appropriate. Decisions made by the Compensation Committee are the responsibility of the Committee and may reflect factors and considerations other than the information and/or recommendations provided by management and the compensation consultants.
Compensation Consultants
The Compensation Committee seeks the advice of an outside compensation consultant to provide assistance and guidance on compensation issues. This consultant is screened and chosen by the Compensation Committee in discussion with management. The consultant may provide the Compensation Committee with relevant information pertaining to market compensation levels, alternative compensation plan designs, market trends and best practices and assists the Compensation Committee with respect to determining the appropriate benchmarks for each Named Executive Officer's compensation. Historically, since February 2008, the Compensation Committee engaged Mercer, wholly owned by Marsh & McLennan Companies (MMC), a human resources consulting services provider, to provide compensation analysis and independent advice. However, starting in October 2014, the Compensation Committee retained Hugessen Consulting Inc. (Hugessen), an independent consulting firm specializing in executive compensation consulting, to provide such services.
The fees paid to Hugessen for Fiscal 2015 for executive compensation consulting did not exceed $120,000. Hugessen did not provide any other services to the Company during Fiscal 2015.
The fees paid to Mercer and the MMC affiliates for the past two fiscal years were as follows:
|
(in thousands)
|
Fiscal 2015
|
Fiscal 2014
|
|||||
|
Executive Compensation
|
$
|
35
|
|
$
|
87
|
|
|
|
Other Services
|
$
|
471
|
|
$
|
372
|
|
|
During the time that Mercer was retained as the executive compensation consultants, various affiliates of MMC, including Mercer, did provide services unrelated to executive compensation. For example, our human resources department utilized Mercer on occasion for general human resources and compensation consulting. We also used other MMC affiliates for services such as health and benefits consulting, Group RRSP and 401(k) investment consulting, and insurance brokerage services. These other MMC affiliates are separate operating companies from Mercer and we have separate relationships with the service teams at each of these operating companies. With respect to executive compensation services, Mercer was retained by and only answered to the Compensation Committee. The Compensation Committee pre-approved all executive compensation services that were provided by Mercer during this period. While Mercer is still involved with monitoring our performance under our LTIP, as of October 2014 they were no longer involved with providing compensation advice to the Committee.
NASDAQ standards require compensation committees to have certain responsibilities and authority regarding the retention, oversight and funding of such committees' advisors and perform an evaluation of each advisor's independence, taking into consideration all factors relevant to that person's independence from management. NASDAQ standards also require that such rights and responsibilities be enumerated in the compensation committee's charter. While, as a foreign private issuer, we are exempt from these rules, nonetheless, our Compensation Committee has the sole authority to retain and terminate outside consultants.
The Compensation Committee met four times during Fiscal 2015, and on several occasions with its independent compensation consultant. Mercer and Hugessen did not attend any Compensation Committee meetings; however, during their respective times engaged as the compensation consultants, they did work in consultation with members of the Compensation Committee. Management assisted in the coordination and preparation of the meeting agenda and materials for each meeting. The agenda is reviewed and approved by the Chairman of the Compensation Committee. The meeting materials are generally mailed to the other Committee members and invitees, if any, for review approximately one week in advance of each meeting.
Compensation Philosophy
We believe that compensation plays an important role in achieving short and long-term business objectives that ultimately drives business success in alignment with long-term shareholder goals.
Our compensation philosophy is based on three fundamental principles:
|
•
|
Strong link to business strategy
- Our short and long-term goals are reflected in our overall compensation program.
|
|
•
|
Pay for Performance
- We aim to reward sustained company performance and individual achievements by aligning a significant portion of total compensation to our financial results and strategic objectives. We believe compensation should fluctuate with financial performance and accordingly, we structure total compensation to be at or above our
|
72
peer group median when our financial performance exceeds our target performance and likewise, we structure total compensation to be below our peer group median if our financial performance falls below our targets; and
|
•
|
Market relevant
- Our compensation program provides market competitive pay in terms of value and structure in order to retain talent who are performing according to their objectives and to attract new talent of the highest caliber. We aim to position our executive officers’ compensation targets at the median in relation to our peer group, however, actual pay depends on performance of the executive officers and the Company.
|
Our reward package is based primarily on results achieved by the Company as a whole. In addition, our Named Executive Officers may have a minority element of their reward package determined by their fulfillment of objectives which are specific to their role (Personal Objectives). The Compensation Committee has the flexibility to exercise discretion to ensure total compensation appropriately reflects performance.
Compensation Objectives
The objectives of our compensation program are to:
|
•
|
Attract and retain highly qualified executive officers who have a history of proven success;
|
|
•
|
Align the interests of executive officers with our shareholders' interests and with the execution of our business strategy;
|
|
•
|
Motivate and reward our high caliber executive team through competitive pay practices and an appropriate mix of short and long-term incentives;
|
|
•
|
Evaluate executive performance on the basis of key financial measurements which we believe closely correlate to long-term shareholder value; and
|
|
•
|
Tie compensation awards directly to key financial measurements with evaluations based on achieving and overachieving predetermined objectives.
|
Competitive Compensation
Aggregate compensation for each Named Executive Officer is designed to be market competitive. The Compensation Committee researches and refers to the compensation practices of similarly situated companies in determining our compensation policy. Although the Compensation Committee reviews each element of compensation for market competitiveness, and may weigh a particular element more heavily than another based on our Named Executive Officer's role within the Company, the focus on being competitive in the market with respect to total compensation remains.
The Compensation Committee regularly reviews data related to compensation levels and programs of a peer group of comparable organizations. In January 2014, a peer group analysis was prepared by Radford for management, then presented to and approved by the Compensation Committee. Our peer group includes global software and service providers that are similar in size, business complexity, and scope of operations to us. Key metrics considered include revenue, market capitalization, number of employees, and net income. Generally, organizations within our peer group are in a similar software industry with revenues, market capitalization and number of employees that fall between one-third and three times that of our market capitalization. This review resulted in our peer group consisting of 18 companies that include 17 US-based companies and one UK based company. There were no Canadian organizations that fell within all of the criteria noted above.
The analysis by Radford, prepared in January 2014 and presented to the Compensation Committee, benchmarked base salary, total cash compensation (base salary plus target short-term incentives), and total direct compensation (total cash compensation plus long-term incentives) for the ten most senior positions, including our Named Executive Officers, to the companies listed below, which collectively comprise our peer group. The Compensation Committee believed it was appropriate to use the same peer group analysis as in Fiscal 2014 primarily because the business and related industry dynamics did not materially change since the analysis was performed.
73
|
Last Fiscal Year
|
Trailing Twelve Months
|
Market Data as of 12/17/13
|
|||||||||||||||||
|
Company
|
Ticker
|
Fiscal Year End
|
# of Employees
|
Revenues ($ in millions)
|
Net Income ($ in millions)
|
Revenues ($ in millions)
|
Net Income ($ in millions)
|
Market Cap ($ in millions)
|
|||||||||||
|
AOL Inc.
|
AOL
|
12/31/12
|
5,600
|
|
$
|
2,191.7
|
|
$
|
1,048.4
|
|
$
|
2,240.4
|
|
$
|
92.1
|
|
$
|
3,518.7
|
|
|
Autodesk Inc.
|
ADSK
|
01/31/13
|
7,300
|
|
$
|
2,312.2
|
|
$
|
247.4
|
|
$
|
2,287.0
|
|
$
|
221.2
|
|
$
|
10,646.1
|
|
|
Broadridge Financial Solutions Inc.
|
BR
|
06/30/13
|
6,400
|
|
$
|
2,430.8
|
|
$
|
212.1
|
|
$
|
2,480.2
|
|
$
|
238.2
|
|
$
|
4,624.3
|
|
|
Cadence Design Systems Inc.
|
CDNS
|
12/31/12
|
5,200
|
|
$
|
1,326.4
|
|
$
|
439.9
|
|
$
|
1,429.0
|
|
$
|
440.4
|
|
$
|
3,942.1
|
|
|
Citrix Systems Inc.
|
CTXS
|
12/31/12
|
8,212
|
|
$
|
2,586.1
|
|
$
|
352.5
|
|
$
|
2,856.0
|
|
$
|
314.9
|
|
$
|
10,943.4
|
|
|
DST Systems Inc.
|
DST
|
12/31/12
|
17,928
|
|
$
|
2,576.6
|
|
$
|
324.0
|
|
$
|
2,649.9
|
|
$
|
306.5
|
|
$
|
3,797.4
|
|
|
Equinix Inc.
|
EQIX
|
12/31/12
|
3,153
|
|
$
|
1,895.7
|
|
$
|
144.7
|
|
$
|
2,092.2
|
|
$
|
88.7
|
|
$
|
8,449.1
|
|
|
Global Payments Inc.
|
GPN
|
05/31/13
|
3,954
|
|
$
|
2,375.9
|
|
$
|
216.1
|
|
$
|
2,415.3
|
|
$
|
234.1
|
|
$
|
4,595.6
|
|
|
Informatica Corporation
|
INFA
|
12/31/12
|
2,814
|
|
$
|
811.6
|
|
$
|
93.2
|
|
$
|
906.9
|
|
$
|
77.5
|
|
$
|
4,245.0
|
|
|
Mentor Graphics Corporation
|
MENT
|
01/31/13
|
5,029
|
|
$
|
1,088.7
|
|
$
|
133.5
|
|
$
|
1,079.7
|
|
$
|
109.4
|
|
$
|
2,709.4
|
|
|
Micros Systems Inc.
|
MCRS
|
06/30/13
|
6,506
|
|
$
|
1,268.1
|
|
$
|
171.4
|
|
$
|
1,282.9
|
|
$
|
162.6
|
|
$
|
4,057.8
|
|
|
Nuance Communications Inc.
|
NUAN
|
09/30/13
|
12,000
|
|
$
|
1,651.5
|
|
$
|
204.8
|
|
$
|
1,851.8
|
|
$
|
33.4
|
|
$
|
4,468.2
|
|
|
PTC Inc.
|
PTC
|
09/30/13
|
6,000
|
|
$
|
1,293.5
|
|
$
|
143.8
|
|
$
|
1,293.5
|
|
$
|
143.8
|
|
$
|
3,887.2
|
|
|
Red Hat Inc.
|
RHT
|
02/28/13
|
5,600
|
|
$
|
1,328.8
|
|
$
|
150.2
|
|
$
|
1,429.2
|
|
$
|
158.9
|
|
$
|
9,008.8
|
|
|
Sage Group
|
SGE
|
09/30/13
|
12,252
|
|
$
|
2,255.9
|
|
$
|
77.9
|
|
$
|
2,255.9
|
|
$
|
77.9
|
|
$
|
7,157.0
|
|
|
Synopsis Inc.
|
SNPS
|
10/31/12
|
8,138
|
|
$
|
1,756.0
|
|
$
|
182.4
|
|
$
|
1,911.6
|
|
$
|
220.0
|
|
$
|
5,938.5
|
|
|
Teradata Corporation
|
TDC
|
12/31/12
|
10,200
|
|
$
|
2,665.0
|
|
$
|
419.0
|
|
$
|
2,663.0
|
|
$
|
377.0
|
|
$
|
6,800.7
|
|
|
TIBCO Software Inc.
|
TIBX
|
11/30/12
|
3,646
|
|
$
|
1,024.6
|
|
$
|
122.0
|
|
$
|
1,051.0
|
|
$
|
88.3
|
|
$
|
3,913.2
|
|
|
75th Percentile
|
8,194
|
|
$
|
2,360.0
|
|
$
|
304.9
|
|
$
|
2,383.2
|
|
$
|
237.2
|
|
$
|
7,067.9
|
|
||
|
50th Percentile
|
6,200
|
|
$
|
1,825.9
|
|
$
|
193.6
|
|
$
|
2,001.9
|
|
$
|
160.8
|
|
$
|
4,531.9
|
|
||
|
25th Percentile
|
5,072
|
|
$
|
1,301.8
|
|
$
|
144.0
|
|
$
|
1,327.4
|
|
$
|
89.5
|
|
$
|
3,920.4
|
|
||
|
Average
|
7,274
|
|
$
|
1,824.4
|
|
$
|
260.2
|
|
$
|
1,898.6
|
|
$
|
188.0
|
|
$
|
5,705.7
|
|
||
|
OpenText (1)
|
OTEX
|
6/30/2013
|
8,400
|
|
$
|
1,850.7
|
|
$
|
144.2
|
|
$
|
5,264.7
|
|
||||||
|
Percentile Ranking
|
77
|
%
|
41
|
%
|
41
|
%
|
62
|
%
|
|||||||||||
|
(1)
|
OpenText results represent unaudited pro-forma revenues and net income for the 12 months ended June 30, 2013 as though the acquisition of GXS had occurred on July 1, 2012. For full details, see the Company’s Current Report on Form 8-K/A as filed with the SEC on April 3, 2014.
|
The purpose of the benchmarking process was to:
|
•
|
Understand the competitiveness of our current pay levels for each executive position relative to companies with similar revenues and business characteristics in our peer group;
|
|
•
|
Identify and understand gaps that may exist between our actual compensation levels and market compensation levels; and
|
|
•
|
Serve as a basis for developing salary adjustments and short-term and long-term incentive award programs for the Compensation Committee's approval.
|
Factoring the benchmarking review performed by the Compensation Committee in Fiscal 2014, Mr. Barrenechea received an adjustment to both his total cash and long term incentive in Fiscal 2015. The completion of several highly accretive acquisitions since Mr. Barrenechea joined Open Text as CEO has expanded the Company’s customer base, led to cost synergies and laid the foundation for future growth, particularly within cloud-based services. The Compensation Committee and the Board are committed to providing Mr. Barrenechea with a total compensation opportunity which rewards him appropriately for leading the superior growth of Open Text’s presence within the EIM market. Recognizing his proven track record, and to support his commitment to continue to deliver superior value creation, the Compensation Committee and the Board believe it is appropriate to target the CEO’s compensation at the top end of its peers. To achieve this positioning, Mr. Barrenechea’s annual compensation has been complemented by a front-loaded grant of performance-based equity, which vest over a five year period. For further details, see “- Long-Term Incentives - Long-Term Equity Grants to CEO” below. The Compensation Committee and
74
the Board believe a grant of this structure, with appropriate performance-conditions and long-term vesting, supports the long-term retention of a proven CEO within the context of the Company’s compensation philosophy principals of market relevance and pay-for-performance. No other adjustments were made to compensation for our Named Executive Officers during Fiscal 2015 as a result of the benchmarking review. However, the benchmarking analysis was indirectly taken into consideration when offering employment to Messrs. Doolittle and Jamieson, and Ms. Zangari, who each joined the Company during Fiscal 2015. See “Long-Term Incentives - Other Long-Term Equity Grants” below.
Aligning Officers' Interests with Shareholders' Interests
We believe that transparent, objective and easily verified corporate goals, combined with relevant and measurable individual performance goals, play an important role in creating and maintaining an effective compensation strategy for our Named Executive Officers. Our objective is to facilitate an increase in shareholder value through the achievement of these corporate goals under the leadership of our Named Executive Officers working in conjunction with all of our valued employees.
We use a combination of fixed and variable compensation to motivate our executive officers to achieve our corporate goals. For Fiscal 2015, the basic components of our executive officer compensation program were:
|
•
|
Fixed pay;
|
|
•
|
Short-term incentives; and
|
|
•
|
Long-term incentives.
|
To ensure alignment of the interests of our executive officers with the interests of our shareholders, our executive officers have a significant proportion of compensation “at risk”. Compensation that is “at risk” means compensation that may or may not be paid to an executive officer depending on whether the Company and such executive officer is able to meet or exceed applicable performance targets. Short-term incentives and long-term incentives meet this definition of compensation which is at risk, and they are also an additional incentive used to promote long-term value. The greater the executive officer’s influence upon our financial or operational results, the higher is the risk/reward portion of his compensation.
The Compensation Committee annually considers the percentage of each Named Executive Officer's total compensation that is “at risk” depending on the Named Executive Officer's responsibilities and objectives.
The chart below provides the approximate percentage of target total compensation provided to each Named Executive Officer that was either fixed pay or “at risk” for Fiscal 2015:
|
Named Executive Officer
|
Fixed Pay Percentage
(“Not At Risk”)
|
Short-Term Incentive
Percentage (at 100% target)
(“At Risk”)
|
Long-Term Incentive
Percentage (at 100% target)
(“At Risk”)
|
|||
|
Mark J. Barrenechea
|
17
|
%
|
17
|
%
|
66
|
%
|
|
John M. Doolittle
|
28
|
%
|
23
|
%
|
49
|
%
|
|
David Jamieson
|
34
|
%
|
33
|
%
|
33
|
%
|
|
Gordon A. Davies
|
26
|
%
|
19
|
%
|
55
|
%
|
|
Lisa Zangari
|
34
|
%
|
23
|
%
|
43
|
%
|
|
Jonathan Hunter
|
31
|
%
|
31
|
%
|
38
|
%
|
Fixed Pay
Fixed pay includes:
|
•
|
Base salary;
|
|
•
|
Perquisites; and
|
|
•
|
Other benefits.
|
Base Salary
The base salary review for each Named Executive Officer takes into consideration factors such as current competitive market conditions and particular skills (such as leadership ability and management effectiveness, experience, responsibility and proven or expected performance) of the particular individual. The Compensation Committee obtains information regarding competitive market conditions through the assistance of management and our compensation consultants.
75
The performance of each of our Named Executive Officers, other than our CEO, is assessed by our CEO in his capacity as the direct supervisor of the other Named Executive Officers. The performance of our CEO is assessed by the Board. The Board conducts the initial discussions and makes the initial decisions with respect to the performance of our CEO in a special session from which management is absent.
For details on the determination of base salary and our benchmarking process, see "Competitive Compensation" above.
Perquisites
Our Named Executive Officers receive a minimal amount of non-cash compensation in the form of executive perquisites. In order to remain competitive in the market place, our executive officers are entitled to some benefits that are not otherwise available to all of our employees. These benefits are provided in the form of a base allowance per year that each Named Executive Officer may choose to use for the purposes of:
|
•
|
Participating in an annual executive medical physical examination;
|
|
•
|
Maintaining membership in a health club;
|
|
•
|
Car allowances; and
|
|
•
|
Purchasing financial advice and related services.
|
Other Benefits
We provide various employee benefit programs on the same terms to all employees, including our Named Executive Officers, such as, but not limited to:
|
•
|
Medical health insurance;
|
|
•
|
Dental insurance;
|
|
•
|
Life insurance; and
|
|
•
|
Tax based retirement savings plans matching contributions.
|
Short-Term Incentives
In Fiscal 2015, all of our Named Executive Officers, with the exception of Mr. McFeeters, who retired from the Company in September 2014, participated in our short-term incentive plan, which is designed to motivate achievement of our short-term corporate goals. Awards made under the short-term incentive plan are made by way of cash payments only.
The amount of the short-term incentive payable to each Named Executive Officer, in general, is based on the ability of each Named Executive Officer to meet pre-established, qualitative and quantitative corporate objectives related to improving shareholder and company value, as applicable, which are reviewed and approved by the Compensation Committee and the Board. For all Named Executive Officers except for Mr. Hunter, these objectives consist of worldwide revenues and worldwide adjusted operating income. Due to Mr. Hunter’s
more direct influence on revenue, his objectives consisted of worldwide revenues and margins by revenue type, and minimum contract value (MCV), as defined below. In addition to these targets, all of our Named Executive Officers, with the exception of Mr. Hunter, have goals which are specific to their role, which we refer to as Personal Objectives. Personal Objectives are measurable and relevant to how we operate and grow and may include matters such as succession planning, corporate development initiatives and specific operational objectives.
Worldwide revenues are derived from the “Total Revenues” line of our audited income statement with certain adjustments relating to the aging of accounts receivable. Worldwide revenues are an important variable that helps us to assess our Named Executive Officers’ roles in helping us to grow and manage our business.
Worldwide adjusted operating income, which is intended to reflect the operational effectiveness of our leadership, is calculated as total revenues less the total cost of revenues and operating expenses excluding amortization of intangible assets, special charges and stock-based compensation expense. Worldwide adjusted operating income is also adjusted to remove the impact of foreign exchange.
Worldwide revenues by revenue type are derived from the “License”, “Cloud services and subscription”, and “Professional service and other” revenue lines in our audited income statement, with certain adjustments relating to the aging of accounts receivable. Worldwide margins by the same revenue types are derived as a ratio of profitability divided by sales. For example, cloud services margins would be calculated by taking its profitability (total cloud services revenues minus total cloud services cost of revenues) divided by total cloud services and revenues. Worldwide margins are also adjusted to remove the impact of foreign exchange. These measures are meaningful when assessing the performance of Mr. Hunter, who had primary responsibility for growing and managing the sales side of our business.
76
MCV is the total projected commissionable incremental revenue defined in a signed and written agreement between the Company and its customer. It represents the minimum amount of revenue that we expect to receive from a contract. For the purposes of calculating the achievement of this performance objective, we only consider MCV that is derived from new business.
We determine short-term performance measures and associated weightings for our Named Executive Officers based on our Named Executive Officer's specific role. We believe that each element of our short-term incentive compensation program requires strong performance from each of our Named Executive Officers in order for the relevant Named Executive Officer to receive the target awards. For details on the determination of targeted awards and our benchmarking process, see "Competitive Compensation" above.
For Fiscal 2015, the following table illustrates the total short-term target awards for each Named Executive Officer, along with the associated weighting of the related performance measures. The target amounts and resulting amounts payable for Messrs. Doolittle and Jamieson and Ms. Zangari were prorated based on the number of months they were employed during Fiscal 2015.
|
Named Executive Officer
|
Total Target
Award |
Worldwide Revenues
|
Worldwide Adjusted Operating Income
|
Worldwide License Revenues and MCV
|
Worldwide Professional Service and Cloud Services Revenues
|
Worldwide Professional Service and Cloud Services Margin
|
Personal Objectives
|
||||||||
|
Mark J. Barrenechea
|
$
|
945,000
|
|
45
|
%
|
45
|
%
|
N/A
|
|
N/A
|
|
N/A
|
|
10
|
%
|
|
John M. Doolittle
|
$
|
287,571
|
|
45
|
%
|
45
|
%
|
N/A
|
|
N/A
|
|
N/A
|
|
10
|
%
|
|
David Jamieson
|
$
|
178,293
|
|
45
|
%
|
45
|
%
|
N/A
|
|
N/A
|
|
N/A
|
|
10
|
%
|
|
Gordon A. Davies
|
$
|
251,049
|
|
45
|
%
|
45
|
%
|
N/A
|
|
N/A
|
|
N/A
|
|
10
|
%
|
|
Lisa Zangari
|
$
|
153,993
|
|
45
|
%
|
45
|
%
|
N/A
|
|
N/A
|
|
N/A
|
|
10
|
%
|
|
Jonathan Hunter
|
$
|
500,000
|
|
N/A
|
|
N/A
|
|
50
|
%
|
25
|
%
|
25
|
%
|
N/A
|
|
For the short-term incentive award amounts that would be earned at each of threshold, target and maximum levels of performance, for applicable objectives, see “Grants of Plan-Based Awards for Fiscal 2015” below.
For each performance measure, the Compensation Committee approves the total target award, and the Board applies a threshold and target level of performance. Where applicable, the Board also applies an objective formula for determining the percentage payout under awards for levels of performance above and below threshold and target, although the Board reserves the right in limited circumstances to make positive or negative adjustments if it considers them to be reasonably appropriate. To the extent target performance is exceeded, the award will be proportionately greater. The threshold and target levels and payout formula are set forth below as well as actual performance and payout percentages achieved in Fiscal 2015.
|
Objectives (in millions)
|
Threshold Target
(90% target) |
Target
|
Fiscal 2015
Actual (1) |
% Target Actually Achieved (2)
|
% of Payment per Fiscal 2015 Payout Table
|
||||||||
|
Worldwide Revenues
|
$
|
1,755
|
|
$
|
1,950
|
|
$
|
1,946
|
|
100
|
%
|
100
|
%
|
|
Worldwide Adjusted Operating Income
|
$
|
521
|
|
$
|
579
|
|
$
|
603
|
|
104
|
%
|
140
|
%
|
|
Worldwide Professional Service and Cloud Services Revenues
|
$
|
781
|
|
$
|
868
|
|
$
|
859
|
|
99
|
%
|
85
|
%
|
|
Worldwide Professional Service and Cloud Services Margin
|
$
|
528
|
|
$
|
587
|
|
$
|
590
|
|
101
|
%
|
110
|
%
|
|
Worldwide License Revenues and MCV (3)
|
N/A
|
|
$
|
570
|
|
$
|
523
|
|
92
|
%
|
N/A
|
|
|
|
(1)
|
Adjusted to remove the impact of foreign exchange and, in some cases, reflect certain adjustments relating to the aging of accounts receivable.
|
|
(2)
|
During the fourth quarter of Fiscal 2015 we combined revenues from cloud services and revenues from subscriptions into one category named "
Cloud services and subscriptions
" revenue. In addition, we reclassified certain license revenue, customer support revenue and professional services revenue to “
Cloud services and subscriptions
” revenue to better align the nature of the services that are now depicted under “
Cloud services and subscriptions
” revenue. The reclassifications were not considered in determining the actual achievement of our Fiscal 2015 objectives.
|
|
(3)
|
There is no threshold target for this performance measure. Payments under the performance measure for worldwide license revenues and MCV are determined based on a graduated scale where every dollar of license revenue and MCV achieved results in a performance payment. Additionally, because payments are based on a graduated scale, it is not meaningful to show a single percentage of payment per the Fiscal 2015 “Worldwide License Revenues and MCV” payout table, as more than one percentage level could be applicable.
|
77
The tables set forth below illustrate the percentage of the target awards that are paid to our Named Executives Officers, in accordance with our actual results achieved during Fiscal 2015.
|
Worldwide Revenues and Worldwide Professional Service and Cloud Services Revenues Calculations
|
|||||
|
% Attainment
|
% Payment
|
% Attainment
|
% Payment
|
||
|
0 - 89%
|
—
|
%
|
102%
|
150
|
%
|
|
90 - 91%
|
15
|
%
|
103%
|
175
|
%
|
|
92 - 93%
|
40
|
%
|
104%
|
200
|
%
|
|
94 - 95%
|
55
|
%
|
105%
|
225
|
%
|
|
96 - 97%
|
70
|
%
|
106%
|
250
|
%
|
|
98 - 99%
|
85
|
%
|
107%
|
275
|
%
|
|
100%
|
100
|
%
|
108% and above
|
300% cap
|
|
|
101%
|
125
|
%
|
|||
|
Formula:
|
|||||
|
Actual / Budget = % of Attainment
|
Example: an attainment of 103% results in a payment of 175%
|
||||
In Fiscal 2015, we achieved 100% of our worldwide revenue target and 99% of our worldwide services and cloud services revenues target. The “Worldwide Revenues and Professional Service and Cloud Services Revenues Calculations” table above illustrates under the “% Attainment” column that an achievement of 100% of target for the worldwide revenue performance criteria results in an award payment of 100% of the target award amount, and an achievement of 99% of target for the worldwide professional service and cloud services and revenues performance criteria results in an award payment of 85% of the target award amount.
|
Worldwide Adjusted Operating Income and Worldwide Professional Service and Cloud Services Margin Calculations
|
|||||
|
% Attainment
|
% Payment
|
% Attainment
|
% Payment
|
||
|
0 - 89%
|
—
|
%
|
108%
|
180
|
%
|
|
90 - 91%
|
15
|
%
|
109%
|
190
|
%
|
|
92 - 93%
|
40
|
%
|
110%
|
200
|
%
|
|
94 - 95%
|
55
|
%
|
111%
|
210
|
%
|
|
96 - 97%
|
70
|
%
|
112%
|
220
|
%
|
|
98 - 99%
|
85
|
%
|
113%
|
230
|
%
|
|
100%
|
100
|
%
|
114%
|
240
|
%
|
|
101%
|
110
|
%
|
115%
|
250
|
%
|
|
102%
|
120
|
%
|
116%
|
260
|
%
|
|
103%
|
130
|
%
|
117%
|
270
|
%
|
|
104%
|
140
|
%
|
118%
|
280
|
%
|
|
105%
|
150
|
%
|
119%
|
290
|
%
|
|
106%
|
160
|
%
|
120% and above
|
300% cap
|
|
|
107%
|
170
|
%
|
|||
|
Formula:
|
|||||
|
Actual / Budget = % of Attainment
|
Example: an attainment of 103% results in a payment of 130%
|
||||
In Fiscal 2015, we achieved 104% of our worldwide adjusted operating income target and 101% of our worldwide professional service and cloud services margin target. The “Worldwide Adjusted Operating Income and Worldwide Professional Service and Cloud Services Margin Calculations” table above illustrates under the “% Attainment” column that an achievement of 104% of target for the worldwide adjusted operating income performance criterion results in an award payment of 140% of the target award amount, and an achievement of 101% of target for the worldwide professional service and cloud services and margin performance criteria results in an award payment of 110% of the target award amount.
78
|
Worldwide License Revenues and MCV Calculations
|
||
|
% Attainment
|
% Payment
|
|
|
0 - 50.01%
|
0.035089
|
%
|
|
50.01 - 100.01%
|
0.052634
|
%
|
|
100.01 - 120.01%
|
0.076758
|
%
|
|
120.01 - 150.01%
|
0.109654
|
%
|
|
150.01 and above
|
0.153516
|
%
|
In Fiscal 2015, we achieved 92% of our worldwide license revenues target. For license revenues achieved up to, and including, the 50
th
percentile of our worldwide license revenue target (level 1), short-term incentive payments were paid at a rate of 0.035089%, resulting in a payment of $0.10 million. For license revenues achieved between the 50
th
percentile and the target amount (level 2), short-term incentives payments were paid at a rate of 0.052634%, resulting in a payment of $0.13 million. In total, for achieving 92% of our worldwide license revenues target, we made short-term incentive payments of approximately $0.23 million.
The actual short-term incentive award earned by each Named Executive Officer for Fiscal 2015 was determined in accordance with the formulas described above. We have set forth below for each Named Executive Officer the award amount actually paid for Fiscal 2015, and the percentage of target award amount represented by the actual award paid broken out by performance measure as follows:
Mark J. Barrenechea
|
Performance Measure:
|
Payable at
Target |
Payable at
Threshold |
Actual
Payable ($) |
Actual
Payable
(% of Target)
|
|||||||
|
Worldwide Revenues
|
$
|
425,250
|
|
$
|
63,788
|
|
$
|
425,250
|
|
100
|
%
|
|
Worldwide Adjusted Operating Income
|
$
|
425,250
|
|
$
|
63,788
|
|
$
|
595,350
|
|
140
|
%
|
|
Personal Objectives
|
$
|
94,500
|
|
$
|
14,175
|
|
$
|
94,500
|
|
100
|
%
|
|
Total
|
$
|
945,000
|
|
$
|
141,751
|
|
$
|
1,115,100
|
|
118
|
%
|
John M. Doolittle
|
Performance Measure:
|
Payable at
Target |
Payable at
Threshold |
Actual
Payable ($) |
Actual
Payable
(% of Target)
|
|||||||
|
Worldwide Revenues
|
$
|
129,407
|
|
$
|
19,411
|
|
$
|
129,407
|
|
100
|
%
|
|
Worldwide Adjusted Operating Income
|
$
|
129,407
|
|
$
|
19,411
|
|
$
|
181,170
|
|
140
|
%
|
|
Personal Objectives
|
$
|
28,757
|
|
$
|
4,314
|
|
$
|
28,757
|
|
100
|
%
|
|
Total
|
$
|
287,571
|
|
$
|
43,136
|
|
$
|
339,334
|
|
118
|
%
|
David Jamieson
|
Performance Measure:
|
Payable at
Target |
Payable at
Threshold |
Actual
Payable ($) |
Actual
Payable
(% of Target)
|
|||||||
|
Worldwide Revenues
|
$
|
80,232
|
|
$
|
12,035
|
|
$
|
80,232
|
|
100
|
%
|
|
Worldwide Adjusted Operating Income
|
$
|
80,232
|
|
$
|
12,035
|
|
$
|
112,325
|
|
140
|
%
|
|
Personal Objectives
|
$
|
17,829
|
|
$
|
2,674
|
|
$
|
17,829
|
|
100
|
%
|
|
Total
|
$
|
178,293
|
|
$
|
26,744
|
|
$
|
210,386
|
|
118
|
%
|
79
Gordon A. Davies
|
Performance Measure:
|
Payable at
Target |
Payable at
Threshold |
Actual
Payable ($) |
Actual
Payable
(% of Target)
|
|||||||
|
Worldwide Revenues
|
$
|
112,972
|
|
$
|
16,946
|
|
$
|
112,972
|
|
100
|
%
|
|
Worldwide Adjusted Operating Income
|
$
|
112,972
|
|
$
|
16,946
|
|
$
|
158,161
|
|
140
|
%
|
|
Personal Objectives
|
$
|
25,105
|
|
$
|
3,766
|
|
$
|
25,105
|
|
100
|
%
|
|
Total
|
$
|
251,049
|
|
$
|
37,658
|
|
$
|
296,238
|
|
118
|
%
|
Lisa Zangari
|
Performance Measure:
|
Payable at
Target |
Payable at
Threshold |
Actual
Payable ($) |
Actual
Payable
(% of Target)
|
|||||||
|
Worldwide Revenues
|
$
|
69,297
|
|
$
|
10,395
|
|
$
|
69,297
|
|
100
|
%
|
|
Worldwide Adjusted Operating Income
|
$
|
69,297
|
|
$
|
10,395
|
|
$
|
97,016
|
|
140
|
%
|
|
Personal Objectives
|
$
|
15,399
|
|
$
|
2,310
|
|
$
|
15,399
|
|
100
|
%
|
|
Total
|
$
|
153,993
|
|
$
|
23,100
|
|
$
|
181,712
|
|
118
|
%
|
Jonathan Hunter
|
Performance Measure:
|
Payable at
Target |
Payable at
Threshold |
Actual
Payable ($) |
Actual
Payable
(% of Target)
|
|||||||
|
Worldwide License Revenues and MCV
|
$
|
250,000
|
|
N/A
|
|
$
|
119,615
|
|
48
|
%
|
|
|
Worldwide Professional Service and Cloud Services Revenue
|
$
|
125,000
|
|
$
|
18,750
|
|
$
|
96,515
|
|
77
|
%
|
|
Worldwide Professional Service and Cloud Services Margin
|
$
|
125,000
|
|
$
|
18,750
|
|
$
|
119,952
|
|
96
|
%
|
|
Total
|
$
|
500,000
|
|
$
|
37,500
|
|
$
|
336,082
|
|
67
|
%
|
Mr. Hunter received four payments based on his performance measures during Fiscal 2015. Due to his more direct influence on revenue generation, Mr. Hunter had calculations performed each quarter on quarterly revenue and margin achievements (versus quarterly target). As a result, his payouts were different from the payout of the other Named Executive Officers with respect to common performance objectives and the percentages illustrated under the payout tables above. As a result of his departure from the Company on May 20, 2015, Mr. Hunter’s payout for the fourth quarter of Fiscal 2015 was calculated at 100% of his quarterly target.
Long-Term Incentives
As with many North American technology companies, we have a general practice of granting variable long-term incentives to executive officers. Our long-term incentives represent a significant proportion of our executive officers’ total compensation, and its purpose is two-fold: (i) as a component of a competitive compensation package; and (ii) to align the interests of our executive officers with the interests of our shareholders. Grants are consistent with competitive market practice, and vesting occurs over time, to ensure alignment with our performance over the longer term.
Long-Term Incentive Plans (LTIP) - General
A target value is established by the Compensation Committee for each Named Executive Officer, except for the CEO, whose target value is established by the Board, based on competitive market practice and by our Named Executive Officer’s ability to influence financial or operational performance. Grants are generally made annually and are comprised of the components outlined in the table below.
The target value of the LTIP is split into three components, with 50% represented by Performance Share Units (PSUs), 25% represented by Restricted Share Units (RSUs) and 25% represented by stock options. PSUs and RSUs are based on a rolling three-year program
,
which means that assessment of a Named Executive Officer's performance under each grant is made continuously over the period, but payments on that grant may only be made at the end of the applicable three year term in either cash or Common Shares, at the discretion of the Board. Options granted under the LTIP generally vest over four years. The LTIP payments may also be subject to certain payment limitations in the event of early termination of employment or change in control of the Company. As well, LTIP payments are subject to mandatory repayment or “clawback” in the event of fraud,
80
willful misconduct or gross negligence by any executive officer, including a Named Executive Officer, affecting the financial performance or financial statements of the Company or the price of our Common Shares. The performance targets and the weightings of performance targets under each LTIP are first recommended by the Compensation Committee and then approved by the Board. No dividends are paid or accrued on PSUs or RSUs.
|
Vehicle
|
% of Total LTIP
|
Description
|
Vesting
|
Payout
|
|
Performance Share Units (PSU)
|
50% of LTIP target award value
|
The value of each PSU is equivalent to one Common Share. The number of PSUs granted is determined by converting the dollar value of the target award to PSUs, based on an average share price determined at time of Board grant. The number of PSUs to vest will be based on the Company’s total shareholder return (TSR) at the end of a three year period as compared to the TSR of companies comprising the constituents of the S&P MidCap400 Software and Services Index.
|
Cliff vesting in the third year following the determination by the Board that the performance criteria have been met.
|
Once vested, units will be settled in either Common Shares or cash, at the discretion of the Board. We expect to settle these awards in Common Shares.
|
|
Restricted Share Units (RSU)
|
25% of LTIP target award value
|
The value of each RSU is equivalent to one Common Share. The number of RSUs granted is determined by converting the dollar value of the target award to RSUs, based on an average share price determined at time of Board grant.
|
Cliff vesting three years after grant date.
|
Once vested, units will be settled in either Common Shares or cash, at the discretion of the Board. We expect to settle these awards in Common Shares.
|
|
Stock Options
|
25% of LTIP target award value
|
The dollar value of the target award is converted to a number of options using a Black Scholes model. The exercise price is equal to the closing price of our Common Shares on the trading day preceding the date of grant.
|
Vesting is typically 25% on each of the first four anniversaries of grant date. Options expire seven years after the grant date.
|
Once vested, participants may exercise options for Common Shares.
|
Fiscal 2017 LTIP
For each Named Executive Officer, the compensation target under the Fiscal 2017 LTIP was determined based on the Named Executive Officer's overall compensation and by their ability to influence our financial or operational performance.
The target compensation set for each Named Executive Officer under the Fiscal 2017 LTIP is comprised of three elements: PSUs, RSUs and stock options and represent 50%, 25% and 25%, respectively, of the Named Executive Officer’s total target award. The table below illustrates the target value of each element under the Fiscal 2017 LTIP for each Named Executive Officer.
|
Named Executive Officer
|
Performance Share Units
|
Restricted Share Units
|
Stock Options
|
||||||
|
Mark J. Barrenechea
|
$
|
1,807,500
|
|
$
|
903,750
|
|
$
|
903,750
|
|
|
John M. Doolittle
|
$
|
409,000
|
|
$
|
204,500
|
|
$
|
204,500
|
|
|
David Jamieson
|
$
|
144,903
|
|
$
|
72,451
|
|
$
|
72,451
|
|
|
Gordon A. Davies
|
$
|
405,000
|
|
$
|
202,500
|
|
$
|
202,500
|
|
|
Lisa Zangari
|
$
|
205,669
|
|
$
|
102,834
|
|
$
|
102,834
|
|
|
Jonathan Hunter (1)
|
$
|
300,000
|
|
$
|
150,000
|
|
$
|
150,000
|
|
|
(1)
|
As a result of his departure from the Company, the grants made to Mr. Hunter under Fiscal 2017 LTIP are not eligible for vesting.
|
Awards granted in Fiscal 2015, under the Fiscal 2017 LTIP were in addition to the awards granted in Fiscal 2013 and Fiscal 2014. For details of our previous LTIPs, see Item 11 of our Annual Report on Form 10-K for the appropriate year.
81
Fiscal 2017 LTIP - PSUs
With respect to our PSUs, we use relative TSR to benchmark the Company’s performance against the performance of the corporations comprising the constituents of the S&P Mid Cap 400 Software & Services Index (the Index), which was selected by the Compensation Committee in consultation with Mercers. The Index is comprised of 400 U.S. public companies with unadjusted market capitalization of $1.2 billion to $5.1 billion and is a useful measure of the performance of mid-sized companies. Relative TSR is the sole measure for each Named Executive Officer's performance over the relevant three year period for the Fiscal 2017 LTIP with respect to PSUs. If over the three year period, the relative cumulative TSR of the Company compared to the cumulative TSR of the Index
is greater than the 66
th
percentile, the relative TSR target will be achieved in full. If it is negative over the three year period, no payout will be made. Otherwise, any target percentile achieved between 1% and 100% will be interpolated to determine a payout that can range from 1.5% to 150% of the target award based on the number of PSUs that were granted in connection with the Fiscal 2017 LTIP.
The amounts that may be realized for PSU awards under the Fiscal 2017 LTIP
are as follows, calculated based on the market price of our Common Shares on the NASDAQ as of June 30, 2015, and applied to the number of PSUs to be issued to the Named Executive Officers based on target level achievement.
|
Fiscal 2017 LTIP PSUs
|
|||||||||
|
Named Executive Officer
|
Threshold at June 30, 2017
|
100% Achievement
at June 30, 2017
|
150% Achievement
at June 30, 2017
|
||||||
|
Mark J. Barrenechea
|
$
|
22,281
|
|
$
|
1,485,425
|
|
$
|
2,228,137
|
|
|
John M. Doolittle
|
$
|
4,286
|
|
$
|
285,737
|
|
$
|
428,605
|
|
|
David Jamieson
|
$
|
1,538
|
|
$
|
102,541
|
|
$
|
153,811
|
|
|
Gordon A. Davies
|
$
|
4,991
|
|
$
|
332,751
|
|
$
|
499,127
|
|
|
Lisa Zangari
|
$
|
2,207
|
|
$
|
147,124
|
|
$
|
220,686
|
|
|
Jonathan Hunter (1)
|
N/A
|
|
N/A
|
|
N/A
|
|
|||
|
(1)
|
As a result of his departure from the Company, the grants made to Mr. Hunter under Fiscal 2017 LTIP are not eligible for vesting.
|
Fiscal 2017 LTIP - RSUs
RSUs vest over three years and do not have any specific performance-based vesting criteria. Provided the eligible employee remains employed throughout the vesting period, all RSUs granted shall become vested RSUs at the end of the Fiscal 2017 LTIP period.
The amounts that may be realized for RSU awards under the Fiscal 2017 LTIP
are as follows, calculated based on the market price of our Common Shares on the NASDAQ as of June 30, 2015, and applied to the number of equivalent RSUs to be issued to the Named Executive Officers.
|
Fiscal 2017 LTIP RSUs
|
|||
|
Named Executive Officer
|
Value at June 30, 2015
|
||
|
Mark J. Barrenechea
|
$
|
742,510
|
|
|
John M. Doolittle
|
$
|
143,071
|
|
|
David Jamieson
|
$
|
51,473
|
|
|
Gordon A. Davies
|
$
|
166,578
|
|
|
Lisa Zangari
|
$
|
73,359
|
|
|
Jonathan Hunter (1)
|
N/A
|
|
|
|
(1)
|
As a result of his departure from the Company, the grants made to Mr. Hunter under Fiscal 2017 LTIP are not eligible for vesting.
|
Fiscal 2017 LTIP - Stock Options
The stock options granted in connection with the Fiscal 2017 LTIP vest over four years, do not have any specific performance-based vesting criteria and, if not exercised, expire after seven years.
As of June 30, 2015, the market price of our Common Shares on the NASDAQ was less than the exercise value of the stock option awards under the Fiscal 2017 LTIP, thus leaving the options without value if they were to expire on June 30, 2015. The details of the option grants are contained in the table found below under “Grants of Plan Based Awards in Fiscal 2015.”
82
Other Long-Term Equity Grants
In addition to grants made in connection with the LTIP, from time to time, we may grant stock options and/or RSUs to new strategic hires and to our employees in recognition of their service, such as for promotions. In Fiscal 2015, we granted stock options to three of our Named Executive Officers, namely, Mr. Doolittle, Mr. Jamieson, and Ms. Zangari, and RSUs to two of our Named Executive Officers, namely Messrs. Doolittle and Jamieson, in connection with the commencement of his/her employment with us. Details of these grants are contained in the table below under “Grants of Plan Based Awards Fiscal 2015”. Our RSUs and stock options generally vest over three and four years, respectively, and do not have any specific performance criteria. With respect to stock option grants, the Board will determine the following, based upon the recommendation of the Compensation Committee: the executive officers entitled to participate in our stock option plan, the number of options to be granted, and any other material terms and conditions of the stock option grant.
All stock option grants, whether part of the LTIP or granted separately for new hires and promotions of existing employees, are governed by our stock option plans. In addition, grants and exercises of stock options are subject to our Insider Trading Policy. For details of our Insider Trading Policy, see “Other Information With Respect to Our Compensation Program - Insider Trading Policy” below.
For details on the determination of targeted awards and our benchmarking process, see "Compensation Objective - Competitive Compensation" above.
Long-Term Equity Grants to CEO
On January 29, 2015, Mr. Barrenechea received a grant of 30,000 RSUs. These RSUs will vest in equal amounts on each of January 29, 2016, January 29, 2017 and January 29, 2018 provided that Mr. Barrenechea remains employed throughout the applicable vesting period. The aggregate amount that may be realized for these RSU awards calculated based on the market price of our Common Shares on the NASDAQ as of June 30, 2015 and applied to the number of RSUs granted is approximately $1.2 million.
In addition, on January 29, 2015, Mr. Barrenechea received a grant of stock options under the 2004 Stock Option Plan to purchase 600,000 Common Shares at an exercise price of $54.17 expiring seven years after the date of grant, and vesting subject to certain conditions provided that Mr. Barrenechea remains an employee.
Time Vested Options
-
Of these options granted to Mr. Barrenechea, options to purchase 200,000 Common Shares vest in accordance with the following schedule:
|
Date
|
Number of Options to Vest
|
|
|
June 30, 2018
|
100,000
|
|
|
June 30, 2019
|
50,000
|
|
|
June 30, 2020
|
50,000
|
|
Performance Vested Options
-
The balance of the options granted to Mr. Barrenechea to purchase 400,000 Common Shares are performance options that vest subject to exceeding a threshold target for the trading price of the Common Shares of $81.26 and up to a target of $108.34 (representing absolute share growth between 50% and 100%) within five years commencing April 1, 2015. The targets required to be met for these performance options to vest are as follows:
50% Vesting
- Performance options to purchase 200,000 Common Shares will vest if the average closing price (ACP) of the Common Shares on NASDAQ for the trading days in any fiscal quarter commencing April 1, 2015 and ending March 31, 2020 exceeds $81.26.
50% - 100% Vesting
-
Performance options to purchase up to an additional 200,000 Common Shares will vest from time to time on a linear basis to the extent that the ACP for the trading days in any fiscal quarter commencing April 1, 2015 and ending March 31, 2020 exceeds a threshold target of $81.26 up to a maximum ACP of $108.34. The following vesting schedule illustrates the aggregate number of these additional performance options that would vest based on the ACP in the quarter:
83
|
Illustrative ACP
|
Aggregate Number of Options to Vest
|
|
|
$86.67
|
40,000
|
|
|
$92.09
|
80,000
|
|
|
$97.51
|
120,000
|
|
|
$102.92
|
160,000
|
|
|
$108.34
|
200,000
|
|
The number of Common Share subject to additional performance options to vest would be equal to 200,000 multiplied by a fraction, the numerator of which is the excess (if any) of ACP in the quarter over $81.26 and the denominator of which is the excess of $108.34 over $81.26. To the extent that the ACP increased from time to time in any subsequent quarter in the five year vesting period, additional performance options would vest in accordance with this formula using the ACP for the prior quarter in which performance options vested in the numerator rather than $81.26. The aggregate number of Common Shares subject to vested performance options is limited to 200,000. The calculation of ACP will be subject to general anti-dilution adjustments substantially similar to those provided for in the Stock Option Plan applicable to option exercise prices.
To the extent that performance options vest during the five year vesting period, they must be held by Mr. Barrenechea until the earlier of the fifth anniversary of the date of grant and the date he ceases to be an employee. Any performance options that vest may be exercised by Mr. Barrenechea during this five year period, provided that the Common Shares acquired on exercise, net of a number of Common Shares that may be sold by Mr. Barrenechea to fund the exercise price and any income taxes payable as a result of such exercise, must be held by Mr. Barrenechea for this same period. Also see “Compensation Objectives - Competitive Compensation” above.
Executive Change in Control and Severance Benefits
Our severance benefit agreements are designed to provide reasonable compensation to departing senior executive officers under certain circumstances. While we do not believe that the severance benefits would be a determinative factor in a senior executive's decision to join or remain with the Company, the absence of such benefits, we believe, would present a distinct competitive disadvantage in the market for talented executive officers. Furthermore, we believe that it is important to set forth the benefits payable in triggering circumstances in advance in an attempt to avoid future disputes or litigation.
The severance benefits we offer to our senior executive officers are competitive with similarly situated individuals and companies. Regarding change in control benefits, we have structured these benefits as a “double trigger” meaning that the benefits are only paid in the event of, first, a change in control transaction, and second, the loss of employment within one year after the transaction. These benefits attempt to provide an incentive to our senior executive officers to remain employed with the Company in the event of such a transaction.
Other Information With Respect to Our Compensation Program
Pension Plans
We do not provide pension benefits or any non-qualified deferred compensation to any of our Named Executive Officers.
Share Ownership Guidelines
We currently have equity ownership guidelines (Share Ownership Guidelines), the objective of which is to encourage our senior management, including our Named Executive Officers, and our directors to buy and hold Common Shares in the Company based upon an investment target. We believe that the Share Ownership Guidelines help align the financial interests of our senior management team and directors with the financial interests of our shareholders.
The equity ownership levels are as follows:
|
CEO/President
|
4x base salary
|
|
Other senior management
|
1x base salary
|
|
Non-management director
|
3x annual retainer
|
84
For purposes of the Share Ownership Guidelines, individuals are deemed to hold all securities over which he or she is the registered or beneficial owner thereof under the rules of Section 13(d) of the Securities Exchange Act through any contract, arrangement, understanding, relationship or otherwise in which such person has or shares:
•
voting power which includes the power to vote, or to direct the voting of, such security; and/or
•
investment power which includes the power to dispose, or to direct the disposition of, such security.
Also, Common Shares will be valued at the greater of their book value (i.e., purchase price) or the current market value. On an annual basis, the Compensation Committee reviews the recommended ownership levels under the Share Ownership Guidelines and the compliance by our executive officers and directors with the Share Ownership Guidelines.
The Board implemented the Share Ownership Guidelines in October 2009 and recommends that equity ownership levels be achieved within five years of becoming a member of the executive leadership team, including Named Executive Officers. The Board also recommends that the executive leadership team retain their ownership levels for so long as they remain members of the executive leadership team.
Named Executive Officers
Named Executive Officers may achieve these Share Ownership Guidelines through the exercise of stock option awards, purchases under the OpenText Employee Stock Purchase Plan (ESPP), through open market purchases made in compliance with applicable securities laws or through any equity plan(s) we may adopt from time to time providing for the acquisition of Common Shares. Until the Share Ownership Guidelines are met, it is recommended that a Named Executive Officer retain a portion of any stock option exercise or LTIP award in Common Shares to contribute to the achievement of the Share Ownership Guidelines. Common Shares issuable pursuant to the unexercised options shall not be counted towards meeting the equity ownership target.
As of the date of this Annual Report on Form 10-K, Mr. Davies complies with the Share Ownership Guidelines for Fiscal 2015
.
The other Named Executive Officers, each of whom has only become subject to these guidelines within the past five years, have five years from becoming subject to these guidelines to achieve the equity ownership guidelines required by his position.
Directors
With respect to non-management directors, both Common Shares and deferred stock units (DSUs) are counted towards the achievement of the Share Ownership Guidelines. Effective February 2, 2010, the Board adopted the Directors’ Deferred Share Unit Plan (DSU Plan), whereby any non-management director of the Company may elect to defer all or part of his or her retainer and/or fees in the form of common stock equivalents. As of the date of this Annual Report on Form 10-K, all non-management directors have exceeded the Share Ownership Guidelines applicable to them, which is three times their annual retainer. For further details, see the table below titled “Director Compensation for Fiscal 2015”.
Insider Trading Policy
All of our employees, officers and directors, including our Named Executive Officers, are required to comply with our Insider Trading Policy. Our Insider Trading Policy prohibits the purchase, sale or trade of our securities with the knowledge of material inside information. In addition, our Insider Trading Policy prohibits our employees, officers and directors, including our Named Executive Officers, from, directly or indirectly, short selling any security of the Company or entering into any other arrangement that results in a gain only if the value of the Company's securities decline in the future, selling a “call option” giving the holder an option to purchase securities of the Company, or buying a “put option” giving the holder an option to sell securities of the Company. The definition of “trading in securities” includes any derivatives-based, monetization, non-recourse loan or similar arrangement that changes the insider’s economic exposure to or interest in securities of the Company and which may not necessarily involve a sale.
All grants of stock options are subject to our Insider Trading Policy and as a result, stock options may not be granted during the “blackout” period beginning on the fifteenth day of the last month of each quarter and ending at the beginning of the second trading day following the date on which the Company’s quarterly or annual financial results, as applicable, have been publicly released. If the Board approves the issuance of stock options during the blackout period, these stock options are not granted until the blackout period is over. The price at which stock options are granted is not less than the closing price of the Company’s Common Shares on the trading day for the NASDAQ market immediately preceding the applicable grant date.
Tax Deductibility of Compensation
Under Section 162(m) of the United States Internal Revenue Code (or Section 162(m)) publicly-held corporations cannot deduct compensation paid in excess of $1,000,000 to certain executive officers in any taxable year. Certain compensation paid
85
under plans that are “performance-based” (which means compensation paid only if the individual's performance meets pre-established objective goals based upon performance criteria approved by shareowners) are not subject to the $1,000,000 annual limit. Although our compensation policy is designed to link compensation to performance, payments in excess of $1,000,000 made pursuant to any of our compensation plans to United States-based executives may not be deductible under Section 162(m).
86
Summary Compensation Table
The following table sets forth summary information concerning the annual compensation of our Named Executive Officers. All numbers are rounded to the nearest dollar or whole share. Changes in exchange rates will impact payments illustrated below that are made in currencies other than the U.S. dollar. Any Canadian dollar payments included herein have been converted to U.S. dollars at an annual average rate of 0.862713
,
0.934857, and 0.992560, for Fiscal 2015, Fiscal 2014, and Fiscal 2013, respectively.
|
|
Fiscal
Year
|
Salary
($) |
Bonus
($)
|
Stock
Awards ($) (1) |
Option
Awards ($) (2) |
Non-Equity
Incentive Plan Compensation ($) (3) |
Change in
Pension Value
and
Non-qualified
Deferred
Compensation
Earnings ($)
|
All Other
Compensation ($) (4) |
Total ($)
|
||||||||||||||
|
Mark J. Barrenechea (5)
|
2015
|
$
|
847,000
|
|
—
|
|
$
|
4,578,866
|
|
$
|
8,923,671
|
|
$
|
1,115,100
|
|
N/A
|
$
|
38,352
|
|
(6)
|
$
|
15,502,989
|
|
|
President and Chief Executive Officer
|
2014
|
$
|
690,247
|
|
—
|
|
$
|
1,262,914
|
|
$
|
524,181
|
|
$
|
869,090
|
|
N/A
|
$
|
19,168
|
|
(7)
|
$
|
3,365,600
|
|
|
2013
|
$
|
620,000
|
|
—
|
|
$
|
1,404,035
|
|
$
|
492,317
|
|
$
|
687,813
|
|
N/A
|
$
|
24,536
|
|
(7)
|
$
|
3,228,701
|
|
|
|
John M. Doolittle (11)
|
2015
|
$
|
351,294
|
|
—
|
|
$
|
1,233,432
|
|
$
|
2,379,500
|
|
$
|
339,334
|
|
N/A
|
$
|
—
|
|
(8)
|
$
|
4,303,560
|
|
|
Chief Financial Officer
|
2014
|
N/A
|
|
N/A
|
|
N/A
|
|
N/A
|
|
N/A
|
|
N/A
|
N/A
|
|
(9)
|
N/A
|
|
||||||
|
2013
|
N/A
|
|
N/A
|
|
N/A
|
|
N/A
|
|
N/A
|
|
N/A
|
N/A
|
|
(9)
|
N/A
|
|
|||||||
|
Paul McFeeters (12)
|
2015
|
$
|
104,173
|
|
—
|
|
$
|
—
|
|
—
|
|
$
|
—
|
|
N/A
|
$
|
—
|
|
(8)
|
$
|
104,173
|
|
|
|
Former Chief Financial Officer and Chief Administrative Officer
|
2014
|
$
|
421,413
|
|
—
|
|
$
|
744,264
|
|
$
|
181,576
|
|
$
|
336,497
|
|
N/A
|
$
|
—
|
|
(8)
|
$
|
1,683,750
|
|
|
2013
|
$
|
421,838
|
|
—
|
|
$
|
486,329
|
|
$
|
170,535
|
|
$
|
308,315
|
|
N/A
|
$
|
—
|
|
(8)
|
$
|
1,387,017
|
|
|
|
David Jamieson (13)
|
2015
|
$
|
178,294
|
|
—
|
|
$
|
339,849
|
|
$
|
887,198
|
|
$
|
210,386
|
|
N/A
|
$
|
—
|
|
(8)
|
$
|
1,615,727
|
|
|
Chief Information Officer
|
2014
|
N/A
|
|
N/A
|
|
N/A
|
|
N/A
|
|
N/A
|
|
N/A
|
N/A
|
|
(9)
|
N/A
|
|
||||||
|
2013
|
N/A
|
|
N/A
|
|
N/A
|
|
N/A
|
|
N/A
|
|
N/A
|
N/A
|
|
(9)
|
N/A
|
|
|||||||
|
Gordon A. Davies
|
2015
|
$
|
358,889
|
|
—
|
|
$
|
636,878
|
|
$
|
202,466
|
|
$
|
296,238
|
|
N/A
|
$
|
17,774
|
|
(10)
|
$
|
1,512,245
|
|
|
Chief Legal Officer and Corporate Secretary
|
2014
|
$
|
380,591
|
|
—
|
|
$
|
506,247
|
|
$
|
125,222
|
|
$
|
253,681
|
|
N/A
|
$
|
—
|
|
(8)
|
$
|
1,265,741
|
|
|
2013
|
$
|
397,024
|
|
—
|
|
$
|
335,427
|
|
$
|
117,602
|
|
$
|
132,134
|
|
N/A
|
$
|
—
|
|
(8)
|
$
|
982,187
|
|
|
|
Lisa Zangari (14)
|
2015
|
$
|
222,214
|
|
—
|
|
$
|
286,491
|
|
$
|
791,316
|
|
$
|
181,712
|
|
N/A
|
$
|
—
|
|
(8)
|
$
|
1,481,733
|
|
|
Chief Human Resources Officer
|
2014
|
N/A
|
|
N/A
|
|
N/A
|
|
N/A
|
|
N/A
|
|
N/A
|
N/A
|
|
(9)
|
N/A
|
|
||||||
|
2013
|
N/A
|
|
N/A
|
|
N/A
|
|
N/A
|
|
N/A
|
|
N/A
|
N/A
|
|
(9)
|
N/A
|
|
|||||||
|
Jonathan Hunter (15)
|
2015
|
$
|
443,750
|
|
—
|
|
$
|
471,443
|
|
$
|
149,975
|
|
$
|
336,082
|
|
N/A
|
$
|
161,017
|
|
(16)
|
$
|
1,562,267
|
|
|
Former SVP, Worldwide Field Operations
|
2014
|
$
|
439,423
|
|
—
|
|
$
|
702,444
|
|
$
|
2,247,940
|
|
$
|
394,515
|
|
N/A
|
$
|
—
|
|
(8)
|
$
|
3,784,322
|
|
|
2013
|
N/A
|
|
N/A
|
|
N/A
|
|
N/A
|
|
N/A
|
|
N/A
|
N/A
|
|
(9)
|
N/A
|
|
|||||||
|
(1)
|
Performance Share Units (PSUs) and Restricted Share Units (RSUs) were granted pursuant to the Fiscal 2017 LTIP and other non- LTIP related grants. The amounts set forth in this column represent the aggregate grant date fair value, as computed in accordance with ASC Topic 718 “Compensation-Stock Compensation” (Topic 718). Grant date fair value may vary from the target value indicated in the table set forth above in the section “Fiscal 2017 LTIP”. For a discussion of the assumptions used in these valuations, see note 12 “Share Capital, Option Plans and Share-based Payments” to our Notes to Consolidated Financial Statements under Item 8 of this Annual Report on Form 10-K. For the maximum value that may be received under the PSU awards, see the “Maximum” column under “Estimated Future Payouts under Equity Incentive Plan Awards” under the “Grants of Plan-Based Awards in Fiscal 2015” table below.
|
87
|
(2)
|
Amounts set forth in this column represent the amount recognized as the aggregate grant date fair value of stock option awards, as calculated in accordance with Topic 718 for the fiscal year in which the awards were granted. In all cases, these amounts do not reflect whether the recipient has actually realized a financial benefit from the exercise of the awards. For a discussion of the assumptions used in this valuation, see note 12 “Share Capital, Option Plans and Share-based Payments” to our Notes to Consolidated Financial Statements under Item 8 of this Annual Report on Form 10-K.
|
|
(3)
|
The amounts set forth in this column for Fiscal 2015 represent payments under the short-term incentive plan.
|
|
(4)
|
Except as otherwise indicated the amounts in “All Other Compensation” primarily include (i) medical examinations; (ii) car allowances, (iii) club memberships reimbursed, and (iv) tax preparation and financial advisory fees paid. “All Other Compensation” does not include benefits received by the Named Executive Officers which are generally available to all our salaried employees.
|
|
(5)
|
On January 29, 2015, Mr. Barrenechea was granted 30,000 RSUs and 600,000 stock options. For further information, see “Compensation Discussion and Analysis - Compensation Objectives - Competitive Compensation” and “Compensation Discussion and Analysis - Aligning Officers' Interests with Shareholders' Interests - Long-Term Incentives - Long-Term Equity Grants to CEO” above.
|
|
(6)
|
Represents amounts we paid or reimbursed for:
|
a.
Tax, Financial, and Estate Planning ($26,952);
b.
Car Allowances ($11,400); and
c.
Other miscellaneous expenses or benefits that are less than 10% of the total amount of perquisites and personal benefits related to Mr. Barrenechea.
|
(7)
|
For details of the amounts of fees or expenses we paid or reimbursed please refer to Summary Compensation Table in Item 11 of our Annual Report on Form 10-K for the corresponding fiscal years ended June 30, 2014 and June 30, 2013.
|
|
(8)
|
The total value of all perquisites and personal benefits for this Named Executive Officer was less than $10,000, and, therefore, excluded.
|
|
(9)
|
The executive officer was not a Named Executive Officer during the fiscal year, and, therefore compensation details have been excluded.
|
|
(10)
|
Represents amounts we paid or reimbursed for:
|
a.
Taxable benefit on annual sales event ($7,925);
b.
Tax, Financial, and Estate Planning ($3,412);
c.
Medical Examination ($2,152); and
d.
Other miscellaneous expenses or benefits that are less than 10% of the total amount of perquisites and personal benefits related to Mr. Davies.
|
(11)
|
The amounts set forth for Mr. Doolittle’s salary and non-equity incentive awards represent a prorated amount based on Mr. Doolittle’s date of hire in September 2014 with the Company.
|
|
(12)
|
The amount set forth for Mr. McFeeters’ salary represents a prorated amount based on Mr. McFeeters’ employment with the Company until his retirement in September 2014.
|
|
(13)
|
The amounts set forth for Mr. Jamieson’s salary and non-equity incentive awards represent a prorated amount based on Mr. Jamieson’s date of hire in October 2014 with the Company.
|
|
(14)
|
The amounts set forth for Ms. Zangari’s salary and non-equity incentive awards represent a prorated amount based on Ms. Zangari’s date of hire in September 2014 with the Company.
|
|
(15)
|
The amounts set forth for Mr. Hunter represent a prorated amount based on Mr. Hunter’s employment with the Company until his departure in May 2015.
|
|
(16)
|
Represents amounts we paid or reimbursed for:
|
a.
Vacation and severance payable as a result of Mr. Hunter's departure from the Company in May 2015 ($152,083); and
b.
Other miscellaneous expenses or benefits that are less than 10% of the total amount of perquisites and personal benefits related to Mr. Hunter.
88
Grants of Plan-Based Awards in Fiscal 2015
The following table sets forth certain information concerning grants of awards made to each Named Executive Officer during Fiscal 2015.
|
|
Estimated Future Payouts
Under Non-Equity Incentive Plan Awards (1) |
All Other Option
Awards: Number
of Securities
Underlying (2)
|
Exercise or
Base Price of Option Awards |
Grant
Date Fair Value of Options (3) |
|||||||||||||||
|
Name
|
Grant Date
|
Threshold
($)
|
Target
($)
|
Maximum
($)
|
Options
(#)
|
($/share)
|
Awards ($)
|
||||||||||||
|
Mark J. Barrenechea
|
August 1, 2014
|
$
|
141,751
|
|
$
|
945,000
|
|
$
|
2,646,000
|
|
63,870
|
|
$
|
55.65
|
|
$
|
903,671
|
|
|
|
January 29, 2015
|
400,000
|
|
$
|
54.17
|
|
$
|
5,392,000
|
|
|||||||||||
|
January 29, 2015
|
200,000
|
|
$
|
54.17
|
|
$
|
2,628,000
|
|
|||||||||||
|
John M. Doolittle
|
September 8, 2014
|
$
|
43,136
|
|
$
|
287,571
|
|
$
|
805,199
|
|
150,000
|
|
$
|
57.29
|
|
$
|
2,178,630
|
|
|
|
September 8, 2014
|
13,830
|
|
$
|
57.29
|
|
$
|
200,870
|
|
|||||||||||
|
Paul McFeeters
|
N/A
|
|
N/A
|
|
N/A
|
|
N/A
|
|
N/A
|
|
N/A
|
|
|||||||
|
David Jamieson
|
November 3, 2014
|
$
|
26,744
|
|
$
|
178,293
|
|
$
|
499,221
|
|
60,000
|
|
$
|
55.12
|
|
$
|
818,448
|
|
|
|
November 3, 2014
|
5,040
|
|
$
|
55.12
|
|
$
|
68,750
|
|
|||||||||||
|
Gordon A. Davies
|
August 1, 2014
|
$
|
37,658
|
|
$
|
251,049
|
|
$
|
702,937
|
|
14,310
|
|
$
|
55.65
|
|
$
|
202,466
|
|
|
|
Lisa Zangari
|
October 24, 2014
|
$
|
23,100
|
|
$
|
153,993
|
|
$
|
431,181
|
|
55,000
|
|
$
|
51.16
|
|
$
|
693,363
|
|
|
|
October 24, 2014
|
$
|
7,770
|
|
$
|
51.16
|
|
$
|
97,953
|
|
||||||||||
|
Jonathan Hunter (7)
|
August 1, 2014
|
$
|
37,500
|
|
$
|
500,000
|
|
N/A
|
|
$
|
10,600
|
|
$
|
55.65
|
|
$
|
149,975
|
|
|
|
|
Estimated Future Payouts
Under Equity
Incentive Plan Awards (4)
|
All Other Stock
Awards: Number
of Securities
Underlying (5)
|
Grant
Date Fair Value of Stock |
||||||||||
|
Name
|
Grant Date
|
Threshold
(#)
|
Target
(#)
|
Maximum
(#)
|
Stock
(#)
|
Awards ($)
|
|||||||
|
Mark J. Barrenechea
|
September 4, 2014
|
550
|
|
36,650
|
|
54,975
|
|
18,320
|
|
$
|
2,841,566
|
|
|
|
January 29, 2015
|
30,000
|
|
(6)
|
$
|
1,737,300
|
|
|||||||
|
John M. Doolittle
|
September 4, 2014
|
106
|
|
7,050
|
|
10,575
|
|
3,530
|
|
$
|
546,932
|
|
|
|
September 8, 2014
|
12,500
|
|
(8)
|
$
|
686,500
|
|
|||||||
|
Paul McFeeters
|
N/A
|
N/A
|
|
N/A
|
|
N/A
|
|
N/A
|
|
N/A
|
|
||
|
David Jamieson
|
November 7, 2014
|
38
|
|
2,530
|
|
3,795
|
|
1,270
|
|
$
|
200,149
|
|
|
|
November 7, 2014
|
2,500
|
|
(9)
|
$
|
139,700
|
|
|||||||
|
Gordon A. Davies
|
September 4, 2014
|
123
|
|
8,210
|
|
12,315
|
|
4,110
|
|
$
|
636,878
|
|
|
|
Lisa Zangari
|
November 7, 2014
|
54
|
|
3,630
|
|
5,445
|
|
1,810
|
|
$
|
286,491
|
|
|
|
Jonathan Hunter (7)
|
September 4, 2014
|
N/A
|
|
N/A
|
|
N/A
|
|
N/A
|
|
N/A
|
|
||
|
(1)
|
Represents the threshold, target and maximum estimated payouts under our short-term incentive plan for Fiscal 2015. For further information, see “Compensation Discussion and Analysis - Aligning Officers' Interests with Shareholders' Interests - Short-Term Incentives” above.
|
|
(2)
|
For further information regarding our options granting procedures, see “Compensation Discussion and Analysis - Aligning Officers' Interests with Shareholders' Interests - Long-Term Incentives” above.
|
|
(3)
|
Amounts set forth in this column represent the amount recognized as the aggregate grant date fair value of equity-based compensation awards, as calculated in accordance with ASC Topic 718 for the fiscal year in which the awards were granted. In all cases, these amounts do not reflect whether the recipient has actually realized a financial benefit from the exercise of the awards. For a discussion of the assumptions used in this valuation, see note 12 “Share Capital, Option Plan and Share-based Payments” to our Notes to Consolidated Financial Statements under Item 8 of this Annual Report on Form 10-K.
|
|
(4)
|
Represents the threshold, target and maximum estimated payouts under our Fiscal 2017 LTIP PSUs. For further information, see “Compensation Discussion and Analysis - Aligning Officers' Interests with Shareholders' Interests - Long-Term Incentives - Fiscal 2017 LTIP” above.
|
|
(5)
|
Represents the estimated payouts under our Fiscal 2017 LTIP RSUs. For further information, see “Compensation Discussion and Analysis - Aligning Officers' Interests with Shareholders' Interests - Long-Term Incentives - Fiscal 2017 LTIP” above.
|
89
|
(6)
|
On January 29, 2015, Mr. Barrenechea was granted 30,000 RSUs and 600,000 stock options. For further information, see “Compensation Discussion and Analysis - Compensation Objectives - Competitive Compensation” and “- Aligning Officers' Interests with Shareholders' Interests - Long-Term Incentives - Long-Term Equity Grants to CEO” above.
|
|
(7)
|
Mr. Hunter is evaluated on (i) worldwide license revenues and MCV, (ii) worldwide professional service and cloud services revenues, and (iii) worldwide professional service and cloud services margin. With respect to worldwide license revenues and MCV, there is no threshold or maximum level of payment related to this performance measure. As a result of his departure from the Company in May 2015, the grants made to Mr. Hunter under Fiscal 2017 LTIP are not eligible for vesting.
|
|
(8)
|
On September 8, 2014 Mr. Doolittle was granted 12,500 RSUs pursuant to his employment agreement. The RSUs vest over three years.
|
|
(9)
|
On November 7, 2014 Mr. Jamieson was granted 2,500 RSUs pursuant to his employment agreement. The RSUs vest over three years.
|
Outstanding Equity Awards at End of Fiscal 2015
The following table sets forth certain information regarding outstanding equity awards held by each Named Executive Officer as of June 30, 2015.
|
|
|
Option Awards
(1)
|
Stock Awards
|
||||||||||||||||
|
Name
|
Grant Date
|
Number of
Securities
Underlying
Unexercised
Options (#)
Exercisable
|
Number of
Securities
Underlying
Unexercised
Options (#)
Non-
exercisable
|
Option
Exercise
Price ($)
|
Option Expiration
Date
|
Number of Shares or Units of Stock That Have Not Vested (#)
(2)
|
Market Value of Shares or Units of Stock That Have Not Vested ($)
(2) |
Equity Incentive
Plan Awards:
Number of
unearned
shares,
units or other
rights that have
not vested
(#) (3)
|
Equity Incentive
Plan Awards:
Market or
payout value of unearned
shares,
units or other
rights that have not vested ($) (3)
|
||||||||||
|
Mark J. Barrenechea (4)
|
February 3, 2012
|
345,123
|
|
320,000
|
|
$
|
30.18
|
|
February 3, 2019
|
||||||||||
|
May 3, 2012
|
50,000
|
|
50,000
|
|
$
|
26.22
|
|
May 3, 2019
|
|||||||||||
|
November 2, 2012
|
15,123
|
|
30,246
|
|
$
|
26.37
|
|
November 2, 2019
|
|||||||||||
|
August 2, 2013
|
16,901
|
|
50,703
|
|
$
|
33.17
|
|
August 2, 2020
|
|||||||||||
|
August 1, 2014
|
63,870
|
|
$
|
55.65
|
|
August 1, 2021
|
|||||||||||||
|
January 29, 2015
|
200,000
|
|
$
|
54.17
|
|
January 29, 2022
|
|||||||||||||
|
January 29, 2015
|
400,000
|
|
$
|
54.17
|
|
January 29, 2022
|
|||||||||||||
|
November 2, 2012
|
19,824
|
|
$
|
803,467
|
|
||||||||||||||
|
December 3, 2012
|
39,648
|
|
$
|
1,606,933
|
|
||||||||||||||
|
November 1, 2013
|
15,058
|
|
$
|
610,301
|
|
||||||||||||||
|
November 1, 2013
|
30,116
|
|
$
|
1,220,601
|
|
||||||||||||||
|
September 4, 2014
|
18,320
|
|
$
|
742,510
|
|
||||||||||||||
|
September 4, 2014
|
36,650
|
|
$
|
1,485,425
|
|
||||||||||||||
|
January 29, 2015
|
30,000
|
|
$
|
1,215,900
|
|
||||||||||||||
|
John M. Doolittle
|
September 8, 2014
|
150,000
|
|
$
|
57.29
|
|
September 8, 2021
|
||||||||||||
|
September 8, 2014
|
13,830
|
|
$
|
57.29
|
|
September 8, 2021
|
|||||||||||||
|
September 8, 2014
|
12,500
|
|
$
|
506,625
|
|
||||||||||||||
|
September 8, 2014
|
3,530
|
|
$
|
143,071
|
|
||||||||||||||
|
September 8, 2014
|
7,050
|
|
$
|
285,737
|
|
||||||||||||||
|
Paul McFeeters
|
N/A
|
||||||||||||||||||
|
David Jamieson
|
November 3, 2014
|
60,000
|
|
$
|
55.12
|
|
November 3, 2021
|
||||||||||||
|
November 3, 2014
|
5,040
|
|
$
|
55.12
|
|
November 3, 2021
|
|||||||||||||
|
November 7, 2014
|
2,500
|
|
$
|
101,325
|
|
||||||||||||||
|
November 7, 2014
|
1,270
|
|
$
|
51,473
|
|
||||||||||||||
|
November 7, 2014
|
2,530
|
|
$
|
102,541
|
|
||||||||||||||
|
Gordon A. Davies
|
November 2, 2012
|
3,614
|
|
7,224
|
|
$
|
26.37
|
|
November 2, 2019
|
||||||||||
|
August 2, 2013
|
12,112
|
|
$
|
33.17
|
|
August 2, 2020
|
|||||||||||||
90
|
August 1, 2014
|
14,310
|
|
$
|
55.65
|
|
August 1, 2021
|
|||||||||||||
|
November 2, 2012
|
4,736
|
|
$
|
191,950
|
|
||||||||||||||
|
December 3, 2012
|
9,472
|
|
$
|
383,900
|
|
||||||||||||||
|
November 1, 2013
|
3,598
|
|
$
|
145,827
|
|
||||||||||||||
|
November 1, 2013
|
7,194
|
|
$
|
291,573
|
|
||||||||||||||
|
September 4, 2014
|
4,110
|
|
$
|
166,578
|
|
||||||||||||||
|
September 4, 2014
|
8,210
|
|
$
|
332,751
|
|
||||||||||||||
|
Lisa Zangari
|
October 24, 2014
|
55,000
|
|
$
|
51.16
|
|
October 24, 2021
|
||||||||||||
|
October 24, 2014
|
7,770
|
|
$
|
51.16
|
|
October 24, 2021
|
|||||||||||||
|
November 7, 2014
|
1,810
|
|
$
|
73,359
|
|
||||||||||||||
|
November 7, 2014
|
3,630
|
|
$
|
147,124
|
|
||||||||||||||
|
Jonathan Hunter
|
November 7, 2013
|
50,000
|
|
$
|
41.61
|
|
August 18, 2015
|
||||||||||||
|
November 7, 2013
|
2,416
|
|
$
|
41.61
|
|
August 18, 2015
|
|||||||||||||
|
November 7, 2013
|
3,623
|
|
$
|
41.61
|
|
August 18, 2015
|
|||||||||||||
|
November 22, 2013
|
2,228
|
|
$
|
90,301
|
|
||||||||||||||
|
November 22, 2013
|
4,458
|
|
$
|
180,683
|
|
||||||||||||||
|
November 22, 2013
|
2,218
|
|
$
|
89,896
|
|
||||||||||||||
|
November 22, 2013
|
4,440
|
|
$
|
179,953
|
|
||||||||||||||
|
(1)
|
Options in the table above vest annually over a period of 4 years starting from the date of grant, with the exception of 600,000 options granted to the CEO. For additional detail, see “Compensation Discussion and Analysis - Aligning Officers' Interests with Shareholders' Interests - Long-Term Incentives - Long-Term Equity Grants to CEO” above.
|
|
(2)
|
Represents each Named Executive Officer's target number of RSUs granted pursuant to the Fiscal 2015, Fiscal 2016, and Fiscal 2017 LTIPs and other RSU grants. These amounts illustrate the market value as of June 30, 2015 based upon the closing price for the Company's Common Shares as traded on the NASDAQ on such date of $40.53.
|
|
(3)
|
Represents each Named Executive Officer's target number of PSUs granted pursuant to the Fiscal 2015, Fiscal 2016, and Fiscal 2017 LTIPs and the market value as of June 30, 2015 based upon the closing price for the Company's Common Shares as traded on the NASDAQ on such date of $40.53.
|
|
(4)
|
On January 29, 2015, Mr. Barrenechea was granted 30,000 RSUs and 600,000 stock options. For further information, see “Compensation Discussion and Analysis - Compensation Objectives - Competitive Compensation” and “Compensation Discussion and Analysis - Aligning Officers' Interests with Shareholders' Interests - Long-Term Incentives - Long-Term Equity Grants to CEO” above.
|
As of June 30, 2015, options to purchase an aggregate of 4,375,365 Common Shares had been previously granted and are outstanding under our stock option plans, of which 1,309,484 Common Shares were vested. Options to purchase an additional 3,020,168 Common Shares remain available for issuance pursuant to our 2004 Stock Option Plan and our 1998 Stock Option Plan. Our option pool represents 3.6% of the Common Shares issued and outstanding as of June 30, 2015 on a fully diluted basis.
During Fiscal 2015, the Company granted options to purchase 1,368,410 Common Shares or 1.1% of the Common Shares issued and outstanding as of June 30, 2015.
Option Exercises and Stock Vested in Fiscal 2015
The following table sets forth certain details with respect to each of the Named Executive Officers concerning the exercise of stock options and vesting of stock in Fiscal 2015:
|
|
Option Awards
|
Stock Awards (3)
|
||||||||
|
Name
|
Number of Shares
Acquired on Exercise
(#)
|
Value Realized on
Exercise
(1) ($)
|
Number of Shares
Acquired on Vesting
(#)
|
Value Realized on Vesting
(2) ($) |
||||||
|
Mark J. Barrenechea
|
100,000
|
|
$
|
2,760,293
|
|
109,792
|
|
$
|
6,308,464
|
|
|
John M. Doolittle
|
—
|
|
$
|
—
|
|
—
|
|
$
|
—
|
|
|
Paul McFeeters
|
11,094
|
|
$
|
291,661
|
|
33,802
|
|
$
|
1,946,995
|
|
|
David Jamieson
|
—
|
|
$
|
—
|
|
—
|
|
$
|
—
|
|
|
Gordon A. Davies
|
7,650
|
|
$
|
191,422
|
|
26,001
|
|
$
|
1,497,658
|
|
|
Lisa Zangari
|
—
|
|
$
|
—
|
|
—
|
|
$
|
—
|
|
|
Jonathan Hunter
|
—
|
|
$
|
—
|
|
—
|
|
$
|
—
|
|
|
(1)
|
“Value realized on exercise” is the excess of the market price, at date of exercise, of the shares underlying the options over the exercise price of the options.
|
91
|
(2)
|
“Value realized on vesting” is the market price of the underlying Common Shares on the vesting date.
|
|
(3)
|
Relates to (i) the vesting of PSUs and RSUs under our Fiscal 2014 LTIP, and (ii) the vesting of RSUs for Mr. Barrenechea in accordance with his Amending Agreement to the Restricted Share Unit Grant Agreement between Mr. Barrenechea and the Company, filed as Exhibit 10.3 to the Company’s Quarterly Report on Form 10-Q filed on November 1, 2012.
|
POTENTIAL PAYMENTS UPON TERMINATION OR CHANGE IN CONTROL
We have entered into employment contracts with each of our Named Executive Officers. These contracts may require us to make certain types of payments and provide certain types of benefits to the Named Executive Officers upon the occurrence of any of these events:
|
•
|
If the Named Executive Officer is terminated without cause; and
|
|
•
|
If there is a change in control in the ownership of the Company and subsequent to the change in control, there is a change in the relationship between the Company and the Named Executive Officer.
|
When determining the amounts and the type of compensation and benefits to provide in the event of a termination or change in control described above, we considered available information with respect to amounts payable to similarly situated officers of our peer groups and the position held by the Named Executive Officer within the Company. The amounts payable upon termination or change in control represent the amounts determined by the Company and are not the result of any individual negotiations between us and any of our Named Executive Officers.
Our employment agreements with our Named Executive Officers are similar in structure, terms and conditions, with the key exception of the amount of severance payments, which is determined by the position held by the Named Executive Officer. Details are set out below of each of their potential payments upon a termination by the Company without cause and upon a change in control event where there is a subsequent change in the relationship between the Company and the Named Executive Officer.
Termination Without Cause
If the Named Executive Officer is terminated without cause, we may be obligated to make payments or provide benefits to the Named Executive Officer. A termination without cause means a termination of a Named Executive Officer for any reason other than the following, each of which provides “cause” for termination:
|
•
|
The failure by the Named Executive Officer to attempt in good faith to perform his duties, other than as a result of a physical or mental illness or injury;
|
|
•
|
The Named Executive Officer's willful misconduct or gross negligence of a material nature in connection with the performance of his duties which is or could reasonably be expected to be injurious to the Company;
|
|
•
|
The breach by the Named Executive Officer of his fiduciary duty or duty of loyalty to the Company;
|
|
•
|
The Named Executive Officer's intentional and unauthorized removal, use or disclosure of information relating to the Company, including customer information, which is injurious to the Company or its customers;
|
|
•
|
The willful performance by the Named Executive Officer of any act of dishonesty or willful misappropriation of funds or property of the Company or its affiliates;
|
|
•
|
The indictment of the Named Executive Officer or a plea of guilty or nolo contender to a felony or other serious crime involving moral turpitude;
|
|
•
|
The material breach by the Named Executive Officer of any obligation material to his employment relationship with the Company; or
|
|
•
|
The material breach by the Named Executive Officer of the Company's policies and procedures which breach causes or could reasonably be expected to cause harm to the Company;
|
provided that in certain of the circumstances listed above, OpenText has given the Named Executive Officer reasonable notice of the reason for termination as well as a reasonable opportunity to correct the circumstances giving rise to the termination.
Change in Control
If there is a change in control of the Company and within one year of such change in control event, there is a change in the relationship between the Company and the Named Executive Officer without the Named Executive Officer's written consent, we may be obligated to provide payments or benefits to the Named Executive Officer, unless such a change is in connection with the termination of the Named Executive Officer either for cause or due to the death or disability of the Named Executive Officer.
A change in control includes the following events:
|
•
|
The sale, lease, exchange or other transfer, in one transaction or a series of related transactions, of all or substantially all of the Company’s assets;
|
92
|
•
|
The approval by the holders of Common Shares of any plan or proposal for the liquidation or dissolution of the Company;
|
|
•
|
Any transaction in which any person or group acquires ownership of more than 50% of outstanding Common Shares; or
|
|
•
|
Any transaction in which a majority of the Board is replaced over a twelve-month period and such replacement of the Board was not approved by a majority of the Board still in office at the beginning of such period.
|
Examples of a change in the relationship between the Named Executive Officer and the Company where payments or benefits may be triggered following a change in control event include:
|
•
|
A material diminution in the duties and responsibilities of the Named Executive Officer, other than (a) a change arising solely out of the Company becoming part of a larger organization following the change in control event or any related change in the reporting hierarchy or (b) a reorganization of the Company resulting in similar changes to the duties and responsibilities of similarly situated executive officers;
|
|
•
|
A material reduction to the Named Executive Officer's compensation, other than a similar reduction to the compensation of similarly situated executive officers;
|
|
•
|
A relocation of the Named Executive Officer's primary work location by more than fifty miles;
|
|
•
|
A reduction in the title or position of the Named Executive Officer, other than (a) a change arising solely out of the Company becoming part of a larger organization following the change in control event or any related change in the reporting hierarchy or (b) a reorganization of the Company resulting in similar changes to the titles or positions of similarly situated executive officers;
|
None of our Named Executive Officers are entitled to the payments or benefits described below, or any other payments or benefits, solely upon a change in control where there is no change to the Named Executive Officer's relationship with the Company.
Amounts Payable Upon Termination or Change in Control
Generally, upon termination of employment without cause or following a change in the Named Executive Officer's relationship with the Company, in each case, either within twelve months of a change in control event or absent a change in control event, the Named Executive Officer is entitled to either twelve or twenty-four months of compensation, depending upon the Named Executive Officer's position, including short term incentives equal to 100% of the current year's target bonus, 100% of other long-term equity RSU grants, and a pro-rated portion of the LTIP.
With respect to the LTIP, if the termination of employment occurs either without cause or due to a change in the nature of the relationship between the Named Executive Officer and the Company, in each case, within twelve months of a change in control event, the Named Executive Officer is entitled to 100% of his LTIP.
With respect to options, (a) upon termination of employment without cause or following a change in the Named Executive Officer's relationship with the Company, in each case, absent a change in control event, the Named Executive Officer is entitled to exercise those stock options which have vested as of the date of termination; and (b) upon termination of employment without cause or upon a change in the relationship between the Named Executive Officer and the Company, in each case, within twelve months of a change in control event, the Named Executive Officer is entitled to exercise 100% of all outstanding options, which are all deemed immediately vested. The Named Executive Officer shall have 90 days from the termination date to exercise vested options. In addition, in the case of Mr. Barrenechea, certain of the options granted to him in Fiscal 2012 (2012 Equity Awards) shall continue to vest for a 27 month period and Mr. Barrenechea shall have 90 days from such 27 month period to exercise the vested awards.
Further details of each Named Executive Officer’s entitlement upon termination of employment without cause or following a change in the Named Executive Officer’s relationship with the Company, both absent a change in control event and within twelve months of a change in control event, are set forth below.
93
No Change in Control
|
No change in control
|
||||||||
|
Base
|
Short term incentives
(1)
|
LTIP
(2)
|
Non-LTIP RSUs
|
Options
(3)
|
Employee and Medical Benefits (4)
|
|||
|
Mark J. Barrenechea
|
Termination without cause or Change in relationship
|
24 months
|
24 months
|
Prorated
|
100% Vested
|
Vested
|
(5)
|
24 months
|
|
John M. Doolittle
|
Termination without cause or Change in relationship
|
12 months
|
12 months
|
Prorated
|
100% Vested
|
Vested
|
12 months
|
|
|
David Jamieson
|
Termination without cause or Change in relationship
|
12 months
|
12 months
|
Prorated
|
100% Vested
|
Vested
|
12 months
|
|
|
Gordon A. Davies
|
Termination without cause or Change in relationship
|
12 months
|
12 months
|
Prorated
|
N/A
|
Vested
|
12 months
|
|
|
Lisa Zangari
|
Termination without cause or Change in relationship
|
12 months
|
12 months
|
Prorated
|
N/A
|
Vested
|
12 months
|
|
|
Jonathan Hunter
|
Termination without cause or Change in relationship
|
12 months
|
12 months
|
Prorated
|
N/A
|
Vested
|
12 months
|
|
|
(1)
|
Assuming 100% achievement of the expected targets for the fiscal year in which the triggering event occurred.
|
|
(2)
|
LTIP amounts are prorated for the number of months of participation at termination date in the applicable 38 month performance period. If the termination date is before the commencement of the 19th month of the performance period, a prorated LTIP will not be paid.
|
|
(3)
|
Already vested as of termination date with no acceleration of unvested options. For a period of 90 days following the termination date, the Named Executive Officer has the right to exercise all options which have vested as of the date of termination.
|
|
(4)
|
Employee and medical benefits provided to each Named Executive Officer immediately prior to the occurrence of the trigger event.
|
|
(5)
|
In addition to Mr. Barrenechea’s right to exercise all options which have vested as of the date of termination for 90 days following such termination, all options granted to Mr. Barrenechea during Fiscal 2012 (Fiscal 2012 Awards) shall continue to vest during the 24 month period following the date of termination and Mr. Barrenechea shall have another 90 days following this period to exercise the Fiscal 2012 Awards. Following these deadlines, all unvested options shall terminate. However, if the triggering event occurs within twelve months of a change in control event, then 100% of all outstanding options and the Fiscal 2012 Awards vest and Mr. Barrenechea shall have 90 days to exercise these options.
|
94
Within 12 Months of a Change in Control
|
Within 12 Months of a Change in Control
|
||||||||
|
Base
|
Short term incentives
(1)
|
LTIP
|
Non-LTIP RSUs
|
Options
(2)
|
Employee and Medical Benefits (3)
|
|||
|
Mark J. Barrenechea
|
Termination without cause or Change in relationship
|
24 months
|
24 months
|
100% Vested
|
100% Vested
|
100% Vested
|
(4)
|
24 months
|
|
John M. Doolittle
|
Termination without cause or Change in relationship
|
24 months
|
24 months
|
100% Vested
|
100% Vested
|
100% Vested
|
24 months
|
|
|
David Jamieson
|
Termination without cause or Change in relationship
|
24 months
|
24 months
|
100% Vested
|
100% Vested
|
100% Vested
|
24 months
|
|
|
Gordon A. Davies
|
Termination without cause or Change in relationship
|
24 months
|
24 months
|
100% Vested
|
N/A
|
100% Vested
|
24 months
|
|
|
Lisa Zangari
|
Termination without cause or Change in relationship
|
24 months
|
24 months
|
100% Vested
|
N/A
|
100% Vested
|
24 months
|
|
|
(1)
|
Assuming 100% achievement of the expected targets for the fiscal year in which the triggering event occurred.
|
|
(2)
|
For a period of 90 days following the termination date, the Named Executive Officer has the right to exercise all options which are deemed to have vested as of the date of termination.
|
|
(3)
|
Employee and medical benefits provided to each Named Executive Officer immediately prior to the occurrence of the trigger event.
|
|
(4)
|
For Mr. Barrenechea, the accelerated vesting includes 100% vesting of his Fiscal 2012 Awards.
|
In addition to the information identified above, each Named Executive Officer is entitled to all accrued payments up to the date of termination, including all earned but unpaid short-term incentive amounts and earned but unpaid LTIP. Except as otherwise required by law, we are required to make all these payments and provide these benefits over a period of 12 months or 24 months, depending on the Named Executive Officer’s entitlement and the circumstances which triggered our obligation to make such payments and provide such benefits, from the date of the event which triggered our obligation. With respect to payments to Mr. Barrenechea, the Company intends to make all required payments to Mr. Barrenechea no later than two and a half months after the end of the later of the fiscal year or calendar year in which the payments are no longer subject to a substantial risk of forfeiture
.
In return for receiving the payments and the benefits described above, each Named Executive Officer must comply with certain obligations in favour of the Company, including a non-disparagement obligation. Also, each Named Executive Officer is bound by a confidentiality and non-solicitation agreement where the non-solicitation obligation lasts 6 months from the date of termination of his employment.
Any breach by a Named Executive Officer of any provision of his contractual agreements may only be waived upon the review and approval of the Board.
Quantitative Estimates of Payments upon Termination or Change in Control
Further information regarding payments to our Named Executive Officers in the event of a termination or a change in control may be found in the table below. This table sets forth the estimated amount of payments and other benefits each Named Executive Officer would be entitled to receive upon the occurrence of the indicated event, assuming that the event occurred on June 30, 2015. Amounts (i) potentially payable under plans which are generally available to all salaried employees, such as life and disability insurance, and (ii) earned but unpaid, in both cases, are excluded from the table. The values related to vesting of stock options and awards are based upon the fair market value of our Common Shares of $40.53 per share as reported on the NASDAQ on June 30, 2015, the last trading day of our fiscal year. The other material assumptions made with respect to the numbers reported in the table below are:
|
•
|
Payments in Canadian dollars included herein are converted to U.S. dollars using an exchange rate, as of June 30, 2015, of 0.862713; and
|
|
•
|
The salary and incentive payments are calculated based on the amounts of salary and incentive payments which were payable to each Named Executive Officer as of June 30, 2015; and
|
95
|
•
|
Payments under the LTIPs are calculated as though 100% of Fiscal 2017 LTIP (granted in Fiscal 2015), Fiscal 2016 LTIP (granted in Fiscal 2014), and Fiscal 2015 LTIP (granted in Fiscal 2013) have vested with respect to a termination without cause or change in relationship following a change in control event, and as though a pro-rated amount have vested with respect to no change in control event.
|
Actual payments made at any future date may vary, including the amount the Named Executive Officer would have accrued under the applicable benefit or compensation plan as well as the price of our Common Shares.
|
Named Executive Officer
|
Salary
($)
|
Short-term
Incentive
Payment
($)
|
Gain on Vesting of LTIP and Non-LTIP RSUs
($)
|
Gain on
Vesting of
Stock Options
($)
|
Employee
Benefits
($)
|
Total
($)
|
||||||||||||||
|
Mark J. Barrenechea
|
Termination Without Cause / Change in Relationship with no Change in Control
|
$
|
1,890,000
|
|
$
|
1,890,000
|
|
$
|
4,640,871
|
|
$
|
3,313,600
|
|
$
|
76,704
|
|
$
|
11,811,175
|
|
|
|
|
Termination Without Cause / Change in Relationship, within 12 months following a Change in Control
|
$
|
1,890,000
|
|
$
|
1,890,000
|
|
$
|
7,685,136
|
|
$
|
4,830,811
|
|
(1)
|
$
|
76,704
|
|
$
|
16,372,650
|
|
|
John M. Doolittle
|
Termination Without Cause / Change in Relationship with no Change in Control
|
$
|
431,357
|
|
$
|
345,085
|
|
$
|
506,625
|
|
$
|
—
|
|
$
|
1,842
|
|
$
|
1,284,909
|
|
|
|
|
Termination Without Cause / Change in Relationship, within 12 months following a Change in Control
|
$
|
862,713
|
|
$
|
690,170
|
|
$
|
935,433
|
|
$
|
—
|
|
(1)
|
$
|
3,683
|
|
$
|
2,491,998
|
|
|
David Jamieson
|
Termination Without Cause / Change in Relationship with no Change in Control
|
$
|
267,441
|
|
$
|
267,441
|
|
$
|
101,325
|
|
$
|
—
|
|
$
|
5,639
|
|
$
|
641,846
|
|
|
|
|
Termination Without Cause / Change in Relationship, within 12 months following a Change in Control
|
$
|
534,882
|
|
$
|
534,882
|
|
$
|
255,339
|
|
$
|
—
|
|
(1)
|
$
|
11,278
|
|
$
|
1,336,380
|
|
|
Gordon A. Davies
|
Termination Without Cause / Change in Relationship with no Change in Control
|
$
|
358,889
|
|
$
|
251,049
|
|
$
|
818,229
|
|
$
|
—
|
|
$
|
17,774
|
|
$
|
1,445,941
|
|
|
|
Termination Without Cause / Change in Relationship, within 12 months following a Change in Control
|
$
|
717,777
|
|
$
|
502,099
|
|
$
|
1,512,579
|
|
$
|
191,497
|
|
(1)
|
$
|
35,547
|
|
$
|
2,959,498
|
|
|
|
Lisa Zangari
|
Termination Without Cause / Change in Relationship with no Change in Control
|
$
|
293,322
|
|
$
|
205,326
|
|
$
|
—
|
|
$
|
—
|
|
$
|
4,201
|
|
$
|
502,849
|
|
|
|
Termination Without Cause / Change in Relationship, within 12 months following a Change in Control
|
$
|
586,645
|
|
$
|
410,651
|
|
$
|
220,483
|
|
$
|
—
|
|
(1)
|
$
|
8,401
|
|
$
|
1,226,179
|
|
|
|
Jonathan Hunter (2)
|
Termination Without Cause / Change in Relationship with no Change in Control
|
$
|
500,000
|
|
$
|
500,000
|
|
$
|
540,833
|
|
$
|
—
|
|
$
|
8,934
|
|
$
|
1,549,767
|
|
|
|
(1)
|
As of June 30, 2015, the market price of our Common Shares on the NASDAQ was less than the exercise value of the stock option awards granted during Fiscal 2015, thus leaving the options without value if the triggering event were to occur on June 30, 3015. For additional details on grants made during Fiscal 2015, see
“Grants of Plan Based Awards in Fiscal 2015” above.
|
|
(2)
|
The amounts set forth for Mr. Hunter represent the actual amounts to be paid as a result of his departure from the Company on May 20, 2015, in accordance with his termination agreement.
|
96
Director Compensation for Fiscal 2015
The following table sets forth summary information concerning the annual compensation received by each of the non-management directors of OpenText for the fiscal year ended June 30, 2015.
|
|
Fees Earned or
Paid in Cash
($) (1)
|
Stock
Awards
($) (2)
|
Option
Awards
($)
|
Non-Equity
Incentive Plan
Compensation
($)
|
Change in Pension Value and Non-qualified
Deferred Compensation
Earnings
($)
|
All Other
Compensation
($)
|
Total
($) |
|||||||||||||
|
P. Thomas Jenkins (3)
|
$
|
—
|
|
$
|
495,015
|
|
$
|
—
|
|
$
|
—
|
|
N/A
|
$
|
—
|
|
$
|
495,015
|
|
|
|
Randy Fowlie (4)
|
$
|
80,750
|
|
$
|
249,997
|
|
$
|
—
|
|
$
|
—
|
|
N/A
|
$
|
—
|
|
$
|
330,747
|
|
|
|
Gail E. Hamilton (5)
|
$
|
91,250
|
|
$
|
200,021
|
|
$
|
—
|
|
$
|
—
|
|
N/A
|
$
|
—
|
|
$
|
291,271
|
|
|
|
Brian J. Jackman (6)
|
$
|
72,750
|
|
$
|
200,021
|
|
$
|
—
|
|
$
|
—
|
|
N/A
|
$
|
—
|
|
$
|
272,771
|
|
|
|
Stephen J. Sadler (7)
|
$
|
52,000
|
|
$
|
200,021
|
|
$
|
—
|
|
$
|
—
|
|
N/A
|
$
|
523,330
|
|
(11)
|
$
|
775,351
|
|
|
Michael Slaunwhite (8)
|
$
|
10,813
|
|
$
|
282,452
|
|
$
|
—
|
|
$
|
—
|
|
N/A
|
$
|
—
|
|
$
|
293,265
|
|
|
|
Katharine B. Stevenson (9)
|
$
|
—
|
|
$
|
283,229
|
|
$
|
—
|
|
$
|
—
|
|
N/A
|
$
|
—
|
|
$
|
283,229
|
|
|
|
Deborah Weinstein (10)
|
$
|
—
|
|
$
|
288,273
|
|
$
|
—
|
|
$
|
—
|
|
N/A
|
$
|
—
|
|
$
|
288,273
|
|
|
|
(1)
|
Non-management directors may elect to defer all or a portion of their retainer and/or fees in the form of Common Share equivalent units under our Directors' Deferred Share Unit Plan (DSU Plan) based on the value of the Company's shares as of the date fees would otherwise be paid. The DSU Plan became effective February 2, 2010, is available to any non-management director of the Company and is designed to promote greater alignment of long-term interests between directors of the Company and its shareholders. DSUs granted as compensation for directors fees vest immediately whereas the annual DSU grant vests at the Company’s next annual general meeting. No DSUs are payable by the Company until the director ceases to be a member of the Board.
|
|
(2)
|
In Fiscal 2015, Messrs. Jenkins, Fowlie, Jackman, Sadler, and Slaunwhite and Mses. Hamilton, Stevenson and Weinstein received 8,548, 4,317, 3,454, 3,454, 4,902, 3,454, 4,916, and 5,007 DSUs, respectively. The amounts set forth in this column represents the amount recognized as the aggregate grant date fair value of equity-based compensation awards, as calculated in accordance with ASC Topic 718. These amounts do not reflect whether the recipient has actually realized a financial benefit from the awards. For a discussion of the assumptions used in this valuation, see note 12 “Share Capital, Option Plan and Share-based Payments” to our consolidated financial statements.
|
|
(3)
|
As of June 30, 2015, Mr. Jenkins holds no options and 16,924 DSUs. Mr. Jenkins serves as Chairman of the Board.
|
|
(4)
|
As of June 30, 2015, Mr. Fowlie holds 25,600 options and 22,665 DSUs.
|
|
(5)
|
As of June 30, 2015, Ms. Hamilton holds 12,200 options and 18,016 DSUs.
|
|
(6)
|
As of June 30, 2015, Mr. Jackman holds 60,600 options and 13,136 DSUs.
|
|
(7)
|
As of June 30, 2015, Mr. Sadler holds no options and 20,456 DSUs.
|
|
(8)
|
As of June 30, 2015, Mr. Slaunwhite holds 23,200 options and 26,978 DSUs.
|
|
(9)
|
As of June 30, 2015, Ms. Stevenson holds 45,000 options and 18,385 DSUs.
|
|
(10)
|
As of June 30, 2015, Ms. Weinstein holds 36,600 options and 24,674 DSUs.
|
|
(11)
|
During Fiscal 2015, Mr. Sadler received $523,330 in consulting fees for assistance with acquisition-related business activities. Mr. Sadler abstained from voting on all transactions from which he would potentially derive consulting fees.
|
Directors who are salaried officers or employees receive no compensation for serving as directors. The material terms of our director compensation arrangements are as follows
:
97
|
Description
|
Amount and Frequency of Payment
|
|
Annual Chairman retainer fee payable to the Chairman of the Board
|
$200,000 per year payable following our Annual General Meeting
|
|
Annual retainer fee payable to each non-management director
|
$50,000 per director payable following our Annual General Meeting
|
|
|
|
|
Annual Independent Lead Director fee payable to the Independent Lead Director
|
$25,000 payable following our Annual General Meeting
|
|
|
|
|
Annual Audit Committee retainer fee payable to each member of the Audit Committee
|
$25,000 per year payable at $6,250 at the beginning of each quarterly period.
|
|
|
|
|
Annual Audit Committee Chair retainer fee payable to the Chair of the Audit Committee
|
$10,000 per year payable at $2,500 at the beginning of each quarterly period.
|
|
|
|
|
Annual Compensation Committee retainer fee payable to each member of the Compensation Committee
|
$15,000 per year payable at $3,750 at the beginning of each quarterly period.
|
|
|
|
|
Annual Compensation Committee Chair retainer fee payable to the Chair of the Compensation Committee
|
$10,000 per year payable at $2,500 at the beginning of each quarterly period.
|
|
|
|
|
Annual Corporate Governance Committee retainer fee payable to each member of the Corporate Governance Committee
|
$8,000 per year payable at $2,000 at the beginning of each quarterly period.
|
|
|
|
|
Annual Corporate Governance Committee Chair retainer fee payable to the Chair of the Corporate Governance Committee
|
$6,000 per year payable at $1,500 at the beginning of each quarterly period.
|
The Board has adopted a DSU Plan which is available to any non-management director of the Company. In Fiscal 2015, certain directors elected to receive DSUs instead of a cash payment for his or her directors’ fees. In addition to the scheduled fee arrangements set forth in the table above, whether paid in cash or DSUs, non-management directors also receive an annual DSU grant representing the long term component of their compensation. The amount of the annual DSU grant is discretionary; however, historically, the amount of this grant has been determined and updated on a periodic basis with the assistance of the Compensation Committee and the compensation consultant and benchmarked against director compensation for comparable companies. DSUs granted as compensation for directors fees vest immediately whereas the annual DSU grant vests at the Company’s next annual general meeting. No DSUs are payable by the Company until the director ceases to be a member of the Board.
As with its employees, the Company believes that granting compensation to directors in the form of equity, such as DSUs, promotes a greater alignment of long-term interests between directors of the Company and the shareholders of the Company. During Fiscal 2015, no stock options were granted to non-management directors and the Company has taken the position that non-management directors will receive DSUs instead of stock options where granting of equity awards is appropriate. All non-management directors have exceeded the Share Ownership Guidelines applicable to them, which is three times their annual retainer. For further details of our Share Ownership Guidelines as they relate to directors, see “Share Ownership Guidelines” above.
The Company does not have a retirement policy for its directors; however, the Company does review its director performance annually as part of its governance process.
Compensation Committee Interlocks and Insider Participation
The members of our Compensation Committee consist of Messrs. Slaunwhite (Chair) and Jackman and Ms. Weinstein. None of the members of the Compensation Committee have been or are an officer or employee of the Company, or any of our subsidiaries, or had any relationship requiring disclosure herein. None of our executive officers served as a member of the compensation committee of another entity (or other committee of the board of directors performing equivalent functions, or in the absence of any such committee, the entire board of directors) one of whose executive officers served as a director of ours.
98
Board's Role in Risk Oversight
The Board has responsibility for risk oversight. On an annual basis, management reviews our risk management policies and practices and presents the results of this review to the Board. In addition, each committee reviews and reports to the Board on risk oversight matters, as described below.
The Audit Committee oversees risks related to our accounting, financial statements and financial reporting process.
The Compensation Committee oversees risks which may be associated with our compensation policies, practices and programs, in particular with respect to our executive officers. The Compensation Committee assesses such risks with the review and assistance of the Company's management and the Compensation Committee's external compensation consultants.
The Corporate Governance and Nominating Committee monitors risk and potential risks with respect to the effectiveness of the Board, and considers aspects such as director succession, Board composition and the principal policies that guide the Company's overall corporate governance.
The members of each of the Audit Committee, Compensation Committee, and the Corporate Governance and Nominating Committee are all “independent” directors within the meaning ascribed to it in Multilateral Instrument 52-110-Audit Committees as well as the listing standards of NASDAQ, and, in the case of the Audit Committee, the additional independence requirements set out by the SEC.
All of our directors are kept informed of our business through open discussions with our management team, including our President and CEO, who serves on our Board. The Board also receives documents, such as quarterly and periodic management reports and financial statements, as well our directors have access to all books, records and reports upon request, and members of management are available at all times to answer any questions which Board members may have.
|
Item 12.
|
Security Ownership of Certain Beneficial Owners and Management and Related Stockholder Matters
|
The following table sets forth certain information as of June 30, 2015 regarding Common Shares beneficially owned by the following persons or companies: (i) each person or company known by us to be the beneficial owner of more than 5% of our outstanding Common Shares, (ii) each director of our Company, (iii) each Named Executive Officer, and (iv) all directors and executive officers as a group. Except as otherwise indicated, we believe that the beneficial owners of the Common Shares listed below have sole investment and voting power with respect to such Common Shares, subject to community property laws where applicable.
The number and percentage of shares beneficially owned as exhibited in Item 12 is based on filings made in accordance with the rules of the SEC, and is not necessarily indicative of beneficial ownership for any other purpose. Under these rules, beneficial ownership includes any shares as to which a person has sole or shared voting or investment power and also any shares of Common Shares underlying options or warrants that are exercisable by that person within 60 days of June 30, 2015. Unless otherwise indicated, the address of each person or entity named in the table is “care of” Open Text Corporation, 275 Frank Tompa Drive, Waterloo, Ontario, Canada, N2L 0A1.
99
|
Name and Address of Beneficial Owner
|
Amount and Nature of
Beneficial Ownership
|
Percent of Common
Shares Outstanding
|
|
|
Jarislowsky, Fraser Ltd. (1)
1010 Sherbrooke St. West, Montreal QC H3A 2R7
|
7,923,922
|
|
6.48%
|
|
FMR LLC (1)
82 Devonshire Street Boston, Massachusetts 02109 |
6,331,760
|
|
5.18%
|
|
Caisse de Depot et Placement du Quebec (1)
1000 Place Jean-Paul Riopelle, Montreal H2Z 2B3
|
6,065,000
|
|
4.96%
|
|
P. Thomas Jenkins (2)
|
1,859,132
|
|
1.51%
|
|
Mark J. Barrenechea (3)
|
512,376
|
|
*
|
|
Michael Slaunwhite (4)
|
240,124
|
|
*
|
|
Randy Fowlie (5)
|
153,911
|
|
*
|
|
Brian J. Jackman (6)
|
94,282
|
|
*
|
|
Stephen J. Sadler (7)
|
92,002
|
|
*
|
|
Katharine B. Stevenson (8)
|
68,131
|
|
*
|
|
Deborah Weinstein (9)
|
57,820
|
|
*
|
|
Gail E. Hamilton (10)
|
33,762
|
|
*
|
|
Gordon A. Davies (11)
|
20,612
|
|
*
|
|
John M. Doolittle
|
—
|
|
*
|
|
David Jamieson
|
—
|
|
*
|
|
Lisa Zangari
|
—
|
|
*
|
|
All executive officers and directors as a group (12)
|
3,261,435
|
|
2.65%
|
|
*
|
Less than 1%
|
|
(1)
|
Information regarding the shares outstanding is based on information filed in Schedule 13G, 13F, or Schedule 13G/A with the SEC. The percentage of Common Shares outstanding is calculated using the total shares outstanding as of June 30, 2015.
|
|
(2)
|
Includes 1,847,302 Common Shares owned, and 11,830 deferred stock units (DSUs) which are exercisable.
|
|
(3)
|
Includes 52,360 Common Shares owned, 427,147 options which are exercisable, and 32,869 options which will become exercisable within 60 days of June 30, 2015.
|
|
(4)
|
Includes 193,400 Common Shares owned, 23,200 options which are exercisable, and 23,524 DSUs which are exercisable.
|
|
(5)
|
Includes 109,100 Common Shares owned, 25,600 options which are exercisable, and 19,211 DSUs which are exercisable.
|
|
(6)
|
Includes 24,000 Common Shares owned, 60,600 options which are exercisable, and 9,682 DSUs which are exercisable.
|
|
(7)
|
Includes 75,000 Common Shares owned and 17,002 DSUs which are exercisable.
|
|
(8)
|
Includes 8,200 Common Shares owned, 45,000 options which are exercisable, and 14,931 DSUs which are exercisable.
|
|
(9)
|
Includes 36,600 options which are exercisable, and 21,220 DSUs which are exercisable.
|
|
(10)
|
Includes 7,000 Common Shares owned, 12,200 options which are exercisable, and 14,562 DSUs which are exercisable.
|
|
(11)
|
Includes 9,382 Common Shares owned, 3,614 options which are exercisable, and 7,616 options which will become exercisable within 60 days of June 30, 2015.
|
|
(12)
|
Includes 2,329,480 Common Shares owned, 783,665 options which are exercisable, 73,749 options which will become exercisable within 60 days of June 30, 2015, and 131,962 DSUs which are exercisable.
|
|
(13)
|
Messrs. McFeeters and Hunter are Named Executive Officers as disclosed in the Compensation Discussion and Analysis. However, both Messrs. McFeeters and Hunter have been excluded from the above table as they were not executive officers as of June 30, 3015.
|
100
Securities Authorized for Issuance under Equity Compensation Plans
The following table sets forth summary information relating to our various stock compensation plans as of
June 30, 2015
:
|
Plan Category
|
Number of securities
to be issued upon exercise
of outstanding options,
warrants, and rights
|
Weighted average
exercise price
of outstanding options,
warrants, and rights
|
Number of securities
remaining available
for future issuance
under equity
compensation plans
(excluding securities
reflected in column a)
|
|
|
(a)
|
(b)
|
(c)
|
|
Equity compensation plans approved by security holders:
|
4,375,365
|
$42.26
|
3,020,168
|
|
Equity compensation plans not approved by security holders :
|
|
|
|
|
Under deferred stock unit awards
|
131,962
|
n/a
|
—
|
|
Under performance stock unit awards
|
198,694
|
n/a
|
—
|
|
Under restricted stock unit awards
|
426,068
|
n/a
|
—
|
|
Total
|
5,132,089
|
n/a
|
3,020,168
|
For more information regarding stock compensation plans, please refer to note 12 "Share Capital, Option Plans and Share-Based Payments" to our Consolidated Financial Statements, under Item 8 of this Annual Report on Form 10-K.
|
Item 13.
|
Certain Relationships and Related Transactions, and Director Independence
|
Related Transactions Policy and Director Independence
We have adopted a written policy that all transactional agreements between us and our officers, directors and affiliates will be first approved by a majority of the independent directors. Once these agreements are approved, payments made pursuant to the agreements are approved by the members of our Audit Committee.
Our procedure regarding the approval of any related party transaction is that the material facts of such transaction shall be reviewed by the independent members of our Board and the transaction approved by a majority of the independent members of our Board. The Board reviews all transactions wherein we are, or will be a participant and any related party has or will have a direct or indirect interest. In determining whether to approve a related party transaction, the Board generally takes into account, among other facts it deems appropriate: whether the transaction is on terms no less favorable than terms generally available to an unaffiliated third party under the same or similar circumstances; the extent and nature of the related person's interest in the transaction; the benefits to the company of the proposed transaction; if applicable, the effects on a director's independence; and if applicable, the availability of other sources of comparable services or products.
The Board has determined that all directors, except Messrs. Barrenechea, Jenkins and Sadler, meet the independence requirements under the NASDAQ Listing Rules and qualify as “independent directors” under those Listing Rules. Mr. Barrenechea is not considered independent by virtue of being our President and Chief Executive Officer. Subject to compliance with the rules of NASDAQ and the Canadian Securities Administrators, Mr. Jenkins will not be considered an “independent director” for a period of three years commencing January 1, 2014. See “Transactions with Related Persons” below with respect to payments made to Mr. Sadler. Each of the members of our Compensation Committee, Audit Committee and Corporate Governance and Nominating Committee is an independent director.
Transactions With Related Persons
One of our directors, Mr. Sadler, received consulting fees for assistance with acquisition-related business activities pursuant to a consulting agreement with the Company. Mr. Sadler's consulting agreement, which was adopted by way of board resolution effective July 1, 2011, is for an indefinite period. The material terms of the agreement are as follows: Mr. Sadler is paid at the rate of Canadian dollars (CAD) $450 per hour for services relating to his consulting agreement. In addition, he is eligible to receive a bonus fee equivalent to 1.0% of the acquired company's revenues, up to CAD $10.0 million in revenue, plus an additional amount of 0.5% of the acquired company's revenues above CAD $10.0 million. The total bonus fee payable, for any given fiscal year, is subject to an annual limit of CAD $450,000 per single acquisition and an aggregate annual limit of CAD $980,000. The acquired company's revenues, for this purpose, is equal to the acquired company's revenues for the 12 months prior to the date of acquisition.
101
During Fiscal 2015, Mr. Sadler received approximately CAD $0.6 million in consulting fees from OpenText (equivalent to $0.5 million USD), inclusive of bonus fees for assistance with acquisition-related business activities. Mr. Sadler abstained from voting on all transactions from which he would potentially derive consulting fees.
|
Item 14.
|
Principal Accountant Fees and Services
|
The aggregate fees for professional services rendered by our independent registered public accounting firm, KPMG LLP, for Fiscal 2015 and Fiscal 2014 were:
Audit Fees
Audit fees were $2.5 million for Fiscal 2015 and $3.3 million for Fiscal 2014. Such fees were primarily for professional services rendered for (a) the annual audits of our consolidated financial statements and the accompanying attestation report regarding our ICFR contained in our Annual Report on Form 10-K, (b) the review of quarterly financial information included in our Quarterly Reports on Form 10-Q, (c) audit services related to mergers and acquisitions, and (d) services related to statutory audits where applicable.
Audit-Related Fees
Audit-related fees were approximately $0.2 million for Fiscal 2015 and $0.3 million for Fiscal 2014. Audit-related fees were primarily for assurance and related services, such as the review of non-periodic filings with the SEC.
Tax Fees
The total fees for tax services were approximately $0.04 million for Fiscal 2015 and $0.05 million for Fiscal 2014. These fees were for services related to tax compliance, including the preparation of tax returns, tax planning and tax advice.
Other Fees
None.
Pre-Approval Policy
OpenText's Audit Committee has established a policy of reviewing, in advance, and either approving or not approving, all audit, audit-related, tax and other non-audit services that our independent registered public accounting firm provides to us. This policy requires that all services received from our independent registered public accounting firm be approved in advance by the Audit Committee or a delegate of the Audit Committee (in this regard). The Audit Committee has delegated the pre-approval responsibility to the Chair of the Audit Committee. All services that KPMG LLP provided to us in Fiscal 2015 and Fiscal 2014 have been pre-approved by the Audit Committee.
The Audit Committee has determined that the provision of the services as set out above is compatible with the maintaining of KPMG LLP's independence in the conduct of its auditing functions.
102
(a) Financial Statements and Schedules
|
Index to Consolidated Financial Statements and Supplementary Data (Item 8)
|
Page Number
|
|
Report of Independent Registered Public Accounting Firm
|
|
|
Report of Independent Registered Public Accounting Firm
|
|
|
Consolidated Balance Sheets at June 30, 2015 and 2014
|
|
|
Consolidated Statements of Income for the years ended June 30, 2015, 2014, and 2013
|
|
|
Consolidated Statements of Comprehensive Income for the years ended June 30, 2015, 2014, and 2013
|
|
|
Consolidated Statements of Shareholders' Equity for the years ended June 30, 2015, 2014, and 2013
|
|
|
Consolidated Statements of Cash Flows for the years ended June 30, 2015, 2014, and 2013
|
|
|
Notes to Consolidated Financial Statements
|
|
(b) The following documents are filed as a part of this report:
1) Consolidated financial statements and Reports of Independent Registered Public Accounting Firm and the related notes thereto are included under Item 8, in Part II.
2) Valuation and Qualifying Accounts; see note 3 "Allowance for Doubtful Accounts" and note 14 "Income Taxes" in the Notes to Consolidated Financial Statements included under Item 8, in Part II.
3) Exhibits: The following exhibits are filed as part of this Annual Report on Form 10-K or are incorporated by reference to exhibits previously filed with the SEC.
|
Exhibit
Number
|
|
Description of Exhibit
|
|
2.1
|
Agreement and Plan of Merger between Open Text Corporation, EPIC Acquisition Sub Inc., a Delaware corporation and an indirect wholly-owned subsidiary of OpenText and EasyLink Services International Corporation dated May 1, 2012. (14)
|
|
|
2.2
|
Agreement and Plan of Merger, dated as of November 4, 2013, among Open Text Corporation, Ocelot Merger Sub, Inc., GXS Group, Inc. and the stockholders' representative named therein. (20)
|
|
|
2.3
|
Support Agreement, dated as of November 4, 2013, among GXS Group, Inc., Open Text Corporation, and Global Acquisition LLC. (20)
|
|
|
2.4
|
Support Agreement, dated as of November 4, 2013, among GXS Group, Inc., Open Text Corporation, CCG Investment Fund, L.P., CCG Associates - QP, LLC, CCG Investment Fund - AI, LP, CCG AV, LLC - Series A, CCG AV, LLC - Series C and CCG CI, LLC. (20)
|
|
|
2.5
|
Agreement and Plan of Merger, dated as of December 5, 2014, by and among Open Text Corporation, Asteroid Acquisition Corporation and Actuate. (24)
|
|
|
3.1
|
Articles of Amalgamation of the Company. (1)
|
|
|
3.2
|
Articles of Amendment of the Company. (1)
|
|
|
3.3
|
Articles of Amendment of the Company. (1)
|
|
|
3.4
|
Articles of Amalgamation of the Company. (1)
|
|
|
3.5
|
Articles of Amalgamation of the Company, dated July 1, 2001. (2)
|
|
|
3.6
|
Articles of Amalgamation of the Company, dated July 1, 2002. (3)
|
|
|
3.7
|
Articles of Amalgamation of the Company, dated July 1, 2003. (4)
|
|
|
3.8
|
Articles of Amalgamation of the Company, dated July 1, 2004. (5)
|
|
|
3.9
|
Articles of Amalgamation of the Company, dated July 1, 2005. (6)
|
|
|
3.10
|
Articles of Continuance of the Company, dated December 29, 2005. (7)
|
|
|
3.11
|
By-Law 1 of Open Text Corporation. (19)
|
|
|
4.1
|
Form of Common Share Certificate. (1)
|
|
103
|
4.2
|
Amended and Restated Shareholder Rights Plan Agreement between Open Text Corporation and Computershare Investor Services, Inc. dated September 26, 2013. (19)
|
|
|
4.3
|
Registration Rights Agreement, dated as of November 4, 2013, by and among Open Text Corporation and the principal stockholders named therein, and for the benefit of the holders (as defined therein). (20)
|
|
|
4.4
|
Indenture, dated as of January 15, 2015, among the Company, the subsidiary guarantors party thereto, Citibank, N.A., as U.S. trustee, and Citi Trust Company Canada, as Canadian trustee (including form of 5.625% Senior Notes due 2023). (26)
|
|
|
10.1
|
1998 Stock Option Plan. (8)
|
|
|
10.2*
|
Form of Indemnity Agreement between the Company and certain of its officers dated September 7, 2006. (9)
|
|
|
10.3*
|
Consulting Agreement between Steven Sadler and SJS Advisors Inc. and the Company, dated May 3, 2005. (10)
|
|
|
10.4
|
Open Text Corporation Directors' Deferred Share Unit Plan effective February 2, 2010. (11)
|
|
|
10.5
|
Amended and Restated Credit Agreement among Open Text Corporation and certain of its subsidiaries, the Lenders, Barclays Bank PLC, Royal Bank of Canada, Barclays Capital and RBC Capital Markets, dated as of November 9, 2011. (12)
|
|
|
10.6
|
2004 Stock Option Plan, as amended September 27, 2012. (15)
|
|
|
10.7*
|
OpenText Corporation Long-Term Incentive Plan 2015 for eligible employees, effective October 3, 2012. (16)
|
|
|
10.8*
|
Employment Agreement, dated October 30, 2012 between Mark Barrenechea and the Company. (16)
|
|
|
10.9*
|
Amendment No. 1 to the Employment Agreement between Mark J. Barrenechea and the Company dated January 24, 2013 (amending the Employment Agreement between Mark J. Barrenechea and the Company dated October 30, 2012). (17)
|
|
|
10.10*
|
Employment Agreement, as of December 19, 2012, between Gordon A. Davies and the Company. (18)
|
|
|
10.11*
|
Employment Agreement, as of July 30, 2013, between Paul McFeeters and the Company. (18)
|
|
|
10.12
|
Commitment Letter, dated as of November 4, 2013, by and among Barclays Bank PLC, Royal Bank of Canada and Open Text Corporation. (20)
|
|
|
10.13
|
First Amendment to Amended and Restated Credit Agreement and Amended and Restated Security and Pledge Agreement, dated as of December 16, 2013, between Open Text ULC, as term borrower, Open Text ULC, Open Text Inc. and Open Text Corporation, as revolving credit borrowers, the domestic guarantors party thereto, each of the lenders party thereto, Barclays Bank PLC, as sole administrative agent and collateral agent, and Royal Bank of Canada, as documentary credit lender. (21)
|
|
|
10.14
|
Credit Agreement, dated as of January 16, 2014, among Open Text Corporation, as guarantor, Ocelot Merger Sub, Inc., which on January 16, 2014 merged with and into GXS Group, Inc. which survived such merger, as borrower, the other domestic guarantors party thereto, the lenders named therein, as lenders, Barclays Bank PLC, as sole administrative agent and collateral agent, and with Barclays and RBC Capital Markets, as lead arrangers and joint bookrunners. (22)
|
|
|
10.15
|
Second Amendment to Amended and Restated Credit Agreement, dated as of December 22, 2014, between Open Text ULC, as term borrower, Open Text ULC, Open Text Holdings, Inc. and Open Text Corporation, as revolving credit borrowers, the domestic guarantors party thereto, each of the lenders party thereto, Barclays Bank PLC, as sole administrative agent and collateral agent, and Royal Bank of Canada, as documentary credit lender. (25)
|
|
|
10.16
|
Tender and Voting Agreement, dated as of December 5, 2014, by and among Open Text Corporation, Asteroid Acquisition Corporation and certain stockholders of Actuate. (24)
|
|
|
10.19*
|
Employment Agreement, dated November 30, 2012, between Muhi Majzoub and the Company. (23)
|
|
|
10.20*
|
Employment Agreement, dated August 15, 2013, between Jonathan Hunter and the Company. (23)
|
|
|
10.21*
|
Employment Agreement, dated July 30, 2014, between John M. Doolittle and the Company. (23)
|
|
|
10.22*
|
Amendment No. 2 to the Employment Agreement between Mark J. Barrenechea and the Company dated July 30, 2013 (amending the Employment Agreement between Mark J. Barrenechea and the Company dated October 30, 2012). (23)
|
|
|
10.23*
|
Employment Agreement, dated September 11, 2014, between Lisa Zangari and the Company.
|
|
|
10.24*
|
Employment Agreement, dated October 13, 2014, between David Jamieson and the Company.
|
|
|
12.1
|
Statement of Computation of Ratios of Earnings to Combined Fixed Charges and Preferences
|
|
|
18.1
|
Preferability letter dated February 2, 2012 from the Company's auditors, KPMG LLP, regarding a change in the Company's accounting policy relating to the income statement classification of tax related interest and penalties. (13)
|
|
|
21.1
|
List of the Company's Subsidiaries.
|
|
|
23.1
|
Consent of Independent Registered Public Accounting Firm.
|
|
104
|
31.1
|
|
Certification of the Chief Executive Officer, pursuant to Rule 13a-14(a) of the Exchange Act, as adopted pursuant to Section 302 of the Sarbanes-Oxley Act of 2002.
|
|
31.2
|
|
Certification of the Chief Financial Officer pursuant to Rule 13a-14(a) of the Exchange Act, as adopted pursuant to Section 302 of the Sarbanes-Oxley Act of 2002.
|
|
32.1
|
|
Certification of the Chief Executive Officer pursuant to 18 U.S.C Section 1350, as adopted pursuant to Section 906 of the Sarbanes-Oxley Act of 2002.
|
|
32.2
|
|
Certification of the Chief Financial Officer pursuant to 18 U.S.C Section 1350, as adopted pursuant to Section 906 of the Sarbanes-Oxley Act of 2002.
|
|
101.INS
|
|
XBRL instance document.
|
|
101.SCH
|
|
XBRL taxonomy extension schema.
|
|
101.CAL
|
|
XBRL taxonomy extension calculation linkbase.
|
|
101.DEF
|
|
XBRL taxonomy extension definition linkbase.
|
|
101.LAB
|
|
XBRL taxonomy extension label linkbase.
|
|
101.PRE
|
|
XBRL taxonomy extension presentation.
|
* Indicates management contract relating to compensatory plans or arrangements
|
(1)
|
Filed as an Exhibit to the Company's Registration Statement on Form F-1 (Registration Number 33-98858) as filed with the Securities and Exchange Commission (the “SEC”) on November 1, 1995 or Amendments 1, 2 or 3 thereto (filed on December 28, 1995, January 22, 1996 and January 23, 1996 respectively), and incorporated herein by reference.
|
|
(2)
|
Filed as an Exhibit to the Company's Annual Report on Form 10-K, as filed with the SEC on September 28, 2001 and incorporated herein by reference.
|
|
(3)
|
Filed as an Exhibit to the Company's Annual Report on Form 10-K, as filed with the SEC on September 28, 2002 and incorporated herein by reference.
|
|
(4)
|
Filed as an Exhibit to the Company's Annual Report on Form 10-K, as filed with the SEC on September 29, 2003 and incorporated herein by reference.
|
|
(5)
|
Filed as an Exhibit to the Company's Annual Report on Form 10-K, as filed with the SEC on September 13, 2004 and incorporated herein by reference.
|
|
(6)
|
Filed as an Exhibit to the Company's Annual Report on Form 10-K, as filed with the SEC on September 27, 2005 and incorporated herein by reference.
|
|
(7)
|
Filed as an Exhibit to the Company's Quarterly Report on Form 10-Q, as filed with the SEC on February 3, 2006 and incorporated herein by reference.
|
|
(8)
|
Filed as an Exhibit to the Company's Annual Report on Form 10-K, as filed with the SEC on August 20, 1999 and incorporated herein by reference.
|
|
(9)
|
Filed as an Exhibit to the Company's Annual Report on Form 10-K, as filed with the SEC on September 12, 2006 and incorporated herein by reference.
|
|
(10)
|
Filed as an Exhibit to the Company's Annual Report on Form 10-K, as filed with the SEC on August 26, 2008 and incorporated herein by reference.
|
|
(11)
|
Filed as an Exhibit to the Company's Quarterly Report on Form 10-Q, as filed with the SEC on April 30, 2010 and incorporated herein by reference.
|
|
(12)
|
Filed as an Exhibit to the Company's Current Report on Form 8-K, as filed with the SEC on November 9, 2011 and incorporated herein by reference.
|
|
(13)
|
Filed as an Exhibit to the Company's Quarterly Report on Form 10-Q, as filed with the SEC on February 2, 2012 and incorporated herein by reference.
|
|
(14)
|
Filed as an Exhibit to the Company’s Current Report on Form 8-K, as filed with the SEC on July 3, 2012 and incorporated herein by reference.
|
|
(15)
|
Filed as an Exhibit to the Company’s Current Report on Form 8-K, as filed with the SEC on October 2, 2012 and incorporated herein by reference.
|
|
(16)
|
Filed as an Exhibit to the Company’s Quarterly Report on Form 10-Q, as filed with the SEC on November 1, 2012 and incorporated herein by reference.
|
|
(17)
|
Filed as an Exhibit to the Company’s Quarterly Report on Form 10-Q, as filed with the SEC on January 25, 2013 and incorporated herein by reference.
|
|
(18)
|
Filed as an Exhibit to the Company's Annual Report on Form 10-K, as filed with the SEC on August 1, 2013 and incorporated herein by reference.
|
105
|
(19)
|
Filed as an Exhibit to the Company's Current Report on Form 8-K, as filed with the SEC on September 26, 2013 and incorporated herein by reference.
|
|
(20)
|
Filed as an Exhibit to the Company's Current Report on Form 8-K/A, as filed with the SEC on November 6, 2013 and incorporated herein by reference.
|
|
(21)
|
Filed as an Exhibit to the Company's Current Report on Form 8-K, as filed with the SEC on December 20, 2013 and incorporated herein by reference.
|
|
(22)
|
Filed as an Exhibit to the Company's Current Report on Form 8-K, as filed with the SEC on January 16, 2014 and incorporated herein by reference.
|
(23)Filed as an Exhibit to the Company's Annual Report on Form 10-K, as filed with the SEC on July 31, 2014 and incorporated herein by reference.
|
(24)
|
Filed as an Exhibit to the Company's Current Report on Form 8-K, as filed with the SEC on December 5, 2014 and incorporated herein by reference.
|
(25) Filed as an exhibit to the Company's Current Report on Form 8-K, as fined with the SEC on December 23, 2014 and incorporated herein by reference.
(26) Filed as an Exhibit to the Company's Current Report on Form 8-K, as filed with the SEC on January 15, 2015 and incorporated herein by reference.
106
Report of Independent Registered Public Accounting Firm
The Board of Directors and Shareholders
Open Text Corporation
We have audited the accompanying consolidated balance sheets of Open Text Corporation as of June 30, 2015 and June 30, 2014, and the related consolidated statements of income, comprehensive income, shareholders’ equity and cash flows for each of the years in the three-year period ended June 30, 2015. These consolidated financial statements are the responsibility of the Company’s management. Our responsibility is to express an opinion on these consolidated financial statements based on our audits.
We conducted our audits in accordance with the standards of the Public Company Accounting Oversight Board (United States). Those standards require that we plan and perform the audit to obtain reasonable assurance about whether the financial statements are free of material misstatement. An audit includes examining, on a test basis, evidence supporting the amounts and disclosures in the financial statements. An audit also includes assessing the accounting principles used and significant estimates made by management, as well as evaluating the overall financial statement presentation. We believe that our audits provide a reasonable basis for our opinion.
In our opinion, the consolidated financial statements referred to above present fairly, in all material respects, the consolidated financial position of Open Text Corporation as of June 30, 2015 and June 30, 2014, and its consolidated results of operations and its consolidated cash flows for each of the years in the three-year period ended June 30, 2015, in conformity with U.S. generally accepted accounting principles.
We also have audited, in accordance with the standards of the Public Company Accounting Oversight Board (United States), Open Text Corporation’s internal control over financial reporting as of June 30, 2015, based on criteria established in
Internal Control - Integrated Framework (2013)
issued by the Committee of Sponsoring Organizations of the Treadway Commission (COSO), and our report dated July 28, 2015 expressed an unqualified opinion on the effectiveness of Open Text Corporation's internal control over financial reporting.
Chartered Professional Accountants, Licensed Public Accountants
Toronto, Canada
July 28, 2015
107
Report of Independent Registered Public Accounting Firm
The Board of Directors and Shareholders
Open Text Corporation
We have audited Open Text Corporation’s internal control over financial reporting as of June 30, 2015, based on criteria established in
Internal Control - Integrated Framework (2013)
issued by the Committee of Sponsoring Organizations of the Treadway Commission (COSO)
.
Open Text Corporation’s management is responsible for maintaining effective internal control over financial reporting and for its assessment of the effectiveness of internal control over financial reporting, included in Part II, Item 9A of this Annual Report on Form 10-K. Our responsibility is to express an opinion on the Company’s internal control over financial reporting based on our audit.
We conducted our audit in accordance with the standards of the Public Company Accounting Oversight Board (United States). Those standards require that we plan and perform the audit to obtain reasonable assurance about whether effective internal control over financial reporting was maintained in all material respects. Our audit included obtaining an understanding of internal control over financial reporting, assessing the risk that a material weakness exists, and testing and evaluating the design and operating effectiveness of internal control based on the assessed risk. Our audit also included performing such other procedures as we considered necessary in the circumstances. We believe that our audit provides a reasonable basis for our opinion.
A company’s internal control over financial reporting is a process designed to provide reasonable assurance regarding the reliability of financial reporting and the preparation of financial statements for external purposes in accordance with generally accepted accounting principles. A company’s internal control over financial reporting includes those policies and procedures that (1) pertain to the maintenance of records that, in reasonable detail, accurately and fairly reflect the transactions and dispositions of the assets of the company; (2) provide reasonable assurance that transactions are recorded as necessary to permit preparation of financial statements in accordance with generally accepted accounting principles, and that receipts and expenditures of the company are being made only in accordance with authorizations of management and directors of the company; and (3) provide reasonable assurance regarding prevention or timely detection of unauthorized acquisition, use, or disposition of the company’s assets that could have a material effect on the financial statements.
Because of its inherent limitations, internal control over financial reporting may not prevent or detect misstatements. Also, projections of any evaluation of effectiveness to future periods are subject to the risk that controls may become inadequate because of changes in conditions, or that the degree of compliance with the policies or procedures may deteriorate.
In our opinion, Open Text Corporation maintained, in all material respects, effective internal control over financial reporting as of June 30, 2015, based on criteria established in
Internal Control - Integrated Framework (2013)
issued by the Committee of Sponsoring Organizations of the Treadway Commission (COSO).
Open Text Corporation
acquired Actuate Corporation during 2015, and management excluded from its assessment of the effectiveness of Open Text Corporation’s internal control over financial reporting as of June 30, 2015, Actuate Corporation’s internal control over financial reporting associated with total assets of $394 million and total revenues of $34 million included in the consolidated financial statements of Open Text Corporation as of and for the year ended June 30, 2015. Our audit of internal control over financial reporting of Open Text Corporation also excluded an evaluation of the internal control over financial reporting of Actuate Corporation.
We also have audited, in accordance with the standards of the Public Company Accounting Oversight Board (United States), the consolidated balance sheets of Open Text Corporation as of June 30, 2015 and June 30, 2014, and the related consolidated statements of income, comprehensive income, shareholders’ equity, and cash flows for each of the years in the three-year period ended June 30, 2015,
and our report dated July 28, 2015 expressed an unqualified opinion on those consolidated financial statements
.
Chartered Professional Accountants, Licensed Public Accountants
Toronto, Canada
July 28, 2015
108
OPEN TEXT CORPORATION
(In thousands of U.S. dollars, except share data)
|
June 30, 2015
|
June 30, 2014
|
||||||
|
|
|
||||||
|
ASSETS
|
|||||||
|
Cash and cash equivalents
|
$
|
699,999
|
|
$
|
427,890
|
|
|
|
Short-term investments
|
11,166
|
|
—
|
|
|||
|
Accounts receivable trade, net of allowance for doubtful accounts of $5,987 as of June 30, 2015 and $4,727 as of June 30, 2014 (note 3)
|
284,131
|
|
292,929
|
|
|||
|
Income taxes recoverable (note 14)
|
21,151
|
|
24,648
|
|
|||
|
Prepaid expenses and other current assets
|
53,191
|
|
42,053
|
|
|||
|
Deferred tax assets (note 14)
|
30,711
|
|
28,215
|
|
|||
|
Total current assets
|
1,100,349
|
|
815,735
|
|
|||
|
Property and equipment (note 4)
|
160,419
|
|
142,261
|
|
|||
|
Goodwill (note 5)
|
2,161,592
|
|
1,940,082
|
|
|||
|
Acquired intangible assets (note 6)
|
679,479
|
|
725,318
|
|
|||
|
Deferred tax assets (note 14)
|
155,411
|
|
161,247
|
|
|||
|
Other assets (note 7)
|
85,576
|
|
52,041
|
|
|||
|
Deferred charges (note 8)
|
37,265
|
|
52,376
|
|
|||
|
Long-term income taxes recoverable (note 14)
|
8,404
|
|
10,638
|
|
|||
|
Total assets
|
$
|
4,388,495
|
|
$
|
3,899,698
|
|
|
|
LIABILITIES AND SHAREHOLDERS’ EQUITY
|
|||||||
|
Current liabilities:
|
|||||||
|
Accounts payable and accrued liabilities (note 9)
|
$
|
241,370
|
|
$
|
231,954
|
|
|
|
Current portion of long-term debt (note 10)
|
8,000
|
|
62,582
|
|
|||
|
Deferred revenues
|
358,066
|
|
332,664
|
|
|||
|
Income taxes payable (note 14)
|
17,001
|
|
12,948
|
|
|||
|
Deferred tax liabilities (note 14)
|
997
|
|
1,053
|
|
|||
|
Total current liabilities
|
625,434
|
|
641,201
|
|
|||
|
Long-term liabilities:
|
|||||||
|
Accrued liabilities (note 9)
|
34,682
|
|
41,999
|
|
|||
|
Deferred credits (note 8)
|
12,943
|
|
17,529
|
|
|||
|
Pension liability (note 11)
|
56,737
|
|
60,300
|
|
|||
|
Long-term debt (note 10)
|
1,580,000
|
|
1,256,750
|
|
|||
|
Deferred revenues
|
28,223
|
|
17,248
|
|
|||
|
Long-term income taxes payable (note 14)
|
151,484
|
|
162,131
|
|
|||
|
Deferred tax liabilities (note 14)
|
69,185
|
|
60,373
|
|
|||
|
Total long-term liabilities
|
1,933,254
|
|
1,616,330
|
|
|||
|
Shareholders’ equity:
|
|||||||
|
Share capital (note 12)
|
|||||||
|
122,293,986 and 121,758,432 Common Shares issued and outstanding at June 30, 2015 and June 30, 2014, respectively; Authorized Common Shares: unlimited
|
808,010
|
|
792,834
|
|
|||
|
Additional paid-in capital
|
126,417
|
|
112,398
|
|
|||
|
Accumulated other comprehensive income
|
51,828
|
|
39,449
|
|
|||
|
Retained earnings
|
863,015
|
|
716,317
|
|
|||
|
Treasury stock, at cost (625,725 shares at June 30, 2015 and 763,278 at June 30, 2014, respectively)
|
(19,986
|
)
|
(19,132
|
)
|
|||
|
Total OpenText shareholders' equity
|
1,829,284
|
|
1,641,866
|
|
|||
|
Non-controlling interests
|
523
|
|
301
|
|
|||
|
Total shareholders’ equity
|
1,829,807
|
|
1,642,167
|
|
|||
|
Total liabilities and shareholders’ equity
|
$
|
4,388,495
|
|
$
|
3,899,698
|
|
|
Guarantees and contingencies (note 13)
Related party transactions (note 22)
Subsequent events (note 23)
See accompanying Notes to
Consolidated Financial Statements
109
OPEN TEXT CORPORATION
(In thousands of U.S. dollars, except share and per share data)
|
Year Ended June 30,
|
||||||||||||
|
2015
|
2014
|
2013
|
||||||||||
|
Revenues:
|
||||||||||||
|
License
|
$
|
294,266
|
|
$
|
305,846
|
|
$
|
272,985
|
|
|||
|
Cloud services and subscriptions
|
|
605,309
|
|
373,400
|
|
180,412
|
|
|||||
|
Customer support
|
731,797
|
|
707,024
|
|
658,216
|
|
||||||
|
Professional service and other
|
220,545
|
|
238,429
|
|
251,723
|
|
||||||
|
Total revenues
|
1,851,917
|
|
1,624,699
|
|
1,363,336
|
|
||||||
|
Cost of revenues:
|
||||||||||||
|
License
|
12,899
|
|
13,161
|
|
15,995
|
|
||||||
|
Cloud services and subscriptions
|
239,719
|
|
142,666
|
|
73,464
|
|
||||||
|
Customer support
|
94,766
|
|
95,979
|
|
106,172
|
|
||||||
|
Professional service and other
|
173,399
|
|
189,947
|
|
196,663
|
|
||||||
|
Amortization of acquired technology-based intangible assets (note 6)
|
81,002
|
|
69,917
|
|
93,610
|
|
||||||
|
Total cost of revenues
|
601,785
|
|
511,670
|
|
485,904
|
|
||||||
|
Gross profit
|
1,250,132
|
|
1,113,029
|
|
877,432
|
|
||||||
|
Operating expenses:
|
||||||||||||
|
Research and development
|
196,491
|
|
176,834
|
|
164,010
|
|
||||||
|
Sales and marketing
|
369,920
|
|
345,643
|
|
289,157
|
|
||||||
|
General and administrative
|
163,042
|
|
142,450
|
|
109,325
|
|
||||||
|
Depreciation
|
50,906
|
|
35,237
|
|
24,496
|
|
||||||
|
Amortization of acquired customer-based intangible assets (note 6)
|
108,239
|
|
81,023
|
|
68,745
|
|
||||||
|
Special charges (note 17)
|
12,823
|
|
31,314
|
|
24,034
|
|
||||||
|
Total operating expenses
|
901,421
|
|
812,501
|
|
679,767
|
|
||||||
|
Income from operations
|
348,711
|
|
300,528
|
|
197,665
|
|
||||||
|
Other income (expense), net
|
(28,047
|
)
|
3,941
|
|
(2,473
|
)
|
||||||
|
Interest and other related expense, net
|
(54,620
|
)
|
(27,934
|
)
|
(16,982
|
)
|
||||||
|
Income before income taxes
|
266,044
|
|
276,535
|
|
178,210
|
|
||||||
|
Provision for income taxes (note 14)
|
31,638
|
|
58,461
|
|
29,690
|
|
||||||
|
Net income for the period
|
$
|
234,406
|
|
$
|
218,074
|
|
$
|
148,520
|
|
|||
|
Net (income) loss attributable to non-controlling interests
|
(79
|
)
|
51
|
|
—
|
|
||||||
|
Net income attributable to OpenText
|
$
|
234,327
|
|
$
|
218,125
|
|
$
|
148,520
|
|
|||
|
Earnings per share—basic attributable to OpenText (note 21)
|
$
|
1.92
|
|
$
|
1.82
|
|
$
|
1.27
|
|
|||
|
Earnings per share—diluted attributable to OpenText (note 21)
|
$
|
1.91
|
|
$
|
1.81
|
|
$
|
1.26
|
|
|||
|
Weighted average number of Common Shares outstanding—basic
|
122,092
|
|
119,674
|
|
117,208
|
|
||||||
|
Weighted average number of Common Shares outstanding—diluted
|
122,957
|
|
120,576
|
|
118,124
|
|
||||||
|
Dividends declared per Common Share
|
$
|
0.7175
|
|
$
|
0.6225
|
|
$
|
0.1500
|
|
|||
See accompanying Notes to
Consolidated Financial Statements
110
OPEN TEXT CORPORATION
CONSOLIDATED STATEMENTS OF COMPREHENSIVE INCOME
(In thousands of U.S. dollars)
|
|
Year Ended June 30,
|
|||||||||||
|
|
2015
|
2014
|
2013
|
|||||||||
|
Net income for the period
|
$
|
234,406
|
|
$
|
218,074
|
|
$
|
148,520
|
|
|||
|
Other comprehensive income—net of tax:
|
||||||||||||
|
Net foreign currency translation adjustments
|
15,690
|
|
(2,779
|
)
|
(1,879
|
)
|
||||||
|
Unrealized gain (loss) on cash flow hedges:
|
||||||||||||
|
Unrealized loss
|
(6,064
|
)
|
(357
|
)
|
(1,054
|
)
|
||||||
|
Loss (gain) reclassified into net income
|
5,710
|
|
3,242
|
|
(1,482
|
)
|
||||||
|
Actuarial gain (loss) relating to defined benefit pension plans:
|
||||||||||||
|
Actuarial loss
|
(3,302
|
)
|
(841
|
)
|
(351
|
)
|
||||||
|
Amortization of actuarial loss into net income
|
357
|
|
294
|
|
292
|
|
||||||
|
Unrealized gain on short-term investments
|
(12
|
)
|
—
|
|
—
|
|
||||||
|
Unrealized gain on marketable securities (Actuate)
|
1,906
|
|
—
|
|
—
|
|
||||||
|
Release of unrealized gain on marketable securities (Actuate)
|
(1,906
|
)
|
—
|
|
—
|
|
||||||
|
Total other comprehensive income (loss), net, for the period
|
12,379
|
|
(441
|
)
|
(4,474
|
)
|
||||||
|
Total comprehensive income
|
246,785
|
|
217,633
|
|
144,046
|
|
||||||
|
Comprehensive (income) loss attributable to non-controlling interests
|
(79
|
)
|
51
|
|
—
|
|
||||||
|
Total comprehensive income attributable to OpenText
|
$
|
246,706
|
|
$
|
217,684
|
|
$
|
144,046
|
|
|||
111
|
OPEN TEXT CORPORATION
CONSOLIDATED STATEMENTS OF SHAREHOLDERS' EQUITY
(In thousands of U.S. dollars and shares)
|
||||||||||||||||||||||||||||||||||
|
|
Common Shares
|
Treasury Stock
|
Additional
Paid in
Capital
|
Accumulated
Retained
Earnings
|
Accumulated Other
Comprehensive
Income
|
Non-Controlling Interest
|
Total
|
|||||||||||||||||||||||||||
|
|
Shares
|
Amount
|
Shares
|
Amount
|
||||||||||||||||||||||||||||||
|
Balance as of June 30, 2012
|
116,718
|
|
$
|
635,321
|
|
(1,586
|
)
|
$
|
(37,387
|
)
|
$
|
95,026
|
|
$
|
442,068
|
|
$
|
44,364
|
|
$
|
—
|
|
$
|
1,179,392
|
|
|||||||||
|
Issuance of Common Shares
|
||||||||||||||||||||||||||||||||||
|
Under employee stock option plans
|
1,254
|
|
14,205
|
|
—
|
|
—
|
|
—
|
|
—
|
|
—
|
|
—
|
|
14,205
|
|
||||||||||||||||
|
Under employee stock purchase plans
|
84
|
|
2,095
|
|
—
|
|
—
|
|
—
|
|
—
|
|
—
|
|
—
|
|
2,095
|
|
||||||||||||||||
|
In connection with acquisitions
|
2
|
|
21
|
|
—
|
|
—
|
|
(21
|
)
|
—
|
|
—
|
|
—
|
|
—
|
|
||||||||||||||||
|
Share-based compensation
|
—
|
|
—
|
|
—
|
|
—
|
|
15,575
|
|
—
|
|
—
|
|
—
|
|
15,575
|
|
||||||||||||||||
|
Income tax effect related to stock options exercised
|
—
|
|
—
|
|
—
|
|
—
|
|
(402
|
)
|
—
|
|
—
|
|
—
|
|
(402
|
)
|
||||||||||||||||
|
Purchase of treasury stock
|
—
|
|
—
|
|
—
|
|
—
|
|
—
|
|
—
|
|
—
|
|
—
|
|
—
|
|
||||||||||||||||
|
Issuance of treasury stock
|
—
|
|
—
|
|
364
|
|
8,313
|
|
(8,313
|
)
|
—
|
|
—
|
|
—
|
|
—
|
|
||||||||||||||||
|
Dividends
|
—
|
|
—
|
|
—
|
|
—
|
|
—
|
|
(17,703
|
)
|
—
|
|
—
|
|
(17,703
|
)
|
||||||||||||||||
|
Other comprehensive income (loss) - net
|
—
|
|
—
|
|
—
|
|
—
|
|
—
|
|
—
|
|
(4,474
|
)
|
—
|
|
(4,474
|
)
|
||||||||||||||||
|
Net income for the year
|
—
|
|
—
|
|
—
|
|
—
|
|
—
|
|
148,520
|
|
—
|
|
—
|
|
148,520
|
|
||||||||||||||||
|
Balance as of June 30, 2013
|
118,058
|
|
$
|
651,642
|
|
(1,222
|
)
|
$
|
(29,074
|
)
|
$
|
101,865
|
|
$
|
572,885
|
|
$
|
39,890
|
|
$
|
—
|
|
$
|
1,337,208
|
|
|||||||||
|
Issuance of Common Shares
|
||||||||||||||||||||||||||||||||||
|
Under employee stock option plans
|
1,043
|
|
22,221
|
|
—
|
|
—
|
|
—
|
|
—
|
|
—
|
|
—
|
|
22,221
|
|
||||||||||||||||
|
Under employee stock purchase plans
|
62
|
|
2,338
|
|
—
|
|
—
|
|
—
|
|
—
|
|
—
|
|
—
|
|
2,338
|
|
||||||||||||||||
|
In connection with acquisitions
|
2,595
|
|
116,777
|
|
—
|
|
—
|
|
—
|
|
—
|
|
—
|
|
—
|
|
116,777
|
|
||||||||||||||||
|
Equity issuance costs
|
—
|
|
(144
|
)
|
—
|
|
—
|
|
—
|
|
—
|
|
—
|
|
—
|
|
(144
|
)
|
||||||||||||||||
|
Share-based compensation
|
—
|
|
—
|
|
—
|
|
—
|
|
19,906
|
|
—
|
|
—
|
|
—
|
|
19,906
|
|
||||||||||||||||
|
Income tax effect related to stock options exercised
|
—
|
|
—
|
|
—
|
|
—
|
|
1,844
|
|
—
|
|
—
|
|
—
|
|
1,844
|
|
||||||||||||||||
|
Purchase of treasury stock
|
—
|
|
—
|
|
(25
|
)
|
(1,275
|
)
|
—
|
|
—
|
|
—
|
|
—
|
|
(1,275
|
)
|
||||||||||||||||
|
Issuance of treasury stock
|
—
|
|
—
|
|
484
|
|
11,217
|
|
(11,217
|
)
|
—
|
|
—
|
|
—
|
|
—
|
|
||||||||||||||||
|
Dividends
|
—
|
|
—
|
|
—
|
|
—
|
|
—
|
|
(74,693
|
)
|
—
|
|
—
|
|
(74,693
|
)
|
||||||||||||||||
|
Other comprehensive income (loss) - net
|
—
|
|
—
|
|
—
|
|
—
|
|
—
|
|
—
|
|
(441
|
)
|
—
|
|
(441
|
)
|
||||||||||||||||
|
Non-controlling interest
|
—
|
|
—
|
|
—
|
|
—
|
|
—
|
|
—
|
|
—
|
|
352
|
|
352
|
|
||||||||||||||||
|
Net income for the year
|
—
|
|
—
|
|
—
|
|
—
|
|
—
|
|
218,125
|
|
—
|
|
(51
|
)
|
218,074
|
|
||||||||||||||||
|
Balance as of June 30, 2014
|
121,758
|
|
$
|
792,834
|
|
(763
|
)
|
$
|
(19,132
|
)
|
$
|
112,398
|
|
$
|
716,317
|
|
$
|
39,449
|
|
$
|
301
|
|
$
|
1,642,167
|
|
|||||||||
|
Issuance of Common Shares
|
||||||||||||||||||||||||||||||||||
|
Under employee stock option plans
|
476
|
|
12,159
|
|
—
|
|
—
|
|
—
|
|
—
|
|
—
|
|
—
|
|
12,159
|
|
||||||||||||||||
|
Under employee stock purchase plans
|
59
|
|
3,017
|
|
—
|
|
—
|
|
—
|
|
—
|
|
—
|
|
—
|
|
3,017
|
|
||||||||||||||||
|
Share-based compensation
|
—
|
|
—
|
|
—
|
|
—
|
|
22,047
|
|
—
|
|
—
|
|
—
|
|
22,047
|
|
||||||||||||||||
|
Income tax effect related to stock options exercised
|
—
|
|
—
|
|
—
|
|
—
|
|
1,675
|
|
—
|
|
—
|
|
—
|
|
1,675
|
|
||||||||||||||||
|
Purchase of treasury stock
|
—
|
|
—
|
|
(240
|
)
|
(10,557
|
)
|
—
|
|
—
|
|
—
|
|
—
|
|
(10,557
|
)
|
||||||||||||||||
|
Issuance of treasury stock
|
—
|
|
—
|
|
377
|
|
9,703
|
|
(9,703
|
)
|
—
|
|
—
|
|
—
|
|
—
|
|
||||||||||||||||
|
Dividends
|
—
|
|
—
|
|
—
|
|
—
|
|
—
|
|
(87,629
|
)
|
—
|
|
—
|
|
(87,629
|
)
|
||||||||||||||||
|
Other comprehensive income - net
|
—
|
|
—
|
|
—
|
|
—
|
|
—
|
|
—
|
|
12,379
|
|
—
|
|
12,379
|
|
||||||||||||||||
|
Non-controlling interest
|
—
|
|
—
|
|
—
|
|
—
|
|
—
|
|
—
|
|
—
|
|
143
|
|
143
|
|
||||||||||||||||
|
Net income for the year
|
—
|
|
—
|
|
—
|
|
—
|
|
—
|
|
234,327
|
|
—
|
|
79
|
|
234,406
|
|
||||||||||||||||
|
Balance as of June 30, 2015
|
122,293
|
|
$
|
808,010
|
|
(626
|
)
|
$
|
(19,986
|
)
|
$
|
126,417
|
|
$
|
863,015
|
|
$
|
51,828
|
|
$
|
523
|
|
$
|
1,829,807
|
|
|||||||||
112
OPEN TEXT CORPORATION
(In thousands of U.S. dollars)
|
Year Ended June 30,
|
|||||||||||
|
|
2015
|
2014
|
2013
|
||||||||
|
Cash flows from operating activities:
|
|||||||||||
|
Net income for the period
|
$
|
234,406
|
|
$
|
218,074
|
|
$
|
148,520
|
|
||
|
Adjustments to reconcile net income to net cash provided by operating activities:
|
|||||||||||
|
Depreciation and amortization of intangible assets
|
240,147
|
|
186,177
|
|
186,851
|
|
|||||
|
Share-based compensation expense
|
22,047
|
|
19,906
|
|
15,575
|
|
|||||
|
Excess tax benefits on share-based compensation expense
|
(1,675
|
)
|
(1,844
|
)
|
(915
|
)
|
|||||
|
Pension expense
|
4,796
|
|
3,232
|
|
1,448
|
|
|||||
|
Amortization of debt issuance costs
|
4,556
|
|
3,191
|
|
2,123
|
|
|||||
|
Amortization of deferred charges and credits
|
10,525
|
|
11,307
|
|
11,815
|
|
|||||
|
Loss on sale and write down of property and equipment
|
1,368
|
|
15
|
|
24
|
|
|||||
|
Deferred taxes
|
(14,578
|
)
|
(12,334
|
)
|
(5,796
|
)
|
|||||
|
Release of unrealized gain on marketable securities to income
|
(3,098
|
)
|
—
|
|
—
|
|
|||||
|
Write off of unamortized debt issuance costs
|
2,919
|
|
—
|
|
—
|
|
|||||
|
Changes in operating assets and liabilities:
|
|||||||||||
|
Accounts receivable
|
43,189
|
|
(17,186
|
)
|
17,965
|
|
|||||
|
Prepaid expenses and other current assets
|
(3,534
|
)
|
11,146
|
|
4,242
|
|
|||||
|
Income taxes
|
2,933
|
|
11,308
|
|
(17,053
|
)
|
|||||
|
Deferred charges and credits
|
—
|
|
9,870
|
|
(9,274
|
)
|
|||||
|
Accounts payable and accrued liabilities
|
(22,714
|
)
|
(36,478
|
)
|
(41,947
|
)
|
|||||
|
Deferred revenue
|
6,775
|
|
16,601
|
|
5,418
|
|
|||||
|
Other assets
|
(5,031
|
)
|
(5,858
|
)
|
(494
|
)
|
|||||
|
Net cash provided by operating activities
|
523,031
|
|
417,127
|
|
318,502
|
|
|||||
|
Cash flows from investing activities:
|
|||||||||||
|
Additions of property and equipment
|
(77,046
|
)
|
(42,268
|
)
|
(23,107
|
)
|
|||||
|
Proceeds from maturity of short-term investments
|
17,017
|
|
—
|
|
—
|
|
|||||
|
Purchase of patents
|
—
|
|
(192
|
)
|
(192
|
)
|
|||||
|
Purchase of Actuate Corporation, net of cash acquired
|
(291,800
|
)
|
—
|
|
—
|
|
|||||
|
Purchase of Informative Graphics Corporation, net of cash acquired
|
(35,180
|
)
|
—
|
|
—
|
|
|||||
|
Purchase of GXS Group, Inc., net of cash acquired
|
—
|
|
(1,076,886
|
)
|
—
|
|
|||||
|
Purchase of Cordys Holding B.V., net of cash acquired
|
—
|
|
(30,588
|
)
|
—
|
|
|||||
|
Purchase of EasyLink Services International Corporation, net of cash acquired
|
—
|
|
—
|
|
(315,331
|
)
|
|||||
|
Purchase of Resonate KT Limited, net of cash acquired
|
—
|
|
—
|
|
(19,366
|
)
|
|||||
|
Purchase of ICCM Professional Services Limited, net of cash acquired
|
—
|
|
—
|
|
(11,257
|
)
|
|||||
|
Purchase of System Solutions Australia Pty Limited, net of cash acquired
|
—
|
|
—
|
|
(516
|
)
|
|||||
|
Purchase of a division of Spicer Corporation
|
(222
|
)
|
—
|
|
—
|
|
|||||
|
Purchase consideration for prior period acquisitions
|
(590
|
)
|
(887
|
)
|
(875
|
)
|
|||||
|
Other investing activities
|
(10,574
|
)
|
(2,547
|
)
|
(3,750
|
)
|
|||||
|
Net cash used in investing activities
|
(398,395
|
)
|
(1,153,368
|
)
|
(374,394
|
)
|
|||||
|
Cash flows from financing activities:
|
|||||||||||
|
Excess tax benefits on share-based compensation expense
|
1,675
|
|
1,844
|
|
915
|
|
|||||
|
Proceeds from issuance of Common Shares
|
15,240
|
|
24,808
|
|
16,347
|
|
|||||
|
Equity issuance costs
|
—
|
|
(144
|
)
|
—
|
|
|||||
|
Purchase of Treasury Stock
|
(10,126
|
)
|
(1,275
|
)
|
—
|
|
|||||
|
Proceeds from long-term debt
|
800,000
|
|
800,000
|
|
—
|
|
|||||
|
Repayment of long-term debt
|
(530,284
|
)
|
(45,911
|
)
|
(30,677
|
)
|
|||||
|
Debt issuance costs
|
(18,271
|
)
|
(16,685
|
)
|
—
|
|
|||||
|
Payments of dividends to shareholders
|
(87,629
|
)
|
(74,693
|
)
|
(17,703
|
)
|
|||||
|
Net cash used in (provided by) financing activities
|
170,605
|
|
687,944
|
|
(31,118
|
)
|
|||||
|
Foreign exchange gain (loss) on cash held in foreign currencies
|
(23,132
|
)
|
5,742
|
|
(2,292
|
)
|
|||||
|
Increase (decrease) in cash and cash equivalents during the period
|
272,109
|
|
(42,555
|
)
|
(89,302
|
)
|
|||||
|
Cash and cash equivalents at beginning of the period
|
427,890
|
|
470,445
|
|
559,747
|
|
|||||
|
Cash and cash equivalents at end of the period
|
$
|
699,999
|
|
$
|
427,890
|
|
$
|
470,445
|
|
||
Supplementary cash flow disclosures (note 20)
See accompanying Notes to
Consolidated Financial Statements
113
OPEN TEXT CORPORATION
NOTES TO
CONSOLIDATED FINANCIAL STATEMENTS
For the
Year Ended June 30, 2015
(Tabular amounts in thousands, except share and per share data)
The accompanying
Consolidated Financial Statements
include the accounts of Open Text Corporation and our subsidiaries, collectively referred to as "OpenText" or the "Company". We wholly own all our subsidiaries with the exception of Open Text South Africa Proprietary Ltd. (OT South Africa), GXS, Inc. (GXS Korea) and EC1 Pte. Ltd. (GXS Singapore), which as of
June 30, 2015
, were
90%
,
85%
and
81%
owned, respectively, by OpenText.
These
Consolidated Financial Statements
are expressed in U.S. dollars and are prepared in accordance with United States generally accepted accounting principles (U.S. GAAP). The information furnished reflects all adjustments necessary for a fair presentation of the results for the periods presented and includes the financial results of Informative Graphics Corporation (IGC), with effect from January 2, 2015, and Actuate Corporation (Actuate), with effect from January 16, 2015 (see note 18).
Use of estimates
The preparation of financial statements in conformity with U.S. GAAP requires us to make estimates, judgments and assumptions that affect the amounts reported in the
Consolidated Financial Statements
. These estimates, judgments and assumptions are evaluated on an ongoing basis. We base our estimates on historical experience and on various other assumptions that we believe are reasonable at that time, the results of which form the basis for making judgments about the carrying values of assets and liabilities that are not readily apparent from other sources. Actual results may differ from those estimates. In particular, significant estimates, judgments and assumptions include those related to: (i) revenue recognition, (ii) allowance for doubtful accounts, (iii) testing of goodwill for impairment, (iv) the valuation of acquired intangible assets, (v) the valuation of long-lived assets, (vi) the recognition of contingencies, (vii) restructuring accruals, (viii) acquisition accruals and pre-acquisition contingencies, (ix) asset retirement obligations, (x) the realization of investment tax credits, (xi) the valuation of stock options granted and obligations related to share-based payments, including the valuation of our long-term incentive plan, (xii) the valuation of financial instruments, (xiii) the valuation of pension assets and obligations, and (xiv) accounting for income taxes.
Reclassifications
Certain prior year balances have been reclassified to conform to the current year's presentation.
During the fourth quarter of Fiscal 2015, we combined revenues from cloud services and revenues from subscriptions into one line item named "
Cloud services and subscriptions
" revenue. In addition, we have reclassified certain license revenue, customer support revenue and professional services revenue to “
Cloud services and subscriptions
” revenue to better align the nature of revenues that are now depicted under “
Cloud services and subscriptions
” revenue. As a result, revenue and cost of revenues previously reflected in "License", "Customer support" and "Professional services and other" were reclassified to “
Cloud services and subscriptions
”. These revenues and expenses have been reclassified in the Consolidated Statements of Income for Fiscal 2014 and Fiscal 2013 to conform with the current period presentation as follows:
|
Fiscal year ended June 30,
|
||||||||
|
2014
|
2013
|
|||||||
|
Reclassifications within revenue
|
||||||||
|
Decrease to License
|
$
|
(3,371
|
)
|
$
|
(6,613
|
)
|
||
|
Decrease to Professional services and other
|
(8,960
|
)
|
—
|
|
||||
|
Increase to Cloud services and subscriptions
|
12,331
|
|
6,613
|
|
||||
|
Reclassifications within cost of revenue
|
||||||||
|
Decrease to cost of revenue - License
|
$
|
(201
|
)
|
$
|
(112
|
)
|
||
|
Decrease to cost of revenue - Customer support
|
(1
|
)
|
(776
|
)
|
||||
|
Decrease to cost of revenue - Professional services and other
|
(6,992
|
)
|
(211
|
)
|
||||
|
Increase to cost of revenue - Cloud services and subscriptions
|
7,194
|
|
1,099
|
|
||||
For more details relating to the accounting policy for cloud services and subscriptions, please see note 2.
114
Accounting Policies
Cash and cash equivalents
Cash and cash equivalents include investments that have terms to maturity of three months or less. Cash equivalents are recorded at cost and typically consist of term deposits, commercial paper, certificates of deposit and short-term interest bearing investment-grade securities of major banks in the countries in which we operate.
Short-Term Investments
In accordance with Financial Accounting Standards Board (FASB), Accounting Standards Codification (ASC) Topic 320 "Investments - Debt and Equity Securities" (Topic 320) related to accounting for certain investments in debt and equity securities, and based on our intentions regarding these instruments, we classify our marketable securities as available for sale and account for these investments at fair value. Marketable securities consist primarily of high quality debt securities with original maturities over 90 days, and may include corporate notes, United States government agency notes and municipal notes.
Allowance for doubtful accounts
We maintain an allowance for doubtful accounts for estimated losses resulting from the inability of customers to make payments. We evaluate the creditworthiness of our customers prior to order fulfillment and based on these evaluations, we adjust our credit limit to the respective customer. In addition to these evaluations, we conduct on-going credit evaluations of our customers' payment history and current creditworthiness. The allowance is maintained for
100%
of all accounts deemed to be uncollectible and, for those receivables not specifically identified as uncollectible, an allowance is maintained for a specific percentage of those receivables based upon the aging of accounts, our historical collection experience and current economic expectations. To date, the actual losses have been within our expectations.
No
single customer accounted for more than 10% of the accounts receivable balance as of June 30, 2015 and 2014.
Property and equipment
Property and equipment are stated at the lower of cost or net realizable value, and shown net of depreciation which is computed on a straight-line basis over the estimated useful lives of the related assets. Gains and losses on asset disposals are taken into income in the year of disposition. Fully depreciated property and equipment are retired from the balance sheet when they are no longer in use. We did not recognize any significant property impairment charges in Fiscal 2015, Fiscal 2014, or Fiscal 2013. The following represents the estimated useful lives of property and equipment:
|
Furniture and fixtures
|
5 years
|
|
Office equipment
|
5 years
|
|
Computer hardware
|
3 years
|
|
Computer software
|
3 years
|
|
Capitalized software
|
5 years
|
|
Leasehold improvements
|
Lesser of the lease term or 5 years
|
|
Building
|
40 years
|
Capitalized Software
We capitalize software development costs in accordance with FASB ASC Topic 350-40 – Accounting for the Costs of Computer Software Developed or Obtained for Internal-Use. We capitalize costs for software to be used internally when we enter the application development stage. This occurs when we complete the preliminary project stage, management authorizes and commits to funding the project, and it is feasible that the project will be completed and the software will perform the intended function. We cease to capitalize costs related to a software project when it enters the post implementation and operation stage. If different determinations are made with respect to the state of development of a software project, then the amount capitalized and the amount charged to expense for that project could differ materially.
Costs capitalized during the application development stage consist of payroll and related costs for employees who are directly associated with, and who devote time directly to, a project to develop software for internal use. We also capitalize the direct costs of materials and services, which generally includes outside contractors, and interest. We do not capitalize any general and administrative or overhead costs or costs incurred during the application development stage related to training or data conversion costs. Costs related to upgrades and enhancements to internal-use software, if those upgrades and
115
enhancements result in additional functionality, are capitalized. If upgrades and enhancements do not result in additional functionality, those costs are expensed as incurred. If different determinations are made with respect to whether upgrades or enhancements to software projects would result in additional functionality, then the amount capitalized and the amount charged to expense for that project could differ materially.
We amortize capitalized costs with respect to development projects for internal-use software when the software is ready for use. The capitalized software development costs are generally amortized using the straight-line method over a 5-year period. In determining and reassessing the estimated useful life over which the cost incurred for the software should be amortized, we consider the effects of obsolescence, technology, competition and other economic factors. If different determinations are made with respect to the estimated useful life of the software, the amount of amortization charged in a particular period could differ materially.
As of June 30, 2015 and 2014 our capitalized software development costs were
$38.6 million
and
$20.0 million
, respectively. Our additions, relating to capitalized software development costs, incurred during Fiscal 2015 and Fiscal 2014 were
$18.6 million
and
$20.0 million
, respectively.
Acquired intangibles
Acquired intangibles consist of acquired technology and customer relationships associated with various acquisitions.
Acquired technology is initially recorded at fair value based on the present value of the estimated net future income-producing capabilities of software products acquired on acquisitions. We amortize acquired technology over its estimated useful life on a straight-line basis.
Customer relationships represent relationships that we have with customers of the acquired companies and are either based upon contractual or legal rights or are considered separable; that is, capable of being separated from the acquired entity and being sold, transferred, licensed, rented or exchanged. These customer relationships are initially recorded at their fair value based on the present value of expected future cash flows. We amortize customer relationships on a straight-line basis over their estimated useful lives.
We continually evaluate the remaining estimated useful life of our intangible assets being amortized to determine whether events and circumstances warrant a revision to the remaining period of amortization.
Impairment of long-lived assets
We account for the impairment and disposition of long-lived assets in accordance with ASC Topic 360, “Property, Plant, and Equipment” (Topic 360). We test long-lived assets or asset groups, such as property and equipment and definite lived intangible assets, for recoverability when events or changes in circumstances indicate that their carrying amount may not be recoverable. Circumstances which could trigger a review include, but are not limited to: significant adverse changes in the business climate or legal factors; current period cash flow or operating losses combined with a history of losses or a forecast of continuing losses associated with the use of the asset; and a current expectation that the asset will more likely than not be sold or disposed of before the end of its estimated useful life.
Recoverability is assessed based on comparing the carrying amount of the asset to the aggregate pre-tax undiscounted cash flows expected to result from the use and eventual disposal of the asset or asset group. Impairment is recognized when the carrying amount is not recoverable and exceeds the fair value of the asset or asset group. The impairment loss, if any, is measured as the amount by which the carrying amount exceeds fair value, which for this purpose is based upon the discounted projected future cash flows of the asset or asset group.
We have not recorded any impairment charges for long-lived assets during Fiscal 2015, Fiscal 2014 and Fiscal 2013.
Goodwill
Goodwill represents the excess of the purchase price in a business combination over the fair value of net tangible and intangible assets acquired. The carrying amount of goodwill is periodically reviewed for impairment (at a minimum annually) and whenever events or changes in circumstances indicate that the carrying value of this asset may not be recoverable.
Our operations are analyzed by management and our chief operating decision maker (CODM) as being part of a single industry segment: the design, development, marketing and sales of Enterprise Information Management software and solutions. Therefore, our goodwill impairment assessment is based on the allocation of goodwill to a single reporting unit.
We perform a qualitative assessment to test our reporting unit's goodwill for impairment. Based on our qualitative assessment, if we determine that the fair value of our reporting unit is more likely than not (i.e., a likelihood of more than 50 percent) to be less than its carrying amount, the two step impairment test is performed. In the first step, we compare the fair value of our reporting unit to its carrying value. If the fair value of the reporting unit exceeds its carrying value, goodwill is not
116
considered impaired and we are not required to perform further testing. If the carrying value of the net assets of our reporting unit exceeds its fair value, then we must perform the second step of the two step impairment test in order to determine the implied fair value of our reporting unit's goodwill. If the carrying value our reporting unit's goodwill exceeds its implied fair value, then an impairment loss equal to the difference would be recorded.
Our annual impairment analysis of goodwill was performed as of April 1, 2015. Our qualitative assessment indicated that there were no indications of impairment and therefore there was no impairment of goodwill required to be recorded for Fiscal 2015 (no impairments were recorded for Fiscal 2014 and Fiscal 2013).
Derivative financial instruments
We use derivative financial instruments to manage foreign currency rate risk. We account for these instruments in accordance with ASC Topic 815, “Derivatives and Hedging” (Topic 815), which requires that every derivative instrument be recorded on the balance sheet as either an asset or liability measured at its fair value as of the reporting date. Topic 815 also requires that changes in our derivative financial instruments' fair values be recognized in earnings; unless specific hedge accounting and documentation criteria are met (i.e. the instruments are accounted for as hedges). We recorded the effective portions of the gain or loss on derivative financial instruments that were designated as cash flow hedges in accumulated other comprehensive income in our accompanying Consolidated Balance Sheets. Any ineffective or excluded portion of a designated cash flow hedge, if applicable, was recognized in our
Consolidated Statements of Income
.
Asset retirement obligations
We account for asset retirement obligations in accordance with ASC Topic 410, “Asset Retirement and Environmental Obligations” (Topic 410), which applies to certain obligations associated with “leasehold improvements” within our leased office facilities. Topic 410 requires that a liability be initially recognized for the estimated fair value of the obligation when it is incurred. The associated asset retirement cost is capitalized as part of the carrying amount of the long-lived asset and depreciated over the remaining life of the underlying asset and the associated liability is accreted to the estimated fair value of the obligation at the settlement date through periodic accretion charges recorded within general and administrative expenses. When the obligation is settled, any difference between the final cost and the recorded amount is recognized as income or loss on settlement in our
Consolidated Statements of Income
.
Business combinations
We apply the provisions of ASC Topic 805, “Business Combinations” (Topic 805), in the accounting for our acquisitions. It requires us to recognize separately from goodwill, the assets acquired and the liabilities assumed at their acquisition date fair values. Goodwill as of the acquisition date is measured as the excess of consideration transferred over the net of the acquisition date fair values of the assets acquired and the liabilities assumed. While we use our best estimates and assumptions to accurately value assets acquired and liabilities assumed at the acquisition date as well as contingent consideration, where applicable, our estimates are inherently uncertain and subject to refinement. As a result, during the measurement period, which may be up to one year from the acquisition date, we may record adjustments to the assets acquired and liabilities assumed with the corresponding offset to goodwill. Upon the conclusion of the measurement period or final determination of the values of assets acquired or liabilities assumed, whichever comes first, any subsequent adjustments would be recorded to our
Consolidated Statements of Income
.
Costs to exit or restructure certain activities of an acquired company or our internal operations are accounted for as one-time termination and exit costs pursuant to ASC Topic 420, “Exit or Disposal Cost Obligations” (Topic 420) and are accounted for separately from the business combination.
For a given acquisition, we generally identify certain pre-acquisition contingencies as of the acquisition date and may extend our review and evaluation of these pre-acquisition contingencies throughout the measurement period in order to obtain sufficient information to assess whether we include these contingencies as a part of the purchase price allocation and, if so, to determine the estimated amounts.
If we determine that a pre-acquisition contingency (non-income tax related) is probable in nature and estimable as of the acquisition date, we record our best estimate for such a contingency as a part of the preliminary purchase price allocation. We often continue to gather information and evaluate our pre-acquisition contingencies throughout the measurement period and if we make changes to the amounts recorded or if we identify additional pre-acquisition contingencies during the measurement period, such amounts will be included in the purchase price allocation during the measurement period and, subsequently, in our results of operations.
Uncertain tax positions and tax related valuation allowances assumed in connection with a business combination are initially estimated as of the acquisition date. We review these items during the measurement period as we continue to actively seek and collect information relating to facts and circumstances that existed at the acquisition date. Changes to these uncertain
117
tax positions and tax related valuation allowances made subsequent to the measurement period, or if they relate to facts and circumstances that did not exist at the acquisition date, are recorded in our provision for income taxes in our
Consolidated Statements of Income
.
Revenue recognition
License revenues
We recognize revenues in accordance with ASC Topic 985-605, “Software Revenue Recognition” (Topic 985-605).
We record product revenues from software licenses and products when persuasive evidence of an arrangement exists, the software product has been shipped, there are no significant uncertainties surrounding product acceptance by the customer, the fees are fixed and determinable, and collection is considered probable. We use the residual method to recognize revenues on delivered elements when a license agreement includes one or more elements to be delivered at a future date if evidence of the fair value of all undelivered elements exists. If an undelivered element for the arrangement exists under the license arrangement, revenues related to the undelivered element is deferred based on vendor-specific objective evidence (VSOE) of the fair value of the undelivered element.
Our multiple-element sales arrangements include arrangements where software licenses and the associated post contract customer support (PCS) are sold together. We have established VSOE of the fair value of the undelivered PCS element based on the contracted price for renewal PCS included in the original multiple element sales arrangement, as substantiated by contractual terms and our significant PCS renewal experience, from our existing worldwide base. Our multiple element sales arrangements generally include irrevocable rights for the customer to renew PCS after the bundled term ends. The customer is not subject to any economic or other penalty for failure to renew. Further, the renewal PCS options are for services comparable to the bundled PCS and cover similar terms.
It is our experience that customers generally exercise their renewal PCS option. In the renewal transaction, PCS is sold on a stand-alone basis to the licensees one year or more after the original multiple element sales arrangement. The exercised renewal PCS price is consistent with the renewal price in the original multiple element sales arrangement, although an adjustment to reflect consumer price changes is common.
If VSOE of fair value does not exist for all undelivered elements, all revenues are deferred until sufficient evidence exists or all elements have been delivered.
We assess whether payment terms are customary or extended in accordance with normal practice relative to the market in which the sale is occurring. Our sales arrangements generally include standard payment terms. These terms effectively relate to all customers, products, and arrangements regardless of customer type, product mix or arrangement size. Exceptions are only made to these standard terms for certain sales in parts of the world where local practice differs. In these jurisdictions, our customary payment terms are in line with local practice.
Cloud services and subscriptions
revenues
Cloud services and subscription revenues consist of (i) software as a service offerings (ii) managed service arrangements and (iii) subscription revenues relating to on premise offerings. The customer contracts for each of these three offerings are long term contracts (greater than twelve months) and are based on the customer’s usage over the contract period. The revenue associated with such contracts is recognized once usage has been measured, the fee fixed and determinable and collection is probable.
In certain managed services arrangements, we sell transaction processing along with implementation and start-up services. The implementation and start-up services do not have stand-alone value and, therefore, they do not qualify as separate units of accounting and are not separated. We believe these services do not have stand-alone value as the customer only receives value from these services in conjunction with the use of the related transaction processing service, we do not sell such services separately, and the output of such services cannot be re-sold by the customer. Revenues related to implementation and start-up services are recognized over the longer of the contract term or the estimated customer life. In some arrangements, we also sell professional services which do have stand-alone value and can be separated from other elements in the arrangement. The revenue related to these services is recognized as the service is performed. In some arrangements, we also sell professional services as a separate single element arrangement. The revenue related to these services is recognized as the service is performed.
We defer all direct and relevant costs associated with implementation of long-term customer contracts to the extent such costs can be recovered through guaranteed contract revenues.
118
Service revenues
Service revenues consist of revenues from consulting, implementation, training and integration services. These services are set forth separately in the contractual arrangements such that the total price of the customer arrangement is expected to vary as a result of the inclusion or exclusion of these services. For those contracts where the services are not essential to the functionality of any other element of the transaction, we determine VSOE of fair value for these services based upon normal pricing and discounting practices for these services when sold separately. These consulting and implementation services contracts are primarily time and materials based contracts that are, on average, less than six months in length. Revenues from these services are recognized at the time such services are performed.
We also enter into contracts that are primarily fixed fee arrangements wherein the services are not essential to the functionality of a software element. In such cases, the proportional performance method is applied to recognize revenues.
Revenues from training and integration services are recognized in the period in which these services are performed.
Customer support revenues
Customer support revenues consist of revenues derived from contracts to provide PCS to license holders. These revenues are recognized ratably over the term of the contract. Advance billings of PCS are not recorded to the extent that the term of the PCS has not commenced and payment has not been received.
Deferred revenues
Deferred revenues primarily relate to support agreements which have been paid for by customers prior to the performance of those services. Generally, the services will be provided in the twelve months after the signing of the agreement.
Long-term sales contracts
We entered into certain long-term sales contracts involving the sale of integrated solutions that include the modification and customization of software and the provision of services that are essential to the functionality of the other elements in this arrangement. As prescribed by ASC Topic 985-605, we recognize revenues from such arrangements in accordance with the contract accounting guidelines in ASC Topic 605-35, “Construction-Type and Production-Type Contracts” (Topic 605-35), after evaluating for separation of any non-Topic 605-35 elements in accordance with the provisions of ASC Topic 605-25, “Multiple-Element Arrangements” (Topic 605-25).
When circumstances exist that allow us to make reasonably dependable estimates of contract revenues, contract costs and the progress of the contract to completion, we account for sales under such long-term contracts using the percentage-of-completion (POC) method of accounting. Under the POC method, progress towards completion of the contract is measured based upon either input measures or output measures. We measure progress towards completion based upon an input measure and calculate this as the proportion of the actual hours incurred compared to the total estimated hours. For training and integration services rendered under such contracts, revenues are recognized as the services are rendered. We will review, on a quarterly basis, the total estimated remaining costs to completion for each of these contracts and apply the impact of any changes on the POC prospectively. If at any time we anticipate that the estimated remaining costs to completion will exceed the value of the contract, the resulting loss will be recognized immediately.
When circumstances exist that prevent us from making reasonably dependable estimates of contract revenues, we account for sales under such long-term contracts using the completed contract method.
Sales to resellers and channel partners
We execute certain sales contracts through resellers and distributors (collectively, resellers) and also large, well-capitalized partners such as SAP AG and Accenture Inc. (collectively, channel partners).
We recognize revenues relating to sales through resellers and channel partners when all the recognition criteria have been met, in other words, persuasive evidence of an arrangement exists, delivery has occurred in the reporting period, the fee is fixed and determinable, and collectability is probable. In addition we assess the creditworthiness of each reseller and if the reseller is newly formed, undercapitalized or in financial difficulty any revenues expected to emanate from such resellers are deferred and recognized only when cash is received and all other revenue recognition criteria are met.
Rights of return and other incentives
We do not generally offer rights of return or any other incentives such as concessions, product rotation, or price protection and, therefore, do not provide for or make estimates of rights of return and similar incentives.
119
Research and development costs
Research and development costs internally incurred in creating computer software to be sold, licensed or otherwise marketed are expensed as incurred unless they meet the criteria for deferral and amortization, as described in ASC Topic 985-20, “Costs of Software to be Sold, Leased, or Marketed” (Topic 985-20). In accordance with Topic 985-20, costs related to research, design and development of products are charged to expenses as incurred and capitalized between the dates that the product is considered to be technologically feasible and is considered to be ready for general release to customers. In our historical experience, the dates relating to the achievement of technological feasibility and general release of the product have substantially coincided. In addition, no significant costs are incurred subsequent to the establishment of technological feasibility. As a result, we do not capitalize any research and development costs relating to internally developed software to be sold, licensed or otherwise marketed.
Income taxes
We account for income taxes in accordance with ASC Topic 740, “Income Taxes” (Topic 740). Deferred tax assets and liabilities arise from temporary differences between the tax bases of assets and liabilities and their reported amounts in the Consolidated Financial Statements that will result in taxable or deductible amounts in future years. These temporary differences are measured using enacted tax rates. A valuation allowance is recorded to reduce deferred tax assets to the extent that we consider it is more likely than not that a deferred tax asset will not be realized. In determining the valuation allowance, we consider factors such as the reversal of deferred income tax liabilities, projected taxable income, and the character of income tax assets and tax planning strategies. A change to these factors could impact the estimated valuation allowance and income tax expense.
We account for our uncertain tax provisions by using a two-step approach to recognizing and measuring uncertain tax positions. The first step is to evaluate the tax position for recognition by determining if the weight of available evidence indicates it is more likely than not, based solely on the technical merits, that the position will be sustained on audit, including resolution of related appeals or litigation processes, if any. The second step is to measure the appropriate amount of the benefit to recognize. The amount of benefit to recognize is measured as the maximum amount which is more likely than not to be realized. The tax position is derecognized when it is no longer more likely than not that the position will be sustained on audit. On subsequent recognition and measurement the maximum amount which is more likely than not to be recognized at each reporting date will represent the Company's best estimate, given the information available at the reporting date, although the outcome of the tax position is not absolute or final. We recognize both accrued interest and penalties related to liabilities for income taxes within the "Provision for Income Taxes" line of our Consolidated Statements of Income (see note 14 for more details).
Fair value of financial instruments
Carrying amounts of certain financial instruments, including cash and cash equivalents, accounts receivable and accounts payable (trade and accrued liabilities) approximate their fair value due to the relatively short period of time between origination of the instruments and their expected realization.
The fair value of our total long-term debt approximates its carrying value.
We apply the provisions of ASC 820, “Fair Value Measurements and Disclosures”, to our derivative financial instruments that we are required to carry at fair value pursuant to other accounting standards (see note 15 for more details).
Foreign currency
Our Consolidated Financial Statements are presented in U.S. dollars. In general, the functional currency of our subsidiaries is the local currency. For each subsidiary, assets and liabilities denominated in foreign currencies are translated into U.S dollars at the exchange rates in effect at the balance sheet dates and revenues and expenses are translated at the average exchange rates prevailing during the month of the transaction. The effect of foreign currency translation adjustments not affecting net income are included in Shareholders' equity under the “Cumulative translation adjustment” account as a component of “Accumulated other comprehensive income”. Transactional foreign currency gains (losses) included in the Consolidated Statements of Income under the line item “Other income (expense) net” for Fiscal 2015, Fiscal 2014 and Fiscal 2013 were
$(31.0) million
,
$4.0 million
and
$(2.6) million
, respectively.
Restructuring charges
We record restructuring charges relating to contractual lease obligations and other exit costs in accordance with ASC Topic 420, “Exit or Disposal Cost Obligations” (Topic 420). Topic 420 requires that a liability for a cost associated with an exit or disposal activity be recognized and measured initially at its fair value in the period in which the liability is incurred. In order to incur a liability pursuant to Topic 420, our management must have established and approved a plan of restructuring in
120
sufficient detail. A liability for a cost associated with involuntary termination benefits is recorded when benefits have been communicated and a liability for a cost to terminate an operating lease or other contract is incurred, when the contract has been terminated in accordance with the contract terms or we have ceased using the right conveyed by the contract, such as vacating a leased facility.
The recognition of restructuring charges requires us to make certain judgments regarding the nature, timing and amount associated with the planned restructuring activities, including estimating sub-lease income and the net recoverable amount of equipment to be disposed of. At the end of each reporting period, we evaluate the appropriateness of the remaining accrued balances (see note 17 for more details).
Litigation
We are currently involved in various claims and legal proceedings. Quarterly, we review the status of each significant legal matter and evaluate such matters to determine how they should be treated for accounting and disclosure purposes in accordance with the requirements of ASC Topic 450-20 "Loss Contingencies" (Topic 450-20). Specifically, this evaluation process includes the centralized tracking and itemization of the status of all our disputes and litigation items, discussing the nature of any litigation and claim, including any dispute or claim that is reasonably likely to result in litigation, with relevant internal and external counsel, and assessing the progress of each matter in light of its merits and our experience with similar proceedings under similar circumstances.
If the potential loss from any claim or legal proceeding is considered probable and the amount can be reasonably estimated, we accrue a liability for the estimated loss in accordance with Topic 450-20. As of the date of this filing on Form 10-K for the year ended June 30, 2015, we do not believe that the outcomes of any of these matters, individually or in the aggregate, will result in losses that are materially in excess of amounts already recognized (see note 13 for more details).
Net income per share
Basic net income per share is computed using the weighted average number of Common Shares outstanding including contingently issuable shares where the contingency has been resolved. Diluted net income per share is computed using the weighted average number of Common Shares and stock equivalents outstanding using the treasury stock method during the year (see note 21 for more details).
Share-based payment
We measure share-based compensation costs, in accordance with ASC Topic 718, “Compensation - Stock Compensation” (Topic 718) on the grant date, based on the calculated fair value of the award. We have elected to treat awards with graded vesting as a single award when estimating fair value. Compensation cost is recognized on a straight-line basis over the employee requisite service period, which in our circumstances is the stated vesting period of the award, provided that total compensation cost recognized at least equals the pro rata value of the award that has vested. Compensation cost is initially based on the estimated number of options for which the requisite service is expected to be rendered. This estimate is adjusted in the period once actual forfeitures are known (see note 12 for more details).
Accounting for Pensions, post-retirement and post-employment benefits
Pension expense is accounted for in accordance with ASC Topic 715, “Compensation-Retirement Benefits” (Topic 715). Pension expense consists of: actuarially computed costs of pension benefits in respect of the current year of service, imputed returns on plan assets (for funded plans) and imputed interest on pension obligations. The expected costs of post retirement benefits, other than pensions, are accrued in the Consolidated Financial Statements based upon actuarial methods and assumptions. The over-funded or under-funded status of defined benefit pension and other post retirement plans are recognized as an asset or a liability (with the offset to “Accumulated Other Comprehensive Income” within “Shareholders' equity”), respectively, on the Consolidated Balance Sheets (see note 11 for more details).
Recent Accounting Pronouncements
Presentation of Debt Issuance Costs
In April 2015, the FASB issued ASU No. 2015-03 "Simplifying the Presentation of Debt Issuance Costs" (ASU 2015-03). This update amended the ASC Subtopic 835-30, "Interest - Imputation of Interest" to simplify the presentation of debt issuance costs by requiring that debt issuance costs related to a recognized debt liability be presented in the balance sheet as a direct deduction from the carrying amount of that debt liability, consistent with debt discounts. The recognition and measurement guidance for debt issuance costs are not affected by the amendments in this update. ASU 2015-03 is effective for our fiscal year ending June 30, 2017, with early adoption permitted. The adoption of ASU 2015-03 is not expected to have a material impact
121
on our
Consolidated Financial Statements
.
Revenue Recognition
I
n May 2014, the FASB issued ASU No. 2014-09, “Revenue from Contracts with Customers: Topic 606” (ASU 2014-09). This update supersedes the revenue recognition requirements in ASC Topic 605, "Revenue Recognition" and nearly all other existing revenue recognition guidance under U.S. GAAP. The core principal of ASU 2014-09 is to recognize revenues when promised goods or services are transferred to customers in an amount that reflects the consideration that is expected to be received for those goods or services. ASU 2014-09 identifies five steps to be followed to achieve this core principal, which includes (i) identifying contract(s) with customers, (ii) identifying performance obligations in the contract(s), (iii) determining the transaction price, (iv) allocating the transaction price to the performance obligations in the contract(s) and (v) recognizing revenue when (or as) the entity satisfies a performance obligation. On April 1, 2015 the FASB voted to defer the effective date of ASU 2014-09 for one year. If finalized, as proposed, the new guidance will be effective for us in the first quarter of our fiscal year ending June 30, 2019. Early adoption, prior to the original effective date, is not permitted. When applying ASU 2014-09 we can either apply the amendments: (i) retrospectively to each prior reporting period presented with the option to elect certain practical expedients as defined within ASU 2014-09 or (ii) retrospectively with the cumulative effect of initially applying ASU 2014-09 recognized at the date of initial application and providing certain additional disclosures as defined within ASU 2014-09. We are currently evaluating the impact of the pending adoption of ASU 2014-09 on our
Consolidated Financial Statements
.
|
Balance as of June 30, 2012
|
$
|
5,655
|
|
|
Bad debt expense
|
2,431
|
|
|
|
Write-off /adjustments
|
(3,215
|
)
|
|
|
Balance as of June 30, 2013
|
4,871
|
|
|
|
Bad debt expense
|
3,081
|
|
|
|
Write-off /adjustments
|
(3,225
|
)
|
|
|
Balance as of June 30, 2014
|
4,727
|
|
|
|
Bad debt expense
|
5,346
|
|
|
|
Write-off /adjustments
|
(4,086
|
)
|
|
|
Balance as of June 30, 2015
|
$
|
5,987
|
|
Included in accounts receivable are unbilled receivables in the amount of
$26.7 million
as of
June 30, 2015
(
June 30, 2014
—
$41.7 million
).
|
|
As of June 30, 2015
|
||||||||||
|
|
Cost
|
Accumulated
Depreciation
|
Net
|
||||||||
|
Furniture and fixtures
|
$
|
17,571
|
|
$
|
(11,334
|
)
|
$
|
6,237
|
|
||
|
Office equipment
|
1,532
|
|
(879
|
)
|
653
|
|
|||||
|
Computer hardware
|
110,076
|
|
(72,479
|
)
|
37,597
|
|
|||||
|
Computer software
|
37,981
|
|
(17,525
|
)
|
20,456
|
|
|||||
|
Capitalized software development costs
|
38,576
|
|
(7,353
|
)
|
31,223
|
|
|||||
|
Leasehold improvements
|
53,391
|
|
(29,458
|
)
|
23,933
|
|
|||||
|
Land and buildings
|
47,525
|
|
(7,205
|
)
|
40,320
|
|
|||||
|
Total
|
$
|
306,652
|
|
$
|
(146,233
|
)
|
$
|
160,419
|
|
||
122
|
|
As of June 30, 2014
|
||||||||||
|
|
Cost
|
Accumulated
Depreciation
|
Net
|
||||||||
|
Furniture and fixtures
|
$
|
16,089
|
|
$
|
(8,856
|
)
|
$
|
7,233
|
|
||
|
Office equipment
|
1,573
|
|
(869
|
)
|
704
|
|
|||||
|
Computer hardware
|
90,469
|
|
(55,433
|
)
|
35,036
|
|
|||||
|
Computer software
|
28,556
|
|
(10,656
|
)
|
17,900
|
|
|||||
|
Capitalized software development costs
|
19,965
|
|
(1,542
|
)
|
18,423
|
|
|||||
|
Leasehold improvements
|
45,934
|
|
(24,251
|
)
|
21,683
|
|
|||||
|
Land and buildings
|
47,149
|
|
(5,867
|
)
|
41,282
|
|
|||||
|
Total
|
$
|
249,735
|
|
$
|
(107,474
|
)
|
$
|
142,261
|
|
||
Goodwill is recorded when the consideration paid for an acquisition of a business exceeds the fair value of identifiable net tangible and intangible assets. The following table summarizes the changes in goodwill since June 30, 2013:
|
Balance as of June 30, 2013
|
$
|
1,246,872
|
|
|
Acquisition of Cordys Holding BV (note 18)
|
18,589
|
|
|
|
Acquisition of GXS Group, Inc. (note 18)
|
672,765
|
|
|
|
Adjustments relating to prior acquisitions
|
1,856
|
|
|
|
Balance as of June 30, 2014
|
$
|
1,940,082
|
|
|
Acquisition of Informative Graphics Corporation (note 18)
|
23,936
|
|
|
|
Acquisition of Actuate Corporation (note 18)
|
197,352
|
|
|
|
Adjustments relating to prior acquisitions
|
222
|
|
|
|
Balance as of June 30, 2015
|
$
|
2,161,592
|
|
|
As of June 30, 2015
|
|||||||||||
|
Cost
|
Accumulated Amortization
|
Net
|
|||||||||
|
Technology Assets
|
$
|
428,724
|
|
$
|
(210,862
|
)
|
$
|
217,862
|
|
||
|
Customer Assets
|
716,525
|
|
(254,908
|
)
|
461,617
|
|
|||||
|
Total
|
$
|
1,145,249
|
|
$
|
(465,770
|
)
|
$
|
679,479
|
|
||
|
As of June 30, 2014
|
|||||||||||
|
Cost
|
Accumulated Amortization
|
Net
|
|||||||||
|
Technology Assets
|
$
|
369,376
|
|
$
|
(143,213
|
)
|
$
|
226,163
|
|
||
|
Customer Assets
|
668,825
|
|
(169,670
|
)
|
499,155
|
|
|||||
|
Total
|
$
|
1,038,201
|
|
$
|
(312,883
|
)
|
$
|
725,318
|
|
||
The above balances for Fiscal 2015 have been adjusted to reflect the impact of intangible assets relating to acquisitions where the gross cost has been fully amortized. The impact of this resulted in a reduction of
$13.4 million
related to Technology Assets and
$23.0 million
related to Customer Assets.
The above balances for Fiscal 2014 have been adjusted to reflect the impact of intangible assets relating to acquisitions where the gross cost has been fully amortized. The impact of this resulted in a reduction of
$329.8 million
related to Technology Assets and
$205.4 million
related to Customer Assets.
The weighted average amortization periods for acquired technology and customer intangible assets are approximately
five
years and
six
years, respectively.
123
The following table shows the estimated future amortization expense for the fiscal years indicated below. This calculation assumes no future adjustments to acquired intangible assets:
|
|
Fiscal years ending
June 30,
|
||
|
2016
|
$
|
181,453
|
|
|
2017
|
164,266
|
|
|
|
2018
|
151,573
|
|
|
|
2019
|
124,404
|
|
|
|
2020 and beyond
|
57,783
|
|
|
|
Total
|
$
|
679,479
|
|
|
As of June 30, 2015
|
As of June 30, 2014
|
||||||
|
Debt issuance costs
|
$
|
30,630
|
|
$
|
19,834
|
|
|
|
Deposits and restricted cash
|
12,137
|
|
14,251
|
|
|||
|
Deferred implementation costs
|
13,736
|
|
5,409
|
|
|||
|
Cost basis investments
|
11,386
|
|
7,276
|
|
|||
|
Marketable securities
|
9,108
|
|
—
|
|
|||
|
Long-term prepaid expenses and other long-term assets
|
8,579
|
|
5,271
|
|
|||
|
Total
|
$
|
85,576
|
|
$
|
52,041
|
|
|
Debt issuance costs relate primarily to costs incurred for the purpose of obtaining our credit facilities and the Senior Notes (as defined in note 10 below), and are being amortized over the respective terms of the Credit Agreement and the Indenture. During the year ended
June 30, 2015
we wrote off
$2.9 million
of unamortized debt issuance costs associated with the repayment of Term Loan A (see note 10).
Deposits and restricted cash relate to security deposits provided to landlords in accordance with facility lease agreements and cash restricted per the terms of contractual-based agreements.
Deferred implementation costs relate to deferred direct and relevant costs on implementation of long-term contracts, to the extent such costs can be recovered through guaranteed contract revenues.
Marketable securities are classified as available for sale securities and are recorded on our
Consolidated Balance Sheets
at fair value with unrealized gains or losses reported as a separate component of Accumulated Other Comprehensive Income.
Cost basis investments relate to investments for which the Company holds less than a
20%
interest, is a limited partner and does not exert significant influence over operational or investment decisions.
Long-term prepaid expenses and other long-term assets primarily relate to advance payments on long-term licenses that are being amortized over the applicable terms of the licenses.
Deferred charges and credits relate to cash taxes payable and the elimination of deferred tax balances relating to legal entity consolidations completed as part of internal reorganizations of our international subsidiaries. Deferred charges and credits are amortized to income tax expense over a period of
6
to
15
years.
Current liabilities
Accounts payable and accrued liabilities are comprised of the following:
124
|
As of June 30, 2015
|
As of June 30, 2014
|
||||||
|
Accounts payable—trade
|
$
|
15,558
|
|
$
|
16,025
|
|
|
|
Accrued salaries and commissions
|
83,888
|
|
80,991
|
|
|||
|
Accrued liabilities
|
107,870
|
|
121,558
|
|
|||
|
Accrued interest on Senior Notes
|
20,625
|
|
—
|
|
|||
|
Amounts payable in respect of restructuring and other Special charges (note 17)
|
12,065
|
|
11,694
|
|
|||
|
Asset retirement obligations
|
1,364
|
|
1,686
|
|
|||
|
Total
|
$
|
241,370
|
|
$
|
231,954
|
|
|
Long-term accrued liabilities
|
As of June 30, 2015
|
As of June 30, 2014
|
||||||
|
Amounts payable in respect of restructuring and other Special charges (note 17)
|
$
|
2,034
|
|
$
|
4,531
|
|
|
|
Other accrued liabilities*
|
24,826
|
|
29,331
|
|
|||
|
Asset retirement obligations
|
7,822
|
|
8,137
|
|
|||
|
Total
|
$
|
34,682
|
|
$
|
41,999
|
|
|
* Other accrued liabilities consist primarily of tenant allowances, deferred rent and lease fair value adjustments relating to certain facilities acquired through business acquisitions.
Asset retirement obligations
We are required to return certain of our leased facilities to their original state at the conclusion of our lease. We have accounted for such obligations in accordance with ASC Topic 410 “Asset Retirement and Environmental Obligations” (Topic 410). As of
June 30, 2015
, the present value of this obligation was
$9.2 million
(
June 30, 2014
—
$9.8 million
), with an undiscounted value of
$9.8 million
(
June 30, 2014
—
$10.4 million
).
Long-term debt
Long-term debt is comprised of the following:
|
As of June 30, 2015
|
As of June 30, 2014
|
||||||
|
Total debt
|
|||||||
|
Senior Notes
|
$
|
800,000
|
|
$
|
—
|
|
|
|
Term Loan A
|
—
|
|
513,750
|
|
|||
|
Term Loan B
|
788,000
|
|
796,000
|
|
|||
|
Mortgage
|
—
|
|
9,582
|
|
|||
|
1,588,000
|
|
1,319,332
|
|
||||
|
Less:
|
|||||||
|
Current portion of long-term debt
|
|||||||
|
Term Loan A
|
—
|
|
45,000
|
|
|||
|
Term Loan B
|
8,000
|
|
8,000
|
|
|||
|
Mortgage
|
—
|
|
9,582
|
|
|||
|
8,000
|
|
62,582
|
|
||||
|
Non-current portion of long-term debt
|
$
|
1,580,000
|
|
$
|
1,256,750
|
|
|
125
Senior Unsecured Fixed Rate Notes
On January 15, 2015, we issued
$800 million
in aggregate principal amount of our 5.625% Senior Notes due 2023 (Senior Notes) in a private placement to qualified institutional buyers pursuant to Rule 144A under the Securities Act of 1933, as amended (Securities Act), and to certain persons in offshore transactions pursuant to Regulation S under the Securities Act. Senior Notes bear interest at a rate of
5.625%
per annum, payable semi-annually in arrears on January 15 and July 15, commencing on July 15, 2015. Senior Notes will mature on January 15, 2023, unless earlier redeemed, in accordance with their terms, or repurchased.
For the
year ended
June 30, 2015
, we recorded interest expense of
$20.6 million
relating to Senior Notes.
Term Loan A and Revolver
Prior to January 15, 2015, one of our credit facilities consisted of a
$600 million
term loan facility (Term Loan A) and a
$300 million
committed revolving credit facility (the Revolver and, together with Term Loan A, defined as the 2011 Credit Agreement).
On January 15, 2015, concurrently with the closing of the offering of Senior Notes, we used a portion of the net proceeds from the offering of Senior Notes to repay in full, the outstanding balance of Term Loan A.
Term Loan A had a
five
year term and repayments made under Term Loan A were equal to
1.25%
of the original principal amount at each quarter for the first 2 years, approximately
1.88%
for years 3 and 4 and
2.5%
for year 5. Term Loan A bore interest at a floating rate of LIBOR plus a fixed amount, depending on our consolidated leverage ratio. Prior to the repayment of Term Loan A, the fixed amount was
2.5%
.
For the
year ended
June 30, 2015
, we recorded interest expense of
$7.7 million
relating to Term Loan A (
June 30, 2014
—
$13.7 million
, June 30, 2013—
$15.5 million
).
On January 15, 2015, concurrently with the closing of the offering of the Senior Notes and effective upon the repayment in full of Term Loan A with a portion of the net proceeds of the offering, the 2011 Credit Agreement was amended and restated as described in the second amendment to the 2011 Credit Agreement to, among other things, remove the provisions related to Term Loan A and modify certain provisions related to the incurrence of debt and liens and the making of acquisitions, investments and restricted payments, replace the covenants to maintain a “consolidated leverage” ratio of no more than
3
:1 and a “consolidated interest coverage” ratio of
3
:1 or more with a covenant to maintain a “consolidated net leverage” ratio of no more than
4
:1, and make other changes, in each case, generally to conform with Term Loan B, as further described below.
Borrowings under the Revolver are secured by a first charge over substantially all of our assets, and as of January 16, 2014, on a pari passu basis with Term Loan B (as defined below). As part of the second amendment to the 2011 Credit Agreement, the commitments available under the Revolver was increased to
$300 million
from
$100 million
. The Revolver will mature on December 22, 2019 with no fixed repayment date prior to the end of the term. As of
June 30, 2015
, we have not drawn any amounts on the Revolver.
Term Loan B
In connection with the acquisition of GXS Group, Inc. (GXS), on January 16, 2014, we entered into a credit facility, which provides for a
$800 million
term loan facility (Term Loan B).
Borrowings under Term Loan B are secured by a first charge over substantially all of our assets on a pari passu basis with the Revolver. We entered into Term Loan B and borrowed the full amount on January 16, 2014.
Term Loan B has a
seven
year term and repayments made under Term Loan B are equal to
0.25%
of the original principal amount in equal quarterly installments for the life of Term Loan B, with the remainder due at maturity. Borrowings under Term Loan B currently bear a floating rate of interest at a rate per annum equal to
2.5%
plus the higher of LIBOR or
0.75%
.
For the
year ended
June 30, 2015
, we recorded interest expense of
$26.1 million
relating to Term Loan B (
June 30, 2014
—
$11.9 million
).
Mortgage
During the fourth quarter of Fiscal 2015, we repaid in full the outstanding balance of our mortgage of
$7.8 million
. The original principal amount of the mortgage was Canadian
$15.0 million
and interest accrued monthly at a variable rate of Canadian prime plus
0.50%
.
For the
year ended
June 30, 2015
, we recorded interest expense of approximately
$0.3 million
relating to the mortgage (
June 30, 2014
—
$0.3 million
, June 30, 2013—
$0.4 million
).
126
The following table provides details of our defined benefit pension plans and long-term employee benefit obligations for Open Text Document Technologies GmbH (CDT), GXS GmbH (
GXS GER
) and GXS Philippines, Inc. (
GXS PHP
) as of
June 30, 2015
and
June 30, 2014
:
|
As of June 30, 2015
|
|||||||||||
|
Total benefit
obligation
|
Current portion of
benefit obligation*
|
Non-current portion of
benefit obligation
|
|||||||||
|
CDT defined benefit plan
|
$
|
26,091
|
|
$
|
575
|
|
$
|
25,516
|
|
||
|
GXS Germany defined benefit plan
|
22,420
|
|
774
|
|
21,646
|
|
|||||
|
GXS Philippines defined benefit plan
|
7,025
|
|
26
|
|
6,999
|
|
|||||
|
Other plans
|
2,751
|
|
175
|
|
2,576
|
|
|||||
|
Total
|
$
|
58,287
|
|
$
|
1,550
|
|
$
|
56,737
|
|
||
|
As of June 30, 2014
|
|||||||||||
|
Total benefit
obligation
|
Current portion of
benefit obligation*
|
Non-current portion of
benefit obligation
|
|||||||||
|
CDT defined benefit plan
|
$
|
29,344
|
|
$
|
634
|
|
$
|
28,710
|
|
||
|
GXS Germany defined benefit plan
|
24,182
|
|
917
|
|
23,265
|
|
|||||
|
GXS Philippines defined benefit plan
|
5,276
|
|
—
|
|
5,276
|
|
|||||
|
Other plans
|
3,148
|
|
99
|
|
3,049
|
|
|||||
|
Total
|
$
|
61,950
|
|
$
|
1,650
|
|
$
|
60,300
|
|
||
|
*
|
The current portion of the benefit obligation has been included within "Accounts payable and accrued liabilities" in the
Consolidated Balance Sheets
.
|
Defined Benefit Plans
CDT Plan
CDT sponsors an unfunded defined benefit pension plan covering substantially all CDT employees (CDT pension plan) which provides for old age, disability and survivors’ benefits. Benefits under the CDT pension plan are generally based on age at retirement, years of service and the employee’s annual earnings. The net periodic cost of this pension plan is determined using the projected unit credit method and several actuarial assumptions, the most significant of which are the discount rate and estimated service costs. No contributions have been made since the inception of the plan. Actuarial gains or losses in excess of 10% of the projected benefit obligation are being amortized and recognized as a component of net periodic benefit costs over the average remaining service period of the plan's active employees. There is approximately
$0.4 million
in accumulated other comprehensive income related to the CDT pension plan that is expected to be recognized as a component of net periodic benefit costs over the next fiscal year.
GXS Germany Plan
As part of our acquisition of GXS, we acquired an unfunded defined benefit pension plan covering certain German employees which provides for old age, disability and survivors' benefits. The
GXS GER plan
has been closed to new participants since 2006. Benefits under the
GXS GER plan
are generally based on a participant’s remuneration, date of hire, years of eligible service and age at retirement. The net periodic cost of this pension plan is determined using the projected unit credit method and several actuarial assumptions, the most significant of which are the discount rate and estimated service costs. No contributions have been made since the inception of the plan. If actuarial gains or losses are in excess of 10% of the projected benefit obligation, such gains or losses will be amortized and recognized as a component of net periodic benefit costs over the average remaining service period of the plan’s active employees. All information presented below for the
GXS GER plan
is presented for the period indicated, starting on January 16, 2014, when such plan was assumed by us with the acquisition of GXS.
GXS Philippines Plan
As part of our acquisition of GXS, we acquired a primarily unfunded defined benefit pension plan covering substantially all of the GXS Philippines employees which provides for retirement, disability and survivors' benefits. Benefits under the
GXS
127
PHP plan
are generally based on a participant’s remuneration, years of eligible service and age at retirement. The net periodic cost of this pension plan is determined using the projected unit credit method and several actuarial assumptions, the most significant of which are the discount rate and estimated service costs. Aside from an initial contribution which had a fair value of approximately
$33.0 thousand
as of
June 30, 2015
, no additional contributions have been made since the inception of the plan. If actuarial gains or losses are in excess of 10% of the projected benefit obligation, such gains or losses will be amortized and recognized as a component of net periodic benefit costs over the average remaining service period of the plan’s active employees. All information presented below for the
GXS PHP plan
is presented for the period indicated, starting on January 16, 2014, when such plan was assumed by us with the acquisition of GXS.
The following are the details of the change in the benefit obligation for each of the above mentioned pension plans for the periods indicated:
|
As of June 30, 2015
|
As of June 30, 2014
|
||||||||||||||||||||||||||||||
|
CDT
|
GXS GER
|
GXS PHP
|
Total
|
CDT
|
GXS GER
|
GXS PHP
|
Total
|
||||||||||||||||||||||||
|
Benefit obligation—beginning of period
|
$
|
29,344
|
|
$
|
24,182
|
|
$
|
5,276
|
|
$
|
58,802
|
|
$
|
23,871
|
|
$
|
23,637
|
|
*
|
$
|
5,182
|
|
*
|
$
|
52,690
|
|
|||||
|
Service cost
|
452
|
|
360
|
|
1,518
|
|
2,330
|
|
458
|
|
173
|
|
724
|
|
1,355
|
|
|||||||||||||||
|
Interest cost
|
735
|
|
625
|
|
289
|
|
1,649
|
|
877
|
|
408
|
|
125
|
|
1,410
|
|
|||||||||||||||
|
Benefits paid
|
(495
|
)
|
(793
|
)
|
(78
|
)
|
(1,366
|
)
|
(522
|
)
|
(461
|
)
|
(66
|
)
|
(1,049
|
)
|
|||||||||||||||
|
Actuarial (gain) loss
|
1,676
|
|
2,701
|
|
201
|
|
4,578
|
|
3,595
|
|
452
|
|
(818
|
)
|
3,229
|
|
|||||||||||||||
|
Foreign exchange (gain) loss
|
(5,621
|
)
|
(4,655
|
)
|
(181
|
)
|
(10,457
|
)
|
1,065
|
|
(27
|
)
|
129
|
|
1,167
|
|
|||||||||||||||
|
Benefit obligation—end of period
|
26,091
|
|
22,420
|
|
7,025
|
|
55,536
|
|
29,344
|
|
24,182
|
|
5,276
|
|
58,802
|
|
|||||||||||||||
|
Less: Current portion
|
(575
|
)
|
(774
|
)
|
(26
|
)
|
(1,375
|
)
|
(634
|
)
|
(917
|
)
|
—
|
|
(1,551
|
)
|
|||||||||||||||
|
Non-current portion of benefit obligation
|
$
|
25,516
|
|
$
|
21,646
|
|
$
|
6,999
|
|
$
|
54,161
|
|
$
|
28,710
|
|
$
|
23,265
|
|
$
|
5,276
|
|
$
|
57,251
|
|
|||||||
* Beginning benefit obligation as of January 16, 2014.
The following are details of net pension expense relating to the following pension plans:
|
|
Year Ended June 30,
|
|||||||||||||||||||||||||||||||||||||||||||||||
|
|
2015
|
2014
|
2013
|
|||||||||||||||||||||||||||||||||||||||||||||
|
CDT
|
GXS GER
|
GXS PHP
|
Total
|
CDT
|
GXS GER
|
GXS PHP
|
Total
|
CDT
|
GXS GER
|
GXS PHP
|
Total
|
|||||||||||||||||||||||||||||||||||||
|
Pension expense:
|
||||||||||||||||||||||||||||||||||||||||||||||||
|
Service cost
|
$
|
452
|
|
$
|
360
|
|
$
|
1,518
|
|
$
|
2,330
|
|
$
|
458
|
|
$
|
173
|
|
$
|
724
|
|
$
|
1,355
|
|
$
|
457
|
|
$
|
—
|
|
$
|
—
|
|
$
|
457
|
|
||||||||||||
|
Interest cost
|
735
|
|
625
|
|
289
|
|
1,649
|
|
877
|
|
408
|
|
125
|
|
1,410
|
|
888
|
|
—
|
|
—
|
|
888
|
|
||||||||||||||||||||||||
|
Amortization of actuarial gains and losses
|
403
|
|
—
|
|
—
|
|
403
|
|
278
|
|
—
|
|
—
|
|
278
|
|
277
|
|
—
|
|
—
|
|
277
|
|
||||||||||||||||||||||||
|
Net pension expense
|
$
|
1,590
|
|
$
|
985
|
|
$
|
1,807
|
|
$
|
4,382
|
|
$
|
1,613
|
|
$
|
581
|
|
$
|
849
|
|
$
|
3,043
|
|
$
|
1,622
|
|
$
|
—
|
|
$
|
—
|
|
$
|
1,622
|
|
||||||||||||
128
In determining the fair value of the pension plan benefit obligations as of
June 30, 2015
and
June 30, 2014
, respectively, we used the following weighted-average key assumptions:
|
As of June 30, 2015
|
As of June 30, 2014
|
||||||||||
|
CDT
|
GXS GER
|
GXS PHP
|
CDT
|
GXS GER
|
GXS PHP
|
||||||
|
Assumptions:
|
|||||||||||
|
Salary increases
|
2.00%
|
2.00%
|
7.00%
|
2.50%
|
2.00%
|
7.00%
|
|||||
|
Pension increases
|
1.75%
|
2.00%
|
3.50%
|
2.00%
|
2.00%
|
6.00%
|
|||||
|
Discount rate
|
2.36%
|
2.54%
|
4.75%
|
2.90%
|
3.00%
|
5.15%
|
|||||
|
Normal retirement age
|
N/A
|
65-67
|
60
|
N/A
|
65-67
|
60
|
|||||
|
Employee fluctuation rate:
|
|||||||||||
|
to age 30
|
1.00%
|
N/A
|
N/A
|
1.00%
|
N/A
|
N/A
|
|||||
|
to age 35
|
0.50%
|
N/A
|
N/A
|
0.50%
|
N/A
|
N/A
|
|||||
|
to age 40
|
—%
|
N/A
|
N/A
|
—%
|
N/A
|
N/A
|
|||||
|
to age 45
|
0.50%
|
N/A
|
N/A
|
0.50%
|
N/A
|
N/A
|
|||||
|
to age 50
|
0.50%
|
N/A
|
N/A
|
0.50%
|
N/A
|
N/A
|
|||||
|
from age 51
|
1.00%
|
N/A
|
N/A
|
1.00%
|
N/A
|
N/A
|
|||||
Anticipated pension payments under the pension plans for the fiscal years indicated below are as follows:
|
|
Fiscal years ending June 30,
|
||||||||||
|
|
CDT
|
|
GXS GER
|
|
GXS PHP
|
||||||
|
2016
|
$
|
575
|
|
|
$
|
774
|
|
|
$
|
26
|
|
|
2017
|
629
|
|
|
788
|
|
|
35
|
|
|||
|
2018
|
672
|
|
|
877
|
|
|
43
|
|
|||
|
2019
|
754
|
|
|
937
|
|
|
105
|
|
|||
|
2020
|
821
|
|
|
989
|
|
|
69
|
|
|||
|
2021 to 2025
|
5,039
|
|
|
5,373
|
|
|
1,203
|
|
|||
|
Total
|
$
|
8,490
|
|
|
$
|
9,738
|
|
|
$
|
1,481
|
|
Other Plans
Other plans include defined benefit pension plans that are offered by certain of our foreign subsidiaries. Many of these plans were assumed through our acquisitions or are required by local regulatory requirements. These other plans are primarily unfunded, with the aggregate projected benefit obligation included in our pension liability. The net periodic cost of these plans are determined using the projected unit credit method and several actuarial assumptions, the most significant of which are the discount rate and estimated service costs.
Cash Dividends
For the
year ended
June 30, 2015
, pursuant to the Company’s dividend policy, we declared total non-cumulative dividends of
$0.7175
per Common Share, in the aggregate amount of
$87.6 million
, which we paid during the same period.
For the
year ended
June 30, 2014
, pursuant to the Company’s dividend policy, we paid total non-cumulative dividends of
$0.6225
per Common Share, in the aggregate amount of
$74.7 million
.
For the
year ended
June 30, 2013
, pursuant to the Company’s dividend policy, we paid total non-cumulative dividends of
$0.15
per Common Share, in the aggregate amount of
$17.7 million
.
Share Capital
Our authorized share capital includes an unlimited number of Common Shares and an unlimited number of Preference Shares. No Preference Shares have been issued.
129
Treasury Stock
Repurchase
During the
year ended
June 30, 2015
, we repurchased
240,222
of our Common Shares, in the amount of
$10.6 million
for potential reissuance under our Long Term Incentive Plans (LTIP) or otherwise. (June 30, 2014—repurchased
25,760
Common Shares for
$1.3 million
, June 30, 2013—
nil
).
Reissuance
During the
year ended
June 30, 2015
, we reissued
377,775
Common Shares, respectively, from treasury stock in connection with the settlement of awards granted under our LTIPs and other awards (
June 30, 2014
—
484,238
, June 30, 2013—
365,232
Common Shares). For more details on this, see "Long Term Incentive Plans" below.
Option Plans
A summary of stock options outstanding under our various stock option plans is set forth below. All numbers shown in the chart below have been adjusted, where applicable, to account for the two-for-one stock splits that occurred on October 22, 2003 and February 18, 2014.
|
|
1998 Stock
Option Plan |
2004 Stock
Option Plan |
|
Date of inception
|
Jun-98
|
Oct-04
|
|
Eligibility
|
Eligible employees and directors,
as determined by the Board of Directors |
Eligible employees and directors,
as determined by the Board of Directors |
|
Options granted to date
|
15,828,580
|
12,725,742
|
|
Options exercised to date
|
(10,694,360)
|
(5,710,107)
|
|
Options cancelled to date
|
(5,110,220)
|
(2,664,270)
|
|
Options outstanding
|
24,000
|
4,351,365
|
|
Termination grace periods
|
Immediately “for cause”;
90 days for any other reason; 180 days due to death |
Immediately “for cause”;
90 days for any other reason; 180 days due to death |
|
Vesting schedule
|
25% per year, unless other-
wise specified |
25% per year, unless other-
wise specified |
|
Exercise price range
|
$10.00 - $10.00
|
$13.85 - $57.29
|
|
Expiration dates
|
2/3/2016
|
11/5/2015 to
4/30/2022 |
The following table summarizes information regarding stock options outstanding at June 30, 2015:
|
|
Options Outstanding
|
Options Exercisable
|
|||||||||||||||||
|
Range of Exercise
Prices
|
Number of options
Outstanding as of June 30, 2015 |
Weighted
Average
Remaining
Contractual
Life (years)
|
Weighted
Average
Exercise
Price
|
Number of options
Exercisable as of June 30, 2015 |
Weighted
Average
Exercise
Price
|
||||||||||||||
|
$
|
10.00
|
|
-
|
$
|
26.22
|
|
560,550
|
|
2.59
|
$
|
22.57
|
|
449,300
|
|
$
|
21.83
|
|
||
|
26.37
|
|
-
|
29.64
|
|
256,773
|
|
4.41
|
27.88
|
|
90,979
|
|
28.01
|
|
||||||
|
30.18
|
|
-
|
30.18
|
|
665,123
|
|
3.60
|
30.18
|
|
345,123
|
|
30.18
|
|
||||||
|
31.76
|
|
-
|
49.04
|
|
440,079
|
|
4.50
|
37.65
|
|
144,832
|
|
38.40
|
|
||||||
|
50.08
|
|
-
|
50.08
|
|
1,123,000
|
|
5.46
|
50.08
|
|
279,250
|
|
50.08
|
|
||||||
|
51.16
|
|
-
|
55.65
|
|
1,166,010
|
|
6.50
|
53.88
|
|
—
|
|
—
|
|
||||||
|
57.29
|
|
-
|
57.29
|
|
163,830
|
|
6.19
|
57.29
|
|
—
|
|
—
|
|
||||||
|
$
|
10.00
|
|
$
|
57.29
|
|
4,375,365
|
|
4.96
|
$
|
42.26
|
|
1,309,484
|
|
$
|
32.32
|
|
|||
130
Share-Based Payments
Total share-based compensation expense for the periods indicated below is detailed as follows:
|
|
Year Ended June 30,
|
|||||||||||
|
|
2015
|
2014
|
2013
|
|||||||||
|
Stock options
|
$
|
12,193
|
|
$
|
7,883
|
|
$
|
5,751
|
|
|||
|
Performance Share Units (issued under LTIP)
|
2,287
|
|
4,643
|
|
6,998
|
|
||||||
|
Restricted Share Units (issued under LTIP)
|
4,574
|
|
2,062
|
|
1,283
|
|
||||||
|
Restricted Share Units (fully vested)
|
—
|
|
3,300
|
|
—
|
|
||||||
|
Restricted Share Units (other)
|
955
|
|
470
|
|
549
|
|
||||||
|
Deferred Share Units (directors)
|
2,038
|
|
1,548
|
|
985
|
|
||||||
|
Restricted stock units (legacy Vignette employees)
|
—
|
|
—
|
|
9
|
|
||||||
|
Total share-based compensation expense
|
$
|
22,047
|
|
$
|
19,906
|
|
$
|
15,575
|
|
|||
Summary of Outstanding Stock Options
As of
June 30, 2015
, options to purchase an aggregate of
4,375,365
Common Shares were outstanding and
3,020,168
Common Shares were available for issuance under our stock option plans. Our stock options generally vest over
four years
and expire between
seven
and
ten years
from the date of the grant. Currently we also have options outstanding that vest over
five years
, as well as options outstanding that vest based on meeting certain market conditions. The exercise price of all our options is set at an amount that is not less than the closing price of our Common Shares on the NASDAQ on the trading day immediately preceding the applicable grant date.
A summary of activity under our stock option plans for
year ended
June 30, 2015
and 2014 is as follows:
|
Options
|
Weighted-
Average Exercise
Price
|
Weighted-
Average
Remaining
Contractual Term
(years)
|
Aggregate Intrinsic Value
($’000s)
|
|||||||||
|
Outstanding at June 30, 2014
|
4,273,226
|
|
$
|
36.35
|
|
|||||||
|
Granted
|
1,368,410
|
|
54.33
|
|
||||||||
|
Exercised
|
(476,103
|
)
|
25.54
|
|
||||||||
|
Forfeited or expired
|
(790,168
|
)
|
41.25
|
|
||||||||
|
Outstanding at June 30, 2015
|
4,375,365
|
|
$
|
42.26
|
|
4.96
|
$
|
22,153
|
|
|||
|
Exercisable at June 30, 2015
|
1,309,484
|
|
$
|
32.32
|
|
3.48
|
$
|
13,635
|
|
|||
|
Options
|
Weighted-
Average Exercise
Price
|
Weighted-
Average
Remaining
Contractual Term
(years)
|
Aggregate Intrinsic Value
($’000s)
|
|||||||||
|
Outstanding at June 30, 2013
|
3,610,782
|
|
$
|
24.72
|
|
|||||||
|
Granted
|
2,206,442
|
|
46.52
|
|
||||||||
|
Exercised
|
(1,043,646
|
)
|
21.29
|
|
||||||||
|
Forfeited or expired
|
(500,352
|
)
|
28.72
|
|
||||||||
|
Outstanding at June 30, 2014
|
4,273,226
|
|
$
|
36.35
|
|
5.33
|
$
|
52,698
|
|
|||
|
Exercisable at June 30, 2014
|
912,375
|
|
$
|
23.14
|
|
3.47
|
$
|
22,624
|
|
|||
131
We estimate the fair value of stock options using the Black-Scholes option-pricing model or, where appropriate, the Monte Carlo Valuation Method, consistent with the provisions of ASC Topic 718, "Compensation—Stock Compensation" (Topic 718) and SEC Staff Accounting Bulletin No. 107. The option-pricing models require input of subjective assumptions, including the estimated life of the option and the expected volatility of the underlying stock over the estimated life of the option. We use historical volatility as a basis for projecting the expected volatility of the underlying stock and estimate the expected life of our stock options based upon historical data.
We believe that the valuation techniques and the approach utilized to develop the underlying assumptions are appropriate in calculating the fair value of our stock option grants. Estimates of fair value are not intended, however, to predict actual future events or the value ultimately realized by employees who receive equity awards.
For the periods indicated, the weighted-average fair value of options and weighted-average assumptions were as follows:
|
|
Year Ended June 30,
|
|||||||||||
|
|
2015
|
2014
|
2013
|
|||||||||
|
Weighted–average fair value of options granted
|
$
|
13.46
|
|
$
|
11.55
|
|
$
|
8.39
|
|
|||
|
Weighted-average assumptions used:
|
||||||||||||
|
Expected volatility
|
32
|
%
|
32
|
%
|
37
|
%
|
||||||
|
Risk–free interest rate
|
1.41
|
%
|
1.34
|
%
|
0.66
|
%
|
||||||
|
Expected dividend yield
|
1.23
|
%
|
1.32
|
%
|
0.31
|
%
|
||||||
|
Expected life (in years)
|
4.33
|
|
4.36
|
|
4.35
|
|
||||||
|
Forfeiture rate (based on historical rates)
|
5
|
%
|
5
|
%
|
5
|
%
|
||||||
|
Average exercise share price
|
$
|
54.33
|
|
$
|
46.52
|
|
$
|
28.15
|
|
|||
|
Derived service period (in years)*
|
2.07
|
|
N/A
|
|
N/A
|
|
||||||
*Options valued using Monte Carlo Valuation Method
As of
June 30, 2015
, the total compensation cost related to the unvested stock option awards not yet recognized was approximately
$34.5 million
, which will be recognized over a weighted-average period of approximately
2.5 years
.
No cash was used by us to settle equity instruments granted under share-based compensation arrangements.
We have not capitalized any share-based compensation costs as part of the cost of an asset in any of the periods presented.
For the
year ended
June 30, 2015
, cash in the amount of
$12.2 million
was received as the result of the exercise of options granted under share-based payment arrangements. The tax benefit realized by us during the
year ended
June 30, 2015
from the exercise of options eligible for a tax deduction was
$1.0 million
.
For the
year ended
June 30, 2014
, cash in the amount of
$22.2 million
was received as the result of the exercise of options granted under share-based payment arrangements. The tax benefit realized by us during the
year ended
June 30, 2014
from the exercise of options eligible for a tax deduction was
$1.8 million
.
For the
year ended
June 30, 2013
, cash in the amount of
$14.2 million
was received as the result of the exercise of options granted under share-based payment arrangements. The tax benefit realized by us during the
year ended
June 30, 2013
from the exercise of options eligible for a tax deduction was
$1.3 million
.
Long-Term Incentive Plans
We incentivize our executive officers, in part, with long term compensation pursuant to our LTIP. The LTIP is a rolling three year program that grants eligible employees a certain number of target Performance Share Units (PSUs) and/or Restricted Share Units (RSUs). Target PSUs become vested upon the satisfaction of certain financial and/or operational performance criteria (the Performance Conditions) that are determined at the time of the grant. Target RSUs become vested when an eligible employee remains employed throughout the vesting period. LTIP grants that have recently vested, or have yet to vest, are described below. LTIP grants will be referred to in this
Annual Report
on Form
10-K
based upon the year in which the grants are expected to vest.
Fiscal 2014 LTIP
Grants made in Fiscal 2012 under the LTIP (collectively referred to as Fiscal 2014 LTIP) took effect in Fiscal 2012 starting on February 3, 2012. Grants made under the Fiscal 2014 LTIP consisted of PSUs and the Performance Conditions for vesting relating to grants were based solely on market conditions. We met these performance conditions and settled Fiscal 2014
132
LTIP by issuing
355,553
Common Shares from our treasury stock in the three months ended December 31, 2014, with a cost of approximately
$8.5 million
.
Fiscal 2015 LTIP
Grants made in Fiscal 2013 under the LTIP (collectively referred to as Fiscal 2015 LTIP), took effect in Fiscal 2013 starting on November 2, 2012 for the RSUs and December 3, 2012 for the PSUs. The Performance Conditions for vesting of the PSUs are based solely upon market conditions. RSUs granted are employee service-based awards and vest over the life of the Fiscal 2015 LTIP. We expect to settle the Fiscal 2015 LTIP awards in stock.
Fiscal 2016 LTIP
Grants made in Fiscal 2014 under the LTIP (collectively referred to as Fiscal 2016 LTIP) consisting of PSUs and RSUs, took effect in Fiscal 2014 starting on November 1, 2013. The Performance Conditions for vesting of the PSUs are based solely upon market conditions. RSUs granted are employee service-based awards and vest over the life of the Fiscal 2016 LTIP. We expect to settle the Fiscal 2016 LTIP awards in stock.
Fiscal 2017 LTIP
Grants made in Fiscal 2015 under the LTIP (collectively referred to as Fiscal 2017 LTIP), consisting of PSUs and RSUs, took effect in Fiscal 2015 starting on September 4, 2014. The Performance Conditions for vesting of the PSUs are based solely upon market conditions. The RSUs are employee service-based awards and vest over the life of the Fiscal 2017 LTIP. We expect to settle the Fiscal 2017 LTIP awards in stock.
PSUs and RSUs granted under the LTIPs have been measured at fair value as of the effective date, consistent with Topic 718, and will be charged to share-based compensation expense over the remaining life of the plan. Stock options granted under the LTIPs have been measured using the Black-Scholes option-pricing model, consistent with Topic 718. We estimate the fair value of PSUs using the Monte Carlo pricing model and RSUs have been valued based upon their grant date fair value.
As of
June 30, 2015
, the total expected compensation cost related to the unvested LTIP awards not yet recognized was
$10.7 million
, which is expected to be recognized over a weighted average period of
1.8 years
.
Restricted Share Units (RSUs)
During the
year ended
June 30, 2015
, we granted
45,000
RSUs to certain employees in accordance with their employment agreements. The RSUs will vest equally over three years from the respective date of grants. We expect to settle the awards in stock.
Deferred Stock Units (DSUs)
During the
year ended
June 30, 2015
, we granted
38,052
DSUs to certain non-employee directors (
June 30, 2014
—
42,298
, June 30, 2013—
40,048
). The DSUs were issued under our Deferred Share Unit Plan. DSUs granted as compensation for directors fees vest immediately, whereas all other DSUs granted vest at our next annual general meeting following the granting of the DSUs. No DSUs are payable by us until the director ceases to be a member of the Board.
Employee Share Purchase Plan (ESPP)
During the
year ended
June 30, 2015
, cash in the amount of approximately
$3.1 million
, was received from employees that will be used to purchase Common Shares in future periods (
June 30, 2014
—
$2.6 million
, June 30, 2013—
$2.1 million
).
We have entered into the following contractual obligations with minimum payments for the indicated fiscal periods as follows:
|
|
Payments due between
|
||||||||||||||||||
|
|
Total
|
July 1, 2015—
June 30, 2016 |
July 1, 2016—
June 30, 2018 |
July 1, 2018—
June 30, 2020 |
July 1, 2020
and beyond |
||||||||||||||
|
Long-term debt obligations*
|
$
|
2,088,255
|
|
$
|
78,938
|
|
$
|
156,944
|
|
$
|
155,957
|
|
$
|
1,696,416
|
|
||||
|
Operating lease obligations**
|
200,984
|
|
47,642
|
|
69,155
|
|
44,253
|
|
39,934
|
|
|||||||||
|
Purchase obligations
|
15,457
|
|
9,707
|
|
5,505
|
|
245
|
|
—
|
|
|||||||||
|
$
|
2,304,696
|
|
$
|
136,287
|
|
$
|
231,604
|
|
$
|
200,455
|
|
$
|
1,736,350
|
|
|||||
133
*Long-term debt obligations include our Senior Notes issued on January 15, 2015. For more details relating to the Senior Notes and the repayments of our Term Loan A and our mortgage, see note 10.
**Net of
$2.8 million
of sublease income to be received from properties which we have subleased to third parties.
Guarantees and Indemnifications
We have entered into customer agreements which may include provisions to indemnify our customers against third party claims that our software products or services infringe certain third party intellectual property rights and for liabilities related to a breach of our confidentiality obligations. We have not made any material payments in relation to such indemnification provisions and have not accrued any liabilities related to these indemnification provisions in our
Consolidated Financial Statements
.
Litigation
We are currently involved in various claims and legal proceedings.
Quarterly, we review the status of each significant legal matter and evaluate such matters to determine how they should be treated for accounting and disclosure purposes in accordance with the requirements of ASC Topic 450-20 "Loss Contingencies" (Topic 450-20). Specifically, this evaluation process includes the centralized tracking and itemization of the status of all our disputes and litigation items, discussing the nature of any litigation and claim, including any dispute or claim that is reasonably likely to result in litigation, with relevant internal and external counsel, and assessing the progress of each matter in light of its merits and our experience with similar proceedings under similar circumstances.
If the potential loss from any claim or legal proceeding is considered probable and the amount can be reasonably estimated, we accrue a liability for the estimated loss in accordance with Topic 450-20. As of the date of this
Annual Report
on Form
10-K
, such aggregated losses were not material to our consolidated financial position or result of operations and we do not believe as of the date of this filing that it is reasonably possible that a loss exceeding the amounts already recognized will be incurred that would be material to our consolidated financial position or results of operations.
Contingencies
As we have previously disclosed, the IRS is examining certain of our tax returns for Fiscal 2010 through Fiscal 2012, and in connection with those examinations is reviewing our internal reorganization in Fiscal 2010 to consolidate certain intellectual property ownership in Luxembourg and Canada and our integration of certain acquisitions into the resulting structure. We also previously disclosed that the examinations may lead to proposed adjustments to our taxes that may be material, individually or in the aggregate, and that we have not recorded any material accruals for any such potential adjustments in our Consolidated Financial Statements.
As part of these examinations, on July 17, 2015 we received from the IRS a Notice of Proposed Adjustment (“NOPA”) in draft form proposing a one-time approximately
$280 million
increase to our U.S. federal taxes arising from the reorganization in Fiscal 2010 and proposing penalties equal to
20%
of the additional taxes, plus interest at the applicable statutory rate (which will continue to accrue until the matter is resolved and may be substantial). A NOPA is an IRS position and does not impose an obligation to pay tax. The draft NOPA may be changed before the final NOPA is issued, including because the IRS reserved the right in the draft NOPA to increase the adjustment. Based on our discussions with the IRS, we expect we will receive an additional NOPA proposing an approximately
$80 million
increase to our U.S. federal taxes for Fiscal 2012 arising from the integration of Global 360 into the structure that resulted from the reorganization, accompanied by proposed penalties and interest (although there can be no assurance that this will be the amount reflected in the NOPA when received). Depending upon the outcome of these matters, additional state income taxes plus penalties and interest may be due.
We strongly disagree with the IRS’ position and intend to vigorously contest the proposed adjustments to our taxable income. We are examining various alternatives available to taxpayers to contest the proposed adjustments. Any such alternatives could involve a lengthy process and result in the incurrence of significant expenses. As of the date of this Annual Report on Form 10-K, we have not recorded any material accruals in respect of these examinations in our Consolidated Financial Statements. An adverse outcome of these tax examinations could have a material adverse effect on our financial position and results of operations.
As part of our acquisition of GXS, we have inherited a tax dispute in Brazil between the Company’s subsidiary, GXS Tecnologia da Informação (Brasil) Ltda. (GXS Brazil), and the municipality of São Paulo, in connection with GXS Brazil’s judicial appeal of a tax claim in the amount of
$2.3 million
as of
June 30, 2015
. We currently have in place a bank guarantee in the amount of
$3.6 million
in recognition of this dispute. However, we believe that the position of the São Paulo tax authorities is not consistent with the relevant facts and based on information available on the case and other similar matters provided by local counsel, we believe that we can defend our position and that no tax is owed. Although we believe that the facts support
134
our position, the ultimate outcome of this matter could result in a loss of up to the claim amount discussed above, plus future interest or penalties that may accrue.
Historically, prior to our acquisition of GXS, GXS would charge certain costs to its subsidiaries, including GXS Brazil, primarily based on historical transfer pricing studies that were intended to reflect the costs incurred by subsidiaries in relation to services provided by the parent company to the subject subsidiary. GXS recorded taxes on amounts billed, that were considered to be due based on the intercompany charges. GXS subsequently re-evaluated its intercompany charges to GXS Brazil and related taxes and, upon taking into consideration the current environment and judicial proceedings in Brazil, concluded that it was probable that certain indirect taxes would be assessable and payable based upon the accrual of such intercompany charges and has approximately
$6.1 million
accrued for the probable amount of a settlement related to the indirect taxes, interest and penalties.
Our Indian subsidiary, GXS India Technology Centre Private Limited (GXS India), is subject to potential assessments by Indian tax authorities in the city of Bangalore. GXS India has received assessment orders from the Indian tax authorities alleging that the transfer price applied to intercompany transactions was not appropriate. Based on advice from our tax advisors, we believe that the facts that the Indian tax authorities are using to support their assessment are incorrect. We have filed appeals and anticipate an eventual settlement with the Indian tax authorities. We have accrued
$1.4 million
to cover our anticipated financial exposure in this matter.
Please also see "Risk Factors" elsewhere in this Annual Report on Form 10-K.
Our effective tax rate represents the net effect of the mix of income earned in various tax jurisdictions that are subject to a wide range of income tax rates.
The following is a geographical breakdown of income before the provision for income taxes:
|
Year Ended June 30,
|
|||||||||||
|
2015
|
2014
|
2013
|
|||||||||
|
Domestic income
|
$
|
(26,927
|
)
|
$
|
(11,623
|
)
|
$
|
(20,525
|
)
|
||
|
Foreign income
|
292,971
|
|
288,158
|
|
198,735
|
|
|||||
|
Income before income taxes
|
$
|
266,044
|
|
$
|
276,535
|
|
$
|
178,210
|
|
||
The provision for income taxes consisted of the following:
|
|
Year Ended June 30,
|
||||||||||
|
|
2015
|
2014
|
2013
|
||||||||
|
Current income taxes:
|
|
|
|
||||||||
|
Domestic
|
$
|
(839
|
)
|
$
|
1,424
|
|
$
|
747
|
|
||
|
Foreign
|
47,055
|
|
69,371
|
|
34,739
|
|
|||||
|
|
46,216
|
|
70,795
|
|
35,486
|
|
|||||
|
Deferred income taxes (recoveries):
|
|
|
|
|
|
|
|||||
|
Domestic
|
3,390
|
|
5,901
|
|
3,126
|
|
|||||
|
Foreign
|
(17,968
|
)
|
(18,235
|
)
|
(8,922
|
)
|
|||||
|
|
(14,578
|
)
|
(12,334
|
)
|
(5,796
|
)
|
|||||
|
Provision for income taxes
|
$
|
31,638
|
|
$
|
58,461
|
|
$
|
29,690
|
|
||
A reconciliation of the combined Canadian federal and provincial income tax rate with our effective income tax rate is as follows:
135
|
|
Year Ended June 30,
|
||||||||||
|
|
2015
|
2014
|
2013
|
||||||||
|
Expected statutory rate
|
26.5
|
%
|
26.5
|
%
|
26.5
|
%
|
|||||
|
Expected provision for income taxes
|
$
|
70,501
|
|
$
|
73,282
|
|
$
|
47,226
|
|
||
|
Effect of foreign tax rate differences
|
(57,017
|
)
|
(52,577
|
)
|
(27,026
|
)
|
|||||
|
Change in valuation allowance
|
6,617
|
|
3,281
|
|
2,082
|
|
|||||
|
Amortization of deferred charges
|
10,525
|
|
11,307
|
|
10,922
|
|
|||||
|
Effect of permanent differences
|
1,321
|
|
7,643
|
|
6,008
|
|
|||||
|
Effect of changes in unrecognized tax benefits
|
(1,800
|
)
|
13,214
|
|
(13,076
|
)
|
|||||
|
Effect of withholding taxes
|
3,045
|
|
2,234
|
|
2,847
|
|
|||||
|
Other items
|
(1,554
|
)
|
68
|
|
8,136
|
|
|||||
|
Impact of internal reorganization of subsidiaries and integration of acquisitions
|
—
|
|
9
|
|
(7,429
|
)
|
|||||
|
|
$
|
31,638
|
|
$
|
58,461
|
|
$
|
29,690
|
|
||
Substantially all the tax rate differential for international jurisdictions was driven by earnings in Luxembourg.
The effective GAAP tax rate (which is the provision for taxes expressed as a percentage of net income before taxes) decreased to
11.9%
for Fiscal 2015, from
21.1%
for Fiscal 2014. The net change is primarily due to a decrease in the net expense of unrecognized tax benefits with related interest and penalties in the amount of
$15.0 million
, a decrease of
$6.3 million
in expenses not deductible for tax purposes in Fiscal 2015 compared to Fiscal 2014 and lower net income, having an impact of
$7.2 million
. The remainder of the differences are due to normal course movements and non-material items.
We have approximately
$46.2 million
of domestic non-capital loss carryforwards. In addition, we have
$648.4 million
of foreign non-capital loss carryforwards of which
$66.8 million
have no expiry date. The remainder of the domestic and foreign losses expires between 2016 and 2035. In addition, investment tax credits of
$44.7 million
will expire between 2018 and 2035.
The primary components of the deferred tax assets and liabilities are as follows, for the periods indicated below:
136
|
|
June 30,
|
||||||
|
|
2015
|
2014
|
|||||
|
Deferred tax assets
|
|
|
|||||
|
Non-capital loss carryforwards
|
$
|
223,812
|
|
$
|
205,576
|
|
|
|
Capital loss carryforwards
|
3,470
|
|
3,452
|
|
|||
|
Undeducted scientific research and development expenses
|
80,804
|
|
76,743
|
|
|||
|
Depreciation and amortization
|
25,974
|
|
16,441
|
|
|||
|
Restructuring costs and other reserves
|
17,271
|
|
20,889
|
|
|||
|
Deferred revenue
|
75,067
|
|
75,515
|
|
|||
|
Other
|
47,581
|
|
33,993
|
|
|||
|
Total deferred tax asset
|
$
|
473,979
|
|
$
|
432,609
|
|
|
|
Valuation allowance
|
$
|
(133,459
|
)
|
$
|
(108,734
|
)
|
|
|
Deferred tax liabilities
|
|||||||
|
Scientific research and development tax credits
|
$
|
(6,831
|
)
|
$
|
(6,848
|
)
|
|
|
Acquired intangibles
|
(180,457
|
)
|
(165,858
|
)
|
|||
|
Other
|
(37,292
|
)
|
(23,133
|
)
|
|||
|
Deferred tax liabilities
|
$
|
(224,580
|
)
|
$
|
(195,839
|
)
|
|
|
Net deferred tax asset
|
$
|
115,940
|
|
$
|
128,036
|
|
|
|
Comprised of:
|
|||||||
|
Current assets
|
$
|
30,711
|
|
$
|
28,215
|
|
|
|
Long-term assets
|
155,411
|
|
161,247
|
|
|||
|
Current liabilities
|
(997
|
)
|
(1,053
|
)
|
|||
|
Long-term liabilities
|
(69,185
|
)
|
(60,373
|
)
|
|||
|
|
$
|
115,940
|
|
$
|
128,036
|
|
|
We believe that sufficient uncertainty exists regarding the realization of certain deferred tax assets that a valuation allowance is required. We continue to evaluate our taxable position quarterly and consider factors by taxing jurisdiction, including but not limited to factors such as estimated taxable income, any historical experience of losses for tax purposes and the future growth of OpenText.
The aggregate changes in the balance of our gross unrecognized tax benefits (including interest and penalties) were as follows:
|
Unrecognized tax benefits as of July 1, 2013
|
$
|
148,903
|
|
|
Increases on account of current year positions
|
5,037
|
|
|
|
Increases on account of prior year positions*
|
45,266
|
|
|
|
Decreases due to settlements with tax authorities
|
(2,321
|
)
|
|
|
Decreases due to lapses of statutes of limitations
|
(6,666
|
)
|
|
|
Unrecognized tax benefits as of July 1, 2014
|
$
|
190,219
|
|
|
Increases on account of current year positions
|
5,881
|
|
|
|
Increases on account of prior year positions
|
1,376
|
|
|
|
Decreases due to settlements with tax authorities
|
(3,084
|
)
|
|
|
Decreases due to lapses of statutes of limitations
|
(14,143
|
)
|
|
|
Unrecognized tax benefits as of June 30, 2015
|
$
|
180,249
|
|
|
*
|
Included in these balances as of June 30, 2014 are acquired balances of
$17.4 million
relating to the acquisition of GXS.
|
137
Included in the above tabular reconciliation are unrecognized tax benefits of
$25.1 million
relating to deferred tax assets in jurisdictions in which these deferred tax assets are offset with valuation allowances. The net unrecognized tax benefit excluding these deferred tax assets is
$155.1 million
as of
June 30, 2015
(
$162.6 million
as of June 30, 2014).
We recognize interest expense and penalties related to income tax matters in income tax expense.
For the years ended
June 30, 2015
, 2014 and 2013, we recognized the following amounts as income tax-related interest expense and penalties:
|
Year Ended June 30,
|
||||||||||||
|
2015
|
2014
|
2013
|
||||||||||
|
Interest expense (income)
|
$
|
4,451
|
|
$
|
6,969
|
|
$
|
(736
|
)
|
|||
|
Penalties expense (recoveries)
|
(2,032
|
)
|
287
|
|
65
|
|
||||||
|
Total
|
$
|
2,419
|
|
$
|
7,256
|
|
$
|
(671
|
)
|
|||
As of
June 30, 2015
and
June 30, 2014
, the following amounts have been accrued on account of income tax-related interest expense and penalties:
|
As of June 30, 2015
|
As of June 30, 2014
|
||||||
|
Interest expense accrued *
|
$
|
28,827
|
|
$
|
26,235
|
|
|
|
Penalties accrued *
|
$
|
5,040
|
|
$
|
7,858
|
|
|
|
*
|
These balances have been included within "Long-term income taxes payable" within the
Consolidated Balance Sheets
.
|
We believe that it is reasonably possible that the gross unrecognized tax benefits, as of
June 30, 2015
, could decrease tax expense in the next 12 months by
$15.6 million
, relating primarily to the expiration of competent authority relief and tax years becoming statute barred for purposes of future tax examinations by local taxing jurisdictions.
Our four most significant tax jurisdictions are Canada, the United States, Luxembourg and Germany. Our tax filings remain subject to audits by applicable tax authorities for a certain length of time following the tax year to which those filings relate. For Canada, the United States, Luxembourg and Germany, the earliest fiscal years open for examination are 2008, 2010, 2011 and 2008, respectively.
We are subject to tax audits in all major taxing jurisdictions in which we operate and currently have tax audits open in Canada, the United States, France, Spain, Germany, India, and the Netherlands. On a quarterly basis we assess the status of these examinations and the potential for adverse outcomes to determine the adequacy of the provision for income and other taxes.
The timing of the resolution of income tax audits is highly uncertain, and the amounts ultimately paid, if any, upon resolution of the issues raised by the taxing authorities may differ from the amounts accrued. It is reasonably possible that within the next 12 months we will receive additional assessments by various tax authorities or possibly reach resolution of income tax audits in one or more jurisdictions. These assessments or settlements may or may not result in changes to our contingencies related to positions on tax filings. The actual amount of any change could vary significantly depending on the ultimate timing and nature of any settlements. We cannot currently provide an estimate of the range of possible outcomes. For more information relating to certain tax audits, please refer to note 13.
As at
June 30, 2015
, we have provided
$12.1 million
(June 30, 2014—
$7.6 million
) in respect of both additional foreign withholding taxes or deferred income tax liabilities for temporary differences related to the undistributed earnings of certain non-United States subsidiaries, and planned periodic repatriations from certain United States and Luxembourg subsidiaries, that will be subject to withholding taxes upon distribution. We have not provided for additional foreign withholding taxes or deferred income tax liabilities related to undistributed earnings of all other non-Canadian subsidiaries, since such earnings are considered permanently invested in those subsidiaries, or are not subject to withholding taxes. It is not practicable to reasonably estimate the amount of additional deferred income tax liabilities or foreign withholding taxes that may be payable should these earnings be distributed in the future.
138
ASC Topic 820 “Fair Value Measurements and Disclosures” (Topic 820) defines fair value, establishes a framework for measuring fair value, and addresses disclosure requirements for fair value measurements. Fair value is the price that would be received upon sale of an asset or paid upon transfer of a liability in an orderly transaction between market participants at the measurement date and in the principal or most advantageous market for that asset or liability. The fair value, in this context, should be calculated based on assumptions that market participants would use in pricing the asset or liability, not on assumptions specific to the entity. In addition, the fair value of liabilities should include consideration of non-performance risk, including our own credit risk.
In addition to defining fair value and addressing disclosure requirements, Topic 820 establishes a fair value hierarchy for valuation inputs. The hierarchy prioritizes the inputs into three levels based on the extent to which inputs used in measuring fair value are observable in the market. Each fair value measurement is reported in one of the three levels which are determined by the lowest level input that is significant to the fair value measurement in its entirety. These levels are:
|
•
|
Level 1—inputs are based upon unadjusted quoted prices for identical instruments traded in active markets.
|
|
•
|
Level 2—inputs are based upon quoted prices for similar instruments in active markets, quoted prices for identical or similar instruments in markets that are not active, and model-based valuation techniques for which all significant assumptions are observable in the market or can be corroborated by observable market data for substantially the full term of the assets or liabilities.
|
|
•
|
Level 3—inputs are generally unobservable and typically reflect management’s estimates of assumptions that market participants would use in pricing the asset or liability. The fair values are therefore determined using model-based techniques that include option pricing models, discounted cash flow models, and similar techniques.
|
Financial Assets and Liabilities Measured at Fair Value on a Recurring Basis:
Our financial assets and liabilities measured at fair value on a recurring basis consisted of the following types of instruments as of
June 30, 2015
and June 30, 2014:
|
June 30, 2015
|
June 30, 2014
|
||||||||||||||||||||||
|
|
|
Fair Market Measurements using:
|
|
Fair Market Measurements using:
|
|||||||||||||||||||
|
|
June 30, 2015
|
Quoted prices
in active
markets for
identical
assets/
(liabilities)
|
Significant
other
observable
inputs
|
Significant
unobservable
inputs
|
June 30, 2014
|
Quoted prices
in active
markets for
identical
assets/
(liabilities)
|
Significant
other
observable
inputs
|
Significant
unobservable
inputs
|
|||||||||||||||
|
(Level 1)
|
(Level 2)
|
(Level 3)
|
(Level 1)
|
(Level 2)
|
(Level 3)
|
||||||||||||||||||
|
Financial Assets:
|
|||||||||||||||||||||||
|
Corporate bonds*
|
20,274
|
|
n/a
|
20,274
|
|
n/a
|
—
|
|
n/a
|
—
|
|
n/a
|
|||||||||||
|
Derivative financial instrument asset (note 16)
|
273
|
|
n/a
|
273
|
|
n/a
|
756
|
|
n/a
|
756
|
|
n/a
|
|||||||||||
|
$
|
20,547
|
|
n/a
|
$
|
20,547
|
|
n/a
|
$
|
756
|
|
n/a
|
$
|
756
|
|
n/a
|
||||||||
*These assets in the table above are classified as Level 2 as certain specific assets included within may not have quoted prices that are readily accessible in an active market or we may have relied on alternative pricing methods that do not rely exclusively on quoted prices to determine the fair value of the investments.
Our valuation techniques used to measure the fair values of the derivative instruments, the counterparty to which has high credit ratings, were derived from pricing models including discounted cash flow techniques, with all significant inputs derived from or corroborated by observable market data, as no quoted market prices exist for these instruments. Our discounted cash flow techniques use observable market inputs, such as, where applicable, foreign currency spot and forward rates.
Our cash and cash equivalents, along with our accounts receivable and accounts payable and accrued liabilities balances, are measured and recognized in our
Consolidated Financial Statements
at an amount that approximates their fair value (a Level 2 measurement) due to their short maturities.
139
A summary of our marketable securities outstanding as of
June 30, 2015
is as follows:
|
Cost
|
Gross Unrealized Gains
|
Gross Unrealized (Losses)
|
Estimated Fair Value
|
||||||||||||
|
Corporate bonds
|
$
|
20,286
|
|
$
|
2
|
|
$
|
(14
|
)
|
$
|
20,274
|
|
|||
The long-term portion of the marketable securities are included within "Other Assets" in the
Consolidated Balance Sheets
.
Assets and Liabilities Measured at Fair Value on a Nonrecurring Basis
We measure certain assets at fair value on a nonrecurring basis. These assets are recognized at fair value when they are deemed to be other-than-temporarily impaired. During the years ended
June 30, 2015
and 2014, no indications of impairment were identified and therefore no fair value measurements were required.
If applicable, we will recognize transfers between levels within the fair value hierarchy at the end of the reporting period in which the actual event or change in circumstance occurs. During the years ended
June 30, 2015
and 2014, we did not have any transfers between Level 1, Level 2 or Level 3.
Marketable Securities
Marketable Securities are classified as available for sale securities and are recorded on our
Consolidated Balance Sheets
at fair value with unrealized gains or losses reported as a separate component of Accumulated Other Comprehensive Income.
Foreign Currency Forward Contracts
We are engaged in hedging programs with relationship banks to limit the potential foreign exchange fluctuations incurred on future cash flows relating to a portion of our Canadian dollar payroll expenses. We operate internationally and are therefore exposed to foreign currency exchange rate fluctuations in the normal course of our business, in particular to changes in the Canadian dollar on account of large costs that are incurred from our centralized Canadian operations, which are denominated in Canadian dollars. As part of our risk management strategy, we use foreign currency forward contracts to hedge portions of our payroll exposure with typical maturities of between one and twelve months. We do not use derivatives for speculative purposes.
We have designated these transactions as cash flow hedges of forecasted transactions under ASC Topic 815 “Derivatives and Hedging” (Topic 815). As the critical terms of the hedging instrument, and of the entire hedged forecasted transaction, are the same, in accordance with Topic 815 we have been able to conclude that changes in fair value or cash flows attributable to the risk being hedged are expected to completely offset at inception and on an ongoing basis. Accordingly, quarterly unrealized gains or losses on the effective portion of these forward contracts have been included within other comprehensive income. The fair value of the contracts, as of
June 30, 2015
, is recorded within “Prepaid expenses and other current assets”.
As of
June 30, 2015
, the notional amount of forward contracts we held to sell U.S. dollars in exchange for Canadian dollars was
$76.4 million
(
June 30, 2014
—
$99.6 million
).
Fair Value of Derivative Instruments and Effect of Derivative Instruments on Financial Performance
The effect of these derivative instruments on our
Consolidated Financial Statements
for the periods indicated below were as follows (amounts presented do not include any income tax effects).
Fair Value of Derivative Instruments in the
Consolidated Balance Sheets
(see note 15)
|
As of June 30, 2015
|
As of June 30, 2014
|
|||||||
|
Derivatives
|
Balance Sheet Location
|
Fair Value
Asset (Liability) |
Fair Value
Asset (Liability) |
|||||
|
Foreign currency forward contracts designated as cash flow hedges
|
Prepaid expenses and other current assets
|
$
|
273
|
|
$
|
756
|
|
|
140
Effects of Derivative Instruments on Income and Other Comprehensive Income (OCI)
|
Year Ended June 30, 2015
|
||||||||||||||||
|
Derivatives in Cash Flow
Hedging Relationship
|
Amount of Gain or (Loss)
Recognized in OCI on
Derivatives
(Effective
Portion)
|
Location of
Gain or (Loss)
Reclassified
from
Accumulated
OCI into
Income
(Effective
Portion)
|
Amount of Gain or
(Loss) Reclassified from
Accumulated OCI into
Income (Effective
Portion)
|
Location of
Gain or (Loss)
Recognized
in Income on
Derivatives
(Ineffective
Portion and
Amount
Excluded from
Effectiveness
Testing)
|
Amount of Gain or (Loss) Recognized in
Income on Derivatives
(Ineffective Portion
and Amount Excluded
from Effectiveness
Testing)
|
|||||||||||
|
Foreign currency forward contracts
|
$
|
(8,252
|
)
|
Operating
expenses |
$
|
(7,769
|
)
|
N/A
|
—
|
|||||||
|
Year Ended June 30, 2014
|
||||||||||||||||
|
Derivatives in Cash Flow
Hedging Relationship
|
Amount of Gain or (Loss)
Recognized in OCI on Derivatives (Effective Portion) |
Location of
Gain or (Loss) Reclassified from Accumulated OCI into Income (Effective Portion) |
Amount of Gain or
(Loss) Reclassified from Accumulated OCI into Income (Effective Portion) |
Location of
Gain or (Loss) Recognized in Income on Derivatives (Ineffective Portion and Amount Excluded from Effectiveness Testing) |
Amount of Gain or (Loss) Recognized in
Income on Derivatives (Ineffective Portion and Amount Excluded from Effectiveness Testing) |
|||||||||||
|
Foreign currency forward contracts
|
$
|
(485
|
)
|
Operating
expenses |
$
|
(4,411
|
)
|
N/A
|
—
|
|||||||
Special charges include costs that relate to certain restructuring initiatives that we have undertaken from time to time under our various restructuring plans, as well as acquisition-related costs and other similar charges.
|
|
Year Ended June 30,
|
|||||||||||
|
|
2015
|
2014
|
2013
|
|||||||||
|
Fiscal 2015 Restructuring Plan
|
$
|
8,218
|
|
$
|
—
|
|
$
|
—
|
|
|||
|
OpenText/GXS Restructuring Plan
|
8,163
|
|
19,306
|
|
—
|
|
||||||
|
Restructuring Plans prior to OpenText/GXS Restructuring Plan
|
(1,809
|
)
|
7,492
|
|
16,339
|
|
||||||
|
Acquisition-related costs
|
4,462
|
|
10,074
|
|
4,925
|
|
||||||
|
Other charges (recoveries)
|
(6,211
|
)
|
(5,558
|
)
|
2,770
|
|
||||||
|
Total
|
$
|
12,823
|
|
$
|
31,314
|
|
|
$
|
24,034
|
|
||
Fiscal 2015 Restructuring Plan
In the third quarter of Fiscal 2015 and in the context of the acquisition of Actuate, we began to implement restructuring activities to streamline our operations (OpenText/Actuate Restructuring Plan). We subsequently announced, on May 20, 2015 that we were initiating a restructuring program in conjunction with organizational changes to support our cloud strategy and drive further operational efficiencies. These charges are combined with the OpenText/Actuate Restructuring Plan (collectively referred to as the
Fiscal 2015 Restructuring Plan
) and are presented below. The
Fiscal 2015 Restructuring Plan
charges relate to workforce reductions and facility consolidations. These charges require management to make certain judgments and estimates regarding the amount and timing of restructuring charges or recoveries. Our estimated liability could change subsequent to its recognition, requiring adjustments to the expense and the liability recorded. On a quarterly basis, we conduct an evaluation of the related liabilities and expenses and revise our assumptions and estimates as appropriate.
141
As of
June 30, 2015
, we expect total costs to be incurred in conjunction with the
Fiscal 2015 Restructuring Plan
to be approximately
$32.0
to
$35.0 million
, of which
$8.0 million
has already been recorded within Special charges to date. We expect the
Fiscal 2015 Restructuring Plan
to be substantially completed by the end of our fiscal year ended June 30, 2016.
A reconciliation of the beginning and ending liability for the
year ended
June 30, 2015
is shown below.
|
Fiscal 2015 Restructuring Plan
|
Workforce
reduction
|
Facility costs
|
Total
|
||||||||
|
Balance as of June 30, 2014
|
$
|
—
|
|
$
|
—
|
|
$
|
—
|
|
||
|
Accruals and adjustments
|
6,015
|
|
2,203
|
|
8,218
|
|
|||||
|
Cash payments
|
(2,135
|
)
|
(61
|
)
|
(2,196
|
)
|
|||||
|
Foreign exchange
|
(38
|
)
|
(16
|
)
|
(54
|
)
|
|||||
|
Balance as of June 30, 2015
|
$
|
3,842
|
|
$
|
2,126
|
|
$
|
5,968
|
|
||
OpenText/GXS Restructuring Plan
In the third quarter of Fiscal 2014 and in the context of the acquisition of GXS, we began to implement restructuring activities to streamline our operations (
OpenText/GXS Restructuring Plan
). These charges relate to workforce reductions, facility consolidations and other miscellaneous direct costs. These charges require management to make certain judgments and estimates regarding the amount and timing of restructuring charges or recoveries. Our estimated liability could change subsequent to its recognition, requiring adjustments to the expense and the liability recorded. On a quarterly basis, we conduct an evaluation of the related liabilities and expenses and revise our assumptions and estimates as appropriate.
Since the inception of the plan
$27.5 million
has been recorded within Special charges. We do not expect to incur any further significant charges related to this plan.
A reconciliation of the beginning and ending liability for the years ended
June 30, 2015
and 2014 are shown below.
|
OpenText/GXS Restructuring Plan
|
Workforce
reduction
|
Facility costs
|
Other
|
Total
|
|||||||||||
|
Balance as of June 30, 2014
|
$
|
5,051
|
|
$
|
6,028
|
|
$
|
—
|
|
$
|
11,079
|
|
|||
|
Accruals and adjustments
|
5,244
|
|
1,159
|
|
1,760
|
|
8,163
|
|
|||||||
|
Cash payments
|
(6,848
|
)
|
(2,914
|
)
|
(1,760
|
)
|
(11,522
|
)
|
|||||||
|
Foreign exchange
|
(601
|
)
|
163
|
|
—
|
|
(438
|
)
|
|||||||
|
Balance as of June 30, 2015
|
$
|
2,846
|
|
$
|
4,436
|
|
$
|
—
|
|
$
|
7,282
|
|
|||
|
OpenText/GXS Restructuring Plan
|
Workforce
reduction
|
Facility costs
|
Total
|
||||||||
|
Balance as of June 30, 2013
|
$
|
—
|
|
$
|
—
|
|
$
|
—
|
|
||
|
Accruals and adjustments
|
13,017
|
|
6,289
|
|
19,306
|
|
|||||
|
Cash payments
|
(7,739
|
)
|
(415
|
)
|
(8,154
|
)
|
|||||
|
Foreign exchange
|
(227
|
)
|
154
|
|
(73
|
)
|
|||||
|
Balance as of June 30, 2014
|
$
|
5,051
|
|
$
|
6,028
|
|
$
|
11,079
|
|
||
Acquisition-related costs
Included within Special charges for the
year ended
June 30, 2015
are costs incurred directly in relation to acquisitions in the amount of
$4.0 million
(
June 30, 2014
—
$8.6 million
, June 30, 2013—
$2.9 million
). Additionally, we incurred costs relating to financial advisory, legal, valuation and audit services and other miscellaneous costs necessary to integrate acquired companies into our organization for the
year ended
June 30, 2015
in the amount of
$0.5 million
(
June 30, 2014
—
$1.5 million
, June 30, 2013—
$2.0 million
).
Other charges (recoveries)
For the
year ended
ended
June 30, 2015
, "Other charges (recoveries)" primarily includes (i) a recovery of
$8.8 million
relating to certain pre-acquisition tax liabilities being released based upon settlement, (ii) a recovery of
$2.7 million
relating to certain pre-acquisition tax liabilities becoming statute barred and (iii) a recovery of
$1.4 million
relating to interest released on certain pre-acquisition liabilities. These recoveries were offset by charges of
$2.9 million
relating to the write-off of unamortized debt issuance costs associated with the repayment of Term Loan A,
$2.1 million
relating to post-business
142
combination compensation obligations associated with the acquisition of Actuate and
$1.2 million
relating to a reduction in leasehold improvements associated with a restructured facility. The remaining amounts relate to miscellaneous other charges.
Included within "Other charges (recoveries)" for the
year ended
June 30, 2014
is a net recovery of
$7.0 million
relating to a reduction of certain pre-acquisition tax liabilities, along with the associated interest accrual. This recovery was offset by a charge of
$1.4 million
relating to a settlement agreement reached in connection with the acquisition of IXOS Software AG in February 2004.
Included within "Other charges (recoveries)" for the year ended June 30, 2013 are charges of
$1.9 million
relating to interest accrued on certain pre-acquisition sales tax liabilities, a charge of
$0.4 million
relating to an allocated portion of a litigation settlement reached in relation to a legacy acquisition litigation matter, and a charge of
$0.5 million
relating to miscellaneous other charges.
Acquisition of Actuate Corporation
On January 16, 2015, we acquired Actuate Corporation (Actuate), based in San Francisco, California, United States. Actuate was a leader in personalized analytics and insights and we believe the acquisition complements our OpenText EIM Suite. In accordance with Topic 805 "Business Combinations" (Topic 805), this acquisition was accounted for as a business combination.
The results of operations of Actuate have been consolidated with those of OpenText beginning January 16, 2015.
The following tables summarize the preliminary consideration paid for Actuate and the amount of the assets acquired and liabilities assumed, as well as the goodwill recorded as of the acquisition date:
|
Cash consideration*
|
$
|
322,417
|
|
|
Fair value, at date of acquisition, on shares of Actuate already owned through open market purchases
|
9,539
|
|
|
|
Preliminary purchase consideration
|
$
|
331,956
|
|
|
Acquisition-related costs (included in Special charges in the Consolidated Statements of Income) for the year ended June 30, 2015
|
$
|
3,340
|
|
Preliminary Purchase Price Allocation
The recognized amounts of identifiable assets acquired and liabilities assumed, based upon their fair values as of January 16, 2015, are set forth below:
|
Current assets (inclusive of cash acquired of $22,463)
|
$
|
78,150
|
|
|
Non-current tangible assets
|
13,540
|
|
|
|
Intangible customer assets
|
62,600
|
|
|
|
Intangible technology assets
|
60,000
|
|
|
|
Liabilities assumed
|
(79,686
|
)
|
|
|
Total identifiable net assets
|
134,604
|
|
|
|
Goodwill
|
197,352
|
|
|
|
Net assets acquired
|
$
|
331,956
|
|
The finalization of the purchase price allocation is pending the determination of the finalization of the fair value for taxation-related balances and for potential unrecorded liabilities. We expect to finalize this determination on or before December 31, 2015.
No
portion of the goodwill recorded upon the acquisition of Actuate is expected to be deductible for tax purposes.
The fair value of current assets acquired includes accounts receivable with a fair value of
$23.4 million
. The gross amount receivable was
$23.6 million
of which
$0.2 million
of this receivable was expected to be uncollectible.
We recognized a gain of
$3.1 million
as a result of remeasuring to fair value our investment in Actuate held before the date of acquisition. The gain is included in "Other income" in our
Consolidated Financial Statements
.
The amount of Actuate’s revenues and net income included in our
Consolidated Statements of Income
for the year ended
June 30, 2015
is set forth below:
143
|
January 16, 2015—
June 30, 2015
|
||||
|
Revenues
|
$
|
34,093
|
|
|
|
Net loss *
|
$
|
(14,242
|
)
|
|
* Net loss includes one-time fees of approximately
$6.2 million
on account of special charges, and
$12.7 million
of amortization charges relating to intangible assets. These losses were offset by a tax recovery of
$6.0 million
.
The unaudited pro forma revenues and net income of the combined entity for the year ended
June 30, 2015
and 2014, respectively, had the acquisition been consummated as of July 1, 2013, are set forth below:
|
|
Year Ended June 30,
|
|||||||
|
|
2015
|
2014
|
||||||
|
Supplemental Unaudited Pro forma Information
|
||||||||
|
Total revenues
|
$
|
1,907,532
|
|
$
|
1,739,995
|
|
||
|
Net income
(1) (2)
|
$
|
210,054
|
|
$
|
196,879
|
|
||
(1) Included in pro forma net income for the year ended June 30, 2015 are approximately
$12.8 million
of one-time expenses incurred by Actuate on account of the acquisition. These one-time expenses include i) approximately
$3.4 million
in employee change in control payments, ii) approximately
$3.9 million
of post-business combination compensation obligations associated with the acquisition, and iii) approximately
$5.5 million
of transaction fees triggered by the closing of the acquisition.
(2) Included in pro forma net income are estimated amortization charges relating to the allocated values of intangible assets.
The unaudited pro forma financial information in the table above is presented for information purposes only and is not indicative of the results of operations that would have been achieved if the acquisition had taken place at the beginning of the periods presented or the results that may be realized in the future.
Informative Graphics Corporation
On January 2, 2015, we acquired Informative Graphics Corporation (IGC), based in Scottsdale, Arizona, United States. IGC was a leading developer of viewing, annotation, redaction and publishing commercial software. Total consideration for IGC was
$40.0 million
(
$38.7 million
- net of cash acquired), of which
$36.5 million
was paid in cash, and
$3.5 million
is currently held back and unpaid in accordance with the purchase agreement. In accordance with Topic 805, this acquisition was accounted for as a business combination. We believe this acquisition will enable OpenText to engineer solutions that further increase a user's experience within our OpenText EIM Suite.
The finalization of the purchase price allocation is pending the determination of the finalization of the fair value for taxation-related balances and for potential unrecorded liabilities. We expect to finalize this determination on or before December 31, 2015.
Acquisition related costs for IGC included in Special charges in the
Consolidated Statements of Income
for the
year ended
June 30, 2015
were
$0.4 million
.
The results of operations of IGC have been consolidated with those of OpenText beginning January 2, 2015.
The acquisition had no significant impact on revenues and net earnings for the
year ended
June 30, 2015
. There was also no significant impact on the Company's revenues and net income on a pro forma basis for all periods presented.
Fiscal 2014
GXS Group, Inc.
On January 16, 2014, we acquired GXS, a Delaware corporation and leader in cloud-based, business-to-business (B2B) integration. The acquisition combined OpenText's Information Exchange portfolio with GXS' portfolio of B2B integration services and managed services. Total consideration for GXS was
$1.2 billion
, inclusive of the issuance of
2,595,042
OpenText Common Shares. In accordance with Topic 805, this acquisition was accounted for as a business combination.
The results of operations of GXS have been consolidated with those of OpenText beginning January 16, 2014.
The following tables summarize the consideration paid for GXS and the amount of the assets acquired and liabilities assumed, as well as the goodwill recorded as of the acquisition date:
144
|
Cash consideration paid
|
$
|
1,101,874
|
|
|
Equity consideration paid
|
116,777
|
|
|
|
Purchase consideration
|
$
|
1,218,651
|
|
As set forth in the purchase agreement,
$60.0 million
of the total cash consideration paid was provided to an escrow agent for indemnification purposes. During the three months ended December 31, 2014,
$30.0 million
of the total amount that was held in escrow was released. The remaining
$30.0 million
will remain in escrow, for indemnification purposes, until January 2016, pursuant to the purchase agreement.
Purchase Price Allocation
The purchase price of GXS has been allocated to GXS' tangible and identifiable intangible assets acquired and liabilities assumed, based on their estimated fair values as of the acquisition date. For certain assets and liabilities, the book values as of the balance sheet date have been determined to reflect fair values. The excess of the purchase price over the net tangible and identifiable intangible assets has been recorded as goodwill.
Our purchase price allocation for GXS is as follows:
|
Current assets (inclusive of cash acquired of $24,382)
|
$
|
127,406
|
|
|
Non-current tangible assets
|
36,139
|
|
|
|
Intangible customer assets
|
364,600
|
|
|
|
Intangible technology assets
|
123,200
|
|
|
|
Liabilities and non-controlling interest assumed
|
(105,459
|
)
|
|
|
Total identifiable net assets
|
545,886
|
|
|
|
Goodwill
|
672,765
|
|
|
|
Net assets acquired
|
$
|
1,218,651
|
|
During Fiscal 2015, we reduced the carrying value of certain tax liabilities and goodwill by
$23.5 million
, which, in accordance with Topic 805, has been accounted for retrospectively in the consolidated financial statements.
No
portion of the goodwill recorded upon the acquisition of GXS is expected to be deductible for tax purposes.
The fair value of current assets acquired includes accounts receivable with a fair value of
$94.3 million
. The gross amount receivable was
$108.2 million
of which
$13.9 million
of this receivable was expected to be uncollectible.
Cordys Holding B.V.
On August 15, 2013, we acquired Cordys Holding B.V. (Cordys), a leading provider of Business Process Management (BPM) and case management solutions, offered on one platform with cloud, mobile, and social capabilities, based in Putten, the Netherlands. Total consideration for Cordys was
$33.2 million
paid in cash (
$30.6 million
- net of cash acquired). In accordance with Topic 805, this acquisition was accounted for as a business combination.
The results of operations of Cordys have been consolidated with those of OpenText beginning August 15, 2013.
The acquisition had no significant impact on revenues and net income for the year ended June 30, 2014. There was also no significant impact on the Company's revenues and net income on a pro forma basis for all periods presented.
Fiscal 2013
EasyLink Services International Corporation
On July 2, 2012, we acquired EasyLink Services International Corporation (EasyLink), a global provider of cloud-based electronic messaging and business integration services, based in Atlanta, Georgia. The acquisition extended our product offerings as we continue to evolve in the Enterprise Information Management market category. Total consideration for EasyLink was
$342.3 million
, paid in cash. In accordance with Topic 805, this acquisition was accounted for as a business combination.
The results of operations of EasyLink have been consolidated with those of OpenText beginning July 2, 2012.
The following tables summarize the consideration paid for EasyLink and the amount of the assets acquired and liabilities assumed, as well as the goodwill recorded as of the acquisition date:
145
|
Cash consideration paid
|
$
|
342,272
|
|
The recognized amounts of identifiable assets acquired and liabilities assumed, based upon their fair values as of July 2, 2012, are set forth below:
|
Current assets (inclusive of cash acquired of $26,941)
|
$
|
74,560
|
|
|
Non-current assets
|
35,024
|
|
|
|
Intangible customer assets
|
126,600
|
|
|
|
Intangible technology assets
|
70,500
|
|
|
|
Total liabilities assumed
|
(148,028
|
)
|
|
|
Total identifiable net assets
|
158,656
|
|
|
|
Goodwill
|
183,616
|
|
|
|
$
|
342,272
|
|
|
No
portion of the goodwill recorded upon the acquisition of EasyLink is expected to be deductible for tax purposes.
Included within current assets were accounts receivable of
$26.2 million
at July 2, 2012. This amount was substantially collected as of June 30, 2013.
Other Fiscal 2013 Acquisitions
During Fiscal 2013, we acquired certain other companies and purchased certain technology and customer assets to expand our product and service offerings. These acquisitions were not significant individually or in the aggregate.
ASC Topic 280, “Segment Reporting” (Topic 280), establishes standards for reporting, by public business enterprises, information about operating segments, products and services, geographic areas, and major customers. The method of determining what information, under Topic 280, to report is based on the way that an entity organizes operating segments for making operational decisions and how the entity’s management and chief operating decision maker (CODM) assess an entity’s financial performance. Our operations are analyzed by management and our CODM as being part of a single industry segment: the design, development, marketing and sales of Enterprise Information Management software and solutions.
The following table sets forth the distribution of revenues, by significant geographic area, for the periods indicated:
|
|
Year Ended June 30,
|
||||||||||
|
|
2015
|
2014
|
2013
|
||||||||
|
Revenues:
|
|||||||||||
|
Canada
|
$
|
113,780
|
|
$
|
117,225
|
|
$
|
103,076
|
|
||
|
United States
|
887,895
|
|
725,852
|
|
611,902
|
|
|||||
|
United Kingdom
|
194,131
|
|
169,511
|
|
131,745
|
|
|||||
|
Germany
|
167,427
|
|
162,966
|
|
138,073
|
|
|||||
|
Rest of Europe
|
276,742
|
|
255,419
|
|
223,444
|
|
|||||
|
All other countries
|
211,942
|
|
193,726
|
|
155,096
|
|
|||||
|
Total revenues
|
$
|
1,851,917
|
|
$
|
1,624,699
|
|
$
|
1,363,336
|
|
||
146
The following table sets forth the distribution of long-lived assets, representing property and equipment and intangible assets, by significant geographic area, as of the periods indicated below.
|
As of June 30,
2015 |
As of June 30,
2014 |
||||||
|
Long-lived assets:
|
|||||||
|
Canada
|
$
|
64,622
|
|
$
|
68,189
|
|
|
|
United States
|
653,576
|
|
644,051
|
|
|||
|
United Kingdom
|
10,988
|
|
14,132
|
|
|||
|
Germany
|
5,320
|
|
5,534
|
|
|||
|
Rest of Europe
|
73,905
|
|
119,686
|
|
|||
|
All other countries
|
31,487
|
|
15,987
|
|
|||
|
Total
|
$
|
839,898
|
|
$
|
867,579
|
|
|
|
|
Year Ended June 30,
|
||||||||||||
|
|
2015
|
2014
|
2013
|
||||||||||
|
Cash paid during the period for interest
|
$
|
34,658
|
|
*
|
$
|
26,697
|
|
$
|
16,299
|
|
|||
|
Cash received during the period for interest
|
$
|
3,905
|
|
$
|
2,463
|
|
$
|
1,439
|
|
||||
|
Cash paid during the period for income taxes
|
$
|
25,870
|
|
$
|
39,834
|
|
$
|
52,827
|
|
**
|
|||
*We entered into Term Loan B on January 16, 2014 (see note 10). For the year ended
June 30, 2015
, this amount includes
$26.1 million
, of interest related to this new credit facility.
**Cash paid for taxes for the year ended June 30, 2013 include payments of
$24.2 million
related to taxes exigible on internal reorganizations of our international subsidiaries.
We issued the Senior Notes on January 16, 2015. Interest owing on the Senior Notes is payable semi-annually starting on July 15, 2015 (see note 10).
Basic earnings per share are computed by dividing net income, attributable to OpenText, by the weighted average number of Common Shares outstanding during the period. Diluted earnings per share are computed by dividing net income, attributable to OpenText, by the shares used in the calculation of basic earnings per share plus the dilutive effect of Common Share equivalents, such as stock options, using the treasury stock method. Common Share equivalents are excluded from the computation of diluted earnings per share if their effect is anti-dilutive.
|
|
Year Ended June 30,
|
|||||||||||
|
|
2015
|
2014
|
2013
|
|||||||||
|
Basic earnings per share
|
||||||||||||
|
Net income attributable to OpenText
|
$
|
234,327
|
|
$
|
218,125
|
|
$
|
148,520
|
|
|||
|
Basic earnings per share attributable to OpenText
|
$
|
1.92
|
|
$
|
1.82
|
|
$
|
1.27
|
|
|||
|
Diluted earnings per share
|
||||||||||||
|
Net income attributable to OpenText
|
$
|
234,327
|
|
$
|
218,125
|
|
$
|
148,520
|
|
|||
|
Diluted earnings per share attributable to OpenText
|
$
|
1.91
|
|
$
|
1.81
|
|
$
|
1.26
|
|
|||
|
Weighted-average number of shares outstanding
|
||||||||||||
|
Basic
|
122,092
|
|
119,674
|
|
117,208
|
|
||||||
|
Effect of dilutive securities
|
865
|
|
902
|
|
916
|
|
||||||
|
Diluted
|
122,957
|
|
120,576
|
|
118,124
|
|
||||||
|
Excluded as anti-dilutive*
|
1,859
|
|
880
|
|
2,262
|
|
||||||
* Represents options to purchase Common Shares excluded from the calculation of diluted earnings per share because the exercise price of the stock options was greater than or equal to the average price of the Common Shares during the period.
147
Our procedure regarding the approval of any related party transaction requires that the material facts of such transaction be reviewed by the independent members of our Board and the transaction be approved by a majority of the independent members of the Board. The Board reviews all transactions in which we are, or will be, a participant and any related party has or will have a direct or indirect interest. In determining whether to approve a related party transaction, the Board generally takes into account, among other facts it deems appropriate, whether the transaction is on terms no less favorable than terms generally available to an unaffiliated third party under the same or similar circumstances; the extent and nature of the related person’s interest in the transaction; the benefits to the Company of the proposed transaction; if applicable, the effects on a director’s independence; and if applicable, the availability of other sources of comparable services or products.
During the
year ended
June 30, 2015
, Mr. Stephen Sadler, a director, earned
$0.5 million
(
June 30, 2014
—
$0.7 million
, June 30, 2013—
$0.6 million
) in consulting fees from OpenText primarily for services rendered relating to the acquisitions of Actuate and IGC. Mr. Sadler abstained from voting on all transactions from which he would potentially derive consulting fees.
Normal Course Issuer Bid
On July 28, 2015, our board of directors authorized the repurchase of up to
$200 million
of our Common Shares. Shares may be repurchased from time to time in the open market, private purchases through forward, derivative, accelerated repurchase or automatic repurchase transactions or otherwise. Certain of our share repurchases may from time to time be effected through repurchase plans. The timing of any repurchases will depend on market conditions, our financial condition, results of operations, liquidity and other factors.
Cash Dividends
As part of our quarterly, non-cumulative cash dividend program, we declared, on
July 28, 2015
, a dividend of
$0.20
per Common Share. The record date for this dividend is
August 28, 2015
and the payment date is
September 18, 2015
. Future declarations of dividends and the establishment of future record and payment dates are subject to the final determination and discretion of our Board of Directors.
148
SIGNATURES
Pursuant to the requirements of the Securities Exchange Act of 1934, as amended, the registrant has duly caused this report to be signed on its behalf by the undersigned thereunto duly authorized.
OPEN TEXT CORPORATION
Date:
July 29, 2015
|
By:
|
/s/ MARK J. BARRENECHEA
|
|
Mark J. Barrenechea
President and Chief Executive Officer
(Principal Executive Officer)
|
|
Pursuant to the requirements of the Securities Exchange Act of 1934, this report has been signed below by the following persons on behalf of the registrant and in the capacities and on the date indicated.
OPEN TEXT CORPORATION
Date:
July 29, 2015
|
By:
|
/s/ MARK J. BARRENECHEA
|
|
Mark J. Barrenechea
President and Chief Executive Officer
(Principal Executive Officer)
|
|
|
/s/ JOHN M. DOOLITTLE
|
|
|
John M. Doolittle
Chief Financial Officer
(Principal Financial Officer)
|
|
|
/s/ SUJEET KINI
|
|
|
Sujeet Kini
Chief Accounting Officer
(Principal Accounting Officer)
|
|
149
DIRECTORS
|
Signature
|
Title
|
Date
|
||
|
/s/ MARK BARRENECHEA
|
Director, President and Chief Executive Officer (Principal Executive Officer)
|
July 29, 2015
|
||
|
Mark Barrenechea
|
||||
|
/S/ P. THOMAS JENKINS
|
Chairman of the Board
|
July 29, 2015
|
||
|
P. Thomas Jenkins
|
||||
|
/S/ RANDY FOWLIE
|
Director
|
July 29, 2015
|
||
|
Randy Fowlie
|
||||
|
/S/ GAIL E. HAMILTON
|
Director
|
July 29, 2015
|
||
|
Gail E. Hamilton
|
||||
|
/S/ BRIAN J. JACKMAN
|
Director
|
July 29, 2015
|
||
|
Brian J. Jackman
|
||||
|
/S/ DEBORAH WEINSTEIN
|
Director
|
July 29, 2015
|
||
|
Deborah Weinstein
|
||||
|
/S/ STEPHEN J. SADLER
|
Director
|
July 29, 2015
|
||
|
Stephen J. Sadler
|
||||
|
/S/ MICHAEL SLAUNWHITE
|
Director
|
July 29, 2015
|
||
|
Michael Slaunwhite
|
||||
|
/S/ KATHARINE B. STEVENSON
|
Director
|
July 29, 2015
|
||
|
Katharine B. Stevenson
|
||||
150
TABLE OF CONTENTS
Part IItem 1. BusinessItem 1A. Risk FactorsItem 1B. Unresolved Staff CommentsItem 2. PropertiesItem 3. Legal ProceedingsItem 4. Mine Safety DisclosuresPart IIItem 5. Market For Registrant's Common Equity, Related Stockholder Matters and Issuer Purchases Of Equity SecuritiesItem 6. Selected Financial DataItem 7. Management S Discussion and Analysis Of Financial Condition and Results Of OperationsItem 7A. Quantitative and Qualitative Disclosures About Market RiskItem 8. Financial Statements and Supplementary DataItem 9. Changes in and Disagreements with Accountants on Accounting and Financial DisclosureItem 9A. Controls and ProceduresPart IIIItem 10. Directors, Executive Officers and Corporate GovernanceItem 11. Executive CompensationItem 12. Security Ownership Of Certain Beneficial Owners and Management and Related Stockholder MattersItem 13. Certain Relationships and Related Transactions, and Director IndependenceItem 14. Principal Accountant Fees and ServicesPart IVItem 15. Exhibits and Financial Statements SchedulesNote 1 Basis Of PresentationNote 2 Accounting Policies and Recent Accounting PronouncementsNote 3 Allowance For Doubtful AccountsNote 4 Property and EquipmentNote 5 GoodwillNote 6 Acquired Intangible AssetsNote 7 Other AssetsNote 8 Deferred Charges and CreditsNote 9 Accounts Payable and Accrued LiabilitiesNote 10 Long-term DebtNote 11 Pension Plans and Other Post Retirement BenefitsNote 12 Share Capital, Option Plans and Share-based PaymentsNote 13 Guarantees and ContingenciesNote 14 Income TaxesNote 15 Fair Value MeasurementsNote 16 Derivative Instruments and Hedging ActivitiesNote 17 Special Charges (recoveries)Note 18 AcquisitionsNote 19 Segment InformationNote 20 Supplemental Cash Flow DisclosuresNote 21 Earnings Per ShareNote 22 Related Party TransactionsNote 23 Subsequent Events