OUTFRONT MEDIA INC.
10-Ks and 10-Qs
|
|
|
|
|
|
|
|
|
|
|
|
|
|
|
|
|
|
|
|
|
|
|
|
|
|
|
|
|
|
|
|
UNITED STATES
SECURITIES AND EXCHANGE COMMISSION
Washington, D.C. 20549
FORM 10-K
(Mark One)
|
x
|
ANNUAL REPORT PURSUANT TO SECTION 13 OR 15(d) OF THE SECURITIES EXCHANGE ACT OF 1934
|
For the fiscal year ended
December 31, 2014
or
|
o
|
TRANSITION REPORT PURSUANT TO SECTION 13 OR 15(d) OF THE SECURITIES EXCHANGE ACT OF 1934
|
|||
|
For the transition period from
|
to
|
|||
Commission File Number: 001-36367
OUTFRONT Media Inc.
(
Exact name of registrant as specified in its charter
)
|
Maryland
|
46-4494703
|
|
|
(
State or other jurisdiction of
incorporation or organization
)
|
(
I.R.S. Employer
Identification No.
)
|
|
|
405 Lexington Avenue, 17th Floor
New York, NY
|
10174
|
|
|
(
Address of principal executive offices
)
|
(
Zip Code
)
|
|
(212) 297-6400
(
Registrant’s telephone number, including area code
)
Securities registered pursuant to section 12(b) of the Act:
|
Title of Each Class
|
Name of each exchange on which registered
|
|
|
Common Stock, $0.01 par value
|
New York Stock Exchange
|
|
Securities registered pursuant to section 12(g) of the Act:
None
(
Title of class
)
Indicate by check mark if the registrant is a well-known seasoned issuer, as defined in Rule 405 of the Securities Act.
o
Yes
x
No
Indicate by check mark if the registrant is not required to file reports pursuant to Section 13 or Section 15(d) of the Act.
o
Yes
x
No
Indicate by check mark whether the registrant (1) has filed all reports required to be filed by Section 13 or 15(d) of the Securities Exchange Act of 1934 during the preceding 12 months (or for such shorter period that the registrant was required to file such reports), and (2) has been subject to such filing requirements for the past 90 days.
x
Yes
o
No
Indicate by check mark whether the registrant has submitted electronically and posted on its corporate Website, if any, every Interactive Data File required to be submitted and posted pursuant to Rule 405 of Regulation S-T (§232.405 of this chapter) during the preceding 12 months (or for such shorter period that the registrant was required to submit and post such files).
x
Yes
o
No
Indicate by check mark if disclosure of delinquent filers pursuant to Item 405 of Regulation S-K (§232.405 of this chapter) is not contained herein, and will not be contained, to the best of registrant’s knowledge, in definitive proxy or information statements incorporated by reference in Part III of this Form 10-K or any amendment to this Form 10-K.
x
Indicate by check mark whether the registrant is a large accelerated filer, an accelerated filer, a non-accelerated filer, or a smaller reporting company. See the definitions of “large accelerated filer,” “accelerated filer” and “smaller reporting company” in Rule 12b-2 of the Exchange Act.
|
Large accelerated filer
|
o
|
Accelerated filer
|
o
|
|
|
Non-accelerated filer
|
x
(Do not check if a smaller reporting company)
|
Smaller reporting company
|
o
|
|
Indicate by check mark whether the registrant is a shell company (as defined in Rule 12b-2 of the Act).
o
Yes
x
No
The aggregate market value of the voting and non-voting stock held by non-affiliates of the registrant as of June 30, 2014, the last business day of the registrant's most recently completed second fiscal quarter, was
$741.1 million
based upon the closing price reported for such date on the New York Stock Exchange.
As of
March 4, 2015
, the number of shares outstanding of the registrant’s common stock was
137,098,703
.
DOCUMENTS INCORPORATED BY REFERENCE
Portions of the registrant's Proxy Statement for the 2015 Annual Meeting of Stockholders are incorporated herein by reference into Part III of this Annual Report on Form 10-K where indicated. Such proxy statement will be filed with the Securities and Exchange Commission within 120 days after the end of the registrant's fiscal year ended December 31, 2014.
OUTFRONT Media Inc.
Table of Contents
|
PART I
|
||
|
PART II
|
||
|
PART III
|
||
|
PART IV
|
||
|
SIGNATURES
|
||
Except as otherwise indicated or unless the context otherwise requires, all references in this Annual Report on Form 10-K to (i) “the Company,” “we,” “our,” “us” and “our company” mean OUTFRONT Media Inc. (formerly known as CBS Outdoor Americas Inc.), a Maryland corporation, and unless the context requires otherwise, its consolidated subsidiaries, and (ii) the “25 largest markets” in the United States, the “180 markets in the United States, Canada and Latin America” and “Nielson Designated Market Areas” are based on Nielsen Media Research’s Designated Market Area rankings as of January 1, 2014.
CAUTIONARY STATEMENT REGARDING FORWARD-LOOKING STATEMENTS
We have made statements in this Annual Report on Form 10-K that are forward-looking statements within the meaning of the federal securities laws, including the Private Securities Litigation Reform Act of 1995. You can identify forward-looking statements by the use of forward-looking terminology such as “believes,” “expects,” “could,” “would,” “may,” “might,” “will,” “should,” “seeks,” “likely,” “intends,” “plans,” “projects,” “predicts,” “estimates,” “forecast” or “anticipates” or the negative of these words and phrases or similar words or phrases that are predictions of or indicate future events or trends and that do not relate solely to historical matters. You can also identify forward-looking statements by discussions of strategy, plans or intentions related to our real estate investment trust (“REIT”) status and our capital resources, portfolio performance and results of operations.
Forward-looking statements involve numerous risks and uncertainties and you should not rely on them as predictions of future events. Forward-looking statements depend on assumptions, data or methods that may be incorrect or imprecise and may not be able to be realized. We do not guarantee that the transactions and events described will happen as described (or that they will happen at all). The following factors, among others, could cause actual results and future events to differ materially from those set forth or contemplated in the forward-looking statements:
|
•
|
Declines in advertising and general economic conditions;
|
|
•
|
Competition;
|
|
•
|
Government regulation;
|
|
•
|
Our inability to increase the number of digital advertising displays in our portfolio;
|
|
•
|
Taxes, fees and registration requirements;
|
|
•
|
Our ability to obtain and renew key municipal concessions on favorable terms;
|
|
•
|
Decreased government compensation for the removal of lawful billboards;
|
|
•
|
Content-based restrictions on outdoor advertising;
|
|
•
|
Environmental, health and safety laws and regulations;
|
|
•
|
Seasonal variations;
|
|
•
|
Acquisitions and other strategic transactions that we may pursue could have a negative effect on our results of operations;
|
|
•
|
Time and resources to comply with rules and regulations as a stand-alone public company;
|
|
•
|
Incremental costs incurred as a stand-alone public company;
|
|
•
|
Dependence on our management team and advertising executives;
|
|
•
|
The ability of our board of directors to cause us to issue additional shares of stock without stockholder approval;
|
|
•
|
Certain provisions of Maryland law may limit the ability of a third party to acquire control of us;
|
|
•
|
Our rights and the rights of our stockholders to take action against our directors and officers are limited;
|
|
•
|
Our substantial indebtedness;
|
|
•
|
Restrictions in the agreements governing our indebtedness;
|
|
•
|
Incurrence of additional debt;
|
|
•
|
Interest rate risk exposure from our variable-rate indebtedness;
|
|
•
|
Our ability to generate cash to service our indebtedness;
|
|
•
|
Hedging transactions;
|
|
•
|
Establishing an operating partnership;
|
|
•
|
Asset impairment charges for goodwill;
|
|
•
|
Diverse risks in our international business;
|
|
•
|
A breach of our security measures;
|
|
•
|
Failure to comply with regulations regarding privacy and data protection;
|
|
•
|
Failing to establish in a timely manner “OUTFRONT” as an independently recognized brand name with a strong reputation;
|
|
•
|
The financial information included in our filings with the Securities and Exchange Commission (the “SEC”) may not be a reliable indicator of our future results;
|
|
•
|
Cash available for distributions;
|
|
•
|
Legislative, administrative, regulatory or other actions affecting REITs, including positions taken by the Internal Revenue Service (the “IRS”);
|
|
•
|
Our failure to remain qualified to be taxed as a REIT;
|
3
|
•
|
REIT ownership limits;
|
|
•
|
REIT distribution requirements;
|
|
•
|
Availability of external sources of capital;
|
|
•
|
We may face other tax liabilities even if we remain qualified to be taxed as a REIT;
|
|
•
|
Complying with REIT requirements may cause us to liquidate investments or forgo otherwise attractive opportunities;
|
|
•
|
Our ability to contribute certain contracts to a taxable REIT subsidiary (“TRS”);
|
|
•
|
Our planned use of TRSs may cause us to fail to remain qualified to be taxed as a REIT;
|
|
•
|
Our ability to hedge effectively;
|
|
•
|
Failure to meet the REIT income tests as a result of receiving non-qualifying income;
|
|
•
|
Even if we remain qualified to be taxed as a REIT, and we sell assets, we could be subject to tax on any unrealized net built-in gains in the assets held before electing to be treated as a REIT;
|
|
•
|
The IRS may deem the gains from sales of our outdoor advertising assets to be subject to a 100% prohibited transaction tax;
|
|
•
|
Our lack of an operating history as a REIT; and
|
|
•
|
We may not be able to engage in desirable strategic or capital-raising transactions as a result of the Separation (as defined herein), and we could be liable for adverse tax consequences resulting from engaging in significant strategic or capital-raising transactions.
|
While forward-looking statements reflect our good-faith beliefs, they are not guarantees of future performance. All forward-looking statements in this Annual Report on Form 10-K apply as of the date of this report or as of the date they were made and, except as required by applicable law, we disclaim any obligation to publicly update or revise any forward-looking statement to reflect changes in underlying assumptions or factors of new information, data or methods, future events or other changes. For a further discussion of these and other factors that could impact our future results, performance or transactions, see “Item 1A. Risk Factors” in this Annual Report on Form 10-K. You should understand that it is not possible to predict or identify all such factors. Consequently, you should not consider any such list to be a complete set of all potential risks or uncertainties.
4
Overview
We are one of the largest providers of advertising space on out-of-home advertising structures and sites across the United States, Canada and Latin America. Our inventory portfolio consists of billboard displays, which are primarily located on the most heavily traveled highways and roadways in top Nielsen Designated Marketing Areas, and transit advertising displays with exclusive multi-year contracts with municipalities in large cities across the United States. In total, we have displays in all of the 25 largest markets in the United States and over 180 markets in the United States, Canada and Latin America. Our top market, high profile location focused portfolio includes sites such as the Bay Bridge in San Francisco, various locations along Sunset Boulevard in Los Angeles, and various sites in and around both Grand Central Station and Times Square in New York. With TAB Out of Home Ratings, we are able to provide advertisers with the actual audience, in terms of size and demographic composition, that is exposed to individual signs. The combination of location and audience delivery is a selling proposition unique to the out-of-home industry. The breadth and depth of our portfolio provides our customers with a multitude of options to address a wide range of marketing objectives from national, brand-building campaigns to hyper-local businesses that want to drive customers to their retail location “one mile down the road.”
We believe that out-of-home advertising is an attractive form of advertising as our displays are ALWAYS ON™ and cannot be turned off, skipped or fast-forwarded, and that it provides our customers with a differentiated advertising solution at an attractive price point relative to other forms of advertising. We also believe that out-of-home is effective as a “stand-alone” media form, and as an integral part of a multi-media campaign, providing enhancements to mobile, social and on-line advertising by amplifying small screen messaging. In addition to leasing displays, we provide other value-added services to our customers, such as pre-campaign category research, creative design support and post-campaign tracking and analytics. We use a real-time mobile operations reporting system that facilitates proof of performance to customers. We have a diversified base of customers across various industries.
We generally (i) own the physical billboard structures on which we display advertising copy for our customers, (ii) hold the legal permits to display advertising thereon and (iii) lease the underlying sites. These lease agreements have terms varying between one month and multiple years, and usually provide renewal options. We estimate that approximately 75% of our billboard structures in the United States are “legal nonconforming” billboards, meaning they were legally constructed under laws in effect at the time they were built, but could not be constructed under current laws. These structures are often located in areas where it is difficult or not permitted to build additional billboards under current laws, which enhances the value of our portfolio. We have a highly diversified portfolio of advertising sites. As of
December 31, 2014
, we had approximately
23,600
lease agreements with approximately
19,000
different landlords in the United States. A substantial number of these lease agreements allow us to abate rent and/or terminate the lease agreement in certain circumstances, which may include where the structure is obstructed, where there is a change in traffic flow and/or where the advertising value of the sign structure is otherwise impaired, providing us with flexibility in renegotiating the terms of our leases with landlords.
We manage our business through the following two segments:
United States.
As of
December 31, 2014
, we had the largest number of advertising displays of any out-of-home advertising company operating in the 25 largest markets in the United States. Our U.S. segment generated
22%
of its revenues in the New York City metropolitan area in
2014
, and 20% in each of
2013
and 2012, and generated
13%
in the Los Angeles metropolitan area in each of
2014
,
2013
and 2012. Our U.S. segment generated revenues of
$1.20 billion
in 2014,
$1.13 billion
in 2013 and
$1.10 billion
in 2012, and Adjusted OIBDA of
$416.2 million
in 2014,
$406.4 million
in 2013 and
$385.4 million
in 2012.
International
. Our International segment includes our operations in Canada and Latin America, including Mexico, Argentina, Brazil, Chile and Uruguay. Our International segment generated revenues of
$155.0 million
in 2014,
$163.9 million
in 2013 and
$186.0 million
in 2012, and Adjusted OIBDA of
$24.3 million
in 2014,
$29.1 million
in 2013, and
$30.5 million
in 2012.
For additional information regarding our revenues, profits and assets by segment and by geographic area, see “Item 7. Management’s Discussion and Analysis of Financial Condition and Results of Operations” and our consolidated financial statements and the notes thereto in Part II, Item 8, of this Annual Report on Form 10-K.
5
History
Our corporate history can be traced back to companies that helped to pioneer the growth of out-of-home advertising in the United States, such as Outdoor Systems, Inc., 3M National, Gannett Outdoor and TDI Worldwide Inc. In 1996, a predecessor of CBS Corporation (“CBS”) acquired TDI Worldwide Inc., which specialized in transit advertising. Three years later, a predecessor of CBS acquired Outdoor Systems, Inc., which represented the consolidation of the outdoor advertising assets of large national operators such as 3M National, Gannett Outdoor (and its Canadian assets held in the name Mediacom) and Vendor (a Mexican outdoor advertising company) and many local operators in the United States, Canada and Mexico. In 2008, a subsidiary of CBS expanded our business into South America through the acquisition of International Outdoor Advertising Holdings Co., which operated in Argentina, Brazil, Chile and Uruguay. The company that we are today represents the hard-to-replicate combination of the assets of all of these businesses, as well as other acquisitions and internally developed assets.
On April 2, 2014, we completed an initial public offering (the “IPO”) of our common stock. On April 16, 2014, CBS received a private letter ruling from the IRS with respect to certain issues relevant to our ability to qualify as a REIT. On July 16, 2014, CBS completed a registered offer to exchange 97,000,000 shares of our common stock that were owned by CBS for outstanding shares of CBS Class B common stock (“the Exchange Offer”). In connection with the Exchange Offer, CBS disposed of all of its shares of our common stock and as of July 16, 2014, we were separated from CBS (the “Separation”) and were no longer a subsidiary of CBS. On July 16, 2014, in connection with the Separation, we ceased to be a member of the CBS consolidated tax group, and on July 17, 2014, we began operating in a manner that will allow us to qualify as a REIT for U.S. federal income tax purposes for our tax year commencing July 17, 2014 and ending December 31, 2014.
On November 20, 2014, the Company changed its legal name to “OUTFRONT Media Inc.”, and its common stock began trading on the New York Stock Exchange under its new ticker symbol “OUT.”
Recent Acquisition Activity
We regularly evaluate potential acquisitions, ranging from small “tuck-in” transactions to larger acquisitions. We completed
$19.6 million
of “tuck-in” acquisitions during 2014. On October 1, 2014, we completed the acquisition of certain outdoor advertising businesses (the “Acquired Business”) of Van Wagner Communications, LLC, for $690.0 million in cash, plus working capital adjustments (the “Acquisition”). The Acquisition was funded with cash on hand and the net proceeds from the issuance and sale of the New Senior Notes (as defined herein). For additional information regarding our acquisition activity, see “Item 7. Management’s Discussion and Analysis of Financial Condition and Results of Operations—Liquidity and Capital Resources.”
Tax Status
Our qualification to be taxed as a REIT is dependent on our ability to meet various complex requirements under the Internal Revenue Code of 1986, as amended (the “Code”), related to, among other things, the sources of our gross income, the composition and values of our assets and the diversity of ownership of our shares. See “Item 1A. Risk Factors—Risks Related to Our Status as a REIT.” As long as we remain qualified to be taxed as a REIT, we generally will not be subject to U.S. federal income tax on REIT taxable income that we distribute to stockholders. To maintain REIT status, we must meet a number of organizational and operational requirements, including a requirement that we annually distribute to our stockholders at least 90% of our REIT taxable income, determined without regard to the dividends-paid deduction and excluding any net capital gains. To the extent that we satisfy this distribution requirement and qualify for taxation as a REIT but distribute less than 100% of our REIT taxable income, determined with the above modifications, we will be subject to U.S. federal income tax on our undistributed net taxable income. In addition, we will be subject to a nondeductible 4% excise tax if the amount that we actually distribute to our stockholders in a calendar year is less than a minimum amount specified under U.S. federal tax laws.
We intend to pay regular quarterly distributions to our stockholders in an amount not less than 100% of our REIT taxable income (determined before the deduction for dividends paid).
We believe we are organized in conformity with the requirements for qualification and taxation as a REIT under the Code and that our manner of operation will enable us to continue to meet those requirements. If we fail to qualify to be taxed as a REIT in any taxable year and do not qualify for certain statutory relief provisions, we will be subject to U.S. federal income tax at regular corporate rates and will be precluded from re-electing REIT status for the subsequent four taxable years. Despite our status as a REIT, we will be subject to certain U.S. federal, state and local taxes on our income or property and the income of our taxable REIT subsidiaries (“TRSs”) will be subject to taxation at regular corporate rates.
In order to comply with certain REIT qualification requirements, on October 29, 2014, our board of directors approved a special dividend of $547.7 million, or $4.56 per share, to distribute our accumulated earnings and profits as of July 17, 2014,
6
the date we began operating in a manner that will allow us to qualify as a REIT for U.S. federal income tax purposes, including any earnings and profits allocated to the Company by CBS in connection with the Separation (the “E&P Purge”). The special dividend was paid on December 31, 2014, to stockholders of record on November 20, 2014. In connection with the special dividend, we paid $109.5 million in cash, and issued 16.5 million new shares of our common stock based on the volume weighted average price of our common stock for the three trading days commencing on December 16, 2014, or $26.4974 per share. A portion ($100.0 million) of the IPO proceeds was retained by us and was applied to the cash portion of the E&P Purge. CBS transferred the balance of the cash portion of the E&P Purge (approximately $9.5 million) to us prior to the payment of the special dividend to stockholders.
Prior to the Separation, we were a member of CBS’s consolidated tax group and were taxable as a regular domestic C corporation for U.S. federal income tax purposes (i.e., we were subject to taxation at regular corporate rates). Pursuant to the tax matters agreement that we entered into with CBS, we are liable to pay CBS for any taxes imposed on or related to us while we were a member of the CBS consolidated tax group. The tax matters agreement also separately allocates among the parties any tax liability arising as a result of any failure of the Separation to qualify as a tax-free transaction based on actions taken during the two-year period following the Separation. After the Separation, CBS ceased to own at least 80% of our outstanding common stock, and as a result, we were no longer a member of CBS’s consolidated tax group.
Growth Strategy
Continued Conversion to Digital Billboard Displays.
The majority of our digital billboard displays have been converted from traditional static billboard displays. Increasing the number of digital billboard displays in our most heavily trafficked locations is an important element of our organic growth strategy, as digital billboard displays have the potential to attract additional business from both new and existing customers. We believe digital billboard displays are attractive to our customers because they allow for the development of richer and more visually engaging messages, provide our customers with the flexibility both to target audiences by time of day and to quickly launch new advertising campaigns, and eliminate or greatly reduce production costs. In addition, digital billboard displays enable us to run multiple advertisements on each display (up to eight per minute). As a result, digital billboard displays generate approximately three to four times more revenue per display on average than traditional static billboard displays, and digital billboard displays generate higher profits and cash flows than traditional static billboard displays. See “—Renovation, Improvement and Development.” As of December 31, 2014, we had
511
digital billboard displays in the United States, representing approximately 1% of our total billboard displays in the United States. As of December 31, 2014, we had
48
digital billboard displays internationally, representing less than 1% of our total billboard displays outside of the United States. As the costs to convert traditional static billboard displays to digital billboard displays have declined, we have continued our conversion efforts, adding
110
digital billboard displays in the United States and
29
outside of the United States in 2014. This compares to approximately 110 digital billboard displays in the United States and 16 outside of the United States in 2013, and 110 digital displays in the United States and 3 outside the United States in 2012. We intend to spend a significant portion of our capital expenditures in the coming years to continue to increase the number of digital billboard displays in our portfolio.
Drive Enhanced Revenue Management.
We focus heavily on inventory management and advertising rate pricing to improve revenue yield over time across our portfolio of advertising structures and sites. By carefully managing our pricing on a market-by-market and display-by-display basis, we aim to improve profitability. We believe that closely monitoring pricing and improving pricing discipline will provide strong potential revenue enhancement.
Increased Use of Social Media and Mobile Technology Engagement.
We believe there is potential for growth in the reach and effectiveness of out-of-home advertising through increased use of social media and mobile technology engagement. In the coming years, we intend to pursue these opportunities, including possible strategic alliances and partnerships with social media and mobile technology companies.
Consider Selected Acquisition Opportunities.
As part of our growth strategy, we frequently evaluate strategic opportunities to acquire new businesses and assets. Consistent with this strategy, we regularly evaluate potential acquisitions, ranging from small “tuck-in” transactions to larger acquisitions. See “—Recent Acquisition Activity.” There can be no assurances that any transactions currently being evaluated will be consummated or, if consummated, that such transactions would prove beneficial to us. Further, our national footprint in the United States and significant presence in Canada and the countries in which we operate in Latin America provide us with an attractive platform on which to add additional advertising structures and sites. Our scale gives us advantages in driving additional revenues and reducing operating costs from acquired billboards. We believe that there is significant opportunity for additional industry consolidation, and we will evaluate opportunities to acquire additional advertising businesses and structures and sites on a case-by-case basis.
7
Continued Adoption & Refinement of Audience Measurement Systems; Utilization of Data/Analytics.
We believe the continued adoption and refinement of the out-of-home advertising industry’s audience measurement system, the “TAB Out of Home Ratings,” will enhance the value of the out-of-home medium by providing customers with improved audience measurement and the ability to target by gender, age, ethnicity and income. New refinements, including the impact of speed (i.e. how quickly a vehicle passes an individual billboard unit), and the recent inclusion of transit metrics, are making the measurement system more robust. Additionally, we will begin to utilize audience data and analytics for more effective targeting, which will factor in location and time in addition to a more granular audience profile. By providing a consistent and standardized audience measurement metric, and overlaying data that is becoming increasingly available and reliable, we will be able to help advertisers impact increasingly mobile audiences with effective media plans in the out-of-home environment for both static and digital displays.
Our Portfolio of Outdoor Advertising Structures and Sites
Diversification by Customer
For the year ended December 31,
2014
, no individual customer represented more than
1.6%
of our revenues in the United States. Therefore, we do not consider detailed information by individual customer to be meaningful.
Diversification by Industry
The following table sets forth information regarding the diversification of revenues earned in the United States among different industries for
2014
. For 2014, as a result of our diverse base of customers, in the United States, no single industry contributed more than
10%
of our revenues in the United States.
|
Percentage of Total United States Revenues for the Year Ended December 31,
|
||||||
|
Industry
|
2014
|
2013
|
||||
|
Retail
|
10
|
%
|
10
|
%
|
||
|
Television
|
8
|
|
8
|
|
||
|
Healthcare/Pharmaceuticals
|
8
|
|
7
|
|
||
|
Entertainment
|
7
|
|
7
|
|
||
|
Restaurants/Fast Food
|
6
|
|
7
|
|
||
|
Professional Services
|
6
|
|
6
|
|
||
|
Telephone/Utilities
|
5
|
|
6
|
|
||
|
Automotive
|
5
|
|
5
|
|
||
|
Financial Services
|
5
|
|
5
|
|
||
|
Casinos/Lottery
|
5
|
|
5
|
|
||
|
Beer/Liquor
|
4
|
|
5
|
|
||
|
Education
|
4
|
|
5
|
|
||
|
Movies
|
4
|
|
4
|
|
||
|
Travel/Leisure
|
4
|
|
4
|
|
||
|
Computers/Internet
|
4
|
|
4
|
|
||
|
Food/Non-Alcoholic Beverages
|
3
|
|
3
|
|
||
|
Real Estate Brokerage
|
2
|
|
1
|
|
||
|
Other
(a)
|
10
|
|
8
|
|
||
|
Total
|
100
|
%
|
100
|
%
|
||
|
(a)
|
No single industry in “Other” individually represents more than 2% of total revenues.
|
8
Diversification by Geography
Our advertising structures and sites are geographically diversified across 36 states and seven countries, as well as Washington D.C. and Puerto Rico. The following table sets forth information regarding the geographic diversification of our advertising structures and sites, including the Acquired Business, which are listed in order of contributions to total revenue.
|
Percentage of Total Revenues for the Year Ended
December 31, 2014
|
Number of Displays as of December 31, 2014
|
|||||||||||||||||||||||
|
Location (Metropolitan Area)
|
Billboard Displays
|
Transit and Other Displays
|
Total Displays
|
Billboard Displays
|
Transit and Other Displays
|
Total Displays
|
Percentage of Total Displays
|
|||||||||||||||||
|
New York, NY
|
6
|
%
|
54
|
%
|
19
|
%
|
492
|
|
182,966
|
|
183,458
|
|
48
|
%
|
||||||||||
|
Los Angeles, CA
|
11
|
|
12
|
|
11
|
|
4,741
|
|
41,280
|
|
46,021
|
|
12
|
|
||||||||||
|
State of New Jersey
|
5
|
|
<1
|
|
4
|
|
4,068
|
|
90
|
|
4,158
|
|
1
|
|
||||||||||
|
Miami, FL
|
4
|
|
3
|
|
4
|
|
1,071
|
|
14,801
|
|
15,872
|
|
4
|
|
||||||||||
|
Houston, TX
|
5
|
|
<1
|
|
4
|
|
1,189
|
|
—
|
|
1,189
|
|
<1
|
|
||||||||||
|
Detroit, MI
|
4
|
|
1
|
|
3
|
|
2,347
|
|
9,840
|
|
12,187
|
|
3
|
|
||||||||||
|
Washington D.C.
|
<1
|
|
9
|
|
3
|
|
26
|
|
36,186
|
|
36,212
|
|
10
|
|
||||||||||
|
San Francisco, CA
|
4
|
|
1
|
|
3
|
|
1,499
|
|
775
|
|
2,274
|
|
<1
|
|
||||||||||
|
Atlanta, GA
|
3
|
|
3
|
|
3
|
|
2,387
|
|
16,500
|
|
18,887
|
|
5
|
|
||||||||||
|
Chicago, IL
|
3
|
|
<1
|
|
2
|
|
1,090
|
|
613
|
|
1,703
|
|
<1
|
|
||||||||||
|
Dallas, TX
|
3
|
|
1
|
|
2
|
|
743
|
|
294
|
|
1,037
|
|
<1
|
|
||||||||||
|
Tampa, FL
|
3
|
|
<1
|
|
2
|
|
1,655
|
|
—
|
|
1,655
|
|
<1
|
|
||||||||||
|
Phoenix, AZ
|
3
|
|
2
|
|
2
|
|
1,852
|
|
3,170
|
|
5,022
|
|
1
|
|
||||||||||
|
Orlando, FL
|
2
|
|
<1
|
|
2
|
|
1,557
|
|
—
|
|
1,557
|
|
<1
|
|
||||||||||
|
St. Louis, MO
|
2
|
|
<1
|
|
1
|
|
1,456
|
|
—
|
|
1,456
|
|
<1
|
|
||||||||||
|
All other United States and Puerto Rico
|
30
|
|
4
|
|
24
|
|
19,937
|
|
4,282
|
|
24,219
|
|
6
|
|
||||||||||
|
Total United States
|
88
|
|
91
|
|
89
|
|
46,110
|
|
310,797
|
|
356,907
|
|
94
|
|
||||||||||
|
Canada
|
6
|
|
5
|
|
6
|
|
5,984
|
|
4,040
|
|
10,024
|
|
3
|
|
||||||||||
|
Mexico
|
4
|
|
1
|
|
3
|
|
4,405
|
|
82
|
|
4,487
|
|
1
|
|
||||||||||
|
South America
|
2
|
|
3
|
|
2
|
|
2,253
|
|
4,650
|
|
6,903
|
|
2
|
|
||||||||||
|
Total International
|
12
|
|
9
|
|
11
|
|
12,642
|
|
8,772
|
|
21,414
|
|
6
|
|
||||||||||
|
Total
|
100
|
%
|
100
|
%
|
100
|
%
|
58,752
|
|
319,569
|
|
378,321
|
|
100
|
%
|
||||||||||
|
Total revenues (in millions)
|
$
|
972.1
|
|
$
|
381.7
|
|
$
|
1,353.8
|
|
|||||||||||||||
The
New York and Los Angeles metropolitan areas contributed 52% and 13%, respectively, of total transit and other revenues in 2013. Los Angeles contributed 10% of total billboard revenues in 2013. The New York and Los Angeles metropolitan areas contributed 50% and 12%, respectively, of total transit and other revenues in 2012.
For additional information regarding revenues for our billboard displays and transit and other displays, by segment, for the years ended December 31, 2014, 2013 and 2012, see “Item 7. Management’s Discussion and Analysis of Financial Condition and Results of Operations” and our consolidated financial statements and the notes thereto in Part II, Item 8, of this Annual Report on Form 10-K.
Renovation, Improvement and Development
Most of our non-maintenance capital expenditures are directed towards new revenue-generating projects, such as the conversion of traditional static billboard displays to digital. As of December 31, 2014, we had
511
digital billboard displays in the United States, representing approximately 1% of our total billboard displays in the United States. As of December 31, 2014, we had
48
digital billboards internationally, representing less than 1% of our total billboard displays outside of the United States. As of December 31, 2014, we had
48
digital billboards internationally, representing less than 1% of our total billboard
9
displays outside of the United States. As the costs to convert traditional static billboard displays to digital billboard displays have declined, we have continued our conversion efforts, adding
110
digital billboard displays in the United States and
29
outside of the United States in 2014. This compares to approximately 110 digital billboard displays in the United States and 16 outside of the United States in 2013, and 110 digital billboards in the United States and 3 outside of the United States in 2012. Revenues related to digital billboards in the United States were
$93.6 million
and outside of the United States were
$3.8 million
in 2014,
$71.9 million
and $1.0 million in 2013 and
$57.8 million
and none in 2012, respectively. As of December 31, 2014, our average initial investment required for a digital billboard display is approximately $250,000. Digital billboard displays generate approximately three to four times more revenue per display on average than traditional static billboard displays. Digital billboard displays also incur, on average, approximately two to three times more operating costs, including higher variable costs associated with the increase in revenue, than traditional static billboard displays. As a result, digital billboard displays generate higher profits and cash flows than traditional static billboard displays. We intend to spend a significant portion of our capital expenditures in the coming years to continue increasing the number of digital billboard displays in our portfolio.
We routinely invest capital in the maintenance and repair of our billboard and transit structures. This includes safety initiatives and replaced displays, as well as new billboard components such as panels, sections, catwalks, lighting and ladders. Our maintenance capital expenditures were
$23.3 million
in 2014,
$23.7 million
in 2013 and
$14.0 million
in 2012.
Contract Expirations
We derive revenues primarily from providing advertising space to customers on our advertising structures and sites. Our contracts with customers generally cover periods ranging from four weeks to one year and are generally billed every four weeks. Since contract terms are short-term in nature, revenues by year of contract expiration are not considered meaningful.
Insurance
Prior to the Separation, the advertising structures and sites in our portfolio were covered under CBS’s blanket policy for commercial general liability, fire, extended coverage, earthquake, business interruption and rental loss insurance. We were also covered by other CBS policies, including errors and omissions, terrorism, director’s and officer’s liability, fiduciary liability, employment practices liability, professional liability and workers’ compensation insurance. We are currently covered by our own policies under a stand-alone insurance program with policy specifications and insured limits based on our assessment of our business and the risks we face as a stand-alone company, which may differ from the policy specifications and insured limits under CBS’s plans. In the opinion of our management, our properties are adequately covered by insurance.
Competition
The outdoor advertising industry is fragmented, consisting of a large number of companies operating on a national basis, including, among others, our company, Clear Channel Outdoor Holdings, Inc., Lamar Advertising Company and JCDecaux S.A., as well as hundreds of smaller regional and local companies operating a limited number of displays in a single or a few local geographic markets. We compete with these companies for both customers and structure and display locations. We also compete with other media, including broadcast and cable television, radio, print media, direct mail marketers, and increasingly, with on-line, mobile and social media advertising platforms. In addition, we compete with a wide variety of out-of-home media, including advertising in shopping centers, airports, movie theaters, supermarkets and taxis. Advertisers compare relative costs of available media, including average cost per thousand impressions or “CPMs”, particularly when delivering a message to customers with distinct demographic characteristics. In competing with other media, the outdoor advertising industry relies on its relative cost efficiency and its ability to reach specific markets, geographic areas and/or demographics.
Seasonality
Our revenues and profits may fluctuate due to seasonal advertising patterns and influences on advertising markets. Typically, our revenues and profits are highest in the fourth quarter, during the holiday shopping season, and lowest in the first quarter, as advertisers cut back on spending following the holiday shopping season. We expect this trend to continue in the future.
Employees
As of December 31, 2014, we had approximately 2,531 employees, of which 319 were local account executives in our U.S. segment, 46 were national account executives in our U.S. segment and 91 were account executives in our International segment. As of December 31, 2014, approximately 2,492 of our employees were full-time employees and approximately 39
10
were part-time employees. Some of these employees are represented by labor unions and are subject to collective bargaining agreements.
Regulation
The outdoor advertising industry is subject to governmental regulation and enforcement at the federal, state and local levels in the United States and to national, regional and local laws and regulations in foreign countries. These regulations have a significant impact on the outdoor advertising industry and our business. The descriptions that follow are summaries and should be read in conjunction with the texts of the regulations described herein, which are subject to change. The descriptions do not purport to describe all present and proposed regulations affecting our businesses.
In the United States, the federal Highway Beautification Act of 1965 (the “HBA”) establishes a framework for the regulation of outdoor advertising on primary and interstate highways built with federal financial assistance. As a condition to federal highway assistance, the HBA requires states to restrict billboards on such highways to commercial and industrial areas, and imposes certain size, spacing and other requirements associated with the installation and operation of billboards. The HBA requires the development of state standards, promotes the expeditious removal of illegal signs and requires just compensation for takings, on affected roadways.
Municipal and county governments generally also have sign controls as part of their zoning laws and building codes, and many have adopted standards more restrictive than the federal requirements. Some state and local government regulations prohibit construction of new billboards and some allow new construction only to replace existing structures. Other state and local regulations and national, regional and local laws and regulations in foreign countries prohibit the relocation or modification of existing billboards, limit the ability to rebuild, replace, repair, maintain and upgrade “legal nonconforming” structures (billboards which conformed with applicable zoning regulations when built but which no longer conform to current zoning regulations), and impose restrictions on the construction, repair, maintenance, lighting, operation, upgrading, height, size, spacing and location of outdoor structures, and the use of new technologies such as digital signs. In addition, from time to time, third parties or local governments commence proceedings in which they assert that we own or operate structures that are not properly permitted or otherwise in strict compliance with applicable law.
Governmental regulation of advertising displays also limits our installation of additional advertising displays, restrict advertising displays to governmentally controlled sites or permit the installation of advertising displays in a manner that benefits our competitors disproportionately, any of which could have an adverse effect on our business, financial condition and results of operations.
Although state and local government authorities from time to time use the power of eminent domain to remove billboards, U.S. law requires payment of compensation if a state or political subdivision compels the removal of a lawful billboard along a primary or interstate highway that was built with federal financial assistance. Additionally, many states require similar compensation (or relocation) with regard to compelled removals of lawful billboards in other locations. Some local governments have attempted to force removal of billboards after a period of years under a concept called amortization. Under this concept the governmental body asserts that just compensation has been earned by continued operation of the billboard over a period of time. Thus far, we have generally been able to obtain satisfactory compensation for our billboards purchased or removed as a result of governmental action, although there is no assurance that this will continue to be the case in the future.
From time to time, legislation has been introduced in both the United States and foreign jurisdictions attempting to impose taxes on revenue from outdoor advertising or for the right to use outdoor advertising assets. Several jurisdictions have already imposed such taxes based on a percentage of our outdoor advertising revenue in that jurisdiction. In addition, some jurisdictions have taxed our personal property and leasehold interests in outdoor advertising locations using various other valuation methodologies. We expect U.S. and foreign jurisdictions to continue to try to impose such taxes as a way of increasing their revenue. In recent years, outdoor advertising also has become the subject of other targeted taxes and fees.
These laws may affect prevailing competitive conditions in our markets in a variety of ways. Such laws may reduce our expansion opportunities or may increase or reduce competitive pressure from other members of the outdoor advertising industry. No assurance can be given that existing or future laws or regulations, and the enforcement thereof, will not materially and adversely affect the outdoor advertising industry. However, we contest laws and regulations that we believe unlawfully restrict our constitutional or other legal rights and may adversely impact the growth of our outdoor advertising business.
A number of foreign, state and local governments have implemented or initiated taxes (including taxes on revenues from outdoor advertising or for the right to use outdoor advertising assets), fees and registration requirements in an effort to decrease or restrict the number of outdoor advertising structures and sites or raise revenues, or both. Restrictions on outdoor advertising
11
of certain products and services are or may be imposed by federal, state and local laws and regulations. For example, tobacco products have been effectively banned from outdoor advertising in all of the jurisdictions in which we currently do business.
As the owner or operator of various real properties and facilities, we must comply with various foreign, federal, state and local environmental, health and safety laws and regulations. We and our properties are subject to such laws and regulations related to the use, storage, disposal, emission and release of hazardous and nonhazardous substances and employee health and safety. Historically, with the exception of safety upgrades, we have not incurred significant expenditures to comply with these laws.
We intend to expand the deployment of digital billboards that display static digital advertising copy from various advertisers that change several times per minute. We have encountered some existing regulations in the United States and across some international jurisdictions that restrict or prohibit these types of digital displays. Furthermore, as digital advertising displays are introduced into the market on a large scale, existing regulations that currently do not apply to digital advertising displays by their terms could be revised to impose specific restrictions on digital advertising displays due to alleged concerns over, among other things, aesthetics or driver safety.
Available Information
Our website address is www.outfrontmedia.com. We are subject to the informational requirements of the Securities Exchange Act of 1934, as amended (the “Exchange Act”), and file or furnish reports, proxy statements, and other information with the SEC, including Annual Reports on Form 10-K, Quarterly Reports on Form 10-Q and Current Reports on Form 8-K and amendments to those reports filed or furnished pursuant to Section 13(a) or 15(d) of the Exchange Act. Such reports and other information filed by the Company with the SEC are available free of charge in the Investor Relations section of our website as soon as reasonably practicable after we electronically file such material with, or furnish it to, the SEC. The public may read and copy any materials we file with the SEC at the SEC’s Public Reference Room at 100 F Street, NE, Room 1580, Washington, DC 20549. The public may obtain information on the operation of the Public Reference Room by calling the SEC at 1-800-SEC-0330. The SEC maintains an Internet site that contains reports, proxy and information statements and other information regarding issuers that file electronically with the SEC at www.sec.gov. The contents of the websites referred to above are not incorporated into this filing.
You should carefully consider the following risks, together with all of the other information in this Annual Report on Form 10-K, including “Item 7. Management’s Discussion and Analysis of Financial Condition and Results of Operations” and our consolidated financial statements and the notes thereto in Part II, Item 8, before investing in the Company. The occurrence of any of the following risks might cause you to lose all or a part of your investment. Certain statements in the following risk factors constitute forward-looking statements. See “Cautionary Statement Regarding Forward-Looking Statements.”
Risks Related to Our Business and Operations
Our business is sensitive to a decline in advertising expenditures, general economic conditions and other external events beyond our control.
We derive our revenues from providing advertising space to customers on out-of-home advertising structures and sites. Our contracts with our customers generally cover periods ranging from four weeks to one year. A decline in the economic prospects of advertisers, the economy in general or the economy of any individual geographic market or industry, particularly a market or industry in which we conduct substantial business, such as the New York City, Los Angeles and New Jersey metropolitan areas, and the retail, television and healthcare/pharmaceuticals industries, could alter current or prospective advertisers’ spending priorities. Disasters, acts of terrorism, political uncertainty, extraordinary weather events, hostilities and power outages could interrupt our ability to display advertising on our advertising structures and sites and lead to a reduction in economic certainty and advertising expenditures. Any reduction in advertising expenditures could harm our business, financial condition or results of operations. In addition, advertising expenditures by companies in certain sectors of the economy represent a significant portion of our revenues. See “Item 1. Business—Our Portfolio of Outdoor Advertising Structures and Sites.” Any political, economic, social or technological change resulting in a reduction in these sectors’ advertising expenditures could adversely affect our business, financial condition and results of operations. Further, advertising expenditure patterns may be impacted by any of these factors; for example, advertisers’ expenditures may be made with less advance notice and may become difficult to forecast from period to period.
12
We operate in a highly competitive industry.
The outdoor advertising industry is fragmented, consisting of a large number of companies operating on a national basis, such as our company, Clear Channel Outdoor Holdings, Inc., Lamar Advertising Company and JCDecaux S.A. , as well as hundreds of smaller regional and local companies operating a limited number of displays in a single or a few local geographic markets. We compete with these companies for both customers and display locations. If our competitors offer advertising displays at rates below the rates we charge our customers, we could lose potential customers and could be pressured to reduce our rates below those currently charged to retain customers, which could have an adverse effect on our business, financial condition and results of operations. A majority of our display locations are leased, and a significant portion of those leases are month-to-month or have a short remaining term. If our competitors offer to lease display locations at rental rates higher than the rental rates we offer, we could lose display locations and could be pressured to increase rental rates above those we currently pays to site landlords, which could have an adverse effect on our business, financial condition and results of operations.
We also compete with other media, including broadcast and cable television, radio, print media, direct mail marketers and increasingly, with on-line, mobile and social media advertising platforms. In addition, we compete with a wide variety of out-of-home media, including advertising in shopping centers, airports, movie theaters, supermarkets and taxis. Advertisers compare relative costs of available media, including the average cost per thousand impressions or “CPM,” particularly when delivering a message to customers with distinct demographic characteristics. In competing with other media, the outdoor advertising industry relies on its relative cost efficiency and its ability to reach specific markets, geographic areas and/or demographics. If we are unable to compete on these terms, we could lose potential customers and could be pressured to reduce rates below those we currently charge to retain customers, which could have an adverse effect on our business, financial condition and results of operations.
Government regulation of outdoor advertising may restrict our outdoor advertising operations.
The outdoor advertising industry is subject to governmental regulation and enforcement at the federal, state and local levels in the United States and to national, regional and local restrictions in foreign countries. These regulations have a significant impact on the outdoor advertising industry and our business. See “Item 1. Business—Regulation.” Regulations and proceedings have made it increasingly difficult to develop new outdoor advertising structures and sites. If there are changes in laws and regulations affecting outdoor advertising at any level of government, if there is an increase in the enforcement of regulations or allegations of noncompliance or if we are unable to resolve allegations, our structures and sites could be subject to removal or modification. If we are unable to obtain acceptable arrangements or compensation in circumstances in which our structures and sites are subject to removal or modification, it could have an adverse effect on our business, financial condition and results of operations. In addition, governmental regulation of advertising displays could limit our installation of additional advertising displays, restrict advertising displays to governmentally controlled sites or permit the installation of advertising displays in a manner that benefits our competitors disproportionately, any of which could have an adverse effect on our business, financial condition and results of operations.
Our inability to increase the number of digital advertising displays in our portfolio could have an adverse effect on our business, financial condition and results of operations.
Our ability to increase the number of digital advertising displays in our portfolio is subject to governmental laws and regulations. For example, in 2013 a California court ruled in favor of a competitor who challenged the validity of our digital display permits in the City of Los Angeles and held that such permits should be invalidated. As another example, in January 2013, Scenic America, Inc., a nonprofit membership organization, filed a lawsuit against the U.S. Department of Transportation and the Federal Highway Administration alleging, among other things, that the Federal Highway Administration exceeded its authority when, in 2007, the Federal Highway Administration issued guidance to assist its division offices in evaluating state regulations that authorize the construction and operation of digital billboards. The case was dismissed in June 2014, but Scenic America filed a notice of appeal in August 2014. If the Federal Highway Administration guidance is vacated, the Federal Highway Administration could then elect to undertake rulemaking or other new administrative action with respect to digital billboard displays that, if enacted in a way that places additional restrictions on digital billboards, could also have an adverse effect on our business, financial condition and results of operations.
Any new governmental restrictions on digital advertising displays could limit our installation of additional digital advertising displays, restrict digital advertising displays to governmentally controlled sites or permit the installation of digital advertising displays in a manner that benefits our competitors disproportionately, any of which could have an adverse effect on our business, financial condition and results of operations. Furthermore, as digital advertising displays are introduced into the market on a large scale, existing regulations that currently do not apply to digital advertising displays by their terms could be revised to impose specific restrictions on digital advertising displays. See “Item 1. Business—Regulation.”
13
In addition, implementation of digital advertising displays by us or our competitors at a rate that exceeds the ability of the market to derive new revenues from those displays could also have an adverse effect on our business, financial condition and results of operations.
Taxes, fees and registration requirements may reduce our profits or expansion opportunities.
A number of foreign, state and local governments have implemented or initiated taxes (including taxes on revenue from outdoor advertising or for the right to use outdoor advertising assets), fees and registration requirements in an effort to decrease or restrict the number of outdoor advertising structures and sites or raise revenue, or both. For example, a tax was imposed on the outdoor advertising industry in Toronto. These efforts may continue, and, if we are unable to pass on the cost of these items to our customers, the increased imposition of these measures could have an adverse effect on our business, financial condition and results of operations.
The success of our transit advertising business is dependent on obtaining and renewing key municipal concessions on favorable terms.
Our transit shelter and transit systems businesses require us to obtain and renew contracts with municipalities and other governmental entities. All of these contracts have fixed terms and generally provide for payments to the governmental entity of a revenue share and/or a fixed payment amount. When these contracts expire, we generally must participate in highly competitive bidding processes in order to obtain a new contract. Our inability to successfully obtain or renew these contracts on favorable economic terms or at all could have an adverse effect on our financial condition and results of operations. In addition, the loss of a key municipal concession in one location could adversely affect our ability to compete in other locations by reducing our scale and ability to offer customers multiregional and national advertising campaigns. These factors could have an adverse effect on our financial condition and results of operations.
Government compensation for the removal of lawful billboards could decrease.
Although federal, state and local government authorities from time to time use the power of eminent domain to remove billboards, U.S. law requires payment of compensation if a government authority compels the removal of a lawful billboard along a primary or interstate highway that was built with federal financial assistance. Additionally, many states require similar compensation (or relocation) with regard to compelled removals of lawful billboards in other locations. Some local governments have attempted to force removal of billboards after a period of years under a concept called amortization. Under this concept, the governmental body asserts that just compensation has been earned by continued operation of the billboard over a period of time. Thus far, we have generally been able to obtain satisfactory compensation for our billboards purchased or removed as a result of governmental action, although there is no assurance that this will continue to be the case in the future, and, if it does not continue to be the case, there could be an adverse effect on our business, financial condition and results of operations.
Content-based restrictions on outdoor advertising may further restrict the categories of customers that can advertise using our structures and sites.
Restrictions on outdoor advertising of certain products and services are or may be imposed by federal, state and local laws and regulations. For example, tobacco products have been effectively banned from outdoor advertising in all of the jurisdictions in which we currently do business. In addition, state and local governments in some cases limit outdoor advertising of alcohol, which represented
4%
of our U.S. revenues in 2014 and
5%
of our U.S. revenues in 2013. Legislation regulating out-of-home advertising due to content-based restrictions could cause a reduction in our revenues from leasing advertising space on outdoor advertising displays that display such advertisements and a simultaneous increase in the available space on the existing inventory of billboards in the outdoor advertising industry, which could have an adverse effect on our business, financial condition and results of operations.
Environmental, health and safety laws and regulations may limit or restrict some of our operations.
As the owner or operator of various real properties and facilities, we must comply with various foreign, federal, state and local environmental, health and safety laws and regulations. We and our properties are subject to such laws and regulations related to the use, storage, disposal, emission and release of hazardous and nonhazardous substances and employee health and safety. Historically, with the exception of safety upgrades, we have not incurred significant expenditures to comply with these laws. However, additional laws that may be passed in the future, or a finding of a violation of or liability under existing laws, could
14
require us to make significant expenditures and otherwise limit or restrict some of our operations, which could have an adverse effect on our business, financial condition and results of operations.
Our operating results are subject to seasonal variations and other factors.
Our business has experienced and is expected to continue to experience seasonality due to, among other things, seasonal advertising patterns and seasonal influences on advertising markets. Typically, our revenues and profits are highest in the fourth quarter, during the holiday shopping season, and lowest in the first quarter, as advertisers cut back on spending following the holiday shopping season. The effects of such seasonality make it difficult to estimate future operating results based on the previous results of any specific quarter, which may make it difficult to plan capital expenditures and expansion, could affect operating results and could have an adverse effect on our business, financial condition and results of operations.
Acquisitions and other strategic transactions that we may pursue could have a negative effect on our results of operations.
We frequently evaluate strategic opportunities both within and outside our existing lines of business. We expect from time to time to pursue additional acquisitions of business and/or assets and other strategic transactions, including technology investments and/or the disposition of certain businesses and/or assets. These acquisitions or transactions could be material, and involve numerous risks, including:
|
•
|
acquisitions or other strategic transactions may prove unprofitable and fail to generate anticipated cash flows or gains;
|
|
•
|
integrating acquired businesses and/or assets may be more difficult, costly or time consuming than expected and the anticipated benefits and costs savings of such acquisitions or transactions may not be fully realized, for example:
|
|
◦
|
we may need to recruit additional senior management, as we cannot be assured that senior management of acquired businesses and/or assets will continue to work for us, and we cannot be certain that our recruiting efforts will succeed;
|
|
◦
|
unforeseen difficulties could divert significant time, attention and effort from management that could otherwise be directed at developing existing business;
|
|
◦
|
we may encounter difficulties expanding corporate infrastructure to facilitate the integration of our operations and systems with those of acquired businesses and/or assets, which may cause us to lose the benefits of any expansion; and/or
|
|
◦
|
we may lose billboard leases, franchises or advertisers in connection with such acquisitions or transactions, which could disrupt our ongoing businesses;
|
|
•
|
we may not be aware of all of the risks associated with any acquired businesses and/or assets and certain of our assumptions with respect to these acquired businesses and/or assets may prove to be inaccurate, which could result in unexpected litigation or regulatory exposure, unfavorable accounting treatment, unexpected increases in taxes due, a loss of anticipated tax benefits or other adverse effects on our business, operating results or financial condition;
|
|
•
|
we may not be able to obtain financing necessary to fund potential acquisitions or strategic transactions;
|
|
•
|
we may face increased competition for acquisitions of businesses and assets from other outdoor advertising companies, some of which may have greater financial resources than we do, which may result in higher prices for those businesses and assets;
|
|
•
|
we may enter into markets and geographic areas where we have limited or no experience; and
|
|
•
|
because we must comply with various requirements under the Code in order to maintain our qualification to be taxed as a REIT, including restrictions on the types of assets we may hold, the sources of our income and accumulation of earnings and profits, our ability to engage in certain acquisitions or strategic transactions, such as acquisitions of C corporations, may be limited. See “—Risks Related to Our Status as a REIT—Complying with REIT requirements may cause us to liquidate investments or forgo otherwise attractive opportunities.”
|
Further, additional acquisitions by us may require antitrust review by U.S. federal antitrust agencies and may require review by foreign antitrust agencies under the antitrust laws of foreign jurisdictions. We can give no assurances that the U.S. Department
15
of Justice, the U.S. Federal Trade Commission or foreign antitrust agencies will not seek to bar us from acquiring additional advertising businesses in any market.
As a stand-alone public company, we will expend additional time and resources to comply with rules and regulations that did not previously apply to us.
Upon completion of the IPO, we became required to implement substantial control systems and procedures in order to satisfy our periodic and current reporting requirements under applicable SEC regulations and comply with the Sarbanes-Oxley Act of 2002, the Dodd-Frank Wall Street Reform and Consumer Protection Act of 2010 and applicable listing standards. As a result, we began incurring significant legal, accounting and other expenses that we had not previously incurred, and our management and other personnel will need to devote a substantial amount of time to comply with these rules and regulations. These costs and time commitments could be substantially more than we currently expect. Therefore, our historical consolidated financial statements may not be indicative of our future costs and performance as a stand-alone public company. If our finance and accounting personnel are unable for any reason to respond adequately to the increased demands resulting from being an independent public company, the quality and timeliness of our financial reporting may suffer, and we could experience significant deficiencies or material weaknesses in our disclosure controls and procedures or internal control over financial reporting.
An inability to establish effective disclosure controls and procedures and internal control over financial reporting or remediate existing deficiencies could cause us to fail to meet our reporting obligations under the Exchange Act, or result in material weaknesses, material misstatements or omissions in our Exchange Act reports, any of which could have an adverse effect on our business, financial condition and results of operations.
We have incurred and will continue to incur significant charges in connection with the Separation and incremental costs as a stand-alone public company.
We have replicated or replaced certain functions, systems and infrastructure to which we no longer have the same access after the Separation. We have also made investments or hired additional employees to operate without the same access to CBS’s existing operational and administrative infrastructure. These initiatives have been costly to implement. We will continue to incur incremental costs as a stand-alone public company.
We are dependent on our management team, and the loss of senior executive officers or other key employees could have an adverse effect on our business, financial condition and results of operations.
We believe our future success depends on the continued service and skills of our existing management team and other key employees with experience and business relationships within their respective segments. The loss of one or more of these key personnel could have an adverse effect on our business, financial condition and results of operations because of their skills, knowledge of the market, years of industry experience and the difficulty of finding qualified replacement personnel. If any of these personnel were to leave and compete with us, it could have an adverse effect on our business, financial condition and results of operations.
Our board of directors has the power to cause us to issue additional shares of stock without stockholder approval.
Our charter authorizes us to issue additional authorized but unissued shares of common or preferred stock. In addition, our charter permits a majority of our entire board of directors to, without stockholder approval, amend our charter to increase or decrease the aggregate number of shares of stock or the number of shares of stock of any class or series that we have authority to issue. Our charter also permits our board of directors to classify or reclassify any unissued shares of common or preferred stock and set the preferences, rights and other terms of the classified or reclassified shares. As a result, our board of directors will be able to establish a series of shares of common or preferred stock that could delay or prevent a transaction or a change in control that might involve a premium price for shares of stock or otherwise be in the best interests of our stockholders.
Certain provisions of Maryland law may limit the ability of a third party to acquire control of us.
Certain provisions of the Maryland General Corporation Law (the “MGCL”) may have the effect of delaying or preventing a transaction or a change in control of us that might involve a premium price for shares of our stock or otherwise be in the best interests of our stockholders, including:
|
•
|
“business combination” provisions that, subject to certain exceptions, prohibit certain business combinations between a Maryland corporation and an “interested stockholder” (defined generally as any person who beneficially owns,
|
16
directly or indirectly, 10% or more of the voting power of a corporation’s outstanding voting stock or an affiliate or associate of a corporation who, at any time during the two-year period immediately prior to the date in question, was the beneficial owner of 10% or more of the voting power of the then-outstanding stock of the corporation) or an affiliate of such an interested stockholder for five years after the most recent date on which the stockholder becomes an interested stockholder, and thereafter imposes two super-majority stockholder voting requirements on these combinations; and
|
•
|
“control share” provisions that provide that, subject to certain exceptions, holders of “control shares” of a Maryland corporation (defined as voting shares of stock that, if aggregated with all other shares of stock owned or controlled by the acquirer, would entitle the acquirer to exercise voting power in the election of directors within one of three increasing ranges) acquired in a “control share acquisition” (defined as the direct or indirect acquisition of issued and outstanding “control shares,” subject to certain exceptions) have no voting rights except to the extent approved by its stockholders by the affirmative vote of at least two-thirds of all of the votes entitled to be cast on the matter, excluding all interested shares.
|
Additionally, we have elected to be subject to Title 3, Subtitle 8 of the MGCL, which permits our board of directors, without stockholder approval and regardless of what is provided in our charter or bylaws, to implement certain takeover defenses.
Our board of directors has by resolution exempted from the provisions of the Maryland Business Combination Act all business combinations (i) between CBS or its affiliates and us and (ii) between us and any other person, provided that such business combination is first approved by our board of directors (including a majority of our directors who are not affiliates or associates of such person). In addition, our bylaws contain a provision opting out of the Maryland Control Share Acquisition Act. Moreover, our charter provides that vacancies on our board may be filled only by a majority of the remaining directors, and that any directors elected by the board to fill vacancies will serve for the remainder of the full term of the class of directors in which the vacancy occurred and until a successor is elected and qualifies. Our charter provides that, subject to the rights, if any, of holders of any class or series of preferred stock to elect or remove one or more directors, members of our board of directors may be removed only for cause (as defined in our charter), and then only by the affirmative vote of at least two-thirds of the votes entitled to be cast generally in the election of directors. Our bylaws provide that our board of directors has the exclusive power to adopt, alter or repeal any provision of our bylaws and to make new bylaws. There can be no assurance that these exemptions or provisions will not be amended or eliminated at any time in the future.
Our rights and the rights of our stockholders to take action against our directors and officers are limited.
Our charter contains a provision that eliminates the liability of our directors and officers to the maximum extent permitted by Maryland law. In addition, our charter authorizes us, and our bylaws obligate us, to the maximum extent permitted by Maryland law in effect from time to time, to indemnify and, without requiring a preliminary determination of the ultimate entitlement to indemnification, pay or reimburse reasonable expenses in advance of final disposition of a proceeding to:
|
•
|
any present or former director or officer who is made or threatened to be made a party to, or witness in, a proceeding by reason of his or her service in that capacity; and
|
|
•
|
any individual who, while a director or officer of our company and at our request, serves or has served as a director, officer, trustee or manager of another corporation, real estate investment trust, limited liability company, partnership, joint venture, trust, employee benefit plan or any other enterprise and who is made or threatened to be made a party to, or witness in, the proceeding by reason of his or her service in that capacity.
|
Our charter and bylaws also permit us to indemnify and advance expenses to any person who served a predecessor of ours in any of the capacities described above and to any employee of our company or a predecessor of our company.
The indemnification and payment or reimbursement of expenses provided by the indemnification provisions of our charter and bylaws shall not be deemed exclusive of or limit in any way other rights to which any person seeking indemnification, or payment or reimbursement of expenses may be or may become entitled under any statute, bylaw, resolution, insurance, agreement, vote of stockholders or disinterested directors or otherwise.
In addition, we have entered into separate indemnification agreements with each of our directors. Each indemnification agreement provides, among other things, for indemnification as provided in the agreement and otherwise to the fullest extent permitted by law and our charter and bylaws against judgments, fines, penalties, amounts paid in settlement and reasonable expenses, including attorneys’ fees. The indemnification agreements provide for the advancement or payment of expenses to the indemnitee and for reimbursement to us if it is found that such indemnitee is not entitled to such advancement.
17
Accordingly, in the event that any of our directors or officers are exculpated from, or indemnified against, liability but whose actions impede our performance, we and our stockholders’ ability to recover damages from that director or officer will be limited.
We have substantial indebtedness that could adversely affect our financial condition.
On January 31, 2014, Outfront Media Capital LLC (“Finance LLC”) and Outfront Media Capital Corporation (“Finance Corp.” and together with Finance LLC, the “Borrowers”) borrowed $800.0 million under a term loan due in 2021 (the “Term Loan”), and entered into a $425.0 million Revolving Credit Facility maturing in 2019 (the “Revolving Credit Facility” and, together with the Term Loan, the “Senior Credit Facilities”), which are governed by a credit agreement, dated as of January 31, 2014, (the “Credit Agreement”). On January 31, 2014, the Borrowers also issued $400.0 million aggregate principal amount of the 5.250% Senior Unsecured Notes due 2022 and $400.0 million aggregate principal amount of 5.625% Senior Unsecured Notes due 2024 (together, the “Senior Notes”; we refer to the issuance of the Senior Notes and the borrowings under the Term Loan as the “Formation Borrowings”) in a private placement. In addition, on October 1, 2014, the Borrowers issued $150.0 million aggregate principal amount of additional 5.250% Senior Unsecured Notes due 2022 and $450.0 million aggregate principal amount of 5.875% Senior Unsecured Notes due 2025 (together, the “New Senior Notes” and, collectively with the Senior Notes, the “Notes”; we refer to the issuance of the New Senior Notes to finance a portion of the consideration for the Acquisition as the “Acquisition Borrowings”) in a private placement. As of December 31, 2014, we had total indebtedness of approximately $2.2 billion (consisting of the
$798.3 million
Term Loan, $800.0 million of Senior Notes and $600.0 million of New Senior Notes) and undrawn commitments under the Senior Credit Facilities of $425.0 million, excluding
$20.6 million
of letters of credit issued against the Revolving Credit Facility. See “Item 7. Management’s Discussion and Analysis of Financial Condition and Results of Operations—Liquidity and Capital Resources.”
Our level of debt could have important consequences, including:
|
•
|
making it more difficult for us to satisfy our obligations with respect to the Notes and our other debt;
|
|
•
|
requiring us to dedicate a substantial portion of our cash flow from operations to payments on indebtedness, thereby reducing the availability of cash flow to fund acquisitions, working capital, capital expenditures, research and development efforts and other corporate purposes;
|
|
•
|
increasing our vulnerability to and limiting our flexibility in planning for, or reacting to, changes in the business, the industries in which we operate, the economy and governmental regulations;
|
|
•
|
restricting us from making strategic acquisitions or causing us to make non-strategic divestitures;
|
|
•
|
exposing us to the risk of increased interest rates as borrowings under the Senior Credit Facilities are expected to be subject to variable rates of interest;
|
|
•
|
placing us at a competitive disadvantage compared to our competitors that have less debt; and
|
|
•
|
limiting our ability to borrow additional funds.
|
The terms of the Credit Agreement and the indentures governing the Notes restrict our current and future operations, particularly our ability to incur debt that we may need to fund initiatives in response to changes in our business, the industries in which we operate, the economy and governmental regulations.
The Credit Agreement and the indentures governing the Notes contain a number of restrictive covenants that impose significant operating and financial restrictions on us and our subsidiaries and limit our ability to engage in actions that may be in our long-term best interests, including restrictions on our and our subsidiaries’ ability to:
|
•
|
incur additional indebtedness;
|
|
•
|
pay dividends on, repurchase or make distributions in respect of our capital stock;
|
|
•
|
make investments or acquisitions;
|
|
•
|
sell, transfer or otherwise convey certain assets;
|
18
|
•
|
change our accounting methods;
|
|
•
|
create liens;
|
|
•
|
enter into sale/leaseback transactions;
|
|
•
|
enter into agreements restricting the ability to pay dividends or make other intercompany transfers;
|
|
•
|
consolidate, merge, sell or otherwise dispose of all or substantially all of our or our subsidiaries’ assets;
|
|
•
|
enter into transactions with affiliates;
|
|
•
|
prepay certain kinds of indebtedness;
|
|
•
|
issue or sell stock of our subsidiaries; and
|
|
•
|
change the nature of our business.
|
In addition, the Credit Agreement has a financial covenant that requires us to maintain a Consolidated Net Secured Leverage Ratio (as described herein). Our ability to meet this financial covenant may be affected by events beyond our control.
As a result of all of these restrictions, we may be:
|
•
|
limited in how we conduct our business;
|
|
•
|
unable to raise additional debt or equity financing to operate during general economic or business downturns; or
|
|
•
|
unable to compete effectively or to take advantage of new business opportunities.
|
These restrictions could hinder our ability to grow in accordance with our strategy or inhibit our ability to adhere to our intended distribution policy and, accordingly, may cause us to incur additional U.S. federal income tax liability beyond current expectations.
A breach of the covenants under the Credit Agreement or either of the indentures governing the Notes could result in an event of default under the applicable agreement. Such a default would allow the lenders under the Senior Credit Facilities and holders of the Notes to accelerate the repayment of such debt and may result in the acceleration of the repayment of any other debt to which a cross-acceleration or cross-default provision applies. In addition, an event of default under the Credit Agreement would also permit the lenders under the Senior Credit Facilities to terminate all other commitments to extend additional credit under the Senior Credit Facilities.
Furthermore, if we were unable to repay the amounts due and payable under the Senior Credit Facilities, those lenders could proceed against the collateral that secures such indebtedness. In the event our creditors accelerate the repayment of our borrowings, we and our subsidiaries may not have sufficient assets to repay that indebtedness.
Despite our substantial indebtedness level, we and our subsidiaries may be able to incur substantially more indebtedness, including secured indebtedness. This could further exacerbate the risks to our financial condition described above.
We and our subsidiaries may incur significant additional indebtedness in the future, including secured indebtedness. Although the indentures governing the Notes and the Credit Agreement contain restrictions on the incurrence of additional indebtedness and additional liens, these restrictions will be subject to a number of qualifications and exceptions, and the additional indebtedness, including secured indebtedness, incurred in compliance with these restrictions could be substantial. If we incur any additional indebtedness that ranks equally with the Notes, subject to collateral arrangements, the holders of that debt will be entitled to share ratably with you in any proceeds distributed in connection with any insolvency, liquidation, reorganization, dissolution or other winding up of our business. This may have the effect of reducing the amount of proceeds paid to you. These restrictions also will not prevent us from incurring obligations that do not constitute indebtedness. If new debt is added to our current debt levels, the related risks that we now face would increase.
19
Our variable rate indebtedness subjects us to interest rate risk, which could cause our debt service obligations to increase significantly.
Borrowings under the Senior Credit Facilities are at variable rates of interest and expose us to interest rate risk. If interest rates increase, our debt service obligations on the variable rate indebtedness will increase even though the amount borrowed remains the same, and our net income and cash flows will correspondingly decrease. At our level of indebtedness, as of December 31, 2014, each 1/8% change in interest rates on our variable rate indebtedness would have resulted in a $1.0 million change in annual estimated interest expense. This amount will increase due to any borrowings we make under our Revolving Credit Facility. In the future, we may enter into interest rate swaps that involve the exchange of floating for fixed rate interest payments in order to reduce future interest rate volatility. However, we may not elect to maintain such interest rate swaps with respect to any of our variable rate indebtedness, and any swaps we enter into may not fully mitigate our interest rate risk.
To service our indebtedness, we require a significant amount of cash and our ability to generate cash depends on many factors beyond our control.
Our ability to make cash payments on and to refinance our indebtedness, including the Notes, and to fund planned capital expenditures will depend on our ability to generate significant operating cash flow in the future. Our ability to generate such cash flow is subject to general economic, financial, competitive, legislative, regulatory and other factors that are beyond our control. In addition, our ability to generate cash flow may be affected by our REIT compliance obligations and any consequences of failing to remain qualified as a REIT. See “—Risks Related to Our Status as a REIT.”
Our business may not generate cash flow from operations in an amount sufficient to enable us to pay our indebtedness, including the Notes, or to fund our other liquidity needs. If we cannot service our indebtedness, we may have to take actions such as refinancing or restructuring our indebtedness, selling assets or reducing or delaying capital expenditures, strategic acquisitions and investments. Such actions, if necessary, may not be effected on commercially reasonable terms or at all. Our ability to refinance or restructure our debt will depend on the condition of the capital markets and our financial condition at the applicable time. Any refinancing of our debt could be at higher interest rates and may require us to comply with more onerous covenants, which could further restrict our business operations. Further, the Credit Agreement and the indentures governing the Notes restrict our ability to undertake or use the proceeds from such measures.
Hedging transactions could have a negative effect on our results of operations.
We may enter into hedging transactions, including without limitation, with respect to foreign currency exchange rates and interest rate exposure on one or more of our assets or liabilities. The use of hedging transactions involves certain risks, including: (1) the possibility that the market will move in a manner or direction that would have resulted in a gain for us had a hedging transaction not been utilized, in which case our performance would have been better had we not engaged in the hedging transaction; (2) the risk of an imperfect correlation between the risk sought to be hedged and the hedging transaction used; (3) the potential illiquidity for the hedging instrument used, which may make it difficult for us to close out or unwind a hedging transaction; (4) the possibility that our counterparty fails to honor its obligations; and (5) the possibility that we may have to post collateral to enter into hedging transactions, which we may lose if we are unable to honor our obligations. We intend to remain qualified to be taxed as a REIT for U.S. federal income tax purposes, as a result of which we have limitations on our income sources, and the hedging strategies available to us will be more limited than those available to companies that are not REITs.
We may establish an operating partnership, which could result in conflicts of interests between our stockholders and holders of our operating partnership units and could limit our liquidity or flexibility.
In the future, we may establish an operating partnership. If we establish an operating partnership, persons holding operating partnership units may have the right to vote on certain amendments to the partnership agreement of our operating partnership, as well as on certain other matters. Unitholders holding these voting rights may be able to exercise them in a manner that conflicts with the interests of our stockholders. Circumstances may arise in the future when the interests of unitholders in our operating partnership conflict with the interests of our stockholders. As the sole member of the general partner of the operating partnership or as the managing member, we would have fiduciary duties to the unitholders of the operating partnership that may conflict with duties that our officers and directors owe to us.
In addition, if we establish an operating partnership, we may acquire certain assets by issuing units in our operating partnership in exchange for an asset owner contributing such assets to the partnership or a subsidiary. If we enter into such transactions, in order to induce the contributors of such assets to accept units in our operating partnership, rather than cash, in exchange for their assets, it may be necessary for us to provide them additional incentives. For instance, our operating partnership’s limited
20
partnership or limited liability company agreement may provide that any unitholder of our operating partnership may exchange units for cash equal to the value of an equivalent number of shares of our common stock or, at our option, for shares of our common stock on a one-for-one basis. We may also enter into additional contractual arrangements with asset contributors under which we would agree to repurchase a contributor’s units for shares of our common stock or cash, at the option of the contributor, at set times. If the contributor required us to repurchase units for cash pursuant to such a provision, it would limit our liquidity and thus our ability to use cash to make other investments, satisfy other obligations or make distributions to stockholders. Moreover, if we were required to repurchase units for cash at a time when we did not have sufficient cash to fund the repurchase, we might be required to sell one or more assets to raise funds to satisfy this obligation. Furthermore, we might agree that if distributions the contributor received as a unitholder in our operating partnership did not provide the contributor with a defined return, then upon redemption of the contributor’s units we would pay the contributor an additional amount necessary to achieve that return. Such a provision could further negatively impact our liquidity and flexibility. Finally, in order to allow a contributor of assets to defer taxable gain on the contribution of assets to our operating partnership, we might agree not to sell a contributed asset for a defined period of time or until the contributor exchanged the contributor’s units for cash or shares. Such an agreement would prevent us from selling those properties, even if market conditions made such a sale favorable to us.
We could suffer losses due to asset impairment charges for goodwill.
A significant portion of our assets consists of goodwill. We test goodwill for impairment during the fourth quarter of each year and between annual tests if events or circumstances require an interim impairment assessment. A downward revision in the estimated fair value of a reporting unit could result in a noncash impairment charge. Any such impairment charge could have a material adverse effect on our reported net income.
We face diverse risks in our international business, which could adversely affect our business, financial condition and results of operations.
Our International segment contributed approximately
11%
to total revenues in 2014, approximately 13% to total revenues in 2013 and approximately 14% to total revenues in 2012. Inherent risks in our international business activities could decrease our International sales and have an adverse effect on our business, financial condition and results of operations. These risks include potentially unfavorable foreign economic conditions, political conditions or national priorities, foreign government regulation and changes in such regulation, violations of applicable anti-corruption laws or regulations, potential expropriation of assets by foreign governments, the failure to bridge cultural differences and limited or prohibited access to our foreign operations and the support they provide. We may also have difficulty repatriating profits or be adversely affected by exchange rate fluctuations in our international business.
If our security measures are breached, we may face liability, and public perception of our services could be diminished, which would negatively impact our ability to attract business partners and advertisers.
Although we have implemented physical and electronic security measures to protect against the loss, misuse and alteration of our websites, digital assets and proprietary business information as well as consumer, business partner and advertiser personally identifiable information, no security measures are perfect and impenetrable and we may be unable to anticipate or prevent unauthorized access. A security breach could occur due to the actions of outside parties, employee error, malfeasance or a combination of these or other actions. If an actual or perceived breach of our security occurs, we could lose competitively sensitive business information or suffer disruptions to our business operations. In addition, the public perception of the effectiveness of our security measures or services could be harmed, we could lose consumers, business partners and advertisers, and we could suffer financial exposure in connection with remediation efforts, investigations and legal proceedings and changes in our security and system protection measures.
Regulations and consumer concerns regarding privacy and data protection, or any failure to comply with these regulations, could negatively impact our business.
We collect and utilize demographic and other information, including personally identifiable information, from and about consumers, business partners, advertisers and website users. We are subject to numerous federal, state, local and foreign laws, rules and regulations as well as industry standards and regulations regarding consumer protection, information security, data protection and privacy, among other things. Many of these laws and industry standards and regulations are still evolving and changes in the ways that data is permitted to be collected, stored, used and/or disclosed may negatively impact the way that we are able to conduct business. In addition, changes in consumer expectations and demands regarding privacy, information security and data protection may result in further restrictions on the way we collect, use, disclose and derive economic value from data that we purchase and/or collect, and may limit our ability to offer targeted advertising opportunities to our business
21
partners and advertisers. Although we have implemented policies and procedures designed to comply with all applicable laws, rules, industry standards and regulations, any failure or perceived failure by us to comply with our policies or applicable regulatory requirements related to consumer protection, information security, data protection and/or privacy could result in a loss of confidence, a loss of goodwill, damage to our brand, loss of consumers, business partners and advertisers, adverse regulatory proceedings and/or civil litigation, which could negatively impact our business.
If we fail to establish in a timely manner “OUTFRONT” as an independently recognized brand name with a strong reputation, our revenue and profitability could decline.
In connection with the IPO, we entered into a license agreement with a wholly owned subsidiary of CBS, pursuant to which we had the right to use “CBS” in the corporate names of the Company and the right to use the “CBS” mark and the “CBS” logo on our advertising billboards for a limited period of time following the Separation. On November 20, 2014, we rebranded, and the Company changed its legal name to “OUTFRONT Media Inc.” and changed the logo on its advertising billboards to “OUTFRONT”. We may not be able to maintain or enjoy comparable name recognition or status under the “OUTFRONT” brand as we did using the “CBS Outdoor” brand. In addition, we face the risk of claims that we have infringed third parties’ intellectual property rights with respect to our trademarks, which could be expensive and time consuming to defend, could require us to alter our trademarks, and/or could require us to pay license, royalty or other fees to third parties in order to continue using our trademarks. If we are unable to successfully manage the transition of our business to our new brand, our revenue and profitability could decline, which could adversely affect our business.
A portion of the historical financial information that we have included in this report may not be representative of the results we would have achieved as a stand-alone public company and may not be a reliable indicator of our future results.
The historical consolidated financial information for the years ended December 31, 2013, 2012, 2011 and 2010 has been presented on a “carve-out” basis from CBS’s consolidated financial statements using the historical results of operations, cash flows, assets and liabilities attributable to CBS’s Outdoor Americas operating segment and include allocations of expenses from CBS. As a result, this historical financial information may not necessarily reflect what our financial condition, results of operations or cash flows would have been had we been an independent, stand-alone entity during the periods presented or what they will be in the future. For additional information, see “Item 6. Selected Financial Data,” “Item 7. Management’s Discussion and Analysis of Financial Condition and Results of Operations” and our consolidated financial statements and the notes thereto in Part II, Item 8, of this Annual Report on Form 10-K.
Our cash available for distribution to stockholders may not be sufficient to make distributions at expected levels, and we may need to borrow in order to make such distributions or may not be able to make such distributions in full.
Distributions that we make will be authorized and determined by our board of directors in its sole discretion out of funds legally available therefor. While we anticipate maintaining relatively stable distribution(s) during each year, the amount, timing and frequency of distributions will be at the sole discretion of our board of directors and will be declared based upon various factors, including, but not limited to: future taxable income, limitations contained in our debt instruments (such as restrictions on distributions in excess of the minimum amount required to maintain our status as a REIT and on the ability of our subsidiaries to distribute cash to the Company), debt service requirements, our results of operations, our financial condition, our operating cash inflows and outflows, including capital expenditures and acquisitions, limitations on our ability to use cash generated in the TRSs to fund distributions and applicable law. We may need to increase our borrowings in order to fund our intended distributions. See “Item 5. Market for Registrant’s Common Equity, Related Stockholder Matters and Issuer Purchases of Equity Securities—Dividend Policy.”
Risks Related to Our Status as a REIT
Legislative, administrative, regulatory or other actions affecting REITs, including positions taken by the IRS, could have a negative effect on us.
The rules dealing with U.S. federal income taxation are continually under review by persons involved in the legislative process and by the IRS and the U.S. Department of the Treasury (the “Treasury”). Changes to the tax laws or interpretations thereof, with or without retroactive application, could materially and adversely affect us or our investors. We cannot predict how changes in the tax laws might affect us or our investors. New legislation, Treasury or tax regulations, administrative interpretations or court decisions could significantly and negatively affect our ability to qualify to be taxed as a REIT and the U.S. federal income tax consequences to us and our investors of such qualification.
22
On February 26, 2014, the Chairman of the Ways and Means Committee of the U.S. House of Representatives released draft proposals titled the Tax Reform Act of 2014 that include several provisions that would impact our ability to remain qualified to be taxed as a REIT. Under the draft proposals, in the case of a tax-free separation of a parent and a subsidiary such as the split-off, both the parent and the newly separated subsidiary would be prohibited from qualifying as a REIT for 10 years following such tax-free separation. In addition, the draft proposals would impose immediate corporate level tax on the built-in gain in the assets of every C corporation that elects to be treated as a REIT, effective for elections made after February 26, 2014. The draft proposals would also require that a REIT distribute earnings and profits accumulated prior to its conversion to a REIT in cash, rather than a combination of cash and stock, effective for distributions made after February 26, 2014. Finally, the proposals would, effective December 31, 2016, exclude all tangible property with a depreciable class life of less than 27.5 years (such as the advertising structures and sites owned and leased by us) from the definition of “real property” for purposes of the REIT asset and income tests. If any of these proposals or legislation containing similar provisions, with such effective dates, were to become law, it could eliminate our ability to qualify to be taxed as a REIT and we would be subject to U.S. federal income tax on our taxable income at regular corporate rates. Any resulting corporate tax liability could be substantial and would reduce the amount of cash available for distribution to holders of our common stock, which in turn could have an adverse impact on the value of our common stock.
If we fail to remain qualified as a REIT, we will be subject to U.S. federal income tax as a regular corporation and could face a substantial tax liability, which would reduce the amount of cash available for distribution to our stockholders.
On July 17, 2014, we began operating in a manner that will allow us to qualify to be taxed as a REIT for U.S. federal income tax purposes for our tax year commencing July 17, 2014 and ending December 31, 2014. We have received an opinion of Skadden, Arps, Slate, Meagher & Flom LLP (“REIT Tax Counsel”), with respect to our qualification to be taxed as a REIT. Investors should be aware, however, that opinions of counsel are not binding on the IRS or any court. The opinion of REIT Tax Counsel represents only the view of REIT Tax Counsel, based on its review and analysis of existing law and on certain representations as to factual matters and covenants made by CBS and us, including representations related to the values of our assets and the sources of our income. The opinion was expressed as of the date issued. REIT Tax Counsel will have no obligation to advise us or the holders of our common stock of any subsequent changes in the matters stated, represented or assumed or of any subsequent change in applicable law. Furthermore, both the validity of the opinion of REIT Tax Counsel and our qualification to be taxed as a REIT will depend on satisfaction by us of certain asset, income, organizational, distribution, stockholder ownership and other requirements on a continuing basis, and compliance with these requirements will not be monitored by REIT Tax Counsel. Our ability to satisfy the asset tests depends upon our analysis of the characterization and fair market values of our assets, some of which are not susceptible to a precise determination, and for which we will not obtain independent appraisals.
CBS received a private letter ruling from the IRS with respect to certain issues relevant to our ability to qualify to be taxed as a REIT. Although we may generally rely upon the ruling, no assurance can be given that the IRS will not challenge our qualification to be taxed as a REIT if the representations made by CBS are inaccurate or on the basis of other issues or facts outside the scope of the ruling. If we were to fail to remain qualified to be taxed as a REIT in any taxable year, we would be subject to U.S. federal income tax, including any applicable alternative minimum tax, on our taxable income at regular corporate rates, and dividends paid to our stockholders would not be deductible by us in computing our taxable income. Any resulting corporate tax liability could be substantial and would reduce the amount of cash available for distribution to holders of our common stock, which in turn could have an adverse impact on the value of our common stock. Unless we were entitled to relief under certain Code provisions, we would also be disqualified from re-electing to be taxed as a REIT for the four taxable years following the year in which we failed to qualify to be taxed as a REIT.
Qualifying to be taxed as a REIT involves highly technical and complex provisions of the Code, and failure to comply with these provisions could jeopardize our REIT qualification.
Qualification to be taxed as a REIT involves the application of highly technical and complex Code provisions for which only limited judicial and administrative authorities exist. Even a technical or inadvertent failure to comply with these provisions could jeopardize our REIT qualification. Our ability to remain qualified to be taxed as a REIT will depend on our satisfaction of certain asset, income, organizational, distribution, stockholder ownership and other requirements on a continuing basis. In addition, our ability to satisfy the requirements to remain qualified to be taxed as a REIT may depend in part on the actions of third parties over which we have no control or only limited influence.
23
The ownership limitations that apply to REITs, as prescribed by the Code and by our charter, may inhibit market activity in the shares of our common stock and restrict our business combination opportunities.
In order for us to qualify to be taxed as a REIT, not more than 50% in value of the outstanding shares of our stock may be owned, beneficially or constructively, by five or fewer individuals, as defined in the Code to include certain entities, at any time during the last half of each taxable year after the first year for which we elect to qualify to be taxed as a REIT. Additionally, at least 100 persons must beneficially own our stock during at least 335 days of a taxable year (other than the first taxable year for which we elect to be taxed as a REIT). Subject to certain exceptions, our charter authorizes our board of directors to take such actions as are necessary and desirable to preserve our qualification to be taxed as a REIT. Our charter also provides that, unless exempted by the board of directors, no person may own more than 9.8% in value or in number, whichever is more restrictive, of the outstanding shares of our common stock or 9.8% in value of the aggregate outstanding shares of all classes and series of our stock. A person that did not acquire more than 9.8% of our outstanding stock may nonetheless become subject to our charter restrictions in certain circumstances, including if repurchases by us cause a person’s holdings to exceed such limitations. The constructive ownership rules are complex and may cause shares of stock owned directly or constructively by a group of related individuals to be constructively owned by one individual or entity. These ownership limits could delay or prevent a transaction or a change in control of our company that might involve a premium price for shares of our stock or otherwise be in the best interests of our stockholders.
REIT distribution requirements could adversely affect our ability to execute our business plan.
To maintain REIT status, we must meet a number of organizational and operational requirements, including a requirement that we annually distribute to our stockholders at least 90% of our REIT taxable income, determined without regard to the dividends-paid deduction and excluding any net capital gains. To the extent that we satisfy this distribution requirement and qualify for taxation as a REIT but distribute less than 100% of our REIT taxable income, determined without regard to the dividends-paid deduction and including any net capital gains, we will be subject to U.S. federal income tax on our undistributed net taxable income. In addition, we will be subject to a nondeductible 4% excise tax if the amount that we actually distribute to our stockholders in a calendar year is less than a minimum amount specified under U.S. federal tax laws. We intend to pay regular quarterly distributions to our stockholders in an amount not less than 100% of our REIT taxable income (determined before the deduction for dividends paid).
From time to time, we may generate taxable income greater than our cash flow as a result of differences in timing between the recognition of taxable income and the actual receipt of cash or the effect of nondeductible capital expenditures, the creation of reserves or required debt or amortization payments. If we do not have other funds available in these situations, we could be required to borrow funds on unfavorable terms, sell assets at disadvantageous prices or distribute amounts that would otherwise be invested in future acquisitions to make distributions sufficient to enable us to pay out enough of our taxable income to satisfy the REIT distribution requirement and to avoid corporate income tax and the 4% excise tax in a particular year. These alternatives could increase our costs or reduce our equity. Thus, compliance with the REIT requirements may impact our ability to grow, which could adversely affect the value of our common stock.
To fund our growth strategy and refinance our indebtedness, we may depend on external sources of capital, which may not be available to us on commercially reasonable terms or at all.
To maintain REIT status, we must meet a number of organizational and operational requirements, including a requirement that we annually distribute to our stockholders at least 90% of our REIT taxable income, determined without regard to the dividends-paid deduction and excluding any net capital gains. As a result of these requirements, we may not be able to fund future capital needs, including any necessary acquisition financing, solely from operating cash flows. Consequently, we expect to rely on third-party capital market sources for debt or equity financing to fund our business strategy. In addition, we will likely need third-party capital market sources to refinance our indebtedness at maturity. Continued or increased turbulence in the United States or international financial markets and economies could adversely impact our ability to replace or renew maturing liabilities on a timely basis or access the capital markets to meet liquidity and capital expenditure requirements and may result in adverse effects on our business, financial condition and results of operations. As such, we may not be able to obtain financing on favorable terms or at all. Our access to third-party sources of capital also depends, in part, on:
|
•
|
the market’s perception of our growth potential;
|
|
•
|
our then-current levels of indebtedness;
|
|
•
|
our historical and expected future earnings, cash flows and cash distributions; and
|
24
|
•
|
the market price per share of our common stock.
|
In addition, our ability to access additional capital may be limited by the terms of the indebtedness we incurred in connection the Formation Borrowings and the Acquisition Borrowings, which may restrict our incurrence of additional debt. If we cannot obtain capital when needed, we may not be able to acquire or develop properties when strategic opportunities arise or refinance our debt, which could have an adverse effect on our business, financial condition and results of operations.
Even if we remain qualified to be taxed as a REIT, we may face other tax liabilities that reduce our cash flow.
Even if we remain qualified for taxation as a REIT, we may be subject to certain U.S. federal, state and local taxes on our income and assets, including taxes on any undistributed income and state or local income, property and transfer taxes. For example, in order to meet the REIT qualification requirements, we may hold some of our assets or conduct certain of our activities through one or more TRSs or other subsidiary corporations that will be subject to foreign, federal, state and local corporate-level income taxes as regular C corporations. In addition, we may incur a 100% excise tax on transactions with a TRS if the transactions are not conducted on an arm’s-length basis. Any of these taxes would decrease cash available for distribution to holders of our common stock.
Complying with REIT requirements may cause us to liquidate investments or forgo otherwise attractive opportunities.
To qualify to be taxed as a REIT for U.S. federal income tax purposes, we must ensure that, at the end of each calendar quarter, at least 75% of the value of our assets consists of cash, cash items, government securities and “real estate assets” (as defined in the Code), including certain mortgage loans and securities. The remainder of our investments (other than government securities, qualified real estate assets and securities issued by a TRS) generally cannot include more than 10% of the outstanding voting securities of any one issuer or more than 10% of the total value of the outstanding securities of any one issuer. In addition, in general, no more than 5% of the value of our total assets (other than government securities, qualified real estate assets and securities issued by a TRS) can consist of the securities of any one issuer, and no more than 25% of the value of our total assets can be represented by securities of one or more TRSs. If we fail to comply with these requirements at the end of any calendar quarter, we must correct the failure within 30 days after the end of the calendar quarter or qualify for certain statutory relief provisions to avoid losing our REIT qualification and suffering adverse tax consequences. As a result, we may be required to liquidate or forgo otherwise attractive investments. These actions could have the effect of reducing our income and amounts available for distribution to holders of our common stock.
In addition to the assets tests set forth above, to qualify to be taxed as a REIT we must continually satisfy tests concerning, among other things, the sources of our income, the amounts we distribute to our stockholders and the ownership of our stock. We may be unable to pursue investments that would be otherwise advantageous to us in order to satisfy the source-of-income or asset-diversification requirements for qualifying to be taxed as a REIT. Thus, compliance with the REIT requirements may hinder our ability to make certain attractive investments.
Complying with REIT requirements may depend on our ability to contribute certain contracts to a taxable REIT subsidiary.
Our ability to satisfy certain REIT requirements may depend on us contributing to a TRS certain contracts, or portions of certain contracts, with respect to outdoor advertising assets that do not qualify as real property for purposes of the REIT asset tests. Moreover, our ability to satisfy the REIT requirements may depend on us properly allocating between us and our TRS the revenue or cost, as applicable, associated with the portion of any such contract contributed to the TRS. There can be no assurance that the IRS will not determine that such contribution was not a true contribution as between us and our TRS or that we did not properly allocate the applicable revenues or costs. Were the IRS successful in such a challenge, it could adversely impact our ability to qualify to be taxed as a REIT or our effective tax rate and tax liability.
Our planned use of taxable REIT subsidiaries may cause us to fail to qualify to be taxed as a REIT.
The net income of our TRSs is not required to be distributed to us, and income that is not distributed to us generally will not be subject to the REIT income distribution requirement. However, there may be limitations on our ability to accumulate earnings in our TRSs and the accumulation or reinvestment of significant earnings in our TRSs could result in adverse tax treatment. In particular, if the accumulation of cash in our TRSs causes the fair market value of our securities in our TRSs and certain other non-qualifying assets to exceed 25% of the fair market value of our assets, we would fail to qualify to be taxed as a REIT.
25
Complying with REIT requirements may limit our ability to hedge effectively and may cause us to incur tax liabilities.
The REIT provisions of the Code substantially limit our ability to hedge our assets and liabilities. Any income from a hedging transaction that we enter into primarily to manage risk of currency fluctuations or to manage risk of interest rate changes with respect to borrowings made or to be made or to acquire or carry real estate assets does not constitute “gross income” for purposes of the 75% or 95% gross income tests that apply to REITs, provided that certain identification requirements are met. To the extent that we enter into other types of hedging transactions or fail to properly identify such a transaction as a hedge, the income is likely to be treated as non-qualifying income for purposes of both of the gross income tests. As a result of these rules, we may be required to limit our use of advantageous hedging techniques or implement those hedges through a TRS. This could increase the cost of our hedging activities because our TRS may be subject to tax on gains or expose us to greater risks associated with changes in interest rates that we would otherwise choose to bear. In addition, losses in our TRS will generally not provide any tax benefit, except that such losses could theoretically be carried back or forward against past or future taxable income in the TRS.
If we fail to meet the REIT income tests as a result of receiving non-qualifying rental income, we would be required to pay a penalty tax in order to retain our REIT status.
Certain income we receive could be treated as non-qualifying income for purposes of the REIT requirements. Even if we have reasonable cause for a failure to meet the REIT income tests as a result of receiving non-qualifying income, we would nonetheless be required to pay a penalty tax in order to retain our REIT status.
Even if we remain qualified to be taxed as a REIT, we could be subject to tax on any unrealized net built-in gains in the assets held before electing to be treated as a REIT.
Following the REIT election, we will own appreciated assets that were held by a C corporation and were acquired by us in a transaction in which the adjusted tax basis of the assets in our hands is determined by reference to the adjusted tax basis of the assets in the hands of the C corporation. If we dispose of any such appreciated assets in a taxable transaction during the 10-year period following our acquisition of the assets from the C corporation (
i.e.
, during the 10-year period following our qualification to be taxed as a REIT), we will be subject to tax at the highest corporate tax rates on any gain from such assets to the extent of the excess of the fair market value of the assets on the date that they were acquired by us (
i.e.
, at the time that we became a REIT) over the adjusted tax basis of such assets on such date, which are referred to as built-in gains. We would be subject to this tax liability even if we maintain our status as a REIT. Any recognized built-in gain will retain its character as ordinary income or capital gain and will be taken into account in determining REIT taxable income and our distribution requirement for the year such gain is recognized. Any tax on the recognized built-in gain will reduce REIT taxable income. We may choose not to sell in a taxable transaction appreciated assets that we might otherwise sell during the 10-year period in which the built-in gain tax applies in order to avoid the built-in gain tax. However, there can be no assurances that such a taxable transaction will not occur. If we sell such assets in a taxable transaction, the amount of corporate tax that we will pay will vary depending on the actual amount of net built-in gain present in those assets as of the time we became a REIT. The amount of tax could be significant.
The IRS may deem the gains from sales of our outdoor advertising assets to be subject to a 100% prohibited transaction tax.
From time to time, we may sell outdoor advertising assets. The IRS may deem one or more sales of our outdoor advertising assets to be “prohibited transactions” (generally, sales or other dispositions of property that is held as inventory or primarily for sale to customers in the ordinary course of a trade or business). If the IRS takes the position that we have engaged in a “prohibited transaction,” the gain we recognize from such sale would be subject to a 100% tax. We do not intend to hold outdoor advertising assets as inventory or for sale in the ordinary course of business; however, whether property is held as inventory or “primarily for sale to customers in the ordinary course of a trade or business” depends on the particular facts and circumstances and there is no assurance that our position will not be challenged by the IRS especially if we make frequent sales or sales of outdoor advertising assets in which we have short holding periods.
We have limited operating history as a REIT, and our inexperience may impede our ability to successfully manage our business or implement effective internal controls.
We have limited operating history as a REIT. We cannot assure you that our past experience will be sufficient to successfully operate our company as a REIT. We are in the process of implementing substantial control systems and procedures in order to maintain our qualification to be taxed as a REIT. As a result, we are incurring and will continue to incur significant legal, accounting and other expenses that we have not previously incurred, and management and other personnel will need to devote a substantial amount of time to comply with these rules and regulations and establish the corporate infrastructure and controls
26
demanded of a REIT. These costs and time commitments could be substantially more than currently expected. If we are unable to operate successfully as a REIT, it could have an adverse effect on our business, financial condition and results of operations.
We may not be able to engage in desirable strategic or capital-raising transactions as a result of the Separation, and we could be liable for adverse tax consequences resulting from engaging in significant strategic or capital-raising transactions.
Under the tax matters agreement that we have entered into with CBS, for two years following the Separation, we generally will be required to indemnify CBS against any tax resulting from the Separation to the extent that such tax resulted from, among other things, the Company (1) entering into any transaction pursuant to which all or a portion of our common stock would be acquired, whether by merger or otherwise, (2) issuing equity securities beyond certain thresholds, (3) repurchasing our common stock, (4) ceasing to actively conduct the U.S. portion of the outdoor business, or (5) taking or failing to take any other action that prevents the Separation and related transactions from being tax-free. Our indemnification obligations to CBS and its subsidiaries, officers and directors are not limited by any maximum amount. If we are required to indemnify CBS
or such other persons under the circumstances set forth in the tax matters agreement, we may be subject to substantial liabilities. We could be liable to CBS for consolidated group losses used by us even if we do not owe any amount to a governmental authority.
These restrictions may limit our ability to pursue strategic transactions or engage in new business or other transactions that may maximize the value of our business.
None.
Our principal executive offices, which we lease, are located at 405 Lexington Avenue, 17th Floor, New York, NY 10174. We and our subsidiaries also own and lease office and warehouse space throughout the United States, Canada and several other foreign countries. We consider our properties adequate for our present needs.
Each of our United States and International segments primarily leases our outdoor advertising sites, but, in a few cases, we own or hold permanent easements on our outdoor advertising sites. These lease agreements have terms varying between one month and multiple years, and usually provide renewal options. There is no significant concentration of outdoor advertising sites under any one lease or with any one landlord. An important part of our business activity is to manage our lease portfolio and negotiate suitable lease renewals and extensions. For further information regarding our outdoor advertising sites and structures, see “Item 1. Business—Our Portfolio of Outdoor Advertising Structures and Sites.”
On an ongoing basis, we are engaged in lawsuits and governmental proceedings and respond to various investigations, inquiries, notices and claims from national, state and local governmental and other authorities (collectively, “litigation”). Litigation is inherently uncertain and always difficult to predict. Although it is not possible to predict with certainty the eventual outcome of any litigation, in our opinion, none of our current litigation is expected to have a material adverse effect on our results of operations, financial position or cash flows.
Not applicable.
27
Market Information
Shares of our common stock began trading on the New York Stock Exchange (“NYSE”) on March 28, 2014 under the ticker symbol “CBSO.” On November 20, 2014, in connection with our rebranding, shares of our common stock began trading on the NYSE under the ticker symbol “OUT”. Prior to March 28, 2014, there was no public market for our common stock.
The following table sets forth the historical high and low sales prices per share of our common stock as reported on the NYSE during the periods indicated, and the amount of dividends declared per share.
|
(per share)
|
High
|
Low
|
Dividends Declared
|
||||||||||
|
2014:
|
|||||||||||||
|
First Quarter (March 28, 2014 to March 31, 2014)
|
$
|
30.47
|
|
$
|
28.95
|
|
$
|
—
|
|
||||
|
Second Quarter
|
35.69
|
|
27.88
|
|
0.37
|
|
|||||||
|
Third Quarter
|
34.75
|
|
29.16
|
|
0.37
|
|
|||||||
|
Fourth Quarter
|
31.64
|
|
25.70
|
|
4.93
|
|
(a)
|
||||||
|
(a)
|
Includes a quarterly cash dividend and a special dividend. On October 29, 2014, our board of directors approved a quarterly cash dividend of $0.37 per share on our common stock, and approved the E&P Purge, comprised of a special dividend of approximately $547.7 million, or $4.56 per share of common stock outstanding on the record date. The quarterly cash dividend was paid on December 15, 2014, to stockholders of record on November 18, 2014, and the special dividend was paid on December 31, 2014, to stockholders of record on November 20, 2014. Stockholders had the right to elect to receive the special dividend in the form of either cash or shares of our common stock. However, the aggregate amount of cash to be distributed was $109.5 million, or 20% of the special dividend, with the balance of the special dividend payable in the form of common stock. Those electing cash received $1.34 in cash, plus 0.1216 shares of our common stock, per share of common stock held on the record date, which together represents $4.56 per share of common stock. Those electing stock, or not making an election, received 0.1722 shares of our common stock per share of common stock held on the record date, which represents $4.56 per share of common stock. See “—Dividend Policy.”
|
The following table sets forth the high and low sales prices per share of our common stock as reported on the NYSE during the periods indicated, as adjusted for the special dividend paid on December 31, 2014, and the amount of dividends declared per share (excluding the special dividend).
|
(per share)
|
High
|
Low
|
Dividends Declared
|
||||||||||
|
2014:
|
|||||||||||||
|
First Quarter (March 28, 2014 to March 31, 2014)
|
$
|
25.91
|
|
$
|
24.39
|
|
$
|
—
|
|
||||
|
Second Quarter
|
31.13
|
|
23.32
|
|
0.37
|
|
|||||||
|
Third Quarter
|
30.19
|
|
24.60
|
|
0.37
|
|
|||||||
|
Fourth Quarter
|
27.08
|
|
25.70
|
|
0.37
|
|
|||||||
On
March 4, 2015
, the closing price of our common stock on the NYSE was $30.27 per share.
Holders
As of
March 4, 2015
, we had
281
holders of record of our common stock.
Dividend Policy
To maintain REIT status, we must annually distribute to our stockholders at least 90% of our REIT taxable income, determined without regard to the dividends-paid deduction and excluding any net capital gains. To the extent that we satisfy this distribution requirement and qualify for taxation as a REIT but distribute less than 100% of our REIT taxable income, determined with the above modifications, we will be subject to U.S. federal income tax on our undistributed net taxable income. In addition, we will be subject to a nondeductible 4% excise tax if the amount that we actually distribute to our stockholders in a calendar year is less than a minimum amount specified under U.S. federal tax laws. We intend to pay regular
28
quarterly distributions to our stockholders in an amount not less than 100% of our REIT taxable income (determined before the deduction for dividends paid). See “Item 1. Business—Tax Status.”
Distributions that we make will be authorized and determined by our board of directors in its sole discretion out of assets legally available therefor. While we anticipate maintaining relatively stable distribution(s) during each year, the amount, timing and frequency of distributions will be at the sole discretion of the board of directors, and distributions will be declared based upon various factors, including but not limited to: future taxable income, limitations contained in our debt instruments (such as restrictions on distributions in excess of the minimum amount required to maintain our status as a REIT and on the ability of our subsidiaries to distribute cash to the Company), debt service requirements, our results of operations, our financial condition, our operating cash inflows and outflows, including capital expenditures and acquisitions, limitations on our ability to use cash generated in the TRSs to fund distributions and applicable law. See “Item 7. Management’s Discussion and Analysis of Financial Condition and Results of Operations—Liquidity and Capital Resources” and our consolidated financial statements and the notes thereto in Part II, Item 8, of this Annual Report on Form 10-K. We may need to increase our borrowings in order to fund our intended distributions. We expect that, at least initially, our distributions may exceed our net income under GAAP, due, in part, to noncash expenses included in net income (loss).
We anticipate that our distributions generally will be taxable as ordinary income to our stockholders, although we may designate a portion of the distributions as qualified dividend income or capital gain dividends or a portion of the distributions may constitute a return of capital or be taxable as capital gain. We will furnish annually to each of our stockholders a statement setting forth distributions paid during the preceding year and their characterization as ordinary income dividends, return of capital, qualified dividends, income or capital gain dividends or nondividend distributions.
On April 28, 2014, we announced that our board of directors had authorized a quarterly cash dividend of $0.37 per share on our common stock, which was paid on June 30, 2014, to stockholders of record at the close of business on June 9, 2014.
On August 6, 2014, we announced that our board of directors had authorized a quarterly cash dividend of $0.37 per share on our common stock, which was paid on September 30, 2014, to stockholders of record at the close of business on September 9, 2014.
On October 29, 2014, we announced that our board of directors had authorized a quarterly cash dividend of $0.37 per share on our common stock, which was paid on December 15, 2014, to stockholders of record at the close of business on November 18, 2014. On October 29, 2014, we also announced that our board of directors approved the E&P Purge, comprised of a special dividend of approximately $547.7 million, or $4.56 per share, on our common stock, payable on December 31, 2014, to stockholders of record at the close of business on November 20, 2014. In connection with the special dividend, we paid approximately $109.5 million in cash, and issued approximately 16.5 million new shares of our common stock, which are eligible for dividends declared in future periods.
On
February 26, 2015
, we announced that our board of directors approved a special cash dividend of
$0.06
per share on our common stock, comprised of a “top-up” of the 2014 annual dividend for REIT distributable income (the “top-up dividend”). The top-up dividend is payable on
March 31, 2015
, to stockholders of record at the close of business on
March 11, 2015
. On
February 26, 2015
, we also announced that our board of directors approved a quarterly cash dividend of
$0.34
per share on our common stock, payable on
March 31, 2015
, to stockholders of record at the close of business on
March 11, 2015
.
Performance Graph
The information in this section, including the performance graph, shall not be deemed “soliciting material” or to be “filed” with the SEC for purposes of Section 18 of the Exchange Act, or otherwise subject to the liabilities under that Section, and shall not be deemed to be incorporated by reference into any filing of the Company under the Securities Act of 1933, as amended, or the Exchange Act
.
The following graph compares the cumulative total stockholder return on OUTFRONT Media Inc.’s common stock to the cumulative total return of Lamar Advertising Company, the Standard & Poor’s 500 Stock Index (“S&P 500”), the S&P 500 Media Industry Index, and the FTSE National Association of Real Estate Investment Trusts (“NAREIT”) All Equity REITs Index.
The performance graph assumes $100 invested on March 28, 2014, in OUTFRONT Media Inc.’s common stock, Lamar Advertising Company’s common stock, the S&P 500, the S&P 500 Media Industry Index, and the FTSE NAREIT All Equity REITs Index, including the reinvestment of dividends, through the calendar year ended December 31, 2014.
29
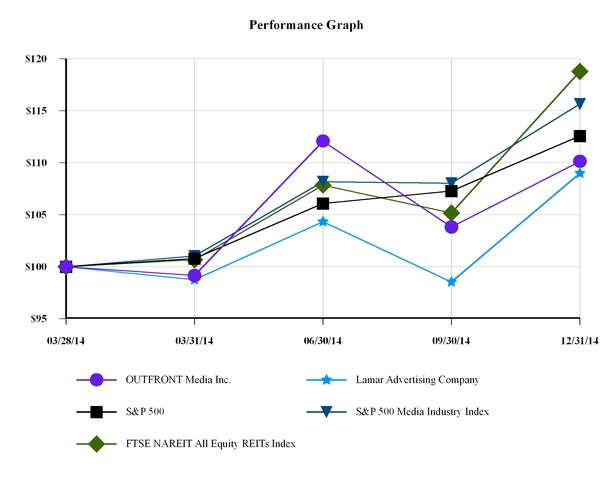
|
Mar. 28, 2014
|
Mar. 31, 2014
|
Jun. 30, 2014
|
Sept. 30, 2014
|
Dec. 31, 2014
|
||||||||||||||||
|
OUTFRONT Media Inc.
|
$
|
100.00
|
|
$
|
99.15
|
|
$
|
112.06
|
|
$
|
103.81
|
|
$
|
110.12
|
|
|||||
|
Lamar Advertising Company
|
100.00
|
|
98.74
|
|
104.32
|
|
98.53
|
|
108.99
|
|
||||||||||
|
S&P 500
|
100.00
|
|
100.80
|
|
106.07
|
|
107.27
|
|
112.56
|
|
||||||||||
|
S&P Media Industry Index
(a)
|
100.00
|
|
101.02
|
|
108.15
|
|
108.01
|
|
115.65
|
|
||||||||||
|
FTSE NAREIT All Equity REITs Index
|
100.00
|
|
100.67
|
|
107.84
|
|
105.16
|
|
118.77
|
|
||||||||||
|
(a)
|
The S&P 500 Media Industry Index consists of the following companies: Cablevision Systems Corporation; Time Warner Cable Inc.; Gannett Co., Inc.; Interpublic Group of Companies, Inc.; Walt Disney Company; Omnicom Group Inc.; Time Warner Inc.; Comcast Corporation; Scripps Networks Interactive, Inc.; Discovery Communications, Inc.; CBS Corporation; Viacom Inc.; DIRECTV; Twenty-first Century Fox, Inc.; and News Corporation.
|
Unregistered Sales of Equity Securities
As part of the formation and reorganization transactions that led up to the Exchange Offer and the Separation, on January 15, 2014, we issued 100 shares of our common stock to an indirect, wholly-owned subsidiary of CBS Corporation, our indirect parent at the time. The shares were issued without registration in reliance on the exemption afforded by Section 4(a)(2) of the Securities Act of 1933 (the “Securities Act”) as a transaction not involving a public offering to a wholly-owned subsidiary of our indirect parent at the time. As a result of a 970,000 to 1 stock split of our common stock declared on March 14, 2014, the 100 shares of our common stock then outstanding were converted into 97,000,000 shares of our common stock. See “—Use of Proceeds from the IPO” and “Item 7. Management’s Discussion and Analysis of Financial Condition and Results of Operations.”
On December 1, 2014, we issued 74,129 shares of our common stock to J&M Holding Enterprises, Inc. (“J&M”), an affiliate of Videri Inc. (“Videri”), in connection with licenses and services to be received under a development and license agreement with J&M and Videri. The shares were issued without registration in reliance on the exemption afforded by Rule 506 of Regulation
30
D and Section 4(a)(2) of the Securities Act as a transaction not involving a public offering or general solicitation to accredited investors, with adequate Company information available.
Use of Proceeds from the IPO
On March 27, 2014, our registration statement on Form S-11 (File No. 333-189643) related to our IPO of 20,000,000 shares of our common stock was declared effective by the SEC and on March 28, 2014, we began trading on the NYSE. On March 28, 2014, the underwriters (represented by Goldman, Sachs & Co., J.P. Morgan Securities LLC, Merrill Lynch, Pierce, Fenner & Smith Incorporated and Morgan Stanley & Co. LLC) exercised their option to purchase additional shares of our common stock at the IPO price, resulting in the issuance of 3,000,000 additional shares of our common stock. On April 2, 2014, we completed the IPO, and the issuance of shares pursuant to the exercise of the underwriters’ option to purchase additional shares, at a price of $28.00 per share for net proceeds of $615.0 million, after deducting underwriting discounts and commissions of $29.0 million. Of the total net proceeds, $515.0 million was transferred to a wholly owned subsidiary of CBS as partial consideration for the contribution of the entities comprising CBS’s Outdoor Americas operating segment to us. The remaining $100.0 million was retained by us and was applied to the cash portion of the E&P Purge, which was approximately $109.5 million. The special dividend was paid on December 31, 2014. CBS transferred the balance of the cash portion of the E&P Purge (approximately $9.5 million) to us prior to the payment of the special dividend to stockholders.
Purchases of Equity Securities by the Issuer
|
Total Number of Shares
Purchased
(a)
|
Average Price Paid Per Share
|
Total Number of Shares Purchased as Part of Publicly Announced Programs
|
Remaining Authorizations
|
||||||||||
|
October 1, 2014 through October 31, 2014
|
276
|
|
$
|
25.94
|
|
—
|
|
—
|
|
||||
|
November 1, 2014 through November 30, 2014
|
190
|
|
26.80
|
|
—
|
|
—
|
|
|||||
|
December 1, 2014 through December 31, 2014
|
—
|
|
—
|
|
—
|
|
—
|
|
|||||
|
Total
|
466
|
|
26.31
|
|
—
|
|
—
|
|
|||||
|
(a)
|
Reflects shares deemed to be surrendered to the Company in connection with tax withholding payments upon the exercise of employee stock options at the related exercise prices.
|
The following table sets forth our selected historical consolidated financial data for the periods presented. The selected historical consolidated statements of operations and cash flow data for each of the years ended December 31, 2014, 2013 and 2012 and the selected historical consolidated balance sheet data as of December 31, 2014 and 2013, have been derived from our audited consolidated financial statements for such years, which are included in this Annual Report on Form 10-K. The selected historical consolidated statements of operations and cash flow data for each of the years ended December 31, 2011 and 2010 and the selected historical consolidated balance sheet information as of December 31, 2012 and 2011 have been derived from our audited historical consolidated financial statements, which are not included in this Annual Report on Form 10-K. The selected historical consolidated balance sheet information as of December 31, 2010, has been derived from our unaudited historical consolidated financial statements, which are not included in this Annual Report on Form 10-K. The unaudited consolidated financial statements have been prepared on the same basis as our audited consolidated financial statements and, in the opinion of management, reflect all adjustments, consisting of only normal recurring adjustments, necessary for a fair presentation of this information.
Our historical consolidated financial data for 2013, 2012, 2011 and 2010 have been presented on a “carve-out” basis from CBS’s consolidated financial statements using the historical results of operations, cash flows, assets and liabilities attributable to CBS’s Outdoor Americas operating segment and include allocations of expenses from CBS. These allocations reflect significant assumptions, and the selected historical consolidated financial information set forth below and the financial statements included elsewhere in this Annual Report on Form 10-K do not necessarily reflect what our results of operations, financial condition or cash flows would have been if we had operated as a stand-alone company during the periods presented, and, accordingly, such information should not be relied upon as an indicator of our future performance, financial condition or liquidity.
31
You should read the following information together with “Item 1A. Risk Factors,” “Item 7. Management’s Discussion and Analysis of Financial Condition and Results of Operations” and our consolidated financial statements and the notes thereto in Part II, Item 8, of this Annual Report on Form 10-K.
|
Year Ended December 31,
|
||||||||||||||||||||
|
(in millions)
|
2014
|
2013
|
2012
|
2011
|
2010
|
|||||||||||||||
|
Statement of Operations data:
|
||||||||||||||||||||
|
Revenues
|
$
|
1,353.8
|
|
$
|
1,294.0
|
|
$
|
1,284.6
|
|
$
|
1,277.1
|
|
$
|
1,214.1
|
|
|||||
|
Less:
|
||||||||||||||||||||
|
Operating, selling and general and administrative expenses
|
940.4
|
|
879.2
|
|
876.2
|
|
862.8
|
|
864.1
|
|
||||||||||
|
Adjusted OIBDA
(a)
|
413.4
|
|
414.8
|
|
408.4
|
|
414.3
|
|
350.0
|
|
||||||||||
|
Less:
|
||||||||||||||||||||
|
Stock-based compensation
(b)
|
10.4
|
|
7.5
|
|
5.7
|
|
5.0
|
|
4.3
|
|
||||||||||
|
Restructuring charges
|
9.8
|
|
—
|
|
2.5
|
|
3.0
|
|
3.9
|
|
||||||||||
|
Acquisition costs
|
10.4
|
|
—
|
|
—
|
|
—
|
|
—
|
|
||||||||||
|
Net (gain) loss on disposition
|
(2.5
|
)
|
(27.3
|
)
|
2.2
|
|
2.0
|
|
1.1
|
|
||||||||||
|
Depreciation
|
107.2
|
|
104.5
|
|
105.9
|
|
109.0
|
|
107.6
|
|
||||||||||
|
Amortization
|
95.0
|
|
91.3
|
|
90.9
|
|
102.9
|
|
106.6
|
|
||||||||||
|
Operating income
|
$
|
183.1
|
|
$
|
238.8
|
|
$
|
201.2
|
|
$
|
192.4
|
|
$
|
126.5
|
|
|||||
|
Benefit (provision) for income taxes
|
$
|
206.0
|
|
$
|
(96.6
|
)
|
$
|
(89.0
|
)
|
$
|
(87.8
|
)
|
$
|
(57.1
|
)
|
|||||
|
Net income
|
$
|
306.9
|
|
$
|
143.5
|
|
$
|
113.4
|
|
$
|
107.1
|
|
$
|
71.3
|
|
|||||
|
Net income per weighted average shares outstanding
(c)
:
|
||||||||||||||||||||
|
Basic
|
$
|
2.69
|
|
$
|
1.26
|
|
$
|
0.99
|
|
$
|
0.94
|
|
$
|
0.62
|
|
|||||
|
Diluted
|
$
|
2.67
|
|
$
|
1.25
|
|
$
|
0.99
|
|
$
|
0.93
|
|
$
|
0.62
|
|
|||||
|
Dividends declared per common share
|
$
|
5.67
|
|
$
|
—
|
|
$
|
—
|
|
$
|
—
|
|
$
|
—
|
|
|||||
|
Funds from operations (“FFO”)
(d)
|
$
|
483.9
|
|
$
|
299.5
|
|
$
|
288.0
|
|
$
|
296.1
|
|
$
|
260.5
|
|
|||||
|
Adjusted FFO (“AFFO”)
(d)
|
$
|
245.2
|
|
$
|
259.9
|
|
$
|
271.2
|
|
$
|
316.2
|
|
$
|
284.8
|
|
|||||
|
Balance sheet data (at period end):
|
||||||||||||||||||||
|
Property and equipment, net
|
$
|
782.9
|
|
$
|
755.4
|
|
$
|
807.9
|
|
$
|
858.2
|
|
$
|
928.4
|
|
|||||
|
Total assets
|
$
|
4,023.6
|
|
$
|
3,355.5
|
|
$
|
3,464.9
|
|
$
|
3,603.0
|
|
$
|
3,751.5
|
|
|||||
|
Current liabilities
|
$
|
255.2
|
|
$
|
212.2
|
|
$
|
205.6
|
|
$
|
196.7
|
|
$
|
203.4
|
|
|||||
|
Long-term debt
|
$
|
2,198.3
|
|
$
|
—
|
|
$
|
—
|
|
$
|
—
|
|
$
|
—
|
|
|||||
|
Total stockholders’ equity/invested equity
|
$
|
1,445.5
|
|
$
|
2,754.4
|
|
$
|
2,843.9
|
|
$
|
2,990.6
|
|
$
|
3,163.3
|
|
|||||
|
Cash flow data:
|
||||||||||||||||||||
|
Cash flow provided by operating activities
|
$
|
262.8
|
|
$
|
281.1
|
|
$
|
305.9
|
|
$
|
340.1
|
|
$
|
271.9
|
|
|||||
|
Capital expenditures
(e)
:
|
||||||||||||||||||||
|
Growth
|
$
|
40.9
|
|
$
|
37.2
|
|
$
|
34.2
|
|
$
|
28.2
|
|
$
|
26.8
|
|
|||||
|
Maintenance
|
23.3
|
|
23.7
|
|
14.0
|
|
15.4
|
|
20.4
|
|
||||||||||
|
Total capital expenditures
|
$
|
64.2
|
|
$
|
60.9
|
|
$
|
48.2
|
|
43.6
|
|
47.2
|
|
|||||||
______________
|
(a)
|
Adjusted OIBDA is a non-GAAP financial measure. We calculate “Adjusted OIBDA” as
Operating income
before
Depreciation
,
Amortization
,
Net (gains) losses on dispositions
,
Stock-based compensation
,
Restructuring charges
and
Acquisition costs
. We use Adjusted OIBDA to evaluate our operating performance. Adjusted OIBDA is among the primary measures we use for managing our business, evaluating our operating performance and planning and forecasting future periods, as it is an important indicator of our operational strength and business performance. Our management believes users of our financial data are best served if the information that is made available to them allows them to align their analysis and evaluation of our operating results along the same lines that our
|
32
management uses in managing, planning and executing our business strategy. Our management also believes that the presentation of Adjusted OIBDA, as a supplemental measure, is useful in evaluating our business because eliminating certain non-comparable items highlight operational trends in our business that may not otherwise be apparent when relying solely on GAAP financial measures. It is management’s opinion that this supplemental measure provides users with an important perspective on our operating performance and also makes it easier for users to compare our results with other companies that have different financing and capital structures or tax rates. See “Item 7. Management’s Discussion and Analysis of Financial Condition and Results of Operations,” for further information about Adjusted OIBDA.
|
(b)
|
Stock-based compensation in 2014 excludes
$5.6 million
recorded as
Restructuring charges
.
|
|
(c)
|
Net income per weighted average share outstanding for all years was calculated based on weighted average shares outstanding for 2014 of
114.3 million
for basic and
114.8 million
for diluted.
|
|
(d)
|
We calculate FFO in accordance with the definition established by NAREIT. FFO reflects net income adjusted to exclude gains and losses from the sale of real estate assets, depreciation and amortization of real estate assets and amortization of direct lease acquisition costs, as well as the same adjustments for our equity-based investments, as applicable. We calculate AFFO as FFO adjusted to include cash paid for direct lease acquisition costs as such costs are generally amortized over a period ranging from four weeks to one year and therefore are incurred on a regular basis. AFFO also includes cash paid for maintenance capital expenditures since these are routine uses of cash that are necessary for our operations. In addition, AFFO excludes costs related to the Acquisition and restructuring charges, as well as certain non-cash items, including non-real estate depreciation and amortization, deferred income taxes, stock-based compensation expense, accretion expense, the non-cash effect of straight-line rent and amortization of deferred financing costs. We use FFO and AFFO for managing our business and for planning and forecasting future periods, and each is an important indicator of our operational strength and business performance, especially compared to other REITs. Our management believes users are best served if the information that is made available to them allows them to align their analysis and evaluation of our operating results along the same lines that our management uses in managing, planning and executing our business strategy. Our management also believes that the presentations of FFO and AFFO, as supplemental measures, are useful in evaluating our business because adjusting results to reflect items that have more bearing on the operating performance of REITs highlight trends in our business that may not otherwise be apparent when relying solely on GAAP financial measures. It is management’s opinion that these supplemental measures provide users with an important perspective on our operating performance and also make it easier to compare our results to other companies in our industry, as well as to REITs. See “Item 7. Management’s Discussion and Analysis of Financial Condition and Results of Operations,” for further information about FFO and AFFO.
|
33
The following table presents a reconciliation of
Net income
to FFO and AFFO:
|
Year Ended December 31,
|
||||||||||||||||||||
|
(in millions)
|
2014
|
2013
|
2012
|
2011
|
2010
|
|||||||||||||||
|
Net income
(1)
|
$
|
306.9
|
|
$
|
143.5
|
|
$
|
113.4
|
|
$
|
107.1
|
|
$
|
71.3
|
|
|||||
|
Depreciation of billboard advertising structures
|
99.6
|
|
97.5
|
|
98.8
|
|
101.3
|
|
99.2
|
|
||||||||||
|
Amortization of real estate-related intangible assets
|
44.9
|
|
43.2
|
|
42.5
|
|
53.5
|
|
57.4
|
|
||||||||||
|
Amortization of direct lease acquisition costs
|
33.8
|
|
30.9
|
|
31.1
|
|
32.1
|
|
30.9
|
|
||||||||||
|
Net (gain) loss on disposition of billboard advertising structures, net of tax
|
(2.1
|
)
|
(16.4
|
)
|
1.3
|
|
1.2
|
|
0.7
|
|
||||||||||
|
Adjustment related to equity-based investments
|
0.8
|
|
0.8
|
|
0.9
|
|
0.9
|
|
1.0
|
|
||||||||||
|
FFO
|
483.9
|
|
299.5
|
|
288.0
|
|
296.1
|
|
260.5
|
|
||||||||||
|
Adjustment for deferred income taxes
|
(249.5
|
)
|
(19.4
|
)
|
(5.7
|
)
|
33.6
|
|
39.5
|
|
||||||||||
|
Cash paid for direct lease acquisition costs
|
(32.8
|
)
|
(31.6
|
)
|
(30.9
|
)
|
(31.8
|
)
|
(29.4
|
)
|
||||||||||
|
Maintenance capital
expenditures
(2)
|
(23.3
|
)
|
(23.7
|
)
|
(14.0
|
)
|
(15.4
|
)
|
(20.4
|
)
|
||||||||||
|
Restructuring charges - severance, net of tax
|
3.7
|
|
—
|
|
—
|
|
—
|
|
—
|
|
||||||||||
|
Acquisition costs, net of tax
|
9.1
|
|
—
|
|
—
|
|
—
|
|
—
|
|
||||||||||
|
Other depreciation
|
7.6
|
|
7.0
|
|
7.1
|
|
7.7
|
|
8.4
|
|
||||||||||
|
Other amortization
|
16.3
|
|
17.2
|
|
17.3
|
|
17.3
|
|
18.3
|
|
||||||||||
|
Stock-based compensation
|
16.0
|
|
7.5
|
|
5.7
|
|
5.0
|
|
4.3
|
|
||||||||||
|
Non-cash effect of straight-line rent
|
(0.2
|
)
|
1.2
|
|
1.2
|
|
1.0
|
|
0.8
|
|
||||||||||
|
Accretion expense
|
2.3
|
|
2.2
|
|
2.5
|
|
2.7
|
|
2.8
|
|
||||||||||
|
Amortization of deferred financing costs
|
12.1
|
|
—
|
|
—
|
|
—
|
|
—
|
|
||||||||||
|
AFFO
|
$
|
245.2
|
|
$
|
259.9
|
|
$
|
271.2
|
|
$
|
316.2
|
|
$
|
284.8
|
|
|||||
|
(1)
|
Our net income reflects our tax status as a regular domestic C corporation for U.S. federal income tax purposes through July 16, 2014. On July 17, 2014, we began operating in a manner that will allow us to qualify to be taxed as a REIT for U.S. federal income tax purposes for our tax year commencing July 17, 2014, and ending December 31, 2014, and therefore our tax expense in future periods is expected to be substantially lower than it has been historically. We realized a tax benefit of
$206.0 million
in 2014, and incurred an income tax expense of
$96.6 million
in 2013,
$89.0 million
in 2012,
$87.8 million
in 2011 and
$57.1 million
in 2010. Our assumed cash paid for taxes during these periods were
$53.0 million
in 2014,
$112.8 million
in 2013,
$96.5 million
in 2012,
$50.9 million
in 2011 and
$18.2 million
in 2010.
|
|
(2)
|
Prior period amounts have been revised to the current presentation to reflect non-cash purchases of property and equipment. See “Item 7. Management’s Discussion and Analysis of Financial Condition and Results of Operations—Liquidity and Capital Resources—Cash Flows.”
|
|
(d)
|
Prior period amounts have been revised to the current presentation to reflect non-cash purchases of property and equipment. See “Item 7. Management’s Discussion and Analysis of Financial Condition and Results of Operations—Liquidity and Capital Resources—Cash Flows.”
|
34
The following Management’s Discussion and Analysis of Financial Condition and Results of Operations (“MD&A”) should be read in conjunction with our historical consolidated financial statements and the notes thereto in Part II, Item 8, of this Annual Report on Form 10-K. This MD&A contains forward-looking statements that involve numerous risks and uncertainties. The forward-looking statements are subject to a number of important factors, including, but not limited to, those factors discussed in “Item 1A. Risk Factors” and the “Cautionary Statement Regarding Forward-Looking Statements” section of this Annual Report on Form 10-K, that could cause our actual results to differ materially from the results described herein or implied by such forward-looking statements
.
Our prior period financial statements and the notes thereto, included in Part II, Item 8, of this Annual Report on Form 10-K, were presented on a “carve-out” basis from the consolidated financial statements of CBS using the historical results of operations, cash flows, assets and liabilities attributable to CBS’s Outdoor Americas operating segment and include allocations of expenses from CBS. These allocations reflect significant assumptions, and the financial statements do not necessarily reflect what our financial position, results of operations or cash flows would have been had we been a stand-alone company during the periods presented. As a result, historical financial information is not necessarily indicative of our future results of operations, financial position or cash flows
.
Overview
We provide advertising space (“displays”) on out-of-home advertising structures and sites across the United States (the “U.S.”), Canada and Latin America. We manage our business through two segments -
U.S.
and
International
.
On April 2, 2014, we completed an IPO of 23,000,000 shares of our common stock, including 3,000,000 shares of our common stock sold pursuant to the underwriters’ option to purchase additional shares, at a price of $28.00 per share for total net proceeds, after underwriting discounts and commissions, of $615.0 million. Of the total net proceeds, $515.0 million was transferred to a wholly owned subsidiary of CBS as partial consideration for the contribution of the entities comprising CBS’ Outdoor Americas operating segment to us. The remaining $100.0 million was retained by us and was applied to the cash portion of the E&P Purge.
On April 16, 2014, CBS received a private letter ruling from the Internal Revenue Service (the “IRS”) with respect to certain issues relevant to our ability to qualify as a real estate investment trust (a “REIT”). On
July 16, 2014
, CBS completed a registered offer to exchange
97,000,000
shares of our common stock that were owned by CBS for outstanding shares of CBS Class B common stock (the “Exchange Offer”). In connection with the Exchange Offer, CBS disposed of all of its shares of our common stock and as of
July 16, 2014
, we were separated from CBS (the “Separation”) and were no longer a subsidiary of CBS. On July 16, 2014, we ceased to be a member of the CBS consolidated tax group and on July 17, 2014, we began operating in a manner that will allow us to qualify as a REIT for U.S. federal income tax purposes for the tax year commencing July 17, 2014, and ending December 31, 2014.
On
October 1, 2014
, we completed our acquisition of certain outdoor advertising businesses (the “Acquired Business”) of Van Wagner Communications, LLC, for
$690.0 million
in cash, plus working capital adjustments (the “Acquisition”). (See the “Overview:
Acquisition
” section of this MD&A.)
In order to comply with certain REIT qualification requirements, on October 29, 2014, our board of directors approved a special dividend of approximately $547.7 million, or $4.56 per share, to distribute accumulated earnings and profits as of July 17, 2014, the date we began operating in a manner that will allow us to qualify as a REIT for U.S. federal income tax purposes, including any earnings and profits allocated to us by CBS in connection with the Separation (the “E&P Purge”). The special dividend was paid on December 31, 2014, to stockholders of record on November 20, 2014. In connection with the special dividend, we paid approximately $109.5 million in cash, and issued approximately 16.5 million new shares of our common stock based on the volume weighted average price of our common stock for the three trading days commencing on December 16, 2014, or $26.4974 per share. A portion ($100.0 million) of the IPO proceeds was retained by us and was applied to the cash portion of the E&P Purge. CBS transferred the balance of the cash portion of the E&P Purge (approximately $9.5 million) to us prior to the payment of the special dividend to stockholders.
On November 20, 2014, we changed our legal name to “OUTFRONT Media Inc.,” and our common stock began trading on the New York Stock Exchange under our new ticker symbol “OUT.”
35
Business
We are one of the largest providers of advertising space on out-of-home advertising structures and sites across the U.S., Canada and Latin America. Our inventory consists of billboard displays, which are primarily located on the most heavily traveled highways and roadways in top Nielsen Designated Marketing Areas and transit advertising displays with exclusive multi-year contracts with municipalities in large cities across the U.S. In total, we have displays in all of the 25 largest markets in the U.S. and over 180 markets in the U.S., Canada and Latin America. Our top market, high profile location focused portfolio includes sites such as the Bay Bridge in San Francisco, various locations along Sunset Boulevard in Los Angeles, and various sites in and around both Grand Central Station and Times Square in New York. With TAB Out of Home Ratings, we are able to provide advertisers with the actual audience, in terms of size and demographic composition that is exposed to individual signs. The combination of location and audience delivery is a selling proposition unique to the out-of-home industry. The breadth and depth of our portfolio provides our customers with a multitude of options to address a wide range of marketing objectives from national, brand-building campaigns to hyper-local businesses that want to drive customers to their retail location “one mile down the road.”
We believe that out-of-home advertising is an attractive form of advertising as our displays are ALWAYS ON™ and cannot be turned off, skipped or fast-forwarded, and that it provides our customers with a differentiated advertising solution at an attractive price point relative to other forms of advertising. We also believe that out-of-home is effective as a “stand-alone” media form, and as an integral part of a multi-media campaign, providing enhancements to mobile, social and on-line advertising by amplifying small screen messaging. In addition to leasing displays, we provide other value-added services to our customers, such as pre-campaign category research, creative design support and post-campaign tracking and analytics. We use a real-time mobile operations reporting system that facilitates proof of performance to customers. We have a diversified base of customers across various industries. During
2014
, our largest categories of advertisers were retail, television and healthcare/pharmaceuticals, which represented
10%
,
8%
and
8%
of our total U.S. revenues, respectively. During
2013
, our largest categories of advertisers were retail, television and entertainment, which represented
10%
,
8%
and
7%
of our total U.S. revenues, respectively.
We manage our business through the following two segments:
United States.
As of
December 31, 2014
, we had the largest number of advertising displays of any out-of-home advertising company operating in the 25 largest markets in the U.S. Our U.S. segment generated
22%
of its revenues in the New York City metropolitan area in
2014
, and 20% in each of
2013
and 2012, and generated
13%
in the Los Angeles metropolitan area in each of
2014
,
2013
and 2012. Our U.S. segment generated
Revenues
of
$1.20 billion
in 2014,
$1.13 billion
in 2013 and
$1.10 billion
in 2012, and Adjusted OIBDA of
$416.2 million
in 2014,
$406.4 million
in 2013 and
$385.4 million
in 2012. (See the “Segment Results of Operations” section of this MD&A.)
International
. Our International segment includes our operations in Canada and Latin America, including Mexico, Argentina, Brazil, Chile and Uruguay. Our International segment generated
Revenues
of
$155.0 million
in 2014,
$163.9 million
in 2013 and
$186.0 million
in 2012, and Adjusted OIBDA of
$24.3 million
in 2014,
$29.1 million
in 2013, and
$30.5 million
in 2012.
Acquisition
On
October 1, 2014
, we completed the Acquisition. The Acquisition was funded with cash on hand and the net proceeds from the issuance and sale of the New Senior Notes (as defined herein). In
2014
, we recorded
$7.6 million
of commitment and other fees in
Interest expense
in the Consolidated Statement of Operations associated with a lender commitment to provide a senior unsecured bridge term loan facility for the purpose of financing the Acquisition in the event we did not complete the offering of the New Senior Notes.
Executive Departures
In 2014, we recorded restructuring charges of
$9.8 million
associated with the reorganization of management, resulting in the departures of Wally Kelly, President and Chief Operating Officer, and Raymond Nowak, Executive Vice President, Chief Administrative Officer and U.S. Chief Financial Officer, from the Company. The restructuring charge is comprised of severance charges, including stock-based compensation of
$5.6 million
.
Economic Environment
Our revenues and operating results are sensitive to fluctuations in advertising expenditures, general economic conditions and other external events beyond our control.
36
Business Environment
We operate in a highly competitive industry. Increasing the number of digital billboard displays in our most heavily trafficked locations is an important element of our organic growth strategy, as digital billboard displays have the potential to attract additional business from both new and existing customers. We believe digital billboard displays are attractive to our customers because they allow for the development of richer and more visually engaging messages, provide our customers with the flexibility both to target audiences by time of day and to quickly launch new advertising campaigns, and eliminate or greatly reduce production costs. In addition, digital billboard displays enable us to run multiple advertisements on each display (up to eight per minute). As a result, digital billboard displays generate approximately three to four times more revenue per display on average than traditional static billboard displays, and digital billboard displays generate higher profits and cash flows than traditional static billboard displays.
Our revenues and profits may fluctuate due to seasonal advertising patterns and influences on advertising markets. Typically, our revenues and profits are highest in the fourth quarter, during the holiday shopping season, and lowest in the first quarter, as advertisers cut back on spending following the holiday shopping season.
Our large-scale portfolio allows our customers to reach a national audience and also provides the flexibility to tailor campaigns to specific regions or markets. In
2014
,
2013
and
2012
, we generated approximately
40%
of our U.S. revenues from national advertising campaigns.
Our transit shelter and transit systems businesses require us to obtain and renew contracts with municipalities and other governmental entities. When these contracts expire, we generally must participate in highly competitive bidding processes in order to obtain a new contract. In November 2014, we were informed that we were not successful in our bid to renew the New York City phone kiosk contract which we obtained as part of the Acquisition, and our operation of these kiosks are expected to cease during the first quarter of 2015. In the fourth quarter of 2014, we generated revenue of $5.3 million related to these operations. Our transit contracts with the New York Metropolitan Transit Authority (the “MTA”), which represents
57%
of our U.S. transit and other revenues, or
17%
of our total U.S. revenues, are scheduled to expire or are otherwise terminable by the MTA in 2015. We expect that a request for proposal will be issued by the MTA in mid-2015. See “Item 1A. Risk Factors—Risks Related to Our Business and Operations—The success of our transit advertising business is dependent on obtaining and renewing key municipal concessions on favorable terms.”
Tax Status
Our qualification to be taxed as a REIT is dependent on our ability to meet various complex requirements under the Internal Revenue Code of 1986, as amended (the “Code”), related to, among other things, the sources of our gross income, the composition and values of our assets and the diversity of ownership of our shares. See “Item 1A. Risk Factors—Risks Related to Our Status as a REIT.” As long as we remain qualified to be taxed as a REIT, we generally will not be subject to U.S. federal income tax on REIT taxable income that we distribute to stockholders. To maintain REIT status, we must meet a number of organizational and operational requirements, including a requirement that we annually distribute to our stockholders at least 90% of our REIT taxable income, determined without regard to the dividends-paid deduction and excluding any net capital gains. To the extent that we satisfy this distribution requirement and qualify for taxation as a REIT but distribute less than 100% of our REIT taxable income, determined with the above modifications, we will be subject to U.S. federal income tax on our undistributed net taxable income. In addition, we will be subject to a nondeductible 4% excise tax if the amount that we actually distribute to our stockholders in a calendar year is less than a minimum amount specified under U.S. federal tax laws. We intend to pay regular quarterly distributions to our stockholders in an amount not less than 100% of our REIT taxable income (determined before the deduction for dividends paid).
We believe we are organized in conformity with the requirements for qualification and taxation as a REIT under the Code and that our manner of operation will enable us to continue to meet those requirements. If we fail to qualify to be taxed as a REIT in any taxable year and do not qualify for certain statutory relief provisions, we will be subject to U.S. federal income tax at regular corporate rates and will be precluded from re-electing REIT status for the subsequent four taxable years. Despite our status as a REIT, we will be subject to certain U.S. federal, state and local taxes on our income or property and the income of our taxable REIT subsidiaries (“TRSs”) will be subject to taxation at regular corporate rates.
37
Key Performance Indicators
Our management reviews our performance by focusing on the indicators described below.
Several of our key performance indicators are not prepared in conformity with Generally Accepted Accounting Principles in the United States of America (“GAAP”). We believe these non-GAAP performance indicators are meaningful supplemental measures of our operating performance and should not be considered in isolation of, or as a substitute for, their most directly comparable GAAP financial measures.
In
2014
, we incurred
$26.3 million
of costs associated with operating as a stand-alone public company (
$19.6 million
incrementally over 2013) and
$75.7 million
of interest expense, net, relating to our entry into the Senior Credit Facilities (as defined herein), the issuance of the Senior Notes (as defined herein) and the lender commitment to provide a senior unsecured bridge term loan facility for the purpose of financing the Acquisition. In
2013
, we incurred a significant net gain of $9.8 million on the disposition of most of our billboards in Salt Lake City in exchange for billboards in New Jersey and a gain of $17.5 million associated with the disposition of our transit shelter operations in Los Angeles.
In an effort to help users evaluate our operating performance for
2014
and
2013
, where indicated, we present Adjusted OIBDA, Funds from Operations (“FFO”) and Adjusted FFO (“AFFO”) and related per adjusted weighted average share amounts, on a REIT-comparable basis.
|
Year Ended December 31,
|
% Change
|
||||||||||
|
(in millions, except percentages)
|
2014
|
2013
|
2014 vs. 2013
|
||||||||
|
Revenues
|
$
|
1,353.8
|
|
$
|
1,294.0
|
|
5
|
%
|
|||
|
Constant dollar revenues
(a)
|
1,353.8
|
|
1,280.9
|
|
6
|
|
|||||
|
Operating income
|
183.1
|
|
238.8
|
|
(23
|
)
|
|||||
|
Adjusted OIBDA
(b)
:
|
|||||||||||
|
Reported
|
413.4
|
|
414.8
|
|
—
|
|
|||||
|
On a REIT-comparable basis
|
413.4
|
|
395.2
|
|
5
|
|
|||||
|
FFO
(b)
:
|
|||||||||||
|
Reported
|
483.9
|
|
299.5
|
|
62
|
|
|||||
|
On a REIT-comparable basis
|
292.5
|
|
283.4
|
|
3
|
|
|||||
|
AFFO
(b)
:
|
|||||||||||
|
Reported
|
245.2
|
|
259.9
|
|
(6
|
)
|
|||||
|
On a REIT-comparable basis
|
282.6
|
|
276.6
|
|
2
|
|
|||||
|
Net income
|
306.9
|
|
143.5
|
|
114
|
|
|||||
|
(a)
|
Revenues on a constant dollar basis are calculated as reported revenues excluding the impact of foreign currency exchange rates between years. We provide constant dollar revenues to understand the underlying growth rate of revenue excluding the impact of changes in foreign currency exchange rates between years, which are not under management’s direct control. Our management believes constant dollar revenues are useful to users because it enables them to better understand the level of growth of our business year to year. Since constant dollar revenues are not calculated in accordance with GAAP, they should not be considered in isolation of, or as a substitute for, revenues as an indicator of operating performance. Constant dollar revenues, as we calculate them, may not be comparable to similarly titled measures employed by other companies.
|
|
(b)
|
See the “Reconciliation of Non-GAAP Financial Measures” section of this MD&A for a reconciliation of
Operating income
to Adjusted OIBDA,
Net income
to FFO and AFFO, and results on a REIT-comparable basis.
|
38
Adjusted OIBDA
We calculate Adjusted OIBDA as
Operating income
before
Depreciation
,
Amortization
,
Net (gains) losses on dispositions,
Stock-based compensation
,
Restructuring charges
and
Acquisition costs
. We calculate Adjusted OIBDA margin by dividing Adjusted OIBDA by total revenues. Adjusted OIBDA and Adjusted OIBDA margin are among the primary measures we use for managing our business, evaluating our operating performance and planning and forecasting future periods, as each is an important indicator of our operational strength and business performance. Our management believes users of our financial data are best served if the information that is made available to them allows them to align their analysis and evaluation of our operating results along the same lines that our management uses in managing, planning and executing our business strategy. Our management also believes that the presentations of Adjusted OIBDA and Adjusted OIBDA margin, as supplemental measures, are useful in evaluating our business because eliminating certain non-comparable items highlight operational trends in our business that may not otherwise be apparent when relying solely on GAAP financial measures. It is management’s opinion that these supplemental measures provide users with an important perspective on our operating performance and also make it easier for users to compare our results with other companies that have different financing and capital structures or tax rates.
FFO and AFFO
We calculate FFO in accordance with the definition established by the National Association of Real Estate Investment Trusts (“NAREIT”). FFO reflects net income adjusted to exclude gains and losses from the sale of real estate assets, depreciation and amortization of real estate assets and amortization of direct lease acquisition costs, as well as the same adjustments for our equity-based investments, as applicable. We calculate AFFO as FFO adjusted to include cash paid for direct lease acquisition costs as such costs are generally amortized over a period ranging from four weeks to one year and therefore are incurred on a regular basis. AFFO also includes cash paid for maintenance capital expenditures since these are routine uses of cash that are necessary for our operations. In addition, AFFO excludes costs related to the Acquisition and restructuring charges, as well as certain non-cash items, including non-real estate depreciation and amortization, deferred income taxes, stock-based compensation expense, accretion expense, the non-cash effect of straight-line rent and amortization of deferred financing costs. We use FFO and AFFO measures for managing our business and for planning and forecasting future periods, and each is an important indicator of our operational strength and business performance, especially compared to other REITs. Our management believes users are best served if the information that is made available to them allows them to align their analysis and evaluation of our operating results along the same lines that our management uses in managing, planning and executing our business strategy. Our management also believes that the presentations of FFO, AFFO, and related per adjusted weighted average share amounts, as supplemental measures, are useful in evaluating our business because adjusting results to reflect items that have more bearing on the operating performance of REITs highlight trends in our business that may not otherwise be apparent when relying solely on GAAP financial measures. It is management’s opinion that these supplemental measures provide users with an important perspective on our operating performance and also make it easier to compare our results to other companies in our industry, as well as to REITs.
Adjusted Weighted Average Shares
We present weighted average shares on an adjusted basis for basic earnings per share (“EPS”) to give effect to the
23,000,000
shares issued on
April 2, 2014
, in connection with the IPO, the
97,000,000
shares outstanding after our stock split and
16,536,001
shares issued in connection with the E&P Purge, and on an adjusted basis for diluted EPS to also give effect to dilutive potential shares from grants of restricted share units (“RSUs”), performance-based RSUs (“PRSUs”) and stock options. Our management believes that these presentations are useful in evaluating our business because they allow users to evaluate our basic and diluted per share results after giving effect to the issuance of shares of our common stock in connection with our IPO and the E&P Purge, which increased our outstanding shares of common stock.
39
REIT-Comparable Basis Adjustments
We calculate Adjusted OIBDA, on a REIT-comparable basis, in 2014 and 2013, by adjusting 2013 to include incremental costs associated with operating as a stand-alone public company of
$19.6 million
, which were incurred in 2014. We calculate FFO and AFFO, on a REIT comparable basis, and related per adjusted weighted average share amounts, to (1) include incremental costs associated with operating as a stand-alone public company, net of tax, of
$11.7 million
incurred in 2014, and interest expense, net of tax, of
$45.3 million
incurred in 2014, relating to our entry into the Senior Credit Facilities, the issuance of the Senior Notes in the first quarter of 2014 and the lender commitment to provide a senior unsecured bridge term loan facility for the purpose of financing the Acquisition, and exclude income taxes that would not have been incurred had we been operating as a REIT in 2014 and 2013, (2) with respect to FFO, on a REIT-comparable basis, and related per adjusted weighted average share amounts only, exclude restructuring charges, net of tax, of
$8.6 million
and costs related to the Acquisition, net of tax, of
$9.1 million
, both incurred in 2014, as well as an income tax benefit from the reversal of deferred tax liabilities due to our REIT conversion of
$235.6 million
in 2014, and (3) with respect to AFFO, on a REIT-comparable basis, and related per adjusted weighted average share amounts, only, include amortization of deferred financing costs incurred in 2014 of
$11.7 million
relating to our entry into the Senior Credit Facilities and the issuance of the Senior Notes in the first quarter of 2014 and the lender commitment to provide a senior unsecured bridge term loan facility for the purpose of financing the Acquisition. Our management believes these adjusted presentations are useful in evaluating our business because they allow users to compare our operating performance for 2013 against the operating performance of 2014, taking into account certain significant costs arising as a result of the Separation and the Acquisition, as well as the REIT tax treatment that would have applied had we been operating as a REIT for the periods presented.
Since adjusted weighted average shares, Adjusted OIBDA, Adjusted OIBDA margin, FFO and AFFO, and, on a REIT-comparable basis, Adjusted OIBDA, FFO and AFFO and related per adjusted weighted average share amounts, are not measures calculated in accordance with GAAP, they should not be considered in isolation of, or as a substitute for, weighted average shares outstanding for basic and diluted EPS,
Operating income
,
Net income
,
Revenues
and Net income per common share for basic and diluted EPS, the most directly comparable GAAP financial measures, as indicators of operating performance. These measures, as we calculate them, may not be comparable to similarly titled measures employed by other companies. In addition, these measures do not necessarily represent funds available for discretionary use and are not necessarily a measure of our ability to fund our cash needs.
40
Reconciliation of Non-GAAP Financial Measures
The following table reconciles
Operating income
to Adjusted OIBDA, and
Net income
to FFO and AFFO. The table also reconciles Adjusted OIBDA, FFO and AFFO to Adjusted OIBDA, FFO and AFFO, and related per adjusted weighted average share amounts, on a REIT-comparable basis.
|
Year Ended December 31,
|
||||||||
|
(in millions, except per share amounts)
|
2014
|
2013
|
||||||
|
Operating income
|
$
|
183.1
|
|
$
|
238.8
|
|
||
|
Restructuring charges
(a)
|
9.8
|
|
—
|
|
||||
|
Acquisition costs
(b)
|
10.4
|
|
—
|
|
||||
|
Net (gain) loss on dispositions
|
(2.5
|
)
|
(27.3
|
)
|
||||
|
Depreciation
|
107.2
|
|
104.5
|
|
||||
|
Amortization
|
95.0
|
|
91.3
|
|
||||
|
Stock-based compensation
(a)
|
10.4
|
|
7.5
|
|
||||
|
Adjusted OIBDA
|
413.4
|
|
414.8
|
|
||||
|
Incremental stand-alone costs
(c)
|
—
|
|
(19.6
|
)
|
||||
|
Adjusted OIBDA, on a REIT-comparable basis
|
$
|
413.4
|
|
$
|
395.2
|
|
||
|
Net income
|
$
|
306.9
|
|
$
|
143.5
|
|
||
|
Depreciation of billboard advertising structures
|
99.6
|
|
97.5
|
|
||||
|
Amortization of real estate-related intangible assets
|
44.9
|
|
43.2
|
|
||||
|
Amortization of direct lease acquisition costs
|
33.8
|
|
30.9
|
|
||||
|
Net (gain) loss on disposition of billboard advertising structures, net of tax
|
(2.1
|
)
|
(16.4
|
)
|
||||
|
Adjustment related to equity-based investments
|
0.8
|
|
0.8
|
|
||||
|
FFO
|
483.9
|
|
299.5
|
|
||||
|
Restructuring charges, net of tax
|
8.6
|
|
—
|
|
||||
|
Acquisition costs, net of tax
(b)
|
9.1
|
|
—
|
|
||||
|
Income tax benefit from reversal of deferred tax liabilities due to REIT conversion
|
(235.6
|
)
|
—
|
|
||||
|
Incremental stand-alone costs, net of tax
(c)
|
—
|
|
(11.7
|
)
|
||||
|
Incremental interest expense, net of tax
(d)
|
—
|
|
(45.3
|
)
|
||||
|
REIT tax adjustment
(e)
|
26.5
|
|
40.9
|
|
||||
|
FFO, on a REIT-comparable basis
|
$
|
292.5
|
|
$
|
283.4
|
|
||
41
|
Year Ended December 31,
|
||||||||
|
(in millions, except per share amounts)
|
2014
|
2013
|
||||||
|
FFO
|
$
|
483.9
|
|
$
|
299.5
|
|
||
|
Adjustment for deferred income taxes
|
(249.5
|
)
|
(19.4
|
)
|
||||
|
Cash paid for direct lease acquisition costs
|
(32.8
|
)
|
(31.6
|
)
|
||||
|
Maintenance capital expenditures
(h)
|
(23.3
|
)
|
(23.7
|
)
|
||||
|
Restructuring charges - severance, net of tax
(a)
|
3.7
|
|
—
|
|
||||
|
Acquisition costs, net of tax
(b)
|
9.1
|
|
—
|
|
||||
|
Other depreciation
|
7.6
|
|
7.0
|
|
||||
|
Other amortization
|
16.3
|
|
17.2
|
|
||||
|
Stock-based compensation
|
16.0
|
|
7.5
|
|
||||
|
Non-cash effect of straight-line rent
|
(0.2
|
)
|
1.2
|
|
||||
|
Accretion expense
|
2.3
|
|
2.2
|
|
||||
|
Amortization of deferred financing costs
|
12.1
|
|
—
|
|
||||
|
AFFO
|
245.2
|
|
259.9
|
|
||||
|
Incremental stand-alone costs, net of tax
(c)
|
—
|
|
(11.7
|
)
|
||||
|
Incremental interest expense, net of tax
(d)
|
—
|
|
(45.3
|
)
|
||||
|
Amortization of deferred financing costs
|
—
|
|
11.7
|
|
||||
|
REIT tax adjustment
(e)
|
37.4
|
|
62.0
|
|
||||
|
AFFO, on a REIT-comparable basis
|
$
|
282.6
|
|
$
|
276.6
|
|
||
|
FFO, on a REIT-comparable basis, per adjusted weighted average share
(f)
:
|
||||||||
|
Basic
|
$
|
2.14
|
|
$
|
2.08
|
|
||
|
Diluted
|
$
|
2.14
|
|
$
|
2.07
|
|
||
|
AFFO, on a REIT-comparable basis, per adjusted weighted average share
(f)
:
|
||||||||
|
Basic
|
$
|
2.07
|
|
$
|
2.03
|
|
||
|
Diluted
|
$
|
2.06
|
|
$
|
2.02
|
|
||
|
Adjusted weighted average shares
(f)
:
|
||||||||
|
Basic
|
136.5
|
|
136.5
|
|
||||
|
Diluted
|
137.0
|
|
137.0
|
|
||||
|
Weighted average shares outstanding:
|
||||||||
|
Basic
|
114.3
|
|
114.3
|
|
||||
|
Diluted
|
114.8
|
|
114.8
|
|
||||
|
(a)
|
Restructuring charges relate to the severance of two executives and excludes stock-based compensation expenses of
$5.6 million
.
|
|
(b)
|
Adjustment to reflect costs related to the Acquisition.
|
|
(c)
|
Adjustment to reflect incremental costs to operate as a stand-alone company at the same level as 2014.
|
|
(d)
|
Adjustment to reflect incremental interest expense, net of tax, at the same level as 2014.
|
|
(e)
|
Adjustment to reflect tax balances as if we had been operating as a REIT for both years.
|
|
(f)
|
Adjusted weighted average shares includes the 23,000,000 shares issued on April 2, 2014, in connection with the IPO, the 97,000,000 shares outstanding after our stock split
(g)
and the
16,536,001
shares issued in connection with the E&P Purge for basic EPS. Adjusted weighted average shares for diluted EPS also includes dilutive potential shares from grants of RSUs, PRSUs and stock options.
|
|
(g)
|
On March 14, 2014, our board of directors declared a 970,000 to 1 stock split. As a result of the stock split, the 100 shares of our common stock then outstanding were converted into 97,000,000 shares of our common stock. The effects of the stock split have been applied retroactively to all reported periods for EPS purposes.
|
|
(h)
|
Prior period amounts have been revised to the current presentation to reflect non-cash purchases of property and equipment.
|
FFO in 2014 of
$483.9 million
increased
62%
compared to 2013, primarily due to the reversal of
$235.6 million
of deferred income tax liabilities due to our change in tax status to that of a REIT, partially offset by higher interest costs, net of tax, of
42
$45.3 million
and incremental stand-alone costs, net of tax, of
$11.7 million
. AFFO
in 2014, was
$245.2 million
, a decrease of
6%
compared to 2013. On a REIT-comparable basis, FFO increased
3%
and AFFO increased
2%
in 2014. AFFO on a REIT-comparable basis, per adjusted weighted average share for basic EPS was
$2.07
per share and diluted EPS was
$2.06
per share in 2014. AFFO on a REIT-comparable basis per adjusted weighted average share was
$2.03
for basic EPS and
$2.02
for diluted EPS in 2013. The increase in FFO and FFO per adjusted weighted average share, on a REIT-comparable basis, for 2014 compared to 2013 was primarily due to the Acquisition. AFFO and AFFO per adjusted weighted average share for 2014, on a REIT-comparable basis, increased
2%
compared to 2013, due primarily to the Acquisition.
Analysis of Results of Operations
Revenues
We derive
Revenues
primarily from providing advertising space to customers on our advertising structures and sites. Our contracts with customers generally cover periods ranging from four weeks to one year. Revenues from billboard displays are recognized as rental income on a straight-line basis over the contract term. Transit and other revenues are recognized as earned, which is typically ratably over the contract period. For space provided to advertisers through the use of an advertising agency whose commission is calculated based on a stated percentage of gross advertising spending, our
Revenues
are reported net of agency commissions.
|
(in constant dollars)
(b)
|
||||||||||||||||||||||||||||||||
|
Year Ended December 31,
|
% Change
|
Year Ended December 31,
|
% Change
|
|||||||||||||||||||||||||||||
|
(in millions, except percentages)
|
2014
|
2013
|
2012
|
2014 vs. 2013
|
2013 vs. 2012
|
2013
|
2012
|
2014 vs. 2013
|
2013 vs. 2012
|
|||||||||||||||||||||||
|
Revenues:
|
||||||||||||||||||||||||||||||||
|
Billboard
|
$
|
972.1
|
|
$
|
925.7
|
|
$
|
913.6
|
|
5
|
%
|
1
|
%
|
$
|
915.6
|
|
$
|
899.8
|
|
6
|
%
|
2
|
%
|
|||||||||
|
Transit and other
|
381.7
|
|
368.3
|
|
371.0
|
|
4
|
|
(1
|
)
|
365.3
|
|
366.9
|
|
4
|
|
—
|
|
||||||||||||||
|
Total revenues
|
$
|
1,353.8
|
|
$
|
1,294.0
|
|
$
|
1,284.6
|
|
5
|
|
1
|
|
$
|
1,280.9
|
|
$
|
1,266.7
|
|
6
|
|
1
|
|
|||||||||
|
Organic
revenues
(a)
:
|
||||||||||||||||||||||||||||||||
|
Billboard
|
$
|
929.5
|
|
$
|
915.6
|
|
$
|
899.8
|
|
2
|
|
2
|
|
$
|
915.6
|
|
$
|
899.8
|
|
2
|
|
2
|
|
|||||||||
|
Transit and other
|
366.0
|
|
351.8
|
|
351.7
|
|
4
|
|
—
|
|
351.8
|
|
351.7
|
|
4
|
|
—
|
|
||||||||||||||
|
Total organic revenues
(a)
|
1,295.5
|
|
1,267.4
|
|
1,251.5
|
|
2
|
|
1
|
|
$
|
1,267.4
|
|
$
|
1,251.5
|
|
2
|
|
1
|
|
||||||||||||
|
Non-organic revenues:
|
||||||||||||||||||||||||||||||||
|
Billboard
|
42.6
|
|
10.1
|
|
13.8
|
|
*
|
|
(27
|
)
|
$
|
—
|
|
$
|
—
|
|
*
|
|
*
|
|
||||||||||||
|
Transit and other
|
15.7
|
|
16.5
|
|
19.3
|
|
(5
|
)
|
(15
|
)
|
13.5
|
|
15.2
|
|
16
|
|
(11
|
)
|
||||||||||||||
|
Total non-organic revenues
|
58.3
|
|
26.6
|
|
33.1
|
|
119
|
|
(20
|
)
|
13.5
|
|
15.2
|
|
*
|
|
(11
|
)
|
||||||||||||||
|
Total revenues
|
$
|
1,353.8
|
|
$
|
1,294.0
|
|
$
|
1,284.6
|
|
5
|
|
1
|
|
$
|
1,280.9
|
|
$
|
1,266.7
|
|
6
|
|
1
|
|
|||||||||
* Calculation not meaningful.
|
(a)
|
Organic revenues exclude revenues associated with significant acquisitions and divestitures, business lines we no longer operate, and the impact of foreign exchange rates (“non-organic revenues”). We provide organic revenues to understand the underlying growth rate of revenue excluding the impact of non-organic revenue items. Our management believes organic revenues are useful to users because it enables them to better understand the level of growth of our business year to year. Since organic revenues are not calculated in accordance with GAAP, it should not be considered in isolation of, or as a substitute for, revenues as an indicator of operating performance. Organic revenues, as we calculate it, may not be comparable to similarly titled measures employed by other companies.
|
|
(b)
|
Revenues on a constant dollar basis are calculated as reported revenues excluding the impact of foreign currency exchange rates between years.
|
Total revenues increased
$59.8 million
, or
5%
, and organic revenues increased
$28.1 million
, or
2%
, in 2014 compared to 2013. In constant dollars, revenues increased
$72.9 million
, or
6%
, and organic revenues increased
$28.1 million
, or
2%
, in 2014 compared to 2013.
Total revenues increased
$9.4 million
, or
1%
, and organic revenues increased
$15.9 million
, or
1%
, in 2013 compared to 2012. In constant dollars, revenues increased
$14.2 million
in 2013, or
1%
, compared to 2012.
43
Non-organic revenues primarily reflect the impact of the Acquisition, the November 2013 sale of our transit shelter operations in the greater Los Angeles area and the April 2014 non-renewal of an unprofitable contract.
Total billboard revenues increased
$46.4 million
, or
5%
, in 2014 compared to 2013, principally driven by the impact of the Acquisition, stronger local advertising sales and the conversion of traditional static billboard displays to digital billboard displays, partially offset by foreign currency exchange losses of
$10.1 million
. In constant dollars, billboard revenues increased
$56.5 million
in 2014 compared to 2013, due primarily to the Acquisition. Total billboard revenues increased
$12.1 million
, or
1%
, in 2013 compared to 2012, principally driven by growth in average revenue per display (yield) attributable to the conversion of traditional static billboard displays to digital billboard displays. In constant dollars, billboard revenues increased
$15.8 million
in 2013 compared to 2012.
Total transit and other revenues increased
$13.4 million
, or
4%
, in 2014 compared to 2013, driven by revenues from the impact of the Acquisition and higher revenues in 2014 from the television and healthcare/pharmaceuticals industries, partially offset by lower revenues in 2014 from the beer/liquor industry, the sale of our transit shelter operations in the greater Los Angeles area, the non-renewal of an unprofitable contract and softer market conditions in national advertising. Total transit and other revenues decreased
$2.7 million
, or
1%
, in 2013 compared to 2012, driven by a decrease of $5.7 million attributable to the non-renewal of several low-margin and unprofitable transit agreements in Canada, partially offset by growth in the United States attributable to higher average rates.
Expenses
|
Year Ended December 31,
|
% Change
|
|||||||||||||||||
|
(in millions, except percentages)
|
2014
|
2013
|
2012
|
2014 vs. 2013
|
2013 vs. 2012
|
|||||||||||||
|
Expenses:
|
||||||||||||||||||
|
Operating
|
$
|
726.5
|
|
$
|
686.9
|
|
$
|
700.1
|
|
6
|
%
|
(2
|
)%
|
|||||
|
Selling, general and administrative
|
224.3
|
|
199.8
|
|
181.8
|
|
12
|
|
10
|
|
||||||||
|
Restructuring charges
|
9.8
|
|
—
|
|
2.5
|
|
*
|
|
*
|
|
||||||||
|
Acquisition costs
|
10.4
|
|
—
|
|
—
|
|
*
|
|
*
|
|
||||||||
|
Net (gain) loss on dispositions
|
(2.5
|
)
|
(27.3
|
)
|
2.2
|
|
(91
|
)
|
*
|
|
||||||||
|
Depreciation
|
107.2
|
|
104.5
|
|
105.9
|
|
3
|
|
(1
|
)
|
||||||||
|
Amortization
|
95.0
|
|
91.3
|
|
90.9
|
|
4
|
|
—
|
|
||||||||
|
Total expenses
|
$
|
1,170.7
|
|
$
|
1,055.2
|
|
$
|
1,083.4
|
|
11
|
|
(3
|
)
|
|||||
|
*
|
Calculation is not meaningful.
|
Operating Expenses
Our operating expenses are composed of the following:
Billboard property lease expenses.
These expenses reflect the cost of leasing the real property on which our billboards are mounted. These lease agreements have terms varying between one month and multiple years, and usually provide renewal options. Rental expenses are comprised of a fixed monthly amount and under certain agreements, also include contingent rent, which varies based on the revenues we generate from the leased site. Property leases are generally paid in advance for periods ranging from one to twelve months. The fixed rent is expensed evenly over the contract term and the contingent rent is expensed as it becomes probable, which is consistent with when the related revenues are recognized.
Transit franchise expenses
.
These expenses reflect costs charged by municipalities and transit operators under transit advertising contracts and are generally calculated based on a percentage of the revenues we generate
under the contract, with a minimum guarantee. The costs that are determined based on a percentage of revenues are expensed as incurred when the related revenues are recognized, and the minimum guarantee is expensed over the contract term.
Posting, maintenance and other site-related expenses
.
These expenses primarily reflect costs associated with posting and rotation, materials, repairs and maintenance, utilities and property taxes.
44
|
Year Ended December 31,
|
% Change
|
|||||||||||||||||
|
(in millions, except percentages)
|
2014
|
2013
|
2012
|
2014 vs. 2013
|
2013 vs. 2012
|
|||||||||||||
|
Operating expenses:
|
||||||||||||||||||
|
Billboard property lease
|
$
|
310.1
|
|
$
|
285.4
|
|
$
|
279.0
|
|
9
|
%
|
2
|
%
|
|||||
|
Transit franchise
|
203.9
|
|
197.1
|
|
203.8
|
|
3
|
|
(3
|
)
|
||||||||
|
Posting, maintenance and other
|
212.5
|
|
204.4
|
|
217.3
|
|
4
|
|
(6
|
)
|
||||||||
|
Total operating expenses
|
$
|
726.5
|
|
$
|
686.9
|
|
$
|
700.1
|
|
6
|
|
(2
|
)
|
|||||
Billboard property lease expenses represented
32%
of billboard revenues in 2014 and
31%
in each of 2013 and 2012. Transit franchise expenses represented
64%
of transit revenues in both 2014 and 2012, and
62%
in 2013. Billboard property lease and transit franchise expenses increased by
$31.5 million
in 2014 over 2013. The increase was primarily due to the impact of the Acquisition.
Posting, maintenance and other expenses as a percentage of
Revenues
were
16%
in each of 2014 and 2013 and
17%
in 2012. Posting, maintenance and other expenses increased
$8.1 million
, or
4%
, in 2014 compared to 2013, principally due to impact of the Acquisition and higher production and installation costs, which are typically billed to the advertiser and recorded as
Revenues
. Posting, maintenance and other expenses decreased
$12.9 million
, or
6%
, in 2013 compared to 2012, principally due to a tax imposed on the billboard industry in Toronto, which resulted in a one-time retroactive payment of $7.9 million in 2012 and lower direct costs for compensation in 2013.
Selling, General and Administrative Expenses (“SG&A”)
SG&A expenses represented
17%
of
Revenues
in 2014,
15%
of
Revenues
in 2013 and
14%
of
Revenues
in 2012. SG&A expenses increased
$24.5 million
, or
12%
, in 2014 compared to 2013, primarily due to incremental stand-alone costs of
$19.6 million
and increased compensation-related expenses, partially offset by the impact of foreign exchange. SG&A expenses increased
$18.0 million
, or
10%
, in 2013 compared to 2012, primarily due to professional fees of $7.3 million related to our preparation to convert to a REIT, incremental costs of $5.2 million related to our preparation to operate as a stand-alone public company, and other increases in professional fees.
During 2015, we expect increased SG&A expenses related to additional public company expenses that did not apply to us historically. These incremental expenses were incurred throughout 2014 and accordingly, will impact 2015 on an annualized basis.
Restructuring Charges
In 2014, we recorded restructuring charges of
$9.8 million
associated with the reorganization of management, resulting in the departures of two executive officers. The restructuring charge is comprised of severance charges, including stock-based compensation of
$5.6 million
.
Net Gain on Dispositions
Net gain on dispositions
was
$2.5 million
in 2014 and includes a gain of $0.6 million related to the divestiture of a transit shelter operation in the greater Los Angeles area.
Net gain on dispositions
in 2013 was
$27.3 million
, which included a gain of $9.8 million from the disposition of most of our billboards in Salt Lake City in exchange for billboards in New Jersey and a gain of $17.5 million associated with the disposition of our transit shelter operations in Los Angeles. During 2013, we sold 50% of our transit shelter operations in Los Angeles, and we and the buyer each subsequently contributed our respective 50% interests in these operations to a 50/50 joint venture we own together.
Depreciation
Depreciation
increased
$2.7 million
, or
3%
, in 2014 compared to 2013, due primarily to depreciation associated with the Acquisition and higher depreciation due to the increased number of digital billboards. Both digital and static billboards are depreciated over an estimated useful life of 5 years to 20 years.
Depreciation
decreased
$1.4 million
, or
1%
, in 2013 compared to 2012, due primarily to disposed billboards.
45
Amortization
Amortization
increased
$3.7 million
in 2014 compared to 2013, principally driven by amortization related to the intangible assets associated with the Acquisition.
Amortization
increased
$0.4 million
in 2013 compared to 2012. Amortization expense includes the amortization of direct lease acquisition costs of
$33.8 million
in 2014,
$30.9 million
in 2013 and
$31.1 million
in 2012. Capitalized direct lease acquisition costs were
$33.8 million
in 2014,
$30.8 million
in 2013 and
$31.4 million
in 2012.
Interest Expense
Interest expense, net, was
$84.8 million
in 2014. We incurred indebtedness of $2.20 billion during 2014. (See the “Liquidity and Capital Resources” section of this MD&A.)
Benefit (Provision) for Income Taxes
Prior to the Separation, we were a member of CBS’s consolidated tax group and were taxable as a regular domestic C corporation for U.S. federal income tax purposes (i.e., we were subject to taxation at regular corporate rates). Pursuant to the tax matters agreement that we entered into with CBS, we are liable to pay CBS for any taxes imposed on or related to us while we were a member of the CBS consolidated tax group. The tax matters agreement also separately allocates among the parties any tax liability arising as a result of any failure of the Separation to qualify as a tax-free transaction based on actions taken during the two-year period following the Separation. After the Separation, CBS ceased to own at least 80% of our outstanding common stock, and as a result, we were no longer a member of CBS’s consolidated tax group.
In 2014, as a result of our REIT conversion, substantially all
Deferred income tax liabilities, net,
was reversed into
Net income
via a non-cash benefit of approximately
$235.6 million
. As a result of our REIT conversion, our effective tax rate for the second half of 2014 was substantially lower than previous periods. Prior to the Separation, our income tax provisions were calculated on a separate tax return basis, with us as the taxpayer, even though our U.S. operating results were included in the consolidated federal, and certain state and local income tax returns of CBS. We believe that the assumptions and estimates used to determine these tax amounts were reasonable. However, the consolidated financial statements included in this Annual Report on Form 10-K may not necessarily reflect our income tax expense or tax payments, or what our tax amounts would have been if we had been a stand-alone company operating as a REIT during the periods prior to the Separation.
The benefit for income taxes in 2014 was
$206.0 million
, including the reversal of
$235.6 million
, representing substantially all
Deferred income tax liabilities, net
, as a result of our REIT conversion, and the provision for income taxes was
$96.6 million
in 2013 and
$89.0 million
in 2012. Excluding the non-cash benefit recorded as a result of our REIT conversion in 2014, the effective income tax rate was
30.3%
for 2014,
40.7%
for 2013 and
44.5%
for 2012. As a result of our REIT conversion, our expected effective tax rate in the future will be substantially lower.
Net income
In 2014,
Net income
was
$306.9 million
, an increase of
$163.4 million
compared to 2013, primarily due to the write-off of deferred taxes in connection with our conversion to a REIT and higher revenues, partially offset by the incurrence of after-tax interest expense, after-tax incremental stand-alone costs, restructuring charges and costs related to the Acquisition in 2014, and an after-tax gain on the disposition of most of our billboards in Salt Lake City in 2013. In 2013,
Net income
was
$143.5 million
, an increase of
$30.1 million
compared to 2012, primarily due to revenue growth.
46
Segment Results of Operations
We present Adjusted OIBDA as the primary measure of profit and loss for our operating segments in accordance with Financial Accounting Standards Board (the “FASB”) guidance for segment reporting. (See the “Key Performance Indicators” section of this MD&A.)
The following table presents our
Revenues
, Adjusted OIBDA,
Operating income (loss)
and
Depreciation
and
Amortization
by segment in 2014, 2013 and 2012.
|
Year Ended December 31,
|
||||||||||||
|
(in millions)
|
2014
|
2013
|
2012
|
|||||||||
|
Revenues:
|
||||||||||||
|
United States
|
$
|
1,198.8
|
|
$
|
1,130.1
|
|
$
|
1,098.6
|
|
|||
|
International
|
155.0
|
|
163.9
|
|
186.0
|
|
||||||
|
Total revenues
|
1,353.8
|
|
1,294.0
|
|
1,284.6
|
|
||||||
|
Foreign currency exchange impact
|
—
|
|
13.1
|
|
17.9
|
|
||||||
|
Constant dollar revenues
(a)
|
$
|
1,353.8
|
|
$
|
1,280.9
|
|
$
|
1,266.7
|
|
|||
|
Operating income
|
$
|
183.1
|
|
$
|
238.8
|
|
$
|
201.2
|
|
|||
|
Restructuring charges
(b)(c)
|
9.8
|
|
—
|
|
2.5
|
|
||||||
|
Acquisition costs
(b)
|
10.4
|
|
—
|
|
—
|
|
||||||
|
Net (gain) loss on dispositions
|
(2.5
|
)
|
(27.3
|
)
|
2.2
|
|
||||||
|
Depreciation
|
107.2
|
|
104.5
|
|
105.9
|
|
||||||
|
Amortization
|
95.0
|
|
91.3
|
|
90.9
|
|
||||||
|
Stock-based compensation
(b)
|
10.4
|
|
7.5
|
|
5.7
|
|
||||||
|
Adjusted OIBDA
|
$
|
413.4
|
|
$
|
414.8
|
|
$
|
408.4
|
|
|||
|
Adjusted OIBDA:
|
||||||||||||
|
United States
|
$
|
416.2
|
|
$
|
406.4
|
|
$
|
385.4
|
|
|||
|
International
|
24.3
|
|
29.1
|
|
30.5
|
|
||||||
|
Corporate
|
(27.1
|
)
|
(20.7
|
)
|
(7.5
|
)
|
||||||
|
Total Adjusted OIBDA
|
$
|
413.4
|
|
$
|
414.8
|
|
$
|
408.4
|
|
|||
|
Operating income (loss):
|
||||||||||||
|
United States
|
$
|
244.3
|
|
$
|
267.1
|
|
$
|
216.4
|
|
|||
|
International
|
(3.5
|
)
|
(0.1
|
)
|
(2.0
|
)
|
||||||
|
Corporate
|
(57.7
|
)
|
(28.2
|
)
|
(13.2
|
)
|
||||||
|
Total operating income
|
$
|
183.1
|
|
$
|
238.8
|
|
$
|
201.2
|
|
|||
|
(a)
|
Revenues on a constant dollar basis are calculated as reported revenues excluding the impact of foreign currency exchange rates between years.
|
|
(b)
|
Restructuring charges, costs related to the Acquisition and stock-based compensation are classified as Corporate expenses.
|
|
(c)
|
Restructuring charges relate to the severance of two executives and includes stock-based compensation expenses of
$5.6 million
.
|
47
United States
|
Year Ended December 31,
|
% Change
|
|||||||||||||||||
|
(in millions, except percentages)
|
2014
|
2013
|
2012
|
2014 vs. 2013
|
2013 vs. 2012
|
|||||||||||||
|
Revenues:
|
||||||||||||||||||
|
Billboard
|
$
|
851.0
|
|
$
|
796.6
|
|
$
|
770.7
|
|
7
|
%
|
3
|
%
|
|||||
|
Transit and other
|
347.8
|
|
333.5
|
|
327.9
|
|
4
|
|
2
|
|
||||||||
|
Total revenues
|
$
|
1,198.8
|
|
$
|
1,130.1
|
|
$
|
1,098.6
|
|
6
|
|
3
|
|
|||||
|
Organic revenues
(a)
:
|
||||||||||||||||||
|
Billboard
|
$
|
808.4
|
|
$
|
796.6
|
|
$
|
770.7
|
|
1
|
|
3
|
|
|||||
|
Transit and other
|
332.1
|
|
320.0
|
|
312.7
|
|
4
|
|
2
|
|
||||||||
|
Total organic revenues
(a)
|
1,140.5
|
|
1,116.6
|
|
1,083.4
|
|
2
|
|
3
|
|
||||||||
|
Non-organic revenues:
|
||||||||||||||||||
|
Billboard
|
42.6
|
|
—
|
|
—
|
|
*
|
|
*
|
|
||||||||
|
Transit and other
|
15.7
|
|
13.5
|
|
15.2
|
|
16
|
|
(11
|
)
|
||||||||
|
Total non-organic revenues
|
58.3
|
|
13.5
|
|
15.2
|
|
*
|
|
(11
|
)
|
||||||||
|
Total revenues
|
1,198.8
|
|
1,130.1
|
|
1,098.6
|
|
6
|
|
3
|
|
||||||||
|
Operating expenses
|
(626.1
|
)
|
(584.2
|
)
|
(577.9
|
)
|
7
|
|
1
|
|
||||||||
|
SG&A expenses
|
(156.5
|
)
|
(139.5
|
)
|
(135.3
|
)
|
12
|
|
3
|
|
||||||||
|
Adjusted OIBDA
|
$
|
416.2
|
|
$
|
406.4
|
|
$
|
385.4
|
|
2
|
|
5
|
|
|||||
|
Operating income
|
$
|
244.3
|
|
$
|
267.1
|
|
$
|
216.4
|
|
(9
|
)
|
23
|
|
|||||
|
Restructuring charges
|
—
|
|
—
|
|
1.8
|
|
*
|
|
*
|
|
||||||||
|
Net (gain) loss on dispositions
|
(2.5
|
)
|
(27.5
|
)
|
1.6
|
|
(91
|
)
|
*
|
|
||||||||
|
Depreciation and amortization
|
174.4
|
|
166.8
|
|
165.6
|
|
5
|
|
1
|
|
||||||||
|
Adjusted OIBDA
|
$
|
416.2
|
|
$
|
406.4
|
|
$
|
385.4
|
|
2
|
|
5
|
|
|||||
|
*
|
Calculation not meaningful.
|
|
(a)
|
Organic revenues exclude revenues associated with significant acquisitions and divestitures, and business lines we no longer operate (“non-organic revenues”).
|
Total U.S. revenues increased
$68.7 million
, or
6%
, and U.S. organic revenues increased
$23.9 million
, or
2%
, in 2014 compared to 2013. Non-organic revenues primarily reflect the Acquisition in 2014, the November 2013 sale of our transit shelter operations in the greater Los Angeles area and the April 2014 non-renewal of an unprofitable contract.
Total revenue growth in 2014 compared to 2013 was led by increases in the television, professional services and retail categories and growth attributable to the conversion of traditional static billboard displays to digital billboard displays. Total U.S. revenues increased
$31.5 million
, or
3%
, and U.S. organic revenues increased
$33.2 million
, or
3%
, in 2013 compared to 2012, reflecting growth attributable to the conversion of traditional static billboard displays to digital billboard displays. Total revenue growth in 2013 compared to 2012 was led by increases from the New York City and San Francisco markets, which increased 3% and 10%, respectively. In 2014, 2013 and 2012, we generated approximately
40%
of our U.S. revenues from national advertising campaigns.
Revenues from U.S. billboards increased
$54.4 million
, or
7%
, in 2014 compared to 2013, primarily reflecting the impact of the Acquisition. Revenues from U.S. billboards increased
$25.9 million
, or
3%
, in 2013 compared to 2012, reflecting growth in average revenue per display (yield) attributable to the conversion of traditional static billboard displays to digital billboard displays.
Organic revenues from U.S. billboards increased
$11.8 million
, or
1%
, in 2014 compared to 2013. Organic revenues from U.S. billboards increased
$25.9 million
, or
3%
, in 2013 compared to 2012.
Transit and other revenues in the U.S. increased
$14.3 million
, or
4%
, in 2014 compared to 2013, reflecting the impact of the Acquisition, higher revenues in 2014 from the television and healthcare/pharmaceuticals industries and local sales in the New York metropolitan area, partially offset by lower revenues in 2014 from the beer/liquor industry, the sale of our transit shelter
48
operations in the greater Los Angeles area, the non-renewal of an unprofitable contract and softer market conditions in national advertising. Transit and other revenues in the U.S. increased
$5.6 million
, or
2%
, in 2013 compared to 2012, reflecting an increase in average rates.
Organic revenues from U.S. transit and other increased
$12.1 million
, or
4%
, in 2014 compared to 2013. Organic revenues from U.S. transit and other increased
$7.3 million
, or
2%
, in 2013 compared to 2012.
U.S. operating and SG&A expenses increased
$41.9 million
and
$17.0 million
, or
7%
and
12%
, respectively, in 2014 compared to 2013, primarily due to $38.9 million of expenses related to the properties acquired in connection with the Acquisition. U.S. operating and SG&A expenses increased
$6.3 million
and
$4.2 million
, or
1%
and
3%
, respectively, in 2013 compared to 2012. U.S. billboard property lease costs increased 4% in 2013 compared to 2012, primarily reflecting higher contingent rent associated with the increase in revenues and higher contractual rent from lease renewals. U.S. transit franchise expenses decreased 2% in 2013 compared to 2012, primarily reflecting cost reductions upon the renewal of a transit contract in Los Angeles at more favorable terms, partially offset by higher revenue-sharing expense associated with the increase in transit and other revenues. In the United States, billboard property lease expenses represented 29% of billboard revenues in 2013 and 30% of billboard revenues in 2012, and transit franchise expenses represented 64% of transit revenues in 2013 and 66% of transit revenues in 2012.
U.S. Adjusted OIBDA increased
$9.8 million
in 2014 compared to 2013, primarily due to the impact of the Acquisition, partially offset by
$9.2 million
of incremental stand-alone costs included in 2014. Adjusted OIBDA margin decreased to
35%
in 2014 from
36%
in 2013. U.S. Adjusted OIBDA increased
$21.0 million
in 2013 compared to 2012. Adjusted OIBDA margin increased to
36%
in 2013 from
35%
in 2012. Net gain on dispositions in 2013 was $27.5 million, which included a gain of $9.8 million from the disposition of most of our billboards in Salt Lake City in exchange for billboards in New Jersey and $17.5 million associated with the disposition of our transit shelter operations in Los Angeles. During 2013, we sold 50% of our transit shelter operations in Los Angeles, and we and the buyer each subsequently contributed our respective 50% interests in these operations to a 50/50 joint venture we own together.
49
International
|
(in constant dollars)
(b)
|
||||||||||||||||||||||||||||||||
|
Year Ended December 31,
|
% Change
|
Year Ended December 31,
|
% Change
|
|||||||||||||||||||||||||||||
|
(in millions, except percentages)
|
2014
|
2013
|
2012
|
2014 vs. 2013
|
2013 vs. 2012
|
2013
|
2012
|
2014 vs. 2013
|
2013 vs. 2012
|
|||||||||||||||||||||||
|
Revenues:
|
||||||||||||||||||||||||||||||||
|
Billboard
|
$
|
121.1
|
|
$
|
129.1
|
|
$
|
142.9
|
|
(6
|
)%
|
(10
|
)%
|
$
|
119.0
|
|
$
|
129.1
|
|
2
|
%
|
(8
|
)%
|
|||||||||
|
Transit and other
|
33.9
|
|
34.8
|
|
43.1
|
|
(3
|
)
|
(19
|
)
|
31.8
|
|
39.0
|
|
7
|
|
(18
|
)
|
||||||||||||||
|
Total revenues
|
$
|
155.0
|
|
$
|
163.9
|
|
$
|
186.0
|
|
(5
|
)
|
(12
|
)
|
$
|
150.8
|
|
$
|
168.1
|
|
3
|
|
(10
|
)
|
|||||||||
|
Organic
revenues
(a)
:
|
||||||||||||||||||||||||||||||||
|
Billboard
|
$
|
121.1
|
|
$
|
119.0
|
|
$
|
129.1
|
|
2
|
|
(8
|
)
|
$
|
119.0
|
|
$
|
129.1
|
|
2
|
|
(8
|
)
|
|||||||||
|
Transit and other
|
33.9
|
|
31.8
|
|
39.0
|
|
7
|
|
(18
|
)
|
31.8
|
|
39.0
|
|
7
|
|
(18
|
)
|
||||||||||||||
|
Total organic revenues
(a)
|
155.0
|
|
150.8
|
|
168.1
|
|
3
|
|
(10
|
)
|
150.8
|
|
168.1
|
|
3
|
|
(10
|
)
|
||||||||||||||
|
Non-organic revenues:
|
||||||||||||||||||||||||||||||||
|
Billboard
|
—
|
|
10.1
|
|
13.8
|
|
*
|
|
(27
|
)
|
—
|
|
—
|
|
*
|
|
*
|
|
||||||||||||||
|
Transit and other
|
—
|
|
3.0
|
|
4.1
|
|
*
|
|
(27
|
)
|
—
|
|
—
|
|
*
|
|
*
|
|
||||||||||||||
|
Total non-organic revenues
|
—
|
|
13.1
|
|
17.9
|
|
*
|
|
(27
|
)
|
—
|
|
—
|
|
*
|
|
*
|
|
||||||||||||||
|
Total revenues
|
$
|
155.0
|
|
$
|
163.9
|
|
$
|
186.0
|
|
(5
|
)
|
(12
|
)
|
$
|
150.8
|
|
$
|
168.1
|
|
3
|
|
(10
|
)
|
|||||||||
|
Canada
|
$
|
82.5
|
|
$
|
84.7
|
|
$
|
99.2
|
|
(3
|
)
|
(15
|
)
|
$
|
79.1
|
|
$
|
89.9
|
|
4
|
|
(12
|
)
|
|||||||||
|
Latin America
|
72.5
|
|
79.2
|
|
86.8
|
|
(8
|
)
|
(9
|
)
|
71.7
|
|
78.2
|
|
1
|
|
(8
|
)
|
||||||||||||||
|
Total revenues
|
155.0
|
|
163.9
|
|
186.0
|
|
(5
|
)
|
(12
|
)
|
150.8
|
|
168.1
|
|
3
|
|
(10
|
)
|
||||||||||||||
|
Operating expenses
|
100.4
|
|
102.7
|
|
122.2
|
|
(2
|
)
|
(16
|
)
|
94.6
|
|
109.6
|
|
6
|
|
(14
|
)
|
||||||||||||||
|
SG&A expenses
|
30.3
|
|
32.1
|
|
33.3
|
|
(6
|
)
|
(4
|
)
|
28.1
|
|
32.9
|
|
8
|
|
(15
|
)
|
||||||||||||||
|
Adjusted OIBDA
|
$
|
24.3
|
|
$
|
29.1
|
|
$
|
30.5
|
|
(16
|
)
|
(5
|
)
|
$
|
28.1
|
|
$
|
25.6
|
|
(14
|
)
|
10
|
|
|||||||||
|
Operating loss
|
$
|
(3.5
|
)
|
$
|
(0.1
|
)
|
$
|
(2.0
|
)
|
*
|
|
(95
|
)
|
|||||||||||||||||||
|
Restructuring charges
|
—
|
|
—
|
|
0.7
|
|
*
|
|
*
|
|
||||||||||||||||||||||
|
Net loss on dispositions
|
—
|
|
0.2
|
|
0.6
|
|
*
|
|
(67
|
)
|
||||||||||||||||||||||
|
Depreciation and amortization
|
27.8
|
|
29.0
|
|
31.2
|
|
(4
|
)
|
(7
|
)
|
||||||||||||||||||||||
|
Adjusted OIBDA
|
$
|
24.3
|
|
$
|
29.1
|
|
$
|
30.5
|
|
(16
|
)
|
(5
|
)
|
|||||||||||||||||||
|
*
|
Calculation is not meaningful.
|
|
(a)
|
Organic revenues exclude revenues associated with significant acquisitions and divestitures, business lines we no longer operate, and the impact of foreign exchange rates (“non-organic revenues”).
|
|
(b)
|
Revenues on a constant dollar basis are calculated as reported revenues excluding the impact of foreign currency exchange rates between years.
|
Total International revenues decreased
$8.9 million
, or
5%
, in 2014 compared to 2013, reflecting the negative impact of foreign exchange. In constant dollars, total International revenues increased
3%
compared to 2013, driven by an increase in Canada of
4%
and in Latin America of
1%
. Total International revenues decreased
$22.1 million
, or
12%
, in 2013 compared to 2012. In constant dollars, total International revenues decreased
10%
, driven by a decrease in Canada of
12%
and Latin America of
8%
. Organic revenues in 2013 for our International segment decreased
10%
compared to 2012, reflecting a decline in Canada associated with the residual impact from the nonrenewal of transit contracts in prior periods and lower political advertising revenues in Mexico due to the presidential election in 2012.
International operating expenses decreased
$2.3 million
, or
2%
, in 2014 compared to 2013, aided by the impact of foreign exchange rates, partially offset by an increase in billboard property and transit franchise lease costs in Canada and South America. International SG&A expenses decreased
$1.8 million
, or
6%
, in 2014 compared to 2013, primarily driven by the
50
impact of foreign exchange rate changes, partially offset by higher compensation-related expenses and commissions. International operating expenses decreased
$19.5 million
, or
16%
, and International SG&A expenses decreased
$1.2 million
, or
4%
, in 2013 compared to 2012, driven by lower expenses from the non-renewal of several low-margin and unprofitable contracts, a tax imposed on the billboard industry in Toronto, which included a one-time retroactive payment of $7.9 million in 2012, and the effect of foreign exchange rates.
International Adjusted OIBDA decreased
$4.8 million
, or
16%
, in 2014 compared to 2013, driven by higher expenses. In constant dollars, International Adjusted OIBDA decreased
$3.8 million
in 2014, or
14%
, compared to 2013. International Adjusted OIBDA decreased
$1.4 million
, or
5%
, in 2013 compared to 2012, driven by a decline in organic revenues, partially offset by the aforementioned impact from the tax imposed on the billboard industry in Toronto. In constant dollars, International Adjusted OIBDA increased
$2.5 million
in 2013, or
10%
, compared to 2012.
Corporate
Corporate expenses primarily include expenses associated with employees who provide centralized services. Corporate expenses, excluding restructuring charges, costs related to the Acquisition and stock-based compensation, were
$27.1 million
in 2014,
$20.7 million
in 2013 and
$7.5 million
in 2012. The increase in corporate expenses in 2014 was primarily due to incremental stand-alone costs of
$10.4 million
, partially offset by lower costs associated with our conversion to a REIT. The increase in corporate expenses in 2013 was primarily due to higher professional fees, which included professional fees of $7.3 million related to our preparation to convert to a REIT, incremental costs of $5.2 million related to our preparation to operate as a stand-alone public company and higher employee compensation expenses, including benefits.
Liquidity and Capital Resources
|
As of
|
|||||||||||
|
(in millions, except percentages)
|
December 31, 2014
|
December 31,
2013 |
% Change
|
||||||||
|
Assets:
|
|||||||||||
|
Cash and cash equivalents
|
$
|
28.5
|
|
$
|
29.8
|
|
(4
|
)%
|
|||
|
Receivables, less allowance ($14.2 in 2014 and $15.7 in 2013)
|
217.5
|
|
178.8
|
|
22
|
|
|||||
|
Deferred income tax assets, net
|
2.3
|
|
24.5
|
|
(91
|
)
|
|||||
|
Prepaid lease and transit franchise costs
|
68.2
|
|
62.7
|
|
9
|
|
|||||
|
Other prepaid expenses
|
26.1
|
|
15.5
|
|
68
|
|
|||||
|
Other current assets
|
12.7
|
|
5.9
|
|
115
|
|
|||||
|
Total current assets
|
355.3
|
|
317.2
|
|
12
|
|
|||||
|
Liabilities:
|
|||||||||||
|
Accounts payable
|
75.2
|
|
80.0
|
|
(6
|
)
|
|||||
|
Accrued compensation
|
34.6
|
|
28.2
|
|
23
|
|
|||||
|
Accrued interest
|
18.0
|
|
0.1
|
|
*
|
|
|||||
|
Accrued lease costs
|
34.4
|
|
17.7
|
|
94
|
|
|||||
|
Other accrued expenses
|
47.4
|
|
37.7
|
|
26
|
|
|||||
|
Deferred revenues
|
18.6
|
|
22.9
|
|
(19
|
)
|
|||||
|
Other current liabilities
|
27.0
|
|
25.6
|
|
5
|
|
|||||
|
Total current liabilities
|
255.2
|
|
212.2
|
|
20
|
|
|||||
|
Working capital
|
$
|
100.1
|
|
$
|
105.0
|
|
(5
|
)
|
|||
|
*
|
Calculation is not meaningful.
|
We continually project anticipated cash requirements for our operating, investing and financing needs as well as cash flows generated from operating activities available to meet these needs. Our short-term cash requirements primarily include payments for operating leases, franchise rights, capital expenditures, interest and dividends. Funding for short-term cash needs will come primarily from our cash on hand, operating cash flows and borrowing capacity under our Revolving Credit Facility (as defined below).
In addition, as part of our growth strategy, we frequently evaluate strategic opportunities to acquire new businesses, assets or digital technology. Consistent with this strategy, we regularly evaluate potential acquisitions, ranging from small “tuck-in”
51
transactions to larger acquisitions, which transactions could be funded through cash on hand, additional borrowings, equity or other securities, or some combination thereof.
Our long-term cash needs include principal payments on outstanding indebtedness. Funding for long-term cash needs will come from our cash on hand, operating cash flows, our ability to issue debt and equity securities, and borrowing capacity under our Revolving Credit Facility.
As of December 31, 2014, we had indebtedness of
$2.20 billion
.
Historically, we participated in CBS’s centralized cash management system. Under this system, on a daily basis, any excess cash we generated was automatically transferred to CBS and any additional daily cash flow needs were funded by CBS. As such, CBS benefited from the positive cash flow we generated, and CBS also provided us with sufficient daily liquidity to fund our ongoing cash needs. As a result, we have historically required minimal cash on hand. As of January 31, 2014, such participation ceased.
On April 2, 2014, we completed an IPO of 23,000,000 shares of our common stock, including 3,000,000 shares of our common stock sold pursuant to the underwriters’ option to purchase additional shares, at a price of $28.00 per share for total net proceeds, after underwriting discounts and commissions, of $615.0 million. Of the total net proceeds, $515.0 million was transferred to a wholly owned subsidiary of CBS as partial consideration for the contribution of the entities comprising CBS’ Outdoor Americas operating segment to us. The remaining $100.0 million was retained by us and was applied to the cash portion of the E&P Purge.
On
February 26, 2015
, we announced that our board of directors approved a special cash dividend of
$0.06
per share on our common stock, comprised of a “top-up” of the 2014 annual dividend for REIT distributable income (the “top-up dividend”). The top-up dividend is payable on
March 31, 2015
, to stockholders of record at the close of business on
March 11, 2015
. On
February 26, 2015
, we also announced that our board of directors approved a quarterly cash dividend of
$0.34
per share on our common stock, payable on
March 31, 2015
, to stockholders of record at the close of business on
March 11, 2015
.
Debt
Long-term debt consists of the following:
|
As of
|
||||||||
|
(in millions, except percentages)
|
December 31, 2014
|
December 31,
2013 |
||||||
|
Term loan, due 2021
|
$
|
798.3
|
|
$
|
—
|
|
||
|
Senior unsecured notes:
|
||||||||
|
5.250% senior unsecured notes, due 2022
|
549.3
|
|
—
|
|
||||
|
5.625% senior unsecured notes, due 2024
|
400.0
|
|
—
|
|
||||
|
5.875% senior unsecured notes, due 2025
|
450.0
|
|
—
|
|
||||
|
Total senior unsecured notes
|
1,399.3
|
|
—
|
|
||||
|
Other
(a)
|
0.7
|
|
—
|
|
||||
|
Total long-term debt
|
$
|
2,198.3
|
|
$
|
—
|
|
||
|
Weighted average cost of debt
|
4.6
|
%
|
—
|
%
|
||||
|
(a)
|
Reflects the outstanding balance as of December 31, 2014, of long-term debt assumed in conjunction with the Acquisition. (See Item 8. Notes to Consolidated Financial Statements, Note 12.
Acquisition
.)
|
|
Payments Due by Period
|
||||||||||||||||||||
|
(in millions)
|
Total
|
2015
|
2016-2017
|
2018-2019
|
2020 and thereafter
|
|||||||||||||||
|
Long-term debt
|
$
|
2,199.3
|
|
$
|
—
|
|
$
|
—
|
|
$
|
—
|
|
$
|
2,199.3
|
|
|||||
|
Interest
|
844.2
|
|
101.3
|
|
204.3
|
|
204.3
|
|
334.3
|
|
||||||||||
|
Total
|
$
|
3,043.5
|
|
$
|
101.3
|
|
$
|
204.3
|
|
$
|
204.3
|
|
$
|
2,533.6
|
|
|||||
52
Term Loan
On January 31, 2014, two of our wholly owned subsidiaries, Outfront Media Capital LLC (“Capital LLC”) and Outfront Media Capital Corporation (“Finance Corp,” and together with Capital LLC, the “Borrowers”), borrowed $800.0 million under a term loan due in 2021 (the “Term Loan,” together with the Revolving Credit Facility (as defined below), the “Senior Credit Facilities”). The Senior Credit Facilities are governed by a credit agreement, dated as of January 31, 2014 (the “Credit Agreement”). The Term Loan is unconditionally guaranteed by us and our material existing and future direct and indirect wholly owned domestic subsidiaries (except the Borrowers), subject to certain exceptions. The Term Loan is secured, subject to certain exceptions, by substantially all of the assets of the Borrowers and the guarantors, including a first-priority pledge of all the capital stock of our subsidiaries directly held by the Borrowers and the guarantors under the Term Loan.
The Term Loan bears interest at a rate per annum equal to 2.25% plus the greater of the London Interbank Offered Rate (“LIBOR”) or 0.75%. The interest rate on the Term Loan was 3.00% per annum as of December 31, 2014. Interest on the term loan is payable at the end of each LIBOR period, but in no event less frequently than quarterly. The Term Loan was issued at a discount which we are amortizing through
Interest expense
on the Consolidated Statement of Operations over the life of the Term Loan. As of December 31, 2014,
$1.7 million
remains unamortized.
Senior Unsecured Notes
On January 31, 2014, the Borrowers issued $400.0 million aggregate principal amount of 5.250% Senior Unsecured Notes due 2022 and $400.0 million aggregate principal amount of 5.625% Senior Unsecured Notes due 2024 (together, the “Senior Notes”) in a private placement. The Senior Notes are fully and unconditionally guaranteed on a senior unsecured basis by the Company and each of its direct and indirect domestic subsidiaries that guarantee the Senior Credit Facilities. Interest on the Senior Notes is payable on May 15 and November 15 of each year.
On or after February 15, 2017, the Borrowers may redeem at any time, or from time to time, some or all of the 5.250% Senior Unsecured Notes due 2022, and on or after February 15, 2019, the Borrowers may also redeem at any time, or from time to time, some or all of the 5.625% Senior Unsecured Notes due 2024. Prior to such dates, the Borrowers may redeem some or all of the Senior Notes subject to a customary make-whole premium. In addition, prior to February 15, 2017, the Borrowers may redeem up to 35% of the aggregate principal amount of each series of Senior Notes with the proceeds of certain equity offerings.
On October 1, 2014, the Borrowers issued $150.0 million aggregate principal amount of 5.250% Senior Unsecured Notes due 2022 (the “New 2022 Senior Notes”) in a private placement. The New 2022 Senior Notes are of the same class and series as, and otherwise identical to, the 5.250% Senior Unsecured Notes due 2022 that were previously issued by the Borrowers on January 31, 2014, (see—
Senior Unsecured Notes
above). Interest on the New 2022 Senior Notes is payable on May 15 and November 15 of each year, beginning on November 15, 2014. The New 2022 Senior Notes were issued at a discount of $0.8 million, which we will amortize through
Interest expense
on the Consolidated Statement of Operations over the life of the New 2022 Senior Notes.
On October 1, 2014, the Borrowers also issued $450.0 million aggregate principal amount of 5.875% Senior Unsecured Notes due 2025 (the “2025 Senior Notes,” together with the “New 2022 Senior Notes,” the “New Senior Notes”) in a private placement. The New Senior Notes are fully and unconditionally guaranteed on a senior unsecured basis by the Company and each of its direct and indirect wholly owned domestic subsidiaries that guarantee the Senior Credit Facilities. Interest on the 2025 Senior Notes is payable on March 15 and September 15 of each year, beginning on March 15, 2015.
On or after February 15, 2017, the Borrowers may redeem at any time, or from time to time, some or all of the New 2022 Senior Notes and on or after September 15, 2019, the Borrowers may redeem at any time, or from time to time, some or all of the 2025 Senior Notes. Prior to such dates, the Borrowers may redeem some or all of the New Senior Notes subject to a customary make-whole premium. In addition, prior to February 15, 2017, the Borrowers may redeem up to 35% of the aggregate principal amount of the New 2022 Senior Notes and prior to September 15, 2017, the Borrowers may redeem up to 35% of the aggregate principal amount of the 2025 Senior Notes with the proceeds of certain equity offerings.
On
February 3, 2015
, we completed an exchange offer pursuant to which the privately issued Senior Notes and New Senior Notes were exchanged for publicly registered Senior Notes and New Senior Notes having substantially identical terms.
53
Revolving Credit Facility
On January 31, 2014, the Borrowers also entered into a $425.0 million Revolving Credit Facility, which matures in 2019 (the “Revolving Credit Facility”). Borrowing rates under the Revolving Credit Facility are based on LIBOR plus a margin based on our Consolidated Net Secured Leverage Ratio, which is the ratio of (i) our consolidated secured debt (less up to $150.0 million of unrestricted cash) to (ii) our Consolidated EBITDA (as defined in the Credit Agreement) for the trailing four consecutive quarters. Interest on the Revolving Credit Facility is payable at the end of each LIBOR period, but in no event less frequently than quarterly. The commitment fee based on the amount of unused commitments under the Revolving Credit Facility in 2014, was
$1.9 million
. As of December 31, 2014, there were no outstanding borrowings under the Revolving Credit Facility. As of December 31, 2014, we had issued letters of credit totaling approximately
$20.6 million
against the Revolving Credit Facility. The Revolving Credit Facility is unconditionally guaranteed by us and our material existing and future direct and indirect wholly owned domestic subsidiaries (except the Borrowers), subject to certain exceptions. The Revolving Credit Facility is secured, subject to certain exceptions, by substantially all of the assets of the Borrowers and the guarantors, including a first-priority pledge of all the capital stock of our subsidiaries directly held by the Borrowers and the guarantors under the Revolving Credit Facility.
As previously described, our revenues and operating income may fluctuate due to seasonal advertising patterns and influences on advertising markets. Typically, our revenues and operating income are highest in the fourth quarter, during the holiday shopping season, and lowest in the first quarter, as advertisers cut back on spending following the holiday shopping season. Likewise, several of our municipal transit contracts require annual estimated revenue share or guarantees to be paid at the beginning of the contract period. During January of each year, we have a significant upfront payment (approximately
$70.0 million
) in connection with calendar-year contracts. We have drawn from the Revolving Credit Facility in January 2015 to make these upfront municipal payments and for seasonal cash management purposes. The amount of outstanding borrowings drawn on the Revolving Credit Facility as of
March 6, 2015
, was
$50.0 million
and is expected to be repaid from the cash flows from those transit contracts during 2015.
Debt Covenants
The Credit Agreement and the indentures governing the Senior Notes and the New Senior Notes contain customary affirmative and negative covenants, subject to certain exceptions, including but not limited to those that limit the Company’s and our subsidiaries’ abilities to (i) pay dividends on, repurchase or make distributions in respect to the Company’s or Finance LLC’s capital stock or make other restricted payments, and (ii) enter into agreements restricting certain subsidiaries’ ability to pay dividends or make other intercompany transfers.
In addition, the terms of the Credit Agreement require that, as long as any commitments remain outstanding under the Revolving Credit Facility, we maintain a Consolidated Net Secured Leverage Ratio of no greater than 4.0 to 1.0. As of December 31, 2014, our Consolidated Net Secured Leverage Ratio was
1.7
to 1.0, as adjusted to give pro forma effect to the Acquisition in accordance with the Credit Agreement. The Credit Agreement also requires that in connection with the incurrence of certain indebtedness, we maintain a Consolidated Total Leverage Ratio, which is the ratio of our consolidated total debt to our Consolidated EBITDA for the trailing four consecutive quarters, of no greater than 6.0 to 1.0. As of December 31, 2014, our Consolidated Total Leverage Ratio was
4.7
to 1.0, as adjusted to give pro forma effect to the Acquisition in accordance with the Credit Agreement.
Letter of Credit Facility
On
January 31, 2014
, the Borrowers also entered into a letter of credit facility, pursuant to which we may obtain letters of credit from time to time in an aggregate outstanding face amount of up to $80.0 million. After the first year, the letter of credit facility will automatically extend for successive one-year periods unless either the Borrowers or the issuing bank under it elect not to extend it. The letter of credit facility is unconditionally guaranteed by us and our material existing and future direct and indirect wholly owned domestic subsidiaries (except the Borrowers), subject to certain exceptions, and is secured on an equal and ratable basis by the same collateral that secure the Senior Credit Facilities. The fee under the letter of credit facility in 2014 was immaterial. As of December 31, 2014, we had issued letters of credit totaling approximately
$68.9 million
against the letter of credit facility.
Deferred Financing Costs
As of December 31, 2014, we had deferred financing costs of
$36.5 million
related fees and expenses associated with the Senior Credit Facilities, Senior Notes, New Senior Notes and letter of credit facility, which are included in
Other current assets
54
and
Other Assets
on the Consolidated Statement of Financial Position. We are amortizing the deferred fees through
Interest expense
on the Consolidated Statement of Operations over the term of each debt facility.
Cash Flows
We have revised the previously reported consolidated Statement of Cash Flows for 2013 and 2012. In prior periods, non-cash purchases of property and equipment were previously included within capital expenditures. The revision increased
Net cash used in investing activities
and increased
Net cash provided by operating activities
by $2.7 million for 2013 and decreased
Net cash used in investing activities
and decreased
Net cash provided by operating activities
by $5.4 million for 2012. We do not believe that these misclassifications were material to the previously reported annual financial statements. The above adjustments had no effect on previously reported Statements of Operations, Statements of Financial Position or Statements of Invested Equity/Stockholders’ Equity. The impacted prior periods will be revised as they are presented in future filings.
The following table sets forth our cash flows in 2014, 2013 and 2012.
|
Year Ended December 31,
|
% Change
|
|||||||||||||||||
|
(in millions, except percentages)
|
2014
|
2013
|
2012
|
2014 vs. 2013
|
2013 vs. 2012
|
|||||||||||||
|
Cash provided by operating activities
|
$
|
262.8
|
|
$
|
281.1
|
|
$
|
305.9
|
|
(7
|
)%
|
(8
|
)%
|
|||||
|
Cash used for investing activities
|
(798.4
|
)
|
(43.7
|
)
|
(48.1
|
)
|
*
|
|
(9
|
)
|
||||||||
|
Cash provided by (used for) financing activities
|
536.6
|
|
(227.0
|
)
|
(277.0
|
)
|
*
|
|
(18
|
)
|
||||||||
|
Effect of exchange rate changes on cash and cash equivalents
|
(2.3
|
)
|
(0.8
|
)
|
1.8
|
|
188
|
|
*
|
|
||||||||
|
Net increase (decrease) to cash and cash equivalents
|
$
|
(1.3
|
)
|
$
|
9.6
|
|
$
|
(17.4
|
)
|
*
|
|
*
|
|
|||||
|
*
|
Calculation is not meaningful.
|
Cash provided by operating activities
decreased
$18.3 million
in 2014 compared to 2013, principally driven by lower net income, as adjusted for non-cash items.
Cash provided by operating activities
decreased $24.8 million in 2013 compared to 2012, principally driven by lower collections, mainly in international regions resulting from a decrease in revenues and the timing of collections, as well as higher operating cash taxes due to an increase in domestic pre-tax income.
Prior to the Separation, we were a part of the consolidated federal and certain state and local income tax returns filed by CBS. Our assumed income tax payments reflected in the Condensed Consolidated Statements of Cash Flows were prepared as if these amounts were calculated on a separate tax return basis, with us as the taxpayer. After the Separation, we began operating in a manner that will allow us to qualify as a REIT for U.S. federal income tax purposes for the tax year commencing
July 17, 2014
, and ending December 31, 2014. Actual cash payments for income taxes were
$53.0 million
in 2014, including payments made to CBS. Assumed cash payments for income taxes of
$112.8 million
in 2013 and
$96.5 million
in 2012, include operating cash taxes of
$118.6 million
in 2013 and
$99.4 million
in 2012, offset by excess tax benefits from stock-based compensation of
$5.8 million
in 2013 and
$2.9 million
in 2012, which are presented as cash flows from financing activities. For 2013, assumed cash payments for income taxes increased
$16.3 million
from 2013 to 2012, principally driven by an increase in domestic pre-tax income. We expect cash payments for income taxes to be significantly lower in 2015, primarily due to reduced tax liability as a result of our conversion to a REIT.
Cash used for investing activities
increased
$754.7 million
in 2014 compared to 2013 and decreased
$4.4 million
in 2013 compared to 2012. In 2014, we completed the Acquisition for
$714.2 million
(including working capital adjustments), completed smaller tuck-in acquisitions for approximately
$19.6 million
, incurred
$64.2 million
in capital expenditures and made an investment of $3.0 million in Videri Inc. in connection with licenses and services to be received under a development and license agreement with Videri Inc. and its affiliate, and received
$4.5 million
in proceeds from dispositions. In 2013,
Cash used for investing activities
consisted of payments for acquisitions of
$11.5 million
, mainly for billboards and intangible assets in New Jersey, and capital expenditures of
$60.9 million
, partially offset by proceeds from dispositions of
$28.7 million
, mainly from the disposition of billboards in Salt Lake City and the sale of 50% of our transit shelter operations in Los Angeles. In 2012,
Cash used for investing activities
primarily includes capital expenditures of
$48.2 million
.
55
The following table presents our capital expenditures in 2014, 2013 and 2012.
|
Year Ended December 31,
|
% Change
|
|||||||||||||||||
|
(in millions, except percentages)
|
2014
|
2013
|
2012
|
2014 vs. 2013
|
2013 vs. 2012
|
|||||||||||||
|
Growth
|
$
|
40.9
|
|
$
|
37.2
|
|
$
|
34.2
|
|
10
|
%
|
9
|
%
|
|||||
|
Maintenance
|
23.3
|
|
23.7
|
|
14.0
|
|
(2
|
)
|
69
|
|
||||||||
|
Total capital expenditures
|
$
|
64.2
|
|
$
|
60.9
|
|
$
|
48.2
|
|
5
|
|
26
|
|
|||||
Capital expenditures increased
$3.3 million
, or
5%
, in 2014 compared to 2013, driven by growth in digital billboard displays, changing our imprints in connection with our new brand “OUTFRONT media” and increased investments in information technology. Capital expenditures increased
$12.7 million
, or
26%
, in 2013 compared to 2012, due primarily to additional expenditures to improve the quality or extend the lives of our U.S. billboards and other fixed assets.
For the full year of 2015, we expect our capital expenditures to be approximately
$70.0 million
, which will be used primarily for growth in digital billboard displays, to improve the quality or extend the life of our U.S. billboards and to renovate certain office facilities.
Cash provided by financing activities
was
$536.6 million
in 2014, compared to
Cash used for financing activities
of
$227.0 million
in 2013 and
$277.0 million
in 2012. In 2014, we incurred debt of
$600.0 million
related to the Acquisition on October 1, 2014, retained $100.0 million related to our IPO, retained $50.0 million related to the incurrence of $1.6 billion of indebtedness on January 31, 2014, received
$49.3 million
of net capital contributions from CBS and paid dividends of
$133.2 million
. In 2013 and 2012,
Cash used for financing activities
principally reflected net cash distributions to CBS of
$232.6 million
in 2013 and
$279.7 million
in 2012.
Contractual Obligations
As of December 31, 2014, our significant contractual obligations and payments due by period were as follows:
|
Payments Due by Period
|
||||||||||||||||||||
|
(in millions)
|
Total
|
2015
|
2016-2017
|
2018-2019
|
2020 and thereafter
|
|||||||||||||||
|
Guaranteed minimum franchise payments
(a)
|
$
|
385.3
|
|
$
|
173.5
|
|
$
|
99.2
|
|
$
|
68.0
|
|
$
|
44.6
|
|
|||||
|
Operating leases
(b)
|
938.5
|
|
122.1
|
|
223.3
|
|
160.6
|
|
432.5
|
|
||||||||||
|
Long-term debt
(c)
|
2,199.3
|
|
—
|
|
—
|
|
—
|
|
2,199.3
|
|
||||||||||
|
Interest
(c)
|
844.2
|
|
101.3
|
|
204.3
|
|
204.3
|
|
334.3
|
|
||||||||||
|
Total
|
$
|
4,367.3
|
|
$
|
396.9
|
|
$
|
526.8
|
|
$
|
432.9
|
|
$
|
3,010.7
|
|
|||||
|
(a)
|
We have agreements with municipalities and transit operators which entitle us to operate advertising displays within their transit systems, including on the interior and exterior of rail and subway cars and buses, as well as on benches, transit shelters, street kiosks, and transit platforms. Under most of these franchise agreements, the franchisor is entitled to receive the greater of a percentage of the relevant revenues, net of agency fees, or a specified guaranteed minimum annual payment. Franchise rights are generally paid monthly, or in some cases upfront at the beginning of the year.
|
|
(b)
|
Consists of noncancellable operating leases with terms in excess of one year for billboard sites, office space and equipment. Total future minimum payments of
$938.5 million
include $897.8 million for our billboard sites.
|
|
(c)
|
In 2014, we incurred long-term debt of
$2.2 billion
. Interest on the Term Loan is variable. For illustrative purposes, we are assuming an interest rate of 3.0% is assumed for all years, which reflects the interest rate as of December 31, 2014. An increase or decrease of 1/8% in the interest rate will change the annual interest expense by $1.0 million.
|
The above table excludes
$1.2 million
of reserves for uncertain tax positions and the related accrued interest and penalties, as we cannot reasonably predict the amount of and timing of cash payments related to this obligation.
In 2015, we expect to contribute
$2.2 million
to our pension plans. Contributions to our pension plans were
$1.6 million
in 2014,
$3.8 million
in 2013 and
$4.1 million
in 2012.
Off-Balance Sheet Arrangements
We have indemnification obligations with respect to letters of credit and surety bonds primarily used as security against non-performance in the normal course of business. The outstanding letters of credit and surety bonds approximated
$103.3 million
as of December 31, 2014, and were not recorded on the Consolidated Statements of Financial Position.
56
Critical Accounting Policies
The preparation of our financial statements in conformity with GAAP requires management to make estimates, judgments and assumptions that affect the reported amounts of assets and liabilities, disclosure of contingent assets and liabilities at the date of the financial statements and the reported amount of revenues and expenses during the reporting period. On an ongoing basis, we evaluate these estimates, which are based on historical experience and on various assumptions that we believe are reasonable under the circumstances. The result of these evaluations forms the basis for making judgments about the carrying values of assets and liabilities and the reported amount of revenues and expenses that are not readily apparent from other sources. Actual results may differ from these estimates under different assumptions.
We consider the following accounting policies to be the most critical as they are significant to its financial condition and results of operations, and require significant judgment and estimates on the part of management in their application. For a summary of our significant accounting policies see the notes to the consolidated financial statements in Part II, Item 8, of this Annual Report on Form 10-K.
Goodwill
We test goodwill for impairment on an annual basis and between annual tests should factors or indicators become apparent that would require an interim test. Goodwill is tested for impairment at the reporting-unit level. Each of our segments consists of two reporting units.
The first step of the goodwill impairment test examines whether the carrying value of a reporting unit exceeds its fair value. We compute the estimated fair value of each reporting unit by adding the present value of the estimated annual cash flows over a discrete projection period to the residual value of the business at the end of the projection period. This technique requires us to use significant estimates and assumptions such as growth rates, operating margins, capital expenditures and discount rates. The estimated growth rates, operating margins and capital expenditures for the projection period are based on our internal forecasts of future performance as well as historical trends. The residual value is estimated based on a perpetual nominal growth rate, which is based on projected long-range inflation and long-term industry projections. The discount rates are determined based on the average of the weighted average cost of capital of comparable entities. A downward revision of these assumptions would decrease the fair values of our reporting units. If the fair value of a reporting unit falls below its carrying value, we would then perform the second step of the goodwill impairment test to determine the amount of any noncash impairment charge. Such a charge could have a material effect on the statement of operations and balance sheet.
Long-Lived Assets
We report long-lived assets, including billboard advertising structures, other property, plant and equipment and intangible assets, at historical cost less accumulated depreciation and amortization. We depreciate or amortize these assets over their estimated useful lives, which generally range from five to 40 years. For billboard advertising structures, we estimate the useful lives based on the estimated economic life of the asset. Transit fixed assets are depreciated over the shorter of their estimated useful lives or the related contractual term. Our long-lived identifiable intangible assets primarily consist of acquired permits and leasehold agreements and franchise agreements, which grant us the right to operate out-of-home advertising structures in specified locations and the right to provide advertising displays on railroad and municipal transit properties. Our long-lived identifiable intangible assets are amortized on a straight-line basis over their estimated useful lives, which is the respective life of the agreement and in some cases includes an estimation for renewals, which is based on historical experience.
Long-lived assets subject to depreciation and amortization are also reviewed for impairment when events and circumstances indicate that the long-lived asset might be impaired, by comparing the forecasted undiscounted cash flows to be generated by those assets to the carrying values of those assets. The significant assumptions we use to determine the useful lives and fair values of long-lived assets include contractual commitments, regulatory requirements, future expected cash flows and industry growth rates, as well as future salvage values.
Asset Retirement Obligation
We record an asset retirement obligation for our estimated future legal obligation, upon termination or nonrenewal of a lease, associated with removing structures from the leased property and, when required by the contract, the cost to return the leased property to its original condition. These obligations are recorded at their present value in the period in which the liability is incurred and are capitalized as part of the related assets’ carrying value. Accretion of the liability is recognized in operating expenses and the capitalized cost is depreciated over the expected useful life of the related asset. The obligation is calculated
57
based on the assumption that all of our advertising structures will be removed within the next 50 years. The significant assumptions used in estimating the asset retirement obligation include the cost of removing the asset, the cost of remediating the leased property to its original condition where required and the timing and number of lease renewals, all of which are estimated based on historical experience.
Income Taxes
Income taxes are accounted for under the asset and liability method of accounting. Deferred income tax assets and liabilities are recognized for the estimated future tax effects of temporary differences between the financial statement carrying amounts and their respective tax basis. Deferred tax assets are reduced by a valuation allowance if it is more likely than not that some or all of the deferred tax assets will not be realized.
Prior to the Separation, we were a member of CBS’s consolidated tax group, and the provision for income taxes, deferred tax assets and liabilities, and income tax payments were calculated on a separate tax return basis, with us as the taxpayer, even though our U.S. operating results were included in the consolidated federal, and certain state and local income tax returns of CBS. We believe that the assumptions and estimates used to determine these tax amounts were reasonable. However, the consolidated financial statements included in this Annual Report on Form 10-K may not necessarily reflect our income tax expense or tax payments, or what our tax amounts would have been if we had been a stand-alone company operating as a REIT during the periods prior to the Separation.
On July 16, 2014, we ceased to be a member of the CBS consolidated tax group and on July 17, 2014, we began operating in a manner that will allow us to qualify as a REIT for U.S. federal income tax purposes for the tax year commencing July 17, 2014, and ending December 31, 2014.
As long as we remain qualified to be taxed as a REIT, we generally will not be subject to U.S. federal income tax on our REIT taxable income that we distribute to our stockholders. If we fail to qualify to be taxed as a REIT in any taxable year and do not qualify for certain statutory relief provisions, we will be subject to U.S. federal income tax at regular corporate rates and will be precluded from re-electing to be taxed as a REIT for the subsequent four taxable years following the year during which we lose our REIT qualification. Even if we qualify for taxation as a REIT, we may be subject to certain U.S. federal, state and local taxes on our income or property, and the income of our TRSs will be subject to taxation at regular corporate rates. Our qualification to be taxed as a REIT will depend upon our ability to meet on a continuing basis, through actual investment and operating results, various complex requirements under the Code, related to, among other things, the sources of our gross income, the composition and values of our assets, our distribution levels and the diversity of ownership of our shares. We believe we are organized in conformity with these requirements and that our manner of operation will enable us to continue to meet the requirements for qualification and taxation as a REIT. (See the “Tax Status” section of this MD&A.)
As a REIT, we must distribute to our stockholders, at least 90% of our REIT taxable income, determined without regard to the deduction for dividends paid and excluding net capital gain. To the extent that we satisfy the 90% distribution requirement, but distribute less than 100% of our taxable income, we will be subject to U.S. federal corporate income tax on the undistributed income. In addition, we would be subject to a 4% nondeductible excise tax on the amount, if any, by which our distributions in any calendar year are less than a minimum amount specified under U.S. federal income tax laws. We intend to pay regular quarterly distributions to our stockholders in an amount not less than 100% of our REIT taxable income (determined before the deduction for dividends paid), which will satisfy the REIT 90% distribution requirement and avoid the 4% nondeductible excise tax.
Purchase Accounting
The allocation of the approximate $690.0 million in total consideration to the “fair market value” of the assets and liabilities of the Acquired Business is a critical estimate. The estimates of the fair values assigned to property, plant and equipment, goodwill and finite-lived intangible assets, are more fully described in Item 8. Note 12.
Acquisition
of the Notes to Consolidated Financial Statements. Additionally, the estimated expected lives of finite-lived intangible assets is a critical estimate.
58
Accounting Standards
Adoption of New Accounting Standards
Presentation of an Unrecognized Tax Benefit When a Net Operating Loss Carryforward, a Similar Tax Loss, or a Tax Credit Carryforward Exists
During 2014, we adopted the FASB’s guidance on the presentation of the reserve for uncertain tax positions when a net operating loss carryforward, a similar tax loss, or a tax credit carryforward exists. This guidance requires the reserve for uncertain tax positions to be presented in the financial statements as a reduction to the deferred tax asset for a tax loss or other tax carryforward that would be applied in the settlement of the uncertain tax position. This guidance did not have a material effect on our consolidated financial statements.
Obligations Resulting from Joint and Several Liability Arrangements
During 2014, we adopted FASB guidance on the recognition, measurement and disclosure of obligations resulting from joint and several liability arrangements for which the total amount of the obligation is fixed at the reporting date. Under this guidance, we are required to measure our obligations under such arrangements as the sum of the amount we agreed to pay in the arrangement among our co-obligors and any additional amount we expect to pay on behalf of our co-obligors. We are also required to disclose the nature and amount of the obligation. This guidance did not have a material effect on our consolidated financial statements.
Recent Pronouncements
Service Concession Arrangements
In January 2014, the FASB issued guidance on the accounting for service concession arrangements with public sector entities. This guidance specifies that an operating entity should not account for a service concession arrangement as a lease and the infrastructure used in a service concession arrangement should not be recognized as property, plant and equipment. This guidance applies when the public sector entity controls the services that the operating entity must provide within the infrastructure and also controls any residual interest in the infrastructure at the end of the term of the arrangement. We are currently evaluating the impact of this guidance, which is effective for reporting periods beginning after December 15, 2014, on our consolidated financial statements.
Reporting Discontinued Operations and Disclosures of Disposals of Components of an Entity
In April 2014, the FASB issued guidance on reporting discontinued operations and disclosures of disposals of components of an entity. The new guidance changes the requirements including additional disclosures, for reporting discontinued operations which may include a component of an entity or a group of components of an entity, or a business or nonprofit activity. Under the new guidance, a discontinued operation is defined as a disposal of a component or group of components that is disposed of or is classified as held for sale and represents a strategic shift that has (or will have) a major effect on an entity’s operations and financial results. This guidance is effective for interim periods and annual periods beginning after December 31, 2014. Early adoption is permitted, but only for disposals that have not been reported in financial statements previously issued or available for issuance. This guidance is not expected to be material to our consolidated financial statements.
Revenue from Contracts with Customers
In May 2014, the FASB issued principles-based guidance addressing revenue recognition issues. The guidance may be applied to all contracts with customers regardless of industry-specific or transaction specific fact patterns. This guidance is to be applied retrospectively and is effective for interim and annual periods beginning after December 15, 2016. Early adoption is not permitted. We are currently evaluating the impact of this guidance on our consolidated financial statements.
We are exposed to market risk related to commodity prices and foreign currency exchange rates, and to a limited extent, interest rates and credit risks.
59
Commodity Price Risk
We incur various operating costs that are subject to price risk caused by volatility in underlying commodity values. Commodity price risk is present in electricity costs associated with powering our digital billboard displays and lighting our traditional static billboard displays at night.
We do not currently use derivatives or other financial instruments to mitigate our exposure to commodity price risk. However, we do enter into contracts with commodity providers to limit our exposure to commodity price fluctuations. For the year ended December 31, 2014, such contracts accounted for 4.0% of our total utility costs. As of December 31, 2014, we had an active electricity purchase agreement with fixed contract rates for locations throughout Texas, which expires in July 2018.
Foreign Exchange Risk
Foreign currency translation risk is the risk that exchange rate gains or losses arise from translating foreign entities’ statements of earnings and statements of financial position from functional currency to our reporting currency (the U.S. Dollar) for consolidation purposes. Although certain of our transactions are denominated in the Canadian Dollar, the Mexican Peso, the Argentine Peso, the Brazilian Real, the Chilean Peso and the Uruguayan Peso, substantially all of our transactions are denominated in the U.S. Dollar, therefore reducing our risk to currency translation exposures.
We do not currently use derivatives or other financial instruments to mitigate foreign currency risk based on our limited exposure to currencies other than the U.S. Dollar, although we may do so in the future.
Interest Rate Risk
We are subject to interest rate risk to the extent we have variable-rate debt outstanding including under our Senior Credit Facilities. As of December 31, 2014, we had an
$800.0 million
variable-rate Term Loan due 2021 outstanding, which has an interest rate of
3.0%
per year. An increase or decrease of 1/8% in our interest rate on the Term Loan will change our annualized interest expense by approximately
$1.0 million
. We do not currently use derivatives or other financial instruments to mitigate interest rate risk, although we may do so in the future.
Credit Risk
In the opinion of our management, credit risk is limited due to the large number of customers and advertising agencies utilized. We perform credit evaluations on our customers and agencies and believe that the allowances for doubtful accounts are adequate. We do not currently use derivatives or other financial instruments to mitigate credit risk.
60
REPORT OF INDEPENDENT REGISTERED PUBLIC ACCOUNTING FIRM
To the Board of Directors of OUTFRONT Media Inc.
In our opinion, the accompanying consolidated statement of financial position and the related consolidated statements of operations, comprehensive income, invested equity/stockholders equity and cash flows present fairly, in all material respects, the financial position of OUTFRONT Media Inc. and its subsidiaries at December 31, 2014 and 2013, and the results of their operations and their cash flows for each of the three years in the period ending December 31, 2014 in conformity with accounting principles generally accepted in the United States of America. In addition, in our opinion, the financial statement schedules listed under Item 15(a)(2) present fairly, in all material respects, the information set forth therein when read in conjunction with the related consolidated financial statements. These financial statements and financial statement schedules are the responsibility of the Company’s management. Our responsibility is to express an opinion on these financial statements and financial statement schedules based on our audits. We conducted our audits of these statements in accordance with the standards of the Public Company Accounting Oversight Board (United States). Those standards require that we plan and perform the audit to obtain reasonable assurance about whether the financial statements are free of material misstatement. An audit includes examining, on a test basis, evidence supporting the amounts and disclosures in the financial statements, assessing the accounting principles used and significant estimates made by management, and evaluating the overall financial statement presentation. We believe that our audits provide a reasonable basis for our opinion.
/s/ PRICEWATERHOUSECOOPERS LLP
PricewaterhouseCoopers LLP
New York, New York
March 6, 2015
61
OUTFRONT Media Inc.
|
As of December 31,
|
||||||||
|
(in millions)
|
2014
|
2013
|
||||||
|
Assets:
|
||||||||
|
Current assets:
|
||||||||
|
Cash and cash equivalents
|
$
|
28.5
|
|
$
|
29.8
|
|
||
|
Receivables, less allowances of $14.2 in 2014 and $15.7 in 2013
|
217.5
|
|
178.8
|
|
||||
|
Deferred income tax assets, net (Note 15)
|
2.3
|
|
24.5
|
|
||||
|
Prepaid lease and transit franchise costs
|
68.2
|
|
62.7
|
|
||||
|
Other prepaid expenses
|
26.1
|
|
15.5
|
|
||||
|
Other current assets
|
12.7
|
|
5.9
|
|
||||
|
Total current assets
|
355.3
|
|
317.2
|
|
||||
|
Property and equipment, net (Note 4)
|
782.9
|
|
755.4
|
|
||||
|
Goodwill (Note 5)
|
2,154.2
|
|
1,865.7
|
|
||||
|
Intangible assets (Note 5)
|
633.2
|
|
364.4
|
|
||||
|
Other assets
|
98.0
|
|
52.8
|
|
||||
|
Total assets
|
$
|
4,023.6
|
|
$
|
3,355.5
|
|
||
|
Liabilities:
|
||||||||
|
Current liabilities:
|
||||||||
|
Accounts payable
|
$
|
75.2
|
|
$
|
80.0
|
|
||
|
Accrued compensation
|
34.6
|
|
28.2
|
|
||||
|
Accrued interest
|
18.0
|
|
0.1
|
|
||||
|
Accrued lease costs
|
34.4
|
|
17.7
|
|
||||
|
Other accrued expenses
|
47.4
|
|
37.7
|
|
||||
|
Deferred revenues
|
18.6
|
|
22.9
|
|
||||
|
Other current liabilities
|
27.0
|
|
25.6
|
|
||||
|
Total current liabilities
|
255.2
|
|
212.2
|
|
||||
|
Long-term debt
|
2,198.3
|
|
—
|
|
||||
|
Deferred income tax liabilities, net (Note 15)
|
17.2
|
|
288.5
|
|
||||
|
Asset retirement obligation (Note 6)
|
36.6
|
|
31.7
|
|
||||
|
Other liabilities
|
70.8
|
|
68.7
|
|
||||
|
Total liabilities
|
2,578.1
|
|
601.1
|
|
||||
|
Commitments and contingencies (Note 17)
|
|
|
||||||
|
Stockholders’ Equity/invested equity (Note 10):
|
||||||||
|
Common stock (2014 - 450.0 shares authorized, and 136.6 shares issued and outstanding; 2013 - no shares authorized, issued or outstanding)
|
1.4
|
|
—
|
|
||||
|
Additional paid-in capital
|
1,911.2
|
|
—
|
|
||||
|
Distribution in excess of earnings
|
(377.0
|
)
|
—
|
|
||||
|
Invested capital
|
—
|
|
2,829.5
|
|
||||
|
Accumulated other comprehensive loss (Note 9)
|
(90.1
|
)
|
(75.1
|
)
|
||||
|
Total stockholders’ equity
|
1,445.5
|
|
—
|
|
||||
|
Total invested equity
|
—
|
|
2,754.4
|
|
||||
|
Total liabilities and stockholders’ equity/invested equity
|
$
|
4,023.6
|
|
$
|
3,355.5
|
|
||
See accompanying notes to consolidated financial statements.
62
OUTFRONT Media Inc.
|
Year Ended December 31,
|
||||||||||||
|
(in millions, except per share amounts)
|
2014
|
2013
|
2012
|
|||||||||
|
Revenues:
|
||||||||||||
|
Billboard
|
$
|
972.1
|
|
$
|
925.7
|
|
$
|
913.6
|
|
|||
|
Transit and other
|
381.7
|
|
368.3
|
|
371.0
|
|
||||||
|
Total revenues
|
1,353.8
|
|
1,294.0
|
|
1,284.6
|
|
||||||
|
Expenses:
|
||||||||||||
|
Operating
|
726.5
|
|
686.9
|
|
700.1
|
|
||||||
|
Selling, general and administrative
|
224.3
|
|
199.8
|
|
181.8
|
|
||||||
|
Restructuring charges (Note 11)
|
9.8
|
|
—
|
|
2.5
|
|
||||||
|
Acquisition costs
|
10.4
|
|
—
|
|
—
|
|
||||||
|
Net (gain) loss on dispositions
|
(2.5
|
)
|
(27.3
|
)
|
2.2
|
|
||||||
|
Depreciation
|
107.2
|
|
104.5
|
|
105.9
|
|
||||||
|
Amortization
|
95.0
|
|
91.3
|
|
90.9
|
|
||||||
|
Total expenses
|
1,170.7
|
|
1,055.2
|
|
1,083.4
|
|
||||||
|
Operating income
|
183.1
|
|
238.8
|
|
201.2
|
|
||||||
|
Interest income (expense), net
|
(84.8
|
)
|
—
|
|
—
|
|
||||||
|
Other income (expense), net
|
(0.3
|
)
|
(1.2
|
)
|
(1.0
|
)
|
||||||
|
Income before benefit (provision) for income taxes and equity in earnings of investee companies
|
98.0
|
|
237.6
|
|
200.2
|
|
||||||
|
Benefit (provision) for income taxes
|
206.0
|
|
(96.6
|
)
|
(89.0
|
)
|
||||||
|
Equity in earnings of investee companies, net of tax
|
2.9
|
|
2.5
|
|
2.2
|
|
||||||
|
Net income
|
$
|
306.9
|
|
$
|
143.5
|
|
$
|
113.4
|
|
|||
|
Net income per common share:
|
||||||||||||
|
Basic
|
$
|
2.69
|
|
$
|
1.26
|
|
$
|
0.99
|
|
|||
|
Diluted
|
$
|
2.67
|
|
$
|
1.25
|
|
$
|
0.99
|
|
|||
|
Weighted average shares outstanding:
|
||||||||||||
|
Basic
|
114.3
|
|
114.3
|
|
114.3
|
|
||||||
|
Diluted
|
114.8
|
|
114.8
|
|
114.8
|
|
||||||
|
Dividends declared per common share
|
$
|
5.67
|
|
$
|
—
|
|
$
|
—
|
|
|||
See accompanying notes to consolidated financial statements.
63
OUTFRONT Media Inc.
Consolidated Statements of Comprehensive Income
|
Year Ended December 31,
|
||||||||||||
|
(in millions)
|
2014
|
2013
|
2012
|
|||||||||
|
Net income
|
$
|
306.9
|
|
$
|
143.5
|
|
$
|
113.4
|
|
|||
|
Other comprehensive income (loss), net of tax:
|
||||||||||||
|
Cumulative translation adjustments
|
(10.7
|
)
|
(14.9
|
)
|
11.0
|
|
||||||
|
Net actuarial gain (loss)
|
(3.1
|
)
|
5.8
|
|
(1.4
|
)
|
||||||
|
Deferred tax rate adjustment
|
(1.2
|
)
|
—
|
|
—
|
|
||||||
|
Total other comprehensive income (loss), net of tax
|
(15.0
|
)
|
(9.1
|
)
|
9.6
|
|
||||||
|
Total comprehensive income
|
$
|
291.9
|
|
$
|
134.4
|
|
$
|
123.0
|
|
|||
See accompanying notes to consolidated financial statements.
64
OUTFRONT Media Inc.
Consolidated Statements of Invested Equity/Stockholders’ Equity
|
(in millions, except per share amounts)
|
Shares of Common Stock
|
Common Stock ($0.01 per share par value)
|
Additional Paid-In Capital
|
Distribution in Excess of Earnings
|
Invested Capital
|
Accumulated Other Comprehensive Loss
|
Treasury Stock, at Cost
|
Total Invested Equity/ Stockholders’ Equity
|
|||||||||||||||||||||||
|
Balance as of December 31, 2011
|
—
|
|
$
|
—
|
|
$
|
—
|
|
$
|
—
|
|
$
|
3,066.2
|
|
$
|
(75.6
|
)
|
$
|
—
|
|
$
|
2,990.6
|
|
||||||||
|
Net income
|
—
|
|
—
|
|
—
|
|
—
|
|
113.4
|
|
—
|
|
—
|
|
113.4
|
|
|||||||||||||||
|
Net distribution to CBS
|
—
|
|
—
|
|
—
|
|
—
|
|
(269.7
|
)
|
—
|
|
—
|
|
(269.7
|
)
|
|||||||||||||||
|
Other comprehensive income
|
—
|
|
—
|
|
—
|
|
—
|
|
—
|
|
9.6
|
|
—
|
|
9.6
|
|
|||||||||||||||
|
Balance as of December 31, 2012
|
—
|
|
—
|
|
—
|
|
—
|
|
2,909.9
|
|
(66.0
|
)
|
—
|
|
2,843.9
|
|
|||||||||||||||
|
Net income
|
—
|
|
—
|
|
—
|
|
—
|
|
143.5
|
|
—
|
|
—
|
|
143.5
|
|
|||||||||||||||
|
Net distribution to CBS
|
—
|
|
—
|
|
—
|
|
—
|
|
(223.9
|
)
|
—
|
|
—
|
|
(223.9
|
)
|
|||||||||||||||
|
Other comprehensive loss
|
—
|
|
—
|
|
—
|
|
—
|
|
—
|
|
(9.1
|
)
|
—
|
|
(9.1
|
)
|
|||||||||||||||
|
Balance as of December 31, 2013
|
—
|
|
—
|
|
—
|
|
—
|
|
2,829.5
|
|
(75.1
|
)
|
—
|
|
2,754.4
|
|
|||||||||||||||
|
Net income
|
—
|
|
—
|
|
—
|
|
305.8
|
|
1.1
|
|
$
|
—
|
|
—
|
|
306.9
|
|
||||||||||||||
|
Other comprehensive loss
|
—
|
|
—
|
|
—
|
|
—
|
|
—
|
|
(15.0
|
)
|
—
|
|
(15.0
|
)
|
|||||||||||||||
|
Initial public offering (“IPO”)
|
23.0
|
|
0.2
|
|
614.8
|
|
—
|
|
—
|
|
—
|
|
—
|
|
615.0
|
|
|||||||||||||||
|
Stock-based payments:
|
|||||||||||||||||||||||||||||||
|
Amortization
|
—
|
|
—
|
|
14.1
|
|
—
|
|
—
|
|
—
|
|
—
|
|
14.1
|
|
|||||||||||||||
|
Shares paid for tax withholding for stock-based payments
|
—
|
|
—
|
|
—
|
|
—
|
|
—
|
|
—
|
|
(0.1
|
)
|
(0.1
|
)
|
|||||||||||||||
|
Retirement of treasury stock
|
—
|
|
—
|
|
(0.1
|
)
|
—
|
|
—
|
|
—
|
|
0.1
|
|
—
|
|
|||||||||||||||
|
Conversion to stockholders’ equity (Note 10)
|
97.0
|
|
1.0
|
|
2,829.6
|
|
—
|
|
(2,830.6
|
)
|
—
|
|
—
|
|
—
|
|
|||||||||||||||
|
Distribution to investee company
|
0.1
|
|
—
|
|
2.0
|
|
—
|
|
—
|
|
—
|
|
—
|
|
2.0
|
|
|||||||||||||||
|
Distribution of debt and IPO proceeds to CBS
|
—
|
|
—
|
|
(2,038.8
|
)
|
—
|
|
—
|
|
—
|
|
—
|
|
(2,038.8
|
)
|
|||||||||||||||
|
Dividends ($5.67 per share)
|
16.5
|
|
0.2
|
|
438.0
|
|
(682.8
|
)
|
—
|
|
—
|
|
—
|
|
(244.6
|
)
|
|||||||||||||||
|
Net contribution from CBS
|
—
|
|
—
|
|
51.6
|
|
—
|
|
—
|
|
—
|
|
—
|
|
51.6
|
|
|||||||||||||||
|
Balance as of December 31, 2014
|
136.6
|
|
$
|
1.4
|
|
$
|
1,911.2
|
|
$
|
(377.0
|
)
|
$
|
—
|
|
$
|
(90.1
|
)
|
$
|
—
|
|
$
|
1,445.5
|
|
||||||||
See accompanying notes to consolidated financial statements.
65
OUTFRONT Media Inc.
|
Year Ended December 31,
|
||||||||||||
|
(in millions)
|
2014
|
2013
|
2012
|
|||||||||
|
Operating activities:
|
||||||||||||
|
Net income
|
$
|
306.9
|
|
$
|
143.5
|
|
$
|
113.4
|
|
|||
|
Adjustments to reconcile net income to net cash flow provided by operating activities:
|
||||||||||||
|
Depreciation and amortization
|
202.2
|
|
195.8
|
|
196.8
|
|
||||||
|
Deferred tax (benefit) liability
|
(249.5
|
)
|
(15.5
|
)
|
(6.6
|
)
|
||||||
|
Stock-based compensation
|
16.0
|
|
7.5
|
|
5.7
|
|
||||||
|
Provision for doubtful accounts
|
2.9
|
|
0.4
|
|
3.1
|
|
||||||
|
Accretion expense
|
2.3
|
|
2.2
|
|
2.5
|
|
||||||
|
Net (gain) loss on dispositions
|
(2.5
|
)
|
(27.3
|
)
|
2.2
|
|
||||||
|
Equity in earnings of investee companies, net of tax
|
(2.9
|
)
|
(2.5
|
)
|
(2.2
|
)
|
||||||
|
Distributions from investee companies
|
7.4
|
|
4.4
|
|
6.4
|
|
||||||
|
Amortization of deferred financing costs and debt discount
|
12.1
|
|
—
|
|
—
|
|
||||||
|
Change in assets and liabilities, net of investing and financing activities:
|
||||||||||||
|
(Increase) decrease in receivables
|
(0.6
|
)
|
(7.1
|
)
|
7.6
|
|
||||||
|
(Increase) decrease in prepaid expenses and other current assets
|
(6.4
|
)
|
9.5
|
|
3.9
|
|
||||||
|
Decrease in accounts payable and accrued expenses
|
(5.8
|
)
|
(32.2
|
)
|
(26.5
|
)
|
||||||
|
Increase (decrease) in deferred revenues
|
(9.8
|
)
|
7.1
|
|
0.9
|
|
||||||
|
Decrease in income taxes
|
(9.0
|
)
|
(6.5
|
)
|
(3.8
|
)
|
||||||
|
Other, net
|
(0.5
|
)
|
1.8
|
|
2.5
|
|
||||||
|
Net cash flow provided by operating activities
|
262.8
|
|
281.1
|
|
305.9
|
|
||||||
|
Investing activities:
|
||||||||||||
|
Capital expenditures
|
(64.2
|
)
|
(60.9
|
)
|
(48.2
|
)
|
||||||
|
Acquisitions
|
(735.7
|
)
|
(11.5
|
)
|
(0.4
|
)
|
||||||
|
Investments in investee companies
|
(3.0
|
)
|
—
|
|
—
|
|
||||||
|
Proceeds from dispositions
|
4.5
|
|
28.7
|
|
0.5
|
|
||||||
|
Net cash flow used for investing activities
|
(798.4
|
)
|
(43.7
|
)
|
(48.1
|
)
|
||||||
|
Financing activities:
|
||||||||||||
|
Proceeds from IPO
|
615.0
|
|
—
|
|
—
|
|
||||||
|
Proceeds from long-term debt borrowings - term loan and senior notes
|
1,598.0
|
|
—
|
|
—
|
|
||||||
|
Proceeds from long-term debt borrowings - new senior notes
|
599.3
|
|
—
|
|
—
|
|
||||||
|
Deferred financing costs
|
(42.7
|
)
|
—
|
|
—
|
|
||||||
|
Excess tax benefit from stock-based compensation
|
—
|
|
5.8
|
|
2.9
|
|
||||||
|
Distribution of debt and IPO proceeds to CBS
|
(2,038.8
|
)
|
—
|
|
—
|
|
||||||
|
Net cash contribution from (distribution to) CBS
|
49.3
|
|
(232.6
|
)
|
(279.7
|
)
|
||||||
|
Dividends
|
(133.2
|
)
|
—
|
|
—
|
|
||||||
|
Special dividend
|
(109.5
|
)
|
—
|
|
—
|
|
||||||
|
Other
|
(0.8
|
)
|
(0.2
|
)
|
(0.2
|
)
|
||||||
|
Net cash flow provided by (used for) financing activities
|
536.6
|
|
(227.0
|
)
|
(277.0
|
)
|
||||||
|
Effect of exchange rate changes on cash and cash equivalents
|
(2.3
|
)
|
(0.8
|
)
|
1.8
|
|
||||||
|
Net increase (decrease) in cash and cash equivalents
|
(1.3
|
)
|
9.6
|
|
(17.4
|
)
|
||||||
|
Cash and cash equivalents at beginning of year
|
29.8
|
|
20.2
|
|
37.6
|
|
||||||
|
Cash and cash equivalents at end of year
|
$
|
28.5
|
|
$
|
29.8
|
|
$
|
20.2
|
|
|||
66
OUTFRONT Media Inc.
Consolidated Statements of Cash Flows (Continued)
|
Year Ended December 31,
|
||||||||||||
|
(in millions)
|
2014
|
2013
|
2012
|
|||||||||
|
Supplemental disclosure of cash flow information:
|
||||||||||||
|
Cash paid for income taxes (Note 15)
|
$
|
53.0
|
|
$
|
112.8
|
|
$
|
96.5
|
|
|||
|
Cash paid for interest
|
55.1
|
|
—
|
|
—
|
|
||||||
|
Non-cash investing and financing activities:
|
||||||||||||
|
Investments in investee companies
|
$
|
—
|
|
$
|
13.1
|
|
$
|
—
|
|
|||
|
Accrued purchases of property and equipment
|
1.4
|
|
12.8
|
|
15.5
|
|
||||||
|
Issuance of stock for purchase of property and equipment
|
2.0
|
|
—
|
|
—
|
|
||||||
See accompanying notes to consolidated financial statements.
67
OUTFRONT Media Inc.
Notes to Consolidated Financial Statements
Description of Business
OUTFRONT Media Inc., formerly known as CBS Outdoor Americas Inc., (the “Company”) and its subsidiaries (collectively, “we,” “us” or “our”) was formed as an indirect wholly owned subsidiary of CBS Corporation (“CBS”). We provide advertising space (“displays”) on out-of-home advertising structures and sites in the U.S., Canada and Latin America. Our portfolio includes billboard displays, which are predominantly located in densely populated major metropolitan areas and along high-traffic expressways and major commuting routes. We also have a number of exclusive multi-year contracts to operate advertising displays in municipal transit systems. We have displays in all of the
25
largest markets in the U.S. and over
180
markets across the U.S., Canada and Latin America. We manage our business through
two
segments -
United States
(“
U.S.
”) and
International
.
On
April 2, 2014
, we completed an initial public offering (the “IPO”) of
23,000,000
shares of our common stock, including
3,000,000
shares of our common stock sold pursuant to the underwriters’ option to purchase additional shares. (See Note 2.
Initial Public Offering
.)
On
April 16, 2014
, CBS received a private letter ruling from the Internal Revenue Service (“IRS”) with respect to certain issues relevant to our ability to qualify as a real estate investment trust (“REIT”). On
July 16, 2014
, we ceased to be a member of the CBS consolidated tax group and on
July 17, 2014
, we began operating in a manner that will allow us to qualify as a REIT for U.S. federal income tax purposes for the tax year commencing
July 17, 2014
, and ending
December 31, 2014
.
On
July 16, 2014
, CBS completed a registered offer to exchange
97,000,000
shares of our common stock that were owned by CBS for outstanding shares of CBS Class B common stock (the “Exchange Offer”). In connection with the Exchange Offer, CBS disposed of all of its shares of our common stock and as of
July 16, 2014
, we were separated from CBS (the “Separation”) and were no longer a subsidiary of CBS.
On
October 1, 2014
, we completed our acquisition of certain outdoor advertising businesses (the “Acquired Business”) of Van Wagner Communications, LLC, for
$690.0 million
in cash, plus working capital adjustments (the “Acquisition”). The Acquisition was funded with the net proceeds from the issuance and sale of the New Senior Notes (as defined in Note 8.
Long-Term Debt
) and cash on hand.
In order to comply with certain REIT qualification requirements, on
October 29, 2014
, our board of directors approved a special dividend of approximately
$547.7 million
, or
$4.56
per share, to distribute accumulated earnings and profits as of
July 17, 2014
, the date we began operating in a manner that will allow us to qualify as a REIT for U.S. federal income tax purposes, including any earnings and profits allocated to us by CBS in connection with the Separation (the “E&P Purge”). The special dividend was paid on
December 31, 2014
, to stockholders of record on
November 20, 2014
. In connection with the special dividend, we paid approximately
$109.5 million
in cash, and issued approximately
16.5 million
new shares of our common stock based on the volume weighted average price of our common stock for the three trading days commencing on
December 16, 2014
, or
$26.4974
per share. As stated in Note 2.
Initial Public Offering
, a portion (
$100.0 million
) of the IPO proceeds was retained by us and was applied to the cash portion of the E&P Purge. CBS transferred the balance of the cash portion of the E&P Purge (approximately
$9.5 million
) to us prior to the payment of the special dividend to stockholders.
On
February 26, 2015
, we announced that our board of directors approved a special cash dividend of
$0.06
per share on our common stock, comprised of a “top-up” of the 2014 annual dividend for REIT distributable income (the “top-up dividend”). The top-up dividend is payable on
March 31, 2015
, to stockholders of record at the close of business on
March 11, 2015
. On
February 26, 2015
, we also announced that our board of directors approved a quarterly cash dividend of
$0.34
per share on our common stock, payable on
March 31, 2015
, to stockholders of record at the close of business on
March 11, 2015
.
68
OUTFRONT Media Inc.
Notes to Consolidated Financial Statements (Continued)
Basis of Presentation and Use of Estimates
The accompanying consolidated financial statements have been prepared pursuant to the rules of the Securities and Exchange Commission (the “SEC”). In the opinion of our management, the accompanying financial statements reflect all adjustments, consisting of normal and recurring adjustments, necessary for a fair presentation of our financial position, results of operations and cash flows for the years presented. Certain previously reported amounts have been reclassified to conform with the current presentation.
We have revised the previously reported condensed consolidated Statement of Cash Flows for the years ended December 31, 2013 and 2012. Historically, non-cash purchases of property and equipment were previously included within capital expenditures. The revision increased
Net cash used in investing activities
and increased
Net cash provided by operating activities
by
$2.7 million
for the year ended December 31, 2013, and decreased
Net cash used in investing activities
and decreased
Net cash provided by operating activities
by
$5.4 million
for the year ended December 31, 2012. We do not believe that these misclassifications were material to the previously reported annual financial statements. The above adjustments had no effect on previously reported Statements of Operations, Statements of Financial Position or Statements of Invested Equity/Stockholders' Equity.
The preparation of our financial statements in conformity with accounting principles generally accepted in the United States of America (“GAAP”) requires management to make estimates, judgments and assumptions that affect the reported amounts of assets and liabilities, disclosure of contingent assets and liabilities at the date of the financial statements, and the reported amount of revenues and expenses during the reporting period. We base our estimates on historical experience and on various other assumptions that are believed to be reasonable under the circumstances, the results of which form the basis for making judgments about the carrying values of assets and liabilities that are not readily apparent from other sources. Actual results may differ from these estimates under different assumptions or conditions.
Our 2013 financial statements were presented on a “carve-out” basis from CBS’s consolidated financial statements based on the historical results of operations, cash flows, assets and liabilities attributable to its Outdoor Americas operating segment. Management believes that the assumptions and estimates used in the preparation of the underlying consolidated financial statements are reasonable. However, the consolidated financial statements herein do not necessarily reflect what our financial position, results of operations or cash flows would have been if we had been a stand-alone company during the periods presented. As a result, such historical financial information is not necessarily indicative of our future results of operations, financial position or cash flows.
On
March 27, 2014
, our registration statement on Form S-11 related to our IPO of our common stock was declared effective by the SEC and on
March 28, 2014
, our common stock began trading on the New York Stock Exchange under the symbol “CBSO.” On
April 2, 2014
, we completed an IPO of
23,000,000
shares of our common stock, including
3,000,000
shares of our common stock sold pursuant to the underwriters’ option to purchase additional shares, at a price of
$28.00
per share for total net proceeds, after underwriting discounts and commissions, of
$615.0 million
. Of the total net proceeds,
$515.0 million
was transferred to a wholly owned subsidiary of CBS as partial consideration for the contribution of the entities comprising CBS’s Outdoor Americas operating segment to us. The remaining
$100.0 million
was retained by us and was applied to the cash portion of the E&P Purge.
Cash and Cash Equivalents
—Cash and cash equivalents consist of cash on hand and short-term (maturities of three months or less at the date of purchase) highly liquid investments. Prior to January 31, 2014, we carried minimal cash on hand as we had participated in CBS’s centralized cash management system. On January 31, 2014, we incurred
$1.6 billion
in debt under the Senior Credit Facilities and the Senior Notes (see Note 8.
Long-Term Debt
), and accordingly, our participation in the CBS centralized cash management system ceased.
Receivables
—Receivables consist primarily of trade receivables from customers, net of advertising agency commissions, and are stated net of an allowance for doubtful accounts. The provision for doubtful accounts is estimated based on historical bad debt experience, the aging of accounts receivable, industry trends and economic indicators, as well as recent payment history for specific customers.
69
OUTFRONT Media Inc.
Notes to Consolidated Financial Statements (Continued)
Property and Equipment
—Property and equipment is stated at cost. Depreciation is computed using the straight-line method over the estimated useful lives as follows:
|
Buildings and improvements
|
20 to 40 years
|
|
Advertising structures
|
5 to 20 years
|
|
Furniture, equipment and other
|
3 to 10 years
|
For advertising structures associated with a contract, the assets are depreciated over the shorter of the contract term or useful life. Maintenance and repair costs to maintain property and equipment in their original operating condition are charged to expense as incurred. Improvements or additions that extend the useful life of the assets are capitalized. When an asset is retired or otherwise disposed of, the associated cost and accumulated depreciation are removed and the resulting gain or loss is recognized.
Business Combinations and Asset Acquisitions
—We routinely acquire out-of-home advertising assets, including advertising structures and permits and leasehold agreements. We determine the accounting for these transactions by first evaluating whether the assets acquired and liabilities assumed, if any, constitute a business using the guidelines in the Financial Accounting Standards Board (“FASB”) guidance for business combinations. If the assets acquired and liabilities assumed constitute a business, the purchase price is allocated to the tangible and identifiable intangible net assets acquired based on their estimated fair values with the excess of the purchase price over those estimated fair values recorded as goodwill. If the acquired assets do not constitute a business, we allocate the purchase price to the individual tangible and intangible assets acquired based on their relative fair values.
Impairment of Long-Lived Assets—
Long-lived assets are assessed for impairment whenever there is an indication that the carrying amount of the asset may not be recoverable. Recoverability of these assets is determined by comparing the forecasted undiscounted cash flows generated by those assets to the respective asset’s carrying value. The amount of impairment loss, if any, will be measured by the difference between the net carrying value and the estimated fair value of the asset and recognized as a non-cash charge.
Goodwill and Intangible Assets—
Goodwill is allocated to various reporting units. Each of our segments consists of two reporting units. Intangible assets, which primarily consist of acquired permits and leasehold agreements and franchise agreements, are amortized by the straight-line method over their estimated useful lives, which range from
five
to
40 years
. Goodwill is not amortized but is tested at the reporting-unit level annually for impairment and between annual tests if events occur or circumstances change that would more likely than not reduce the fair value below its carrying amount. If the carrying value of goodwill exceeds its fair value, an impairment loss is recognized as a non-cash charge.
Revenue Recognition
—Our revenues are primarily derived from providing space on advertising displays for local, regional and national advertisements. Contracts with customers generally cover periods ranging from four weeks to twelve months and are generally billed every four weeks. Revenues from billboard displays are recognized as rental income on a straight-line basis over the contract term. Transit and other revenues are recognized as earned, which is typically ratably over the contract period. For space provided to advertisers through the use of an advertising agency whose commission is calculated based on a stated percentage of gross billing revenues, revenues are reported net of agency commissions.
Deferred revenues primarily consist of revenues paid in advance of being earned.
Revenues derived from a single contract that contains multiple site locations are allocated based on the relative fair value of each delivered item and recognized in accordance with the applicable revenue recognition criteria for the specific unit of accounting.
Concentration of Credit Risk—
In the opinion of management, credit risk is limited due to the large number of customers and advertising agencies utilized. We perform credit evaluations on our customers and agencies and believe that the allowances for doubtful accounts are adequate.
Billboard Property Lease and Transit Franchise Expenses
—Our billboards are primarily located on leased real property. Lease agreements are negotiated for varying terms ranging from
one month
to multiple years, most of which provide renewal options.
70
OUTFRONT Media Inc.
Notes to Consolidated Financial Statements (Continued)
Lease costs consist of a fixed monthly amount and certain lease agreements also include contingent rent based on the revenues we generate from the leased site. Property leases are generally paid in advance for periods ranging from
one
to
twelve months
.
The fixed component of lease costs is expensed evenly over the contract term, and contingent rent is expensed as it becomes probable, which is consistent with when the related revenues are recognized.
Transit franchise agreements generally provide for payment to the municipality or transit operator of the greater of a percentage of the revenues that we generate under the related transit contract and a specified guaranteed minimum payment. The costs which are determined based on a percentage of revenues are expensed as incurred when the related revenues are recognized, and the minimum guarantee is expensed over the contract term.
Direct Lease Acquisition Costs—
Variable commissions directly associated with billboard revenues are amortized on a straight-line basis over the related customer lease term, which generally ranges from four weeks to one year. Amortization of direct lease acquisition costs is presented within amortization expense in the accompanying Consolidated Statements of Operations.
Foreign Currency Translation and Transactions—
The assets and liabilities of foreign subsidiaries are translated at exchange rates in effect at the balance sheet date, while results of operations are translated at average exchange rates for the respective periods. The resulting translation gains and losses are included as a component of invested equity in accumulated other comprehensive loss. Foreign currency transaction gains and losses are included in “Other income (expense), net” in the Consolidated Statements of Operations.
Income Taxes—
Prior to the Separation, we were a member of CBS’s consolidated tax group, and the provision for income taxes, deferred tax assets and liabilities, and income tax payments were calculated on a separate tax return basis, with us as the taxpayer, even though our U.S. operating results were included in the consolidated federal, and certain state and local income tax returns of CBS. We believe that the assumptions and estimates used to determine these tax amounts were reasonable.
On July 16, 2014, we ceased to be a member of the CBS consolidated tax group and on July 17, 2014, we began operating in a manner that will allow us to qualify as a REIT for U.S. federal income tax purposes for the tax year commencing July 17, 2014, and ending December 31, 2014. We believe we are organized in conformity with the requirements for qualification and taxation as a REIT under Sections 856-860 of the Internal Revenue Code of 1986, as amended (the “Code”), and intend to elect REIT status with the filing of the tax return for the above-referenced short taxable year. Accordingly, we generally will not be subject to U.S. federal income tax on our REIT taxable income that we distribute to our stockholders.
We have elected to treat our subsidiaries that participate in certain non-REIT qualifying activities, and our foreign subsidiaries, as taxable REIT subsidiaries (“TRS”). As such, the taxable income of our TRSs will be subject to federal, state and foreign income taxation at regular corporate rates.
Income taxes are accounted for under the asset and liability method of accounting. Deferred income tax assets and liabilities are recognized for the estimated future tax effects of temporary differences between the financial statement carrying amounts and their respective tax basis. Deferred tax assets are reduced by a valuation allowance if it is more likely than not that some or all of the deferred tax assets will not be realized.
We have applied the FASB’s guidance relating to uncertainty in income taxes recognized. Under this guidance we may recognize the tax benefit from an uncertain tax position only if it is more likely than not that the tax position will be sustained on examination by taxing authorities, based on the technical merits of the position. The tax benefits recognized from such a position are measured based on the largest benefit that has a greater than fifty percent likelihood of being realized upon ultimate settlement. The guidance on accounting for uncertainty in income taxes also provides guidance on de-recognition, classification, interest and penalties on income taxes, and accounting in interim periods.
Asset Retirement Obligation
—An asset retirement obligation is established for the estimated future obligation, upon termination or non-renewal of a lease, associated with removing structures from the leased property and, when required by the contract, the cost to return the leased property to its original condition. These obligations are recorded at their present value in the period in which the liability is incurred and are capitalized as part of the related assets’ carrying value. Accretion of the liability is recognized in operating expenses and the capitalized cost is depreciated over the expected useful life of the related asset.
71
OUTFRONT Media Inc.
Notes to Consolidated Financial Statements (Continued)
Stock-based Compensation
—During 2014, we converted CBS stock options and CBS restricted stock units (“RSUs”) issued by CBS to certain of our employees to stock options and RSUs issued under our equity incentive plan with the same terms and conditions as the CBS awards. We measure the cost of employee services received in exchange for an award of equity instruments based on the grant-date fair value of the award. The cost was recognized over the vesting period during which an employee was required to provide service in exchange for the award.
Adoption of New Accounting Standards
Presentation of an Unrecognized Tax Benefit When a Net Operating Loss Carryforward, a Similar Tax Loss, or a Tax Credit Carryforward Exists
During 2014, we adopted the Financial Accounting Standards Board’s (the “FASB’s”) guidance on the presentation of the reserve for uncertain tax positions when a net operating loss carryforward, a similar tax loss, or a tax credit carryforward exists. This guidance requires the reserve for uncertain tax positions to be presented in the financial statements as a reduction to the deferred tax asset for a tax loss or other tax carryforward that would be applied in the settlement of the uncertain tax position. This guidance did not have a material effect on our consolidated financial statements.
Obligations Resulting from Joint and Several Liability Arrangements
During 2014, we adopted FASB guidance on the recognition, measurement and disclosure of obligations resulting from joint and several liability arrangements for which the total amount of the obligation is fixed at the reporting date. Under this guidance, we are required to measure our obligations under such arrangements as the sum of the amount we agreed to pay in the arrangement among our co-obligors and any additional amount we expect to pay on behalf of our co-obligors. We are also required to disclose the nature and amount of the obligation. This guidance did not have a material effect on our consolidated financial statements.
Recent Pronouncements
Service Concession Arrangements
In
January 2014
, the FASB issued guidance on the accounting for service concession arrangements with public sector entities. This guidance specifies that an operating entity should not account for a service concession arrangement as a lease and the infrastructure used in a service concession arrangement should not be recognized as property, plant and equipment. This guidance applies when the public sector entity controls the services that the operating entity must provide within the infrastructure and also controls any residual interest in the infrastructure at the end of the term of the arrangement. We are currently evaluating the impact of this guidance, which is effective for reporting periods beginning after
December 15, 2014
, on our consolidated financial statements.
Reporting Discontinued Operations and Disclosures of Disposals of Components of an Entity
In
April 2014
, the FASB issued guidance on reporting discontinued operations and disclosures of disposals of components of an entity. The new guidance changes the requirements, including additional disclosures, for reporting discontinued operations which may include a component of an entity or a group of components of an entity, or a business or nonprofit activity. Under the new guidance, a discontinued operation is defined as a disposal of a component or group of components that is disposed of or is classified as held for sale and represents a strategic shift that has (or will have) a major effect on an entity’s operations and financial results. This guidance is effective for interim periods and annual periods beginning after
December 31, 2014
. Early adoption is permitted, but only for disposals that have not been reported in financial statements previously issued or available for issuance. This guidance is not expected to have a material effect on our consolidated financial statements.
Revenue from Contracts with Customers
In
May 2014
, the FASB issued principles-based guidance addressing revenue recognition issues. The guidance may be applied to all contracts with customers regardless of industry-specific or transaction specific fact patterns. This guidance is to be applied retrospectively and is effective for interim and annual periods beginning after
December 15, 2016
. Early adoption is not permitted. We are currently evaluating the impact of this guidance on our consolidated financial statements.
72
OUTFRONT Media Inc.
Notes to Consolidated Financial Statements (Continued)
The table below presents the balances of major classes of assets and accumulated depreciation.
|
As of December 31,
|
||||||||
|
(in millions)
|
2014
|
2013
|
||||||
|
Land
|
$
|
88.1
|
|
$
|
88.6
|
|
||
|
Buildings and improvements
|
47.0
|
|
45.0
|
|
||||
|
Advertising structures
|
1,745.6
|
|
1,662.3
|
|
||||
|
Furniture, equipment and other
|
78.1
|
|
77.2
|
|
||||
|
Construction in progress
|
17.1
|
|
18.9
|
|
||||
|
1,975.9
|
|
1,892.0
|
|
|||||
|
Less accumulated depreciation
|
1,193.0
|
|
1,136.6
|
|
||||
|
Property and equipment, net
|
$
|
782.9
|
|
$
|
755.4
|
|
||
Depreciation expense was
$107.2 million
in 2014,
$104.5 million
in 2013 and
$105.9 million
in 2012.
For the years ended December 31, 2014 and 2013, the changes in the book value of goodwill by segment were as follows:
|
(in millions)
|
U.S.
|
International
|
Total
|
|||||||||
|
As of December 31, 2012
|
$
|
1,758.0
|
|
$
|
119.2
|
|
$
|
1,877.2
|
|
|||
|
Currency translation adjustments
|
—
|
|
(5.1
|
)
|
(5.1
|
)
|
||||||
|
Dispositions
|
(6.4
|
)
|
—
|
|
(6.4
|
)
|
||||||
|
As of December 31, 2013
|
1,751.6
|
|
114.1
|
|
1,865.7
|
|
||||||
|
Currency translation adjustments
|
—
|
|
(10.5
|
)
|
(10.5
|
)
|
||||||
|
Additions
(a)
|
299.2
|
|
—
|
|
299.2
|
|
||||||
|
Dispositions
|
(0.2
|
)
|
—
|
|
(0.2
|
)
|
||||||
|
As of December 31, 2014
|
$
|
2,050.6
|
|
$
|
103.6
|
|
$
|
2,154.2
|
|
|||
|
(a)
|
In 2014, we completed the Acquisition (see Note 12.
Acquisition
).
|
Our identifiable intangible assets primarily consist of acquired permits and leasehold agreements and franchise agreements which grant us the right to operate out-of-home structures in specified locations and the right to provide advertising space on railroad and municipal transit properties. Identifiable intangible assets are amortized on a straight-line basis over their estimated useful life, which is the respective life of the agreement that in some cases includes historical experience of renewals.
73
OUTFRONT Media Inc.
Notes to Consolidated Financial Statements (Continued)
Our identifiable intangible assets consist of the following:
|
(in millions)
|
Gross
|
Accumulated
Amortization
|
Net
|
|||||||||
|
As of December 31, 2014:
|
||||||||||||
|
Permits and leasehold agreements
|
$
|
1,119.2
|
|
$
|
(677.2
|
)
|
$
|
442.0
|
|
|||
|
Franchise agreements
|
474.7
|
|
(321.1
|
)
|
153.6
|
|
||||||
|
Other intangible assets
|
39.9
|
|
(2.3
|
)
|
37.6
|
|
||||||
|
Total intangible assets
|
$
|
1,633.8
|
|
$
|
(1,000.6
|
)
|
$
|
633.2
|
|
|||
|
As of December 31, 2013:
|
||||||||||||
|
Permits and leasehold agreements
|
$
|
880.6
|
|
$
|
(659.0
|
)
|
$
|
221.6
|
|
|||
|
Franchise agreements
|
462.4
|
|
(320.7
|
)
|
141.7
|
|
||||||
|
Other intangible assets
|
2.1
|
|
(1.0
|
)
|
1.1
|
|
||||||
|
Total intangible assets
|
$
|
1,345.1
|
|
$
|
(980.7
|
)
|
$
|
364.4
|
|
|||
All of our intangible assets, except goodwill, are subject to amortization. Amortization expense was
$95.0 million
in 2014,
$91.3 million
in 2013 and
$90.9 million
in 2012, which includes the amortization of direct lease acquisition costs of
$33.8 million
in 2014,
$30.9 million
in 2013 and
$31.1 million
in 2012. Direct lease acquisition costs are amortized on a straight-line basis over the related customer lease term, which generally ranges from four weeks to one year.
We expect our aggregate annual amortization expense for intangible assets, before considering the impact of future direct lease acquisition costs, for each of the years 2015 through 2019, to be as follows:
|
(in millions)
|
2015
|
2016
|
2017
|
2018
|
2019
|
|||||||||||||||
|
Amortization expense
|
$
|
76.7
|
|
$
|
71.7
|
|
$
|
49.5
|
|
$
|
42.7
|
|
$
|
40.9
|
|
|||||
The following table sets forth the change in the asset retirement obligations associated with our advertising structures located on leased properties.
The obligation is calculated based on the assumption that all of our advertising structures will be removed within the next 50 years
. The estimated annual costs to dismantle and remove the structures upon the termination or non-renewal of our leases are consistent with our historical experience.
|
For Year Ended December 31,
|
||||||||
|
(in millions)
|
2014
|
2013
|
||||||
|
Balance, at beginning of period
|
$
|
31.7
|
|
$
|
30.6
|
|
||
|
Accretion expense
|
2.3
|
|
2.2
|
|
||||
|
Additions
|
4.7
|
|
0.4
|
|
||||
|
Liabilities settled
|
(1.2
|
)
|
(0.9
|
)
|
||||
|
Foreign currency translation adjustments
|
(0.9
|
)
|
(0.6
|
)
|
||||
|
Balance, at end of period
|
$
|
36.6
|
|
$
|
31.7
|
|
||
CBS Corporation
Our financial statements as of and for the year ended December 31, 2014, include charges from CBS for services, such as tax, internal audit, cash management, insurance, technology systems and other services. In addition, prior to 2014, CBS provided benefits to our employees, including certain post-employment benefits, medical, dental, life and disability insurance and participation in a 401(k) savings plan. Charges for these services and benefits are reflected in the consolidated financial statements based on the specific identification of costs, assets and liabilities or based on various allocation methods, including
74
OUTFRONT Media Inc.
Notes to Consolidated Financial Statements (Continued)
factors such as headcount, time and effort spent on matters relating to us, and the number of CBS operating entities benefiting from such services. Charges for these services and benefits have been included in
Selling, general and administrative
expenses in the accompanying Consolidated Statements of Operations and totaled
$9.6 million
in 2014,
$60.9 million
in 2013 and
$47.7 million
in 2012. Also included in these charges are professional fees associated with our planned election to be taxed as a REIT. Our expenses as a stand-alone company may be different from those reflected in the Consolidated Statements of Operations prior to the IPO. Effective January 1, 2014, our employees began participating in employee benefit plans maintained by us. As a result, there were no benefits provided by CBS in 2014. In addition, during 2014, all services previously provided by CBS have been transitioned to us.
As of December 31, 2014, there were
no
receivables from CBS and payables to CBS were
$0.2 million
, which were included in
Other current liabilities
on our Consolidated Statement of Financial Position. As of December 31, 2013, there were no receivables or payables from CBS on our Consolidated Statement of Financial Position.
On April 2, 2014, we entered into a transition services agreement with CBS, pursuant to which CBS will temporarily provide us with certain services (including legal, finance, information technology, insurance, tax and employment functions), and we will provide certain limited services to CBS. Also on April 2, 2014, we entered into a license agreement with a wholly owned subsidiary of CBS, pursuant to which we have the right to use “CBS” in the corporate names of the Company and our subsidiaries and have the right to use the “CBS” mark and logo on our advertising billboards. On July 16, 2014, we amended the transition services agreement to extend the time periods in which CBS will provide the transition services described above to January 16, 2015 or to July 16, 2015, as applicable depending on the services being provided. Also on July 16, 2014, we amended the license agreement to extend the time period in which we have the right to use “CBS” in the corporate names of the Company and our subsidiaries to
December 31, 2014
, and have the right to use the “CBS” mark and logo on our advertising displays to
March 31, 2016
. Effective
November 20, 2014
, we re-branded the Company to “
OUTFRONT
media,” our common stock began trading on the New York Stock Exchange under the symbol “OUT” and our legal name changed to OUTFRONT Media Inc.
Prior to the incurrence of indebtedness on January 31, 2014, intercompany transactions between CBS and us were considered to be effectively settled in cash in the financial statements. The net effect of the settlement of these intercompany transactions, in addition to cash transfers to and from CBS, are reflected in
Net cash contribution from (distribution to) CBS
on the Condensed Consolidated Statements of Cash Flows and
Net contribution from (distribution to) CBS
on the Consolidated Statements of Invested Equity/Stockholders’ Equity. The amounts on these financial statement line items differ due to non-cash transactions, such as stock-based compensation expense.
For advertising spending placed by CBS and its subsidiaries, we recognized total revenues of
$18.6 million
, of which
$7.7 million
was before the Separation, for 2014,
$14.9 million
for 2013 and
$16.6 million
for 2012.
On July 16, 2014, CBS completed the Separation and as a result of this transaction, CBS and their affiliates ceased to be related parties.
Other Related Parties
Viacom Inc. is controlled by National Amusements, Inc., the controlling stockholder of CBS. On July 16, 2014, CBS completed the Separation and as a result of this transaction, Viacom Inc. ceased to be a related party. Revenues recognized for advertising spending placed by various subsidiaries of Viacom Inc. were
$10.4 million
, of which
$4.3 million
was before the Separation, in 2014,
$9.3 million
in 2013 and
$9.4 million
in 2012.
We have a
50%
ownership interest in
two
joint ventures that operate transit shelters in Los Angeles and Vancouver. These ventures are accounted for as equity investments. These investments totaled
$20.1 million
as of December 31, 2014, and
$24.1 million
as of December 31, 2013, and are included in
Other assets
on the Consolidated Statements of Financial Position. We provide sales and management services to these joint ventures.
75
OUTFRONT Media Inc.
Notes to Consolidated Financial Statements (Continued)
Long-term debt consists of the following:
|
As of
|
||||||||
|
(in millions, except percentages)
|
December 31,
2014 |
December 31,
2013 |
||||||
|
Term loan, due 2021
|
$
|
798.3
|
|
$
|
—
|
|
||
|
Senior unsecured notes:
|
||||||||
|
5.250% senior unsecured notes, due 2022
|
549.3
|
|
—
|
|
||||
|
5.625% senior unsecured notes, due 2024
|
400.0
|
|
—
|
|
||||
|
5.875% senior unsecured notes, due 2025
|
450.0
|
|
—
|
|
||||
|
Total senior unsecured notes
|
1,399.3
|
|
—
|
|
||||
|
Other
(a)
|
0.7
|
|
—
|
|
||||
|
Total long-term debt
|
$
|
2,198.3
|
|
$
|
—
|
|
||
|
Weighted average cost of debt
|
4.6
|
%
|
—
|
%
|
||||
|
(a)
|
Reflects the outstanding balance as of December 31, 2014, of long-term debt assumed in conjunction with the Acquisition. (See Note 12.
Acquisition
.)
|
Term Loan
On
January 31, 2014
,
two
of our wholly owned subsidiaries, Outfront Media Capital LLC (“Capital LLC”) and Outfront Media Capital Corporation (“Finance Corp,” and together with Capital LLC, the “Borrowers”), borrowed
$800.0 million
under a term loan due in
2021
(the “Term Loan,” together with the Revolving Credit Facility (as defined below), the “Senior Credit Facilities”). The Senior Credit Facilities are governed by a credit agreement, dated as of
January 31, 2014
(the “Credit Agreement”). The Term Loan is unconditionally guaranteed by us and our material existing and future direct and indirect wholly owned domestic subsidiaries (except the Borrowers), subject to certain exceptions. The Term Loan is secured, subject to certain exceptions, by substantially all of the assets of the Borrowers and the guarantors, including a first-priority pledge of all the capital stock of our subsidiaries directly held by the Borrowers and the guarantors under the Term Loan.
The Term Loan bears interest at a rate per annum equal to
2.25%
plus the greater of the London Interbank Offered Rate (“LIBOR”) or 0.75%
. The interest rate on the Term Loan was
3.00%
per annum as of
December 31, 2014
. Interest on the term loan is payable at the end of each LIBOR period, but in no event less frequently than quarterly. The Term Loan was issued at a discount which we are amortizing through
Interest expense
on the Consolidated Statement of Operations over the life of the Term Loan. As of
December 31, 2014
,
$1.7 million
remains unamortized.
Senior Unsecured Notes
On
January 31, 2014
, the Borrowers issued
$400.0 million
aggregate principal amount of
5.250%
Senior Unsecured Notes due
2022
and
$400.0 million
aggregate principal amount of
5.625%
Senior Unsecured Notes due
2024
(together, the “Senior Notes”) in a private placement. The Senior Notes are fully and unconditionally guaranteed on a senior unsecured basis by the Company and each of its direct and indirect domestic subsidiaries that guarantee the Senior Credit Facilities. Interest on the Senior Notes is payable on
May 15
and
November 15
of each year.
On or after
February 15, 2017
, the Borrowers may redeem at any time, or from time to time, some or all of the
5.250%
Senior Unsecured Notes due
2022
, and on or after
February 15, 2019
, the Borrowers may also redeem at any time, or from time to time, some or all of the
5.625%
Senior Unsecured Notes due
2024
. Prior to such dates, the Borrowers may redeem some or all of the Senior Notes subject to a customary make-whole premium. In addition, prior to
February 15, 2017
, the Borrowers may redeem up to
35%
of the aggregate principal amount of each series of Senior Notes with the proceeds of certain equity offerings.
On
October 1, 2014
, the Borrowers issued
$150.0 million
aggregate principal amount of
5.250%
Senior Unsecured Notes due
2022
(the “New 2022 Senior Notes”) in a private placement. The New 2022 Senior Notes are of the same class and series as, and otherwise identical to, the
5.250%
Senior Unsecured Notes due 2022 that were previously issued by the Borrowers on
76
OUTFRONT Media Inc.
Notes to Consolidated Financial Statements (Continued)
January 31, 2014
, (see—
Senior Unsecured Notes
above). Interest on the New 2022 Senior Notes is payable on
May 15
and
November 15
of each year, beginning on
November 15, 2014
. The New 2022 Senior Notes were issued at a discount of
$0.8 million
, which we will amortize through
Interest expense
on the Consolidated Statement of Operations over the life of the New 2022 Senior Notes.
On
October 1, 2014
, the Borrowers also issued
$450.0 million
aggregate principal amount of
5.875%
Senior Unsecured Notes due
2025
(the “2025 Senior Notes,” together with the “New 2022 Senior Notes,” the “New Senior Notes”) in a private placement. The New Senior Notes are fully and unconditionally guaranteed on a senior unsecured basis by the Company and each of its direct and indirect wholly owned domestic subsidiaries that guarantee the Senior Credit Facilities. Interest on the 2025 Senior Notes is payable on
March 15
and
September 15
of each year, beginning on
March 15, 2015
.
On or after
February 15, 2017
, the Borrowers may redeem at any time, or from time to time, some or all of the New 2022 Senior Notes and on or after
September 15, 2019
, the Borrowers may redeem at any time, or from time to time, some or all of the 2025 Senior Notes. Prior to such dates, the Borrowers may redeem some or all of the New Senior Notes subject to a customary make-whole premium. In addition, prior to
February 15, 2017
, the Borrowers may redeem up to
35%
of the aggregate principal amount of the New 2022 Senior Notes and prior to
September 15, 2017
, the Borrowers may redeem up to
35%
of the aggregate principal amount of the 2025 Senior Notes with the proceeds of certain equity offerings.
On
February 3, 2015
, we completed an exchange offer pursuant to which the privately issued Senior Notes and New Senior Notes were exchanged for publicly registered Senior Notes and New Senior Notes having substantially identical terms.
Revolving Credit Facility
On
January 31, 2014
, the Borrowers also entered into a
$425.0 million
Revolving Credit Facility, which matures in
2019
(the “Revolving Credit Facility”). Borrowing rates under the Revolving Credit Facility are based on LIBOR plus a margin based on our Consolidated Net Secured Leverage Ratio, which is the ratio of (i) our consolidated secured debt (less up to
$150.0 million
of unrestricted cash) to (ii) our Consolidated EBITDA (as defined in the Credit Agreement) for the trailing four consecutive quarters. Interest on the Revolving Credit Facility is payable at the end of each LIBOR period, but in no event less frequently than quarterly. The commitment fee based on the amount of unused commitments under the Revolving Credit Facility in
2014
, was
$1.9 million
. As of
December 31, 2014
, there were
no
outstanding borrowings under the Revolving Credit Facility. As of
December 31, 2014
, we had issued letters of credit totaling approximately
$20.6 million
against the Revolving Credit Facility. The Revolving Credit Facility is unconditionally guaranteed by us and our material existing and future direct and indirect wholly owned domestic subsidiaries (except the Borrowers), subject to certain exceptions. The Revolving Credit Facility is secured, subject to certain exceptions, by substantially all of the assets of the Borrowers and the guarantors, including a first-priority pledge of all the capital stock of our subsidiaries directly held by the Borrowers and the guarantors under the Revolving Credit Facility.
Our revenues and operating income may fluctuate due to seasonal advertising patterns and influences on advertising markets. Typically, our revenues and operating income are highest in the fourth quarter, during the holiday shopping season, and lowest in the first quarter, as advertisers cut back on spending following the holiday shopping season. Likewise, several of our municipal transit contracts require annual estimated revenue share or guarantees to be paid at the beginning of the contract period. During January of each year, we have a significant upfront payment (approximately
$70.0 million
) in connection with calendar-year contracts. We have drawn from the Revolving Credit Facility in January 2015 to make these upfront municipal payments and for seasonal cash management purposes. The amount of outstanding borrowings drawn on the Revolving Credit Facility as of
March 6, 2015
, was
$50.0 million
and is expected to be repaid from the cash flows from those transit contracts during 2015.
Debt Covenants
The Credit Agreement and the indentures governing the Senior Notes and the New Senior Notes contain customary affirmative and negative covenants, subject to certain exceptions, including but not limited to those that limit the Company’s and our subsidiaries’ abilities to (i) pay dividends on, repurchase or make distributions in respect to the Company’s or Finance LLC’s capital stock or make other restricted payments, and (ii) enter into agreements restricting certain subsidiaries’ ability to pay dividends or make other intercompany transfers.
77
OUTFRONT Media Inc.
Notes to Consolidated Financial Statements (Continued)
In addition, the terms of the Credit Agreement require that, as long as any commitments remain outstanding under the Revolving Credit Facility, we maintain a Consolidated Net Secured Leverage Ratio of no greater than 4.0 to 1.0.
As of
December 31, 2014
, our Consolidated Net Secured Leverage Ratio was
1.7
to 1.0, as adjusted to give pro forma effect to the Acquisition in accordance with the Credit Agreement.
The Credit Agreement also requires that, in connection with the incurrence of certain indebtedness, we maintain a Consolidated Total Leverage Ratio, which is the ratio of our consolidated total debt to our Consolidated EBITDA for the trailing four consecutive quarters, of no greater than 6.0 to 1.0.
As of
December 31, 2014
, our Consolidated Total Leverage Ratio was
4.7
to 1.0, as adjusted to give pro forma effect to the Acquisition in accordance with the Credit Agreement.
Letter of Credit Facility
On
January 31, 2014
, the Borrowers also entered into a letter of credit facility, pursuant to which we may obtain letters of credit from time to time in an aggregate outstanding face amount of up to
$80.0 million
. After the first year, the letter of credit facility will automatically extend for successive one-year periods unless either the Borrowers or the issuing bank under it elect not to extend it. The letter of credit facility is unconditionally guaranteed by us and our material existing and future direct and indirect wholly owned domestic subsidiaries (except the Borrowers), subject to certain exceptions, and is secured on an equal and ratable basis by the same collateral that secure the Senior Credit Facilities. The fee under the letter of credit facility in
2014
was immaterial. As of
December 31, 2014
, we had issued letters of credit totaling approximately
$68.9 million
against the letter of credit facility.
Deferred Financing Costs
As of
December 31, 2014
, we had deferred financing costs of
$36.5 million
related fees and expenses associated with the Senior Credit Facilities, Senior Notes, New Senior Notes and letter of credit facility, which are included in
Other current assets
and
Other Assets
on the Consolidated Statement of Financial Position. We are amortizing the deferred fees through
Interest expense
on the Consolidated Statement of Operations over the term of each debt facility.
Fair Value
Under the fair value hierarchy, observable inputs such as unadjusted quoted prices in active markets for identical assets or liabilities are defined as Level 1; observable inputs other than quoted prices included within Level 1 that are either directly or indirectly observable for the asset or liability are defined as Level 2; and unobservable inputs for the asset or liability are defined as Level 3. The aggregate fair value of our debt, which is estimated based on quoted market prices of similar liabilities, was approximately
$2.2 billion
as of
December 31, 2014
. The fair value of our debt is classified as Level 2 as of December 31, 2014.
78
OUTFRONT Media Inc.
Notes to Consolidated Financial Statements (Continued)
The following table presents the changes in the components of accumulated other comprehensive income (loss).
|
(in millions)
|
Cumulative
Translation
Adjustments
|
Net
Actuarial
Gain
(Loss)
|
Accumulated
Other
Comprehensive
Income (Loss)
|
|||||||||
|
As of December 31, 2011
|
$
|
(65.3
|
)
|
$
|
(10.3
|
)
|
$
|
(75.6
|
)
|
|||
|
Other comprehensive income (loss)
|
11.0
|
|
(1.4
|
)
|
9.6
|
|
||||||
|
As of December 31, 2012
|
(54.3
|
)
|
(11.7
|
)
|
(66.0
|
)
|
||||||
|
Other comprehensive income (loss) before reclassifications
|
(14.9
|
)
|
5.2
|
|
(9.7
|
)
|
||||||
|
Amortization of actuarial losses reclassified to net income
(a)
|
—
|
|
0.6
|
|
0.6
|
|
||||||
|
Total other comprehensive income (loss), net of tax
|
(14.9
|
)
|
5.8
|
|
(9.1
|
)
|
||||||
|
As of December 31, 2013
|
(69.2
|
)
|
(5.9
|
)
|
(75.1
|
)
|
||||||
|
Other comprehensive income (loss) before reclassifications
|
(10.7
|
)
|
(3.3
|
)
|
(14.0
|
)
|
||||||
|
Amortization of actuarial losses reclassified to net income
(a)
|
—
|
|
0.2
|
|
0.2
|
|
||||||
|
Deferred tax rate adjustment
|
—
|
|
(1.2
|
)
|
(1.2
|
)
|
||||||
|
Total other comprehensive income (loss), net of tax
|
(10.7
|
)
|
(4.3
|
)
|
(15.0
|
)
|
||||||
|
As of December 31, 2014
|
$
|
(79.9
|
)
|
$
|
(10.2
|
)
|
$
|
(90.1
|
)
|
|||
|
(a)
|
See Note 14.
Retirement Benefits
for additional details of items reclassified from accumulated other comprehensive income to net income.
|
Net actuarial gain (loss) included in other comprehensive income (loss) is net of a tax expense of
$1.3 million
in 2014 and
$3.3 million
in 2013, and net of a tax benefit of
$0.3 million
in 2012.
On
January 15, 2014
,
100
shares of our common stock were issued to CBS. On
March 14, 2014
, our board of directors declared a
970,000
to 1 stock split. As a result of the stock split, the
100
shares of our common stock then outstanding were converted into
97,000,000
shares of our common stock. The effects of the stock split have been applied retroactively. For purposes of calculating earnings per share,
97,000,000
shares were considered outstanding for all periods presented.
On
March 25, 2014
, our board of directors granted CBS and certain of its affiliates a waiver of the ownership restrictions contained in our charter, subject to certain initial and ongoing conditions designed to protect our status as a REIT.
On
March 27, 2014
, our registration statement on Form S-11 related to our IPO of our common stock was declared effective by the SEC. On April 2, 2014, we completed an IPO of
23,000,000
shares of our common stock, including
3,000,000
shares of our common stock sold pursuant to the underwriters’ option to purchase additional shares, at a price of
$28.00
per share. Our total shares issued and outstanding upon completion of the IPO was
120,000,000
. (See Note 2.
Initial Public Offering
.)
On
December 1, 2014
, we issued
74,129
shares of our common stock to J&M Holding Enterprises, Inc. (“J&M”), an affiliate of Videri Inc. (“Videri”), in connection with licenses and services to be received under a development and license agreement (the “Videri Agreement”) with J&M and Videri. We also invested
$3.0 million
in Videri for a minority interest, accounted for as a cost-method investment, in connection with the Videri Agreement.
On
December 31, 2014
, we distributed
16,536,001
shares of our common stock as the stock portion of the E&P Purge.
As of
December 31, 2014
,
450,000,000
shares of our common stock, par value
$0.01
per share, were authorized;
136,624,157
shares were issued and outstanding; and
50,000,000
shares of our preferred stock, par value
$0.01
per share, were authorized with no shares issued and outstanding.
In 2014, we recorded restructuring charges of
$9.8 million
associated with the reorganization of management, resulting in the departures of Wally Kelly, President and Chief Operating Officer, and Raymond Nowak, Executive Vice President, Chief
79
OUTFRONT Media Inc.
Notes to Consolidated Financial Statements (Continued)
Administrative Officer and U.S. Chief Financial Officer, from the Company. The restructuring charge is comprised of severance charges, including stock-based compensation of
$5.6 million
. As of December 31, 2014,
$3.9 million
in restructuring reserves remained outstanding and is included in
Other current liabilities
on the Consolidated Statement of Financial Position.
During 2012, to reduce our cost structure, we recorded restructuring charges of
$2.5 million
, mainly in the United States segment. The charges principally reflected severance costs associated with the elimination of positions. As of December 31, 2013, all of the restructuring reserves related to the 2012 charges were fully utilized.
On
October 1, 2014
, we completed the Acquisition for
$690.0 million
in cash, plus working capital adjustments.
Our Consolidated Statement of Operations for 2014 includes
$55.2 million
of revenue and
$10.1 million
of operating income related to the results of operations of the Acquired Business from the date of its acquisition on October 1, 2014.
The allocation of the purchase price of the Acquired Business is based on the fair value of assets acquired and liabilities assumed as of October 1, 2014, the effective date of the Acquisition. The preliminary purchase price allocation related to the Acquisition was not final as of December 31, 2014, and is based upon a preliminary valuation, which is subject to change as we obtain additional information, including information regarding fixed assets, intangible assets and certain liabilities.
The preliminary allocation of the purchase price presented below represents the effect of recording the preliminary estimates of the fair value of assets acquired and liabilities assumed as of the date of the Acquisition, based on the total transaction consideration of
$690.0 million
in cash, plus working capital adjustments. These preliminary estimates will be revised in future periods. Any changes to the initial estimates of the fair value of the assets and liabilities will be recorded as adjustments to those assets and liabilities and residual amounts will be allocated to goodwill.
|
(in millions)
|
Purchase Price
|
|||
|
Base purchase price
|
$
|
690.0
|
|
|
|
Working capital and other adjustments
|
24.2
|
|
||
|
Estimated transaction consideration
|
$
|
714.2
|
|
|
|
Current assets
|
$
|
44.4
|
|
|
|
Property, plant and equipment
|
83.2
|
|
||
|
Goodwill
|
299.2
|
|
||
|
Intangible assets
(a)
|
316.6
|
|
||
|
Other assets
|
11.1
|
|
||
|
Current liabilities
|
(34.5
|
)
|
||
|
Long-term debt
(b)
|
(1.4
|
)
|
||
|
Other liabilities
|
(4.4
|
)
|
||
|
Total net assets acquired
|
$
|
714.2
|
|
|
|
(a)
|
Intangible assets included with the preliminary purchase price allocation are as follows:
|
|
(in millions)
|
Estimated Useful Life
|
Intangible Assets Allocation
|
||||
|
Permits and leasehold agreements
|
12 - 20 years
|
$
|
244.0
|
|
||
|
Franchise agreements
|
4 - 15 years
|
34.8
|
|
|||
|
Advertising relationships
|
7 years
|
16.0
|
|
|||
|
Other
|
1 - 5 years
|
21.8
|
|
|||
|
$
|
316.6
|
|
||||
80
OUTFRONT Media Inc.
Notes to Consolidated Financial Statements (Continued)
|
(b)
|
In conjunction with the Acquisition, we assumed a total of
$1.4 million
of long term debt, due to three unrelated third parties. The debt has varying maturities through June 1, 2021. In November 2014, we prepaid one of the debt obligations, leaving a remaining balance of
$0.7 million
as of December 31, 2014, with varying maturities through January 31, 2017.
|
Unaudited Pro Forma Condensed Combined Statements of Operations Information
The following unaudited pro forma financial information presents our results of operations combined with the Acquired Business as if the Acquisition had occurred as of January 1, 2013. The pro forma information is not necessarily indicative of what the financial position or results of operations actually would have been had the Acquisition been completed as of January 1, 2013. In addition, the unaudited pro forma financial information is not indicative of, nor does it purport to project, our future financial position or operating results. The unaudited pro forma financial information excludes acquisition and integration costs and does not give effect to any estimated and potential cost savings or other operating efficiencies that could result from the Acquisition.
|
Year Ended December 31,
|
||||||||||
|
(in millions, except per share amounts)
|
2014
|
2013
|
||||||||
|
Revenues
|
$
|
1,505.9
|
|
$
|
1,500.3
|
|
||||
|
Operating income
|
193.6
|
|
240.1
|
|
||||||
|
Net income
|
293.6
|
|
117.6
|
|
||||||
|
Net income per common share attributable to shareholders of OUTFRONT Media Inc.:
|
||||||||||
|
Basic
|
$
|
2.57
|
|
$
|
1.03
|
|
||||
|
Diluted
|
$
|
2.56
|
|
$
|
1.02
|
|
||||
Transaction Costs
In 2014, we recorded
$7.6 million
of commitment and other fees in
Interest income (expense), net
, in the Consolidated Statement of Operations associated with a lender commitment to provide a senior unsecured bridge term loan facility for the purpose of financing the Acquisition in the event we did not complete the offering of the New Senior Notes. In addition we also recorded
$10.4 million
of other acquisition costs.
On
March 18, 2014
, our board of directors approved the Omnibus Stock Incentive Plan (the “Stock Plan”) and reserved
8,000,000
shares of our common stock for stock-based awards. Under the Stock Plan, the board of directors is authorized to grant awards of options to purchase shares of our common stock (the “OUTFRONT Options”), stock appreciation rights, restricted and unrestricted stock, restricted share units (“RSUs”), dividend equivalents, performance awards, including performance-based restricted share units (“PRSUs”), and other equity-related awards and cash payments to all of our employees and non-employee directors and employees of our subsidiaries. In addition, consultants and advisors who perform services for us and our subsidiaries may, under certain conditions, receive grants under our Stock Plan.
RSUs and PRSUs accrue dividend equivalents in amounts equal to the regular cash dividends paid on our common stock and will be paid in either cash or stock. Accrued dividend equivalents payable in stock shall convert to shares of our common stock on the date of vesting.
The Stock Plan also provides for the treatment of awards held by our employees that were originally granted under various CBS stock plans. Prior to our IPO, certain of our employees were granted awards of RSUs, PRSUs and stock options for CBS Class B common stock under the CBS equity incentive plans. At the time of the IPO, substantially all outstanding RSUs and PRSUs for CBS Class B common stock (the “CBS RSUs”) were converted into RSUs and PRSUs for our common stock (the “OUTFRONT RSUs”) under the Stock Plan.
Compensation expense for RSUs is determined based upon the market price of the shares underlying the awards on the date of grant and expensed over the vesting period, which is generally a
three
- to
four
-year service period. For PRSU awards, the number of shares an employee earns may range from
0%
to
120%
based on the outcome of a
one year
performance condition. Compensation expense is recorded based on the probable outcome of the performance condition. On an annual basis, the board
81
OUTFRONT Media Inc.
Notes to Consolidated Financial Statements (Continued)
of directors will review actual performance and certify the degree to which performance goals applicable to the award have been met. Forfeitures of RSUs are estimated on the date of grant based on historical forfeiture rates. On an annual basis, adjustments are made to compensation expense based on actual forfeitures and the forfeiture rates are revised as necessary.
The following table summarizes our stock-based compensation expense for 2014, 2013 and 2012.
|
Year Ended December 31,
|
||||||||||||
|
(in millions)
|
2014
|
2013
|
2012
|
|||||||||
|
RSUs and PRSUs
|
$
|
13.1
|
|
$
|
6.8
|
|
$
|
5.2
|
|
|||
|
Stock options
|
2.9
|
|
0.7
|
|
0.5
|
|
||||||
|
Stock-based compensation expense, before income taxes
|
16.0
|
|
7.5
|
|
5.7
|
|
||||||
|
Tax benefit
|
(3.0
|
)
|
(3.0
|
)
|
(2.3
|
)
|
||||||
|
Stock-based compensation expense, net of tax
|
$
|
13.0
|
|
$
|
4.5
|
|
$
|
3.4
|
|
|||
As of December 31, 2014, total unrecognized compensation cost related to non-vested RSUs and PRSUs was
$18.1 million
, which is expected to be recognized over a weighted average period of
2.8 years
, and total unrecognized compensation cost related to non-vested stock options was
$0.6 million
, which is expected to be recognized over a weighted average period of
2.6 years
.
RSUs and PRSUs
On
March 27, 2014
,
256,172
non-vested CBS RSUs held by our employees were converted into
561,021
non-vested OUTFRONT RSUs. The number of RSUs was converted at a ratio of approximately
2.2
to 1.0 to preserve the fair value of the awards both before and after conversion.
82
OUTFRONT Media Inc.
Notes to Consolidated Financial Statements (Continued)
The following table summarizes the activity of the RSUs and PRSUs issued to our employees.
|
CBS RSUs
|
OUTFRONT RSUs
|
|||||||||||||
|
Activity
|
Weighted Average Per Share Grant Date Fair Market Value
|
Activity
|
Weighted Average Per Share Grant Date Fair Market Value
|
|||||||||||
|
Non-vested as of December 31, 2013
|
472,490
|
|
$
|
32.09
|
|
|||||||||
|
Employee transfers and grants
|
11,875
|
|
34.66
|
|
||||||||||
|
Vested
|
(157,723
|
)
|
22.51
|
|
||||||||||
|
Forfeited
|
(2,909
|
)
|
37.67
|
|
||||||||||
|
Non-vested before conversion
|
323,733
|
|
36.80
|
|
||||||||||
|
CBS RSUs converted to OUTFRONT RSUs
|
(256,172
|
)
|
37.77
|
|
||||||||||
|
Non-vested OUTFRONT RSUs converted from CBS RSUs
|
561,021
|
|
$
|
17.24
|
|
|||||||||
|
Non-vested CBS RSUs not converted to OUTFRONT RSUs
(a)
|
67,561
|
|
33.16
|
|
||||||||||
|
Granted:
|
||||||||||||||
|
RSUs
|
488,729
|
|
26.76
|
|
||||||||||
|
RSUs issued in connection with special dividend
(b)
|
161,720
|
|
26.73
|
|
||||||||||
|
PRSUs
|
182,844
|
|
29.97
|
|
||||||||||
|
Dividend equivalents
|
||||||||||||||
|
Vested:
|
||||||||||||||
|
RSUs
|
(67,561
|
)
|
33.16
|
|
(33,177
|
)
|
16.29
|
|
||||||
|
PRSUs
|
(29,458
|
)
|
15.28
|
|
||||||||||
|
Forfeitures:
|
||||||||||||||
|
RSUs
|
(37,788
|
)
|
24.00
|
|
||||||||||
|
PRSUs
|
(15,289
|
)
|
26.39
|
|
||||||||||
|
Dividend equivalents
|
||||||||||||||
|
Non-vested as of December 31, 2014
|
—
|
|
—
|
|
1,278,602
|
|
21.92
|
|
||||||
|
(a)
|
Reflects CBS RSUs which vested in April 2014.
|
|
(b)
|
Represents an adjustment to the outstanding awards for the E&P Purge pursuant to the anti-dilution provisions of the Stock Plan.
|
The total fair value of CBS RSUs that vested was
$15.1 million
during 2014,
$16.4 million
during 2013 and
$11.4 million
during 2012. The total fair value of OUTFRONT RSUs and PRSUs that vested was
$1.6 million
during 2014.
Stock Options
Stock options vest over a
four
-year service period and expire
eight
or
ten
years from the date of grant. Forfeitures are estimated on the date of grant based on historical forfeiture rates. On an annual basis, adjustments are made to compensation expense based on actual forfeitures and the forfeiture rates are revised as necessary.
83
OUTFRONT Media Inc.
Notes to Consolidated Financial Statements (Continued)
The weighted average fair value of stock options as of the grant date was
$14.04
in 2013 and
$8.83
in 2012, respectively. Compensation expense for stock options is determined based on the grant date fair value of the award using the Black-Scholes options-pricing model with the following weighted average assumptions:
|
Year Ended December 31,
|
||||||||
|
2014
|
2013
|
2012
|
||||||
|
Expected dividend yield
|
N/A
|
1.38
|
%
|
2.00
|
%
|
|||
|
Expected stock price volatility
|
N/A
|
35.00
|
%
|
40.20
|
%
|
|||
|
Risk-free interest rate
|
N/A
|
1.20
|
%
|
1.01
|
%
|
|||
|
Expected term of options (years)
|
N/A
|
5.00
|
|
5.02
|
|
|||
N/A - Not applicable.
The expected stock price volatility was determined using a weighted average of historical volatility for CBS Class B Common Stock and implied volatility of publicly traded options to purchase CBS Class B Common Stock. Given the existence of an actively traded market for CBS options, we were able to derive implied volatility using publicly traded options to purchase CBS Class B Common Stock that were trading near the grant date of the employee stock options at a similar exercise price and a remaining term of greater than one year.
The risk-free interest rate was based on a U.S. Treasury rate in effect on the date of grant with a term equal to the expected life. The expected term was determined based on historical employee exercise and post-vesting termination behavior. The expected dividend yield represented the future expectation of the dividend yield based on current rates and historical patterns of dividend changes.
On
July 16, 2014
,
219,741
outstanding CBS stock options held by our active employees were converted into
409,207
Outdoor Options. Vested outstanding CBS stock options held by former employees of the Company were not converted into Outdoor Options. The CBS stock options were converted at a ratio of approximately
1.9
to 1.0 to preserve the intrinsic value of the award at the time of conversion.
The following table summarizes the activity of CBS’s stock options and OUTFRONT stock options issued to our employees.
|
CBS
Stock Options
|
CBS
Weighted Average Exercise Price
|
OUTFRONT
Stock Options
|
OUTFRONT Weighted Average Exercise Price
|
|||||||||||
|
Outstanding as of December 31, 2013
|
399,581
|
|
$
|
29.30
|
|
|||||||||
|
Exercised
|
(123,574
|
)
|
22.05
|
|
||||||||||
|
Forfeited or expired
|
(39,405
|
)
|
30.67
|
|
||||||||||
|
CBS stock options converted to OUTFRONT stock options
|
(219,741
|
)
|
33.27
|
|
||||||||||
|
Outstanding OUTFRONT stock options converted from CBS stock options
|
409,207
|
|
$
|
17.87
|
|
|||||||||
|
Adjustment in connection with special dividend
(a)
|
63,898
|
|
N/A
|
|
||||||||||
|
Exercised
|
(3,519
|
)
|
12.73
|
|
||||||||||
|
Forfeited or expired
|
(18,696
|
)
|
19.96
|
|
||||||||||
|
Outstanding as of December 31, 2014
|
450,890
|
|
15.29
|
|
||||||||||
|
Exercisable as of December 31, 2014
|
16,861
|
|
27.38
|
|
191,445
|
|
10.62
|
|
||||||
|
(a)
|
Represents an adjustment to the outstanding awards for the E&P Purge pursuant to the anti-dilution provisions of the Stock Plan.
|
84
OUTFRONT Media Inc.
Notes to Consolidated Financial Statements (Continued)
The following table summarizes other information relating to stock option exercises during the years ended December 31, 2014, 2013 and 2012.
|
Year Ended December 31,
|
||||||||||||
|
(in millions)
|
2014
|
2013
|
2012
|
|||||||||
|
Cash paid to CBS by our employees for stock option exercises
|
$
|
5.0
|
|
$
|
4.0
|
|
$
|
6.5
|
|
|||
|
Tax benefit of CBS stock option exercises
|
—
|
|
2.5
|
|
0.8
|
|
||||||
|
Intrinsic value of CBS stock option exercises
|
5.3
|
|
6.1
|
|
1.9
|
|
||||||
Activity related to exercises by our employees of our stock options was immaterial.
The following table summarizes information concerning outstanding and exercisable stock options to purchase our common stock under the Stock Plan as of December 31, 2014.
|
Outstanding
|
Exercisable
|
|||||||||||||||
|
Range of
Exercise Price
|
Number
of
Options
|
Remaining
Contractual
Life (Years)
|
Weighted
Average
Exercise
Price
|
Number of
Options
|
Weighted
Average
Exercise
Price
|
|||||||||||
|
$0 to 4.99
|
64,556
|
|
2.15
|
$
|
2.43
|
|
64,556
|
|
$
|
2.43
|
|
|||||
|
$5 to 9.99
|
23,446
|
|
3.17
|
6.25
|
|
23,446
|
|
6.25
|
|
|||||||
|
$10 to 14.99
|
180,908
|
|
3.55
|
12.64
|
|
67,162
|
|
12.49
|
|
|||||||
|
$20 to 24.99
|
78,567
|
|
6.12
|
20.07
|
|
10,429
|
|
20.07
|
|
|||||||
|
$25 to 29.99
|
103,413
|
|
6.72
|
26.39
|
|
25,852
|
|
26.39
|
|
|||||||
|
450,890
|
|
191,445
|
|
|||||||||||||
Stock options outstanding as of December 31, 2014, have a weighted average remaining contractual life of
4.49 years
and the total intrinsic value for “in-the-money” options, based on the closing stock price of our common stock of
$26.84
, was
$5.2 million
. Stock options exercisable as of December 31, 2014, have a weighted average remaining contractual life of
2.85 years
and the total intrinsic value for “in-the-money” exercisable options was
$3.1 million
.
We sponsor
two
defined benefit pension plans covering specific groups of employees in Canada and the U.S.
The benefits for the pension plan in Canada are based primarily on an employee’s years of service and average pay near retirement. Participating employees in this plan are vested after two years of service or immediately, depending on the province of their employment. We fund this plan in accordance with the rules and regulations of the Pension Benefits Act of the Province of Ontario, Canada. Plan assets consist principally of equity securities, corporate bonds and government related securities included in a trust.
The pension plan in the U.S. covers a small number of hourly employees. The investments of the pension plan in the U.S. consist entirely of the plan’s interest in a trust, which invests the assets of this plan. The plan is funded in accordance with requirements of the Employee Retirement Income Security Act of 1974, as amended.
We use a December 31 measurement date for all pension plans.
85
OUTFRONT Media Inc.
Notes to Consolidated Financial Statements (Continued)
The following table sets forth the change in benefit obligation for our pension plans.
|
As of December 31,
|
||||||||||||
|
(in millions)
|
2014
|
2013
|
2012
|
|||||||||
|
Benefit obligation, beginning of year
|
$
|
46.0
|
|
$
|
52.7
|
|
$
|
46.8
|
|
|||
|
Service cost
|
1.4
|
|
1.7
|
|
1.5
|
|
||||||
|
Interest cost
|
2.2
|
|
2.0
|
|
2.2
|
|
||||||
|
Actuarial (gain) loss
|
7.2
|
|
(5.1
|
)
|
2.7
|
|
||||||
|
Benefits paid
|
(1.8
|
)
|
(1.6
|
)
|
(2.2
|
)
|
||||||
|
Cumulative translation adjustments
|
(4.1
|
)
|
(3.7
|
)
|
1.7
|
|
||||||
|
Benefit obligation, end of year
|
$
|
50.9
|
|
$
|
46.0
|
|
$
|
52.7
|
|
|||
The following table sets forth the change in plan assets for our pension plans.
|
As of December 31,
|
||||||||
|
(in millions)
|
2014
|
2013
|
||||||
|
Fair value of plan assets, beginning of year
|
$
|
43.7
|
|
$
|
40.1
|
|
||
|
Actual return on plan assets
|
4.1
|
|
4.5
|
|
||||
|
Employer contributions
|
1.6
|
|
3.8
|
|
||||
|
Benefits paid
|
(1.8
|
)
|
(1.6
|
)
|
||||
|
Cumulative translation adjustments
|
(3.5
|
)
|
(3.1
|
)
|
||||
|
Fair value of plan assets, end of year
|
$
|
44.1
|
|
$
|
43.7
|
|
||
The funded status of pension benefit obligations and the related amounts recognized on the Consolidated Statement of Financial Position were as follows:
|
As of December 31,
|
||||||||
|
(in millions)
|
2014
|
2013
|
||||||
|
Funded status, end of year
|
$
|
(6.8
|
)
|
$
|
(2.3
|
)
|
||
|
Amounts recognized on the Consolidated Statement of Financial Position:
|
||||||||
|
Other noncurrent liabilities
|
(6.8
|
)
|
(2.3
|
)
|
||||
|
Net amounts recognized
|
(6.8
|
)
|
(2.3
|
)
|
||||
The following amounts were recognized in accumulated other comprehensive loss on the Consolidated Statement of Financial Position.
|
As of December 31,
|
||||||||
|
(in millions)
|
2014
|
2013
|
||||||
|
Net actuarial loss
|
$
|
(14.5
|
)
|
$
|
(10.2
|
)
|
||
|
Deferred tax rate adjustment
|
(1.2
|
)
|
—
|
|
||||
|
Deferred income taxes
|
5.5
|
|
4.3
|
|
||||
|
Net amount recognized in accumulated other comprehensive loss
|
(10.2
|
)
|
(5.9
|
)
|
||||
The accumulated benefit obligation for the defined benefit pension plans was
$46.6 million
as of December 31, 2014, and
$41.6 million
as of December 31, 2013.
86
OUTFRONT Media Inc.
Notes to Consolidated Financial Statements (Continued)
The information for the pension plans with an accumulated benefit obligation in excess of plan assets is set forth below.
|
As of December 31,
|
||||||||
|
(in millions)
|
2014
|
2013
(a)
|
||||||
|
Projected benefit obligation
|
$
|
50.9
|
|
$
|
2.0
|
|
||
|
Accumulated benefit obligation
(a)
|
46.6
|
|
1.9
|
|
||||
|
Fair value of plan assets
(a)
|
44.1
|
|
1.8
|
|
||||
|
(a)
|
As of December 31, 2013, the fair value of plan assets exceeded the accumulated benefit obligation for our pension plan in Canada.
|
The following tables present the components of net periodic pension cost and amounts recognized in other comprehensive income (loss).
|
As of December 31,
|
||||||||||||
|
(in millions)
|
2014
|
2013
|
2012
|
|||||||||
|
Service cost
|
$
|
1.4
|
|
$
|
1.7
|
|
$
|
1.5
|
|
|||
|
Interest cost
|
2.2
|
|
2.0
|
|
2.2
|
|
||||||
|
Expected return on plan assets
|
(2.5
|
)
|
(2.4
|
)
|
(2.1
|
)
|
||||||
|
Amortization of actuarial losses
|
0.3
|
|
1.0
|
|
0.9
|
|
||||||
|
Net periodic pension cost
|
$
|
1.4
|
|
$
|
2.3
|
|
$
|
2.5
|
|
|||
|
(in millions)
|
Year Ended December 31, 2014
|
|||
|
Actuarial losses
|
$
|
(5.7
|
)
|
|
|
Amortization of actuarial losses
(a)
|
0.3
|
|
||
|
Cumulative translation adjustments
|
1.0
|
|
||
|
Deferred tax rate adjustment
|
(1.2
|
)
|
||
|
(5.6
|
)
|
|||
|
Deferred income taxes
|
1.3
|
|
||
|
Recognized in other comprehensive loss, net of tax
|
$
|
(4.3
|
)
|
|
|
(a)
|
Reflects amounts reclassified from accumulated other comprehensive income (loss) to net income.
|
Estimated net actuarial losses related to the defined benefit pension plans of approximately
$0.9 million
, will be amortized from accumulated other comprehensive loss into net periodic pension costs in 2015.
|
As of and for the Year Ended December 31,
|
||||||
|
2014
|
2013
|
|||||
|
Weighted average assumptions used to determine benefit obligations:
|
||||||
|
Discount rate
|
4.0
|
%
|
5.0
|
%
|
||
|
Rate of compensation increase
|
3.0
|
|
3.0
|
|
||
|
Weighted average assumptions used to determine net periodic cost:
|
||||||
|
Discount rate
|
5.0
|
|
4.0
|
|
||
|
Expected long-term return on plan assets
|
5.6
|
|
6.0
|
|
||
|
Rate of compensation increase
|
3.0
|
|
3.0
|
|
||
For each pension plan, the discount rate is determined based on the yield on portfolios of high quality bonds, constructed to provide cash flows necessary to meet the expected future benefit payments, as determined for the projected benefit obligation. The expected return on plan assets assumption was derived using the current and expected asset allocation of the pension plan assets and considering historical as well as expected returns on various classes of plan assets.
87
OUTFRONT Media Inc.
Notes to Consolidated Financial Statements (Continued)
Plan Assets
Our plan assets are included in a trust in Canada and a trust in the U.S. The asset allocations of these trusts are based upon an analysis of the timing and amount of projected benefit payments, projected company contributions, the expected returns and risk of the asset classes and the correlation of those returns. As of December 31, 2014, we invested approximately
40%
in fixed income instruments,
53%
in equity instruments, and the remainder in cash, cash equivalents and other investments.
The following tables set forth our pension plan assets measured at fair value on a recurring basis as of December 31, 2014 and 2013. These assets have been categorized according to the three-level fair value hierarchy established by the FASB which prioritizes the inputs used in measuring fair value. Level 1 is based on quoted prices for the asset in active markets. Level 2 is based on inputs that are observable other than quoted market prices in active markets, such as quoted prices for the asset in inactive markets or quoted prices for similar assets. Level 3 is based on unobservable inputs that market participants would use in pricing the asset.
|
As of December 31, 2014
|
||||||||||||||||
|
(in millions)
|
Level 1
|
Level 2
|
Level 3
|
Total
|
||||||||||||
|
Cash and cash equivalents
(a)
|
$
|
1.2
|
|
$
|
1.8
|
|
$
|
—
|
|
$
|
3.0
|
|
||||
|
Fixed income securities:
|
||||||||||||||||
|
Government related securities
|
1.3
|
|
3.2
|
|
—
|
|
4.5
|
|
||||||||
|
Corporate bonds
(b)
|
—
|
|
13.3
|
|
—
|
|
13.3
|
|
||||||||
|
Equity securities
(c)
:
|
||||||||||||||||
|
U.S. equity
|
—
|
|
7.7
|
|
—
|
|
7.7
|
|
||||||||
|
International equity
|
—
|
|
15.6
|
|
—
|
|
15.6
|
|
||||||||
|
Other
|
—
|
|
—
|
|
—
|
|
—
|
|
||||||||
|
Total assets
|
$
|
2.5
|
|
$
|
41.6
|
|
$
|
—
|
|
$
|
44.1
|
|
||||
|
As of December 31, 2013
|
||||||||||||||||
|
(in millions)
|
Level 1
|
Level 2
|
Level 3
|
Total
|
||||||||||||
|
Cash and cash equivalents
(a)
|
$
|
—
|
|
$
|
2.6
|
|
$
|
—
|
|
$
|
2.6
|
|
||||
|
Fixed income securities:
|
||||||||||||||||
|
Government related securities
|
1.4
|
|
6.3
|
|
—
|
|
7.7
|
|
||||||||
|
Corporate bonds
(b)
|
—
|
|
9.6
|
|
—
|
|
9.6
|
|
||||||||
|
Equity securities
(c)
:
|
||||||||||||||||
|
U.S. equity
|
4.9
|
|
2.6
|
|
—
|
|
7.5
|
|
||||||||
|
International equity
|
—
|
|
16.2
|
|
—
|
|
16.2
|
|
||||||||
|
Other
|
—
|
|
0.1
|
|
—
|
|
0.1
|
|
||||||||
|
Total assets
|
$
|
6.3
|
|
$
|
37.4
|
|
$
|
—
|
|
$
|
43.7
|
|
||||
|
(a)
|
Assets categorized as Level 2 reflect investments in money market funds.
|
|
(b)
|
Securities of diverse industries, substantially all investment grade.
|
|
(c)
|
Assets categorized as Level 2 reflect investments in common collective funds.
|
Money market investments are carried at amortized cost which approximates fair value due to the short-term maturity of these investments. Investments in equity securities are reported at fair value based on quoted market prices on national security exchanges. The fair value of investments in common collective funds are determined using the Net Asset Value (“NAV”) provided by the administrator of the fund. The NAV is determined by each fund’s trustee based upon the fair value of the underlying assets owned by the fund, less liabilities, divided by the number of outstanding units. The fair value of government related securities and corporate bonds is determined based on quoted market prices on national security exchanges, when available, or using valuation models which incorporate certain other observable inputs including recent trading activity for comparable securities and broker-quoted prices.
88
OUTFRONT Media Inc.
Notes to Consolidated Financial Statements (Continued)
Future Benefit Payments
|
(in millions)
|
2015
|
2016
|
2017
|
2018
|
2019
|
2020-2024
|
||||||
|
Estimated future benefit payments for pension plans
|
1.2
|
1.2
|
1.3
|
1.5
|
1.7
|
12.9
|
||||||
We expect to contribute
$2.2 million
to our pension plans in 2015.
Multi-Employer Pension and Postretirement Benefit Plans
We contribute to multi-employer plans that provide pension and other postretirement benefits to certain employees under collective bargaining agreements. Contributions to these plans were
$2.0 million
in 2014,
$1.6 million
in 2013 and
$1.7 million
in 2012. Based on our contributions to each individual multi-employer plan relative to the total contributions of all participating employers in such plan, no multi-employer plan was deemed to be individually significant to us.
Defined Contribution Plans
CBS sponsored defined contribution plans in which substantially all of our employees meeting eligibility requirements were able to participate. Employer contributions to such plans were
$3.7 million
in 2013 and
$3.4 million
in 2012. On January 1, 2014, the account balances for our employees were transferred to a defined contribution plan sponsored by us and employer contributions for the plan was
$3.8 million
in 2014.
Prior to the Separation, we were a member of CBS’s consolidated tax group and were taxable as a regular domestic C corporation for U.S. federal income tax purposes. Pursuant to the tax matters agreement that we entered into with CBS, we are liable to pay CBS for any taxes imposed on or related to us while we were a member of the CBS consolidated tax group. After the Separation, CBS ceased to own at least
80%
of our outstanding common stock, and as a result, we were no longer a member of CBS’s consolidated tax group.
As of July 17, 2014, we believe we are organized in conformity with the requirements for qualification and taxation as a REIT under the Code, and, accordingly, we have not provided for U.S. federal income tax on our REIT taxable income that we distributed to our stockholders. We have elected to treat our subsidiaries that participate in certain non-REIT qualifying activities, and our foreign subsidiaries, as TRSs. As such, we have provided for their federal, state and foreign income taxes.
In 2014, as a result of our REIT conversion, substantially all
Deferred income tax liabilities, net,
was reversed into
Net income
via a non-cash benefit of approximately
$235.6 million
. As a result of our REIT conversion, our effective tax rate for the second half of 2014 was substantially lower than previous periods. Prior to the Separation, our income tax provisions were calculated on a separate tax return basis, with us as the taxpayer, even though our U.S. operating results were included in the consolidated federal, and certain state and local income tax returns of CBS. We believe that the assumptions and estimates used to determine these tax amounts were reasonable. However, the consolidated financial statements may not necessarily reflect our income tax expense or tax payments, or what our tax amounts would have been if we had been a stand-alone company operating as a REIT during the periods prior to the Separation.
Cash paid for income taxes was assumed to be
$53.0 million
in 2014,
$112.8 million
in 2013 and
$96.5 million
in 2012.
The U.S. and foreign components of
Income before benefit (provision) for income taxes and equity in earnings of investee companies
were as follows:
|
Year Ended December 31,
|
||||||||||||
|
(in millions)
|
2014
|
2013
|
2012
|
|||||||||
|
United States
|
$
|
102.8
|
|
$
|
239.8
|
|
$
|
201.9
|
|
|||
|
Foreign
|
(4.8
|
)
|
(2.2
|
)
|
(1.7
|
)
|
||||||
|
Income before benefit (provision) for income taxes and equity in earnings of investee companies
|
$
|
98.0
|
|
$
|
237.6
|
|
$
|
200.2
|
|
|||
89
OUTFRONT Media Inc.
Notes to Consolidated Financial Statements (Continued)
The following table reconciles
Income before benefit (provision) for income taxes and equity in earnings of investee companies
to REIT taxable income for the period July 17, 2014, through December 31, 2014.
|
Year Ended December 31,
|
||||||||
|
(in millions)
|
2014
|
|||||||
|
Income before benefit (provision) for income taxes and equity in earnings of investee companies
|
$
|
98.0
|
|
|||||
|
Income before benefit (provision) for income taxes and equity in earnings of investee companies for the period January 1, 2014, through July 16, 2014
|
(57.9
|
)
|
||||||
|
Income before benefit (provision) for income taxes and equity in earnings of investee companies for the period July 17, 2014, through December 31, 2014
|
40.1
|
|
||||||
|
Income of TRSs
|
(1.6
|
)
|
||||||
|
Income from REIT operations
|
38.5
|
|
||||||
|
Book depreciation in excess of tax depreciation
|
15.0
|
|
||||||
|
Book amortization in excess of tax amortization
|
21.3
|
|
||||||
|
Book/tax differences - stock-based compensation
|
8.1
|
|
||||||
|
Book/tax differences - capitalized costs
|
7.4
|
|
||||||
|
Book/tax differences - investments in joint ventures
|
2.5
|
|
||||||
|
Book/tax differences - other
|
4.2
|
|
||||||
|
REIT taxable income for the period July 17, 2014, through December 31, 2014 (estimated)
|
$
|
97.0
|
|
|||||
The components of the
Benefit (provision) for income taxes
are as follows:
|
Year Ended December 31,
|
||||||||||||
|
(in millions)
|
2014
|
2013
|
2012
|
|||||||||
|
Current:
|
||||||||||||
|
Federal
|
$
|
29.9
|
|
$
|
85.1
|
|
$
|
71.8
|
|
|||
|
State and local
|
9.8
|
|
21.8
|
|
18.9
|
|
||||||
|
Foreign
|
3.8
|
|
5.2
|
|
4.9
|
|
||||||
|
43.5
|
|
112.1
|
|
95.6
|
|
|||||||
|
Deferred tax (benefit) liability:
|
||||||||||||
|
Federal
|
(198.0
|
)
|
(3.6
|
)
|
(5.1
|
)
|
||||||
|
State and local
|
(50.3
|
)
|
(10.0
|
)
|
1.7
|
|
||||||
|
Foreign
|
(1.2
|
)
|
(1.9
|
)
|
(3.2
|
)
|
||||||
|
(249.5
|
)
|
(15.5
|
)
|
(6.6
|
)
|
|||||||
|
(Benefit) provision for income taxes
|
$
|
(206.0
|
)
|
$
|
96.6
|
|
$
|
89.0
|
|
|||
Excluding the non-cash benefit recorded as a result of our REIT conversion in 2014, the effective income tax rate was
30.3%
in 2014,
40.7%
in 2013 and
44.5%
in 2012.
90
OUTFRONT Media Inc.
Notes to Consolidated Financial Statements (Continued)
The difference between income taxes expected at the U.S. federal statutory income tax rate of
35%
and the
Benefit (provision) for income taxes
is summarized as follows:
|
Year Ended December 31,
|
||||||||||||
|
(in millions)
|
2014
|
2013
|
2012
|
|||||||||
|
Taxes on income at U.S. statutory rate
|
$
|
34.3
|
|
$
|
83.2
|
|
$
|
70.1
|
|
|||
|
REIT dividends paid deduction
|
(13.5
|
)
|
—
|
|
—
|
|
||||||
|
State and local taxes, net of federal tax benefit
|
4.8
|
|
7.6
|
|
13.4
|
|
||||||
|
Effect of foreign operations
|
2.9
|
|
4.0
|
|
2.2
|
|
||||||
|
Deferred tax adjustment due to REIT conversion
|
(235.6
|
)
|
—
|
|
—
|
|
||||||
|
Other, net
(a)
|
1.1
|
|
1.8
|
|
3.3
|
|
||||||
|
(Benefit) provision for income taxes
|
$
|
(206.0
|
)
|
$
|
96.6
|
|
$
|
89.0
|
|
|||
|
(a)
|
For 2012, other primarily reflects a charge related to our domestic production deduction.
|
The following table is a summary of the components of deferred income tax assets and liabilities.
|
As of December 31,
|
||||||||
|
(in millions)
|
2014
|
2013
|
||||||
|
Deferred income tax assets:
|
||||||||
|
Provision for expenses and losses
|
$
|
2.8
|
|
$
|
31.3
|
|
||
|
Postretirement and other employee benefits
|
4.6
|
|
9.9
|
|
||||
|
Tax credit and loss carryforwards
|
10.9
|
|
14.6
|
|
||||
|
Other
|
—
|
|
0.1
|
|
||||
|
Total deferred income tax assets
|
18.3
|
|
55.9
|
|
||||
|
Valuation allowance
|
(6.9
|
)
|
(10.1
|
)
|
||||
|
Deferred income tax assets, net
|
11.4
|
|
45.8
|
|
||||
|
Deferred income tax liabilities:
|
||||||||
|
Property, equipment and intangible assets
|
(18.8
|
)
|
(309.3
|
)
|
||||
|
Other
|
—
|
|
(0.5
|
)
|
||||
|
Total deferred income tax liabilities
|
(18.8
|
)
|
(309.8
|
)
|
||||
|
Deferred income tax liabilities, net
|
$
|
(7.4
|
)
|
$
|
(264.0
|
)
|
||
As of December 31, 2014, we had net operating loss carryforwards for federal, state and local, and foreign jurisdictions of
$33.7 million
. Approximately
$20.9 million
of these losses may be carried forward indefinitely, subject to limitations imposed by local tax laws. The remaining net operating losses expire in various years from
2015
through
2027
.
Deferred income tax assets were reduced by a valuation allowance of
$6.9 million
as of December 31, 2014, and
$10.1 million
as of December 31, 2013, principally relating to income tax benefits from net operating losses which are not expected to be realized.
As a result of the Separation, we have been allocated a portion of the CBS’s foreign unremitted earnings as of July 16, 2014. Our share of the undistributed earnings of foreign subsidiaries not included in our consolidated federal income tax return that could be subject to additional income taxes if remitted was approximately
$214.4 million
as of December 31, 2014. No provision has been recorded for the U.S. or foreign taxes that could result from the remittance of such undistributed earnings since we intend to distribute only the portion of such earnings which would be remitted in tax-free transactions, and intend to reinvest the remainder outside the U.S. indefinitely. The determination of the unrecognized U.S. federal deferred income tax liability for undistributed earnings is not practical.
91
OUTFRONT Media Inc.
Notes to Consolidated Financial Statements (Continued)
The following table sets forth the change in the reserve for uncertain tax positions, excluding related accrued interest and penalties.
|
(in millions)
|
||||
|
As of January 1, 2012
|
$
|
5.4
|
|
|
|
Additions for current year tax positions
|
3.8
|
|
||
|
Reductions for prior year tax positions
|
(4.3
|
)
|
||
|
As of December 31, 2012
|
4.9
|
|
||
|
Additions for current year tax positions
|
0.2
|
|
||
|
Reductions for prior year tax positions
|
(1.1
|
)
|
||
|
As of December 31, 2013
|
4.0
|
|
||
|
Additions for current year tax positions
|
0.1
|
|
||
|
Reductions for prior year tax positions
|
(2.9
|
)
|
||
|
As of December 31, 2014
|
$
|
1.2
|
|
|
During 2014, reductions for prior year tax positions includes
$2.1 million
of liabilities which were transferred to CBS pursuant to our tax matters agreement. The reduction in this liability did not impact our provision for income taxes during the year. The reserve for uncertain tax positions of
$1.2 million
as of December 31, 2014, includes
$0.8 million
which would affect our effective income tax rate if and when recognized in future years.
We recognize interest and penalty charges related to the reserve for uncertain tax positions as part of income tax expense. These charges were not material for any of the periods presented.
|
Year Ended December 31,
|
||||||||||||
|
(in millions)
|
2014
|
2013
|
2012
|
|||||||||
|
Net income
|
$
|
306.9
|
|
$
|
143.5
|
|
$
|
113.4
|
|
|||
|
Weighted average shares for basic EPS
|
114.3
|
|
114.3
|
|
114.3
|
|
||||||
|
Dilutive potential shares from grants of RSUs, PRSUs and stock options
(a)
|
0.5
|
|
0.5
|
|
0.5
|
|
||||||
|
Weighted average shares for diluted EPS
|
114.8
|
|
114.8
|
|
114.8
|
|
||||||
|
(a)
|
The potential impact of an aggregate
0.2 million
granted RSUs, PRSUs and stock options for 2014 was antidilutive.
|
Off-Balance Sheet Commitments
Our off-balance sheet commitments primarily consist of operating lease arrangements and guaranteed minimum franchise payments. These arrangements result from our normal course of business and represent obligations that are payable over several years.
We have long-term operating leases for office space, billboard sites and equipment, which expire at various dates. Certain leases contain renewal and escalation clauses.
We have agreements with municipalities and transit operators which entitle us to operate advertising displays within their transit systems, including on the interior and exterior of rail and subway cars and buses, as well as on benches, transit shelters, street kiosks, and transit platforms. Under most of these franchise agreements, the franchisor is entitled to receive the greater of a percentage of the relevant revenues, net of agency fees, or a specified guaranteed minimum annual payment.
92
OUTFRONT Media Inc.
Notes to Consolidated Financial Statements (Continued)
As of December 31, 2014, minimum rental payments under non-cancellable operating leases with terms in excess of one year and guaranteed minimum franchise payments are as follows:
|
(in millions)
|
Operating
Leases
|
Guaranteed
Minimum
Franchise
Payments
|
||||||
|
2015
|
$
|
122.1
|
|
$
|
173.5
|
|
||
|
2016
|
121.7
|
|
56.0
|
|
||||
|
2017
|
101.6
|
|
43.2
|
|
||||
|
2018
|
86.8
|
|
40.9
|
|
||||
|
2019
|
73.8
|
|
27.1
|
|
||||
|
2020 and thereafter
|
432.5
|
|
44.6
|
|
||||
|
Total minimum payments
|
$
|
938.5
|
|
$
|
385.3
|
|
||
Rent expense was
$317.4 million
in 2014,
$292.0 million
in 2013 and
$283.2 million
in 2012, including contingent rent amounts of
$59.5 million
in 2014,
$35.7 million
in 2013 and
$28.6 million
in 2012. Rent expense is primarily reflected in operating expenses on the Consolidated Statements of Operations and includes rent on cancellable leases and leases with terms under one year, as well as contingent rent, none of which are included in the operating lease commitments in the table above.
Letters of Credit
We have indemnification obligations with respect to letters of credit and surety bonds primarily used as security against non-performance in the normal course of business. The outstanding letters of credit and surety bonds approximated
$103.3 million
as of December 31, 2014, and were not recorded on the Consolidated Statements of Financial Position.
Legal Matters
On an ongoing basis, we are engaged in lawsuits and governmental proceedings and respond to various investigations, inquiries, notices and claims from national, state and local governmental and other authorities (collectively, “litigation”). Litigation is inherently uncertain and always difficult to predict. Although it is not possible to predict with certainty the eventual outcome of any litigation, in our opinion, none of our current litigation is expected to have a material adverse effect on our results of operations, financial position or cash flows.
Videri
As of December 31, 2014, pursuant to the Videri Agreement, we agreed to issue
0.9 million
additional shares of our common stock to Videri and J&M, as applicable, upon the satisfaction of certain milestones.
The following tables set forth our financial performance by segment. We manage our operations through
two
segments—United States and International.
|
Year Ended December 31,
|
||||||||||||
|
(in millions)
|
2014
|
2013
|
2012
|
|||||||||
|
Revenues:
|
||||||||||||
|
United States
|
$
|
1,198.8
|
|
$
|
1,130.1
|
|
$
|
1,098.6
|
|
|||
|
International
|
155.0
|
|
163.9
|
|
186.0
|
|
||||||
|
Total revenues
|
$
|
1,353.8
|
|
$
|
1,294.0
|
|
$
|
1,284.6
|
|
|||
We present
Operating income (loss)
before
Depreciation
,
Amortization
,
Net gain (loss) on dispositions,
Stock-based compensation,
Restructuring charges
and
Acquisition costs
(“Adjusted OIBDA”) as the primary measure of profit and loss for our operating segments in accordance with FASB guidance for segment reporting.
93
OUTFRONT Media Inc.
Notes to Consolidated Financial Statements (Continued)
|
Year Ended December 31,
|
||||||||||||
|
(in millions)
|
2014
|
2013
|
2012
|
|||||||||
|
Net income
|
$
|
306.9
|
|
$
|
143.5
|
|
$
|
113.4
|
|
|||
|
(Benefit) provision for income taxes
|
(206.0
|
)
|
96.6
|
|
89.0
|
|
||||||
|
Equity in earnings of investee companies, net of tax
|
(2.9
|
)
|
(2.5
|
)
|
(2.2
|
)
|
||||||
|
Interest expense (income), net
|
84.8
|
|
—
|
|
—
|
|
||||||
|
Other (income) expense, net
|
0.3
|
|
1.2
|
|
1.0
|
|
||||||
|
Operating income
|
183.1
|
|
238.8
|
|
201.2
|
|
||||||
|
Restructuring charges
(a)
|
9.8
|
|
—
|
|
2.5
|
|
||||||
|
Acquisition costs
(a)
|
10.4
|
|
—
|
|
—
|
|
||||||
|
Net gain on dispositions
|
(2.5
|
)
|
(27.3
|
)
|
2.2
|
|
||||||
|
Depreciation and amortization
|
202.2
|
|
195.8
|
|
196.8
|
|
||||||
|
Stock-based compensation
(a)
|
10.4
|
|
7.5
|
|
5.7
|
|
||||||
|
Total Adjusted OIBDA
|
$
|
413.4
|
|
$
|
414.8
|
|
$
|
408.4
|
|
|||
|
Adjusted OIBDA:
|
||||||||||||
|
United States
|
$
|
416.2
|
|
$
|
406.4
|
|
$
|
385.4
|
|
|||
|
International
|
24.3
|
|
29.1
|
|
30.5
|
|
||||||
|
Corporate
|
(27.1
|
)
|
(20.7
|
)
|
(7.5
|
)
|
||||||
|
Total Adjusted OIBDA
|
$
|
413.4
|
|
$
|
414.8
|
|
$
|
408.4
|
|
|||
|
(a)
|
In 2014, restructuring charges (including stock-based compensation of
$5.6 million
), costs related to the Acquisition and stock-based compensation are classified as Corporate expense.
|
|
Year Ended December 31,
|
||||||||||||
|
(in millions)
|
2014
|
2013
|
2012
|
|||||||||
|
Operating income (loss):
|
||||||||||||
|
U.S.
|
$
|
244.3
|
|
$
|
267.1
|
|
$
|
216.4
|
|
|||
|
International
|
(3.5
|
)
|
(0.1
|
)
|
(2.0
|
)
|
||||||
|
Corporate
|
(57.7
|
)
|
(28.2
|
)
|
(13.2
|
)
|
||||||
|
Total operating income
|
$
|
183.1
|
|
$
|
238.8
|
|
$
|
201.2
|
|
|||
|
Net (gain) loss on dispositions:
|
||||||||||||
|
U.S.
|
$
|
(2.5
|
)
|
$
|
(27.5
|
)
|
$
|
1.6
|
|
|||
|
International
|
—
|
|
0.2
|
|
0.6
|
|
||||||
|
Total gain on dispositions
|
$
|
(2.5
|
)
|
$
|
(27.3
|
)
|
$
|
2.2
|
|
|||
|
Depreciation and amortization:
|
||||||||||||
|
U.S.
|
$
|
174.4
|
|
$
|
166.8
|
|
$
|
165.6
|
|
|||
|
International
|
27.8
|
|
29.0
|
|
31.2
|
|
||||||
|
Total depreciation and amortization
|
$
|
202.2
|
|
$
|
195.8
|
|
$
|
196.8
|
|
|||
|
Capital expenditures:
|
||||||||||||
|
U.S.
|
$
|
56.8
|
|
$
|
54.1
|
|
$
|
42.5
|
|
|||
|
International
|
7.4
|
|
6.8
|
|
5.7
|
|
||||||
|
Total capital expenditures
|
$
|
64.2
|
|
$
|
60.9
|
|
$
|
48.2
|
|
|||
94
OUTFRONT Media Inc.
Notes to Consolidated Financial Statements (Continued)
|
As of December 31,
|
||||||||||||
|
(in millions)
|
2014
|
2013
|
2012
|
|||||||||
|
Assets:
|
||||||||||||
|
U.S.
|
$
|
3,704.2
|
|
$
|
3,027.6
|
|
$
|
3,114.4
|
|
|||
|
International
|
270.4
|
|
327.9
|
|
350.5
|
|
||||||
|
Corporate
|
49.0
|
|
—
|
|
—
|
|
||||||
|
Total assets
|
$
|
4,023.6
|
|
$
|
3,355.5
|
|
$
|
3,464.9
|
|
|||
|
Year Ended December 31,
|
||||||||||||
|
(in millions)
|
2014
|
2013
|
2012
|
|||||||||
|
Revenues
(a)
:
|
||||||||||||
|
United States
|
$
|
1,198.8
|
|
$
|
1,130.1
|
|
$
|
1,098.6
|
|
|||
|
Canada
|
82.5
|
|
84.7
|
|
99.2
|
|
||||||
|
Latin America
|
72.5
|
|
79.2
|
|
86.8
|
|
||||||
|
Total revenues
|
$
|
1,353.8
|
|
$
|
1,294.0
|
|
$
|
1,284.6
|
|
|||
|
(a)
|
Revenues classifications are based on customers’ locations.
|
|
As of December 31,
|
||||||||||||
|
(in millions)
|
2014
|
2013
|
2012
|
|||||||||
|
Long-lived assets
(a)
:
|
||||||||||||
|
United States
|
$
|
3,423.6
|
|
$
|
2,768.5
|
|
2,782.7
|
|
||||
|
Canada
|
112.0
|
|
138.1
|
|
193.7
|
|
||||||
|
Latin America
|
94.5
|
|
107.6
|
|
159.3
|
|
||||||
|
Total long-lived assets
|
$
|
3,630.1
|
|
$
|
3,014.2
|
|
$
|
3,135.7
|
|
|||
|
(a)
|
Reflects total assets less current assets, investments and non-current deferred tax assets.
|
95
OUTFRONT Media Inc.
Notes to Consolidated Financial Statements (Continued)
We and our material existing and future direct and indirect
100%
owned domestic subsidiaries (except the Borrowers under the Senior Credit Facilities) guarantee the obligations under the Term Loan and the Revolving Credit Facility. The Senior Notes and New Senior Notes are fully and unconditionally, and jointly and severally guaranteed on a senior unsecured basis by us and each of our direct and indirect wholly owned domestic subsidiaries that guarantees the Senior Credit Facilities (see Note 8.
Long-Term Debt
). The Parent Company, OUTFRONT Media Inc., and the Subsidiary Issuer, Outfront Media Capital LLC, were formed in preparation for the split-off. The balances and activity with respect to these entities were minimal prior to our incurrence of indebtedness pursuant to the Senior Credit Facilities and the Senior Notes in January 2014. Outfront Media Capital Corporation, which was also formed in preparation for the split-off, is a co-issuer finance subsidiary with no assets or liabilities, and therefore has not been included in the tables below. The following condensed consolidating schedules present financial information on a combined basis in conformity with the SEC’s Regulation S-X, Rule 3-10.
|
As of December 31, 2014
|
||||||||||||||||||||||||
|
(in millions)
|
Parent Company
|
Subsidiary Issuer
|
Guarantor Subsidiaries
|
Non-Guarantor Subsidiaries
|
Eliminations
|
Consolidated
|
||||||||||||||||||
|
Current assets:
|
||||||||||||||||||||||||
|
Cash and cash equivalents
|
$
|
—
|
|
$
|
11.5
|
|
$
|
8.8
|
|
$
|
8.2
|
|
$
|
—
|
|
$
|
28.5
|
|
||||||
|
Receivables, less allowances
|
—
|
|
—
|
|
186.5
|
|
31.0
|
|
—
|
|
217.5
|
|
||||||||||||
|
Other current assets
|
—
|
|
5.3
|
|
83.5
|
|
20.5
|
|
—
|
|
109.3
|
|
||||||||||||
|
Total current assets
|
—
|
|
16.8
|
|
278.8
|
|
59.7
|
|
—
|
|
355.3
|
|
||||||||||||
|
Property and equipment, net
|
—
|
|
—
|
|
683.3
|
|
99.6
|
|
—
|
|
782.9
|
|
||||||||||||
|
Goodwill
|
—
|
|
—
|
|
2,050.6
|
|
103.6
|
|
—
|
|
2,154.2
|
|
||||||||||||
|
Intangible assets
|
—
|
|
—
|
|
633.0
|
|
0.2
|
|
—
|
|
633.2
|
|
||||||||||||
|
Investment in subsidiaries
|
1,445.5
|
|
3,613.0
|
|
208.1
|
|
—
|
|
(5,266.6
|
)
|
—
|
|
||||||||||||
|
Other assets
|
—
|
|
31.2
|
|
59.5
|
|
7.3
|
|
—
|
|
98.0
|
|
||||||||||||
|
Intercompany
|
—
|
|
—
|
|
75.1
|
|
62.9
|
|
(138.0
|
)
|
—
|
|
||||||||||||
|
Total assets
|
$
|
1,445.5
|
|
$
|
3,661.0
|
|
$
|
3,988.4
|
|
$
|
333.3
|
|
$
|
(5,404.6
|
)
|
$
|
4,023.6
|
|
||||||
|
Total current liabilities
|
$
|
—
|
|
$
|
17.9
|
|
$
|
219.1
|
|
$
|
18.2
|
|
$
|
—
|
|
$
|
255.2
|
|
||||||
|
Long-term debt
|
—
|
|
2,197.6
|
|
0.7
|
|
—
|
|
—
|
|
2,198.3
|
|
||||||||||||
|
Deferred income tax liabilities, net
|
—
|
|
—
|
|
—
|
|
17.2
|
|
—
|
|
17.2
|
|
||||||||||||
|
Asset retirement obligation
|
—
|
|
—
|
|
28.3
|
|
8.3
|
|
—
|
|
36.6
|
|
||||||||||||
|
Deficit in excess of investment of subsidiaries
|
—
|
|
—
|
|
2,167.5
|
|
—
|
|
(2,167.5
|
)
|
—
|
|
||||||||||||
|
Other liabilities
|
—
|
|
—
|
|
64.4
|
|
6.4
|
|
—
|
|
70.8
|
|
||||||||||||
|
Intercompany
|
—
|
|
—
|
|
62.9
|
|
75.1
|
|
(138.0
|
)
|
—
|
|
||||||||||||
|
Total liabilities
|
—
|
|
2,215.5
|
|
2,542.9
|
|
125.2
|
|
(2,305.5
|
)
|
2,578.1
|
|
||||||||||||
|
Total stockholders’ equity
|
1,445.5
|
|
1,445.5
|
|
1,445.5
|
|
208.1
|
|
(3,099.1
|
)
|
1,445.5
|
|
||||||||||||
|
Total liabilities and stockholders’ equity
|
$
|
1,445.5
|
|
$
|
3,661.0
|
|
$
|
3,988.4
|
|
$
|
333.3
|
|
$
|
(5,404.6
|
)
|
$
|
4,023.6
|
|
||||||
96
OUTFRONT Media Inc.
Notes to Consolidated Financial Statements (Continued)
|
As of December 31, 2013
|
||||||||||||||||||||||||
|
(in millions)
|
Parent Company
|
Subsidiary Issuer
|
Guarantor Subsidiaries
|
Non-Guarantor Subsidiaries
|
Eliminations
|
Consolidated
|
||||||||||||||||||
|
Current assets:
|
||||||||||||||||||||||||
|
Cash and cash equivalents
|
$
|
—
|
|
$
|
—
|
|
$
|
2.1
|
|
$
|
27.7
|
|
$
|
—
|
|
$
|
29.8
|
|
||||||
|
Receivables, less allowances
|
—
|
|
—
|
|
146.0
|
|
32.8
|
|
—
|
|
178.8
|
|
||||||||||||
|
Other current assets
|
—
|
|
—
|
|
89.1
|
|
19.5
|
|
—
|
|
108.6
|
|
||||||||||||
|
Total current assets
|
—
|
|
—
|
|
237.2
|
|
80.0
|
|
—
|
|
317.2
|
|
||||||||||||
|
Property and equipment, net
|
—
|
|
—
|
|
628.1
|
|
127.3
|
|
—
|
|
755.4
|
|
||||||||||||
|
Goodwill
|
—
|
|
—
|
|
1,751.6
|
|
114.1
|
|
—
|
|
1,865.7
|
|
||||||||||||
|
Intangible assets
|
—
|
|
—
|
|
364.2
|
|
0.2
|
|
—
|
|
364.4
|
|
||||||||||||
|
Investment in subsidiaries
|
—
|
|
—
|
|
232.9
|
|
—
|
|
(232.9
|
)
|
—
|
|
||||||||||||
|
Other assets
|
—
|
|
—
|
|
46.5
|
|
6.3
|
|
—
|
|
52.8
|
|
||||||||||||
|
Intercompany
|
—
|
|
—
|
|
66.0
|
|
55.7
|
|
(121.7
|
)
|
—
|
|
||||||||||||
|
Total assets
|
$
|
—
|
|
$
|
—
|
|
$
|
3,326.5
|
|
$
|
383.6
|
|
$
|
(354.6
|
)
|
$
|
3,355.5
|
|
||||||
|
Total current liabilities
|
$
|
—
|
|
$
|
—
|
|
$
|
168.3
|
|
$
|
43.9
|
|
$
|
—
|
|
$
|
212.2
|
|
||||||
|
Deferred income tax liabilities, net
|
—
|
|
—
|
|
259.4
|
|
29.1
|
|
—
|
|
288.5
|
|
||||||||||||
|
Asset retirement obligation
|
—
|
|
—
|
|
23.1
|
|
8.6
|
|
—
|
|
31.7
|
|
||||||||||||
|
Other liabilities
|
—
|
|
—
|
|
65.6
|
|
3.1
|
|
—
|
|
68.7
|
|
||||||||||||
|
Intercompany
|
—
|
|
—
|
|
55.7
|
|
66.0
|
|
(121.7
|
)
|
—
|
|
||||||||||||
|
Total liabilities
|
—
|
|
—
|
|
572.1
|
|
150.7
|
|
(121.7
|
)
|
601.1
|
|
||||||||||||
|
Total invested equity
|
—
|
|
—
|
|
2,754.4
|
|
232.9
|
|
(232.9
|
)
|
2,754.4
|
|
||||||||||||
|
Total liabilities and invested equity
|
$
|
—
|
|
$
|
—
|
|
$
|
3,326.5
|
|
$
|
383.6
|
|
$
|
(354.6
|
)
|
$
|
3,355.5
|
|
||||||
97
OUTFRONT Media Inc.
Notes to Consolidated Financial Statements (Continued)
|
Year Ended December 31, 2014
|
||||||||||||||||||||||||
|
(in millions)
|
Parent Company
|
Subsidiary Issuer
|
Guarantor Subsidiaries
|
Non-Guarantor Subsidiaries
|
Eliminations
|
Consolidated
|
||||||||||||||||||
|
Revenues:
|
||||||||||||||||||||||||
|
Billboard
|
$
|
—
|
|
$
|
—
|
|
851.0
|
|
121.1
|
|
$
|
—
|
|
$
|
972.1
|
|
||||||||
|
Transit and other
|
—
|
|
—
|
|
347.8
|
|
33.9
|
|
—
|
|
381.7
|
|
||||||||||||
|
Total revenues
|
—
|
|
—
|
|
1,198.8
|
|
155.0
|
|
—
|
|
1,353.8
|
|
||||||||||||
|
Expenses:
|
||||||||||||||||||||||||
|
Operating
|
—
|
|
—
|
|
626.1
|
|
100.4
|
|
—
|
|
726.5
|
|
||||||||||||
|
Selling, general and administrative
|
1.3
|
|
—
|
|
192.7
|
|
30.3
|
|
—
|
|
224.3
|
|
||||||||||||
|
Restructuring charges
|
—
|
|
—
|
|
9.8
|
|
—
|
|
—
|
|
9.8
|
|
||||||||||||
|
Acquisition costs
|
—
|
|
—
|
|
10.4
|
|
—
|
|
—
|
|
10.4
|
|
||||||||||||
|
Net (gain) loss on dispositions
|
—
|
|
—
|
|
(2.5
|
)
|
—
|
|
—
|
|
(2.5
|
)
|
||||||||||||
|
Depreciation
|
—
|
|
—
|
|
84.5
|
|
22.7
|
|
—
|
|
107.2
|
|
||||||||||||
|
Amortization
|
—
|
|
—
|
|
89.9
|
|
5.1
|
|
—
|
|
95.0
|
|
||||||||||||
|
Total expenses
|
1.3
|
|
—
|
|
1,010.9
|
|
158.5
|
|
—
|
|
1,170.7
|
|
||||||||||||
|
Operating income (loss)
|
(1.3
|
)
|
—
|
|
187.9
|
|
(3.5
|
)
|
—
|
|
183.1
|
|
||||||||||||
|
Interest income (expense), net
|
—
|
|
(84.8
|
)
|
(0.2
|
)
|
0.2
|
|
—
|
|
(84.8
|
)
|
||||||||||||
|
Other income (expenses)
|
—
|
|
—
|
|
—
|
|
(0.3
|
)
|
—
|
|
(0.3
|
)
|
||||||||||||
|
Income before income taxes and equity earnings of investee
|
(1.3
|
)
|
(84.8
|
)
|
187.7
|
|
(3.6
|
)
|
—
|
|
98.0
|
|
||||||||||||
|
Provision for income taxes
|
—
|
|
—
|
|
209.7
|
|
(3.7
|
)
|
—
|
|
206.0
|
|
||||||||||||
|
Equity in earnings of investee companies, net of tax
|
308.2
|
|
393.0
|
|
(89.2
|
)
|
0.7
|
|
(609.8
|
)
|
2.9
|
|
||||||||||||
|
Net income
|
$
|
306.9
|
|
$
|
308.2
|
|
$
|
308.2
|
|
$
|
(6.6
|
)
|
$
|
(609.8
|
)
|
$
|
306.9
|
|
||||||
|
Net income
|
$
|
306.9
|
|
$
|
308.2
|
|
$
|
308.2
|
|
$
|
(6.6
|
)
|
$
|
(609.8
|
)
|
$
|
306.9
|
|
||||||
|
Other comprehensive income (loss), net of tax:
|
||||||||||||||||||||||||
|
Cumulative translation adjustments
|
(10.7
|
)
|
(10.7
|
)
|
(10.7
|
)
|
(10.7
|
)
|
32.1
|
|
(10.7
|
)
|
||||||||||||
|
Net actuarial loss
|
(3.1
|
)
|
(3.1
|
)
|
(3.1
|
)
|
(2.9
|
)
|
9.1
|
|
(3.1
|
)
|
||||||||||||
|
Deferred tax rate adjustment
|
(1.2
|
)
|
(1.2
|
)
|
(1.2
|
)
|
(1.2
|
)
|
3.6
|
|
(1.2
|
)
|
||||||||||||
|
Total other comprehensive income (loss), net of tax
|
(15.0
|
)
|
(15.0
|
)
|
(15.0
|
)
|
(14.8
|
)
|
44.8
|
|
(15.0
|
)
|
||||||||||||
|
Total comprehensive income
|
$
|
291.9
|
|
$
|
293.2
|
|
$
|
293.2
|
|
$
|
(21.4
|
)
|
$
|
(565.0
|
)
|
$
|
291.9
|
|
||||||
98
OUTFRONT Media Inc.
Notes to Consolidated Financial Statements (Continued)
|
Year Ended December 31, 2013
|
||||||||||||||||||||||||
|
(in millions)
|
Parent Company
|
Subsidiary Issuer
|
Guarantor Subsidiaries
|
Non-Guarantor Subsidiaries
|
Eliminations
|
Consolidated
|
||||||||||||||||||
|
Revenues:
|
||||||||||||||||||||||||
|
Billboard
|
$
|
—
|
|
$
|
—
|
|
$
|
796.6
|
|
$
|
129.1
|
|
$
|
—
|
|
$
|
925.7
|
|
||||||
|
Transit and other
|
—
|
|
—
|
|
333.5
|
|
34.8
|
|
—
|
|
368.3
|
|
||||||||||||
|
Total revenues
|
—
|
|
—
|
|
1,130.1
|
|
163.9
|
|
—
|
|
1,294.0
|
|
||||||||||||
|
Expenses:
|
||||||||||||||||||||||||
|
Operating
|
—
|
|
—
|
|
584.2
|
|
102.7
|
|
—
|
|
686.9
|
|
||||||||||||
|
Selling, general and administrative
|
—
|
|
—
|
|
167.7
|
|
32.1
|
|
—
|
|
199.8
|
|
||||||||||||
|
Net (gain) loss on dispositions
|
—
|
|
—
|
|
(27.5
|
)
|
0.2
|
|
—
|
|
(27.3
|
)
|
||||||||||||
|
Depreciation
|
—
|
|
—
|
|
80.7
|
|
23.8
|
|
—
|
|
104.5
|
|
||||||||||||
|
Amortization
|
—
|
|
—
|
|
86.1
|
|
5.2
|
|
—
|
|
91.3
|
|
||||||||||||
|
Total expenses
|
—
|
|
—
|
|
891.2
|
|
164.0
|
|
—
|
|
1,055.2
|
|
||||||||||||
|
Operating income
|
—
|
|
—
|
|
238.9
|
|
(0.1
|
)
|
—
|
|
238.8
|
|
||||||||||||
|
Other income (expenses)
|
—
|
|
—
|
|
(0.2
|
)
|
(1.0
|
)
|
—
|
|
(1.2
|
)
|
||||||||||||
|
Income before income taxes and equity earnings of investee
|
—
|
|
—
|
|
238.7
|
|
(1.1
|
)
|
—
|
|
237.6
|
|
||||||||||||
|
Provision for income taxes
|
—
|
|
—
|
|
(93.3
|
)
|
(3.3
|
)
|
—
|
|
(96.6
|
)
|
||||||||||||
|
Equity in earnings of investee companies, net of tax
|
—
|
|
—
|
|
(1.9
|
)
|
—
|
|
4.4
|
|
2.5
|
|
||||||||||||
|
Net income
|
$
|
—
|
|
$
|
—
|
|
$
|
143.5
|
|
$
|
(4.4
|
)
|
$
|
4.4
|
|
$
|
143.5
|
|
||||||
|
Net income
|
$
|
—
|
|
$
|
—
|
|
$
|
143.5
|
|
$
|
(4.4
|
)
|
$
|
4.4
|
|
$
|
143.5
|
|
||||||
|
Other comprehensive income (loss), net of tax:
|
||||||||||||||||||||||||
|
Cumulative translation adjustments
|
—
|
|
—
|
|
(14.9
|
)
|
(14.9
|
)
|
14.9
|
|
(14.9
|
)
|
||||||||||||
|
Net actuarial loss
|
—
|
|
—
|
|
5.8
|
|
5.6
|
|
(5.6
|
)
|
5.8
|
|
||||||||||||
|
Total other comprehensive income (loss), net of tax
|
—
|
|
—
|
|
(9.1
|
)
|
(9.3
|
)
|
9.3
|
|
(9.1
|
)
|
||||||||||||
|
Total comprehensive income
|
$
|
—
|
|
$
|
—
|
|
$
|
134.4
|
|
$
|
(13.7
|
)
|
$
|
13.7
|
|
$
|
134.4
|
|
||||||
99
OUTFRONT Media Inc.
Notes to Consolidated Financial Statements (Continued)
|
Year Ended December 31, 2012
|
||||||||||||||||||||||||
|
(in millions)
|
Parent Company
|
Subsidiary Issuer
|
Guarantor Subsidiaries
|
Non-Guarantor Subsidiaries
|
Eliminations
|
Consolidated
|
||||||||||||||||||
|
Revenues:
|
||||||||||||||||||||||||
|
Billboard
|
$
|
—
|
|
$
|
—
|
|
$
|
770.7
|
|
$
|
142.9
|
|
$
|
—
|
|
$
|
913.6
|
|
||||||
|
Transit and other
|
—
|
|
—
|
|
327.9
|
|
43.1
|
|
—
|
|
371.0
|
|
||||||||||||
|
Total revenues
|
—
|
|
—
|
|
1,098.6
|
|
186.0
|
|
—
|
|
1,284.6
|
|
||||||||||||
|
Expenses:
|
||||||||||||||||||||||||
|
Operating
|
—
|
|
—
|
|
577.9
|
|
122.2
|
|
—
|
|
700.1
|
|
||||||||||||
|
Selling, general and administrative
|
—
|
|
—
|
|
148.5
|
|
33.3
|
|
—
|
|
181.8
|
|
||||||||||||
|
Restructuring charges
|
—
|
|
—
|
|
1.8
|
|
0.7
|
|
—
|
|
2.5
|
|
||||||||||||
|
Net (gain) loss on dispositions
|
—
|
|
—
|
|
1.6
|
|
0.6
|
|
—
|
|
2.2
|
|
||||||||||||
|
Depreciation
|
—
|
|
—
|
|
80.4
|
|
25.5
|
|
—
|
|
105.9
|
|
||||||||||||
|
Amortization
|
—
|
|
—
|
|
85.2
|
|
5.7
|
|
—
|
|
90.9
|
|
||||||||||||
|
Total expenses
|
—
|
|
—
|
|
895.4
|
|
188.0
|
|
—
|
|
1,083.4
|
|
||||||||||||
|
Operating income (loss)
|
—
|
|
—
|
|
203.2
|
|
(2.0
|
)
|
—
|
|
201.2
|
|
||||||||||||
|
Other income (expenses)
|
—
|
|
—
|
|
(0.1
|
)
|
(0.9
|
)
|
—
|
|
(1.0
|
)
|
||||||||||||
|
Income before income taxes and equity earnings of investee
|
—
|
|
—
|
|
203.1
|
|
(2.9
|
)
|
—
|
|
200.2
|
|
||||||||||||
|
Provision for income taxes
|
—
|
|
—
|
|
(87.3
|
)
|
(1.7
|
)
|
—
|
|
(89.0
|
)
|
||||||||||||
|
Equity in earnings of investee companies, net of tax
|
—
|
|
—
|
|
(2.4
|
)
|
—
|
|
4.6
|
|
2.2
|
|
||||||||||||
|
Net income
|
$
|
—
|
|
$
|
—
|
|
$
|
113.4
|
|
$
|
(4.6
|
)
|
$
|
4.6
|
|
$
|
113.4
|
|
||||||
|
Net income
|
$
|
—
|
|
$
|
—
|
|
$
|
113.4
|
|
$
|
(4.6
|
)
|
$
|
4.6
|
|
$
|
113.4
|
|
||||||
|
Other comprehensive income (loss), net of tax:
|
||||||||||||||||||||||||
|
Cumulative translation adjustments
|
—
|
|
—
|
|
11.0
|
|
11.0
|
|
(11.0
|
)
|
11.0
|
|
||||||||||||
|
Net actuarial loss
|
—
|
|
—
|
|
(1.4
|
)
|
(1.3
|
)
|
1.3
|
|
(1.4
|
)
|
||||||||||||
|
Total other comprehensive income (loss), net of tax
|
—
|
|
—
|
|
9.6
|
|
9.7
|
|
(9.7
|
)
|
9.6
|
|
||||||||||||
|
Total comprehensive income
|
$
|
—
|
|
$
|
—
|
|
$
|
123.0
|
|
$
|
5.1
|
|
$
|
(5.1
|
)
|
$
|
123.0
|
|
||||||
100
OUTFRONT Media Inc.
Notes to Consolidated Financial Statements (Continued)
|
Year Ended December 31, 2014
|
||||||||||||||||||||||||
|
(in millions)
|
Parent Company
|
Subsidiary Issuer
|
Guarantor Subsidiaries
|
Non-Guarantor Subsidiaries
|
Eliminations
|
Consolidated
|
||||||||||||||||||
|
Cash provided by operating activities
|
$
|
(1.3
|
)
|
$
|
(54.8
|
)
|
$
|
330.6
|
|
$
|
(11.7
|
)
|
$
|
—
|
|
$
|
262.8
|
|
||||||
|
Investing activities:
|
||||||||||||||||||||||||
|
Capital expenditures
|
—
|
|
—
|
|
(56.8
|
)
|
(7.4
|
)
|
—
|
|
(64.2
|
)
|
||||||||||||
|
Acquisitions
|
—
|
|
—
|
|
(735.7
|
)
|
—
|
|
—
|
|
(735.7
|
)
|
||||||||||||
|
Investments in investee companies
|
—
|
|
—
|
|
(3.0
|
)
|
—
|
|
—
|
|
(3.0
|
)
|
||||||||||||
|
Proceeds from dispositions
|
—
|
|
—
|
|
4.2
|
|
0.3
|
|
—
|
|
4.5
|
|
||||||||||||
|
Cash used in investing activities
|
—
|
|
—
|
|
(791.3
|
)
|
(7.1
|
)
|
—
|
|
(798.4
|
)
|
||||||||||||
|
Financing activities:
|
||||||||||||||||||||||||
|
Proceeds from IPO
|
615.0
|
|
—
|
|
—
|
|
—
|
|
—
|
|
615.0
|
|
||||||||||||
|
Proceeds from long-term debt borrowings - term loan and senior notes
|
—
|
|
1,598.0
|
|
—
|
|
—
|
|
—
|
|
1,598.0
|
|
||||||||||||
|
Proceeds from long-term debt borrowings - new senior notes
|
—
|
|
599.3
|
|
—
|
|
—
|
|
—
|
|
599.3
|
|
||||||||||||
|
Deferred financing costs
|
—
|
|
(42.7
|
)
|
—
|
|
—
|
|
—
|
|
(42.7
|
)
|
||||||||||||
|
Distribution of debt and IPO proceeds to CBS
|
(515.0
|
)
|
(1,523.8
|
)
|
—
|
|
—
|
|
—
|
|
(2,038.8
|
)
|
||||||||||||
|
Net cash contribution from (distribution to) CBS
|
9.5
|
|
—
|
|
39.8
|
|
—
|
|
—
|
|
49.3
|
|
||||||||||||
|
Dividends
|
(133.2
|
)
|
—
|
|
—
|
|
—
|
|
—
|
|
(133.2
|
)
|
||||||||||||
|
Special dividend
|
(109.5
|
)
|
—
|
|
—
|
|
—
|
|
—
|
|
(109.5
|
)
|
||||||||||||
|
Intercompany
|
134.5
|
|
(564.5
|
)
|
428.4
|
|
1.6
|
|
—
|
|
—
|
|
||||||||||||
|
Other
|
—
|
|
—
|
|
(0.8
|
)
|
—
|
|
—
|
|
(0.8
|
)
|
||||||||||||
|
Cash used in financing activities
|
1.3
|
|
66.3
|
|
467.4
|
|
1.6
|
|
—
|
|
536.6
|
|
||||||||||||
|
Effect of exchange rate on cash and cash equivalents
|
—
|
|
—
|
|
—
|
|
(2.3
|
)
|
—
|
|
(2.3
|
)
|
||||||||||||
|
Net increase (decrease) in cash and cash equivalents
|
—
|
|
11.5
|
|
6.7
|
|
(19.5
|
)
|
—
|
|
(1.3
|
)
|
||||||||||||
|
Cash and cash equivalents at beginning of period
|
—
|
|
—
|
|
2.1
|
|
27.7
|
|
—
|
|
29.8
|
|
||||||||||||
|
Cash and cash equivalents at end of period
|
$
|
—
|
|
$
|
11.5
|
|
$
|
8.8
|
|
$
|
8.2
|
|
$
|
—
|
|
$
|
28.5
|
|
||||||
101
OUTFRONT Media Inc.
Notes to Consolidated Financial Statements (Continued)
|
Year Ended December 31, 2013
|
||||||||||||||||||||||||
|
(in millions)
|
Parent Company
|
Subsidiary Issuer
|
Guarantor Subsidiaries
|
Non-Guarantor Subsidiaries
|
Eliminations
|
Consolidated
|
||||||||||||||||||
|
Cash provided by operating activities
|
$
|
—
|
|
$
|
—
|
|
$
|
268.2
|
|
$
|
12.9
|
|
$
|
—
|
|
$
|
281.1
|
|
||||||
|
Investing activities:
|
||||||||||||||||||||||||
|
Capital expenditures
|
—
|
|
—
|
|
(54.1
|
)
|
(6.8
|
)
|
—
|
|
(60.9
|
)
|
||||||||||||
|
Acquisitions
|
—
|
|
—
|
|
(11.5
|
)
|
—
|
|
—
|
|
(11.5
|
)
|
||||||||||||
|
Proceeds from dispositions
|
—
|
|
—
|
|
28.6
|
|
0.1
|
|
—
|
|
28.7
|
|
||||||||||||
|
Cash used in investing activities
|
—
|
|
—
|
|
(37.0
|
)
|
(6.7
|
)
|
—
|
|
(43.7
|
)
|
||||||||||||
|
Financing activities:
|
||||||||||||||||||||||||
|
Excess tax benefit from stock-based compensation
|
—
|
|
—
|
|
5.8
|
|
—
|
|
—
|
|
5.8
|
|
||||||||||||
|
Net cash (distribution to)/contribution from CBS
|
—
|
|
—
|
|
(244.4
|
)
|
11.8
|
|
—
|
|
(232.6
|
)
|
||||||||||||
|
Other
|
—
|
|
—
|
|
—
|
|
(0.2
|
)
|
—
|
|
(0.2
|
)
|
||||||||||||
|
Cash used in financing activities
|
—
|
|
—
|
|
(238.6
|
)
|
11.6
|
|
—
|
|
(227.0
|
)
|
||||||||||||
|
Effect of exchange rate on cash and cash equivalents
|
—
|
|
—
|
|
—
|
|
(0.8
|
)
|
—
|
|
(0.8
|
)
|
||||||||||||
|
Net increase (decrease) in cash and cash equivalents
|
—
|
|
—
|
|
(7.4
|
)
|
17.0
|
|
—
|
|
9.6
|
|
||||||||||||
|
Cash and cash equivalents at beginning of period
|
—
|
|
—
|
|
9.5
|
|
10.7
|
|
—
|
|
20.2
|
|
||||||||||||
|
Cash and cash equivalents at end of period
|
$
|
—
|
|
$
|
—
|
|
$
|
2.1
|
|
$
|
27.7
|
|
$
|
—
|
|
$
|
29.8
|
|
||||||
|
Year Ended December 31, 2012
|
||||||||||||||||||||||||
|
(in millions)
|
Parent Company
|
Subsidiary Issuer
|
Guarantor Subsidiaries
|
Non-Guarantor Subsidiaries
|
Eliminations
|
Consolidated
|
||||||||||||||||||
|
Cash provided by operating activities
|
$
|
—
|
|
$
|
—
|
|
$
|
277.3
|
|
$
|
28.6
|
|
$
|
—
|
|
$
|
305.9
|
|
||||||
|
Investing activities:
|
||||||||||||||||||||||||
|
Capital expenditures
|
—
|
|
—
|
|
(42.5
|
)
|
(5.7
|
)
|
—
|
|
(48.2
|
)
|
||||||||||||
|
Acquisitions
|
—
|
|
—
|
|
(0.4
|
)
|
—
|
|
—
|
|
(0.4
|
)
|
||||||||||||
|
Proceeds from dispositions
|
—
|
|
—
|
|
0.4
|
|
0.1
|
|
—
|
|
0.5
|
|
||||||||||||
|
Cash used in investing activities
|
—
|
|
—
|
|
(42.5
|
)
|
(5.6
|
)
|
—
|
|
(48.1
|
)
|
||||||||||||
|
Financing activities:
|
||||||||||||||||||||||||
|
Excess tax benefit from stock-based compensation
|
—
|
|
—
|
|
2.9
|
|
—
|
|
—
|
|
2.9
|
|
||||||||||||
|
Net cash distribution to CBS
|
—
|
|
—
|
|
(238.2
|
)
|
(41.5
|
)
|
—
|
|
(279.7
|
)
|
||||||||||||
|
Other
|
—
|
|
—
|
|
—
|
|
(0.2
|
)
|
—
|
|
(0.2
|
)
|
||||||||||||
|
Cash used in financing activities
|
—
|
|
—
|
|
(235.3
|
)
|
(41.7
|
)
|
—
|
|
(277.0
|
)
|
||||||||||||
|
Effect of exchange rate on cash and cash equivalents
|
—
|
|
—
|
|
—
|
|
1.8
|
|
—
|
|
1.8
|
|
||||||||||||
|
Net increase (decrease) in cash and cash equivalents
|
—
|
|
—
|
|
(0.5
|
)
|
(16.9
|
)
|
—
|
|
(17.4
|
)
|
||||||||||||
|
Cash and cash equivalents at beginning of period
|
—
|
|
—
|
|
10.0
|
|
27.6
|
|
—
|
|
37.6
|
|
||||||||||||
|
Cash and cash equivalents at end of period
|
$
|
—
|
|
$
|
—
|
|
$
|
9.5
|
|
$
|
10.7
|
|
$
|
—
|
|
$
|
20.2
|
|
||||||
102
OUTFRONT Media Inc.
Notes to Consolidated Financial Statements (Continued)
As of
March 6, 2015
, we have issued
185,323
shares of our common stock to J&M or Videri, as applicable, in connection with the achievement of milestones under the Videri Agreement.
Our revenues and profits experience seasonality due to seasonal advertising patterns and influences on advertising markets. Typically, our revenues and profits are highest in the fourth quarter, during the holiday shopping season, and lowest in the first quarter, as advertisers cut back on spending following the holiday shopping season.
|
2014
|
||||||||||||||||||||||||
|
(in millions)
|
First
Quarter
|
Second
Quarter
|
Third
Quarter
|
Fourth
Quarter
|
Total
Year
|
|||||||||||||||||||
|
Revenues:
|
||||||||||||||||||||||||
|
United States
|
$
|
255.0
|
|
$
|
291.1
|
|
$
|
296.3
|
|
$
|
356.4
|
|
$
|
1,198.8
|
|
|||||||||
|
International
|
32.9
|
|
43.3
|
|
40.2
|
|
38.6
|
|
155.0
|
|
||||||||||||||
|
Total revenues
|
$
|
287.9
|
|
$
|
334.4
|
|
$
|
336.5
|
|
$
|
395.0
|
|
(b)
|
$
|
1,353.8
|
|
||||||||
|
Adjusted OIBDA:
|
||||||||||||||||||||||||
|
United States
|
$
|
80.3
|
|
$
|
106.4
|
|
$
|
106.3
|
|
123.2
|
|
416.2
|
|
|||||||||||
|
International
|
1.1
|
|
9.5
|
|
6.3
|
|
7.4
|
|
24.3
|
|
||||||||||||||
|
Corporate
|
(5.8
|
)
|
(5.6
|
)
|
(5.7
|
)
|
(10.0
|
)
|
(27.1
|
)
|
||||||||||||||
|
Total Adjusted OIBDA
|
75.6
|
|
110.3
|
|
106.9
|
|
120.6
|
|
(b)
|
413.4
|
|
|||||||||||||
|
Restructuring charges - severance only
|
—
|
|
—
|
|
(2.7
|
)
|
(1.5
|
)
|
(4.2
|
)
|
||||||||||||||
|
Acquisition costs
|
—
|
|
—
|
|
(1.4
|
)
|
(9.0
|
)
|
(b)
|
(10.4
|
)
|
|||||||||||||
|
Net gain (loss) on dispositions
|
0.9
|
|
—
|
|
0.5
|
|
1.1
|
|
2.5
|
|
||||||||||||||
|
Depreciation
|
(26.1
|
)
|
(26.5
|
)
|
(26.7
|
)
|
(27.9
|
)
|
(107.2
|
)
|
||||||||||||||
|
Amortization
|
(21.9
|
)
|
(22.6
|
)
|
(22.8
|
)
|
(27.7
|
)
|
(95.0
|
)
|
||||||||||||||
|
Stock-based compensation
|
(1.8
|
)
|
(2.9
|
)
|
(6.2
|
)
|
(5.1
|
)
|
(16.0
|
)
|
||||||||||||||
|
Total operating income
|
$
|
26.7
|
|
$
|
58.3
|
|
$
|
47.6
|
|
$
|
50.5
|
|
(b)
|
$
|
183.1
|
|
||||||||
|
Operating income (loss):
|
||||||||||||||||||||||||
|
United States
|
$
|
40.0
|
|
$
|
64.2
|
|
$
|
64.3
|
|
75.8
|
|
244.3
|
|
|||||||||||
|
International
|
(5.7
|
)
|
(c)
|
2.6
|
|
(c)
|
(0.7
|
)
|
(c)
|
0.3
|
|
(c)
|
(3.5
|
)
|
||||||||||
|
Corporate
|
(7.6
|
)
|
(d)
|
(8.5
|
)
|
(d)
|
(16.0
|
)
|
(d)
|
(25.6
|
)
|
(d)
|
(57.7
|
)
|
||||||||||
|
Total operating income
|
$
|
26.7
|
|
$
|
58.3
|
|
$
|
47.6
|
|
$
|
50.5
|
|
(b)
|
$
|
183.1
|
|
||||||||
|
Net income
|
$
|
8.4
|
|
$
|
22.4
|
|
$
|
248.3
|
|
(a)
|
$
|
27.8
|
|
(b)
|
$
|
306.9
|
|
|||||||
|
(a)
|
During the third quarter of 2014, we recorded a reversal of
$232.3 million
, representing substantially all
Deferred income tax liabilities, net
, as a result of our REIT conversion (see Note 15.
Income Taxes
).
|
|
(b)
|
In the fourth quarter of 2014, we issued the New Senior Notes (see Note 8.
Long-Term Debt
) and completed the Acquisition (see Note 12.
Acquisition
) and also reversed an additional
$3.3 million
of
Deferred income tax liabilities, net,
related to our REIT conversion.
|
|
(c)
|
We incurred incremental U.S. stand-alone costs of
$1.7 million
during the first quarter of 2014;
$2.1 million
during the second quarter of 2014,
$2.7 million
during the third quarter of 2014 and
$2.7 million
during the fourth quarter of 2014.
|
|
(d)
|
We incurred incremental corporate stand-alone costs of
$2.1 million
during the first quarter of 2014;
$3.1 million
during the second quarter of 2014,
$2.5 million
during the third quarter of 2014 and
$2.7 million
during the fourth quarter of 2014.
|
103
OUTFRONT Media Inc.
Notes to Consolidated Financial Statements (Continued)
|
2013
|
||||||||||||||||||||||||
|
(in millions)
|
First
Quarter
|
Second
Quarter
|
Third
Quarter
|
Fourth
Quarter
|
Total
Year
|
|||||||||||||||||||
|
Revenues:
|
||||||||||||||||||||||||
|
United States
|
$
|
245.2
|
|
$
|
285.9
|
|
$
|
296.5
|
|
$
|
302.5
|
|
$
|
1,130.1
|
|
|||||||||
|
International
|
34.0
|
|
46.8
|
|
41.7
|
|
41.4
|
|
163.9
|
|
||||||||||||||
|
Total revenues
|
$
|
279.2
|
|
$
|
332.7
|
|
$
|
338.2
|
|
$
|
343.9
|
|
$
|
1,294.0
|
|
|||||||||
|
Adjusted OIBDA:
|
||||||||||||||||||||||||
|
United States
|
$
|
80.1
|
|
$
|
106.5
|
|
$
|
113.6
|
|
$
|
106.2
|
|
$
|
406.4
|
|
|||||||||
|
International
|
0.6
|
|
11.5
|
|
7.9
|
|
9.1
|
|
29.1
|
|
||||||||||||||
|
Corporate
|
(5.3
|
)
|
(4.9
|
)
|
(5.4
|
)
|
(5.1
|
)
|
(20.7
|
)
|
||||||||||||||
|
Total Adjusted OIBDA
|
75.4
|
|
113.1
|
|
116.1
|
|
110.2
|
|
414.8
|
|
||||||||||||||
|
Net gain (loss) on dispositions
|
9.8
|
|
(a)
|
(0.1
|
)
|
0.1
|
|
17.5
|
|
(b)
|
27.3
|
|
||||||||||||
|
Depreciation
|
(26.0
|
)
|
(25.9
|
)
|
(26.4
|
)
|
(26.2
|
)
|
(104.5
|
)
|
||||||||||||||
|
Amortization
|
(22.9
|
)
|
(22.7
|
)
|
(22.6
|
)
|
(23.1
|
)
|
(91.3
|
)
|
||||||||||||||
|
Stock-based compensation
|
(1.6
|
)
|
(1.6
|
)
|
(2.6
|
)
|
(1.7
|
)
|
(7.5
|
)
|
||||||||||||||
|
Total operating income
|
$
|
34.7
|
|
$
|
62.8
|
|
$
|
64.6
|
|
$
|
76.7
|
|
$
|
238.8
|
|
|||||||||
|
Operating income (loss):
|
||||||||||||||||||||||||
|
United States
|
$
|
48.2
|
|
$
|
65.2
|
|
$
|
72.0
|
|
$
|
81.7
|
|
$
|
267.1
|
|
|||||||||
|
International
|
(6.6
|
)
|
4.1
|
|
0.6
|
|
1.8
|
|
(0.1
|
)
|
||||||||||||||
|
Corporate
|
(6.9
|
)
|
(6.5
|
)
|
(8.0
|
)
|
(6.8
|
)
|
(28.2
|
)
|
||||||||||||||
|
Total operating income
|
$
|
34.7
|
|
$
|
62.8
|
|
$
|
64.6
|
|
$
|
76.7
|
|
$
|
238.8
|
|
|||||||||
|
Net income
|
$
|
19.9
|
|
$
|
36.4
|
|
$
|
37.2
|
|
$
|
50.0
|
|
$
|
143.5
|
|
|||||||||
|
(a)
|
During the first quarter of 2013, we exchanged most of our billboards in Salt Lake City for billboards in New Jersey resulting in a gain of
$9.8 million
.
|
|
(b)
|
During the fourth quarter of 2013, we sold
50%
of our transit shelter operations in Los Angeles, and we and the buyer each subsequently contributed our respective
50%
interests in these operations to a 50/50 joint venture they own together. This transaction resulted in a gain of
$17.5 million
.
|
104
None.
Evaluation of Disclosure Controls and Procedures
As required by Rule 13a-15(b) of the Exchange Act, our management has carried out an evaluation, under the supervision of and with the participation of our Chief Executive Officer and Chief Financial Officer, of the effectiveness of the design and operation of our disclosure controls and procedures, as defined in Rule 13a-15(e) of the Exchange Act, as of the end of the period covered by this report. Based on the foregoing, our Chief Executive Officer and Chief Financial Officer concluded that our disclosure controls and procedures for the periods covered by this report were effective to provide reasonable assurance that information required to be disclosed by us in reports that we file or submit under the Exchange Act is recorded, processed, summarized and reported within the time periods specified in Securities and Exchange Commission’s rules and forms and is accumulated and communicated to our management, including our Chief Executive Officer and Chief Financial Officer, as appropriate to allow timely decisions regarding required disclosure.
Management’s Report on Internal Control Over Financial Reporting
This Annual Report on Form 10-K does not include a report of management’s assessment regarding internal control over financial reporting or an attestation report of our registered public accounting firm due to a transition period established by the rules of the Securities and Exchange Commission for newly public companies.
None.
The Company has adopted a Business Conduct Statement that applies to all executive officers, employees and directors of the Company. In addition, the Company has adopted a Supplemental Code of Ethics applicable to our principal executive officer, principal financial officer and principal accounting officer or controller or persons performing similar functions. Both the Business Conduct Statement and the Supplemental Code of Ethics are available in the Investor Relations section of our website at www.outfrontmedia.com. We intend to satisfy the disclosure requirements under Item 5.05 of Form 8-K regarding any amendment to, or waiver from, a provision of the Business Conduct Statement or the Supplemental Code of Ethics that applies to our principal executive officer, principal financial officer or principal accounting officer or controller or persons performing similar functions, and relates to any element of the definition of code of ethics set forth in Item 406(b) of Regulation S-K, by posting such information on our website at www.outfrontmedia.com.
All additional information required by this item is incorporated by reference to our Proxy Statement for the 2015 Annual Meeting of Stockholders to be filed with the SEC within 120 days of the fiscal year ended December 31, 2014.
The information required by this item is incorporated by reference to our Proxy Statement for the 2015 Annual Meeting of Stockholders to be filed with the SEC within 120 days of the fiscal year ended December 31, 2014.
The information required by this item is incorporated by reference to our Proxy Statement for the 2015 Annual Meeting of Stockholders to be filed with the SEC within 120 days of the fiscal year ended December 31, 2014.
The information required by this item is incorporated by reference to our Proxy Statement for the 2015 Annual Meeting of Stockholders to be filed with the SEC within 120 days of the fiscal year ended December 31, 2014.
105
The information required by this item is incorporated by reference to our Proxy Statement for the 2015 Annual Meeting of Stockholders to be filed with the SEC within 120 days of the fiscal year ended December 31, 2014.
(a)(1)
Financial Statements.
The financial statements filed as part of this Annual Report on Form 10-K are listed in the index to the financial statements, which is included in Part II, Item 8, of this Annual Report on Form 10-K.
(a)(2)
Financial Statement Schedules
. The following financial statement schedules should be read in conjunction with the consolidated financial statements included in Part II, Item 8, of this Annual Report on Form 10-K.
All other schedules for which provision is made in the applicable accounting regulation of the SEC are not required under the related instructions or are inapplicable, and therefore have been omitted.
106
OUTFRONT Media Inc.
Schedule II—Valuation and Qualifying Accounts
(in millions)
|
Col. A
|
Col. B
|
Col. C
|
Col. D
|
Col. E
|
||||||||||||||||||||
|
Description
|
Balance at
Beginning
of Period
|
Balance
Acquired through
Acquisitions
|
Charged to
Costs and
Expenses
|
Charged
to Other
Accounts
(a)
|
Deductions
|
Balance at
End of
Period
|
||||||||||||||||||
|
Allowance for doubtful accounts:
|
||||||||||||||||||||||||
|
Year ended December 31, 2014
|
$
|
15.7
|
|
$
|
—
|
|
$
|
2.9
|
|
$
|
(0.7
|
)
|
$
|
3.7
|
|
$
|
14.2
|
|
||||||
|
Year ended December 31, 2013
|
$
|
19.3
|
|
$
|
—
|
|
$
|
0.4
|
|
$
|
—
|
|
$
|
4.0
|
|
$
|
15.7
|
|
||||||
|
Year ended December 31, 2012
|
$
|
22.4
|
|
$
|
—
|
|
$
|
3.1
|
|
$
|
0.2
|
|
$
|
6.4
|
|
$
|
19.3
|
|
||||||
|
Valuation allowance on deferred tax assets:
|
||||||||||||||||||||||||
|
Year ended December 31, 2014
|
$
|
10.1
|
|
$
|
—
|
|
$
|
0.5
|
|
$
|
—
|
|
$
|
3.7
|
|
$
|
6.9
|
|
||||||
|
Year ended December 31, 2013
|
$
|
8.0
|
|
$
|
—
|
|
$
|
3.0
|
|
$
|
—
|
|
$
|
0.9
|
|
$
|
10.1
|
|
||||||
|
Year ended December 31, 2012
|
$
|
7.5
|
|
$
|
—
|
|
$
|
0.7
|
|
$
|
—
|
|
$
|
0.2
|
|
$
|
8.0
|
|
||||||
|
(a)
|
Reflects change in allowance related to foreign currency translation adjustments.
|
107
OUTFRONT Media, Inc.
SCHEDULE III – Schedule of Real Estate and
Accumulated Depreciation
as of
December 31, 2014
(in millions)
|
Initial Cost
|
Cost
Capitalized
Subsequent
to
Acquisition
|
Gross Carrying Amount at December 31, 2014
(3)
|
|||||||||||||||||||||||||||||||||||
|
Description
(1)
|
Encumbrances
|
Land
|
Structures and Improvements
|
Land
|
Structures and Improvements
|
Total
|
Accumulated
Depreciation
|
Construction
Date
|
Acquisition
Date
|
Useful
Lives
|
|||||||||||||||||||||||||||
|
Structures added prior to January 1, 2014
|
|||||||||||||||||||||||||||||||||||||
|
United States - 44,235 displays
|
—
|
|
(2)
|
(2)
|
(2)
|
$
|
83.6
|
|
$
|
1,277.5
|
|
$
|
1,361.1
|
|
$
|
(832.7
|
)
|
Various
|
Various
|
5 to 20 years
|
|||||||||||||||||
|
Canada - 5,955 displays
|
—
|
|
(2)
|
(2)
|
(2)
|
2.5
|
|
318.0
|
|
320.5
|
|
(249.7
|
)
|
Various
|
Various
|
5 to 20 years
|
|||||||||||||||||||||
|
Mexico - 4,397 displays
|
—
|
|
(2)
|
(2)
|
(2)
|
2.0
|
|
28.8
|
|
30.8
|
|
(18.0
|
)
|
Various
|
Various
|
5 to 20 years
|
|||||||||||||||||||||
|
Argentina - 494 displays
|
—
|
|
(2)
|
(2)
|
(2)
|
—
|
|
1.4
|
|
1.4
|
|
(0.5
|
)
|
Various
|
Various
|
5 to 20 years
|
|||||||||||||||||||||
|
Brazil - 704 displays
|
—
|
|
(2)
|
(2)
|
(2)
|
—
|
|
5.1
|
|
5.1
|
|
(1.2
|
)
|
Various
|
Various
|
5 to 20 years
|
|||||||||||||||||||||
|
Uruguay - 149 displays
|
—
|
|
(2)
|
(2)
|
(2)
|
—
|
|
1.8
|
|
1.8
|
|
(1.4
|
)
|
Various
|
Various
|
5 to 20 years
|
|||||||||||||||||||||
|
Chile - 820 displays
|
—
|
|
(2)
|
(2)
|
(2)
|
—
|
|
3.6
|
|
3.6
|
|
(3.3
|
)
|
Various
|
Various
|
5 to 20 years
|
|||||||||||||||||||||
|
$
|
88.1
|
|
$
|
1,636.2
|
|
$
|
1,724.3
|
|
$
|
(1,106.8
|
)
|
||||||||||||||||||||||||||
|
Structures added subsequent to January 1, 2014
|
|||||||||||||||||||||||||||||||||||||
|
United States - 1,875 displays
(4)
|
$
|
—
|
|
$
|
107.7
|
|
$
|
—
|
|
$
|
—
|
|
$
|
107.7
|
|
$
|
107.7
|
|
$
|
(2.5
|
)
|
Various
|
Various
|
5 to 20 years
|
|||||||||||||
|
Canada - 29 displays
|
—
|
|
1.0
|
|
—
|
|
—
|
|
1.0
|
|
1.0
|
|
—
|
|
Various
|
Various
|
5 to 20 years
|
||||||||||||||||||||
|
Mexico - 8 displays
|
—
|
|
0.3
|
|
—
|
|
—
|
|
0.3
|
|
0.3
|
|
(0.1
|
)
|
Various
|
Various
|
5 to 20 years
|
||||||||||||||||||||
|
Argentina - 23 displays
|
—
|
|
0.1
|
|
—
|
|
—
|
|
0.1
|
|
0.1
|
|
—
|
|
Various
|
Various
|
5 to 20 years
|
||||||||||||||||||||
|
Brazil - 60 displays
|
—
|
|
0.2
|
|
—
|
|
—
|
|
0.2
|
|
0.2
|
|
—
|
|
Various
|
Various
|
5 to 20 years
|
||||||||||||||||||||
|
Uruguay - 0 displays
|
—
|
|
—
|
|
—
|
|
—
|
|
—
|
|
—
|
|
—
|
|
Various
|
Various
|
5 to 20 years
|
||||||||||||||||||||
|
Chile - 3 displays
|
—
|
|
0.1
|
|
—
|
|
—
|
|
0.1
|
|
0.1
|
|
—
|
|
Various
|
Various
|
5 to 20 years
|
||||||||||||||||||||
|
$
|
—
|
|
$
|
109.4
|
|
$
|
—
|
|
$
|
—
|
|
$
|
109.4
|
|
$
|
109.4
|
|
$
|
(2.6
|
)
|
|||||||||||||||||
|
Total
|
|||||||||||||||||||||||||||||||||||||
|
United States - 46,110 displays
|
$
|
83.6
|
|
$
|
1,385.2
|
|
$
|
1,468.8
|
|
$
|
(835.2
|
)
|
Various
|
Various
|
5 to 20 years
|
||||||||||||||||||||||
|
Canada - 5,984 displays
|
2.5
|
|
319.0
|
|
321.5
|
|
(249.7
|
)
|
Various
|
Various
|
5 to 20 years
|
||||||||||||||||||||||||||
|
Mexico - 4,405 displays
|
2.0
|
|
29.1
|
|
31.1
|
|
(18.1
|
)
|
Various
|
Various
|
5 to 20 years
|
||||||||||||||||||||||||||
|
Argentina - 517 displays
|
—
|
|
1.5
|
|
1.5
|
|
(0.5
|
)
|
Various
|
Various
|
5 to 20 years
|
||||||||||||||||||||||||||
|
Brazil - 764 displays
|
—
|
|
5.3
|
|
5.3
|
|
(1.2
|
)
|
Various
|
Various
|
5 to 20 years
|
||||||||||||||||||||||||||
|
Uruguay - 149 displays
|
—
|
|
1.8
|
|
1.8
|
|
(1.4
|
)
|
Various
|
Various
|
5 to 20 years
|
||||||||||||||||||||||||||
|
Chile - 823 displays
|
—
|
|
3.7
|
|
3.7
|
|
(3.3
|
)
|
Various
|
Various
|
5 to 20 years
|
||||||||||||||||||||||||||
|
$
|
88.1
|
|
$
|
1,745.6
|
|
$
|
1,833.7
|
|
$
|
(1,109.4
|
)
|
||||||||||||||||||||||||||
______________________
|
(1)
|
No
single asset exceeded
5%
of the total gross carrying amount as of
December 31, 2014
.
|
|
(2)
|
This information is omitted as it would be impracticable to compile on a site-by-site basis.
|
|
(3)
|
Includes sites under construction.
|
|
(4)
|
Includes the outstanding balance as of
December 31, 2014
, of structures added in conjunction with the Acquisition. For additional information regarding the Acquisition, see Part II, Item 8, of this Annual Report on Form 10-K, Notes to Consolidated Financial Statements, Note 12.
Acquisition
.
|
108
The following table summarizes the activity for the Company’s real estate assets, which consist of advertising displays, and the related accumulated depreciation.
|
2014
|
2013
|
2012
|
|||||||||
|
Gross real estate assets:
|
|||||||||||
|
Balance at the beginning of the year
|
$
|
1,750.9
|
|
$
|
1,743.7
|
|
$
|
1,714.6
|
|
||
|
Additions for construction of / improvements to structures
|
136.6
|
|
51.6
|
|
47.1
|
|
|||||
|
Assets sold or written-off
|
(14.2
|
)
|
(14.9
|
)
|
(32.3
|
)
|
|||||
|
Foreign exchange
|
(39.6
|
)
|
(29.5
|
)
|
14.3
|
|
|||||
|
Balance at the end of the year
|
$
|
1,833.7
|
|
$
|
1,750.9
|
|
$
|
1,743.7
|
|
||
|
Accumulated depreciation:
|
|||||||||||
|
Balance at the beginning of the year
|
$
|
1,052.7
|
|
$
|
990.0
|
|
$
|
911.0
|
|
||
|
Depreciation
|
99.6
|
|
97.5
|
|
98.8
|
|
|||||
|
Foreign exchange
|
(29.9
|
)
|
(21.1
|
)
|
9.9
|
|
|||||
|
Assets sold or written-off
|
(13.0
|
)
|
(13.7
|
)
|
(29.7
|
)
|
|||||
|
Balance at the end of the year
|
$
|
1,109.4
|
|
$
|
1,052.7
|
|
$
|
990.0
|
|
||
109
(a)(3)
Exhibits.
The exhibits filed as part of this Annual Report on Form 10-K are listed on the Exhibit Index immediately following the signature page hereto, which is incorporated herein by reference.
110
SIGNATURES
Pursuant to the requirements of Section 13 or 15(d) of the Securities Exchange Act of 1934, the registrant has duly caused this report to be signed on its behalf by the undersigned, thereunto duly authorized.
|
OUTFRONT MEDIA INC.
|
||||
|
By:
|
/s/ Donald R. Shassian
|
|||
|
Name:
|
Donald R. Shassian
|
|||
|
Title:
|
Executive Vice President and Chief Financial Officer
|
|||
Date:
March 6, 2015
POWER OF ATTORNEY
Each person whose signature appears below constitutes and appoints Donald R. Shassian, Richard H. Sauer and Louis J. Capocasale, and each of them, as his or her true and lawful attorney-in-fact and agent, with full power of substitution and resubstitution, for him or her and in his or her name, place and stead, in any and all capacities, to sign any and all amendments to this Annual Report on Form 10-K, and to file the same, with all exhibits thereto, and other documents in connection therewith, with the Securities and Exchange Commission, granting unto said attorneys-in-fact and agents, and each of them, full power and authority to do and perform each and every act and thing requisite and necessary to be done in connection therewith, as fully to all intents and purposes as he or she might or could do in person, hereby ratifying and confirming all that said attorneys-in-fact and agents, or any of them, or their or his substitutes, may lawfully do or cause to be done by virtue thereof.
Pursuant to the requirements of the Securities Exchange Act of 1934, this report has been signed below by the following persons on behalf of the registrant and in the capacities and on the dates indicated.
|
Signature
|
Title
|
Date
|
||
|
/s/ Jeremy J. Male
|
Chairman and Chief Executive Officer
|
March 6, 2015
|
||
|
Jeremy J. Male
|
(Principal Executive Officer)
|
|||
|
/s/ Donald R. Shassian
|
Executive Vice President and Chief Financial Officer
|
March 6, 2015
|
||
|
Donald R. Shassian
|
(Principal Financial and Principal Accounting Officer)
|
|||
|
/s/ Nicolas Brien
|
Director
|
March 6, 2015
|
||
|
Nicolas Brien
|
||||
|
/s/ Manuel A. Diaz
|
Director
|
March 6, 2015
|
||
|
Manuel A. Diaz
|
||||
|
/s/ Peter Mathes
|
Director
|
March 6, 2015
|
||
|
Peter Mathes
|
||||
|
/s/ Susan M. Tolson
|
Director
|
March 6, 2015
|
||
|
Susan M. Tolson
|
||||
|
/s/ Joseph H. Wender
|
Director
|
March 6, 2015
|
||
|
Joseph H. Wender
|
||||
111
EXHIBIT INDEX
|
Exhibit
Number
|
Description
|
|
|
2.1
|
Agreement and Plan of Reorganization, dated as of January 15, 2014, by and among CBS Corporation, CBS Outdoor Americas Inc. and CBS Radio Media Corporation (incorporated herein by reference to Exhibit 2.1 to the Company’s Registration Statement on Form S-11 (File No. 333-189643), filed on January 31, 2014).
|
|
|
2.2
|
Master Separation Agreement, dated as of April 2, 2014, by and between CBS Outdoor Americas Inc. and CBS Corporation (incorporated herein by reference to Exhibit 2.1 to the Company’s Current Report on Form 8-K, filed on April 2, 2014).+
|
|
|
2.3
|
Membership Interest Purchase Agreement, dated as of July 20, 2014, by and among CBS Outdoor Americas Inc., CBS Outdoor LLC, Van Wagner Communications, LLC, Van Wagner Twelve Holdings, LLC and Richard M. Schaps (incorporated herein by reference to Exhibit 2.1 to the Company’s Current Report on Form 8-K, filed on July 21, 2014).+
|
|
|
3.1
|
Articles of Amendment and Restatement of OUTFRONT Media Inc. effective March 28, 2014, as amended by the Articles of Amendment of OUTFRONT Media Inc. effective November 20, 2014. (incorporated herein by reference to Exhibit 3.1 to the Company’s Current Report on Form 8-K, filed on November 20, 2014).
|
|
|
3.2
|
Amended and Restated Bylaws of OUTFRONT Media Inc. (incorporated herein by reference to Exhibit 3.2 to the Company’s Current Report on Form 8-K, filed on November 20, 2014).
|
|
|
4.1
|
Indenture, dated as of January 31, 2014, by and among CBS Outdoor Americas Capital LLC, CBS Outdoor Americas Capital Corporation, the guarantors named therein and Deutsche Bank Trust Company Americas
(incorporated herein by reference to Exhibit 4.1 to the Company’s Registration Statement on Form S-11 (File No. 333-189643), filed on January 31, 2014).
|
|
|
4.2
|
Registration Rights Agreement, dated as of January 31, 2014, by and among CBS Outdoor Americas Capital LLC, CBS Outdoor Americas Capital Corporation, the guarantors named therein and Deutsche Bank Securities Inc., Wells Fargo Securities, LLC and Citigroup Global Markets Inc. (incorporated herein by reference to Exhibit 4.2 to the Company’s Registration Statement on Form S-11 (File No. 333-189643), filed on January 31, 2014).
|
|
|
4.3
|
Indenture, dated as of October 1, 2014, by and among CBS Outdoor Americas Capital LLC, CBS Outdoor Americas Capital Corporation, the guarantors named therein and Deutsche Bank Trust Company Americas (incorporated herein by reference to Exhibit 4.1 to the Company’s Current Report on Form 8-K, filed on October 2, 2014).
|
|
|
4.4
|
First Supplemental Indenture, dated as of October 1, 2014, by and among CBS Outdoor Americas Capital LLC, CBS Outdoor Americas Capital Corporation, the guarantors named therein and Deutsche Bank Trust Company Americas (incorporated herein by reference to Exhibit 4.2 to the Company’s Current Report on Form 8-K, filed on October 2, 2014).
|
|
|
10.1
|
Tax Matters Agreement, dated as of April 2, 2014, by and between CBS Outdoor Americas Inc. and CBS Corporation (incorporated herein by reference to Exhibit 10.1 to the Company’s Current Report on Form 8-K, filed on April 2, 2014).
|
|
|
10.2
|
Transition Services Agreement, dated as of April 2, 2014, by and between CBS Outdoor Americas Inc. and CBS Corporation (incorporated herein by reference to Exhibit 10.2 to the Company’s Current Report on Form 8-K, filed on April 2, 2014).
|
|
|
10.3
|
Registration Rights Agreement, dated as of April 2, 2014, by and between CBS Outdoor Americas Inc. and CBS Corporation (incorporated herein by reference to Exhibit 10.4 to the Company’s Current Report on Form 8-K, filed on April 2, 2014).
|
|
|
10.4
|
License Agreement, dated as of April 2, 2014, by and between CBS Outdoor Americas Inc. and CBS Broadcasting Inc. (incorporated herein by reference to Exhibit 10.3 to the Company’s Current Report on Form 8-K, filed on April 2, 2014).
|
|
|
10.5
|
Form of Director Indemnification Agreement (incorporated herein by reference to Exhibit 10.5 to the Company’s Registration Statement on Form S-11 (File No. 333-189643), filed on February 18, 2014).
|
|
112
|
10.6
|
Commitment Letter, dated as of July 20, 2014, between CBS Outdoor Americas Capital LLC, CBS Outdoor Americas Capital Corporation, CBS Outdoor Americas Inc., Wells Fargo Securities, LLC and WF Investment Holdings, LLC (incorporated herein by reference to Exhibit 10.1 to the Company’s Current Report on Form 8-K, filed on July 21, 2014).
|
|
|
10.7
|
Amended and Restated Transition Services Agreement, dated as of July 16, 2014, by and between CBS Outdoor Americas Inc. and CBS Corporation (incorporated herein by reference to Exhibit 10.1 to the Company’s Current Report on Form 8-K, filed on July 16, 2014).
|
|
|
10.8
|
Amended and Restated License Agreement, dated as of July 16, 2014, by and between CBS Outdoor Americas Inc. and CBS Broadcasting Inc. (incorporated herein by reference to Exhibit 10.2 to the Company’s Current Report on Form 8-K, filed on July 16, 2014).
|
|
|
10.9
|
Credit Agreement, dated as of January 31, 2014, by and among CBS Outdoor Americas Capital LLC, CBS Outdoor Americas Capital Corporation, the guarantors party thereto, Citibank, N.A. and the other lenders party thereto from time to time (incorporated herein by reference to Exhibit 10.9 to the Company’s Registration Statement on Form S-4 (File No. 333-201197), filed on December 22, 2014).
|
|
|
10.10
|
Omnibus Stock Incentive Plan (incorporated herein by reference to Exhibit 10.6 to the Company’s Current Report on Form 8-K, filed on April 2, 2014).*
|
|
|
10.11
|
Executive Bonus Plan (incorporated herein by reference to Exhibit 10.7 to the Company’s Current Report on Form 8-K, filed on April 2, 2014).*
|
|
|
10.12
|
Outdoor Excess 401(k) Plan (incorporated herein by reference to Exhibit 10.9 to the Company’s Registration Statement on Form S-11 (File No. 333-189643), filed on February 18, 2014).*
|
|
|
10.13
|
Employment Agreement with Jeremy J. Male, dated as of September 6, 2013 (incorporated herein by reference to Exhibit 10.10 to the Company’s Registration Statement on Form S-11 (File No. 333-189643), filed on February 18, 2014).*
|
|
|
10.14
|
Employment Agreement with Wally Kelly, dated as of August 21, 2013 (incorporated herein by reference to Exhibit 10.11 to the Company’s Registration Statement on Form S-11 (File No. 333-189643), filed on February 18, 2014).*
|
|
|
10.15
|
Employment Agreement with Donald R. Shassian, dated as of November 20, 2013 (incorporated herein by reference to Exhibit 10.12 to the Company’s Registration Statement on Form S-11 (File No. 333-189643), filed on February 18, 2014).*
|
|
|
10.16
|
Employment Agreement with Raymond Nowak, dated as of November 25, 2013 (incorporated herein by reference to Exhibit 10.13 to the Company’s Registration Statement on Form S-11 (File No. 333-189643), filed on February 18, 2014).*
|
|
|
10.17
|
Employment Letter with Richard Sauer, dated as of October 26, 2006 (incorporated herein by reference to Exhibit 10.14 to the Company’s Registration Statement on Form S-11 (File No. 333-189643), filed on February 18, 2014).*
|
|
|
10.18
|
Employment Agreement with Richard Sauer, dated as of February 17, 2014 (incorporated herein by reference to Exhibit 10.15 to the Company’s Registration Statement on Form S-11 (File No. 333-189643), filed on February 18, 2014).*
|
|
|
10.19
|
Form of Certificate and Terms and Conditions for Performance-Based Restricted Share Units Awards with Time Vesting (incorporated herein by reference to Exhibit 10.11 to the Company’s Quarterly Report on Form 10-Q for the quarterly period ended March 31, 2014).*
|
|
|
10.20
|
Form of Certificate and Terms and Conditions for Restricted Share Units Awards with Time Vesting (incorporated herein by reference to Exhibit 10.12 to the Company’s Quarterly Report on Form 10-Q for the quarterly period ended March 31, 2014).*
|
|
|
10.21
|
Form of Certificate and Terms and Conditions for Restricted Share Units Awards with Time Vesting for Directors (incorporated herein by reference to Exhibit 10.13 to the Company’s Quarterly Report on Form 10-Q for the quarterly period ended March 31, 2014).*
|
|
|
10.22
|
Summary of Compensation for Outside Directors (incorporated herein by reference to Exhibit 10.14 to the Company’s Quarterly Report on Form 10-Q for the quarterly period ended March 31, 2014).*
|
|
113
|
10.23
|
CBS Corporation 2004 Long-Term Management Incentive Plan (as amended and restated through May 25, 2006) (incorporated herein by reference to Exhibit 10 to CBS Corporation’s Quarterly Report on Form 10-Q for the quarterly period ended June 30, 2006, File No. 001-09553).*
|
|
|
10.24
|
CBS Corporation 2009 Long-Term Incentive Plan (effective February 21, 2008, as amended and restated May 23, 2013) (incorporated herein by reference to Exhibit 10(c) to CBS Corporation’s Quarterly Report on Form 10-Q for the quarterly period ended June 30, 2013, File No. 001-09553).*
|
|
|
10.25
|
Form of Certificate and Terms and Conditions for Converted Stock Options (incorporated herein by reference to Exhibit 10(c)(ii) to CBS Corporation’s Annual Report on Form 10-K for the fiscal year ended December 31, 2011, File No. 001-09553).*
|
|
|
10.26
|
Form of Certificate and Terms and Conditions of Converted Performance-Based Restricted Share Units with Time Vesting (incorporated herein by reference to Exhibit 10(c)(v) to CBS Corporation’s Annual Report on Form 10-K for the fiscal year ended December 31, 2011, File No. 001-09553).*
|
|
|
10.27
|
Form of Certificate and Terms and Conditions of Converted Restricted Share Units with Time Vesting (incorporated herein by reference to Exhibit 10(c)(vii) to CBS Corporation’s Annual Report on Form 10-K for the fiscal year ended December 31, 2011, File No. 001-09553).*
|
|
|
10.28
|
Employment Agreement with Andy Sriubas, dated as of July 28, 2014 (incorporated herein by reference to Exhibit 10.2 to the Company’s Quarterly Report on Form 10-Q for the quarterly period ended September 30, 2014).*
|
|
|
10.29
|
Registration Rights Agreement, dated as of October 1, 2014, by and among CBS Outdoor Americas Capital LLC, CBS Outdoor Americas Capital Corporation, the guarantors named therein and Wells Fargo Securities, LLC and Goldman, Sachs & Co. (incorporated herein by reference to Exhibit 10.1 to the Company’s Current Report on Form 8-K, filed on October 2, 2014).
|
|
|
10.30
|
Employment Agreement with Clive Punter, dated as of October 6, 2014 (incorporated herein by reference to Exhibit 10.30 to the Company’s Registration Statement on Form S-4 (File No. 333-201197), filed on December 22, 2014).*
|
|
|
10.31
|
Employment Agreement with Nancy Tostanoski, dated as of May 5, 2014 (incorporated herein by reference to Exhibit 10.31 to the Company’s Registration Statement on Form S-4 (File No. 333-201197), filed on December 22, 2014).*
|
|
|
10.32
|
Employment Agreement with Jodi Senese, dated as of April 15, 2013 (incorporated herein by reference to Exhibit 10.32 to the Company’s Registration Statement on Form S-4 (File No. 333-201197), filed on December 22, 2014).*
|
|
|
10.33
|
Letter Agreement with Wally Kelly, dated as of July 23, 2014 (incorporated herein by reference to Exhibit 10.33 to the Company’s Registration Statement on Form S-4 (File No. 333-201197), filed on December 22, 2014).*
|
|
|
10.34
|
Letter Agreement with Raymond Nowak, dated of as November 25, 2014 (incorporated herein by reference to Exhibit 10.1 to the Company’s Current Report on Form 8-K, filed on December 2, 2014).*
|
|
|
21.1
|
List of Subsidiaries of the Company.
|
|
|
23.1
|
Consent of PricewaterhouseCoopers LLP.
|
|
|
24.1
|
Power of Attorney (Included on the signature page of this Annual Report on Form 10-K and incorporated herein by reference).
|
|
|
31.1
|
Certification of the Chief Executive Officer of OUTFRONT Media Inc. pursuant to Rule 13a-14(a) or 15d-14(a), as adopted pursuant to Section 302 of the Sarbanes-Oxley Act of 2002.
|
|
|
31.2
|
Certification of the Chief Financial Officer of OUTFRONT Media Inc. pursuant to Rule 13a-14(a) or 15d-14(a), as adopted pursuant to Section 302 of the Sarbanes-Oxley Act of 2002.
|
|
|
32.1
|
Certification of the Chief Executive Officer of OUTFRONT Media Inc. furnished pursuant to 18 U.S.C. Section 1350, as adopted pursuant to section 906 of the Sarbanes-Oxley act of 2002.
|
|
|
32.2
|
Certification of the Chief Financial Officer of OUTFRONT Media Inc. furnished pursuant to 18 U.S.C. Section 1350, as adopted pursuant to section 906 of the Sarbanes-Oxley act of 2002.
|
|
|
101.INS
|
XBRL Instance Document
|
|
|
101.SCH
|
XBRL Taxonomy Extension Schema
|
|
|
101.CAL
|
XBRL Taxonomy Calculation Linkbase
|
|
114
|
101.DEF
|
XBRL Taxonomy Definition Document
|
|
|
101.LAB
|
XBRL Taxonomy Label Linkbase
|
|
|
101.PRE
|
XBRL Taxonomy Presentation Linkbase
|
|
|
+
|
Schedules, annexes and exhibits have been omitted pursuant to Item 601(b)(2) of Regulation S-K. The Company agrees to furnish supplementally to the SEC a copy of any omitted schedule, annex or exhibit upon request.
|
|
|
*
|
Management contracts and compensatory plans and arrangements.
|
|
115
TABLE OF CONTENTS
Part IItem 1. BusinessItem 1A. Risk FactorsItem 1B. Unresolved Staff CommentsItem 2. PropertiesItem 3. Legal ProceedingsItem 4. Mine Safety DisclosuresPart IIItem 5. Market For Registrant S Common Equity, Related Stockholder Matters and Issuer Purchases Of Equity SecuritiesItem 6. Selected Financial DataItem 7. Management S Discussion and Analysis Of Financial Condition and Results Of OperationsItem 7A. Quantitative and Qualitative Disclosures About Market RiskItem 8. Financial Statements and Supplementary DataNote 1. Description Of Business and Basis Of PresentationNote 2. Initial Public OfferingNote 3. Summary Of Significant Accounting PoliciesNote 4. Property and EquipmentNote 5. Goodwill and Other Intangible AssetsNote 6. Asset Retirement ObligationNote 7. Related Party TransactionsNote 8. Long-term DebtNote 9. Accumulated Other Comprehensive IncomeNote 10. EquityNote 11. Restructuring ChargesNote 12. AcquisitionNote 13. Stock-based CompensationNote 14. Retirement BenefitsNote 15. Income TaxesNote 16. Earnings Per Share ( Eps )Note 17. Commitments and ContingenciesNote 18. Segment InformationNote 19. Condensed Consolidating Financial InformationNote 20. Subsequent EventsNote 21. Quarterly Financial Data (unaudited)Item 9. Changes in and Disagreements with Accountants on Accounting and Financial DisclosureItem 9A. Controls and ProceduresItem 9B. Other InformationPart IIIItem 10. Directors, Executive Officers and Corporate GovernanceItem 11. Executive CompensationItem 12. Security Ownership Of Certain Beneficial Owners and Management and Related Stockholder MattersItem 13. Certain Relationships and Related Transactions, and Director IndependenceItem 14. Principal Accounting Fees and ServicesPart IVItem 15. Exhibits, Financial Statement Schedules