OXFORD INDUSTRIES INC
10-Ks and 10-Qs
|
|
|
|
|
|
|
|
|
|
|
|
|
|
|
|
|
|
|
|
|
|
|
|
|
|
|
|
|
|
|
|
|
|
|
|
|
|
|
|
|
|
|
|
|
|
|
|
|
|
|
|
|
|
|
|
|
|
|
UNITED STATES
SECURITIES AND EXCHANGE COMMISSION
Washington, D.C. 20549
FORM 10-K
|
ý
|
ANNUAL REPORT PURSUANT TO SECTION 13 OR 15(d) OF THE SECURITIES EXCHANGE ACT OF 1934
|
|
For the fiscal year ended February 2, 2019
|
|
|
or
|
|
|
o
|
TRANSITION REPORT PURSUANT TO SECTION 13 OR 15(d) OF THE SECURITIES EXCHANGE ACT OF 1934
|
|
For the transition period from to
|
|
Commission File Number: 1-4365
OXFORD INDUSTRIES, INC.
(Exact name of registrant as specified in its charter)
|
Georgia
(State or other jurisdiction of incorporation or organization)
|
58-0831862
(I.R.S. Employer Identification No.)
|
|
|
999 Peachtree Street, N.E., Suite 688, Atlanta, Georgia 30309
(Address of principal executive offices) (Zip Code)
|
||
|
Registrant's telephone number, including area code:
(404) 659-2424
|
||
|
Securities registered pursuant to Section 12(b) of the Act:
|
||
|
Title of each class
|
Name of each exchange on which registered
|
|
|
Common Stock, $1 par value
|
New York Stock Exchange
|
|
|
Securities registered pursuant to Section 12(g) of the Act:
NONE
|
||
Indicate by check mark if the registrant is a well-known seasoned issuer as defined in Rule 405 of the Securities Act. Yes
ý
No
o
Indicate by check mark if the registrant is not required to file reports pursuant to Section 13 or Section 15(d) of the Act. Yes
o
No
ý
Indicate by check mark whether the registrant (1) has filed all reports required to be filed by Section 13 or 15(d) of the Securities Exchange Act of 1934 during the preceding 12 months (or for such shorter period that the registrant was required to file such reports), and (2) has been subject to such filing requirements for the past 90 days. Yes
ý
No
o
Indicate by check mark whether the registrant has submitted electronically every Interactive Data File required to be submitted pursuant to Rule 405 of Regulation S-T during the preceding 12 months (or for such shorter period that the registrant was required to submit such files). Yes
ý
No
o
Indicate by check mark if disclosure of delinquent filers pursuant to Item 405 of Regulation S-K is not contained herein, and will not be contained, to the best of registrant's knowledge, in definitive proxy or information statements incorporated by reference in Part III of this Form 10-K or any amendment to this Form 10-K.
ý
Indicate by check mark whether the registrant is a large accelerated filer, an accelerated filer, a non-accelerated filer or a smaller reporting company. See the definitions of "large accelerated filer," "accelerated filer," "smaller reporting company" and "emerging growth company" in Rule 12b-2 of the Exchange Act.
|
Large accelerated filer
ý
|
Accelerated filer
o
|
Non-accelerated filer
o
|
Smaller reporting company
o
|
Emerging growth company
o
|
If an emerging growth company, indicate by check mark if the registrant has elected not to use the extended transition period for complying with any new or revised financial accounting standards provided pursuant to Section 13(a) of the Exchange Act.
o
Indicate by check mark whether the registrant is a shell company (as defined in Rule 12b-2 of the Act). Yes
o
No
ý
As of August 3, 2018, which is the last business day of the registrant's most recently completed second fiscal quarter, the aggregate market value of the voting stock held by non-affiliates of the registrant (based upon the closing price for the common stock on the New York Stock Exchange on that date) was $1,308,008,474. For purposes of this calculation only, shares of voting stock directly and indirectly attributable to executive officers, directors and holders of 10% or more of the registrant's voting stock (based on Schedule 13G filings made as of or prior to August 3, 2018) are excluded. This determination of affiliate status and the calculation of the shares held by any such person are not necessarily conclusive determinations for other purposes.
Indicate the number of shares outstanding of each of the registrant's classes of common stock, as of the latest practicable date.
|
Title of Each Class
|
Number of Shares Outstanding
as of March 15, 2019 |
|
|
Common Stock, $1 par value
|
16,958,942
|
|
Documents Incorporated by Reference
Portions of our proxy statement for our Annual Meeting of Shareholders to be held on June 18, 2019 are incorporated by reference into Part III of this Form 10-K.
Table of Contents
|
|
|
Page
|
CAUTIONARY STATEMENTS REGARDING FORWARD-LOOKING STATEMENTS
Our SEC filings and public announcements may include forward-looking statements about future events. Generally, the words "believe," "expect," "intend," "estimate," "anticipate," "project," "will" and similar expressions identify forward-looking statements, which generally are not historical in nature. We intend for all forward-looking statements contained herein, in our press releases or on our website, and all subsequent written and oral forward-looking statements attributable to us or persons acting on our behalf, to be covered by the safe harbor provisions for forward-looking statements within the meaning of the Private Securities Litigation Reform Act of 1995 and the provisions of Section 27A of the Securities Act of 1933 and Section 21E of the Securities Exchange Act of 1934 (which Sections were adopted as part of the Private Securities Litigation Reform Act of 1995). Such statements are subject to a number of risks, uncertainties and assumptions including, without limitation, competitive conditions, which may be impacted by evolving consumer shopping patterns; the impact of economic conditions on consumer demand and spending for apparel and related products; demand for our products; timing of shipments requested by our wholesale customers; expected pricing levels; retention of and disciplined execution by key management; the timing and cost of store and restaurant openings and of capital expenditures; weather; changes in international, federal or state tax, trade and other laws and regulations; costs of products as well as the raw materials used in those products; costs of labor; acquisition and disposition activities, including our ability to timely recognize expected synergies from any acquisitions; expected outcomes of pending or potential litigation and regulatory actions; access to capital and/or credit markets; and factors that could affect our consolidated effective tax rate. Forward-looking statements reflect our expectations at the time such forward looking statements are made, based on information available at such time, and are not guarantees of performance. Although we believe that the expectations reflected in such forward-looking statements are reasonable, these expectations could prove inaccurate as such statements involve risks and uncertainties, many of which are beyond our ability to control or predict. Should one or more of these risks or uncertainties, or other risks or uncertainties not currently known to us or that we currently deem to be immaterial, materialize, or should underlying assumptions prove incorrect, actual results may vary materially from those anticipated, estimated or projected. Important factors relating to these risks and uncertainties include, but are not limited to, those described in Part I, Item 1A. Risk Factors and elsewhere in this report and those described from time to time in our future reports filed with the SEC. We caution that one should not place undue reliance on forward-looking statements, which speak only as of the date on which they are made. We disclaim any intention, obligation or duty to update or revise any forward-looking statements, whether as a result of new information, future events or otherwise, except as required by law.
DEFINITIONS
As used in this report, unless the context requires otherwise, "our," "us" or "we" means Oxford Industries, Inc. and its consolidated subsidiaries; "SG&A" means selling, general and administrative expenses; "SEC" means the United States Securities and Exchange Commission; "FASB" means the Financial Accounting Standards Board; "ASC" means the FASB Accounting Standards Codification; "GAAP" means generally accepted accounting principles in the United States; "discontinued operations" means the assets and operations of our former Ben Sherman operating group which we sold in Fiscal 2015; "TBBC" means The Beaufort Bonnet Company; and "U.S. Tax Reform" means the United States Tax Cuts and Jobs Act as enacted on December 22, 2017. Unless otherwise indicated, all references to assets, liabilities, revenues, expenses or other information in this report reflect continuing operations. Additionally, the terms listed below reflect the respective period noted:
|
Fiscal 2019
|
52 weeks ending February 1, 2020
|
|
Fiscal 2018
|
52 weeks ended February 2, 2019
|
|
Fiscal 2017
|
53 weeks ended February 3, 2018
|
|
Fiscal 2016
|
52 weeks ended January 28, 2017
|
|
Fiscal 2015
|
52 weeks ended January 30, 2016
|
|
Fiscal 2014
|
52 weeks ended January 31, 2015
|
|
Fourth quarter Fiscal 2018
|
13 weeks ended February 2, 2019
|
|
Third quarter Fiscal 2018
|
13 weeks ended November 3, 2018
|
|
Second quarter Fiscal 2018
|
13 weeks ended August 4, 2018
|
|
First quarter Fiscal 2018
|
13 weeks ended May 5, 2018
|
|
Fourth quarter Fiscal 2017
|
14 weeks ended February 3, 2018
|
|
Third quarter Fiscal 2017
|
13 weeks ended October 28, 2017
|
|
Second quarter Fiscal 2017
|
13 weeks ended July 29, 2017
|
|
First quarter Fiscal 2017
|
13 weeks ended April 29, 2017
|
3
PART I
Item 1.
Business
BUSINESS AND PRODUCTS
Overview
We are a global apparel company that designs, sources, markets and distributes products bearing the trademarks of our Tommy Bahama, Lilly Pulitzer and Southern Tide lifestyle brands and other owned and licensed brands as well as private label apparel products. During
Fiscal 2018
, 93% of our net sales were from products bearing brands that we own and 69% of our net sales were through our direct to consumer channels of distribution. In
Fiscal 2018
, 96% of our consolidated net sales were to customers located in the United States, with the sales outside the United States consisting primarily of our Tommy Bahama product sales in Canada and the Asia-Pacific region.
Our business strategy is to develop and market compelling lifestyle brands and products that evoke a strong emotional response from our target consumers. We consider lifestyle brands to be those brands that have a clearly defined and targeted point of view inspired by an appealing lifestyle or attitude. Furthermore, we believe lifestyle brands that create an emotional connection, like Tommy Bahama, Lilly Pulitzer and Southern Tide, can command greater loyalty and higher price points at retail and create licensing opportunities, which may drive higher earnings. We believe the attraction of a lifestyle brand depends on creating compelling product, effectively communicating the respective lifestyle brand message and distributing products to consumers where and when they want them.
Our ability to compete successfully in styling and marketing is directly related to our proficiency in foreseeing changes and trends in fashion and consumer preference and presenting appealing products for consumers. Our design-led, commercially informed lifestyle brand operations strive to provide exciting, differentiated products each season.
To further strengthen each lifestyle brand's connections with consumers, we directly communicate with consumers through digital and print media on a regular basis. We believe our ability to effectively communicate the images, lifestyle and products of our brands and create an emotional connection with consumers is critical to the success of our brands. Advertising for our brands often attempts to convey the lifestyle of the brand as well as a specific product.
We distribute our owned lifestyle branded products primarily through our direct to consumer channels, consisting of our Tommy Bahama and Lilly Pulitzer retail stores and our e-commerce sites for Tommy Bahama, Lilly Pulitzer and Southern Tide, and through our wholesale distribution channels. During
Fiscal 2018
, our retail, e-commerce and restaurant operations represented 40%, 21% and 8%, respectively, of our net sales. Our direct to consumer operations provide us with the opportunity to interact directly with our customers, present to them a broad assortment of our current season products and immerse them in the theme of the lifestyle brand. We believe that presenting our products in a setting specifically designed to showcase the lifestyle on which the brands are based enhances the image of our brands. Our 130 Tommy Bahama and 62 Lilly Pulitzer full-price retail stores provide high visibility for our brands and products and allow us to stay close to the preferences of our consumers, while also providing a platform for long-term growth for the brands. We also operate 17 Tommy Bahama restaurants, including Marlin Bars, generally adjacent to a Tommy Bahama full-price retail store location, which we believe further enhance the brand's image with consumers. Additionally, we operate 37 Tommy Bahama outlet stores, which play an important role in overall inventory and brand management by disposing of excess inventory.
The wholesale operations of our lifestyle brands complement our direct to consumer operations and provide access to a larger group of consumers. As we seek to maintain the integrity of our lifestyle brands by limiting promotional activity in our full-price retail stores and e-commerce websites, we generally target wholesale customers that follow this same approach in their stores. Our wholesale customers for our Tommy Bahama, Lilly Pulitzer and Southern Tide brands generally include various specialty stores, Signature Stores for Lilly Pulitzer and Southern Tide, better department stores and multi-branded e-commerce retailers. Within our Lanier Apparel operating group, we sell tailored clothing and sportswear products under licensed, private label and owned brands. Lanier Apparel's customers include department stores, discount and off-price retailers, warehouse clubs, national chains, specialty stores and multi-branded e-commerce retailers.
All of our operating groups operate in highly competitive apparel markets in which numerous U.S. and foreign-based apparel firms compete. No single apparel firm or small group of apparel firms dominates the apparel industry, and our direct competitors vary by operating group and distribution channel. We believe the principal competitive factors in the apparel industry are reputation, value, and image of brand names; design; consumer preference; price; quality; marketing; product fulfillment capabilities; and customer service.
4
The disposal of discontinued, end of season or excess inventory is an ongoing part of any apparel business, and our operating groups have historically utilized a variety of methods to sell such inventory, including outlet stores in Tommy Bahama, e-commerce flash sales, and off-price retailers. Our focus in disposing of the excess inventory for our lifestyle brands is to do so in a brand appropriate setting and achieve an acceptable margin.
The apparel industry is cyclical and very dependent upon the overall level and focus of discretionary consumer spending, which changes as consumer preferences and regional, domestic and international economic conditions change. Increasingly, consumers are choosing to spend less of their discretionary spending on certain product categories, including apparel, while spending more on services and other product categories. Further, negative economic conditions often have a longer and more severe impact on the apparel industry than on other industries. We believe the changes in consumer preferences for discretionary spending, the current global economic conditions and economic uncertainty continue to impact the business of each of our operating groups and the apparel industry as a whole.
We believe the retail apparel market is evolving very rapidly and in ways that are having a disruptive impact on traditional fashion retailing. The application of technology, including the internet and mobile devices, to fashion retail provides consumers increasing access to multiple, responsive distribution platforms and an unprecedented ability to communicate directly with brands and retailers. As a result, consumers have more information and greater control over information they receive as well as broader, faster and cheaper access to goods than ever before. This, along with the coming of age of the “millennial” generation, is revolutionizing the way that consumers shop for fashion and other goods, which is evidenced by weakness and store closures for certain department stores and mall-based retailers, decreased consumer retail traffic, a more promotional retail environment, expansion of off-price and discount retailers, and a shift from bricks and mortar to internet purchasing. These changes may require that brands and retailers approach their operations, including marketing and advertising, very differently than historical practices and may result in increased operating costs to generate growth or even maintain their current sales levels.
Investments and Opportunities
While the evolution in the fashion retail industry presents significant risks, especially for traditional retailers who fail or are unable to adapt, we believe it also presents a tremendous opportunity for brands and retailers to capitalize on the changing consumer environment. We believe our brands have true competitive advantages in this new retailing paradigm, and we are leveraging technology to serve our consumers when and where they want to be served. We continue to believe that our lifestyle brands, with their strong emotional connections with consumers, are well suited to succeed and thrive in the long term while managing the various challenges facing our industry.
Specifically, we believe our lifestyle brands have opportunities for long-term growth in our direct to consumer businesses. We anticipate increased sales in our e-commerce operations, which are expected to grow at a faster rate than bricks and mortar comparable store sales. We also believe growth can be achieved through prudent expansion of bricks and mortar full-price retail store and restaurant operations and modest comparable full-price retail store and restaurant sales increases. We expect there will continue to be desirable locations for additional retail stores, but at a more measured growth rate than prior years.
We believe our lifestyle brands have an opportunity for modest sales increases in their wholesale businesses in the long term. However, we must be diligent in our effort to avoid compromising the integrity of our brands by maintaining or growing sales with wholesale customers that may not be aligned with our long-term strategy. This is particularly important with the challenges in the department store channel, which represented approximately 12% of our consolidated net sales in
Fiscal 2018
, compared to approximately 14% in
Fiscal 2017
. The management of wholesale distribution for our lifestyle brands resulted in a decrease in wholesale sales in
Fiscal 2018
. While we anticipate modest growth in our wholesale sales in Fiscal 2019, there could be additional reductions in wholesale sales in future years, as the amount of sales to certain wholesale accounts could decrease if the number of doors that carry our product decreases, the volume sold for a particular door is reduced or the account is exited altogether. We anticipate that sales increases in our wholesale businesses in the long term will stem primarily from current customers adding within their existing door count and increasing their online business; increased sales to online retailers; and our selective addition of new wholesale customers who generally present and merchandise our products in a way that is consistent with our full-price, direct to consumer distribution strategy. We also believe that there are opportunities for modest sales growth for Lanier Apparel in the future through new product programs and licenses.
We believe we must continue to invest in our lifestyle brands to take advantage of their long-term growth opportunities. Investments include capital expenditures primarily related to the direct to consumer operations, such as technology enhancements, e-commerce initiatives and retail store and restaurant build-out for new, relocated or remodeled
5
locations, as well as distribution center and administrative office expansion initiatives. Additionally, we anticipate increased employment and other costs to support ongoing business operations and fuel future sales growth.
In the midst of the changes in our industry, an important initiative for us in recent years was to increase the profitability of the Tommy Bahama business. These initiatives generally focused on increasing gross margin and operating margin through efforts such as: product cost reductions; selective price increases; reducing inventory purchases; redefining our approach to inventory clearance; effectively managing controllable and discretionary operating expenses; taking a more conservative approach to retail store openings and lease renewals; and continuing our efforts to reduce Asia-Pacific operating losses. While progress was made on these initiatives in both
Fiscal 2018
and Fiscal 2017, we expect to make further progress on improving the profitability of the Tommy Bahama business in the future.
We continue to believe it is important to maintain a strong balance sheet and liquidity. We believe positive cash flow from operations, coupled with the strength of our balance sheet and liquidity, will provide us with sufficient resources to fund future investments in our owned lifestyle brands. While we believe we have significant opportunities to appropriately deploy our capital and resources in our existing lifestyle brands, our strong cash flows from operations provide us the ability to continue to evaluate opportunities to add additional lifestyle brands to our portfolio in the future if we identify appropriate targets that meet our investment criteria. While we are actively exploring acquisition opportunities, investment opportunities for the types of large brands with the attributes that we desire are not always available at an acceptable price. Therefore, our interest in acquiring smaller brands and earlier stage companies has increased in recent years, particularly in businesses where we may have the opportunity to more fully integrate the brand into our existing infrastructure and shared services functions.
Important factors relating to certain risks, many of which are beyond our ability to control or predict, which could impact our business are described in Part I, Item 1A. Risk Factors of this report.
Operating Groups
Our business is primarily operated through our Tommy Bahama, Lilly Pulitzer, Lanier Apparel and Southern Tide operating groups. We identify our operating groups based on the way our management organizes the components of our business for purposes of allocating resources and assessing performance. Our operating group structure reflects a brand-focused management approach, emphasizing operational coordination and resource allocation across each brand's direct to consumer, wholesale and licensing operations, as applicable.
Tommy Bahama, Lilly Pulitzer and Southern Tide each design, source, market and distribute apparel and related products bearing their respective trademarks and license their trademarks for other product categories, while Lanier Apparel designs, sources and distributes branded and private label men's tailored clothing, sportswear and other products. Corporate and Other is a reconciling category for reporting purposes and includes our corporate offices, substantially all financing activities, the elimination of inter-segment sales and any other items that are not allocated to the operating groups including LIFO accounting adjustments. Because our LIFO inventory pool does not correspond to our operating group definitions, LIFO inventory accounting adjustments are not allocated to the operating groups. Corporate and Other also includes the operations of other businesses which are not included in our operating groups. The operations of TBBC, which we acquired in December 2017, and our Lyons, Georgia distribution center are included in Corporate and Other.
For additional information about each of our operating groups, see Part II, Item 7. Management's Discussion and Analysis of Financial Condition and Results of Operations, and Note 2 to our consolidated financial statements, each included in this report. The table below presents certain financial information about each of our operating groups, as well as Corporate and Other (in thousands).
6
|
Fiscal 2018
|
Fiscal 2017
|
Fiscal 2016
|
|||||||
|
Net Sales
|
|
|
|||||||
|
Tommy Bahama
|
$
|
675,358
|
|
$
|
686,021
|
|
$
|
658,911
|
|
|
Lilly Pulitzer
|
272,299
|
|
248,931
|
|
233,294
|
|
|||
|
Lanier Apparel
|
100,471
|
|
106,852
|
|
100,753
|
|
|||
|
Southern Tide
|
45,248
|
|
40,940
|
|
27,432
|
|
|||
|
Corporate and Other
|
14,090
|
|
3,467
|
|
2,198
|
|
|||
|
Total net sales
|
$
|
1,107,466
|
|
$
|
1,086,211
|
|
1,022,588
|
|
|
|
Operating Income (Loss)
|
|
|
|||||||
|
Tommy Bahama
|
$
|
53,139
|
|
$
|
55,002
|
|
$
|
44,101
|
|
|
Lilly Pulitzer
|
47,239
|
|
46,608
|
|
51,995
|
|
|||
|
Lanier Apparel
|
5,057
|
|
6,546
|
|
6,955
|
|
|||
|
Southern Tide
|
5,663
|
|
4,504
|
|
(282
|
)
|
|||
|
Corporate and Other (1)
|
(20,506
|
)
|
(26,660
|
)
|
(12,885
|
)
|
|||
|
Total Operating Income
|
$
|
90,592
|
|
$
|
86,000
|
|
89,884
|
|
|
|
(1)
Corporate and Other included a LIFO accounting charge of $0.8 million, a LIFO accounting charge of $7.8 million and a LIFO accounting credit of $5.9 million in Fiscal 2018, Fiscal 2017 and Fiscal 2016, respectively.
|
|||||||||
The table below presents the total assets of each of our operating groups (in thousands).
|
February 2, 2019
|
February 3, 2018
|
|||||
|
Assets
|
|
|
||||
|
Tommy Bahama
|
$
|
439,353
|
|
$
|
439,871
|
|
|
Lilly Pulitzer
|
152,113
|
|
142,882
|
|
||
|
Lanier Apparel
|
54,369
|
|
31,575
|
|
||
|
Southern Tide
|
97,939
|
|
94,032
|
|
||
|
Corporate and Other
(1)
|
(16,520
|
)
|
(8,419
|
)
|
||
|
Total Assets
|
$
|
727,254
|
|
$
|
699,941
|
|
|
(1)
Total assets for Corporate and Other include LIFO reserves of $62.1 million and $61.5 million as of February 2, 2019 and February 3, 2018, respectively.
|
||||||
Tommy Bahama
Tommy Bahama designs, sources, markets and distributes men's and women's sportswear and related products. Tommy Bahama's typical consumer is older than 45 years old, has a household annual income in excess of $100,000, lives in or travels to warm weather and resort locations and embraces a relaxed and casual approach to daily living. Tommy Bahama products can be found in our Tommy Bahama stores and on our Tommy Bahama e-commerce website, tommybahama.com, as well as at better department stores, independent specialty stores and multi-branded e-commerce retailers. We also operate Tommy Bahama restaurants and license the Tommy Bahama name for various product categories. During
Fiscal 2018
, 95% of Tommy Bahama's sales were to customers within the United States, with the remaining sales in Canada, Australia and Asia.
We believe that the attraction to our consumers of the Tommy Bahama brand, which was founded in 1992, is a reflection of our efforts over many years to maintain appropriate quality and design of our Tommy Bahama apparel, accessories and licensed products, limit the distribution of Tommy Bahama products to a select tier of retailers, and effectively communicate the relaxed and casual Tommy Bahama lifestyle. We expect to continue to follow this approach for the brand in the future. We believe that the retail sales value of all Tommy Bahama branded products sold during
Fiscal 2018
, including our estimate of retail sales by our wholesale customers and other third party retailers, exceeded $1.2 billion.
We believe there is ample opportunity to expand the reach of the Tommy Bahama brand, while maintaining the select distribution that Tommy Bahama has historically maintained. In order to take advantage of opportunities for long-term growth, we must continue to invest in the Tommy Bahama brand. These investments include capital expenditures and ongoing expenses to enhance e-commerce and other technology capabilities; open new stores and restaurants; remodel and/or relocate existing stores and restaurants; maintain and upgrade our distribution and other facilities; and enhance our marketing efforts to communicate the lifestyle to existing and targeted new consumers.
7
We believe there are opportunities for continued growth in the United States primarily through direct to consumer expansion. In recent years, an important initiative for us has been to increase the profitability of the Tommy Bahama business. These initiatives generally focused on increasing gross margin and operating margin through efforts such as: product cost reductions; selective price increases; reducing inventory purchases; redefining our approach to inventory clearance; effectively managing controllable and discretionary operating expenses; taking a more conservative approach to retail store openings and lease renewals; and continuing our efforts to reduce Asia-Pacific operating losses. While progress was made on these initiatives in both
Fiscal 2018
and Fiscal 2017, we expect to make further progress on improving the profitability of the Tommy Bahama business in the future.
During Fiscal 2018, we incurred certain charges related to the restructure and downsizing of our Tommy Bahama Japan operations, including the Fiscal 2018 early lease termination and closure of the Tommy Bahama Ginza flagship retail-restaurant location, for which the lease was previously scheduled to expire in 2022. These charges included in Tommy Bahama totaled $4 million in Fiscal 2018 and are discussed in Note 12 to our consolidated financial statements. Following the closure of the Ginza retail store, we maintain a limited presence in Japan, which will allow us to continue to review various alternatives for the Tommy Bahama brand in Japan. We expect that operating results in our Tommy Bahama Asia-Pacific operations should be near break-even going forward after incurring losses each year since our entry into the Asia-Pacific market in 2012.
Design, Sourcing, Marketing and Distribution
Tommy Bahama products are designed by product specific teams who focus on the target consumer. The design process includes feedback from buyers, consumers and sales agents, along with market trend research. Our Tommy Bahama apparel products generally incorporate fabrics made of cotton, silk, linen, nylon, leather, tencel and other natural and man-made fibers, or blends of two or more of these materials.
We operate a buying office located in Hong Kong to manage the production and sourcing of the substantial majority of our Tommy Bahama products. During
Fiscal 2018
, we utilized approximately 185 suppliers to manufacture our Tommy Bahama products and 70% of Tommy Bahama's product purchases were from manufacturers in China. The largest 10 suppliers of Tommy Bahama products provided 50% of the products acquired during
Fiscal 2018
, with no individual supplier providing more than 10%.
Advertising and marketing are an integral part of the long-term strategy for the Tommy Bahama brand, and we therefore devote significant resources to these efforts. While advertising for Tommy Bahama promotes our products, the primary emphasis is on brand image and brand lifestyle. Tommy Bahama's advertising attempts to engage individuals within the brand's consumer demographic and guide them on a regular basis to our retail stores, e-commerce websites or wholesale customers' stores and websites in search of our products. The marketing of the Tommy Bahama brand includes email, internet and social media advertising and traditional media such as catalogs, print and other communications, as well as moving media and trade show initiatives. As a lifestyle brand, we believe that it is very important that Tommy Bahama communicate regularly with consumers about product offerings or other brand events in order to maintain and strengthen Tommy Bahama's guest connections.
We also believe that highly visible full-price retail store locations with creative design, broad merchandise selection and brand appropriate visual presentation are key enticements for customers. We intend for our full-price retail stores to enhance our guests' shopping experience, which we believe will increase brand loyalty. Marketing initiatives at our full-price retail stores may include special event promotions and a variety of public relations activities designed to create awareness of our products, including those that support worthwhile causes in local communities.
In addition, we utilize loyalty award cards, Flip Side events and Friends & Family events to drive traffic to our stores and websites. These initiatives are effective in increasing traffic as the proportion of our sales that occur during our marketing initiatives have increased in recent years, which puts some downward pressure on our direct to consumer gross margins. We believe our traditional and digital media communications increase the sales of our own full-price retail stores and e-commerce operations, as well as the sales of our products for our wholesale customers.
For certain wholesale customers, we also provide point-of-sale materials and signage to enhance the presentation of our products and/or participate in cooperative advertising programs.
We operate a Tommy Bahama distribution center in Auburn, Washington, which serves our North America direct to consumer and wholesale operations. Activities at the distribution center include receiving finished goods from suppliers, inspecting the products and shipping the products to our Tommy Bahama stores, our wholesale customers and our e-commerce customers. We seek to maintain sufficient levels of Tommy Bahama inventory at the distribution center to support our direct to consumer operations, as well as pre-booked orders and some limited replenishment ordering for our wholesale customers. We use local third party distribution centers for our Asia-Pacific operations.
8
Direct to Consumer Operations
A key component of our Tommy Bahama growth strategy is to operate our own stores and e-commerce websites, which we believe permits us to develop and build brand awareness by presenting our products in a setting specifically designed to showcase the aspirational lifestyle on which the products are based. Our Tommy Bahama direct to consumer channels, which consist of retail store, e-commerce and restaurant operations, in the aggregate, represented 79% of Tommy Bahama's net sales in
Fiscal 2018
. We expect the percentage of our Tommy Bahama sales which are direct to consumer sales will continue to increase in future years. Retail store, e-commerce and restaurant net sales accounted for 48%, 18% and 13%, respectively, of Tommy Bahama's net sales in
Fiscal 2018
.
Our direct to consumer strategy for the Tommy Bahama brand includes locating and operating full-price retail stores in upscale malls, lifestyle shopping centers, resort destinations and brand-appropriate street locations. Generally, we seek to locate our full-price retail stores in shopping areas and malls that have high-profile or upscale consumer brand adjacencies. As of
February 2, 2019
, the majority of our Tommy Bahama full-price retail stores were in street-front locations or lifestyle centers with the remainder primarily in regional indoor malls. Our full-price retail stores allow us the opportunity to carry a full line of current season merchandise, including apparel, home products and accessories, all presented in an aspirational, island-inspired atmosphere designed to be relaxed, comfortable and unique. We believe that the Tommy Bahama full-price retail stores provide high visibility for the brand and products and allow us to stay close to the preferences of our consumers. Further, we believe that our presentation of products and our strategy to operate the full-price retail stores with limited in-store promotional activities are good for the Tommy Bahama brand and, in turn, enhance business with our wholesale customers. Generally, we believe there are opportunities for additional full-price retail stores in both warmer and colder climates, as we believe the more important consideration is whether the location attracts the affluent consumer that we are targeting. We believe that we have opportunities for continued direct to consumer sales growth for our Tommy Bahama women's business, which represented 30% of sales in our full-price direct to consumer operations in
Fiscal 2018
and
Fiscal 2017
compared to 28% in Fiscal 2016. In
Fiscal 2018
, approximately one-fourth of the sales of women's product in our full-price direct to consumer operations were swimwear, cover-ups and swim-related products.
Disposal of discontinued or end of season inventory is an ongoing part of any apparel business and, historically, Tommy Bahama has utilized its outlet stores and sales to off-price retailers to sell its excess inventory. Our Tommy Bahama outlet stores, which generated 9% of our total Tommy Bahama net sales in
Fiscal 2018
, are generally located in outlet shopping centers that include upscale retailers and serve an important role in overall inventory management by often allowing us to sell discontinued and out-of-season products at better prices than are otherwise available from outside parties. We believe that this approach has helped us protect the integrity of the Tommy Bahama brand by allowing our full-price retail stores to limit promotional activity while controlling the distribution of discontinued and out-of-season product. To supplement the clearance items sold in Tommy Bahama outlets, approximately 20% of the product sold in our Tommy Bahama outlets was made specifically for our outlets. We anticipate that we would generally operate one outlet for approximately every three full-price retail stores. In Fiscal 2018, we closed two outlets and opened one outlet.
In an effort to improve the profitability of our end of season clearance strategy for our products, commencing in 2017, we initiated selected initial markdowns in our full-price retail stores and on our e-commerce website for end of season product and disposed of more end of season inventory for women's, home and other product categories through off-price retailers than we have historically. We expect to continue this clearance model, which has reduced the quantity of end of season product that is transferred to our outlets. We believe that this model has improved the product offering and presentation in our outlet stores and has improved the profitability of our end of season clearance sales.
For Tommy Bahama's domestic full-price retail stores and retail-restaurant locations operating for the full
Fiscal 2018
year, sales per gross square foot, excluding restaurant sales and restaurant space, were approximately $610 during
Fiscal 2018
. In
Fiscal 2018
, our domestic outlet stores generated approximately $340 of sales per square foot for outlets open for the entire 2018 fiscal year.
As of
February 2, 2019
, we operated
17
Tommy Bahama restaurants including Marlin Bar locations, generally adjacent to a Tommy Bahama full-price retail store location. These retail-restaurant locations, which generate approximately 25% of Tommy Bahama's net sales, provide us with the opportunity to immerse customers in the ultimate Tommy Bahama experience. We do not anticipate that the majority of our retail locations will have an adjacent restaurant; however, in select high-profile, brand appropriate locations, such as Naples, Florida, Waikiki, Hawaii, and New York City, we have determined that an adjacent restaurant can further enhance the image or exposure of the brand. The net sales per square foot in our domestic full-price retail stores which are adjacent to a restaurant are on average twice the sales per square foot of our other domestic full-price retail stores. We believe that the customer immersing themselves into the Tommy Bahama lifestyle by having a meal or a drink at the Tommy Bahama restaurant and visiting the adjacent retail store may entice the customer to purchase additional Tommy Bahama merchandise and potentially provide a memorable consumer experience that further enhances the relationship between Tommy Bahama and the consumer. During Fiscal 2016, we opened our first Marlin Bar
9
concept location in Estero, Florida. In Fiscal 2018, we opened our second Marlin Bar concept location in Palm Springs, California. The Marlin Bar concept, like our traditional restaurant locations, is adjacent to one of our retail locations and serves food and beverages, but in a smaller space and with food options more focused on small plate offerings rather than entrees. The first two Marlin Bar locations, in both the restaurant and full-price retail store sales of the location, have provided nice financial results to date. We believe that with the smaller footprint, reduced labor requirements and lower required capital expenditure for build-out, the Marlin Bar concept provides us with the long-term potential for opening retail-restaurant locations in sites that otherwise may not have been suitable or brand appropriate for one of our traditional retail-restaurant locations.
As of
February 2, 2019
, the total square feet of space utilized for our Tommy Bahama full-price retail store and outlet store operations was 0.6 million with another 0.1 million of total square feet utilized in our Tommy Bahama restaurant operations. The table below provides certain information regarding Tommy Bahama retail stores and restaurants operated by us as of
February 2, 2019
.
|
Full-Price Retail Stores
|
Outlet Stores
|
Retail-Restaurant
Locations (1) |
Total
|
|||||
|
Florida
|
20
|
|
5
|
|
5
|
|
30
|
|
|
California
|
16
|
|
5
|
|
4
|
|
25
|
|
|
Texas
|
7
|
|
4
|
|
2
|
|
13
|
|
|
Hawaii
|
4
|
|
1
|
|
3
|
|
8
|
|
|
Nevada
|
4
|
|
1
|
|
1
|
|
6
|
|
|
Maryland
|
3
|
|
2
|
|
—
|
|
5
|
|
|
New York
|
2
|
|
2
|
|
1
|
|
5
|
|
|
Other states
|
38
|
|
13
|
|
1
|
|
52
|
|
|
Total domestic
|
94
|
|
33
|
|
17
|
|
144
|
|
|
Canada
|
8
|
|
2
|
|
—
|
|
10
|
|
|
Total North America
|
102
|
|
35
|
|
17
|
|
154
|
|
|
Australia
|
10
|
|
2
|
|
—
|
|
12
|
|
|
Japan
|
1
|
|
—
|
|
—
|
|
1
|
|
|
Total
|
113
|
|
37
|
|
17
|
|
167
|
|
|
Average square feet per store
(2)
|
3,400
|
|
4,700
|
|
4,300
|
|
|
|
|
Total square feet at year end
(2)
|
380,000
|
|
175,000
|
|
75,000
|
|
|
|
|
(1)
Consists of 15 retail-restaurant locations of our traditional island format and two Marlin Bar retail-restaurant locations.
|
||||||||
|
(2)
Square feet for retail-restaurant locations consists of retail space square feet and excludes square feet used in the associated restaurant operations.
|
||||||||
The table below reflects the changes in store count for Tommy Bahama stores during
Fiscal 2018
.
|
Full-Price Retail Stores
|
Outlet Stores
|
Retail-Restaurant
Locations |
Total
|
|||||
|
Open as of beginning of fiscal year
|
110
|
|
38
|
|
18
|
|
166
|
|
|
Opened
|
3
|
|
1
|
|
1
|
|
5
|
|
|
Closed
|
—
|
|
(2
|
)
|
(2
|
)
|
(4
|
)
|
|
Open as of end of fiscal year
|
113
|
|
37
|
|
17
|
|
167
|
|
We anticipate that our store count at the end of Fiscal 2019 will be comparable to our store count at the end of Fiscal 2018. We expect that much of our store opening activity in Fiscal 2019 will be in the second half of the year and focused on additional Marlin Bar locations. In Fiscal 2019 we expect to open three Marlin Bars consisting of two Marlin Bars which are a relocation and expansion of an existing retail store location and one of which is a new location. In Fiscal 2019 as well as in future years, we expect to opportunistically close certain marginal full-price retail and outlet locations at lease expiration unless the landlord provides a compelling offer for us to continue in the location. We believe there continue to be opportunities for Tommy Bahama to open additional full-price retail and retail-restaurant locations in the future, but we do not expect the number of locations to increase at the same pace as prior years and some of the growth may be conversions of full-price retail stores to retail-restaurant locations.
10
The operation of full-price retail stores, outlet stores and retail-restaurant locations requires a greater amount of initial capital investment than wholesale operations, as well as greater ongoing operating costs. We estimate that we will spend approximately $1 million on average in connection with the build-out of a domestic full-price retail store. However, individual locations, particularly those in urban locations, may require investments greater than these amounts depending on a variety of factors, including the location and size of the full-price retail store. The cost of a traditional Tommy Bahama retail-restaurant location and a Marlin Bar is significantly more than the cost of a full-price retail store and can vary significantly depending on a variety of factors. Historically, the cost of our retail-restaurant locations has been approximately $5 million; however, we have spent significantly more than that amount for certain locations and significantly less than this amount for our two Marlin Bar locations. For most of our retail stores and restaurants, the landlord provides certain incentives to fund a portion of our capital expenditures.
Additionally, we incur capital expenditure costs related to periodic remodels of existing stores, particularly when we renew or extend a lease beyond the original lease term, or otherwise determine that a remodel of a store is appropriate. We also incur capital expenditures when a lease expires, and we determine it is appropriate to relocate to a new location in the same vicinity as the previous store. The cost of store relocations is generally comparable to the costs of opening a new full-price retail store or outlet store. We anticipate that the capital expenditures for relocations and remodels, in the aggregate, may continue to increase in future periods.
In addition to our full-price retail stores and outlet stores, our direct to consumer approach includes various e-commerce websites, including the tommybahama.com website. During
Fiscal 2018
, e-commerce sales represented 18% of Tommy Bahama's net sales. Our Tommy Bahama websites allow consumers to buy Tommy Bahama products directly from us via the internet. These websites also enable us to increase our database of consumer contacts, which allows us to communicate directly and frequently with consenting consumers. As we reach more customers in the future, we anticipate that our e-commerce distribution channel for Tommy Bahama will continue to grow at a faster pace than our domestic full-price retail store operations or wholesale operations.
Wholesale Operations
To complement our direct to consumer operations and have access to a larger group of consumers, we continue to maintain our profitable wholesale operations for Tommy Bahama. Tommy Bahama's wholesale customers include better department stores, specialty stores and multi-brand e-commerce retailers that generally follow a retail model approach with limited discounting. We value our long-standing relationships with our wholesale customers and are committed to working with them to enhance the success of the Tommy Bahama brand within their stores.
Wholesale sales for Tommy Bahama accounted for 21% of Tommy Bahama's net sales in
Fiscal 2018
. Approximately 60% of Tommy Bahama's wholesale business reflects sales to major department stores with the remaining wholesale sales primarily sales to specialty stores. Tommy Bahama men's products are available in more than 1,800 retail locations in North America, while Tommy Bahama women's products are available in more than 1,100 retail locations in North America. During
Fiscal 2018
, 16% of Tommy Bahama's net sales were to Tommy Bahama's ten largest wholesale customers, with its largest customer representing 5% of Tommy Bahama's net sales.
We believe that the integrity and continued success of the Tommy Bahama brand, including its direct to consumer operations, is dependent, in part, upon controlled wholesale distribution, with careful selection of the retailers through which Tommy Bahama products are sold. As a result of our approach to limiting our wholesale distribution, we believe that sales growth in our men's apparel wholesale business, which represented approximately 86% of Tommy Bahama's domestic wholesale sales in
Fiscal 2018
, may be somewhat limited. However, we believe that we may have opportunities for wholesale sales increases for our Tommy Bahama women's business in the future, with its appeal evidenced by women's product representing 30% of sales in our full-price retail stores and e-commerce websites in
Fiscal 2018
.
We maintain Tommy Bahama apparel sales offices and showrooms in New York and Seattle, as well as other locations, to facilitate sales to our wholesale customers. Our Tommy Bahama wholesale operations utilize a sales force consisting of a combination of Tommy Bahama employees and independent commissioned sales representatives.
Licensing Operations
We believe licensing is an attractive business opportunity for the Tommy Bahama brand. For an established lifestyle brand, licensing typically requires modest additional investment but can yield high-margin income. It also affords the opportunity to enhance overall brand awareness and exposure. In evaluating a licensee for Tommy Bahama, we typically consider the candidate's experience, financial stability, sourcing expertise and marketing ability. We also evaluate the marketability and compatibility of the proposed licensed products with other Tommy Bahama products.
11
Our agreements with Tommy Bahama licensees are for specific geographic areas and expire at various dates in the future, and in limited cases include contingent renewal options. Generally, the agreements require minimum royalty payments as well as royalty payments based on specified percentages of the licensee's net sales of the licensed products as well as obligations to expend certain funds towards marketing the brand on an approved basis. Our license agreements generally provide us the right to approve all products, advertising and proposed channels of distribution. Third party license arrangements for our Tommy Bahama products include the following product categories:
|
Men's and women's headwear
|
Watches
|
Outdoor furniture and related products
|
|
Footwear
|
Belts, leather goods and gifts
|
Indoor furniture
|
|
Men's hosiery
|
Handbags
|
Mattresses and box springs
|
|
Sleepwear
|
Luggage
|
Bedding and bath linens
|
|
Shampoo, soap and bath amenities
|
Rugs
|
Table top accessories
|
|
Cigar accessories
|
Fragrances
|
Fabrics
|
In addition to our license arrangements for the specific product categories listed above, we may enter into certain international distributor agreements which allow those parties to distribute Tommy Bahama apparel and other products on a wholesale and/or retail basis within certain countries or regions. As of
February 2, 2019
, we have agreements for distribution of Tommy Bahama products in the Middle East, Greater China and parts of Latin America. Substantially all of the products sold by the distributors are identical to the products sold in our own Tommy Bahama stores. In addition to selling Tommy Bahama goods to wholesale accounts, the distributors may, in some cases, operate their own retail stores. As of
February 2, 2019
, we have licensed Tommy Bahama stores located in the Middle East, Greater China and Central America. None of these agreements are expected to generate growth that would materially impact the operating results of Tommy Bahama in the near term.
Seasonal Aspects of Business
Tommy Bahama's operating results are impacted by seasonality as the demand by specific product or style, as well as by distribution channel, may vary significantly depending on the time of year. Typically, the demand in the direct to consumer operations, including sales at our own stores and e-commerce sites, for Tommy Bahama products in our principal markets is generally higher in the spring, summer and holiday seasons and lower in the fall season. However, wholesale product shipments are generally shipped prior to each of the retail selling seasons. As the timing of certain unusual or non-recurring items, economic conditions, wholesale product shipments or other factors affecting the business may vary from one year to the next, we do not believe that net sales or operating income (loss) for any particular quarter or the distribution of net sales and operating income (loss) for
Fiscal 2018
are necessarily indicative of anticipated results for the full fiscal year or expected distribution in future years. The following table presents the percentage of net sales and operating income (loss) for Tommy Bahama by quarter for
Fiscal 2018
:
|
First Quarter
|
Second Quarter
|
Third Quarter
|
Fourth Quarter
|
|||||
|
Net sales
|
25
|
%
|
29
|
%
|
18
|
%
|
28
|
%
|
|
Operating income (loss)
|
27
|
%
|
39
|
%
|
(10
|
)%
|
44
|
%
|
Lilly Pulitzer
Lilly Pulitzer designs, sources, markets and distributes upscale collections of women's and girl's dresses, sportswear and related products. The Lilly Pulitzer brand was originally created in the late 1950s by Lilly Pulitzer and is an affluent brand with a heritage and aesthetic based on the Palm Beach resort lifestyle. The brand is somewhat unique among women's brands in that it has demonstrated multi-generational appeal, including among young women in college or recently graduated from college; young mothers with their daughters; and women who are not tied to the academic calendar. Lilly Pulitzer products can be found in our owned Lilly Pulitzer stores, in Lilly Pulitzer Signature Stores, which are described below, and on our Lilly Pulitzer website, lillypulitzer.com, as well as in better department and independent specialty stores. During
Fiscal 2018
, 50% and 35% of Lilly Pulitzer's net sales were for women's sportswear and dresses, respectively, with the remaining sales consisting of Lilly Pulitzer accessories, including scarves, bags, jewelry and belts; children's apparel; footwear; and licensed products.
We believe that there is significant opportunity to expand the reach of the Lilly Pulitzer brand, while at the same time maintaining the exclusive distribution that Lilly Pulitzer has historically maintained. We believe that in order to take advantage of opportunities for long-term growth, we must continue to invest in the Lilly Pulitzer brand. These investments include enhancing e-commerce and other technology capabilities; opening and operating full-price retail stores; remodeling and/or relocating existing stores; and increasing employment, advertising and other functions to support a growing business. While we believe that these investments will generate long-term benefits, the investments may have a short-term negative impact on
12
Lilly Pulitzer's operating margin, particularly if there is insufficient sales growth to absorb the incremental costs in a particular year.
We believe the attraction of the Lilly Pulitzer brand to our consumers is a reflection of years of maintaining appropriate quality and design of the Lilly Pulitzer apparel, accessories and licensed products, restricting the distribution of the Lilly Pulitzer products to a select tier of retailers and effectively communicating the message of Lilly Pulitzer's optimistic Palm Beach resort chic lifestyle. We believe this approach to quality, design, distribution and communication has been critical in allowing us to achieve the current retail price points for Lilly Pulitzer products. We believe that the retail sales value of all Lilly Pulitzer branded products sold during
Fiscal 2018
, including our estimate of retail sales by our wholesale customers and other third party retailers, exceeded $325 million.
Design, Sourcing, Marketing and Distribution
Lilly Pulitzer's products are developed by our dedicated design teams located at the Lilly Pulitzer headquarters in King of Prussia, Pennsylvania as well as in Palm Beach, Florida. Our Lilly Pulitzer design teams focus on the target consumer, and the design process combines feedback from buyers, consumers and our sales force, along with market trend research. Lilly Pulitzer apparel products are designed to incorporate various fiber types, including cotton, silk, linen and other natural and man-made fibers, or blends of two or more of these materials.
Lilly Pulitzer uses a combination of in-house employees in our King of Prussia and Hong Kong offices and third party buying agents primarily based in Asia to manage the production and sourcing of its apparel products. Through its buying agents and direct sourcing, Lilly Pulitzer used approximately 50 vendors, with no individual supplier providing more than 10% and the largest 10 suppliers providing 55%, of the products acquired during
Fiscal 2018
. In
Fiscal 2018
, 50% of Lilly Pulitzer's product purchases were from manufacturers located in China.
Advertising and marketing are an integral part of the long-term strategy of the Lilly Pulitzer brand, and we therefore devote significant resources to advertising and marketing. Lilly Pulitzer's advertising attempts to engage individuals within the brand's consumer demographic and guide them on a regular basis to our full-price retail stores, e-commerce websites and wholesale customers' stores and websites in search of our products. The marketing of the Lilly Pulitzer brand includes email, internet and social media advertising as well as traditional media such as catalogs, print and other communications and moving media and trade show initiatives. We believe that it is very important that a lifestyle brand effectively communicate with consumers on a regular basis about product offerings or other brand events in order to maintain and strengthen the brand's connections with guests.
In addition to our ongoing Lilly Pulitzer marketing initiatives, on occasion we also enter into collaborations with third parties to increase brand awareness or create additional brand excitement like we did with S'well water bottles and Pottery Barn in recent years. Often these collaborations do not generate material direct revenue for Lilly Pulitzer, but instead provide significant press or social media exposure and excitement for the brand that complement our ongoing advertising and marketing initiatives. We believe in today's environment it is important to continue to find new, creative ways to advertise in order to differentiate the brand.
We believe that highly visible full-price retail store locations with creative design, broad merchandise selection and brand appropriate visual presentation are key enticements for customers to visit our full-price retail stores and buy merchandise. We believe that full-price retail stores enhance the shopping experience of our customers, which will increase consumer brand loyalty. Marketing initiatives at certain of our full-price retail stores may include special event promotions and a variety of public relations activities designed to create awareness of our stores and products and in some cases including "shop and share" events benefiting local charities. At certain times during the year, an integral part of the marketing plan for Lilly Pulitzer includes certain gift with purchase programs where the consumer earns the right to a Lilly Pulitzer gift product if certain spending thresholds are achieved. We believe that our full-price retail store operations, as well as our traditional and digital media communications and periodic collaborations with others, enhance brand awareness and increase the sales of Lilly Pulitzer products in all channels of distribution.
For certain of our wholesale customers, we also provide point-of-sale materials and signage to enhance the presentation of our branded products at their retail locations and/or participate in cooperative advertising programs.
Lilly Pulitzer operates a distribution center in King of Prussia, Pennsylvania. Activities at the distribution center include receiving finished goods from suppliers, inspecting the products and shipping the products to wholesale customers, Lilly Pulitzer full-price retail stores and our e-commerce customers. We seek to maintain sufficient levels of inventory at the distribution center to support our direct to consumer operations, as well as pre-booked orders and some limited replenishment ordering for our wholesale customers.
Direct to Consumer Operations
13
A key component of our Lilly Pulitzer growth strategy is to operate our own stores and e-commerce website, which we believe permits us to develop and build brand awareness by presenting products in a setting specifically designed to showcase the aspirational lifestyle on which they are based. Lilly Pulitzer's direct to consumer distribution channel, which consists of full-price retail store and e-commerce operations, represented 78% and 72% of Lilly Pulitzer's net sales in
Fiscal 2018
and
Fiscal 2017
, respectively. We expect the percentage of our Lilly Pulitzer sales which are direct to consumer sales will continue to increase in future years, but at a much more modest pace than the
Fiscal 2018
increase.
Our direct to consumer strategy for the Lilly Pulitzer brand includes operating full-price retail stores in higher-end malls, lifestyle shopping centers, resort destinations and brand-appropriate street locations. Sales at our full-price retail stores represented 42% of Lilly Pulitzer's net sales during
Fiscal 2018
. As of
February 2, 2019
, about one-third of our Lilly Pulitzer stores were located in outdoor regional lifestyle centers and another one-third of our Lilly Pulitzer stores were located in indoor regional malls, with the remaining locations in resort or street locations. In certain resort locations such as Nantucket, Martha's Vineyard and Watch Hill, our stores are only open during the resort season. Additionally, we may open temporary pop-up stores in certain locations.
Each full-price retail store carries a wide range of merchandise, including apparel, footwear and accessories, all presented in a manner intended to enhance the Lilly Pulitzer image, brand awareness and acceptance. Our Lilly Pulitzer full-price retail stores allow us to present Lilly Pulitzer's full line of current season products. We believe our Lilly Pulitzer full-price retail stores provide high visibility for the brand and products and enable us to stay close to the needs and preferences of consumers. We also believe that our presentation of products and our strategy to operate the full-price retail stores with limited promotional activities complement our business with our wholesale customers. Generally, we believe there are opportunities for full-price retail stores in both warmer and cooler climates, as we believe the more important consideration is whether the location attracts the affluent consumer that we are targeting.
Lilly Pulitzer's full-price retail store sales per gross square foot for
Fiscal 2018
were approximately $725 for the full-price retail stores which were open the full
Fiscal 2018
year compared to approximately $800 for the Lilly Pulitzer stores open for the full
Fiscal 2017
. The decrease in sales per gross square foot was primarily due to the impact of smaller market seasonal and resort location stores opened, including acquired Signature Stores, during Fiscal 2017, partially offset by positive comparable store sales. The table below provides certain information regarding Lilly Pulitzer full-price retail stores as of
February 2, 2019
.
|
|
Number of
Full-Price Retail Stores
|
|
|
Florida
|
18
|
|
|
Massachusetts
|
7
|
|
|
Virginia
|
6
|
|
|
Maryland
|
3
|
|
|
New York
|
3
|
|
|
North Carolina
|
3
|
|
|
Ohio
|
3
|
|
|
Texas
|
3
|
|
|
Other
|
16
|
|
|
Total
|
62
|
|
|
Average square feet per store
|
2,600
|
|
|
Total square feet at year-end
|
160,000
|
|
The table below reflects the changes in store count for Lilly Pulitzer stores during
Fiscal 2018
.
|
|
Full-Price Retail Stores
|
|
|
Open as of beginning of fiscal year
|
57
|
|
|
Opened
|
5
|
|
|
Open as of end of fiscal year
|
62
|
|
After increasing our store count by five stores in Fiscal 2018, including opening stores on Worth Avenue in Palm Beach, Florida and at Whalers Village in Maui, Hawaii, we expect to open stores at a more modest pace in Fiscal 2019. In the First Quarter of Fiscal 2019, we opened a Lilly Pulitzer store in Newport Beach, California. The operation of full-price retail
14
stores requires a greater amount of initial capital investment than wholesale operations, as well as greater ongoing operating costs. We anticipate that most future full-price retail store openings will generally be 2,500 square feet on average; however, the determination of actual size of the store will depend on a variety of criteria. To open a 2,500 square foot Lilly Pulitzer full-price retail store, we anticipate capital expenditures of approximately $1 million on average. For most of our full-price retail stores, the landlord provides certain incentives to fund a portion of our capital expenditures.
In addition to new store openings, we also incur capital expenditure costs related to remodels, expansions or downsizing of existing stores, particularly when we renew or extend a lease beyond the original lease term, or otherwise determine that a remodel of a store is appropriate. We may also incur capital expenditures if we determine it is appropriate to relocate a store to a new location. The cost of store relocations, if any, will generally be comparable to the cost of opening a new store. Alternatively, when a lease expires we may decide to close the store rather than relocating the store to another location or renewing the lease.
In addition to operating Lilly Pulitzer full-price retail stores, another key element of our direct to consumer strategy is the lillypulitzer.com website, which represented 36% of Lilly Pulitzer's net sales in
Fiscal 2018
compared to 34% in
Fiscal 2017
. The Lilly Pulitzer e-commerce business has experienced significant growth in recent years, and we anticipate that the rate of growth of the e-commerce business will remain strong in the future. We also utilize the Lilly Pulitzer website as an effective means of liquidating discontinued or out-of-season inventory in a brand appropriate manner and at gross margins in excess of 40% via e-commerce flash clearance sales. These sales are brand appropriate events that create a significant amount of excitement with loyal Lilly Pulitzer consumers, who are looking for an opportunity to purchase Lilly Pulitzer products at a discounted price. These e-commerce flash clearance sales typically run for three days during the summer clearance period in August or September and for two days during the post-holiday clearance period in January, allowing the Lilly Pulitzer website to remain full-price for the remaining 360 days of the year. During
Fiscal 2018
, approximately 46% of Lilly Pulitzer's e-commerce sales were e-commerce flash clearance sales.
Wholesale Operations
To complement our direct to consumer operations and have access to a larger group of consumers, we continue to maintain our profitable wholesale operations for Lilly Pulitzer. These wholesale operations are primarily with independent specialty stores, Signature Stores, better department stores and multi-branded e-commerce retailers that generally follow a retail model approach with limited discounting. During
Fiscal 2018
, approximately 22% of Lilly Pulitzer's net sales were sales to wholesale customers compared to 28% in
Fiscal 2017
with the decrease primarily due to Lilly Pulitzer's acquisition of 12 Signature Stores in Fiscal 2017 and reduced sales to department stores as Lilly Pulitzer continues to manage its distribution in wholesale accounts. During
Fiscal 2018
, about one-third of Lilly Pulitzer's wholesale sales were to Lilly Pulitzer's Signature Stores, one-fourth of Lilly Pulitzer's wholesale sales were to specialty stores and one-fifth of Lilly Pulitzer's wholesale sales were to department stores. The remaining wholesale sales were primarily to national accounts, including on-line retailers, and off-price retailers. Lilly Pulitzer's net sales to its ten largest wholesale customers represented 11% of Lilly Pulitzer's net sales in
Fiscal 2018
with its largest customer representing less than 5% of Lilly Pulitzer's net sales.
An important part of Lilly Pulitzer's wholesale distribution is sales to Signature Stores. For these stores, we enter into agreements whereby we grant the other party the right to independently operate one or more stores as a Lilly Pulitzer Signature Store, subject to certain conditions, including designating substantially all the store specifically for Lilly Pulitzer products and adhering to certain trademark usage requirements. These agreements are generally for a two-year period. We sell products to these Lilly Pulitzer Signature Stores on a wholesale basis and do not receive royalty income associated with these sales. As of
February 2, 2019
, there were 48 Lilly Pulitzer Signature Stores.
We believe that the integrity and continued success of the Lilly Pulitzer brand, including its direct to consumer operations, is dependent, in part, upon controlled wholesale distribution with careful selection of the retailers through which Lilly Pulitzer products are sold. We continue to value our long-standing relationships with our wholesale customers and are committed to working with them to enhance the success of the Lilly Pulitzer brand within their stores. Lilly Pulitzer apparel products are available in approximately 250 wholesale doors.
We maintain Lilly Pulitzer apparel sales offices and showrooms in Palm Beach, Florida, King of Prussia, Pennsylvania and New York City. Our wholesale operations for Lilly Pulitzer utilize a sales force consisting of salaried sales employees.
Licensing Operations
We license the Lilly Pulitzer trademark to licensees in categories beyond Lilly Pulitzer's core product categories. In the long term, we believe licensing may be an attractive business opportunity for the Lilly Pulitzer brand, particularly once our direct to consumer presence has expanded. Once a brand is established, licensing requires modest additional investment but can yield high-margin income. It also affords the opportunity to enhance overall brand awareness and exposure. In evaluating a potential Lilly Pulitzer licensee, we consider the candidate's experience, financial stability, manufacturing performance and
15
marketing ability. We also evaluate the marketability and compatibility of the proposed products with other Lilly Pulitzer branded products.
Our agreements with Lilly Pulitzer licensees are for specific geographic areas and expire at various dates in the future. Generally, the agreements require minimum royalty payments as well as royalty and advertising payments based on specified percentages of the licensee's net sales of the licensed products. Our license agreements generally provide us the right to approve all products, advertising and proposed channels of distribution.
Third party license arrangements for Lilly Pulitzer products include the following product categories: stationery and gift products; home furnishing fabrics; and eyewear.
Seasonal Aspects of Business
Lilly Pulitzer's operating results are impacted by seasonality as the demand by specific product or style as well as demand by distribution channel may vary significantly depending on the time of year. Typically, the demand in the direct to consumer operations for Lilly Pulitzer products is generally higher in the spring, summer and resort seasons and lower in the fall season. However, wholesale product shipments are generally shipped prior to each of the retail selling seasons. Further, in the third and fourth quarters of our fiscal year, which have not historically been strong direct to consumer or wholesale quarters for Lilly Pulitzer, Lilly Pulitzer has held significant e-commerce flash clearance sales which partially offsets the impact of seasonality on Lilly Pulitzer's sales, but to a lesser degree on operating income. As the timing of certain unusual or non-recurring items, economic conditions, wholesale product shipments, the magnitude of e-commerce flash clearance sales or other factors affecting the business may vary from one year to the next, we do not believe that net sales or operating income for any particular quarter or the distribution of net sales for
Fiscal 2018
are necessarily indicative of anticipated results for the full fiscal year or expected distribution in future years. The following table presents the percentage of net sales and operating income for Lilly Pulitzer by quarter for
Fiscal 2018
:
|
First Quarter
|
Second Quarter
|
Third Quarter
|
Fourth Quarter
|
|||||
|
Net sales
|
25
|
%
|
26
|
%
|
25
|
%
|
24
|
%
|
|
Operating income
|
34
|
%
|
39
|
%
|
20
|
%
|
7
|
%
|
Lanier Apparel
Lanier Apparel designs, sources and distributes branded and private label men's apparel, including tailored clothing, casual pants and sportswear, across a wide range of price points, but primarily at moderate price points. The majority of our Lanier Apparel products are sold under certain trademarks licensed to us by third parties. Lanier Apparel's licensed brands for certain product categories include Kenneth Cole®, Dockers®, Nick Graham® and Cole Haan®, which is a new license for Lanier Apparel with initial product sales in Fiscal 2018. Additionally, we design and market products for our owned Billy London®, Oxford® (formerly Oxford Golf®), Duck Head® and Strong Suit® brands. Both Duck Head and Strong Suit were acquired during Fiscal 2016. Sales of branded products licensed to us or owned by us represented 60% and 20%, respectively, of Lanier Apparel's net sales during
Fiscal 2018
.
In addition to these branded businesses, Lanier Apparel designs and sources private label apparel products for certain customers, including tailored clothing and pants programs for large department stores, warehouse clubs, and other retailers. Sales of private label products represented 20% of Lanier Apparel's net sales in
Fiscal 2018
. For our large retail customers, the private label programs offer the customer product exclusivity, generally at higher gross margins than they would achieve on branded products, while allowing us the opportunity to leverage our design, sourcing, production, logistics and distribution infrastructure. For other customers, we may perform any combination of design, sourcing, production, logistics or distribution services for a brand owner. In these cases, the brand owner may have determined it is more efficient to outsource certain functions, may be a smaller company that lacks such functional expertise or may want to focus their energies on the other aspects of their brand. Lanier Apparel is an efficient operator that excels in sourcing, production, logistics, distribution and design and can leverage its infrastructure by providing services and resources to these smaller brand owners.
Our Lanier Apparel products are primarily sold through large retailers including department stores, discount and off-price retailers, warehouse clubs, national chains, specialty retailers, multi-branded e-commerce retailers and others. Lanier Apparel's products are sold in more than 5,000 retail locations. In Lanier Apparel, we have long-standing relationships with some of the United States' largest retailers, including department stores which represented 30% of Lanier Apparel's sales in
Fiscal 2018
. During
Fiscal 2018
, Lanier Apparel's three largest customers represented 23%, 20%, and 17%, respectively, of Lanier Apparel's net sales. Sales to Lanier Apparel's 10 largest customers represented more than 80% of Lanier Apparel's net sales during
Fiscal 2018
. The amount and percentage of net sales attributable to an individual customer in future years may be different than
Fiscal 2018
as sales to wholesale customers are not tied to long-term contracts.
16
As certain of Lanier Apparel's private label and branded sales are program based, where Lanier Apparel must bid for a program on a case-by-case and season-by-season basis, an individual customer could increase, decrease or discontinue its purchases from us at any time. Thus, significant fluctuations in Lanier Apparel's operating results from one year to the next may result, particularly if a program is not renewed, the customer decides to use another vendor, we determine that the return on the program is not acceptable to us, a new program is initiated, there is a significant increase in the volume of the program or otherwise.
The moderate price point tailored clothing and sportswear markets are extremely competitive sectors, with significant retail competition as well as gross margin pressures due to retail sales price pressures and production cost increases. We believe that our Lanier Apparel business has historically excelled at bringing quality products to our customers at competitive prices and managing inventory risk appropriately while requiring minimal capital expenditure investments.
Design, Manufacturing, Sourcing, Marketing and Distribution
We believe that superior customer service and supply chain management, as well as the design of quality products, are all integral components of our strategy in the branded and private label tailored clothing and sportswear markets in which Lanier Apparel operates. Our Lanier Apparel design teams, which are primarily located in New York City and Atlanta, focus on the target consumer for each brand and product. The design process combines feedback from buyers and sales agents along with market trend research and input from manufacturers. Our various Lanier Apparel products are manufactured from a variety of fibers, including wool, silk, linen, cotton and other natural fibers, as well as synthetics and blends of these materials.
Lanier Apparel manages production in Asia and Latin America through the efforts of our Lanier Apparel offices in Atlanta and Hong Kong as well as third party buying agents. Lanier Apparel's sourcing operations are also supplemented, as appropriate, by third party contractors who may provide certain sourcing functions or in-country quality assurance to further enhance Lanier Apparel's global sourcing operations. During
Fiscal 2018
, almost two-thirds of Lanier Apparel's product purchases were from manufacturers located in Vietnam. Lanier Apparel purchased goods from approximately 135 suppliers in
Fiscal 2018
. The 10 largest suppliers of Lanier Apparel provided 90% of the finished goods and raw materials Lanier Apparel acquired from third parties during
Fiscal 2018
, with 30% of our product purchases acquired from Lanier Apparel's largest third party supplier. In addition to purchasing products from third parties, Lanier Apparel operates a manufacturing facility, located in Merida, Mexico, which produced 10% of our Lanier Apparel products during
Fiscal 2018
.
The advertising efforts of Lanier Apparel are much more product specific than the advertising for our owned lifestyle brands. For Lanier Apparel's licensed branded products, advertising primarily consists of cooperative advertising with our larger customers, contributions to the licensor based on a specified percentage of our net sales to fund the licensor's general brand advertising initiatives and attending brand appropriate trade shows. As a provider of private label apparel, we are generally not responsible for advertising for private label brands. For its owned brands, Lanier Apparel engages in marketing activities to increase the recognition and appeal of the brands.
For Lanier Apparel, we utilize a distribution center located in Toccoa, Georgia, a distribution center in Lyons, Georgia and certain third party distribution centers for our product shipments, where we receive goods from our suppliers, inspect those products and ship the goods to our customers. We seek to maintain sufficient levels of inventory to support programs for pre-booked orders and to meet customer demand for at-once ordering. For certain standard product styles, which represents about one-half of Lanier Apparel's net sales, we maintain in-stock replenishment programs, providing shipment to customers and consumers within just a few days of receiving the order. These types of programs generally require higher inventory levels. Lanier Apparel utilizes various off-price retailers to sell excess prior-season inventory.
We maintain apparel sales offices and showrooms for our Lanier Apparel products in several locations, including New York City and Atlanta and employ a sales force consisting primarily of salaried employees. Lanier Apparel operates websites for certain of its businesses and also ships orders directly to consumers who purchase products from the websites of certain of its wholesale customers. Sales to our customers where the consumer orders from the website of Lanier Apparel's wholesale customers, e-commerce retailers and catalog retailers as well as sales on Lanier Apparel's own websites represented more than 10% of Lanier Apparel's sales in
Fiscal 2018
.
Seasonal Aspects of Business
Lanier Apparel's operating results are impacted by seasonality as the demand by specific product or style may vary significantly depending on the time of year. As a wholesale apparel business, in which product shipments generally occur prior to the retail selling seasons, the seasonality of Lanier Apparel often reflects stronger spring and fall wholesale deliveries which typically occur in our first and third quarters; however, in some fiscal years this will not be the case due to certain of Lanier Apparel's operations resulting from program-driven businesses. The timing of certain unusual or non-recurring items, economic conditions, wholesale product shipments, the introduction of new programs, the loss of programs or customers or other factors affecting the business may vary significantly from one year to the next. Therefore, we do not believe that net sales or operating
17
income of Lanier Apparel for any particular quarter or the distribution of net sales and operating income for
Fiscal 2018
are necessarily indicative of anticipated results for the full fiscal year or expected distribution in future years. The following table presents the percentage of net sales and operating income for Lanier Apparel by quarter for
Fiscal 2018
:
|
First Quarter
|
Second Quarter
|
Third Quarter
|
Fourth Quarter
|
|||||
|
Net sales
|
20
|
%
|
24
|
%
|
29
|
%
|
27
|
%
|
|
Operating income
|
7
|
%
|
16
|
%
|
45
|
%
|
32
|
%
|
Southern Tide
We acquired the Southern Tide lifestyle apparel brand in Fiscal 2016. Southern Tide designs, sources, markets and distributes high-quality apparel bearing the distinctive Skipjack logo. Southern Tide offers an extensive selection of men’s shirts, pants, shorts, outerwear, ties, swimwear, footwear and accessories, as well as women's and youth collections. Launched in 2006, Southern Tide combines the modern design elements of today's youthful trends with love for the Southern culture and lifestyle. The brand has an appeal to all ages who have an appreciation for classic design, vibrant colors, a great fit and an affection for the coast. Southern Tide products can be found in independent specialty retailers, better department stores, Southern Tide Signature Stores as described below, and on our Southern Tide website, southerntide.com. During
Fiscal 2018
, 82% of Southern Tide's sales were wholesale sales and 18% of Southern Tide's sales were e-commerce sales.
We believe that there is significant opportunity to expand the reach of the Southern Tide brand by increasing the specialty store, department store and Signature Store presence of the brand, as well as increasing e-commerce sales. However, this growth and expansion will be at a prudent pace as we believe that the integrity and success of the Southern Tide brand is dependent, in part, upon controlled wholesale distribution with careful selection of the retailers through which Southern Tide products are sold.
We believe that in order to take advantage of opportunities for long-term growth, we must continue to invest in the Southern Tide brand. In the near term, these investments will primarily consist of an increase in employment, advertising and other costs to support a growing wholesale business with specialty and department stores, increasing the number of Southern Tide Signature Stores and costs to enhance e-commerce and other technology capabilities. While we believe that these investments will generate long-term benefits, the investments may have a short-term negative impact on Southern Tide's operating margin given the current size of the Southern Tide business. We believe that the retail sales value of all Southern Tide branded products sold during
Fiscal 2018
, including our estimate of retail sales by our wholesale customers and other third party retailers, exceeded $75 million.
Design, Sourcing, Marketing and Distribution
Southern Tide's products are developed by our dedicated design teams located at the Southern Tide headquarters in Greenville, South Carolina. Our Southern Tide design teams focus on the target consumer, and the design process combines feedback from buyers, consumers and our sales force, along with market trend research. Southern Tide apparel products are designed to incorporate various fiber types, including cotton and other natural and man-made fibers, or blends of two or more of these materials.
During
Fiscal 2018
, Southern Tide utilized our Hong Kong-based sourcing office to manage the production and sourcing of a majority of its apparel product purchases with the remaining product purchases via third party buying agents. Southern Tide used approximately 70 suppliers with the largest individual supplier providing 13% of the Southern Tide products in
Fiscal 2018
. Also, the largest 10 suppliers of Southern Tide provided 55% of the Southern Tide products acquired, and approximately 55% of Southern Tide apparel products were sourced from China.
Advertising and marketing are an integral part of the long-term strategy for the Southern Tide brand, and we therefore devote significant resources to advertising and marketing. Southern Tide's advertising attempts to engage individuals within the brand's consumer demographic and guide them on a regular basis to our e-commerce website and wholesale customers' stores and websites in search of our products. The marketing of the Southern Tide brand includes email, internet and social media advertising as well as traditional media such as catalogs, print and other correspondence with customers and moving media and trade show initiatives. We believe that it is very important that a lifestyle brand effectively communicate with consumers on a regular basis about product offerings or other brand events in order to maintain and strengthen the brand's connections with consumers. For certain of our wholesale customers, we also provide point-of-sale materials and signage to enhance the presentation of our branded products at their retail locations and/or participate in cooperative advertising programs. Additionally, Southern Tide enters into certain sponsorship or co-branding arrangements, which may be for a particular cause or non-profit organization, that the Southern Tide team believes will resonate with its target consumers.
18
Southern Tide utilizes our owned distribution center in Lyons, Georgia for its warehouse and distribution center operations. Activities at the distribution center include receiving finished goods from suppliers, inspecting the products and shipping the products to wholesale customers and our e-commerce customers as well as embroidery of certain collegiate, corporate and golf related products. We seek to maintain sufficient levels of inventory at the distribution center to support our direct to consumer operations, as well as pre-booked orders and some limited replenishment ordering for our wholesale customers.
Wholesale Operations
At this time, Southern Tide's business is predominantly a wholesale business with sales to independent specialty stores, department stores and Southern Tide Signature Stores. Southern Tide's wholesale operations provide an opportunity to grow our business and have access to a large group of consumers. During
Fiscal 2018
, approximately 16% of Southern Tide's sales were to department stores and 10% of net sales were to Southern Tide Signature Stores. Southern Tide's net sales to its ten largest wholesale customers represented 39% of Southern Tide's net sales in
Fiscal 2018
, with its largest customer representing 12% of Southern Tide's net sales. Southern Tide products are available in more than 1,000 retail locations.
A key component of Southern Tide's plans for growth in wholesale distribution is sales to Signature Stores. For Signature Stores, we enter into agreements whereby we grant the other party the right to independently operate one or more stores as a Southern Tide Signature Store, subject to certain conditions, including designating substantially all the store specifically for Southern Tide products and adhering to certain trademark usage requirements. We sell products to these Southern Tide Signature Stores on a wholesale basis and do not receive royalty income associated with these sales. As of
February 2, 2019
, there were 14 Signature Stores including stores in Massachusetts, Florida, North Carolina and South Carolina. We anticipate additional Signature Stores opening in Fiscal 2019. In addition, we believe there is opportunity for wholesale growth for Southern Tide in women's apparel, which represented 15% of Southern Tide's net sales in
Fiscal 2018
.
We maintain Southern Tide apparel sales offices and showrooms in Greenville, South Carolina. Our wholesale operations for Southern Tide utilize a sales force consisting of a combination of salaried sales employees and commissioned agents.
Direct to Consumer Operations
A key component of our Southern Tide growth strategy is to expand our direct to consumer operations, which currently consist of the Southern Tide website. The Southern Tide website markets a full line of merchandise, including apparel and accessories, all presented in a manner intended to enhance the Southern Tide image, brand awareness and acceptance. We believe our Southern Tide website enables us to stay close to the needs and preferences of consumers. Additionally, we are exploring the feasibility of opening company owned Southern Tide stores in the future.
In addition to off-price retailers, we also utilize the Southern Tide website as a means of liquidating discontinued or out-of-season inventory in a brand appropriate manner. During the year, we have a number of e-commerce flash clearance sales per year, which are typically in industry end of season promotional periods.
Licensing Operations
We currently license the Southern Tide trademark to licensees for certain bed, bath and tie product categories. The agreements require minimum royalty payments as well as royalty payments based on specified percentages of the licensee's net sales of the licensed products and provides us the right to approve all products, advertising and proposed channels of distribution. In the long term, we believe licensing may be an attractive business opportunity for Southern Tide, but opportunities may be somewhat limited until the sales volume and distribution of the Southern Tide brand expands. Once the brand is more fully established, licensing requires modest additional investment but can yield high-margin income. It also affords the opportunity to enhance overall brand awareness and exposure.
Seasonal Aspects of Business
Southern Tide's operating results are impacted by seasonality as the demand by specific product or style as well as the demand by distribution channel may vary significantly depending on the time of year. Southern Tide is primarily a wholesale apparel business and currently has a heavier concentration of Spring/Summer product category offerings. Thus, the seasonality of Southern Tide generally reflects stronger sales in the first half of the fiscal year. The timing of certain unusual or non-recurring items, economic conditions, wholesale product shipments or other factors affecting the business may vary from one year to the next. Therefore, we do not believe that net sales or operating income of Southern Tide for any particular quarter or the distribution of net sales and operating income for
Fiscal 2018
are necessarily indicative of anticipated results for the full fiscal year or expected distribution in future years. The following table presents the percentage of net sales and operating income for Southern Tide by quarter for
Fiscal 2018
:
19
|
First Quarter
|
Second Quarter
|
Third Quarter
|
Fourth Quarter
|
|||||
|
Net sales
|
30
|
%
|
26
|
%
|
21
|
%
|
23
|
%
|
|
Operating income
|
44
|
%
|
25
|
%
|
9
|
%
|
22
|
%
|
Corporate and Other
Corporate and Other is a reconciling category for reporting purposes and includes our corporate offices, substantially all financing activities, the elimination of inter-segment sales and any other items that are not allocated to the operating groups including LIFO accounting adjustments. Because our LIFO inventory pool does not correspond to our operating group definitions, LIFO inventory accounting adjustments are not allocated to the operating groups. Corporate and Other also includes the operations of other businesses which are not included in our operating groups. The operations of TBBC and our Lyons, Georgia distribution center are included in Corporate and Other. TBBC, which we acquired in December 2017, designs, sources, markets and distributes premium childrenswear including bonnets, hats, apparel, swimwear and accessories through the TBBC e-commerce website, thebeaufortbonnetcompany.com, as well as wholesale specialty retailers.
Discontinued Operations
Discontinued operations include the assets and operations of our former Ben Sherman operating group which we sold in July 2015. Unless otherwise indicated, all references to assets, liabilities, revenues, expenses and other information in this report reflect continuing operations and exclude any amounts related to the discontinued operations of our former Ben Sherman operating group. Refer to Note 1 in our consolidated financial statements included in this report for additional information about discontinued operations. We do not anticipate any cash flows or earnings related to discontinued operations in future periods.
TRADEMARKS
We own trademarks, many of which are very important and valuable to our business including Tommy Bahama, Lilly Pulitzer and Southern Tide. Generally, our trademarks are subject to registrations and pending applications throughout the world for use on apparel and, in some cases, apparel-related products, accessories, home furnishings and beauty products, as well as in connection with retail services. We continue to evaluate our worldwide usage and registration of our trademarks. In general, trademarks remain valid and enforceable as long as the trademarks are used in connection with our products and services in the relevant jurisdiction and the required registration renewals are filed. Important factors relating to risks associated with our trademarks include, but are not limited to, those described in Part I, Item 1A. Risk Factors.
PRODUCT SOURCING AND CORPORATE SOCIAL RESPONSIBILITY
We intend to maintain flexible, diversified, cost-effective sourcing operations that provide high-quality apparel and related products. Our operating groups, either internally or through the use of third party buying agents, source virtually all of our apparel and related products from non-exclusive, third party producers located in foreign countries, with a significant concentration in Asia. During
Fiscal 2018
, approximately 54% and 15% of our apparel and related products, excluding restaurant products, acquired directly by us or via buying agents, were from producers located in China and Vietnam, respectively, with no other country representing more than 10% of such purchases. We expect that the percentage of our products sourced from producers located in China will decrease in future years. Although we place a high value on long-term relationships with our suppliers of apparel and related products and have used many of our suppliers for a number of years, generally we do not have long-term contracts with our suppliers. Instead, we conduct business on an order-by-order basis. Thus, we compete with other companies for the production capacity of independent manufacturers. We believe that this approach provides us with the greatest flexibility in identifying the appropriate manufacturers while considering quality, cost, timing of product delivery and other criteria. We generally acquire products sold in our restaurant operations from various third party domestic suppliers. During
Fiscal 2018
, no individual third party manufacturer, licensee or other supplier provided more than 10% of our product purchases.
We purchase virtually all of our apparel and related products from third party producers as package purchases of finished goods, which are manufactured with oversight by us or our third party buying agents and to our design and fabric specifications. The use of contract manufacturers reduces the amount of capital investment required by us, as operating manufacturing facilities can require a significant amount of capital investment. We depend on the ability of third party producers to secure a sufficient supply of specified raw materials, adequately finance the production of goods ordered and maintain sufficient manufacturing and shipping capacity. We believe that purchasing substantially all of our products as package purchases allows us to reduce our working capital requirements as we are not required to purchase, or finance the purchase of, the raw materials or other production costs related to our apparel and related product purchases until we take ownership of the finished goods, which typically occurs when the goods are shipped by the third party producers. In addition to
20
purchasing products from third parties, our Lanier Apparel operating group operates an owned manufacturing facility located in Merida, Mexico, which produced 2% of our total company products during
Fiscal 2018
.
As the design, manufacture and transportation of apparel and related products for our brands may take as many as six months for each season, we typically make commitments months in advance of when products will arrive in our retail stores or our wholesale customers' stores. We continue to seek ways to reduce the time required from design and ordering to bringing products to our customers. As our merchandising departments must estimate our requirements for finished goods purchases for our own retail stores and e-commerce sites based on historical product demand data and other factors, and as purchases for our wholesale accounts must be committed to prior to the receipt of customer orders, we carry the risk that we have purchased more inventory than will ultimately be desired or that we will not have purchased sufficient inventory to satisfy demand, resulting in lost sales opportunities.
As part of our commitment to source our products in a lawful, ethical and socially responsible manner, each of our operating groups has implemented a code of conduct program applicable to vendors from whom we purchase apparel and related products, which includes provisions related to abiding by applicable laws as well as compliance with other business or ethical standards, including related human rights, health, safety, working conditions, environmental and other requirements. We require that each of our vendors and licensees comply with the applicable code of conduct or substantially similar compliance standards. All of our vendors from whom we purchase goods are also required by us to adhere to the United States Customs and Border Protection’s Customs-Trade Partnership Against Terrorism program, including standards relating to facility, procedural, personnel and cargo security. On an ongoing basis we assess vendors' compliance with the applicable code of conduct and applicable laws and regulations through audits performed by either our employees or our designated agents. The assessment of compliance by vendors is directed by our corporate leadership team. In the event we determine that a vendor is not abiding by our required standards, we work with the vendor to remediate the violation. If the violation is not satisfactorily remediated, we will discontinue use of the vendor. For more information on our initiatives with respect to corporate social responsibility, please visit our website at oxfordinc.com.
IMPORT RESTRICTIONS AND OTHER GOVERNMENT REGULATIONS
We are exposed to certain risks as a result of our international operations as substantially all of our merchandise, as well as the products purchased by our licensing partners, is manufactured by foreign suppliers. During
Fiscal 2018
, approximately 54% and 15% of our apparel and related products, excluding restaurant products, acquired directly by us or via buying agents, were from producers located in China and Vietnam, respectively, with no other country representing more than 10% of such purchases. Products imported by us, or imported by others and ultimately sold to us, are subject to customs, trade and other laws and regulations governing their entry into the United States and other countries where we sell our products, including various federal, state and local laws and regulations that govern any of our activities that may have adverse environmental, health and safety effects. Noncompliance with these laws and regulations may result in significant monetary penalties.
Substantially all of the merchandise we acquire is subject to certain duties which are assessed on the value of the imported product. These amounts represent a component of the inventories we sell and are included in cost of goods sold in our consolidated statements of operations. We paid total duties of more than $40 million on products imported into the United States directly by us in
Fiscal 2018
, with the average duty rate on those products of approximately 15% of the value of the imported product. Duty rates vary depending on the type of garment, fiber content and country of origin and are subject to change in future periods. In addition, while the World Trade Organization's member nations have eliminated quotas on apparel and textiles, the United States and other countries into which we import our products are still allowed in certain circumstances to unilaterally impose "anti-dumping" or "countervailing" duties in response to threats to their comparable domestic industries.
Although we have not been materially inhibited from doing business in desired markets in the past, we cannot assure that significant impediments will not arise in the future as we expand product offerings and brands and enter into new markets. In addition, in recent years the United States government has implemented additional duties on certain product categories across various industries and there continues to be discussion of potential additional duties or other changes to duties applicable to the apparel industry. There remains a significant amount of uncertainty related to these topics; however, it is possible that changes, if implemented, could have a significant unfavorable impact on the apparel retail industry and our cost of goods sold, operations, net sales, net earnings and cash flows. Our management regularly monitors proposed regulatory changes and the existing regulatory environment, including any impact on our operations or on our ability to import products. As a result of these changes and increased costs of production in certain countries that unfavorably impact our cost of goods sold, we continue to make changes in our supply chain, including exiting certain factories and sourcing those apparel or related products from a factory in a different foreign country.
In addition, apparel and other related products sold by us are subject to stringent and complex product performance and security and safety standards, laws and other regulations. These regulations relate principally to product labeling,
21
certification of product safety and importer security procedures. We believe that we are in material compliance with those regulations. Our licensed products and licensing partners are also generally subject to such regulation. Our agreements require our licensing partners to operate in compliance with all laws and regulations.
Important factors relating to risks associated with government regulations include those described in Part I, Item 1A. Risk Factors.
INFORMATION TECHNOLOGIES
We believe that sophisticated information systems and functionality are important components of maintaining our competitive position and supporting continued growth of our businesses, particularly in the ever-changing consumer shopping environment. Our information systems are designed to provide effective retail store, e-commerce, restaurant and wholesale operations while emphasizing efficient point-of-sale, distribution center, design, sourcing, order processing, marketing, customer relationship management, accounting and other functions. We regularly evaluate the adequacy of our information technologies and upgrade or enhance our systems to gain operating efficiencies, to provide additional consumer access and to support our anticipated growth as well as other changes in our business. We believe that continuous upgrading and enhancements to our information systems with newer technology that offers greater efficiency, functionality and reporting capabilities is critical to our operations and financial condition.
SEASONAL ASPECTS OF BUSINESS
Each of our operating groups is impacted by seasonality as the demand by specific product or style, as well as by distribution channel, may vary significantly depending on the time of year. For details of the impact of seasonality on each of our operating groups, see the business discussion of each operating group above.
As the timing of certain unusual or non-recurring items, economic conditions, wholesale product shipments, weather or other factors affecting our operations may vary from one year to the next, we do not believe that net sales or operating income for any particular quarter or the distribution of net sales and operating income for
Fiscal 2018
are necessarily indicative of anticipated results for the full fiscal year or expected distribution in future years. Our third quarter has historically been our smallest net sales and operating income quarter and that result is expected to continue. The following table presents our percentage of net sales and operating results by quarter for
Fiscal 2018
:
|
First
Quarter
|
Second
Quarter
|
Third
Quarter
|
Fourth
Quarter
|
|||||
|
Net sales
|
25
|
%
|
27
|
%
|
21
|
%
|
27
|
%
|
|
Operating income
|
31
|
%
|
40
|
%
|
4
|
%
|
25
|
%
|
ORDER BACKLOG
As two-thirds of our sales are direct to consumer sales, which are not reflected in an order backlog, and the order backlog for wholesale sales may be impacted by a variety of factors, we do not believe that order backlog information is necessarily indicative of sales to be expected for future periods. Therefore, we believe the order backlog is not material for an understanding of our business taken as a whole. Further, as our sales continue to shift towards direct to consumer rather than wholesale sales, the order backlog will continue to be less meaningful as a measure of our future sales and results of operations.
EMPLOYEES
As of
February 2, 2019
, we employed approximately 6,100 persons, of whom approximately 85% were employed in the United States. Approximately 70% of our employees were retail store and restaurant employees. We believe our employee relations are good.
INFORMATION
Oxford Industries, Inc. is a Georgia corporation originally founded in 1942. Our corporate headquarters are located at 999 Peachtree Street, N.E., Ste. 688, Atlanta, Georgia 30309. Our internet address is oxfordinc.com. Copies of our annual report on Form 10-K, proxy statement, quarterly reports on Form 10-Q and current reports on Form 8-K, and amendments to those reports filed or furnished pursuant to Section 13(a) or 15(d) of the Securities Exchange Act of 1934, as amended, are available free of charge on our website the same day that they are electronically filed with the SEC. The information on our website is not and should not be considered part of this Annual Report on Form 10-K and is not incorporated by reference in this document. In addition, copies of our annual report on Form 10-K, excluding exhibits, are available without cost to our shareholders by writing to Investor Relations, Oxford Industries, Inc., 999 Peachtree Street, N.E., Suite 688, Atlanta, Georgia 30309.
22
Item 1A.
Risk Factors
The risks described below highlight some of the factors that could materially affect our operations. If any of these risks actually occurs, our business, financial condition, prospects and/or operating results may be adversely affected. These are not the only risks and uncertainties we face. Additional risks and uncertainties that we currently consider immaterial or are not presently known to us may also adversely affect our business.
We operate in a highly competitive industry which is evolving very rapidly; our ability to execute our direct to consumer and portfolio-level strategies and/or transform our operations in light of shifts in consumer shopping behavior subjects us to risks that could adversely affect our financial results and operations.
We operate in a highly competitive industry in which the principal competitive factors are the reputation, value and image of brand names; design; consumer preference; price; quality; marketing; product fulfillment capabilities; and customer service. We believe that our ability to compete successfully is directly related to our proficiency in foreseeing changes and trends in fashion and consumer preference, including the manner in which retail consumers seek to transact business and access products, and presenting appealing products for consumers when and where they seek it.
The highly competitive apparel industry is characterized by increasingly reduced barriers to entry. There are an abundant and rapidly growing number of domestic and foreign apparel designers, manufacturers, distributors, importers, licensors and retailers, some of whom are also our customers, and some of whom may be significantly larger, are more diversified and/or have significantly greater financial resources than we do. Competitive factors within the apparel industry may result in reduced sales, increased costs, lower prices for our products and/or decreased margins.
One of our key initiatives has been to grow our branded businesses through distribution strategies that allow our consumers to access our brands whenever and wherever they choose to shop. Our success depends to a large degree on our ability to design and deliver compelling products; introduce new retail, restaurant and other concepts; identify suitable locations with the proper consumer demographics and suitable economic structures; establish the infrastructure necessary to support growth; source appropriate levels of inventory; hire and train qualified personnel; anticipate and implement innovations in sales and marketing technology to align with our consumers’ shopping preferences; maintain brand specific websites, mobile applications and other social media presence that offer the functionality and security customers expect; and enhance our advertising and marketing activities effectively to maintain our current customers and attract and introduce new ones to our brands and offerings.
The retail apparel market is evolving very rapidly and in ways that are having a disruptive impact on traditional fashion retailers. This includes greater transparency for consumers in product pricing and competitive offerings from competing brands as a result of technological advances; continued declines in retail traffic for traditional fashion retailers, particularly mall-based retailers who have historically relied on the appeal of department stores to attract consumers, as consumers find new ways to shop; the entry by large e-commerce retailers and others with significant financial resources and enhanced distribution capabilities into the fashion retail space; increased investment in technology and multi-channel distribution strategies by large, traditional bricks and mortar and big box retailers; ongoing success in off-price and fast fashion channels of distribution, in particular those who offer brand label products at clearance; an increased emphasis by consumers on purchasing products that incorporate sustainable materials and practices in the supply chain; and increased promotional activities, both online and in-store, by department stores and traditional fashion retailers seeking to remain competitive, and in some cases viable, in the current retail environment.
Any inability on our part to properly manage the competitive challenges in our industry and effectively adapt to the evolving consumer shopping behavioral trends may result in lost sales, increase our costs and/or adversely impact our results of operations, reputation and credibility.
Our success depends on the reputation and value of our brands; any failure to maintain the reputation or value of our brands and/or to offer innovative, fashionable and desirable products could adversely affect our business operations and financial condition.
Our success depends on the reputation and value of our brand names. The value of our brands could be diminished by actions taken by us or by our wholesale customers or others who have an interest in the brands. Actions that could cause harm to our brands include failing to respond to emerging fashion trends or meet consumer quality expectations; selling products bearing our brands through distribution channels that are inconsistent with the retail channels in which our customers expect to find those brands; becoming overly promotional; or setting up consumer expectations for promotional activity for our products. Customer activation, retention and acquisition in today’s technology-driven retail environment is critical. As a result, we are becoming more
23
reliant on social media as one of our marketing strategies, and the value of our brands could be adversely affected if we do not effectively communicate our brand message through social media vehicles that interface with existing and potential customers in “real-time.”
During Fiscal 2018, Tommy Bahama’s and Lilly Pulitzer’s net sales represented 61% and 25%, respectively, of our consolidated net sales. The significant concentration in our portfolio heightens the risks we face if one of these brands fails to meet our expectations and/or is adversely impacted by actions we or third parties take with respect to that brand or by competitive conditions in the apparel industry.
Although certain of our products carry over from season to season, the apparel industry is subject to rapidly changing fashion trends and shifting consumer demands. Due to the competitive nature of the apparel industry, there can be no assurance that the demand for our products will not decline or that we will be able to successfully evaluate and adapt our products to align with consumer preferences and changes in consumer demographics. Any failure on our part to develop and market appealing products could harm the reputation and desirability of our brands and products and/or result in weakened financial performance.
We also license many of our brand names to third party licensees, including for purposes of developing and marketing products outside of our core categories; for purposes of retail and/or wholesale distribution of our products, including our Lilly Pulitzer Signature Stores and Southern Tide Signature Stores; and to introduce new concepts outside our core expertise. While we enter into comprehensive license and similar collaborative agreements with these third parties covering product design, product quality, brand standards, sourcing, social compliance, distribution, operations, manufacturing and/or marketing requirements and approvals, there can be no guarantee our brands will not be negatively impacted through our association with products or concepts outside of our core apparel products, by the market perception of the third parties with whom we associate and/or due to the actions of a licensee. The improper or detrimental actions of a licensee could significantly impact the perception of our brands.
In addition, we cannot always control the marketing and promotion of our products by our wholesale customers, licensees or other third parties, and actions by such parties that are inconsistent with our own marketing and distribution efforts and practices or that otherwise adversely affect the appeal of our products could diminish the value or reputation of one or more of our brands and have an adverse effect on our sales and business operations.
We have a robust legal and social compliance program for our third party manufacturers and vendors, including codes of conduct and vendor compliance standards. The reputation of our brands could be harmed if these third parties, substantially all of which are located outside the United States, fail to meet appropriate product safety, product quality and social compliance (including labor practices and human rights) standards. Despite our efforts, we cannot ensure that our manufacturers and vendors will at all times conduct their operations in accordance with ethical practices or that the products we purchase will always meet our safety and quality control standards. Any violation of our applicable codes of conduct, social compliance programs or local laws by our manufacturers or vendors or other actions or failures by us or such parties may result in a negative public perception of our brands or products, as well as disrupt our supply chain, which may adversely affect our business operations.
Our business and financial condition are heavily influenced by general economic conditions, which are outside of our control.
We are a consumer products company and are highly dependent on consumer discretionary spending and retail traffic patterns. The levels of demand for apparel products change as regional, domestic and international economic conditions change. Demand for our products may be significantly impacted by trends in consumer confidence and discretionary consumer spending patterns, which may be influenced by employment levels; recessions; inflation; fuel and energy costs; interest rates; tax rates; personal debt levels; savings rates; stock market and housing market volatility; shifting social ideology; natural disasters and/or weather patterns; and general uncertainty about the future. The factors impacting consumer confidence and discretionary consumer spending patterns are outside of our control and difficult to predict, and, often, the apparel industry experiences longer periods of recession and greater declines than the general economy. In addition, as the growth in our direct to consumer operations continues to outpace our other operations, we have increased exposure to the risks associated with a volatile and unpredictable economic environment. Any decline in consumer confidence or change in discretionary consumer spending patterns could reduce our sales and/or adversely affect our business and financial condition.
Additionally, significant changes in the operations or liquidity of any of the parties with which we conduct our business, including suppliers, customers, trademark licensees and lenders, among others, now or in the future, or in the access to capital markets for any such parties, could result in lower demand for our products, lower sales, higher costs, greater credit risk on our sales or other disruptions in our business.
Cybersecurity attacks and/or breaches of information security or privacy could disrupt our operations, cause us to incur additional expenses, expose us to litigation and/or cause us financial harm.
24
Cybersecurity attacks continue to become increasingly sophisticated, and experienced computer programmers and hackers may be able to penetrate our network security and misappropriate or compromise our assets, including confidential information, or disrupt our systems. We are regularly subject to attempts by attackers to gain unauthorized access to our networks, systems and data, or to obtain, change or destroy confidential information. In addition, customers may use devices or software that are beyond our control environment to purchase our products, which may provide additional avenues for attackers to gain access to confidential information.
Despite our implementation of security measures, if an actual or perceived data security breach occurs, whether as a result of cybersecurity attacks, computer viruses, vandalism, human error or otherwise, or if there are perceived vulnerabilities in our systems, the image of our brands and our reputation and credibility could be damaged, and, in some cases, our continued operations may be impaired or restricted. The costs to prevent, eliminate or mitigate cyber or other security problems and vulnerabilities, including to comply with security or other measures under state, federal and international laws governing the unauthorized disclosure of confidential information, to resolve any litigation or to investigate any actual or perceived breach and to enhance cybersecurity protection through organizational changes, deploying additional personnel and protection technologies, training employees and engaging third party experts and consultants could be significant and result in significant financial losses and expenses, as well as lost sales. In addition, although we have business continuity plans and other safeguards in place, our operations may be adversely affected by an actual or perceived data security breach. While we continue to evolve and modify our business continuity plans, there can be no assurance in an escalating threat environment that they will be effective in avoiding disruption and business impacts, and any insurance we maintain may not be adequate to compensate us for all resulting losses.
As an ongoing part of our business operations, including direct to consumer transactions and marketing through various social media tools, we regularly collect and utilize sensitive and confidential personal information, including of our customers, employees and suppliers. The routine operation of our business involves the storage and transmission of customer personal information and preferences, and we use social media and other online and technology-driven marketing and related activities to connect with our customers. The regulatory environment governing our use of individually identifiable data of customers, employees and others is complex, and the security of personal information is a matter of public concern.
As part of our routine operations, we also contract with third party service providers to store, process and transmit personal information of our customers and employees. Although we contractually require that these providers implement reasonable security measures, we cannot control third parties and cannot guarantee that a security breach will not occur at their location or within their systems. Privacy breaches of confidential information stored or used by our third party service providers or disruptions in their systems may expose us to the same risks as a breach of our own systems, including negative publicity, potential out-of-pocket costs and adverse effects on our business and customer relationships.
The regulatory environment is constantly changing with new and modified state, federal and international privacy and security laws, such as the General Data Protection Regulation in the E.U. which became effective in Fiscal 2018 and the California Consumer Privacy Act which is scheduled to become effective during Fiscal 2019. Compliance with these laws, and any newly enacted laws and regulations, may require us to modify our operations and/or incur costs to make necessary systems changes and implement new administrative processes. Our failure to comply with these laws and regulations could lead to significant fines and penalties or adverse publicity.
In addition, because we process and transmit payment card information, we are subject to the payment card industry data security standard and card brand operating rules, which provides for a comprehensive set of rules relating to the retention and/or transmission of payment card information. If we do not comply with the applicable standards, we may be subject to fines or restrictions on our ability to accept payment cards, which could have a material adverse effect on our operations.
The loss of one or more of our key wholesale customers, or a significant adverse change in a customer’s financial performance or financial position, could negatively impact our net sales and profitability.
We generate a significant percentage of our wholesale sales from a few key customers. For example, during Fiscal 2018, 45% of our consolidated wholesale sales, or 14% of our consolidated net sales, were to our five largest customers. Over the last several years, there have been significant levels of store closures and bankruptcies and financial restructurings by department stores and other large retailers, particularly as the retail industry has transitioned more towards online and mobile transactions; increased prevalence and emphasis on private label products at large retailers; direct sourcing of products by large retailers; consolidation of a number of retailers; and increased competition experienced by our wholesale customers from online competitors. A decrease in the number of stores that carry our products, restructuring of our customers’ operations, continued store closures by major department stores and other large retailers, increased direct sourcing and greater leverage by customers, realignment of customer affiliations or other factors could negatively impact our net sales and profitability.
25
We generally do not have long-term contracts with our wholesale customers. Instead, we rely on long-standing relationships with these customers, the appeal of our brands and our position within the marketplace. As a result, purchases generally occur on an order-by-order basis, and each relationship can typically be terminated by either party at any time. A decision by one or more of our key wholesale customers to terminate its relationship with us or to reduce its purchases from us, whether motivated by competitive considerations, quality or style issues, financial difficulties, economic conditions or otherwise, could adversely affect our net sales and profitability, as it would be difficult to immediately, if at all, replace this business with new customers, reduce our operating costs or increase sales volumes with other existing customers. In addition, as department stores and other retailers become more promotional, we continuously evaluate our sales to certain wholesale channels of distribution, for brand protection or otherwise, and in some cases have terminated or curtailed our sales to those customers and may continue to do so, which impacts our net sales and profitability.
We also extend credit to most of our key wholesale customers without requiring collateral, which results in a large amount of receivables from just a few customers. At February 2, 2019, our five largest outstanding customer balances represented $37 million, or 53% of our consolidated receivables balance. Companies in the apparel industry, including some of our customers, may experience financial difficulties, including bankruptcies, restructurings and reorganizations, tightened credit markets and/or declining sales and profitability. A significant adverse change in a customer’s financial position or ability to satisfy its obligations to us could cause us to limit or discontinue business with that customer, in some cases after we have already made product purchase commitments for inventory; require us to assume greater credit risk relating to that customer’s receivables; or limit our ability to collect amounts related to shipments to that customer.
We rely to a large extent on third party producers in foreign countries to meet our production demands, and failures by these producers to meet our requirements, the unavailability of suitable producers at reasonable prices and/or changes in international trade regulation may negatively impact our ability to deliver quality products to our customers on a timely basis, disrupt our supply chain or result in higher costs or reduced net sales.
We source substantially all of our products from non-exclusive, third party producers located in foreign countries, including sourcing approximately 54% and 15% of our product purchases from China and Vietnam, respectively, during Fiscal 2018. Although we place a high value on long-term relationships with our suppliers, generally we do not have long-term supply contracts but, instead, conduct business on an order-by-order basis. Therefore, we compete with other companies for the production capacity of independent manufacturers. We also depend on the ability of these third party producers to secure a sufficient supply of raw materials, adequately finance the production of goods ordered and maintain sufficient manufacturing and shipping capacity, and in some cases, the products we purchase and the raw materials that are used in our products are available only from one source or a limited number of sources. Although we monitor production in third party manufacturing locations, we cannot be certain that we will not experience operational difficulties with our manufacturers, such as the reduction of available production capacity, errors in complying with product specifications, insufficient quality control, failures to meet production deadlines or increases in manufacturing costs. In addition, we may experience disruptions in our supply chain as we actively seek to diversify the jurisdictions from which we source products. Any such difficulties may negatively impact our ability to deliver quality products to our customers on a timely basis. This would jeopardize our ability to properly merchandise our direct to consumer channels and service our customers, which may, in turn, have a negative impact on our customer relationships and result in lower net sales and profits.
Due to our sourcing activities, we are exposed to risks associated with changes in the laws and regulations governing the importing and exporting of apparel products into and from the countries in which we operate. These risks include changes in social, political, labor and economic conditions or terrorist acts that could result in the disruption of trade from the countries in which our manufacturers are located; the imposition of additional or new duties, tariffs, taxes, quota restrictions or other changes and shifts in sourcing patterns as a result of such changes; significant delays in the delivery of our products, due to security or other considerations; fluctuations in sourcing costs; the imposition of antidumping or countervailing duties; fluctuations in the value of the dollar against foreign currencies; changes in customs procedures for importing apparel products; and restrictions on the transfer of funds to or from foreign countries. Notably, the current political landscape has introduced significant uncertainty with respect to future trade regulations and existing international trade agreements, including the possibility of imposing significantly higher tariffs on products manufactured in China, from which a majority of our apparel and related product purchases are sourced. We cannot predict whether, and to what extent, there may be changes to international trade agreements or whether quotas, duties, tariffs, exchange controls or other restrictions on our products will be changed or imposed. Any of these factors may disrupt our supply chain, and we may be unable to offset any associated cost increases by shifting production to suitable manufacturers in other jurisdictions in a timely manner or at acceptable prices, and future regulatory actions or changes in international trade regulation may provide our competitors with a material advantage over us or render our products less desirable in the marketplace.
26
Our operations are reliant on information technology and any interruption or other failure, including an inability to timely upgrade our systems, may impair our ability to provide products to our customers, efficiently conduct our operations and/or meet the needs of our management.
The efficient operation of our business depends on information technology. This requires us to devote significant financial and employee resources to information technology initiatives and operations. Information systems are used in all stages of our operations and as a method of communication with our customers, service providers and suppliers. Many of our information technology solutions are operated and/or maintained by third parties, including our use of cloud-based solutions. Additionally, each of our operating groups utilizes e-commerce websites, point-of-sale systems and wholesale ordering systems to acquire, manage and sell goods. Our management also relies on information systems to provide relevant and accurate information in order to allocate resources, manage operations and forecast and report our operating results. Service interruptions may occur as a result of a number of factors, including power outages, consumer traffic levels, computer viruses, hacking or other unlawful activities by third parties, human error, disasters or failures to properly install, upgrade, integrate, protect, repair or maintain our various systems and e-commerce websites. We regularly evaluate upgrades or enhancements to our information systems to more efficiently and competitively operate our businesses, including recent upgrades to our warehouse management, guest relations, omnichannel and/or enterprise order management systems in certain of our businesses. We may experience difficulties during the implementation, upgrade or subsequent operation of our systems and/or not be equipped to address system problems. Any material disruption in our information technology solutions, or any failure to timely, efficiently and effectively integrate new systems, could have an adverse effect on our business or results of operations.
In addition, as our business continues to grow and we face new challenges in the current retail environment, we evaluate our systems on an ongoing basis to ensure they meet our business needs and, as needed, replace and/or upgrade those systems, which may be expensive undertakings. We must, however, be diligent in our evaluation of these systems, as reliance on outdated technology may inhibit our ability to operate efficiently, which could adversely affect our financial condition and results of operations. As we transition to new systems, we may also face certain challenges, including the risk of introducing cybersecurity vulnerabilities into our systems or the loss of certain functionality, information from our legacy systems and efficient interfaces with third party and continuing systems. Temporary processes or solutions, including manual operations, which may be required to be instituted in the short term could also significantly increase the risk of loss or corruption of data and information. All of these events could have a material adverse effect on our financial conditions and results of operations.
Our business depends on our senior management and other key personnel, and the unsuccessful transition of key management responsibilities, the unexpected loss of individuals integral to our business, our inability to attract and retain qualified personnel in the future or our failure to successfully plan for and implement succession of our senior
management and key personnel may have an adverse effect on our operations, business relationships and ability to execute our strategies.
Our senior management has substantial experience and expertise in the apparel and related industries, with our Chairman and Chief Executive Officer Mr. Thomas C. Chubb III having worked with our company for 30 years, including in various executive management capacities. Our success depends on disciplined execution at all levels of our organization, including our senior management, and continued succession planning. Competition for qualified personnel is intense, and we compete to attract and retain these individuals with other companies that may have greater financial resources than us. While we believe that we have depth within our management team, the unexpected loss of any of our senior management, or the unsuccessful integration of new leadership, could harm our business and financial performance. In addition, we may be unable to retain or recruit qualified personnel in key areas such as product design, sales, marketing (including individuals with key insights into digital and social media marketing strategies), distribution, technology, sourcing and other support functions, which could result in missed sales opportunities and harm to key business relationships.
We rely on our primary distribution facilities in order to support our direct to consumer and wholesale operations, meet customer expectations, manage inventory, complete sales and achieve operating efficiencies, and any disruption or failure in these facilities may materially adversely affect our business or operations.
We may have a greater risk than our peers due to the concentration of our distribution facilities, as substantially all of our products for each operating group are distributed through one or two principal distribution centers. The primary distribution facilities that we operate are: a distribution center in Auburn, Washington dedicated to our Tommy Bahama products; a distribution center in King of Prussia, Pennsylvania dedicated to our Lilly Pulitzer products; a distribution center in Toccoa, Georgia dedicated to our Lanier Apparel products; and a distribution center in Lyons, Georgia primarily dedicated to our Lilly Pulitzer, Lanier Apparel and Southern Tide products. Each of these distribution centers relies on computer-controlled and automated equipment, which may be subject to a number of risks. Our ability to support our direct to consumer operations, meet customer expectations, manage inventory and achieve objectives for operating efficiencies depends on the proper operation of these distribution facilities, each of which manages the receipt, storage, sorting, packing and distribution of finished goods.
27
If any of our primary distribution facilities were to shut down or otherwise become inoperable or inaccessible for any reason, including as a result of natural or man-made disasters, human error, cybersecurity attacks, computer viruses or otherwise, if our distribution facilities fail to upgrade their technological systems to ensure efficient operations or if we are unable to receive goods in a distribution center or to ship the goods in a distribution center, as a result of a technology failure or otherwise, we could experience a substantial loss of inventory, a reduction in sales, higher costs, insufficient inventory at our retail stores to meet consumer expectations and longer lead times associated with the distribution of our products. In addition, for the distribution facilities that we operate, there are substantial fixed costs associated with these large, highly automated distribution centers, and we could experience reduced operating and cost efficiencies during periods of economic weakness. Any disruption to our distribution facilities or in their efficient operation could negatively affect our operating results and our customer relationships.
We may be unable to grow our business through organic growth, and any failure to successfully execute this aspect of our business strategy may have a material adverse effect on our business, financial condition, liquidity and results of operations.
One key component of our business strategy is organic growth in our brands. Organic growth may be achieved by, among other things, increasing sales in our direct to consumer channels; selling our products in new markets, such as the opening of Lilly Pulitzer retail stores in Hawaii in Fiscal 2018 and California in Fiscal 2019; increasing our market share in existing markets; expanding the demographic appeal of our brands; expanding our margins through product cost reductions, price increases, or otherwise; expanding the customer reach of our brands through new and enhanced advertising initiatives; and increasing the product offerings and concepts within our various operating groups, such as the opening of additional Marlin Bars. Successful growth of our business is subject to, among other things, our ability to implement plans for expanding and/or maintaining our existing businesses and categories within our businesses at satisfactory levels. We may not be successful in achieving suitable organic growth, and our inability to grow our business may have a material adverse effect on our business, financial condition, liquidity and results of operations.
At the beginning of Fiscal 2017, we announced initiatives to improve Tommy Bahama’s operating performance and long-term growth prospects. These initiatives, which included an enhanced outlet and clearance strategy, improving gross margin through selective price increases and reducing product costs and controlling operating expenses, while at the same time focusing on growing revenues through new product line and marketing initiatives. While we saw improvements in Tommy Bahama’s operating performance during Fiscal 2017 and Fiscal 2018, any strategic initiative of this nature is inherently challenging and faces significant potential risks. We may be unable to continue the upward trajectory we have seen recently at Tommy Bahama, which may adversely affect our ability to achieve long-term sustainable growth while at the same time detracting from our focus and execution of other strategic initiatives.
In addition, investments we make in technology, advertising and infrastructure, retail stores and restaurants, office and distribution center facilities, personnel and elsewhere may not yield the full benefits we anticipate and/or sales growth may be outpaced by increases in operating costs, putting downward pressure on our operating margins and adversely affecting our results of operations. If we are unable to increase our revenues organically, we may be required to pursue other strategic initiatives, including reductions in costs and/or acquisitions, in order to grow our business. These initiatives may not be available to us on desirable terms, inhibiting our ability to increase profitability.
The acquisition of new businesses and the divestiture or discontinuation of businesses and product lines have certain inherent risks, including, for example, strains on our management team and unexpected costs and other charges resulting from the transaction.
Growth of our business through acquisitions of lifestyle brands that fit within our business model is a component of our business strategy. Acquisitions involve numerous risks, including: the competitive climate for desirable acquisition candidates, which drives market multiples; the benefits of the acquisition not materializing as planned or not materializing within the time periods or to the extent anticipated; our ability to manage the people and processes of an acquired business; difficulties in retaining key relationships with customers and suppliers; risks in entering geographic markets and/or product categories in which we have no or limited prior experience; the assumption of contractual and other liabilities, some of which may not be known at the time of acquisition; and the possibility that we pay more to consummate an acquisition than the value we derive from the acquired business. Additionally, acquisitions may cause us to incur debt, or make dilutive issuances of our equity securities.
As a result of acquisitions, we may become responsible for unexpected liabilities that we failed or were unable to discover in the course of performing due diligence. Although we may be entitled to indemnification against undisclosed liabilities from the sellers of the acquired business, our recourse may be limited and we cannot be certain that the indemnification, even if obtained, will be enforceable or collectible. Any of these liabilities, individually or in the aggregate, could have a material adverse effect on our business, financial condition and results of operations, distract our management or harm our reputation.
28
Certain acquisitions may also be structured utilizing contingent consideration based on the acquired business’ post-closing results. The principals from whom we acquired such a business, many of whom may continue to operate the business as our employees, may have differing interests than those of our shareholders because of such arrangements.
In addition, integrating acquired businesses is a complex, time-consuming and expensive process. The integration process for newly acquired businesses could create a number of challenges and adverse consequences for us associated with the integration of product lines, support functions, employees, sales teams and outsourced manufacturers; employee turnover, including key management and creative personnel of the acquired and existing businesses; disruption in product cycles for newly acquired product lines; maintenance of acceptable standards, controls, procedures and policies; operating business in new geographic territories; diversion of the attention of our management from other areas of our business; and the impairment of relationships with customers of the acquired and existing businesses. Merger and acquisition activity is inherently risky, and we cannot be certain that any acquisition will be successful and will not materially harm our business, operating results or financial condition.
As described in Note 1 in our consolidated financial statements included in this report, at the time of an acquisition, we estimate and record the fair value of purchased intangible assets, such as trademarks, reacquired rights and customer relationships, and record goodwill generally to the extent the cost to acquire a business exceeds our assessment of the net fair value of tangible and intangible assets. We test indefinite-lived intangible assets and goodwill for possible impairment as of the first day of the fourth quarter of each fiscal year, or at an interim date if indicators of impairment exist at that date. It is possible that we could have an impairment charge for intangible assets or goodwill associated with an acquired business in future periods if, among other things, economic conditions decline, our strategies for an acquired business change, the results of operations of an acquired business are less than anticipated at the time of acquisition or enterprise values and market multiples of comparable businesses decline. A future impairment charge for intangible assets or goodwill could have a material adverse effect on our consolidated financial statements or results of operations.
As the fashion retail environment evolves, our investment criteria for acquisitions has grown to include smaller brands, such as Southern Tide and TBBC which we acquired in Fiscal 2016 and Fiscal 2017, respectively, in an earlier stage of the brand’s life cycle, where we can more fully integrate the brand into our existing infrastructure and shared services functions and better leverage our resources. While acquisitions of these early stage brands may have a smaller upfront purchase price, the limited operating history, less experienced management teams and less sophisticated systems, infrastructure and relationships generally associated with such brands may heighten the risks associated with acquisitions generally, including the heightened risk that the target company may be unable to achieve the projected financial results anticipated.
From time to time, we also divest or discontinue businesses, product lines and/or programs that do not align with our strategy or provide the returns that we expect or desire, such as our Fiscal 2018 restructure and downsizing of our Tommy Bahama Japan operations. Such dispositions and/or discontinuations may result in underutilization of our retained resources if the exited operations are not replaced with new lines of business, either internally or through acquisition. In addition, we may become responsible for unexpected liabilities, some of which may be triggered or increased by a purchaser’s operation of the disposed business following the transaction. Those liabilities combined with any other liabilities we contractually retain, individually or in the aggregate, could adversely affect our financial condition and results of operations.
Our business is subject to various federal, foreign, state and local laws and regulations, and the costs of compliance with, or the violation of, such laws and regulations could have an adverse effect on our costs or operations.
In the United States, we are subject to stringent standards, laws and other regulations, including those relating to health, product performance and safety, labor, employment, privacy and data security, anti-bribery, consumer protection, taxation, customs, logistics and other operational matters. In addition, operating in foreign jurisdictions requires compliance with similar laws and regulations. These laws and regulations, in the United States and abroad, are complex and often vary widely by jurisdiction, making it difficult for us to ensure that we are currently or will in the future be compliant with all applicable laws and regulations. We may be required to make significant expenditures or modify our business practices to comply with existing or future laws or regulations, and unfavorable resolution to litigation or a violation of applicable laws and regulations by us, or any of our suppliers or licensees, may restrict our ability to import products, require a recall of our products, lead to fines or otherwise increase our costs, negatively impact our ability to attract and retain employees, materially limit our ability to operate our business or result in adverse publicity. Compliance with these laws and regulations requires us to devote significant time, financial and management resources, and to update our processes and programs, in response to newly implemented or changing regulatory requirements, all of which could affect the manner in which we operate our business or adversely affect our results of operations.
29
From time to time, we are involved in litigation matters, which may relate to consumer protection, employment practices and intellectual property infringement and which may include a class action, and we are subject to various claims and pending or threatened lawsuits in the ordinary course of our business operations. Often, these cases raise complex factual and legal issues and, due to the inherent uncertainties of litigation, we cannot accurately predict the ultimate outcome of any such proceedings. Regardless of the outcome or whether the claims have merit, legal proceedings may be expensive and require significant management time.
Also, the restaurant industry requires compliance with a variety of federal, state and local regulations. In particular, all of our Tommy Bahama restaurants, including our Marlin Bar concept, serve alcohol and, therefore, maintain liquor licenses. Our ability to maintain our liquor licenses depends on our compliance with applicable laws and regulations. The loss of a liquor license would adversely affect the profitability of that restaurant. Additionally, as a participant in the restaurant industry, we face risks related to food quality, food-borne illness, injury, health inspection scores and labor relations. The negative impact of adverse publicity relating to allegations of actual or perceived violations at one of our restaurants may extend beyond the restaurant involved to affect some or all of the other restaurants, as well as the image of the Tommy Bahama brand as a whole.
Regardless of whether any allegations of violations of the laws and regulations governing our business are valid or whether we ultimately become liable, we may be materially affected by negative publicity associated with these and other issues, such as those relating to our social responsibility and sustainability initiatives.
Our business could be harmed if we fail to maintain proper inventory levels.
Many factors, such as economic conditions, fashion trends, consumer preferences, the financial condition of our wholesale customers and weather, make it difficult to accurately forecast demand for our products. In order to meet the expected demand for our products in a cost-effective manner, we make commitments for production several months prior to our receipt of these goods and often in advance of firm commitments, if any, from wholesale customers. Depending on the demand levels for our products, we may be unable to sell the products we have ordered or that we have in our inventory, which may result in inventory markdowns or the sale of excess inventory at discounted prices and through off-price channels. These events could significantly harm our operating results and impair the image of our brands. Conversely, if we underestimate demand for our products or if we are unable to access our products when we need them, for example due to a third party manufacturer’s inability to source materials or produce goods in a timely fashion or as a result of delays in the delivery of products to us, we may experience inventory shortages, which might result in unfilled orders, negatively impact customer relationships, diminish brand loyalty and result in lost sales, any of which could harm our business. These risks relating to inventory may also escalate as our direct to consumer sales continue to increase as a proportion of our consolidated net sales, given the absence of purchase commitments for direct to consumer-designated inventory.
We may be unable to protect our trademarks and other intellectual property.
We believe that our trademarks and other intellectual property, as well as certain contractual arrangements, including licenses, and other proprietary intellectual property rights, have significant value and are important to our continued success and our competitive position due to their recognition by retailers and consumers. In Fiscal 2018, 93% of our consolidated net sales were attributable to branded products for which we own the trademark. Therefore, our success depends to a significant degree on our ability to protect and preserve our intellectual property. We rely on laws in the United States and other countries to protect our proprietary rights. However, we may not be able to sufficiently prevent third parties from using our intellectual property without our authorization, particularly in those countries where the laws do not protect our proprietary rights as fully as in the United States. The use of our intellectual property or similar intellectual property by others could reduce or eliminate any competitive advantage we have developed, causing us to lose sales or otherwise harm the reputation of our brands.
We devote significant resources to the registration and protection of our trademarks and to anti-counterfeiting efforts. Despite these efforts, we regularly discover products that infringe our proprietary rights or that otherwise seek to mimic or leverage our intellectual property. Counterfeiting and other infringing activities typically increase as brand recognition increases. Counterfeiting and other infringement of our intellectual property could divert away sales, and association of our brands with inferior counterfeit reproductions or third party labels could adversely affect the integrity and reputation of our brands.
Additionally, there can be no assurance that the actions that we have taken will be adequate to prevent others from seeking to block sales of our products as violations of proprietary rights. As we extend our brands into new product categories and new product lines and expand the geographic scope of the manufacture, distribution and marketing of our brands’ products, we could become subject to litigation or challenge based on allegations of the infringement of intellectual property rights of third parties, including by various third parties who have acquired or claim ownership rights in some of our trademarks internationally. In the event a claim of infringement against us is successful or would otherwise affect our operations, we may be required to pay damages,
30
royalties, license fees or other costs to continue to use intellectual property rights that we had been using, or we may be unable to obtain necessary licenses from third parties at a reasonable cost or within a reasonable time. Litigation and other legal action of this type, regardless of whether it is successful, could result in substantial costs to us and diversion of the attention of our management and other resources.
Fluctuations and volatility in the cost and availability of raw materials, labor and freight may materially increase our costs.
We and our third party suppliers rely on the availability of raw materials at reasonable prices. The principal fabrics used in our business are cotton, linens, wools, silk, other natural fibers, synthetics and blends of these materials. The prices paid for these fabrics depend on the market price for raw materials used to produce them. The cost of the materials that are used in our manufacturing process, such as oil-related commodity prices and other raw materials, such as dyes and chemicals, and other costs, can fluctuate. We historically have not entered into any futures contracts to hedge commodity prices, and in recent years, we have seen significant variability in the costs of certain raw materials, including cotton. These pricing fluctuations could continue in future years.
We have also seen increases in the cost of labor at many of our suppliers in recent years, as well as in freight costs. In China, for example, apparel manufacturers have experienced increased costs due to labor shortages and other factors, and these increased costs are often passed on to us. Although we attempt to mitigate the effect of increases in our cost of goods sold through sourcing initiatives and by selectively increasing the prices of our products, these product costing pressures, as well as other variable cost pressures, may materially increase our costs, and we may be unable to fully pass on these costs to our customers.
As of February 2, 2019, we had approximately 6,100 employees worldwide, of which approximately 70% are retail store and restaurant employees. The employment and employment-related costs associated with our employees are a significant component in our SG&A, particularly of our retail store and restaurant operations. Employment costs are affected by labor markets, as well as various federal, state and foreign laws governing matters such as minimum wage rates, overtime compensation and other requirements. We are experiencing increases in our employment and employment-related costs as a result of a tightening job market. In addition, in recent years, there has been significant political pressure and legislative action to increase the minimum wage rate in many of the jurisdictions in which our stores are located. Any increases in our employment costs, as a result of market conditions or otherwise, may materially increase our costs, reduce the profitability of our operations and/or adversely impact our results of operations.
We are subject to risks associated with leasing real estate for our retail stores and restaurants, which generally consist of long-term leases negotiated at prevailing market rents.
An integral part of our strategy has been to develop and operate retail stores and restaurants for certain of our lifestyle brands. Net sales from our retail stores and restaurants were 47% of our consolidated net sales during Fiscal 2018.
We lease all of our retail store and restaurant locations. Successful operation of our retail stores and restaurants depends, in part, on our ability to identify desirable, brand appropriate locations; the overall ability of the location to attract a consumer base sufficient to make sales volume profitable; our ability to negotiate satisfactory lease terms and employ qualified personnel; and our ability to timely construct and complete any build-out and open the location in accordance with our plans. A decline in the volume of consumer traffic at our retail stores and restaurants, due to economic conditions, shifts in consumer shopping preferences or technology, a decline in the popularity of malls or lifestyle centers in general or at those in which we operate, the closing of anchor stores or other adjacent tenants or otherwise, could have a negative impact on our sales, gross margin and results of operations. In addition, as and when we seek to open new retail stores and restaurants, we compete with others for favorable locations, lease terms and desired personnel. As consumer shopping patterns continue to negatively impact bricks and mortar retail traffic generally, the competition for premium retail space in long-term sustainable locations continues to increase. Our growth may be limited if we are unable to identify new locations with consumer traffic sufficient to support a profitable sales level or the local market reception to a new retail store opening is inconsistent with our expectations.
Our retail store and restaurant leases generally represent long-term financial commitments, with substantial costs at lease inception for a location’s design, leasehold improvements, fixtures and systems installation. On an ongoing basis, we review the financial performance of our retail and restaurant locations in order to determine whether continued operation is appropriate. Even if we determine that it is desirable to exit a particular location, we may be unable to close an underperforming location due to continuous use clauses and/or because negotiating an early termination would be cost prohibitive. In addition, due to the fixed-cost structure associated with these operations, negative cash flows or the closure of a retail store or restaurant could result in write-downs of inventory, impairment of leasehold improvements, impairment of other long-lived assets, severance costs, lease termination costs or the loss of working capital, which could adversely impact our business and financial results. Furthermore, as
31
each of our leases expire, we may be unable to negotiate renewals, either on commercially acceptable terms or at all, which could force us to close retail stores and/or restaurants in desirable locations.
Our geographic concentration of retail stores, restaurants and wholesale customers for certain of our brands exposes us to certain regional risks.
Our retail and restaurant locations are heavily concentrated in certain geographic areas in the United States, including Florida, California, Texas and Hawaii for our Tommy Bahama operations (76 of 144 domestic stores and 14 of 17 restaurants, including Marlin Bars, are in these states as of February 2, 2019) and Florida, Massachusetts and Virginia for our Lilly Pulitzer operations (31 of 62 retail stores as of February 2, 2019). Additionally, the wholesale sales for each of Tommy Bahama, Lilly Pulitzer and Southern Tide are also geographically concentrated, including in geographic areas where we have concentrations of our own retail store locations. Due to these concentrations, we have heightened exposure to factors that impact these regions, including general economic conditions, weather patterns, natural disasters, changing demographics and other factors.
Our operations may be affected by changes in weather patterns, natural or man-made disasters, war, terrorism or other catastrophes.
Our sales volume and operations may be adversely affected by unseasonable or severe weather conditions, natural or man-made disasters, war, terrorist attacks, including heightened security measures and responsive military actions, or other catastrophes which may cause consumers to alter their purchasing habits or result in a disruption to our operations. Because of the seasonality of our business, the concentration of a significant proportion of our retail stores and wholesale customers in certain geographic regions, including a resort and/or coastal focus in Tommy Bahama’s, Lilly Pulitzer’s and Southern Tide's operations, the concentration of our sourcing operations and the concentration of our distribution center operations, the occurrence of such events could disproportionately impact our business, financial condition and operating results.
We hold licenses for the use of other parties’ brand names, and we cannot guarantee our continued use of such brand names or the quality or salability of such brand names.
We have entered into license and design agreements to use certain trademarks and trade names, such as Kenneth Cole, Dockers, Nick Graham and Cole Haan, to market some of our products. During Fiscal 2018, sales of products bearing brands licensed to us accounted for 6% of our consolidated net sales and 60% of Lanier Apparel’s net sales. When we enter into these license and design agreements, they generally provide for short contract durations (typically three to five years); these agreements may include options to extend the term of the contract but, when available, are generally subject to our satisfaction of certain contingencies (e.g., minimum sales thresholds) that may be difficult for us to satisfy. Competitive conditions for the right to use popular trademarks means that we cannot guarantee that we will be able to renew these licenses on acceptable terms upon expiration, that the terms of any renewal will not result in operating margin pressures or reduced profitability or that we will be able to acquire new licenses to use other desirable trademarks. The termination or expiration of a license agreement would cause us to lose the sales and any associated profits generated pursuant to such license, which could be material, and in certain cases could also result in an impairment charge for related assets, leave us with underutilized overhead and/or adversely impact existing synergies.
Our license agreements generally require us to receive approval from the brand’s owner of all design and other elements of the licensed products we sell prior to production, as well as to receive approval from the brand owner of distribution channels in which we may sell and the manner in which we market and distribute licensed products. Any failure by us to comply with these requirements could result in the termination of the license agreement.
In addition to certain compliance obligations, all of our significant licenses provide minimum thresholds for royalty payments and advertising expenditures for each license year, which we must pay regardless of the level of our sales of the licensed products. If these thresholds are not met, our licensors may be permitted contractually to terminate these agreements or seek payment of minimum royalties even if the minimum sales are not achieved. In addition, our licensors produce their own products and license their trademarks to other third parties, and we are unable to control the quality, style or image of these goods. If licensors or others do not maintain the quality of these trademarks or if the brand image deteriorates, or the licensors otherwise change the parameters of design, pricing, distribution or marketing, our sales and any associated profits generated by such brands may decline.
Our international direct to consumer and licensing operations may present risks that could have a material adverse effect on our business and financial position.
Starting in 2010 and 2011, we focused on expanding Tommy Bahama’s direct to consumer operations in international markets, notably the Asia-Pacific region and Canada. The operations in the Asia-Pacific region initially generated significant operating losses, and we have continued to curtail those operations since Fiscal 2015 to focus on alternative opportunities to present
32
the Tommy Bahama brand in various international markets. We continue to operate stores in Australia, as well as one retail location in Japan. Other than those locations, we have closed all our Asia-Pacific retail stores as of February 2, 2019.
We have limited experience with regulatory environments and market practices related to international operations and there are risks associated with doing business in these markets, including lack of brand recognition in certain markets; understanding fashion trends and satisfying consumer tastes; market acceptance of our products, which is difficult to assess immediately; establishing appropriate market-specific operational and logistics functions; managing compliance with the various legal requirements; staffing and managing foreign operations; fluctuations in currency exchange rates; obtaining governmental approvals that may be required to operate; potentially adverse tax implications; and maintaining proper levels of inventory. If we are unable to properly manage these risks or if our international efforts do not prove successful, our business, financial condition and results of operations could be negatively impacted.
As we continue to explore long-term opportunities for our Tommy Bahama brand internationally, we may elect to enter into retail or wholesale distribution arrangements, or joint ventures, with third parties for certain markets. Any such arrangements are subject to a number of risks and uncertainties, including our reliance on the operational skill and expertise of a local operator, the ability of the joint venture or operator to manage its employees and appropriately represent our brands in those markets and any protective rights that we may be forced to grant to the third party, which could limit our ability to fully realize the anticipated benefits of such a relationship.
We are also subject to certain anti-corruption laws, including the U.S. Foreign Corrupt Practices Act, in addition to the local laws of the foreign countries into which we enter. If any of our international operations, or our employees or agents, violates such laws, we could become subject to sanctions or other penalties that could negatively affect our reputation, business and operating results.
As a global apparel company, we may experience fluctuations in our tax liabilities and effective tax rate.
As a global apparel company, we are subject to income taxes in the United States and various foreign jurisdictions. We record our income tax liability based on an analysis and interpretation of local tax laws and regulations, which requires a significant amount of judgment and estimation. In addition, we may from time to time modify our operations in an effort to minimize our global income tax exposure. Our effective income tax rate in any particular period or in future periods may be affected by a number of factors, including a shift in the mix of revenues, income and/or losses among domestic and international sources during a year or over a period of years; changes in tax laws and regulations and/or international tax treaties; the outcome of income tax audits in various jurisdictions; the difference between the income tax deduction and the previously recognized income tax benefit related to the vesting of equity-based compensation awards; and the resolution of uncertain tax positions, any of which could adversely affect our effective income tax rate and profitability.
Further, changes to U.S. and foreign tax laws and compliance with new tax laws could have a material adverse effect on our tax expense, cash flows and operations. For example, the Organization for Economic Cooperation and Development has published action plans that, if adopted by countries where we do business, could materially impact our tax obligations in those countries.
We make use of debt to finance our operations, which exposes us to risks that could adversely affect our business, financial position and operating results.
Our levels of debt vary as a result of the seasonality of our business, investments in our operations and working capital needs. As of February 2, 2019, we had $13 million of borrowings outstanding under our U.S. Revolving Credit Agreement. In the future, our debt levels may increase under our existing facility or potentially under new facilities, or the terms or forms of our financing arrangements may change.
Our indebtedness includes, and any future indebtedness may include, certain obligations and limitations, including the periodic payment of principal, interest and unused line fees, maintenance of certain covenants and certain other limitations. The negative covenants in our debt agreements limit our ability to incur debt; guaranty certain obligations; incur liens; pay dividends; repurchase common stock; make investments; sell assets; make acquisitions; merge with other companies; or satisfy other debt. These obligations and limitations may increase our vulnerability to adverse economic and industry conditions, place us at a competitive disadvantage compared to any competitors that may be less leveraged and limit our flexibility in carrying out our business plans and planning for, or reacting to, change.
In addition, we have interest rate risk on indebtedness under our variable rate U.S. Revolving Credit Agreement. Our exposure to variable rate indebtedness may increase in the future, based on our debt levels and/or the terms of future financing
33
arrangements. Further, an increase in the interest rate environment would require us to pay a greater amount of our funds from operations towards interest, even if the amount of borrowings outstanding remains the same. As a result, we may have to revise or delay our business plans, reduce or delay capital expenditures or otherwise adjust our plans for operations.
A portion of our indebtedness under the U.S. Revolving Credit Agreement at any time may be based on LIBOR, which is the subject of recent proposals for reform or elimination. In particular, on July 27, 2017, the United Kingdom’s Financial Conduct Authority, which regulates LIBOR, publicly announced that it intends to stop persuading or compelling banks to submit LIBOR rates after 2021. It is unclear what the impact, if any, might be if LIBOR ceases to exist or if the methods of calculating LIBOR change from current methods.
The continued growth of our business also depends on our access to sufficient funds. We rely on cash flow from operations and borrowings under our U.S. Revolving Credit Agreement to fund our working capital, capital expenditures and investment activities. As of February 2, 2019, we had $254 million in unused availability under our U.S. Revolving Credit Agreement. If the need arises in the future to finance expenditures in excess of those supported by our operations and the existing credit facility, including to consummate a material acquisition if the right opportunity was presented, we may need to seek additional funding, which may be through debt or equity financing. Our ability to obtain that financing will depend on many factors, including prevailing market conditions, our financial condition and, depending on the sources of financing, our ability to negotiate favorable terms and conditions. The terms of any such financing or our inability to secure such financing could adversely affect our ability to execute our strategies.
Labor-related matters, including labor disputes, may adversely affect our operations.
We may be adversely affected as a result of labor disputes in our own operations or in those of third parties with whom we work. Our business depends on our ability to source and distribute products in a timely manner, and our new retail store and restaurant growth is dependent on timely construction of our locations. While we are not subject to any organized labor agreements and have historically enjoyed good employee relations, there can be no assurance that we will not experience work stoppages or other labor problems in the future with our non-unionized employees. In addition, potential labor disputes at independent factories where our goods are produced, shipping ports or transportation carriers create risks for our business, particularly if a dispute results in work slowdowns, lockouts, strikes or other disruptions during our peak manufacturing, shipping and selling seasons. Further, we plan our inventory purchases and forecasts based on the anticipated timing of retail store and restaurant openings, which could be delayed as a result of a number of factors, including labor disputes among contractors engaged to construct our locations or within government licensing or permitting offices. Any potential labor dispute, either in our own operations or in those of third parties on whom we rely, could materially affect our costs, decrease our sales, harm our reputation or otherwise negatively affect our operations.
Our international operations, including foreign sourcing, result in an exposure to fluctuations in foreign currency exchange rates.
We are exposed to certain currency exchange risks in conducting business outside of the United States. The substantial majority of our product purchases are from foreign vendors and are denominated in U.S. dollars. If the value of the U.S. dollar decreases relative to certain foreign currencies in the future, then the prices that we negotiate for products could increase and we may be unable to pass this increase on to customers, which would negatively impact our margins. However, if the value of the U.S. dollar increases between the time a price is set and payment for a product, the price we pay may be higher than that paid for comparable goods by competitors that pay for goods in local currencies, and these competitors may be able to sell their products at more competitive prices. Additionally, currency fluctuations could also disrupt the business of our independent manufacturers by making their purchases of raw materials more expensive and difficult to finance.
We received U.S. dollars for 96% of our product sales during Fiscal 2018, with the remaining sales primarily related to our retail operations in Canada, Australia and Japan. An increase in the value of the U.S. dollar compared to other currencies in which we have sales could result in lower levels of sales and earnings reported in our consolidated statements of operations, even though the sales in foreign currencies could be equal to or greater than amounts in prior periods. In addition, to the extent that a stronger U.S. dollar increases product and other costs, products sold in foreign markets in the local currency may realize lower gross margins.
Our business could be impacted as a result of actions by activist shareholders or others.
We may be subject, from time to time, to legal and business challenges in the operation of our company due to actions instituted by activist shareholders or others. Responding to such actions could be costly and time-consuming, may not align with our business strategies and could divert the attention of our Board of Directors and senior management from the pursuit of our
34
business strategies. Perceived uncertainties as to our future direction as a result of activism may lead to the perception of a change in the direction of the business or other instability and may adversely affect our relationships with vendors, customers, prospective and current employees and others.
Item 1B.
Unresolved Staff Comments
None.
Item 2.
Properties
We lease and own space for our retail stores and restaurants, distribution centers, sales/administration offices and manufacturing operations in various domestic and international locations. We believe that our existing properties are well maintained, are in good operating condition and will be adequate for our present level of operations.
In the ordinary course of business, we enter into lease agreements for our direct to consumer operations, including leases for retail and restaurant space. Most of the leases require us to pay specified minimum rent, as well as a portion of operating expenses, real estate taxes and insurance applicable to the property, contingent rent based on a percentage of the location's net sales in excess of a specific threshold and in some locations sales tax on rental amounts paid to the landlord. The leases have varying terms and expirations and may have provisions to extend, renew or terminate the lease agreement, among other terms and conditions. Periodically, we assess the operating results of our direct to consumer locations to assess whether the location provides, or is expected to provide, an appropriate long-term return on investment, whether the location remains brand appropriate and other factors. As a result of this assessment, we may determine that it is appropriate to close certain stores that do not continue to meet our investment criteria, not renew certain leases, exercise an early termination option, or otherwise negotiate an early termination. For existing leases in desirable locations, we anticipate that we will be able to extend our leases, to the extent that they expire in the near future, on terms that are satisfactory to us, or if necessary, locate substitute properties on acceptable terms. The terms and conditions of lease renewals or relocations may not be as favorable as existing leases.
As of
February 2, 2019
, our 229 direct to consumer locations utilized approximately 0.9 million square feet of leased space in the United States, Canada, Australia and Japan. Each of our retail stores and restaurants is less than 20,000 square feet, and we do not believe that we are dependent upon any individual retail store or restaurant location for our business operations. Greater detail about the retail space used by each operating group is included in Part I, Item 1, Business included in this report.
As of
February 2, 2019
, we utilized approximately 1.6 million square feet of owned or leased distribution, manufacturing and administrative/sales facilities in the United States, Mexico and Hong Kong. In addition to our owned distribution facilities, we may utilize certain third party warehouse/distribution providers where we do not own or lease any space. Our distribution, manufacturing, administrative and sales facilities provide space for employees and functions used in support of our direct to consumer and wholesale operations.
Details of the principal administrative, sales, distribution and manufacturing facilities used in our operations, including approximate square footage, are as follows:
|
Location
|
Primary Use
|
Operating Group
|
Square
Footage
|
Lease
Expiration
|
|
|
Seattle, Washington
|
Sales/administration
|
Tommy Bahama
|
115,000
|
|
2026
|
|
Auburn, Washington
|
Distribution center
|
Tommy Bahama
|
325,000
|
|
2025
|
|
King of Prussia, Pennsylvania
|
Sales/administration and distribution center
|
Lilly Pulitzer
|
160,000
|
|
Owned
|
|
Toccoa, Georgia
|
Distribution center
|
Lanier Apparel
|
310,000
|
|
Owned
|
|
Merida, Mexico
|
Manufacturing plant
|
Lanier Apparel
|
80,000
|
|
Owned
|
|
Greenville, South Carolina
|
Sales/administration
|
Southern Tide
|
14,000
|
|
2024
|
|
Atlanta, Georgia
|
Sales/administration
|
Corporate and Other and Lanier Apparel
|
30,000
|
|
2023
|
|
Lyons, Georgia
|
Distribution center
|
Various
|
420,000
|
|
Owned
|
Item 3.
Legal Proceedings
From time to time, we are a party to litigation and regulatory actions arising in the ordinary course of business. These actions may relate to trademark and other intellectual property, licensing arrangements, real estate, importing or exporting
35
regulations, taxation, employee relation matters or other topics. We are not currently a party to any litigation or regulatory action or aware of any proceedings contemplated by governmental authorities that we believe could reasonably be expected to have a material impact on our financial position, results of operations or cash flows. However, our assessment of any litigation or other legal claims could potentially change in light of the discovery of additional factors not presently known or determinations by judges, juries, or others which are not consistent with our evaluation of the possible liability or outcome of such litigation or claims.
Item 4.
Mine Safety Disclosures
Not applicable.
PART II
Item 5.
Market for Registrant's Common Equity, Related Stockholder Matters and Issuer Purchases of Equity Securities
Market and Dividend Information
Our common stock is listed and traded on the New York Stock Exchange under the symbol "OXM." As of March 15, 2019, there were 287
record holders of our common stock.
Although we have paid dividends in each quarter since we became a public company in July 1960, including
$23 million
in total or $1.36 per common share in
Fiscal 2018
, we may discontinue or modify dividend payments at any time if we determine that other uses of our capital, including payment of outstanding debt, funding of acquisitions, funding of capital expenditures or repurchases of outstanding shares, may be in our best interest; if our expectations of future cash flows and future cash needs outweigh the ability to pay a dividend; or if the terms of our credit facility, other debt instruments or applicable law limit our ability to pay dividends. We may borrow to fund dividends in the short term based on our expectation of operating cash flows in future periods subject to the terms and conditions of our credit facility, other debt instruments and applicable law. All cash flow from operations will not be paid out as dividends in all periods. For details about limitations on our ability to pay dividends, see Note 5 of our consolidated financial statements and Part II, Item 7. Management's Discussion and Analysis of Financial Condition and Results of Operations, both contained in this report.
Recent Sales of Unregistered Securities
We did not sell any unregistered equity securities during
Fiscal 2018
.
Purchases of Equity Securities by the Issuer and Affiliated Purchasers
We have certain stock incentive plans as described in Note 7 to our consolidated financial statements included in this report, all of which are publicly announced plans. Under the plans, we can repurchase shares from employees to cover employee tax liabilities related to the vesting of shares of our stock. During the Fourth Quarter of
Fiscal 2018
, no shares were repurchased pursuant to these plans.
In March 2017, our Board of Directors authorized us to spend up to $50 million to repurchase shares of our stock. This authorization superseded and replaced all previous authorizations to repurchase shares of our stock and has no automatic expiration. As of
February 2, 2019
, no shares of our stock had been repurchased pursuant to this authorization.
36
Stock Price Performance Graph
The graph below reflects cumulative total shareholder return (assuming an initial investment of $100 and the reinvestment of dividends) on our common stock compared to the cumulative total return for a period of five years, beginning February 1, 2014 and ending
February 2, 2019
, of:
•
The S&P SmallCap 600 Index; and
•
The S&P 500 Apparel, Accessories and Luxury Goods.
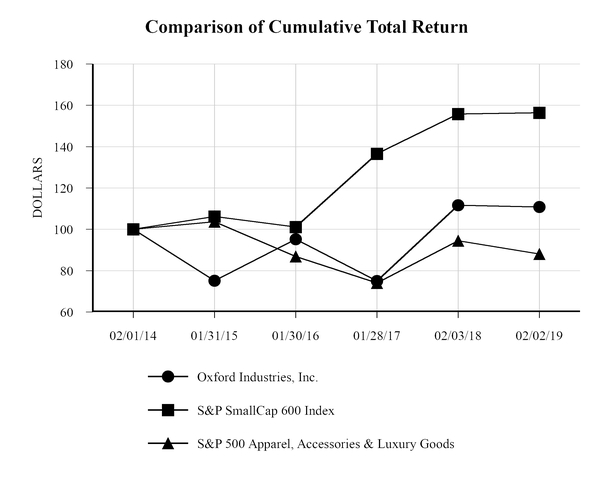
|
INDEXED RETURNS
|
||||||||||||
|
|
Base Period
|
Years Ended
|
||||||||||
|
Company / Index
|
2/1/14
|
1/31/15
|
|
1/30/16
|
|
1/28/17
|
|
2/3/18
|
|
2/2/19
|
|
|
|
Oxford Industries, Inc.
|
100
|
75.14
|
|
95.15
|
|
74.96
|
|
111.69
|
|
110.78
|
|
|
|
S&P SmallCap 600 Index
|
100
|
106.15
|
|
101.18
|
|
136.59
|
|
155.82
|
|
156.37
|
|
|
|
S&P 500 Apparel, Accessories & Luxury Goods
|
100
|
103.68
|
|
86.86
|
|
74.01
|
|
94.47
|
|
88.04
|
|
|
37
Item 6.
Selected Financial Data
Our selected financial data included in the table below reflects (1) the acquisition of the Southern Tide operations and assets in April 2016 and (2) the divestiture of the operations and assets of our former Ben Sherman operating group in July 2015, resulting in the classification of Ben Sherman operations as discontinued operations in our consolidated statements of operations for all periods presented. Cash flow, capital expenditures, equity compensation, depreciation and amortization amounts below include amounts for both continuing and discontinued operations as our consolidated statements of cash flow are presented on a consolidated basis including continuing and discontinued operations.
|
Fiscal 2018
|
|
Fiscal 2017
|
|
Fiscal 2016
|
|
Fiscal 2015
|
|
Fiscal 2014
|
|
||||||
|
|
(in millions, except per share amounts)
|
||||||||||||||
|
Net sales
|
$
|
1,107.5
|
|
$
|
1,086.2
|
|
$
|
1,022.6
|
|
$
|
969.3
|
|
$
|
920.3
|
|
|
Cost of goods sold
|
470.3
|
|
473.6
|
|
442.3
|
|
412.7
|
|
402.4
|
|
|||||
|
Gross profit
|
637.2
|
|
612.6
|
|
580.3
|
|
556.6
|
|
517.9
|
|
|||||
|
SG&A
|
560.5
|
|
540.5
|
|
504.6
|
|
473.5
|
|
439.1
|
|
|||||
|
Royalties and other operating income
|
14.0
|
|
13.9
|
|
14.2
|
|
14.4
|
|
13.9
|
|
|||||
|
Operating income
|
90.6
|
|
86.0
|
|
89.9
|
|
97.5
|
|
92.8
|
|
|||||
|
Interest expense, net
|
2.3
|
|
3.1
|
|
3.4
|
|
2.5
|
|
3.2
|
|
|||||
|
Earnings from continuing operations before income taxes
|
88.3
|
|
82.9
|
|
86.5
|
|
95.1
|
|
89.6
|
|
|||||
|
Income taxes
|
22.0
|
|
18.2
|
|
32.0
|
|
36.5
|
|
35.8
|
|
|||||
|
Net earnings from continuing operations
|
66.3
|
|
64.7
|
|
54.5
|
|
58.5
|
|
53.8
|
|
|||||
|
Income (loss), including loss on sale, from discontinued operations, net of taxes
|
—
|
|
0.4
|
|
(2.0
|
)
|
(28.0
|
)
|
(8.0
|
)
|
|||||
|
Net earnings
|
$
|
66.3
|
|
$
|
65.1
|
|
$
|
52.5
|
|
$
|
30.6
|
|
$
|
45.8
|
|
|
Diluted earnings from continuing operations per share
|
$
|
3.94
|
|
$
|
3.87
|
|
$
|
3.27
|
|
$
|
3.54
|
|
$
|
3.27
|
|
|
Diluted income (loss), including loss on sale, from discontinued operations per share
|
$
|
—
|
|
$
|
0.02
|
|
$
|
(0.12
|
)
|
$
|
(1.69
|
)
|
$
|
(0.49
|
)
|
|
Diluted net earnings per share
|
$
|
3.94
|
|
$
|
3.89
|
|
$
|
3.15
|
|
$
|
1.85
|
|
$
|
2.78
|
|
|
Diluted weighted average shares outstanding
|
16.8
|
|
16.7
|
|
16.6
|
|
16.6
|
|
16.5
|
|
|||||
|
Dividends declared and paid
|
$
|
23.1
|
|
$
|
18.2
|
|
$
|
18.1
|
|
$
|
16.6
|
|
$
|
13.9
|
|
|
Dividends declared and paid per share
|
$
|
1.36
|
|
$
|
1.08
|
|
$
|
1.08
|
|
$
|
1.00
|
|
$
|
0.84
|
|
|
Total assets, at period-end
|
$
|
727.3
|
|
$
|
699.9
|
|
$
|
685.2
|
|
$
|
582.7
|
|
$
|
622.4
|
|
|
Long-term debt at period-end
|
$
|
13.0
|
|
$
|
45.8
|
|
$
|
91.5
|
|
$
|
44.0
|
|
$
|
104.8
|
|
|
Shareholders' equity, at period-end
|
$
|
478.4
|
|
$
|
429.8
|
|
$
|
376.1
|
|
$
|
334.4
|
|
$
|
290.6
|
|
|
Cash provided by operating activities
|
$
|
96.4
|
|
$
|
118.6
|
|
$
|
118.6
|
|
$
|
105.4
|
|
$
|
95.4
|
|
|
Capital expenditures
|
$
|
37.0
|
|
$
|
38.7
|
|
$
|
49.4
|
|
$
|
73.1
|
|
$
|
50.4
|
|
|
Depreciation and amortization expense
|
$
|
42.5
|
|
$
|
42.4
|
|
$
|
42.2
|
|
$
|
36.4
|
|
$
|
37.6
|
|
|
Equity compensation expense
|
$
|
7.3
|
|
$
|
6.4
|
|
$
|
6.4
|
|
$
|
5.2
|
|
$
|
4.1
|
|
|
LIFO accounting charge (credit)
|
$
|
0.8
|
|
$
|
7.8
|
|
$
|
(5.9
|
)
|
$
|
0.3
|
|
$
|
2.1
|
|
|
Book value per share at period-end
|
$
|
28
|
|
$
|
26
|
|
$
|
22
|
|
$
|
20
|
|
$
|
18
|
|
|
Stock price per share at period-end
|
$
|
77
|
|
$
|
79
|
|
$
|
54
|
|
$
|
70
|
|
$
|
56
|
|
38
Item 7.
Management's Discussion and Analysis of Financial Condition and Results of Operations
The following discussion and analysis of our operations, cash flows, liquidity and capital resources should be read in conjunction with our consolidated financial statements contained in this report.
OVERVIEW
We are a global apparel company that designs, sources, markets and distributes products bearing the trademarks of our Tommy Bahama, Lilly Pulitzer and Southern Tide lifestyle brands and other owned and licensed brands as well as private label apparel products. During
Fiscal 2018
, 93% of our net sales were from products bearing brands that we own and 69% of our net sales were through our direct to consumer channels of distribution. In
Fiscal 2018
, 96% of our consolidated net sales were to customers located in the United States, with the sales outside the United States consisting primarily of our Tommy Bahama product sales in Canada and the Asia-Pacific region.
Our business strategy is to develop and market compelling lifestyle brands and products that evoke a strong emotional response from our target consumers. We consider lifestyle brands to be those brands that have a clearly defined and targeted point of view inspired by an appealing lifestyle or attitude. Furthermore, we believe lifestyle brands that create an emotional connection, like Tommy Bahama, Lilly Pulitzer and Southern Tide, can command greater loyalty and higher price points at retail and create licensing opportunities, which may drive higher earnings. We believe the attraction of a lifestyle brand depends on creating compelling product, effectively communicating the respective lifestyle brand message and distributing products to consumers where and when they want them.
Our ability to compete successfully in styling and marketing is directly related to our proficiency in foreseeing changes and trends in fashion and consumer preference and presenting appealing products for consumers. Our design-led, commercially informed lifestyle brand operations strive to provide exciting, differentiated products each season.
To further strengthen each lifestyle brand's connections with consumers, we directly communicate with consumers through digital and print media on a regular basis. We believe our ability to effectively communicate the images, lifestyle and products of our brands and create an emotional connection with consumers is critical to the success of our brands. Advertising for our brands often attempts to convey the lifestyle of the brand as well as a specific product.
We distribute our owned lifestyle branded products primarily through our direct to consumer channels, consisting of our Tommy Bahama and Lilly Pulitzer retail stores and our e-commerce sites for Tommy Bahama, Lilly Pulitzer and Southern Tide, and through our wholesale distribution channels. Our direct to consumer operations provide us with the opportunity to interact directly with our customers, present to them a broad assortment of our current season products and immerse them in the theme of the lifestyle brand. We believe that presenting our products in a setting specifically designed to showcase the lifestyle on which the brands are based enhances the image of our brands. Our Tommy Bahama and Lilly Pulitzer full-price retail stores provide high visibility for our brands and products and allow us to stay close to the preferences of our consumers, while also providing a platform for long-term growth for the brands. In Tommy Bahama, we also operate a limited number of restaurants and Marlin Bars, generally adjacent to a Tommy Bahama full-price retail store location, which we believe further enhance the brand's image with consumers. Our e-commerce websites, which represented 21% of our consolidated net sales in
Fiscal 2018
, provide the opportunity to increase revenues by reaching a larger population of consumers and at the same time allow our brands to provide a broader range of products.
The wholesale operations of our lifestyle brands complement our direct to consumer operations and provide access to a larger group of consumers. As we seek to maintain the integrity of our lifestyle brands by limiting promotional activity in our full-price retail stores and e-commerce websites, we generally target wholesale customers that follow this same approach in their stores. Our wholesale customers for our Tommy Bahama, Lilly Pulitzer and Southern Tide brands generally include various specialty stores, Signature Stores for Lilly Pulitzer and Southern Tide, better department stores and multi-branded e-commerce retailers. Within our Lanier Apparel operating group, we sell tailored clothing and sportswear products under licensed, private label and owned brands. Lanier Apparel's customers include department stores, discount and off-price retailers, warehouse clubs, national chains, specialty stores and multi-branded e-commerce retailers.
The disposal of discontinued, end of season or excess inventory is an ongoing part of any apparel business, and our operating groups have historically utilized a variety of methods to sell such inventory, including outlet stores in Tommy Bahama, e-commerce flash sales, and off-price retailers. Our focus in disposing of the excess inventory for our lifestyle brands is to do so in a brand appropriate setting and achieve an acceptable margin.
39
All of our operating groups operate in highly competitive apparel markets in which numerous U.S. and foreign-based apparel firms compete. No single apparel firm or small group of apparel firms dominates the apparel industry, and our direct competitors vary by operating group and distribution channel. We believe the principal competitive factors in the apparel industry are reputation, value, and image of brand names; design; consumer preference; price; quality; marketing; product fulfillment capabilities; and customer service.
The apparel industry is cyclical and very dependent upon the overall level and focus of discretionary consumer spending, which changes as consumer preferences and regional, domestic and international economic conditions change. Increasingly, consumers are choosing to spend less of their discretionary spending on certain product categories, including apparel, while spending more on services and other product categories. Further, negative economic conditions often have a longer and more severe impact on the apparel industry than on other industries. We believe the changes in consumer preferences for discretionary spending, the current global economic conditions and economic uncertainty continue to impact the business of each of our operating groups and the apparel industry as a whole.
We believe the retail apparel market is evolving very rapidly and in ways that are having a disruptive impact on traditional fashion retailing. The application of technology, including the internet and mobile devices, to fashion retail provides consumers increasing access to multiple, responsive distribution platforms and an unprecedented ability to communicate directly with brands and retailers. As a result, consumers have more information and greater control over information they receive as well as broader, faster and cheaper access to goods than ever before. This, along with the coming of age of the “millennial” generation, is revolutionizing the way that consumers shop for fashion and other goods, which is evidenced by weakness and store closures for certain department stores and mall-based retailers, decreased consumer retail traffic, a more promotional retail environment, expansion of off-price and discount retailers, and a shift from bricks and mortar to internet purchasing. These changes may require that brands and retailers approach their operations, including marketing and advertising, very differently than historical practices and may result in increased operating costs to generate growth or even maintain their current sales levels.
While this evolution in the fashion retail industry presents significant risks, especially for traditional retailers who fail or are unable to adapt, we believe it also presents a tremendous opportunity for brands and retailers to capitalize on the changing consumer environment. We believe our brands have true competitive advantages in this new retailing paradigm, and we are leveraging technology to serve our consumers when and where they want to be served. We continue to believe that our lifestyle brands, with their strong emotional connections with consumers, are well suited to succeed and thrive in the long term while managing the various challenges facing our industry.
Specifically, we believe our lifestyle brands have opportunities for long-term growth in our direct to consumer businesses. We anticipate increased sales in our e-commerce operations, which are expected to grow at a faster rate than bricks and mortar comparable store sales. We also believe growth can be achieved through prudent expansion of bricks and mortar full-price retail store and restaurant operations and modest comparable full-price retail store and restaurant sales increases. We expect there will continue to be desirable locations for additional retail stores, but at a more measured growth rate than prior years.
We believe our lifestyle brands have an opportunity for modest sales increases in their wholesale businesses in the long term. However, we must be diligent in our effort to avoid compromising the integrity of our brands by maintaining or growing sales with wholesale customers that may not be aligned with our long-term strategy. This is particularly important with the challenges in the department store channel, which represented approximately 12% of our consolidated net sales in
Fiscal 2018
, compared to approximately 14% in
Fiscal 2017
. The management of wholesale distribution for our lifestyle brands resulted in a decrease in wholesale sales in
Fiscal 2018
. While we anticipate modest growth in our wholesale sales in Fiscal 2019, there could be additional reductions in wholesale sales in future years, as the amount of sales to certain wholesale accounts could decrease if the number of of doors that carry our product decreases, the volume sold for a particular door is reduced or the account is exited altogether. We anticipate that sales increases in our wholesale businesses in the long term will stem primarily from current customers adding within their existing door count and increasing their online business; increased sales to online retailers; and our selective addition of new wholesale customers who generally present and merchandise our products in a way that is consistent with our full-price, direct to consumer distribution strategy. We also believe that there are opportunities for modest sales growth for Lanier Apparel in the future through new product programs and licenses.
We believe we must continue to invest in our lifestyle brands to take advantage of their long-term growth opportunities. Investments include capital expenditures primarily related to the direct to consumer operations, such as technology enhancements, e-commerce initiatives and retail store and restaurant build-out for new, relocated or remodeled locations, as well as distribution center and administrative office expansion initiatives. Additionally, we anticipate increased employment and other costs to support ongoing business operations and fuel future sales growth.
40
In the midst of the changes in our industry, an important initiative for us in recent years was to increase the profitability of the Tommy Bahama business. These initiatives generally focused on increasing gross margin and operating margin through efforts such as: product cost reductions; selective price increases; reducing inventory purchases; redefining our approach to inventory clearance; effectively managing controllable and discretionary operating expenses; taking a more conservative approach to retail store openings and lease renewals; and continuing our efforts to reduce Asia-Pacific operating losses. While progress was made on these initiatives in both
Fiscal 2018
and Fiscal 2017, we expect to make further progress on improving the profitability of the Tommy Bahama business in the future.
We continue to believe it is important to maintain a strong balance sheet and liquidity. We believe positive cash flow from operations, coupled with the strength of our balance sheet and liquidity, will provide us with sufficient resources to fund future investments in our owned lifestyle brands. While we believe we have significant opportunities to appropriately deploy our capital and resources in our existing lifestyle brands, our strong cash flows from operations provide us the ability to continue to evaluate opportunities to add additional lifestyle brands to our portfolio in the future if we identify appropriate targets that meet our investment criteria. While we are actively exploring acquisition opportunities, investment opportunities for the types of large brands with the attributes that we desire are not always available at an acceptable price. Therefore, our interest in acquiring smaller brands and earlier stage companies has increased in recent years, particularly in businesses where we may have the opportunity to more fully integrate the brand into our existing infrastructure and shared services functions.
Important factors relating to certain risks, many of which are beyond our ability to control or predict, which could impact our business are described in Part I, Item 1A. Risk Factors of this report.
The following table sets forth our consolidated operating results from continuing operations (in thousands, except per share amounts) for
Fiscal 2018
compared to
Fiscal 2017
:
|
Fiscal 2018
|
Fiscal 2017
|
|||||
|
Net sales
|
$
|
1,107,466
|
|
$
|
1,086,211
|
|
|
Operating income
|
$
|
90,592
|
|
$
|
86,000
|
|
|
Net earnings from continuing operations
|
$
|
66,291
|
|
$
|
64,701
|
|
|
Net earnings from continuing operations per diluted share
|
$
|
3.94
|
|
$
|
3.87
|
|
|
Weighted average shares outstanding - diluted
|
16,842
|
|
16,734
|
|
||
The higher net earnings per diluted share in
Fiscal 2018
was due to (1) the improved operating results in Corporate and Other, primarily due to the favorable net impact of LIFO accounting and the operations of TBBC, (2) increased operating income in Southern Tide primarily due to higher net sales, (3) lower interest expense, and (4) improved operating income in Lilly Pulitzer primarily reflecting higher sales. These items were partially offset by (1) the higher effective tax rate reflecting the net impact of a lower corporate income tax rate in Fiscal 2018 offset by the revaluation of deferred tax amounts in Fiscal 2017, (2) lower operating income in Lanier Apparel, primarily due to lower sales, and (3) lower operating income in Tommy Bahama, primarily due to charges related to the restructure and downsizing of our Tommy Bahama Japan operations and lower wholesale sales.
OPERATING GROUPS
Our business is primarily operated through our Tommy Bahama, Lilly Pulitzer, Lanier Apparel and Southern Tide operating groups. We identify our operating groups based on the way our management organizes the components of our business for purposes of allocating resources and assessing performance. Our operating group structure reflects a brand-focused management approach, emphasizing operational coordination and resource allocation across each brand's direct to consumer, wholesale and licensing operations, as applicable.
Tommy Bahama, Lilly Pulitzer and Southern Tide each design, source, market and distribute apparel and related products bearing their respective trademarks and license their trademarks for other product categories, while Lanier Apparel designs, sources and distributes branded and private label men's tailored clothing, sportswear and other products. Corporate and Other is a reconciling category for reporting purposes and includes our corporate offices, substantially all financing activities, the elimination of inter-segment sales and any other items that are not allocated to the operating groups including LIFO accounting adjustments. Because our LIFO inventory pool does not correspond to our operating group definitions, LIFO inventory accounting adjustments are not allocated to the operating groups. Corporate and Other also includes the operations of other businesses which are not included in our operating groups. The operations of TBBC, which we acquired in December 2017, and our Lyons, Georgia distribution center are included in Corporate and Other.
41
For additional information about each of our operating groups, see Part I, Item 1. Business and Note 2 to our consolidated financial statements, both included in this report.
COMPARABLE STORE SALES
We often disclose comparable store sales in order to provide additional information regarding changes in our results of operations between periods. Our disclosures of comparable store sales include net sales from full-price retail stores and our e-commerce sites, excluding sales associated with e-commerce flash clearance sales. We believe that the inclusion of both our full-price retail stores and e-commerce sites in the comparable store sales disclosures is a more meaningful way of reporting our comparable store sales results, given similar inventory planning, allocation and return policies, as well as our cross-channel marketing and other initiatives for the direct to consumer channel. For our comparable store sales disclosures, we exclude (1) outlet store sales, warehouse sales and e-commerce flash clearance sales, as those clearance sales are used primarily to liquidate end of season inventory, which may vary significantly depending on the level of end of season inventory on hand and generally occur at lower gross margins than our non-clearance direct to consumer sales, and (2) restaurant sales, as we do not currently believe that the inclusion of restaurant sales in our comparable store sales disclosures is meaningful in assessing our consolidated results of operations. Comparable store sales information reflects net sales, including shipping and handling revenues, if any, associated with product sales.
For purposes of our disclosures, we consider a comparable store to be, in addition to our e-commerce sites, a physical full-price retail store that was owned and open as of the beginning of the prior fiscal year and which did not have during the relevant periods, and is not within the current fiscal year scheduled to have, (1) a remodel or other event which would result in a closure for an extended period of time (which we define as a period of two weeks or longer), (2) a greater than 15% change in the size of the retail space due to expansion, reduction or relocation to a new retail space or (3) a relocation to a new space that was significantly different from the prior retail space. For those stores which are excluded from comparable stores based on the preceding sentence, the stores continue to be excluded from comparable store sales until the criteria for a new store is met subsequent to the remodel, relocation, or other event. A store that is remodeled will generally continue to be included in our comparable store sales metrics as a store is not typically closed for longer than a two-week period during a remodel; however, a store that is relocated generally will not be included in our comparable store sales metrics until that store has been open in the relocated space for the entirety of the prior fiscal year because the size or other characteristics of the store typically change significantly from the prior location. Any stores that were closed during the prior fiscal year or current fiscal year, or which we expect to close or vacate in the current fiscal year, are excluded from the definition of comparable store sales.
Because Fiscal 2017 included 53 weeks and Fiscal 2018 included 52 weeks, we calculated comparable store sales on a 52 week basis for Fiscal 2018 compared to a 52 week basis for the 52 weeks ended February 3, 2018. Also, for Fiscal 2017 versus Fiscal 2016 comparable store sales, we calculated comparable store sales on a 53 week to 53 week basis for Fiscal 2017. We believe this calendar-adjusted comparable store sales presentation for Fiscal 2018 and Fiscal 2017 provides a more accurate assessment of comparable store productivity than a 52 week to 53 week basis comparison of comparable store sales.
Definitions and calculations of comparable store sales differ among retail companies, and therefore comparable store sales metrics disclosed by us may not be comparable to the metrics disclosed by other companies.
STORE COUNT
The table below provides store count information for Tommy Bahama and Lilly Pulitzer as of the dates specified.
|
February 2, 2019
|
February 3, 2018
|
January 28, 2017
|
January 30, 2016
|
|
|
Tommy Bahama Full-Price Retail Stores
|
113
|
110
|
111
|
107
|
|
Tommy Bahama Retail-Restaurant Locations
|
17
|
18
|
17
|
16
|
|
Tommy Bahama Outlet Stores
|
37
|
38
|
40
|
41
|
|
Total Tommy Bahama Retail Locations
|
167
|
166
|
168
|
164
|
|
Lilly Pulitzer Full-Price Retail Stores
|
62
|
57
|
40
|
34
|
|
Total Oxford Retail Locations
|
229
|
223
|
208
|
198
|
42
RESULTS OF OPERATIONS
The following table sets forth the specified line items in our consolidated statements of operations both in dollars (in thousands) and as a percentage of net sales. We have calculated all percentages based on actual data, but percentage columns may not add due to rounding. Individual line items of our consolidated statements of operations may not be directly comparable to those of our competitors, as classification of certain expenses may vary by company.
Unless otherwise indicated, all references to assets, liabilities, revenues, expenses and other information in this report reflect continuing operations and exclude any amounts related to discontinued operations. Refer to Note 1 in our consolidated financial statements included in this report for additional information about discontinued operations. We do not anticipate any cash flows or earnings related to discontinued operations in future periods.
|
Fiscal 2018
|
Fiscal 2017
|
Fiscal 2016
|
|||||||||||||
|
Net sales
|
$
|
1,107,466
|
|
100.0
|
%
|
$
|
1,086,211
|
|
100.0
|
%
|
$
|
1,022,588
|
|
100.0
|
%
|
|
Cost of goods sold
|
470,342
|
|
42.5
|
%
|
473,579
|
|
43.6
|
%
|
442,284
|
|
43.3
|
%
|
|||
|
Gross profit
|
637,124
|
|
57.5
|
%
|
612,632
|
|
56.4
|
%
|
580,304
|
|
56.7
|
%
|
|||
|
SG&A
|
560,508
|
|
50.6
|
%
|
540,517
|
|
49.8
|
%
|
504,600
|
|
49.3
|
%
|
|||
|
Royalties and other operating income
|
13,976
|
|
1.3
|
%
|
13,885
|
|
1.3
|
%
|
14,180
|
|
1.4
|
%
|
|||
|
Operating income
|
90,592
|
|
8.2
|
%
|
86,000
|
|
7.9
|
%
|
89,884
|
|
8.8
|
%
|
|||
|
Interest expense, net
|
2,283
|
|
0.2
|
%
|
3,109
|
|
0.3
|
%
|
3,421
|
|
0.3
|
%
|
|||
|
Earnings from continuing operations before income taxes
|
88,309
|
|
8.0
|
%
|
82,891
|
|
7.6
|
%
|
86,463
|
|
8.5
|
%
|
|||
|
Income taxes
|
22,018
|
|
2.0
|
%
|
18,190
|
|
1.7
|
%
|
31,964
|
|
3.1
|
%
|
|||
|
Net earnings from continuing operations
|
$
|
66,291
|
|
6.0
|
%
|
$
|
64,701
|
|
6.0
|
%
|
$
|
54,499
|
|
5.3
|
%
|
|
Income (loss) from discontinued operations, net of taxes
|
—
|
|
NM
|
|
389
|
|
NM
|
|
(2,038
|
)
|
NM
|
|
|||
|
Net earnings
|
$
|
66,291
|
|
NM
|
|
$
|
65,090
|
|
NM
|
|
$
|
52,461
|
|
NM
|
|
|
Weighted average shares outstanding - diluted
|
16,842
|
|
16,734
|
|
16,649
|
|
|||||||||
The following table presents the proportion of our consolidated net sales by distribution channel for each period presented:
|
|
Fiscal 2018
|
Fiscal 2017
|
Fiscal 2016
|
|||
|
Full-price retail stores and outlets
|
40
|
%
|
39
|
%
|
40
|
%
|
|
E-commerce
|
21
|
%
|
19
|
%
|
18
|
%
|
|
Restaurant
|
8
|
%
|
8
|
%
|
7
|
%
|
|
Wholesale
|
31
|
%
|
34
|
%
|
35
|
%
|
|
Total
|
100
|
%
|
100
|
%
|
100
|
%
|
FISCAL 2018 COMPARED TO FISCAL 2017
The discussion and tables below compare certain line items included in our statements of operations for
Fiscal 2018
, which included 52 weeks, to
Fiscal 2017
, which included 53 weeks. Each dollar and percentage change provided reflects the change between these fiscal periods unless indicated otherwise. Each dollar and share amount included in the tables is in thousands except for per share amounts.
Net Sales
43
|
Fiscal 2018
|
Fiscal 2017
|
$ Change
|
% Change
|
||||||||
|
Tommy Bahama
|
$
|
675,358
|
|
$
|
686,021
|
|
$
|
(10,663
|
)
|
(1.6
|
)%
|
|
Lilly Pulitzer
|
272,299
|
|
248,931
|
|
23,368
|
|
9.4
|
%
|
|||
|
Lanier Apparel
|
100,471
|
|
106,852
|
|
(6,381
|
)
|
(6.0
|
)%
|
|||
|
Southern Tide
|
45,248
|
|
40,940
|
|
4,308
|
|
10.5
|
%
|
|||
|
Corporate and Other
|
14,090
|
|
3,467
|
|
10,623
|
|
306.4
|
%
|
|||
|
Total net sales
|
$
|
1,107,466
|
|
$
|
1,086,211
|
|
$
|
21,255
|
|
2.0
|
%
|
Consolidated net sales increased
$21 million
, or
2%
, in the 52 week
Fiscal 2018
compared to the 53 week Fiscal 2017. The increase in consolidated net sales was primarily driven by (1) a $19 million, or 4%, calendar-adjusted comparable store sales increase from $481 million in the 52-week period ended February 3, 2018 to $500 million in
Fiscal 2018
, (2) an incremental net sales increase of $18 million associated with the operation of non-comp full-price retail stores, primarily in Lilly Pulitzer, (3) an incremental net sales increase of $11 million of e-commerce and wholesale sales for TBBC, which we acquired in the Fourth Quarter of Fiscal 2017, (4) a $6 million increase in net sales through our off-price direct to consumer channels reflecting an increase in Lilly Pulitzer e-commerce flash clearance sales partially offset by lower sales at Tommy Bahama outlets and (5) a $1 million increase in restaurant sales in Tommy Bahama. These increases in consolidated net sales were partially offset by (1) a $28 million net decrease in wholesale sales, consisting of decreases in Tommy Bahama, Lilly Pulitzer and Lanier Apparel partially offset by an increase in Southern Tide, and (2) a $5 million decrease in direct to consumer sales due to the impact on comparable store sales of one less week in Fiscal 2018 than Fiscal 2017. We estimate that the 53rd week in Fiscal 2017, with no corresponding week in Fiscal 2018, resulted in approximately $17 million of lower sales in Fiscal 2018 when considering the impact on direct to consumer comparable store sales noted above, as well as the impact on non comparable direct to consumer, restaurant, outlet and wholesale sales. By way of comparison, on a fiscal period basis, consolidated comparable store sales increased 3% in
Fiscal 2018
relative to
Fiscal 2017
. The changes in net sales by operating group are discussed below.
Tommy Bahama:
The Tommy Bahama net sales decrease of
$11 million
, or
2%
, in
Fiscal 2018
compared to
Fiscal 2017
was primarily due to (1) a $15 million decrease in wholesale sales, including lower full-price wholesale sales, as Tommy Bahama continues to manage its exposure to department stores by reducing department store door count, and lower off-price wholesale sales, as Tommy Bahama disposed of a more significant amount of aged inventory in
Fiscal 2017
, (2) a $4 million decrease in direct to consumer sales due to the impact on comparable store sales of one less week in Fiscal 2018 than Fiscal 2017 and (3) a $3 million decrease in outlet store sales, reflecting lower sales at existing outlets as well as the impact of outlet closures in Fiscal 2017 and Fiscal 2018. These decreases were partially offset by (1) an $11 million, or 3%, increase in calendar-adjusted comparable store sales from $361 million in the 52 week period ended February 3, 2018 to $372 million in
Fiscal 2018
, reflecting strong growth in e-commerce sales and slightly negative retail store comparable store sales, and (2) a $1 million increase in restaurant sales resulting from increased sales at existing restaurants partially offset by the net impact of new restaurants opened, closed or remodeled in Fiscal 2018 and Fiscal 2017. By way of comparison, on a fiscal period basis, Tommy Bahama comparable store sales increased 2% in
Fiscal 2018
relative to
Fiscal 2017
. The following table presents the proportion of net sales by distribution channel for Tommy Bahama for each period presented:
|
|
Fiscal 2018
|
Fiscal 2017
|
||
|
Full-price retail stores and outlets
|
48
|
%
|
49
|
%
|
|
E-commerce
|
18
|
%
|
16
|
%
|
|
Restaurant
|
13
|
%
|
12
|
%
|
|
Wholesale
|
21
|
%
|
23
|
%
|
|
Total
|
100
|
%
|
100
|
%
|
Lilly Pulitzer:
The Lilly Pulitzer net sales increase of
$23 million
, or
9%
, was primarily the result of (1) an incremental net sales increase of $18 million associated with the operation of non-comp full-price retail stores, including stores opened by Lilly Pulitzer, the 12 Signature Stores acquired in Fiscal 2017 and retail stores remodeled in Fiscal 2018 and Fiscal 2017, (2) an $8 million, or 7%, increase in calendar-adjusted comparable store sales from $113 million in the 52-week period ended February 3, 2018 to $121 million in
Fiscal 2018
, with strong increases in both e-commerce and retail store comparable store sales, and
44
(3) a $9 million increase in e-commerce flash clearance sales to $46 million in Fiscal 2018. These increases were partially offset by (1) a $10 million decrease in wholesale sales, due to a decrease in full-price wholesale sales reflecting Lilly Pulitzer's efforts to manage its exposure to department stores and Fiscal 2018 not including any wholesale sales to the Signature Stores acquired in Fiscal 2017 partially offset by increased off-price wholesale sales in Fiscal 2018, and (2) a $1 million decrease in direct to consumer sales due to the impact on comparable store sales of one less week in Fiscal 2018 than Fiscal 2017. By way of comparison, on a fiscal period basis, Lilly Pulitzer comparable store sales increased 6% in
Fiscal 2018
relative to
Fiscal 2017
. The following table presents the proportion of net sales by distribution channel for Lilly Pulitzer for each period presented:
|
|
Fiscal 2018
|
Fiscal 2017
|
||
|
Full-price retail stores
|
42
|
%
|
38
|
%
|
|
E-commerce
|
36
|
%
|
34
|
%
|
|
Wholesale
|
22
|
%
|
28
|
%
|
|
Total
|
100
|
%
|
100
|
%
|
Lanier Apparel:
The decrease in net sales for Lanier Apparel of
$6 million
, or
6%
, was primarily due to (1) the exit from certain programs or customers, including the impact of customers who filed for bankruptcy in Fiscal 2018, (2) lower volume in various programs, including the impact of softness in the replenishment reorders of certain programs and (3) the prior year including initial shipments in certain private label and branded programs. These decreases were partially offset by increased volume in other programs, including initial shipments of Cole Haan licensed tailored clothing in Fiscal 2018.
Southern Tide:
The increase in net sales for Southern Tide of
$4 million
, or
11%
, was primarily due to increased sales in the wholesale channel of distribution. The increased wholesale sales reflect increased sales to (1) Signature Stores, including those opened in Fiscal 2018 and Fiscal 2017, (2) department stores and (3) off-price retailers. The following table presents the proportion of net sales by distribution channel for Southern Tide for each period presented:
|
|
Fiscal 2018
|
Fiscal 2017
|
||
|
E-commerce
|
18
|
%
|
19
|
%
|
|
Wholesale
|
82
|
%
|
81
|
%
|
|
Total
|
100
|
%
|
100
|
%
|
Corporate and Other:
Corporate and Other net sales primarily consist of the net sales of TBBC, which include e-commerce and wholesale operations, and our Lyons, Georgia distribution center operations. The increase in net sales of
$11 million
was primarily due to Fiscal 2018 including a full year of TBBC sales after the acquisition of TBBC in December 2017.
Gross Profit
The table below presents gross profit by operating group and in total for
Fiscal 2018
and
Fiscal 2017
, as well as the change between those two periods. Our gross profit and gross margin, which is calculated as gross profit divided by net sales, may not be directly comparable to those of our competitors, as the statement of operations classification of certain expenses may vary by company.
45
|
|
Fiscal 2018
|
Fiscal 2017
|
$ Change
|
% Change
|
|||||||
|
Tommy Bahama
|
$
|
413,455
|
|
$
|
410,018
|
|
$
|
3,437
|
|
0.8
|
%
|
|
Lilly Pulitzer
|
165,486
|
|
155,373
|
|
10,113
|
|
6.5
|
%
|
|||
|
Lanier Apparel
|
28,844
|
|
32,500
|
|
(3,656
|
)
|
(11.2
|
)%
|
|||
|
Southern Tide
|
22,572
|
|
20,217
|
|
2,355
|
|
11.6
|
%
|
|||
|
Corporate and Other
|
6,767
|
|
(5,476
|
)
|
12,243
|
|
NM
|
|
|||
|
Total gross profit
|
$
|
637,124
|
|
$
|
612,632
|
|
$
|
24,492
|
|
4.0
|
%
|
|
LIFO charge included in Corporate and Other
|
$
|
773
|
|
$
|
7,821
|
|
|
|
|
|
|
|
Tommy Bahama Japan inventory markdown charges
|
$
|
461
|
|
$
|
—
|
|
|||||
|
Lilly Pulitzer inventory step-up charges
|
$
|
—
|
|
$
|
1,047
|
|
|||||
|
Corporate and Other inventory step-up charges
|
$
|
157
|
|
$
|
111
|
|
|||||
The table below presents gross margin by operating group an in total for
Fiscal 2018
and
Fiscal 2017
.
|
|
Fiscal 2018
|
Fiscal 2017
|
||
|
Tommy Bahama
|
61.2
|
%
|
59.8
|
%
|
|
Lilly Pulitzer
|
60.8
|
%
|
62.4
|
%
|
|
Lanier Apparel
|
28.7
|
%
|
30.4
|
%
|
|
Southern Tide
|
49.9
|
%
|
49.4
|
%
|
|
Corporate and Other
|
NM
|
|
NM
|
|
|
Consolidated gross margin
|
57.5
|
%
|
56.4
|
%
|
The increase in consolidated gross profit in
Fiscal 2018
was due to both increased net sales, as discussed above, and increased gross margin. The improved consolidated gross margin was primarily due to (1)
Fiscal 2018
including a
$1 million
LIFO accounting charge compared to
Fiscal 2017
including an
$8 million
LIFO accounting charge and (2)
Fiscal 2017
including inventory step-up charges of $1 million related to acquisitions, with only a small charge in
Fiscal 2018
. Additionally, gross margin was favorably impacted by a change in sales mix resulting from a higher proportion of direct to consumer sales and a lower proportion of wholesale sales. We estimate that the 53rd week in Fiscal 2017, with no corresponding week in Fiscal 2018, resulted in approximately $9 million of lower gross profit in Fiscal 2018. Changes in gross margin by operating group is discussed below.
Tommy Bahama:
The increase in gross margin for Tommy Bahama was primarily driven by (1) a change in sales mix as full-price and off-price wholesale sales and outlet store sales were a lower proportion of net sales for Tommy Bahama in
Fiscal 2018
, (2) improved gross margins on off-price wholesale and outlet store sales, (3) the favorable outcome of a duty assessment assertion and (4) improved initial margins reflecting progress in our initiatives to selectively increase prices and reduce product costs. These favorable changes were partially offset by (1) the gross margin impact of an increasing proportion of direct to consumer sales occurring during our periodic loyalty award card, Flip Side and Friends and Family marketing events, which typically have lower gross margins than sales during other periods and (2) the impact of the inventory markdown charges related to the restructure and downsizing of the Tommy Bahama Japan operations.
Lilly Pulitzer:
The decrease in gross margin for Lilly Pulitzer reflects (1) a greater proportion of e-commerce flash clearance sales and off-price wholesale sales, as well as lower gross margins on these off-price sales and (2) lower gross margins in full price direct to consumer operations reflecting more gift with purchase and other consumer allowance amounts. These decreases were partially offset by the impact of
Fiscal 2017
including inventory step-up charges related to Signature Store acquisitions of $1 million, with no such charges in
Fiscal 2018
.
Lanier Apparel:
The decrease in gross margin for Lanier Apparel was primarily due to (1)
Fiscal 2018
including more significant charges for certain customer allowance, cooperative advertising and other amounts related to certain programs, with
Fiscal
46
2017
including certain favorable customer allowance items due, in part, to the exit from certain programs resulting in the reversal of previously recognized amounts and (2)
Fiscal 2018
continued to face gross margin pressures.
Southern Tide:
The increase in gross margin for Southern Tide was primarily due to (1) improved gross margins on off-price sales and (2) an insurance recovery on certain inventory in
Fiscal 2018
. These favorable changes were partially offset by a change in sales mix with Signature Store and department store sales, which often require increased customer discounts and allowances, including cooperative advertising and fixtures, and off-price sales representing a greater proportion of net sales.
Corporate and Other:
The gross profit in Corporate and Other primarily reflects (1) the gross profit of TBBC, (2) the gross profit of our Lyons, Georgia distribution center and (3) the impact of LIFO accounting adjustments. The primary driver for the improved gross profit was (1) the net favorable impact of LIFO accounting in
Fiscal 2018
compared to
Fiscal 2017
and (2)
Fiscal 2018
including a full year of the gross profit of TBBC, which was acquired in December 2017. The LIFO accounting impact in Corporate and Other in each period primarily reflects the sale of inventory that had been marked down to the estimated net realizable value in prior periods in an operating group but generally reversed in Corporate and Other as part of LIFO accounting.
SG&A
|
|
Fiscal 2018
|
Fiscal 2017
|
$ Change
|
% Change
|
|||||||
|
SG&A
|
$
|
560,508
|
|
$
|
540,517
|
|
$
|
19,991
|
|
3.7
|
%
|
|
SG&A (as a % of net sales)
|
50.6
|
%
|
49.8
|
%
|
|
|
|
|
|||
|
Tommy Bahama Canada intangible asset amortization
|
$
|
1,387
|
|
$
|
1,523
|
|
|||||
|
Lilly Pulitzer Signature Store intangible asset amortization
|
$
|
378
|
|
$
|
180
|
|
|||||
|
Southern Tide intangible asset amortization
|
$
|
288
|
|
$
|
288
|
|
|||||
|
Tommy Bahama Japan restructuring SG&A charges
|
$
|
3,206
|
|
$
|
—
|
|
|||||
|
Lilly Pulitzer Signature Store acquisitions transaction/integration costs
|
$
|
—
|
|
$
|
870
|
|
|||||
|
TBBC change in fair value of contingent consideration
|
$
|
970
|
|
$
|
—
|
|
|||||
The increase in SG&A in
Fiscal 2018
was primarily due to (1) increased advertising expense of $9 million, with much of the increased spending focused on consumer acquisition initiatives in the First Half of Fiscal 2018, (2) $5 million of incremental costs in
Fiscal 2018
associated with additional retail stores and restaurants, (3) $4 million of incremental SG&A associated with TBBC, (4) $3 million of Tommy Bahama Japan restructuring charges, including lease termination fees, premises reinstatement costs, non-cash impairment charges and severance amounts, (5) a
$1 million
charge for the change in the fair value of the TBBC contingent consideration and (6) other increases in SG&A to support the businesses including increased salaries and wages, occupancy and other operating expenses in our ongoing direct to consumer and wholesale operations. These increases in SG&A were partially offset by (1) an approximate $7 million impact from one less week in Fiscal 2018 and (2) $5 million of lower incentive compensation amounts.
Royalties and other operating income
|
|
Fiscal 2018
|
Fiscal 2017
|
$ Change
|
% Change
|
|||||||
|
Royalties and other operating income
|
$
|
13,976
|
|
$
|
13,885
|
|
$
|
91
|
|
0.7
|
%
|
Royalties and other operating income primarily reflects income received from third parties from the licensing of our Tommy Bahama, Lilly Pulitzer and Southern Tide brands. The comparable royalties and other income in
Fiscal 2018
primarily reflects increased royalty income in Lilly Pulitzer partially offset by decreased royalty income in Tommy Bahama.
Operating income (loss)
47
|
|
Fiscal 2018
|
Fiscal 2017
|
$ Change
|
% Change
|
|||||||
|
Tommy Bahama
|
$
|
53,139
|
|
$
|
55,002
|
|
$
|
(1,863
|
)
|
(3.4
|
)%
|
|
Lilly Pulitzer
|
47,239
|
|
46,608
|
|
631
|
|
1.4
|
%
|
|||
|
Lanier Apparel
|
5,057
|
|
6,546
|
|
(1,489
|
)
|
(22.7
|
)%
|
|||
|
Southern Tide
|
5,663
|
|
4,504
|
|
1,159
|
|
25.7
|
%
|
|||
|
Corporate and Other
|
(20,506
|
)
|
(26,660
|
)
|
6,154
|
|
23.1
|
%
|
|||
|
Total Operating Income
|
$
|
90,592
|
|
$
|
86,000
|
|
$
|
4,592
|
|
5.3
|
%
|
|
LIFO charge included in Corporate and Other
|
$
|
773
|
|
$
|
7,821
|
|
|
|
|
|
|
|
Tommy Bahama Japan inventory markdown charges
|
$
|
461
|
|
$
|
—
|
|
|||||
|
Lilly Pulitzer inventory step-up charges
|
$
|
—
|
|
$
|
1,047
|
|
|||||
|
Corporate and Other inventory step-up charges
|
$
|
157
|
|
$
|
111
|
|
|||||
|
Tommy Bahama Canada intangible asset amortization
|
$
|
1,387
|
|
$
|
1,523
|
|
|||||
|
Lilly Pulitzer Signature Store intangible asset amortization
|
$
|
378
|
|
$
|
180
|
|
|||||
|
Southern Tide intangible asset amortization
|
$
|
288
|
|
$
|
288
|
|
|||||
|
Tommy Bahama Japan restructuring SG&A charges
|
$
|
3,206
|
|
$
|
—
|
|
|||||
|
Lilly Pulitzer Signature Store acquisitions transaction/integration costs
|
$
|
—
|
|
$
|
870
|
|
|
|
|
|
|
|
TBBC change in fair value of contingent consideration
|
$
|
970
|
|
$
|
—
|
|
|||||
The increase in operating income in
Fiscal 2018
was primarily due to higher sales and gross margins partially offset by higher SG&A, as discussed above. On an operating group basis, the increase in operating income was primarily due to improved operating results in Corporate and Other, Southern Tide and Lilly Pulitzer, partially offset by lower operating income in Tommy Bahama and Lanier Apparel. Changes in operating income (loss) by operating group are discussed below.
Tommy Bahama:
|
|
Fiscal 2018
|
Fiscal 2017
|
$ Change
|
% Change
|
|||||||
|
Net Sales
|
$
|
675,358
|
|
$
|
686,021
|
|
$
|
(10,663
|
)
|
(1.6
|
)%
|
|
Gross margin
|
61.2
|
%
|
59.8
|
%
|
|
|
|
|
|||
|
Operating income
|
$
|
53,139
|
|
$
|
55,002
|
|
$
|
(1,863
|
)
|
(3.4
|
)%
|
|
Operating income as % of net sales
|
7.9
|
%
|
8.0
|
%
|
|
|
|
|
|||
|
Tommy Bahama Japan inventory markdown charges
|
$
|
461
|
|
$
|
—
|
|
|||||
|
Tommy Bahama Canada intangible asset amortization
|
$
|
1,387
|
|
$
|
1,523
|
|
|||||
|
Tommy Bahama Japan restructuring SG&A charges
|
$
|
3,206
|
|
$
|
—
|
|
|||||
The lower operating income for Tommy Bahama was primarily due to lower sales and higher SG&A which offset the favorable impact of higher gross margin. The increased SG&A included (1) $6 million of increased advertising expense, with much of the increased advertising spend focused on consumer acquisition initiatives, (2) $3 million of Tommy Bahama Japan restructuring charges, as discussed in Note 12, and (3) increased salaries and wages, occupancy and other operating expenses in our ongoing direct to consumer and wholesale operations. These increases in SG&A were partially offset by (1) the impact of one less week in Fiscal 2018 resulting in an estimated SG&A decrease of $5 million and (2) $5 million of lower incentive compensation amounts in
Fiscal 2018
.
Lilly Pulitzer:
48
|
|
Fiscal 2018
|
Fiscal 2017
|
$ Change
|
% Change
|
|||||||
|
Net Sales
|
$
|
272,299
|
|
$
|
248,931
|
|
$
|
23,368
|
|
9.4
|
%
|
|
Gross margin
|
60.8
|
%
|
62.4
|
%
|
|
|
|
|
|||
|
Operating income
|
$
|
47,239
|
|
$
|
46,608
|
|
$
|
631
|
|
1.4
|
%
|
|
Operating income as % of net sales
|
17.3
|
%
|
18.7
|
%
|
|
|
|
|
|||
|
Lilly Pulitzer inventory step-up charges
|
$
|
—
|
|
$
|
1,047
|
|
|||||
|
Lilly Pulitzer Signature Store intangible asset amortization
|
$
|
378
|
|
$
|
180
|
|
|||||
|
Lilly Pulitzer Signature Store acquisitions transaction/integration costs
|
$
|
—
|
|
$
|
870
|
|
|||||
The higher operating income in Lilly Pulitzer reflects higher sales, partially offset by higher SG&A and lower gross margin. The higher SG&A for
Fiscal 2018
includes (1) $6 million of incremental SG&A associated with the cost of operating additional retail stores, including the 12 Signature Stores acquired in Fiscal 2017, (2) $2 million of increased advertising expense and (3) SG&A increases to support the planned growth of the business, including additional employment cost. These SG&A increases were partially offset by (1)
Fiscal 2017
including certain transaction and integration costs with no such charges in
Fiscal 2018
and (2) the impact of one less week in Fiscal 2018 resulting in an estimated SG&A decrease of $1 million.
Lanier Apparel:
|
|
Fiscal 2018
|
Fiscal 2017
|
$ Change
|
% Change
|
|||||||
|
Net Sales
|
$
|
100,471
|
|
$
|
106,852
|
|
$
|
(6,381
|
)
|
(6.0
|
)%
|
|
Gross margin
|
28.7
|
%
|
30.4
|
%
|
|
|
|
|
|||
|
Operating income
|
$
|
5,057
|
|
$
|
6,546
|
|
$
|
(1,489
|
)
|
(22.7
|
)%
|
|
Operating income as % of net sales
|
5.0
|
%
|
6.1
|
%
|
|
|
|
|
|||
The lower operating income for Lanier Apparel was primarily due to the lower sales and lower gross margin, partially offset by reduced SG&A. The reduced SG&A was primarily due to lower (1) incentive compensation amounts, (2) bad debt expense, (3) sales-related variable expenses, including royalties, shipping and advertising, reflecting the lower sales and (4) SG&A reflecting the impact of one less week in Fiscal 2018.
Southern Tide:
|
|
Fiscal 2018
|
Fiscal 2017
|
$ Change
|
% Change
|
|||||||
|
Net Sales
|
$
|
45,248
|
|
$
|
40,940
|
|
$
|
4,308
|
|
10.5
|
%
|
|
Gross margin
|
49.9
|
%
|
49.4
|
%
|
|
|
|
|
|||
|
Operating income
|
$
|
5,663
|
|
$
|
4,504
|
|
$
|
1,159
|
|
25.7
|
%
|
|
Operating income as % of net sales
|
12.5
|
%
|
11.0
|
%
|
|||||||
|
Southern Tide intangible asset amortization
|
$
|
288
|
|
$
|
288
|
|
|||||
The higher operating income for Southern Tide was primarily due to the higher sales, partially offset by higher SG&A. The higher SG&A included increased incentive compensation and variable expenses associated with the higher sales partially offset by the impact of one less week in Fiscal 2018.
Corporate and Other:
|
|
Fiscal 2018
|
Fiscal 2017
|
$ Change
|
% Change
|
|||||||
|
Net Sales
|
$
|
14,090
|
|
$
|
3,467
|
|
$
|
10,623
|
|
306.4
|
%
|
|
Operating loss
|
$
|
(20,506
|
)
|
$
|
(26,660
|
)
|
$
|
6,154
|
|
23.1
|
%
|
|
LIFO charge included in Corporate and Other
|
$
|
773
|
|
$
|
7,821
|
|
|
|
|
|
|
|
Corporate and Other inventory step-up charges
|
$
|
157
|
|
$
|
111
|
|
|||||
|
TBBC change in fair value of contingent consideration
|
$
|
970
|
|
$
|
—
|
|
|||||
49
The improved operating results in Corporate and Other were primarily due to (1) the $7 million net favorable impact of LIFO accounting, (2) the operating income of TBBC, (3) a lower operating loss in our corporate operations, due in part to lower incentive compensation expense and certain life insurance proceeds in
Fiscal 2018
and the impact of one less week in Fiscal 2018, and (4) improved operating results in our Lyons, Georgia distribution center operations. These favorable items were partially offset by the $1 million charge for the change in the fair value of the TBBC contingent consideration.
Interest expense, net
|
|
Fiscal 2018
|
Fiscal 2017
|
$ Change
|
% Change
|
|||||||
|
Interest expense, net
|
$
|
2,283
|
|
$
|
3,109
|
|
$
|
(826
|
)
|
(26.6
|
)%
|
Interest expense decreased in
Fiscal 2018
primarily due to lower average debt outstanding during
Fiscal 2018
partially offset by higher interest rates and higher unused line fees in
Fiscal 2018
.
Income taxes
|
|
Fiscal 2018
|
Fiscal 2017
|
$ Change
|
% Change
|
|||||||
|
Income taxes
|
$
|
22,018
|
|
$
|
18,190
|
|
$
|
3,828
|
|
21.0
|
%
|
|
Effective tax rate
|
24.9
|
%
|
21.9
|
%
|
|||||||
Income taxes and the effective tax rate in
Fiscal 2018
and
Fiscal 2017
were both impacted by U.S. Tax Reform, which reduced corporate income tax rates from 35% to 21%. As a result, the income tax amounts and effective tax rates for Fiscal 2018 and Fiscal 2017 are not comparable.
While the statutory United States federal income tax rate for
Fiscal 2017
was 35% for the majority of the year, Fiscal 2017 included a $12 million favorable impact from the revaluation of deferred tax amounts resulting from U.S. Tax Reform. Additionally, income tax expense for
Fiscal 2018
reflects a United States federal corporate income tax rate of 21% due to U.S. Tax Reform as well as the favorable impact of certain stock awards that vested during the year and other discrete items. Refer to Note 8 for additional information about income taxes and U.S. Tax Reform. Our effective tax rate for Fiscal 2019 is expected to be approximately 26%.
Net earnings
|
|
Fiscal 2018
|
Fiscal 2017
|
||||
|
Net sales
|
$
|
1,107,466
|
|
$
|
1,086,211
|
|
|
Operating income
|
$
|
90,592
|
|
$
|
86,000
|
|
|
Net earnings from continuing operations
|
$
|
66,291
|
|
$
|
64,701
|
|
|
Net earnings from continuing operations per diluted share
|
$
|
3.94
|
|
$
|
3.87
|
|
|
Weighted average shares outstanding - diluted
|
16,842
|
|
16,734
|
|
||
The higher net earnings per diluted share in
Fiscal 2018
was due to (1) the improved operating results in Corporate and Other, primarily due to the favorable impact of LIFO accounting and the operations of TBBC, (2) increased operating income in Southern Tide primarily due to higher net sales, (3) lower interest expense, and (4) improved operating income in Lilly Pulitzer primarily reflecting higher sales. These items were partially offset by (1) the higher effective tax rate, reflecting the net impact of a lower corporate income tax rate in Fiscal 2018 offset by the revaluation of deferred tax amounts in Fiscal 2017, (2) lower operating income in Lanier Apparel, primarily due to lower sales, and (3) lower operating income in Tommy Bahama, primarily due to charges related to the restructure and downsizing of our Tommy Bahama Japan operations and lower wholesale sales.
FISCAL 2017 COMPARED TO FISCAL 2016
The discussion and tables below compare certain line items included in our statements of operations for Fiscal 2017, which included 53 weeks, to Fiscal 2016, which included 52 weeks. Each dollar and percentage change provided reflects the change between these periods unless indicated otherwise. Each dollar and share amount included in the tables is in thousands except for per share amounts.
50
Net Sales
|
Fiscal 2017
|
Fiscal 2016
|
$ Change
|
% Change
|
||||||||
|
Tommy Bahama
|
$
|
686,021
|
|
$
|
658,911
|
|
$
|
27,110
|
|
4.1
|
%
|
|
Lilly Pulitzer
|
248,931
|
|
233,294
|
|
15,637
|
|
6.7
|
%
|
|||
|
Lanier Apparel
|
106,852
|
|
100,753
|
|
6,099
|
|
6.1
|
%
|
|||
|
Southern Tide
|
40,940
|
|
27,432
|
|
13,508
|
|
49.2
|
%
|
|||
|
Corporate and Other
|
3,467
|
|
2,198
|
|
1,269
|
|
57.7
|
%
|
|||
|
Total net sales
|
$
|
1,086,211
|
|
$
|
1,022,588
|
|
$
|
63,623
|
|
6.2
|
%
|
Consolidated net sales increased $64 million, or 6%, in the 53 week Fiscal 2017 compared to the 52 week Fiscal 2016. The increase in consolidated net sales was driven by (1) an incremental net sales increase of $21 million associated with the operation of non-comp full-price retail stores and the Southern Tide e-commerce operations, which we acquired in April 2016, (2) a $19 million, or 4% increase in comparable store sales to $445 million in Fiscal 2017 from $426 million in Fiscal 2016, (3) an $18 million aggregate increase in wholesale sales, primarily consisting of higher sales in Southern Tide, which we acquired in April 2016, Lanier Apparel, Tommy Bahama and Corporate and Other partially offset by a decrease in Lilly Pulitzer and (4) a $10 million increase in restaurant sales in Tommy Bahama. These increases were partially offset by a $3 million decrease in net sales through our off-price direct to consumer clearance channels consisting of lower sales in Tommy Bahama and higher sales in Lilly Pulitzer. We estimate that the 53rd week in Fiscal 2017 provided an approximate $17 million benefit to our consolidated net sales. On a 53 week to 53 week basis, comparable store sales increased 3% in Fiscal 2017.
We believe that certain macroeconomic factors, including lower retail store traffic and the evolving impact of digital technology on consumer shopping habits, continued to impact the sales in each of our direct to consumer and wholesale businesses. The changes in net sales by operating group are discussed below.
Tommy Bahama:
The Tommy Bahama net sales increase of $27 million, or 4%, in the 53 week Fiscal 2017 compared to the 52 week Fiscal 2016 was primarily a result of (1) a $21 million, or 6%, increase in comparable store sales to $340 million in Fiscal 2017 from $320 million in Fiscal 2016, (2) a $10 million increase in restaurant sales reflecting sales from a restaurant that opened in Fiscal 2017, a Marlin Bar that opened in late Fiscal 2016 and increased sales at existing restaurants, (3) an incremental net sales increase of $5 million associated with the operation of non-comp full-price retail stores and (4) a $3 million increase in wholesale sales reflecting higher off-price sales, as Tommy Bahama sold excess prior season inventory, partially offset by lower full-price wholesale sales, as Tommy Bahama continued to manage its exposure to department stores. These increases were partially offset by $11 million of lower sales in our off-price direct to consumer clearance channels, primarily resulting from the absence of any e-commerce flash clearance sales in Fiscal 2017, compared to $9 million of e-commerce flash clearance sales in Fiscal 2016, as well as lower sales in existing outlet stores. Tommy Bahama's direct to consumer sales benefited from (1) increased marketing and advertising including substantial Spring 2017 and Holiday 2017 catalogs, which both presented the wide breadth of Tommy Bahama products in one place, (2) increased sales from its semiannual Friends & Family events held each year, (3) increased sales from Tommy Bahama's loyalty award card and Flip Side events held in the second quarter and fourth quarter of each year and (4) Tommy Bahama taking initial markdowns on select items at the end of the selling season in our retail stores and on our e-commerce website in Fiscal 2017 after initiating that approach in January 2017. On a 53 week to 53 week basis, Tommy Bahama comparable store sales increased 5% in Fiscal 2017.
The following table presents the proportion of net sales by distribution channel for Tommy Bahama for each period presented:
|
|
Fiscal 2017
|
Fiscal 2016
|
||
|
Full-price retail stores and outlets
|
49
|
%
|
50
|
%
|
|
E-commerce
|
16
|
%
|
16
|
%
|
|
Restaurant
|
12
|
%
|
11
|
%
|
|
Wholesale
|
23
|
%
|
23
|
%
|
|
Total
|
100
|
%
|
100
|
%
|
Lilly Pulitzer:
51
The Lilly Pulitzer net sales increase of $16 million, or 7%, in the 53 week Fiscal 2017 compared to the 52 week Fiscal 2016, was primarily a result of (1) an incremental net sales increase of $14 million associated with the operation of additional full-price retail stores and (2) an $8 million increase in e-commerce flash clearance sales. These sales increases were partially offset by (1) a $4 million decrease in wholesale sales and (2) a $2 million, or 2%, decrease in comparable store sales to $105 million in Fiscal 2017 compared to $107 million in Fiscal 2016, with negative retail comparable store sales offsetting positive e-commerce comparable store sales. The decrease in comparable store sales primarily reflects reduced retail store traffic while the lower wholesale sales were a result of lower sales to department stores, as Lilly Pulitzer continues to manage its exposure to department stores, and the result of the acquisition of 12 Signature Stores in Fiscal 2017. On a 53 week to 53 week basis, Lilly Pulitzer comparable store sales decreased 3% in Fiscal 2017.
The following table presents the proportion of net sales by distribution channel for Lilly Pulitzer for each period presented:
|
|
Fiscal 2017
|
Fiscal 2016
|
||
|
Full-price retail stores and warehouse sales
|
38
|
%
|
36
|
%
|
|
E-commerce
|
34
|
%
|
32
|
%
|
|
Wholesale
|
28
|
%
|
32
|
%
|
|
Total
|
100
|
%
|
100
|
%
|
Lanier Apparel:
The increase in net sales for Lanier Apparel of $6 million, or 6%, was primarily due to increased sales in various programs, including initial shipments in some programs, as well as sales associated with the Strong Suit and Duck Head businesses, which were acquired in Fiscal 2016. These sales increases were partially offset by lower sales in other programs resulting from reductions in volume and the exit from various programs.
Southern Tide:
The increase in net sales of $14 million for Southern Tide in Fiscal 2017 was primarily due to Fiscal 2017 including a full year of operations, while Fiscal 2016 only included the operations from the date of our acquisition on April 19, 2016 through January 28, 2017. Therefore, net sales for Fiscal 2016 excluded much of the Spring 2016 wholesale shipments. The following table presents the proportion of net sales by distribution channel for Southern Tide for each period presented:
|
|
Fiscal 2017
|
Fiscal 2016
|
||
|
E-commerce
|
19
|
%
|
23
|
%
|
|
Wholesale
|
81
|
%
|
77
|
%
|
|
Total
|
100
|
%
|
100
|
%
|
Corporate and Other:
Corporate and Other net sales primarily consist of the net sales of our Lyons, Georgia distribution center to third party warehouse customers and TBBC, which was acquired in December 2017, as well as the impact of the elimination of any intercompany sales between our operating groups.
Gross Profit
The table below presents gross profit by operating group and in total for Fiscal 2017 and Fiscal 2016, as well as the change between those two periods. Our gross profit and gross margin, which is calculated as gross profit divided by net sales, may not be directly comparable to those of our competitors as the statement of operations classification of certain expenses may vary by company.
52
|
|
Fiscal 2017
|
Fiscal 2016
|
$ Change
|
% Change
|
|||||||
|
Tommy Bahama
|
$
|
410,018
|
|
$
|
386,650
|
|
$
|
23,368
|
|
6.0
|
%
|
|
Lilly Pulitzer
|
155,373
|
|
145,875
|
|
9,498
|
|
6.5
|
%
|
|||
|
Lanier Apparel
|
32,500
|
|
29,490
|
|
3,010
|
|
10.2
|
%
|
|||
|
Southern Tide
|
20,217
|
|
10,912
|
|
9,305
|
|
85.3
|
%
|
|||
|
Corporate and Other
|
(5,476
|
)
|
7,377
|
|
(12,853
|
)
|
NM
|
|
|||
|
Total gross profit
|
$
|
612,632
|
|
$
|
580,304
|
|
$
|
32,328
|
|
5.6
|
%
|
|
LIFO charge (credit) included in Corporate and Other
|
$
|
7,821
|
|
$
|
(5,884
|
)
|
|||||
|
Lilly Pulitzer inventory step-up charges
|
$
|
1,047
|
|
$
|
—
|
|
|||||
|
Southern Tide inventory step-up charges
|
$
|
—
|
|
$
|
2,667
|
|
|||||
|
Corporate and Other inventory step-up charges
|
$
|
111
|
|
$
|
—
|
|
|||||
The increase in consolidated gross profit was primarily due to (1) higher net sales, (2) improved gross margin in Tommy Bahama and (3) Southern Tide including an inventory step-up charge of $3 million in Fiscal 2016. These items were partially offset by (1) the $14 million net unfavorable impact of LIFO accounting and (2) Lilly Pulitzer including an inventory step-up charge of $1 million in Fiscal 2017. We estimate that the 53rd week in Fiscal 2017 resulted in approximately $9 million of additional gross profit. Changes in gross margin by operating group are discussed below. The table below presents gross margin by operating group and in total for Fiscal 2017 and Fiscal 2016.
|
|
Fiscal 2017
|
Fiscal 2016
|
||
|
Tommy Bahama
|
59.8
|
%
|
58.7
|
%
|
|
Lilly Pulitzer
|
62.4
|
%
|
62.5
|
%
|
|
Lanier Apparel
|
30.4
|
%
|
29.3
|
%
|
|
Southern Tide
|
49.4
|
%
|
39.8
|
%
|
|
Corporate and Other
|
NM
|
|
NM
|
|
|
Consolidated gross margin
|
56.4
|
%
|
56.7
|
%
|
On a consolidated basis, gross margin decreased in Fiscal 2017, primarily as a result of (1) the net unfavorable impact of LIFO accounting of $14 million between Fiscal 2017 and Fiscal 2016 and (2) Lilly Pulitzer including an inventory step-up charge in Fiscal 2017 which was partially offset by (1) improved gross margins in Tommy Bahama and Lanier Apparel and (2) Southern Tide including an inventory step-up charge in Fiscal 2016.
Tommy Bahama:
The increase in gross margin for Tommy Bahama in Fiscal 2017 primarily resulted from (1) the Fourth Quarter of Fiscal 2016 including $5 million of inventory markdowns to estimated realizable value for certain aged women's, home and other products, (2) Fiscal 2017 including a greater proportion of full-price sales in the direct to consumer channels of distribution and (3) the impact of select retail price increases and product cost reductions commencing late in Fiscal 2017. These items were partially offset by (1) Fiscal 2017 including increased off-price wholesale sales, including the sale of the aged inventory which was marked down in the Fourth Quarter of Fiscal 2016 at a nominal gross profit, and (2) the gross margin impact of an increasing proportion of sales in our direct to consumer business occurring during our periodic loyalty award card, Flip Side and Friends and Family marketing events, which typically have lower gross margins than sales during other periods.
Lilly Pulitzer:
The decrease in gross margin for Lilly Pulitzer was due to Fiscal 2017 including $1 million of incremental cost of goods sold related to the step-up of inventory associated with the acquisition of certain Lilly Pulitzer Signature Stores. The impact of the step-up of inventory was partially offset by the impact of a change in sales mix towards direct to consumer sales and improved gross margins for off-price e-commerce flash clearance and wholesale sales in Fiscal 2017.
Lanier Apparel:
53
The increase in gross margin for Lanier Apparel for Fiscal 2017 was primarily due to lower customer allowance and inventory markdown amounts due, in part, to the exit from certain programs resulting in the reversal of previously recognized amounts and a change in sales mix as branded sales represented a greater proportion of Lanier Apparel sales in Fiscal 2017.
Southern Tide:
The increase in gross margin for Southern Tide in Fiscal 2017 was primarily due to the gross profit of Southern Tide for Fiscal 2016 including $3 million of incremental cost of goods sold associated with the step-up of inventory recognized at acquisition. All amounts related to the step-up of inventory were recognized during Fiscal 2016. Additionally, Southern Tide's gross margin during Fiscal 2017 reflects a change in sales mix with a greater proportion of wholesale sales and off-price sales partially offset by reductions in product costs. Wholesale sales, which typically have a lower gross margin than e-commerce sales, represented a greater proportion of Southern Tide in Fiscal 2017, primarily due to seasonality as Fiscal 2016 did not include a full year of operations, while off-price sales increased in Fiscal 2017 as Southern Tide focused on moving excess and prior season inventory.
Corporate and Other:
The gross profit in Corporate and Other in each period primarily reflects (1) the gross profit of our Lyons, Georgia distribution center and, in Fiscal 2017, the TBBC operations, (2) the impact of LIFO accounting adjustments and (3) the impact of certain consolidating adjustments, including the elimination of any intercompany sales between our operating groups. The primary driver for the lower gross profit was the unfavorable impact of an $8 million LIFO accounting charge in Fiscal 2017 compared to a $6 million LIFO accounting credit in Fiscal 2016. The LIFO accounting charge in Corporate and Other in Fiscal 2017 primarily results from the sale of inventory that had been marked down to net realizable value in prior periods in the operating groups, but generally reversed in Corporate and Other as part of LIFO accounting as well as a change in the LIFO reserve resulting from increases in the PPI as published by the United States Department of Labor. The LIFO accounting credit in Corporate and Other in Fiscal 2016 primarily resulted from the reversal of inventory markdowns to estimated net realizable value recognized in the operating groups during Fiscal 2016.
SG&A
|
|
Fiscal 2017
|
Fiscal 2016
|
$ Change
|
% Change
|
|||||||
|
SG&A
|
$
|
540,517
|
|
$
|
504,600
|
|
$
|
35,917
|
|
7.1
|
%
|
|
SG&A (as a % of net sales)
|
49.8
|
%
|
49.3
|
%
|
|
|
|
|
|||
|
Tommy Bahama Canada intangible asset amortization
|
$
|
1,523
|
|
$
|
1,491
|
|
|||||
|
Lilly Pulitzer Signature Store intangible asset amortization
|
$
|
180
|
|
$
|
—
|
|
|||||
|
Southern Tide intangible asset amortization
|
$
|
288
|
|
$
|
263
|
|
|||||
|
Lilly Pulitzer Signature Store acquisitions transaction/integration costs
|
$
|
870
|
|
$
|
—
|
|
|||||
|
Southern Tide distribution center integration charges
|
$
|
—
|
|
$
|
454
|
|
|||||
|
Southern Tide transaction costs included in Corporate and Other
|
$
|
—
|
|
$
|
762
|
|
|||||
The increase in SG&A was primarily due to (1) a $13 million increase in incentive compensation, reflecting higher incentive compensation amounts in Tommy Bahama, Corporate and Other and Lanier Apparel, partially offset by lower incentive compensation amounts in Lilly Pulitzer, (2) $12 million of incremental costs in Fiscal 2017 associated with additional retail stores and restaurants, (3) increased advertising expense for our brands, (4) other infrastructure and employment cost increases related to expanding certain of our business operations and (5) $4 million of incremental SG&A in the First Quarter of Fiscal 2017 associated with the Southern Tide business, which was acquired in April 2016. We estimate that the 53rd week in Fiscal 2017 resulted in approximately $7 million of incremental SG&A.
Royalties and other operating income
|
|
Fiscal 2017
|
Fiscal 2016
|
$ Change
|
% Change
|
|||||||
|
Royalties and other operating income
|
$
|
13,885
|
|
$
|
14,180
|
|
$
|
(295
|
)
|
(2.1
|
)%
|
54
Royalties and other operating income primarily reflects income received from third parties from the licensing of our Tommy Bahama, Lilly Pulitzer and Southern Tide brands. The decrease in royalties and other operating income resulted from decreased royalty income for Lilly Pulitzer.
Operating income (loss)
|
|
Fiscal 2017
|
Fiscal 2016
|
$ Change
|
% Change
|
|||||||
|
Tommy Bahama
|
$
|
55,002
|
|
$
|
44,101
|
|
$
|
10,901
|
|
24.7
|
%
|
|
Lilly Pulitzer
|
46,608
|
|
51,995
|
|
$
|
(5,387
|
)
|
(10.4
|
)%
|
||
|
Lanier Apparel
|
6,546
|
|
6,955
|
|
$
|
(409
|
)
|
(5.9
|
)%
|
||
|
Southern Tide
|
4,504
|
|
(282
|
)
|
$
|
4,786
|
|
NM
|
|
||
|
Corporate and Other
|
(26,660
|
)
|
(12,885
|
)
|
$
|
(13,775
|
)
|
(106.9
|
)%
|
||
|
Total operating income
|
$
|
86,000
|
|
$
|
89,884
|
|
$
|
(3,884
|
)
|
(4.3
|
)%
|
|
LIFO charge (credit) included in Corporate and Other
|
$
|
7,821
|
|
$
|
(5,884
|
)
|
|
|
|
|
|
|
Lilly Pulitzer inventory step-up charges
|
$
|
1,047
|
|
$
|
—
|
|
|||||
|
Southern Tide inventory step-up charges
|
$
|
—
|
|
$
|
2,667
|
|
|||||
|
Corporate and Other inventory step-up charges
|
$
|
111
|
|
$
|
—
|
|
|||||
|
Tommy Bahama Canada intangible asset amortization
|
$
|
1,523
|
|
$
|
1,491
|
|
|||||
|
Lilly Pulitzer Signature Store intangible asset amortization
|
$
|
180
|
|
$
|
—
|
|
|||||
|
Southern Tide intangible asset amortization
|
$
|
288
|
|
$
|
263
|
|
|||||
|
Lilly Pulitzer Signature Store acquisitions transaction/integration costs
|
$
|
870
|
|
$
|
—
|
|
|||||
|
Southern Tide distribution center integration charges
|
$
|
—
|
|
$
|
454
|
|
|||||
|
Southern Tide transaction costs included in Corporate and Other
|
$
|
—
|
|
$
|
762
|
|
|||||
The decrease in operating income in Fiscal 2017 was due to (1) the lower operating results in Corporate and Other, primarily due to the impact of LIFO accounting, (2) lower operating income in Lilly Pulitzer primarily due to higher SG&A, including charges and transaction/integration costs associated with the Fiscal 2017 acquisition of certain Lilly Pulitzer Signature Store operations and (3) lower operating income in Lanier Apparel. These items were partially offset by increased operating income in Tommy Bahama and Southern Tide, which included certain purchase accounting charges in Fiscal 2016 and was not owned for the full year in Fiscal 2016. Changes in operating income (loss) by operating group are discussed below.
Tommy Bahama:
|
|
Fiscal 2017
|
Fiscal 2016
|
$ Change
|
% Change
|
|||||||
|
Net sales
|
$
|
686,021
|
|
$
|
658,911
|
|
$
|
27,110
|
|
4.1
|
%
|
|
Gross margin
|
59.8
|
%
|
58.7
|
%
|
|
|
|
|
|||
|
Operating income
|
$
|
55,002
|
|
$
|
44,101
|
|
$
|
10,901
|
|
24.7
|
%
|
|
Operating income as a % of net sales
|
8.0
|
%
|
6.7
|
%
|
|
|
|
|
|||
|
Tommy Bahama Canada intangible asset amortization
|
$
|
1,523
|
|
$
|
1,491
|
|
|||||
The increase in operating income for Tommy Bahama was primarily due to increased sales and higher gross margin, as discussed above, partially offset by higher SG&A. The higher SG&A for Fiscal 2017 includes (1) an $11 million increase in incentive compensation amounts, (2) incremental brand advertising expense, including the cost of the Spring 2017 and Holiday 2017 catalogs and (3) $4 million of incremental SG&A associated with non-comp retail stores and restaurants. These cost increases were partially offset by certain cost reductions in Tommy Bahama's retail store, wholesale and corporate operations as Tommy Bahama has focused on reducing certain employment and other operating costs.
Lilly Pulitzer:
55
|
|
Fiscal 2017
|
Fiscal 2016
|
$ Change
|
% Change
|
|||||||
|
Net sales
|
$
|
248,931
|
|
$
|
233,294
|
|
$
|
15,637
|
|
6.7
|
%
|
|
Gross margin
|
62.4
|
%
|
62.5
|
%
|
|
|
|
|
|||
|
Operating income
|
$
|
46,608
|
|
$
|
51,995
|
|
$
|
(5,387
|
)
|
(10.4
|
)%
|
|
Operating income as a % of net sales
|
18.7
|
%
|
22.3
|
%
|
|
|
|
|
|||
|
Lilly Pulitzer inventory step-up charges
|
$
|
1,047
|
|
$
|
—
|
|
|||||
|
Lilly Pulitzer Signature Store intangible asset amortization
|
$
|
180
|
|
$
|
—
|
|
|||||
|
Lilly Pulitzer Signature Store acquisitions transaction/integration costs
|
$
|
870
|
|
$
|
—
|
|
|||||
The lower operating income in Lilly Pulitzer was primarily due to increased SG&A and the $1 million inventory step-up charge associated with the acquisition of certain Lilly Pulitzer Signature Stores partially offset by higher sales. The higher SG&A for Fiscal 2017 includes (1) $7 million of incremental SG&A associated with operating additional retail stores, (2) SG&A increases to support the planned growth of the business, including additional employee headcount, and (3) $1 million consisting of transaction/integration costs and the amortization of intangible assets associated with the acquired Lilly Pulitzer Signature Stores. These additional SG&A amounts were partially offset by $1 million of lower incentive compensation amounts in Fiscal 2017.
Lanier Apparel:
|
|
Fiscal 2017
|
Fiscal 2016
|
$ Change
|
% Change
|
|||||||
|
Net sales
|
$
|
106,852
|
|
$
|
100,753
|
|
$
|
6,099
|
|
6.1
|
%
|
|
Gross margin
|
30.4
|
%
|
29.3
|
%
|
|
|
|
|
|||
|
Operating income
|
$
|
6,546
|
|
$
|
6,955
|
|
$
|
(409
|
)
|
(5.9
|
)%
|
|
Operating income as a % of net sales
|
6.1
|
%
|
6.9
|
%
|
|
|
|
|
|||
The lower operating income for Lanier Apparel reflects higher SG&A partially offset by the impact of higher sales and gross margin. The SG&A increase primarily resulted from (1) $2 million of incremental infrastructure costs primarily associated with the Strong Suit and Duck Head businesses, which were acquired in Fiscal 2016, (2) $1 million of increased incentive compensation and (3) $1 million of higher bad debt expense.
Southern Tide:
|
|
Fiscal 2017
|
Fiscal 2016
|
$ Change
|
% Change
|
|||||||
|
Net sales
|
$
|
40,940
|
|
$
|
27,432
|
|
$
|
13,508
|
|
49.2
|
%
|
|
Gross margin
|
49.4
|
%
|
39.8
|
%
|
|
|
|
|
|||
|
Operating income (loss)
|
$
|
4,504
|
|
$
|
(282
|
)
|
$
|
4,786
|
|
NM
|
|
|
Operating income (loss) as % of net sales
|
11.0
|
%
|
(1.0
|
)%
|
|||||||
|
Southern Tide inventory step-up charges
|
$
|
—
|
|
$
|
2,667
|
|
|||||
|
Southern Tide intangible asset amortization
|
$
|
288
|
|
$
|
263
|
|
|||||
|
Southern Tide distribution center integration charges
|
$
|
—
|
|
$
|
454
|
|
|||||
The increase in operating income for Southern Tide in Fiscal 2017 was primarily due to Fiscal 2017 including a full year of operations. Fiscal 2016 only included the operations from the date of our acquisition on April 19, 2016 through January 28, 2017 and also included a $3 million inventory step-up charge and certain distribution center integration charges, with no such charges in Fiscal 2017.
Corporate and Other:
56
|
|
Fiscal 2017
|
Fiscal 2016
|
$ Change
|
% Change
|
|||||||
|
Net sales
|
$
|
3,467
|
|
$
|
2,198
|
|
$
|
1,269
|
|
57.7
|
%
|
|
Operating loss
|
$
|
(26,660
|
)
|
$
|
(12,885
|
)
|
$
|
(13,775
|
)
|
(106.9
|
)%
|
|
LIFO charge (credit) included in Corporate and Other
|
$
|
7,821
|
|
$
|
(5,884
|
)
|
|||||
|
Corporate and Other inventory step-up charges
|
$
|
111
|
|
$
|
—
|
|
|||||
|
Southern Tide transaction costs included in Corporate and Other
|
$
|
—
|
|
$
|
762
|
|
|||||
The lower operating results in Corporate and Other were primarily due to (1) the $14 million net unfavorable impact of LIFO accounting and (2) $2 million of higher incentive compensation expense. These items were partially offset by (1) $1 million of transaction expenses associated with the Southern Tide acquisition in Fiscal 2016, with no such expenses in Fiscal 2017 and (2) improved operating results for our Lyons, Georgia distribution center operations.
Interest expense, net
|
|
Fiscal 2017
|
Fiscal 2016
|
$ Change
|
% Change
|
|||||||
|
Interest expense, net
|
$
|
3,109
|
|
$
|
3,421
|
|
$
|
(312
|
)
|
(9.1
|
)%
|
Interest expense for Fiscal 2017 decreased from the prior year primarily due to Fiscal 2016 including the write off of certain deferred financing costs associated with our amendment and restatement of our revolving credit agreement. The impact of lower average debt outstanding during Fiscal 2017 compared to Fiscal 2016 was partially offset by higher interest rates in Fiscal 2017.
Income taxes
|
|
Fiscal 2017
|
Fiscal 2016
|
$ Change
|
% Change
|
|||||||
|
Income taxes
|
$
|
18,190
|
|
$
|
31,964
|
|
$
|
(13,774
|
)
|
(43.1
|
)%
|
|
Effective tax rate
|
21.9
|
%
|
37.0
|
%
|
|
|
|
|
|||
|
Impact of U.S. Tax Reform
|
$
|
11,495
|
|
$
|
—
|
|
|||||
Income taxes in Fiscal 2017 decreased from the prior year primarily due to Fiscal 2017 including the provisional $12 million favorable impact from U.S. Tax Reform primarily resulting from the valuation of deferred tax assets and liabilities to reflect the new enacted United States Federal tax rate of 21% rather than the historical 35% rate. As a result, the income tax amounts and effective tax rates for Fiscal 2017 and Fiscal 2016 are not comparable.
Additionally, Fiscal 2017 included the favorable impact of (1) the blended tax rate for Fiscal 2017 resulting from the enactment of U.S. Tax Reform, (2) improved operating results in certain of our foreign jurisdictions, including foreign sourcing operations, which have lower tax rates than our domestic earnings, and (3) $1 million of favorable discrete items in Fiscal 2017 primarily related to certain prior year tax items, which were offset by the $1 million unfavorable impact of certain stock awards that vested during the First Quarter of Fiscal 2017. Fiscal 2016 included the favorable impact of (1) earnings in certain foreign jurisdictions which have lower tax rates than our domestic earnings, (2) the utilization of certain foreign operating loss carryforward amounts and (3) the reversal of valuation allowances in certain foreign jurisdictions based on our assessment of the facts and circumstances related to our ability to realize those net operating loss carryforwards in future periods. Refer to Note 8 to our consolidated financial statements contained in this report for additional information about income taxes.
Net earnings from continuing operations
|
|
Fiscal 2017
|
Fiscal 2016
|
||||
|
Net sales
|
$
|
1,086,211
|
|
$
|
1,022,588
|
|
|
Operating income
|
$
|
86,000
|
|
$
|
89,884
|
|
|
Net earnings from continuing operations
|
$
|
64,701
|
|
$
|
54,499
|
|
|
Net earnings from continuing operations per diluted share
|
$
|
3.87
|
|
$
|
3.27
|
|
|
Weighted average shares outstanding - diluted
|
16,734
|
|
16,649
|
|
||
57
The higher net earnings in Fiscal 2017 was primarily due to (1) a lower effective tax rate primarily resulting from the impact of U.S. Tax Reform as discussed in Note 8 to our consolidated financial statements included in this report, (2) higher operating income in Tommy Bahama and (3) improved operating results in Southern Tide, which included certain purchase accounting charges and was not owned for the full year in Fiscal 2016. These items were partially offset by (1) the impact of LIFO accounting on Corporate and Other operating results, (2) lower operating income in Lilly Pulitzer, due in part to charges associated with the Fiscal 2017 acquisition of certain Lilly Pulitzer Signature Store operations, and (3) lower operating income in Lanier Apparel.
Discontinued operations
|
|
Fiscal 2017
|
Fiscal 2016
|
$ Change
|
% Change
|
||||||
|
Income (loss) from discontinued operations, net of taxes
|
$
|
389
|
|
$
|
(2,038
|
)
|
$
|
2,427
|
|
NM
|
The income from discontinued operations, net of taxes in Fiscal 2017 was primarily due to a reduction in the retained lease obligations liability of our discontinued operations. This resulted from negotiated settlements in respect of the retained lease obligations for an amount in the aggregate less than the previously recognized lease obligations liability. The loss from discontinued operations, net of taxes in Fiscal 2016 primarily resulted from an additional loss related to the retained lease obligations liability of our discontinued operations due to an updated assessment of the anticipated losses considering anticipated sub-lease income to be earned, timing of obtaining a tenant, lease incentives and market rents. We do not anticipate any cash flows or earnings related to discontinued operations in future periods.
FINANCIAL CONDITION, LIQUIDITY AND CAPITAL RESOURCES
Our primary source of revenue and cash flow is through our design, sourcing, marketing and distribution of branded apparel products bearing the trademarks of our Tommy Bahama, Lilly Pulitzer and Southern Tide lifestyle brands, other owned and licensed brands, and private label apparel products. Our primary uses of cash flow include the purchase of products in the operation of our business from third party contract manufacturers outside of the United States, as well as operating expenses, including employee compensation and benefits, occupancy-related costs, marketing and advertising costs, distribution costs, other general and administrative expenses and the payment of periodic interest payments related to our financing arrangements.
Additionally, we use cash for the funding of capital expenditures, dividends and repayment of indebtedness. In the ordinary course of business, we maintain certain levels of inventory, extend credit to our wholesale customers and pay our operating expenses. Thus, we require a certain amount of working capital to operate our business. If cash inflows are less than cash outflows, we have access to amounts under our U.S. Revolving Credit Agreement, subject to its terms, which is described below. We may seek to finance our future cash requirements through various methods, including cash flow from operations, borrowings under our current or additional credit facilities, sales of debt or equity securities, and cash on hand.
As of
February 2, 2019
, we had
$8 million
of cash and cash equivalents on hand, as well as
$13 million
of borrowings outstanding and
$254 million
of availability under our U.S. Revolving Credit Agreement. We believe our balance sheet and anticipated future positive cash flow from operating activities provide sufficient cash flow to satisfy our ongoing cash requirements as well as ample opportunity to continue to invest in our brands, direct to consumer initiatives and other strategic initiatives.
Key Liquidity Measures
|
($ in thousands)
|
February 2, 2019
|
February 3, 2018
|
$ Change
|
% Change
|
|||||||
|
Total Current Assets
|
$
|
269,788
|
|
$
|
236,118
|
|
$
|
33,670
|
|
14.3
|
%
|
|
Total Current Liabilities
|
142,209
|
|
135,010
|
|
7,199
|
|
5.3
|
%
|
|||
|
Working capital
|
$
|
127,579
|
|
$
|
101,108
|
|
$
|
26,471
|
|
26.2
|
%
|
|
Working capital ratio
|
1.90
|
|
1.75
|
|
|
|
|
|
|||
|
Debt to total capital ratio
|
3
|
%
|
10
|
%
|
|
|
|
|
|||
Our working capital ratio is calculated by dividing total current assets by total current liabilities. Current assets increased from
February 3, 2018
to
February 2, 2019
primarily due to higher inventories. Current liabilities increased from
February 3, 2018
to
February 2, 2019
primarily due to higher accounts payable partially offset by lower accrued compensation.
58
For the ratio of debt to total capital, debt is defined as short-term and long-term debt, and total capital is defined as debt plus shareholders' equity. Debt was
$13 million
at
February 2, 2019
and
$46 million
at
February 3, 2018
, while shareholders’ equity was
$478 million
at
February 2, 2019
and
$430 million
at
February 3, 2018
. The decrease in debt since
February 3, 2018
was primarily due to
$96 million
of cash flow from operations which was partially offset by cash payments of
$37 million
for capital expenditures and
$23 million
for dividends. Shareholders' equity
increased from
February 3, 2018
, primarily as a result of net earnings less dividends paid during the period. Our debt levels and ratio of debt to total capital in future periods may not be comparable to historical amounts as we continue to assess, and possibly make changes to, our capital structure. Changes in our capital structure in the future, if any, will depend on prevailing market conditions, our liquidity requirements, contractual restrictions and other factors. The amounts involved may be material.
Balance Sheet
The following tables set forth certain information included in our consolidated balance sheets (in thousands). Below each table are explanations for any significant changes in the balances from
February 3, 2018
to
February 2, 2019
.
Current Assets:
|
February 2, 2019
|
February 3, 2018
|
$ Change
|
% Change
|
||||||||
|
Cash and cash equivalents
|
$
|
8,327
|
|
$
|
6,343
|
|
$
|
1,984
|
|
31.3
|
%
|
|
Receivables, net
|
69,037
|
|
67,542
|
|
1,495
|
|
2.2
|
%
|
|||
|
Inventories, net
|
160,656
|
|
126,812
|
|
33,844
|
|
26.7
|
%
|
|||
|
Prepaid expenses and other current assets
|
31,768
|
|
35,421
|
|
(3,653
|
)
|
(10.3
|
)%
|
|||
|
Total Current Assets
|
$
|
269,788
|
|
$
|
236,118
|
|
$
|
33,670
|
|
14.3
|
%
|
Cash and cash equivalents as of
February 2, 2019
and
February 3, 2018
represent typical cash amounts maintained on an ongoing basis in our operations, which generally ranges from $5 million to $10 million at any given time. Any excess cash is generally used to repay amounts outstanding under our U.S. Revolving Credit Agreement. The increase in receivables, net as of
February 2, 2019
was primarily due to higher wholesale sales in the Fourth Quarter of Fiscal 2018 resulting in higher trade accounts receivables partially offset by a $4 million reduction in income tax receivables reflecting the collection of certain income tax receivable amounts during the year and a $3 million reduction in receivables due from landlords reflecting the timing of payment of certain tenant improvement allowance amounts.
Inventories, net, which is net of a $62 million LIFO reserve in both periods, increased as of
February 2, 2019
due to increases in inventories in each operating group. The increased inventory was primarily due to (1) the impact of the earlier Chinese New Year in Fiscal 2019 resulting in $16 million higher inventory in transit at
February 2, 2019
, (2) increased inventory levels in Lanier Apparel due to less inventory than optimal at
February 3, 2018
, reflecting transitions in certain replenishment programs, and the impact of the softer sales than plan in Lanier Apparel in the Fourth Quarter of Fiscal 2018 and (3) increased inventory to support anticipated sales growth in each operating group. We believe that inventory levels in each operating group are appropriate to support anticipated sales for the First Quarter of Fiscal 2019. Prepaid expenses and other current assets decreased as of
February 2, 2019
primarily as a result of lower prepaid advertising amounts.
Non-current Assets:
|
February 2, 2019
|
February 3, 2018
|
$ Change
|
% Change
|
||||||||
|
Property and equipment, net
|
$
|
192,576
|
|
$
|
193,533
|
|
$
|
(957
|
)
|
(0.5
|
)%
|
|
Intangible assets, net
|
176,176
|
|
178,858
|
|
(2,682
|
)
|
(1.5
|
)%
|
|||
|
Goodwill
|
66,621
|
|
66,703
|
|
(82
|
)
|
(0.1
|
)%
|
|||
|
Other non-current assets, net
|
22,093
|
|
24,729
|
|
(2,636
|
)
|
(10.7
|
)%
|
|||
|
Total non-current assets, net
|
$
|
457,466
|
|
$
|
463,823
|
|
$
|
(6,357
|
)
|
(1.4
|
)%
|
Property and equipment, net decreased as of
February 2, 2019
primarily a result of depreciation expense exceeding capital expenditures in
Fiscal 2018
. The decrease in intangible assets, net as of
February 2, 2019
was primarily due to amortization of intangible assets in
Fiscal 2018
. The decrease in other non-current assets, net as of
February 2, 2019
was primarily due to reductions in amounts related to certain investments in officers' life insurance policies, investments in unconsolidated entities, security deposits and unamortized deferred financing costs.
59
Liabilities:
|
February 2, 2019
|
February 3, 2018
|
$ Change
|
% Change
|
||||||||
|
Total current liabilities
|
$
|
142,209
|
|
$
|
135,010
|
|
$
|
7,199
|
|
5.3
|
%
|
|
Long-term debt
|
12,993
|
|
45,809
|
|
(32,816
|
)
|
(71.6
|
)%
|
|||
|
Other non-current liabilities
|
75,286
|
|
74,029
|
|
1,257
|
|
1.7
|
%
|
|||
|
Deferred taxes
|
18,411
|
|
15,269
|
|
3,142
|
|
20.6
|
%
|
|||
|
Total liabilities
|
$
|
248,899
|
|
$
|
270,117
|
|
$
|
(21,218
|
)
|
(7.9
|
)%
|
Current liabilities increased as of
February 2, 2019
primarily due to higher accounts payable amounts primarily resulting from increased inventory in transit at
February 2, 2019
and the timing of payment of certain payable amounts, partially offset by the reduction of amounts related to discontinued operations to $0 at
February 2, 2019
compared to $2 million at
February 3, 2018
. The increase in accounts payable was partially offset by a $6 million reduction in accrued compensation resulting from decreased bonuses at Tommy Bahama, Corporate and Other and Lanier Apparel partially offset by increased bonuses at Southern Tide and Lilly Pulitzer. Other accrued expenses and liabilities were comparable at
February 2, 2019
and
February 3, 2018
reflecting an increase in gift card liabilities, accrued royalties and accrued advertising offset by a reduction in accrued duties and estimated direct to consumer returns.
The decrease in debt as of
February 2, 2019
was primarily due to
$96 million
of cash flow from operations which was partially offset by cash payments of
$37 million
for capital expenditures and
$23 million
for dividends. Other non-current liabilities increased as of
February 2, 2019
primarily due to increases in deferred compensation liabilities and fair value of contingent consideration partially offset by decreases in deferred rent tenant improvement allowance liabilities from landlords. Deferred taxes increased as of
February 2, 2019
primarily due to timing differences associated with depreciation, amortization and prepaid expenses partially offset by timing differences associated with inventories.
Statement of Cash Flows
The following table sets forth the net cash flows, including continuing and discontinued operations, resulting in the change in our cash and cash equivalents (in thousands):
|
Fiscal 2018
|
Fiscal 2017
|
Fiscal 2016
|
|||||||
|
Cash provided by operating activities
|
$
|
96,377
|
|
$
|
118,593
|
|
$
|
118,565
|
|
|
Cash used in investing activities
|
(37,397
|
)
|
(54,277
|
)
|
(146,491
|
)
|
|||
|
Cash (used in) provided by financing activities
|
(56,765
|
)
|
(64,712
|
)
|
27,367
|
|
|||
|
Net change in cash and cash equivalents
|
$
|
2,215
|
|
$
|
(396
|
)
|
$
|
(559
|
)
|
Cash and cash equivalents on hand were
$8 million
and
$6 million
at
February 2, 2019
and
February 3, 2018
, respectively. Changes in cash flows in
Fiscal 2018
,
Fiscal 2017
and
Fiscal 2016
related to operating activities, investing activities and financing activities are discussed below.
Operating Activities:
In
Fiscal 2018
,
Fiscal 2017
and
Fiscal 2016
, operating activities provided
$96 million
,
$119 million
and
$119 million
of cash, respectively. The cash flow from operating activities for each period was primarily the result of net earnings for the relevant period adjusted, as applicable, for non-cash activities including depreciation, amortization and equity-based compensation, as well as the net impact of changes in deferred taxes and our working capital accounts. In
Fiscal 2018
, working capital account changes had an unfavorable impact on cash flow from operations, while in
Fiscal 2017
and
Fiscal 2016
, working capital account changes had a favorable impact on cash flow from operations.
In
Fiscal 2018
, the more significant changes in working capital accounts were an increase in inventories, which decreased cash flow from operations, partially offset by an increase in current liabilities and a decrease in prepaid expenses and other current assets, each of which increased cash flow from operations. In
Fiscal 2017
, the more significant changes in working capital accounts were decreases in inventories, which increased cash flow from operations, partially offset by increases in prepaid expenses and other current assets and receivables, each of which decreased cash flow from operations. In
Fiscal 2016
, in addition to the favorable impact of deferred taxes, the more significant changes in working capital accounts were decreases in receivables and inventories, each of which increased cash flow from operations.
60
Investing Activities:
During
Fiscal 2018
,
Fiscal 2017
and
Fiscal 2016
, investing activities used
$37 million
,
$54 million
and
$146 million
, respectively, of cash. Our cash flow used in investing activities on an ongoing basis typically consists of our capital expenditure investments in our existing brands and acquisitions of new businesses. Our capital expenditures primarily consist of costs associated with information technology initiatives, including e-commerce capabilities; opening, relocating and remodeling retail stores and restaurants; and facilities enhancements for distribution centers and offices.
In
Fiscal 2018
,
Fiscal 2017
and
Fiscal 2016
, we paid
$37 million
,
$39 million
and
$49 million
, respectively, for capital expenditures. During each of
Fiscal 2018
,
Fiscal 2017
and
Fiscal 2016
, we paid certain amounts related to acquisitions. In
Fiscal 2018
, we paid certain small amounts consisting of working capital and other related settlements associated with recent acquisitions, while in
Fiscal 2017
we paid amounts for various smaller acquisitions including the acquisition of the operations and assets of TBBC and 12 Lilly Pulitzer Signature Stores as well as working capital settlements related to other recent acquisitions. In
Fiscal 2016
, we acquired Southern Tide, and also completed other smaller acquisitions. Additionally, in
Fiscal 2016
we paid certain amounts associated with the sale of Ben Sherman.
Financing Activities:
During
Fiscal 2018
,
Fiscal 2017
and
Fiscal 2016
, financing activities used
$57 million
of cash, used
$65 million
of cash and provided
$27 million
of cash, respectively. In
Fiscal 2018
and
Fiscal 2017
, we decreased debt as our cash flow from operations exceeded our capital expenditures, payment of dividends and amounts paid related to acquisitions. During
Fiscal 2016
, we increased debt primarily for funding our acquisition of Southern Tide, capital expenditures and dividends, which in the aggregate exceeded our cash flow from operations. During
Fiscal 2018
,
Fiscal 2017
and
Fiscal 2016
we paid
$23 million
,
$18 million
and
$18 million
of dividends, respectively.
We anticipate that cash flow provided by or used in financing activities in the future will be dependent upon whether our cash flow from operating activities exceeds our capital expenditures, dividend payments, acquisitions and any other investing or financing activities. Generally, we anticipate that excess cash, if any, will be used to repay debt on our U.S. Revolving Credit Agreement or if we have no outstanding debt we anticipate investing the excess cash in short term investments.
Liquidity and Capital Resources
We had
$13 million
outstanding as of
February 2, 2019
under our $325 million Fourth Amended and Restated Credit Agreement ("U.S. Revolving Credit Agreement") compared to
$46 million
of borrowings outstanding as of
February 3, 2018
. The U.S. Revolving Credit Agreement generally (1) is limited to a borrowing base consisting of specified percentages of eligible categories of assets, (2) accrues variable-rate interest (weighted average borrowing rate of
5.8%
as of
February 2, 2019
), unused line fees and letter of credit fees based upon average unused availability or utilization, (3) requires periodic interest payments with principal due at maturity (May 2021) and (4) is secured by a first priority security interest in substantially all of the assets of Oxford Industries, Inc. and its domestic subsidiaries, including accounts receivable, books and records, chattel paper, deposit accounts, equipment, certain general intangibles, inventory, investment property (including the equity interests of certain subsidiaries), negotiable collateral, life insurance policies, supporting obligations, commercial tort claims, cash and cash equivalents, eligible trademarks, proceeds and other personal property.
To the extent cash flow needs exceed cash flow provided by our operations we will have access, subject to its terms, to our U.S. Revolving Credit Agreement to provide funding for operating activities, capital expenditures and acquisitions, if any. Our U.S. Revolving Credit Agreement is also used to establish collateral for certain insurance programs and leases and to finance trade letters of credit for product purchases, which reduce the amounts available under our line of credit when issued. As of
February 2, 2019
,
$5 million
of letters of credit were outstanding against our U.S. Revolving Credit Agreement. After considering these limitations and the amount of eligible assets in our borrowing base, as applicable, as of
February 2, 2019
, we had
$253.7 million
in unused availability under the U.S. Revolving Credit Agreement, subject to certain limitations on borrowings.
Covenants, Other Restrictions and Prepayment Penalties
The U.S. Revolving Credit Agreement is subject to a number of affirmative covenants regarding the delivery of financial information, compliance with law, maintenance of property, insurance requirements and conduct of business. Also, the U.S. Revolving Credit Agreement is subject to certain negative covenants or other restrictions including, among other things, limitations on our ability to (1) incur debt, (2) guaranty certain obligations, (3) incur liens, (4) pay dividends to shareholders,
61
(5) repurchase shares of our common stock, (6) make investments, (7) sell assets or stock of subsidiaries, (8) acquire assets or businesses, (9) merge or consolidate with other companies or (10) prepay, retire, repurchase or redeem debt.
Additionally, the U.S. Revolving Credit Agreement contains a financial covenant that applies if excess availability under the agreement for
three
consecutive days is less than the greater of (1)
$23.5 million
or (2)
10%
of availability. In such case, our fixed charge coverage ratio as defined in the U.S. Revolving Credit Agreement must not be less than
1.0
to
1.0
for the immediately preceding
12
fiscal months for which financial statements have been delivered. This financial covenant continues to apply until we have maintained excess availability under the U.S. Revolving Credit Agreement of more than the greater of (1)
$23.5 million
or (2)
10%
of availability for
30
consecutive days.
We believe that the affirmative covenants, negative covenants, financial covenants and other restrictions under the U.S. Revolving Credit Agreement are customary for those included in similar facilities entered into at the time we entered into the U.S. Revolving Credit Agreement. During
Fiscal 2018
and as of
February 2, 2019
, no financial covenant testing was required pursuant to our U.S. Revolving Credit Agreement as the minimum availability threshold was met at all times. As of
February 2, 2019
, we were compliant with all covenants related to the U.S. Revolving Credit Agreement.
Other Liquidity Items:
We anticipate that we will be able to satisfy our ongoing cash requirements, which generally consist of working capital and other operating activity needs, capital expenditures, interest payments on our debt and dividends, if any, primarily from positive cash flow from operations supplemented by borrowings under our U.S. Revolving Credit Agreement. Our need for working capital is typically seasonal with the greatest requirements generally in the fall and spring of each year. Our capital needs will depend on many factors including our growth rate, the need to finance inventory levels and the success of our various products. We anticipate that at the maturity of the U.S. Revolving Credit Agreement or as otherwise deemed appropriate, we will be able to refinance the facility or obtain other financing on terms available in the market at that time. The terms of any future financing arrangements may not be as favorable as the terms of the current agreement or current market terms.
On March 26, 2019, our Board of Directors approved a cash dividend of $0.37 per share payable on May 3, 2019 to shareholders of record as of the close of business on April 18, 2019. Although we have paid dividends in each quarter since we became a public company in July 1960, including
$23 million
in total, or $1.36 per common share, in
Fiscal 2018
, we may discontinue or modify dividend payments at any time if we determine that other uses of our capital, including payment of outstanding debt, funding of acquisitions, funding of capital expenditures or repurchases of outstanding shares, may be in our best interest; if our expectations of future cash flows and future cash needs outweigh the ability to pay a dividend; or if the terms of our credit facility, other debt instruments or applicable law limit our ability to pay dividends. We may borrow to fund dividends in the short term based on our expectation of operating cash flows in future periods subject to the terms and conditions of our credit facility, other debt instruments and applicable law. All cash flow from operations will not be paid out as dividends in all periods. For details about limitations on our ability to pay dividends, see the discussion of the U.S. Revolving Credit Agreement above.
Contractual Obligations
The following table summarizes our contractual cash obligations, as of
February 2, 2019
, by future period (in thousands):
|
|
Payments Due by Period
|
||||||||||||||
|
|
Less Than
1 year
|
1-3 Years
|
3-5 Years
|
More Than
5 Years
|
Total
|
||||||||||
|
Contractual Obligations:
|
|
|
|
|
|
||||||||||
|
U.S. Revolving Credit Agreement (1)
|
$
|
—
|
|
$
|
—
|
|
$
|
—
|
|
$
|
—
|
|
$
|
—
|
|
|
Operating leases (2)
|
68,447
|
|
127,856
|
|
109,919
|
|
123,751
|
|
429,973
|
|
|||||
|
Minimum royalty and advertising payments pursuant to royalty agreements
|
5,648
|
|
9,211
|
|
—
|
|
—
|
|
14,859
|
|
|||||
|
Letters of credit
|
4,765
|
|
—
|
|
—
|
|
—
|
|
4,765
|
|
|||||
|
Other (3)(4)(5)
|
—
|
|
—
|
|
—
|
|
—
|
|
—
|
|
|||||
|
Total
|
$
|
78,860
|
|
$
|
137,067
|
|
$
|
109,919
|
|
$
|
123,751
|
|
$
|
449,597
|
|
_______________________________________________________________________________
62
|
(1)
|
Principal, interest, unused line fees and letter of credit fees and amounts payable in future periods on our U.S. Revolving Credit Agreement have been excluded from the table above, as the principal amount that will be outstanding and interest rate during any fiscal year will be dependent upon future events which are not known at this time. During
Fiscal 2018
, we paid
$2 million
of interest, unused line fees and letter of credit fees.
|
|
(2)
|
Amounts to be paid in future periods for real estate taxes, sales tax, insurance, other operating expenses and contingent rent applicable to the properties pursuant to the respective operating leases have been excluded from the table above, as the amounts payable in future periods are, in most cases, not quantified in the lease agreements or are dependent on factors which may not be known at this time. Such amounts incurred in
Fiscal 2018
totaled
$28 million
.
|
|
(3)
|
Amounts totaling
$13 million
of deferred compensation obligations, which are included in other non-current liabilities in our consolidated balance sheet as of
February 2, 2019
, have been excluded from the table above, due to the uncertainty of the timing of the payment of these obligations, which are generally at the discretion of the individual employees or upon the death of the individual.
|
|
(4)
|
Non-current deferred taxes, which is the net amount of deferred tax liabilities and deferred tax assets, of
$18 million
included in our consolidated balance sheet as of
February 2, 2019
and discussed in Note 8 to our consolidated financial statements included in this report have been excluded from the above table, as deferred income tax liabilities are calculated based on temporary differences between the tax basis and book basis of assets and liabilities, which will result in taxable amounts in future years when the amounts are settled at their reported financial statement amounts. As the results of these calculations do not have a direct connection with the amount of cash taxes to be paid in any future periods, scheduling deferred income tax amounts by period could be misleading.
|
|
(5)
|
Amounts totaling $1 million of contingent consideration amounts, which are included in other non-current liabilities in our consolidated balance sheet as of
February 2, 2019
, have been excluded from the table above, due to the uncertainty of the amount or timing of these potential obligations, which are dependent upon future earnings of TBBC over the next three years.
|
Our anticipated capital expenditures for Fiscal
2019
, which are excluded from the table above as we are generally not contractually obligated to pay these amounts as of
February 2, 2019
, are expected to be in a range of $45 million to $50 million. These expenditures are expected to consist primarily of costs associated with information technology initiatives, including e-commerce capabilities; new retail stores and Marlin Bars; and investments to remodel existing retail stores and restaurants. Our capital expenditure amounts in future years may increase or decrease from the amounts incurred in prior years depending on the information technology initiatives, direct to consumer location openings, relocations and remodels and other infrastructure requirements deemed appropriate for that year to support future expansion of our businesses.
Off Balance Sheet Arrangements
We have not entered into agreements which meet the SEC's definition of an off balance sheet financing arrangement, other than operating leases, and have made no financial commitments to or guarantees with respect to any unconsolidated subsidiaries or special purpose entities.
CRITICAL ACCOUNTING POLICIES
The discussion and analysis of our financial condition and results of operations are based upon our consolidated financial statements, which have been prepared in accordance with GAAP in a consistent manner. The preparation of these financial statements requires the selection and application of accounting policies. Further, the application of GAAP requires us to make estimates and judgments about future events that affect the reported amounts of assets, liabilities, revenues and expenses and related disclosures. On an ongoing basis, we evaluate our estimates, including those discussed below. We base our estimates on historical experience, current trends and various other assumptions that we believe are reasonable under the circumstances, the results of which form the basis for making judgments about the carrying values of assets and liabilities that are not readily apparent from other sources.
Actual results may differ from these estimates under different assumptions or conditions. We believe it is possible that other professionals, applying reasonable judgment to the same set of facts and circumstances, could develop and support a range of alternative estimated amounts. We believe that we have appropriately applied our critical accounting policies. However, in the event that inappropriate assumptions or methods were used relating to the critical accounting policies below, our consolidated statements of operations could be misstated.
63
A detailed summary of significant accounting policies is included in Note 1 to our consolidated financial statements contained in this report. The following is a brief discussion of the more significant estimates, assumptions and judgments we use or the amounts most sensitive to change from outside factors.
Revenue Recognition and Accounts Receivable
Our revenue consists of direct to consumer sales, including our retail store, e-commerce and restaurant operations, and wholesale sales, as well as royalty income, which is included in royalties and other income in our consolidated statements of operations. We recognize revenue when performance obligations under the terms of the contracts with our customers are satisfied. Our performance obligations generally consist of delivering our products to our direct to consumer and wholesale customers. Control of the product is generally transferred upon providing the product to consumers in our bricks and mortar retail stores and restaurants, upon physical delivery of the products to consumers in our e-commerce operations and upon shipment from the distribution center to customers in our wholesale operations. Once control is transferred to the customer, we have completed our performance obligations related to the contract and have an unconditional right to consideration for the products sold as outlined in the contract. Our receivables resulting from contracts with customers in our direct to consumer operations are generally collected within a few days, upon settlement of the credit card transaction. Our receivables resulting from contracts with our customers in our wholesale operations are generally collected within one quarter, in accordance with established credit terms.
In the ordinary course of our wholesale operations, we offer discounts, allowances and cooperative advertising support to some of our wholesale customers for certain products. Wholesale sales are recorded net of such discounts, allowances and cooperative advertising support for our customers, operational chargebacks and provisions for estimated wholesale returns. As certain allowances, other deductions and returns are not finalized until the end of a season, program or other event which may not have occurred yet, we estimate such discounts, allowances and returns on an ongoing basis to estimate the consideration from the customer that we expect to ultimately receive. We only recognize revenue to the extent that it is probable that we will not have a a significant reversal of revenue in a future period. Significant considerations in determining our estimates for discounts, allowances, operational chargebacks and returns for wholesale customers may include historical and current trends, agreements with customers, projected seasonal results, an evaluation of current economic conditions, specific program or product expectations and retailer performance. Actual discounts and allowances to our wholesale customers have not differed materially from our estimates in prior periods. As of
February 2, 2019
, our total reserves for discounts, returns and allowances for our wholesale businesses were $7 million and, therefore, if the allowances changed by 10% it would have had a pre-tax impact of $0.7 million on earnings in
Fiscal 2018
. The substantial majority of these reserves as of
February 2, 2019
relate to our Lanier Apparel business.
In our direct to consumer operations, consumers have certain rights to return product within a specified period and are eligible for certain point of sale discounts, thus retail store, e-commerce and restaurant revenues are recorded net of estimated returns and discounts, as applicable. We make estimates of reserves for products which were sold prior to the balance sheet date but that we anticipate may be returned by the consumer subsequent to that date. The determination of direct to consumer return reserve amounts requires judgment and consideration of historical and current trends, evaluation of current economic trends and other factors. Our historical estimates of direct to consumer return reserves have not differed materially from actual results. As of
February 2, 2019
, our direct to consumer return reserve was $3 million. A 10% change in the direct to consumer sales return reserve as of
February 2, 2019
would have had a $0.2 million impact on gross profit and pre-tax earnings in
Fiscal 2018
.
We extend credit to certain wholesale customers based on an evaluation of the customer's financial capacity and condition, usually without requiring collateral. We recognize estimated reserves for bad debts based on our historical collection experience, the financial condition of our customers, an evaluation of current economic conditions and anticipated trends, each of which is subjective and requires certain assumptions. Actual charges for bad debts have not differed materially from our estimates in prior periods. As of
February 2, 2019
, our allowance for bad debts was $1 million, and therefore, if the allowance for bad debts changed by 10% it would have had a pre-tax impact of $0.1 million on earnings in
Fiscal 2018
. While the amounts deemed uncollectible have not been significant in recent years if, in the future, amounts due from significant customer(s) were deemed to be uncollectible as a result of events that occur subsequent to
February 2, 2019
this could result in a material charge to our consolidated statements of operations in future periods.
Inventories, net
For operating group reporting, inventory is carried at the lower of the first-in, first-out (FIFO) method cost or market. We continually evaluate the composition of our inventories, substantially all of which is finished goods inventory, for identification of distressed inventory. In performing this evaluation, we consider slow-turning products, an indication of lack of consumer acceptance of particular products, prior seasons' fashion products and current levels of replenishment program products as compared to future sales estimates. We estimate the amount of goods that we will not be able to sell in the normal course of business and write down the value of these goods as necessary. As the amount to be ultimately realized for the goods
64
is not necessarily known at period end, we must utilize certain assumptions considering historical experience, inventory quantity, quality, age and mix, historical sales trends, future sales projections, consumer and retailer preferences, market trends, general economic conditions and our plans to sell the inventory. Also, we provide an allowance for shrinkage, as appropriate, for the period between the last physical inventory count and each balance sheet date. Historically, our estimates of inventory markdowns and inventory shrinkage have not varied significantly from actual results.
For consolidated financial reporting,
$150 million
, or
93%
, of our inventories are valued at the lower of the last-in, first-out (LIFO) method cost or market after deducting the
$62 million
LIFO reserve as of
February 2, 2019
. The remaining
$11 million
of our inventories are valued at the lower of FIFO cost or market as of
February 2, 2019
. LIFO reserves are based on the Producer Price Index (PPI) as published by the United States Department of Labor. We write down inventories valued at the lower of LIFO cost or market when LIFO cost exceeds market value. We deem LIFO accounting adjustments to not only include changes in the LIFO reserve, but also changes in markdown reserves which are considered in LIFO accounting. As our LIFO inventory pool does not correspond to our operating group definitions, LIFO inventory accounting adjustments are not allocated to the respective operating groups. Thus, the impact of accounting for inventories on the LIFO method is reflected in Corporate and Other for operating group reporting purposes.
As of
February 2, 2019
, we had recorded a reserve of $1 million related to inventory on the lower of FIFO cost or market method and for inventory on the lower of LIFO cost or market method with markdowns in excess of our LIFO reserve. A 10% change in the amount of such markdowns would have a pre-tax impact of $0.1 million on earnings in
Fiscal 2018
. A change in the markdowns of our inventory valued at the lower of LIFO cost or market method that is not marked down in excess of our LIFO reserve typically would not be expected to have a material impact on our consolidated financial statements. A change in inventory levels, or the mix by inventory category, at the end of future fiscal years compared to inventory balances as of
February 2, 2019
could result in a material impact on our consolidated financial statements as such a change may erode portions of our earlier base year layers for purposes of making our annual LIFO computation. Additionally, a change in the PPI as published by the United States Department of Labor as compared to the indexes as of
February 2, 2019
could result in a material impact on our consolidated financial statements as inflation or deflation would change the amount of our LIFO reserve.
Given the significant amount of uncertainty surrounding the year-end LIFO calculation, including the estimate of year-end inventory balances, the proportion of inventory in each inventory category and the year-end PPI, we typically do not adjust our LIFO reserve in the first three quarters of a fiscal year. This policy may result in significant LIFO accounting adjustments in the fourth quarter of the fiscal year resulting from the year over year changes in inventory levels, the PPI and markdown reserves. On a quarterly basis during each of the first three quarters of the fiscal year, we do recognize changes in markdown reserves as those amounts can be estimated on a quarterly basis.
Accounting for business combinations requires that assets and liabilities, including inventories, are recorded at fair value at the acquisition date. In accordance with GAAP, the definition of fair value of inventories acquired generally will equal the expected sales price less certain costs associated with selling the inventory, which may exceed the actual cost of producing the acquired inventories. Based on the inventory turn of the acquired inventories, amounts are recognized as additional cost of goods sold in the periods subsequent to the acquisition as the acquired inventory is sold in the ordinary course of business. In determining the fair value of the acquired inventory, as well as the appropriate period to recognize the charge in our consolidated statements of operations as the acquired inventory is sold, we must make certain assumptions regarding costs incurred prior to acquisition for the acquired inventory, an appropriate profit allowance, estimates of the costs to sell the inventory and the timing of the sale of the acquired inventory. Such estimates involve significant uncertainty, and the use of different assumptions could have a material impact on our consolidated financial statements.
Goodwill and Intangible Assets, net
The cost of each acquired business is allocated to the individual tangible and intangible assets acquired and liabilities assumed or incurred as a result of the acquisition based on their estimated fair values. The assessment of the estimated fair values of assets and liabilities acquired requires us to make certain assumptions regarding the use of the acquired assets, anticipated cash flows, probabilities of cash flows, discount rates and other factors. As a result of our prior acquisitions, significant intangible assets and goodwill were acquired resulting in
$176 million
of intangible assets and
$67 million
of goodwill in our consolidated balance sheet as of
February 2, 2019
.
Our intangibles assets primarily consist of trademarks, reacquired rights and customer relationships. Goodwill is recognized as the amount by which the cost to acquire a company or group of assets exceeds the fair value of assets acquired less any liabilities assumed at acquisition. See Note 4 in our consolidated financial statements included in this report for further details about our various intangible assets and goodwill amounts.
65
The fair values and useful lives of these acquired intangible assets and goodwill are estimated based on our assessment as well as independent third party appraisals in some cases. Such valuations, which are dependent upon a number of uncertain factors, may include a discounted cash flow analysis of anticipated revenues and expenses or cost savings resulting from the acquired intangible asset using an estimate of a risk-adjusted market-based cost of capital as the discount rate. The valuation of intangible assets and goodwill requires significant judgment due to the variety of uncertain factors, including planned use of the intangible assets as well as estimates of net sales, royalty income, operating income, growth rates, royalty rates for the trademarks, discount rates and income tax rates, among other factors. The use of different assumptions related to these uncertain factors at acquisition or a later date could result in a material change to the amounts of intangible assets and goodwill initially recorded at acquisition, which could result in a material impact on our consolidated financial statements.
Trademarks with indefinite lives and goodwill are not amortized but instead evaluated, either qualitatively or quantitatively, for impairment annually as of the first day of the fourth quarter of our fiscal year or more frequently if events or circumstances indicate that the intangible asset or goodwill might be impaired. The evaluation of the recoverability of trademarks with indefinite lives and goodwill includes valuations based on a discounted cash flow analysis which is typically similar to the analysis performed at acquisition. This approach is dependent upon a number of uncertain factors, including those used in the initial valuation of the intangible assets and goodwill listed above. Such estimates involve significant uncertainty, and if our plans or anticipated results change, the impact on our financial statements could be significant. If this analysis indicates an impairment of a trademark with an indefinite useful life, the amount of the impairment is recognized in the consolidated financial statements based on the amount that the carrying value exceeds the estimated fair value of the asset.
Amortization of intangible assets with finite lives, which primarily consist of trademarks, reacquired rights and customer relationships, is recognized over their estimated useful lives using the straight line method of amortization or another method of amortization that reflects the pattern in which the economic benefits of the intangible assets are consumed or otherwise realized. We amortize our intangible assets with finite lives for periods of up to 20 years. The determination of an appropriate useful life for amortization is based on the remaining contractual period, as applicable, our plans for the intangible asset as well as factors outside of our control, including expected customer attrition. Intangible assets with finite lives are reviewed for impairment periodically if events or changes in circumstances indicate that the carrying amount may not be recoverable. If expected future discounted cash flows from operations are less than their carrying amounts, an asset is determined to be impaired and a loss is recorded for the amount by which the carrying value of the asset exceeds its fair value. Amortization related to intangible assets with finite lives totaled
$3 million
during
Fiscal 2018
and is anticipated to be approximately
$1 million
in Fiscal
2019
.
Goodwill is quantitatively evaluated for possible impairment by comparing the estimated fair value of the goodwill to its carrying value. The quantitative test includes valuations of each applicable underlying business using fair value techniques and market comparables, which may include a discounted cash flow analysis or an independent appraisal. Significant estimates, some of which may be very subjective, considered in such a discounted cash flow analysis are future cash flow projections of the business, a risk-adjusted market-based cost of capital as the discount rate, income tax rates and other assumptions. The estimates and assumptions included in the evaluation of the recoverability of goodwill involve significant uncertainty, and if our plans or anticipated results change, the impact on our financial statements could be significant. If an annual or interim analysis indicates an impairment of goodwill balances, the impairment is recognized in our consolidated financial statements as the amount that the carrying value of the goodwill exceeds the estimated fair value of the goodwill.
Intangible assets and goodwill acquired in recent transactions are naturally more susceptible to impairment, primarily since they are recorded at fair value based on recent operating plans and macroeconomic conditions present at the time of acquisition. Consequently, if operating results, plans for the acquired business and/or macroeconomic conditions change after an acquisition, it could result in the impairment of the acquired assets. A change in macroeconomic conditions may not only impact the estimated operating cash flows used in our cash flow models but may also impact other assumptions used in our analysis, including but not limited to, the risk-adjusted market-based cost of capital and/or discount rates. Additionally, we are required to ensure that assumptions used to determine fair value in our analyses are consistent with the assumptions a hypothetical market participant would use. Therefore, the cost of capital discount rates used in our analyses may increase or decrease based on market conditions and trends regardless of whether our actual cost of capital changed. As we acquired Southern Tide in Fiscal 2016 and TBBC in Fiscal 2017 and recorded a significant amount of intangible assets and goodwill related to these acquisitions, those assets recognized are more sensitive to changes in assumptions than our other intangible assets and goodwill amounts.
In
Fiscal 2018
,
Fiscal 2017
and
Fiscal 2016
, no impairment charges related to intangible assets or goodwill were recognized.
Other Fair Value Measurements
66
For many assets and liabilities, the determination of fair value may not require the use of many assumptions or other estimates. However, in some cases the assumptions or inputs associated with the determination of fair value as of a measurement date may require the use of many assumptions and may be internally derived or otherwise unobservable. We utilize certain market-based and internally derived information and make assumptions about the information in (1) determining the fair values of assets and liabilities acquired as part of a business combination, (2) adjusting recognized assets and liabilities to fair value and (3) assessing recognized assets for impairment, including intangible assets, goodwill and property and equipment.
As noted above, the cost of each acquired business is allocated to the individual tangible and intangible assets acquired and liabilities assumed or incurred as a result of the acquisition based on its estimated fair value. The assessment of the estimated fair values of assets and liabilities acquired requires us to make certain assumptions regarding the use of the acquired assets, anticipated cash flows, probabilities of cash flows, discount rates and other factors. To the extent information to revise the allocation becomes available during the allocation period the allocation of the purchase price will be adjusted. Should information become available after the allocation period indicating that adjustments to the allocation are appropriate, those adjustments will be included in operating results.
For the determination of fair value for assets and liabilities acquired as part of a business combination, adjusting recognized assets and liabilities to fair value and assessing, and possibly adjusting, recognized assets for impairment, the assumptions, or the timing of changes in these assumptions, that we make regarding the valuation of these assets could differ significantly from the assumptions made by other parties. The use of different assumptions could result in materially different valuations for the respective assets and liabilities, which would impact our consolidated financial statements.
In connection with certain acquisitions, we have entered into contingent consideration arrangements to compensate the sellers if certain targets are achieved. For a contingent consideration arrangement as of the date of acquisition we must determine the fair value of the contingent consideration which would estimate the discounted fair value of any expected payments. Such valuation requires assumptions regarding anticipated cash flows, probabilities of cash flows, discount rates and other factors, each requiring a significant amount of judgment. Subsequent to the date of acquisition, we are required to periodically adjust the liability for the contingent consideration to reflect the fair value of the contingent consideration by reassessing any valuation assumptions as of the balance sheet date.
From time to time, we may recognize obligations related to certain leased space associated with exiting retail or office space. In these cases, we must determine the net loss related to the space if the anticipated cash outflows for the space exceed the estimated cash inflows related to the space. While estimated cash outflows are generally known since there is an underlying lease, the estimated cash inflows for sublease rental income and other costs are often very subjective if there is not a sub-lease agreement in place at that time since those amounts are dependent upon many factors including, but not limited to, whether a sub-tenant will be obtained, the time required to obtain the sub-tenant as well as the rent payments and any tenant allowances agreed with the sub-tenant as part of the future lease negotiations. Also, it is possible that we could negotiate a lease termination in the future that would differ from the amount of the required payments pursuant to the lease agreement. Thus, our estimate of a liability related to a lease obligation could change significantly as we obtain better information in the future or if our current assumptions do not materialize. The assumptions made by another party related to such leases could be different than the assumptions made by us.
Income Taxes
We recognize deferred tax assets to the extent we believe it is more likely than not that these assets will be realized. In making such a determination, we consider all available positive and negative evidence, including future reversals of existing taxable temporary differences, projected future taxable income, taxable income in carryback years, tax-planning strategies, and results of recent operations. Valuation allowances are established when we determine that it is more-likely-than-not that some portion or all of a deferred tax asset will not be realized.
Valuation allowances, which total
$5 million
as of
February 2, 2019
, are analyzed periodically and adjusted as events occur or circumstances change that would indicate adjustments to the valuation allowances are appropriate. Valuation allowance amounts could have a material impact on our consolidated statements of operations in the future if assumptions related to realizability of the deferred tax assets changed significantly. Additionally, the timing of recognition of a valuation allowance or any reversal of a valuation allowance requires a significant amount of judgment to assess all the positive and negative evidence, particularly when operating results in the respective jurisdiction have changed or are expected to change from losses to income or from income to losses. As realization of deferred tax assets and liabilities is dependent upon future taxable income in specific jurisdictions, changes in tax laws and rates and shifts in the amount of taxable income among state and foreign jurisdictions may have a significant impact on the amount of benefit ultimately realized for deferred tax assets and liabilities.
67
As a global company, we are subject to income taxes in a number of domestic and foreign jurisdictions. Therefore, our income tax provision involves many uncertainties due to not only the timing differences of income for financial statement reporting and tax return reporting, but also the application of complex tax laws and regulations, which are subject to interpretation and judgment. The use of different assumptions or a change in our assumptions related to book to tax timing differences, our determination of whether foreign investments or earnings are permanently reinvested, the ability to realize uncertain tax positions, the appropriateness of valuation allowances, a reduction in valuation allowances or other considerations, transfer pricing practices, the impact of our tax planning strategies and the jurisdictions or significance of earnings in future periods each could have a significant impact on our income tax rate. Additionally, factors impacting income taxes, including changes in tax laws or interpretations, court case decisions, statute of limitation expirations or audit settlements, could have a significant impact on our income tax rate. An increase in our consolidated income tax rate from
24.9%
to 25.9% during
Fiscal 2018
would have reduced net earnings by $1 million.
Income tax expense recorded during interim periods is generally based on the expected tax rate for the year, considering projections of earnings and book to tax differences as of the balance sheet date, subject to certain limitations associated with separate foreign jurisdiction losses in interim periods. The tax rate ultimately realized for the year may increase or decrease due to actual operating results or book to tax differences varying from the amounts on which our interim calculations were based. Any changes in assumptions related to the need for a valuation allowance, the ability to realize an uncertain tax position, changes in enacted tax rates, the expected operating results in total or by jurisdiction for the year, or other assumptions are accounted for in the period in which the change occurs. As certain of our foreign operations are in a loss position and realization of a future benefit for the losses is uncertain, a significant variance in losses in such jurisdictions from our expectations can have a significant impact on our expected annual tax rate. The recognition of the benefit of losses expected to be realized may be limited in an interim period and may require adjustments to tax expense in the interim period that yield an effective tax rate for the interim period that is not representative of the expected tax rate for the full year.
See Note 8 in our consolidated financial statements included in this report for further discussion of income taxes, including the impact of U.S. Tax Reform.
RECENT ACCOUNTING PRONOUNCEMENTS
Refer to Note 1 in our consolidated financial statements included in this report for a discussion of recent accounting pronouncements issued by the FASB that we have not yet adopted that may have a material affect on our financial position, results of operations or cash flows.
SEASONALITY
Each of our operating groups is impacted by seasonality as the demand by specific product or style, as well as by distribution channel, may vary significantly depending on the time of year. For information regarding the impact of seasonality on individual operating groups and for our total company, see Part I, Item 1, Business, included in this report.
Item 7A.
Quantitative and Qualitative Disclosures About Market Risk
Interest Rate Risk
We are exposed to market risk from changes in interest rates on our indebtedness, which could impact our financial condition and results of operations in future periods. We may attempt to limit the impact of interest rate changes on earnings and cash flow, primarily through a mix of variable-rate and fixed-rate debt, although at times all of our debt may be either variable-rate or fixed-rate debt. Further, at times we may enter into interest rate swap arrangements related to certain of our variable-rate debt in order to fix the interest rate if we determine that our exposure to interest rate changes is higher than optimal. Our assessment also considers our need for flexibility in our borrowing arrangements resulting from the seasonality of our business, anticipated future cash flows and our expectations about the risk of future interest rate changes, among other factors. We continuously monitor interest rates to consider the sources and terms of our borrowing facilities in order to determine whether we have achieved our interest rate management objectives. We do not enter into debt agreements or interest rate hedging transactions on a speculative basis.
As of
February 2, 2019
, all of our
$13 million
of debt outstanding was subject to variable interest rates. Our U.S. Revolving Credit Agreement accrues interest based on variable interest rates while providing the necessary borrowing flexibility we require due to the seasonality of our business and our need to fund certain product purchases with trade letters of credit. During
Fiscal 2018
, our interest expense was
$2 million
. Based on the average amount of variable-rate debt outstanding in
Fiscal 2018
, a 100 basis point increase in interest rates would not have increased our interest expense materially. To the
68
extent that the amounts outstanding under our variable-rate lines of credit increase or decrease, our exposure to changes in interest rates would also change.
While we anticipate that our average borrowings in Fiscal 2019 will be lower than our average borrowings in Fiscal 2017, we anticipate that a greater proportion of our borrowings will be at a higher effective interest rate due to the lower borrowings reducing our ability to lock into longer maturity, lower rate borrowing options. Additionally, for the amounts of unused credit under the U.S. Revolving Credit Agreement we pay unused line fees, which partially offset the interest expense impact of the lower average borrowings. Considering these two factors we expect our interest expense, including interest, unused lines fees and amortization of deferred financing costs, in the aggregate, to be approximately $2 million in Fiscal 2019.
Foreign Currency Risk
To the extent that we have assets, liabilities, revenues or expenses denominated in foreign currencies that are not hedged, we are subject to foreign currency transaction and translation gains and losses. As of
February 2, 2019
, our foreign currency exchange risk exposure primarily results from transactions of our businesses operating outside of the United States, which is primarily related to (1) our Tommy Bahama operations in Canada, Australia and Japan purchasing goods in U.S. dollars or other currencies which are not the functional currency of the business and (2) certain other transactions, including intercompany transactions.
Substantially all of our net sales and our inventory purchases from our contract manufacturers in
Fiscal 2018
were denominated in U.S. dollars. Purchase prices for our products may be impacted by fluctuations in the exchange rate between the U.S. dollar and the local currencies of the contract manufacturers, which may have the effect of increasing our cost of goods sold in the future even though our inventory is purchased on a U.S. dollar arrangement. Additionally, to the extent that the exchange rate between the U.S. dollar and the currency that the inventory will be sold in (e.g. the Canadian dollar, Australian dollar or Japanese Yen) changes, the gross margins of those businesses could be impacted significantly, particularly if we are not able to increase sales prices to our customers.
We may enter into short-term forward foreign currency exchange contracts in the ordinary course of business to mitigate a portion of the risk associated with foreign currency exchange rate fluctuations related to purchases of inventory or selling goods in currencies other than the functional currencies by certain of our foreign operations. As of
February 2, 2019
, we were not a party to any foreign currency forward exchange contracts. Due to the limited magnitude and the uncertainty about timing of foreign currency cash flows provided by or used in our international operations, we have not historically entered into forward foreign currency exchange contracts for our continuing operations. However, if our international operations expand, it may be appropriate in the future to enter into hedging arrangements for certain operations. At this time, we do not anticipate that the impact of foreign currency changes on our international operations would have a material impact on our operating income or our net earnings in the near term given the proportion of our operations in international markets.
In addition to foreign currency risks related to specific transactions listed above, we also have foreign currency exposure risk associated with translating the financial statements of our foreign operations with a functional currency other than the U.S. dollar into U.S. dollars for financial reporting purposes. A strengthening U.S. dollar could result in lower levels of sales and earnings in our consolidated statements of operations in future periods although the sales and earnings in the foreign currencies could be equal to or greater than amounts as reported in the prior year. Alternatively, if foreign operations have operating losses, then a strengthening U.S. dollar could result in lower losses although the losses in foreign currencies could be equal to or greater than amounts as previously reported. As of
February 2, 2019
, accumulated other comprehensive loss in our consolidated balance sheets related to our Canada, Australia and Japan investments and operations were $3 million, $1 million and $1 million, respectively.
We view our foreign investments as long term and we generally do not hedge such foreign investments. Also, we do not hold or issue any derivative financial instruments related to foreign currency exposure for speculative purposes.
Commodity and Inflation Risk
We are affected by inflation and changing prices through the purchase of full-package finished goods from contract manufacturers, who manufacture products consisting of various raw material components. Inflation/deflation risks are managed by each operating group, when possible, through negotiating product prices in advance, selective price increases and cost containment initiatives. We have not historically entered into significant long-term sales or purchase contracts or engaged in hedging activities with respect to our commodity risk.
69
Item 8.
Financial Statements and Supplementary Data
|
OXFORD INDUSTRIES, INC.
CONSOLIDATED BALANCE SHEETS
($ in thousands, except par amounts)
|
||||||
|
February 2, 2019
|
February 3, 2018
|
|||||
|
ASSETS
|
|
|
||||
|
Current Assets
|
|
|
||||
|
Cash and cash equivalents
|
$
|
8,327
|
|
$
|
6,343
|
|
|
Receivables, net
|
69,037
|
|
67,542
|
|
||
|
Inventories, net
|
160,656
|
|
126,812
|
|
||
|
Prepaid expenses and other current assets
|
31,768
|
|
35,421
|
|
||
|
Total Current Assets
|
$
|
269,788
|
|
$
|
236,118
|
|
|
Property and equipment, net
|
192,576
|
|
193,533
|
|
||
|
Intangible assets, net
|
176,176
|
|
178,858
|
|
||
|
Goodwill
|
66,621
|
|
66,703
|
|
||
|
Other non-current assets, net
|
22,093
|
|
24,729
|
|
||
|
Total Assets
|
$
|
727,254
|
|
$
|
699,941
|
|
|
LIABILITIES AND SHAREHOLDERS' EQUITY
|
|
|
||||
|
Current Liabilities
|
|
|
||||
|
Accounts payable
|
$
|
81,612
|
|
$
|
68,267
|
|
|
Accrued compensation
|
24,226
|
|
29,941
|
|
||
|
Other accrued expenses and liabilities
|
36,371
|
|
36,802
|
|
||
|
Total Current Liabilities
|
$
|
142,209
|
|
$
|
135,010
|
|
|
Long-term debt
|
12,993
|
|
45,809
|
|
||
|
Other non-current liabilities
|
75,286
|
|
74,029
|
|
||
|
Deferred taxes
|
18,411
|
|
15,269
|
|
||
|
Commitments and contingencies
|
|
|
||||
|
Shareholders' Equity
|
|
|
||||
|
Common stock, $1.00 par value per share
|
16,959
|
|
16,839
|
|
||
|
Additional paid-in capital
|
142,976
|
|
136,664
|
|
||
|
Retained earnings
|
323,515
|
|
280,395
|
|
||
|
Accumulated other comprehensive loss
|
(5,095
|
)
|
(4,074
|
)
|
||
|
Total Shareholders' Equity
|
$
|
478,355
|
|
$
|
429,824
|
|
|
Total Liabilities and Shareholders' Equity
|
$
|
727,254
|
|
$
|
699,941
|
|
See accompanying notes.
70
|
OXFORD INDUSTRIES, INC.
CONSOLIDATED STATEMENTS OF OPERATIONS
($ and shares in thousands, except per share amounts)
|
|||||||||
|
Fiscal
2018 |
Fiscal
2017 |
Fiscal
2016 |
|||||||
|
Net sales
|
$
|
1,107,466
|
|
$
|
1,086,211
|
|
$
|
1,022,588
|
|
|
Cost of goods sold
|
470,342
|
|
473,579
|
|
442,284
|
|
|||
|
Gross profit
|
$
|
637,124
|
|
$
|
612,632
|
|
$
|
580,304
|
|
|
SG&A
|
560,508
|
|
540,517
|
|
504,600
|
|
|||
|
Royalties and other operating income
|
13,976
|
|
13,885
|
|
14,180
|
|
|||
|
Operating income
|
$
|
90,592
|
|
$
|
86,000
|
|
$
|
89,884
|
|
|
Interest expense, net
|
2,283
|
|
3,109
|
|
3,421
|
|
|||
|
Earnings from continuing operations before income taxes
|
$
|
88,309
|
|
$
|
82,891
|
|
$
|
86,463
|
|
|
Income taxes
|
22,018
|
|
18,190
|
|
31,964
|
|
|||
|
Net earnings from continuing operations
|
$
|
66,291
|
|
$
|
64,701
|
|
$
|
54,499
|
|
|
Income (loss) from discontinued operations, net of taxes
|
—
|
|
389
|
|
(2,038
|
)
|
|||
|
Net earnings
|
$
|
66,291
|
|
$
|
65,090
|
|
$
|
52,461
|
|
|
Net earnings from continuing operations per share:
|
|
|
|||||||
|
Basic
|
$
|
3.97
|
|
$
|
3.90
|
|
$
|
3.30
|
|
|
Diluted
|
$
|
3.94
|
|
$
|
3.87
|
|
$
|
3.27
|
|
|
Income (loss) from discontinued operations, net of taxes, per share:
|
|
|
|
||||||
|
Basic
|
$
|
—
|
|
$
|
0.02
|
|
$
|
(0.12
|
)
|
|
Diluted
|
$
|
—
|
|
$
|
0.02
|
|
$
|
(0.12
|
)
|
|
Net earnings per share:
|
|
|
|
||||||
|
Basic
|
$
|
3.97
|
|
$
|
3.92
|
|
$
|
3.18
|
|
|
Diluted
|
$
|
3.94
|
|
$
|
3.89
|
|
$
|
3.15
|
|
|
Weighted average shares outstanding:
|
|
|
|||||||
|
Basic
|
16,678
|
|
16,600
|
|
16,522
|
|
|||
|
Diluted
|
16,842
|
|
16,734
|
|
16,649
|
|
|||
|
Dividends declared per share
|
$
|
1.36
|
|
$
|
1.08
|
|
$
|
1.08
|
|
See accompanying notes.
71
|
OXFORD INDUSTRIES, INC.
CONSOLIDATED STATEMENTS OF COMPREHENSIVE INCOME
($ in thousands)
|
|||||||||
|
Fiscal
2018 |
Fiscal
2017 |
Fiscal
2016 |
|||||||
|
Net earnings
|
$
|
66,291
|
|
$
|
65,090
|
|
$
|
52,461
|
|
|
Other comprehensive (loss) income, net of taxes:
|
|
|
|
||||||
|
Foreign currency translation adjustment
|
(1,021
|
)
|
1,202
|
|
1,553
|
|
|||
|
Comprehensive income
|
$
|
65,270
|
|
$
|
66,292
|
|
$
|
54,014
|
|
See accompanying notes.
72
|
OXFORD INDUSTRIES, INC.
CONSOLIDATED STATEMENTS OF SHAREHOLDERS' EQUITY
($ in thousands)
|
|||||||||||||||
|
Common
Stock
|
Additional
Paid-In
Capital
|
Retained
Earnings
|
Accumulated
Other
Comprehensive
(Loss) Income
|
Total
|
|||||||||||
|
January 30, 2016
|
$
|
16,601
|
|
$
|
125,477
|
|
$
|
199,151
|
|
$
|
(6,829
|
)
|
$
|
334,400
|
|
|
Net earnings and other comprehensive income
|
—
|
|
—
|
|
52,461
|
|
1,553
|
|
54,014
|
|
|||||
|
Shares issued under equity plans
|
196
|
|
1,061
|
|
—
|
|
—
|
|
1,257
|
|
|||||
|
Compensation expense for equity awards
|
—
|
|
6,445
|
|
—
|
|
—
|
|
6,445
|
|
|||||
|
Repurchase of shares
|
(28
|
)
|
(1,839
|
)
|
—
|
|
—
|
|
(1,867
|
)
|
|||||
|
Cash dividends declared and paid
|
—
|
|
—
|
|
(18,119
|
)
|
—
|
|
(18,119
|
)
|
|||||
|
January 28, 2017
|
$
|
16,769
|
|
$
|
131,144
|
|
$
|
233,493
|
|
$
|
(5,276
|
)
|
$
|
376,130
|
|
|
Net earnings and other comprehensive income
|
—
|
|
—
|
|
65,090
|
|
1,202
|
|
66,292
|
|
|||||
|
Shares issued under equity plans
|
110
|
|
1,273
|
|
—
|
|
—
|
|
1,383
|
|
|||||
|
Compensation expense for equity awards
|
—
|
|
6,413
|
|
—
|
|
—
|
|
6,413
|
|
|||||
|
Repurchase of shares
|
(40
|
)
|
(2,166
|
)
|
—
|
|
—
|
|
(2,206
|
)
|
|||||
|
Cash dividends declared and paid
|
—
|
|
—
|
|
(18,188
|
)
|
—
|
|
(18,188
|
)
|
|||||
|
February 3, 2018
|
$
|
16,839
|
|
$
|
136,664
|
|
$
|
280,395
|
|
$
|
(4,074
|
)
|
$
|
429,824
|
|
|
Net earnings and other comprehensive income (loss)
|
—
|
|
—
|
|
66,291
|
|
(1,021
|
)
|
65,270
|
|
|||||
|
Shares issued under equity plans
|
150
|
|
1,306
|
|
—
|
|
—
|
|
1,456
|
|
|||||
|
Compensation expense for equity awards
|
—
|
|
7,327
|
|
—
|
|
—
|
|
7,327
|
|
|||||
|
Repurchase of shares
|
(30
|
)
|
(2,321
|
)
|
—
|
|
—
|
|
(2,351
|
)
|
|||||
|
Cash dividends declared and paid
|
—
|
|
—
|
|
(23,054
|
)
|
—
|
|
(23,054
|
)
|
|||||
|
Cumulative effect of change in accounting standard
|
—
|
|
—
|
|
(117
|
)
|
—
|
|
(117
|
)
|
|||||
|
February 2, 2019
|
$
|
16,959
|
|
$
|
142,976
|
|
$
|
323,515
|
|
$
|
(5,095
|
)
|
$
|
478,355
|
|
See accompanying notes.
73
|
OXFORD INDUSTRIES, INC.
CONSOLIDATED STATEMENTS OF CASH FLOWS
($ in thousands)
|
|||||||||
|
Fiscal 2018
|
Fiscal 2017
|
Fiscal 2016
|
|||||||
|
Cash Flows From Operating Activities:
|
|
|
|
||||||
|
Net earnings
|
$
|
66,291
|
|
$
|
65,090
|
|
$
|
52,461
|
|
|
Adjustments to reconcile net earnings to cash provided by operating activities:
|
|
|
|||||||
|
Depreciation
|
39,880
|
|
39,998
|
|
40,069
|
|
|||
|
Amortization of intangible assets
|
2,610
|
|
2,404
|
|
2,150
|
|
|||
|
Equity compensation expense
|
7,327
|
|
6,413
|
|
6,445
|
|
|||
|
Amortization of deferred financing costs
|
424
|
|
431
|
|
693
|
|
|||
|
Change in fair value of contingent consideration
|
970
|
|
—
|
|
—
|
|
|||
|
Deferred income taxes
|
2,927
|
|
1,817
|
|
7,880
|
|
|||
|
Changes in working capital, net of acquisitions and dispositions, if any:
|
|
|
|||||||
|
Receivables, net
|
(1,560
|
)
|
(8,270
|
)
|
7,377
|
|
|||
|
Inventories, net
|
(36,518
|
)
|
19,504
|
|
4,222
|
|
|||
|
Prepaid expenses and other current assets
|
5,848
|
|
(10,479
|
)
|
(1,799
|
)
|
|||
|
Current liabilities
|
5,081
|
|
1,287
|
|
434
|
|
|||
|
Other balance sheet changes
|
3,097
|
|
398
|
|
(1,367
|
)
|
|||
|
Cash provided by operating activities
|
$
|
96,377
|
|
$
|
118,593
|
|
$
|
118,565
|
|
|
Cash Flows From Investing Activities:
|
|
|
|||||||
|
Acquisitions, net of cash acquired
|
(354
|
)
|
(15,529
|
)
|
(95,046
|
)
|
|||
|
Purchases of property and equipment
|
(37,043
|
)
|
(38,748
|
)
|
(49,415
|
)
|
|||
|
Other investing activities
|
—
|
|
—
|
|
(2,030
|
)
|
|||
|
Cash used in investing activities
|
$
|
(37,397
|
)
|
$
|
(54,277
|
)
|
$
|
(146,491
|
)
|
|
Cash Flows From Financing Activities:
|
|
|
|||||||
|
Repayment of revolving credit arrangements
|
(290,526
|
)
|
(295,326
|
)
|
(430,995
|
)
|
|||
|
Proceeds from revolving credit arrangements
|
257,710
|
|
249,625
|
|
478,529
|
|
|||
|
Deferred financing costs paid
|
—
|
|
—
|
|
(1,438
|
)
|
|||
|
Proceeds from issuance of common stock
|
1,456
|
|
1,383
|
|
1,257
|
|
|||
|
Repurchase of stock awards for employee tax withholding liabilities
|
(2,351
|
)
|
(2,206
|
)
|
(1,867
|
)
|
|||
|
Cash dividends declared and paid
|
(23,054
|
)
|
(18,188
|
)
|
(18,119
|
)
|
|||
|
Cash (used in) provided by financing activities
|
$
|
(56,765
|
)
|
$
|
(64,712
|
)
|
$
|
27,367
|
|
|
Net change in cash and cash equivalents
|
$
|
2,215
|
|
$
|
(396
|
)
|
$
|
(559
|
)
|
|
Effect of foreign currency translation on cash and cash equivalents
|
(231
|
)
|
407
|
|
568
|
|
|||
|
Cash and cash equivalents at the beginning of year
|
6,343
|
|
6,332
|
|
6,323
|
|
|||
|
Cash and cash equivalents at the end of year
|
$
|
8,327
|
|
$
|
6,343
|
|
$
|
6,332
|
|
|
Supplemental disclosure of cash flow information:
|
|
|
|||||||
|
Cash paid for interest, net
|
$
|
2,108
|
|
$
|
2,773
|
|
$
|
2,626
|
|
|
Cash paid for income taxes
|
$
|
13,609
|
|
$
|
20,653
|
|
$
|
29,872
|
|
See accompanying notes.
74
OXFORD INDUSTRIES, INC.
NOTES TO CONSOLIDATED FINANCIAL STATEMENTS
February 2, 2019
Note 1. Summary of Significant Accounting Policies
Principal Business Activity
We are a global apparel company that designs, sources, markets and distributes products bearing the trademarks of our Tommy Bahama®, Lilly Pulitzer® and Southern Tide® lifestyle brands and other owned and licensed brands as well as private label apparel products. We distribute our owned lifestyle branded products through our direct to consumer channel, consisting of retail stores and e-commerce sites, and our wholesale distribution channel, which includes better department stores, specialty stores and multi-branded e-commerce retailers. Additionally, we operate Tommy Bahama restaurants, including Marlin Bars, generally adjacent to a Tommy Bahama retail store location. Our branded and private label apparel products of Lanier Apparel are distributed through department stores, national chains, warehouse clubs, specialty stores, specialty catalogs, and multi-branded e-commerce retailers.
Fiscal Year
We operate and report on a 52/53 week fiscal year. Our fiscal year ends on the Saturday closest to January 31. As used in our consolidated financial statements, the terms Fiscal 2016, Fiscal 2017, Fiscal 2018 and Fiscal 2019 reflect the
52
weeks ended
January 28, 2017
;
53
weeks ended
February 3, 2018
;
52
weeks ended
February 2, 2019
and 52 weeks ending February 1, 2020, respectively.
Principles of Consolidation
Our consolidated financial statements include the accounts of Oxford Industries, Inc. and any other entities in which we have a controlling financial interest, including our wholly-owned domestic and foreign subsidiaries, or variable interest entities for which we are the primary beneficiary. Generally, we consolidate businesses that we control through ownership of a majority voting interest. Additionally, there are situations in which consolidation is required even though the usual condition of consolidation (ownership of a majority voting interest) does not apply. In determining whether a controlling financial interest exists, we consider ownership of voting interests, as well as other rights of the investors which might indicate which investor is the primary beneficiary. The primary beneficiary has both the power to direct the activities of the entity that most significantly impact the entity's economic performance and the obligation to absorb losses or the right to receive benefits from the entity that could potentially be significant to the entity.
We account for investments in which we exercise significant influence, but do not control via voting rights and were determined to not be the primary beneficiary, using the equity method of accounting. Generally, we determine that we exercise significant influence over a corporation or a limited liability company when we own
20%
or more or
3%
or more, respectively, of the voting interests unless the facts and circumstances of that investment do not indicate that we have the ability to exhibit significant influence. Under the equity method of accounting, original investments are recorded at cost, and are subsequently adjusted for our contributions to, distributions from and share of income or losses of the entity. Our investments accounted for using the equity method of accounting are included in other non-current assets in our consolidated balance sheets, while the income or loss related to our investments accounted for using the equity method of accounting is included in royalties and other operating income in our consolidated statements of operations.
All significant intercompany accounts and transactions are eliminated in consolidation.
Business Combinations
The cost of each acquired business is allocated to the individual tangible and intangible assets acquired and liabilities assumed based on their estimated fair values. The assessment of the estimated fair values of assets and liabilities acquired requires us to make certain assumptions regarding the use of the acquired assets, anticipated cash flows, probabilities of cash flows, discount rates and other factors. Additionally, the definition of fair value of inventories acquired generally will equal the expected sales price less certain costs associated with selling the inventory, which may exceed the actual cost of the acquired inventories resulting in an inventory step-up to fair value at acquisition. The purchase price allocation may be revised during an allocation period as necessary when, and if, information becomes available to revise the fair values of the assets acquired and the liabilities assumed. The allocation period will not exceed
one year
from the date of the acquisition. Should information become available after the allocation period indicating that an adjustment to the purchase price allocation is appropriate, that adjustment will be included in our consolidated statements of operations. The results of operations of acquired businesses are included in our consolidated statements of operations from the respective dates of the acquisitions. Transaction costs related to
75
OXFORD INDUSTRIES, INC.
NOTES TO CONSOLIDATED FINANCIAL STATEMENTS (Continued)
Note 1. Summary of Significant Accounting Policies (Continued)
business combinations are included in SG&A in our consolidated statements of operations as incurred. Refer to Note 11 for additional disclosures related to business combinations.
Revenue Recognition and Receivables
In May 2014, the FASB issued guidance, as revised through supplemental guidance, which provided a single, comprehensive accounting model for revenue arising from contracts with customers. This new revenue recognition guidance superseded most of the prior revenue recognition guidance, which specified that revenue should be recognized when risks and rewards transfer to a customer. Under the new guidance, revenue is recognized at an amount that reflects the consideration expected to be received for those goods and services pursuant to a five-step approach: (1) identify the contracts with the customer; (2) identify the separate performance obligations in the contracts; (3) determine the transaction price; (4) allocate the transaction price to separate performance obligations; and (5) recognize revenue when, or as, each performance obligation is satisfied.
We adopted the revised revenue recognition guidance as of the first day of Fiscal 2018 using the modified retrospective method, applying the guidance only to contracts that were not completed prior to Fiscal 2018. There was no adjustment to retained earnings for the cumulative effect of applying the guidance upon adoption as there was no change in the timing or amount of revenue recognition for any of our revenue streams. Our accounting policies and practices for
Fiscal 2018
, pursuant to the new guidance, are discussed below, followed by a brief description of our historical accounting policies and practices for Fiscal 2017 and Fiscal 2016.
Our revenue consists of direct to consumer sales, including our retail store, e-commerce and restaurant operations, and wholesale sales, as well as royalty income, which is included in royalties and other income in our consolidated statements of operations. The table below quantifies the amount of net sales by distribution channel (in thousands) for each period presented.
|
Fiscal 2018
|
Fiscal 2017
|
Fiscal 2016
|
|||||||
|
Retail
|
$
|
439,556
|
|
$
|
427,439
|
|
$
|
411,390
|
|
|
E-commerce
|
239,034
|
|
205,475
|
|
184,686
|
|
|||
|
Restaurant
|
84,530
|
|
83,900
|
|
74,079
|
|
|||
|
Wholesale
|
341,615
|
|
366,123
|
|
349,196
|
|
|||
|
Other
|
2,731
|
|
3,274
|
|
3,237
|
|
|||
|
Net sales
|
$
|
1,107,466
|
|
$
|
1,086,211
|
|
$
|
1,022,588
|
|
Pursuant to the new revenue recognition guidance, in Fiscal 2018 we recognized revenue when performance obligations under the terms of the contracts with our customers were satisfied. Our performance obligations generally consist of delivering our products to our direct to consumer and wholesale customers. Control of the product is generally transferred upon providing the product to consumers in our bricks and mortar retail stores and restaurants, upon physical delivery of the products to consumers in our e-commerce operations and upon shipment from the distribution center to customers in our wholesale operations. Once control is transferred to the customer, we have completed our performance obligations related to the contract and have an unconditional right to consideration for the products sold as outlined in the contract. Our receivables resulting from contracts with customers in our direct to consumer operations are generally collected within a few days, upon settlement of the credit card transaction. Our receivables resulting from contracts with our customers in our wholesale operations are generally collected within one quarter, in accordance with established credit terms. All of our performance obligations under the terms of our contracts with customers in our direct to consumer and wholesale operations have an expected original duration of
one
year or less. Our revenue, including any freight income, is recognized net of applicable taxes in our consolidated statements of operations.
In our direct to consumer operations, consumers have certain rights to return product within a specified period and are eligible for certain point of sale discounts, thus retail store, e-commerce and restaurant revenues are recorded net of estimated returns and discounts, as applicable. The sales return allowance is recognized on a gross basis as a return liability for the amount of sales estimated to be returned and a return asset for the right to recover the product estimated to be returned by the customer. The value of inventory associated with a right to recover the goods returned are included in prepaid expenses and other current assets in our consolidated balance sheet as of
February 2, 2019
, whereas prior to Fiscal 2018 those amounts were included in inventories. The changes in the return liability are recognized in net sales in our consolidated statements of
76
OXFORD INDUSTRIES, INC.
NOTES TO CONSOLIDATED FINANCIAL STATEMENTS (Continued)
Note 1. Summary of Significant Accounting Policies (Continued)
operations and the changes in the return asset are recognized in cost of goods sold in our consolidated statements of operations for all periods presented.
In the ordinary course of our wholesale operations, we offer discounts, allowances and cooperative advertising support to some of our wholesale customers for certain products. Some of these arrangements are written agreements, while others may be implied by customary practices or expectations in the industry. Wholesale sales are recorded net of such discounts, allowances and cooperative advertising support for our customers, operational chargebacks and provisions for estimated wholesale returns. As certain allowances, other deductions and returns are not finalized until the end of a season, program or other event which may not have occurred yet, we estimate such discounts, allowances and returns on an ongoing basis to estimate the consideration from the customer that we expect to ultimately receive. We only recognize revenue to the extent that it is probable that we will not have a a significant reversal of revenue in a future period. Significant considerations in determining our estimates for discounts, allowances, operational chargebacks and returns for wholesale customers may include historical and current trends, agreements with customers, projected seasonal results, an evaluation of current economic conditions, specific program or product expectations and retailer performance. We record the discounts, returns and allowances as a reduction to net sales in our consolidated statements of operations and as a reduction to receivables, net in our consolidated balance sheets, with the estimated value of inventory expected to be returned in prepaid expenses and other current assets in our consolidated balance sheets as of
February 2, 2019
. As of
February 2, 2019
and
February 3, 2018
, reserve balances recorded as a reduction to receivables related to these items were
$6.6 million
and
$6.5 million
, respectively.
We extend credit to certain wholesale customers based on an evaluation of the customer's financial capacity and condition, usually without requiring collateral. In circumstances where we become aware of a specific wholesale customer's inability to meet its financial obligations, a specific reserve for bad debt is taken as a reduction to accounts receivable to reduce the net recognized receivable to the amount reasonably expected to be collected. Such amounts are written off at the time that the amounts are not considered collectible. For all other wholesale customers, we recognize estimated reserves for bad debts based on our historical collection experience, the financial condition of our customers, an evaluation of current economic conditions and anticipated trends, each of which is subjective and requires certain assumptions. We include such charges and write-offs in SG&A in our consolidated statements of operations and as a reduction to receivables, net in our consolidated balance sheets. As of
February 2, 2019
and
February 3, 2018
, bad debt reserve balances were
$0.7 million
and
$1.7 million
, respectively.
In addition to trade and other receivables, an income tax receivable of
$0.9 million
and
$5.3 million
is included in receivables, net in our consolidated balance sheet as of
February 2, 2019
and
February 3, 2018
, respectively. Substantially all other amounts recognized in receivables, net as of those dates represent receivables related to contracts with customers. As of
February 2, 2019
, prepaid expenses and other current assets included
$1.8 million
representing the estimated value of inventory for wholesale and direct to consumer sales returns, which was recognized in inventories in prior years pursuant to the previous guidance. An estimated sales return liability of
$3.3 million
for expected direct to consumer returns is classified in other accrued expenses and liabilities in our consolidated balance sheet as of
February 2, 2019
. We did not have any significant contract assets related to contracts with customers, other than receivables and the value of inventory associated with reserves for expected sales returns, as of
February 2, 2019
or
February 3, 2018
.
In addition to our estimated return amounts, our contract liabilities related to contracts with customers include gift cards and merchandise credits issued by us, which do not have an expiration date, but are redeemable on demand by the holder of the card. Historically, substantially all gift cards and merchandise credits are redeemed within
one
year of issuance. Gift cards and merchandise credits are recorded as a liability until our performance obligation is satisfied, which occurs when redeemed by the consumer, at which point revenue is recognized. However, we recognize estimated breakage income for certain gift cards and merchandise credits using the redemption recognition method, subject to applicable laws in certain states. Contract liabilities for gift cards purchased by consumers and merchandise credits received by customers but not yet redeemed, less any breakage income recognized to date, is included in other accrued expenses and liabilities in our consolidated balance sheets and totaled
$11.5 million
and
$9.9 million
as of
February 2, 2019
and
February 3, 2018
, respectively. Gift card breakage, which was not material in any period presented, is included in net sales in our consolidated statements of operations.
Royalties from the license of our owned brands, which are generally based on the greater of a percentage of the licensee's actual net sales or a contractually determined minimum royalty amount, are recognized over the period that licensees are provided access to our trademarks and benefit from such access through their sales. Payments are generally due quarterly, and depending on time of receipt, may be recorded as a liability until recognized as revenue. Royalty income is based upon the guaranteed minimum royalty obligations and adjusted as sales data, or estimates thereof, is received from licensees. Royalty income, which is included in royalties and other operating income in our consolidated statements of operations, were
$13.6 million
,
$13.5 million
and
$14.0 million
during
Fiscal 2018
,
Fiscal 2017
and
Fiscal 2016
, respectively.
77
OXFORD INDUSTRIES, INC.
NOTES TO CONSOLIDATED FINANCIAL STATEMENTS (Continued)
Note 1. Summary of Significant Accounting Policies (Continued)
Pursuant to the previous revenue recognition guidance, during Fiscal 2017 and Fiscal 2016, we considered revenue realized or realizable and earned when the following criteria were met: (1) persuasive evidence of an agreement existed, (2) delivery has occurred, (3) our price to the buyer was fixed or determinable and (4) collectibility was reasonably assured. Retail store, e-commerce and restaurant revenues were recognized at the time of sale to consumers, which was at the time of purchase for retail and restaurant transactions and the time of delivery to consumers for e-commerce sales. Retail store, e-commerce and restaurant revenues were recorded net of estimated returns and discounts, as applicable. In Fiscal 2017 and Fiscal 2016, for substantially all of our wholesale sales, our products were considered sold and delivered at the time of shipment from our distribution center and recorded net of related discounts, cooperative advertising support, operational chargebacks and provisions for estimated returns. As certain allowances and other deductions were not finalized until the end of a season, program or other event which may not have occurred yet, we estimated such discounts and allowances on an ongoing basis.
Cost of Goods Sold
We include in cost of goods sold all sourcing, procurement and other costs incurred prior to or in association with the receipt of finished goods at our distribution facilities, as well as freight from our warehouse to our own retail stores, wholesale customers and e-commerce consumers. The costs prior to receipt at our distribution facilities include product cost, inbound freight charges, import costs, purchasing costs, internal transfer costs, direct labor, manufacturing overhead, insurance, duties, brokers' fees, consolidators' fees and depreciation and amortization expense associated with our manufacturing, sourcing and procurement operations. We generally classify amounts billed to customers for freight in net sales, and classify freight costs in cost of goods sold in our consolidated statements of operations. Our gross profit and gross margins may not be directly comparable to those of our competitors, as statement of operations classifications of certain expenses may vary by company.
SG&A
We include in SG&A costs incurred subsequent to the receipt of finished goods at our distribution facilities, such as the cost of inspection, stocking, warehousing, picking and packing, and all costs associated with the operations of our retail stores, e-commerce sites, restaurants and concessions, such as labor, occupancy costs, store and restaurant pre-opening costs (including rent, marketing, store set-up costs and training expenses) and other fees. SG&A also includes product design costs, selling costs, royalty expense, advertising, promotion and marketing expenses, professional fees, other general and administrative expenses, our corporate overhead costs and amortization of intangible assets.
Distribution network costs, including costs associated with preparing goods to ship to customers and our costs to operate our distribution facilities, are included as a component of SG&A. We consider distribution network costs to be the costs associated with operating our distribution centers, as well as the costs paid to third parties who perform those services for us. In
Fiscal 2018
,
Fiscal 2017
and
Fiscal 2016
, distribution network costs included in SG&A totaled
$27.6 million
,
$25.0 million
and
$23.6 million
, respectively.
All costs associated with advertising, promotion and marketing of our products are expensed during the period when the advertisement is first shown. Costs associated with cooperative advertising programs under which we agree to make general contributions to our wholesale customers' advertising and promotional funds are generally recorded as a reduction to net sales as recognized. Advertising, promotion and marketing expenses recognized in SG&A, including employment costs for our advertising and marketing employees, for
Fiscal 2018
,
Fiscal 2017
and
Fiscal 2016
were
$63.6 million
,
$55.2 million
and
$53.0 million
, respectively. Prepaid advertising, promotion and marketing expenses included in prepaid expenses in our consolidated balance sheets as of
February 2, 2019
and
February 3, 2018
were
$4.6 million
and
$8.6 million
, respectively.
Royalty expense related to our license of third party brands, which are generally based on the greater of a percentage of our actual net sales for the brand or a contractually determined minimum royalty amount, are recorded based upon the guaranteed minimum levels and adjusted based on net sales of the licensed products, as appropriate. In some cases, we may be required to make certain up-front payments for the license rights, which are deferred and recognized as royalty expense over the term of the license agreement. Royalty expenses recognized as SG&A in
Fiscal 2018
,
Fiscal 2017
and
Fiscal 2016
were
$6.4 million
,
$6.0 million
and
$4.8 million
, respectively.
78
OXFORD INDUSTRIES, INC.
NOTES TO CONSOLIDATED FINANCIAL STATEMENTS (Continued)
Note 1. Summary of Significant Accounting Policies (Continued)
Cash and Cash Equivalents
We consider cash equivalents to be short-term investments with original maturities of three months or less for purposes of our consolidated statements of cash flows.
Inventories, net
Substantially all of our inventories are finished goods inventories of apparel, accessories, footwear and related products. Inventories are valued at the lower of cost or market.
For operating group reporting, inventory is carried at the lower of FIFO cost or market. We evaluate the composition of our inventories for identification of distressed inventory at least quarterly. In performing this evaluation, we consider slow-turning products, an indication of lack of consumer acceptance of particular products, prior-seasons' fashion products, broken assortments, and current levels of replenishment program products as compared to expected sales. We estimate the amount of goods that we will not be able to sell in the normal course of business and write down the value of these goods as necessary. As the amount to be ultimately realized for the goods is not necessarily known at period end, we must utilize certain assumptions considering historical experience, inventory quantity, quality, age and mix, historical sales trends, future sales projections, consumer and retailer preferences, market trends, general economic conditions and our plans to sell the inventory. Also, we provide an allowance for shrinkage, as appropriate, for the period between the last physical inventory count and each balance sheet date.
For consolidated financial reporting, as of
February 2, 2019
and
February 3, 2018
,
$149.7 million
, or
93%
, and
$118.0 million
, or
93%
, of our inventories were valued at the lower of the LIFO cost or market after deducting our LIFO reserve. The remaining
$11.0 million
and
$8.8 million
of our inventories were valued at the lower of FIFO cost or market as of
February 2, 2019
and
February 3, 2018
, respectively. Generally, inventories of our domestic operations are valued at the lower of LIFO cost or market, and our inventories of our international operations are valued at the lower of FIFO cost or market. Our LIFO reserves are based on the Producer Price Index as published by the United States Department of Labor. We write down inventories valued at the lower of LIFO cost or market when LIFO cost exceeds market value. We deem LIFO accounting adjustments to not only include changes in the LIFO reserve, but also changes in markdown reserves which are considered in LIFO accounting. As our LIFO inventory pool does not correspond to our operating group definitions, LIFO inventory accounting adjustments are not allocated to the respective operating groups. Thus, the impact of accounting for inventories on the LIFO method is reflected in Corporate and Other for operating group reporting purposes included in Note 2.
There were
no
LIFO inventory layer liquidations that had a material impact on our net earnings in
Fiscal 2018
,
Fiscal 2017
or
Fiscal 2016
. As of
February 2, 2019
and
February 3, 2018
, the LIFO reserve included in our consolidated balance sheets were
$62.1 million
and
$61.5 million
, respectively.
Property and Equipment, net
Property and equipment, including leasehold improvements that are reimbursed by landlords as a tenant improvement allowance and assets under capital leases, if any, is carried at cost less accumulated depreciation. Additions are capitalized while repair and maintenance costs are charged to our consolidated statements of operations as incurred. Depreciation is calculated using both straight-line and accelerated methods generally over the estimated useful lives of the assets as follows:
|
Leasehold improvements
|
Lesser of remaining life of the asset or lease term
|
|
|
Furniture, fixtures, equipment and technology
|
2 – 15 years
|
|
|
Buildings and improvements
|
7 – 40 years
|
|
Property and equipment is reviewed periodically for impairment if events or changes in circumstances indicate that the carrying amount may not be recoverable. Events that would typically result in such an assessment would include a change in the estimated useful life of the assets, including a change in our plans of the anticipated period of operating a leased retail store or restaurant location, the discontinued use of an asset and other factors. This review includes the evaluation of any under-performing stores and assessing the recoverability of the carrying value of the assets related to the store. If the estimated fair value, utilizing the age-life method, is less than the carrying amount of the asset, an asset is determined to be impaired and a loss is recorded for the amount by which the carrying value of the asset exceeds its estimated fair value.
Substantially all of our depreciation expense is included in SG&A in our consolidated statements of operations, with the only depreciation included elsewhere within our consolidated statements of operations reflecting depreciation associated with
79
OXFORD INDUSTRIES, INC.
NOTES TO CONSOLIDATED FINANCIAL STATEMENTS (Continued)
Note 1. Summary of Significant Accounting Policies (Continued)
our manufacturing, sourcing and procurement processes, which is included in cost of goods sold. During
Fiscal 2018
,
Fiscal 2017
and
Fiscal 2016
,
$1.3 million
,
$0.9 million
and
$1.9 million
, respectively, of property and equipment impairment charges were recognized in SG&A primarily related to retail store assets and information technology assets. Depreciation expense as disclosed in our consolidated statements of cash flows and Note 2 includes fixed asset impairment charges.
Intangible Assets
At acquisition, we estimate and record the fair value of purchased intangible assets, which primarily consist of trademarks, reacquired rights and customer relationships. The fair values and useful lives of these intangible assets are estimated based on our assessment as well as independent third party appraisals in some cases. Such valuations, which are dependent upon a number of uncertain factors, may include a discounted cash flow analysis of anticipated revenues and expenses or cost savings resulting from the acquired intangible asset using an estimate of a risk-adjusted market-based cost of capital as the discount rate. Any costs associated with extending or renewing recognized intangible assets are generally expensed as incurred.
Intangible assets with indefinite lives, which consist of our Tommy Bahama, Lilly Pulitzer and Southern Tide trademarks, are not amortized but instead evaluated for impairment annually or more frequently if events or circumstances indicate that the intangible asset might be impaired. The evaluation of the recoverability of trademarks with indefinite lives includes valuations based on a discounted cash flow analysis utilizing the relief from royalty method, among other considerations. Like the initial valuation, the evaluation of recoverability is dependent upon a number of uncertain factors which require certain assumptions to be made by us, including estimates of net sales, royalty income, operating income, growth rates, royalty rates for the trademark, discount rates and income tax rates, among other factors.
We have the option to first assess qualitative factors to determine whether it is more likely than not that an indefinite-lived intangible asset is impaired as a basis for determining whether it is necessary to perform the quantitative impairment test. We also have the option to bypass the qualitative assessment for any indefinite-lived intangible asset in any period and proceed directly to performing the quantitative impairment test. Bypassing the qualitative assessment in any period does not prohibit us from performing the qualitative assessment in any subsequent period.
We test, either quantitatively or qualitatively, intangible assets with indefinite lives for impairment as of the first day of the fourth quarter of our fiscal year, or at an interim date if indicators of impairment exist at that date. If an annual or interim analysis indicates an impairment of a trademark with an indefinite useful life, the amount of the impairment is recognized in our consolidated financial statements based on the amount that the carrying value exceeds the estimated fair value of the asset.
No
impairment of intangible assets with indefinite lives was recognized during any period presented.
We recognize amortization of intangible assets with finite lives, which primarily consist of certain trademarks, including The Beaufort Bonnet Company, which we refer to as TBBC, and Lanier Apparel's owned brands, reacquired rights and customer relationships, over the estimated useful life of the related intangible asset using the straight line method or a method of amortization that reflects the pattern in which the economic benefits of the intangible asset are consumed or otherwise realized. Certain of our intangible assets with finite lives may be amortized over periods of up to
20 years
. The determination of an appropriate useful life for amortization considers our plans for the intangible assets, the remaining contractual period of the reacquired right, and factors outside of our control, including expected customer attrition. Amortization of intangible assets is included in SG&A in our consolidated statements of operations. Intangible assets with finite lives are reviewed for impairment periodically if events or changes in circumstances indicate that the carrying amount may not be recoverable. If expected future discounted cash flows resulting from the intangible assets are less than their carrying amounts, an asset is determined to be impaired and a loss is recorded for the amount by which the carrying value of the asset exceeds its fair value.
No
impairment of intangible assets with finite lives was recognized during any period presented.
Goodwill, net
Goodwill is recognized as the amount by which the cost to acquire a business exceeds the fair value of tangible and intangible assets acquired less any liabilities assumed at acquisition. Thus, the amount of goodwill recognized in connection with a business combination is dependent upon the fair values assigned to the individual assets acquired and liabilities assumed in a business combination. Goodwill is allocated to the respective reporting unit at the time of acquisition. Goodwill is not amortized but instead is evaluated for impairment annually or more frequently if events or circumstances indicate that the goodwill might be impaired.
We test, either qualitatively or quantitatively, goodwill for impairment as of the first day of the fourth quarter of our fiscal year or when impairment indicators exist. The qualitative factors that we use to determine the likelihood of goodwill impairment, as well as to determine if an interim test is appropriate, include: (a) macroeconomic conditions, (b) industry and
80
OXFORD INDUSTRIES, INC.
NOTES TO CONSOLIDATED FINANCIAL STATEMENTS (Continued)
Note 1. Summary of Significant Accounting Policies (Continued)
market considerations, (c) cost factors, (d) overall financial performance, (e) other relevant entity-specific events, (f) events affecting a reporting unit, (g) a sustained decrease in share price, or (h) other factors as appropriate. In the event we determine that we will bypass the qualitative impairment option or if we determine that a quantitative test is appropriate, the quantitative test includes valuations of each applicable underlying business using fair value techniques and market comparables, which may include a discounted cash flow analysis or an independent appraisal. Significant estimates, some of which may be very subjective, considered in such a discounted cash flow analysis are future cash flow projections of the business, an estimate of the risk-adjusted market-based cost of capital as the discount rate, income tax rates and other assumptions. The estimates and assumptions included in the evaluation of the recoverability of goodwill involve significant uncertainty, and if our plans or anticipated results change, the impact on our financial statements could be significant.
If an annual or interim analysis indicates an impairment of goodwill balances, the impairment is recognized in our consolidated financial statements.
No
impairment of goodwill was recognized during any period presented.
All goodwill for Tommy Bahama, Lilly Pulitzer and Corporate and Other is deductible for income tax purposes, while the majority of the goodwill included in the balance sheet for Southern Tide is deductible for income tax purposes.
Prepaid Expenses and Other Non-Current Assets, net
Amounts included in prepaid expenses primarily consist of prepaid operating expenses, including advertising, rent, taxes, maintenance and other services contracts, royalties, insurance, samples and retail supplies. Other non-current assets primarily consist of assets set aside for potential liabilities related to our deferred compensation plan as discussed below, assets related to certain investments in officers' life insurance policies, security deposits, investments in unconsolidated entities and deferred financing costs related to our revolving credit agreement.
Officers' life insurance policies that are owned by us, substantially all of which are included in other non-current assets, net, are recorded at their cash surrender value, less any outstanding loans associated with the life insurance policies that are payable to the life insurance company with which the policy is outstanding. As of
February 2, 2019
and
February 3, 2018
, officers' life insurance policies, net, recorded in our consolidated balance sheets totaled
$3.6 million
and
$5.3 million
, respectively.
Deferred financing costs for our revolving credit agreements are included in other non-current assets, net in our consolidated financial statements. Deferred financing costs are amortized on a straight-line basis, which approximates the effective interest method over the term of the related debt. Amortization of deferred financing costs is included in interest expenses in consolidated statements of operations. Unamortized deferred financing costs included in other non-current assets, net totaled
$1.0 million
and
$1.4 million
at
February 2, 2019
and
February 3, 2018
, respectively.
Deferred Compensation
We have a non-qualified deferred compensation plan offered to a select group of highly compensated employees and our non-employee directors. The plan provides participants with the opportunity to defer a portion of their cash compensation in a given plan year, of which a percentage may be matched by us in accordance with the terms of the plan. We make contributions to rabbi trusts or other investments to provide a source of funds for satisfying these deferred compensation liabilities. Investments held for our deferred compensation plan consist of insurance contracts and are recorded based on valuations which generally incorporate unobservable factors. A change in the value of the underlying assets would substantially be offset by a change in the liability to the participant resulting in an immaterial net impact on our consolidated financial statements. These securities approximate the participant-directed investment selections underlying the deferred compensation liabilities.
The total value of the assets set aside for potential deferred compensation liabilities, substantially all of which are included in other non-current assets, net, as of
February 2, 2019
and
February 3, 2018
was
$12.7 million
and
$12.5 million
, respectively, substantially all of which are held in a rabbi trust. Substantially all the assets set aside for potential deferred compensation liabilities are life insurance policies recorded at their cash surrender value, less any outstanding loans associated with the life insurance policies that are payable to the life insurance company with which the policy is outstanding. The liabilities associated with the non-qualified deferred compensation plan are included in other non-current liabilities in our consolidated balance sheets and totaled
$12.9 million
and
$12.2 million
at
February 2, 2019
and
February 3, 2018
, respectively.
81
OXFORD INDUSTRIES, INC.
NOTES TO CONSOLIDATED FINANCIAL STATEMENTS (Continued)
Note 1. Summary of Significant Accounting Policies (Continued)
Accounts Payable, Accrued Compensation and Other Accrued Expenses and Liabilities
Liabilities for accounts payable, accrued compensation and other accrued expenses and liabilities are carried at cost, which reflects the fair value of the consideration expected to be paid in the future for goods and services received, whether or not billed to us. Accruals for employee insurance and workers' compensation, which are included in other accrued expenses and liabilities in our consolidated balance sheets, include estimated settlements for known claims, as well as accruals for estimates of incurred but not reported claims based on our claims experience and statistical trends.
Legal and Other Contingencies
We are subject to certain claims and assessments in the ordinary course of business. The claims and assessments may relate, among other things, to disputes about intellectual property, real estate and contracts, as well as labor, employment, environmental, customs and tax matters. For those matters where it is probable that we have incurred a loss and the loss, or range of loss, can be reasonably estimated, we have recorded reserves in other accrued expenses and liabilities or other non-current liabilities in our consolidated financial statements for the estimated loss and related expenses, such as legal fees. In other instances, because of the uncertainties related to both the probable outcome or amount or range of loss, we are unable to make a reasonable estimate of a liability, if any, and therefore have not recorded a reserve. As additional information becomes available or as circumstances change, we adjust our assessment and estimates of such liabilities accordingly. Additionally, for any potential gain contingencies, we do not recognize the gain until the period that all contingencies have been resolved and the amounts are realizable. We believe the outcome of outstanding or pending matters, individually and in the aggregate, will not have a material impact on our consolidated financial statements, based on information currently available.
In connection with acquisitions, we may enter into contingent consideration arrangements, which provide for the payment of additional purchase consideration to the sellers if certain performance criteria are achieved during a specified period. We must recognize the fair value of the contingent consideration based on its estimated fair value at the date of acquisition. Such valuation requires assumptions regarding anticipated cash flows, probabilities of cash flows, discount rates and other factors. Each of these assumptions may involve a significant amount of uncertainty. Subsequent to the date of acquisition, we must periodically adjust the liability for the contingent consideration to reflect the fair value of the contingent consideration by reassessing our valuation assumptions as of that date. A change in assumptions related to contingent consideration amounts could have a material impact on our consolidated financial statements. Any change in the fair value of the contingent consideration is recognized in SG&A in our consolidated statements of operations.
A change in the fair value of contingent consideration of
$1.0 million
associated with the acquisition of TBBC was recognized in our consolidated statements of operations in
Fiscal 2018
, with
no
such amounts recognized in our prior year consolidated statements of operations. As of
February 2, 2019
,
no
amounts had been paid pursuant to the arrangement. As of
February 2, 2019
and
February 3, 2018
,
$1.3 million
and
$0.3 million
, respectively, of contingent consideration related to the TBBC acquisition is recognized as a liability in our consolidated balance sheet, with the substantial majority of those amounts included in other non-current liabilities.
Other Non-current Liabilities
Amounts included in other non-current liabilities primarily consist of deferred rent related to our operating lease agreements as discussed below and deferred compensation as discussed above.
Leases
In the ordinary course of business, we enter into lease agreements for retail, food and beverage, office and warehouse/distribution space, as well as leases for certain equipment. The leases have varying terms and expirations and frequently have provisions to extend, renew or terminate the lease agreement, among other terms and conditions. We assess the lease at inception and determine whether the lease qualifies as a capital or operating lease, with substantially all of our leases classified as operating leases. Assets leased under operating leases have not historically been recognized as assets and liabilities in our consolidated balance sheets.
When a non-cancelable operating lease includes fixed escalation clauses, lease incentives for rent holidays or landlord build-out-related allowances, rent expense is generally recognized on a straight-line basis over the initial term of the lease from the date that we take possession of the space and does not assume that any termination options included in the lease will be exercised. Contingent rents, including those based on a percentage of retail sales over stated levels, and rental payment increases based on a contingent future event are recognized as the expense is incurred. The difference between the rents payable under the lease and the amount recognized on a straight-line basis is recorded in other non-current liabilities in our consolidated
82
OXFORD INDUSTRIES, INC.
NOTES TO CONSOLIDATED FINANCIAL STATEMENTS (Continued)
Note 1. Summary of Significant Accounting Policies (Continued)
balance sheets, with the exception of certain current liability amounts recorded in other accrued expenses and liabilities. Any tenant improvement allowance amounts received from the landlord are initially deferred as a liability in our consolidated balance sheets and then recognized in our consolidated statements of operations as a reduction to rent expense over the term of the lease agreement. Deferred rent in our consolidated balance sheets, including tenant improvement allowances and all amounts in non-current and current liabilities, as of
February 2, 2019
and
February 3, 2018
was
$60.7 million
and
$61.4 million
, respectively.
If we vacate leased space and determine that we do not plan to use the space in the future, we recognize a loss for any future rent payments, less any anticipated future sublease income and adjusted for any deferred rent amounts included in our consolidated balance sheet on that date. Additionally, for any lease that we terminate and agree to a lease termination payment, we recognize in SG&A in our consolidated statements of operations a loss for the lease termination payment at the time of the agreement.
Foreign Currency Transactions and Translation
We are exposed to foreign currency exchange risk when we generate net sales or incur expenses in currencies other than the functional currency of the respective operations. The resulting assets and liabilities denominated in amounts other than the respective functional currency are re-measured into the respective functional currency at the rate of exchange in effect on the balance sheet date, and income and expenses are re-measured at the average rates of exchange prevailing during the relevant period. The impact of any such re-measurement is recognized in our consolidated statements of operations in that period. Net gains (losses) related to foreign currency transactions recognized in
Fiscal 2018
,
Fiscal 2017
and
Fiscal 2016
were not material to our consolidated financial statements.
Additionally, the financial statements of our operations for which the functional currency is a currency other than the U.S. dollar are translated into U.S. dollars at the rate of exchange in effect on the balance sheet date for the balance sheet and at the average rates of exchange prevailing during the relevant period for the statements of operations. The impact of such translation is recognized in accumulated other comprehensive income (loss) in our consolidated balance sheets and included in other comprehensive income (loss) in our consolidated statements of comprehensive income resulting in
no
impact on net earnings for the relevant period.
Derivative Financial Instruments
Derivative financial instruments, if any, are measured at their fair values in our consolidated balance sheets. Unrealized gains and losses on derivative financial instruments are recognized as prepaid expenses or accrued expenses, respectively. The accounting for changes in the fair value of derivative instruments depends on whether the derivative has been designated and qualifies for hedge accounting. The criteria used to determine if a derivative financial instrument qualifies for hedge accounting treatment are whether an appropriate hedging instrument has been identified and designated to reduce a specific exposure and whether there is a high correlation between changes in the fair value of the hedging instrument and the identified exposure based on the nature of the hedging relationship.
We may formally document hedging instruments and hedging relationships at the inception of each contract. Further, we assess both at the inception of a contract and on an ongoing basis whether the hedging instrument is effective in offsetting the risk of the hedged transaction. For any derivative financial instrument that is designated and qualifies for hedge accounting treatment and has not been settled as of period-end, the unrealized gains (losses) on the outstanding derivative financial instrument is recognized, to the extent the hedge relationship has been effective, as a component of comprehensive income in our consolidated statements of comprehensive income and accumulated other comprehensive income (loss) in our consolidated balance sheets. For any financial instrument that is not designated as a hedge for accounting purposes, or for any ineffective portion of a hedge, the unrealized gains (losses) on the outstanding derivative financial instrument is included in net earnings. Cash flows related to hedging transactions are classified in our consolidated statements of cash flows and consolidated statements of operations in the same category as the items hedged. We do not use derivative financial instruments for trading or speculative purposes.
Foreign Currency Risk
As of
February 2, 2019
, our foreign currency exchange risk exposure primarily results from our businesses operating outside of the United States, which are primarily related to (1) our Tommy Bahama operations in Canada, Australia and Japan purchasing goods in U.S. dollars or other currencies which are not the functional currency of the business and (2) certain other transactions, including intercompany transactions. We may enter into short-term forward foreign currency exchange contracts in the ordinary course of business to mitigate a portion of the risk associated with foreign currency exchange rate fluctuations
83
OXFORD INDUSTRIES, INC.
NOTES TO CONSOLIDATED FINANCIAL STATEMENTS (Continued)
Note 1. Summary of Significant Accounting Policies (Continued)
related to purchases of inventory or selling goods in currencies other than the functional currencies by certain of our foreign operations. As of
February 2, 2019
, we were not a party to any forward foreign currency exchange contracts.
Interest Rate Risk
As of
February 2, 2019
, we were exposed to market risk from changes in interest rates on our variable-rate indebtedness under our U.S. Revolving Credit Agreement. We may attempt to limit the impact of interest rate changes on earnings and cash flow, primarily through a mix of variable-rate and fixed-rate debt, although at times all of our debt may be either variable-rate or fixed-rate debt. At times we may enter into interest rate swap arrangements related to certain of our variable-rate debt in order to fix the interest rate if we determine that our exposure to interest rate changes is higher than optimal. Our assessment also considers our need for flexibility in our borrowing arrangements resulting from the seasonality of our business, anticipated future cash flows and our expectations about the risk of future interest rate changes, among other factors. As of
February 2, 2019
, we did not have any interest rate swap agreements, thus all of our debt was variable-rate debt with exposure to changes in interest rates.
Fair Value Measurements
Fair value, in accordance with GAAP, is defined as the exchange price that would be received for an asset or paid to transfer a liability (an exit price) in the principal or most advantageous market for the asset or liability in an orderly transaction between market participants at the measurement date. As such, fair value is a market-based measurement that should be determined based on assumptions that market participants would use in pricing an asset or liability. Valuation techniques include the market approach (comparable market prices), the income approach (present value of future income or cash flow), and the cost approach (cost to replace the service capacity of an asset or replacement cost). These valuation techniques may be based upon observable and unobservable inputs.
The three levels of inputs used to measure fair value pursuant to the guidance are as follows: (1) Level 1—Quoted prices in active markets for identical assets or liabilities; (2) Level 2—Observable inputs other than quoted prices included in Level 1, such as quoted prices for similar assets and liabilities in active markets; quoted prices for identical or similar assets and liabilities in markets that are not active; or other inputs that are observable or can be corroborated by observable market data; and (3) Level 3—Unobservable inputs that are supported by little or no market activity and that are significant to the fair value of the assets or liabilities, which includes certain pricing models, discounted cash flow methodologies and similar techniques that use significant unobservable inputs.
Our financial instruments consist primarily of our cash and cash equivalents, accounts receivable, accounts payable, accrued expenses and debt. Given their short-term nature, the carrying amounts of cash and cash equivalents, receivables, accounts payable and accrued expenses generally approximate their fair values. Additionally, we believe the carrying amounts of our variable-rate borrowings approximate fair value. We have determined that our property and equipment, intangible assets and goodwill, for which the book values are disclosed in Notes 3 and 4, are non-financial assets measured at fair value on a non-recurring basis. We have determined that our approaches for determining fair values of our property and equipment, intangible assets and goodwill generally are based on Level 3 inputs. Additionally, for contingent consideration fair value amounts, we have determined that our approaches for determining fair value are generally based on Level 3 inputs.
Equity Compensation
We have certain equity compensation plans as described in Note 7, which provide for the ability to grant restricted shares, restricted share units, options and other equity awards to our employees and non-employee directors. We recognize compensation expense related to equity awards to employees and non-employee directors in SG&A in our consolidated statements of operations based on their fair values on the grant date. The fair values of restricted shares and restricted share units are determined based on the fair value of our common stock on the grant date, regardless of whether the awards are performance or service based.
We use the fair value method to recognize compensation expense related to equity awards, with a corresponding entry to additional paid-in capital. For awards with specified service requirements, the fair value of the equity awards granted to employees is recognized over the respective service period. For performance-based awards, during the performance period we assess expected performance versus the predetermined performance goals and adjust the cumulative equity compensation expense to reflect the relative expected performance achievement. The equity compensation expense is recognized on a straight-line basis over the aggregate performance period and any additional required service period. No estimate of future stock award forfeitures is considered in our calculation of compensation expense as the impact of forfeitures on compensation expense is recognized at the time of forfeit.
84
OXFORD INDUSTRIES, INC.
NOTES TO CONSOLIDATED FINANCIAL STATEMENTS (Continued)
Note 1. Summary of Significant Accounting Policies (Continued)
Comprehensive Income and Accumulated Other Comprehensive Loss
Comprehensive income consists of net earnings and specified components of other comprehensive loss. Other comprehensive income includes changes in assets and liabilities that are not included in net earnings pursuant to GAAP, such as foreign currency translation adjustments between the functional and reporting currencies and the net unrealized gain (loss) associated with cash flow hedges which qualify for hedge accounting, if any. These amounts of accumulated other comprehensive loss are deferred in accumulated other comprehensive loss, which is included in shareholders' equity in our consolidated balance sheets. Substantially all amounts included in accumulated other comprehensive loss in our consolidated balance sheets, as well as any related changes, reflect the net foreign currency translation adjustment related to our Tommy Bahama operations in Canada, Australia and Japan. No material amounts of accumulated other comprehensive loss were reclassified from accumulated other comprehensive loss into our consolidated statements of operations during any period presented.
Dividends
Dividends are accrued at the time declared by our Board of Directors and typically paid within the same fiscal quarter.
Concentration of Credit Risk and Significant Customers
We are exposed to concentrations of credit risk as a result of our receivables balances, for which the total exposure is limited to the amount recognized in our consolidated balance sheets. We sell our merchandise to customers operating in a number of retail distribution channels in the United States and other countries. We extend credit to certain wholesale customers based on an evaluation of the customer's credit history and financial condition, usually without requiring collateral. Credit risk is impacted by conditions or occurrences within the economy and the retail industry and is principally dependent on each customer's financial condition. Additionally, a decision by the controlling owner of a group of stores or any significant customer to decrease the amount of merchandise purchased from us or to cease carrying our products could have an adverse effect on our results of operations in future periods.
No
individual customer represented greater than
10%
of our consolidated net sales in
Fiscal 2018
,
Fiscal 2017
or
Fiscal 2016
. As of
February 2, 2019
,
two
customers each represented
15%
of our receivables included in our consolidated balance sheet.
Income Taxes
Income taxes included in our consolidated financial statements are determined using the asset and liability method. Under this method, income taxes are recognized based on amounts of income taxes payable or refundable in the current year as well as the impact of any items that are recognized in different periods for consolidated financial statement reporting and tax return reporting purposes. Prepaid income taxes and income taxes payable are recognized in prepaid expenses and other accrued expenses and liabilities, respectively, in our consolidated balance sheets. As certain amounts are recognized in different periods for consolidated financial statement and tax return reporting purposes, financial statement and tax bases of assets and liabilities differ, resulting in the recognition of deferred tax assets and liabilities. The deferred tax assets and liabilities reflect the estimated future tax effects attributable to these differences, as well as the impact of net operating loss, capital loss and federal and state credit carry-forwards, each as determined under enacted tax laws and rates expected to apply in the period in which such amounts are expected to be realized or settled.
We recognize deferred tax assets to the extent we believe it is more likely than not that these assets will be realized. In making such a determination, we consider all available positive and negative evidence, including future reversals of existing taxable temporary differences, projected future taxable income, taxable income in carryback years, tax-planning strategies, and results of recent operations. Valuation allowances are established when we determine that it is more likely than not that some portion or all of a deferred tax asset will not be realized.
Valuation allowances are analyzed periodically and adjusted as events occur or circumstances change that would indicate adjustments to the valuation allowances are appropriate. If we determine that we are more likely than not to realize our deferred tax assets in the future in excess of their net recorded amount, we will reduce the deferred tax asset valuation allowance, which will reduce income tax expense. As realization of deferred tax assets and liabilities is dependent upon future taxable income in specific jurisdictions, changes in tax laws and rates and shifts in the amount of taxable income among jurisdictions may have a significant impact on the amount of benefit ultimately realized for deferred tax assets and liabilities. We account for the effect of changes in tax laws or rates in the period of enactment.
We utilize a two-step approach for evaluating uncertain tax positions. Under the two-step method, recognition occurs when we conclude that a tax position, based solely on technical merits, is more likely than not to be sustained upon examination. The
85
OXFORD INDUSTRIES, INC.
NOTES TO CONSOLIDATED FINANCIAL STATEMENTS (Continued)
Note 1. Summary of Significant Accounting Policies (Continued)
second step, measurement, is only addressed if step one has been satisfied. The tax benefit recorded is measured as the largest amount of benefit determined on a cumulative probability basis that is more likely than not to be realized upon ultimate settlement. Those tax positions failing to qualify for initial recognition are recognized in the first subsequent interim period they meet the more likely than not threshold or are resolved through negotiation or litigation with the relevant taxing authority or upon expiration of the statute of limitations. Alternatively, de-recognition of a tax position that was previously recognized occurs when we subsequently determine that a tax position no longer meets the more likely than not threshold of being sustained. Interest and penalties associated with unrecognized tax positions are recorded within income tax expense in our consolidated statements of operations. As of
February 2, 2019
and
February 3, 2018
and during
Fiscal 2018
,
Fiscal 2017
and
Fiscal 2016
, we did not have any material unrecognized tax benefit amounts, including any related potential penalty or interest expense, or material changes in unrecognized tax benefit amounts.
In the case of foreign subsidiaries there are certain exceptions to the requirement that deferred tax liabilities be recognized for the difference in the financial statement and tax bases of assets. When the financial statement basis of the investment in a foreign subsidiary, excluding undistributed earnings, exceeds the tax basis in such investment, the deferred liability is not recognized if management considers the investment to be essentially permanent in duration. Further, deferred tax liabilities are not required to be recognized for undistributed earnings of foreign subsidiaries when management considers those earnings to be permanently reinvested outside the United States
.
The Tax Cuts and Jobs Act ("U.S. Tax Reform") as enacted on December 22, 2017 changed the way federal tax is applied to distributions of earnings of foreign subsidiaries. Generally, the aggregate of all post-1986 accumulated undistributed earnings and profits of foreign subsidiaries as of November 2, 2017 or December 31, 2017 was, if positive, subject to a U.S. "transition tax”, and future distributions of foreign earnings are generally not subject to federal tax. We have calculated the undistributed earnings of foreign subsidiaries as of the measurement dates and determined that
no
transition tax was due and accordingly have
not
recorded a transition tax amount in our consolidated statements of operations. While future distributions of foreign subsidiary earnings are not subject to federal tax, there are other possible tax impacts, including state taxes and foreign withholding tax, that must be considered if the earnings are not considered to be permanently reinvested. Further, U.S. Tax Reform did not exempt from federal tax the gain realized upon the sale of a foreign subsidiary, and consideration must be given to the impact of differences in the book and tax basis of foreign subsidiaries not arising from earnings when determining whether a liability must be recorded if the investment is not considered to be permanently reinvested. We consider all of our investments in and undistributed earnings of our foreign subsidiaries to be permanently reinvested outside the United States as of
February 2, 2019
and therefore have not recorded a deferred tax liability on these amounts in our consolidated financial statements.
We generally receive a U.S. income tax benefit upon the vesting of shares granted to employees. The benefit is equal to the difference, multiplied by the appropriate tax rate, between the fair value of the shares and the taxes payable by the employee at the time of vesting of a restricted share award. We record the tax benefit associated with the vesting of share awards granted to employees as a reduction to income taxes payable and a reduction to income taxes in our consolidated statements of operations.
We file income tax returns in the United States and various state, local and foreign jurisdictions. Our federal, state, local and foreign income tax returns filed for years prior to Fiscal 2015, with limited exceptions, are no longer subject to examination by tax authorities.
Earnings (Loss) Per Share
Basic net earnings from continuing operations, net earnings from discontinued operations and net earnings per share are each calculated by dividing the respective earnings amount by the weighted average shares outstanding during the period. Shares repurchased, if any, are removed from the weighted average number of shares outstanding upon repurchase and delivery.
Diluted net earnings from continuing operations, net earnings from discontinued operations and net earnings per share are each calculated similarly to the amounts above, except that the weighted average shares outstanding in the diluted calculations also includes the potential dilution using the treasury stock method that could occur if dilutive securities, including restricted share awards, options or other dilutive awards, were converted to shares. The treasury stock method assumes that shares are issued for any restricted share awards, options or other dilutive awards that are "in the money," and that we use the proceeds received to repurchase shares at the average market value of our shares for the respective period. For purposes of the treasury stock method, proceeds consist of cash to be paid and future compensation expense to be recognized.
86
OXFORD INDUSTRIES, INC.
NOTES TO CONSOLIDATED FINANCIAL STATEMENTS (Continued)
Note 1. Summary of Significant Accounting Policies (Continued)
Use of Estimates
The preparation of our consolidated financial statements in conformity with GAAP requires us to make certain estimates and assumptions that affect the amounts reported as assets, liabilities, revenues and expenses in the consolidated financial statements and accompanying notes. Actual results could differ from those estimates.
Discontinued Operations
Unless otherwise indicated, all references to assets, liabilities, revenues and expenses in our consolidated financial statements reflect continuing operations and exclude any amounts related to the discontinued operations of our former Ben Sherman operating group which we sold in 2015. Amounts included in discontinued operations in our consolidated statements of operations in Fiscal 2017 and Fiscal 2016 primarily consist of revisions to our net loss anticipated in connection with certain retained lease obligations related to our former Ben Sherman operating group. During Fiscal 2017, we negotiated settlements in respect of these outstanding lease obligations by agreeing to make one-time cash payments lower than the aggregate total outstanding liabilities related to discontinued operations at that time resulting in income from discontinued operations during the period. The settlements resulted in liabilities related to discontinued operations, which were included in accounts payable in our consolidated balance sheet as of
February 3, 2018
, of
$2.1 million
. The final satisfaction of those obligations was completed in February 2018.
Accounting Standards Adopted in Fiscal 2018
As disclosed above in "Revenue Recognition and Receivables", in May 2014, the FASB issued guidance, as revised through supplemental guidance, which provided a single, comprehensive accounting model for revenue arising from contracts with customers. This new revenue recognition guidance superseded most of the prior revenue recognition guidance. Under the new guidance, revenue is recognized at an amount that reflects the consideration expected to be received for those goods and services pursuant to a five-step approach: (1) identify the contracts with the customer; (2) identify the separate performance obligations in the contracts; (3) determine the transaction price; (4) allocate the transaction price to separate performance obligations; and (5) recognize revenue when, or as, each performance obligation is satisfied. The new guidance also required additional disclosures about the nature, timing and uncertainty of revenue and cash flow arising from customer contracts, including significant judgments and changes in judgments.
We adopted the revised revenue recognition guidance as of the first day of Fiscal 2018 using the modified retrospective method, applying the guidance only to contracts that were not completed prior to Fiscal 2018. There was no adjustment to retained earnings for the cumulative effect of applying the guidance upon adoption as there was no change in the timing or amount of revenue recognition for any of our revenue streams. We have changed our accounting policies and practices, as described in "Revenue Recognition and Receivables" above. Additionally, we designed and implemented specific controls over our evaluation of the impact of the new guidance, including disclosure requirements and the collection of relevant data for the reporting process.
We made the following accounting policy elections and practical expedients related to the new revenue recognition guidance: (1) we exclude any taxes collected from customers that are remitted to taxing authorities from net sales, which is consistent with our historical policy; (2) we deem charges incurred by us before and after the customer obtains control of goods, as applicable, as fulfillment costs; (3) as customer payment terms are less than one year from the transfer of goods, we do not adjust receivable amounts for the effects of time value of money, which is consistent with our historical policy; and (4) we utilize the portfolio approach when multiple contracts or performance obligations are involved in the determination of revenue recognition. We do not believe the use of any practical expedients utilized by us had a material impact on our financial statements upon our adoption of the revised guidance.
In October 2016, the FASB issued guidance on the recognition of current and deferred income taxes for intra-entity asset transfers. The revised guidance requires an entity to recognize the income tax consequences of an intra-entity transfer of an asset (other than inventory) when the transfer occurs. We adopted this guidance in the First Quarter of Fiscal 2018, resulting in a
$0.1 million
reduction to retained earnings as of February 4, 2018 and no impact on net earnings for any period presented.
Other recently issued guidance that was adopted in
Fiscal 2018
did not have a material impact on our consolidated financial statements upon adoption.
87
OXFORD INDUSTRIES, INC.
NOTES TO CONSOLIDATED FINANCIAL STATEMENTS (Continued)
Note 1. Summary of Significant Accounting Policies (Continued)
Recently Issued Accounting Standards Applicable to Future Years
In February 2016, the FASB issued revised lease accounting guidance. The guidance requires companies to record substantially all leases, including operating leases, as assets and liabilities on the balance sheet. For these leases, we will be required to recognize (1) a right of use asset which will represent our right to use, or control the use of, a specified asset for a lease term and (2) a lease liability equal to our obligation to make lease payments arising from a lease, measured on a discounted basis. Also, the revised guidance requires additional qualitative and quantitative footnote disclosures in our consolidated financial statements. The guidance will be adopted by us on the first day of the First Quarter of Fiscal 2019. The guidance requires the use of the modified retrospective transition approach, which includes a number of optional practical expedients that companies may elect to apply, including an option to not apply the new guidance in the comparative periods presented within the financial statements in the year of adoption.
In Fiscal 2018, we implemented a new third party lease administration software, including validation of the relevant lease information included in the lease administration software for real estate leases, and in early Fiscal 2019 we implemented the related lease accounting module. We are in process of completing our (1) assessment to ensure all real estate, equipment and other leases have been identified, (2) evaluation of practical expedients and (3) accounting policy elections, as well as the documentation of these items. We are also implementing changes in internal controls related to lease accounting resulting from the adoption of the new guidance. We plan on electing the practical expedient to use the effective date as of the date of initial application on transition, and as a result will not adjust comparative period financial information or make the lease disclosures of the new guidance for periods prior to the effective date. Additionally, we plan on electing the package of practical expedients which allows us to not reassess our prior conclusions related to lease identification, lease classification and initial direct costs, but we do not plan on electing the hindsight practical expedient related to the determination of the reasonably certain lease term for existing leases.
Considering the magnitude of our existing real estate leases, which are classified as operating leases, the new lease guidance will have a significant impact on our consolidated balance sheet by requiring the recognition of a significant amount of lease-related right of use assets and lease liabilities. Additionally, upon adoption of the new guidance, certain prepaid rent amounts previously classified in prepaid expenses as well as deferred rent amounts previously classified as non-current liabilities will be reclassified to reduce right of use assets. While we are still assessing the potential impact of the revised guidance, we do not anticipate the adoption of the guidance will have a material impact on our consolidated statement of operations and statement of cash flows.
In June 2016, the FASB issued guidance, as amended, on the measurement of credit losses on financial instruments. This guidance amends the impairment model by requiring that companies use a forward-looking approach based on expected losses to estimate credit losses on certain financial instruments, including trade receivables. This guidance will be effective in Fiscal 2020, which will commence on February 2, 2020, with early adoption permitted. We are currently assessing the impact that adopting this guidance will have on our consolidated financial statements.
Recent accounting pronouncements pending adoption not discussed above are either not applicable or are not expected to have a material impact on our consolidated financial statements.
Note 2. Operating Groups
We identify our operating groups based on the way our management organizes the components of our business for purposes of allocating resources and assessing performance. Our operating group structure reflects a brand-focused management approach, emphasizing operational coordination and resource allocation across each brand's direct to consumer, wholesale and licensing operations, as applicable. Our business is primarily operated through our Tommy Bahama, Lilly Pulitzer, Lanier Apparel and Southern Tide operating groups.
Tommy Bahama, Lilly Pulitzer and Southern Tide each design, source, market and distribute apparel and related products bearing their respective trademarks and license their trademarks for other product categories, while Lanier Apparel designs, sources and distributes branded and private label men's tailored clothing, sportswear and other products. Corporate and Other is a reconciling category for reporting purposes and includes our corporate offices, substantially all financing activities, the elimination of inter-segment sales and any other items that are not allocated to the operating groups including LIFO accounting adjustments. Because our LIFO inventory pool does not correspond to our operating group definitions, LIFO inventory accounting adjustments are not allocated to the operating groups. Corporate and Other also includes the operations of other
88
OXFORD INDUSTRIES, INC.
NOTES TO CONSOLIDATED FINANCIAL STATEMENTS (Continued)
Note 2. Operating Groups (Continued)
businesses which are not included in our operating groups. The operations of TBBC, which we acquired in December 2017, and our Lyons, Georgia distribution center are included in Corporate and Other.
The tables below present certain financial information (in thousands) about our operating groups, as well as Corporate and Other.
|
Fiscal 2018
|
Fiscal 2017
|
Fiscal 2016
|
|||||||
|
Net Sales
|
|||||||||
|
Tommy Bahama
|
$
|
675,358
|
|
$
|
686,021
|
|
$
|
658,911
|
|
|
Lilly Pulitzer
|
272,299
|
|
248,931
|
|
233,294
|
|
|||
|
Lanier Apparel
|
100,471
|
|
106,852
|
|
100,753
|
|
|||
|
Southern Tide
|
45,248
|
|
40,940
|
|
27,432
|
|
|||
|
Corporate and Other
|
14,090
|
|
3,467
|
|
2,198
|
|
|||
|
Net Sales
|
$
|
1,107,466
|
|
$
|
1,086,211
|
|
$
|
1,022,588
|
|
|
Depreciation and Amortization of Intangible Assets
|
|||||||||
|
Tommy Bahama
|
$
|
29,549
|
|
$
|
30,998
|
|
$
|
31,796
|
|
|
Lilly Pulitzer
|
10,605
|
|
9,021
|
|
7,968
|
|
|||
|
Lanier Apparel
|
567
|
|
583
|
|
478
|
|
|||
|
Southern Tide
|
528
|
|
441
|
|
390
|
|
|||
|
Corporate and Other
|
1,241
|
|
1,359
|
|
1,451
|
|
|||
|
Depreciation and Amortization of Intangible Assets
|
$
|
42,490
|
|
$
|
42,402
|
|
$
|
42,083
|
|
|
Operating Income (Loss)
|
|||||||||
|
Tommy Bahama
|
$
|
53,139
|
|
$
|
55,002
|
|
$
|
44,101
|
|
|
Lilly Pulitzer
|
47,239
|
|
46,608
|
|
51,995
|
|
|||
|
Lanier Apparel
|
5,057
|
|
6,546
|
|
6,955
|
|
|||
|
Southern Tide
|
5,663
|
|
4,504
|
|
(282
|
)
|
|||
|
Corporate and Other
(1)
|
(20,506
|
)
|
(26,660
|
)
|
(12,885
|
)
|
|||
|
Operating Income
|
90,592
|
|
86,000
|
|
89,884
|
|
|||
|
Interest expense, net
|
2,283
|
|
3,109
|
|
3,421
|
|
|||
|
Earnings Before Income Taxes
|
$
|
88,309
|
|
$
|
82,891
|
|
$
|
86,463
|
|
|
(1)
Corporate and Other included a LIFO accounting charge of $0.8 million, a LIFO accounting charge of $7.8 million and a LIFO accounting credit of $5.9 million in Fiscal 2018, Fiscal 2017 and Fiscal 2016, respectively.
|
|||||||||
|
Fiscal 2018
|
Fiscal 2017
|
Fiscal 2016
|
|||||||
|
Purchases of Property and Equipment
|
|||||||||
|
Tommy Bahama
|
$
|
25,111
|
|
$
|
24,962
|
|
$
|
34,191
|
|
|
Lilly Pulitzer
|
10,777
|
|
11,150
|
|
14,142
|
|
|||
|
Lanier Apparel
|
99
|
|
305
|
|
295
|
|
|||
|
Southern Tide
|
149
|
|
1,138
|
|
27
|
|
|||
|
Corporate and Other
|
907
|
|
1,193
|
|
760
|
|
|||
|
Purchases of Property and Equipment
|
$
|
37,043
|
|
$
|
38,748
|
|
$
|
49,415
|
|
89
OXFORD INDUSTRIES, INC.
NOTES TO CONSOLIDATED FINANCIAL STATEMENTS (Continued)
Note 2. Operating Groups (Continued)
|
February 2, 2019
|
February 3, 2018
|
|||||
|
Total Assets
|
||||||
|
Tommy Bahama
|
$
|
439,353
|
|
$
|
439,871
|
|
|
Lilly Pulitzer
|
152,113
|
|
142,882
|
|
||
|
Lanier Apparel
|
54,369
|
|
31,575
|
|
||
|
Southern Tide
|
97,939
|
|
94,032
|
|
||
|
Corporate and Other
(1)
|
(16,520
|
)
|
(8,419
|
)
|
||
|
Total Assets
|
$
|
727,254
|
|
$
|
699,941
|
|
|
(1)
Total assets for Corporate and Other include LIFO reserves of $62.1 million and $61.5 million as of February 2, 2019 and February 3, 2018, respectively.
|
||||||
Net book value of our property and equipment and net sales by geographic area are presented in the tables below (in thousands). The other foreign amounts primarily relate to our Tommy Bahama operations in Canada, Australia and Japan.
|
Net Book Value of Property and Equipment
|
February 2, 2019
|
February 3, 2018
|
||||
|
United States
|
$
|
186,426
|
|
$
|
187,109
|
|
|
Other foreign
|
6,150
|
|
6,424
|
|
||
|
|
$
|
192,576
|
|
$
|
193,533
|
|
|
Net Sales
|
Fiscal 2018
|
Fiscal 2017
|
Fiscal 2016
|
||||||
|
United States
|
$
|
1,067,235
|
|
$
|
1,048,619
|
|
$
|
986,062
|
|
|
Other foreign
|
40,231
|
|
37,592
|
|
36,526
|
|
|||
|
|
$
|
1,107,466
|
|
$
|
1,086,211
|
|
$
|
1,022,588
|
|
The tables below quantify, for each operating group and in total, the amount of net sales by distribution channel (in thousands) and as a percentage of net sales for each period presented.
|
Fiscal 2018
|
||||||||
|
Net Sales
|
Retail
|
E-commerce
|
Restaurant
|
Wholesale
|
Other
|
|||
|
Tommy Bahama
|
$
|
675,358
|
|
48%
|
18%
|
13%
|
21%
|
—%
|
|
Lilly Pulitzer
|
272,299
|
|
42%
|
36%
|
—%
|
22%
|
—%
|
|
|
Lanier Apparel
|
100,471
|
|
—%
|
—%
|
—%
|
100%
|
—%
|
|
|
Southern Tide
|
45,248
|
|
—%
|
18%
|
—%
|
82%
|
—%
|
|
|
Corporate and Other
|
14,090
|
|
—%
|
54%
|
—%
|
30%
|
16%
|
|
|
Total net sales
|
$
|
1,107,466
|
|
40%
|
21%
|
8%
|
31%
|
—%
|
|
Fiscal 2017
|
||||||||
|
Net Sales
|
Retail
|
E-commerce
|
Restaurant
|
Wholesale
|
Other
|
|||
|
Tommy Bahama
|
$
|
686,021
|
|
49%
|
16%
|
12%
|
23%
|
—%
|
|
Lilly Pulitzer
|
248,931
|
|
38%
|
34%
|
—%
|
28%
|
—%
|
|
|
Lanier Apparel
|
106,852
|
|
—%
|
—%
|
—%
|
100%
|
—%
|
|
|
Southern Tide
|
40,940
|
|
—%
|
19%
|
—%
|
81%
|
—%
|
|
|
Corporate and Other
|
3,467
|
|
—%
|
23%
|
—%
|
16%
|
61%
|
|
|
Total net sales
|
$
|
1,086,211
|
|
39%
|
19%
|
8%
|
34%
|
—%
|
90
OXFORD INDUSTRIES, INC.
NOTES TO CONSOLIDATED FINANCIAL STATEMENTS (Continued)
Note 2. Operating Groups (Continued)
|
Fiscal 2016
|
||||||||
|
Net Sales
|
Retail
|
E-commerce
|
Restaurant
|
Wholesale
|
Other
|
|||
|
Tommy Bahama
|
$
|
658,911
|
|
50%
|
16%
|
11%
|
23%
|
—%
|
|
Lilly Pulitzer
|
233,294
|
|
36%
|
32%
|
—%
|
32%
|
—%
|
|
|
Lanier Apparel
|
100,753
|
|
—%
|
—%
|
—%
|
100%
|
—%
|
|
|
Southern Tide
|
27,432
|
|
—%
|
23%
|
—%
|
77%
|
—%
|
|
|
Corporate and Other
|
2,198
|
|
—%
|
—%
|
—%
|
—%
|
100%
|
|
|
Total net sales
|
$
|
1,022,588
|
|
40%
|
18%
|
7%
|
35%
|
—%
|
Note 3. Property and Equipment, Net
Property and equipment, carried at cost, is summarized as follows (in thousands):
|
February 2, 2019
|
February 3, 2018
|
|||||
|
Land
|
$
|
3,166
|
|
$
|
3,166
|
|
|
Buildings and improvements
|
38,782
|
|
36,331
|
|
||
|
Furniture, fixtures, equipment and technology
|
223,666
|
|
205,854
|
|
||
|
Leasehold improvements
|
229,141
|
|
231,108
|
|
||
|
494,755
|
|
476,459
|
|
|||
|
Less accumulated depreciation and amortization
|
(302,179
|
)
|
(282,926
|
)
|
||
|
Property and equipment, net
|
$
|
192,576
|
|
$
|
193,533
|
|
Note 4. Intangible Assets and Goodwill
Intangible assets by category are summarized below (in thousands):
|
February 2, 2019
|
February 3, 2018
|
|||||
|
Intangible assets with finite lives
|
$
|
51,929
|
|
$
|
52,470
|
|
|
Accumulated amortization
|
(40,753
|
)
|
(38,612
|
)
|
||
|
Total intangible assets with finite lives, net
|
11,176
|
|
13,858
|
|
||
|
Intangible assets with indefinite lives:
|
|
|
||||
|
Tommy Bahama Trademarks
|
$
|
110,700
|
|
$
|
110,700
|
|
|
Lilly Pulitzer Trademarks
|
27,500
|
|
27,500
|
|
||
|
Southern Tide Trademarks
|
26,800
|
|
26,800
|
|
||
|
Total intangible assets, net
|
$
|
176,176
|
|
$
|
178,858
|
|
91
OXFORD INDUSTRIES, INC.
NOTES TO CONSOLIDATED FINANCIAL STATEMENTS (Continued)
Intangible assets, by operating group and in total, for
Fiscal 2016
,
Fiscal 2017
and
Fiscal 2018
are as follows (in thousands):
|
Tommy Bahama
|
Lilly Pulitzer
|
Lanier Apparel
|
Southern Tide
|
Corporate and Other
|
Total
|
|||||||||||||
|
Balance, January 30, 2016
|
$
|
114,944
|
|
$
|
28,794
|
|
$
|
—
|
|
$
|
—
|
|
$
|
—
|
|
$
|
143,738
|
|
|
Acquisition
|
—
|
|
—
|
|
3,137
|
|
30,240
|
|
—
|
|
33,377
|
|
||||||
|
Amortization
|
(1,599
|
)
|
(199
|
)
|
(89
|
)
|
(263
|
)
|
—
|
|
(2,150
|
)
|
||||||
|
Other, including foreign currency
|
280
|
|
—
|
|
—
|
|
—
|
|
—
|
|
280
|
|
||||||
|
Balance, January 28, 2017
|
113,625
|
|
28,595
|
|
3,048
|
|
29,977
|
|
—
|
|
175,245
|
|
||||||
|
Acquisition
|
—
|
|
1,500
|
|
—
|
|
—
|
|
4,440
|
|
5,940
|
|
||||||
|
Amortization
|
(1,580
|
)
|
(346
|
)
|
(172
|
)
|
(288
|
)
|
(18
|
)
|
(2,404
|
)
|
||||||
|
Other, including foreign currency
|
112
|
|
—
|
|
(35
|
)
|
—
|
|
—
|
|
77
|
|
||||||
|
Balance, February 3, 2018
|
112,157
|
|
29,749
|
|
2,841
|
|
29,689
|
|
4,422
|
|
178,858
|
|
||||||
|
Acquisition
|
—
|
|
—
|
|
—
|
|
—
|
|
—
|
|
—
|
|
||||||
|
Amortization
|
(1,385
|
)
|
(533
|
)
|
(171
|
)
|
(288
|
)
|
(233
|
)
|
(2,610
|
)
|
||||||
|
Other, including foreign currency
|
(72
|
)
|
—
|
|
—
|
|
—
|
|
—
|
|
(72
|
)
|
||||||
|
Balance, February 2, 2019
|
$
|
110,700
|
|
$
|
29,216
|
|
$
|
2,670
|
|
$
|
29,401
|
|
$
|
4,189
|
|
$
|
176,176
|
|
Based on the current estimated useful lives assigned to our intangible assets, amortization expense for each of the next five years is expected to be
$1.2 million
,
$1.2 million
,
$1.0 million
,
$1.0 million
and
$0.8 million
.
Goodwill, by operating group and in total, for
Fiscal 2016
,
Fiscal 2017
and
Fiscal 2018
is as follows (in thousands):
|
Tommy Bahama
|
Lilly Pulitzer
|
Southern Tide
|
Corporate and Other
|
Total
|
|||||||||||
|
Balance, January 30, 2016
|
$
|
728
|
|
$
|
16,495
|
|
$
|
—
|
|
$
|
—
|
|
$
|
17,223
|
|
|
Acquisition
|
—
|
|
—
|
|
42,745
|
|
—
|
|
42,745
|
|
|||||
|
Other, including foreign currency
|
47
|
|
—
|
|
—
|
|
—
|
|
47
|
|
|||||
|
Balance, January 28, 2017
|
775
|
|
16,495
|
|
42,745
|
|
—
|
|
60,015
|
|
|||||
|
Acquisition
|
—
|
|
3,027
|
|
—
|
|
3,615
|
|
6,642
|
|
|||||
|
Other, including foreign currency
|
46
|
|
—
|
|
—
|
|
—
|
|
46
|
|
|||||
|
Balance, February 3, 2018
|
821
|
|
19,522
|
|
42,745
|
|
3,615
|
|
66,703
|
|
|||||
|
Acquisition
|
—
|
|
—
|
|
—
|
|
—
|
|
—
|
|
|||||
|
Other, including foreign currency
|
(67
|
)
|
—
|
|
—
|
|
(15
|
)
|
(82
|
)
|
|||||
|
Balance, February 2, 2019
|
$
|
754
|
|
$
|
19,522
|
|
$
|
42,745
|
|
$
|
3,600
|
|
$
|
66,621
|
|
Note 5. Debt
We had
$13.0 million
outstanding as of
February 2, 2019
under our
$325 million
Fourth Amended and Restated Credit Agreement ("U.S. Revolving Credit Agreement") compared to
$45.8 million
of borrowings outstanding as of
February 3, 2018
.
The U.S. Revolving Credit Agreement generally (1) is limited to a borrowing base consisting of specified percentages of eligible categories of assets, (2) accrues variable-rate interest (weighted average borrowing rate of
5.8%
as of
February 2, 2019
), unused line fees and letter of credit fees based upon average unused availability or utilization, (3) requires periodic interest payments with principal due at maturity (May 2021) and (4) is secured by a first priority security interest in substantially all of the assets of Oxford Industries, Inc. and its domestic subsidiaries, including accounts receivable, books and records, chattel paper, deposit accounts, equipment, certain general intangibles, inventory, investment property (including the equity interests of certain subsidiaries), negotiable collateral, life insurance policies, supporting obligations, commercial tort
92
OXFORD INDUSTRIES, INC.
NOTES TO CONSOLIDATED FINANCIAL STATEMENTS (Continued)
Note 5. Debt (Continued)
claims, cash and cash equivalents, eligible trademarks, proceeds and other personal property. On May 24, 2016, the U.S. Revolving Credit Agreement amended and restated our Third Amended Restated Credit Agreement to (1) increase the borrowing capacity of the facility, (2) extend the maturity of the facility and (3) modify certain other provisions and restrictions of our Third Amended Restated Credit Agreement.
To the extent cash flow needs exceed cash flow provided by our operations we will have access, subject to its terms, to our U.S. Revolving Credit Agreement to provide funding for operating activities, capital expenditures and acquisitions, if any. Our U.S. Revolving Credit Agreement is also used to establish collateral for certain insurance programs and leases and to finance trade letters of credit for product purchases, which reduce the amounts available under our line of credit when issued. As of
February 2, 2019
,
$4.8 million
of letters of credit were outstanding against our U.S. Revolving Credit Agreement. After considering these limitations and the amount of eligible assets in our borrowing base, as applicable, as of
February 2, 2019
, we had
$253.7 million
in unused availability under the U.S. Revolving Credit Agreement, subject to certain limitations on borrowings.
Covenants, Other Restrictions and Prepayment Penalties
The U.S. Revolving Credit Agreement is subject to a number of affirmative covenants regarding the delivery of financial information, compliance with law, maintenance of property, insurance requirements and conduct of business. Also, the U.S. Revolving Credit Agreement is subject to certain negative covenants or other restrictions including, among other things, limitations on our ability to (1) incur debt, (2) guaranty certain obligations, (3) incur liens, (4) pay dividends to shareholders, (5) repurchase shares of our common stock, (6) make investments, (7) sell assets or stock of subsidiaries, (8) acquire assets or businesses, (9) merge or consolidate with other companies or (10) prepay, retire, repurchase or redeem debt.
Additionally, the U.S. Revolving Credit Agreement contains a financial covenant that applies if excess availability under the agreement for
three
consecutive days is less than the greater of (1)
$23.5 million
or (2)
10%
of availability. In such case, our fixed charge coverage ratio as defined in the U.S. Revolving Credit Agreement must not be less than
1.0
to
1.0
for the immediately preceding
12
fiscal months for which financial statements have been delivered. This financial covenant continues to apply until we have maintained excess availability under the U.S. Revolving Credit Agreement of more than the greater of (1)
$23.5 million
or (2)
10%
of availability for
30
consecutive days.
We believe that the affirmative covenants, negative covenants, financial covenants and other restrictions under the U.S. Revolving Credit Agreement are customary for those included in similar facilities entered into at the time we entered into the U.S. Revolving Credit Agreement. During
Fiscal 2018
and as of
February 2, 2019
, no financial covenant testing was required pursuant to our U.S. Revolving Credit Agreement as the minimum availability threshold was met at all times. As of
February 2, 2019
, we were compliant with all covenants related to the U.S. Revolving Credit Agreement.
Note 6. Commitments and Contingencies
We have operating lease agreements for retail space, restaurants, warehouses and sales and administrative offices as well as equipment with varying terms. Total rent expense, which includes minimum rents, sales tax, real estate taxes, insurance and other operating expenses and contingent rents incurred under all leases was
$95.9 million
,
$92.1 million
and
$87.8 million
in
Fiscal 2018
,
Fiscal 2017
and
Fiscal 2016
, respectively. Most of our leases provide for payments of real estate taxes, sales taxes, insurance or other operating expenses applicable to the property and most of our retail and restaurant leases also provide for contingent rent based on sales. Payments for real estate taxes, sales tax, insurance, other operating expenses and contingent percentage rent are included in rent expense above, but are generally not included in the aggregate minimum rental commitments below, as, in many cases, the amounts payable in future periods are not quantified in the lease agreement or may be dependent on future events. The total amount of such charges included in total rent expense above were
$28.4 million
,
$24.8 million
and
$23.9 million
in
Fiscal 2018
,
Fiscal 2017
and
Fiscal 2016
, respectively, which includes
$1.9 million
,
$1.6 million
and
$1.1 million
of contingent percentage rent during
Fiscal 2018
,
Fiscal 2017
and
Fiscal 2016
, respectively.
As of
February 2, 2019
, the aggregate minimum base rental commitments for all non-cancelable operating real property leases with original terms in excess of one year are
$68.4 million
,
$65.5 million
,
$62.4 million
,
$59.4 million
, and
$50.5 million
for each of the next five years and
$123.8 million
thereafter.
93
OXFORD INDUSTRIES, INC.
NOTES TO CONSOLIDATED FINANCIAL STATEMENTS (Continued)
As of
February 2, 2019
, we are also obligated under certain apparel license and design agreements to make future minimum royalty and advertising payments of
$5.6 million
,
$5.6 million
,
$3.6 million
,
$0.0 million
, and
$0.0 million
for each of the next five years and
none
thereafter. These amounts do not include amounts, if any, that exceed the minimums required pursuant to the agreements.
During the 1990s, we discovered the presence of hazardous waste on
one
of our properties. We believe that remedial or other activities may be required, including continued investigation and monitoring of groundwater and soil, although the timing and extent of such activities is uncertain. As of
February 2, 2019
and
February 3, 2018
, the reserve for the remediation of this site was
$0.4 million
and
$0.5 million
, respectively, which is included in other non-current liabilities in our consolidated balance sheets. The amount recorded represents our estimate of the costs, on an undiscounted basis, to clean up and monitor the site as well as any associated legal and consulting fees, based on currently available information. This estimate may change in future periods as more information on the activities required and timing of those activities become known.
In Fiscal 2016, we recognized a charge of
$1.3 million
related to an assertion of underpaid customs duties concerning the method used to determine the dutiable value of certain inventory. We appealed this assessment in accordance with the standard procedures of the relevant customs authorities. We obtained a favorable ruling on appeal resulting in the
Fiscal 2018
reversal for all amounts previously accrued related to the assertion. The liability included in our consolidated balance sheet related to this assertion of underpaid customs duties was
$0.0 million
and
$1.9 million
as of
February 2, 2019
and
February 3, 2018
, respectively.
In connection with our Fiscal 2017 acquisition of TBBC, as disclosed in Note 12, we entered into a contingent consideration agreement which requires us to make cash payments to the sellers of up to
$3.5 million
in the aggregate subject to TBBC's achievement of certain earnings targets over a
four
year period subsequent to the acquisition. As of
February 2, 2019
,
$0.3 million
has been earned and is payable in Fiscal 2019 pursuant to this contingent consideration agreement. One of the sellers of TBBC is an employee and continues to manage the operations of TBBC.
Note 7. Shareholders' Equity
Common Stock
We had
60 million
shares of
$1.00
par value per share common stock authorized for issuance as of
February 2, 2019
and
February 3, 2018
. We had
17.0 million
and
16.8 million
shares of common stock issued and outstanding as of
February 2, 2019
and
February 3, 2018
, respectively.
Long-Term Stock Incentive Plan
As of
February 2, 2019
,
0.8 million
shares were available for issuance under our Long-Term Stock Incentive Plan (the "Long-Term Stock Incentive Plan"). The Long-Term Stock Incentive Plan allows us to grant equity-based awards to employees and non-employee directors in the form of stock options, stock appreciation rights, restricted shares and/or restricted share units.
No
additional grants are available under any predecessor plans.
Restricted share awards granted to officers and other key employees generally vest
three
or
four years
from the date of grant if (1) the performance threshold, if any, was met and (2) the employee is still employed by us on the vesting date. At the time that restricted shares are issued, the shareholder is generally, subject to the terms of the respective agreement, entitled to the same dividend and voting rights as other holders of our common stock as long as the restricted shares are outstanding. The employee generally is restricted from transferring or selling any restricted shares and generally forfeits the awards upon the termination of employment prior to the end of the vesting period. The specific provisions of the awards, including exercisability and term of the award, are evidenced by agreements with the employee as determined by the compensation committee of our Board of Directors.
The table below summarizes the restricted share award activity for officers and other key employees (in shares) during
Fiscal 2018
,
Fiscal 2017
, and
Fiscal 2016
:
94
OXFORD INDUSTRIES, INC.
NOTES TO CONSOLIDATED FINANCIAL STATEMENTS (Continued)
|
|
Fiscal 2018
|
Fiscal 2017
|
Fiscal 2016
|
||||||||||||
|
|
Number of
Shares
|
Weighted-
average
grant date
fair value
|
Number of
Shares
|
Weighted-
average
grant date
fair value
|
Number of
Shares
|
Weighted-
average
grant date
fair value
|
|||||||||
|
Restricted share awards outstanding at beginning of fiscal year
|
211,045
|
|
$
|
63
|
|
228,682
|
|
$
|
69
|
|
175,886
|
|
$
|
67
|
|
|
Service-based restricted share awards granted/issued
|
49,726
|
|
$
|
79
|
|
58,753
|
|
$
|
56
|
|
44,437
|
|
$
|
73
|
|
|
Performance-based restricted share awards issued related to prior year performance awards
|
72,427
|
|
$
|
57
|
|
30,443
|
|
$
|
76
|
|
87,009
|
|
$
|
58
|
|
|
Restricted share awards vested, including restricted shares repurchased from employees for employees' tax liability
|
(73,408
|
)
|
$
|
58
|
|
(92,239
|
)
|
$
|
78
|
|
(58,711
|
)
|
$
|
51
|
|
|
Restricted share awards forfeited
|
(1,900
|
)
|
62
|
|
(14,594
|
)
|
58
|
|
(19,939
|
)
|
67
|
|
|||
|
Restricted share awards outstanding at end of fiscal year
|
257,890
|
|
$
|
66
|
|
211,045
|
|
$
|
63
|
|
228,682
|
|
$
|
69
|
|
The following table summarizes information about the unvested restricted share awards as of
February 2, 2019
. The unvested restricted share awards will be settled in shares of our common stock on the vesting date, subject to the employee still being an employee at that time.
|
Description
|
Number of
Unvested Share Awards
|
Average Market
Price on
Date of Grant
|
|||
|
Service-based & Performance-based Restricted Share Awards Vesting in April 2019
|
74,317
|
|
$
|
73
|
|
|
Service-based & Performance-based Restricted Share Awards Vesting in April 2020
|
117,837
|
|
$
|
57
|
|
|
Service-based Restricted Share Awards Vesting in April 2021
|
43,636
|
|
$
|
75
|
|
|
Other Service-based Restricted Share Awards Vesting at Various Dates
|
22,100
|
|
$
|
71
|
|
|
Total
|
257,890
|
|
|||
Restricted shares pursuant to performance-based awards are not issued until approved by our compensation committee following completion of the performance period. During Fiscal 2018, approximately
45,000
restricted shares were earned by recipients related to the Fiscal 2018 performance period; however, these share awards were not included in the tables above as the awards had not been issued as of
February 2, 2019
. The grant date fair value of these
45,000
awards was
$79
per share, and the awards vest in April 2021.
As of
February 2, 2019
, there was
$8.5 million
of unrecognized compensation expense related to the unvested restricted share awards, which have been granted to employees but have not yet vested, including the Fiscal 2018 performance-based awards issued in the First Quarter of Fiscal 2019. As of
February 2, 2019
, the weighted average remaining life of the outstanding awards was one year.
In addition, we grant restricted shares to our non-employee directors for a portion of each non-employee director's compensation. The non-employee directors must complete certain service requirements; otherwise, the restricted shares are subject to forfeiture. On the date of issuance, the non-employee directors are entitled to the same dividend and voting rights as other holders of our common stock. The non-employee directors are restricted from transferring or selling the restricted shares prior to the end of the vesting period.
Employee Stock Purchase Plan
95
OXFORD INDUSTRIES, INC.
NOTES TO CONSOLIDATED FINANCIAL STATEMENTS (Continued)
There were
0.4 million
shares of our common stock authorized for issuance under our Employee Stock Purchase Plan ("ESPP") as of
February 2, 2019
. The ESPP allows qualified employees to purchase shares of our common stock on a quarterly basis, based on certain limitations, through payroll deductions. The shares purchased pursuant to the ESPP are not subject to any vesting or other restrictions. On the last day of each calendar quarter, the accumulated payroll deductions are applied toward the purchase of our common stock at a price equal to
85%
of the closing market price on that date. Equity compensation expense related to the employee stock purchase plan recognized was
$0.3 million
,
$0.2 million
and
$0.2 million
in
Fiscal 2018
,
Fiscal 2017
and
Fiscal 2016
, respectively.
Preferred Stock
We had
30 million
shares of
$1.00
par value preferred stock authorized for issuance as of
February 2, 2019
and
February 3, 2018
.
No
preferred shares were issued or outstanding as of
February 2, 2019
or
February 3, 2018
.
Note 8. Income Taxes
U.S. Tax Reform, as enacted on December 22, 2017, made significant changes in the taxation of our domestic and foreign earnings. The change in the federal corporate tax rate also required revaluation of our deferred tax assets and liabilities to reflect the enacted rate at which we expect those differences to reverse. U.S. Tax Reform moves the U.S. to a territorial taxation system under which the earnings of foreign subsidiaries will generally not be subject to U.S. federal income tax upon distribution and imposed a one-time transition tax on the amount of previously untaxed earnings of those foreign subsidiaries measured as of November 2, 2017 or December 31, 2017, whichever resulted in the greater taxable amount. Additional changes included the increase in bonus depreciation available for certain assets acquired after September 27, 2017 and limitations on the deduction for certain expenses, including executive compensation and interest incurred in taxable years beginning on or after January 1, 2018. Other changes impacting foreign taxable income included, for years beginning after December 31, 2017, a tax on global intangible low-taxed income (“GILTI”), disallowance of deductions for certain payments (the base erosion anti-abuse tax, or “BEAT”) and new deductions enacted for certain foreign-derived intangible income (“FDII”).
The SEC issued Staff Accounting Bulletin No. 118 (“SAB 118”), which provided us with up to one year to complete accounting for the impacts of U.S. Tax Reform. In accordance with SAB 118, since our initial accounting for the U.S. Tax Reform impact was incomplete, we included a provisional income tax benefit of
$11.5 million
in our Fiscal 2017 consolidated statements of operations. The estimated provisional tax benefit primarily related to our deferred income tax assets and liabilities, including the impacts of the change in the federal corporate tax rate, deductions for executive compensation, our indefinite reinvestment assertion, the transition tax, GILTI, BEAT, and FDII. During Fiscal 2018 as we completed our calculation of the impact of U.S. Tax Reform, we did not recognize any material measurement period adjustments to the provisional amounts recognized in Fiscal 2017. The final impact of U.S. Tax Reform could change in the future if additional regulatory guidance is issued which clarifies or changes certain regulations as currently interpreted by us. In the Fourth Quarter of Fiscal 2018, we elected an accounting policy related to how we will account for GILTI and determined that we would recognize the impact of GILTI as a period cost.
The following table summarizes our distribution between domestic and foreign earnings (loss) before income taxes and the provision (benefit) for income taxes (in thousands):
96
OXFORD INDUSTRIES, INC.
NOTES TO CONSOLIDATED FINANCIAL STATEMENTS (Continued)
|
Fiscal
2018 |
Fiscal
2017 |
Fiscal
2016 |
|||||||
|
Earnings from continuing operations before income taxes:
|
|
|
|
||||||
|
Domestic
|
$
|
85,050
|
|
$
|
78,707
|
|
$
|
84,843
|
|
|
Foreign
|
3,259
|
|
4,184
|
|
1,620
|
|
|||
|
Earnings from continuing operations before income taxes
|
$
|
88,309
|
|
$
|
82,891
|
|
$
|
86,463
|
|
|
Income taxes:
|
|||||||||
|
Current:
|
|
|
|
||||||
|
Federal
|
$
|
12,543
|
|
$
|
11,710
|
|
$
|
19,704
|
|
|
State
|
4,474
|
|
3,775
|
|
4,475
|
|
|||
|
Foreign
|
1,979
|
|
707
|
|
599
|
|
|||
|
18,996
|
|
16,192
|
|
24,778
|
|
||||
|
Deferred—primarily Federal
|
3,141
|
|
1,690
|
|
8,108
|
|
|||
|
Deferred—Foreign
|
(119
|
)
|
308
|
|
(922
|
)
|
|||
|
Income taxes
|
$
|
22,018
|
|
$
|
18,190
|
|
$
|
31,964
|
|
Reconciliations of the United States federal statutory income tax rates and our effective tax rates are summarized as follows:
|
Fiscal
2018 |
Fiscal
2017 |
Fiscal
2016 |
||||
|
Statutory tax rate
(1)
|
21.0
|
%
|
33.7
|
%
|
35.0
|
%
|
|
State income taxes—net of federal income tax benefit
|
4.6
|
%
|
3.6
|
%
|
3.8
|
%
|
|
Impact of foreign operations rate differential
(2)
|
0.7
|
%
|
(0.6
|
)%
|
(0.4
|
)%
|
|
Valuation allowance for foreign losses and other carry-forwards
(3)
|
(0.1
|
)%
|
1.1
|
%
|
(0.6
|
)%
|
|
U.S. Tax Reform impact of tax rate change on deferred tax amounts
|
—
|
%
|
(14.4
|
)%
|
—
|
%
|
|
Other, net
|
(1.3
|
)%
|
(1.5
|
)%
|
(0.8
|
)%
|
|
Effective tax rate for continuing operations
|
24.9
|
%
|
21.9
|
%
|
37.0
|
%
|
|
(1)
The statutory tax rate for Fiscal 2018 reflects the reduction of the federal corporate marginal tax rate to 21%, while Fiscal 2016 reflects the federal corporate marginal tax rate prior to U.S. Tax Reform of 35%. Fiscal 2017 is a blended rate that reflects the reduction of the federal corporate marginal tax rate effective January 1, 2018.
|
||||||
|
(2)
Impact of foreign operations rate differential primarily reflects the rate differential between the United States and the respective foreign jurisdictions for any foreign income or losses, and the impact of any permanent differences.
|
||||||
|
(3)
Valuation allowance for foreign losses and other carry-forwards primarily reflects the valuation allowance recorded due to our inability to recognize an income tax benefit related to certain operating loss carry-forwards and deferred tax assets during the period. The benefit in Fiscal 2018 and Fiscal 2016 was primarily due to the utilization of certain operating loss carryforward benefits against current year earnings and changes in our assessment of the likelihood of recognition of certain foreign operating loss carryforwards.
|
||||||
Deferred tax assets and liabilities included in our consolidated balance sheets are comprised of the following (in thousands):
97
OXFORD INDUSTRIES, INC.
NOTES TO CONSOLIDATED FINANCIAL STATEMENTS (Continued)
|
February 2,
2019 |
February 3,
2018 |
|||||
|
Deferred Tax Assets:
|
|
|
||||
|
Inventories
|
$
|
13,210
|
|
$
|
12,207
|
|
|
Accrued compensation and benefits
|
8,096
|
|
7,660
|
|
||
|
Receivable allowances and reserves
|
890
|
|
1,630
|
|
||
|
Deferred rent and lease obligations
|
3,371
|
|
3,322
|
|
||
|
Operating loss and other carry-forwards
|
2,785
|
|
4,218
|
|
||
|
Other, net
|
4,122
|
|
3,739
|
|
||
|
Deferred tax assets
|
32,474
|
|
32,776
|
|
||
|
Deferred Tax Liabilities:
|
|
|
||||
|
Depreciation and amortization
|
(11,917
|
)
|
(10,210
|
)
|
||
|
Acquired intangible assets
|
(32,913
|
)
|
(31,327
|
)
|
||
|
Deferred tax liabilities
|
(44,830
|
)
|
(41,537
|
)
|
||
|
Valuation allowance
|
(5,103
|
)
|
(5,624
|
)
|
||
|
Net deferred tax liability
|
$
|
(17,459
|
)
|
$
|
(14,385
|
)
|
As of
February 2, 2019
and
February 3, 2018
our operating loss and other carry-forwards primarily relate to our operations in Canada, Hong Kong and Japan, as well as certain states. The majority of these operating loss carry-forwards allow for carry-forward of at least
20 years
and in some cases, indefinitely. The substantial majority of our valuation allowance of
$5.1 million
and
$5.6 million
as of
February 2, 2019
and
February 3, 2018
, respectively, relates to the foreign and state operating loss carry-forwards and the deferred tax assets in those jurisdictions. The recent history of operating losses in certain jurisdictions is considered significant negative evidence against the future realizability of these tax benefits. The amount of the valuation allowance could change in the future if our operating results or estimates of future taxable operating results changes, particularly if, in future years, objective evidence in the form of cumulative losses is no longer present in the applicable jurisdictions. Alternatively, if we generate additional operating losses in future periods in certain jurisdictions, we may determine it is necessary to increase valuation allowances for certain deferred tax assets.
No
deferred tax liabilities related to our original investments in our foreign subsidiaries and foreign earnings and profits ("E&P"), if any, were recorded in our consolidated balance sheet through Fiscal 2017, as substantially all our original investments and related earnings of our foreign subsidiaries have been considered reinvested outside of the United States. While U.S. Tax Reform made significant changes to how foreign earnings are taxed, we continue to assert that all of our investments in foreign subsidiaries and related earnings are permanently reinvested outside the United States. Therefore, we have
not
recorded any deferred tax liabilities related to investments and earnings in our consolidated balance sheets as of
February 2, 2019
. To the extent that foreign earnings were to be distributed, the foreign earnings should not be subject to federal tax under the new U.S. tax rules. While other taxes could be payable on such distributions, including state, foreign withholding or other taxes under foreign law, we believe that such tax expense would not be material.
Accounting for income taxes requires that we offset all deferred tax liabilities and assets within each tax jurisdiction and present them as a single amount in our consolidated balance sheets, with all net deferred tax assets or deferred tax liabilities by jurisdiction recognized as non-current deferred tax assets or deferred tax liabilities in our consolidated balance sheets. The amounts of deferred income taxes included in our consolidated balance sheets are as follows (in thousands):
98
OXFORD INDUSTRIES, INC.
NOTES TO CONSOLIDATED FINANCIAL STATEMENTS (Continued)
|
February 2,
2019 |
February 3,
2018 |
|||||
|
Assets:
|
|
|
||||
|
Deferred tax assets
|
$
|
952
|
|
$
|
884
|
|
|
Liabilities:
|
|
|
||||
|
Deferred tax liabilities
|
(18,411
|
)
|
(15,269
|
)
|
||
|
Net deferred tax liability
|
$
|
(17,459
|
)
|
$
|
(14,385
|
)
|
Note 9. Defined Contribution Plans
We have a tax-qualified voluntary retirement savings plan covering substantially all United States employees and other similar plans covering certain foreign employees. If a participant elects to contribute, a portion of the contribution may be matched by us. Additionally, we incur certain charges related to our non-qualified deferred compensation plan as discussed in Note 1. Realized and unrealized gains and losses on the deferred compensation plan investments are recorded in SG&A in our consolidated statements of operations and substantially offset the changes in deferred compensation liabilities to participants resulting from changes in market values. Our aggregate expense under these defined contribution and non-qualified deferred compensation plans in
Fiscal 2018
,
Fiscal 2017
and
Fiscal 2016
was
$5.1 million
,
$3.6 million
and
$3.5 million
, respectively, with the increase in
Fiscal 2018
primarily due to an increase in the company match for the voluntary retirement savings plan.
Note 10. Summarized Quarterly Data (unaudited)
Each of our fiscal quarters consists of thirteen week periods, beginning on the first day after the end of the prior fiscal quarter, except that the fourth quarter in a year with
53
weeks (such as Fiscal 2017) includes
14
weeks. Following is a summary of our
Fiscal 2018
and
Fiscal 2017
, quarterly results (in thousands, except per share amounts):
99
OXFORD INDUSTRIES, INC.
NOTES TO CONSOLIDATED FINANCIAL STATEMENTS (Continued)
|
First
Quarter
|
Second
Quarter
|
Third
Quarter
|
Fourth
Quarter
|
Total
(1)
|
|||||||||||
|
Fiscal 2018
|
|
|
|
|
|
||||||||||
|
Net sales
|
$
|
272,628
|
|
$
|
302,641
|
|
$
|
233,662
|
|
$
|
298,535
|
|
$
|
1,107,466
|
|
|
Gross profit
|
$
|
164,146
|
|
$
|
179,297
|
|
$
|
129,279
|
|
$
|
164,402
|
|
$
|
637,124
|
|
|
Operating income
|
$
|
28,373
|
|
$
|
36,513
|
|
$
|
3,705
|
|
$
|
22,001
|
|
$
|
90,592
|
|
|
Net earnings
(2)
|
$
|
20,567
|
|
$
|
27,184
|
|
$
|
1,861
|
|
$
|
16,679
|
|
$
|
66,291
|
|
|
Net earnings per share
(2)
:
|
|||||||||||||||
|
Basic
|
$
|
1.24
|
|
$
|
1.63
|
|
$
|
0.11
|
|
$
|
1.00
|
|
$
|
3.97
|
|
|
Diluted
|
$
|
1.23
|
|
$
|
1.61
|
|
$
|
0.11
|
|
$
|
0.99
|
|
$
|
3.94
|
|
|
Weighted average shares outstanding:
|
|
|
|
||||||||||||
|
Basic
|
16,639
|
|
16,683
|
|
16,694
|
|
16,698
|
|
16,678
|
|
|||||
|
Diluted
|
16,769
|
|
16,840
|
|
16,870
|
|
16,890
|
|
16,842
|
|
|||||
|
Fiscal 2017
|
|
|
|
|
|
||||||||||
|
Net sales
|
$
|
272,363
|
|
$
|
284,709
|
|
$
|
235,960
|
|
$
|
293,179
|
|
$
|
1,086,211
|
|
|
Gross profit
|
$
|
159,410
|
|
$
|
165,969
|
|
$
|
125,176
|
|
$
|
162,077
|
|
$
|
612,632
|
|
|
Operating income
|
$
|
29,959
|
|
$
|
36,402
|
|
$
|
1,124
|
|
$
|
18,515
|
|
$
|
86,000
|
|
|
Net earnings from continuing operations
|
$
|
17,197
|
|
$
|
22,689
|
|
$
|
1,072
|
|
$
|
23,743
|
|
$
|
64,701
|
|
|
Income from discontinued operations, net of taxes
|
$
|
—
|
|
$
|
—
|
|
$
|
—
|
|
$
|
389
|
|
$
|
389
|
|
|
Net earnings
|
$
|
17,197
|
|
$
|
22,689
|
|
$
|
1,072
|
|
$
|
24,132
|
|
$
|
65,090
|
|
|
Net earnings from continuing operations per share:
|
|||||||||||||||
|
Basic
|
$
|
1.04
|
|
$
|
1.37
|
|
$
|
0.06
|
|
$
|
1.43
|
|
$
|
3.90
|
|
|
Diluted
|
$
|
1.03
|
|
$
|
1.36
|
|
$
|
0.06
|
|
$
|
1.41
|
|
$
|
3.87
|
|
|
Income from discontinued operations, net of taxes, per share:
|
|||||||||||||||
|
Basic
|
$
|
—
|
|
$
|
—
|
|
$
|
—
|
|
$
|
0.02
|
|
$
|
0.02
|
|
|
Diluted
|
$
|
—
|
|
$
|
—
|
|
$
|
—
|
|
$
|
0.02
|
|
$
|
0.02
|
|
|
Net earnings per share:
|
|||||||||||||||
|
Basic
|
$
|
1.04
|
|
$
|
1.37
|
|
$
|
0.06
|
|
$
|
1.45
|
|
$
|
3.92
|
|
|
Diluted
|
$
|
1.03
|
|
$
|
1.36
|
|
$
|
0.06
|
|
$
|
1.44
|
|
$
|
3.89
|
|
|
Weighted average shares outstanding:
|
|
|
|
||||||||||||
|
Basic
|
16,549
|
|
16,605
|
|
16,618
|
|
16,624
|
|
16,600
|
|
|||||
|
Diluted
|
16,695
|
|
16,700
|
|
16,735
|
|
16,802
|
|
16,734
|
|
|||||
|
(1)
The sum of the quarterly net earnings per share amounts may not equal the amount for the year due to rounding.
|
|||||||||||||||
|
(2)
There were no net earnings from discontinued operations in Fiscal 2018.
|
|||||||||||||||
The Fourth Quarters of
Fiscal 2018
and
Fiscal 2017
included a LIFO accounting charge of
$0.7 million
and
$4.1 million
, respectively. The full years of
Fiscal 2018
and
Fiscal 2017
included a LIFO accounting charge of
$0.8 million
and
$7.8 million
, respectively. Additionally, the Fourth Quarter of Fiscal 2017 and Fiscal 2017 included a reduction of tax expense of
$11.5 million
related to U.S. Tax Reform as disclosed in Note 8.
100
OXFORD INDUSTRIES, INC.
NOTES TO CONSOLIDATED FINANCIAL STATEMENTS (Continued)
Note 11. Business Combinations
Fiscal 2017 Business Combinations
During Fiscal 2017 we completed certain acquisitions which resulted in our acquisition of TBBC and 12 Lilly Pulitzer Signature Stores. TBBC, which we acquired in December 2017, designs, sources, markets and distributes premium childrenswear including bonnets, hats, apparel, swimwear and accessories through the TBBC e-commerce website as well as wholesale specialty retailers. The Lilly Pulitzer Signature Stores that were acquired are located in Massachusetts, Virginia and Maryland. We believe the TBBC acquisition further advances our strategic goal of owning a diversified portfolio of lifestyle brands, while the acquisition of the Lilly Pulitzer Signature Stores allows for growth of Lilly Pulitzer's direct to consumer business, particularly in some key markets. Subsequent to their respective acquisitions, the acquired Lilly Pulitzer Signature Stores are included in our Lilly Pulitzer operating group, while the TBBC operations are included in Corporate and Other.
The purchase price, in the aggregate, of our Fiscal 2017 acquisitions was
$17.5 million
primarily consisting of cash, subject to adjustment based on net working capital or inventory amounts as of the closing dates of the respective acquisitions. We used borrowings under our revolving credit facility to finance the transactions. Transaction and integration costs related to the acquisitions totaled
$1.0 million
and are included in SG&A in
Fiscal 2018
. The following table summarizes our allocation of the purchase price for the Fiscal 2017 acquisitions, in the aggregate (in thousands):
|
Fiscal 2017 acquisitions
|
|||
|
Cash and cash equivalents
|
$
|
406
|
|
|
Inventories (1)
|
3,910
|
|
|
|
Prepaid expenses and other current assets
|
595
|
|
|
|
Property and equipment
|
682
|
|
|
|
Intangible assets
|
5,940
|
|
|
|
Goodwill
|
6,642
|
|
|
|
Accounts payable, accrued expenses and other liabilities
|
(640
|
)
|
|
|
Purchase price (2)
|
$
|
17,535
|
|
|
(1) Includes a step-up of acquired inventory from cost to fair value of $1.3 million with $1.2 million of this step-up amount recognized in Fiscal 2017 in cost of goods sold in our consolidated statement of operations.
|
|||
|
(2) In connection with the TBBC acquisition, we entered into a contingent consideration agreement pursuant to which we will be obligated to make cash payments to the sellers of up to $3.5 million in the aggregate subject to TBBC's achievement of certain earnings targets over a four year period subsequent to the acquisition. Estimated fair value of the contingent consideration amount as of the acquisition date was $0.3 million.
|
|||
Intangible assets allocated in connection with our purchase price allocation consisted of the following (in thousands):
|
Useful life
|
Fiscal 2017 acquisitions
|
|||
|
Finite lived intangible assets acquired:
|
||||
|
Trade names and trademarks
|
20 years
|
$
|
4,220
|
|
|
Other intangible assets including reacquired rights, customer relationships and non-compete agreements
|
3 - 10 years
|
$
|
1,720
|
|
|
$
|
5,940
|
|
||
Fiscal 2016 Business Combinations
On April 19, 2016, we acquired Southern Tide, LLC, which owns the Southern Tide lifestyle apparel brand. Southern Tide carries an extensive selection of men’s shirts, pants, shorts, outerwear, ties, swimwear, footwear and accessories, as well as a women’s collection. The brand’s products are sold through its wholesale operations to specialty stores and department stores as well as through its direct to consumer operations on the Southern Tide website. We believe that the acquisition of Southern Tide further advances our strategic goal of owning a diversified portfolio of lifestyle brands. The acquisition provides strategic benefits through growth opportunities and further diversification of our business.
101
OXFORD INDUSTRIES, INC.
NOTES TO CONSOLIDATED FINANCIAL STATEMENTS (Continued)
The purchase price for the acquisition of Southern Tide was
$85 million
in cash, subject to adjustment based on net working capital as of the closing date of the acquisition. After giving effect to the final working capital adjustment paid in Fiscal 2016, the purchase price paid was
$92.0 million
, net of acquired cash of
$2.4 million
. We used borrowings under our revolving credit facility to finance the transaction. Transaction costs related to this acquisition totaled
$0.8 million
and are included in SG&A in Corporate and Other in Fiscal 2016. The following table summarizes our allocation of the purchase price for the Southern Tide acquisition (in thousands):
|
Southern Tide acquisition
|
|||
|
Cash and cash equivalents
|
$
|
2,423
|
|
|
Receivables
|
6,616
|
|
|
|
Inventories (1)
|
16,251
|
|
|
|
Prepaid expenses
|
740
|
|
|
|
Property and equipment
|
220
|
|
|
|
Intangible assets
|
30,240
|
|
|
|
Goodwill
|
42,745
|
|
|
|
Other non-current assets
|
344
|
|
|
|
Accounts payable, accrued expenses and other liabilities
|
(3,473
|
)
|
|
|
Deferred taxes
|
(1,812
|
)
|
|
|
Purchase price
|
$
|
94,294
|
|
|
(1) Includes a step-up of acquired inventory from cost to fair value of $2.7 million. This step-up amount was recognized in Fiscal 2016 in cost of goods sold in our consolidated statement of operations.
|
|||
Intangible assets allocated in connection with our purchase price allocation consisted of the following (in thousands):
|
Useful life
|
Southern Tide acquisition
|
|||
|
Finite lived intangible assets acquired, primarily consisting of customer relationships
|
5 - 20 years
|
$
|
3,440
|
|
|
Trade names and trademarks
|
Indefinite
|
26,800
|
|
|
|
$
|
30,240
|
|
||
In addition to the Southern Tide acquisition, Lanier Apparel completed
two
acquisitions resulting in total cash payments of
$3.1 million
in Fiscal 2016. Assets acquired in these acquisitions primarily consisted of certain intangible assets.
102
OXFORD INDUSTRIES, INC.
NOTES TO CONSOLIDATED FINANCIAL STATEMENTS (Continued)
Note 12. Tommy Bahama Japan Charges
During Fiscal 2018, we incurred certain charges related to the restructure and downsizing of our Tommy Bahama Japan operations, including the Fiscal 2018 early lease termination and closure of the Tommy Bahama Ginza flagship retail-restaurant location, for which the lease was previously scheduled to expire in 2022. These charges totaled
$3.7 million
in Fiscal 2018, consisting of
$1.5 million
of lease termination and premises reinstatement charges,
$1.1 million
of non-cash asset impairment charges,
$0.5 million
of inventory markdowns and
$0.5 million
of other charges including employee severance. These charges, which are included in Tommy Bahama, were recognized in SG&A except for the inventory markdowns which were recognized in cost of goods sold. As of
February 2, 2019
, amounts related to these charges that are still outstanding total
$1.4 million
, which are primarily related to lease termination and premises reinstatement charges, and are included in current liabilities in our consolidated balance sheet. These amounts are expected to be paid in the first half of Fiscal 2019.
103
SCHEDULE II
Oxford Industries, Inc.
Valuation and Qualifying Accounts
|
Column A
|
Column B
|
Column C
|
Column D
|
|
Column E
|
||||||||||||
|
Description
|
Balance at
Beginning
of Period
|
Additions
Charged to
Costs and
Expenses
|
Charged
to Other
Accounts–
Describe
|
Deductions–
Describe
|
|
Balance at
End of
Period
|
|||||||||||
|
|
(In thousands)
|
||||||||||||||||
|
Fiscal 2018
|
|
|
|
|
|
|
|||||||||||
|
Deducted from asset accounts:
|
|
|
|
|
|
|
|||||||||||
|
Accounts receivable reserves(1)
|
$
|
6,485
|
|
$
|
9,599
|
|
—
|
|
|
$
|
(9,438
|
)
|
(4)
|
$
|
6,646
|
|
|
|
Allowance for doubtful accounts(2)
|
$
|
1,659
|
|
$
|
225
|
|
—
|
|
|
$
|
(1,223
|
)
|
(5)
|
$
|
661
|
|
|
|
Fiscal 2017
|
|
|
|
|
|
|
|||||||||||
|
Deducted from asset accounts:
|
|
|
|
|
|
|
|||||||||||
|
Accounts receivable reserves(1)
|
$
|
9,301
|
|
$
|
9,059
|
|
—
|
|
|
$
|
(11,875
|
)
|
(4)
|
$
|
6,485
|
|
|
|
Allowance for doubtful accounts(2)
|
$
|
811
|
|
$
|
1,366
|
|
—
|
|
|
$
|
(518
|
)
|
(5)
|
$
|
1,659
|
|
|
|
Fiscal 2016
|
|
|
|
|
|
|
|||||||||||
|
Deducted from asset accounts:
|
|
|
|
|
|
|
|||||||||||
|
Accounts receivable reserves(1)
|
$
|
8,402
|
|
$
|
10,032
|
|
$
|
153
|
|
(3)
|
$
|
(9,286
|
)
|
(4)
|
$
|
9,301
|
|
|
Allowance for doubtful accounts(2)
|
$
|
454
|
|
$
|
506
|
|
$
|
80
|
|
(3)
|
$
|
(229
|
)
|
(5)
|
$
|
811
|
|
_______________________________________________________________________________
|
(1)
|
Accounts receivable reserves include estimated reserves for allowances, returns and discounts related to our wholesale operations as discussed in our significant accounting policy disclosure for "Revenue Recognition and Receivables" in Note 1 of our consolidated financial statements.
|
|
(2)
|
Allowance for doubtful accounts consists of amounts reserved for our estimate of a customer's inability to meet its financial obligations as discussed in our significant accounting policy disclosure for "Revenue Recognition and Receivables" in Note 1 of our consolidated financial statements.
|
|
(3)
|
Addition due to business combinations in Fiscal 2016.
|
|
(4)
|
Principally amounts written off related to customer allowances, returns and discounts.
|
|
(5)
|
Principally accounts written off as uncollectible.
|
104
Report of Independent Registered Public Accounting Firm
To the Shareholders and the Board of Directors of Oxford Industries, Inc.
Opinion on the Financial Statements
We have audited the accompanying consolidated balance sheets of Oxford Industries, Inc. (the Company) as of February 2, 2019 and February 3, 2018, the related consolidated statements of operations, comprehensive income, shareholders’ equity and cash flows for each of the three years in the period ended February 2, 2019, and the related notes and the financial statement schedule listed in the Index at Item 15(a) (collectively referred to as the “consolidated financial statements”). In our opinion, the consolidated financial statements present fairly, in all material respects, the financial position of the Company at February 2, 2019 and February 3, 2018, and the results of its operations and its cash flows for each of the three years in the period ended February 2, 2019, in conformity with U.S. generally accepted accounting principles.
We also have audited, in accordance with the standards of the Public Company Accounting Oversight Board (United States) (PCAOB), the Company's internal control over financial reporting as of February 2, 2019, based on criteria established in Internal Control-Integrated Framework issued by the Committee of Sponsoring Organizations of the Treadway Commission (2013 framework), and our report dated April 1, 2019 expressed an unqualified opinion thereon.
Basis for Opinion
These financial statements are the responsibility of the Company's management. Our responsibility is to express an opinion on the Company’s financial statements based on our audits. We are a public accounting firm registered with the PCAOB and are required to be independent with respect to the Company in accordance with the U.S. federal securities laws and the applicable rules and regulations of the Securities and Exchange Commission and the PCAOB.
We conducted our audits in accordance with the standards of the PCAOB. Those standards require that we plan and perform the audit to obtain reasonable assurance about whether the financial statements are free of material misstatement, whether due to error or fraud. Our audits included performing procedures to assess the risks of material misstatement of the financial statements, whether due to error or fraud, and performing procedures that respond to those risks. Such procedures included examining, on a test basis, evidence regarding the amounts and disclosures in the financial statements. Our audits also included evaluating the accounting principles used and significant estimates made by management, as well as evaluating the overall presentation of the financial statements. We believe that our audits provide a reasonable basis for our opinion.
/s/ Ernst & Young LLP
We have served as the Company's auditor since 2002.
Atlanta, Georgia
April 1, 2019
105
Item 9.
Changes in and Disagreements With Accountants on Accounting and Financial Disclosure
None.
Item 9A.
Controls and Procedures
Evaluation of Disclosure Controls and Procedures
Our company, under the supervision and with the participation of our management, including our principal executive officer and principal financial officer, have evaluated the effectiveness of our disclosure controls and procedures as of the end of the period covered by this report. Based upon that evaluation, our principal executive officer and principal financial officer concluded that, as of the end of the period covered by this report, our disclosure controls and procedures were effective.
Changes in and Evaluation of Internal Control over Financial Reporting
There have not been any changes in our internal control over financial reporting during the fourth quarter of
Fiscal 2018
that have materially affected, or are reasonably likely to materially affect, our internal control over financial reporting.
Report of Management on Internal Control over Financial Reporting
Our management is responsible for establishing and maintaining adequate internal control over financial reporting (as such term is defined in Rules 13a-15(f) and 15d-15(f) under the Securities Exchange Act of 1934). Our internal control over financial reporting is a process designed to provide reasonable assurance regarding the reliability of financial reporting and the preparation of our consolidated financial statements for external purposes in accordance with accounting principles generally accepted in the United States. Our internal control over financial reporting is supported by a program of appropriate reviews by management, written policies and guidelines, careful selection and training of qualified personnel, and a written code of conduct.
We assessed the effectiveness of our internal control over financial reporting as of
February 2, 2019
. In making this assessment, management used the updated framework issued by
the Committee of Sponsoring Organizations of the Treadway Commission ("COSO") in
Internal Control—Integrated Framework (2013)
. Based on this assessment, we believe that our internal control over financial reporting was effective as of
February 2, 2019
.
Ernst & Young LLP, our independent registered public accounting firm, has audited our internal control over financial reporting as of
February 2, 2019
, and its report thereon is included herein.
|
/s/ THOMAS C. CHUBB III
|
/s/ K. SCOTT GRASSMYER
|
|
|
Thomas C. Chubb III
Chairman, Chief Executive Officer and President
(Principal Executive Officer)
|
K. Scott Grassmyer
Executive Vice President — Finance, Chief Financial Officer and Controller
(Principal Financial Officer)
|
|
|
April 1, 2019
|
April 1, 2019
|
|
Limitations on the Effectiveness of Controls
Because of their inherent limitations, our disclosure controls and procedures and our internal controls over financial reporting may not prevent or detect misstatements. Projections of any evaluation of effectiveness for future periods are subject to the risks that controls may become inadequate because of changes in conditions, or that the degree of compliance with the policies or procedures may deteriorate. A control system, no matter how well designed and operated, can provide only reasonable, not absolute, assurance that a control system's objectives will be met.
106
Report of Independent Registered Public Accounting Firm
To the Shareholders and the Board of Directors of Oxford Industries, Inc.
Opinion on Internal Control over Financial Reporting
We have audited Oxford Industries, Inc.'s internal control over financial reporting as of February 2, 2019, based on criteria established in Internal Control-Integrated Framework issued by the Committee of Sponsoring Organizations of the Treadway Commission (2013 framework) (the COSO criteria). In our opinion, Oxford Industries, Inc. (the Company) maintained, in all material respects, effective internal control over financial reporting as of February 2, 2019, based on the COSO criteria.
We also have audited, in accordance with the standards of the Public Company Accounting Oversight Board (United States) (PCAOB), the consolidated balance sheets of the Company as of February 2, 2019 and February 3, 2018, and the related consolidated statements of operations, comprehensive income, shareholders' equity and cash flows for each of the three years in the period ended February 2, 2019, and the related notes and the financial statement schedule listed in the Index at Item 15(a) and our report dated April 1, 2019 expressed an unqualified opinion thereon.
Basis for Opinion
The Company’s management is responsible for maintaining effective internal control over financial reporting and for its assessment of the effectiveness of internal control over financial reporting included in the accompanying Management Report on Internal Control over Financial Reporting. Our responsibility is to express an opinion on the Company’s internal control over financial reporting based on our audit. We are a public accounting firm registered with the PCAOB and are required to be independent with respect to the Company in accordance with the U.S. federal securities laws and the applicable rules and regulations of the Securities and Exchange Commission and the PCAOB.
We conducted our audit in accordance with the standards of the PCAOB. Those standards require that we plan and perform the audit to obtain reasonable assurance about whether effective internal control over financial reporting was maintained in all material respects.
Our audit included obtaining an understanding of internal control over financial reporting, assessing the risk that a material weakness exists, testing and evaluating the design and operating effectiveness of internal control based on the assessed risk, and performing such other procedures as we considered necessary in the circumstances. We believe that our audit provides a reasonable basis for our opinion.
Definition and Limitations of Internal Control Over Financial Reporting
A company’s internal control over financial reporting is a process designed to provide reasonable assurance regarding the reliability of financial reporting and the preparation of financial statements for external purposes in accordance with generally accepted accounting principles. A company’s internal control over financial reporting includes those policies and procedures that (1) pertain to the maintenance of records that, in reasonable detail, accurately and fairly reflect the transactions and dispositions of the assets of the company; (2) provide reasonable assurance that transactions are recorded as necessary to permit preparation of financial statements in accordance with generally accepted accounting principles, and that receipts and expenditures of the company are being made only in accordance with authorizations of management and directors of the company; and (3) provide reasonable assurance regarding prevention or timely detection of unauthorized acquisition, use, or disposition of the company’s assets that could have a material effect on the financial statements.
Because of its inherent limitations, internal control over financial reporting may not prevent or detect misstatements. Also, projections of any evaluation of effectiveness to future periods are subject to the risk that controls may become inadequate because of changes in conditions, or that the degree of compliance with the policies or procedures may deteriorate.
/s/ Ernst & Young LLP
Atlanta, Georgia
April 1, 2019
107
Item 9B.
Other Information
None.
PART III
Item 10.
Directors, Executive Officers and Corporate Governance
The following table sets forth certain information concerning the members of our Board of Directors:
|
Name
|
Principal Occupation
|
|
Helen Ballard
|
Ms. Ballard is the owner of Helen Ballard LLC, a home furnishing product design business.
|
|
Thomas C. Chubb III
|
Mr. Chubb is our Chairman, Chief Executive Officer and President.
|
|
Thomas C. Gallagher
|
Mr. Gallagher is Non-Executive Chairman of the Board of Directors of Genuine Parts Company, a distributor of automotive replacement parts, industrial replacement parts, office products and electrical/electronic materials.
|
|
Virginia A. Hepner
|
Ms. Hepner served as President and Chief Executive Officer of the Woodruff Arts Center, one of the world’s largest arts centers, until her retirement in 2017.
|
|
John R. Holder
|
Mr. Holder is Chairman and Chief Executive Officer of Holder Properties, a full-service commercial and residential real estate developer.
|
|
Stephen S. Lanier
|
Mr. Lanier is a Managing Partner of Fremantle, Capital LLC, a private investment firm that provides capital growth to mature, lower middle market companies primarily in the southeast and Texas.
|
|
Dennis M. Love
|
Mr. Love served as Chairman of Printpack Inc., a manufacturer of flexible and specialty rigid packaging, until his retirement in 2017.
|
|
Clarence H. Smith
|
Mr. Smith is Chairman of the Board, President and Chief Executive Officer of Haverty Furniture Companies, Inc., a home furnishings retailer.
|
|
Clyde C. Tuggle
|
Mr. Tuggle is co-founder of Pine Island Capital Partners, a private investment firm.
|
|
E. Jenner Wood III
|
Mr. Wood served as Corporate Executive Vice President of SunTrust Banks, Inc. until his retirement in 2016.
|
The following table sets forth certain information concerning our executive officers:
|
Name
|
Position Held
|
|
Thomas C. Chubb III
|
Chairman, Chief Executive Officer and President
|
|
Thomas E. Campbell
|
Executive Vice President - People & Technology
|
|
K. Scott Grassmyer
|
Executive Vice President - Finance, Chief Financial Officer and Controller
|
|
J. Wesley Howard, Jr.
|
President, Lanier Apparel
|
|
Michelle M. Kelly
|
Chief Executive Officer, Lilly Pulitzer
|
|
Suraj A. Palakshappa
|
Vice President - Law, General Counsel and Secretary
|
|
Douglas B. Wood
|
Chief Executive Officer, Tommy Bahama
|
Additional information required by this Item 10 of Part III will appear in our definitive proxy statement under the headings "Corporate Governance and Board Matters—Directors," "Executive Officers," "Common Stock Ownership by Management and Certain Beneficial Owners—Section 16(a) Beneficial Ownership Reporting Compliance," "Corporate Governance and Board Matters—Website Information," "Additional Information—Submission of Director Candidates by Shareholders," and "Corporate Governance and Board Matters—Board Meetings and Committees of our Board of Directors," and is incorporated herein by reference.
Item 11.
Executive Compensation
The information required by this Item 11 of Part III will appear in our definitive proxy statement under the headings "Corporate Governance and Board Matters—Director Compensation," "Executive Compensation," "Nominating, Compensation & Governance Committee Report" and "Compensation Committee Interlocks and Insider Participation" and is incorporated herein by reference.
108
Item 12.
Security Ownership of Certain Beneficial Owners and Management and Related Stockholder Matters
The information required by this Item 12 of Part III will appear in our definitive proxy statement under the headings "Equity Compensation Plan Information" and "Common Stock Ownership by Management and Certain Beneficial Owners" and is incorporated herein by reference.
Item 13.
Certain Relationships and Related Transactions, and Director Independence
The information required by this Item 13 of Part III will appear in our definitive proxy statement under the headings "Certain Relationships and Related Transactions" and "Corporate Governance and Board Matters—Director Independence" and is incorporated herein by reference.
Item 14.
Principal Accounting Fees and Services
The information required by this Item 14 of Part III will appear in our definitive proxy statement under the heading "Audit-Related Matters—Fees Paid to Independent Registered Public Accounting Firm" and "Audit-Related Matters—Audit Committee Pre-Approval of Audit and Permissible Non-Audit Services of Independent Auditors" and is incorporated herein by reference.
PART IV
Item 15.
Exhibits, Financial Statement Schedules
(a)
1. Financial Statements
The following consolidated financial statements are included in Part II, Item 8 of this report:
|
•
|
Consolidated Balance Sheets as of
February 2, 2019
and
February 3, 2018
.
|
|
•
|
Consolidated Statements of Operations for
Fiscal 2018
,
Fiscal 2017
and
Fiscal 2016
.
|
|
•
|
Consolidated Statements of Comprehensive Income for
Fiscal 2018
,
Fiscal 2017
and
Fiscal 2016
.
|
|
•
|
Consolidated Statements of Shareholders' Equity for
Fiscal 2018
,
Fiscal 2017
and
Fiscal 2016
.
|
|
•
|
Consolidated Statements of Cash Flows for
Fiscal 2018
,
Fiscal 2017
and
Fiscal 2016
.
|
|
•
|
Notes to Consolidated Financial Statements for
Fiscal 2018
,
Fiscal 2017
and
Fiscal 2016
.
|
2. Financial Statement Schedules
|
•
|
Schedule II—Valuation and Qualifying Accounts
|
All other schedules for which provisions are made in the applicable accounting regulation of the SEC are not required under the related instructions or are inapplicable and, therefore, have been omitted.
(b) Exhibits
109
|
2.1
|
|
|
2.2
|
|
|
3.1
|
|
|
3.2
|
|
|
10.1
|
|
|
10.2
|
|
|
10.3
|
|
|
10.4
|
|
|
10.5
|
|
|
21
|
|
|
23
|
|
|
24
|
|
|
31.1
|
|
|
31.2
|
|
|
32
|
|
|
101INS
|
XBRL Instance Document
|
|
101SCH
|
XBRL Taxonomy Extension Schema Document
|
|
101CAL
|
XBRL Taxonomy Extension Calculation Linkbase Document
|
|
101DEF
|
XBRL Taxonomy Extension Definition Linkbase Document
|
|
101LAB
|
XBRL Taxonomy Extension Label Linkbase Document
|
|
101PRE
|
XBRL Taxonomy Extension Presentation Linkbase Document
|
_______________________________________________________________________________
|
*
|
Filed herewith
|
|
†
|
Management contract or compensation plan or arrangement required to be filed as an exhibit to this form pursuant to Item 15(b) of this report.
|
We agree to file upon request of the SEC a copy of all agreements evidencing long-term debt omitted from this report pursuant to Item 601(b)(4)(iii) of Regulation S-K. Shareholders may obtain copies of Exhibits without charge upon written request to the Corporate Secretary, Oxford Industries, Inc., 999 Peachtree Street, N.E., Ste. 688, Atlanta, Georgia 30309.
110
Item 16.
Form 10-K Summary
None.
SIGNATURES
Pursuant to the requirements of Section 13 or 15(d) of the Securities Exchange Act of 1934, the registrant has duly caused this report to be signed on its behalf by the undersigned, hereunto duly authorized.
|
|
Oxford Industries, Inc.
|
|
|
|
By:
|
/s/ THOMAS C. CHUBB III
|
|
Thomas C. Chubb III
Chairman, Chief Executive Officer and President
|
||
Date:
April 1, 2019
Pursuant to the requirements of the Securities Exchange Act of 1934, this report has been signed below by the following persons on behalf of the registrant and in the capacities and on the dates indicated.
|
Signature
|
Capacity
|
Date
|
|
/s/ THOMAS C. CHUBB III
|
|
|
|
Thomas C. Chubb III
|
Chairman of the Board of Directors, Chief Executive Officer and President (Principal Executive Officer)
|
April 1, 2019
|
|
/s/ K. SCOTT GRASSMYER
|
|
|
|
K. Scott Grassmyer
|
Executive Vice President
—
Finance, Chief Financial Officer and Controller (Principal Financial Officer and Principal Accounting Officer)
|
April 1, 2019
|
|
*
|
||
|
Helen Ballard
|
Director
|
April 1, 2019
|
|
*
|
|
|
|
Thomas C. Gallagher
|
Director
|
April 1, 2019
|
|
*
|
||
|
Virginia A. Hepner
|
Director
|
April 1, 2019
|
|
*
|
||
|
John R. Holder
|
Director
|
April 1, 2019
|
|
*
|
||
|
Stephen S. Lanier
|
Director
|
April 1, 2019
|
|
*
|
||
|
Dennis M. Love
|
Director
|
April 1, 2019
|
|
*
|
||
|
Clarence H. Smith
|
Director
|
April 1, 2019
|
|
*
|
||
|
Clyde C. Tuggle
|
Director
|
April 1, 2019
|
|
*
|
||
|
E. Jenner Wood III
|
Director
|
April 1, 2019
|
|
*By
|
||
|
/s/ SURAJ A. PALAKSHAPPA
|
|
|
|
Suraj A. Palakshappa
as Attorney-in-Fact
|
||
111
TABLE OF CONTENTS
Part IItem 1. BusinessItem 1A. Risk FactorsItem 1B. Unresolved Staff CommentsItem 2. PropertiesItem 3. Legal ProceedingsItem 4. Mine Safety DisclosuresPart IIItem 5. Market For Registrant's Common Equity, Related Stockholder Matters and Issuer Purchases Of Equity SecuritiesItem 6. Selected Financial DataItem 7. Management's Discussion and Analysis Of Financial Condition and Results Of OperationsItem 7A. Quantitative and Qualitative Disclosures About Market RiskItem 8. Financial Statements and Supplementary DataNote 1. Summary Of Significant Accounting PoliciesNote 1. Summary Of Significant Accounting Policies (continued)Note 2. Operating GroupsNote 2. Operating Groups (continued)Note 3. Property and Equipment, NetNote 4. Intangible Assets and GoodwillNote 5. DebtNote 5. Debt (continued)Note 6. Commitments and ContingenciesNote 7. Shareholders' EquityNote 8. Income TaxesNote 9. Defined Contribution PlansNote 10. Summarized Quarterly Data (unaudited)Note 11. Business CombinationsNote 12. Tommy Bahama Japan ChargesItem 9. Changes in and Disagreements with Accountants on Accounting and Financial DisclosureItem 9A. Controls and ProceduresItem 9B. Other InformationPart IIIItem 10. Directors, Executive Officers and Corporate GovernanceItem 11. Executive CompensationItem 12. Security Ownership Of Certain Beneficial Owners and Management and Related Stockholder MattersItem 13. Certain Relationships and Related Transactions, and Director IndependenceItem 14. Principal Accounting Fees and ServicesPart IVItem 15. Exhibits, Financial Statement SchedulesItem 16. Form 10-k Summary