PALO ALTO NETWORKS INC
10-Ks and 10-Qs
|
|
|
|
|
|
|
|
|
|
|
|
|
|
|
|
|
|
|
|
|
|
|
|
|
|
|
|
|
|
|
|
|
|
|
|
|
|
|
|
|
|
|
|
|
|
|
|
|
|
UNITED STATES
SECURITIES AND EXCHANGE COMMISSION
Washington, D.C. 20549
_____________________
Form 10-K
_____________________
(Mark One)
|
x
|
ANNUAL REPORT PURSUANT TO SECTION 13 OR 15(d) OF THE SECURITIES EXCHANGE ACT OF 1934
|
For the fiscal year ended
July 31, 2016
or
|
¨
|
TRANSITION REPORT PURSUANT TO SECTION 13 OR 15(d) OF THE SECURITIES EXCHANGE ACT OF 1934
|
For the transition period from
to
Commission File Number 0
01-35594
Palo Alto Networks, Inc.
(Exact name of registrant as specified in its charter)
|
Delaware
|
20-2530195
|
|
(State or other jurisdiction of
incorporation or organization)
|
(I.R.S. Employer
Identification No.)
|
|
4401 Great America Parkway
Santa Clara, California 95054
(Address of principal executive office, including zip code)
|
|
(408) 753-4000
(Registrant’s telephone number, including area code)
Securities registered pursuant to Section 12(b) of the Act:
|
Title of each class
|
|
Name of each exchange on which registered
|
|
Common Stock, par value $0.0001 per share
|
|
New York Stock Exchange LLC
|
Securities registered pursuant to Section 12(g) of the Act:
None
Indicate by check mark if the registrant is a well-known seasoned issuer, as defined in Rule 405 of the Securities Act. Yes
x
No
¨
Indicate by check mark if the registrant is not required to file reports pursuant to Section 13 or Section 15(d) of the Securities Exchange Act of 1934 (the “Exchange Act”). Yes
¨
No
x
Indicate by check mark whether the registrant: (1) has filed all reports required to be filed by Section 13 or 15(d) of the Exchange Act during the preceding 12 months (or for such shorter period that the registrant was required to file such reports), and (2) has been subject to such filing requirements for the past 90 days.
Yes
x
No
¨
Indicate by check mark whether the registrant has submitted electronically and posted on its corporate Web site, if any, every Interactive Data File required to be submitted and posted pursuant to Rule 405 of Regulation S-T (§232.405 of this chapter) during the preceding 12 months (or for such shorter period that the registrant was required to submit and post such files).
Yes
x
No
¨
Indicate by a check mark if disclosure of delinquent filers pursuant to Item 405 of Regulation S-K (§229.405 of this chapter) is not contained herein, and will not be contained, to the best of registrant’s knowledge, in definitive proxy or information statements incorporated by reference in Part III of this Form 10-K or any amendment to this Form 10-K.
¨
Indicate by check mark whether the registrant is a large accelerated filer, an accelerated filer, a non-accelerated filer, or a smaller reporting company. See the definitions of “large accelerated filer,” “accelerated filer” and “smaller reporting company” in Rule 12b-2 of the Exchange Act. (Check one):
|
Large accelerated filer
|
x
|
Accelerated filer
|
¨
|
|
Non-accelerated filer
|
¨
(Do not check if a smaller reporting company)
|
Smaller reporting company
|
¨
|
Indicate by check mark whether the registrant is a shell company (as defined in Rule 12b-2 of the Exchange Act). Yes
¨
No
x
The aggregate market value of voting stock held by non-affiliates of the registrant was
$12,713,712,655
as of January 29,
2016
, the last business day of the registrant’s most recently completed second fiscal quarter (based on the closing sales price for the common stock on the New York Stock Exchange on such date). Shares of common stock held by each executive officer, director, and holder of 5% or more of the outstanding common stock have been excluded in that such persons may be deemed to be affiliates. This determination of affiliate status is not necessarily a conclusive determination for other purposes.
On
August 24, 2016
,
90,850,457
shares of the registrant’s common stock, $0.0001 par value, were outstanding.
DOCUMENTS INCORPORATED BY REFERENCE
Portions of the information called for by Part III of this Annual Report on Form 10-K is hereby incorporated by reference from the definitive proxy statement for the Registrant’s annual meeting of stockholders, which will be filed with the Securities and Exchange Commission not later than 120 days after the Registrant’s fiscal year ended
July 31, 2016
.
TABLE OF CONTENTS
|
Page
|
||
|
PART I
|
||
|
Item 1.
|
||
|
Item 1A.
|
||
|
Item 1B.
|
||
|
Item 2.
|
||
|
Item 3.
|
||
|
Item 4.
|
||
|
PART II
|
||
|
Item 5.
|
||
|
Item 6.
|
||
|
Item 7.
|
||
|
Item 7A.
|
||
|
Item 8.
|
||
|
Item 9.
|
||
|
Item 9A.
|
||
|
Item 9B.
|
||
|
PART III
|
||
|
Item 10.
|
||
|
Item 11.
|
||
|
Item 12.
|
||
|
Item 13.
|
||
|
Item 14.
|
||
|
PART IV
|
||
|
Item 15.
|
||
-
2
-
SPECIAL NOTE REGARDING FORWARD-LOOKING STATEMENTS
This Annual Report on Form 10-K, including the sections entitled “Business,” “Risk Factors,” and “Management’s Discussion and Analysis of Financial Condition and Results of Operations,” contains forward-looking statements within the meaning of Section 27A of the Securities Act of 1933 and Section 21E of the Securities Exchange Act of 1934. The words “believe,” “may,” “will,” “potentially,” “estimate,” “continue,” “anticipate,” “intend,” “could,” “would,” “project,” “plan,” “expect,” and similar expressions that convey uncertainty of future events or outcomes are intended to identify forward-looking statements.
These forward-looking statements include, but are not limited to, statements concerning the following:
|
•
|
trends in and expectations regarding revenue (including our revenue mix), costs of revenue, gross margin, cash flows, interest expense, and operating expenses (including future share-based compensation expense);
|
|
•
|
our expectation that we will continue to grow our installed end-customer base;
|
|
•
|
our expectations regarding future investments in research and development, customer support, and in our sales force, including expectations regarding growth in our sales headcount;
|
|
•
|
our expectation that we will continue to expand internationally;
|
|
•
|
our expectation that we will continue to introduce new subscriptions, renew existing contracts, and increase sales to our existing customer base;
|
|
•
|
seasonal trends in our results of operations;
|
|
•
|
our expectation that we will expand our facilities or add new facilities as we add employees and enter new geographic markets;
|
|
•
|
the sufficiency of our cash flow from operations with existing cash and cash equivalents to meet our cash needs for the foreseeable future;
|
|
•
|
future investments in product development, services, or technologies;
|
|
•
|
our ability to grow our installed end-customer base; and
|
|
•
|
the timing and amount of capital expenditures and share repurchases.
|
These forward-looking statements are subject to a number of risks, uncertainties, and assumptions, including those described in “Risk Factors” included in Part I, Item 1A and elsewhere in this Annual Report on Form 10-K. Moreover, we operate in a very competitive and rapidly changing environment, and new risks emerge from time to time. It is not possible for our management to predict all risks, nor can we assess the impact of all factors on our business or the extent to which any factor, or combination of factors, may cause actual results to differ materially from those contained in any forward-looking statements we may make. In light of these risks, uncertainties, and assumptions, the forward-looking events and circumstances discussed in this Annual Report on Form 10-K may not occur, and actual results could differ materially and adversely from those anticipated or implied in the forward-looking statements. We undertake no obligation to revise or publicly release the results of any revision to these forward-looking statements, except as required by law. Given these risks and uncertainties, readers are cautioned not to place undue reliance on such forward-looking statements.
|
ITEM 1.
|
BUSINESS
|
General
We have pioneered the next generation of security through our innovative platform that allows enterprises, service providers, and government entities to secure their organizations by safely enabling applications running on their networks and by preventing breaches that stem from targeted cyber attacks. Our platform uses an innovative traffic classification engine that identifies network traffic by application, user, and content and provides consistent security across the network, endpoint, and cloud. Accordingly, our platform enables our end-customers to maintain the visibility and control needed to protect their valued data and critical control systems while pursuing technology initiatives, like cloud and mobility, that grow their business. We believe our platform offers superior performance compared to legacy approaches and reduces the total cost of ownership for organizations by simplifying their security infrastructure and eliminating the need for multiple, stand-alone security appliances and software products.
-
3
-
Our Next-Generation Security Platform consists of three major elements: our Next-Generation Firewall, our Advanced Endpoint Protection, and our Threat Intelligence Cloud.
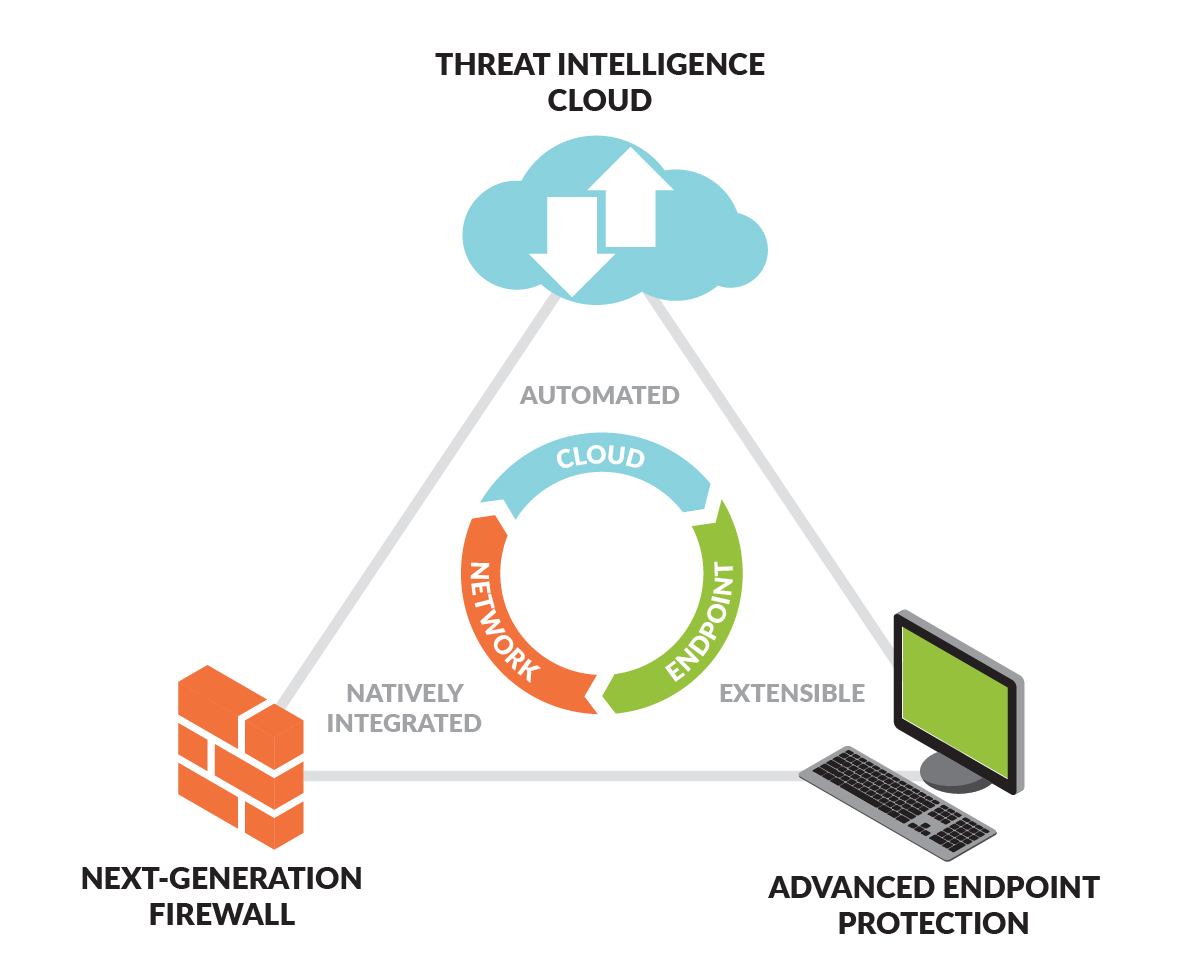
Our Next-Generation Firewall delivers application, user, and content visibility and control as well as protection against network-based cyber threats integrated within the firewall through our proprietary hardware and software architecture. Our Advanced Endpoint Protection prevents cyber attacks that aim to run malicious code or exploit software vulnerabilities on a broad variety of fixed and virtual endpoints and servers. Our Threat Intelligence Cloud provides central intelligence capabilities, security for software as a service (“SaaS”) applications, and automated delivery of preventative measures against cyber attacks.
We were incorporated in 2005 as Palo Alto Networks, Inc., a Delaware corporation. Our corporate headquarters are located in Santa Clara, California.
Products and Services
Firewall Appliances.
All of our firewall appliances incorporate our PAN-OS operating system and come with the same rich set of features ensuring consistent operation across our entire product line. These features include: App-ID, User-ID, site-to-site VPN, remote access Secure Sockets Layer (“SSL”) VPN, and Quality-of-Service (“QoS”). Our appliances are designed for different performance requirements throughout an organization and are classified based on throughput, ranging from our PA-200, which is designed for enterprise remote offices, to our top-of-the-line PA-7080, which is designed for large scale data centers and service provider use. Our firewall appliances come in a physical form factor, as well as in a virtual form factor that is available for virtualization environments from companies such as VMware, Inc. (“VMware”), Microsoft Corporation (“Microsoft”), and Amazon.com, Inc. (“Amazon”), and KVM/OpenStack environments.
Panorama.
Panorama is our centralized security management solution for global control of all of our appliances deployed on an end-customer’s network as a virtual appliance or a physical appliance. Panorama is used for centralized policy management, device management, software licensing and updates, centralized logging and reporting, and log storage. Panorama controls the security, network address translation (“NAT”), QoS, policy based forwarding, decryption, application override, captive portal, and distributed denial of service/denial of service (“DDoS/DoS”) protection aspects of the appliances and virtual systems under management. Panorama centrally manages device software and associated updates, including SSL-VPN clients, GlobalProtect clients, dynamic content updates, and software licenses. Panorama offers the ability to view logs and run reports from all managed appliances without the need to forward the logs and to report on aggregate user activity for all users, including mobile users. Panorama reliably expands the log storage for long-term event investigation and analysis through high-availability features for central management.
Virtual System Upgrades
.
Virtual System Upgrades are available as extensions to the Virtual System capacity that ships with our physical appliances. Virtual Systems provide a mechanism to support multiple distinct security policies and administrative access for tenants on the same hardware device, which is applicable to our large enterprise and service provider end-customers.
Subscription Services
.
We offer a number of subscription services as part of our platform. Of these subscription services, Threat Prevention Subscription, URL Filtering Subscription, WildFire Subscription, and GlobalProtect Subscription are sold as options to our firewall appliances, whereas the others are sold on a per-user or per-endpoint basis. Our subscription services include:
-
4
-
|
•
|
Threat Prevention Subscription.
This service provides the intrusion detection and prevention capabilities of our platform. Our threat prevention engine blocks vulnerability exploits, viruses, spyware, buffer overflows, denial-of-service attacks, and port scans from compromising and damaging enterprise information resources. It includes mechanisms such as protocol decoder-based analysis, protocol anomaly-based protection, stateful pattern matching, statistical anomaly detection, heuristic-based analysis, custom vulnerability, and spyware phone home signatures.
|
|
•
|
URL Filtering Subscription.
This service provides the uniform resource locator (“URL”) filtering capabilities of our platform. The URL filtering database consists of millions of URLs across many categories and is designed to monitor and control employee web surfing activities. The on-appliance URL database can be augmented to suit the traffic patterns of the local user community with a custom URL database. URLs that are not categorized by the local URL database can be pulled into a separate, cache-based URL database from a very extensive, cloud-based URL database.
|
|
•
|
WildFire Subscription.
This cloud-based or appliance-based service provides protection against targeted malware and advanced persistent threats. This service provides a near real-time analysis engine for detecting previously unseen malware. The core component of this service is a sandbox environment that can operate on an end-customers’ private cloud or our public cloud where files can be run and monitored for more than 100 behavioral characteristics that identify the file as malware. Once identified, preventive measures are automatically generated and delivered to all devices that subscribe to the service. By providing this as a cloud-based service, all of our end-customers benefit from malware found on any network.
|
|
•
|
GlobalProtect Subscription.
This appliance-based service provides protection for mobile users of both traditional laptop devices and mobile devices. It expands the boundaries of the physical network, effectively establishing a logical perimeter that encompasses remote laptop and mobile device users irrespective of their location. When a remote user logs into the device, GlobalProtect automatically determines the closest gateway available to the roaming device and establishes a secure connection. Windows and Apple laptops as well as mobile devices, such as Android phones and tablets and Apple iPhones and iPads, will stay connected to the corporate network whenever they are on a network of any kind. As a result, they are protected as if they never left the corporate campus. GlobalProtect ensures that the same secure application enablement policies that protect users at the corporate site are enforced for all users, independent of their location.
|
|
•
|
VM-Series Subscription.
VM-Series, the virtual form factor of our Next-Generation Firewall, is offered as both a perpetual license as well as a term-based subscription service. The VM-Series provides all of the same security capabilities of our hardware appliances, but as a software package that can be deployed on VMware’s ESXi, Microsoft’s Hyper-V, and Red Hat KVM hypervisors, as well as natively in Amazon’s AWS cloud and Microsoft’s Azure cloud.
|
|
•
|
Traps Endpoint Protection Subscription.
This service provides protection for endpoints against cyber attacks that aim to run malicious code or exploit software vulnerabilities. It prevents known and previously unknown attacks through its unique capability of stopping the underlying exploit techniques and can prevent cyber attacks without relying on prior knowledge of the attack. Through its integration with WildFire, it is also capable of preventing cyber attacks that rely on malware.
|
|
•
|
AutoFocus Subscription.
This cloud-based service provides threat intelligence capabilities to our end-customers’ security operations teams. Indicators of compromise and anomalies that occur on an end-customer’s network can be correlated with similar data that has been centrally collected by us in our Threat Intelligence Cloud from among all our participating end-customers. This offers our end-customers priority alerts, deep attack context, and high-fidelity threat intelligence across millions of malware samples and tens of billions of file artifacts.
|
|
•
|
Aperture Subscription.
This cloud-based service provides content control for IT-sanctioned SaaS applications that are used to store and share end-customer’s data. It offers end-customers the capability to safely use these SaaS applications and avert risks associated with improper sharing of confidential data and risks associated with sharing of malicious content.
|
Support and Maintenance.
We offer Standard Support, Premium Support, and four-hour Premium Support to our end-customers and channel partners. Our channel partners that operate a Palo Alto Networks Authorized Support Center (“ASC”) typically deliver level-one and level-two support. We provide level-three support 24 hours a day, seven days a week through regional support centers that are located worldwide. We also offer an annual subscription-based Technical Account Management (“TAM”) service that provides dedicated support for end-customers with unique or complex support requirements. We offer our end-customers ongoing maintenance services for both hardware and software in order to receive ongoing security updates, PAN-OS upgrades, bug fixes, and repair. End-customers typically purchase these services for a one-year or longer term at the time of the initial product sale and typically renew for successive one-year or longer periods. Additionally, we provide expedited replacement for any defective hardware. We use a third-party logistics provider to manage our worldwide deployment of spare appliances and other accessories.
Professional Services.
Professional services are primarily delivered through our authorized channel partners and include on-location, hands-on experts who plan, design, and deploy effective security solutions tailored to our end-customers’ specific requirements. These services include application traffic management, solution design and planning, configuration, and firewall
-
5
-
migration. Our education services provide online and classroom-style training and are also primarily delivered through our authorized partners.
Major Product Development Projects
We continue to invest in innovation and strengthening our product portfolio, which resulted in several new product offerings during fiscal
2016
. These new product offerings include: our PA-7080 appliance, which is our top-of-the-line chassis-based appliance ideally suited for very large enterprise deployments and service provider customers; our Aperture subscription service, which provides added visibility and control within IT-sanctioned SaaS applications; and our AutoFocus cyber threat intelligence service, which provides prioritized actionable intelligence on targeted cyber attacks. In addition, we delivered PAN-OS and Panorama 7.1, an important software release that extended our cloud support to include Microsoft Azure, reduced the time from first detection of new malware to prevention from fifteen minutes down to five minutes, and added new levels of visibility into SaaS usage that when combined with GlobalProtect and Aperture provide security for sanctioned and unsanctioned SaaS applications.
Technology
We combine our proprietary hardware and software architecture, PAN-OS operating system, Traps, and Threat Intelligence Cloud to provide a comprehensive security platform. The core of our platform is our Next-Generation Firewall, which integrates application visibility and control and is comprised of three identification technologies: App-ID, User-ID, and Content-ID. These technologies allow organizations to enable the secure use of applications while managing the inherent risks of doing so. These fine-grained policy management and enforcement capabilities are delivered at low latency, multi-gigabit performance through our innovative SP3 architecture.
App-ID.
App-ID is our application classification engine that uses multiple identification techniques to determine the exact identity of applications traversing the network. App-ID is the foundational classification engine that provides the core traffic classification to all other functions in our platform. The App-ID classification is used to invoke other security functions.
App-ID uses a series of classification techniques to accurately identify an application. When traffic first enters the network, App-ID applies an initial policy check based on Internet Protocol (“IP”) and port. Signatures are then applied to the traffic to identify the application based on application properties and related transaction characteristics. If the traffic is encrypted and a decryption policy is in place, the application is first decrypted, then application signatures are applied. Additional context-based signature analysis is then performed to identify known protocols that may be hiding other applications. Encrypted traffic that was decrypted is then re-encrypted before being sent back into the network. For evasive applications that cannot be identified through advanced signature and protocol analysis, heuristics or behavioral analysis are used to determine the identity of the application. When an application is accurately identified during this series of successive techniques, the policy check determines how to treat the application and associated functions. The policy check can block the application, allow it and scan for threats, inspect it for unauthorized file transfer and data patterns, or shape its use of network resources by applying a quality-of-service policy.
App-ID consistently classifies all network traffic, including business applications, consumer applications, and network protocols, across all ports. Consequently, there is no need to perform a series of signature checks to look for an application that is thought to be on the network. App-ID continually monitors the state of the application to determine if the application changes. Our platform allows only those applications within the policy to enter the network, while all other applications are blocked.
Internally developed or custom applications can be managed using either an application override or custom App-IDs. End-customers can use either of these mechanisms to apply the same level of control over their internal or custom applications that they apply to common applications. Because the application landscape is constantly changing, our research teams are constantly updating our App-ID classification engine. We deliver updated App-IDs automatically to our end-customers through our weekly update service.
User-ID.
User-ID integrates our platform with a wide range of enterprise user directories and technologies, including Active Directory, eDirectory, Open LDAP, Citrix Terminal Server, Microsoft Exchange, Microsoft Terminal Server, and ZENworks. A network-based, User-ID agent communicates with the domain controllers, directories, or supported enterprise applications, mapping information such as user, role, and current IP address to the firewall, making the policy integration transparent. In cases where user repository information does not include the current IP address of the user, a transparent, captive portal authentication or challenge/response mechanism can be used to tie users into the security policy. In cases where a user repository or application is in place that already has knowledge of users and their current IP address, a standards-based application programming interface (“API”) can be used to tie the repository to our platform.
Content-ID.
Content-ID is a collection of technologies that enables many of our subscription services. Content-ID combines a real-time threat prevention engine, a cloud-based analysis service, and a comprehensive URL categorization database to limit unauthorized data and file transfers, detect and block a wide range of threats, and control non-work related web surfing.
The threat prevention engine blocks several common types of attacks, including vulnerability exploits, buffer overflows, and port scans from compromising and damaging enterprise information resources. It includes mechanisms such as protocol decoder-based
-
6
-
analysis, protocol anomaly-based protection, stateful pattern matching, statistical anomaly detection, heuristic-based analysis, custom vulnerability, and spyware “phone home” signatures.
Our cloud-based analysis service, WildFire, provides a near real-time analysis engine for detecting previously unseen targeted malware. The core component of WildFire is a sandbox environment that can be deployed in a customer’s private cloud or on our public cloud where files can be run and monitored for more than 100 behavioral characteristics that identify the file as malware. Once identified, signatures are automatically generated and delivered to all end-customers that subscribe to the WildFire service. By providing WildFire as a cloud-based service, all of our end-customers benefit from malware found on a single network or endpoint. Refer to the “WildFire” section below for a more detailed discussion of our WildFire technology.
Our URL filtering database consists of millions of URLs across many categories and is designed to monitor and control employee web surfing activities. The on-appliance URL database can be augmented to suit the traffic patterns of the local user community with a custom URL database. URLs that are not categorized by the local URL database can be pulled into an on-appliance data cache from a very extensive, cloud-based URL database. The data filtering features in our platform enable policies that reduce the risks associated with the transfer of unauthorized files and data. This can be achieved by blocking files by type, by controlling sensitive data, such as credit card and social security numbers in application content or attachments, and by controlling file transfers within applications.
SP3.
SP3 is our proprietary software and hardware architecture that is comprised of two elements: single-pass software and parallel processing hardware.
Our single-pass software accomplishes two key functions in our platform. First, it performs operations once per packet. As a packet is processed, the networking functions, the policy lookup, the application identification and decoding, and the signature matching for any and all threats and content are all performed simultaneously. This significantly reduces the amount of processing required to perform multiple functions in one security device. Second, the content scanning step is stream-based and uses uniform signature matching to detect and block threats. Instead of using multiple scanning passes and file proxies, which require download prior to scanning, our single-pass software scans content once in a stream-based fashion to minimize latency. This results in very high throughput and low latency, even with all security functions active. It also offers a single, fully integrated policy, thus enabling easier management of security.
Our parallel processing hardware is designed to optimize single-pass software performance through the use of separate data and control planes, which means that heavy utilization of one does not negatively impact the performance of the other. Our hardware also uses discrete, specialized processing groups to perform critical functions. On the data plane, this includes functions such as networking, policy enforcement, encryption and decryption, decompression, and content scanning. On the control plane, this includes configuration management, logging, and reporting.
We believe that the combination of single-pass software and parallel processing hardware is unique in the enterprise security industry and allows our platform to safely enable applications and prevent cyber threats at very high levels of performance and throughput.
PAN-OS Operating System.
Our PAN-OS operating system provides the foundation for our security platform and contains App-ID, User-ID, and Content-ID. PAN-OS performs the core functions of our platform while also providing the networking, security, and management functions needed for implementation. The PAN-OS networking functions include dynamic routing, switching, high availability, and VPN support, which enables deployment into a broad range of networking environments.
We have the ability to enable a series of virtual firewall instances or virtual systems. Each virtual system is an independent (virtual) firewall within the device that is managed separately and cannot be accessed or viewed by any other administrator of any other virtual system. This capability allows enterprises and service providers to separate firewall instances in departmental and multi-tenant managed services scenarios.
The security functions in PAN-OS are implemented in a single security policy and include application, application function, user, group, port, and service-based elements. Policy responses can range from open (allow but monitor for activity), to moderate (enabling certain applications or functions), to closed (deny). The tight integration of application control, users, and groups, and the ability to scan the allowed traffic for a wide range of threats minimizes the number of policies.
PAN-OS also includes attack protection capabilities, such as blocking invalid or malformed packets, IP defragmentation, Transmission Control Protocol (“TCP”) reassembly, and network traffic normalization. PAN-OS eliminates invalid and malformed packets, while TCP reassembly and IP defragmentation is performed to ensure the utmost accuracy and protection despite any attack evasion techniques.
WildFire.
WildFire is our cloud-based malware analysis environment that offers a completely new approach to cybersecurity. Through native integration with our Next-Generation Firewall, the service brings advanced threat detection and prevention to every system deployed throughout the network, automatically sharing protections with all WildFire subscribers globally.
The service offers a unified, hybrid cloud architecture deployed via either the public cloud, a private cloud appliance that maintains all data on the local network, or a combination of the two. This allows us to perform dynamic analysis of suspicious content
-
7
-
in a cloud-based virtual environment to discover unknown threats, automatic creation and enforcement of best-in-class, content-based malware protections, and link detection in email, proactively blocking access to malicious websites.
Advanced attacks are not point-in-time events. Adversaries deliver attacks persistently, often using non-standard ports, protocols or encryption for subsequent attack stages. Like our Next-Generation Firewall, WildFire provides complete visibility into unknown threats within all traffic across thousands of applications, including Web traffic, email protocols (SMTP, IMAP, POP), and FTP, regardless of ports or encryption (SSL).
Once WildFire discovers a new threat, the service automatically generates protections across the attack lifecycle, blocking malicious files and command-and-control traffic. Uniquely, many of these protections are content-based, not relying on easily changed attributes such as hash, filename or URL, allowing the service to block the initial malware and future variants without any additional action or analysis. WildFire informs the protection of our other security services, blocking threats in-line through Threat Prevention (anti-malware, DNS, command-and-control), Web Security (malicious URLs in PAN-DB), and GlobalProtect (anti-malware for mobile devices).
Traps.
Traps is our Advanced Endpoint Protection product that prevents advanced attacks originating from either exploits or malicious executables before any malicious activity can successfully run, regardless of software patches in place. If an attack attempt is made, Traps will immediately block the technique or techniques, terminate the process, and notify both the user and the administrator that an attack was thwarted. Whenever a block does occur, Traps will collect detailed forensics, including the offending process, the memory state when it was prevented, and many other details that are reported to the Endpoint Security Manager (“ESM”).
The Traps agent injects itself into each process as it is started. When an attacker attempts to exploit a software vulnerability, the Traps protection modules cause the exploit attempt to fail because Traps has already made the process impervious to those techniques. When the attempt is prevented, the Traps agent kills the process and reports all of the details to the ESM.
Traps policy is configured to protect over 100 processes - each one with dozens of proprietary exploit prevention modules (“EPMs”). However, unlike other products, Traps is not limited to protecting only those processes or applications. Our end-customers use Traps to protect all manner of processes and applications by simply adding them to the policy configuration. Processes that have been run on the endpoint automatically show up in the ESM console, making it easy to protect those processes with the click of a button. This is especially useful for those end-customers running industry-specific applications. Traps can protect point-of-sale (“POS”) systems, ATM machines, SCADA, and any other applications from exploitation.
Certifications.
Many of our products have been awarded Federal Information Processing Standard
(“FIPS”) 140-2 Level 2, Common Criteria/National Information Assurance Partnership (“NIAP”) Evaluation Assurance Level
(“
EAL”) 2, Common Criteria/NIAP EAL4+, Network Equipment-Building System (“NEBS”), and ICSA Firewall certifications.
Intellectual Property
Our industry is characterized by the existence of a large number of patents and frequent claims and related litigation regarding patent and other intellectual property rights. In particular, leading companies in the enterprise security industry have extensive patent portfolios and are regularly involved in both offensive and defensive litigation. We continue to grow our patent portfolio and own intellectual property and related intellectual property rights around the world that relate to our products, services, research and development, and other activities, and our success depends in part upon our ability to protect our core technology and intellectual property. We file patent applications to protect our intellectual property and believe that the duration of our issued patents is sufficient when considering the expected lives of our products.
We actively seek to protect our global intellectual property rights and to deter unauthorized use of our intellectual property by controlling access to and use of our proprietary software and other confidential information through the use of internal and external controls, including contractual protections with employees, contractors, end-customers and partners, and our software is protected by U.S. and international copyright laws. Despite our efforts to protect our trade secrets and proprietary rights through intellectual property rights, licenses, and confidentiality agreements, unauthorized parties may still copy or otherwise obtain and use our software and technology, particularly in countries that provide less protection of intellectual property rights and in the absence of harmonized international intellectual property standards.
From time to time, third parties may assert patent, copyright, trademark, and other intellectual property rights against us, our channel partners, or our end-customers, which our standard license and other agreements may obligate us to indemnify against such claims. Successful claims of infringement by a third party could prevent us from distributing certain products or performing certain services, require us to expend time and money to develop non-infringing solutions, or force us to pay substantial damages (including treble damages if we are found to have willfully infringed patents or copyrights), royalties or other fees. In addition, based on our greater visibility and market exposure as a public company, we face a higher risk of being the subject of intellectual property infringement claims from third parties. We cannot assure you that we do not currently infringe, or that we will not in the future infringe, upon any third-party patents or other proprietary rights. See “Risk Factors—Claims by others that we infringe their proprietary technology or other rights could harm our business” and “Legal Proceedings” below for additional information.
-
8
-
Customers
Our end-customers are predominantly medium to large enterprises, service providers, and government entities. Our end-customers operate in a variety of industries, including education, energy, financial services, government entities, healthcare, Internet and media, manufacturing, public sector, and telecommunications. Our end-customers deploy our platform for a variety of security functions across a variety of deployment scenarios. Typical deployment scenarios include the enterprise perimeter, the enterprise data center, and the distributed enterprise perimeter. Our end-customer deployments typically involve at least one pair of our products along with one or more of our subscription services, depending on size, security needs and requirements, and network complexity. As of
July 31, 2016
, we had approximately
34,000
end-customers worldwide. No single end-customer accounted for more than 10% of our total revenue in fiscal
2016
,
2015
, or
2014
.
Backlog
Orders for services for multiple years are billed upfront shortly after fulfillment of an order and are included in deferred revenue. Timing of revenue recognition for services may vary depending on the contractual service period or when the services are rendered. Products are shipped and billed shortly after receipt of an order. The majority of our product revenue comes from orders that are received and shipped in the same quarter. As such, we do not believe that our product backlog at any particular time is meaningful and it is not necessarily indicative of our future operating results.
Seasonality
Our business is affected by seasonal fluctuations in customer spending patterns. We have begun to see seasonal patterns in our business, which we expect to become more pronounced as we continue to grow, with our strongest sequential revenue growth occurring in our fiscal second and fourth quarters.
Sales, Customer Support and Marketing
We primarily sell our products and services to end-customers through our channel partners utilizing a two-tier, indirect fulfillment model whereby we sell our products and services to our distributors, which, in turn, sell to our resellers, which then sell to our end-customers. Sales are subject to our standard, non-exclusive distributor agreement, which provides for an initial term of one year, one-year renewal terms, termination by us with 30-90 days written notice prior to the renewal date, and payment to us from the channel partner within 30-45 calendar days of the date we issue an invoice for such sales. For fiscal
2016
,
58.2%
of our total revenue was derived from sales to
two
distributors.
We also sell our VM-Series virtual firewalls directly to end-customers through Amazon’s AWS Marketplace and Microsoft’s Azure Marketplace under a usage-based licensing model.
Sales.
Our sales organization is responsible for large-account acquisition and overall market development, which includes the management of the relationships with our channel partners, working with our channel partners in winning and supporting end-customers through a direct-touch approach, and acting as the liaison between our end-customers and our marketing and product development organizations. We expect to continue to grow our sales headcount in all of our principal markets and expand our presence into countries where we currently do not have a direct sales presence.
Our sales organization is supported by sales engineers with responsibility for pre-sales technical support, solutions engineering for our end-customers, and technical training for our channel partners.
Channel Program.
Our NextWave Channel Partner program is focused on building in-depth relationships with solutions-oriented distributors and resellers that have strong security expertise. The program rewards these partners based on a number of attainment goals, as well as provides them access to marketing funds, technical and sales training, and support. To ensure optimal productivity, we operate a formal accreditation program for our channel partners’ sales and technical professionals. As of
July 31, 2016
, we had more than
3,600
channel partners.
Customer Support.
Our customer support organization is responsible for delivering support, professional, and educational services directly to our channel partners and to end-customers. We leverage the capabilities of our channel partners and train them in the delivery of support, professional, and educational services to ensure these services are locally delivered. We believe that a broad range of support services is essential to the successful customer deployment and ongoing support of our products, and we have hired support engineers with proven experience to provide those services.
Marketing.
Our marketing is focused on building our brand reputation and the market awareness of our platform and driving pipeline and end-customer demand. Our marketing team consists primarily of product marketing, programs marketing, field marketing, channel marketing, and public relations functions. Marketing activities include pipeline development through demand generation, social media and advertising programs, managing the corporate web site and partner portal, trade shows and conferences, press, analyst, and customer relations, and customer awareness. Every year we organize our end-customer conference “Ignite.” We also publish major market research papers such as the “Application Usage and Threat Report,” which are based on the application and
-
9
-
cyber threat landscape of our end-customers. These activities and tools benefit both our direct and indirect channels and are available at no cost to our channel partners.
Manufacturing
We outsource the manufacturing of our security products to various contract manufacturers and original design manufacturers. This approach allows us to reduce our costs as it reduces our manufacturing overhead and inventory and also allows us to adjust more quickly to changing end-customer demand. Our primary manufacturing partner is Flextronics International, Ltd. (“Flex”), who assembles our products using design specifications, quality assurance programs, and standards that we establish, and procures components and assembles our products based on our demand forecasts. These forecasts represent our estimates of future demand for our products based upon historical trends and analysis from our sales and product management functions as adjusted for overall market conditions.
The component parts within our products are either sourced by our contract manufacturers or by various suppliers. We do not have any long-term manufacturing contracts that guarantee us any fixed capacity or pricing, which could increase our exposure to supply shortages or price fluctuations related to raw materials.
Research and Development
Our research and development effort is focused on developing new hardware and software and on enhancing and improving our existing products and services. We believe that hardware and software both are critical to expanding our leadership in the enterprise security market. Our engineering team has deep networking, endpoint, and security expertise and works closely with end-customers to identify their current and future needs. In addition to our focus on hardware and software, our research and development team is focused on research into applications and threats, which allows us to respond to the rapidly changing application and threat landscape.
We believe that innovation and timely development of new features and products is essential to meeting the needs of our end-customers and improving our competitive position. We supplement our own research and development effort with technologies and products that we license from third parties. We test our products thoroughly to certify and ensure interoperability with third-party hardware and software products.
We plan to continue to significantly invest in our research and development effort. Our research and development expense was
$284.2 million
,
$185.8 million
, and
$104.8 million
in fiscal
2016
,
2015
, and
2014
, respectively.
Competition
We operate in the intensely competitive enterprise security market that is characterized by constant change and innovation. Changes in the application, threat, and technology landscape result in evolving customer requirements for the protection from threats and the safe enablement of applications. Our main competitors fall into four categories:
|
•
|
large networking vendors such as Cisco Systems, Inc. (“Cisco”) and Juniper Networks, Inc. (“Juniper”) that incorporate security features in their products;
|
|
•
|
large companies such as Intel Corporation (“Intel”) and International Business Machines Corporation (“IBM”) that have acquired large network and endpoint security specialist vendors in recent years and have the technical and financial resources to bring competitive solutions to the market;
|
|
•
|
independent security vendors such as Check Point Software Technologies Ltd. (“Check Point”), Fortinet, Inc. (“Fortinet”), FireEye, Inc. (“FireEye”), and Symantec Corporation (“Symantec”) that offer a mix of network and endpoint security products; and
|
|
•
|
small and large companies that offer point solutions that compete with some of the features present in our platform.
|
As our market grows, it will attract more highly specialized vendors as well as larger vendors that may continue to acquire or bundle their products more effectively.
The principal competitive factors in our market include:
|
•
|
product features, reliability, performance, and effectiveness;
|
|
•
|
product line breadth, diversity, and applicability;
|
|
•
|
product extensibility and ability to integrate with other technology infrastructures;
|
|
•
|
price and total cost of ownership;
|
|
•
|
adherence to industry standards and certifications;
|
|
•
|
strength of sales and marketing efforts; and
|
-
10
-
|
•
|
brand awareness and reputation.
|
We believe we generally compete favorably with our competitors on the basis of these factors as a result of the features and performance of our platform, the ease of integration of our products with technological infrastructures, and the relatively low total cost of ownership of our products. However, many of our competitors have substantially greater financial, technical, and other resources, greater name recognition, larger sales and marketing budgets, broader distribution, more diversified product lines, and larger and more mature intellectual property portfolios.
Employees
As of
July 31, 2016
, we had
3,795
employees. Competition for qualified personnel in our industry is intense, and we believe that our future success depends in part on our continued ability to hire, motivate, and retain such personnel.
Segment and Geographic Information
We are organized and operate in a single reportable segment, with 70.6% of our total revenue from the Americas, 17.9% from Europe, the Middle East, and Africa (“EMEA”), and 11.5% from Asia Pacific and Japan (“APAC”) in fiscal
2016
. Refer to Note
14
. Segment Information of Notes to Consolidated Financial Statements included in Part II, Item 8 of this Annual Report on Form 10-K for more information about segments and revenue and assets by geographic region.
Available Information
Our website is located at www.paloaltonetworks.com, and our investor relations website is located at investors.paloaltonetworks.com. Our Annual Reports on Form 10-K, Quarterly Reports on Form 10-Q, Current Reports on Form 8-K and amendments to reports filed or furnished pursuant to Sections 13(a) and 15(d) of the Securities Exchange Act of 1934, as amended (the “Exchange Act”), are available free of charge on the Investors portion of our web site as soon as reasonably practicable after we electronically file such material with, or furnish it to, the Securities and Exchange Commission (“SEC”). We also provide a link to the section of the SEC’s website at www.sec.gov that has all of our public filings, including Annual Reports on Form 10-K, Quarterly Reports on Form 10-Q, Current Reports on Form 8-K, all amendments to those reports, our Proxy Statements, and other ownership related filings. Further, a copy of this Annual Report on Form 10-K is located at the SEC’s Public Reference Room at 100 F Street, NE, Washington, D.C. 20549. Information on the operation of the Public Reference Room can be obtained by calling the SEC at 1-800-SEC-0330.
We also use our investor relations website as a channel of distribution for important company information. For example, webcasts of our earnings calls and certain events we participate in or host with members of the investment community are on our investor relations website. Additionally, we announce investor information, including news and commentary about our business and financial performance, SEC filings, notices of investor events, and our press and earnings releases, on our investor relations website. Investors and others can receive notifications of new information posted on our investor relations website in real time by signing up for email alerts and RSS feeds. Further corporate governance information, including our corporate governance guidelines, board committee charters, and code of conduct, is also available on our investor relations website under the heading “Governance.” The contents of our websites are not incorporated by reference into this Annual Report on Form 10-K or in any other report or document we file with the SEC, and any references to our websites are intended to be inactive textual references only.
|
ITEM 1A.
|
RISK FACTORS
|
Our operations and financial results are subject to various risks and uncertainties including those described below. The risks and uncertainties described below are not the only ones we face. Additional risks and uncertainties that we are unaware of, or that we currently believe are not material, also may become important factors that affect us. If any of the following risks or others not specified below materialize, our business, financial condition, and operating results could be materially adversely affected and the market price of our common stock could decline.
Risks Related to Our Business and Our Industry
Our business and operations have experienced rapid growth in recent periods, and if we do not effectively manage any future growth or are unable to improve our systems, processes, and controls, our operating results could be adversely affected.
We have experienced rapid growth and increased demand for our products and services over the last few years. As a result, our employee headcount and number of end-customers have increased significantly, and we expect both to continue to grow over the next year. For example, from the end of fiscal
2015
to the end of fiscal
2016
, our headcount increased from
2,637
to
3,795
employees, and our number of end-customers increased from over
26,000
to approximately
34,000
. In addition, as we have grown, we have increasingly managed more complex deployments of our products and services with larger end-customers. The growth and expansion of our business and product and service offerings places a significant strain on our management, operational,
-
11
-
and financial resources. To manage any future growth effectively, we must continue to improve and expand our information technology and financial infrastructure, our operating and administrative systems, and our ability to manage headcount, capital, and processes in an efficient manner.
We may not be able to successfully implement or scale improvements to our systems, processes, and controls in an efficient or timely manner. In addition, our existing systems, processes, and controls may not prevent or detect all errors, omissions, or fraud. We may also experience difficulties in managing improvements to our systems, processes, and controls or in connection with third-party software licensed to help us with such improvements. Any future growth would add complexity to our organization and require effective coordination throughout our organization. Failure to manage any future growth effectively could result in increased costs, disrupt our existing customer relationships, reduce demand for or limit us to smaller deployments of our platform, and harm our business performance and operating results.
Our operating results may vary significantly from period to period and be unpredictable, which could cause the market price of our common stock to decline.
Our operating results, in particular, our revenues, gross margins, operating margins, and operating expenses, have historically varied from period to period, and even though we have experienced growth, we expect variation to continue as a result of a number of factors, many of which are outside of our control and may be difficult to predict, including:
|
•
|
our ability to attract and retain new end-customers or sell additional products and services to our existing end-customers;
|
|
•
|
the budgeting cycles, seasonal buying patterns, and purchasing practices of end-customers;
|
|
•
|
changes in end-customer, distributor or reseller requirements, or market needs;
|
|
•
|
price competition;
|
|
•
|
the timing and success of new product and service introductions by us or our competitors or any other change in the competitive landscape of our industry, including consolidation among our competitors or end-customers and strategic partnerships entered into by our competitors;
|
|
•
|
changes in the mix of our products and services, including increases in multi-year subscriptions and support and maintenance;
|
|
•
|
our ability to successfully expand our business domestically and internationally;
|
|
•
|
changes in the growth rate of the enterprise security market;
|
|
•
|
deferral of orders from end-customers in anticipation of new products or product enhancements announced by us or our competitors;
|
|
•
|
the timing and costs related to the development or acquisition of technologies or businesses or strategic partnerships;
|
|
•
|
lack of synergy, or the inability to realize expected synergies, resulting from acquisitions or strategic partnerships;
|
|
•
|
our inability to complete or integrate efficiently any acquisitions that we have completed, or that we may undertake;
|
|
•
|
our ability to increase the size and productivity of our distribution channel;
|
|
•
|
decisions by potential end-customers to purchase security solutions from larger, more established security vendors or from their primary network equipment vendors;
|
|
•
|
changes in end-customer penetration, attach, and renewal rates for our services;
|
|
•
|
timing of revenue recognition and revenue deferrals;
|
|
•
|
our ability to manage production and manufacturing related costs, global customer service organization costs, inventory excess and obsolescence costs, and warranty costs;
|
|
•
|
insolvency or credit difficulties confronting our end-customers, which could adversely affect their ability to purchase or pay for our products and services, or confronting our key suppliers, including our sole source suppliers, which could disrupt our supply chain;
|
|
•
|
any disruption in our channel or termination of our relationships with important channel partners, including as a result of consolidation among distributors and resellers of security solutions;
|
|
•
|
our inability to fulfill our end-customers’ orders due to supply chain delays or events that impact our manufacturers or their suppliers;
|
-
12
-
|
•
|
increased expenses, unforeseen liabilities, or write-downs and any impact on our operating results from any acquisitions we consummate;
|
|
•
|
the cost and potential outcomes of litigation, which could have a material adverse effect on our business;
|
|
•
|
seasonality or cyclical fluctuations in our markets;
|
|
•
|
future accounting pronouncements or changes in our accounting policies, including the potential impact of the adoption and implementation of the Financial Accounting Standards Board’s new standard regarding revenue recognition;
|
|
•
|
increases or decreases in our expenses or fluctuations in our sales cycle caused by fluctuations in foreign currency exchange rates, as an increasing amount of our expenses is incurred and paid in currencies other than the U.S. dollar;
|
|
•
|
political, economic and social instability, including continued hostilities in the Middle East, terrorist activities, and any disruption these events may cause to the broader global industrial economy; and
|
|
•
|
general macroeconomic conditions, both domestically and in our foreign markets that could impact some or all regions where we operate.
|
Any one of the factors above, or the cumulative effect of some of the factors referred to above, may result in significant fluctuations in our financial and other operating results. This variability and unpredictability could result in our failure to meet our revenue, margin, or other operating result expectations or those of securities analysts or investors for a particular period. If we fail to meet or exceed such expectations for these or any other reasons, the market price of our common stock could fall substantially, and we could face costly lawsuits, including securities class action suits.
Uncertain or weakened global economic conditions could have an adverse effect on our business and operating results.
We operate globally and as a result our business and revenues are impacted by global macroeconomic conditions. The global macroeconomic environment has been and may continue to be inconsistent and challenging due to instability in the global credit markets, the current economic challenges in China, falling demand for oil and other commodities, uncertainties regarding the effects of the recent “Brexit” decision, geopolitical turmoil and other disruptions to global and regional economies and markets. As a result, any continued or further uncertainty, weakness or deterioration in global macroeconomic and market conditions may cause our end-customers to modify spending priorities or delay purchasing decisions, and result in lengthened sales cycles, all of which could harm our business and operating results.
Our revenue growth rate in recent periods may not be indicative of our future performance.
We have experienced revenue growth rates of
48.5%
and
55.1%
in fiscal
2016
and fiscal
2015
, respectively. Our revenue for any prior quarterly or annual period should not be relied upon as an indication of our future revenue or revenue growth for any future period. If we are unable to maintain consistent revenue or revenue growth, the market price of our common stock could be volatile, and it may be difficult for us to achieve and maintain profitability or maintain or increase cash flow on a consistent basis.
We have a history of losses, anticipate increasing our operating expenses in the future, and may not be able to achieve or maintain profitability or maintain or increase cash flow on a consistent basis, which could cause our business, financial condition, and operating results to suffer.
Other than fiscal 2012, we have incurred losses in all fiscal years since our inception. As a result, we had an accumulated deficit of
$726.6 million
at
July 31, 2016
. We anticipate that our operating expenses will continue to increase in the foreseeable future as we continue to grow our business. Our growth efforts may prove more expensive than we currently anticipate, and we may not succeed in increasing our revenues sufficiently, or at all, to offset higher expenses. Revenue growth may slow or revenue may decline for a number of possible reasons, including slowing demand for our products or services, increasing competition, a decrease in the growth of our overall market, or a failure to capitalize on growth opportunities. Any failure to increase our revenue as we grow our business could prevent us from achieving or maintaining profitability or maintaining or increasing cash flow on a consistent basis. In addition, we may have difficulty achieving profitability under U.S. GAAP due to share-based compensation expense and other non-cash charges. If we are unable to navigate these challenges as we encounter them, our business, financial condition, and operating results may suffer.
If we are unable to sell additional products and services to our end-customers, our future revenue and operating results will be harmed.
Our future success depends, in part, on our ability to expand the deployment of our platform with existing end-customers. This may require increasingly sophisticated and costly sales efforts that may not result in additional sales. The rate at which our end-customers purchase additional products and services depends on a number of factors, including the perceived need for
-
13
-
additional security products and services as well as general economic conditions. Further, existing end-customers have no contractual obligation to and may not renew their subscription and support and maintenance contracts after the completion of their initial contract period. Our end-customers’ renewal rates may decline or fluctuate as a result of a number of factors, including their satisfaction with our services and our end-customer support, the frequency and severity of subscription outages, our product uptime or latency, and the pricing of our, or competing, services. Additionally, our end-customers may renew their subscription and support and maintenance services for shorter contract lengths or on other terms that are less economically beneficial to us. We also cannot be certain that our end-customers will renew their subscription and support and maintenance services. If our efforts to sell additional products and services to our end-customers are not successful or our end-customers do not renew their subscription and support and maintenance agreements or renew on less favorable terms, our revenues may grow more slowly than expected or decline.
We face intense competition in our market, especially from larger, well-established companies, and we may lack sufficient financial or other resources to maintain or improve our competitive position.
The market for enterprise security products is intensely competitive, and we expect competition to increase in the future from established competitors and new market entrants. Our main competitors fall into four categories:
|
•
|
large networking vendors such as Cisco and Juniper that incorporate security features in their products;
|
|
•
|
large companies such as Intel and IBM that have acquired large network and endpoint security specialist vendors in recent years and have the technical and financial resources to bring competitive solutions to the market;
|
|
•
|
independent security vendors such as Check Point, Fortinet, FireEye, and Symantec that offer a mix of network and endpoint security products; and
|
|
•
|
small and large companies that offer point solutions that compete with some of the features present in our platform.
|
Many of our existing competitors have, and some of our potential competitors could have, substantial competitive advantages such as:
|
•
|
greater name recognition and longer operating histories;
|
|
•
|
larger sales and marketing budgets and resources;
|
|
•
|
broader distribution and established relationships with distribution partners and end-customers;
|
|
•
|
greater customer support resources;
|
|
•
|
greater resources to make strategic acquisitions or enter into strategic partnerships;
|
|
•
|
lower labor and development costs;
|
|
•
|
larger and more mature intellectual property portfolios; and
|
|
•
|
substantially greater financial, technical, and other resources.
|
In addition, some of our larger competitors have substantially broader and more diverse product and services offerings, which may make them less susceptible to downturns in a particular market and allow them to leverage their relationships based on other products or incorporate functionality into existing products to gain business in a manner that discourages users from purchasing our products and services, including through selling at zero or negative margins, offering concessions, product bundling, or closed technology platforms. Many of our smaller competitors that specialize in providing protection from a single type of security threat are often able to deliver these specialized security products to the market more quickly than we can.
Organizations that use legacy products and services may believe that these products and services are sufficient to meet their security needs or that our platform only serves the needs of a portion of the enterprise security market. Accordingly, these organizations may continue allocating their information technology budgets for legacy products and services and may not adopt our security platform. Further, many organizations have invested substantial personnel and financial resources to design and operate their networks and have established deep relationships with other providers of networking and security products. As a result, these organizations may prefer to purchase from their existing suppliers rather than add or switch to a new supplier such as us regardless of product performance, features, or greater services offerings or may be more willing to incrementally add solutions to their existing security infrastructure from existing suppliers than to replace it wholesale with our solutions.
Conditions in our market could change rapidly and significantly as a result of technological advancements, partnering or acquisitions by our competitors, or continuing market consolidation. New start-up companies that innovate and large competitors that are making significant investments in research and development may invent similar or superior products and technologies that compete with our products and technology. Some of our competitors have made or could make acquisitions of businesses that may allow them to offer more directly competitive and comprehensive solutions than they had previously offered and adapt more
-
14
-
quickly to new technologies and end-customer needs. Our current and potential competitors may also establish cooperative relationships among themselves or with third parties that may further enhance their resources.
These competitive pressures in our market or our failure to compete effectively may result in price reductions, fewer orders, reduced revenue and gross margins, and loss of market share. Any failure to meet and address these factors could seriously harm our business and operating results.
A network or data security incident may allow unauthorized access to our network or data, harm our reputation, create additional liability and adversely impact our financial results.
Increasingly, companies are subject to a wide variety of attacks on their networks on an ongoing basis. In addition to traditional computer “hackers,” malicious code (such as viruses and worms), phishing attempts, employee theft or misuse, and denial of service attacks, sophisticated nation-state and nation-state supported actors now engage in intrusions and attacks (including advanced persistent threat intrusions) and add to the risks to our internal networks and the information they store and process. Despite significant efforts to create security barriers to such threats, it is virtually impossible for us to entirely mitigate these risks. Furthermore, as a well-known provider of security solutions, we may be a more attractive target for such attacks. A breach in our data security could compromise our networks or networks secured by our products, creating system disruptions or slowdowns and exploiting security vulnerabilities of our products, and the information stored on our networks could be accessed, publicly disclosed, altered, lost, or stolen, which could subject us to liability and cause us financial harm. Although we have not yet experienced significant damages from unauthorized access by a third party of our internal network, any actual or perceived breach of network security in our internal systems could result in damage to our reputation, negative publicity, loss of channel partners, end-customers and sales, loss of competitive advantages over our competitors, increased costs to remedy any problems, and costly litigation. Any of these negative outcomes could adversely impact the market perception of our products and services and investor confidence in our company and could seriously harm our business or operating results.
Reliance on shipments at the end of the quarter could cause our revenue for the applicable period to fall below expected levels.
As a result of end-customer buying patterns and the efforts of our sales force and channel partners to meet or exceed their sales objectives, we have historically received a substantial portion of sales orders and generated a substantial portion of revenue during the last few weeks of each fiscal quarter. If expected revenue at the end of any fiscal quarter is delayed for any reason, including the failure of anticipated purchase orders to materialize (particularly for large enterprise end-customers with lengthy sales cycles), our logistics partners’ inability to ship products prior to fiscal quarter-end to fulfill purchase orders received near the end of the fiscal quarter, our failure to manage inventory to meet demand, any failure of our systems related to order review and processing, or any delays in shipments based on trade compliance requirements, our revenue for that quarter could fall below our expectations and the estimates of analysts, which could adversely impact our business and operating results and cause a decline in the market price of our common stock.
Seasonality may cause fluctuations in our revenue.
We believe there are significant seasonal factors that may cause our second and fourth fiscal quarters to record greater revenue sequentially than our first and third fiscal quarters. We believe that this seasonality results from a number of factors, including:
|
•
|
end-customers with a December 31 fiscal year-end choosing to spend remaining unused portions of their discretionary budgets before their year-end, which potentially results in a positive impact on our revenue in our second fiscal quarter;
|
|
•
|
our sales compensation plans, which are typically structured around annual quotas and commission rate accelerators, which potentially results in a positive impact on our revenue in our fourth fiscal quarter;
|
|
•
|
seasonal reductions in business activity during August in the United States, Europe and certain regions, which potentially results in a negative impact on our first fiscal quarter revenue; and
|
|
•
|
the timing of end-customer budget planning at the beginning of the calendar year, which can result in a delay in spending at the beginning of the calendar year potentially resulting in a negative impact on our revenue in our third fiscal quarter.
|
As we continue to grow, seasonal or cyclical variations in our operations may become more pronounced, and our business, operating results and financial position may be adversely affected.
-
15
-
If we are unable to hire, integrate, train, retain, and motivate qualified personnel and senior management, our business could suffer.
Our future success depends, in part, on our ability to continue to attract, integrate, and retain qualified and highly skilled personnel. We are substantially dependent on the continued service of our existing engineering personnel because of the complexity of our platform. Additionally, any failure to hire, train, and adequately incentivize our sales personnel or the inability of our recently hired sales personnel to effectively ramp to target productivity levels could negatively impact our growth and operating margins. Competition for highly skilled personnel, particularly in engineering, is often intense, especially in the San Francisco Bay Area, where we have a substantial presence and need for such personnel. In addition, the industry in which we operate generally experiences high employee attrition. Although we have entered into employment offer letters with our key personnel, these agreements have no specific duration and constitute at-will employment. We do not maintain key person life insurance policies on any of our employees. The loss of one or more of our key employees could seriously harm our business. If we are unable to attract, integrate, or retain the qualified and highly skilled personnel required to fulfill our current or future needs, our business, financial condition, and operating results could be harmed.
Our future performance also depends on the continued services and continuing contributions of our senior management to execute on our business plan and to identify and pursue new opportunities and product innovations. The loss of services of senior management or the ineffective management of any leadership transitions, especially within in our sales organization, could significantly delay or prevent the achievement of our development and strategic objectives, which could adversely affect our business, financial condition, and operating results.
Further, we believe that a critical contributor to our success and our ability to retain highly skilled personnel has been our corporate culture, which we believe fosters innovation, teamwork, passion for end-customers, focus on execution, and the facilitation of critical knowledge transfer and knowledge sharing. As we grow and change, we may find it difficult to maintain these important aspects of our corporate culture. Any failure to preserve our culture as we grow could limit our ability to innovate and could negatively affect our ability to retain and recruit personnel, continue to perform at current levels or execute on our business strategy.
If we are not successful in executing our strategy to increase sales of our products and services to new and existing medium and large enterprise end-customers, our operating results may suffer.
Our growth strategy is dependent, in part, upon increasing sales of our products to new and existing medium and large enterprise end-customers. Sales to these types of end-customers involve risks that may not be present, or that are present to a lesser extent, with sales to smaller entities. These risks include:
|
•
|
competition from larger competitors, such as Cisco, Check Point, and Juniper, that traditionally target larger enterprises, service providers, and government entities and that may have pre-existing relationships or purchase commitments from those end-customers;
|
|
•
|
increased purchasing power and leverage held by large end-customers in negotiating contractual arrangements with us;
|
|
•
|
more stringent requirements in our worldwide support and maintenance service contracts, including stricter support response times and penalties for any failure to meet support requirements; and
|
|
•
|
longer sales cycles, in some cases over 12 months, and the associated risk that substantial time and resources may be spent on a potential end-customer that elects not to purchase our products and services.
|
In addition, product purchases by large enterprises are frequently subject to budget constraints, multiple approvals, and unplanned administrative, processing, and other delays. Finally, large enterprises typically have longer implementation cycles, require greater product functionality and scalability and a broader range of services, demand that vendors take on a larger share of risks, sometimes require acceptance provisions that can lead to a delay in revenue recognition, and expect greater payment flexibility from vendors. All of these factors can add further risk to business conducted with these end-customers. If we fail to realize an expected sale from a large end-customer in a particular quarter or at all, our business, operating results, and financial condition could be materially and adversely affected.
We rely on revenue from subscription and support and maintenance services, and because we recognize revenue from subscription and support and maintenance services over the term of the relevant service period, downturns or upturns in sales of these subscription and support and maintenance services are not immediately reflected in full in our operating results.
Services revenue accounts for a significant portion of our revenue, comprising
51.3%
of total revenue in fiscal
2016
,
46.9%
of total revenue in fiscal
2015
, and
43.1%
of total revenue in fiscal
2014
. Sales of new or renewal subscription and support and maintenance contracts may decline and fluctuate as a result of a number of factors, including end-customers’ level of satisfaction with our products and services, the prices of our products and services, the prices of products and services offered by our competitors, and reductions in our end-customers’ spending levels. If our sales of new or renewal subscription and support and
-
16
-
maintenance contracts decline, our total revenue and revenue growth rate may decline and our business will suffer. In addition, we recognize subscription and support and maintenance revenue monthly over the term of the relevant service period, which is typically one to five years. As a result, much of the subscription and support and maintenance revenue we report each fiscal quarter is the recognition of deferred revenue from subscription and support and maintenance contracts entered into during previous fiscal quarters. Consequently, a decline in new or renewed subscription or support and maintenance contracts in any one fiscal quarter will not be fully or immediately reflected in revenue in that fiscal quarter but will negatively affect our revenue in future fiscal quarters. Also, it is difficult for us to rapidly increase our services revenue through additional services sales in any period, as revenue from new and renewal subscription and support and maintenance contracts must be recognized over the applicable service period.
Defects, errors, or vulnerabilities in our products or services, the failure of our products or services to block a virus or prevent a security breach, misuse of our products, or risks of product liability claims could harm our reputation and adversely impact our operating results.
Because our products and services are complex, they have contained and may contain design or manufacturing defects or errors that are not detected until after their commercial release and deployment by our end-customers. For example, from time to time, certain of our end-customers have reported defects in our products related to performance, scalability, and compatibility. Additionally, defects may cause our products or services to be vulnerable to security attacks, cause them to fail to help secure networks, or temporarily interrupt end-customers’ networking traffic. Because the techniques used by computer hackers to access or sabotage networks change frequently and generally are not recognized until launched against a target, we may be unable to anticipate these techniques and provide a solution in time to protect our end-customers’ networks. Furthermore, as a well-known provider of security solutions, our networks, products, including cloud-based technology, and services could be targeted by attacks specifically designed to disrupt our business and harm our reputation. In addition, defects or errors in our subscription updates or our products could result in a failure of our services to effectively update end-customers’ hardware and cloud-based products. Our data centers and networks may experience technical failures and downtime, may fail to distribute appropriate updates, or may fail to meet the increased requirements of a growing installed end-customer base, any of which could temporarily or permanently expose our end-customers’ networks, leaving their networks unprotected against the latest security threats. Moreover, our products must interoperate with our end-customers’ existing infrastructure, which often have different specifications, utilize multiple protocol standards, deploy products from multiple vendors, and contain multiple generations of products that have been added over time. As a result, when problems occur in a network, it may be difficult to identify the sources of these problems.
The occurrence of any such problem in our products, whether real or perceived, could result in:
|
•
|
expenditure of significant financial and product development resources in efforts to analyze, correct, eliminate, or work-around errors or defects or to address and eliminate vulnerabilities;
|
|
•
|
loss of existing or potential end-customers or channel partners;
|
|
•
|
delayed or lost revenue;
|
|
•
|
delay or failure to attain market acceptance;
|
|
•
|
an increase in warranty claims compared with our historical experience, or an increased cost of servicing warranty claims, either of which would adversely affect our gross margins; and
|
|
•
|
litigation, regulatory inquiries, or investigations that may be costly and harm our reputation.
|
Further, our products may be misused by end-customers or third parties that obtain access to our products. For example, our products could be used to censor private access to certain information on the Internet. Such use of our products for censorship could result in negative press coverage and negatively affect our reputation.
The limitation of liability provisions in our standard terms and conditions of sale may not fully or effectively protect us from claims as a result of federal, state, or local laws or ordinances, or unfavorable judicial decisions in the United States or other countries. The sale and support of our products also entails the risk of product liability claims. Although we may be indemnified by our third-party manufacturers for product liability claims arising out of manufacturing defects, because we control the design of our products, we may not be indemnified for product liability claims arising out of design defects. We maintain insurance to protect against certain claims associated with the use of our products, but our insurance coverage may not adequately cover any claim asserted against us. In addition, even claims that ultimately are unsuccessful could result in our expenditure of funds in litigation, divert management’s time and other resources, and harm our reputation.
-
17
-
False detection of applications, viruses, spyware, vulnerability exploits, data patterns, or URL categories could adversely affect our business.
Our classifications of application type, virus, spyware, vulnerability exploits, data, or URL categories may falsely detect applications, content, or threats that do not actually exist. This risk is heightened by the inclusion of a “heuristics” feature in our products, which attempts to identify applications and other threats not based on any known signatures but based on characteristics or anomalies which indicate that a particular item may be a threat. These false positives may impair the perceived reliability of our products and may therefore adversely impact market acceptance of our products. If our products restrict important files or applications based on falsely identifying them as malware or some other item that should be restricted, this could adversely affect end-customers’ systems and cause material system failures. Any such false identification of important files or applications could result in damage to our reputation, negative publicity, loss of channel partners, end-customers and sales, increased costs to remedy any problem, and costly litigation.
We rely on our channel partners to sell substantially all of our products, and if these channel partners fail to perform, our ability to sell and distribute our products and services will be limited, and our operating results will be harmed.
Substantially all of our revenue is generated by sales through our channel partners, including distributors and resellers. We provide our channel partners with specific training and programs to assist them in selling our products, but there can be no assurance that these steps will be effective. In addition, our channel partners may be unsuccessful in marketing, selling, and supporting our products and services. We may not be able to incentivize these channel partners to sell our products to end-customers and, in particular, to large enterprises. These channel partners may also have incentives to promote our competitors’ products and may devote more resources to the marketing, sales, and support of such competitive products. Our agreements with our channel partners may generally be terminated for any reason by either party with advance notice prior to each annual renewal date. We cannot be certain that we will retain these channel partners or that we will be able to secure additional or replacement channel partners. In addition, any new channel partner requires extensive training and may take several months or more to achieve productivity. Our channel partner sales structure could subject us to lawsuits, potential liability, and reputational harm if, for example, any of our channel partners misrepresent the functionality of our products or services to end-customers or violate laws or our corporate policies. If we fail to effectively manage our sales channels or channel partners, our ability to sell our products and services and operating results will be harmed.
If we do not accurately predict, prepare for, and respond promptly to the rapidly evolving technological and market developments and successfully manage product introductions and transitions to meet changing end-customer needs in the enterprise security market, our competitive position and prospects will be harmed.
The enterprise security market has grown quickly and is expected to continue to evolve rapidly. Moreover, many of our end-customers operate in markets characterized by rapidly changing technologies and business plans, which require them to add numerous network access points and adapt increasingly complex enterprise networks, incorporating a variety of hardware, software applications, operating systems, and networking protocols. If we fail to accurately predict end-customers’ changing needs and emerging technological trends in the enterprise security industry, including in the areas of mobility, virtualization, cloud computing, and software defined networks (“SDN”), our business could be harmed. The technology in our platform is especially complex because it needs to effectively identify and respond to new and increasingly sophisticated methods of attack, while minimizing the impact on network performance. Additionally, some of our new platform features and related platform enhancements may require us to develop new hardware architectures that involve complex, expensive, and time-consuming research and development processes. The development of our platform is difficult and the timetable for commercial release and availability is uncertain as there can be long time periods between releases and availability of new platform features. If we experience unanticipated delays in the availability of new products, platform features and services and fail to meet customer expectations for such availability, our competitive position and business prospects will be harmed.
Additionally, we must commit significant resources to developing new platform features before knowing whether our investments will result in products, services and platform features the market will accept. The success of new platform features depends on several factors, including appropriate new product definition, differentiation of new products, services and platform features from those of our competitors, and market acceptance of these products, services and platform features. Moreover, successful new product introduction and transition depends on a number of factors including, our ability to manage the risks associated with new product production ramp-up issues, the availability of application software for new products, the effective management of purchase commitments and inventory, the availability of products in appropriate quantities and costs to meet anticipated demand, and the risk that new products may have quality or other defects or deficiencies in the early stages of introduction. There can be no assurance that we will successfully identify opportunities for new products and services, develop and bring new products and services to market in a timely manner, or achieve market acceptance of our products and services, or that products, services, and technologies developed by others will not render our products, services or technologies obsolete or noncompetitive.
-
18
-
Our current research and development efforts may not produce successful products or platform features that result in significant revenue, cost savings or other benefits in the near future, if at all.
Developing our products, platform features and related enhancements is expensive. Our investments in research and development may not result in significant design improvements, marketable products or platform features, or may result in products or platform features that are more expensive than anticipated. Additionally, we may not achieve the cost savings or the anticipated performance improvements we expect, and we may take longer to generate revenue, or generate less revenue, than we anticipate. Our future plans include significant investments in research and development and related product opportunities. We believe that we must continue to dedicate a significant amount of resources to our research and development efforts to maintain our competitive position. However, we may not receive significant revenue from these investments in the near future, if at all, or these investments may not yield the expected benefits, either of which could adversely affect our business and operating results.
Because we depend on third-party manufacturers to build and ship our products, we are susceptible to manufacturing and logistics delays and pricing fluctuations that could prevent us from shipping customer orders on time, if at all, or on a cost-effective basis, which may result in the loss of sales and end-customers.
We depend on third-party manufacturers, primarily a subsidiary of Flex, our contract manufacturer, as sole source manufacturers for our product lines. Our reliance on these third-party manufacturers reduces our control over the manufacturing process and exposes us to risks, including reduced control over quality assurance, product costs, product supply, timing and transportation risk. Our products are primarily manufactured by our contract manufacturers at facilities located in the United States. Over time, a growing portion of our products may be manufactured outside the United States as we look for cost savings opportunities, which may subject us to additional logistical risks or risks associated with complying with local rules and regulations in foreign countries. Any manufacturing and logistics disruption by our third-party manufacturers could severely impair our ability to fulfill orders.
In addition, we are subject to requirements under the Dodd-Frank Wall Street Reform and Consumer Protection Act of 2010 to diligence, disclose, and report whether or not our products contain minerals originating from the Democratic Republic of the Congo and adjoining countries, or conflict minerals. We have incurred and expect to incur additional costs to comply with these disclosure requirements, including costs related to determining the source of any of the relevant minerals and metals used in our products. These requirements could adversely affect the sourcing, availability, and pricing of minerals used in the manufacture of semiconductor devices or other components used in our products. We may also encounter end-customers who require that all of the components of our products be certified as conflict free. If we are not able to meet this requirement, such end-customers may choose not to purchase our products.
Our third-party manufacturers typically fulfill our supply requirements on the basis of individual orders. We do not have long-term contracts with these manufacturers that guarantee capacity, the continuation of particular pricing terms, or the extension of credit limits. Accordingly, they are not obligated to continue to fulfill our supply requirements and the prices we pay for manufacturing services could be increased on short notice. Our contract with Flex permits them to terminate the agreement for their convenience, subject to prior notice requirements. If we are required to change contract manufacturers, our ability to meet our scheduled product deliveries to our end-customers could be adversely affected, which could cause the loss of sales to existing or potential end-customers, delayed revenue or an increase in our costs which could adversely affect our gross margins. Any production interruptions for any reason, such as a natural disaster, epidemic, capacity shortages, or quality problems, at one of our manufacturing partners would negatively affect sales of our product lines manufactured by that manufacturing partner and adversely affect our business and operating results.
Managing the supply of our products and product components is complex. Insufficient supply and inventory may result in lost sales opportunities or delayed revenue, while excess inventory may harm our gross margins.
Our third-party manufacturers procure components and build our products based on our forecasts, and we generally do not hold inventory for a prolonged period of time. These forecasts are based on estimates of future demand for our products, which are in turn based on historical trends and analyses from our sales and marketing organizations, adjusted for overall market conditions. In order to reduce manufacturing lead times and plan for adequate component supply, from time to time we may issue forecasts for components and products that are non-cancelable and non-returnable.
Our inventory management systems and related supply chain visibility tools may be inadequate to enable us to forecast accurately and effectively manage supply of our products and product components. If we ultimately determine that we have excess supply, we may have to reduce our prices and write-down inventory, which in turn could result in lower gross margins. If our actual component usage and product demand are lower than the forecast we provide to our third-party manufacturers, we accrue for losses on manufacturing commitments in excess of forecasted demand. Alternatively, insufficient supply levels may lead to shortages that result in delayed product revenue or loss of sales opportunities altogether as potential end-customers turn to competitors’ products that are readily available. If we are unable to effectively manage our supply and inventory, our operating results could be adversely affected.
-
19
-
Because some of the key components in our products come from limited sources of supply, we are susceptible to supply shortages or supply changes, which could disrupt or delay our scheduled product deliveries to our end-customers and may result in the loss of sales and end-customers.
Our products rely on key components, including integrated circuit components, which our contract manufacturers purchase on our behalf from a limited number of suppliers, including sole source providers. The manufacturing operations of some of our component suppliers are geographically concentrated in Asia and elsewhere, which makes our supply chain vulnerable to regional disruptions, such as natural disasters, fire, political instability, civil unrest, a power outage, or a localized health risk, and as a result could impair the volume of components that we are able to obtain.
Further, we do not have volume purchase contracts with any of our component suppliers, and they could cease selling to us at any time. If we are unable to obtain a sufficient quantity of these components in a timely manner for any reason, sales of our products could be delayed or halted or we could be forced to expedite shipment of such components or our products at dramatically increased costs. Our component suppliers also change their selling prices frequently in response to market trends, including industry-wide increases in demand, and because we do not have volume purchase contracts with these suppliers, we are susceptible to price fluctuations related to raw materials and components and may not be able to adjust our prices accordingly. Additionally, poor quality in any of the sole-sourced components in our products could result in lost sales or sales opportunities.
If we are unable to obtain a sufficient volume of the necessary components for our products on commercially reasonable terms or the quality of the components do not meet our requirements, we could also be forced to redesign our products and qualify new components from alternate suppliers. The resulting stoppage or delay in selling our products and the expense of redesigning our products could result in lost sales opportunities and damage to customer relationships, which would adversely affect our business and operating results.
The sales prices of our products and services may decrease, which may reduce our gross profits and adversely impact our financial results.
The sales prices for our products and services may decline for a variety of reasons, including competitive pricing pressures, discounts, a change in our mix of products and services, anticipation of the introduction of new products or services, or promotional programs. Competition continues to increase in the market segments in which we participate, and we expect competition to further increase in the future, thereby leading to increased pricing pressures. Larger competitors with more diverse product and service offerings may reduce the price of products or services that compete with ours or may bundle them with other products and services. Additionally, although we price our products and services worldwide in U.S. dollars, currency fluctuations in certain countries and regions may negatively impact actual prices that channel partners and end-customers are willing to pay in those countries and regions. Furthermore, we anticipate that the sales prices and gross profits for our products will decrease over product life cycles. We cannot guarantee that we will be successful in developing and introducing new offerings with enhanced functionality on a timely basis, or that our product and service offerings, if introduced, will enable us to maintain our prices and gross profits at levels that will allow us to achieve and maintain profitability.
We generate a significant amount of revenue from sales to distributors, resellers, and end-customers outside of the United States, and we are therefore subject to a number of risks associated with international sales and operations.
We have a limited history of marketing, selling, and supporting our products and services internationally. We may experience difficulties in recruiting, training, managing, and retaining an international staff, and specifically staff related to sales management and sales personnel. We also may not be able to maintain successful strategic distributor relationships internationally or recruit additional companies to enter into strategic distributor relationships. Business practices in the international markets that we serve may differ from those in the United States and may require us in the future to include terms other than our standard terms related to payment, warranties, or performance obligations in end-customer contracts.
Additionally, our international sales and operations are subject to a number of risks, including the following:
|
•
|
political, economic and social uncertainty around the world, in particular, macroeconomic challenges in Europe, terrorist activities, and continued hostilities in the Middle East;
|
|
•
|
greater difficulty in enforcing contracts and accounts receivable collection and longer collection periods;
|
|
•
|
the uncertainty of protection for intellectual property rights in some countries;
|
|
•
|
greater risk of unexpected changes in regulatory practices, tariffs, and tax laws and treaties;
|
|
•
|
risks associated with trade restrictions and foreign legal requirements, including the importation, certification, and localization of our products required in foreign countries;
|
-
20
-
|
•
|
greater risk of a failure of foreign employees, channel partners, distributors, and resellers to comply with both U.S. and foreign laws, including antitrust regulations, the U.S. Foreign Corrupt Practices Act, the U.K. Bribery Act, U.S. or foreign sanctions regimes and export or import control laws, and any trade regulations ensuring fair trade practices;
|
|
•
|
heightened risk of unfair or corrupt business practices in certain geographies and of improper or fraudulent sales arrangements;
|
|
•
|
increased expenses incurred in establishing and maintaining office space and equipment for our international operations;
|
|
•
|
management communication and integration problems resulting from cultural and geographic dispersion; and
|
|
•
|
fluctuations in exchange rates between the U.S. dollar and foreign currencies in markets where we do business and related impact on sales cycles.
|
These and other factors could harm our ability to gain future international revenues and, consequently, materially impact our business, operating results, and financial condition. The expansion of our existing international operations and entry into additional international markets will require significant management attention and financial resources. Our failure to successfully manage our international operations and the associated risks effectively could limit the future growth of our business.
Further, we are subject to risks associated with changes in economic and political conditions in countries in which we operate or sell our products and services. For instance, on June 23, 2016, the United Kingdom (the “U.K.”) held a referendum in which voters approved an exit from the European Union (the “E.U.”), commonly referred to as “Brexit.” As a result of the referendum, it is expected that the British government will begin negotiating the terms of the U.K.’s withdrawal from the E.U. A withdrawal could, among other outcomes, disrupt the free movement of goods, services and people between the U.K. and the E.U., undermine bilateral cooperation in key policy areas and significantly disrupt trade between the U.K. and the E.U.; however, the full effects of Brexit are uncertain and will depend on any agreements the U.K. makes to retain access to E.U. markets either during a transitional period or more permanently. In addition, Brexit could lead to legal uncertainty and potentially divergent national laws and regulations as the U.K. determines which E.U. laws to replace or replicate. Given these possibilities and others we may not anticipate, as well as the lack of comparable precedent, the full extent to which our business, operating results and financial condition could be adversely affected by Brexit is uncertain.
The announcement of Brexit and the withdrawal of the U.K. from the E.U. may also create global economic uncertainty, which may cause our end-customers to closely monitor their costs and reduce their spending budgets. Any of these effects of Brexit, among others noted above, could adversely affect our business, financial condition, operating results and cash flows.
We are exposed to fluctuations in currency exchange rates, which could negatively affect our financial condition and operating results.
Our sales contracts are primarily denominated in U.S. dollars, and therefore, substantially all of our revenue is not subject to foreign currency risk. However, including as a result of the announcement of Brexit, there has been, and may continue to be, significant volatility in global stock markets and currency exchange rate fluctuations that resulted in the strengthening of the U.S. dollar against foreign currencies in which we conduct business. The strengthening of the U.S. dollar increases the real cost of our platform to our end-customers outside of the United States, leading to delays in the purchase of our products and services and the lengthening of our sales cycle. If the U.S. dollar continues to strengthen, this could adversely affect our financial condition and operating results. In addition, increased international sales in the future, including through our channel partners and other partnerships, may result in greater foreign currency denominated sales, increasing our foreign currency risk.
Our operating expenses incurred outside the United States and denominated in foreign currencies are increasing and are subject to fluctuations due to changes in foreign currency exchange rates. If we are not able to successfully hedge against the risks associated with foreign currency fluctuations, our financial condition and operating results could be adversely affected. As of
July 31, 2016
, we had not entered into any hedging transactions. On August 30, 2016, in an effort to reduce our foreign currency exchange exposure related to our euro-dominated expenditures for the fiscal year ending July 31, 2017, we entered into forward contracts with a notional amount of €66.9 million. The effectiveness of our existing hedging transactions and the availability and effectiveness of any hedging transactions we may decide to enter into in the future may be limited and we may not be able to successfully hedge our exposure, which could adversely affect our financial condition and operating results.
A small number of channel partners represent a large percentage of our revenue and gross accounts receivable. We are exposed to the credit and liquidity risk of some of our channel partners and to credit exposure in weakened markets, which could result in material losses.
For fiscal
2016
,
two
distributors represented
58.2%
of our total revenue, and as of
July 31, 2016
,
four
distributors represented
74.1
% of our gross accounts receivable. Most of our sales to our channel partners are made on an open credit basis. Although we have programs in place that are designed to monitor and mitigate these risks, we cannot guarantee these programs
-
21
-
will be effective in reducing our credit risks, especially as we expand our business internationally. If we are unable to adequately control these risks, our business, operating results, and financial condition could be harmed.
A portion of our revenue is generated by sales to government entities, which are subject to a number of challenges and risks.
Sales to government entities are subject to a number of risks. Selling to government entities can be highly competitive, expensive, and time-consuming, often requiring significant upfront time and expense without any assurance that these efforts will generate a sale. The substantial majority of our sales to date to government entities have been made indirectly through our channel partners. Government certification requirements for products like ours may change, thereby restricting our ability to sell into the federal government sector until we have attained the revised certification. If our products are late in achieving or fail to achieve compliance with these certifications and standards, or our competitors achieve compliance with these certifications and standards, we may be disqualified from selling our products to such governmental entity, or be at a competitive disadvantage, which would harm our business, operating results, and financial condition. Government demand and payment for our products and services may be impacted by public sector budgetary cycles, contracting requirements, and funding authorizations, with funding reductions or delays adversely affecting public sector demand for our products and services. Government entities may have statutory, contractual, or other legal rights to terminate contracts with our distributors and resellers for convenience or due to a default, and any such termination may adversely impact our future operating results. Governments routinely investigate and audit government contractors’ administrative processes, and any unfavorable audit could result in the government refusing to continue buying our products and services, a reduction of revenue, or fines or civil or criminal liability if the audit uncovers improper or illegal activities, which could adversely impact our operating results in a material way. Finally, for purchases by the U.S. government, the U.S. government may require certain products to be manufactured in the United States and other relatively high cost manufacturing locations, and we may not manufacture all products in locations that meet such requirements, affecting our ability to sell these products to the U.S. government.
Our ability to sell our products is dependent on the quality of our technical support services and those of our channel partners, and the failure to offer high-quality technical support services could have a material adverse effect on our end-customers’ satisfaction with our products and services, our sales, and our operating results.
After our products are deployed within our end-customers’ networks, our end-customers depend on our technical support services, as well as the support of our channel partners, to resolve any issues relating to our products. Our channel partners often provide similar technical support for third parties’ products, and may therefore have fewer resources to dedicate to the support of our products. If we or our channel partners do not effectively assist our end-customers in deploying our products, succeed in helping our end-customers quickly resolve post-deployment issues, or provide effective ongoing support, our ability to sell additional products and services to existing end-customers would be adversely affected and our reputation with potential end-customers could be damaged. Many larger enterprise, service provider, and government entity end-customers have more complex networks and require higher levels of support than smaller end-customers. If we or our channel partners fail to meet the requirements of these larger end-customers, it may be more difficult to execute on our strategy to increase our coverage with larger end-customers. Additionally, if our channel partners do not effectively provide support to the satisfaction of our end-customers, we may be required to provide direct support to such end-customers, which would require us to hire additional personnel and to invest in additional resources. It can take several months to recruit, hire, and train qualified technical support employees. We may not be able to hire such resources fast enough to keep up with unexpected demand, particularly if the sales of our products exceed our internal forecasts. As a result, our and our channel partners’ ability to provide adequate and timely support to our end-customers will be negatively impacted, and our end-customers’ satisfaction with our products and services will be adversely affected. Additionally, to the extent that we may need to rely on our sales engineers to provide post-sales support while we are ramping our support resources, our sales productivity will be negatively impacted, which would harm our revenues. Our or our channel partners’ failure to provide and maintain high-quality support services could have a material adverse effect on our business, financial condition, and operating results.
We may acquire other businesses, which could require significant management attention, disrupt our business, dilute stockholder value, and adversely affect our operating results.
As part of our business strategy, we may acquire or make investments in complementary companies, products, or technologies. For example, in December 2013, we acquired Morta Security, Inc. (“Morta”), in April 2014, we acquired Cyvera Ltd. (“Cyvera”), and in May 2015, we acquired CirroSecure, Inc. (“CirroSecure”), all of which were cybersecurity companies. Our ability as an organization to acquire and integrate other companies, products, or technologies in a successful manner is unproven. The identification of suitable acquisition candidates is difficult, and we may not be able to complete such acquisitions on favorable terms, if at all. If we do complete future acquisitions, we may not ultimately strengthen our competitive position or achieve our goals and business strategy, we may be subject to claims or liabilities assumed from an acquired company, product, or technology, and any acquisitions we complete could be viewed negatively by our end-customers, investors, and securities analysts. In addition, if we are unsuccessful at integrating past or future acquisitions, or the technologies associated with such acquisitions, into our
-
22
-
company, the revenue and operating results of the combined company could be adversely affected. Any integration process may require significant time and resources, which may disrupt our ongoing business and divert management’s attention, and we may not be able to manage the integration process successfully. We may not successfully evaluate or utilize the acquired technology or personnel, realize anticipated synergies from the acquisition, or accurately forecast the financial impact of an acquisition transaction and integration of such acquisition, including accounting charges and any potential impairment of goodwill and intangible assets recognized in connection with such acquisitions. We may have to pay cash, incur debt, or issue equity or equity-linked securities to pay for any future acquisitions, each of which could adversely affect our financial condition or the market price of our common stock. Furthermore, the sale of equity or issuance of equity-linked debt to finance any future acquisitions could result in dilution to our stockholders. See the risk factors entitled “Our failure to raise additional capital or generate the significant capital necessary to expand our operations and invest in new products could reduce our ability to compete and could harm our business” and “The issuance of additional stock in connection with financings, acquisitions, investments, our stock incentive plans, the conversion of our Notes or exercise of the related warrants, or otherwise will dilute all other stockholders.” The occurrence of any of these risks could harm our business, operating results, and financial condition.
Claims by others that we infringe their proprietary technology or other rights could harm our business.
Companies in the enterprise security industry own large numbers of patents, copyrights, trademarks, domain names, and trade secrets and frequently enter into litigation based on allegations of infringement, misappropriation, or other violations of intellectual property or other rights. Third parties have asserted and may in the future assert claims of infringement of intellectual property rights against us. For example, in December 2011, Juniper, one of our competitors, filed a lawsuit against us alleging patent infringement. In September 2013, we filed a lawsuit against Juniper alleging patent infringement. In May 2014, we entered into a Settlement, Release and Cross-License Agreement with Juniper to resolve all pending disputes between Juniper and us, including dismissal of all pending litigation.
Third parties may also assert such claims against our end-customers or channel partners, whom our standard license and other agreements obligate us to indemnify against claims that our products infringe the intellectual property rights of third parties. In addition, to the extent we hire personnel from competitors, we may be subject to allegations that they have been improperly solicited, that they have divulged proprietary or other confidential information, or that their former employers own their inventions or other work product. Furthermore, we may be unaware of the intellectual property rights of others that may cover some or all of our technology or products. As the number of products and competitors in our market increases and overlaps occur, infringement claims may increase. While we intend to increase the size of our patent portfolio, our competitors and others may now and in the future have significantly larger and more mature patent portfolios than we have. In addition, litigation may involve patent holding companies or other adverse patent owners who have no relevant product revenue and against whom our own patents may therefore provide little or no deterrence or protection. In addition, we have not registered our trademarks in all of our geographic markets and failure to secure those registrations could adversely affect our ability to enforce and defend our trademark rights. Any claim of infringement by a third party, even those without merit, could cause us to incur substantial costs defending against the claim, could distract our management from our business, and could require us to cease use of such intellectual property. Furthermore, because of the substantial amount of discovery required in connection with intellectual property litigation, there is a risk that some of our confidential information could be compromised by disclosure during this type of litigation. A successful claimant could secure a judgment or we may agree to a settlement that prevents us from distributing certain products or performing certain services or that requires us to pay substantial damages, royalties, or other fees. Any of these events could seriously harm our business, financial condition, and operating results.
Our proprietary rights may be difficult to enforce or protect, which could enable others to copy or use aspects of our products without compensating us.
We rely and expect to continue to rely on a combination of confidentiality and license agreements with our employees, consultants, and third parties with whom we have relationships, as well as trademark, copyright, patent, and trade secret protection laws, to protect our proprietary rights. We have filed various applications for certain aspects of our intellectual property. Valid patents may not issue from our pending applications, and the claims eventually allowed on any patents may not be sufficiently broad to protect our technology or products. We cannot be certain that we were the first to make the inventions claimed in our pending patent applications or that we were the first to file for patent protection, which could prevent our patent applications from issuing as patents or invalidate our patents following issuance. Additionally, the process of obtaining patent protection is expensive and time-consuming, and we may not be able to prosecute all necessary or desirable patent applications at a reasonable cost or in a timely manner. Any issued patents may be challenged, invalidated or circumvented, and any rights granted under these patents may not actually provide adequate defensive protection or competitive advantages to us. Additional uncertainty may result from changes to patent-related laws and court rulings in the United States and other jurisdictions. As a result, we may not be able to obtain adequate patent protection or effectively enforce any issued patents.
Despite our efforts to protect our proprietary rights, unauthorized parties may attempt to copy aspects of our products or obtain and use information that we regard as proprietary. We generally enter into confidentiality or license agreements with our
-
23
-
employees, consultants, vendors, and end-customers, and generally limit access to and distribution of our proprietary information. However, we cannot be certain that we have entered into such agreements with all parties who may have or have had access to our confidential information or that the agreements we have entered into will not be breached. We cannot guarantee that any of the measures we have taken will prevent misappropriation of our technology. Because we may be an attractive target for computer hackers, we may have a greater risk of unauthorized access to, and misappropriation of, our proprietary information. In addition, the laws of some foreign countries do not protect our proprietary rights to as great an extent as the laws of the United States, and many foreign countries do not enforce these laws as diligently as government agencies and private parties in the United States. From time to time, we may need to take legal action to enforce our patents and other intellectual property rights, to protect our trade secrets, to determine the validity and scope of the proprietary rights of others or to defend against claims of infringement or invalidity. Such litigation could result in substantial costs and diversion of resources and could negatively affect our business, operating results, and financial condition. Attempts to enforce our rights against third parties could also provoke these third parties to assert their own intellectual property or other rights against us, or result in a holding that invalidates or narrows the scope of our rights, in whole or in part. If we are unable to protect our proprietary rights (including aspects of our software and products protected other than by patent rights), we may find ourselves at a competitive disadvantage to others who need not incur the additional expense, time, and effort required to create the innovative products that have enabled us to be successful to date. Any of these events would have a material adverse effect on our business, financial condition, and operating results.
Our use of open source software in our products could negatively affect our ability to sell our products and subject us to possible litigation.
Our products contain software modules licensed to us by third-party authors under “open source” licenses. Some open source licenses contain requirements that we make available applicable source code for modifications or derivative works we create based upon the type of open source software we use. If we combine our proprietary software with open source software in a certain manner, we could, under certain open source licenses, be required to release the source code of our proprietary software to the public. This would allow our competitors to create similar products with lower development effort and time and ultimately could result in a loss of product sales for us.
Although we monitor our use of open source software to avoid subjecting our products to conditions we do not intend, the terms of many open source licenses have not been interpreted by United States courts, and there is a risk that these licenses could be construed in a way that could impose unanticipated conditions or restrictions on our ability to commercialize our products. From time to time, there have been claims against companies that distribute or use open source software in their products and services, asserting that open source software infringes the claimants’ intellectual property rights. We could be subject to suits by parties claiming infringement of intellectual property rights in what we believe to be licensed open source software. If we are held to have breached the terms of an open source software license, we could be required to seek licenses from third parties to continue offering our products on terms that are not economically feasible, to re-engineer our products, to discontinue the sale of our products if re-engineering could not be accomplished on a timely basis, or to make generally available, in source code form, our proprietary code, any of which could adversely affect our business, operating results, and financial condition.
In addition to risks related to license requirements, usage of open source software can lead to greater risks than use of third-party commercial software, as open source licensors generally do not provide warranties or assurance of title or controls on origin of the software. In addition, many of the risks associated with usage of open source software, such as the lack of warranties or assurances of title, cannot be eliminated, and could, if not properly addressed, negatively affect our business. We have established processes to help alleviate these risks, including a review process for screening requests from our development organizations for the use of open source software, but we cannot be sure that our processes for controlling our use of open source software in our products will be effective.
We license technology from third parties, and our inability to maintain those licenses could harm our business.
We incorporate technology that we license from third parties, including software, into our products and services. We cannot be certain that our licensors are not infringing the intellectual property rights of third parties or that our licensors have sufficient rights to the licensed intellectual property in all jurisdictions in which we may sell our products. In addition, some licenses may be non-exclusive, and therefore our competitors may have access to the same technology licensed to us. Some of our agreements with our licensors may be terminated for convenience by them. If we are unable to continue to license any of this technology because of intellectual property infringement claims brought by third parties against our licensors or against us, or if we are unable to continue our license agreements or enter into new licenses on commercially reasonable terms, our ability to develop and sell products and services containing such technology would be severely limited, and our business could be harmed. Additionally, if we are unable to license necessary technology from third parties, we may be forced to acquire or develop alternative technology, which we may be unable to do in a commercially feasible manner or at all, and we may be required to use alternative technology of lower quality or performance standards. This would limit and delay our ability to offer new or competitive products and services and increase our costs of production. As a result, our margins, market share, and operating results could be significantly harmed.
-
24
-
We face risks associated with having operations and employees located in Israel.
As a result of our acquisition of Cyvera, we have offices and employees located in Israel. As a result, political, economic, and military conditions in Israel directly affect our operations. The future of peace efforts between Israel and its Arab neighbors remains uncertain. There has been a significant increase in hostilities and political unrest between Hamas and Israel in the past few years. The effects of these hostilities and violence on the Israeli economy and our operations in Israel are unclear, and we cannot predict the effect on us of further increases in these hostilities or future armed conflict, political instability or violence in the region. Current or future tensions and conflicts in the Middle East could adversely affect our business, operating results, financial condition and cash flows.
In addition, many of our employees in Israel are obligated to perform annual reserve duty in the Israeli military and are subject to being called for active duty under emergency circumstances. We cannot predict the full impact of these conditions on us in the future, particularly if emergency circumstances or an escalation in the political situation occurs. If many of our employees in Israel are called for active duty for a significant period of time, our operations and our business could be disrupted and may not be able to function at full capacity. Any disruption in our operations in Israel could adversely affect our business.
Our failure to adequately protect personal information could have a material adverse effect on our business.
A wide variety of provincial, state, national, and international laws and regulations apply to the collection, use, retention, protection, disclosure, transfer, and other processing of personal data. These data protection and privacy-related laws and regulations are evolving and being tested in courts and may result in ever-increasing regulatory and public scrutiny as well as escalating levels of enforcement and sanctions. Further, the interpretation and application of foreign laws and regulations in many cases is uncertain, and our legal and regulatory obligations in foreign jurisdictions are subject to frequent and unexpected changes, including the potential for various regulatory or other governmental bodies to enact new or additional laws or regulations, to issue rulings that invalidate prior laws or regulations, or to increase penalties significantly. For example, the recently adopted E.U. General Data Protection Regulation imposes more stringent data protection requirements, and provides for greater penalties for noncompliance. Our failure to comply with applicable laws and regulations, or to protect personal data, could result in enforcement action against us, including fines, imprisonment of company officials and public censure, claims for damages by end-customers and other affected individuals, damage to our reputation and loss of goodwill (both in relation to existing end-customers and prospective end-customers), any of which could have a material adverse effect on our operations, financial performance, and business. Evolving and changing definitions of personal data and personal information, within the E.U., the United States, and elsewhere, especially relating to classification of IP addresses, machine identification, location data, and other information, may limit or inhibit our ability to operate or expand our business, including limiting strategic partnerships that may involve the sharing of data. Even the perception of privacy concerns, whether or not valid, may harm our reputation and inhibit adoption of our products by current and future end-customers.
We are subject to governmental export and import controls that could subject us to liability or impair our ability to compete in international markets.
Because we incorporate encryption technology into our products, certain of our products are subject to U.S. export controls and may be exported outside the United States only with the required export license or through an export license exception. If we were to fail to comply with U.S. export licensing requirements, U.S. customs regulations, U.S. economic sanctions, or other laws, we could be subject to substantial civil and criminal penalties, including fines, incarceration for responsible employees and managers, and the possible loss of export or import privileges. Obtaining the necessary export license for a particular sale may be time-consuming and may result in the delay or loss of sales opportunities. Furthermore, U.S. export control laws and economic sanctions prohibit the shipment of certain products to U.S. embargoed or sanctioned countries, governments, and persons. Even though we take precautions to ensure that our channel partners comply with all relevant regulations, any failure by our channel partners to comply with such regulations could have negative consequences for us, including reputational harm, government investigations, and penalties.
In addition, various countries regulate the import of certain encryption technology, including through import permit and license requirements, and have enacted laws that could limit our ability to distribute our products or could limit our end-customers’ ability to implement our products in those countries. Changes in our products or changes in export and import regulations may create delays in the introduction of our products into international markets, prevent our end-customers with international operations from deploying our products globally or, in some cases, prevent or delay the export or import of our products to certain countries, governments, or persons altogether. Any change in export or import regulations, economic sanctions or related legislation, shift in the enforcement or scope of existing regulations, or change in the countries, governments, persons, or technologies targeted by such regulations, could result in decreased use of our products by, or in our decreased ability to export or sell our products to, existing or potential end-customers with international operations. Any decreased use of our products or limitation on our ability to export to or sell our products in international markets would likely adversely affect our business, financial condition, and operating results.
-
25
-
Our failure to raise additional capital or generate the significant capital necessary to expand our operations and invest in new products could reduce our ability to compete and could harm our business.
We intend to continue to make investments to support our business growth and may require additional funds to respond to business challenges, including the need to develop new features to enhance our platform, improve our operating infrastructure, or acquire complementary businesses and technologies. Accordingly, we may need to engage in equity or debt financings to secure additional funds. If we raise additional equity or equity-linked financing, our stockholders may experience significant dilution of their ownership interests and the market price of our common stock could decline. For example, in June 2014, we issued 0.0% Convertible Senior Notes due 2019 (the “Notes”) and any conversion of some or all of the Notes into common stock will dilute the ownership interests of existing stockholders to the extent we deliver shares upon conversion of any of the Notes. See the risk factor entitled “The issuance of additional stock in connection with financings, acquisitions, investments, our stock incentive plans, the conversion of our Notes, or otherwise will dilute all other stockholders.” Furthermore, if we engage in additional debt financing, the holders of our debt would have priority over the holders of our common stock, and we may be required to accept terms that restrict our ability to incur additional indebtedness. We may also be required to take other actions that would otherwise be in the interests of the debt holders and would require us to maintain specified liquidity or other ratios, any of which could harm our business, operating results, and financial condition. We may not be able to obtain additional financing on terms favorable to us, if at all. If we are unable to obtain adequate financing or financing on terms satisfactory to us when we require it, our ability to continue to support our business growth and to respond to business challenges could be significantly impaired, and our business may be adversely affected.
We have a corporate structure aligned with the international nature of our business activities, and if we do not achieve increased tax benefits as a result of our corporate structure, our financial condition and operating results could be adversely affected.
We have reorganized our corporate structure and intercompany relationships to more closely align with the international nature of our business activities. This corporate structure may allow us to reduce our overall effective tax rate through changes in how we use our intellectual property, international procurement, and sales operations. This corporate structure may also allow us to obtain financial and operational efficiencies. These efforts require us to incur expenses in the near term for which we may not realize related benefits. If the structure is not accepted by the applicable taxing authorities, if there are any changes in domestic and international tax laws that negatively impact the structure, including proposed legislation to reform U.S. taxation of international business activities and recent guidance regarding base erosion and profit shifting (“BEPS”) provided by the Organisation for Economic Co-operation and Development, or if we do not operate our business consistent with the structure and applicable tax provisions, we may fail to achieve the reduction in our overall effective tax rate and the other financial and operational efficiencies that we anticipate as a result of the structure and our future financial condition and operating results may be negatively impacted.
We may have exposure to greater than anticipated tax liabilities.
Our income tax obligations are based in part on our corporate structure and intercompany arrangements, including the manner in which we develop, value, and use our intellectual property and the valuations of our intercompany transactions. The tax laws applicable to our business, including the laws of the United States and other jurisdictions, are subject to interpretation and certain jurisdictions may aggressively interpret their laws in an effort to raise additional tax revenue. The taxing authorities of the jurisdictions in which we operate may challenge our methodologies for valuing developed technology or intercompany arrangements, which could increase our worldwide effective tax rate and harm our financial position and operating results. It is possible that tax authorities may disagree with certain positions we have taken and any adverse outcome of such a review or audit could have a negative effect on our financial position and operating results. Further, the determination of our worldwide provision for income taxes and other tax liabilities requires significant judgment by management, and there are transactions where the ultimate tax determination is uncertain. Although we believe that our estimates are reasonable, the ultimate tax outcome may differ from the amounts recorded in our consolidated financial statements and may materially affect our financial results in the period or periods for which such determination is made.
If our estimates or judgments relating to our critical accounting policies are based on assumptions that change or prove to be incorrect, our operating results could fall below our publicly announced guidance or the expectations of securities analysts and investors, resulting in a decline in the market price of our common stock.
The preparation of financial statements in conformity with U.S. GAAP requires management to make estimates and assumptions that affect the amounts reported in our consolidated financial statements and accompanying notes. We base our estimates on historical experience and on various other assumptions that we believe to be reasonable under the circumstances, the results of which form the basis for making judgments about the carrying values of assets, liabilities, equity, revenue, and expenses that are not readily apparent from other sources. For more information, refer to the section entitled “Critical Accounting Estimates” in “Management’s Discussion and Analysis of Financial Condition and Results of Operations” included in Part II, Item 7 of this Annual Report on Form 10-K. If our assumptions change or if actual circumstances differ from our assumptions, our operating
-
26
-
results may be adversely affected and could fall below our publicly announced guidance or the expectations of securities analysts and investors, resulting in a decline in the market price of our common stock.
Failure to comply with governmental laws and regulations could harm our business.
Our business is subject to regulation by various federal, state, local, and foreign governmental agencies, including agencies responsible for monitoring and enforcing employment and labor laws, workplace safety, product safety, environmental laws, consumer protection laws, anti-bribery laws, import/export controls, federal securities laws, and tax laws and regulations. In certain jurisdictions, these regulatory requirements may be more stringent than those in the United States. Noncompliance with applicable regulations or requirements could subject us to investigations, sanctions, mandatory product recalls, enforcement actions, disgorgement of profits, fines, damages, civil and criminal penalties, or injunctions. If any governmental sanctions are imposed, or if we do not prevail in any possible civil or criminal litigation resulting from any alleged noncompliance, our business, operating results, and financial condition could be materially adversely affected. In addition, responding to any action will likely result in a significant diversion of management’s attention and resources and an increase in professional fees. Enforcement actions, litigation, and sanctions could harm our business, operating results, and financial condition.
If we fail to comply with environmental requirements, our business, financial condition, operating results, and reputation could be adversely affected.
We are subject to various environmental laws and regulations including laws governing the hazardous material content of our products and laws relating to the collection of and recycling of electrical and electronic equipment. Examples of these laws and regulations include the E.U. Restriction on the Use of Certain Hazardous Substances in Electrical and Electronic Equipment Directive (“RoHS”) and the E.U. Waste Electrical and Electronic Equipment Directive (“WEEE Directive”), as well as the implementing legislation of the E.U. member states. Similar laws and regulations have been passed or are pending in China, South Korea, Norway, and Japan and may be enacted in other regions, including in the United States, and we are, or may in the future be, subject to these laws and regulations.
The E.U. RoHS and the similar laws of other jurisdictions limit the content of certain hazardous materials such as lead, mercury, and cadmium in the manufacture of electrical equipment, including our products. Our current products comply with the E.U. RoHS requirements. However, if there are changes to this or other laws (or their interpretation) or if new similar laws are passed in other jurisdictions, we may be required to reengineer our products to use components compatible with these regulations. This reengineering and component substitution could result in additional costs to us or disrupt our operations or logistics.
The WEEE Directive requires electronic goods producers to be responsible for the collection, recycling, and treatment of such products. Changes in interpretation of the directive may cause us to incur costs or have additional regulatory requirements to meet in the future in order to comply with this directive, or with any similar laws adopted in other jurisdictions.
We are also subject to environmental laws and regulations governing the management of hazardous materials, which we use in small quantities in our engineering labs. Our failure to comply with past, present, and future similar laws could result in reduced sales of our products, substantial product inventory write-offs, reputational damage, penalties, and other sanctions, any of which could harm our business and financial condition. We also expect that our products will be affected by new environmental laws and regulations on an ongoing basis. To date, our expenditures for environmental compliance have not had a material impact on our operating results or cash flows, and although we cannot predict the future impact of such laws or regulations, they will likely result in additional costs and may increase penalties associated with violations or require us to change the content of our products or how they are manufactured, which could have a material adverse effect on our business, operating results, and financial condition.
Our business is subject to the risks of earthquakes, fire, power outages, floods, and other catastrophic events, and to interruption by man-made problems such as terrorism.
Both our corporate headquarters and the location where our products are manufactured are located in the San Francisco Bay Area, a region known for seismic activity. In addition, other natural disasters, such as fire or floods, a significant power outage, terrorism, or other geo-political unrest could affect our supply chain, manufacturers, logistics providers, channel partners, or end-customers or the economy as a whole and such disruption could impact our shipments and sales. These risks may be further increased if the disaster recovery plans for us and our suppliers prove to be inadequate. To the extent that any of the above should result in delays or cancellations of customer orders, or the delay in the manufacture, deployment, or shipment of our products, our business, financial condition, and operating results would be adversely affected.
-
27
-
Risks Related to Our Notes
We may not have the ability to raise the funds necessary to settle conversions of the Notes or to repurchase the Notes upon a fundamental change, and our future debt may contain limitations on our ability to pay cash upon conversion or repurchase of the Notes.
Holders of the Notes will have the right to require us to repurchase all or a portion of their Notes upon the occurrence of a fundamental change at a repurchase price equal to 100% of the principal amount of the Notes to be repurchased, plus accrued and unpaid special interest, if any, to, but excluding, the fundamental change repurchase date. In addition, upon conversion of the Notes, we will be required to make cash payments for each $1,000 in principal amount of Notes converted of at least the lesser of $1,000 and the sum of the daily conversion values. However, we may not have enough available cash or be able to obtain financing at the time we are required to make repurchases of Notes surrendered therefor or pay cash with respect to Notes being converted.
In addition, our ability to repurchase or to pay cash upon conversion of the Notes may be limited by law, regulatory authority or agreements governing our future indebtedness. Our failure to repurchase the Notes at a time when the repurchase is required by the indenture governing the Notes or to pay cash upon conversion of the Notes as required by the indenture would constitute a default under the indenture. A default under the indenture or the fundamental change itself could also lead to a default under agreements governing our future indebtedness. If the payment of the related indebtedness were to be accelerated after any applicable notice or grace periods, we may not have sufficient funds to repay the indebtedness and repurchase the Notes or to pay cash upon conversion of the Notes.
We may still incur substantially more debt or take other actions that would diminish our ability to make payments on the Notes when due.
We and our subsidiaries may be able to incur substantial additional debt in the future, subject to the restrictions contained in our debt instruments, some of which may be secured debt. We are not restricted under the terms of the indenture governing the Notes from incurring additional debt, securing existing or future debt, recapitalizing our debt or taking a number of other actions that are not limited by the terms of the indenture governing the Notes that could have the effect of diminishing our ability to make payments on the Notes when due. While the terms of any future indebtedness we may incur could restrict our ability to incur additional indebtedness, any such restrictions will indirectly benefit holders of the Notes only to the extent any such indebtedness or credit facility is not repaid or does not mature while the Notes are outstanding.
Risks Related to Ownership of Our Common Stock
Our actual operating results may differ significantly from our guidance.
From time to time, we have released, and may continue to release, guidance in our quarterly earnings releases, quarterly earnings conference calls, or otherwise, regarding our future performance that represents our management’s estimates as of the date of release. This guidance, which includes forward-looking statements, has been and will be based on projections prepared by our management. These projections are not prepared with a view toward compliance with published guidelines of the American Institute of Certified Public Accountants, and neither our registered public accountants nor any other independent expert or outside party compiles or examines the projections. Accordingly, no such person expresses any opinion or any other form of assurance with respect to the projections.
Projections are based upon a number of assumptions and estimates that, while presented with numerical specificity, are inherently subject to significant business, economic and competitive uncertainties and contingencies, many of which are beyond our control and are based upon specific assumptions with respect to future business decisions, some of which will change. The rapidly evolving market in which we operate may make it difficult to evaluate our current business and our future prospects, including our ability to plan for and model future growth. We intend to state possible outcomes as high and low ranges which are intended to provide a sensitivity analysis as variables are changed. However, actual results will vary from our guidance and the variations may be material. The principal reason that we release guidance is to provide a basis for our management to discuss our business outlook as of the date of release with analysts and investors. We do not accept any responsibility for any projections or reports published by any such persons. Investors are urged not to rely upon our guidance in making an investment decision regarding our common stock.
Any failure to successfully implement our operating strategy or the occurrence of any of the events or circumstances set forth in this “Risk Factors” section in this Annual Report on Form 10-K could result in our actual operating results being different from our guidance, and the differences may be adverse and material.
-
28
-
The market price of our common stock historically has been volatile and the value of your investment could decline.
The market price of our common stock has been volatile since our initial public offering (“IPO”). Since shares of our common stock were sold in our IPO in July 2012 at a price of $42.00 per share, the reported high and low sales prices of our common stock has ranged from $
200.55
to $
39.08
, through
August 24, 2016
. The market price of our common stock may fluctuate widely in response to various factors, some of which are beyond our control. These factors include:
|
•
|
announcements of new products, services or technologies, commercial relationships, strategic partnerships, acquisitions or other events by us or our competitors;
|
|
•
|
price and volume fluctuations in the overall stock market from time to time;
|
|
•
|
news announcements that affect investor perception of our industry, including reports related to the discovery of significant cyber attacks;
|
|
•
|
significant volatility in the market price and trading volume of technology companies in general and of companies in our industry;
|
|
•
|
fluctuations in the trading volume of our shares or the size of our public float;
|
|
•
|
actual or anticipated changes in our operating results or fluctuations in our operating results;
|
|
•
|
whether our operating results meet the expectations of securities analysts or investors;
|
|
•
|
actual or anticipated changes in the expectations of securities analysts or investors;
|
|
•
|
inaccurate or unfavorable research reports about our business and industry published by securities analysts or reduced coverage of our company by securities analysts;
|
|
•
|
litigation involving us, our industry, or both;
|
|
•
|
regulatory developments in the United States, foreign countries or both;
|
|
•
|
major catastrophic events;
|
|
•
|
sales of large blocks of our common stock or substantial future sales by our directors, executive officers, employees and significant stockholders;
|
|
•
|
sales of our common stock by investors who view the Notes as a more attractive means of equity participation in us;
|
|
•
|
hedging or arbitrage trading activity involving our common stock as a result of the existence of the Notes;
|
|
•
|
departures of key personnel; or
|
|
•
|
economic uncertainty around the world, in particular, macroeconomic challenges in Europe.
|
The market price of our common stock could decline for reasons unrelated to our business, operating results, or financial condition and as a result of events that do not directly affect us. In the past, following periods of volatility in the market price of a company’s securities, securities class action litigation has often been brought against that company. Securities litigation could result in substantial costs and divert our management’s attention and resources from our business. This could have a material adverse effect on our business, operating results, and financial condition.
The issuance of additional stock in connection with financings, acquisitions, investments, our stock incentive plans, the conversion of our Notes or exercise of the related warrants, or otherwise will dilute all other stockholders.
Our amended and restated certificate of incorporation authorizes us to issue up to 1.0 billion shares of common stock and up to 100.0 million shares of preferred stock with such rights and preferences as may be determined by our board of directors. Subject to compliance with applicable rules and regulations, we may issue shares of common stock or securities convertible into shares of our common stock from time to time in connection with a financing, acquisition, investment, our stock incentive plans, the conversion of our Notes, the settlement of our warrants, or otherwise. Any such issuance could result in substantial dilution to our existing stockholders and cause the market price of our common stock to decline.
We cannot guarantee that our recently announced share repurchase program will be fully consummated or that it will enhance shareholder value, and share repurchases could affect the price of our common stock.
In August 2016, our board of directors authorized a $500.0 million share repurchase which will be funded from available working capital. The repurchase authorization will expire on August 31, 2018. Although our board of directors has authorized a share repurchase program, the share repurchase program does not obligate us to repurchase any specific dollar amount or to acquire any specific number of shares. The share repurchase program could affect the price of our common stock, increase
-
29
-
volatility and diminish our cash reserves. In addition, it may be suspended or terminated at any time, which may result in a decrease in the price of our common stock.
The convertible note hedge and warrant transactions may affect the value of our common stock.
In connection with the sale of the Notes, we entered into convertible note hedge transactions with certain counterparties. We also entered into warrant transactions with the counterparties pursuant to which we sold warrants for the purchase of our common stock. The convertible note hedge transactions are expected generally to reduce the potential dilution to our common stock upon any conversion of Notes and/or offset any cash payments we are required to make in excess of the principal amount of any converted Notes. The warrants could separately have a dilutive effect to the extent that the market price per share of our common stock exceeds the strike price of the warrants unless, subject to certain conditions, we elect to cash settle the warrants.
The counterparties or their respective affiliates may modify their hedge positions by entering into or unwinding various derivatives with respect to our common stock and/or purchasing or selling our common stock or other securities of ours in secondary market transactions prior to the maturity of the Notes (and are likely to do so during any observation period related to a conversion of Notes). This activity could also cause or avoid an increase or a decrease in the market price of our common stock or the Notes, which could affect a Note holder’s ability to convert the Notes and, to the extent the activity occurs during any observation period related to a conversion of Notes, it could affect the amount and value of the consideration that such Note holder will receive upon conversion of the Notes.
We do not make any representation or prediction as to the direction or magnitude of any potential effect that the transactions described above may have on the price of the Notes or our common stock. In addition, we do not make any representation that the counterparties or their respective affiliates will engage in these transactions or that these transactions, once commenced, will not be discontinued without notice.
We do not intend to pay dividends for the foreseeable future.
We have never declared or paid any dividends on our common stock. We intend to retain any earnings to finance the operation and expansion of our business, and we do not anticipate paying any cash dividends in the future. As a result, you may only receive a return on your investment in our common stock if the market price of our common stock increases.
The requirements of being a public company may strain our resources, divert management’s attention, and affect our ability to attract and retain qualified board members.
As a public company, we are subject to the reporting requirements of the Securities Exchange Act of 1934, as amended (the “Exchange Act”), the Sarbanes-Oxley Act, the Dodd-Frank Act, the listing requirements of the New York Stock Exchange (“NYSE”), and other applicable securities rules and regulations. Compliance with these rules and regulations have increased our legal and financial compliance costs, made some activities more difficult, time-consuming or costly, and increased demand on our systems and resources. Among other things, the Exchange Act requires that we file annual, quarterly, and current reports with respect to our business and operating results. In addition, the Sarbanes-Oxley Act requires, among other things, that we maintain effective disclosure controls and procedures and internal control over financial reporting. In order to meet the requirements of this standard, significant resources and management oversight may be required. As a result, management’s attention may be diverted from other business concerns, which could harm our business and operating results. Although we have already hired additional employees to comply with these requirements, we may need to hire even more employees in the future, which will increase our costs and expenses.
In addition, changing laws, regulations, and standards related to corporate governance and public disclosure are creating uncertainty for public companies, increasing legal and financial compliance costs, and making some activities more time-consuming. These laws, regulations, and standards are subject to varying interpretations, in many cases due to their lack of specificity, and, as a result, their application in practice may evolve over time as new guidance is provided by regulatory and governing bodies. This could result in continuing uncertainty regarding compliance matters and higher costs necessitated by ongoing revisions to disclosure and governance practices. We intend to invest resources to comply with evolving laws, regulations, and standards, and this investment may result in increased general and administrative expense and a diversion of management’s time and attention from revenue-generating activities to compliance activities. If our efforts to comply with new laws, regulations, and standards differ from the activities intended by regulatory or governing bodies, regulatory authorities may initiate legal proceedings against us and our business may be harmed.
We also expect that being a public company and these new rules and regulations will make it more expensive for us to obtain and maintain director and officer liability insurance, and in the future, we may be required to accept reduced coverage or incur substantially higher costs to obtain coverage. These factors could also make it more difficult for us to attract and retain qualified members of our board of directors, particularly to serve on our Audit Committee and Compensation Committee, and qualified executive officers.
-
30
-
We are obligated to maintain proper and effective internal control over financial reporting. We may not complete our analysis of our internal control over financial reporting in a timely manner, or this internal control may not be determined to be effective, which may adversely affect investor confidence in our company and, as a result, the value of our common stock.
While we were able to determine in our management's report for fiscal
2016
that our internal control over financial reporting is effective, as well as provide an unqualified attestation report from our independent registered public accounting firm to that effect, we may not be able to complete our evaluation, testing, and any required remediation in a timely fashion, may be unable to assert that our internal controls are effective, or our independent registered public accounting firm may not be able to formally attest to the effectiveness of our internal control over financial reporting in the future. In the event that our chief executive officer, chief financial officer, or independent registered public accounting firm determines in the future that our internal control over financial reporting is not effective as defined under Section 404, we could be subject to one or more investigations or enforcement actions by state or federal regulatory agencies, stockholder lawsuits or other adverse actions requiring us to incur defense costs, pay fines, settlements or judgments and causing investor perceptions to be adversely affected and potentially resulting in a decline in the market price of our stock.
Our charter documents and Delaware law, as well as certain provisions of our Notes, could discourage takeover attempts and lead to management entrenchment, which could also reduce the market price of our common stock.
Provisions in our amended and restated certificate of incorporation and amended and restated bylaws may have the effect of delaying or preventing a change in control of our company or changes in our management. Our amended and restated certificate of incorporation and amended and restated bylaws include provisions that:
|
•
|
establish that our board of directors is divided into three classes, Class I, Class II and Class III, with three-year staggered terms;
|
|
•
|
authorize our board of directors to issue shares of preferred stock and to determine the price and other terms of those shares, including preferences and voting rights, without stockholder approval;
|
|
•
|
provide our board of directors with the exclusive right to elect a director to fill a vacancy created by the expansion of our board of directors or the resignation, death or removal of a director;
|
|
•
|
prohibit our stockholders from taking action by written consent;
|
|
•
|
specify that special meetings of our stockholders may be called only by the chairman of our board of directors, our president, our secretary, or a majority vote of our board of directors;
|
|
•
|
require the affirmative vote of holders of at least 66 2/3% of the voting power of all of the then outstanding shares of the voting stock, voting together as a single class, to amend the provisions of our amended and restated certificate of incorporation relating to the issuance of preferred stock and management of our business or our amended and restated bylaws;
|
|
•
|
authorize our board of directors to amend our bylaws by majority vote; and
|
|
•
|
establish advance notice procedures with which our stockholders must comply to nominate candidates to our board of directors or to propose matters to be acted upon at a stockholders’ meeting.
|
These provisions may frustrate or prevent any attempts by our stockholders to replace or remove our current management by making it more difficult for our stockholders to replace members of our board of directors, which is responsible for appointing the members of management. In addition, as a Delaware corporation, we are subject to Section 203 of the Delaware General Corporation Law. These provisions may prohibit large stockholders, in particular those owning 15% or more of our outstanding voting stock, from merging or combining with us for a certain period of time. Additionally, certain provisions of our Notes could make it more difficult or more expensive for a third party to acquire us. The application of Section 203 or certain provisions of our Notes also could have the effect of delaying or preventing a change in control of us. Any of these provisions could, under certain circumstances, depress the market price of our common stock.
|
ITEM 1B.
|
UNRESOLVED STAFF COMMENTS
|
None.
|
ITEM 2.
|
PROPERTIES
|
Our corporate headquarters is located in Santa Clara, California where we lease approximately 300,000 square feet of space under a lease agreement that expires in July 2023, with two separate five-year options to extend the lease term. We also currently lease
-
31
-
approximately 1,062,000 square feet of additional space in Santa Clara, California which is currently under construction and, upon completion, will serve as our future corporate headquarters. In addition, we also lease space for personnel in locations throughout the United States and various international locations, including the Netherlands, Singapore, Israel, the United Kingdom, Japan, and Australia. Refer to Note
8
. Commitments and Contingencies of Notes to Consolidated Financial Statements included in Part II, Item 8 of this Annual Report on Form 10-K for more information on our operating leases.
We believe that our current facilities are adequate to meet our current needs. We intend to expand our facilities or add new facilities as we add employees and enter new geographic markets, and we believe that suitable additional or alternative space will be available as needed to accommodate ongoing operations and any such growth. However, we expect to incur additional expenses in connection with such new or expanded facilities.
|
ITEM 3.
|
LEGAL PROCEEDINGS
|
The information set forth under the “Litigation” subheading in Note
8
. Commitments and Contingencies of Notes to Consolidated Financial Statements in Part II, Item 8 of this Annual Report on Form 10-K is incorporated herein by reference.
|
ITEM 4.
|
MINE SAFETY DISCLOSURES
|
Not applicable.
-
32
-
|
ITEM 5.
|
MARKET FOR REGISTRANT’S COMMON EQUITY, RELATED STOCKHOLDER MATTERS AND ISSUER PURCHASES OF EQUITY SECURITIES
|
Market Information
Our common stock, $0.0001 par value per share, began trading on the New York Stock Exchange (“NYSE”) on July 20, 2012, where its prices are quoted under the symbol “PANW.”
Holders of Record
As of
August 24, 2016
, there were
88
holders of record of our common stock. Because many of our shares of common stock are held by brokers and other institutions on behalf of stockholders, we are unable to estimate the total number of stockholders represented by these record holders.
Price Range of Our Common Stock
The following table sets forth the reported high and low sales prices of our common stock for the periods indicated, as regularly quoted on the NYSE:
|
High
|
Low
|
||||||
|
Year Ended July 31, 2015
|
|||||||
|
First Quarter
|
$
|
108.50
|
|
$
|
76.86
|
|
|
|
Second Quarter
|
$
|
130.00
|
|
$
|
102.02
|
|
|
|
Third Quarter
|
$
|
158.24
|
|
$
|
121.31
|
|
|
|
Fourth Quarter
|
$
|
200.55
|
|
$
|
144.42
|
|
|
|
Year Ended July 31, 2016
|
|||||||
|
First Quarter
|
$
|
191.00
|
|
$
|
140.39
|
|
|
|
Second Quarter
|
$
|
194.73
|
|
$
|
135.89
|
|
|
|
Third Quarter
|
$
|
165.29
|
|
$
|
111.09
|
|
|
|
Fourth Quarter
|
$
|
151.99
|
|
$
|
114.64
|
|
|
Dividend Policy
We have never declared or paid, and do not anticipate declaring or paying in the foreseeable future, any cash dividends on our capital stock. Any future determination as to the declaration and payment of dividends, if any, will be at the discretion of our board of directors, subject to applicable laws and will depend on then existing conditions, including our financial condition, operating results, contractual restrictions, capital requirements, business prospects, and other factors our board of directors may deem relevant.
Securities Authorized for Issuance under Equity Compensation Plans
See Part III, Item 12 “Security Ownership of Certain Beneficial Owners and Management and Related Stockholder Matters” of this Annual Report on Form 10-K for more information regarding securities authorized for issuance.
Recent Sale of Unregistered Securities
There were no sales of unregistered securities during fiscal
2016
.
Issuer Purchases of Equity Securities
On August 26, 2016, our board of directors authorized a $500.0 million share repurchase which will be funded from available working capital. Repurchases may be made at management’s discretion from time to time on the open market, through privately negotiated transactions, transactions structured through investment banking institutions, block purchase techniques, 10b5-1 trading plans, or a combination of the foregoing. The repurchase authorization will expire on August 31, 2018, and may be suspended or discontinued at any time.
-
33
-
Stock Price Performance Graph
This performance graph shall not be deemed “filed” for purposes of Section 18 of the Securities Exchange Act of 1934, as amended (the “Exchange Act”), or incorporated by reference into any filing of Palo Alto Networks, Inc. under the Securities Act of 1933, as amended, or the Exchange Act, except as shall be expressly set forth by specific reference in such filing.
This performance graph compares the cumulative total return on our common stock with that of the NYSE Composite Index and the NYSE Arca Tech 100 Index. This performance graph assumes $100 was invested on July 20, 2012, the date our common stock commenced trading on the NYSE, in each of the common stock of Palo Alto Networks, Inc., the NYSE Composite Index, and the NYSE Arca Tech 100 Index, and assumes the reinvestment of any dividends. The stock price performance on this performance graph is not necessarily indicative of future stock price performance.
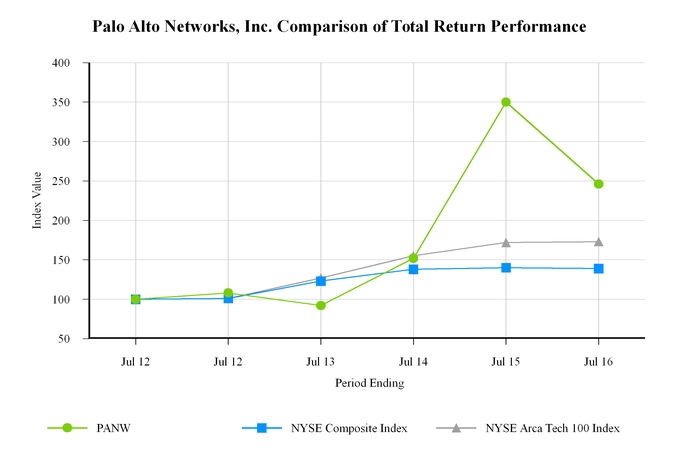
|
Company/Index
|
7/20/2012
|
7/31/2012
|
7/31/2013
|
7/31/2014
|
7/31/2015
|
7/31/2016
|
|||||||||||||||||
|
Palo Alto Networks, Inc.
|
$
|
100.00
|
|
$
|
107.55
|
|
$
|
92.11
|
|
$
|
152.19
|
|
$
|
349.76
|
|
$
|
246.36
|
|
|||||
|
NYSE Composite Index
|
$
|
100.00
|
|
$
|
101.34
|
|
$
|
123.19
|
|
$
|
138.23
|
|
$
|
140.24
|
|
$
|
139.00
|
|
|||||
|
NYSE Arca Tech 100 Index
|
$
|
100.00
|
|
$
|
101.35
|
|
$
|
127.39
|
|
$
|
154.80
|
|
$
|
171.76
|
|
$
|
173.48
|
|
|||||
-
34
-
|
ITEM 6.
|
SELECTED FINANCIAL DATA
|
The selected consolidated statement of operations data for fiscal
2016
,
2015
, and
2014
and the consolidated balance sheet data as of
July 31, 2016
and
2015
are derived from our audited consolidated financial statements included elsewhere in this Annual Report on Form 10-K. The selected consolidated statement of operations data for fiscal
2013
and
2012
and the consolidated balance sheet data as of
July 31, 2014
,
2013
, and
2012
are derived from audited financial statements not included in this Annual Report on Form 10-K. Our historical results are not necessarily indicative of the results that may be expected in the future. The selected consolidated financial data below should be read in conjunction with the section entitled “Management’s Discussion and Analysis of Financial Condition and Results of Operations” included in Part II, Item 7 of this Annual Report on Form 10-K and our consolidated financial statements and related notes included in Part II, Item 8 of this Annual Report on Form 10-K.
|
|
Year Ended July 31,
|
||||||||||||||||||
|
|
2016
|
2015
|
2014
|
2013
|
2012
|
||||||||||||||
|
(in millions)
|
|||||||||||||||||||
|
Selected Consolidated Statements of Operations Data:
|
|||||||||||||||||||
|
Revenue:
|
|||||||||||||||||||
|
Product
|
$
|
670.8
|
|
$
|
492.7
|
|
$
|
340.1
|
|
$
|
243.7
|
|
$
|
174.5
|
|
||||
|
Services
|
707.7
|
|
435.4
|
|
258.1
|
|
152.4
|
|
80.6
|
|
|||||||||
|
Total revenue
|
1,378.5
|
|
928.1
|
|
598.2
|
|
396.1
|
|
255.1
|
|
|||||||||
|
Cost of revenue:
|
|||||||||||||||||||
|
Product
|
175.4
|
|
131.1
|
|
85.5
|
|
63.4
|
|
44.6
|
|
|||||||||
|
Services
|
194.6
|
|
120.4
|
|
74.1
|
|
46.3
|
|
25.9
|
|
|||||||||
|
Total cost of revenue
(1)
|
370.0
|
|
251.5
|
|
159.6
|
|
109.7
|
|
70.5
|
|
|||||||||
|
Total gross profit
|
1,008.5
|
|
676.6
|
|
438.6
|
|
286.4
|
|
184.6
|
|
|||||||||
|
Operating expenses:
|
|||||||||||||||||||
|
Research and development
|
284.2
|
|
185.8
|
|
104.8
|
|
62.5
|
|
38.6
|
|
|||||||||
|
Sales and marketing
|
776.0
|
|
522.7
|
|
334.8
|
|
199.8
|
|
115.9
|
|
|||||||||
|
General and administrative
|
138.4
|
|
101.6
|
|
73.1
|
|
42.7
|
|
26.2
|
|
|||||||||
|
Legal settlement
|
—
|
|
—
|
|
141.2
|
|
—
|
|
—
|
|
|||||||||
|
Total operating expenses
(1)
|
1,198.6
|
|
810.1
|
|
653.9
|
|
305.0
|
|
180.7
|
|
|||||||||
|
Operating income (loss)
|
(190.1
|
)
|
(133.5
|
)
|
(215.3
|
)
|
(18.6
|
)
|
3.9
|
|
|||||||||
|
Interest expense
|
(23.4
|
)
|
(22.3
|
)
|
(1.9
|
)
|
(0.1
|
)
|
—
|
|
|||||||||
|
Other income (expense), net
|
8.4
|
|
0.2
|
|
(5.0
|
)
|
—
|
|
(1.1
|
)
|
|||||||||
|
Income (loss) before income taxes
|
(205.1
|
)
|
(155.6
|
)
|
(222.2
|
)
|
(18.7
|
)
|
2.8
|
|
|||||||||
|
Provision for income taxes
|
20.8
|
|
9.4
|
|
4.3
|
|
10.5
|
|
2.1
|
|
|||||||||
|
Net income (loss)
|
$
|
(225.9
|
)
|
$
|
(165.0
|
)
|
$
|
(226.5
|
)
|
$
|
(29.2
|
)
|
$
|
0.7
|
|
||||
|
Net income (loss) attributable to common stockholders, basic and diluted
|
$
|
(225.9
|
)
|
$
|
(165.0
|
)
|
$
|
(226.5
|
)
|
$
|
(29.2
|
)
|
$
|
—
|
|
||||
|
Net income (loss) per share attributable to common stockholders, basic and diluted
|
$
|
(2.59
|
)
|
$
|
(2.02
|
)
|
$
|
(3.05
|
)
|
$
|
(0.43
|
)
|
$
|
0.00
|
|
||||
|
Weighted-average shares used to compute net income (loss) per share attributable to common stockholders, basic and diluted
|
87.1
|
|
81.6
|
|
74.3
|
|
68.7
|
|
19.6
|
|
|||||||||
|
(1)
|
Includes share-based compensation as follows:
|
-
35
-
|
|
Year Ended July 31,
|
||||||||||||||||||
|
|
2016
|
2015
|
2014
|
2013
|
2012
|
||||||||||||||
|
|
(in millions)
|
||||||||||||||||||
|
Cost of product revenue
|
$
|
6.2
|
|
$
|
3.9
|
|
$
|
1.6
|
|
$
|
0.8
|
|
$
|
0.1
|
|
||||
|
Cost of services revenue
|
40.9
|
|
20.4
|
|
9.4
|
|
3.6
|
|
0.7
|
|
|||||||||
|
Research and development
|
132.9
|
|
74.8
|
|
29.5
|
|
9.9
|
|
3.7
|
|
|||||||||
|
Sales and marketing
|
152.4
|
|
84.1
|
|
42.6
|
|
20.5
|
|
4.3
|
|
|||||||||
|
General and administrative
|
60.5
|
|
38.2
|
|
16.8
|
|
9.1
|
|
5.1
|
|
|||||||||
|
Total share-based compensation
|
$
|
392.9
|
|
$
|
221.4
|
|
$
|
99.9
|
|
$
|
43.9
|
|
$
|
13.9
|
|
||||
|
|
July 31,
|
||||||||||||||||||
|
|
2016
|
2015
|
2014
|
2013
|
2012
|
||||||||||||||
|
|
(in millions)
|
||||||||||||||||||
|
Selected Consolidated Balance Sheet Data:
|
|||||||||||||||||||
|
Cash and cash equivalents
|
$
|
734.4
|
|
$
|
375.8
|
|
$
|
653.8
|
|
$
|
310.6
|
|
$
|
322.6
|
|
||||
|
Investments
|
1,204.0
|
|
952.0
|
|
320.6
|
|
126.3
|
|
—
|
|
|||||||||
|
Working capital
(1)
|
872.3
|
|
41.8
|
|
610.1
|
|
323.6
|
|
259.7
|
|
|||||||||
|
Total assets
|
2,761.2
|
|
1,965.2
|
|
1,478.5
|
|
585.6
|
|
407.8
|
|
|||||||||
|
Total deferred revenue
|
1,240.8
|
|
713.7
|
|
422.6
|
|
249.2
|
|
135.8
|
|
|||||||||
|
Convertible senior notes, net
(1)
|
508.2
|
|
487.1
|
|
466.9
|
|
—
|
|
—
|
|
|||||||||
|
Common stock and additional paid-in capital
|
1,515.5
|
|
988.7
|
|
804.4
|
|
381.6
|
|
309.1
|
|
|||||||||
|
Total stockholders’ equity
|
$
|
789.9
|
|
$
|
487.9
|
|
$
|
468.6
|
|
$
|
272.4
|
|
$
|
229.1
|
|
||||
|
(1)
|
As of July 31, 2015, the convertible senior notes, net balance was classified in current liabilities in our consolidated balance sheets. Refer to Note
7
. Convertible Senior Notes of Notes to Consolidated Financial Statements included in Part II, Item 8 of this Annual Report on Form 10-K for more information.
|
|
ITEM 7.
|
MANAGEMENT’S DISCUSSION AND ANALYSIS OF FINANCIAL CONDITION AND RESULTS OF OPERATIONS
|
The following discussion and analysis of our financial condition and results of operations should be read in conjunction with our consolidated financial statements and related notes appearing elsewhere in this Annual Report on Form 10-K. The following discussion and analysis contains forward-looking statements based on current expectations and assumptions that are subject to risks and uncertainties, which could cause our actual results to differ materially from those anticipated or implied by any forward-looking statements. Factors that could cause or contribute to such differences include, but are not limited to, those discussed in this Annual Report on Form 10-K, and in particular, the risks discussed under the caption “Risk Factors” in Part I, Item 1A of this report.
Our Management’s Discussion and Analysis of Financial Condition and Results of Operations (“MD&A”) is organized as follows:
|
•
|
Overview.
A discussion of our business and overall analysis of financial and other highlights in order to provide context for the remainder of MD&A.
|
|
•
|
Key Financial Metrics.
A summary of our GAAP and non-GAAP key financial metrics, which management monitors to evaluate our performance.
|
|
•
|
Results of Operations.
A discussion of the nature and trends in our financial results and an analysis of our financial results comparing fiscal
2016
to
2015
and fiscal
2015
to
2014
.
|
|
•
|
Liquidity and Capital Resources.
An analysis of changes in our balance sheets and cash flows, and a discussion of our financial condition and our ability to meet cash needs.
|
|
•
|
Contractual Obligations and Commitments.
An overview of our contractual obligations, contingent liabilities, commitments, and off-balance sheet arrangements outstanding as of
July 31, 2016
, including expected payment schedules.
|
-
36
-
|
•
|
Critical Accounting Estimates.
A discussion of our accounting policies that require critical estimates, assumptions, and judgments.
|
|
•
|
Recent Accounting Pronouncements.
A discussion of expected impacts of impending accounting changes on financial information to be reported in the future.
|
Overview
We have pioneered the next generation of security through our innovative platform that allows enterprises, service providers, and government entities to secure their organizations by safely enabling applications running on their networks and by preventing breaches that stem from targeted cyber attacks. Our platform uses an innovative traffic classification engine that identifies network traffic by application, user, and content and provides consistent security across the network, endpoint, and cloud. Accordingly, our platform enables our end-customers to maintain the visibility and control needed to protect their valued data and critical control systems while pursuing technology initiatives, like cloud and mobility, that grow their business. We believe our platform offers superior performance compared to legacy approaches and reduces the total cost of ownership for organizations by simplifying their security infrastructure and eliminating the need for multiple, stand-alone security appliances and software products.
Our Next-Generation Security Platform consists of three major elements: our Next-Generation Firewall, our Advanced Endpoint Protection, and our Threat Intelligence Cloud. Our Next-Generation Firewall delivers application, user, and content visibility and control as well as protection against network-based cyber threats integrated within the firewall through our proprietary hardware and software architecture. Our Advanced Endpoint Protection prevents cyber attacks that aim to run malicious code or exploit software vulnerabilities on a broad variety of fixed and virtual endpoints and servers. Our Threat Intelligence Cloud provides central intelligence capabilities, security for SaaS applications, and automated delivery of preventative measures against cyber attacks.
For fiscal
2016
,
2015
, and
2014
, total revenue was
$1.4 billion
,
$928.1 million
, and
$598.2 million
, respectively, representing year-over-year growth of
48.5%
for fiscal
2016
and
55.1%
for fiscal
2015
. Our growth reflects the increased adoption of our hybrid SaaS revenue model, which consists of product, subscriptions, and support and maintenance. We believe this model will enable us to benefit from recurring revenues as we continue to grow our installed end-customer base. As of
July 31, 2016
, we had approximately
34,000
end-customers in over
140
countries. Our end-customers represent a broad range of industries including education, energy, financial services, government entities, healthcare, Internet and media, manufacturing, public sector, and telecommunications, and include some of the largest Fortune 100 and Global 2000 companies in the world.
Our product revenue grew to
$670.8 million
or
48.7%
of total revenue for fiscal
2016
, representing year-over-year growth of
36.2%
. Product revenue is generated from sales of our appliances, primarily our Next-Generation Firewall, which is available in physical and virtualized form. Our Next-Generation Firewall incorporates our proprietary PAN-OS operating system, which provides a consistent set of capabilities across our entire product line. Our products are designed for different performance requirements throughout an organization, ranging from our PA-200, which is designed for enterprise remote offices, to our top-of-the-line PA-7080, which was released in August 2015 and is especially suited for very large enterprise deployments and service provider customers. The same firewall functionality that is delivered in our physical appliances is also available in our VM-Series virtual firewalls, which secure virtualized and cloud-based computing environments.
Our recurring services revenue grew to
$707.7 million
or
51.3%
of total revenue for fiscal
2016
, representing year-over-year growth of
62.5%
, led by revenue from subscription services, which grew
67.8%
to
$357.0 million
, and followed by support and maintenance services, which grew
57.5%
to
$350.7 million
. Our subscriptions include two new services released during the first quarter of fiscal 2016: our Aperture subscription service, which provides added visibility and control within IT-sanctioned SaaS applications that are used to store and share end-customer’s data, and our AutoFocus cyber threat intelligence service, which provides prioritized actionable intelligence on targeted cyber attacks. Our subscriptions provide our end-customers with real-time access to the latest antivirus, intrusion prevention, web filtering, and modern malware prevention capabilities across fixed and mobile devices.
We maintain a field sales force that works closely with our channel partners in developing sales opportunities. We use a two-tier, indirect fulfillment model whereby we sell our products and services to our distributors, which, in turn, to our resellers, which then sell to our end-customers. When end-customers purchase an appliance, they typically purchase one or more of our subscriptions for additional functionality, as well as support and maintenance in order to receive ongoing security updates, upgrades, bug fixes, and repairs.
We believe that the growth of our business and our short-term and long-term success are dependent upon many factors, including our ability to extend our technology leadership, grow our base of end-customers, expand deployment of our platform and services within existing end-customers, and focus on end-customer satisfaction. To manage any future growth effectively, we must continue to improve and expand our information technology and financial infrastructure, our operating and administrative systems and controls, and our ability to manage headcount, capital, and processes in an efficient manner. While these areas present
-
37
-
significant opportunities for us, they also pose challenges and risks that we must successfully address in order to sustain the growth of our business and improve our operating results. For additional information regarding the challenges and risks we face, see the “Risk Factors” section in Part I, Item 1A of this Annual Report on Form 10-K.
Key Financial Metrics
We monitor the key financial metrics set forth in the tables below to help us evaluate growth trends, establish budgets, measure the effectiveness of our sales and marketing efforts, and assess operational efficiencies. We discuss revenue, gross margin, and the components of operating loss and margin below under “—Results of Operations.”
|
July 31,
|
|||||||
|
2016
|
2015
|
||||||
|
(in millions)
|
|||||||
|
Total deferred revenue
|
$
|
1,240.8
|
|
$
|
713.7
|
|
|
|
Cash, cash equivalents, and investments
|
$
|
1,938.4
|
|
$
|
1,327.8
|
|
|
|
Year Ended July 31,
|
|||||||||||
|
2016
|
2015
|
2014
|
|||||||||
|
(dollars in millions)
|
|||||||||||
|
Total revenue
|
$
|
1,378.5
|
|
$
|
928.1
|
|
$
|
598.2
|
|
||
|
Total revenue year-over-year percentage increase
|
48.5
|
%
|
55.1
|
%
|
51.0
|
%
|
|||||
|
Gross margin percentage
|
73.2
|
%
|
72.9
|
%
|
73.3
|
%
|
|||||
|
Operating loss
|
$
|
(190.1
|
)
|
$
|
(133.5
|
)
|
$
|
(215.3
|
)
|
||
|
Operating margin percentage
|
(13.8
|
)%
|
(14.4
|
)%
|
(36.0
|
)%
|
|||||
|
Billings
|
$
|
1,905.6
|
|
$
|
1,219.1
|
|
$
|
771.4
|
|
||
|
Billings year-over-year percentage increase
|
56.3
|
%
|
58.0
|
%
|
51.4
|
%
|
|||||
|
Cash flow provided by operating activities
|
$
|
658.1
|
|
$
|
350.3
|
|
$
|
88.4
|
|
||
|
Free cash flow (non-GAAP)
|
$
|
585.6
|
|
$
|
316.5
|
|
$
|
52.3
|
|
||
|
•
|
Deferred Revenue.
Our deferred revenue consists of amounts that have been invoiced but have not been recognized as revenue as of the period end. The majority of our deferred revenue balance consists of subscription and support and maintenance revenue that is recognized ratably over the contractual service period. We monitor our deferred revenue balance because it represents a significant portion of revenue to be recognized in future periods.
|
|
•
|
Billings.
We define billings as total revenue plus the change in total deferred revenue during the period. We consider billings to be a key measure used by management to manage our business given our hybrid SaaS revenue model, and believe billings provides investors with an important indicator of the health and visibility of our business because it includes services revenue, which is recognized ratably over the subscription period or the period in which the services are expected to be performed, as the case may be, and product revenue, which is recognized at the time of shipment, provided that all other revenue recognition criteria have been met. We consider billings to be a useful metric for management and investors, particularly if we continue to experience increased sales of subscriptions and strong renewal rates for subscriptions and support and maintenance services, and as we monitor our near term cash flows. While we believe that billings provides useful information to investors and others in understanding and evaluating our operating results in the same manner as our management, it is important to note that other companies, including companies in our industry, may not use billings, may calculate billings differently, may have different billing frequencies, or may use other financial measures to evaluate their performance, all of which could reduce the usefulness of billings as a comparative measure. We calculate billings in the following manner:
|
-
38
-
|
Year Ended July 31,
|
|||||||||||
|
2016
|
2015
|
2014
|
|||||||||
|
(in millions)
|
|||||||||||
|
Billings:
|
|||||||||||
|
Total revenue
|
$
|
1,378.5
|
|
$
|
928.1
|
|
$
|
598.2
|
|
||
|
Add: change in total deferred revenue, net of acquired deferred revenue
|
527.1
|
|
291.0
|
|
173.2
|
|
|||||
|
Billings
|
$
|
1,905.6
|
|
$
|
1,219.1
|
|
$
|
771.4
|
|
||
|
•
|
Cash Flow Provided by Operating Activities.
We monitor cash flow provided by operating activities as a measure of our overall business performance. Our cash flow provided by operating activities is driven in large part by sales of our products and from up-front payments for both subscriptions and support and maintenance services. Monitoring cash flow provided by operating activities enables us to analyze our financial performance without the non-cash effects of certain items such as depreciation, amortization, and share-based compensation costs, thereby allowing us to better understand and manage the cash needs of our business.
|
|
•
|
Free Cash Flow (non-GAAP).
We define free cash flow, a non-GAAP financial measure, as cash provided by operating activities less purchases of property, equipment, and other assets. We consider free cash flow to be a profitability and liquidity measure that provides useful information to management and investors about the amount of cash generated by the business after necessary capital expenditures. A limitation of the utility of free cash flow as a measure of our financial performance and liquidity is that it does not represent the total increase or decrease in our cash balance for the period. In addition, it is important to note that other companies, including companies in our industry, may not use free cash flow, may calculate free cash flow in a different manner than we do, or may use other financial measures to evaluate their performance, all of which could reduce the usefulness of free cash flow as a comparative measure. A reconciliation of free cash flow to cash flow provided by operating activities, the most directly comparable financial measure calculated and presented in accordance with GAAP, is provided below:
|
|
Year Ended July 31,
|
|||||||||||
|
2016
|
2015
|
2014
|
|||||||||
|
(in millions)
|
|||||||||||
|
Free cash flow (non-GAAP):
|
|||||||||||
|
Net cash provided by operating activities
|
$
|
658.1
|
|
$
|
350.3
|
|
$
|
88.4
|
|
||
|
Less: purchases of property, equipment, and other assets
|
72.5
|
|
33.8
|
|
36.1
|
|
|||||
|
Free cash flow (non-GAAP)
(1)
|
$
|
585.6
|
|
$
|
316.5
|
|
$
|
52.3
|
|
||
|
Net cash used in investing activities
|
$
|
(338.9
|
)
|
$
|
(679.0
|
)
|
$
|
(320.3
|
)
|
||
|
Net cash provided by financing activities
|
$
|
39.4
|
|
$
|
50.7
|
|
$
|
575.1
|
|
||
______________
|
(1)
|
Includes our cash payments of $75.0 million and $20.0 million in fiscal 2014 for the legal settlement with Juniper and the Mutual Covenant Not to Sue and Release Agreement with Fortinet, respectively.
|
-
39
-
Results of Operations
The following table summarizes our results of operations for the periods presented and as a percentage of our total revenue for those periods based on our consolidated statements of operations data. The period to period comparison of results is not necessarily indicative of results for future periods.
|
Year Ended July 31,
|
||||||||||||||||||||
|
2016
|
2015
|
2014
|
||||||||||||||||||
|
Amount
|
% of Revenue
|
Amount
|
% of Revenue
|
Amount
|
% of Revenue
|
|||||||||||||||
|
(dollars in millions)
|
||||||||||||||||||||
|
Revenue:
|
||||||||||||||||||||
|
Product
|
$
|
670.8
|
|
48.7
|
%
|
$
|
492.7
|
|
53.1
|
%
|
$
|
340.1
|
|
56.9
|
%
|
|||||
|
Services
|
707.7
|
|
51.3
|
%
|
435.4
|
|
46.9
|
%
|
258.1
|
|
43.1
|
%
|
||||||||
|
Total revenue
|
1,378.5
|
|
100.0
|
%
|
928.1
|
|
100.0
|
%
|
598.2
|
|
100.0
|
%
|
||||||||
|
Cost of revenue:
|
||||||||||||||||||||
|
Product
|
175.4
|
|
12.7
|
%
|
131.1
|
|
14.1
|
%
|
85.5
|
|
14.3
|
%
|
||||||||
|
Services
|
194.6
|
|
14.1
|
%
|
120.4
|
|
13.0
|
%
|
74.1
|
|
12.4
|
%
|
||||||||
|
Total cost of revenue
(1)
|
370.0
|
|
26.8
|
%
|
251.5
|
|
27.1
|
%
|
159.6
|
|
26.7
|
%
|
||||||||
|
Total gross profit
|
1,008.5
|
|
73.2
|
%
|
676.6
|
|
72.9
|
%
|
438.6
|
|
73.3
|
%
|
||||||||
|
Operating expenses:
|
||||||||||||||||||||
|
Research and development
|
284.2
|
|
20.6
|
%
|
185.8
|
|
20.0
|
%
|
104.8
|
|
17.5
|
%
|
||||||||
|
Sales and marketing
|
776.0
|
|
56.3
|
%
|
522.7
|
|
56.3
|
%
|
334.8
|
|
56.0
|
%
|
||||||||
|
General and administrative
|
138.4
|
|
10.1
|
%
|
101.6
|
|
11.0
|
%
|
73.1
|
|
12.2
|
%
|
||||||||
|
Legal settlement
|
—
|
|
—
|
%
|
—
|
|
—
|
%
|
141.2
|
|
23.6
|
%
|
||||||||
|
Total operating expenses
(1)
|
1,198.6
|
|
87.0
|
%
|
810.1
|
|
87.3
|
%
|
653.9
|
|
109.3
|
%
|
||||||||
|
Operating loss
|
(190.1
|
)
|
(13.8
|
)%
|
(133.5
|
)
|
(14.4
|
)%
|
(215.3
|
)
|
(36.0
|
)%
|
||||||||
|
Interest expense
|
(23.4
|
)
|
(1.7
|
)%
|
(22.3
|
)
|
(2.4
|
)%
|
(1.9
|
)
|
(0.3
|
)%
|
||||||||
|
Other income (expense), net
|
8.4
|
|
0.6
|
%
|
0.2
|
|
—
|
%
|
(5.0
|
)
|
(0.8
|
)%
|
||||||||
|
Loss before income taxes
|
(205.1
|
)
|
(14.9
|
)%
|
(155.6
|
)
|
(16.8
|
)%
|
(222.2
|
)
|
(37.1
|
)%
|
||||||||
|
Provision for income taxes
|
20.8
|
|
1.5
|
%
|
9.4
|
|
1.0
|
%
|
4.3
|
|
0.8
|
%
|
||||||||
|
Net loss
|
$
|
(225.9
|
)
|
(16.4
|
)%
|
$
|
(165.0
|
)
|
(17.8
|
)%
|
$
|
(226.5
|
)
|
(37.9
|
)%
|
|||||
(1)
Includes share-based compensation as follows:
-
40
-
|
Year Ended July 31,
|
|||||||||||
|
2016
|
2015
|
2014
|
|||||||||
|
(in millions)
|
|||||||||||
|
Cost of product revenue
|
$
|
6.2
|
|
$
|
3.9
|
|
$
|
1.6
|
|
||
|
Cost of services revenue
|
40.9
|
|
20.4
|
|
9.4
|
|
|||||
|
Research and development
|
132.9
|
|
74.8
|
|
29.5
|
|
|||||
|
Sales and marketing
|
152.4
|
|
84.1
|
|
42.6
|
|
|||||
|
General and administrative
|
60.5
|
|
38.2
|
|
16.8
|
|
|||||
|
Total share-based compensation
|
$
|
392.9
|
|
$
|
221.4
|
|
$
|
99.9
|
|
||
Revenue
We derive revenue from sales of our products and services. Revenue is recognized when persuasive evidence of an arrangement exists, delivery has occurred, the fee is fixed or determinable, and collectability is reasonably assured. We expect our revenue to vary from quarter to quarter based on seasonal and cyclical factors.
Our total revenue is comprised of the following:
|
•
|
Product Revenue
.
Product revenue is derived primarily from sales of our appliances. Product revenue also includes revenue derived from software licenses of Panorama and, to a lesser extent, the VM-Series. We recognize product revenue at the time of shipment, provided that all other revenue recognition criteria have been met.
|
|
•
|
Services Revenue
.
Services revenue is derived primarily from sales of our subscriptions and support and maintenance. Our contractual subscription and support and maintenance terms are typically one to five years. We recognize revenue from subscriptions and support and maintenance over the contractual service period. As a percentage of total revenue, we expect our services revenue to vary from quarter to quarter and increase over the long term as we introduce new subscriptions, such as Aperture and AutoFocus, renew existing services contracts, and expand our installed end-customer base.
|
|
Year Ended July 31,
|
|
Year Ended July 31,
|
|
||||||||||||||||||||||||||
|
|
2016
|
2015
|
Change
|
2015
|
2014
|
Change
|
|||||||||||||||||||||||
|
Amount
|
Amount
|
Amount
|
%
|
Amount
|
Amount
|
Amount
|
%
|
||||||||||||||||||||||
|
|
(dollars in millions)
|
||||||||||||||||||||||||||||
|
Revenue:
|
|||||||||||||||||||||||||||||
|
Product
|
$
|
670.8
|
|
$
|
492.7
|
|
$
|
178.1
|
|
36.2
|
%
|
$
|
492.7
|
|
$
|
340.1
|
|
$
|
152.6
|
|
44.8
|
%
|
|||||||
|
Services
|
|||||||||||||||||||||||||||||
|
Subscription
|
357.0
|
|
212.7
|
|
144.3
|
|
67.8
|
%
|
212.7
|
|
123.2
|
|
89.5
|
|
72.6
|
%
|
|||||||||||||
|
Support and maintenance
|
350.7
|
|
222.7
|
|
128.0
|
|
57.5
|
%
|
222.7
|
|
134.9
|
|
87.8
|
|
65.2
|
%
|
|||||||||||||
|
Total services
|
707.7
|
|
435.4
|
|
272.3
|
|
62.5
|
%
|
435.4
|
|
258.1
|
|
177.3
|
|
68.7
|
%
|
|||||||||||||
|
Total revenue
|
$
|
1,378.5
|
|
$
|
928.1
|
|
$
|
450.4
|
|
48.5
|
%
|
$
|
928.1
|
|
$
|
598.2
|
|
$
|
329.9
|
|
55.1
|
%
|
|||||||
|
Revenue by geographic theater:
|
|||||||||||||||||||||||||||||
|
Americas
|
$
|
973.2
|
|
$
|
639.4
|
|
$
|
333.8
|
|
52.2
|
%
|
$
|
639.4
|
|
$
|
396.7
|
|
$
|
242.7
|
|
61.2
|
%
|
|||||||
|
EMEA
|
247.1
|
|
178.7
|
|
68.4
|
|
38.2
|
%
|
178.7
|
|
126.9
|
|
51.8
|
|
40.8
|
%
|
|||||||||||||
|
APAC
|
158.2
|
|
110.0
|
|
48.2
|
|
43.8
|
%
|
110.0
|
|
74.6
|
|
35.4
|
|
47.4
|
%
|
|||||||||||||
|
Total revenue
|
$
|
1,378.5
|
|
$
|
928.1
|
|
$
|
450.4
|
|
48.5
|
%
|
$
|
928.1
|
|
$
|
598.2
|
|
$
|
329.9
|
|
55.1
|
%
|
|||||||
Product revenue increased year-over-year for both fiscal
2016
and fiscal
2015
. The increases in both periods were driven by increased demand for our higher end appliances. The change in product revenue due to pricing was not significant for either period.
Services revenue increased year-over-year for both fiscal
2016
and fiscal
2015
. The increases in both periods were due to the adoption of subscriptions and high renewal rates for both subscriptions and support and maintenance services. The mix between subscription revenue and support and maintenance revenue will fluctuate over time, depending on the introduction of new
-
41
-
subscription offerings, renewals of support and maintenance services, and our ability to increase sales to new and existing customers. The change in services revenue due to pricing was not significant for either period.
With respect to geographic theaters, the Americas contributed the largest portion of the year-over-year increases in revenue for both fiscal
2016
and fiscal
2015
due to its larger and more established sales force compared to our other theaters. Revenue from both EMEA and APAC increased year-over-year for both fiscal
2016
and fiscal
2015
due to our investment in increasing the size of our sales force and number of channel partners in these theaters.
Cost of Revenue
Our cost of revenue consists of cost of product revenue and cost of services revenue.
Cost of Product Revenue
Cost of product revenue primarily includes costs paid to our third-party contract manufacturer. Our cost of product revenue also includes amortization of intellectual property licenses, product testing costs, shipping costs, personnel costs, which consist of salaries, benefits, bonuses, and share-based compensation associated with our operations organization, and allocated costs. Allocated costs consist of certain facilities, depreciation, benefits, recruiting, and information technology costs that we allocate based on headcount. We expect our cost of product revenue to increase as our product revenue increases.
|
|
Year Ended July 31,
|
Year Ended July 31,
|
|||||||||||||||||||||||||||
|
|
2016
|
2015
|
Change
|
2015
|
2014
|
Change
|
|||||||||||||||||||||||
|
Amount
|
Amount
|
Amount
|
%
|
Amount
|
Amount
|
Amount
|
%
|
||||||||||||||||||||||
|
|
(dollars in millions)
|
||||||||||||||||||||||||||||
|
Cost of product revenue
|
$
|
175.4
|
|
$
|
131.1
|
|
$
|
44.3
|
|
33.8
|
%
|
$
|
131.1
|
|
$
|
85.5
|
|
$
|
45.6
|
|
53.3
|
%
|
|||||||
|
Number of employees at period end
|
91
|
|
67
|
|
24
|
|
35.8
|
%
|
67
|
|
50
|
|
17
|
|
34.0
|
%
|
|||||||||||||
Cost of product revenue increased for fiscal
2016
compared to fiscal
2015
due to an increase in product unit volume for our higher end appliances.
Cost of product revenue increased for fiscal
2015
compared to fiscal
2014
due to an increase in product unit volume, as well as amortization of intellectual property licenses of $10.2 million.
Cost of Services Revenue
Cost of services revenue includes personnel costs for our global customer support and technical operations organizations, amortization of acquired intangible assets, third-party professional services costs, and allocated costs. We expect our cost of services revenue to increase as our installed end-customer base grows.
|
|
Year Ended July 31,
|
Year Ended July 31,
|
|||||||||||||||||||||||||||
|
|
2016
|
2015
|
Change
|
2015
|
2014
|
Change
|
|||||||||||||||||||||||
|
Amount
|
Amount
|
Amount
|
%
|
Amount
|
Amount
|
Amount
|
%
|
||||||||||||||||||||||
|
|
(dollars in millions)
|
||||||||||||||||||||||||||||
|
Cost of services revenue
|
$
|
194.6
|
|
$
|
120.4
|
|
$
|
74.2
|
|
61.7
|
%
|
$
|
120.4
|
|
$
|
74.1
|
|
$
|
46.3
|
|
62.4
|
%
|
|||||||
|
Number of employees at period end
|
539
|
|
357
|
|
182
|
|
51.0
|
%
|
357
|
|
229
|
|
128
|
|
55.9
|
%
|
|||||||||||||
Cost of services revenue increased year-over-year for both fiscal
2016
and fiscal
2015
. The increases in both periods were driven by increases in personnel costs, which grew
$42.1 million
to
$104.1 million
for fiscal
2016
compared to fiscal
2015
and grew $25.8 million to $62.0 million for fiscal
2015
compared to fiscal
2014
. The increases in personnel costs in both periods were due to headcount growth. The remaining increases in both periods were due to expansion of our customer service capabilities and infrastructure to support our growing installed end-customer base.
Gross Margin
Gross margin, or gross profit as a percentage of revenue, has been and will continue to be affected by a variety of factors, including the average sales price of our products, manufacturing costs, the mix of products sold, and the mix of revenue between products and services. For sales of our products, our higher end firewall products generally have higher gross margins than our lower end firewall products within each product series. For sales of our services, our subscriptions typically have higher gross
-
42
-
margins than our support and maintenance. We expect our gross margins to fluctuate over time depending on the factors described above.
|
|
Year Ended July 31,
|
|||||||||||||||||||
|
|
2016
|
2015
|
2014
|
|||||||||||||||||
|
|
Amount
|
Gross
Margin
|
Amount
|
Gross
Margin
|
Amount
|
Gross
Margin |
||||||||||||||
|
|
(dollars in millions)
|
|||||||||||||||||||
|
Gross profit:
|
||||||||||||||||||||
|
Product
|
$
|
495.4
|
|
73.9
|
%
|
$
|
361.6
|
|
73.4
|
%
|
$
|
254.6
|
|
74.9
|
%
|
|||||
|
Services
|
513.1
|
|
72.5
|
%
|
315.0
|
|
72.3
|
%
|
184.0
|
|
71.3
|
%
|
||||||||
|
Total gross profit
|
$
|
1,008.5
|
|
73.2
|
%
|
$
|
676.6
|
|
72.9
|
%
|
$
|
438.6
|
|
73.3
|
%
|
|||||
Product gross margin
increased
for fiscal
2016
compared to fiscal
2015
due to our continued focus on material cost reductions. Product gross margin decreased for fiscal
2015
compared to fiscal
2014
due to increased amortization of intellectual property licenses as a result of the Settlement Agreement with Juniper in May 2014.
Services gross margin was flat for fiscal
2016
compared to fiscal
2015
. Services gross margin increased for fiscal
2015
compared to fiscal
2014
due to contributions from our higher margin subscription services, partially offset by increased amortization of purchased intangible assets.
Operating Expenses
Our operating expenses consist of research and development, sales and marketing, general and administrative, and legal settlement expense. Personnel costs are the most significant component of operating expenses and consist of salaries, benefits, bonuses, share-based compensation, and with regard to sales and marketing expense, sales commissions. Our operating expenses also include allocated costs, which consist of certain facilities, depreciation, benefits, recruiting, and information technology costs that we allocate based on headcount. We expect operating expenses to increase in absolute dollars and decrease over the long term as a percentage of revenue as we continue to scale our business. As of
July 31, 2016
, we expect to recognize approximately
$822.9 million
of share-based compensation expense over a weighted-average period of approximately
2.4 years
, excluding additional share-based compensation expense related to any future grants of share-based awards. Share-based compensation expense, net of forfeitures, is recognized on a straight-line basis over the requisite service periods of the awards.
Research and Development
Research and development expense consists primarily of personnel costs. Research and development expense also includes prototype related expenses and allocated costs. We expect research and development expense to increase in absolute dollars as we continue to invest in our future products and services, although our research and development expense may fluctuate as a percentage of total revenue.
|
|
Year Ended July 31,
|
Year Ended July 31,
|
|||||||||||||||||||||||||||
|
|
2016
|
2015
|
Change
|
2015
|
2014
|
Change
|
|||||||||||||||||||||||
|
Amount
|
Amount
|
Amount
|
%
|
Amount
|
Amount
|
Amount
|
%
|
||||||||||||||||||||||
|
|
(dollars in millions)
|
||||||||||||||||||||||||||||
|
Research and development
|
$
|
284.2
|
|
$
|
185.8
|
|
$
|
98.4
|
|
52.9
|
%
|
$
|
185.8
|
|
$
|
104.8
|
|
$
|
81.0
|
|
77.3
|
%
|
|||||||
|
Number of employees at period end
|
637
|
|
475
|
|
162
|
|
34.1
|
%
|
475
|
|
312
|
|
163
|
|
52.2
|
%
|
|||||||||||||
Research and development expense increased year-over-year for both fiscal
2016
and fiscal
2015
. The increases in both periods were driven by increases in personnel costs, which grew
$86.8 million
to
$236.4 million
for fiscal
2016
compared to fiscal
2015
and grew $73.7 million to $149.6 million for fiscal
2015
compared to fiscal
2014
. The increases in personnel costs in both periods were due to headcount growth.
Sales and Marketing
Sales and marketing expense consists primarily of personnel costs, including commission costs. We expense commission costs as incurred. Sales and marketing expense also includes costs for market development programs, promotional and other marketing costs, travel costs, professional services, and allocated costs. We continue to thoughtfully invest in headcount and have substantially grown our sales presence internationally. We expect sales and marketing expense to continue to increase in absolute
-
43
-
dollars as we increase the size of our sales and marketing organizations to increase touch points with end-customers and to expand our international presence, although our sales and marketing expense may fluctuate as a percentage of total revenue.
|
|
Year Ended July 31,
|
Year Ended July 31,
|
|||||||||||||||||||||||||||
|
|
2016
|
2015
|
Change
|
2015
|
2014
|
Change
|
|||||||||||||||||||||||
|
Amount
|
Amount
|
Amount
|
%
|
Amount
|
Amount
|
Amount
|
%
|
||||||||||||||||||||||
|
|
(dollars in millions)
|
||||||||||||||||||||||||||||
|
Sales and marketing
|
$
|
776.0
|
|
$
|
522.7
|
|
$
|
253.3
|
|
48.5
|
%
|
$
|
522.7
|
|
$
|
334.8
|
|
$
|
187.9
|
|
56.1
|
%
|
|||||||
|
Number of employees at period end
|
2,092
|
|
1,443
|
|
649
|
|
45.0
|
%
|
1,443
|
|
956
|
|
487
|
|
50.9
|
%
|
|||||||||||||
Sales and marketing expense increased year-over-year for both fiscal
2016
and fiscal
2015
. The increases in both periods were driven by increases in personnel costs, which grew
$185.2 million
to
$553.0 million
for fiscal
2016
compared to fiscal
2015
and grew $140.4 million to $367.8 million for fiscal
2015
compared to fiscal
2014
. The increases in personnel costs in both periods were due to headcount growth.
General and Administrative
General and administrative expense consists of personnel costs for our executive, finance, human resources, legal, and information technology organizations, professional services costs, which consist primarily of legal, auditing, accounting, and other consulting costs, and certain non-recurring general expenses. Certain facilities, depreciation, benefits, recruiting, and information technology costs are allocated to other organizations based on headcount. We expect general and administrative expense to increase in absolute dollars due to additional costs associated with accounting, compliance, insurance, and investor relations, although our general and administrative expense may fluctuate as a percentage of total revenue.
|
|
Year Ended July 31,
|
Year Ended July 31,
|
|||||||||||||||||||||||||||
|
|
2016
|
2015
|
Change
|
2015
|
2014
|
Change
|
|||||||||||||||||||||||
|
Amount
|
Amount
|
Amount
|
%
|
Amount
|
Amount
|
Amount
|
%
|
||||||||||||||||||||||
|
|
(dollars in millions)
|
||||||||||||||||||||||||||||
|
General and administrative
|
$
|
138.4
|
|
$
|
101.6
|
|
$
|
36.8
|
|
36.2
|
%
|
$
|
101.6
|
|
$
|
73.1
|
|
$
|
28.5
|
|
38.8
|
%
|
|||||||
|
Number of employees at period end
|
436
|
|
295
|
|
141
|
|
47.8
|
%
|
295
|
|
175
|
|
120
|
|
68.6
|
%
|
|||||||||||||
General and administrative expense increased year-over-year for both fiscal
2016
and fiscal
2015
. The increases in both periods were driven by increases in personnel costs, which grew
$32.9 million
to
$96.5 million
for fiscal
2016
compared to fiscal
2015
and grew $31.4 million to $63.5 million for fiscal
2015
compared to fiscal
2014
. The increases in personnel costs in both periods were due to headcount growth.
Legal Settlement
We incurred legal settlement expenses of $121.2 million and $20.0 million in fiscal 2014 related to the Settlement Agreement with Juniper and the Mutual Covenant Not to Sue and Release Agreement with Fortinet, respectively. Refer to the discussion under Note
9
. Legal Settlement of Notes to Consolidated Financial Statements in Part II, Item 8 of this Annual Report on Form 10-K for information related to these matters.
-
44
-
Interest Expense
Interest expense primarily consists of the amortization of the debt discount and debt issuance costs related to the 0.0% Convertible Seniors Notes due 2019 (the “Notes”). This interest expense is non-cash and will range from $24.5 million to $25.7 million per year through fiscal 2019.
|
|
Year Ended July 31,
|
Year Ended July 31,
|
|||||||||||||||||||||||||
|
|
2016
|
2015
|
Change
|
2015
|
2014
|
Change
|
|||||||||||||||||||||
|
Amount
|
Amount
|
Amount
|
%
|
Amount
|
Amount
|
Amount
|
%
|
||||||||||||||||||||
|
|
(dollars in millions)
|
||||||||||||||||||||||||||
|
Interest expense
|
$
|
23.4
|
|
$
|
22.3
|
|
$
|
1.1
|
|
4.8%
|
$
|
22.3
|
|
$
|
1.9
|
|
$
|
20.4
|
|
NM
|
|||||||
Interest expense was flat for fiscal 2016 compared to fiscal 2015. Interest expense increased for fiscal 2015 compared to fiscal 2014 due to the amortization of the debt discount and debt issuance costs related to the Notes, which were issued on June 30, 2014.
Other Income (Expense), Net
Other income (expense), net includes interest income earned on our cash, cash equivalents, and investments, foreign currency remeasurement gains and losses, and foreign currency transaction gains and losses.
|
|
Year Ended July 31,
|
Year Ended July 31,
|
|||||||||||||||||||||||||
|
|
2016
|
2015
|
Change
|
2015
|
2014
|
Change
|
|||||||||||||||||||||
|
Amount
|
Amount
|
Amount
|
%
|
Amount
|
Amount
|
Amount
|
%
|
||||||||||||||||||||
|
|
(dollars in millions)
|
||||||||||||||||||||||||||
|
Other income (expense), net
|
$
|
8.4
|
|
$
|
0.2
|
|
$
|
8.2
|
|
NM
|
$
|
0.2
|
|
$
|
(5.0
|
)
|
$
|
5.2
|
|
NM
|
|||||||
Other income (expense), net increased for fiscal
2016
compared to fiscal
2015
due to an increase in interest income and higher foreign currency remeasurement gains. In fiscal 2014, we recorded an expense of $5.9 million in other income (expense), net to record the change in fair value of the warrant issued to Juniper in connection with the Settlement Agreement. The warrant was classified as a liability on our consolidated balance sheets and remeasured to fair value from June 3, 2014, the issuance date of the warrant, through July 1, 2014, the date the warrant was exercised.
Provision for Income Taxes
Provision for income taxes consists primarily of income taxes in foreign jurisdictions in which we conduct business, withholding taxes, federal and state income taxes in the United States, and amortization of our deferred tax charges. We maintain a full valuation allowance for domestic deferred tax assets, including net operating loss carryforwards and tax credits.
In recent years, we reorganized our corporate structure and intercompany relationships to more closely align with the international nature of our business activities. Our corporate structure has caused, and may continue to cause, disproportionate relationships between our overall effective tax rate and other jurisdictional measures.
In fiscal 2015, we recorded deferred tax charges of $36.8 million in connection with a corporate restructure. The current portion of the deferred tax charges is included in prepaid expenses and other current assets and the remainder in other assets in our consolidated balance sheets. The deferred tax charges are being amortized on a straight-line basis over approximately seven years as a component of provision for income taxes.
|
|
Year Ended July 31,
|
|
|
Year Ended July 31,
|
|
|
|||||||||||||||||||||||
|
|
2016
|
2015
|
Change
|
2015
|
2014
|
Change
|
|||||||||||||||||||||||
|
|
Amount
|
Amount
|
Amount
|
%
|
Amount
|
Amount
|
Amount
|
%
|
|||||||||||||||||||||
|
|
(dollars in millions)
|
||||||||||||||||||||||||||||
|
Provision for income taxes
|
$
|
20.8
|
|
$
|
9.4
|
|
$
|
11.4
|
|
121.4
|
%
|
$
|
9.4
|
|
$
|
4.3
|
|
$
|
5.1
|
|
119.1
|
%
|
|||||||
|
Effective tax rate
|
(10.2
|
)%
|
(6.0
|
)%
|
(6.0
|
)%
|
(1.9
|
)%
|
|||||||||||||||||||||
We recorded an
income tax provision
for fiscal
2016
due to federal, state, and foreign income taxes, withholding taxes, and amortization of our deferred tax charges. The provision for income taxes
increased
for fiscal
2016
compared to fiscal
2015
primarily due to an increase in foreign taxes and amortization of our deferred tax charges.
-
45
-
We recorded an
income tax provision
for fiscal 2015 due to federal, state, and foreign income taxes, foreign withholding taxes, and amortization of our deferred tax charges. The provision for income taxes increased for fiscal 2015 compared to fiscal 2014 due to amortization of our deferred tax charges and a shift in geographical mix of income, partially offset by the tax benefit from a partial release of the valuation allowance in connection with the acquisition of CirroSecure.
Liquidity and Capital Resources
|
July 31,
|
|||||||
|
2016
|
2015
|
||||||
|
(in millions)
|
|||||||
|
Working capital
(1)
|
$
|
872.3
|
|
$
|
41.8
|
|
|
|
Cash, cash equivalents, and investments:
|
|||||||
|
Cash and cash equivalents
|
$
|
734.4
|
|
$
|
375.8
|
|
|
|
Investments
|
1,204.0
|
|
952.0
|
|
|||
|
Total cash, cash equivalents, and investments
|
$
|
1,938.4
|
|
$
|
1,327.8
|
|
|
______________
|
(1)
|
As of July 31, 2015, the net carrying amount of the Notes was classified in current liabilities in our consolidated balance sheets. Refer to Note
7
. Convertible Senior Notes of Notes to Consolidated Financial Statements included in Part II, Item 8 of this Annual Report on Form 10-K for more information.
|
At
July 31, 2016
, our total cash, cash equivalents, and investments of
$1.9 billion
were held for general corporate purposes, of which approximately
$148.6 million
was held outside of the United States. We do not provide for federal income taxes on the undistributed earnings of our foreign subsidiaries, all of which we expect to reinvest outside of the United States indefinitely. However, if these funds were needed for our domestic operations, we would be required to accrue and pay U.S. taxes on undistributed earnings of foreign subsidiaries. There are no other restrictions on the use of these funds. If we were to repatriate these earnings to the United States, any associated income tax liability would be insignificant.
As of
July 31, 2016
, all of the Notes remained outstanding. The Notes mature on July 1, 2019, however, prior to January 1, 2019, holders may surrender their Notes for early conversion under certain circumstances. Upon conversion, we will pay cash equal to the aggregate principal amount of the Notes to be converted, and, at our election, will pay or deliver cash and/or shares of our common stock for the amount of our conversion obligation in excess of the aggregate principal amount of the Notes being converted. Refer to Note
7
. Convertible Senior Notes of Notes to Consolidated Financial Statements included in Part II, Item 8 of this Annual Report on Form 10-K for information on the Notes.
On August 26, 2016, our board of directors authorized a $500.0 million share repurchase which will be funded from available working capital. Repurchases may be made at management’s discretion from time to time on the open market, through privately negotiated transactions, transactions structured through investment banking institutions, block purchase techniques, 10b5-1 trading plans, or a combination of the foregoing. The repurchase authorization will expire on August 31, 2018, and may be suspended or discontinued at any time.
The following table summarizes our cash flows for the years ended
July 31, 2016
,
2015
, and
2014
.
|
Year Ended July 31,
|
|||||||||||
|
2016
|
2015
|
2014
|
|||||||||
|
(in millions)
|
|||||||||||
|
Net cash provided by operating activities
|
$
|
658.1
|
|
$
|
350.3
|
|
$
|
88.4
|
|
||
|
Net cash used in investing activities
|
(338.9
|
)
|
(679.0
|
)
|
(320.3
|
)
|
|||||
|
Net cash provided by financing activities
|
39.4
|
|
50.7
|
|
575.1
|
|
|||||
|
Net increase (decrease) in cash and cash equivalents
|
$
|
358.6
|
|
$
|
(278.0
|
)
|
$
|
343.2
|
|
||
We believe that our cash flow from operations with existing cash and cash equivalents will be sufficient to meet our anticipated cash needs for the foreseeable future. Our future capital requirements will depend on many factors including our growth rate, the timing and extent of spending to support development efforts, the expansion of sales and marketing activities, the introduction of new and enhanced products and services offerings, the costs to acquire or invest in complementary businesses and technologies, the costs to ensure access to adequate manufacturing capacity, the investments in our new corporate headquarters,
-
46
-
and the continuing market acceptance of our products. In addition, from time to time we may incur additional tax liability in connection with certain tax structuring decisions.
We may also choose to seek additional equity or debt financing. In the event that additional financing is required from outside sources, we may not be able to raise it on terms acceptable to us or at all. If we are unable to raise additional capital when desired, our business, operating results, and financial condition may be adversely affected.
Operating Activities
Our operating activities have consisted of net loss adjusted for certain non-cash items and changes in assets and liabilities.
Cash provided by operating activities in fiscal
2016
was
$658.1 million
, an
increase
of
$307.8 million
compared to fiscal
2015
. The increase was due to growth of our business and changes in our assets and liabilities during fiscal
2016
, which included an increase in sales of subscription and support and maintenance contracts to new and existing customers as reflected by an increase in deferred revenue, and was partially offset by an increase in accounts receivable due to an increase in sales near the end of the period.
Cash provided by operating activities in fiscal 2015 was $350.3 million, an increase of $261.9 million compared to fiscal 2014. The increase was due to growth of our business and changes in our assets and liabilities during fiscal 2015. Additionally, in fiscal 2014, we made a total of $95.0 million in payments related to legal settlements. Changes in assets and liabilities for fiscal 2015 compared to fiscal 2014 include an increase in sales of subscriptions and support and maintenance contracts to new and existing customers as reflected by an increase in deferred revenue. In addition, during fiscal 2015, we made a tax payment of $12.8 million in connection with an intercompany transfer of intellectual property.
Investing Activities
Our investing activities have consisted of capital expenditures, net investment purchases, sales, and maturities, and business acquisitions. We expect to continue such activities as our business grows.
Cash used in investing activities during fiscal
2016
was
$338.9 million
, a decrease of
$340.1 million
compared to fiscal
2015
, due to lower net purchases of available-for-sale investments and a payment of $15.1 million related to our acquisition of CirroSecure in fiscal 2015, partially offset by increased investment in infrastructure and facilities to support the growth of our business.
Cash used in investing activities during fiscal 2015 was $679.0 million, an increase of $358.7 million compared to fiscal 2014. The increase was due to higher net purchases of available-for-sale investments in fiscal 2015, partially offset by higher payments made in fiscal 2014 related to our acquisitions of Cyvera and Morta.
Financing Activities
Our financing activities have consisted of proceeds from the issuance of the Notes and proceeds from sales of shares through employee equity incentive plans.
Cash provided by financing activities during fiscal
2016
was
$39.4 million
, a
decrease
of
$11.3 million
compared to fiscal
2015
, due to a payment of deferred consideration related to our acquisition of Cyvera, lower proceeds from the sale of shares through employee equity incentive plans, and a decrease in excess tax benefit from share-based compensation arrangements.
Cash provided by financing activities during fiscal 2015 was $50.7 million, a decrease of $524.4 million compared to fiscal 2014. The
decrease
was due to net proceeds from the issuance of the Notes of $527.7 million in fiscal 2014.
Contractual Obligations and Commitments
The following summarizes our contractual obligations and commitments as of
July 31, 2016
:
|
Payments Due by Period
|
|||||||||||||||||||
|
Total
|
Less Than 1
Year |
1 - 3 Years
|
3- 5 Years
|
More Than 5
Years |
|||||||||||||||
|
(in millions)
|
|||||||||||||||||||
|
0.0% Convertible Senior Notes due 2019
|
$
|
575.0
|
|
$
|
—
|
|
$
|
575.0
|
|
$
|
—
|
|
$
|
—
|
|
||||
|
Operating lease obligations
(1)
|
509.3
|
|
27.3
|
|
79.5
|
|
103.9
|
|
298.6
|
|
|||||||||
|
Purchase obligations
(2)
|
54.2
|
|
54.2
|
|
—
|
|
—
|
|
—
|
|
|||||||||
|
Total
(3)
|
$
|
1,138.5
|
|
$
|
81.5
|
|
$
|
654.5
|
|
$
|
103.9
|
|
$
|
298.6
|
|
||||
-
47
-
______________
|
(1)
|
Consists of contractual obligations from our non-cancelable operating leases. Excludes contractual sublease proceeds of
$5.1 million
, of which $
3.0 million
will be received in less than one year and
$2.1 million
will be received in one to two years. Refer to Note
8
. Commitments and Contingencies of Notes to Consolidated Financial Statements included in Part II, Item 8 of this Annual Report on Form 10-K for more information on our operating leases.
|
|
(2)
|
Consists of minimum purchase commitments of products and components with our independent contract manufacturer and original design manufacturers. Obligations under contracts that we can cancel without a significant penalty are not included in the table above.
|
|
(3)
|
No amounts related to income taxes are included. As of
July 31, 2016
, we had approximately $
48.4 million
of tax liabilities recorded related to uncertainty in income tax positions.
|
Off-Balance Sheet Arrangements
Through
July 31, 2016
, we did not have any relationships with unconsolidated organizations or financial partnerships, such as structured finance or special purpose entities that would have been established for the purpose of facilitating off-balance sheet arrangements or other contractually narrow or limited purposes.
Critical Accounting Estimates
Our consolidated financial statements have been prepared in accordance with U.S. GAAP. The preparation of these consolidated financial statements requires us to make estimates and assumptions that affect the reported amounts of assets, liabilities, revenue, expenses, and related disclosures. We base our estimates on historical experience and on various other assumptions that we believe are reasonable under the circumstances. We evaluate our estimates and assumptions on an ongoing basis. Actual results may differ from these estimates. To the extent that there are material differences between these estimates and our actual results, our future financial statements will be affected.
The critical accounting policies requiring estimates, assumptions, and judgments that we believe have the most significant impact on our consolidated financial statements are described below.
Revenue Recognition
We recognize revenue when persuasive evidence of an arrangement exists, delivery has occurred, the fee is fixed or determinable, and collectability is reasonably assured. Most of our arrangements, other than renewals of subscriptions and support and maintenance, are multiple-element arrangements with a combination of hardware, software, subscriptions, support and maintenance, and other services. For multiple-element arrangements, we allocate revenue to each unit of accounting based on an estimated selling price at the arrangement inception. The estimated selling price for each element is based upon the following hierarchy:
|
•
|
Vendor-specific objective evidence (“VSOE”) of selling price, if available,
|
|
•
|
Third-party evidence (“TPE”) of selling price, if VSOE of selling price is not available, or
|
|
•
|
Best estimate of selling price (“BESP”), if neither VSOE of selling price nor TPE of selling price are available.
|
We establish VSOE of selling price using the prices charged for a deliverable when sold separately. We establish TPE of selling price by evaluating similar and interchangeable competitor products or services in standalone arrangements with similarly situated partners. We establish BESP primarily based on historical transaction pricing, whereby historical transactions are segregated based on our pricing model and our go-to-market strategy, which include factors such as type of sales channel (reseller, distributor, or end-customer), the geographies in which our products and services were sold (domestic or international), and offering type (products or services). To further support the best estimate of selling price as determined by the historical transaction pricing or when such information is unavailable, such as when there are limited sales of a new product or service, we consider the same factors we have established through our pricing model and go-to-market strategy. The determination of BESP is made through consultation with and approval by our management. In determining BESP, we rely on certain assumptions and apply significant judgment. As our business offerings evolve over time, we may be required to modify our estimated selling prices in subsequent periods, and the timing of our revenue recognition could be affected.
Share-Based Compensation
Compensation expense related to share-based transactions is measured and recognized in the financial statements based on fair value estimated on the grant date. The fair value of restricted stock units (“RSUs”) and restricted stock awards (“RSAs”) is based on the closing market price of our common stock on the date of grant. The fair value of stock options and shares sold
-
48
-
through our employee stock purchase plan (“ESPP”) are estimated on the grant date using the Black-Scholes option pricing model, which requires the use of subjective assumptions, including the expected term of the award and the expected volatility of the price of our common stock.
We recognize share-based compensation expense on a straight-line basis over the requisite service periods of the awards, net of estimated forfeitures. Our estimated forfeiture rate is based on an analysis of our actual historical forfeitures. A change in our estimated forfeiture rate could have a significant impact on our share-based compensation expense as the cumulative effect of adjusting the rate is recognized in the period the forfeiture estimate is changed.
We will continue to use judgment in evaluating the assumptions related to our share-based compensation expense on a prospective basis. As we continue to accumulate additional data, we may have refinements to our estimates, which could materially impact our future share-based compensation expense.
Income Taxes
We account for income taxes using the asset and liability method, which requires the recognition of deferred tax assets and liabilities for the expected future tax consequences of events that have been recognized in our financial statements or tax returns. In addition, deferred tax assets are recorded for the future benefit of utilizing net operating losses and research and development credit carryforwards. Valuation allowances are provided when necessary to reduce deferred tax assets to the amount expected to be realized.
Significant judgment is required in determining any valuation allowance recorded against deferred tax assets. In assessing the need for a valuation allowance, we consider all available evidence, including past operating results, estimates of future taxable income, and the feasibility of tax planning strategies. In the event that we change our determination as to the amount of deferred tax assets that can be realized, we will adjust our valuation allowance with a corresponding impact to the provision for income taxes in the period in which such determination is made.
We apply the authoritative accounting guidance prescribing a threshold and measurement attribute for the financial recognition and measurement of a tax position taken or expected to be taken in a tax return. We recognize liabilities for uncertain tax positions based on a two-step process. The first step is to evaluate the tax position for recognition by determining if the weight of available evidence indicates that it is more likely than not that the position will be sustained on audit, including resolution of related appeals or litigation processes, if any. The second step requires us to estimate and measure the tax benefit as the largest amount that is more likely than not to be realized upon ultimate settlement.
Significant judgment is also required in evaluating our uncertain tax positions and determining our provision for income taxes. Although we believe our reserves are reasonable, no assurance can be given that the final tax outcome of these matters will not be different from that which is reflected in our historical income tax provisions and accruals. We adjust these reserves in light of changing facts and circumstances, such as the closing of a tax audit or the refinement of an estimate. To the extent that the final tax outcome of these matters is different than the amounts recorded, such differences may impact the provision for income taxes in the period in which such determination is made.
Contract Manufacturer Liabilities
We outsource most of our manufacturing, repair, and supply chain management operations to our independent contract manufacturer, which procures components and assembles our products based on our demand forecasts. These forecasts of future demand are based upon historical trends and analysis from our sales and product management functions as adjusted for overall market conditions. We accrue for costs for manufacturing commitments in excess of our forecasted demand, including costs for excess components or for carrying costs incurred by our contract manufacturer. Actual component usage and product demand may be materially different from our forecast, and could be caused by factors outside of our control, which could have an adverse impact on our results of operations. To date, we have not accrued significant costs associated with this exposure.
Loss Contingencies
We are subject to the possibility of various loss contingencies arising in the ordinary course of business. We accrue for loss contingencies when it is probable that an asset has been impaired or a liability has been incurred and the amount of loss can be reasonably estimated. If we determine that a loss is possible and the range of the loss can be reasonably determined, then we disclose the range of the possible loss. We regularly evaluate current information available to us to determine whether an accrual is required, an accrual should be adjusted or a range of possible loss should be disclosed.
From time to time, we are involved in disputes, litigation, and other legal actions. However, there are many uncertainties associated with any litigation, and these actions or other third-party claims against us may cause us to incur substantial settlement charges, which are inherently difficult to estimate and could adversely affect our results of operations. The actual liability in any
-
49
-
such matters may be materially different from our estimates, which could result in the need to adjust our liability and record additional expenses.
Goodwill, Intangibles, and Other Long-Lived Assets
We make significant estimates, assumptions, and judgments when valuing goodwill and other purchased intangible assets in connection with the initial purchase price allocation of an acquired entity, as well as when evaluating impairment of goodwill and other purchased intangible assets on an ongoing basis. These estimates are based upon a number of factors, including historical experience, market conditions, and information obtained from the management of the acquired company. Critical estimates in valuing certain intangible assets include, but are not limited to, cash flows that an asset is expected to generate in the future, discount rates, the time and expense that would be necessary to recreate the assets, and the profit margin a market participant would receive. The amounts and useful lives assigned to identified intangible assets impacts the amount and timing of future amortization expense.
We evaluate goodwill for impairment on an annual basis in our fourth fiscal quarter or more frequently if we believe impairment indicators exist. We first analyze qualitative factors, which include industry and market considerations, overall financial performance, and other relevant events and factors affecting the reporting unit. If qualitative factors indicate that it is more likely than not that the reporting unit’s fair value is less than its carrying amount, then we will perform the quantitative analysis required under the two-step goodwill impairment test.
Under the two-step goodwill impairment test, we first compare the reporting unit’s carrying amount, including goodwill, to the fair value of the reporting unit. The fair value of the reporting unit is estimated using significant judgment based on a combination of the income and the market approaches. If the fair value of the reporting unit does not exceed the carrying amount of the net assets assigned to the reporting unit, then we perform the second step of the impairment test in order to determine the implied fair value of the reporting unit’s goodwill. When the carrying amount of a reporting unit’s goodwill exceeds its implied fair value, we record an impairment loss equal to the difference. Determining the fair value of a reporting unit is highly judgmental in nature and involves the use of significant estimates and assumptions. These estimates and assumptions include revenue growth rates and operating margins used to calculate projected future cash flows, operating trends, risk-adjusted discount rates, future economic and market conditions, and determination of appropriate market comparables. We base our fair value estimates on assumptions we believe to be reasonable but that are unpredictable and inherently uncertain. Actual future results may differ from those estimates.
We evaluate long-lived assets, such as property, equipment, and purchased intangible assets for impairment whenever events or changes in circumstances indicate that the carrying amount of the assets may not be recoverable. Such events or changes in circumstances include, but are not limited to, a significant decrease in the fair value of the underlying asset or asset group, a significant decrease in the benefits realized from the acquired assets, difficulty and delays in integrating the business, or a significant change in the operations of the acquired assets or use of an asset. A long-lived asset is considered impaired if its carrying amount exceeds the estimated future undiscounted cash flows the asset or asset group is expected to generate. If a long-lived asset is considered to be impaired, the impairment to be recognized is the amount by which the carrying amount of the asset exceeds the fair value of the asset or asset group.
To date, we have not recognized any impairment losses on our goodwill, intangible assets, and long-lived assets.
Recent Accounting Pronouncements
Refer to “Recent Accounting Pronouncements” in Note 1. Description of Business and Summary of Significant Accounting Policies of Notes to Consolidated Financial Statements included in Part II, Item 8 of this Annual Report on Form 10-K.
|
ITEM 7A.
|
QUANTITATIVE AND QUALITATIVE DISCLOSURES ABOUT MARKET RISK
|
Foreign Currency Exchange Risk
Our sales contracts are primarily denominated in U.S. dollars. A portion of our operating expenses are incurred outside of the United States and are denominated in foreign currencies and are subject to fluctuations due to changes in foreign currency exchange rates, particularly changes in the euro, British pound, Singapore dollar, Israeli shekel, and Japanese yen. Additionally, fluctuations in foreign currency exchange rates may cause us to recognize transaction gains and losses in our statement of operations. The effect of an immediate 10% adverse change in foreign exchange rates on monetary assets and liabilities at
July 31, 2016
would not be material to our financial condition or results of operations. As of
July 31, 2016
, foreign currency transaction gains and losses and exchange rate fluctuations have not been material to our financial statements. On August 30, 2016, in an effort to reduce our foreign currency exchange exposure related to our euro-dominated expenditures for the fiscal year ending July 31, 2017, we entered into forward contracts with a notional amount of €66.9 million. The effectiveness of our existing hedging transactions and the availability and
-
50
-
effectiveness of any hedging transactions we may decide to enter into in the future may be limited and we may not be able to successfully hedge our exposure, which could adversely affect our financial condition and operating results.
As our international operations grow, our risks associated with fluctuation in currency rates will become greater, and we will continue to reassess our approach to managing this risk. In addition, a weakening U.S. dollar can increase the costs of our international expansion and a strengthening U.S. dollar can increase the real cost of our products to our end-customers outside of the United States, leading to delays in the purchase of our products and services. For additional information, see the risk factor entitled “We are exposed to fluctuations in currency exchange rates, which could negatively affect our financial condition and operating results” in Part 1, Item 1A of this Annual Report on Form 10-K.
Interest Rate Risk
The primary objectives of our investment activities are to preserve principal, provide liquidity, and maximize income without significantly increasing risk. Some of the securities we invest in are subject to interest risk. To minimize this risk, we maintain our portfolio of cash, cash equivalents, and short-term investments in a variety of securities, including commercial paper, money market funds, U.S. government and agency securities, and corporate debt securities. Due to the short duration and conservative nature of our investment portfolio, a movement of 10% in market interest rates would not have a material impact on our operating results and the total value of the portfolio. The effect of an immediate 10% change in interest rates at
July 31, 2016
would not have been material to our operating results and the total value of the portfolio assuming consistent investment levels.
Market Risk and Market Interest Risk
In June 2014, we issued $575.0 million aggregate principal amount of 0.0% Convertible Senior Notes due 2019 (the “Notes”). We carry this instrument at face value less unamortized discount on our balance sheet. As this instrument does not bear interest, we have no financial and economic interest exposure associated with changes in interest rates. However, the fair value of fixed rate instruments fluctuate when interest rates change, and additionally, in the case of the Notes, when the market price of our common stock fluctuates.
-
51
-
|
ITEM 8.
|
FINANCIAL STATEMENTS AND SUPPLEMENTARY DATA
|
INDEX TO CONSOLIDATED FINANCIAL STATEMENTS
-
52
-
REPORT OF INDEPENDENT REGISTERED PUBLIC ACCOUNTING FIRM
The Board of Directors and Stockholders
Palo Alto Networks, Inc.
We have audited the accompanying consolidated balance sheets of Palo Alto Networks, Inc. as of
July 31, 2016
and
2015
, and the related consolidated statements of operations, comprehensive loss, stockholders’ equity, and cash flows for each of the three years in the period ended
July 31, 2016
. These financial statements are the responsibility of the Company’s management. Our responsibility is to express an opinion on these financial statements based on our audits.
We conducted our audits in accordance with the standards of the Public Company Accounting Oversight Board (United States). Those standards require that we plan and perform the audit to obtain reasonable assurance about whether the financial statements are free of material misstatement. An audit includes examining, on a test basis, evidence supporting the amounts and disclosures in the financial statements. An audit also includes assessing the accounting principles used and significant estimates made by management, as well as evaluating the overall financial statement presentation. We believe that our audits provide a reasonable basis for our opinion.
In our opinion, the financial statements referred to above present fairly, in all material respects, the consolidated financial position of Palo Alto Networks, Inc. at
July 31, 2016
and
2015
, and the consolidated results of its operations and its cash flows for each of the three years in the period ended
July 31, 2016
, in conformity with U.S. generally accepted accounting principles.
We also have audited, in accordance with the standards of the Public Company Accounting Oversight Board (United States), Palo Alto Networks, Inc.’s internal control over financial reporting as of
July 31, 2016
, based on criteria established in Internal Control-Integrated Framework issued by the Committee of Sponsoring Organizations of the Treadway Commission (2013 framework) and our report dated
September 8, 2016
expressed an unqualified opinion thereon.
/s/ Ernst & Young LLP
San Jose, California
September 8, 2016
-
53
-
REPORT OF INDEPENDENT REGISTERED PUBLIC ACCOUNTING FIRM
The Board of Directors and Stockholders
Palo Alto Networks, Inc.
We have audited Palo Alto Networks, Inc.’s internal control over financial reporting as of
July 31, 2016
, based on criteria established in Internal Control-Integrated Framework issued by the Committee of Sponsoring Organizations of the Treadway Commission (2013 framework) (the COSO criteria). Palo Alto Networks, Inc.’s management is responsible for maintaining effective internal control over financial reporting, and for its assessment of the effectiveness of internal control over financial reporting included in the accompanying Management’s Report on Internal Control Over Financial Reporting. Our responsibility is to express an opinion on the company’s internal control over financial reporting based on our audit.
We conducted our audit in accordance with the standards of the Public Company Accounting Oversight Board (United States). Those standards require that we plan and perform the audit to obtain reasonable assurance about whether effective internal control over financial reporting was maintained in all material respects. Our audit included obtaining an understanding of internal control over financial reporting, assessing the risk that a material weakness exists, testing and evaluating the design and operating effectiveness of internal control based on the assessed risk, and performing such other procedures as we considered necessary in the circumstances. We believe that our audit provides a reasonable basis for our opinion.
A company’s internal control over financial reporting is a process designed to provide reasonable assurance regarding the reliability of financial reporting and the preparation of financial statements for external purposes in accordance with generally accepted accounting principles. A company’s internal control over financial reporting includes those policies and procedures that (1) pertain to the maintenance of records that, in reasonable detail, accurately and fairly reflect the transactions and dispositions of the assets of the company; (2) provide reasonable assurance that transactions are recorded as necessary to permit preparation of financial statements in accordance with generally accepted accounting principles, and that receipts and expenditures of the company are being made only in accordance with authorizations of management and directors of the company; and (3) provide reasonable assurance regarding prevention or timely detection of unauthorized acquisition, use, or disposition of the company’s assets that could have a material effect on the financial statements.
Because of its inherent limitations, internal control over financial reporting may not prevent or detect misstatements. Also, projections of any evaluation of effectiveness to future periods are subject to the risk that controls may become inadequate because of changes in conditions, or that the degree of compliance with the policies or procedures may deteriorate.
In our opinion, Palo Alto Networks, Inc. maintained, in all material respects, effective internal control over financial reporting as of
July 31, 2016
, based on the COSO criteria.
We also have audited, in accordance with the standards of the Public Company Accounting Oversight Board (United States), the consolidated balance sheets of Palo Alto Networks, Inc. as of
July 31, 2016
and
2015
, and the related consolidated statements of operations, comprehensive loss, stockholders’ equity, and cash flows for each of the three years in the period ended
July 31, 2016
of Palo Alto Networks, Inc. and our report dated
September 8, 2016
expressed an unqualified opinion thereon.
/s/ Ernst & Young LLP
San Jose, California
September 8, 2016
-
54
-
MANAGEMENT’S REPORT ON INTERNAL CONTROL OVER FINANCIAL REPORTING
Management’s Report on Internal Control Over Financial Reporting
The management of Palo Alto Networks, Inc. (the “Company”) is responsible for establishing and maintaining adequate internal control over financial reporting as defined in Rules 13a-15(f) and 15d-15(f) under the Securities Exchange Act of 1934 for the Company. The Company’s internal control over financial reporting is a process designed under the supervision of the Company’s principal executive and principal financial officers to provide reasonable assurance regarding the reliability of financial reporting and the preparation of the Company’s financial statements for external purposes in accordance with U.S. generally accepted accounting principles.
The Company’s internal control over financial reporting includes those policies and procedures that: (i) pertain to the maintenance of records that, in reasonable detail, accurately and fairly reflect the transactions and dispositions of the assets of the Company; (ii) provide reasonable assurance that transactions are recorded as necessary to permit preparation of financial statements in accordance with U.S. generally accepted accounting principles, and that receipts and expenditures of the Company are being made only in accordance with authorizations of management and directors of the Company; and (iii) provide reasonable assurance regarding prevention or timely detection of unauthorized acquisition, use, or disposition of the Company’s assets that could have a material effect on the Consolidated Financial Statements.
Because of its inherent limitations, internal control over financial reporting may not prevent or detect misstatements. Also, projections of any evaluation of effectiveness to future periods are subject to the risk that controls may become inadequate because of changes in conditions, or that the degree of compliance with the policies or procedures may deteriorate.
Management assessed the effectiveness of the Company’s internal control over financial reporting as of
July 31, 2016
, based on the framework set forth by the Committee of Sponsoring Organizations of the Treadway Commission (“COSO”) in Internal Control - Integrated Framework (2013 framework). Based on that assessment, management concluded that, as of
July 31, 2016
, the Company’s internal control over financial reporting was effective.
The effectiveness of the Company’s internal control over financial reporting as of
July 31, 2016
, has been audited by Ernst & Young LLP, the independent registered public accounting firm that audits the Company’s Consolidated Financial Statements, as stated in their report preceding this report, which expresses an unqualified opinion on the effectiveness of the Company’s internal control over financial reporting as of
July 31, 2016
.
-
55
-
PALO
ALTO NETWORKS, INC.
(In millions, except per share data)
|
July 31,
|
|||||||
|
2016
|
2015
|
||||||
|
Assets
|
|||||||
|
Current assets:
|
|||||||
|
Cash and cash equivalents
|
$
|
734.4
|
|
$
|
375.8
|
|
|
|
Short-term investments
|
551.2
|
|
413.2
|
|
|||
|
Accounts receivable, net of allowance for doubtful accounts of $2.4 and $0.7 at July 31, 2016 and July 31, 2015, respectively
|
348.7
|
|
212.4
|
|
|||
|
Prepaid expenses and other current assets
|
84.8
|
|
72.6
|
|
|||
|
Total current assets
|
1,719.1
|
|
1,074.0
|
|
|||
|
Property and equipment, net
|
117.2
|
|
62.9
|
|
|||
|
Long-term investments
|
652.8
|
|
538.8
|
|
|||
|
Goodwill
|
163.5
|
|
163.5
|
|
|||
|
Intangible assets, net
|
44.0
|
|
52.7
|
|
|||
|
Other assets
|
64.6
|
|
73.3
|
|
|||
|
Total assets
|
$
|
2,761.2
|
|
$
|
1,965.2
|
|
|
|
Liabilities, temporary equity, and stockholders’ equity
|
|||||||
|
Current liabilities:
|
|||||||
|
Accounts payable
|
$
|
30.2
|
|
$
|
13.2
|
|
|
|
Accrued compensation
|
73.5
|
|
79.8
|
|
|||
|
Accrued and other liabilities
|
39.2
|
|
28.2
|
|
|||
|
Deferred revenue
|
703.9
|
|
423.9
|
|
|||
|
Convertible senior notes, net
|
—
|
|
487.1
|
|
|||
|
Total current liabilities
|
846.8
|
|
1,032.2
|
|
|||
|
Convertible senior notes, net
|
508.2
|
|
—
|
|
|||
|
Long-term deferred revenue
|
536.9
|
|
289.8
|
|
|||
|
Other long-term liabilities
|
79.4
|
|
67.4
|
|
|||
|
Commitments and contingencies (Note 8)
|
|
|
|
|
|||
|
Temporary equity
|
—
|
|
87.9
|
|
|||
|
Stockholders’ equity:
|
|||||||
|
Preferred stock; $0.0001 par value; 100.0 shares authorized; none issued and outstanding at July 31, 2016 and July 31, 2015
|
—
|
|
—
|
|
|||
|
Common stock and additional paid-in capital; $0.0001 par value; 1,000.0 shares authorized; 90.5 and 84.8 shares issued and outstanding at July 31, 2016 and July 31, 2015, respectively
|
1,515.5
|
|
988.7
|
|
|||
|
Accumulated other comprehensive income (loss)
|
1.0
|
|
(0.1
|
)
|
|||
|
Accumulated deficit
|
(726.6
|
)
|
(500.7
|
)
|
|||
|
Total stockholders’ equity
|
789.9
|
|
487.9
|
|
|||
|
Total liabilities, temporary equity, and stockholders’ equity
|
$
|
2,761.2
|
|
$
|
1,965.2
|
|
|
See notes to consolidated financial statements.
-
56
-
PALO ALTO NETWORKS, INC.
(In millions, except per share data)
|
Year Ended July 31,
|
|||||||||||
|
2016
|
2015
|
2014
|
|||||||||
|
Revenue:
|
|||||||||||
|
Product
|
$
|
670.8
|
|
$
|
492.7
|
|
$
|
340.1
|
|
||
|
Services
|
707.7
|
|
435.4
|
|
258.1
|
|
|||||
|
Total revenue
|
1,378.5
|
|
928.1
|
|
598.2
|
|
|||||
|
Cost of revenue:
|
|||||||||||
|
Product
|
175.4
|
|
131.1
|
|
85.5
|
|
|||||
|
Services
|
194.6
|
|
120.4
|
|
74.1
|
|
|||||
|
Total cost of revenue
|
370.0
|
|
251.5
|
|
159.6
|
|
|||||
|
Total gross profit
|
1,008.5
|
|
676.6
|
|
438.6
|
|
|||||
|
Operating expenses:
|
|||||||||||
|
Research and development
|
284.2
|
|
185.8
|
|
104.8
|
|
|||||
|
Sales and marketing
|
776.0
|
|
522.7
|
|
334.8
|
|
|||||
|
General and administrative
|
138.4
|
|
101.6
|
|
73.1
|
|
|||||
|
Legal settlement (Note 9)
|
—
|
|
—
|
|
141.2
|
|
|||||
|
Total operating expenses
|
1,198.6
|
|
810.1
|
|
653.9
|
|
|||||
|
Operating loss
|
(190.1
|
)
|
(133.5
|
)
|
(215.3
|
)
|
|||||
|
Interest expense
|
(23.4
|
)
|
(22.3
|
)
|
(1.9
|
)
|
|||||
|
Other income (expense), net
|
8.4
|
|
0.2
|
|
(5.0
|
)
|
|||||
|
Loss before income taxes
|
(205.1
|
)
|
(155.6
|
)
|
(222.2
|
)
|
|||||
|
Provision for income taxes
|
20.8
|
|
9.4
|
|
4.3
|
|
|||||
|
Net loss
|
$
|
(225.9
|
)
|
$
|
(165.0
|
)
|
$
|
(226.5
|
)
|
||
|
Net loss per share, basic and diluted
|
$
|
(2.59
|
)
|
$
|
(2.02
|
)
|
$
|
(3.05
|
)
|
||
|
Weighted-average shares used to compute net loss per share, basic and diluted
|
87.1
|
|
81.6
|
|
74.3
|
|
|||||
See notes to consolidated financial statements .
-
57
-
PALO ALTO NETWORKS, INC.
CONSOLIDATED STATEMENTS OF COMPREHENSIVE LOSS
(In millions)
|
Year Ended July 31,
|
|||||||||||
|
2016
|
2015
|
2014
|
|||||||||
|
Net loss
|
$
|
(225.9
|
)
|
$
|
(165.0
|
)
|
$
|
(226.5
|
)
|
||
|
Other comprehensive income (loss), net of tax:
|
|||||||||||
|
Change in unrealized gains (losses) on investments
|
1.1
|
|
—
|
|
(0.1
|
)
|
|||||
|
Comprehensive loss
|
$
|
(224.8
|
)
|
$
|
(165.0
|
)
|
$
|
(226.6
|
)
|
||
See notes to consolidated financial statements
.
-
58
-
PALO ALTO NETWORKS, INC.
CONSOLIDATED STATEMENTS OF STOCKHOLDERS’ EQUITY
(In millions)
|
|
Common Stock
and
Additional Paid-In Capital
|
Accumulated
Other
Comprehensive Income (Loss)
|
Accumulated
Deficit
|
Total
Stockholders’
Equity
|
||||||||||||||
|
|
Shares
|
Amount
|
||||||||||||||||
|
Balance as of July 31, 2013
|
71.6
|
|
$
|
381.6
|
|
$
|
—
|
|
$
|
(109.2
|
)
|
$
|
272.4
|
|
||||
|
Net loss
|
—
|
|
—
|
|
—
|
|
(226.5
|
)
|
(226.5
|
)
|
||||||||
|
Other comprehensive loss
|
—
|
|
—
|
|
(0.1
|
)
|
—
|
|
(0.1
|
)
|
||||||||
|
Issuance of common stock in connection with employee equity incentive plans and related excess tax benefit
|
4.8
|
|
48.0
|
|
—
|
|
—
|
|
48.0
|
|
||||||||
|
Share-based compensation for equity based awards
|
—
|
|
99.8
|
|
—
|
|
—
|
|
99.8
|
|
||||||||
|
Issuance of common stock in connection with legal settlement
|
1.5
|
|
113.3
|
|
—
|
|
—
|
|
113.3
|
|
||||||||
|
Issuance of common stock in connection with acquisition
|
1.6
|
|
87.5
|
|
—
|
|
—
|
|
87.5
|
|
||||||||
|
Equity component of convertible senior notes, net
|
—
|
|
106.9
|
|
—
|
|
—
|
|
106.9
|
|
||||||||
|
Purchase of convertible senior note hedges
|
—
|
|
(111.0
|
)
|
—
|
|
—
|
|
(111.0
|
)
|
||||||||
|
Issuance of warrants
|
—
|
|
78.3
|
|
—
|
|
—
|
|
78.3
|
|
||||||||
|
Balance as of July 31, 2014
|
79.5
|
|
|
804.4
|
|
|
(0.1
|
)
|
|
(335.7
|
)
|
|
468.6
|
|
||||
|
Net loss
|
—
|
|
—
|
|
—
|
|
(165.0
|
)
|
(165.0
|
)
|
||||||||
|
Issuance of common stock in connection with employee equity incentive plans and related excess tax benefit
|
5.3
|
|
50.9
|
|
—
|
|
—
|
|
50.9
|
|
||||||||
|
Share-based compensation for equity based awards
|
—
|
|
221.3
|
|
—
|
|
—
|
|
221.3
|
|
||||||||
|
Temporary equity reclassification
|
—
|
|
(87.9
|
)
|
—
|
|
—
|
|
(87.9
|
)
|
||||||||
|
Balance as of July 31, 2015
|
84.8
|
|
988.7
|
|
(0.1
|
)
|
(500.7
|
)
|
487.9
|
|
||||||||
|
Net loss
|
—
|
|
—
|
|
—
|
|
(225.9
|
)
|
(225.9
|
)
|
||||||||
|
Other comprehensive income
|
—
|
|
—
|
|
1.1
|
|
—
|
|
1.1
|
|
||||||||
|
Issuance of common stock in connection with employee equity incentive plans and related excess tax benefit
|
5.7
|
|
45.8
|
|
—
|
|
—
|
|
45.8
|
|
||||||||
|
Share-based compensation for equity based awards
|
—
|
|
393.1
|
|
—
|
|
—
|
|
393.1
|
|
||||||||
|
Temporary equity reclassification
|
—
|
|
87.9
|
|
—
|
|
—
|
|
87.9
|
|
||||||||
|
Balance as of July 31, 2016
|
90.5
|
|
$
|
1,515.5
|
|
$
|
1.0
|
|
$
|
(726.6
|
)
|
$
|
789.9
|
|
||||
See notes to consolidated financial statements.
-
59
-
PALO ALTO NETWORKS, INC.
(In millions)
|
Year Ended July 31,
|
|||||||||||
|
2016
|
2015
|
2014
|
|||||||||
|
Cash flows from operating activities
|
|||||||||||
|
Net loss
|
$
|
(225.9
|
)
|
$
|
(165.0
|
)
|
$
|
(226.5
|
)
|
||
|
Adjustments to reconcile net loss to net cash provided by operating activities:
|
|||||||||||
|
Share-based compensation for equity based awards
|
392.8
|
|
221.3
|
|
99.8
|
|
|||||
|
Issuance of common stock for legal settlement
|
—
|
|
—
|
|
46.2
|
|
|||||
|
Depreciation and amortization
|
42.8
|
|
28.9
|
|
19.4
|
|
|||||
|
Amortization of investment premiums, net of accretion of purchase discounts
|
3.0
|
|
3.2
|
|
1.5
|
|
|||||
|
Amortization of debt discount and debt issuance costs
|
23.4
|
|
22.3
|
|
1.8
|
|
|||||
|
Change in fair value of common stock warrant
|
—
|
|
—
|
|
5.9
|
|
|||||
|
Excess tax benefit from share-based compensation arrangements
|
(0.5
|
)
|
(2.5
|
)
|
(1.0
|
)
|
|||||
|
Changes in operating assets and liabilities, net of effects of acquisitions:
|
|||||||||||
|
Accounts receivable, net
|
(136.4
|
)
|
(76.8
|
)
|
(47.9
|
)
|
|||||
|
Prepaid expenses and other assets
|
2.6
|
|
(34.2
|
)
|
(10.3
|
)
|
|||||
|
Accounts payable
|
15.1
|
|
(3.5
|
)
|
(1.1
|
)
|
|||||
|
Accrued compensation
|
(6.3
|
)
|
31.1
|
|
26.3
|
|
|||||
|
Accrued and other liabilities
|
20.4
|
|
34.5
|
|
1.1
|
|
|||||
|
Deferred revenue
|
527.1
|
|
291.0
|
|
173.2
|
|
|||||
|
Net cash provided by operating activities
|
658.1
|
|
350.3
|
|
88.4
|
|
|||||
|
Cash flows from investing activities
|
|||||||||||
|
Purchases of investments
|
(1,037.0
|
)
|
(987.6
|
)
|
(506.6
|
)
|
|||||
|
Proceeds from sales of investments
|
141.9
|
|
18.5
|
|
74.6
|
|
|||||
|
Proceeds from maturities of investments
|
628.7
|
|
339.0
|
|
233.5
|
|
|||||
|
Business acquisitions, net of cash acquired
|
—
|
|
(15.1
|
)
|
(85.7
|
)
|
|||||
|
Purchases of property, equipment, and other assets
|
(72.5
|
)
|
(33.8
|
)
|
(36.1
|
)
|
|||||
|
Net cash used in investing activities
|
(338.9
|
)
|
(679.0
|
)
|
(320.3
|
)
|
|||||
|
Cash flows from financing activities
|
|||||||||||
|
Proceeds from borrowings on convertible senior notes, net
|
—
|
|
—
|
|
560.4
|
|
|||||
|
Proceeds from issuance of warrants
|
—
|
|
—
|
|
78.3
|
|
|||||
|
Purchase of convertible note hedges
|
—
|
|
—
|
|
(111.0
|
)
|
|||||
|
Proceeds from sales of shares through employee equity incentive plans
|
45.3
|
|
48.2
|
|
46.4
|
|
|||||
|
Excess tax benefit from share-based compensation arrangements
|
0.5
|
|
2.5
|
|
1.0
|
|
|||||
|
Payment of deferred consideration related to prior year business acquisition
|
(6.4
|
)
|
—
|
|
—
|
|
|||||
|
Net cash provided by financing activities
|
39.4
|
|
50.7
|
|
575.1
|
|
|||||
|
Net increase (decrease) in cash and cash equivalents
|
358.6
|
|
(278.0
|
)
|
343.2
|
|
|||||
|
Cash and cash equivalents—beginning of period
|
375.8
|
|
653.8
|
|
310.6
|
|
|||||
|
Cash and cash equivalents—end of period
|
$
|
734.4
|
|
$
|
375.8
|
|
$
|
653.8
|
|
||
|
Supplemental disclosures of cash flow information
|
|||||||||||
|
Cash paid for income taxes
|
$
|
7.1
|
|
$
|
17.5
|
|
$
|
1.5
|
|
||
|
Cash paid for interest
|
$
|
—
|
|
$
|
0.1
|
|
$
|
—
|
|
||
|
Non-cash investing and financing activities
|
|||||||||||
|
Issuance of common stock in connection with acquisition
|
$
|
—
|
|
$
|
—
|
|
$
|
87.5
|
|
||
See notes to consolidated financial statements
.
-
60
-
NOTES TO CONSOLIDATED FINANCIAL STATEMENTS
1. Description of Business and Summary of Significant Accounting Policies
Description of Business
Palo Alto Networks, Inc. (the “Company,” “we,” “us,” or “our”), located in Santa Clara, California, was incorporated in March 2005 under the laws of the State of Delaware and commenced operations in April 2005. We offer a next-generation security platform that empowers enterprises, service providers, and government entities to secure their organizations by safely enabling applications running on their networks and by preventing breaches that stem from targeted cyber attacks.
Basis of Presentation
The accompanying consolidated financial statements have been prepared in conformity with U.S. generally accepted accounting principles (“GAAP”). The consolidated financial statements include all adjustments necessary for a fair presentation of our annual results. All adjustments are of a normal recurring nature. Certain prior period amounts have been reclassified to conform with current period presentation.
Principles of Consolidation
The consolidated financial statements include our accounts and our wholly owned subsidiaries. All significant intercompany balances and transactions have been eliminated in consolidation.
Use of Estimates
The preparation of consolidated financial statements in conformity with U.S. GAAP requires management to make estimates and assumptions that affect the reported amounts of assets and liabilities and disclosure of contingent assets and liabilities at the date of the consolidated financial statements and the reported amounts of revenues and expenses during the reporting period. Such management estimates include, but are not limited to the best estimate of selling price for our products and services, share-based compensation, fair value of assets acquired and liabilities assumed in business combinations, the assessment of recoverability of our property and equipment, identified intangibles and goodwill, future taxable income, contract manufacturer liabilities, and loss contingencies. We base our estimates on historical experience and also on assumptions that we believe are reasonable. Actual results could differ materially from those estimates.
Concentrations
Financial instruments that subject us to concentrations of credit risk consist primarily of cash and cash equivalents, investments, and accounts receivable.
We invest only in high-quality credit instruments and maintain our cash and cash equivalents and available-for-sale investments in fixed income securities. Management believes that the financial institutions that hold our investments are financially sound and, accordingly, are subject to minimal credit risk. Deposits held with banks may exceed the amount of insurance provided on such deposits.
Our accounts receivables are primarily derived from our distributors representing various geographical locations. We perform ongoing credit evaluations and generally do not require collateral on accounts receivable. We maintain an allowance for doubtful accounts for estimated potential credit losses. As of
July 31, 2016
,
four
distributors represented
26.1%
,
25.6%
,
11.4%
, and
11.0%
of our gross accounts receivable. For fiscal
2016
,
two
distributors represented
31.0%
and
27.2%
of our total revenue. We rely on an independent contract manufacturer to assemble most of our products and sole suppliers for a certain number of our components.
Comprehensive Loss
Comprehensive loss is comprised of net loss and other comprehensive income (loss). Unrealized gains and losses on available-for-sale investments are included in our other comprehensive income (loss).
Foreign Currency Transactions
The functional currency of our foreign subsidiaries is the U.S. dollar. Monetary assets and liabilities denominated in foreign currencies have been remeasured into U.S. dollars using the exchange rates in effect at the balance sheet dates. Foreign currency denominated income and expenses have been remeasured using the average exchange rates in effect during each period. Foreign currency remeasurement gains and losses and foreign currency transaction gains and losses are not significant to the financial statements.
-
61
-
Cash and Cash Equivalents
We consider all highly liquid investments held at financial institutions, such as commercial paper, money market funds, and other money market securities with original maturities of three months or less at date of purchase to be cash equivalents.
Fair Value
We define fair value as the price that would be received from selling an asset or paid to transfer a liability in an orderly transaction between market participants at the measurement date. When determining the fair value measurements for assets and liabilities which are required to be recorded at fair value, we consider the principal or most advantageous market in which to transact and the market-based risk. We apply fair value accounting for all financial assets and liabilities that are recognized or disclosed at fair value in the financial statements on a recurring basis. The carrying amounts reported in the consolidated financial statements approximate the fair value for cash and cash equivalents, accounts receivable, accounts payable, and accrued liabilities, due to their short-term nature.
Investments
We classify our investments as available-for-sale at the time of purchase since it is our intent that these investments are available for current operations, and include these investments on our consolidated balance sheet as either short-term or long-term investments depending on their maturity. Investments not considered cash equivalents and with maturities one year or less from the consolidated balance sheet date are classified as short-term investments. Investments with maturities greater than one year from the consolidated balance sheet date are classified as long-term investments.
Investments are considered impaired when a decline in fair value is judged to be other-than-temporary. We consult with our investment managers and consider available quantitative and qualitative evidence in evaluating potential impairment of our investments on a quarterly basis. If the cost of an individual investment exceeds its fair value, we evaluate, among other factors, general market conditions, the duration and extent to which the fair value is less than cost, and our intent and ability to hold the investment. Once a decline in fair value is determined to be other-than-temporary, an impairment charge is recorded and a new cost basis in the investment is established.
Accounts Receivable
Trade accounts receivable are recorded at the invoiced amount, net of allowances for doubtful accounts. The allowance for doubtful accounts is based on our assessment of the collectability of accounts. Management regularly reviews the adequacy of the allowance for doubtful accounts by considering the age of each outstanding invoice, each channel partner’s expected ability to pay, and the collection history with each channel partner, when applicable, to determine whether a specific allowance is appropriate. Accounts receivable deemed uncollectible are charged against the allowance for doubtful accounts when identified. As of
July 31, 2016
and
2015
, the allowance for doubtful accounts activity was not significant.
Property and Equipment
Property and equipment are recorded at cost. Depreciation is computed using the straight-line method over the estimated useful lives of the assets, generally
three
to
ten
years. Leasehold improvements are depreciated over the shorter of the estimated useful lives of the improvements or the remaining lease term.
Business Combinations
We include the results of operations of the businesses that we acquire as of the respective dates of acquisition. We allocate the fair value of the purchase price of our acquisitions to the tangible assets acquired, liabilities assumed, and intangible assets acquired, based on their estimated fair values. The excess of the purchase price over the fair values of these identifiable assets and liabilities is recorded as goodwill. Additional information existing as of the acquisition date but unknown to us may become known during the remainder of the measurement period, not to exceed 12 months from the acquisition date, which may result in changes to the amounts and allocations recorded.
Amortization of Intangible Assets
Purchased intangible assets with finite lives are carried at cost, less accumulated amortization. Amortization is computed over the estimated useful lives of the respective assets. Acquisition-related in-process research and development represents the fair value of incomplete research and development projects that have not reached technological feasibility as of the date of acquisition. Initially, these assets are not subject to amortization. Assets related to projects that have been completed are transferred to developed technology, which are subject to amortization.
-
62
-
Impairment of Goodwill, Intangible Assets, and Long-Lived Assets
Goodwill is evaluated for impairment on an annual basis in the fourth quarter of our fiscal year, and whenever events or changes in circumstances indicate the carrying amount of goodwill may not be recoverable. We have elected to first assess qualitative factors to determine whether it is more likely than not that the fair value of our single reporting unit is less than its carrying amount. If we determine that it is more likely than not that the fair value of our single reporting unit is less than its carrying amount, then the two-step goodwill impairment test will be performed. The first step, identifying a potential impairment, compares the fair value of our single reporting unit with its carrying amount. If the carrying amount exceeds its fair value, the second step will be performed; otherwise, no further step is required. The second step, measuring the impairment loss, compares the implied fair value of the goodwill with the carrying amount of the goodwill. Any excess of the goodwill carrying amount over the implied fair value is recognized as an impairment loss.
We evaluate events and changes in circumstances that could indicate carrying amounts of purchased intangible assets and long-lived assets may not be recoverable. When such events or changes in circumstances occur, we assess the recoverability of these assets by determining whether or not the carrying amount will be recovered through undiscounted expected future cash flows. If the total of the future undiscounted cash flows is less than the carrying amount of an asset, we record an impairment loss for the amount by which the carrying amount of the asset exceeds the fair value of the asset.
Through
July 31, 2016
, we have not recognized any impairment losses on our goodwill, intangible assets, and long-lived assets.
Contract Manufacturer Liabilities
We outsource most of our manufacturing, repair, and supply chain management operations to our independent contract manufacturer and payments to it are a significant portion of our product cost of revenues. Although we could be contractually obligated to purchase manufactured products, we generally do not own the manufactured products. Product title transfers from our independent contract manufacturer to us and immediately to our channel partners upon shipment. Our independent contract manufacturer assembles our products using design specifications, quality assurance programs, and standards that we establish and it procures components and assembles our products based on our demand forecasts. These forecasts represent our estimates of future demand for our products based upon historical trends and analysis from our sales and product management functions as adjusted for overall market conditions. If the actual component usage and product demand are significantly lower than forecast, we accrue for costs for contractual manufacturing commitments in excess of our forecasted demand including costs for excess components or for carrying costs incurred by our contract manufacturer. Through
July 31, 2016
, we have not accrued any significant costs associated with this exposure.
Convertible Senior Notes
On June 30, 2014, we issued
$575.0 million
aggregate principal amount of
0.0%
Convertible Senior Notes due 2019 (the “Notes”). In accounting for the issuance of the Notes, we separated the Notes into liability and equity components. The carrying amount of the liability component was calculated by measuring the fair value of a similar liability that does not have an associated convertible feature. The carrying amount of the equity component representing the conversion option was determined by deducting the fair value of the liability component from the par value of the Notes as a whole. This difference represents a debt discount that is amortized to interest expense using the effective interest method over the term of the Notes. The equity component is not remeasured as long as it continues to meet the conditions for equity classification. In accounting for the transaction costs related to the issuance of the Notes, we allocated the total amount incurred to the liability and equity components using the same proportions as the proceeds from the Notes. Transaction costs attributable to the liability component are being amortized to interest expense using the effective interest method over the term of the Notes. Transaction costs attributable to the equity component were netted with the equity component of the Notes in additional paid-in capital in the consolidated balance sheets.
When the Notes are convertible, the net carrying amount of the Notes and related debt issuance costs will be classified as current liabilities and current assets, respectively, in our consolidated balance sheets. In addition, a portion of the equity component representing the conversion option will be reclassified to temporary equity in our consolidated balance sheets.
Revenue Recognition
We generate revenue from the sales of hardware and software products, subscriptions, support and maintenance, and other services primarily through a direct sales force and indirect relationships with channel partners, and, to a lesser extent, directly to end-customers.
Revenue is recognized when all of the following criteria are met:
|
•
|
Persuasive Evidence of an Arrangement Exists.
We rely upon non-cancelable sales agreements and purchase orders to determine the existence of an arrangement.
|
|
•
|
Delivery has Occurred.
We use shipping documents or transmissions of product or service contract registration codes to determine delivery.
|
-
63
-
|
•
|
The Fee is Fixed or Determinable.
We assess whether the fee is fixed or determinable based on the payment terms associated with the transaction.
|
|
•
|
Collectability is Reasonably Assured.
We assess collectability based on credit analysis and payment history.
|
We recognize product revenue at the time of shipment provided that all other revenue recognition criteria have been met. Our channel partners generally receive an order from an end-customer prior to placing an order with us. In addition, payment from our channel partners is not contingent on the partner’s success in sales to end-customers. Our channel partners generally do not stock appliances and only have limited stock rotation rights and no price protection rights. When necessary, we make certain estimates and maintain allowances for sales returns and other programs based on our historical experience. To date, these estimates have not been significant. We recognize services revenue from subscriptions and support and maintenance ratably over the contractual service period, which is typically one to five years. Other services revenue is recognized as the services are rendered.
Most of our arrangements, other than renewals of subscriptions and support and maintenance, are multiple-element arrangements with a combination of hardware, software, subscriptions, support and maintenance, and other services. Products and services generally qualify as separate units of accounting. Our hardware deliverables typically include proprietary operating system software, which together deliver the essential functionality of our products. For multiple-element arrangements, we allocate revenue to each unit of accounting based on an estimated selling price at the arrangement inception. The estimated selling price for each element is based upon the following hierarchy: vendor-specific objective evidence (“VSOE”) of selling price, if available, third-party evidence (“TPE”) of selling price, if VSOE of selling price is not available, or best estimate of selling price (“BESP”), if neither VSOE of selling price nor TPE of selling price are available. The total arrangement consideration is allocated to each separate unit of accounting using the relative estimated selling prices of each unit based on the aforementioned selling price hierarchy. We limit the amount of revenue recognized for delivered elements to an amount that is not contingent upon future delivery of additional products or services or meeting of any specified performance conditions.
In multiple-element arrangements where software deliverables are included, revenue is allocated to each separate unit of accounting for each of the non-software deliverables and to the software deliverables as a group using the relative estimated selling prices of each of the deliverables in the arrangement based on the aforementioned estimated selling price hierarchy. The arrangement consideration allocated to the software deliverables as a group is then allocated to each software deliverable using the residual method when VSOE of fair value of the undelivered items exists. Under the residual method, the amount of revenue allocated to delivered elements equals the total arrangement consideration less the aggregate fair value of any undelivered elements. In determining VSOE of fair value, we evaluate whether a substantial majority of the historical prices charged for a product or service sold on a standalone basis, as represented by a percentage of list price, fall within a reasonably narrow range. If VSOE of fair value of one or more undelivered items does not exist, revenue from the software portion of the arrangement is deferred and recognized at the earlier of: (i) delivery of those elements or (ii) when fair value can be established unless support and maintenance is the only undelivered element, in which case, the entire software arrangement fee is recognized ratably over the contractual service period.
We account for multiple agreements with a single partner as one arrangement if the contractual terms and/or substance of those agreements indicate that they may be so closely related that they are, in effect, parts of a single arrangement.
Revenues are reported net of sales taxes. Shipping charges billed to channel partners are included in revenues and related costs are included in cost of revenue. Sales commissions and other incremental costs to acquire contracts are also expensed as incurred. After receipt of a partner order, any amounts billed in excess of revenue recognized are recorded as deferred revenue.
Advertising Costs
Advertising costs, which are expensed and included in sales and marketing expense when incurred, were
$6.6 million
,
$4.8 million
, and
$3.7 million
, during the years ended
July 31, 2016
,
2015
, and
2014
, respectively.
Software Development Costs
Internally developed software includes security software developed to meet our internal needs to provide cloud-based subscription services to our end-customers and business software that we customize to meet our specific operational needs. These capitalized costs consist of internal compensation related costs and external direct costs incurred during the application development stage and will be amortized over a useful life of
three
to
five
years.
The costs to develop software that is marketed externally have not been capitalized as we believe our current software development process is essentially completed concurrent with the establishment of technological feasibility. As such, all related software development costs are expensed as incurred and included in research and development expense in our consolidated statements of operations.
-
64
-
Share-Based Compensation
Compensation expense related to share-based transactions, including employee and non-employee director awards, is measured and recognized in the financial statements based on fair value on the grant date. We recognize share-based compensation expense, net of estimated forfeitures, on a straight-line basis over the requisite service periods of the related awards.
Leases
We rent our facilities under operating lease agreements and recognize related rent expense on a straight-line basis over the term of the lease. Some of our lease agreements contain rent holidays, scheduled rent increases, lease incentives, and renewal options. Rent holidays and scheduled rent increases are included in the determination of rent expense to be recorded over the lease term. Lease incentives are recognized as a reduction of rent expense on a straight-line basis over the term of the lease. Renewals are not assumed in the determination of the lease term unless they are deemed to be reasonably assured at the inception of the lease. We begin recognizing rent expense on the date that we obtain the legal right to use and control the leased space.
Income Taxes
We account for income taxes using the asset and liability method, which requires the recognition of deferred tax assets and liabilities for the expected future tax consequences of events that have been recognized in our financial statements or tax returns. In addition, deferred tax assets are recorded for the future benefit of utilizing net operating losses and research and development credit carryforwards. Valuation allowances are provided when necessary to reduce deferred tax assets to the amount expected to be realized.
Significant judgment is required in determining any valuation allowance recorded against deferred tax assets. In assessing the need for a valuation allowance, we consider all available evidence, including past operating results, estimates of future taxable income, and the feasibility of tax planning strategies. In the event that we change our determination as to the amount of deferred tax assets that can be realized, we will adjust our valuation allowance with a corresponding impact to the provision for income taxes in the period in which such determination is made.
We apply the authoritative accounting guidance prescribing a threshold and measurement attribute for the financial recognition and measurement of a tax position taken or expected to be taken in a tax return. We recognize liabilities for uncertain tax positions based on a two-step process. The first step is to evaluate the tax position for recognition by determining if the weight of available evidence indicates that it is more likely than not that the position will be sustained on audit, including resolution of related appeals or litigation processes, if any. The second step requires us to estimate and measure the tax benefit as the largest amount that is more likely than not to be realized upon ultimate settlement.
Loss Contingencies
We are subject to the possibility of various loss contingencies arising in the ordinary course of business. In determining loss contingencies, we consider the likelihood of loss or impairment of an asset, or the incurrence of a liability, as well as our ability to reasonably estimate the amount of loss. An estimated loss contingency is accrued when it is probable that an asset has been impaired or a liability has been incurred and the amount of loss can be reasonably estimated. If we determine that a loss is possible and the range of the loss can be reasonably determined, then we disclose the range of the possible loss. We regularly evaluate current information available to us to determine whether an accrual is required, an accrual should be adjusted or a range of possible loss should be disclosed.
Recent Accounting Pronouncements
In August 2016, the Financial Accounting Standards Board (“FASB”) issued new authoritative guidance addressing eight specific cash flow issues with the objective of reducing the existing diversity in practice in how certain transactions are presented and classified in the statement of cash flows. The standard is effective for us for our first quarter of fiscal 2019 and will be applied on a retrospective basis. Early adoption is permitted. We are currently evaluating whether this standard will have a material impact on our consolidated financial statements.
In June 2016, the FASB issued new authoritative guidance on the accounting for credit losses on most financial assets and certain financial instruments. The standard replaces the existing incurred loss model with an expected credit loss model for financial assets measured at amortized cost, including trade receivables, and requires that credit losses on available-for-sale debt securities be presented as an allowance rather than as a write-down. The standard is effective for us for our first quarter of fiscal 2021 and will be applied on a modified-retrospective basis. Early adoption is permitted beginning our first quarter of fiscal 2020. We are currently evaluating whether this standard will have a material impact on our consolidated financial statements.
In March 2016, the FASB issued authoritative guidance simplifying several aspects of the accounting for employee share-based payment transactions, including the income tax consequences, accounting for forfeitures, and classification of excess tax benefits on the statement of cash flows. The standard is effective for us for our first quarter of fiscal 2018, however, early adoption is permitted. We are currently evaluating whether this standard will have a material impact on our consolidated financial statements.
-
65
-
In February 2016, the FASB issued new authoritative guidance on lease accounting. Among its provisions, the standard requires lessees to recognize right-of-use assets and lease liabilities on the balance sheet for operating leases and also requires additional qualitative and quantitative disclosures about lease arrangements. The standard is effective for us for our first quarter of fiscal 2020 and will be applied on a modified retrospective basis, with the option to elect certain practical expedients. Early adoption is permitted. We are currently evaluating whether this standard will have a material impact on our consolidated financial statements.
In April 2015, the FASB issued new authoritative guidance on fees paid in a cloud computing arrangement. The standard requires customers in a cloud computing arrangement to evaluate whether the arrangement includes a software license. If the arrangement includes a software license, the customer should account for the software license element of the arrangement consistent with the acquisition of other software licenses. If the arrangement does not include a software license, the customer should account for the arrangement as a service contract. The standard is effective for us for our first quarter of fiscal 2017 and will be applied on a prospective basis. We do not expect the adoption of the standard will have a material impact on our consolidated financial statements.
In April 2015, the FASB issued updated authoritative guidance to simplify the presentation of debt issuance costs. The amended standard requires that debt issuance costs related to a recognized debt liability be presented in the balance sheet as a direct deduction from the carrying amount of the related debt liability, consistent with the presentation of debt discounts, instead of being presented as an asset. The amended standard is effective for us for our first quarter of fiscal 2017 and will be applied on a retrospective basis. We do not expect the adoption of the standard will have a material impact on our consolidated financial statements.
In May 2014, the FASB issued new authoritative guidance on revenue from contracts with customers. The new standard provides principles for recognizing revenue for the transfer of promised goods or services to customers with the consideration to which the entity expects to be entitled in exchange for those goods or services. The standard also requires significantly expanded disclosures about revenue recognition. The FASB subsequently delayed the effective date of the standard by one year and as a result, the standard is now effective for us for our first quarter of fiscal 2019 using either of two methods: (i) retrospective to each prior reporting period presented with the option to elect certain practical expedients as defined within the guidance; or (ii) retrospective with the cumulative effect of initially applying the guidance recognized at the date of initial application and providing certain additional disclosures as defined per the guidance. Early adoption as of the original effective date is permitted. We are currently evaluating adoption methods and whether this standard will have a material impact on our consolidated financial statements.
2. Fair Value Measurements
We categorize assets and liabilities recorded at fair value on our consolidated balance sheets based upon the level of judgment associated with inputs used to measure their fair value. The categories are as follows:
|
•
|
Level 1—Inputs are unadjusted quoted prices in active markets for identical assets or liabilities.
|
|
•
|
Level 2—Inputs are quoted prices for similar assets and liabilities in active markets or inputs that are observable for the assets or liabilities, either directly or indirectly through market corroboration, for substantially the full term of the financial instruments.
|
|
•
|
Level 3—Inputs are unobservable inputs based on our own assumptions used to measure assets and liabilities at fair value. The inputs require significant management judgment or estimation.
|
-
66
-
The following table presents the fair value of our financial assets and liabilities using the above input categories as of
July 31, 2016
and
July 31, 2015
(in millions):
|
July 31, 2016
|
July 31, 2015
|
|||||||||||||||||||||||||||||||
|
Level 1
|
Level 2
|
Level 3
|
Total
|
Level 1
|
Level 2
|
Level 3
|
Total
|
|||||||||||||||||||||||||
|
Short-term investments:
|
||||||||||||||||||||||||||||||||
|
Certificates of deposit
|
$
|
—
|
|
$
|
—
|
|
$
|
—
|
|
$
|
—
|
|
$
|
—
|
|
$
|
1.0
|
|
$
|
—
|
|
$
|
1.0
|
|
||||||||
|
Commercial paper
|
—
|
|
3.0
|
|
—
|
|
3.0
|
|
—
|
|
—
|
|
—
|
|
—
|
|
||||||||||||||||
|
Corporate debt securities
|
—
|
|
121.4
|
|
—
|
|
121.4
|
|
—
|
|
97.8
|
|
—
|
|
97.8
|
|
||||||||||||||||
|
U.S. government and agency securities
|
—
|
|
426.8
|
|
—
|
|
426.8
|
|
—
|
|
314.4
|
|
—
|
|
314.4
|
|
||||||||||||||||
|
Total short-term investments
|
—
|
|
551.2
|
|
—
|
|
551.2
|
|
—
|
|
413.2
|
|
—
|
|
413.2
|
|
||||||||||||||||
|
Long-term investments:
|
||||||||||||||||||||||||||||||||
|
Certificates of deposit
|
—
|
|
5.4
|
|
—
|
|
5.4
|
|
—
|
|
—
|
|
—
|
|
—
|
|
||||||||||||||||
|
Corporate debt securities
|
—
|
|
166.1
|
|
—
|
|
166.1
|
|
—
|
|
92.9
|
|
—
|
|
92.9
|
|
||||||||||||||||
|
U.S. government and agency securities
|
—
|
|
481.3
|
|
—
|
|
481.3
|
|
—
|
|
445.9
|
|
—
|
|
445.9
|
|
||||||||||||||||
|
Total long-term investments
|
—
|
|
652.8
|
|
—
|
|
652.8
|
|
—
|
|
538.8
|
|
—
|
|
538.8
|
|
||||||||||||||||
|
Total assets measured at fair value
|
$
|
—
|
|
$
|
1,204.0
|
|
$
|
—
|
|
$
|
1,204.0
|
|
$
|
—
|
|
$
|
952.0
|
|
$
|
—
|
|
$
|
952.0
|
|
||||||||
Refer to Note
7
. Convertible Senior Notes for the carrying amount and estimated fair value of our convertible senior notes as of
July 31, 2016
and July 31, 2015.
3. Investments
The following tables summarize the amortized cost, unrealized gains and losses, and fair value of our available-for-sale investments as of
July 31, 2016
and
July 31, 2015
(in millions):
|
July 31, 2016
|
|||||||||||||||
|
Amortized Cost
|
Unrealized Gains
|
Unrealized Losses
|
Estimated Fair Value
|
||||||||||||
|
Certificates of deposit
|
$
|
5.4
|
|
$
|
—
|
|
$
|
—
|
|
$
|
5.4
|
|
|||
|
Commercial paper
|
3.0
|
|
—
|
|
—
|
|
3.0
|
|
|||||||
|
Corporate debt securities
|
286.7
|
|
0.8
|
|
—
|
|
287.5
|
|
|||||||
|
U.S. government and agency securities
|
907.3
|
|
0.9
|
|
(0.1
|
)
|
908.1
|
|
|||||||
|
Total
|
$
|
1,202.4
|
|
$
|
1.7
|
|
$
|
(0.1
|
)
|
$
|
1,204.0
|
|
|||
|
July 31, 2015
|
|||||||||||||||
|
Amortized Cost
|
Unrealized Gains
|
Unrealized Losses
|
Estimated Fair Value
|
||||||||||||
|
Certificates of deposit
|
$
|
1.0
|
|
$
|
—
|
|
$
|
—
|
|
$
|
1.0
|
|
|||
|
Corporate debt securities
|
190.9
|
|
—
|
|
(0.2
|
)
|
190.7
|
|
|||||||
|
U.S. government and agency securities
|
760.2
|
|
0.3
|
|
(0.2
|
)
|
760.3
|
|
|||||||
|
Total
|
$
|
952.1
|
|
$
|
0.3
|
|
$
|
(0.4
|
)
|
$
|
952.0
|
|
|||
Unrealized losses related to these investments are due to interest rate fluctuations as opposed to credit quality. In addition, we do not intend to sell and it is not likely that we would be required to sell these investments before recovery of their amortized cost basis, which may be at maturity. As a result, there were no other-than-temporary impairments for these investments at
July 31, 2016
and
2015
.
We received proceeds of
$141.9 million
,
$18.5 million
, and
$74.6 million
from sales of investments during the years ended
July 31, 2016
,
2015
, and
2014
, respectively. We use the specific identification method to determine the cost basis of investments sold.
-
67
-
The following table summarizes the amortized cost and fair value of our available-for-sale investments as of
July 31, 2016
, by contractual years-to-maturity (in millions):
|
Amortized Cost
|
Fair Value
|
||||||
|
Due within one year
|
$
|
551.0
|
|
$
|
551.2
|
|
|
|
Due between one and three years
|
651.4
|
|
652.8
|
|
|||
|
Total
|
$
|
1,202.4
|
|
$
|
1,204.0
|
|
|
4. Acquisitions
Fiscal 2015
CirroSecure, Inc.
On May 22, 2015, we completed our acquisition of CirroSecure, Inc. (“CirroSecure”), a privately-held cybersecurity company. The acquisition expands the functionality of our next-generation security platform by providing additional security for SaaS applications. We accounted for this transaction as a business combination in exchange for total cash consideration of
$15.3 million
.
We allocated the purchase consideration to the assets acquired and liabilities assumed based on their estimated fair values and as a result, recorded a developed technology intangible asset of
$11.0 million
, goodwill of
$8.1 million
, and net liabilities of
$3.8 million
in our consolidated balance sheets as of the acquisition date. The developed technology is being amortized over an estimated useful life of
seven years
. The goodwill is attributable to the assembled workforce and expected post-acquisition synergies and is not deductible for income tax purposes.
Fiscal 2014
Cyvera Ltd.
On April 9, 2014, we completed our acquisition of Cyvera Ltd. (“Cyvera”), a privately-held cybersecurity company located in Tel Aviv, Israel. The acquisition extends our next-generation security platform with an innovative approach to preventing attacks on the endpoint. We accounted for this transaction as a business combination in exchange for total consideration of approximately
$177.6 million
, which consisted of the following (in millions):
|
Amount
|
|||
|
Cash
|
$
|
90.1
|
|
|
Common stock (1.3 million shares)
|
87.5
|
|
|
|
Total
|
$
|
177.6
|
|
As part of the acquisition, we agreed to replace Cyvera’s unvested options with our restricted stock units with an estimated fair value of
$6.4 million
. Of the total estimated fair value, a portion was allocated to the purchase consideration and the remainder was allocated to future services and is being expensed over the remaining service periods on a straight-line basis as share-based compensation. In addition, we issued
0.3 million
shares of restricted common stock with a total fair value of
$17.6 million
to certain Cyvera employees. The restriction on these shares will be released over a period of
three years
from the acquisition date, subject to continued employment. These shares were excluded from the purchase consideration and are being expensed over the remaining service periods on a straight-line basis as share-based compensation.
The following table summarizes our allocation of the purchase consideration based on the fair value of assets acquired and liabilities assumed (in millions):
|
Amount
|
|||
|
Cash
|
$
|
6.9
|
|
|
Goodwill
|
145.3
|
|
|
|
Identified intangible assets
|
42.3
|
|
|
|
Accrued and other liabilities, net
|
(7.0
|
)
|
|
|
Long-term deferred tax liability, net
|
(9.9
|
)
|
|
|
Total
|
$
|
177.6
|
|
-
68
-
The following table presents details of the identified intangible assets acquired as of the date of acquisition (in millions, except years):
|
Fair Value
|
Estimated Useful Life
|
||||
|
Developed technology
|
$
|
34.5
|
|
7 years
|
|
|
In-process research and development
|
7.6
|
|
N/A
|
||
|
Other
|
0.2
|
|
2 years
|
||
|
Total
|
$
|
42.3
|
|
||
Goodwill generated from this business combination is primarily attributable to the assembled workforce and synergies from combined selling opportunities of both network security products and endpoint security products. The goodwill is not deductible for income tax purposes.
Morta Security, Inc.
On December 26, 2013, we completed our acquisition of Morta Security, Inc. (“Morta”), a privately-held cybersecurity company. We accounted for this transaction as a business combination and exchanged total cash consideration of
$10.3 million
. Morta brings us a team of cybersecurity experts which will enhance the proven detection and prevention capabilities of our WildFire offering.
The following table summarizes our allocation of the purchase consideration based on the fair value of assets acquired and liabilities assumed (in millions):
|
Amount
|
|||
|
Goodwill
|
$
|
10.1
|
|
|
Identified intangible assets
|
2.2
|
|
|
|
Net liabilities assumed
|
(2.0
|
)
|
|
|
Total
|
$
|
10.3
|
|
The following table presents details of the identified intangible assets acquired (in millions, except years):
|
Fair Value
|
Estimated Useful Life
|
||||
|
In-process research and development held for defensive purposes
|
$
|
1.9
|
|
3 years
|
|
|
Other
|
0.3
|
|
2 years
|
||
|
Total
|
$
|
2.2
|
|
||
Goodwill generated from this business combination is primarily attributable to human capital with threat intelligence experience and capabilities, and is not deductible for income tax purposes.
5. Intangible Assets
The following table presents details of our purchased intangible assets as of
July 31, 2016
and
July 31, 2015
(in millions):
|
July 31,
|
|||||||||||||||||||||||
|
2016
|
2015
|
||||||||||||||||||||||
|
Gross Carrying Amount
|
Accumulated Amortization
|
Net Carrying Amount
|
Gross Carrying Amount
|
Accumulated Amortization
|
Net Carrying Amount
|
||||||||||||||||||
|
Developed technology
|
$
|
53.1
|
|
$
|
(15.4
|
)
|
$
|
37.7
|
|
$
|
53.1
|
|
$
|
(7.7
|
)
|
$
|
45.4
|
|
|||||
|
Acquired intellectual property
|
8.9
|
|
(2.9
|
)
|
6.0
|
|
8.2
|
|
(1.9
|
)
|
6.3
|
|
|||||||||||
|
In-process research and development held for defensive purposes
|
1.9
|
|
(1.6
|
)
|
0.3
|
|
1.9
|
|
(1.0
|
)
|
0.9
|
|
|||||||||||
|
Other
|
0.5
|
|
(0.5
|
)
|
—
|
|
0.5
|
|
(0.4
|
)
|
0.1
|
|
|||||||||||
|
Total purchased intangible assets
|
$
|
64.4
|
|
$
|
(20.4
|
)
|
$
|
44.0
|
|
$
|
63.7
|
|
$
|
(11.0
|
)
|
$
|
52.7
|
|
|||||
-
69
-
We recognized amortization expense of
$9.4 million
,
$7.9 million
, and
$2.9 million
for the years ended
July 31, 2016
,
2015
, and
2014
, respectively.
The following table summarizes our estimated future amortization expense of intangible assets as of
July 31, 2016
(in millions):
|
Amount
|
|||
|
Years ending July 31:
|
|||
|
2017
|
$
|
8.7
|
|
|
2018
|
8.3
|
|
|
|
2019
|
8.2
|
|
|
|
2020
|
8.1
|
|
|
|
2021
|
6.5
|
|
|
|
2022 and thereafter
|
4.2
|
|
|
|
Total future amortization expense
|
$
|
44.0
|
|
6. Property and Equipment
The following table presents details of our property and equipment, net as of
July 31, 2016
and
July 31, 2015
(in millions):
|
|
July 31,
|
||||||
|
|
2016
|
2015
|
|||||
|
Computers, equipment, and software
|
$
|
102.7
|
|
$
|
62.6
|
|
|
|
Leasehold improvements
|
58.0
|
|
25.5
|
|
|||
|
Demonstration units
|
20.1
|
|
16.0
|
|
|||
|
Furniture and fixtures
|
14.6
|
|
6.6
|
|
|||
|
Total property and equipment
|
195.4
|
|
110.7
|
|
|||
|
Less: accumulated depreciation
|
(78.2
|
)
|
(47.8
|
)
|
|||
|
Total property and equipment, net
|
$
|
117.2
|
|
$
|
62.9
|
|
|
We recognized depreciation expense of
$33.1 million
,
$20.3 million
, and
$14.0 million
related to property and equipment during the years ended
July 31, 2016
,
2015
, and
2014
, respectively.
7
. Convertible Senior Notes
Convertible Senior Notes
On
June 30, 2014
, we issued
$575.0 million
aggregate principal amount of
0.0%
Convertible Senior Notes due 2019 (the “Notes”). The Notes are governed by an indenture between us, as the issuer, and U.S. Bank National Association, as Trustee (the “Indenture”). The Notes are unsecured, unsubordinated obligations that do not contain any financial covenants or restrictions on the payments of dividends, the incurrence of indebtedness, or the issuance or repurchase of securities by us or any of our subsidiaries. The Notes mature on
July 1, 2019
unless converted or repurchased in accordance with their terms prior to such date. We cannot redeem the Notes prior to maturity.
The Notes are convertible for up to
5.2 million
shares of our common stock at an initial conversion rate of approximately
9.068
shares of common stock per
$1,000
principal amount, which is equal to an initial conversion price of approximately
$110.28
per share of common stock, subject to adjustment. Holders of the Notes may surrender their Notes for conversion at their option at any time prior to the close of business on the business day immediately preceding
January 1, 2019
, only under the following circumstances:
|
•
|
during any fiscal quarter commencing after the fiscal quarter ending on
October 31, 2014
(and only during such fiscal quarter), if the last reported sale price of our common stock for at least
20
trading days (whether or not consecutive) during a period of
30
consecutive trading days ending on the last trading day of the immediately preceding fiscal quarter is greater than or equal to
130%
of the conversion price for the Notes on each applicable trading day (the “sale price condition”);
|
|
•
|
during the
five
business day period after any
five
consecutive trading day period, in which the trading price per $1,000 principal amount of Notes for each trading day of the measurement period was less than
98%
of the product of the last reported sale price of our common stock and the conversion rate for the Notes on each such trading day; or
|
|
•
|
upon the occurrence of specified corporate events.
|
-
70
-
On or after January 1, 2019, holders may convert all or any portion of their Notes at any time prior to the close of business on the second scheduled trading day immediately preceding the maturity date regardless of the foregoing conditions. Upon conversion, holders will receive cash equal to the aggregate principal amount of the Notes to be converted, and, at our election, cash and/or shares of our common stock for any amounts in excess of the aggregate principal amount of the Notes being converted.
The conversion price will be subject to adjustment in some events. Holders of the Notes who convert their Notes in connection with certain corporate events that constitute a “make-whole fundamental change” per the Indenture are, under certain circumstances, entitled to an increase in the conversion rate. Additionally, upon the occurrence of a corporate event that constitutes a “fundamental change” per the Indenture, holders of the Notes may require us to repurchase for cash all or a portion of the Notes at a purchase price equal to
100%
of the principal amount of the Notes plus accrued and unpaid contingent interest.
In accounting for the issuance of the Notes, we separated the Notes into liability and equity components. The carrying amount of the liability component was calculated by measuring the fair value of a similar liability that does not have an associated convertible feature. The carrying amount of the equity component representing the conversion option was determined by deducting the fair value of the liability component from the par value of the Notes as a whole. The difference between the principal amount of the Notes and the liability component (the “debt discount”), is amortized to interest expense using the effective interest method over the term of the Notes. The equity component of the Notes was recorded in additional paid-in capital in our consolidated balance sheets and is not remeasured as long as it continues to meet the conditions for equity classification.
In accounting for the transaction costs related to the issuance of the Notes, we allocated the total amount incurred to the liability and equity components using the same proportions as the proceeds from the Notes. Transaction costs attributable to the liability component were recorded in other assets in our consolidated balance sheets and are being amortized to interest expense in our consolidated statements of operations using the effective interest method over the term of the Notes. Transaction costs attributable to the equity component were netted with the equity component of the Notes in additional paid-in capital in our consolidated balance sheets. We recorded liability issuance costs, or debt issuance costs, of
$12.5 million
and equity issuance costs of
$2.9 million
.
The sale price condition was met during the fiscal quarter ended July 31, 2015, and as a result, holders could convert their Notes at any time during the fiscal quarter ending October 31, 2015. Accordingly, the net carrying amount of the Notes and related debit issuance costs were classified in current liabilities and current assets, respectively, and a portion of the equity component representing the conversion option was classified as temporary equity in our consolidated balance sheets as of July 31, 2015. The portion of the equity component classified as temporary equity was measured as the difference between the principal and net carrying amount of the Notes. The sale price condition was not met during the fiscal quarter ended
July 31, 2016
. Since the Notes were no longer convertible, the net carrying amount of the Notes and related debt issuance costs were reclassified into long-term liabilities and other assets, respectively, in our consolidated balance sheets as of
July 31, 2016
. In addition, the portion of the equity component classified as temporary equity was reclassified into additional paid-in capital in our consolidated balance sheets as of
July 31, 2016
.
The following table sets forth the components of the Notes as of
July 31, 2016
and
July 31, 2015
(in millions):
|
July 31,
|
|||||||
|
2016
|
2015
|
||||||
|
Liability:
|
|||||||
|
Principal
|
$
|
575.0
|
|
$
|
575.0
|
|
|
|
Less: debt discount, net of amortization
|
66.8
|
|
87.9
|
|
|||
|
Net carrying amount
|
$
|
508.2
|
|
$
|
487.1
|
|
|
|
Equity (including temporary equity)
|
$
|
109.8
|
|
$
|
109.8
|
|
|
The total estimated fair value of the Notes was
$761.9 million
and
$994.8 million
at
July 31, 2016
and
July 31, 2015
, respectively. The fair value was determined based on the closing trading price per $100 of the Notes as of the last day of trading for the period. We consider the fair value of the Notes at
July 31, 2016
and
July 31, 2015
to be a Level 2 measurement. The fair value of the Notes is primarily affected by the trading price of our common stock and market interest rates. As of
July 31, 2016
, the if-converted value of the Notes exceeded its principal amount by
$80.0 million
.
-
71
-
The following table sets forth interest expense recognized related to the Notes (dollars in millions):
|
Year Ended July 31,
|
|||||||||||
|
2016
|
2015
|
2014
|
|||||||||
|
Amortization of debt discount
|
$
|
21.1
|
|
$
|
20.2
|
|
$
|
1.6
|
|
||
|
Amortization of debt issuance costs
|
2.3
|
|
2.1
|
|
0.2
|
|
|||||
|
Total interest expense recognized
|
$
|
23.4
|
|
$
|
22.3
|
|
$
|
1.8
|
|
||
|
Effective interest rate of the liability component
|
4.8
|
%
|
4.8
|
%
|
4.8
|
%
|
|||||
Note Hedges
To minimize the impact of potential economic dilution upon conversion of the Notes, we entered into convertible note hedge transactions (the “Note Hedges”) with respect to our common stock concurrent with the issuance of the Notes. The Note Hedges cover up to
5.2 million
shares of our common stock at a strike price per share that corresponds to the initial conversion price of the Notes, which are also subject to adjustment, and are exercisable upon conversion of the Notes. The Note Hedges will expire upon maturity of the Notes. The Note Hedges are separate transactions and are not part of the terms of the Notes. Holders of the Notes will not have any rights with respect to the Note Hedges. The shares receivable related to the Note Hedges are excluded from the calculation of diluted earnings per share as they are antidilutive.
We paid an aggregate amount of
$111.0 million
for the Note Hedges, which is included in additional paid-in capital in our consolidated balance sheets.
Warrants
Separately, but concurrently with our issuance of the Notes, we entered into transactions whereby we sold warrants (the “Warrants”) to acquire up to
5.2 million
shares of our common stock at a strike price of approximately
$137.85
per share, subject to adjustments. The shares issuable under the Warrants will be included in the calculation of diluted earnings per share when the average market value per share of our common stock for the reporting period exceeds the strike price of the Warrants. The Warrants are separate transactions and are not part of the Notes or Notes Hedges, and are not remeasured through earnings each reporting period. Holders of the Notes and Note Hedges will not have any rights with respect to the Warrants.
We received aggregate proceeds of
$78.3 million
from the sale of the Warrants, which is included in additional paid-in capital in our consolidated balance sheets.
8
. Commitments and Contingencies
Leases
We lease our facilities under various non-cancelable operating leases, which expire through the year ending
July 31, 2028
.
In September 2012, we entered into
two
lease agreements for an aggregate of approximately
300,000
square feet of space in Santa Clara, California to serve as our corporate headquarters beginning in November 2013. The leases commenced in November 2012 and August 2013, expire in July 2023, and allow for
two
separate
five
-year options to extend the lease term. Payments under these leases are approximately
$94.3 million
over the lease term. Each lease has a rent holiday, which was included in the determination of rent expense.
In July 2013, we entered into a
51
-month sub-lease agreement for our previous corporate headquarters with a commencement date of January 2014. Net proceeds from this sub-lease are approximately
$10.7 million
over the lease term.
In May 2015, we entered into
three
lease agreements for approximately
752,000
square feet of corporate office space in Santa Clara, California to serve as our future corporate headquarters. In October 2015, we entered into a fourth lease agreement for approximately
310,000
square feet of additional office space at the same location. The first lease commenced in February 2016 and will expire in April 2021. The remaining three leases will commence between May 2017 and December 2017 and expire in April 2028, however, the property is currently under construction and as a result, the lease commencement dates may change based on progress of the construction project. The leases contain a rent holiday period, scheduled rent increases, lease incentives, and renewal options which allow the lease terms to be extended through April 2046. Rental payments under the four lease agreements are approximately
$376.7 million
over the lease term.
We recognized rent expense of
$20.2 million
,
$15.4 million
, and
$13.2 million
for the years ended
July 31, 2016
,
2015
, and
2014
, respectively. Rent expense is recognized on a straight-line basis over the term of the lease.
-
72
-
The following table presents details of the aggregate future non-cancelable minimum rental payments under our operating leases as of
July 31, 2016
(in millions):
|
Amount
|
|||
|
Years ending July 31:
|
|||
|
2017
|
$
|
27.3
|
|
|
2018
|
33.3
|
|
|
|
2019
|
46.2
|
|
|
|
2020
|
49.8
|
|
|
|
2021
|
54.1
|
|
|
|
2022 and thereafter
|
298.6
|
|
|
|
Committed gross lease payments
|
509.3
|
|
|
|
Less: proceeds from sublease rental
|
5.1
|
|
|
|
Net operating lease obligation
|
$
|
504.2
|
|
Contract Manufacturer Commitments
Our independent contract manufacturer procures components and assembles our products based on our forecasts. These forecasts are based on estimates of demand for our products primarily for the next 12 months, which are in turn based on historical trends and an analysis from our sales and product marketing organizations, adjusted for overall market conditions. In order to reduce manufacturing lead times and plan for adequate supply, we may issue forecasts and orders for components and products that are non-cancelable. As of
July 31, 2016
, our purchase commitments under such orders were
$54.2 million
, excluding obligations under contracts that we can cancel without a significant penalty.
Litigation
In December 2011, Juniper Networks, Inc. (“Juniper”) filed a complaint against us in the United States District Court for the District of Delaware alleging patent infringement, which sought preliminary and permanent injunctions against infringement, treble damages, and attorneys’ fees. On September 30, 2013, we filed a lawsuit against Juniper in the United States District Court for the Northern District of California alleging that Juniper’s products infringe three of our U.S. patents, and sought monetary damages and a permanent injunction. On May 27, 2014, we entered into a Settlement, Release and Cross-License Agreement (the “Settlement Agreement”) with Juniper to resolve all pending litigation between the parties, including those discussed above. Refer to Note
9
. Legal Settlement for more information on the Settlement Agreement.
In addition to the above matter, we are subject to legal proceedings, claims, and litigation arising in the ordinary course of business, including intellectual property litigation. Such matters are subject to many uncertainties and outcomes are not predictable with assurance. We accrue for contingencies when we believe that a loss is probable and that we can reasonably estimate the amount of any such loss.
To the extent there is a reasonable possibility that a loss exceeding amounts already recognized may be incurred and the amount of such additional loss would be material, we will either disclose the estimated additional loss or state that such an estimate cannot be made. As of
July 31, 2016
, we have not recorded any significant accruals for loss contingencies associated with such legal proceedings, determined that an unfavorable outcome is probable or reasonably possible, or determined that the amount or range of any possible loss is reasonably estimable.
Indemnification
Under the indemnification provisions of our standard sales related contracts, we agree to defend our end-customers against third-party claims asserting infringement of certain intellectual property rights, which may include patents, copyrights, trademarks, or trade secrets, and to pay judgments entered on such claims. Our exposure under these indemnification provisions is generally limited to payments made to us for the alleged infringing products over the preceding twelve months under the agreement. However, certain agreements include indemnification provisions that could potentially expose us to losses in excess of these payments. In addition, we indemnify our officers, directors, and certain key employees while they are serving in good faith in their company capacities. To date, we have not recorded any accruals for loss contingencies associated with indemnification claims or determined that an unfavorable outcome is probable or reasonably possible.
-
73
-
9
. Legal Settlement
Settlement, Release and Cross-License Agreement with Juniper
On
May 27, 2014
, we entered into the Settlement Agreement with Juniper, whereby we resolved all pending litigation matters. Under the terms of the Settlement Agreement, we agreed to pay Juniper a one-time settlement amount comprised of
$75.0 million
in cash,
1.1 million
shares of our common stock, and a warrant to purchase
0.5 million
shares of our common stock, in exchange for the following:
|
•
|
Mutual dismissal with prejudice of all pending litigation between the parties and general release of all liability for Palo Alto Networks and Juniper,
|
|
•
|
Cross-license between both parties for the patents-in-suit and associated family members and counterparts worldwide for the life of the patents, and
|
|
•
|
Mutual covenant not to sue for infringement of any other patents for a period of
eight years
.
|
The fair value of the total consideration as of the settlement date was
$182.5 million
, which was comprised of
$75.0 million
in cash,
$75.3 million
in common stock, and
$32.2 million
in warrant. The fair values of the common stock and warrant were measured using the closing price of our common stock on the settlement date.
The warrant was issued on June 3, 2014 and entitled Juniper to purchase up to
0.5 million
shares of common stock at an exercise price of
$0.0001
per share and was classified as a liability during the period it was outstanding. On July 1, 2014, Juniper exercised the warrant in full. Accordingly, we recorded the change in the fair value of the warrant liability through the exercise date of
$5.9 million
within other income (expense), net in our consolidated statement of operations for the year ended July 31,
2014.
We accounted for the Settlement Agreement as a multiple-element arrangement and allocated the fair value of the consideration as of the settlement date to the identifiable elements based on their estimated fair values. Of the total settlement amount,
$61.3 million
was allocated to the licensing of intellectual property,
$54.3 million
was allocated to the mutual dismissal of claims, and the remaining amount was allocated to the mutual covenant not to sue. The mutual dismissal of claims and the mutual covenant not to sue have no identifiable future benefit, and as a result we recorded a settlement charge within legal settlement expense in our consolidated statement of operations for the year ended July 31, 2014. The licensing of intellectual property is being amortized to cost of product revenue in our consolidated statements of operations over the estimated period of benefit of
five years
.
Mutual Covenant Not to Sue and Release Agreement
On January 27, 2014, we executed a Mutual Covenant Not to Sue and Release Agreement with Fortinet, Inc., thereby extending an existing covenant for six more years. We evaluated the transaction as a multiple-element arrangement and allocated the one-time payment that we made in the amount of
$20.0 million
to each identifiable element using its relative fair value. Based on our estimates of fair value, we determined that the primary benefit of the arrangement is avoided litigation cost and the release of any potential past claims, with no material value attributable to future use or benefit. Accordingly, we recorded a
$20.0 million
settlement charge within legal settlement expense in our consolidated statement of operations for the year ended July 31, 2014.
10. Equity Award Plans
Share-Based Compensation Plans
2012 Equity Incentive Plan
Our 2012 Equity Incentive Plan (our “2012 Plan”) was adopted by our board of directors and approved by the stockholders on June 5, 2012 and was effective one business day prior to the effectiveness of our registration statement for our initial public offering (“IPO”). Our 2012 Plan replaced our 2005 Equity Incentive Plan (our “2005 Plan”), which terminated upon the completion of our IPO, however, awards that were outstanding upon termination remained outstanding pursuant to their original terms. Our 2012 Plan provides for the granting of stock options, restricted stock awards (“RSAs”), restricted stock units (“RSUs”), stock appreciation rights, performance units, and performance shares to our employees, directors, and consultants.
Awards granted under our 2012 Plan vest over the periods determined by the board of directors, generally
three
to
four years
from the date of grant, and our options expire no more than
ten years
after the date of grant. Since our IPO in 2012, awards granted under our 2012 Plan consist primarily of RSUs. Until vested, RSUs do not have the voting and dividend participation rights of common stock and the shares underlying the awards are not considered issued and outstanding.
A total of
16.8 million
shares of our common stock are reserved for issuance pursuant to our 2012 Plan as of
July 31, 2016
. This includes shares that are (i) reserved but unissued under our 2005 Plan on the effective date of our 2012 Plan or (ii) returned to our 2005 Plan as a result of expiration or termination of options. On the first day of each fiscal year, the number of shares in the reserve
-
74
-
may be increased by the lesser of (i)
8,000,000
shares, (ii)
4.5%
of the outstanding shares of common stock on the last day of our immediately preceding fiscal year, or (iii) such other amount as determined by our board of directors.
2012 Employee Stock Purchase Plan
Our 2012 Employee Stock Purchase Plan (our “2012 ESPP”) was adopted by our board of directors and approved by the stockholders on June 5, 2012 and was effective upon completion of our IPO.
Our 2012 ESPP permits eligible employees to acquire shares of our common stock at
85%
of the lower of the fair market value of our common stock on the first trading day of each offering period or on the exercise date. Each offering period will be approximately six months starting on the first trading date after March 15 and September 15 of each year. Participants may purchase shares of common stock through payroll deductions of up to
15%
of their eligible compensation, subject to purchase limits of
625
shares during a six-month period or
$25,000
worth of stock for each calendar year. During the year ended
July 31, 2016
, employees purchased
0.2 million
shares of common stock under our 2012 ESPP at an average exercise price of
$126.96
per share.
A total of
2.4 million
shares of our common stock are available for sale under our 2012 ESPP as of
July 31, 2016
. On the first day of each fiscal year, the number of shares in the reserve may be increased by the lesser of (i)
2,000,000
shares, (ii)
1%
of the outstanding shares of our common stock on the first day of the fiscal year, or (iii) such other amount as determined by our board of directors.
Stock Option Activities
The following table summarizes the stock option activity under our stock plans during the reporting period (in millions, except per share amounts):
|
Options Outstanding
|
||||||||||||
|
Number
of Shares |
Weighted-
Average Exercise Price Per Share |
Weighted-
Average Remaining Contractual Term (Years) |
Aggregate
Intrinsic Value |
|||||||||
|
Balance—July 31, 2015
|
3.3
|
|
$
|
13.74
|
|
6.2
|
$
|
562.9
|
|
|||
|
Options granted
|
—
|
|
—
|
|
||||||||
|
Options forfeited
|
—
|
|
—
|
|
||||||||
|
Options exercised
|
(1.2
|
)
|
14.21
|
|
||||||||
|
Balance—July 31, 2016
|
2.1
|
|
$
|
13.42
|
|
5.2
|
$
|
244.9
|
|
|||
|
Options vested and expected to vest—July 31, 2016
|
2.1
|
|
$
|
13.42
|
|
5.2
|
$
|
244.9
|
|
|||
|
Options exercisable—July 31, 2016
|
2.1
|
|
$
|
13.42
|
|
5.2
|
$
|
244.9
|
|
|||
The intrinsic value of options exercised during the years ended
July 31, 2016
,
2015
, and
2014
was
$176.1 million
,
$301.1 million
, and
$198.8 million
, respectively. The grant-date fair value of options vested during the years ended
July 31, 2016
,
2015
, and
2014
was
$8.1 million
,
$14.6 million
, and
$17.1 million
, respectively.
-
75
-
Restricted Stock Unit (“RSU”) and Restricted Stock Award (“RSA”) Activities
The following table summarizes the RSU and RSA activity under our stock plans during the reporting period (in millions, except per share amounts):
|
RSAs Outstanding
|
RSUs Outstanding
|
||||||||||||||||||
|
Number
of Shares |
Weighted-
Average Grant-Date Fair Value Per Share |
Number
of Shares |
Weighted-
Average Grant-Date Fair Value Per Share |
Weighted-
Average Remaining Contractual Term (Years) |
Aggregate
Intrinsic Value |
||||||||||||||
|
Balance—July 31, 2015
|
—
|
|
$
|
—
|
|
7.2
|
|
$
|
95.66
|
|
1.2
|
$
|
1,334.8
|
|
|||||
|
Granted
|
1.1
|
|
170.97
|
|
3.2
|
|
160.60
|
|
|||||||||||
|
Vested
|
—
|
|
—
|
|
(3.3
|
)
|
89.76
|
|
|||||||||||
|
Forfeited
|
—
|
|
—
|
|
(0.6
|
)
|
104.08
|
|
|||||||||||
|
Balance—July 31, 2016
|
1.1
|
|
$
|
170.97
|
|
6.5
|
|
$
|
130.14
|
|
1.1
|
$
|
852.7
|
|
|||||
|
Expected to vest—July 31, 2016
|
1.0
|
|
$
|
170.97
|
|
6.2
|
|
$
|
129.64
|
|
1.1
|
$
|
810.0
|
|
|||||
The weighted-average grant-date fair value of RSUs granted during the years ended
July 31, 2016
,
2015
, and
2014
was
$160.60
,
$122.36
, and
$61.00
per share, respectively. The aggregate fair value, as of the respective vesting dates, of RSUs vested during the years ended
July 31, 2016
,
2015
, and
2014
was
$513.0 million
,
$350.4 million
, and
$57.4 million
, respectively.
Shares Available for Grant
The following table presents the stock activity and the total number of shares available for grant as of
July 31, 2016
(in millions):
|
Number of shares
|
||
|
Balance—July 31, 2015
|
8.1
|
|
|
Authorized
|
3.8
|
|
|
RSUs and RSAs granted
|
(4.3
|
)
|
|
RSUs forfeited
|
0.6
|
|
|
Balance—July 31, 2016
|
8.2
|
|
Share-Based Compensation
We record share-based compensation awards based on estimated fair value as of the grant date. The fair value of RSUs and RSAs is based on the closing market price of our common stock on the date of grant. The fair value of shares sold through our 2012 ESPP are estimated on the grant date using the Black-Scholes option pricing model.
The following table summarizes share-based compensation included in costs and expenses (in millions):
|
Year Ended July 31,
|
|||||||||||
|
2016
|
2015
|
2014
|
|||||||||
|
Cost of product revenue
|
$
|
6.2
|
|
$
|
3.9
|
|
$
|
1.6
|
|
||
|
Cost of services revenue
|
40.9
|
|
20.4
|
|
9.4
|
|
|||||
|
Research and development
|
132.9
|
|
74.8
|
|
29.5
|
|
|||||
|
Sales and marketing
|
152.4
|
|
84.1
|
|
42.6
|
|
|||||
|
General and administrative
|
60.5
|
|
38.2
|
|
16.8
|
|
|||||
|
Total share-based compensation
|
$
|
392.9
|
|
$
|
221.4
|
|
$
|
99.9
|
|
||
During the year ended July 31, 2014, we accelerated the vesting of certain share-based awards in connection with our acquisitions of Cyvera and Morta and as a result, we recorded
$3.4 million
of compensation expense within general and administrative expense. At
July 31, 2016
, total compensation cost related to unvested share-based awards not yet recognized was
$822.9 million
, net of estimated forfeitures. This cost is expected to be amortized on a straight-line basis over a weighted-average period of approximately
2.4 years
. Future grants will increase the amount of compensation expense to be recorded in these periods.
-
76
-
11. Income Taxes
The following table presents the components of income (loss) before income taxes (in millions):
|
|
Year Ended July 31,
|
||||||||||
|
|
2016
|
2015
|
2014
|
||||||||
|
United States
|
$
|
(216.2
|
)
|
$
|
(47.5
|
)
|
$
|
(149.3
|
)
|
||
|
Foreign
|
11.1
|
|
(108.1
|
)
|
(72.9
|
)
|
|||||
|
Total
|
$
|
(205.1
|
)
|
$
|
(155.6
|
)
|
$
|
(222.2
|
)
|
||
The following table summarizes the provision for income taxes (in millions):
|
|
Year Ended July 31,
|
||||||||||
|
|
2016
|
2015
|
2014
|
||||||||
|
Federal:
|
|||||||||||
|
Current
|
$
|
1.9
|
|
$
|
1.8
|
|
$
|
0.8
|
|
||
|
Deferred
|
(0.6
|
)
|
(3.0
|
)
|
—
|
|
|||||
|
State:
|
|||||||||||
|
Current
|
1.1
|
|
0.7
|
|
0.2
|
|
|||||
|
Deferred
|
(0.1
|
)
|
(0.4
|
)
|
(0.3
|
)
|
|||||
|
Foreign:
|
|||||||||||
|
Current
|
19.1
|
|
10.7
|
|
4.7
|
|
|||||
|
Deferred
|
(0.6
|
)
|
(0.4
|
)
|
(1.1
|
)
|
|||||
|
Total
|
$
|
20.8
|
|
$
|
9.4
|
|
$
|
4.3
|
|
||
For the year ended July 31, 2016, our provision for income taxes increased compared to the year ended July 31, 2015 primarily due to an increase in foreign taxes and amortization of our deferred tax charges.
For the year ended July 31, 2015, due to our acquisition of CirroSecure, a deferred tax liability was established for the book-tax basis difference related to purchased intangibles. The net deferred tax liability from acquisitions provided an additional source of income to support the realizability of our pre-existing deferred tax assets and as a result, we released a portion of the valuation allowance that was established in the previous year and recorded a tax benefit of
$3.4 million
.
The following table presents the items accounting for the difference between income taxes computed at the federal statutory income tax rate and the provision for income taxes:
|
|
Year Ended July 31,
|
|||||||
|
|
2016
|
2015
|
2014
|
|||||
|
Federal statutory rate
|
35.0
|
%
|
35.0
|
%
|
35.0
|
%
|
||
|
Effect of:
|
||||||||
|
State taxes, net of federal tax benefit
|
(1.5
|
)
|
3.6
|
|
1.3
|
|
||
|
Foreign income at other than U.S. rates
|
(8.8
|
)
|
(6.5
|
)
|
(12.1
|
)
|
||
|
Change in valuation allowance
|
(24.9
|
)
|
(28.5
|
)
|
(21.3
|
)
|
||
|
Share-based compensation
|
(13.3
|
)
|
(10.2
|
)
|
(3.2
|
)
|
||
|
Amortization of deferred tax charges
|
(2.8
|
)
|
(2.2
|
)
|
—
|
|
||
|
Research credits
|
9.5
|
|
6.7
|
|
1.3
|
|
||
|
Other, net
|
(3.4
|
)
|
(3.9
|
)
|
(2.9
|
)
|
||
|
Total
|
(10.2
|
)%
|
(6.0
|
)%
|
(1.9
|
)%
|
||
During the year ended July 31, 2016, we accounted for the outcome of
The Gillette Company et al. v. California Franchise Tax Board
which disallowed the election to use an evenly weighted, three factor apportionment formula utilized by us on our tax return for the year ended July 31, 2014.
The impact for the change in apportionment is reflected in state taxes, net of federal tax benefit above and is fully offset by changes in our valuation allowance.
-
77
-
During the year ended July 31, 2015, we completed several changes to our corporate structure to more closely align with the global nature of our business. As a result, we recorded deferred tax charges in prepaid expenses and other current assets and other assets on our consolidated balance sheets. These amounts are being amortized on a straight-line basis over the life of the associated assets as a component of provision for income taxes in our consolidated statements of operations.
The following table presents the components of our deferred tax assets and liabilities as of
July 31, 2016
and
July 31, 2015
(in millions):
|
|
July 31,
|
||||||
|
|
2016
|
2015
|
|||||
|
Deferred tax assets:
|
|||||||
|
Accruals and reserves
|
$
|
43.5
|
|
$
|
38.9
|
|
|
|
Deferred revenue
|
62.0
|
|
35.3
|
|
|||
|
Research and development and foreign tax credits
|
41.4
|
|
20.1
|
|
|||
|
Net operating loss carryforwards
|
5.4
|
|
18.4
|
|
|||
|
Share-based compensation
|
55.2
|
|
35.9
|
|
|||
|
Gross deferred tax assets
|
207.5
|
|
148.6
|
|
|||
|
Valuation allowance
|
(189.4
|
)
|
(138.4
|
)
|
|||
|
Total deferred tax assets
|
18.1
|
|
10.2
|
|
|||
|
Deferred tax liabilities:
|
|||||||
|
Fixed assets and intangible assets
|
(14.2
|
)
|
(7.9
|
)
|
|||
|
Other deferred tax liabilities
|
(2.5
|
)
|
(1.6
|
)
|
|||
|
Total deferred tax liabilities
|
(16.7
|
)
|
(9.5
|
)
|
|||
|
Total
|
$
|
1.4
|
|
$
|
0.7
|
|
|
A valuation allowance is provided when it is more likely than not that the deferred tax asset will not be realized. Realization of deferred tax assets is dependent upon future taxable income, if any, the amount and timing of which are uncertain. At such time, if it is determined that it is more likely than not that the deferred tax assets are realizable, the valuation allowance will be adjusted. As of
July 31, 2016
, we have provided a valuation allowance for our federal and state deferred tax assets that we believe will, more likely than not, be unrealizable. The net valuation allowance
increased
by approximately
$51.0 million
from the year ended
July 31, 2015
to the year ended
July 31, 2016
, which was primarily attributable to an increase in deferred tax assets in our federal and state jurisdictions.
As of
July 31, 2016
, we had federal, state, and foreign NOL carryforwards of approximately
$1.1 billion
,
$823.8 million
, and
$8.9 million
, respectively as reported on our tax returns, available to reduce future taxable income, if any. If not utilized, our federal and state NOL carryforwards will expire in various amounts at various dates beginning in the years ending July 31, 2027 and July 31, 2017, respectively. Our foreign NOL will carry forward indefinitely.
As of
July 31, 2016
, we had federal and state research and development tax credit carryforwards of approximately
$37.1 million
and
$37.2 million
, respectively as reported on our tax returns. If not utilized, the federal credit carryforwards will expire in various amounts at various dates beginning in the year ending July 31, 2026. The state credit will carry forward indefinitely.
As of
July 31, 2016
, we had foreign tax credit carryforwards of
$1.7 million
as reported on our tax returns. If not utilized, the foreign tax credit carryforwards will expire in various amounts at various dates beginning in the year ending July 31, 2021.
Utilization of the NOL carryforwards and credits may be subject to a substantial annual limitation due to the ownership change limitations provided by the Internal Revenue Code of 1986, as amended, and similar state provisions. The annual limitation may result in the expiration of NOLs and credits before utilization.
We use the with-and-without approach to determine the recognition and measurement of excess tax benefits resulting from share-based awards. Accordingly, we have elected to recognize excess income tax benefits from share-based awards in additional paid-in capital only if an incremental income tax benefit would be realized after considering all other tax attributes presently available to us. As of
July 31, 2016
, we had excess tax benefits from share-based awards of
$1.0 billion
,
$669.7 million
, and
$8.9 million
included in federal, state, and foreign NOL, respectively. We also had
$5.3 million
of excess tax benefits from share-based awards included in federal research and development tax credit. The impact of this excess tax benefit is recognized as additional paid-in capital when it reduces taxes payable. We have elected to account for the indirect effects of share-based awards on other tax attributes, such as the research, foreign and other tax credits, through the consolidated statements of operations.
-
78
-
During the years ended
July 31, 2016
,
2015
, and
2014
, we recorded excess tax benefits that resulted from allocating certain tax effects related to exercises of stock options and vesting of RSUs directly to stockholders’ equity in the amount of
$0.5 million
,
$2.5 million
, and
$1.0 million
, respectively.
In December 2015, the Protecting Americans from Tax Hikes Act of 2015 (the “PATH Act”) was signed into law. Among its provisions, the PATH Act retroactively extends the bonus depreciation and other corporate tax incentives through December 31, 2019, and permanently extends the federal research and development credit. Due to the valuation allowance against our domestic deferred tax assets, we did not recognize any discrete tax benefits during the year ended
July 31, 2016
as a result of the legislation.
As of
July 31, 2016
, we had
$127.7 million
of unrecognized tax benefits,
$21.9 million
of which would affect income tax expense if recognized, after consideration of our valuation allowance in the United States and other assets. As of
July 31, 2015
, we had
$67.2 million
of unrecognized tax benefits,
$10.8 million
of which would affect income tax expense if recognized, after consideration of our valuation allowance in the United States. As of
July 31, 2016
, our federal, state, and foreign returns for the tax years 2008 through the current period remain subject to adjustment due to examination. Fiscal years outside the normal statute of limitation remain open to audit by tax authorities due to tax attributes generated in earlier years, which have been carried forward and may be audited in subsequent years when utilized. We do not expect the amount of unrecognized tax benefits as of
July 31, 2016
to change significantly over the next 12 months. We recognize both interest and penalties associated with uncertain tax positions as a component of income tax expense. During the years ended
July 31, 2016
,
2015
, and
2014
, we recognized income tax expense related to interest and penalties of
$1.6 million
,
$1.1 million
, and
$0.3 million
, respectively. We had accrued interest and penalties on our consolidated balance sheets related to unrecognized tax benefits of
$3.3 million
and
$1.8 million
as of
July 31, 2016
and
2015
, respectively. The ultimate amount and timing of any future cash settlements cannot be predicted with reasonable certainty.
The following table presents a reconciliation of the beginning and ending amount of our gross unrecognized tax benefits (in millions):
|
|
Year Ended July 31,
|
||||||||||
|
|
2016
|
2015
|
2014
|
||||||||
|
Unrecognized tax benefits at the beginning of the period
|
$
|
67.2
|
|
$
|
10.4
|
|
$
|
6.6
|
|
||
|
Additions for tax positions taken in prior years
|
25.2
|
|
6.1
|
|
0.4
|
|
|||||
|
Reductions for tax positions taken in prior years
|
—
|
|
(0.6
|
)
|
—
|
|
|||||
|
Additions for tax positions taken in the current year
|
35.3
|
|
51.3
|
|
3.4
|
|
|||||
|
Unrecognized tax benefits at the end of the period
|
$
|
127.7
|
|
$
|
67.2
|
|
$
|
10.4
|
|
||
During the year ended July 31, 2016, our additions for tax positions taken in prior years and additions for tax positions taken in the current year were primarily attributable to uncertain tax positions relating to federal and state research and development credits, adjustments for California apportionment, and transfer pricing methodologies.
As of
July 31, 2016
, we had approximately
$9.7 million
of undistributed earnings in foreign subsidiaries. We expect to permanently reinvest these earnings outside of the United States to fund future foreign operations. We project that we will have sufficient cash flow in the United States and will not need to repatriate the foreign earnings to finance our domestic operations. If we were to distribute these earnings to the United States, we would be subject to U.S. income taxes, an adjustment for foreign tax credits, and foreign withholding taxes. We have not recorded a deferred tax liability on any portion of our undistributed earnings in foreign subsidiaries. If we were to repatriate these earnings to the United States, any associated income tax liability would be insignificant.
12. Net Income (Loss) Per Share
Basic net income (loss) per share is computed by dividing net income (loss) by basic weighted-average shares outstanding during the period. Diluted net income (loss) per share is computed by dividing net income (loss) by diluted weighted-average shares outstanding, including potentially dilutive securities.
The following table presents the computation of basic and diluted net loss per share of common stock (in millions, except per share data):
|
|
Year Ended July 31,
|
||||||||||
|
|
2016
|
2015
|
2014
|
||||||||
|
Net loss
|
$
|
(225.9
|
)
|
$
|
(165.0
|
)
|
$
|
(226.5
|
)
|
||
|
Weighted-average shares used to compute net loss per share, basic and diluted
|
87.1
|
|
81.6
|
|
74.3
|
|
|||||
|
Net loss per share, basic and diluted
|
$
|
(2.59
|
)
|
$
|
(2.02
|
)
|
$
|
(3.05
|
)
|
||
-
79
-
The following securities were excluded from the computation of diluted net loss per share of common stock for the periods presented as their effect would have been antidilutive (in millions):
|
Year Ended July 31,
|
||||||||
|
2016
|
2015
|
2014
|
||||||
|
RSUs
|
6.5
|
|
7.2
|
|
6.0
|
|
||
|
Convertible senior notes
|
5.2
|
|
5.2
|
|
5.2
|
|
||
|
Warrants related to the issuance of convertible senior notes
|
5.2
|
|
5.2
|
|
5.2
|
|
||
|
Options to purchase common stock
|
2.1
|
|
3.3
|
|
5.8
|
|
||
|
RSAs
|
1.1
|
|
—
|
|
—
|
|
||
|
ESPP shares
|
0.1
|
|
0.1
|
|
0.1
|
|
||
|
Total
|
20.2
|
|
21.0
|
|
22.3
|
|
||
13. Employee Benefit Plan
We have established a 401(k) tax-deferred savings plan which permits participants to make contributions by salary deduction pursuant to Section 401(k) of the Internal Revenue Code. In fiscal 2016, we began to make matching contributions based upon the amount of employees’ contributions, subject to certain limitations. Our matching contributions to the plan were immaterial for the year ended July 31, 2016.
14
. Segment Information
We conduct business globally and are primarily managed on a geographic theater basis. Our chief operating decision maker reviews financial information presented on a consolidated basis accompanied by information about revenue by geographic region for purposes of allocating resources and evaluating financial performance. We have one business activity and there are no segment managers who are held accountable for operations, operating results, and plans for levels, components, or types of products or services below the consolidated unit level. Accordingly, we are considered to be in a single reportable segment and operating unit structure.
The following table presents revenue by geographic theater (in millions):
|
|
Year Ended July 31,
|
||||||||||
|
|
2016
|
2015
|
2014
|
||||||||
|
Revenue:
|
|||||||||||
|
Americas
|
|||||||||||
|
United States
|
$
|
901.8
|
|
$
|
593.8
|
|
$
|
363.2
|
|
||
|
Other Americas
|
71.4
|
|
45.6
|
|
33.5
|
|
|||||
|
Total Americas
|
973.2
|
|
639.4
|
|
396.7
|
|
|||||
|
Europe, the Middle East, and Africa (“EMEA”)
|
247.1
|
|
178.7
|
|
126.9
|
|
|||||
|
Asia Pacific and Japan (“APAC”)
|
158.2
|
|
110.0
|
|
74.6
|
|
|||||
|
Total revenue
|
$
|
1,378.5
|
|
$
|
928.1
|
|
$
|
598.2
|
|
||
The following table presents revenue for groups of similar products and services (in millions):
|
|
Year Ended July 31,
|
||||||||||
|
|
2016
|
2015
|
2014
|
||||||||
|
Revenue:
|
|||||||||||
|
Product
|
$
|
670.8
|
|
$
|
492.7
|
|
$
|
340.1
|
|
||
|
Services
|
|||||||||||
|
Subscription
|
357.0
|
|
212.7
|
|
123.2
|
|
|||||
|
Support and maintenance
|
350.7
|
|
222.7
|
|
134.9
|
|
|||||
|
Total services
|
707.7
|
|
435.4
|
|
258.1
|
|
|||||
|
Total revenue
|
$
|
1,378.5
|
|
$
|
928.1
|
|
$
|
598.2
|
|
||
Substantially all of our assets were attributable to our U.S. operations as of
July 31, 2016
and
2015
.
-
80
-
15. Selected Quarterly Financial Data (Unaudited)
The following tables set forth selected unaudited quarterly financial data for the years ended
July 31, 2016
and
2015
(in millions, except per share amounts):
|
|
Three Months Ended
|
||||||||||||||
|
|
Oct. 31,
2015
|
Jan. 31,
2016
|
Apr. 30,
2016
|
Jul. 31,
2016
|
|||||||||||
|
Revenue:
|
|||||||||||||||
|
Product
|
$
|
147.7
|
|
$
|
169.9
|
|
$
|
162.1
|
|
$
|
191.1
|
|
|||
|
Services
|
149.5
|
|
164.8
|
|
183.7
|
|
209.7
|
|
|||||||
|
Total revenue
|
297.2
|
|
334.7
|
|
345.8
|
|
400.8
|
|
|||||||
|
Cost of revenue:
|
|||||||||||||||
|
Product
|
38.8
|
|
44.9
|
|
43.2
|
|
48.5
|
|
|||||||
|
Services
|
40.4
|
|
49.3
|
|
51.7
|
|
53.2
|
|
|||||||
|
Total cost of revenue
|
79.2
|
|
94.2
|
|
94.9
|
|
101.7
|
|
|||||||
|
Total gross profit
|
218.0
|
|
240.5
|
|
250.9
|
|
299.1
|
|
|||||||
|
Operating expenses:
|
|||||||||||||||
|
Research and development
|
59.7
|
|
74.0
|
|
74.0
|
|
76.5
|
|
|||||||
|
Sales and marketing
|
158.3
|
|
187.6
|
|
202.0
|
|
228.1
|
|
|||||||
|
General and administrative
|
30.8
|
|
34.2
|
|
33.5
|
|
39.9
|
|
|||||||
|
Total operating expenses
|
248.8
|
|
295.8
|
|
309.5
|
|
344.5
|
|
|||||||
|
Operating loss
|
(30.8
|
)
|
(55.3
|
)
|
(58.6
|
)
|
(45.4
|
)
|
|||||||
|
Interest expense
|
(5.8
|
)
|
(5.8
|
)
|
(5.8
|
)
|
(6.0
|
)
|
|||||||
|
Other income, net
|
2.2
|
|
2.5
|
|
1.0
|
|
2.7
|
|
|||||||
|
Loss before income taxes
|
(34.4
|
)
|
(58.6
|
)
|
(63.4
|
)
|
(48.7
|
)
|
|||||||
|
Provision for income taxes
|
4.3
|
|
3.9
|
|
6.8
|
|
5.8
|
|
|||||||
|
Net loss
|
$
|
(38.7
|
)
|
$
|
(62.5
|
)
|
$
|
(70.2
|
)
|
$
|
(54.5
|
)
|
|||
|
Net loss per share, basic and diluted
|
$
|
(0.45
|
)
|
$
|
(0.72
|
)
|
$
|
(0.80
|
)
|
$
|
(0.61
|
)
|
|||
-
81
-
|
|
Three Months Ended
|
||||||||||||||
|
|
Oct. 31,
2014 |
Jan. 31,
2015 |
Apr. 30,
2015 |
Jul. 31,
2015 |
|||||||||||
|
Revenue:
|
|||||||||||||||
|
Product
|
$
|
101.5
|
|
$
|
115.6
|
|
$
|
121.5
|
|
$
|
154.1
|
|
|||
|
Services
|
90.8
|
|
102.1
|
|
112.7
|
|
129.8
|
|
|||||||
|
Total revenue
|
192.3
|
|
217.7
|
|
234.2
|
|
283.9
|
|
|||||||
|
Cost of revenue:
|
|||||||||||||||
|
Product
|
29.1
|
|
30.7
|
|
32.8
|
|
38.5
|
|
|||||||
|
Services
|
24.3
|
|
28.7
|
|
31.6
|
|
35.8
|
|
|||||||
|
Total cost of revenue
|
53.4
|
|
59.4
|
|
64.4
|
|
74.3
|
|
|||||||
|
Total gross profit
|
138.9
|
|
158.3
|
|
169.8
|
|
209.6
|
|
|||||||
|
Operating expenses:
|
|||||||||||||||
|
Research and development
|
37.3
|
|
47.0
|
|
48.4
|
|
53.1
|
|
|||||||
|
Sales and marketing
|
106.4
|
|
122.8
|
|
131.1
|
|
162.4
|
|
|||||||
|
General and administrative
|
19.0
|
|
27.0
|
|
27.0
|
|
28.6
|
|
|||||||
|
Total operating expenses
|
162.7
|
|
196.8
|
|
206.5
|
|
244.1
|
|
|||||||
|
Operating loss
|
(23.8
|
)
|
(38.5
|
)
|
(36.7
|
)
|
(34.5
|
)
|
|||||||
|
Interest expense
|
(5.5
|
)
|
(5.5
|
)
|
(5.7
|
)
|
(5.6
|
)
|
|||||||
|
Other income (expense), net
|
0.4
|
|
0.3
|
|
—
|
|
(0.5
|
)
|
|||||||
|
Loss before income taxes
|
(28.9
|
)
|
(43.7
|
)
|
(42.4
|
)
|
(40.6
|
)
|
|||||||
|
Provision for (benefit from) income taxes
|
1.2
|
|
(0.7
|
)
|
3.5
|
|
5.4
|
|
|||||||
|
Net loss
|
$
|
(30.1
|
)
|
$
|
(43.0
|
)
|
$
|
(45.9
|
)
|
$
|
(46.0
|
)
|
|||
|
Net loss per share, basic and diluted
|
$
|
(0.38
|
)
|
$
|
(0.53
|
)
|
$
|
(0.56
|
)
|
$
|
(0.55
|
)
|
|||
16. Subsequent Events
Share Repurchase
On August 26, 2016, our board of directors authorized a
$500.0 million
share repurchase which will be funded from available working capital. Repurchases may be made at management’s discretion from time to time on the open market, through privately negotiated transactions, transactions structured through investment banking institutions, block purchase techniques, 10b5-1 trading plans, or a combination of the foregoing. The repurchase authorization will expire on August 31, 2018, and may be suspended or discontinued at any time.
Hedging
On August 30, 2016, we entered into forward contracts with a notional amount of
€66.9 million
to hedge the foreign currency exposure related to our euro-denominated expenditures for the fiscal year ending July 31, 2017. These forward contracts have been designated as hedging instruments for hedge accounting purposes.
|
ITEM 9.
|
CHANGES IN AND DISAGREEMENTS WITH ACCOUNTANTS ON ACCOUNTING AND FINANCIAL DISCLOSURE
|
None.
|
ITEM 9A.
|
CONTROLS AND PROCEDURES
|
Evaluation of Disclosure Controls and Procedures
Our management, with the participation of our chief executive officer and chief financial officer, evaluated the effectiveness of our disclosure controls and procedures pursuant to Rule 13a-15 under the Securities Exchange Act of 1934, as amended (the “Exchange Act”). In designing and evaluating the disclosure controls and procedures, management recognizes that any controls and procedures, no matter how well designed and operated, can provide only reasonable assurance of achieving the desired control
-
82
-
objectives. In addition, the design of disclosure controls and procedures must reflect the fact that there are resource constraints and that management is required to apply its judgment in evaluating the benefits of possible controls and procedures relative to their costs.
Based on our evaluation, our chief executive officer and chief financial officer concluded that, as of
July 31, 2016
, our disclosure controls and procedures are designed at a reasonable assurance level and are effective to provide reasonable assurance that information we are required to disclose in reports that we file or submit under the Exchange Act is recorded, processed, summarized, and reported within the time periods specified in Securities and Exchange Commission (SEC) rules and forms, and that such information is accumulated and communicated to our management, including our chief executive officer and chief financial officer, as appropriate, to allow timely decisions regarding required disclosure.
Management’s Annual Report on Internal Control Over Financial Reporting
For “Management’s Annual Report on Internal Control Over Financial Reporting” see the report under Part II, Item 8 of this Annual Report on Form 10-K, which report is incorporated herein by reference.
For the “Report of Independent Registered Public Accounting Firm,” see the report under Part II, Item 8 of this Annual Report on Form 10-K, which report is incorporated herein by reference.
Changes in Internal Control Over Financial Reporting
There were no changes in our internal control over financial reporting identified in connection with the evaluation required by Rule 13a-15(d) and 15d-15(d) of the Exchange Act that occurred during the quarter ended
July 31, 2016
that have materially affected, or are reasonably likely to materially affect, our internal control over financial reporting.
|
ITEM 9B.
|
OTHER INFORMATION
|
None.
-
83
-
|
ITEM 10.
|
DIRECTORS, EXECUTIVE OFFICERS AND CORPORATE GOVERNANCE
|
Executive Officers and Directors
The information required by this item will be contained in our definitive proxy statement to be filed with the SEC in connection with our
2016
annual meeting of stockholders (the “Proxy Statement”), which is expected to be filed not later than 120 days after the end of our fiscal year ended
July 31, 2016
, and is incorporated in this report by reference.
|
ITEM 11.
|
EXECUTIVE COMPENSATION
|
The information required by this item will be set forth in the Proxy Statement and is incorporated herein by reference.
|
ITEM 12.
|
SECURITY OWNERSHIP OF CERTAIN BENEFICIAL OWNERS AND MANAGEMENT AND RELATED STOCKHOLDER MATTERS
|
The information required by this item will be set forth in the Proxy Statement and is incorporated herein by reference.
|
ITEM 13.
|
CERTAIN RELATIONSHIPS AND RELATED TRANSACTIONS, AND DIRECTOR INDEPENDENCE
|
The information required by this item will be set forth in the Proxy Statement and is incorporated herein by reference.
|
ITEM 14.
|
PRINCIPAL ACCOUNTANT FEES AND SERVICES
|
The information required by this item will be set forth in the Proxy Statement and is incorporated herein by reference.
-
84
-
|
ITEM 15.
|
EXHIBITS AND FINANCIAL STATEMENT SCHEDULES
|
Documents filed as part of this Annual Report on Form 10-K are as follows:
|
1.
|
Consolidated Financial Statements
|
Our Consolidated Financial Statements are listed in the “Index to Consolidated Financial Statements” under Part II, Item 8 of this Annual Report on Form 10-K.
|
2.
|
Financial Statement Schedules
|
Financial statement schedules have been omitted because they are not required, not applicable, not present in amounts sufficient to require submission of the schedule, or the required information is shown in the Consolidated Financial Statements or Notes thereto.
|
3.
|
Exhibits
|
The documents listed in the Exhibit Index of this Annual Report on Form 10-K are incorporated by reference or are filed with this Annual Report on Form 10-K, in each case as indicated therein (numbered in accordance with Item 601 of Regulation S-K).
-
85
-
SIGNATURES
Pursuant to the requirements of Section 13 or 15(d) of the Securities Exchange Act of 1934, the Registrant has duly caused this report to be signed on its behalf by the undersigned, thereunto duly authorized, on
September 8, 2016
.
|
PALO ALTO NETWORKS, INC.
|
|
|
By:
|
/s/ M
ARK
D. M
C
L
AUGHLIN
|
|
Mark D. McLaughlin
|
|
|
Chief Executive Officer
|
|
-
86
-
POWER OF ATTORNEY
KNOW ALL THESE PERSONS BY THESE PRESENTS, that each person whose signature appears below constitutes and appoints Mark D. McLaughlin and Steffan C. Tomlinson, and each of them, as his true and lawful attorney-in-fact and agent, with full power of substitution and resubstitution, for him and in his name, place and stead, in any and all capacities, to sign any and all amendments to this Annual Report on Form 10-K, and to file the same, with all exhibits thereto, and other documents in connection therewith, with the Securities and Exchange Commission, granting unto said attorneys-in-fact and agents, and each of them, full power and authority to do and perform each and every act and thing requisite and necessary to be done in connection therewith, as fully to all intents and purposes as he might or could do in person, hereby ratifying and confirming all that said attorneys-in-fact and agents, or any of them, or their or his substitutes, may lawfully do or cause to be done by virtue thereof.
Pursuant to the requirements of the Securities Exchange Act of 1934, this report has been signed below by the following persons on behalf of the Registrant and in the capacities and on the dates indicated:
|
Signature
|
Title
|
|
Date
|
|
|
/s/ M
ARK
D. M
C
L
AUGHLIN
|
Chief Executive Officer and Director (Principal Executive Officer)
|
|
September 8, 2016
|
|
|
Mark D. McLaughlin
|
||||
|
/s/ S
TEFFAN
C. T
OMLINSON
|
Chief Financial Officer (Principal Accounting and Financial Officer)
|
|
September 8, 2016
|
|
|
Steffan C. Tomlinson
|
||||
|
/s/ N
IR
Z
UK
|
Chief Technical Officer and Director
|
|
September 8, 2016
|
|
|
Nir Zuk
|
||||
|
/s/ F
RANK
C
ALDERONI
|
Director
|
September 8, 2016
|
||
|
Frank Calderoni
|
||||
|
/s/ A
SHEEM
C
HANDNA
|
Director
|
|
September 8, 2016
|
|
|
Asheem Chandna
|
||||
|
/s/ J
OHN
M. D
ONOVAN
|
Director
|
|
September 8, 2016
|
|
|
John M. Donovan
|
||||
|
/s/ C
ARL
E
SCHENBACH
|
Director
|
|
September 8, 2016
|
|
|
Carl Eschenbach
|
||||
|
/s/ J
AMES
J. G
OETZ
|
Director
|
|
September 8, 2016
|
|
|
James J. Goetz
|
||||
|
/s/ S
TANLEY
J. M
ERESMAN
|
Director
|
|
September 8, 2016
|
|
|
Stanley J. Meresman
|
||||
|
/s/ D
ANIEL
J. W
ARMENHOVEN
|
Director
|
|
September 8, 2016
|
|
|
Daniel J. Warmenhoven
|
||||
-
87
-
EXHIBIT INDEX
|
Exhibit
Number
|
Exhibit Description
|
Incorporated by Reference
|
||||||||
|
Form
|
File No.
|
Exhibit
|
Filing Date
|
|||||||
|
3.1
|
Restated Certificate of Incorporation of the Registrant.
|
10-K
|
001-35594
|
3.1
|
October 4, 2012
|
|||||
|
3.2
|
Amended and Restated Bylaws of the Registrant.
|
10-K
|
001-35594
|
3.2
|
October 4, 2012
|
|||||
|
4.1
|
Warrant to Purchase Stock by Juniper Networks, Inc.
|
8-K
|
001-35594
|
4.1
|
June 4, 2014
|
|||||
|
4.2
|
Indenture between the Registrant and U.S. Bank National Association, dated as of June 30, 2014.
|
8-K
|
001-35594
|
4.1
|
July 1, 2014
|
|||||
|
10.1*
|
Form of Indemnification Agreement between the Registrant and its directors and officers.
|
S-1/A
|
333-180620
|
10.1
|
July 9, 2012
|
|||||
|
10.2*
|
2005 Equity Incentive Plan and related form agreements under 2005 Equity Incentive Plan.
|
S-1/A
|
333-180620
|
10.2
|
July 9, 2012
|
|||||
|
10.3*
|
2012 Equity Incentive Plan and related form agreements under 2012 Equity Incentive Plan, as amended.
|
10-K
|
001-35594
|
10.3
|
September 18, 2014
|
|||||
|
10.4*
|
2012 Employee Stock Purchase Plan and related form agreements under 2012 Employee Stock Purchase Plan, as amended and restated.
|
10-Q
|
001-35594
|
10.3
|
November 25, 2014
|
|||||
|
10.5*
|
Employee Incentive Compensation Plan, as amended and restated.
|
10-Q
|
001-35594
|
10.2
|
November 25, 2014
|
|||||
|
10.6*
|
Offer Letter between the Registrant and Mark D. McLaughlin, dated July 21, 2011, as amended.
|
S-1
|
333-180620
|
10.6
|
April 6, 2012
|
|||||
|
10.7*
|
Offer Letter between the Registrant and Steffan C. Tomlinson, dated January 17, 2012.
|
S-1
|
333-180620
|
10.7
|
April 6, 2012
|
|||||
|
10.8*
|
Letter Agreement between the Registrant and Nir Zuk, dated December 19, 2011.
|
S-1
|
333-180620
|
10.8
|
April 6, 2012
|
|||||
|
10.9*
|
Letter Agreement between the Registrant and René Bonvanie, dated December 19, 2011.
|
S-1
|
333-180620
|
10.10
|
April 6, 2012
|
|||||
|
10.10*
|
Offer Letter between the Registrant and Stanley J. Meresman, dated September 8, 2014.
|
8-K
|
001-35594
|
10.1
|
September 22, 2014
|
|||||
|
10.11*
|
Offer Letter between the Registrant and Daniel J. Warmenhoven, dated February 14, 2012.
|
S-1
|
333-180620
|
10.13
|
April 6, 2012
|
|||||
|
10.12*
|
Offer Letter between the Registrant and Mark F. Anderson, dated May 23, 2012.
|
S-1/A
|
333-180620
|
10.16
|
July 9, 2012
|
|||||
|
10.13*
|
Offer Letter between the Registrant and John M. Donovan, dated September 14, 2012.
|
8-K
|
001-35594
|
10.1
|
September 20, 2012
|
|||||
|
10.14*
|
Offer Letter between the Registrant and Carl Eschenbach, dated May 9, 2013.
|
8-K
|
001-35594
|
10.1
|
May 30, 2013
|
|||||
|
10.15*
|
Offer Letter between the Registrant and Frank Calderoni, dated February 24, 2016.
|
8-K
|
001-35594
|
10.1
|
February 25, 2016
|
|||||
|
10.16
|
Lease between the Registrant and Santa Clara Office Partners LLC, dated October 20, 2010, as amended.
|
S-1
|
333-180620
|
10.14
|
April 6, 2012
|
|||||
|
10.17
|
Amendment No. 2 to Lease between the Registrant and Santa Clara Office Partners LLC, dated July 2, 2013.
|
10-K
|
001-35594
|
10.17
|
September 25, 2013
|
|||||
|
10.18
|
Lease between the Registrant and SI 34 LLC, dated September 17, 2012.
|
10-K
|
001-35594
|
10.16
|
October 4, 2012
|
|||||
|
10.19
|
Lease between the Registrant and SI 34 LLC, dated September 17, 2012.
|
10-K
|
001-35594
|
10.16
|
October 4, 2012
|
|||||
-
88
-
|
Exhibit
Number
|
Exhibit Description
|
Incorporated by Reference
|
||||||||
|
Form
|
File No.
|
Exhibit
|
Filing Date
|
|||||||
|
10.20**
|
Amended and Restated Flextronics Manufacturing Services Agreement, by and between the Registrant and Flextronics Telecom Systems Ltd., dated December 8, 2015.
|
8-K
|
001-35594
|
10.1
|
December 14, 2015
|
|||||
|
10.21
|
Settlement, Release and Cross-License Agreement, dated May 27, 2014, by and between the Registrant and Juniper Networks, Inc.
|
8-K
|
001-35594
|
10.1
|
May 28, 2014
|
|||||
|
10.22
|
Share Purchase Agreement between the Registrant, Cyvera Ltd., Palo Alto Networks Holding B.V., the shareholders of Cyvera Ltd. and Shareholder Representative Services LLC, dated March 22, 2014.
|
10-Q
|
001-35594
|
10.1
|
June 3, 2014
|
|||||
|
10.23
|
Amendment No. 1 to the Share Purchase Agreement between the Registrant, Cyvera Ltd., Palo Alto Networks Holding B.V., the shareholders of Cyvera Ltd. and Shareholder Representative Services LLC, dated April 9, 2014.
|
10-Q
|
001-35594
|
10.2
|
June 3, 2014
|
|||||
|
10.24
|
Purchase Agreement, dated June 24, 2014, by and among the Registrant and J.P. Morgan Securities LLC, RBC Capital Markets, LLC and Citigroup Global Markets Inc., as representatives of the initial purchasers named therein.
|
8-K
|
001-35594
|
10.1
|
June 26, 2014
|
|||||
|
10.25
|
Form of Convertible Note Hedge Confirmation.
|
8-K
|
001-35594
|
10.2
|
June 26, 2014
|
|||||
|
10.26
|
Form of Warrant Confirmation.
|
8-K
|
001-35594
|
10.3
|
June 26, 2014
|
|||||
|
10.27
|
Lease between the Registrant and Santa Clara Campus Property Owner I LLC, dated May 28, 2015.
|
10-K
|
001-35594
|
10.29
|
September 17, 2015
|
|||||
|
10.28
|
Lease between the Registrant and Santa Clara Campus Property Owner I LLC, dated May 28, 2015.
|
10-K
|
001-35594
|
10.30
|
September 17, 2015
|
|||||
|
10.29
|
Lease between the Registrant and Santa Clara Campus Property Owner I LLC, dated May 28, 2015.
|
10-K
|
001-35594
|
10.31
|
September 17, 2015
|
|||||
|
10.30
|
Lease by and between the Registrant and Santa Clara Campus Property Owner I LLC, dated October 7, 2015.
|
8-K
|
001-35594
|
10.1
|
October 19, 2015
|
|||||
|
10.31
|
Amendment No. 1 to Lease by and between the Registrant and Santa Clara Phase I Property LLC, dated November 9, 2015.
|
10-Q
|
001-35594
|
10.2
|
November 24, 2015
|
|||||
|
10.32
|
Amendment No. 1 to Lease by and between the Registrant and Santa Clara Campus Property Owner I LLC, dated November 9, 2015.
|
10-Q
|
001-35594
|
10.3
|
November 24, 2015
|
|||||
|
21.1
|
List of subsidiaries of the Registrant.
|
|||||||||
|
23.1
|
Consent of Independent Registered Public Accounting Firm.
|
|||||||||
|
24.1
|
Power of Attorney (contained in the signature page to this Annual Report on Form 10-K).
|
|||||||||
|
31.1
|
Certification of the Chief Executive Officer pursuant to Section 302(a) of the Sarbanes-Oxley Act of 2002.
|
|||||||||
|
31.2
|
Certification of the Chief Financial Officer pursuant to Section 302(a) of the Sarbanes-Oxley Act of 2002.
|
|||||||||
|
32.1†
|
Certification of Chief Executive Officer pursuant to 18 U.S.C. Section 1350, as adopted pursuant to section 906 of the Sarbanes-Oxley Act of 2002.
|
|||||||||
-
89
-
|
Exhibit
Number
|
Exhibit Description
|
Incorporated by Reference
|
||||||||
|
Form
|
File No.
|
Exhibit
|
Filing Date
|
|||||||
|
32.2†
|
Certification of Chief Financial Officer pursuant to 18 U.S.C. Section 1350, as adopted pursuant to section 906 of the Sarbanes-Oxley Act of 2002.
|
|||||||||
|
101.INS
|
XBRL Instance Document.
|
|||||||||
|
101.SCH
|
XBRL Taxonomy Schema Linkbase Document.
|
|||||||||
|
101.CAL
|
XBRL Taxonomy Calculation Linkbase Document.
|
|||||||||
|
101.DEF
|
XBRL Taxonomy Definition Linkbase Document.
|
|||||||||
|
101.LAB
|
XBRL Taxonomy Labels Linkbase Document.
|
|||||||||
|
101.PRE
|
XBRL Taxonomy Presentation Linkbase Document.
|
|||||||||
|
*
|
Indicates a management contract or compensatory plan or arrangement.
|
|
**
|
Registrant has omitted portions of the relevant exhibit and filed such exhibit separately with the Securities and Exchange Commission pursuant to a request for confidential treatment under Rule 406 under the Securities Act of 1933, as amended.
|
|
†
|
The certifications attached as Exhibit 32.1 and Exhibit 32.2 that accompany this Annual Report on Form 10-K, are not deemed filed with the Securities and Exchange Commission and are not to be incorporated by reference into any filing of the Registrant under the Securities Act of 1933, as amended, or the Securities Exchange Act of 1934, as amended, whether made before or after the date of this Annual Report on Form 10-K, irrespective of any general incorporation language contained in such filing.
|
-
90
-
TABLE OF CONTENTS
Part IItem 1. BusinessItem 1A. Risk FactorsItem 1B. Unresolved Staff CommentsItem 2. PropertiesItem 3. Legal ProceedingsItem 4. Mine Safety DisclosuresPart IIItem 5. Market For Registrant S Common Equity, Related Stockholder Matters and Issuer Purchases Of Equity SecuritiesItem 6. Selected Financial DataItem 7. Management S Discussion and Analysis Of Financial Condition and Results Of OperationsItem 7A. Quantitative and Qualitative Disclosures About Market RiskItem 8. Financial Statements and Supplementary DataItem 9. Changes in and Disagreements with Accountants on Accounting and Financial DisclosureItem 9A. Controls and ProceduresItem 9B. Other InformationPart IIIItem 10. Directors, Executive Officers and Corporate GovernanceItem 11. Executive CompensationItem 12. Security Ownership Of Certain Beneficial Owners and Management and Related Stockholder MattersItem 13. Certain Relationships and Related Transactions, and Director IndependenceItem 14. Principal Accountant Fees and ServicesPart IVItem 15. Exhibits and Financial Statement Schedules