PAID INC
10-Ks and 10-Qs
|
|
|
|
|
UNITED STATES
SECURITIES AND EXCHANGE COMMISSION
Washington, D.C. 20549
FORM 10-K
þ
Annual Report Pursuant to Section 13 or 15(d) of the Securities Exchange Act of 1934
For the fiscal year ended December 31, 2011 or
¨
Transition Report Pursuant to Section 13 or 15(d) of the Securities Exchange Act of 1934
For the transition period from
to
COMMISSION FILE NUMBER 0-28720

(Exact Name of Registrant as Specified in its Charter)
|
DELAWARE
|
73-1479833
|
|
(State or Other Jurisdiction of Incorporation or Organization)
|
(I.R.S. Employer Identification No.)
|
40 Washington Street, Westborough, Massachusetts 01581
(Address of Principal Executive Offices) (Zip Code)
(617) 861-6050
(Registrant’s Telephone Number, Including Area Code)
Securities registered under Section 12(b) of the Act:
None
Securities registered under Section 12(g) of the Act:
Common Stock, $0.001 Par Value
Indicate by check mark if the registrant is a well-known seasoned issuer, as defined in Rule 405 of the Securities Act.
Yes
o
No
þ
Indicate by check mark if the registrant is not required to file reports pursuant to Section 13 or Section 15(d) of the Act.
Yes
o
No
þ
Indicate by check mark whether the registrant: (1) has filed all reports required to be filed by Section 13 or 15(d) of the Securities Exchange Act of 1934 during the preceding 12 months (or for such shorter period that the registrant was required to file such reports), and (2) has been subject to such filing requirements for the past 90 days. Yes
¨
No
þ
Indicate by check mark whether the registrant has submitted electronically and posted on its corporate Web site, if any, every Interactive Data File required to be submitted and posted pursuant to Rule 405 of Regulation S-T (§232.405 of this chapter) during the preceding 12 months (or for such shorter period that the registrant was required to submit and post such files). Yes
þ
No
o
Indicate by check mark if disclosure of delinquent filers pursuant to Item 405 of Regulation S-K is not contained herein, and will not be contained, to the best of registrant's knowledge, in definitive proxy or information statements incorporated by reference in Part III of this Form 10-K or any amendment to this Form 10-K.
o
Indicate by check mark whether the registrant is a large accelerated filer, an accelerated filer, a non-accelerated filer, or a smaller reporting company. See the definitions of “large accelerated filer”, “accelerated filer”, and “smaller reporting company” in Rule 12b-2 of the Exchange Act. (Check one):
|
Large accelerated filer
|
o
|
Accelerated Filer
|
þ
|
Non-accelerated filer
|
o
|
Smaller reporting company
|
o
|
Indicate by check mark whether the registrant is a shell company (as defined in Rule 12b-2 of the Exchange Act). Yes
o
No
þ
The aggregate market value of the common stock held by non-affiliates of the registrant based on the last sale price of such stock as reported by the Over-the-Counter Bulletin Board on June 30, 2011 (the last business day of the Registrant's most recently completed second fiscal quarter) was approximately $101,275,449
As of
May 10, 2012
, the registrant had
311,390,478
shares of Common Stock outstanding.
DOCUMENTS INCORPORATED BY REFERENCE
No documents are incorporated by reference into this Annual Report except those Exhibits so incorporated as set forth in the Exhibit Index
PAID, INC.
FORM 10-K
FOR THE YEARS ENDED DECEMBER 31, 2011, 2010, AND 2009
TABLE OF CONTENTS
|
PART I
|
|
||
|
|
|
|
|
|
|
|||
|
|
|||
|
PART II
|
|||
|
PART III
|
|||
|
Item 12
.
|
|||
|
PART IV
|
|||
-
2
-
Forward Looking Statements
This Annual Report on Form 10-K contains certain forward-looking statements (within the meaning of Section 27A of the Securities Act of 1933 and Section 21E of the Securities Exchange Act of 1934) regarding the Company and its business, financial condition, results of operations and prospects. Words such as "expects," "anticipates," "intends," "plans," "believes," "seeks," "estimates", "could", "may", "should", "will", "would", and similar expressions or variations of such words are intended to identify forward-looking statements in this report. Additionally, statements concerning future matters such as the development of new services, technology enhancements, purchases of equipment, credit arrangements, possible changes in legislation and other statements regarding matters that are not historical are forward-looking statements.
Although forward-looking statements in this Annual Report reflect the good faith judgment of the Company's management, such statements can be based only on facts and factors currently known by the Company. Further, whether actual results will conform to our expectations and predictions is subject to a number of known and unknown risks and uncertainties, including the risks and uncertainties discussed in this Annual Report; general economic, market, or business conditions; the opportunities that may be presented to and pursued by us; competitive actions by other companies; changes in laws or regulations; and other circumstances, many of which are beyond our control. Thus, actual results and outcomes may differ materially from results and outcomes discussed in this report. Although the Company believes that its plans, intentions and expectations reflected in these forward-looking statements are reasonable, the Company can give no assurance that its plans, intentions or expectations will be achieved. For a more complete discussion of these risk factors, see Item 1A, "Risk Factors".
For example, the Company's ability to achieve positive cash flow and to become profitable may be adversely affected as a result of a number of factors that could thwart its efforts. These factors include the Company's inability to successfully implement the Company's business and revenue model, tour or event cancellations, higher costs than anticipated, the Company's inability to sell its products and services to a sufficient number of customers, the introduction of competing products by others, the Company's failure to attract sufficient interest in and traffic to its sites, the Company's inability to complete development of its sites, the failure of the Company's operating systems, and the Company's inability to increase its revenues as rapidly as anticipated. If the Company is not profitable in the future, it will not be able to continue its business operations.
Except as required by applicable laws, we do not intend to publish updates or revisions of any forward-looking statements we make to reflect new information, future events or otherwise. Readers are urged to review carefully and to consider the various disclosures made by the Company in this Annual Report, which attempts to advise interested parties of the risks and factors that may affect our business, financial condition, results of operations and prospects.
Overview
PAID, Inc. (the “Company”) was incorporated in Delaware on August 9, 1995. The Company's main web address is located at www.paid.com,
which offers updated information on various aspects of our operations. Information contained in the Company's website shall not be deemed to be a part of this Annual Report. The Company's principal executive offices are located at 40 Washington Street, Westborough, Massachusetts 01581, and the Company's telephone number is (617) 861-6050.
We file annual reports on Form 10-K, quarterly reports on Form 10-Q, and current reports on Form 8-K with the Securities and Exchange Commission (the “SEC”). These reports, any amendments to these reports, proxy and information statements and certain other documents we file with the SEC are available through the SEC's website at www.sec.gov or free of charge on our website as soon as reasonably practicable after we file the documents with the SEC. The public may also read and copy these reports and any other materials we file with the SEC at the SEC's Public Reference Room at 100 F Street, NE, Washington, D.C. 20549. You may obtain information on the operation of the Public Reference Room by calling the SEC at 1-800-SEC-0330.
Our Business
The Company's primary focus is to provide brand-related services to businesses, celebrity clients in the entertainment industry as well as charitable organizations. PAID's brand management, brand marketing, social media marketing, product design and merchandising, website design; development and hosting services are designed to grow each client's customer base in size, loyalty and revenue generation. We offer entertainers and business entities comprehensive web-presence and related services supporting and managing clients' official websites and fan-community services including e-commerce, VIP ticketing, live event fan experiences, user-generated content, client content publishing and distribution, fan forums, social network
-
3
-
management, social media marketing, customer data capture, management and analysis. PAID's brand support services also include design and production of print, audio and video promotion marketing materials for client branded products and events. In addition to sourcing, designing and marketing, PAID sells merchandise for celebrities and businesses, through official website stores and other web-based outlets as well as on-tour and retail outlets. Our celebrity services proprietary content management system and our use of both off-the-shelf best of class and proprietary software applications provides an opportunity for our clients to offer a Direct-To-Consumer solution enabling more information, merchandise and experiences directly to their customers and communities while optimizing our ability to capture customer data and build robust customer data-bases for them. We provide business management tools for online retailers, through AuctionInc, which is home to our patented shipping calculator and automated auction checkout and order processing system. This system provides the fundamental structure for our celebrity web hosting and development services, and for individuals seeking a professional and interactive presence on the Internet.
All the sales for our celebrity and entertainment services, other than retail and tour merchandise, are made through the client's official website and official social network site and PAID's proprietary content managed system. A customer interested in a membership, merchandise, fan experience or ticket would use our system to make purchases, and then depending on the sale, the Company either ships the merchandise, or delivers the fan experience at a concert or other event. The services offered by a client depend upon the client's desire and willingness to offer different initiatives. Not all clients and customer bases are the same and the Company works closely with its different clients to cater to their unique needs. Our services also include video production, marketing, management, sponsorship, mobile marketing, and website development and management. We provide services for artists and organizations such as Aerosmith, The Moody Blues, Stand Up 2 Cancer, Deep Purple, comedian Ron White, Rockapella and others.
AuctionInc Software.
AuctionInc is a suite of online shipping management tools assisting businesses with e-commerce storefronts, shipping solutions, inventory management, and auction processing. The application was designed originally to reduce overhead costs for auction sales, but over time the functionality and core business is strictly focused on shipping calculations. The product does have tools to assist with other aspects of the fulfillment process, but the main purpose of the product is to provide accurate shipping calculations and packaging algorithms that provide customers with the best possible shipping solutions.
The AuctionInc system was originally designed to assist and improve just the Company's sales, but management realized that there was a need for an order management system for individuals and businesses that sell on the Internet, specifically at auction. In 2000 the Company's technology team focused its attention on the core fundamental piece of the system called the Shipping Calculator. The Company recognized the potential importance of the calculator and filed for a patent before launching it to the public in April of 2001. The Company obtained its first patent on the shipping calculator in January 2008, and the second patent in April 2011. The product is modular based and we continue to develop new tools and products for its customers.
Industry Background
Growth of the Internet and the Web
The Internet enables millions of people worldwide to share information, communicate and conduct business electronically. The growth in the number of Web users is being driven by the increasing importance of the Internet as a communications medium, an information resource, and a sales and distribution channel. The Internet has also evolved into a unique marketing channel. Unlike the traditional marketing channels, Internet retailers do not have many of the overhead costs borne by traditional retailers. The Internet offers the opportunity to create a large, geographically dispersed customer base more quickly than traditional retailers. The Internet also offers customers a broader selection of goods to purchase, provides sellers the opportunity to sell their goods more efficiently to a broader base of buyers and allows business transactions to occur at all hours.
State of Viral Communities on the Internet
The massive growth of online communities over the past decade has reached viral proportions. Internet communities are built revolving around ideas, music, individuals, artists, writers, or any tangible or intangible entity, and new content can be distributed within minutes of exposure. Artists can announce tours or other news, sell premium tickets to fan club members, sell merchandise, and other fan experiences. Viral communities and viral marketing are a phenomenon that web users are embracing with vigor. As traffic and communities continue to grow, more services will be required to sustain the appetite of these users.
-
4
-
Business Strategy
Our mission is to increase the Company's market share and revenues by providing products and services that grow each of our client's customer bases in size, loyalty and revenue generation. As the Company continues to support our clients in earning more, owning more and keeping more of the business they are responsible for having created in the first place, we continue to strengthen our reputation, add new clients to our client base and share in the increase in revenues across the aggregate of the Company's client roster. Our strategy to achieve our mission is based upon the following:
During 2011 we experienced continued expansion of our Direct-to-Consumer marketing, ecommerce and fulfillment services, celebrity web-hosting, merchandising and fan experience programs. We believe there will be an increase in online and social communities that will create an opportunity for more celebrity web store management, fan community monetization and fulfillment services. It is our view that our services and programs will become more desirable as these communities and social interaction increases. Our proprietary Content Management System was built to handle news, events, ticketing, fan experiences, e-commerce, video, music streaming, mobile services, downloads and forums. Our Customer Relationship Management was developed to facilitate the capture, analysis and management of customer data.
Fulfillment: The Company continues to increase fulfillment services by adding new business relationships to our fulfillment client roster. The Company is increasing new business development efforts - adding experienced sales and marketing personnel, targeting a greater number and wider range of companies in need of fulfillment services. The Company is providing fulfillment services as a partner to companies in a growing sector of commerce, ecommerce and social commerce service providers with ecommerce platforms which facilitate engagement and monetization of consumers via social media networks, distributed affiliate sites, and advertising networks but which do not offer inventory management and pick-pack-ship fulfillment services themselves.
The Company recognizes that fulfillment is a customer-facing service wherein the action of delivering a product to a customer provides the Company with the opportunity to 'touch' the customer multiple times throughout the fulfillment cycle. The Company sees this as an opportunity to incorporate into the fulfillment process increased sales and marketing tools and practices which result in an increase in per-customer purchases and new customer referrals.
Consumer Data Management: The monetization of consumer data continues to prove to be a growing and profitable business practice. The Company manages fan and customer communities also known as affinity groups which are representative of taste-makers and trend-setters whose interests and behaviors are valuable to the Company and the Company's clients as well as to a much greater range of marketers generally. These affinity groups can be quantified and qualified by the Company owing to the Company's established direct-to-consumer communication channels and practices, our robust Customer Relationship Management system and our consumer data analytics capabilities.
Our key objectives include the capture, analysis and monetization of consumer data with both short and longer term goals. We believe that by knowing the consumer better, we are able to turn consumers into customers. By targeting the customer with greater accuracy, delivering messages the customer has expressed interest in receiving, the Company can offer our customers and our clients' customers products and services they want to buy. Doing so reduces cost of sale, enables quicker inventory turns, results in higher margins and profits and also engenders customer trust and loyalty. Customer loyalty provides for a business-to-customer relationship in which the customer is positively inclined to share information about themselves - consumer data. Loyal customers engage in greater numbers and when incented by contests, VIP experiences, various promotions and product discounts, loyal fans/customers are willing to share information about themselves, their likes, dislikes, affiliations and consumer behaviors. The compilation and analysis of this consumer data can be fashioned into a suite of predictive modeling tools and made available as a B-to-B product for marketers of goods and services across a broad range of industries.
Strategic Partnerships: Our growth strategy includes strategic partnerships with music business industry leaders in providing software solutions which enable Direct-To-Consumer ecommerce. We have partnered with these companies to provide inventory management and pick-pack-ship fulfillment services for their clients including- John Legend, Carly Simon, Taye Diggs, as well as breakout indie artists, Fitz and the Tantrums and Silversun Pickups. We also partner with providers of turnkey solutions for their celebrity clients for design, product development, manufacturing and sales in all channels of retail distribution: live events, web stores, sponsorships, and third-party licensing. We provide web store development, ecommerce, inventory management and pick-pack-ship services to their celebrity clients including Slash, Slayer, Alice Cooper, and others.
-
5
-
We expect the above plan will enable us to increase our celebrity services and offer a wider variety of management services providing more resources for a sales and a marketing campaign to promote the Company.
In providing our services, our business plan includes the payment of advances to some clients on merchandise and VIP programs and appearances, and recoupment of those advances from the artists' and celebrities' share of profits, as agreed upon in any agreement with the artist or celebrity.
The business strategy described above is intended to enhance our opportunities in the online e-commerce market. However, there are a number of factors that may impact our plans and inhibit our success. See “Risk Factors” included in Item 1A. Therefore, we have no guarantees and can provide no assurances, that our plans will be successful.
Marketing and Sales
Successful branding of our corporate identity and services is the key to our success. We changed our name to PAID, Inc. at the end of 2003 and have consolidated our websites and brands under one Internet presence.
In 2011 we added additional sales and marketing personnel and employed cutting edge technology to drive the awareness and to deliver our products and services to a larger audience. Promoting and marketing PAID's celebrity services will continue by using various mediums of marketing; social engine marketing; “adword” campaigns, search engine optimization, email marketing, social media marketing, traditional print media and public relations methods, and presence at industry conferences and trade shows. However, as our celebrity services continue to gain exposure, we have had substantial opportunity to grow our business through referrals. Networking and referral business is a large portion of sales and marketing for these types of services. As we market and promote our celebrity services, we also will be supporting our proprietary content management system, increasing our CRM capabilities with enhanced marketing services, and continue to invest in our shipping calculator products.
The Company is extending its sales and marketing initiatives by incorporating sales and marketing materials and outreach into fulfillment and customer service activities.
The Company will continue to market AuctionInc throughout 2012. In the past, representatives of the Company attended trade shows, events and conferences to analyze the potential for AuctionInc and to narrow the Company's marketing base. Based on experience with existing partnerships that promote AuctionInc, the Company believes that creating partnerships is an effective marketing tool to promote and encourage new registrations. The Company will continue to seek new partnerships. The Company may promote the AuctionInc product line in trade publications to reach small and midsize companies.
Although we believe that this marketing strategy, if successful, will lead to increased revenues, and attract more users to our site, we have no commitments that our marketing will be successful or our sales will increase. There are a number of factors that may impact our plans and inhibit our success. See “Risk Factors” included in Item 1A. Therefore, we have no guarantees and can provide no assurances that our plans will be successful.
Revenue Sources
In 2011, our revenues were derived from our online merchandise and fulfillment operations, client services and touring programs. Although we expect that this revenue model will generate increased revenue, if we are not successful in implementing this model, if the entertainment industry and fans do not accept the services we provide, if costs are higher than anticipated, or if revenues do not increase as rapidly as hoped, we may not be able to generate positive cash flow. There are a number of factors that may impact our plans and inhibit our success. See “Risk Factors” included in Item 1A. Therefore, we have no guarantees and can provide no assurances, that our plans will be successful.
Competition
Our web hosting software program, AuctionInc software suite, is proprietary. We received two patents related to our online action shipping calculator in January 2008 and April 2011. We do not have any other patents for our designs or innovations and we may not be able to obtain copyright, patent or other protection for our proprietary technologies or for the processes developed by our employees. Legal standards relating to intellectual property rights in computer software are still developing and this area of the law is evolving with new technologies. Our intellectual property rights do not guarantee any competitive advantage and may not sufficiently protect us against competitors with similar technology. To protect our interest in our intellectual property, we restrict access by others to our proprietary software. In addition, we have federally registered the “PAID” and "Rockin' Coffee" marks. We believe that our products and other proprietary rights do not infringe on the
-
6
-
proprietary rights of third parties. However, there can be no assurance that third parties will not assert infringement claims against us in the future with respect to current or future products or other works of ours. This assertion may require us to enter into royalty arrangements or result in costly litigation.
We also utilize free open-source technology in certain areas. Unlike proprietary software, open-source software has publicly available source code and can be copied, modified and distributed with minimal restrictions. The client websites we build are developed on a Coldfusion proprietary content management and ecommerce engine. We use open source software and technology as well to support the growing social and viral opportunities on the Internet. By using 'best-of-breed' products and tools we can maximize our clients opportunities while minimizing our costs which we are able to pass on to our customers.
Research and Development
Over the past 2 years the Company has not made additional investments in research and development.
Employees
The Company currently has 32 full time equivalent employees. We believe that our future success will depend in part on our continued ability to attract, hire and retain qualified personnel. We have no collective bargaining agreements and consider the relationship with our employees to be good.
Government Regulation
We are not currently subject to direct federal, state or local regulation, and laws or regulations applicable to access or commerce on the Internet, other than regulations applicable to businesses generally. However, due to the increasing popularity and use of the Internet and other online services, it is possible that a number of laws and regulations may be adopted with respect to the Internet or other online services covering issues such as user privacy, freedom of expression, pricing, content and quality of products and services, taxation, advertising, intellectual property rights and information security.
You should carefully consider the risks
and uncertainties described below before deciding to invest in shares of our common stock. If
any of the following risks or uncertainties actually occurs, our business, prospects,
financial condition and operating results would likely suffer, possibly materially.
In that event, the market price of our common stock could decline and you could lose
all or part of your investment.
Risks Relating to the Company
We have experienced significant operating losses.
Our business and prospects must be considered in light of the risks, expenses and difficulties that are inherent in our business. The risks include:
|
•
|
our ability to anticipate and adapt to a developing market;
|
|
•
|
our ability to attract new businesses in the entertainment market for our brand-related services;
|
|
•
|
our ability to engage musical artists and celebrities and name brands, to service a sustainable fan base for each musical artist and celebrity, and to sell merchandise, VIP tickets, fan experiences and other services;
|
|
•
|
dependence upon the level of hits to our artists' sites and on sites that we use to sell our products and services;
|
|
•
|
the popularity and success of the artists and name brands who receive our services;
|
|
•
|
artist tour activities and fan attendance;
|
|
•
|
our ability to recoup any advance paid to an artist or celebrity for merchandise, artist appearances, and VIP programs;
|
|
•
|
our ability to engage organizations for web site development and sponsorship;
|
|
•
|
our ability to market, license and enforce our patented shipping calculator; and
|
|
•
|
development of equal or superior Internet portals, auctions and related services by competitors.
|
To address these risks, we must, among other things, successfully market celebrities, musical artists, and name brands and service their fan or consumer base, increase traffic to their web sites, maintain our customer base, attract significant numbers of new customers and clients, respond to competitive developments, implement and execute successfully our business strategy and continue to develop and upgrade our technologies and customer services. We cannot offer any assurances that we will be successful in addressing these risks.
We incurred substantial losses each year since 1999. There can be no assurance that we will be profitable in the
-
7
-
future.
Our capital is limited and we may need additional financing to continue operations.
We require substantial working capital to fund our business. Additional funds or authorized common stock may be necessary for our Company to continue its operations and to make recoupable advances for merchandise, artist appearances, and VIP programs. If we are unable to obtain financing in the amounts desired and on acceptable terms, or at all, or issue stock, we could be required to reduce significantly the scope of our expenditures or limit our ability to engage an artist, which would have a material adverse effect on our business potential and the market price of our common stock. If we raise additional funds by issuing equity securities, our shareholders will be further diluted. Based on our cash position as of
December 31, 2011
, we may need additional capital to fund our anticipated operating expenses over the next 12 months. If we require additional funding, there can be no assurances that the financing will be obtained, or if obtained, that funding will be obtained on reasonably acceptable terms.
We are unable to guarantee that the marketplace will accept our software products.
The software markets are characterized by rapid technological change, frequent new product enhancements, uncertain product life cycles, changes in customer demands and evolving industry standards. Our software products could be rendered obsolete if products based on new technologies are introduced or new industry standards emerge, or if we do not obtain adequate intellectual property protection. We are unable to provide any assurances that the marketplace will accept our software products and services, or that we will be able to provide these products and services at a profit.
Our operating results are unpredictable and are expected to fluctuate in the future.
You should not rely on the results for any period as an indication of future performance. Our operating results are unpredictable and are expected to fluctuate in the future due to a number of factors, many of which are outside our control. These factors beyond our control include:
|
•
|
our ability to engage well known celebrities, musical artists, and businesses in the entertainment industry with name brands for merchandise sales, web site and fan management, as well as other entities for web site development and sponsorship;
|
|
•
|
our ability to engage celebrities for ticket sales services;
|
|
•
|
our ability to significantly increase our customer base and traffic to our web sites, manage our inventory mix and the mix of products offered, liquidate our inventory in a timely manner, maintain gross margins, and maintain customer satisfaction;
|
|
•
|
our ability to market and sell our software products;
|
|
•
|
the availability and pricing of merchandise from vendors;
|
|
•
|
consumer confidence in encrypted transactions in the Internet environment;
|
|
•
|
the timing, cost and availability of advertising on our web sites and other entities' web sites;
|
|
•
|
popularity of celebrities;
|
|
•
|
the amount and timing of costs related to expansion of our operations and the hiring of experienced personnel;
|
|
•
|
the announcement or introduction of new types of services or products by our competitors;
|
|
•
|
technical difficulties with respect to consumer and fan use of our web sites;
|
|
•
|
our ability to make acquisitions of complementary business and technologies;
|
|
•
|
governmental regulation by federal or local governments; and
|
|
•
|
general economic conditions and economic conditions specific to the Internet and electronic commerce.
|
As a strategic response to changes in the competitive environment, we may from time to time make certain service, marketing or supply decisions or acquisitions that could have a material adverse effect on our results of operations and financial condition. In 2011, our revenues were derived from our celebrity services, fulfillment services, and ticketing and fan experiences.
The successful operation of our business depends upon the supply of critical technology elements from other third parties, including our Internet service provider and technology licensors.
Our operations depend on a number of third parties for Internet/telecom access, delivery services, and software services. We have limited control over these third parties and no long-term relationships with any of them. We rely on an Internet service provider to connect our web sites to the Internet. From time to time, we have experienced temporary interruptions in our web sites' connection and also our telecommunications access. We license technology and related databases from third parties for certain elements of our properties. Furthermore, we are dependent on hardware suppliers for
-
8
-
prompt delivery, installation, and service of servers and other equipment to deliver our products and services. Our internally developed software depends on an operating system, database and server software that was developed and produced by and licensed from third parties. We have from time to time discovered errors and defects in the software from these third parties and, in part, rely on these third parties to correct these errors and defects in a timely manner. Any errors, failures, interruptions, or delays experienced in connection with these third-party technologies and information services could negatively impact our relationship with users and adversely affect our brand and our business, and could expose us to liabilities to third parties.
We rely on third parties for our order fulfillment, and failures on the part of these third parties could harm our business.
We use overnight courier and delivery services for substantially all of our merchandise and products. We use third party manufacturers to produce our merchandise. Should these vendors be unable to deliver our products for a sustained time period as a result of a strike, war, act of terrorism, business failure, or other reason, our business, results of operations and financial condition would be adversely affected. If, due to computer systems failures or other problems related to these third-party service providers, we experience any delays in shipment, our business, results of operations and financial condition would be adversely affected.
Our failure to manage growth could place a significant strain on our management, operational and financial resources.
Growth places a significant strain on our management, operational and financial resources, and has placed significant demands on our management, which currently includes only three executive officers. In order to manage growth, we will be required to expand existing operations, particularly with respect to customer service and merchandising, to improve existing and implement new operational, financial and inventory systems, procedures and controls.
We have experienced a significant strain on our resources because of:
|
•
|
the need to manage relationships with our clients, including musical artists, businesses in the entertainment industry with name brands, and other celebrities;
|
|
•
|
the need to manage relationships with various technology licensors, advertisers, other web sites and services, Internet service providers and other third parties;
|
|
•
|
difficulties in hiring and retaining skilled personnel necessary to support our businesses;
|
|
•
|
the need to train and manage a growing employee base; and
|
|
•
|
pressures for the continued development of our financial and information management systems.
|
Difficulties we may encounter in dealing successfully with the above risks could seriously harm our operations. We cannot offer any assurance that our current personnel, systems, procedures and controls will be adequate to support our future operations or that management will be able to identify, hire, train, retain, motivate and manage required personnel.
If our acquisitions are not successful, or if we are not able to structure future acquisitions in a financially efficient manner, there could be an adverse effect on our business and operations.
If appropriate opportunities present themselves, we may acquire businesses, technologies, services or products that we believe will help us develop and expand our business. The process of integrating an acquired business, technology, service or product may result in operating difficulties and expenditures which we cannot anticipate and may absorb significant management attention that would otherwise be available for further development of our existing business. Moreover, the anticipated benefits of any acquisition may not be realized. Any future acquisitions of other businesses, technologies, services or products might require us to obtain additional equity or debt financing, which might not be available to us on favorable terms or at all, and might be dilutive. Additionally, we may not be able to successfully identify, negotiate or finance future acquisitions or to integrate acquisitions with our current business.
Our Company's success still depends upon the continued services of its current management and other relationships.
We are substantially dependent on the continued services of our management, Gregory Rotman, our President and Chief Executive Officer; Christopher Culross, our Chief Financial Officer, and Richard Rotman, our Chief Operating Officer, Vice President, and Secretary, and with the President of our celebrity services group, Keith Garde. These individuals have acquired specialized knowledge and skills with respect to our Company and our operations and relationships with our clients. As a result, if any of these individuals were to leave our Company, we could face substantial difficulty in hiring qualified successors and could experience a loss in revenue while any successor obtains the necessary training and experience or builds new relationships. We do not maintain any key person life insurance.
-
9
-
Loss of our key relationships, management and other personnel could result in the loss of key tours.
The live music business is uniquely dependent upon personal relationships, as promoters and executives leverage their existing network of relationships with artists, agents and managers in order to secure the rights to the live music tours and events which are critical to our success. Due to the importance of those industry contacts to our business, the loss of any of our officers, relationships or other key personnel could adversely affect our operations.
Our Company's success will depend on our ability to attract and retain qualified personnel.
We believe that our future success will depend upon our ability to identify, attract, hire, train, motivate and retain other highly skilled managerial, merchandising, accounting, technical consulting, marketing and customer service personnel. We cannot offer assurances that we will be successful in attracting, assimilating or retaining the necessary personnel, and the failure to do so could have a material adverse effect on our business.
Our success depends upon market awareness of our brand.
Development and awareness of our Company will depend largely on our success in increasing our customer and client base. If vendors do not perceive us as an effective marketing and sales channel for their merchandise, or artists do not perceive our Company as offering an entertaining and desirable way to purchase services and merchandise through websites we develop, we may be unsuccessful in promoting and maintaining our brand. If celebrities, musical artists or sports figures do not recognize or trust our name, they will be less likely to engage us for our services. To attract and retain customers and to promote and maintain our Company in response to competitive pressures, we may find it necessary to increase our marketing, networking, and advertising budgets and otherwise to increase substantially our financial commitment to creating and maintaining brand loyalty among vendors, clients and consumers. We will need to continue to devote substantial financial and other resources to increase and maintain the awareness of our online brands among web site users, advertisers and e-commerce entities that we have advertising relationships with through:
|
•
|
web advertising, marketing, and social media;
|
|
•
|
traditional media advertising campaigns; and
|
|
•
|
providing a high quality user experience.
|
Our results of operations could be seriously harmed if our investment of financial and other resources, in an attempt to achieve or maintain a leading position in Internet commerce or to promote and maintain our brand, does not generate a corresponding increase in net revenue, or if the expense of developing and promoting our online brands becomes excessive.
System failures could result in interruptions in our service, which could harm our business.
A key element of our strategy is to generate a high volume of traffic to, and use of, our web sites, and the web sites that we manage. Accordingly, the satisfactory performance, reliability and availability of these web sites, transaction processing systems, network infrastructure and delivery and shipping systems are critical to our operating results, as well as our reputation and our ability to attract and retain customers and maintain adequate customer service levels.
We periodically have experienced minor systems interruptions, including Internet disruptions. Some of the interruptions are due to upgrading our equipment to increase speed and reliability. During these upgrades the outages have generally lasted for a few hours, and even longer, on occasion. Any systems interruptions, including Internet disruptions, which result in the unavailability of these web sites or reduced order fulfillment performance would reduce the volume of goods sold, which could harm our business. In addition to placing increased burdens on our engineering staff, these outages create a large number of user questions and complaints that need to be responded to by our personnel. We cannot offer assurances that:
|
•
|
we will be able to accurately project the rate or timing of increases if any, in the use of our web sites;
|
|
•
|
we will be able to expand and upgrade on a timely basis our systems and infrastructure to accommodate increases in the use of these web sites;
|
|
•
|
we will have uninterrupted access to the Internet;
|
|
•
|
our users will be able to reach these web sites;
|
|
•
|
communications via these web sites will be secure;
|
|
•
|
we or our suppliers' network will be able to timely achieve or maintain a sufficiently high capacity of data transmission, especially if the customer usage of these web sites increases.
|
Any disruption in the Internet access to our web sites or any systems failures could significantly reduce consumer demand for our services, diminish the level of traffic to our web sites, impair our reputation and reduce our commerce and advertising revenues.
-
10
-
We do not have redundant systems, a disaster recovery plan or alternate providers with respect to our communications hardware and computer hardware.
Our main servers are located within 15 minutes from our corporate headquarters. Our Massachusetts facilities are not protected from fire, flood, power loss, telecommunication failure, break-in and similar events. We do not presently have fully redundant systems, a formal disaster recovery plan or alternative providers of hosting services. A substantial interruption in these systems would have a material adverse effect on our business, results of operations and financial condition.
Our servers are also vulnerable to computer viruses, physical or electronic break-ins, attempts by third parties to deliberately exceed the capacity of our systems and similar disruptive problems. Computer viruses, break-ins or other problems caused by third parties could lead to interruptions, delays, loss of data or cessation in service to users of our services and products and could seriously harm our business and results of operations.
There are certain provisions of Delaware law that could have anti‑takeover effects.
Certain provisions of Delaware law and our Certificate of Incorporation, and Bylaws could make an acquisition of our Company by means of a tender offer, a proxy contest or otherwise, and the removal of our incumbent officers and directors more difficult. Our Certificate of Incorporation and Bylaws do not provide for cumulative voting in the election of directors. Our Bylaws include advance notice requirements for the submission by stockholders of nominations for election to the Board of Directors and for proposing matters that can be acted upon by stockholders at a meeting.
We are subject to the anti‑takeover provisions of Section 203 of the Delaware General Corporation Law (the “DGCL”), which will prohibit us from engaging in a “business combination” with an “interested stockholder” for three years after the date of the transaction in which the person became an interested stockholder unless the business combination is approved in a prescribed manner. Generally, a "business combination" includes a merger, asset or stock sale, or other transaction resulting in a financial benefit to the interested stockholder. Generally, an "interested stockholder" is a person who, together with affiliates and associates, owns (or within three years prior to the determination of interested stockholder status, did own) 15% or more of a corporation's voting stock. The existence of this provision would be expected to have an anti-takeover effect with respect to transactions not approved in advance by the Board of Directors, including discouraging attempts that might result in a premium over the market price for the shares of common stock held by stockholders. Section 203 could adversely affect the ability of stockholders to benefit from certain transactions which are opposed by the Board or by stockholders owning 15% of our common stock, even though such a transaction may offer our stockholders the opportunity to sell their stock at a price above the prevailing market price.
Our success is dependent in part on our ability to obtain and maintain proprietary protection for our technologies and processes.
Our most important intellectual property relates to the software for our AuctionInc products, our web-hosting services and our research center. We do not have any patents or patent applications for our designs or innovations, except for our patent with respect to our online auction shipping calculator, one of our software products. We may not be able to obtain copyright, patent or other protection for our proprietary technologies or for the processes developed by our employees. Legal standards relating to intellectual property rights in computer software are still developing and this area of the law is evolving with new technologies. Our intellectual property rights do not guarantee any competitive advantage and may not sufficiently protect us against competitors with similar technology.
As part of our confidentiality procedures, we generally enter into agreements with our employees and consultants and limit access to and distribution of our software, documentation and other proprietary information. We cannot offer assurances that the steps we have taken will prevent misappropriation of our technology or that agreements entered into for that purpose will be enforceable. Notwithstanding the precautions we have taken, it might be possible for a third party to copy or otherwise obtain and use our software or other proprietary information without authorization or to develop similar software independently. Policing unauthorized use of our technology is difficult, particularly because the global nature of the Internet makes it difficult to control the ultimate destination or security of software or other data transmitted. The laws of other countries may afford our Company little or no effective protection of its intellectual property. Because our success in part relies upon our technologies, if proper protection is not available or can be circumvented, our business may suffer.
Intellectual property infringement claims would harm our business.
We may in the future receive notices from third parties claiming infringement by our software or other aspects of our business. Any future claim, with or without merit, could result in significant litigation costs and diversion of resources, including the attention of management, and require us to enter into royalty and licensing agreements, which could have a material adverse effect on our business, results of operations and financial condition. Royalty and licensing agreements, if required, may not be available on terms acceptable to the Company or at all. In the future, we may also need to file lawsuits to enforce our intellectual property rights, to protect our trade secrets, or to determine the validity and scope of the proprietary rights of others. This litigation, whether successful or unsuccessful, could result in substantial costs and diversion of resources,
-
11
-
which could have a material adverse effect on our business, results of operations and financial condition.
Our success is dependent on licensed technologies.
We rely on a variety of technologies that we license from third parties. We license some of our software from third party vendors. We have two perpetual licenses for the proprietary software eCMS and acquired the source codes for the software. We also rely on encryption and authentication technology licensed from a third party through an online user agreement to provide the security and authentication necessary to effect secure transmission of confidential information.
We cannot make any assurances that these third-party technology licenses will continue to be available to us on commercially reasonable terms. Although no single software vendor licensor provides us with irreplaceable software, the termination of a license and the need to obtain and install new software on our systems would interrupt our operations. Our inability to maintain or obtain upgrades to any of these technology licenses could result in delays in completing our proprietary software enhancements and new developments until equivalent technology could be identified, licensed or developed and integrated. These delays would materially and adversely affect our business, results of operations and financial condition.
We may be exposed to liability for content retrieved from our web sites.
We may be exposed to liability for content retrieved from our web sites. Our exposure to liability from providing content on the Internet is currently uncertain. Due to third party use of information and content downloaded from our web sites, we may be subject to claims relating to:
|
•
|
the content and publication of various materials based on defamation, libel, negligence, personal injury and other legal theories;
|
|
•
|
copyright, trademark or patent infringement and wrongful action due to the actions of third parties; and
|
|
•
|
other theories based on the nature and content of online materials made available through our web sites.
|
Our exposure to any related liability could result in us incurring significant costs and could drain our financial and other resources. We do not maintain insurance specifically covering these claims. Liability or alleged liability could further harm our business by diverting the attention and resources of our management and by damaging our reputation in our industry and with our customers.
The Company may be exposed to potential risks relating to our significant deficiencies and material weaknesses in our internal controls over financial reporting.
As directed by Section 404 of the Sarbanes-Oxley Act of 2002 (“SOX 404”), the Securities and Exchange Commission adopted rules requiring public companies to include a report of management on the company's internal control over financial reporting in their annual reports, including Form 10-K. In addition, the independent registered public accounting firm auditing a company's financial statements also must attest to and report on the effectiveness of the Company's internal control over financial reporting as well as the operating effectiveness of the Company's internal controls. We have identified significant deficiencies and material weaknesses in our internal controls and have taken steps to remediate them as cost-effectively as possible. Based on these significant deficiencies and material weaknesses, investors and others may lose confidence in the reliability of our financial statements and our ability to obtain equity or debt financing could suffer.
Risks Associated With Our Industry
The market for online services is intensely competitive with low barriers to entry.
The market for Internet products and services is very competitive. Barriers to entry are relatively low, and current and new competitors can launch new sites at a relatively low cost using commercially available software. We currently or potentially compete with a variety of other companies depending on the type of merchandise and sales format offered to customers. These competitors include:
|
•
|
other companies that manage celebrity web sites or that sell concert tour tickets online, such as Live Nation/Ticketmaster/VIP Nation, MusicToday, Ground Control, Artist Arena, and FanAsylum;
|
|
•
|
a number of indirect competitors that specialize in electronic commerce or derive a substantial portion of their revenue from electronic commerce, including Internet Shopping Network, Shopping.com, Amazon and Ebay
|
|
•
|
a variety of other companies that offer merchandise similar to ours but through physical auctions and with which we compete for sources of supply.
|
We believe that the principal competitive factors affecting our market are the ability to engage celebrities, musical artists, and businesses in the entertainment industry with name brands, the tour activities of our musical artists, and ability to attract customers at favorable customer acquisition costs, operate the web sites in an uninterrupted manner and with acceptable
-
12
-
speed, provide effective customer service and obtain merchandise at satisfactory prices. We cannot offer any assurances that we can maintain our competitive position against current and potential competitors, especially those with greater financial, marketing, customer support, technical and other resources.
Current competitors have established or may establish cooperative relationships among themselves or directly with celebrities, and musical artists, and with vendors to obtain exclusive or semi‑exclusive sources of merchandise. Accordingly, it is possible that new competitors or alliances may emerge and rapidly acquire market share. Increased competition is likely to result in reduced operating margins, loss of market share and a diminished brand franchise, any one of which could materially adversely affect our business, results of operations and financial condition. Many of our current and potential competitors have significantly greater financial, marketing, customer support, technical and other resources than the Company. As a result, these competitors may be able to secure merchandise from vendors on more favorable terms than we can, and they may be able to respond more quickly to changes in customer preferences or to devote greater resources to the development, promotion and sale of their merchandise than we can.
Our success in providing services and merchandise depends upon the popularity of the musical artist, celebrity, and other entities that we serve.
We provide a full line of services for musical artists, and celebrities, as well as other entities with name brands, including sales of merchandise, online ticketing and fan experiences, and a fan web site. Our success depends in part on the level of popularity of a particular artist, the depth of the fan base, and the continued popularity of the artist. The Company can be adversely affected, and incur substantial loss of revenue, if an entire tour, or one or more shows within a tour, is terminated due to lack of interest, illness, death, or for any other reason. In the event that a show or tour is canceled or postponed, the Company may incur losses for that show, or fail to recoup any advance monies paid to the artist. In addition, we may not be able to obtain sufficient insurance coverage at reasonable costs to adequately protect us against the death, disability or other failure of such artists to continue engaging in revenue-generating activities under those arrangements.
Any inability to fund the significant up-front cash requirements associated with our touring business could result in the loss of key tours.
To secure a tour, including global tours by major artists, or to establish a relationship, we are often asked to advance funds to the artist or celebrity prior to the sale of any tickets for that tour. If we do not have sufficient cash on hand or capacity under any credit agreement to obtain cash to advance the necessary funds for any given tour, we would not be able to secure the artist and our revenue would be negatively impacted.
The live entertainment business is highly sensitive to public tastes and dependent on our ability to secure popular artists and other live entertainment events, and we may be unable to anticipate or respond to changes in consumer preferences, which may result in decreased demand for our services.
Our ability to generate revenue from our entertainment operations is highly sensitive to rapidly changing public tastes and dependent on the availability of popular artists, brands and events. Our success depends in part on our ability to anticipate the tastes of consumers and to offer events that appeal to them. Since we rely on unrelated parties to create and perform live entertainment content, such as concerts, musical performances, or appearances, any unwillingness to tour or lack of availability of popular artists, could limit our ability to generate revenue. In particular, there are a limited number of artists that can headline a major North American or global tour or who can sell out larger venues. If those key artists do not continue to tour, or if we are unable to secure the rights to their future tours, then our business would be adversely affected.
In addition, we often agree to pay an artist an upfront recoupable advance for artist or celebrity appearances, VIP programs, and merchandise, prior to our receiving any operating income. We may agree to advance funds for the artist to record an album, or to pre-fund other artist or brand ventures, and agree to recoup the advance based on future sales. Therefore, if the public is not receptive to the tour, merchandise, album, or other venture, we may incur a loss depending on the amount of any advance or incurred costs relative to any revenue earned. We may not have cancellation insurance policies in place to cover our losses if a performer cancels a tour. Furthermore, consumer preferences change from time to time, and our failure to anticipate, identify or react to these changes could result in reduced demand for our services, which would adversely affect our operating results and profitability.
We may be adversely affected by the deterioration in economic conditions, which could affect consumer and corporate spending and our ability to raise capital, and, therefore, significantly adversely impact our operating results.
A decline in attendance at or reduction in the number of live entertainment events may have an adverse effect on our revenue and operating income. The impact of slowdowns on our business is difficult to predict, but they may result in reductions in ticket sales, sponsorship opportunities and our ability to generate revenue. The risks associated with our businesses may become more acute in periods of slowing economy or recession, which may be accompanied by a decrease in attendance at live entertainment events. Instability in the financial markets as a result of recession or otherwise, as well as
-
13
-
insufficient financial sector liquidity, also could affect the cost of capital and energy suppliers and our ability to raise capital.
Our business depends on discretionary consumer and corporate spending. Many factors related to corporate spending and discretionary consumer spending, including economic conditions affecting disposable consumer income such as employment, fuel prices, interest and tax rates and inflation can significantly impact our operating results. Business conditions, as well as various industry conditions, including corporate marketing and promotional spending and interest levels, can also significantly impact our operating results. These factors can affect attendance at our events, premium seats, sponsorship, advertising and hospitality spending, concession and souvenir sales, as well as the financial results of sponsors of our venues, events and the industry. Negative factors such as challenging economic conditions, public concerns over additional terrorism and security incidents, particularly when combined, can impact corporate and consumer spending, and one negative factor can impact our results more than another. There can be no assurance that consumer and corporate spending will not be adversely impacted by economic conditions, thereby possibly impacting our operating results and growth.
Market consolidation has created and continues to create companies that are larger and have greater resources than us.
As the online commerce market continues to grow, other companies may enter into business combinations or alliances that strengthen their competitive positions. For example, in early 2010, Live Nation merged with Ticketmaster. The effects that any completed and pending acquisitions and strategic plans may have on us cannot be predicted with accuracy, but some of these companies that maintain divisions that compete with us are aligned with companies that are larger or better established than us. Even though some of the competitive services offered by these companies may comprise a small amount of their business, their potential access to greater financial, marketing and technical resources would put them in a stronger competitive position as compared to our Company. In addition, these companies include television broadcasters with access to unique content and substantial marketing resources that may not be available to our Company.
Security breaches and credit card fraud could harm our business.
We rely on encryption and authentication technology licensed from a third party through an online user agreement to provide the security and authentication necessary to effect secure transmission of confidential information. We believe that a significant barrier to electronic commerce and communications is the secure transmission of confidential information over public networks. We cannot give assurances that advances in computer capabilities, new discoveries in the field of cryptography or other events or developments will not result in a compromise or breach of the algorithms we use to protect customer transaction data. If this compromise of our security were to occur, it could have a material adverse effect on our business, results of operations and financial condition. A party who is able to circumvent our security measures could misappropriate proprietary information or cause interruptions in our operations. To the extent that activities of our Company or third-party contractors involve the storage and transmission of proprietary information, such as credit card numbers, security breaches could expose us to a risk of loss or litigation and possible liability. We may be required to expend significant capital and other resources to protect against the threat of security breaches or to alleviate problems caused by these breaches. We cannot offer assurances that our security measures will prevent security breaches or that failure to prevent these security breaches will not have a material adverse effect on our business.
Our industry may be exposed to increased government regulation.
Our Company is not currently subject to direct regulation by any government agency, other than regulations applicable to businesses generally, and laws or regulations directly applicable to access to, or commerce on, the Internet. Today there are relatively few laws specifically directed towards online services, other than to protect user privacy or children. However, due to the increasing popularity and use of the Internet, it is possible that a number of laws and regulations may be adopted with respect to the Internet, covering issues such as user privacy, freedom of expression, pricing, content and quality of products and services, fraud, taxation, advertising, intellectual property rights and information security. Compliance with additional regulation could hinder our growth or prove to be prohibitively expensive.
The applicability to the Internet of existing laws in various jurisdictions governing issues such as property ownership, sales tax, libel and personal privacy is uncertain and may take years to resolve. In addition, because our service is available over the Internet in multiple states, and we sell to numerous consumers resident in these states, these jurisdictions may claim that we are required to qualify to do business as a foreign corporation in each state. Our failure to qualify as a foreign corporation in a jurisdiction where it is required to do so could subject our Company to taxes and penalties for the failure to qualify. Any new legislation or regulation, or the application of laws or regulations from jurisdictions whose laws do not currently apply to our business, could have a material adverse effect our business, results of operations and financial condition.
-
14
-
Risks Associated with our Common Stock
Our stock price has been and may continue to be very volatile.
The market price of the shares of our common stock has been, and is likely to be, highly volatile. During the 24 months prior to
December 31, 2011
, our stock price as traded on the OTC Bulletin Board has ranged from a high of
$0.60
per share to a low of
$0.08
per share. The variance in our share price makes it difficult to forecast with any certainty the stock price at which you may be able to buy or sell your shares of our common stock. The market price for our stock could be subject to wide fluctuations in response to factors that are out of our control such as:
|
•
|
actual or anticipated variations in our results of operations,
|
|
•
|
announcements of new products, services or technological innovations by our competitors;
|
|
•
|
developments with respect to patents, copyrights or proprietary rights;
|
|
•
|
short selling our common stock and stock price manipulation;
|
|
•
|
developments in Internet regulation; and
|
|
•
|
general conditions and trends in the Internet, entertainment and electronic commerce industries.
|
The trading prices of many technology companies' stock have experienced extreme price and volume fluctuations. These fluctuations often have been unrelated or disproportionate to the operating performance of these companies. These broad market factors may adversely affect the market price of our common stock. These market fluctuations, as well as general economic, political and market conditions such as recessions or interest rate fluctuations, may adversely affect the market price of our common stock. Any negative change in the public's perception of the prospects of Internet or e-commerce companies could depress our stock price regardless of our results.
We have issued options, warrants that have had and will have a dilutive effect on our shareholders.
We have issued numerous options, and convertible securities to acquire our common stock that have had a dilutive effect on our shareholders. We depend on our ability to issue stock and options to conserve cash. We compensate a number of employees and consultants through stock option grants under the Company's 2001 Non-Qualified Stock Option Plan and more recently under the 2011 Non-Qualified Stock Option Plan. One hundred twenty million shares were registered under the 2001 plan since its inception in 2001, and thirty million shares were registered in 2011 under the 2011 plan. Typically, shares are immediately exercised by the employee or consultant. In 2011, employees received options for
2,280,344
shares equal to
$526,600
in compensation, and consultants and professionals received
7,211,585
shares equal to
$1,693,900
in compensation. Dilution is more substantial when our stock price is low.
We may have difficulty obtaining additional financing as a result of the significant number of shares that have been issued and the few remaining shares available for issuance.
New investors may either decline to make an investment in our Company due to the large number of shares outstanding and the few remaining shares that are authorized and available for issuance.
“Penny stock” regulations may impose certain restrictions on marketability of securities.
The SEC adopted regulations which generally define "penny stock" to be an equity security that has a market price of less than $5.00 per share. Our common stock may be subject to rules that impose additional sales practice requirements on broker-dealers who sell these securities to persons other than established customers and accredited investors (generally those with assets in excess of $1,000,000, or annual incomes exceeding $200,000 or $300,000 together with their spouse). For transactions covered by these rules, the broker-dealer must make a special suitability determination for the purchase of these securities and have received the purchaser's prior written consent to the transaction.
Additionally, for any transaction, other than exempt transactions, involving a penny stock, the rules require the delivery, prior to the transaction, of a risk disclosure document mandated by the SEC relating to the penny stock market. The broker-dealer also must disclose the commissions payable to both the broker-dealer and the registered representative, current quotations for the securities and, if the broker-dealer is the sole market-maker, the broker-dealer must disclose this fact and the broker-dealer's presumed control over the market. Finally, monthly statements must be sent disclosing recent price information for the penny stock held in the account and information on the limited market in penny stocks. Consequently, the "penny stock" rules may restrict the ability of broker-dealers to sell our common stock and may affect the ability to sell our common stock in the secondary market.
The market for our Company's securities is limited and may not provide adequate liquidity.
Our common stock is currently traded on the OTC Bulletin Board (“OTCBB”), a regulated quotation service that displays real-time quotes, last-sale prices, and volume information in over-the-counter equity securities. As a result, an investor may find it more difficult to dispose of, or obtain accurate quotations as to the price of, our securities than if the securities were
-
15
-
traded on the Nasdaq Stock market, or another national exchange. There is a limited number of active market makers of our common stock. In order to trade shares of our common stock you must use one of these market makers unless you trade your shares in a private transaction. In the twelve months prior to
December 31, 2011
, the actual daily trading volume ranged from a low of 26,500 shares of common stock to a high of over 4.3 million shares of common stock with 17 days exceeding a trading volume of 1,000,000 shares. Selling our shares can be more difficult because smaller quantities of shares are bought and sold and news media coverage about us is limited. These factors result in a limited trading market for our common stock and therefore holders of our Company's stock may be unable to sell shares purchased should they desire to do so.
None.
As of December 31, 2011 the Company maintained its principal office and fulfillment center in Worcester, Massachusetts, and its corporate office in Boston, Massachusetts, both on a tenant-at-will basis. Effective December 7, 2011, the Company entered into an operating lease which expires in April 2016, for 26,061 square feet of office and warehouse space located in Westborough, Massachusetts. The Company closed its Boston office, and occupied the new facility on January 13, 2012. The Company expects to consolidate all of its operations into this new facility in the first half of 2012.
From time to time we may be a party to various legal proceedings arising in the ordinary course of our business. Our management is not aware of any litigation outstanding, threatened or pending as of the date hereof by or against us or our properties which we believe would be material to our financial condition or results of operations.
None.
-
16
-
Securities
Our common stock, par value $.001 per share, is presently traded on the Over-the-Counter Bulletin Board (“OTCBB”) under the symbol, "PAYDE.OB".
The following table sets forth the high and low bid information for our common stock as reported by OTCBB for the twelve quarters ended
December 31, 2011
. The quotations from the OTCBB reflect inter-dealer prices without retail mark-up, mark-down, or commission and may not represent actual transactions.
|
2009
|
High
|
Low
|
||||||
|
Quarter ended March 31, 2009
|
$
|
0.23
|
|
$
|
0.08
|
|
||
|
Quarter ended June 30, 2009
|
$
|
0.42
|
|
$
|
0.10
|
|
||
|
Quarter ended September 30, 2009
|
$
|
0.55
|
|
$
|
0.31
|
|
||
|
Quarter ended December 31, 2009
|
$
|
0.60
|
|
$
|
0.28
|
|
||
|
2010
|
High
|
Low
|
||||||
|
Quarter ended March 31, 2010
|
$
|
0.52
|
|
$
|
0.27
|
|
||
|
Quarter ended June 30, 2010
|
$
|
0.40
|
|
$
|
0.23
|
|
||
|
Quarter ended September 30, 2010
|
$
|
0.39
|
|
$
|
0.17
|
|
||
|
Quarter ended December 31, 2010
|
$
|
0.40
|
|
$
|
0.23
|
|
||
|
|
|
|
||||||
|
2011
|
High
|
Low
|
||||||
|
Quarter ended March 31, 2011
|
$
|
0.34
|
|
$
|
0.22
|
|
||
|
Quarter ended June 30, 2011
|
$
|
0.49
|
|
$
|
0.23
|
|
||
|
Quarter ended September 30, 2011
|
$
|
0.39
|
|
$
|
0.20
|
|
||
|
Quarter ended December 31, 2011
|
$
|
0.27
|
|
$
|
0.12
|
|
||
As of
May 10, 2012
, there were approximately
1,563
holders of record of our common stock. Because many of the shares are held by brokers and other institutions on behalf of stockholders, the Company is unable to estimate the total number of individual stockholders represented by these holders of record.
We have not previously paid cash dividends on our common stock, and intend to utilize current resources to operate the business; thus, it is not anticipated that cash dividends will be paid on our common stock in the foreseeable future.
Equity Compensation Plan Information
|
|
Number of Securities To be Issued Upon Exercise of Outstanding Options, Warrants and Rights
|
Weighted-Average Exercise Price of Outstanding Options, Warrants and Rights
|
Number of Securities Remaining Available For Future Issuance Under Equity Compensation Plans (Excluding Securities Reflected in Column (a))
|
||||
|
|
(a)
|
(b)
|
(c)
|
||||
|
Equity Compensation Plans Approved by Security Holders
|
13,121,952
|
|
$
|
0.104
|
|
—
|
|
|
Equity Compensation Plans Not Approved by Security Holders
|
4,061,332
|
|
$
|
0.107
|
|
19,047,447
|
|
|
Total
|
17,183,284
|
|
$
|
0.105
|
|
19,047,447
|
|
-
17
-
Refer to Note 9, Notes to Financial Statements for the
Years ended December 31, 2011, 2010, and 2009
incorporated by reference herein from Part II, Item 8, of this Annual Report, for a discussion of the material features of the stock options, warrants and related stock plans.
Recent Sales of Unregistered Securities
None.
Repurchase of Equity Securities
None.
Performance Graph
The following graph compares the annual percentage change in our cumulative total stockholder return on our common stock during the period commencing on December 31, 2006 and ending on
December 31, 2011
(as measured by dividing (i) the sum of (A) the cumulative amount of dividends for the measurement period, assuming dividend reinvestment, and (B) the difference between our share price at the end and the beginning of the measurement period; by (B) our share price at the beginning of the measurement period) with the cumulative total return of the Nasdaq Stock Exchange Composite Index and two peer issuers, Live Nation, Inc. (NYSE: LYV) and Collectors Universe (NASDAQ: CLCT) during such period. We have not paid any dividends on our common stock, and we do not include dividends in the representation of our performance. The stock price performance on the graph below does not necessarily indicate future price performance.
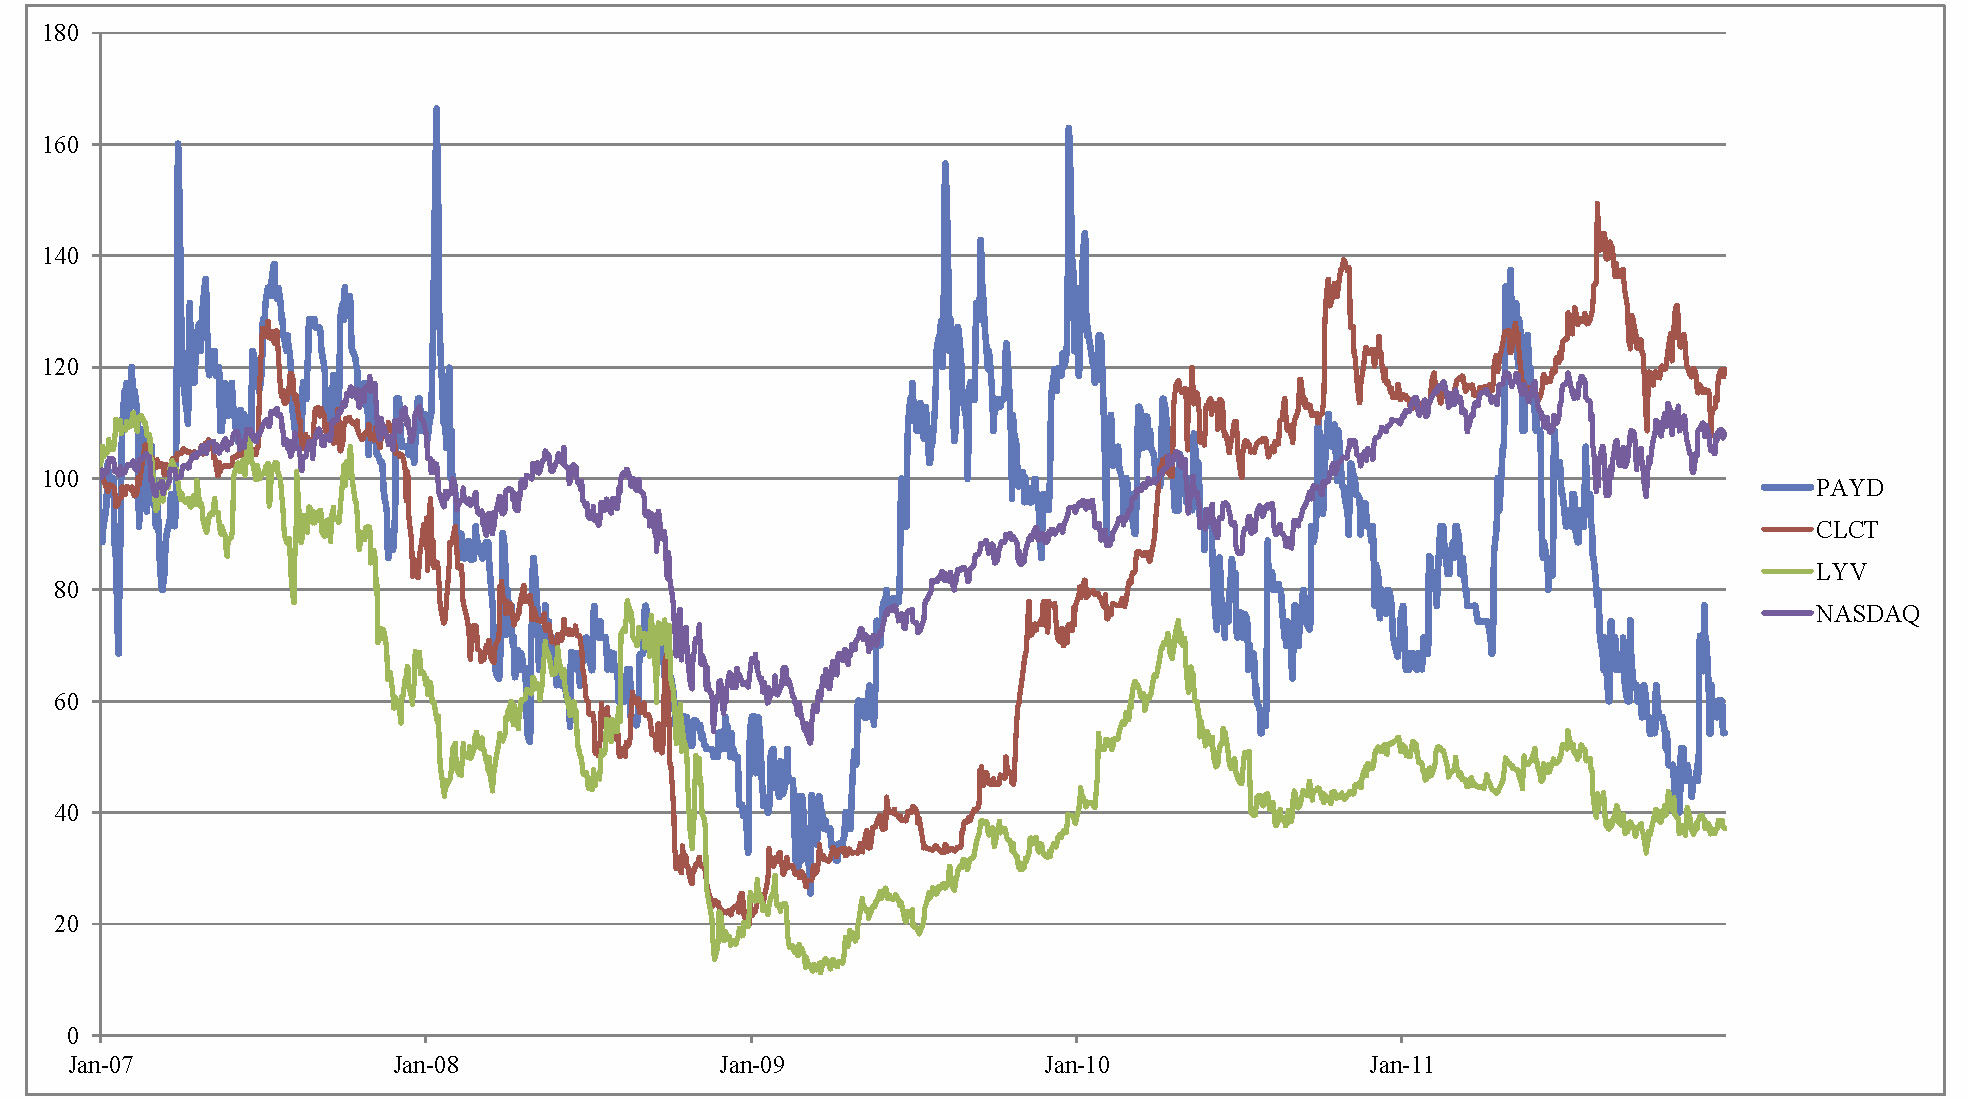
|
Company/Index
|
2006
|
2007
|
2008
|
2009
|
2010
|
2011
|
||||||||||||
|
PAID, INC.
|
$
|
100
|
|
$
|
111
|
|
$
|
54
|
|
$
|
134
|
|
$
|
74
|
|
$
|
54
|
|
|
Nasdaq Stock Exchange Composite Index
|
$
|
100
|
|
$
|
110
|
|
$
|
65
|
|
$
|
94
|
|
$
|
110
|
|
$
|
108
|
|
|
Collectors Universe, Inc. (NASDAQ: CLCT)
|
$
|
100
|
|
$
|
92
|
|
$
|
24
|
|
$
|
77
|
|
$
|
114
|
|
$
|
120
|
|
|
Live Nation, Inc. (NYSE: LYV)
|
$
|
100
|
|
$
|
65
|
|
$
|
29
|
|
$
|
37
|
|
$
|
51
|
|
$
|
37
|
|
-
18
-
The following table summarizes our financial data for the periods presented. You should read the following financial information together with the information under “Management's Discussion and Analysis of Financial Condition and Results of Operations” and our financial statements and the notes to those financial statements appearing elsewhere in this annual report. The selected statements of operations data for the fiscal years ended
December 31, 2011, 2010, and 2009
, and the selected balance sheet data as of
December 31, 2011, 2010 and 2009
are derived from the audited financial statements, which are included elsewhere in this document. The selected statements of operations and balance sheet data for the years ended December 31, 2008 and 2007, are derived from our audited financial statements not included in this document. Historical results are not necessarily indicative of the results to be expected in future periods.
|
|
For the Years Ended December 31,
|
||||||||||||||||||
|
|
2011
|
|
2010
|
|
2009
|
|
2008
|
|
2007
|
||||||||||
|
Statement of Operations Data:
|
|
|
|
|
|
|
|
|
|
||||||||||
|
Revenue
|
$
|
6,920,500
|
|
|
$
|
7,194,700
|
|
|
$
|
4,726,000
|
|
|
$
|
2,181,200
|
|
|
3,383,300
|
|
|
|
Cost of revenues
|
4,595,500
|
|
|
5,033,600
|
|
|
3,269,700
|
|
|
1,501,500
|
|
|
2,080,800
|
|
|||||
|
Gross profit
|
2,325,000
|
|
|
2,161,100
|
|
|
1,456,300
|
|
|
679,700
|
|
|
1,302,500
|
|
|||||
|
|
|
|
|
|
|
|
|
|
|
||||||||||
|
Operating expenses:
|
|
|
|
|
|
|
|
|
|
||||||||||
|
General and administrative expenses
|
6,313,100
|
|
|
5,467,400
|
|
|
5,018,600
|
|
|
4,930,900
|
|
|
3,958,800
|
|
|||||
|
Loss from operations
|
(3,988,100
|
)
|
|
(3,306,300
|
)
|
|
(3,562,300
|
)
|
|
(4,251,200
|
)
|
|
(2,656,300
|
)
|
|||||
|
Other income (expense), net
|
13,900
|
|
|
(500
|
)
|
|
78,000
|
|
|
(483,200
|
)
|
|
(67,800
|
)
|
|||||
|
Loss before income taxes
|
(3,974,200
|
)
|
|
(3,306,800
|
)
|
|
(3,484,300
|
)
|
|
(4,734,400
|
)
|
|
(2,724,100
|
)
|
|||||
|
Provision for income taxes
|
—
|
|
|
—
|
|
|
—
|
|
|
—
|
|
|
—
|
|
|||||
|
Net loss
|
$
|
(3,974,200
|
)
|
|
$
|
(3,306,800
|
)
|
|
$
|
(3,484,300
|
)
|
|
$
|
(4,734,400
|
)
|
|
(2,724,100
|
)
|
|
|
Loss per share - basic
|
$
|
(0.01
|
)
|
|
$
|
(0.01
|
)
|
|
$
|
(0.01
|
)
|
|
$
|
(0.02
|
)
|
|
$
|
(0.01
|
)
|
|
Weighted Average Shares
|
294,685,429
|
|
|
277,021,260
|
|
|
260,711,253
|
|
|
240,469,844
|
|
|
226,679,082
|
|
|||||
|
|
|
|
|
|
|
|
|
|
|
||||||||||
|
|
|
|
|
|
|
|
|
|
|
||||||||||
|
|
For the Years Ended December 31,
|
||||||||||||||||||
|
Balance Sheet Data:
|
2011
|
|
2010
|
|
2009
|
|
2008
|
|
2007
|
||||||||||
|
Total current assets
|
$
|
3,368,200
|
|
|
$
|
3,176,000
|
|
|
$
|
2,933,600
|
|
|
$
|
1,572,700
|
|
|
$
|
1,685,400
|
|
|
Property and equipment, net
|
91,000
|
|
|
71,800
|
|
|
40,500
|
|
|
31,000
|
|
|
74,300
|
|
|||||
|
Other intangible assets, net
|
7,100
|
|
|
8,000
|
|
|
9,000
|
|
|
9,900
|
|
|
10,800
|
|
|||||
|
Long term assets
|
1,468,000
|
|
|
—
|
|
|
—
|
|
|
—
|
|
|
—
|
|
|||||
|
Total assets
|
$
|
4,934,300
|
|
|
$
|
3,255,800
|
|
|
$
|
2,983,100
|
|
|
$
|
1,613,600
|
|
|
$
|
1,770,500
|
|
|
|
|
|
|
|
|
|
|
|
|
||||||||||
|
Total current liabilities
|
$
|
2,141,100
|
|
|
$
|
933,600
|
|
|
$
|
942,800
|
|
|
$
|
1,014,200
|
|
|
$
|
762,300
|
|
|
Long term liabilities
|
21,000
|
|
|
10,300
|
|
|
—
|
|
|
—
|
|
|
—
|
|
|||||
|
Total shareholders’ equity
|
2,772,200
|
|
|
2,311,900
|
|
|
2,040,300
|
|
|
599,300
|
|
|
1,008,300
|
|
|||||
|
Total liabilities and shareholders’ equity
|
$
|
4,934,300
|
|
|
$
|
3,255,800
|
|
|
$
|
2,983,100
|
|
|
$
|
1,613,500
|
|
|
$
|
1,770,600
|
|
-
19
-
Forward Looking Statements
This Annual Report on Form 10-K contains certain forward-looking statements (within the meaning of Section 27A of the Securities Act of 1933 and Section 21E of the Securities Exchange Act of 1934) regarding the Company and its business, financial condition, results of operations and prospects. Words such as "expects," "anticipates," "intends," "plans," "believes," "seeks," "estimates", "could", "may", "should", "will", "would", and similar expressions or variations of such words are intended to identify forward-looking statements in this report. Additionally, statements concerning future matters such as the development of new services, technology enhancements, purchase of equipment, credit arrangements, possible changes in legislation and other statements regarding matters that are not historical are forward-looking statements.
Although forward-looking statements in this annual report reflect the good faith judgment of the Company's management, such statements can only be based on facts and factors currently known by the Company. Consequently, forward-looking statements are inherently subject to risks, contingencies and uncertainties, and actual results and outcomes may differ materially from results and outcomes discussed in this report. Although the Company believes that its plans, intentions and expectations reflected in these forward-looking statements are reasonable, the Company can give no assurance that its plans, intentions or expectations will be achieved. For a more complete discussion of these risk factors, see Item 1A, "Risk Factors.”
For example, the Company's ability to achieve positive cash flow and to become profitable may be adversely affected as a result of a number of factors that could thwart its efforts. These factors include the Company's inability to successfully implement the Company's business and revenue model, tour or event cancellations, higher costs than anticipated, the Company's inability to sell its products and services to a sufficient number of customers, the introduction of competing products or services by others, the Company's failure to attract sufficient interest in, and traffic to, its sites, the Company's inability to complete development of its sites, the failure of the Company's operating systems, and the Company's inability to increase its revenues as rapidly as anticipated. If the Company is not profitable in the future, it will not be able to continue its business operations.
Overview
The primary focus of PAID, Inc. (the “Company”) is to provide brand-related services to businesses, celebrity clients in the entertainment industry as well as charitable organizations. PAID's brand management, brand marketing, social media marketing, product design and merchandising, website design; development and hosting services are designed to grow each client's customer base in size, loyalty and revenue generation. We offer entertainers and business entities comprehensive web-presence and related services supporting and managing clients' official websites and fan-community services including e-commerce, VIP ticketing, live event fan experiences, user-generated content, client content publishing and distribution, fan forums, social network management, social media marketing, customer data capture, management and analysis.
Critical Accounting Policies
Our significant accounting policies are more fully described in Note 3 to our financial statements. However, certain of our accounting policies are particularly important to the portrayal of our financial position and results of operations and require the application of significant judgment by our management; as a result, they are subject to an inherent degree of uncertainty. In applying these policies, our management makes estimates and judgments that affect the reported amounts of assets, liabilities, revenues and expenses and related disclosures. Those estimates and judgments are based upon our historical experience, the terms of existing contracts, our observance of trends in the industry, information that we obtain from our customers and outside sources, and on various other assumptions that we believe to be reasonable and appropriate under the circumstances, the results of which form the basis for making judgments about the carrying values of assets and liabilities that are not readily apparent from other sources. Actual results may differ from these estimates under different assumptions or conditions. Our critical accounting policies include:
Inventories
Inventories are stated at the lower of average cost or market on a first-in, first-out method. On a periodic basis we review inventories on hand to ascertain if any is slow moving or obsolete. In connection with this review, we establish reserves based upon management's experience and assessment of current product demand. A substantial portion of the Company's inventories is comprised of movie posters for which valuation is more subjective than with more standard inventories. The balance is comprised of merchandise and collectibles that relate to performing artists. General economic conditions, tour schedules of performing artists, and the reputation of the performing artists/athletes, might make sale or disposition of these
-
20
-
inventories more or less difficult. Any increases in the reserves would cause a decline in profitability, since such increases are recorded as charges against operations.
Prepaid royalties
The Company accounts for prepaid royalties in accordance with FASB ASC 928, "Financial Reporting in the Record and Music Industry". Prepaid royalties represent amounts paid in advance to certain clients and are recoupable against future royalties earned by the clients. Advances are issued in either cash or stock and advance amounts are calculated based on the client's projected earning potential over a fixed period of time. Advances issued in stock are recorded at the fair value on the date of issue.
Results of Operations
Comparison of the years ended
December 31, 2011 and 2010
The following discussion compares the Company's results of operations for the year ended
December 31, 2011
with those for the year ended
December 31, 2010
. The Company's financial statements and notes thereto included elsewhere in this annual report contain detailed information that should be referred to in conjunction with the following discussion.
Revenues
The following table compares total revenue for the periods indicated.
|
Years ended December 31,
|
||||||||||
|
2011
|
2010
|
% Change
|
||||||||
|
Merchandising and fulfillment
|
$
|
2,736,900
|
|
$
|
2,173,400
|
|
26
|
%
|
||
|
Client services
|
387,400
|
|
490,200
|
|
(21
|
)%
|
||||
|
Touring revenue
|
3,796,200
|
|
4,531,100
|
|
(16
|
)%
|
||||
|
Total revenues
|
$
|
6,920,500
|
|
$
|
7,194,700
|
|
(4
|
)%
|
||
Revenues decreased 4% in 2011 primarily from a 16% decrease in touring revenue and a 21% decrease in client services. The decrease was offset by a
26%
increase in merchandising and fulfillment.
Merchandise and fulfillment revenues increased
$563,500
or
26%
to
$2,736,900
compared to
$2,173,400
in 2010. In 2011 the Company focused on marketing and social media campaigns, which resulted in reaching new customers. The increase in new customers resulted in double digit revenue increases in a number of the Company's existing clients. In addition, the Company rolled out its new sales data management system which allowed the Company to develop client specific promotional campaigns, which resulted in better targeting of the existing customer base.
Client Services revenues decreased $102,800 or 21% to $387,400 compared to $490,200 in 2010. In 2010 the Company completed a large consulting project it obtained in 2009, and was hired by one of our major clients to provide creative and general business consulting services for a large US tour. At the end of 2010, those projects were completed. In 2011 the Company obtained smaller technology related projects resulting in the decrease in revenues for 2011 as compared to 2010.
Touring revenue decreased $734,900 or 16% to $3,796,200 compared to $4,531,100 in 2010. The Company has generated a consistent touring base and revenues are directly impacted by our client's touring schedules and frequency. In 2011 our clients generally had shorter touring schedules and toured less frequently which was the primary contributor to the decrease in revenues.
Gross Profit
Gross profit increased $163,900 or 8% to $2,325,000 compared to $2,161,100 in 2010. Gross margin increased 3.6 percentage points to 33.6% from 30.0% in 2010. The increase was mainly attributable to an increase in merchandising and fulfillment margins due to lower inventory cost and an increase in shipping and handling fees charged.
-
21
-
Operating Expenses
Total operating expenses in 2011 were $6,313,100 compared to $5,467,400 in 2010, an increase of $845,700 or 15%.
The increase is due to increases of $229,200 in client expenses related to touring activities, credit card processing costs, and international shipping costs, $347,100 in personnel costs due to an increase in key personnel and general increases in salary cost, $243,700 in option compensation due to additional option grants, and $21,500 in administrative costs.
Net Loss
The Company realized a net loss in 2011 of
$3,974,200
compared to a net loss of
$3,306,800
for the same period in 2010. The losses for 2011 and 2010 each represent $0.01 per share.
Inflation
The Company believes that inflation has not had a material effect on its results of operations.
Comparison of the years ended
December 31, 2010 and 2009
The following discussion compares the Company's results of operations for the year ended
December 31, 2010
with those for the year ended
December 31, 2009
. The Company's financial statements and notes thereto included elsewhere in this annual report contain detailed information that should be referred to in conjunction with the following discussion.
Revenues
The following table compares total revenue for the periods indicated.
|
For the Years Ended
|
||||||||
|
2010
|
2009
|
% Change
|
||||||
|
Merchandising and fulfillment
|
2,173,400
|
|
1,589,900
|
|
37
|
%
|
||
|
Client services
|
490,200
|
|
642,500
|
|
(24
|
)%
|
||
|
Touring revenues
|
4,531,100
|
|
2,493,600
|
|
82
|
%
|
||
|
Total revenues
|
7,194,700
|
|
4,726,000
|
|
52
|
%
|
||
Revenues in 2010 increased $2,468,700 or 52% to $7,194,700 as compared to revenues of $4,726,000 in 2009. The increase was due to the following:
Merchandising and fulfillment revenues increased 37% or $583,500 to $2,173,400 in 2010 as compared to $1,589,900 in 2009. This increase was due to the addition of 8 new merchandise and fulfillment clients. In addition, one of our major clients conducted a bi-annual, nationally televised event that generated substantial fulfillment activity in the second half of 2010.
Client services revenues in 2010 decreased 24% or $152,300 to $490,200 compared to $642,500 in 2009. The Company secured a large consulting project and was hired to provide creative and production services. These services were performed and earned throughout 2009. The project ended in the third quarter of 2010, which was the primary reason for the decrease.
Touring revenues in 2010 increased $2,037,500 or 82% to $4,531,100 compared to $2,493,600 in 2009. The increase was attributable to an increase in the number of touring clients and the frequency of tour dates. In 2010 the Company had several clients with touring projects throughout the year as compared to 2009 where the Company had fewer touring clients, with one of those clients prematurely canceling their tour in the third quarter.
Gross profit
Gross profit increased $704,800 to $2,161,100 in 2010, as compared to $1,456,300 in 2009. The increase was mainly attributed to higher revenues in touring. The overall gross margin decreased slightly from 30.8% to 30% due to lower gross margins related to touring.
-
22
-
Operating expenses
Total operating expenses in 2010 were $
5,467,400
compared to $
5,018,600
in 2009, an increase of $448,800 or 8.9%. The increase was attributable to an increase in our administrative expenses of $550,000 due to an increase in sales commissions, travel related to business development and investor relations activities, increases in insurance and the write down of uncollectible pre-paid royalties. The increase was also attributable to the increase in consulting fees of $30,000. The increase was offset by a $131,200 reduction in professional fees, and freight costs.
Net Loss
The Company realized a net loss in 2010 of $3,306,800 compared to a net loss $3,484,300 in 2009. The 2010 and 2009 losses each represent $0.01 per share.
Inflation
The Company believes that inflation has not had a material effect on its results of operations.
Comparison of the years ended December 31, 2009 and 2008
The following discussion compares the Company's results of operations for the year ended December 31, 2009 with those for the year ended December 31, 2008. The Company's financial statements and notes thereto included elsewhere in this annual report contain detailed information that should be referred to in conjunction with the following discussion.
Revenues
The following table compares total revenue for the periods indicated.
|
For the Years Ended
|
||||||||
|
2009
|
2008
|
% Change
|
||||||
|
Merchandising and fulfillment
|
1,589,900
|
|
804,000
|
|
98
|
%
|
||
|
Client services
|
642,500
|
|
180,600
|
|
256
|
%
|
||
|
Touring revenues
|
2,493,600
|
|
1,196,600
|
|
108
|
%
|
||
|
Total revenues
|
4,726,000
|
|
2,181,200
|
|
117
|
%
|
||
Revenues for the year ended December 31, 2009 increased $2,544,800 or 117% to $4,726,000 as compared to revenues of $2,181,200 for the year ended December 31, 2008. The increase was due to the following:
Merchandising and fulfillment revenues increased 98% or $785,900 to $1,589,900 in 2009 compared to $804,000 in 2008. This increase was due to the addition of 2 new merchandise and fulfillment clients. The increase was also attributable to a substantial increase in membership revenue since a major client announced tour dates for 2009.
Client services revenues in 2009 increased 256% or $461,900 to $642,500 compared to $180,600 in 2008. The increase was due to the Company being awarded a large consulting project and was hired to provide creative and production services that supported the activities for one of our major clients.
Touring revenues increased $1,297,000 or 108% to $2,493,600 compared to $1,196,600 in 2008. The increase in revenue was attributable to a substantial increase both in volume and in price for select VIP services related to a tour from one of our major clients. This increase was less than expected because the client canceled the tour in the third quarter of 2009.
Gross Profit
Gross profit increased $776,600 to $1,456,300 in 2009, as compared to $679,700 in 2008. The increase was mainly attributed to higher revenues in touring. The overall gross margin decreased slightly from 31.2% to 30.8% due to lower gross margins related to touring.
Operating Expenses.
Total operating expenses in 2009 were $5,018,600 compared to $4,930,900 in 2008, an increase of $87,700 or 2%. The increase includes increases in payroll and related costs of $81,000, tour expenses of $42,000, and credit card processing fees of $163,000. These increases were offset by decreases in professional fees of $112,000, and other operating related costs of $86,300. The increase in credit card processing fees is directly attributed to higher levels of touring activity and an increase in ecommerce related sales.
-
23
-
Interest Expense.
During 2009, the Company incurred approximately $2,500 of interest charges compared to interest charges of $484,400 in 2008, a decrease of $481,900. This decrease is attributable to the discount related to restricted stock granted in settlement of notes payable and amortization of the fair value of warrants issued in connection with short term debt in 2008 that did not recur in 2009.
Net Loss.
The Company realized a net loss in 2009 of $3,484,000 compared to a net loss of $4,734,000 in 2008. The 2009 loss represented $.01 per share while the loss for 2008 represented $.02 per share.
Inflation.
The Company believes that inflation has not had a material effect on its results of operations.
Operating Cash Flows
A summarized reconciliation of the Company's net loss to cash provided by (used in) operating activities for the
years ended December 31, 2011, 2010, and 2009
, is as follows
|
2011
|
2010
|
2009
|
||||||
|
Net loss
|
(3,974,200
|
)
|
(3,306,800
|
)
|
(3,484,300
|
)
|
||
|
Depreciation and amortization
|
40,600
|
|
26,900
|
|
18,300
|
|
||
|
Share based compensation
|
699,900
|
|
452,000
|
|
—
|
|
||
|
Payment of stock option exercise received as compensation
|
235,800
|
|
384,500
|
|
—
|
|
||
|
Change in fair value of stock price guarantee
|
63,300
|
|
—
|
|
—
|
|
||
|
Unrealized gain on investment
|
(80,000
|
)
|
—
|
|
—
|
|
||
|
Payments received in common stock
|
(125,000
|
)
|
—
|
|
453,000
|
|
||
|
Intrinsic value of stock options awarded
|
|
|
|
|||||
|
in payment of outside services and compensation
|
2,220,500
|
|
2,671,900
|
|
2,837,800
|
|
||
|
Services provided in consideration of stock subscription
|
—
|
|
70,000
|
|
50,000
|
|
||
|
Deferred revenues, net of prepaid royalties
|
576,400
|
|
(546,000
|
)
|
(77,900
|
)
|
||
|
Changes in current assets and liabilities
|
631,300
|
|
(546,000
|
)
|
(309,700
|
)
|
||
|
Net cash provided by (used in) operating activities
|
288,600
|
|
(793,500
|
)
|
(512,800
|
)
|
||
Working Capital and Liquidity
The Company had cash and cash equivalents of
$996,000
at
December 31, 2011
, compared to
$747,300
at December 31, 2010. The Company had approximately
$1,227,100
of working capital at
December 31, 2011
, a decrease of
$1,015,300
, compared to
$2,242,400
at December 31, 2010. The decrease in working capital is attributed to increases of $527,000 in accounts payable and accrued expenses directly related the the costs associated with fourth quarter touring and related royalties, $506,000 due to the derivative liability related to the rent guarantee associated with or new facility, offset by a $200,000 increase in investments.
The Company had cash and cash equivalents of
$747,300
at December 31, 2010, compared to $730,400 at December 31, 2009. Working capital at December 31, 2010 was $2,242,400, compared to $1,991,000 at December 31, 2009, an increase of $251,400. The increase was primarily attributable to increases in accounts receivable of $121,700, an increase in prepaid royalties of $519,800, offset by a decrease in prepaid expenses of $406,000. The increase in prepaid royalties relates to advances paid to clients in anticipation of touring activities for 2011.
The Company may need an infusion of additional capital to fund anticipated operating costs over the next 12 months. Management believes that that there are sufficient resources to generate positive cash flow through the continued growth in new business, through the recoupment of prepaid royalties, and an increase in inventory turns. Subject to the discussion below, management believes that the Company has adequate cash resources to fund operations during the next 12 months. In addition, management continues to explore opportunities and has added additional resources to monetize its patents. However, there can be no assurance that anticipated touring activity will occur, and that the Company will be successful in monetizing its patents.
-
24
-
Management continues to seek alternative sources of capital to support operations. Finally, world economic conditions, in particular those in the United States, may impact sales of fan experiences and the availability of financing.
Contractual Obligations and Other Commercial Commitments
The table below summarizes our gross contractual obligations and other commercial commitments as of
December 31, 2011
.
|
Contractual Obligations
|
Total
|
|
Less than 1 year
|
|
1-3 years
|
|
3-5 years
|
|
More than 5 years
|
||||||||||
|
|
|
|
|
|
|
|
|
|
|
||||||||||
|
Operating lease
|
$
|
821,069
|
|
|
$
|
149,064
|
|
|
$
|
332,538
|
|
|
$
|
332,538
|
|
|
$
|
6,928
|
|
|
Capital Lease
|
38,169
|
|
|
14,869
|
|
|
20,516
|
|
|
2,784
|
|
|
—
|
|
|||||
|
Total contractual obligations
|
$
|
859,238
|
|
|
$
|
163,933
|
|
|
$
|
353,054
|
|
|
$
|
335,322
|
|
|
$
|
6,928
|
|
Market Risk
Market risk is the potential loss arising from adverse changes in market rates and prices, such as foreign currency rates, interest rates, and other relevant market rates or price changes. In the ordinary course of business, the Company is not exposed to market risk resulting from changes in foreign currency exchange rates. The Company's overall risk management strategy seeks to balance the magnitude of the exposure and the costs and availability of appropriate financial instruments.
Impact of Inflation and Changing Prices
Historically, our business has not been materially impacted by inflation. We price and provide our service within a short time frame.
Foreign Currency Fluctuation
Our revenue is primarily denominated in U.S. dollars. Therefore, we are not directly affected by foreign exchange fluctuations. However, fluctuations in foreign exchange rates may have an effect on tour merchandise and VIP ticket sales for concerts occurring outside the U.S. We do not believe that foreign exchange fluctuations will materially affect our results of operations.
Derivative Instrument
The Company accounts for derivative instruments on the balance sheet at fair value using the Black-Scholes option pricing model calculation. Changes in fair value of the Company's pre-paid rent guarantee are recorded each period in the statement of operations as a component of other income.
Seasonality
Our revenue is subject to seasonality and fluctuations during the year primarily related to artist touring activities. Our clients typically tour between March and October. In addition, the timing of tours for top-grossing acts could impact comparability of quarterly results year over year.
The financial statements listed in Item 15(a) are incorporated herein by reference and are filed as a part of this report and follow the signature pages to this Annual Report on Form 10-K on page F-1.
None.
-
25
-
Evaluation of Disclosure Controls and Procedures
The Company's management, including the President of the Company, as its principal executive officer, and the Chief Financial Officer of the Company, as its principal financial officer, has evaluated the effectiveness of the Company's “disclosure controls and procedures,” as such term is defined in Rule 13a-15(e) promulgated under the Securities Exchange Act of 1934, as amended (the “Exchange Act”). Based upon this evaluation, the President and Chief Financial Officer concluded that, as of the end of each period covered by this report, the Company's disclosure controls and procedures were not effective, due to material weaknesses in internal control over financial reporting described below, for the purpose of ensuring that the information required to be disclosed in the reports that the Company files or submits under the Exchange Act with the Securities and Exchange Commission is recorded, processed, summarized and reported within the time period specified by the Securities and Exchange Commission's rules and forms, and is accumulated and communicated to the Company's management, including its principal executive and financial officers, as appropriate to allow timely decisions regarding required disclosure.
As described in our accompanying
Management's Report on Internal Control over Financial Reporting
, we have identified five remaining material weaknesses in internal control over financial reporting. Because of these remaining material weaknesses, we concluded that, as of
December 31, 2011, 2010, and 2009
, our internal control over financial reporting was not effective based on the criteria outlined in
Internal Control-Integrated Framework
issued by the Committee of Sponsoring Organizations of the Treadway Commission. Accordingly, we have also concluded that our disclosure controls and procedures were not effective as of
December 31, 2011, 2010, and 2009
.
We have implemented new procedures and controls in 2011 and expect to take further steps to remediate the material weaknesses at the entity and activity levels, and to review further our procedures and controls in 2012. In addition, we expect to make additional changes to our infrastructure and related processes that we believe are also reasonably likely to strengthen and materially affect our internal control over financial reporting.
Prior to the complete remediation of these material weaknesses, there remains risk that the processes and procedures on which we currently rely will fail to be sufficiently effective, which could result in material misstatement of our financial position or results of operations and require a restatement. Moreover, because of the inherent limitations in all control systems, no evaluation of controls-even where we conclude the controls are operating effectively-can provide absolute assurance that all control issues, including instances of fraud, if any, have been detected. These inherent limitations include the realities that judgments in decision-making can be faulty, and breakdowns can occur because of simple error or mistake. Additionally, controls can be circumvented by the individual acts of some persons, by collusion of two or more people, or by management override of the controls. The design of any system of controls also is based in part upon certain assumptions about the likelihood of future events, and there can be no assurance that any design will succeed in achieving its stated goals under all potential future conditions. Over time, our control systems, as we develop them, may become inadequate because of changes in conditions, or the degree of compliance with the policies or procedures may deteriorate. Because of the inherent limitations in a cost-effective control system, misstatements due to error or fraud may occur and not be detected and could be material to our financial statements.
The certifications of our principal executive officer and principal financial officer required in accordance with Rule 13a-14(a) under the Exchange Act and Section 302 of the Sarbanes-Oxley Act of 2002 are attached as exhibits to this Annual Report on Form 10-K. The disclosures set forth in this Item 9A contain information concerning (i) the evaluation of our disclosure controls and procedures, and changes in internal control over financial reporting, referred to in paragraph 4 of the certifications, and (ii) material weaknesses in the design or operation of our internal control over financial reporting, referred to in paragraph 5 of the certifications. Those certifications should be read in conjunction with this Item 9A for a more complete understanding of the matters covered by the certifications.
Management's Annual Report on Internal Control over Financial Reporting
Management is responsible for establishing and maintaining effective internal control over financial reporting of the Company. Internal control over financial reporting is a process designed by, or under the supervision of, our Chief Executive Officer and Chief Financial Officer and effected by our Board of Directors, management and other personnel, to provide reasonable assurance regarding the reliability of financial reporting and the preparation of financial statements for external purposes in accordance with generally accepted accounting principles.
-
26
-
Our internal control over financial reporting includes those policies and procedures that: (1) pertain to the maintenance of records that, in reasonable detail, accurately and fairly reflect our transactions and dispositions of our assets; (2) provide reasonable assurance that transactions are recorded as necessary to permit preparation of financial statements in accordance with generally accepted accounting principles, and that our receipts and expenditures are being made only in accordance with authorizations of our management and directors; and (3) provide reasonable assurance regarding prevention or timely detection of unauthorized acquisition, use, or disposition of our assets that could have a material effect on the financial statements.
A material weakness is a deficiency, or combination of deficiencies, in internal control over financial reporting such that there is a reasonable possibility that a material misstatement of our annual or interim financial statements will not be prevented or detected on a timely basis.
Management, with the participation of our principal executive officer and principal financial officer, is required to evaluate the effectiveness of our internal controls over financial reporting as of
December 31, 2011, 2010, and 2009
based on criteria established under the Committee of Sponsoring Organizations of the Treadway Commission (“COSO”) framework, an integrated framework for evaluation of internal controls issued to identify the risks and control objectives related to the evaluation of the control environment. Management has concluded that our internal controls over financial reporting were not effective as of December 31, 2011 due to the following:
|
1.
|
Entity Level Controls
|
|
◦
|
Lack of corporate governance
|
|
◦
|
Ineffective control environment
|
|
◦
|
Lack of segregation of duties
|
|
2.
|
Activity Level Controls
|
|
◦
|
Lack of procedures and control documentation
|
|
◦
|
Lack of information technology controls and documentation
|
1.
Inadequate Entity Level Controls
Lack of Corporate Governance
The Company's Corporate Governance is made up of a set of practices, policies, laws, and principles, designed to provide guidance and structure to directors, managers, and employees with a clear view of corporate goals and business objectives. These processes and procedures need to be clearly defined, presented and administered to each participant in the organization, and should document the distribution of rights and responsibilities among employees, management, clients and customers.
Steps taken towards Remediation for a Lack of Corporate Governance:
|
•
|
The Company has made improvements by designing and drafting a corporate governance policy which has been approved by the Board of Directors, which documents the role of the Board and management, functions of the Board, role of the Audit Committee, agenda items for Board meetings, recoupment of unearned compensation, indemnification, reporting of concerns and complaints, and director access to management.
|
|
•
|
The Company has increased the number of regularly scheduled Board meetings where management presents operating results and engages the Board in operational issues.
|
|
•
|
The Company has reorganized the organizational reporting structure to enable greater oversight and control of operations which has increased the level of awareness and accountability.
|
|
•
|
The Company meets regularly throughout the year to review operating results, policies and procedures, and employee reviews and practices. The Company also has an annual planning meeting to set strategy and goals for the coming year, and consults with its outside professionals on compliance requirements.
|
Ineffective Control Environment
The control environment philosophy of an organization influences the consciousness of its people and how they conduct their activities and responsibilities. Control environment factors include, the integrity, ethical values, and competence of the entity's people; management's philosophy and operating style; the way management assigns authority and responsibility; the way management organizes and develops its people; and the attention and direction provided by the audit committee and board of directors.
-
27
-
Steps taken towards Remediation for an Ineffective Control Environment:
|
•
|
The Company has strengthened its hiring and employment practices by completing in-depth screenings of new personnel, and has initiated formal employee review procedures.
|
|
•
|
In 2011, the Company contracted with an outside consulting company to provide training to our managers, customer service and operational personnel. The Company is also assisting us in developing and documenting our policies, procedures and controls which will assist us in the remediation of our weakness in internal controls.
|
|
•
|
Management has direct oversight and responsibility for independent contractors and consultants. All independent contractors and consultants are required to follow strict corporate policies relating to confidential information, and non-disclosure of corporate and client data. Management sets project goals and objectives for each independent contractor and consultant and measures the performance of each on a regular basis.
|
|
•
|
Management and the Board formally meet to discuss our filings and the discussions are being documented for future reference. During these discussions, our auditors, and legal counsel may present to the Company various information which may be of material importance to our financial reporting and internal controls.
|
|
•
|
With the addition of new management personnel, department managers are required to review their procedures and policies to make sure they are effective. The Company is evaluating the procedure and polices that have material weakness and developing corrective action plans to strengthen our internal controls.
|
|
•
|
The Company has made sweeping changes to its policies and procedures with regard to its financial reporting systems. Upgrades to software systems have been made throughout 2011 which has resulted in the automation of accounting transactions and has enhanced our financial reporting and timeliness of operating results . Management and staff are more integrated into the review process, and results are tracked against expectations.
|
|
•
|
Finance staff are required to review expenses for proper approval and accounting treatment. Managers and staff are required to have expenditures pre-approved by their supervisor, all significant expenditures require multiple approvals including Company officers.
|
Lack of Segregation of Duties
A clear and concise segregation of duties is important to maximize checks and balances so that no single individual has control over two or more phases of a transaction or operation. A strong segregation of duty also is critical to reduce effectively the risk of mistakes and inappropriate actions preventing fraud and discourages collusion. It can be difficult for small businesses to always have a clear separation of duties because there simply are not enough personnel to cover each and every process and procedure. Ultimately, checks and balances need to be in place as a supportive measure to the business operations, but also as a fraud prevention measure as well.
Steps taken towards Remediation for Segregation of Duties:
|
•
|
The Company has changed processes and procedures, has hired additional personnel, and has made upgrades to its inventory management system to better align duties and responsibilities so that there is a greater segregation of duties.
|
|
•
|
The Company has added additional personnel and has segregated certain duties and tasks to provide greater oversight. Transactional processing requires review and approval from an independent staff member or manager. Manual tasks are required to follow written or verbal procedures that have been approved by the Company.
|
|
•
|
The Company implemented new project management software which was designed to increase efficiencies and reduce overhead. The software also identifies deliverables which may be dependent on other deliverables enabling the project managers to redirect duties to other individuals. This software assists the Company with reducing its dependency on any one particular employee with multiple responsibilities, thus preventing a bottleneck and risk of too much control on any one individual.
|
Although significant steps have been taken in this area, many of the changes made to our entity level controls were implemented late in 2008, with no significant steps made in 2009 or 2010. In 2011 the Company implemented new procedures and policies, upgraded systems, and hired additional personnel. The Company believes significant improvements have been made to remediate its material weakness in the internal controls over financial reporting at the entity level, but does not have the appropriate documentation to support its efforts. The Company also believes that further work is still required to develop appropriate controls in some aspects of entity level control to provide reasonable assurance that controls are designed in the most effective and efficient manner possible. While we believe these changes will be effective at mitigating risk of material error, there continues to be additional work required for us to conclude that all three of these control areas are operating effectively. As noted in the Management's Report on Internal Control over Financial Reporting, we consider each of these control areas within the entity level control to constitute a material weakness.
-
28
-
2.
Inadequate Activity Level Controls
Lack of procedures and control documentation
The Company's lacks sufficient documentation relating to certain accounts, revenue recognition, purchasing, accounts payable, inventory, and financial closing, which in effect make these internal controls ineffective. The lack of documentation in internal controls relating to these accounts may affect the financial statements and will directly affect the nature and timing of other auditing procedures for certain activities.
Steps taken towards Remediation of Revenue Recognition:
|
•
|
Most revenue transactions are online credit card payments from products placed for sale on various clients' web sites. The pricing for the products listed is reviewed and approved by management and documented on purchase orders that are reviewed by each department manager.
|
|
•
|
In 2011 the Company upgraded its transactional processing systems which resulted in the automation of several manual accounting tasks. This automation eliminated the risk of human error for these manual tasks and created a more concise audit trail in the revenue recognition process.
|
|
•
|
Each week client managers and marketing staff receive a document outlining the revenues from all clients with strategic information enabling them to compare actual results versus plan and be able to prepare goal and objectives for future weeks. Management reviews the document and works with client management and marketing personnel to hit incremental milestones and forecast.
|
|
•
|
All web sales are reconciled across the Company's multiple revenue and accounting systems comparing for any discrepancies.
|
|
•
|
Improved systems and procedures reconciling offsite revenue nightly. This process reconciles individual revenues directly back to individual general ledger accounts. There is a clear segregation of duties throughout the process minimizing risk of fraud and requiring more individuals to be accountable at different times.
|
Steps taken towards Remediation of Expenditures and Accounts Payable:
|
•
|
Established improved procedures documenting and providing an approval process for authorizing a merchandising agent to complete and submit a purchase order. Each purchase order has been authorized by management and a clear segregation of duties exists between the merchandise being ordered, received and payment made.
|
|
•
|
An internal control procedure has been implemented for receiving goods accurately and validating the cost, quantities, quality of goods against the purchase order.
|
|
•
|
Implemented a policy to obtain at least two quotes on inventory purchases.
|
|
•
|
Implemented a signature authorization policy outlining specific authority prior to any commitment of our funds for various transactions and purchases.
|
|
•
|
Client accounts are reviewed monthly with client managers and accounting staff to assess project performance against expectations. Client revenues are reviewed weekly with client managers and marketing to assess actual results versus plan. Expenses are reviewed as incurred for proper accounting treatment and approval. Client royalty statements are prepared as required and reviewed by management and client managers.
|
|
•
|
The Vendor Master File is reviewed on a weekly basis for updates and changes and any changes are analyzed and monitored for their activity and frequency.
|
Steps taken towards Remediation of Inventory Controls:
|
•
|
Access to changing data within the inventory management software has been restricted to only essential personnel. Other individuals have access to view data and access reports, but they are restricted from making any changes within the system.
|
|
•
|
Policies have been implemented that require all purchases and inventory maintenance to be reviewed by management to authorize pricing, sales and promotional events through client web sites.
|
|
•
|
Improved procedures regarding receiving logs, quality assurance checks, and purchase order processes have been implemented to provide for a clear separation of duties. These procedures deter fraud and protect against collusion.
|
|
•
|
Improved physical inventory controls, and interim cycle counts are overseen by management, with weekly reviews randomly checking floor to sheet and sheet to floor. This procedure, along with improved reporting, is designed to tighten inventory controls and increase inventory turns. Management and merchandising personnel meet regularly to review inventory levels, and client product lines.
|
Steps taken towards Remediation of Financial Closing:
|
•
|
The Company has moved all accounting functions in-house from a third party certified accounting firm.
|
|
•
|
The Company closes its books and reconciles all accounts monthly, and provides management with a comprehensive set of financial and operating reports and analysis of results.
|
|
•
|
The Company has hired professional accounting staff and segregates accounting functions so that no one individual is responsible for the review, approval and oversight of any one task.
|
-
29
-
Lack of information technology controls and documentation
Information technology controls are specific activities performed by persons or systems designed to ensure that the business objectives can be met, protect the business from fraud and collusion, and keep the corporate assets protected and safe.
Steps taken towards Remediation of Information Technology Controls:
|
•
|
Enhanced the documentation and procedures of our information technology to control assurance that changes to financial applications are properly authorized and tested and that access to our information systems and financial applications are appropriately restricted.
|
|
•
|
Updated our information systems user profiles to improve access controls.
|
|
•
|
Implemented improvements to our information systems to further address control deficiencies.
|
|
•
|
Updated secure backup procedures with best practice methodologies for protecting our financial data and, in case of a problem, continuously testing restoration from backup tapes.
|
|
•
|
Enhanced the documentation of certain core proprietary technologies so that there is more redundancy and protection of corporate assets.
|
Although significant steps have been taken in this area, many of the changes made to our activity level controls were implemented late in 2008, with no significant steps made in 2009 or 2010. In 2011 the Company made significant improvements to the activity level controls specifically with regard to the deficiencies with the financial close and inventory controls. With the consolidation of facilities in 2012, the Company expects to take additional steps to remediate the deficiency in information technology controls and has begun to outline the steps needed to cure this deficiency. In addition, further work is required to develop appropriate controls in the other aspects of activity level control to provide reasonable assurance that controls are designed in the most effective and efficient manner possible. Therefore, while we believe these changes are effective at mitigating risk of material error, there continues to be additional work required for us to conclude that both of these control areas are operating effectively. Therefore, as noted in the Management's Report on Internal Control over Financial Reporting, we consider each of these control areas within the activity level control to constitute a material weakness.
A factor for our internal control deficiencies is the small size of the Company and the lack of a financial expert on the Audit Committee of the Board of Directors and other corporate governance controls. As defined by the Public Company Accounting Oversight Board Auditing Standard No. 5, a material weakness is a significant control deficiency or a combination of significant control deficiencies that results in there being more than a remote likelihood that a material misstatement of the annual or interim financial statements will not be prevented or detected. Management continues to monitor and assess the controls to ensure compliance.
Our independent registered public accounting firm has issued its report on the Company's internal control over financial reporting as of
December 31, 2011, 2010, and 2009
. This report appears below.
Attestation Report of the Independent Registered Public Accounting Firm
REPORT OF INDEPENDENT REGISTERED PUBLIC ACCOUNTING FIRM
To the Board of Directors and
Stockholders of PAID, Inc.
We have audited the internal control over financial reporting of PAID, Inc. (the “Company”) as of December 31, 2011, based on criteria established in
Internal Control-Integrated Framework
issued by the Committee of Sponsoring Organizations of the Treadway Commission (COSO). The Company's management is responsible for maintaining effective internal control over financial reporting and for its assessment of the effectiveness of internal control over financial reporting, included in the accompanying Management Report on Internal Control over Financial Reporting. Our responsibility is to express an opinion on the Company's internal control over financial reporting based on our audit.
We conducted our audit in accordance with the standards of the Public Company Accounting Oversight Board (United States). Those standards require that we plan and perform the audit to obtain reasonable assurance about whether effective internal control over financial reporting was maintained in all material respects. Our audit of internal control over financial reporting included obtaining an understanding of internal control over financial reporting, assessing the risk that a material weakness exists, and testing and evaluating the design and operating effectiveness of internal control based on the assessed risk, and performed such other procedures as we considered necessary in the circumstances. We believe that our audit provides a reasonable basis for our opinion.
A company's internal control over financial reporting is a process designed to provide reasonable assurance regarding the reliability
-
30
-
of financial reporting and the preparation of financial statements for external purposes in accordance with generally accepted accounting principles. A company's internal control over financial reporting includes those policies and procedures that (1) pertain to the maintenance of records that, in reasonable detail, accurately and fairly reflect the transactions and dispositions of the assets of the company; (2) provide reasonable assurance that transactions are recorded as necessary to permit preparation of financial statements in accordance with generally accepted accounting principles, and that receipts and expenditures of the company are being made only in accordance with authorizations of management and directors of the company; and (3) provide reasonable assurance regarding prevention or timely detection of unauthorized acquisition, use, or disposition of the company's assets that could have a material effect on the financial statements.
Because of the inherent limitations, internal control over financial reporting may not prevent or detect misstatements. Also, projections of any evaluation of effectiveness of the internal control over financial reporting to future periods are subject to the risk that controls may become inadequate because of changes in conditions, or that the degree of compliance with the policies or procedures may deteriorate.
A material weakness is a control deficiency, or combination of deficiencies, in internal control over financial reporting, such that there is a reasonable possibility that a material misstatement of the Company's annual or interim financial statements will not be prevented or detected on a timely basis.
As described in Management's Annual Report on Internal Control over Financial Reporting, management has concluded that the Company did not maintain effective control over financial reporting as of December 31, 2011 due to pervasive control deficiencies and material weaknesses. The existence of pervasive control deficiencies and material weaknesses impairs the effectiveness of other controls by rendering their design ineffective or by keeping them from operating effectively. As stated in management's report, the pervasive deficiencies identified include both entity and activity level controls and consisted of (1) ineffective corporate governance, (2) an ineffective control environment, (3) the lack of any procedural and control documentation, (4) a pervasive lack of segregation of duties without appropriate alternative controls and, (5) the lack of information technology controls and documentation. These material weaknesses were considered in determining the nature, timing, and extent of audit procedures applied in our audits of the financial statements. This report does not affect our report on such financial statements.
In our opinion, because of the effect of the material weakness described above on the achievement of the objectives of the control criteria, PAID, Inc. has not maintained effective internal control over financial reporting as of December 31, 2011, based on criteria established in
Internal Control-Integrated Framework
issued by the Committee of Sponsoring Organizations of the Treadway Commission (COSO).
We have also audited, in accordance with the standards of the Public Company Accounting Oversight Board (United States), the balance sheets and the related statements of operations, shareholders' equity and cash flows of PAID, Inc., and our report dated
May 15, 2012
expressed an unqualified opinion on those financial statements.
/s/ Rosen Seymour Shapss Martin & Company LLP
CERTIFIED PUBLIC ACCOUNTANTS
New York, New York
May 15, 2012
Changes in Internal Control Over Financial Reporting
As discussed in the Managements' Annual Report on Internal Control over Financial Reporting, the Company made a number of changes to improve its internal controls over financial reporting late in 2008. Although significant steps were taken late in 2008, no additional changes were made in 2009 or 2010. In 2011 the Company made considerable improvements to the entity and activity controls and expects to take further steps in 2012 to remediate the outlined deficiencies. However, while we believe they are effective at mitigating risk of material error, we have not yet concluded that they are operating effectively. There was no change in our internal control over financial reporting during the fourth fiscal quarter of 2011 that has materially affected, or is reasonably likely to materially affect, our internal control over financial reporting.
Not applicable.
-
31
-
Directors and Executive Officers
The following table sets forth certain information regarding the directors and executive officers of PAID:
|
Name
|
Age
|
Position
|
|||
|
Gregory Rotman*
|
46
|
Director, Chief Executive Officer & President
|
|||
|
Richard Rotman*
|
41
|
Director, Chief Operating Officer, Vice President & Secretary
|
|||
|
Christopher Culross
|
45
|
Chief Financial Officer, Treasurer & Assistant Secretary
|
|||
|
Andrew Pilaro
|
42
|
Director
|
|||
|
*Gregory Rotman and Richard Rotman are brothers.
|
|||||
Each of the directors was elected as of September 19, 2000, for a term expiring at the 2001 Annual Meeting of Stockholders and until their successors are elected and qualified. The Company has not held an annual meeting or elected directors since September 19, 2000. Under the Delaware General Corporation Law, each director holds office until such director's successor is elected and qualified or until such director's earlier resignation or removal. The following is a description of the current occupation and business experience for at least five years for each director and executive officer.
Gregory Rotman
has served as a Director and the Chief Executive Officer and President of PAID, Inc. since February 1999. From 1995 to 1998, he served as a Partner of Teamworks, LLC, which was responsible for the design, financing and build-out of MCI National Sports Gallery.
Richard Rotman
has served as a Director and Vice President and Secretary of PAID since February 1999. He has served as Chief Operating Officer since March 2010, and as Chief Financial Officer and Treasurer from February 1999 through March 2010. Prior to joining PAID, he was involved in the management and day-to-day operations of Rotman Auction, which he formed in February 1997. From 1995 until February 1997, Mr. Rotman worked for the family business, Rotman Collectibles, where he focused on sale and distribution of collectibles, including through auctions and on the Internet.
Christopher Culross
became the Company's Chief Financial Officer effective in March 2010. Prior to joining PAID in October 2009, he served as the Chief Financial Officer of G.V. Moore Lumber Co., Inc., from 2007 until 2009, as Corporate Controller for ClearStory Systems, Inc. from 2005 to 2007, as Chief Financial Officer/Chief Operating Officer for the Center for Living and Working, Inc., from 2002 to 2005, and as Director of Budgeting and Planning for ACT Manufacturing, Inc. from 2000 to 2002.
Andrew Pilaro
has served as a Director of PAID since September 2000. Since 2005, he has served as Chairman of CAP Advisors Limited, an investment management company, with responsibility for asset management.
The Company has not made any material changes to the procedures by which security holders may recommend nominees to the Board of Directors.
Other Significant Persons
Keith Garde
, age 58, is President of the celebrity services group. Mr. Garde has more than 25 years of management and production experience in the entertainment industry. In 1995, Mr. Garde founded PKA Management, a Boston-based firm that manages national talent, manages video production and provides consulting services. Mr. Garde was one of the early pioneers in leveraging the Internet for entertainment entities, utilizing it for the digital distribution of artists' content and intellectual property. Mr. Garde has collaborated on special projects for MTV, VH1, A&E, ESPN, NFL, Disney, Paramount Pictures, Daimler-Chrysler, multiple record labels and many other major corporations and artists. He also serves as special projects manager for the artist Aerosmith.
Audit Committee
The Securities and Exchange Commission has adopted rules to implement certain requirements of the Sarbanes-Oxley
-
32
-
Act of 2002 pertaining to public company audit committees. One of the rules requires a company to disclose whether it has an “audit committee financial expert” serving on its audit committee. Based on its review of the criteria of an audit committee financial expert under the rule adopted by the SEC, the Board of Directors does not believe that any member of the Board of Directors' Audit Committee would be described as an audit committee financial expert. At this time, the Board of Directors believes it would be desirable for the Audit Committee to have an audit committee financial expert serving on the committee. While from time to time informal discussions as to potential candidates have occurred, no formal search process has commenced. Andrew Pilaro, the Company's only independent director, is the sole member of the audit committee. The audit committee does not have a charter.
Audit Committee Report
The Audit Committee reviewed and discussed our audited financial statements for the years ended
December 31, 2011, 2010, and 2009
with our management. The Audit Committee also reviewed and discussed our audited financial statements and the matters required to be discussed by Auditing Standards No. 61, as amended (AICPA, Professional Standards, Vol. 1 AU section 380) with Rosen Seymour Shapss Martin & Company LLP, our independent registered public accounting firm. The Audit Committee received from Rosen Seymour Shapss Martin & Company LLP the written disclosures and letter required by applicable requirements of the Public Company Accounting Oversight Board regarding the independent accountant's communications with the audit committee concerning independence, and has discussed with the independent accountant the independent accountant's independence.
Based on the reviews and discussions referred to above, the Audit Committee recommended to our Board of Directors that our audited financial statements be included in our Annual Report on Form 10-K for the years ended
December 31, 2011, 2010, and 2009
.
|
The Audit Committee
|
|
Andrew Pilaro
|
Code of Ethics
The Company has adopted a Code of Ethics that applies to all of its directors, officers, and employees, including its principal executive officer, principal financial officer, principal accounting officer, or controller, or persons performing similar functions. A written copy of the Company's Code of Ethics will be provided to anyone, free of charge, upon request to: Christopher Culross, CFO, PAID, INC., 40 Washington Street, Westborough, Massachusetts 01581.
Any waiver of the code of business conduct and ethics for directors or executive officers, or any amendment to the code that applies to directors or executive officers, may only be made by the board of directors. We intend to satisfy the disclosure requirement under Item 5.05 of Form 8-K regarding an amendment to, or waiver from, a provision of this code of ethics by posting such information on our web site, at the address and location specified above. To date, no such waivers have been requested or granted.
Section 16(a) Beneficial Ownership Reporting Compliance
Section 16(a) of the Securities Exchange Act of 1934 requires the Company's directors and executive officers, and persons who own more than 10% of the Company's outstanding Common Stock to file with the Securities and Exchange Commission initial reports of ownership and reports of changes in ownership of Common Stock. These persons are required by SEC regulation to furnish the Company with copies of all such reports they file. To the Company's knowledge, based solely on a review of the copies of such reports furnished to the Company and representations that no other reports were required, all Section 16(a) filing requirements applicable to its officers and directors and beneficial owners of more than 10% of the Company's stock, have been complied with for the period which this Form 10-K relates, except that each of Richard Rotman and Andrew Pilaro were one day late with respect to a Form 4 filing related to one transaction.
-
33
-
Compensation Discussion and Analysis
Overview
Our three member board of directors serves in lieu of a compensation committee. The Board does not have a separate compensation committee. The Board is responsible for establishing policies and otherwise discharging the responsibilities of a compensation committee with respect to the compensation of our executive officers. Our President and our Chief Operating Officer are members of the Board and help set compensation.
In prior years the Board has set a low salary for its executive officers, and has relied at times on grants of stock options as further compensation incentive. The primary objective of our use of stock options is to compensate executives in a way that reinforces decisions which would lead to long-term growth, which in turn leads to increased stockholder value. The Board also periodically is responsible for administering our incentive and equity-based plans. All decisions with respect to executive compensation are approved by the Board, including the one independent member of the board.
Elements of compensation for our executives named in the Summary Compensation Table generally include one or more of the following:
|
•
|
Base Salary (not typically subject to adjustment);
|
|
•
|
Bonus; and
|
|
•
|
Stock Option Awards.
|
In addition, our executives receive the same health, disability and insurance benefits as all other full time employees.
Our allocation between long-term and currently paid compensation is intended to ensure adequate base compensation to attract and retain personnel, while providing incentives to maximize long-term value for our Company and our shareholders. We provide cash compensation in the form of base salary to meet competitive salary norms to the extent possible. At times, we provide non-cash compensation to reward tenure with the Company. Our option awards typically require a one to four year vesting from the date of grant to encourage management continuity. There is no established policy or formula for deciding when to award long-term compensation or the amount of such compensation. This approach provides us with flexibility to respond to marketplace and individual factors in attracting and retaining our executives and encouraging performance.
Elements of Compensation
Base Salary
We believe that base salary is used to recognize the experience, skills, knowledge and responsibilities required of all our employees, including our executive officers. Generally, we believe that executive base salaries should be targeted near the median of the range of salaries for executives in similar positions at comparable companies. However, the Board does not believe that a sufficient peer group exists to appropriately compare the base salaries against other companies, but believes that salaries should be competitive with other public companies that have similar equity structures.
In prior years our executives have not received a base salary increase in an effort to focus on continued investment in the growth of the Company. When determining base salaries, the Compensation Committee considers a variety of factors. Those factors included level of the individual's responsibility, individual's unique skills, base salaries at prior employment, and the availability of others in the market with similar skills, experience and abilities. In 2011 the Board reviewed the salaries of the Company's President and COO, who in prior years had base salaries that were considered low for their skills, and abilities, as compared to other individuals within the market. Based on their review the Board approved to increase the base salaries of the named executives to better align them with executives of other public companies of similar size and equity structures.
Bonus and Other Non-Equity Incentive Plan Compensation
While the Company may from time to time award a bonus to an executive, the Company does not have a bonus plan for its executive officers. The Company also does not grant other non-equity plan compensation.
Stock Option and Equity Incentive Programs
We believe that equity grants provide our executive officers with a strong link to our long-term performance, create an ownership culture and closely align the interests of our executive officers with the interests of our shareholders. Because of the direct relationship between the value of an option and the market price of our common stock, we believe that granting stock options is a good method of motivating the executive officers to manage our Company in a manner that is consistent with the interests of our Company and our shareholders. We believe that equity grants in the form of stock options motivate executives
-
34
-
to make stronger business decisions, improve financial performance, focus on both short-term and long-term objectives and encourage behavior that protects and enhances the long-term interests of our stockholders. In addition, the one to four year vesting feature of our typical equity grants is designed to encourage executive officer retention because this feature provides an incentive to our executive officers to remain in our employ during the vesting period.
In determining the size of equity grants to our executive officers, our Board considers the applicable executive officer's performance, the period during which an executive officer has been in a key position with us, the amount of equity previously awarded to the applicable executive officer, the vesting of such awards, the number of shares available under our plans, the limitations under our plans and the recommendations of management.
We currently do not have any formal requirement to grant, or not to grant, equity compensation on specified dates. The grant value of all equity awards granted to executive officers is equal to the fair market value on the date of grant.
Under the Company's 2002 Stock Option Plan, the Board is authorized to determine and designate from time to time those individuals to whom options are granted. Unless an earlier expiration is specified by the Board in the option agreement, each option granted under the Stock Option Plan will expire generally on the tenth anniversary of the date the option was granted.
In 2011 we made an equity grant to our President and Chief Financial Officer as an incentive to create long-term value for the Company and its stockholders. The Board approved a 2011 grant of 2,500,000 options to our President and 1,500,000 options to our Chief Financial Officer, subject to a two year vesting schedule.
Perquisites
Our executive officers do not receive any perquisites and are not entitled to benefits that are not otherwise available to all of our employees. In this regard it should be noted that we do not provide pension arrangements, post-retirement health coverage, or similar benefits for our executive officers or employees.
Defined Contribution Plan
The Company adopted a 401(k) plan for all of its employees in January 2012. Under the plan, the Company has the option to make matching contributions, up to 7% of employee contributions. All employees are treated equally under the plan. The Company has not made any matching contributions.
Employment Agreements
We have not entered into formal employment agreements with our employees.
Accounting and Tax Considerations
We select and implement our various elements of compensation for their ability to help us achieve our performance and retention goals and not based on any unique or preferential financial accounting treatment. In this regard, Section 162(m) of the Internal Revenue Code generally sets a limit of one million dollars on the amount of annual compensation (other than certain enumerated categories of performance-based compensation) that we may deduct for federal income tax purposes. Compensation realized upon the exercise of stock options is considered performance based if, among other requirements, the plan pursuant to which the options are granted has been approved by the a company's stockholders and has a limit on the total number of shares that may be covered by options issued to any plan participant in any specified period. Options granted under our 2002 Stock Option Plan and our 2011 Stock Option Plan are considered performance based. Therefore any compensation realized upon the exercise of stock options granted under our stock option plans will be excluded from the deductibility limits of Section 162(m). While we have not adopted a policy requiring that all compensation be deductible, we consider the consequences of Section 162(m) in designing our compensation practices.
Stock Ownership Guidelines
Although we have not adopted any stock ownership guidelines, we believe that our compensation of executive officers, which includes the use of stock options, results in an alignment of interest between these individuals and our stockholders.
Benchmarking and Consultants
Our Board reviews the history of all the elements of each executive officer's total compensation over the past several years. The Board may choose to compare the compensation of the executive officers with that of the executive officers in an appropriate market comparison group comprised of smaller public entities. The Board does not believe that a sufficient peer
-
35
-
group exists to appropriately compare the base salaries against other companies, but believes that the salaries paid are competitive with or substantially lower than other comparable entities.
Other Employees
In 2011, we compensated a number of non-executive employees and consultants through stock option grants under the Company's 2001 Non-Qualified Stock Option Plan. The 2001 Plan expired on January 31, 2011 and was replaced with the 2011 Non-Qualified Stock Option Plan. One hundred twenty million shares were reserved under the 2001 Plan since its inception, and thirty million shares were reserved under the 2011 Plan. Typically, except for executive officers, shares are immediately exercised by the employee or consultant. In 2011, employees received options for
2,280,344
shares equal to
$526,600
in compensation, and consultants and professionals received
7,211,585
shares equal to
$1,693,900
in compensation.
Compensation to the Named Executive Officers
While we did not research comparable salaries with a peer group, we believe that our named executive officers' salaries are either competitive with or substantially lower than salaries of similarly situated executive officers.
Two of our three named executives have served in their roles since February 1999. Over the past 10 years, the two executives received two stock option grants which vested over time. The first grant was made under the Company's 2002 Stock Option Plan on October 11, 2002. Both executives were granted options to purchase 10,000,000 shares of common stock at an exercise price of $.041, pursuant to the following vesting schedule: options to purchase 4,000,000 shares of common stock vested on April 11, 2003; options to purchase 3,000,000 shares of common stock vested on October 11, 2003, and options to purchase 3,000,000 shares vested on October 11, 2004. Under the Company's 2002 Stock Option Plan, on January 10, 2008, each of Gregory Rotman and Richard Rotman received an additional grant of 2,500,000 shares of common stock at $.415 per share, which vest on January 10, 2012, such shares were re-priced to $.145 per share in November 2011. On November 10, 2011 Gregory Rotman received and additional grant under the Company's 2002 Stock Option Plan of 2,500,000 shares of common stock at $.145 per share, which vest over a two year period. On that same date, under the Company's 2011 Non-Qualified Stock Option Plan, Christopher Culross received a stock option grant to purchase 1,500,000 shares of common stock at $.145 per share, which vest over a two year period.
The following table sets forth the compensation of the Company's chief executive officer, the chief financial officer, and each officer whose total cash compensation exceeded $100,000, for the last three fiscal years ended
December 31, 2011, 2010, and 2009
.
|
|
|
|
Summary Compensation Table
|
||||||||||||||||||||
|
Name and
|
|
|
|
|
|
Salary (1)
|
|
Bonus
|
|
Option Awards ($) (1)
|
|
All Other
|
|
||||||||||
|
Principal Position
|
|
|
Year
|
|
|
|
Compensation ($) (3)
|
Total
|
|||||||||||||||
|
Gregory Rotman
|
|
2011
|
|
|
$
|
276,400
|
|
|
—
|
|
|
$
|
363,400
|
|
|
$
|
12,500
|
|
$
|
652,300
|
|
||
|
President and Chief Executive Officer (PEO)
|
|
2010
|
|
|
113,000
|
|
|
—
|
|
|
—
|
|
|
17,200
|
|
130,200
|
|
||||||
|
|
2009
|
|
|
100,000
|
|
|
—
|
|
|
—
|
|
|
17,600
|
|
117,600
|
|
|||||||
|
|
|
|
|
|
|
|
|
|
|
|
|
|
|
|
|
|
|||||||
|
Christopher Culross
|
|
2011
|
|
|
200,000
|
|
|
—
|
|
|
173,500
|
|
|
—
|
|
373,500
|
|
||||||
|
Chief Financial Officer (PFO)
|
|
2010
|
|
|
196,600
|
|
|
—
|
|
|
—
|
|
|
—
|
|
196,600
|
|
||||||
|
|
|
|
2009
|
(2)
|
|
28,800
|
|
|
—
|
|
|
10,400
|
|
|
—
|
|
39,200
|
|
|||||
|
|
|
||||||||||||||||||||||
|
Richard Rotman
|
|
2011
|
|
|
204,400
|
|
|
—
|
|
|
74,200
|
|
|
—
|
|
278,600
|
|
||||||
|
Chief Operating Officer, Vice President, and Secretary
|
|
2010
|
|
|
113,000
|
|
|
57,300
|
|
|
—
|
|
|
—
|
|
170,300
|
|
||||||
|
|
2009
|
|
|
100,000
|
|
|
—
|
|
|
—
|
|
|
—
|
|
100,000
|
|
|||||||
|
1.
|
Represents the dollar amount recognized for financial statement reporting purposes for the year ended December 31, 2011 in accordance with FASB ASC Topic 718, as outlined in Note 8 of our Audited Financial Statements contained herein.
|
|
2.
|
Start date was October 21, 2009. Salary was annualized at $150,000 per year. Mr. Culross was promoted to CFO in March 2010.
|
|
3.
|
Home utility expenses.
|
-
36
-
The following tables set forth certain information related to outstanding equity awards as of
December 31, 2011
for our executive officers.
|
OUTSTANDING EQUITY AWARDS AT FISCAL YEAR-END
|
||||||||||||
|
|
|
|
|
|
|
|
|
|
|
|
||
|
|
|
Option Awards
|
||||||||||
|
Name
|
|
Number of Securities Underlying Unexercised Options (#) Exercisable
|
|
Number of Securities Underlying Unexercised Options (#) Unexercisable
|
|
Equity Incentive Plan Awards: Number of Securities Underlying Unexercised Unearned Options (#)
|
|
Option Exercise Price ($)
|
|
Option Expiration Date
|
||
|
Gregory Rotman, President and CEO (PEO)
|
|
2,500,000
|
|
—
|
|
—
|
|
$
|
0.145
|
|
|
1/9/2018
|
|
|
—
|
|
2,500,000
|
|
—
|
|
$
|
0.145
|
|
|
11/9/2021
|
|
|
|
|
|
|
|
|
|
|
|
|
|
|
|
|
Christopher Culross,
Chief Financial Officer, Treasurer and Assistant Secretary (PFO) |
|
—
|
|
1,500,000
|
|
—
|
|
0.145
|
|
|
11/9/2021
|
|
|
|
—
|
|
—
|
|
—
|
|
—
|
|
|
—
|
||
|
|
|
|
|
|
|
|
|
|
|
|
||
|
Richard Rotman, Chief Operating Officer, Vice President and Secretary
|
|
3,121,952
|
|
—
|
|
—
|
|
$
|
0.041
|
|
|
10/10/2012
|
|
|
2,500,000
|
|
—
|
|
—
|
|
$
|
0.145
|
|
|
1/9/2018
|
|
|
OPTION EXERCISES AND STOCK VESTED
|
||||||
|
|
|
|
|
|
||
|
|
|
Option Awards
|
||||
|
Name
|
|
Number of Shares Acquired on Exercise #
|
|
Value Realized on Exercise $
|
||
|
Gregory Rotman, President and CEO (PEO)
|
|
3,750,000
|
|
$
|
522,750
|
|
|
|
|
|
|
|
|
|
|
Christopher Culross, Chief Financial Officer, Treasurer and Assistant Secretary (PFO)
|
|
—
|
|
—
|
|
|
|
|
|
|
|
|
||
|
|
|
|
|
|
||
|
Richard Rotman, Chief Operating Officer, Vice President and Secretary
|
|
2,000,000
|
|
$
|
218,000
|
|
Our named executive officers who serve as directors, did not receive any separate compensation from the Company for serving as directors in 2011. On October 11, 2002, our independent director, Andrew Pilaro received options to purchase 2,000,000 shares of common stock at an exercise price of $.041, pursuant to the 2002 Stock Option Plan, subject to the following vesting schedule: options to purchase 800,000 shares of common stock vested immediately; options to purchase an additional 600,000 shares of common stock vested on October 11, 2003, and options to purchase 600,000 shares of common stock vested on October 11, 2004, and expire on October 11, 2012. On November 10, 2011 Andrew Pilaro received an additional option grant to purchase 500,000 of common stock at an exercise price of $0.145, pursuant to the 2002 Stock Option Plan. The shares granted vest immediately and expire on November 10, 2021.
The following table provides compensation information for the one-year period ended
December 31, 2011
for the only non-employee member of our Board of Directors.
|
|
|
Director Compensation in 2011
|
||||
|
Name and
|
|
Fees earned or paid in cash
|
|
Option Awards ($)
|
|
Total
|
|
Andrew Pilaro
|
|
$—
|
|
$65,544
|
|
$65,544
|
-
37
-
Compensation Committee Interlocks and Insider Participation
The Company has no separate compensation committee. Each of Gregory Rotman, Richard Rotman and Andrew Pilaro, and no other current or former officer or director, participated in deliberations of the Board of Directors concerning executive officer compensation. For the fiscal year ended
December 31, 2011
, (i) no executive officer of the Company served as a member of the compensation committee (or other board committee performing equivalent functions or, in the absence of any such committee, the entire board of directors) of another entity, one of whose executive officers served on the compensation committee (or other board committee performing equivalent functions or, in the absence of any such committee, the entire board of directors) of the Company; (ii) no executive officer of the Company served as a director of another entity, one of whose executive officers served on the compensation committee (or other board committee performing equivalent functions or, in the absence of any such committee, the entire board of directors) of the Company; and (iii) no executive officer of the Company served as a member of the compensation committee (or other board committee performing equivalent functions or, in the absence of any such committee, the entire board of directors) of another entity, one of whose executive officers served as a director of the Company.
Compensation Committee Report
The board of directors has reviewed and discussed the Compensation Discussion and Analysis required by Item 402(b) of SEC Regulation S-K with management and, based on such review and discussions, the board of directors recommended that this Compensation Discussion and Analysis be included in this Annual Report on Form 10-K.
Board of Directors
Andrew Pilaro
Gregory Rotman
Richard Rotman
To the knowledge of the management of the Company the following table sets forth the beneficial ownership of our common stock as of
May 10, 2012
of each of our directors and executive officers, and all of our directors and executive officers as a group.
|
Name of Beneficial Owner
|
|
Amount and Nature of Beneficial Ownership
|
|
|
Percent of Class (5)
|
|
Gregory Rotman
|
|
5,689,866
|
(1)
|
|
1.83%
|
|
Richard Rotman
|
|
14,514,862
|
(2)
|
|
4.66%
|
|
Christopher Culross
|
|
—
|
(3)
|
|
—%
|
|
Andrew Pilaro
|
|
2,568,700
|
(4)
|
|
0.82%
|
|
All directors and executive
|
|
22,773,428
|
|
|
7.31%
|
|
officers as a group (4 individuals)
|
|
|
|
|
|
|
|
|
|
|
|
|
|
(1)
|
Included are options to purchase 2,500,000 shares of the Company's common stock at an exercise price of $.145, granted on January 10, 2008, which vest on January 10, 2012. Excluded are options to purchase 2,500,000 shares of the Company's common stock at an exercise price of $.145, granted on November 10, 2011, which vest over two years, as such options are not exercisable within 60 days, and thus, are not beneficially owned.
|
|
(2)
|
Includes options to purchase 3,121,952 shares of the Company's common stock at an exercise price of $.041, granted on October 11, 2002, options to purchase 2,500,000 shares of the Company's common stock at an exercise price of $.145, granted on January 10, 2008, which vest on January 10, 2012.
|
|
(3)
|
Excludes options to purchase 1,500,000 share of the Company's common stock at an exercise price of $.145, granted on November 10, 2011, which vest over two years. These options are not exercisable within 60 days, and thus, are not beneficially owned.
|
|
(4)
|
Includes 17,200 shares held indirectly as custodian for Mr. Pilaro's minor sons and options to purchase 2,500,000 shares of the Company's common stock at an exercise price of $.041, all of which are vested.
|
|
(5)
|
Percentages are calculated on the basis of the amount of outstanding securities plus for such person or group, any
|
-
38
-
securities that person or group has the right to acquire within 60 days.
To the knowledge of the management of the Company, based solely on our review of SEC filings, the following table sets forth the beneficial ownership of our common stock as of
May 10, 2012
of each beneficial owner of more than five percent of any class of the Company's Common Stock, other than as held by our directors and executive officers.
|
Name and Address of Beneficial Owner
|
|
Amount and Nature of Beneficial Ownership
|
|
Percent of Class
|
|
|
Lewis Opportunity Fund, L.P.
|
|
25,162,645
|
|
|
8.12%
|
|
LAM Waiting Game Fund LTD
|
|
|
|
|
|
|
500 5th Avenue, Suite 2240
|
|
|
|
|
|
|
New York, NY 10010
|
|
|
|
|
|
|
|
|
|
|
|
|
The information regarding the Company's “Equity Compensation Plan Information” is incorporated herein by reference in Part II, Item 5 of this Annual Report on Form 10-K.
The Company did not engage in any transaction in 2009, 2010 or 2011, and does not currently propose any transaction, in which the Company was is a participant and the amount involved exceeds $120,000, and in which any related person had or will have a direct or indirect material interest.
Review, Approval or Ratification of Transactions with Related Parties
It is our unwritten policy, which policy is not otherwise evidenced, for any related party transaction that involves more than a de minimis obligation, expense or payment or stock option or equity grants, to obtain approval by our entire board of directors prior to our entering into any such transaction. In conformity with our various policies on related party transactions, any transactions discussed in this Item 13 has been reviewed and approved by our board of directors.
Director Independence
We are currently traded on the OTCBB. Accordingly, we are not required to and do not have a majority of independent directors or a compensation or nominating committee. Andrew Pilaro is the sole member of the audit committee.
Our board of directors currently consists of three members. Our board of directors determined that one of the three directors, Andrew Pilaro, is independent under the standards of the “Nasdaq Global Market" pursuant to Nasdaq Listing Rule 5605.
Each of the directors was elected as of September 19, 2000, for a term expiring at the 2001 Annual Meeting of Stockholders and until their successors are elected and qualified. The Company has not held an annual meeting or elected directors since September 19, 2000. Under the Delaware General Corporation Law, each director holds office until such director's successor is elected and qualified or until such director's earlier resignation or removal.
Audit Fees
. The aggregate fees billed by Grant Thornton LLP for the audit of the Company's annual financial statements for the fiscal year ended December 31, 2010, and the reviews of the quarterly financial statements included in the Company's Forms 10‑Q for fiscal years 2011 and 2010, were $95,300 and $68,500, respectively.
Audit Related Fees
.
There were no audit related fees for the past two fiscal years. There were no fees billed to the Company by Grant Thornton LLP for the past two fiscal years for assurance and related services that are reasonably related to the performance of the audit or review of the Company's financial statements.
Tax Fees
. There were no fees billed to the Company by Grant Thornton LLP in either of the past two fiscal years for professional services for tax compliance, tax advice, and tax planning.
All Other Fees
.
In 2011 the Company was billed by Grant Thornton LLP $15,200 in fees for other services. There were no fees billed to the Company by Grant Thornton LLP for any other services in 2010.
The Audit Committee approves all audit and audit-related fees. The Audit Committee is required to pre-approve all non-audit services to be performed by the auditor. The percentage of hours expended on the principal accountant's engagement to audit the Company's financial statements for the most recent fiscal year that were attributed to work performed by persons
-
39
-
other than the principal accountant's full-time, permanent employees was 0%.
-
40
-
(a)(1) Financial Statements
For a list of the financial information included herein, see “Index to Audited Financial Statements” on page 41 of this Annual Report on Form 10-K.
(a)(2) Financial Statements Schedules
All schedules are omitted because they are not applicable or the required information is included in the financial statements or notes thereto.
(a)(3) Exhibits
The list of exhibits filed as a part of this Annual Report on Form 10-K is set forth on the Exhibit Index immediately preceding the exhibits hereto and is incorporated herein by reference.
-
41
-
SIGNATURES
Pursuant to the requirements of Section 13 or 15(d) of the Securities Exchange Act of 1934, the registrant has duly caused this report to be signed on its behalf by the undersigned, thereunto duly authorized.
|
|
PAID, INC.
|
||
|
|
|
|
|
|
By:
|
/s/ Gregory Rotman
|
||
|
|
|
Gregory Rotman, President
|
|
|
Date:
|
May 15, 2012
|
||
Pursuant to the requirements of the Securities Exchange Act of 1934, this report has been signed below by the following persons on behalf of the registrant and in the capacities and on the dates indicated.
|
Signature
|
Title
|
Date
|
|||
|
/s/ Gregory Rotman
|
President and Director (PEO)
|
May 15, 2012
|
|||
|
Gregory Rotman
|
|
||||
|
/s/ Richard Rotman
|
Vice President, Secretary and Director
|
May 15, 2012
|
|||
|
Richard Rotman
|
|||||
|
/s/ Andrew Pilaro
|
Director
|
May 15, 2012
|
|||
|
Andrew Pilaro
|
|||||
|
|
|
||||
|
/s/ Christopher R. Culross
|
Chief Financial Officer (PFO)
|
May 15, 2012
|
|||
|
Christopher R. Culross
|
|
||||
-
42
-
PAID, INC.
INDEX TO AUDITED FINANCIAL STATEMENTS
DECEMBER 31, 2011, 2010, AND 2009
|
Years ended December 31, 2011, 2010, and 2009
|
|
|
Years ended December 31, 2011, 2010, and 2009
|
|
|
Years ended December 31, 2011, 2010, and 2009
|
|
-
43
-
REPORT OF INDEPENDENT REGISTERED PUBLIC ACCOUNTING FIRM
To the Board of Directors and
Stockholders of PAID, Inc.
We have audited the accompanying balance sheets of PAID, Inc. as of December 31, 2011, 2010 and 2009, and the related statements of operations, shareholders' equity and cash flows for each of the years in the three-year period ended December 31, 2011. PAID, Inc.'s management is responsible for these financial statements. Our responsibility is to express an opinion on these financial statements based on our audits.
We conducted our audits in accordance with the standards of the Public Company Accounting Oversight Board (United States). Those standards require that we plan and perform the audit to obtain reasonable assurance about whether the financial statements are free of material misstatement. An audit includes examining, on a test basis, evidence supporting the amounts and disclosures in the financial statements. An audit also includes assessing the accounting principles used and significant estimates made by management, as well as evaluating the overall financial statement presentation. We believe that our audits provide a reasonable basis for our opinion.
In our opinion, the financial statements referred to above present fairly, in all material respects, the financial position of PAID, Inc. as of December 31, 2011, 2010 and 2009, and the results of its operations and its cash flows for each of the years in the three-year period ended December 31, 2011 in conformity with accounting principles generally accepted in the United States of America.
We also have audited, in accordance with the standards of the Public Company Accounting Oversight Board (United States), PAID, Inc.'s internal control over financial reporting as of December 31, 2011, based on criteria established in
Internal Control-Integrated Framework
issued by the Committee of Sponsoring Organizations of the Treadway Commission (COSO), and our report dated May 15, 2012 expressed an adverse opinion.
/s/ Rosen Seymour Shapss Martin & Company LLP
CERTIFIED PUBLIC ACCOUNTANTS
New York, New York
May 15, 2012
-
44
-
PAID, INC.
AS OF DECEMBER 31,
|
ASSETS
|
2011
|
2010
|
2009
|
||||||||
|
Current assets:
|
|
|
|||||||||
|
Cash and cash equivalents
|
$
|
996,000
|
|
$
|
747,300
|
|
$
|
730,400
|
|
||
|
Investments
|
205,000
|
|
—
|
|
—
|
|
|||||
|
Accounts receivable, net
|
194,300
|
|
303,900
|
|
182,300
|
|
|||||
|
Inventories, net
|
876,700
|
|
1,052,500
|
|
1,042,700
|
|
|||||
|
Prepaid expenses and other current assets
|
574,100
|
|
112,600
|
|
518,700
|
|
|||||
|
Prepaid royalties
|
522,100
|
|
959,700
|
|
439,900
|
|
|||||
|
Due from employees
|
—
|
|
—
|
|
19,600
|
|
|||||
|
Total current assets
|
3,368,200
|
|
3,176,000
|
|
2,933,600
|
|
|||||
|
Property and equipment, net
|
91,000
|
|
71,800
|
|
40,500
|
|
|||||
|
Intangible asset, net
|
7,100
|
|
8,000
|
|
9,000
|
|
|||||
|
Prepaid facility costs
|
1,468,000
|
|
—
|
|
—
|
|
|||||
|
Total assets
|
$
|
4,934,300
|
|
$
|
3,255,800
|
|
$
|
2,983,100
|
|
||
|
LIABILITIES AND SHAREHOLDERS' EQUITY
|
|
|
|
|
|||||||
|
Current liabilities:
|
|
|
|
|
|||||||
|
Accounts payable
|
$
|
491,400
|
|
$
|
292,500
|
|
$
|
159,700
|
|
||
|
Capital leases - current portion
|
13,800
|
|
6,500
|
|
—
|
|
|||||
|
Accrued expenses
|
1,332,500
|
|
470,000
|
|
592,300
|
|
|||||
|
Deferred revenues
|
303,400
|
|
164,600
|
|
190,800
|
|
|||||
|
Total current liabilities
|
2,141,100
|
|
933,600
|
|
942,800
|
|
|||||
|
Long-term liabilities:
|
|||||||||||
|
Capital leases - net of current
|
21,000
|
|
10,300
|
|
—
|
|
|||||
|
Commitments and contingencies (note 12)
|
|
|
|
|
|||||||
|
Shareholders' equity:
|
|
|
|
|
|||||||
|
Common stock, $.001 par value, 350,000,000 shares authorized; 308,736,705, 286,449,511, and 268,174,642 shares issued and outstanding at December 31, 2011, 2010, and 2009 respectively
|
308,800
|
|
286,500
|
|
268,200
|
|
|||||
|
Additional paid-in capital
|
49,273,300
|
|
44,861,100
|
|
41,371,000
|
|
|||||
|
Accumulated deficit
|
(46,809,900
|
)
|
(42,835,700
|
)
|
(39,528,900
|
)
|
|||||
|
Stock subscription receivable
|
—
|
|
—
|
|
(70,000
|
)
|
|||||
|
Total shareholders' equity
|
2,772,200
|
|
2,311,900
|
|
2,040,300
|
|
|||||
|
Total liabilities and shareholders' equity
|
$
|
4,934,300
|
|
$
|
3,255,800
|
|
$
|
2,983,100
|
|
||
See accompanying notes to financial statements
45
PAID, INC.
FOR THE YEARS ENDED DECEMBER 31,
|
|
2011
|
2010
|
2009
|
||||||||
|
Revenues
|
$
|
6,920,500
|
|
$
|
7,194,700
|
|
$
|
4,726,000
|
|
||
|
Cost of revenues
|
4,595,500
|
|
5,033,600
|
|
3,269,700
|
|
|||||
|
Gross profit
|
2,325,000
|
|
2,161,100
|
|
1,456,300
|
|
|||||
|
Operating expenses
|
6,313,100
|
|
5,467,400
|
|
5,018,600
|
|
|||||
|
Loss from operations
|
(3,988,100
|
)
|
(3,306,300
|
)
|
(3,562,300
|
)
|
|||||
|
Other income (expense):
|
|
|
|
|
|
|
|||||
|
Interest expense
|
(2,800
|
)
|
(600
|
)
|
(2,500
|
)
|
|||||
|
Other income
|
16,700
|
|
100
|
|
80,500
|
|
|||||
|
Total other income (expense), net
|
13,900
|
|
(500
|
)
|
78,000
|
|
|||||
|
Loss before income taxes
|
(3,974,200
|
)
|
(3,306,800
|
)
|
(3,484,300
|
)
|
|||||
|
Provision for income taxes
|
—
|
|
—
|
|
—
|
|
|||||
|
Net loss
|
$
|
(3,974,200
|
)
|
$
|
(3,306,800
|
)
|
$
|
(3,484,300
|
)
|
||
|
Loss per share - basic
|
$
|
(0.01
|
)
|
$
|
(0.01
|
)
|
$
|
(0.01
|
)
|
||
|
Weighted average shares - basic and diluted
|
294,685,429
|
|
277,021,260
|
|
260,711,253
|
|
|||||
See accompanying notes to financial statements
-
46
-
PAID, INC.
STATEMENTS OF CHANGES IN SHAREHOLDERS' EQUITY
FOR THE
FOR THE YEARS ENDED DECEMBER 31, 2011, 2010, AND 2009
|
|
Common stock
|
Additional Paid-in Capital
|
Accumulated Deficit
|
Stock Subscription Receivable
|
Total
|
|||||||||||||||||
|
|
Shares
|
Amount
|
||||||||||||||||||||
|
Balance, December 31, 2008
|
251,369,046
|
|
$
|
251,400
|
|
$
|
36,392,500
|
|
$
|
(36,044,600
|
)
|
—
|
|
$
|
599,300
|
|
||||||
|
Issuance of common stock pursuant to exercise of stock options granted to employees for services
|
1,098,272
|
|
1,100
|
|
280,900
|
|
—
|
|
—
|
|
282,000
|
|
||||||||||
|
Issuance of common stock pursuant to exercise of stock options granted to professionals and consultants
|
8,880,400
|
|
8,900
|
|
2,472,600
|
|
—
|
|
—
|
|
2,481,500
|
|
||||||||||
|
Gross compensation related to stock options granted to consultant for service
|
—
|
|
—
|
|
74,400
|
|
—
|
|
—
|
|
74,400
|
|
||||||||||
|
Proceeds from the assignment of call options
|
—
|
|
—
|
|
158,200
|
|
—
|
|
—
|
|
158,200
|
|
||||||||||
|
Issuance of common stock
|
4,826,924
|
|
4,800
|
|
1,341,400
|
|
—
|
|
—
|
|
1,346,200
|
|
||||||||||
|
Exercise of warrants
|
2,000,000
|
|
2,000
|
|
198,000
|
|
—
|
|
(120,000
|
)
|
80,000
|
|
||||||||||
|
Services received in consideration of payment of stock subscription receivable
|
—
|
|
—
|
|
—
|
|
—
|
|
50,000
|
|
50,000
|
|
||||||||||
|
Share based compensation related to issuance of incentive stock options
|
—
|
|
—
|
|
453,000
|
|
—
|
|
—
|
|
453,000
|
|
||||||||||
|
Net loss
|
—
|
|
—
|
|
—
|
|
(3,484,300
|
)
|
—
|
|
(3,484,300
|
)
|
||||||||||
|
Balance, December 31, 2009
|
268,174,642
|
|
$
|
268,200
|
|
$
|
41,371,000
|
|
$
|
(39,528,900
|
)
|
$
|
(70,000
|
)
|
$
|
2,040,300
|
|
|||||
|
Issuance of common stock pursuant to exercise of stock options granted to employees for services
|
910,239
|
|
|
900
|
|
|
288,000
|
|
|
—
|
|
|
—
|
|
288,900
|
|
||||||
|
Issuance of common stock pursuant to exercise of stock options granted to professionals and consultants
|
7,986,582
|
|
|
8,000
|
|
|
2,375,000
|
|
|
—
|
|
|
—
|
|
2,383,000
|
|
||||||
|
Share based compensation related to issuance of incentive stock options
|
—
|
|
|
—
|
|
|
452,000
|
|
|
—
|
|
|
—
|
|
452,000
|
|
||||||
|
Services received in consideration of payment of stock subscription receivable
|
—
|
|
|
—
|
|
|
—
|
|
|
—
|
|
|
70,000
|
|
70,000
|
|
||||||
|
Options exercised
|
9,378,048
|
|
|
9,400
|
|
|
375,100
|
|
|
—
|
|
|
—
|
|
384,500
|
|
||||||
|
Net loss
|
—
|
|
|
—
|
|
|
—
|
|
|
(3,306,800
|
)
|
|
—
|
|
(3,306,800
|
)
|
||||||
|
Balance, December 31, 2010
|
286,449,511
|
|
$
|
286,500
|
|
$
|
44,861,100
|
|
$
|
(42,835,700
|
)
|
$
|
—
|
|
$
|
2,311,900
|
|
|||||
-
47
-
|
|
Common stock
|
Additional Paid-in Capital
|
Accumulated Deficit
|
Stock Subscription Receivable
|
Total
|
|||||||||||||||||
|
|
Shares
|
Amount
|
||||||||||||||||||||
|
Issuance of common stock pursuant to exercise of stock options granted to employees for services
|
2,280,344
|
|
2,300
|
|
524,300
|
|
—
|
|
—
|
|
526,600
|
|
||||||||||
|
Issuance of common stock pursuant to exercise of stock options granted to professionals and consultants
|
7,211,585
|
|
7,200
|
|
1,686,700
|
|
—
|
|
—
|
|
1,693,900
|
|
||||||||||
|
Issuance of restricted common stock for the prepayment of facility costs
|
6,082,985
|
|
6,100
|
|
1,271,300
|
|
—
|
|
—
|
|
1,277,400
|
|
||||||||||
|
Share based compensation related to issuance of incentive stock options
|
—
|
|
—
|
|
699,900
|
|
—
|
|
—
|
|
699,900
|
|
||||||||||
|
Options exercised
|
6,712,280
|
|
6,700
|
|
230,000
|
|
—
|
|
—
|
|
236,700
|
|
||||||||||
|
Net loss
|
—
|
|
—
|
|
—
|
|
(3,974,200
|
)
|
(3,974,200
|
)
|
||||||||||||
|
Balance, December 31, 2011
|
308,736,705
|
|
$
|
308,800
|
|
49,273,300
|
|
(46,809,900
|
)
|
—
|
|
$
|
2,772,200
|
|
||||||||
See accompanying notes to financial statements
-
48
-
PAID, INC.
FOR THE
FOR THE YEARS ENDED DECEMBER 31,
|
|
2011
|
2010
|
2009
|
||||||||
|
Operating activities:
|
|
|
|
||||||||
|
Net loss
|
$
|
(3,974,200
|
)
|
$
|
(3,306,800
|
)
|
$
|
(3,484,300
|
)
|
||
|
Adjustments to reconcile net loss to net cash provided by (used in) operating activities:
|
|
|
|
|
|
|
|||||
|
Depreciation and amortization
|
40,600
|
|
26,900
|
|
18,300
|
|
|||||
|
Unrealized gain on investments
|
(80,000
|
)
|
—
|
|
—
|
|
|||||
|
Bad debts
|
23,300
|
|
22,500
|
|
—
|
|
|||||
|
Inventory reserve
|
125,000
|
|
—
|
|
112,500
|
|
|||||
|
Change in fair value of stock price guarantee
|
63,300
|
|
—
|
|
—
|
|
|||||
|
Payments received in common stock
|
(125,000
|
)
|
—
|
|
—
|
|
|||||
|
Payment of stock option exercise received as compensation
|
235,800
|
|
384,500
|
|
—
|
|
|||||
|
Share based compensation
|
699,900
|
|
452,000
|
|
453,000
|
|
|||||
|
Fair value of stock options awarded to professionals and consultants in payment of fees for services provided
|
1,693,900
|
|
2,383,000
|
|
2,555,800
|
|
|||||
|
Fair value of stock options awarded to employees in payment of compensation
|
526,600
|
|
288,900
|
|
282,000
|
|
|||||
|
Services received in consideration of payment of stock subscription receivable
|
—
|
|
70,000
|
|
50,000
|
|
|||||
|
Changes in assets and liabilities:
|
|
|
|
|
|||||||
|
Accounts receivable
|
86,300
|
|
(144,200
|
)
|
(199,500
|
)
|
|||||
|
Inventories
|
50,800
|
|
(9,800
|
)
|
(138,300
|
)
|
|||||
|
Prepaid expense and other current assets
|
(209,700
|
)
|
425,900
|
|
58,000
|
|
|||||
|
Prepaid royalties
|
437,600
|
|
(519,900
|
)
|
(148,900
|
)
|
|||||
|
Accounts payable
|
198,900
|
|
132,800
|
|
(239,700
|
)
|
|||||
|
Accrued expenses
|
356,700
|
|
(122,400
|
)
|
97,200
|
|
|||||
|
Deferred revenue
|
138,800
|
|
(26,100
|
)
|
71,100
|
|
|||||
|
Net cash provided by (used in) operating activities
|
288,600
|
|
57,300
|
|
(512,800
|
)
|
|||||
|
Investing activities:
|
|
|
|
|
|
|
|||||
|
Property and equipment additions
|
(28,500
|
)
|
(38,900
|
)
|
(26,900
|
)
|
|||||
|
|
|
||||||||||
|
Financing activities:
|
|
|
|
|
|
|
|||||
|
Payments on capital lease
|
(12,400
|
)
|
(1,500
|
)
|
—
|
|
|||||
|
Proceeds from assignment of call option
|
—
|
|
—
|
|
158,200
|
|
|||||
|
Proceeds from sale of warrants
|
—
|
|
—
|
|
80,000
|
|
|||||
|
Proceeds from issuance of common stock
|
—
|
|
—
|
|
925,000
|
|
|||||
|
Proceeds from the exercise of stock options
|
1,000
|
|
—
|
|
—
|
|
|||||
|
Net cash provided by (used in) financing activities
|
(11,400
|
)
|
(1,500
|
)
|
1,163,200
|
|
|||||
|
|
|
|
|
||||||||
|
Net increase in cash and cash equivalents
|
248,700
|
|
16,900
|
|
623,500
|
|
|||||
|
|
|
|
|
||||||||
|
Cash and cash equivalents, beginning
|
747,300
|
|
730,400
|
|
106,900
|
|
|||||
|
|
|
|
|
||||||||
|
Cash and cash equivalents, ending
|
$
|
996,000
|
|
$
|
747,300
|
|
$
|
730,400
|
|
||
|
|
|
|
|
||||||||
|
SUPPLEMENTAL DISCLOSURES OF CASH FLOW INFORMATION
|
|
|
|
|
|
|
|||||
|
Cash paid during the period for:
|
|
|
|
|
|
|
|||||
|
Income taxes
|
$
|
—
|
|
$
|
—
|
|
$
|
—
|
|
||
|
Interest
|
$
|
2,000
|
|
$
|
600
|
|
$
|
—
|
|
||
|
|
|
|
|
||||||||
|
SUPPLEMENTAL DISCLOSURES OF NON-CASH INFORMATION
|
|
|
|
|
|
|
|
|
|||
|
Acquisition of property and equipment under capital lease
|
$
|
30,400
|
|
|
$
|
18,300
|
|
|
$
|
—
|
|
|
Amounts due in connection with issuance of common stock
|
$
|
—
|
|
|
$
|
—
|
|
|
$
|
421,200
|
|
|
Common stock issued in payment of future facility costs
|
$
|
1,277,400
|
|
|
$
|
—
|
|
|
$
|
—
|
|
See accompanying notes to financial statements
-
49
-
PAID, INC.
NOTES TO FINANCIAL STATEMENTS
DECEMBER 31, 2011, 2010, AND 2009
The Company's primary focus is to provide brand-related services to businesses, celebrity clients in the entertainment industry as well as charitable organizations. PAID's brand management, brand marketing, social media marketing, product design and merchandising, website design; development and hosting services are designed to grow each client's customer base in size, loyalty and revenue generation. We offer entertainers and business entities comprehensive web-presence and related services supporting and managing clients' official websites and fan-community services including e-commerce, VIP ticketing, live event fan experiences, user-generated content, client content publishing and distribution, fan forums, social network management, social media marketing, customer data capture, management and analysis.
The Company has continued to incur significant losses. For the
years ended December 31, 2011, 2010, and 2009
, the Company reported losses of
$3,974,200
,
$3,306,800
, and
$3,484,300
, respectively. The Company has an accumulated deficit of
$46,809,900
at
December 31, 2011
.
Management believes that its efforts over the past two years has positioned the Company to take advantage of growth opportunities within the music and entertainment related industries. With the consolidation of facilities into our new Westborough location, management believes that the Company will be able to increase productivity and will be able to create efficiencies without having to incur additional overhead to support our client base. In addition, the Company expects to have a direct cash savings in 2012 of approximately $75,000 due to the Company's prior payment of rent in stock as outlined in Note 12. In 2011 the Company invested in infrastructure and new technologies, to enable us to process a higher volume of ecommerce activity, and be able to collect key data on buyers of our products and services. The Company has restructured personnel and has hired top talent to oversee business functions, such as fulfillment operations, client services, and business development. The Company will continue to develop key partnerships to aid in the acquisition of new clients and services.
Management believes that these changes will have a positive impact on revenues and gross profits for 2012, and with the recoupment of prepaid royalties and an increase in inventory turns, the Company should have sufficient resources to generate positive cash flow. In addition, the Company continues to increase its efforts to generate income from its patents.
Presentation and Basis of Financial Statements
The accompanying financial statements have been prepared in accordance with accounting principles generally accepted in the United States of America (“GAAP”).
Use of Estimates
In preparing financial statements in conformity with GAAP, management is required to make estimates and assumptions that affect the reported amounts of assets and liabilities and disclosure of contingent assets and liabilities as of the date of the balance sheets and reported amounts of revenue and expenses during the reporting periods. Material estimates that are particularly susceptible to significant change in the near term relate to inventories, deferred tax asset valuation, assumptions used in the determination of fair value of stock options and warrants using the Black-Scholes option-pricing model, and forfeiture rates related to unvested stock options. Although these estimates are based on management's knowledge of current events and actions, they may ultimately differ from actual results.
Cash and Cash Equivalents
The Company considers all highly liquid investments purchased with an original maturity of three months or less to be cash equivalents.
Investments
As of
December 31, 2011
, the Company's investments consisted of trading securities that were stated at fair value, with gains or losses resulting from changes in fair value recognized in earnings as other (income) expense, net. Management determines the appropriate classification of its investments in debt and equity securities at the time of purchase and reevaluates such determinations at each balance sheet date. Marketable debt and equity securities that are bought and held principally for the purpose of selling them in the near term are classified as trading securities and are reported at fair value, with unrealized
50
gains and losses recognized as earnings. Debt securities are classified as held for maturity when the Company has the positive intent and ability to hold the securities to maturity. Held to maturity securities are recorded as either short term or long term on the balance sheet based on contractual maturity dates and are stated at cost. Securities not classified as held to maturity or as trading, are classified as available-for-sale, and are carried at fair market value, with the unrealized gains and losses, net of tax, included in the determination of comprehensive income and reported in shareholders' equity.
Accounts Receivable
Accounts receivable are carried at original invoice amount less an estimate for doubtful receivables based on a review of all outstanding amounts on a monthly basis. Accounts receivable are presented net of an allowance for doubtful collections of
$48,300
,
$25,000
and
$2,500
at
December 31, 2011, 2010, and 2009
, respectively. In determining this allowance, objective evidence that a single receivable is uncollectible as well as a historical pattern of collections of accounts receivable that indicates the entire face amount of a portfolio of accounts receivable may not be collectible is considered at each balance sheet date. Accounts are written off when significantly past due after exhaustive efforts at collection.
Inventories
Inventories consist of merchandise for sale and are stated at the lower of average cost or market determined on a first-in, first-out (FIFO) method. When a purchase contains multiple copies of the same item, they are stated at average cost.
Management periodically reviews inventories on hand to ascertain if any is slow moving or obsolete. In connection with this review, at
December 31, 2011
, 2010, and 2009 the Company provided for reserves totaling
$655,000
,
$609,000
, and
$587,000
respectively.
Prepaid Royalties
In accordance with GAAP, prepaid royalties, which consist of artist royalty advances are deferred when paid and expensed based on the completion of performances, shows or other activities. Certain stock advances contain guarantees related to the proceeds from the sale of the stock, and are accounted for at fair value on the date of issuance.
Property and Equipment
Property and equipment are stated at cost. Depreciation is computed using the straight-line method over the estimated useful lives of 3 to 5 years.
Intangible Assets
Intangible assets consist of patents which are being amortized on a straight-line basis over their estimated useful life of 17 years.
Asset Impairment
Long lived assets to be held and used are reviewed to determine whether any events or changes in circumstances indicate that their carrying amount not be recoverable. The Company bases its evaluation on indicators about the future economic benefits that the assets can be expected to provide including historical or future profitability measurements. Management reviews the estimated useful lives, as well as other external market conditions or factors that may be present. If such impairment indicators are present or other factors exist that indicate that the carrying amount of the asset may not be recoverable, the Company determines whether an impairment has occurred through the use of an undiscounted cash flow analysis of assets at the lowest level for which identifiable cash flows exist. If impairment is indicated, the Company recognizes a loss for the difference between the carrying amount and the estimated fair value of the asset. The fair value of the asset is measured using an estimated discounted cash flow analysis.
51
Fair Value Measurement
Financial instruments and certain non-financial assets and liabilities are measured at their fair value as determined based on the assets highest and best use. GAAP has established a framework for measuring fair value that is based on a hierarchy which requires that the valuation technique used be based on the most objective inputs available for measuring a particular asset or liability. There are three broad levels in the fair value hierarchy which describe the degree of objectivity of the inputs used to determine fair value. The fair value hierarchy is set forth below:
Level 1 - inputs to the valuation methodology are quoted prices (unadjusted) for identical assets or liabilities in active markets.
Level 2 - inputs to the valuation methodology include quoted prices for similar assets and liabilities in active markets, and inputs that are observable for the asset or liability, either directly or indirectly, for substantially the full term of the financial instrument.
Level 3 - inputs to the valuation methodology are unobservable and significant to the fair value measurement. They are based on best information available in the absence of level 1 and 2 inputs.
The fair value of the Company's cash and cash equivalents, accounts receivable, investments, accounts payable, accrued expenses, and capital leases are approximately the same as their carrying amounts. In addition, the Company's derivative instruments, consisting of stock options, stock purchase warrants, and a stock price guarantee, are all valued using the Black-Scholes option pricing model.
Income Taxes
Income taxes are accounted for under the liability method. Under this method, deferred income taxes are provided for temporary differences between the financial reporting and the tax bases of assets and liabilities and are measured using enacted laws and rates that will be in effect when the differences are expected to reverse. A valuation allowance is provided when management believes it is more likely than not that some or all of the deferred tax assets will not be realized. GAAP requires that, in applying the liability method, the financial statement effects of an uncertain tax position be recognized based on the outcome that is more likely than not to occur. Under this criterion the most likely resolution of an uncertain tax position should be analyzed based on technical merits and on the outcome that would likely be sustained under examination. These requirements became effective for annual financial statements beginning after December 15, 2008 and the Company adopted them as of January 1, 2009. The Company has no uncertain tax positions as of December 31, 2011.
Revenue Recognition
The Company generates revenue principally from sales of fan experiences, fan club membership fees, sales of its purchased inventories, and from
consulting services.
Fan experience sales generally include tickets and related experiences at concerts and other events conducted by performing artists. Revenues associated with these fan experiences are generally reported gross, rather than net, and are deferred until the related event has been concluded, at which time the revenues and related direct costs are recognized.
Fan club membership fees are recognized ratably over the term of the related membership, generally one year.
For sales of merchandise owned and warehoused by the Company, the Company is responsible for conducting the sale, billing the customer, shipping the merchandise to the customer, processing customer returns and collecting accounts receivable. The Company recognizes revenue upon verification of the credit card transaction and shipment of the merchandise, discharging all obligations of the Company with respect to the transaction.
Client services revenues include web development and design, creative services, film and video services, marketing services and general business consulting services. For contracts that are of a short duration and fixed price, revenue is recognized when there are no significant obligations and upon acceptance by the customer of the completed project. Revenues on longer-term fixed price contracts are recognized using the percent-of-completion method. Services that are preformed on a time and material basis are recognized as the related services are performed.
Cost of Revenues
Cost of revenues include event tickets, ticketing and venue fees, shipping and handling fees associated with e-commerce sales, merchandise and royalties paid to clients.
52
Selling and Administration Expenses
Selling, general, and administrative expenses include indirect client related expenses, including credit card processing fees, payroll, travel, facility costs, and other general and administrative expenses.
Advertising Costs
Advertising costs, totaling
$9,900
,
$12,800
, and
$33,700
in
2011
,
2010
, and
2009
, respectively, are charged to expense when incurred.
Share-Based Compensation
Share-based compensation cost is measured at their fair value on the grant date, and is recognized as an expense over the employee's or non-employee's requisite service period (generally the vesting period of the equity grant).
Segment Reporting
The Company has determined that it has only one discreet operating segment consisting of activities and services surrounding the sale of fan experiences, fan club memberships, and merchandise associated with its relationships with performing artists and organizations.
Concentrations
The Company's financial instruments that are exposed to concentrations of credit risk consist primarily of cash and cash equivalents. The Company places its cash and cash equivalents with high credit quality institutions.
For the years ended
December 31, 2011
and
December 31, 2010
revenues from a limited number of clients accounted for approximately
54%
and
75%
, respectively, of total revenues. These revenues were generated from the sales of tour merchandise, VIP services, merchandising
and fulfillment services, and client services. For the year ended December 31, 2009, one client Aerosmith, generated 67% of the Company's revenues primarily from the sales of VIP experiences
Earnings Per Common Share
Basic earnings per share represents income available to common stockholders divided by the weighted-average number of common shares outstanding during the period. Diluted earnings per share reflects additional common shares that would have been outstanding if dilutive potential common shares had been issued, as well as any adjustment to income that would result from the assumed issuance. Potential common shares that may be issued by the Company relate to outstanding stock options and warrants. The number of common shares that would be included in the calculation of outstanding options and warrants is determined using the treasury stock method. The assumed conversion of outstanding dilutive stock options and warrants would increase the shares outstanding but would not require an adjustment of income as a result of the conversion. Stock options and warrants applicable to
17,183,284
,
18,995,564
, and
32,914,625
shares at
December 31, 2011, 2010, and 2009
, respectively, have been excluded from the computation of diluted earnings per share because they would reduce the reported loss per share and therefore have an anti-dilutive effect.
Reclassifications
Certain amounts in the 2010 and 2009 financial statements have been reclassified to conform to the 2011 presentation with no effect on previously reported net loss or accumulated deficit.
53
At December 31, property and equipment consisted of the following:
|
2011
|
2010
|
2009
|
|||||||||
|
Computer equipment and software
|
$
|
226,900
|
|
$
|
177,800
|
|
$
|
126,100
|
|
||
|
Office furniture and equipment
|
19,200
|
|
9,300
|
|
3,800
|
|
|||||
|
Website development costs
|
314,200
|
|
314,200
|
|
314,200
|
|
|||||
|
560,300
|
|
501,300
|
|
444,100
|
|
||||||
|
Accumulated depreciation
|
(469,300
|
)
|
(429,500
|
)
|
(403,600
|
)
|
|||||
|
$
|
91,000
|
|
$
|
71,800
|
|
$
|
40,500
|
|
|||
Depreciation expense of property and equipment for the
years ended December 31, 2011, 2010, and 2009
amounted to
$39,700
,
$25,900
, and
$17,400
The Company has a patent for the real-time calculation of shipping costs for items purchased through online auctions using a zip code as a destination location indicator. It includes shipping charge calculations across multiple carriers and accounts for additional characteristics of the item being shipped, such as weight, special packaging or handling, and insurance costs.
On April 19, 2011, the Company was granted a patent for a technique for facilitating advanced, rapid, accurate estimation of shipping costs across multiple shipping carriers and shipping options between buyer and seller in an online auction.
At December 31, intangible assets consisted of the following:
|
2011
|
2010
|
2009
|
|||||||||
|
Patents
|
$
|
16,000
|
|
$
|
16,000
|
|
$
|
16,000
|
|
||
|
16,000
|
|
16,000
|
|
16,000
|
|
||||||
|
Accumulated amortization
|
(8,900
|
)
|
(8,000
|
)
|
(7,000
|
)
|
|||||
|
$
|
7,100
|
|
$
|
8,000
|
|
$
|
9,000
|
|
|||
Amortization expense of intangible assets for the
years ended December 31, 2011, 2010, and 2009
was approximately
$900
.
Estimated future annual amortization expense is approximately $900 for each year through 2019.
At December 31, accrued expenses consist of the following:
|
|
2011
|
2010
|
2009
|
||||||||
|
Payroll and related costs
|
$
|
41,600
|
|
$
|
48,300
|
|
$
|
179,600
|
|
||
|
Professional and consulting fees
|
51,200
|
|
86,400
|
|
186,100
|
|
|||||
|
Royalties
|
587,300
|
|
266,100
|
|
184,500
|
|
|||||
|
Rent guarantee liability
|
505,900
|
|
—
|
|
—
|
|
|||||
|
Other
|
146,500
|
|
69,200
|
|
42,100
|
|
|||||
|
Total
|
$
|
1,332,500
|
|
$
|
470,000
|
|
$
|
592,300
|
|
||
54
Capital Lease Obligations
The Company is obligated under various capital leases for equipment, which expire at various dates through April 2015. As of December 31, 2011 the assets capitalized under these leases cost approximately
$50,000
, and have associated accumulated depreciation of approximately
$13,800
. As of December 31, 2010, the assets capitalized under these leases cost approximately
$19,500
, and have associated accumulated depreciation of approximately
$1,600
.
Minimum future lease payments under capital lease obligations as of
December 31, 2011
are as follows:
|
Year Ended December 31,
|
|
||
|
2012
|
$
|
14,870
|
|
|
2013
|
12,160
|
|
|
|
2014
|
8,360
|
|
|
|
2015
|
2,780
|
|
|
|
Total future minimum lease payments
|
38,170
|
|
|
|
Less amount representing interest
|
3,370
|
|
|
|
Present value of net minimum lease payments
|
34,800
|
|
|
|
Less current portion
|
13,800
|
|
|
|
|
$
|
21,000
|
|
There was no provision for income taxes for the
years ended December 31, 2011, 2010, and 2009
due to the Company's net operating losses and its valuation reserve against deferred income taxes.
The difference between the provision for income taxes using amounts computed by applying the statutory federal income tax rate of 34% and the Company's effective tax rate is due primarily to the net operating losses incurred by the Company and the valuation reserve against the Company's deferred tax asset.
The tax effects of significant temporary differences and carry forwards that give rise to deferred taxes are as follows:
|
|
2011
|
2010
|
2010
|
||||||||
|
Federal net operating loss carry forward
|
$
|
12,536,000
|
|
$
|
11,529,000
|
|
$
|
10,568,000
|
|
||
|
State net operating loss carry forward
|
1,653,000
|
|
1,340,000
|
|
1,311,000
|
|
|||||
|
|
14,189,000
|
|
12,869,000
|
|
11,879,000
|
|
|||||
|
Valuation allowance
|
(14,189,000
|
)
|
(12,869,000
|
)
|
(11,879,000
|
)
|
|||||
|
Net deferred tax asset
|
$
|
—
|
|
$
|
—
|
|
$
|
—
|
|
||
The valuation reserve applicable to net deferred tax assets at
December 31, 2011
, 2010, and 2009 is due to the likelihood that the potential future benefits from the deferred tax assets will not to be realized.
The Company has not been audited by the Internal Revenue Service ("IRS") or any states in connection with income taxes. The Company files income tax returns in the U.S. federal jurisdiction and Massachusetts. The periods from 2008-2011 remain open to examination by the IRS and state jurisdictions. The Company believes it is not subject to any tax risk beyond the preceding discussion. The Company's policy is to recognize interest and penalties accrued on any unrecognized tax benefits as a component of income tax expense.
At
December 31, 2011
and 2010, the Company has federal and state net operating loss carry forwards of approximately
$38,500,000
and
$17,400,000
, respectively, available to offset future taxable income. The state carry-forwards will expire intermittently through 2015, while the federal carry forwards will expire intermittently through 2030.
55
Call Option Agreements
In connection with a May 9, 2005 settlement with Leslie Rotman regarding the value paid and the value received in a 2001 transaction the Company received a call option for 2,000,000 shares of the Company's common stock at $.001 per share. Leslie Rotman is the mother, of Gregory Rotman, President of the Company, and Richard Rotman, Vice President and Secretary of the Company. The option was assignable by the Company. During 2009 and prior years the Company assigned options to purchase 2,000,000 shares of common stock in exchange for $725,979. The proceeds from the assignments of these options were added to the paid in capital of the Company. At December 31, 2009 there were no remaining call options outstanding.
Warrants
During the year ended December 31, 2005, the Company entered into an Agreement and sold a warrant to purchase common stock ("Warrant") to an investor. The investor paid the Company $110,000 in deposits ("Deposits") for the right to acquire up to 2,000,000 shares of unregistered common stock. On June 28, 2009 the Warrant was exercised with a remaining $200,000 of consideration paid in the form of $80,000 of cash and an agreement for $120,000 for future consulting services valued at $120,000. At December 31, 2009 the unused portion of consulting services included in stock subscription receivable was $70,000. During the year ended December 31, 2010 the investor provided the balance of the consulting services.
During the second and third quarters of 2008, in connection with $1,100,000 of short term notes payable, the Company granted warrants for 1,100,000 shares of common stock exercisable at $.25 per share. All of these warrants expired during the second and third quarter of 2011.
Share-based Incentive Plans
During the
years ended December 31, 2011, 2010, and 2009
, the Company had three stock option plans that include both incentive and non-qualified options to be granted to certain eligible employees, non-employee directors, or consultants of the Company.
Issuance of Common Stock
During 2009 the Company had agreements with certain individual artists of a single band, the Company issued 4,826,924 shares of common stock and guaranteed the individual artists that those shares would sell for a minimum of $1,600,000. If the shares sold for less than the minimum agreed upon amount the artists would receive cash or additional shares to make up the difference. The shares and guaranteed amounts were based upon a minimum number of tour dates. A portion of the related tour was canceled after only approximately 35% of the dates were performed. Consequently, in 2009 the Company included approximately $565,000 related to the portion of the tour that was completed in the cost of revenues. The artists sold the related shares, and as a result of an unanticipated increase in the market value of the Company's stock, and the tour cancellation, received in excess of the guaranteed amounts. Consequently, the Company agreed to receive back $1,346,220 representing the amount of the original advance payment associated with the canceled portion of the tour totaling $346,876 plus $999,344 representing the amount in excess of the guaranteed payment for the tour dates performed. These transactions are reported in the 2009 statement of changes in stockholders' equity as issuance of common stock.
At December 31, 2009, there remained outstanding receivables related to this arrangement totaling approximately $421,200. In January 2010, $115,000 was collected and the balance totaling $306,200 was reclassified to prepaid royalties. As of December 31, 2011 those royalties were earned and fully recouped.
56
Share-based Incentive Plans
Active Plans:
2011 Plan
On February 1, 2011, the Company adopted the 2011 Non-Qualified Stock Option Plan (the "2011 Plan"), to replace the 2001 Plan discussed below, and has filed Registration Statements on Form S-8 to register 30,000,000 shares of its common stock. Under the 2011 Plan, employees and consultants may elect to receive their gross compensation in the form of options, exercisable at $.001 per share, to acquire the number of shares of the Company's common stock equal to their gross compensation divided by the fair value of the stock on the date of grant. Information with respect to stock options granted under this plan during the year ended December 31, 2011 is as follows:
|
|
Number of shares
|
Weighted average exercise price per share
|
||||
|
Options outstanding at December 31, 2010
|
—
|
|
$
|
—
|
|
|
|
Granted
|
12,027,653
|
|
0.037
|
|
||
|
Exercised
|
(9,027,653
|
)
|
0.001
|
|
||
|
Options outstanding at December 31, 2011
|
3,000,000
|
|
$
|
0.145
|
|
|
A summary of the awards under this plan during the year ended December 31, 2011 is as follows:
|
|
Number of shares
|
|
Gross Compensation
|
|||
|
|
2011
|
|||||
|
Employee payroll
|
2,262,367
|
|
|
$
|
522,400
|
|
|
Consulting and professional fees
|
6,154,472
|
|
|
1,440,800
|
|
|
|
Total
|
8,416,839
|
|
|
$
|
1,963,200
|
|
At
December 31, 2011
there were
19,047,447
shares reserved for issuance under this plan.
2002 Plan
The 2002 Stock Option Plan (“2002 Plan”) provides for the award of qualified and non-qualified options for up to 30,000,000 shares. The options granted have a ten-year contractual term and have a vesting schedule of either immediately, two years, or four years from the date of grant. Information with respect to stock options granted under this plan during the
years ended December 31, 2011, 2010, and 2009
is as follows:
|
|
Number of shares
|
Weighted average exercise price per share
|
||||
|
Options outstanding at December 31, 2008
|
28,250,000
|
|
$
|
1.080
|
|
|
|
Forfeited
|
(3,000,000
|
)
|
0.415
|
|
||
|
Options outstanding at December 31, 2009
|
25,250,000
|
|
$
|
0.115
|
|
|
|
Granted
|
—
|
|
—
|
|
||
|
Exercised
|
(9,378,048
|
)
|
0.041
|
|
||
|
Options outstanding at December 31, 2010
|
15,871,952
|
|
$
|
0.159
|
|
|
|
Granted
|
3,000,000
|
|
0.145
|
|
||
|
Exercised
|
(5,750,000
|
)
|
0.041
|
|
||
|
Options outstanding at December 31, 2011
|
13,121,952
|
|
$
|
0.104
|
|
|
There are currently no shares reserved for issuance under this plan.
57
Option Repricing
In November 2011 the Board of Directors approved a vote to reprice 5,000,000 employee stock options. The options were originally issued on January 2008, and had an original grant price $0.415. The grant price was lowered to $0.145, which reflects the market value of the stock as of the reprice date. The repriced options continue to vest according to the original grant date. The Company recorded an additional compensation charge of $148,415 at December 31, 2011, using the Black-Scholes option pricing model with the following weighted average assumptions:
|
Expected term (plain-vanilla)
|
3 years
|
|
|
Expected volatility
|
104.12
|
%
|
|
Expected dividends
|
None
|
|
|
Risk free interest rate
|
0.01
|
%
|
The intrinsic value of options exercised during the years ended December 31, 2011 and, 2010, was $1,066,963, and $4,743,392 in exchange for $236,712, and $384,500 of cash respectively. The intrinsic value of option exercised during the year ended December 31, 2009 was $2,387,424 in exchange for no cash, since they were all exercised under the 2001 Plan.
Fair value of issuances
The fair value of the Company's option grants under the 2011, 2002 and 2001 Plans was estimated at the date of grant using the Black-Scholes option-pricing model with the following weighted average assumptions:
|
|
2011
|
2010
|
2009
|
|||||
|
Expected term (based upon historical experience)
|
<1 week
|
|
<1 week
|
|
<1 week
|
|
||
|
Expected volatility
|
103.26
|
%
|
107.24
|
%
|
108.31
|
%
|
||
|
Expected dividends
|
None
|
|
None
|
|
None
|
|
||
|
Risk free interest rate
|
0.02
|
%
|
0.13
|
%
|
3.40
|
%
|
||
The stock volatility for each grant is determined based on a review of the experience of the weighted average of historical daily price changes of the Company's common stock over the expected option term. The expected term was determined using the simplified method for estimating expected option life, which qualify as “plain-vanilla” options; and the risk-free rate is based on the U.S. Treasury yield curve in effect at the time of grant for periods corresponding with the expected life of the option.
The fair value of options granted under all plans in 2011 was $694,179 which, assuming no forfeiture rate, resulted in $97,618, in additional compensation expense being charged to operations during 2011. The Company used the Black-Scholes option pricing model with the following weighted average assumptions:
|
Expected term (plain-vanilla)
|
5.75 years
|
|
|
Expected volatility
|
104.12
|
%
|
|
Expected dividends
|
None
|
|
|
Risk free interest rate
|
0.01
|
%
|
All but 10,500,000 options outstanding at
December 31, 2011
are fully vested and exercisable. Information pertaining to options outstanding at
December 31, 2011
is as follows:
58
|
Exercise Prices
|
Number of shares
|
Weighted Average Remaining Contractual Life
|
Aggregate Intrinsic Value
|
||||||||
|
0.001
|
|
1,061,332
|
|
6.73
|
|
$
|
200,600
|
|
|||
|
0.041
|
|
5,121,952
|
|
0.78
|
|
763,200
|
|
||||
|
0.145
|
|
11,000,000
|
|
8.12
|
|
495,000
|
|
||||
|
|
17,183,284
|
|
|
|
|||||||
2001 Plan
The 2001 Non-Qualified Stock Option Plan (the "2001 Plan") expired on January 31, 2011. The Company adopted the 2001 Plan on February 1, 2001 and filed Registration Statements on Form S-8 to register 120,000,000 shares of its common stock. Under the 2001 Plan, employees and consultants could have elected to receive their gross compensation in the form of options, exercisable at $.001 per share, to acquire the number of shares of the Company's common stock equal to their gross compensation divided by the fair value of the stock on the date of grant. Information with respect to stock options granted under this plan during the
years ended December 31, 2011, 2010, and 2009
is as follows:
|
|
Number of shares
|
Weighted average exercise price per share
|
||||
|
Options outstanding at December 31, 2008
|
1,527,625
|
|
$
|
1.08
|
|
|
|
Granted
|
15,301,583
|
|
0.415
|
|
||
|
Exercised
|
(14,805,596
|
)
|
0.001
|
|
||
|
Options outstanding at December 31, 2009
|
2,023,612
|
|
$
|
0.001
|
|
|
|
Granted
|
8,896,821
|
|
0.001
|
|
||
|
Exercised
|
(8,896,821
|
)
|
0.001
|
|
||
|
Options outstanding at December 31, 2010
|
2,023,612
|
|
$
|
0.001
|
|
|
|
Granted
|
1,075,090
|
|
0.001
|
|
||
|
Exercised
|
(2,037,370
|
)
|
0.001
|
|
||
|
Options outstanding at December 31, 2011
|
1,061,332
|
|
$
|
0.001
|
|
|
A summary of the awards under this plan during the
years ended December 31, 2011, 2010, and 2009
is as follows:
|
|
Number of shares
|
|
Gross Compensation
|
|||
|
|
2011
|
|||||
|
Employee payroll
|
17,977
|
|
|
$
|
4,200
|
|
|
Consulting and professional fees
|
1,057,113
|
|
|
253,100
|
|
|
|
Total
|
1,075,090
|
|
|
$
|
257,300
|
|
|
|
|
|
|
|||
|
|
2010
|
|||||
|
Employee payroll
|
910,239
|
|
|
$
|
288,900
|
|
|
Consulting and professional fees
|
7,986,582
|
|
|
2,383,000
|
|
|
|
Total
|
8,896,821
|
|
|
$
|
2,671,900
|
|
|
2009
|
||||||
|
Employee payroll
|
1,098,272
|
|
$
|
282,000
|
|
|
|
Consulting and professional fees
|
13,707,324
|
|
3,827,600
|
|
||
|
Total
|
14,805,596
|
|
$
|
4,109,600
|
|
|
59
There are currently no shares reserved for issuance under this plan.
Expired Plans
During July 1999, the Company's Board of Directors adopted the 1999 Plan (“1999 Plan”) which provided for the award of non-qualified options for up to 1,000,000 shares. The 1999 Plan expired in July 2009 as did all 37,000 options that were outstanding with an exercise price of $1.62 per share.
Also during July 1999, the Company's Board of Directors adopted, subject to stockholders' approval, the 1999 Omnibus Share Plan (the "Omnibus Plan") that provided for both incentive and non-qualified stock options, stock appreciation rights and other awards to directors, officers, and employees of the Company to purchase or receive up to 1,000,000 shares of the Company's stock. The Omnibus Plan also expired in July 2009. No options were ever granted under the Omnibus Plan.
The segments of revenue for the years ended December 31, are as follows:
|
Years ended December 31,
|
|||||||||||
|
2011
|
2010
|
2009
|
|||||||||
|
Merchandising and fulfillment
|
$
|
2,736,900
|
|
$
|
2,173,400
|
|
$
|
1,589,900
|
|
||
|
Client services
|
387,400
|
|
490,200
|
|
642,500
|
|
|||||
|
Touring
|
3,796,200
|
|
4,531,100
|
|
2,493,600
|
|
|||||
|
Total revenues
|
$
|
6,920,500
|
|
$
|
7,194,700
|
|
$
|
4,726,000
|
|
||
Steven Rotman is the father, and Leslie Rotman is the mother, of Gregory Rotman, President of the Company, and Richard Rotman, Vice President and Secretary of the Company. The Company entered into a number of transactions during 2009 with both Steven Rotman and Leslie Rotman. Management believes that these transactions are fair and reasonable to the Company and no less favorable than could have been obtained by an unaffiliated third party.
In December 2001, the Company engaged Steven Rotman to provide consulting services to the Company. He has not provided any consulting services to the Company since 2009, where he provided $60,000 of consulting fees which were paid to him in the form of options under the 2001 Plan.
The Company pays rent, as a tenant at will, to a company in which Steven Rotman is a shareholder. Monthly payments under this arrangement are approximately $2,500.
Lease commitment
The Company leases an office facility in Boston, Massachusetts under a tenant at will agreement. In November 2011 the Landlord was notified under the provisions of the agreement that the Company will terminate the tenant at will agreement and will vacate the premises in January 2012. The tenant at will agreement requires monthly payments of approximately $5,800, plus increases in real estate taxes and operating expenses.
On January 21, 2012 the Company closed its Boston office and moved to its new facility in Westborough, Massachusetts. The Company plans on moving its fulfillment center located in Worcester, Massachusetts to the Westborough facility in the second quarter of 2012.
Rent expense incurred for each of the years ended December 31, 2011, 2010 and 2009 is $94,000.
Prepaid facility costs
Effective August 5, 2011, the Company had entered into a Lease with Flanders 155 LLC for premises located at 155 Flanders Road, Westborough, Massachusetts. Due to additional spacing needs, the Company and the Landlord terminated the lease and entered into a new lease on substantially the same terms for a different location owned by a sister affiliate of the Landlord, located at 40 Washington Street, Westborough, Massachusetts (the “Washington Street Location”). The lease is for
60
an initial five year term, with an option to renew for one additional five year term. Monthly rent is $13,855.77 for the initial five year term, plus applicable taxes and operating expenses, all of which has been paid in shares of restricted stock of the Company. Monthly rent under the new lease is slightly higher in cost, but due to increased square footage in the Washington Street Location, has a lower cost per square foot.
The original payment consisted of 6,082,985 shares of common stock, at a closing market price of $.21 per share, based on a closing price as of August 22, 2011, which will be applied to the new lease at the Washington Street Location. The payment was for rent over five years, projected taxes and operating expenses, and a security deposit, for a total payment in common stock of $1,277,400. The Company has guaranteed to the Landlord under the Lease that the shares will sell on the open market for at least the value of the rent and other costs for a period of three months after the initial six month restriction on transfer, if the shares are sold during that time, although the Landlord may choose to hold the shares and forego the guaranty.
Legal matters
In the normal course of business, the Company periodically becomes involved in litigation. As of
December 31, 2011
, in the opinion of management, the Company had no pending litigation that would have a material adverse effect on the Company's financial position, results of operations, or cash flows.
Prepaid royalties represent amounts paid in advance to certain clients and are recoupable against future royalties earned by the clients. Advances are issued in either cash or stock and advance amounts are calculated based on the clients' projected earning potential over a fixed period of time. Advances issued in stock are recorded at the fair value on the date of issue. The Company did not have any royalty payment guaranties outstanding at
December 31, 2011
.
The following table presents fair values for those assets and liabilities measured at fair value on a recurring basis and the level within the fair value hierarchy in which the measurements fall. No transfers among the levels within the fair value hierarchy occurred during the years ended
December 31, 2011
or
December 31, 2010
.
|
Fair Value
|
|||||||||
|
Level
|
2011
|
2010
|
|||||||
|
Investments
|
1
|
|
$
|
205,000
|
|
—
|
|
||
|
Rent payment guarantee
|
2
|
|
$
|
(505,900
|
)
|
||||
The fair value of the Company's investments classified as trading securities is determined based on the closing market prices of the respective common stocks as of December 31, 2011.
In 2011 the Company entered into a lease agreement for the Company's principal office and warehouse facility. The terms of the lease consisted of a payment of rent over five years plus projected operating expenses and a security deposit. The payment was made with 6,082,985 shares of common stock, at a closing price of $.21 per share, based on the closing price as of August 22, 2011. The Company has guaranteed the landlord that the shares will sell on the open market for at least $1,386,500, given the landlord sells the shares within a period of three months after the initial six month restriction on transfer has expired.
The fair value of the rent guarantee was calculated using the Black-Scholes Option Pricing Model with the following assumptions:
|
Term of guarantee
|
5 months
|
|
|
Historical volatility
|
83.73%
|
|
|
Expected dividend
|
None
|
|
|
Risk free interest rate
|
0.01%
|
|
The Company recorded $442,600 in additional pre-paid rent expense due to the fair value of the guarantee, and will be amortized over the life of the lease. The fair value adjustment of the offsetting derivative liability will be recorded in the
-
61
-
statement of operations as a component of other income.
-
62
-
The following table presents selected unaudited financial information for the twelve quarters in the period ended
December 31, 2011
. The results for any quarter are not necessarily indicative of future quarterly results and, accordingly, period-to-period comparisons should not be relied upon as an indication of future performance.
|
|
FOR THE QUARTERS ENDED
|
||||||||||||||
|
|
3/31/2011
|
|
|
6/30/2011
|
|
|
9/30/2011
|
|
|
12/31/2011
|
|
||||
|
Revenues
|
$
|
711,300
|
|
|
$
|
1,674,500
|
|
|
$
|
1,620,400
|
|
|
$
|
2,914,300
|
|
|
|
|
|
|
|
|
|
|
||||||||
|
Gross Profit
|
211,000
|
|
|
591,600
|
|
|
609,900
|
|
|
912,400
|
|
||||
|
|
|
|
|
|
|
|
|
||||||||
|
Loss from Operations
|
(1,020,400
|
)
|
|
(810,700
|
)
|
|
(802,500
|
)
|
|
(1,354,500
|
)
|
||||
|
|
|
|
|
|
|
|
|
||||||||
|
Net Loss
|
$
|
(1,020,900
|
)
|
|
$
|
(811,400
|
)
|
|
$
|
(803,300
|
)
|
|
$
|
(1,338,600
|
)
|
|
|
|
|
|
|
|
|
|
||||||||
|
Loss per share - basic
|
$
|
—
|
|
|
$
|
—
|
|
|
$
|
—
|
|
|
$
|
—
|
|
|
|
|
|
|
|
|
|
|
||||||||
|
Weighted average shares - basic
|
287,979,151
|
|
|
289,464,362
|
|
|
295,014,276
|
|
|
306,111,060
|
|
||||
|
|
|
|
|
|
|
|
|
||||||||
|
|
|
|
|
|
|
|
|
||||||||
|
|
FOR THE QUARTERS ENDED
|
||||||||||||||
|
|
3/31/2010
|
|
|
6/30/2010
|
|
|
9/30/2010
|
|
|
12/31/2010
|
|
||||
|
Revenues
|
$
|
1,078,100
|
|
|
$
|
1,194,500
|
|
|
$
|
4,186,700
|
|
|
$
|
735,400
|
|
|
|
|
|
|
|
|
|
|
||||||||
|
Gross Profit
|
429,200
|
|
|
457,200
|
|
|
1,150,700
|
|
|
124,000
|
|
||||
|
|
|
|
|
|
|
|
|
||||||||
|
Loss from Operations
|
(783,100
|
)
|
|
(805,100
|
)
|
|
(344,000
|
)
|
|
(1,374,100
|
)
|
||||
|
|
|
|
|
|
|
|
|
||||||||
|
Net Loss
|
$
|
(783,100
|
)
|
|
$
|
(805,100
|
)
|
|
$
|
(344,200
|
)
|
|
$
|
(1,374,400
|
)
|
|
|
|
|
|
|
|
|
|
||||||||
|
Loss per share - basic
|
$
|
—
|
|
|
$
|
—
|
|
|
$
|
—
|
|
|
$
|
—
|
|
|
|
|
|
|
|
|
|
|
||||||||
|
Weighted average shares - basic
|
269,918,897
|
|
|
273,501,440
|
|
|
279,750,389
|
|
|
284,611,109
|
|
||||
|
FOR THE QUARTERS ENDED
|
|||||||||||||||
|
3/31/2009
|
|
6/30/2009
|
|
9/30/2009
|
|
12/31/2009
|
|
||||||||
|
Revenues
|
$
|
326,900
|
|
$
|
1,620,900
|
|
$
|
2,116,500
|
|
$
|
661,700
|
|
|||
|
Gross Profit
|
159,500
|
|
528,200
|
|
1,300,700
|
|
(532,100
|
)
|
|||||||
|
Loss from Operations
|
(836,300
|
)
|
(1,111,500
|
)
|
209,100
|
|
(1,823,600
|
)
|
|||||||
|
Net Loss
|
$
|
(838,800
|
)
|
$
|
(1,106,800
|
)
|
$
|
209,800
|
|
$
|
(1,748,500
|
)
|
|||
|
Loss per share - basic
|
$
|
—
|
|
$
|
—
|
|
$
|
—
|
|
$
|
(0.01
|
)
|
|||
|
Weighted average shares - basic
|
252,826,173
|
|
257,294,430
|
|
257,294,430
|
|
267,380,185
|
|
|||||||
|
Weighted average shares - diluted
|
N/A
|
|
N/A
|
|
286,541,637
|
|
N/A
|
|
|||||||
-
63
-
EXHIBIT INDEX
|
No.
|
Description of Exhibits
|
||
|
3.1
|
|
Certificate of Incorporation, as amended (incorporated by reference to Exhibit 3.1 to Form 8-K, filed on November 25, 2003)
|
|
|
3.2
|
|
Amended and Restated Bylaws (incorporated by reference to Exhibit 3.2 to Form 8-K, filed on December 8, 2004)
|
|
|
4.1
|
|
Specimen of certificate for Common Stock (incorporated by reference to Exhibit 4.1 to Form SB-2/A filed on December 1, 2000)
|
|
|
4.2
|
|
Agreement dated November 21, 2008, by and between the Company and Lewis Asset Management Equity Fund, LLP with respect to the purchase of 2,500,000 shares at $.20 per share (incorporated by reference to Exhibit 4.2 to Form 10-KSB filed on March 31, 2009)
|
|
|
4.3
|
|
Form of Warrant to Lewis Asset Management with respect to Promissory Note dated April 29, 2009 (incorporated by reference to Exhibit 4.2 to Form 10-Q filed on May 12, 2009)
|
|
|
10.1+
|
|
2001 Non-Qualified Stock Option Plan, as amended (incorporated by reference from Exhibit 99.1 to Form S-8 filed on September 5, 2003)
|
|
|
10.2+
|
|
2002 Non-Qualified Stock Option Plan (incorporated by reference from Exhibit 10.17 to Form 10-KSB filed on March 31, 2003)
|
|
|
10.3+
|
|
2011 Non-Qualified Stock Option Plan (incorporated by reference from Exhibit 99.1 to Form S-8 filed on February 2, 2011)
|
|
|
10.4
|
|
Promissory Note dated April 29, 2009 for up to $2,500,000 to Lewis Asset Management (incorporated by reference to Exhibit 10.2 to Form 10-Q filed on May 12, 2009)
|
|
|
10.5
|
|
Lease agreement, dated December 7, 2011 between Forty Washington, LLC and the Company
(incorporated by reference to exhibit 10.1 to our Report on Form 8-K/A filed on December 13, 2011)
|
|
|
23*
|
|
Consent of Rosen Seymour Shapss Martin & Company LLP
|
|
|
31.1*
|
|
CEO Certification required under Section 302 of Sarbanes-Oxley Act of 2002
|
|
|
31.2*
|
|
CFO Certification required under Section 302 of Sarbanes-Oxley Act of 2002
|
|
|
32*
|
|
CEO and CFO Certification required under Section 906 of Sarbanes-Oxley Act of 2002
|
|
|
*filed herewith
|
|
|
+Indicates a management contract or any compensatory plan, contract or arrangement
|
|
-
64
-
TABLE OF CONTENTS
Part IItem 1. BusinessItem 1A. Risk FactorsItem 1B. Unresolved Staff CommentsItem 2. PropertiesItem 3. Legal ProceedingsItem 4. Mine Safety DisclosurePart IIItem 5. Market For Registrant's Common Equity, Related Stockholder Matters and Issuer Purchases Of EquityItem 6. Selected Financial DataItem 7. Management's Discussion and Analysis Of Financial Condition and Results Of OperationsItem 7A. Quantitative and Qualitative Disclosure About Market RiskItem 8. Financial Statements and Supplementary DataItem 9. Changes in and Disagreements with Accountants on Accounting and Financial DisclosureItem 9A. Controls and ProceduresItem 9B. Other InformationPart IIIItem 10. Directors, Executive Officers and Corporate GovernanceItem 11. Executive CompensationItem 12. Security Ownership Of Certain Beneficial Owners and Management and Related Stockholder MattersItem 13. Certain Relationships and Related Transactions, and Director IndependenceItem 14. Principal Accountant Fees and ServicesPart IVItem 15. Exhibits and Financial Statement SchedulesNote 1. OrganizationNote 2. Management's PlansNote 3. Summary Of Significant Accounting PolicesNote 4. Property and EquipmentNote 5. Intangible AssetsNote 6. Accrued ExpensesNote 7. Long-term LiabilitiesNote 8. Income TaxesNote 9. Common StockNote 10. Revenue SegmentNote 11. Related Party TransactionsNote 12. Commitments and ContinginciesNote 13. Prepaid RoyaltiesNote 14. Fair Value DisclosureNote 15. Stock Price GuaranteeNote 16. Results By Quarter (unaudited)