PAYCHEX INC
10-Ks and 10-Qs
|
|
|
|
|
|
|
|
|
|
|
|
|
|
|
|
|
|
|
|
|
|
|
|
|
|
|
|
|
|
|
|
|
|
|
|
|
|
|
|
|
|
|
|
|
|
|
|
|
|
|
|
|
|
|
|
|
|
|
UNITED STATES
SECURITIES AND EXCHANGE COMMISSION
WASHINGTON, D.C. 20549
_____________________________
FORM 10-K
ANNUAL REPORT PURSUANT TO SECTION 13 OR 15(d) OF THE SECURITIES
EXCHANGE ACT OF 1934
For the fiscal year ended
May 31, 2014
Commission file number 0-11330
____________________________
Paychex, Inc.
911 Panorama Trail South
Rochester, New York 14625-2396
(585) 385-6666
A Delaware Corporation
IRS Employer Identification Number: 16-1124166
|
Securities registered pursuant to Section 12(b) of the Act:
|
|
Common Stock, $0.01 Par Value
|
|
Name of exchange on which registered:
|
|
NASDAQ Global Select Market
|
Indicate by check mark if the registrant is a well-known seasoned issuer, as defined in Rule 405 of the Securities Act. Yes
þ
No
¨
Indicate by check mark if the registrant is not required to file reports pursuant to Section 13 or Section 15(d) of the Act. Yes
¨
No
þ
Indicate by check mark whether the registrant (1) has filed all reports required to be filed by Section 13 or 15(d) of the Securities Exchange Act of 1934 during the preceding 12 months (or for such shorter period that the registrant was required to file such reports), and (2) has been subject to such filing requirements for the past 90 days. Yes
þ
No
¨
Indicate by check mark whether the registrant has submitted electronically and posted on its corporate Web site, if any, every Interactive Data File required to be submitted and posted pursuant to Rule 405 of Regulation S-T during the preceding 12 months (or for such shorter period that the registrant was required to submit and post such files). Yes
þ
No
¨
Indicate by check mark if disclosure of delinquent filers pursuant to Item 405 of Regulation S-K is not contained herein, and will not be contained, to the best of registrant’s knowledge, in definitive proxy or information statements incorporated by reference in Part III of this Form 10-K or any amendment to this Form 10-K.
þ
Indicate by check mark whether the registrant is a large accelerated filer, an accelerated filer, a non-accelerated filer, or a smaller reporting company. See the definitions of “large accelerated filer,” “accelerated filer” and “smaller reporting company” in Rule 12b-2 of the Exchange Act.
|
Large accelerated filer
þ
|
|
Accelerated filer
¨
|
|
Non-accelerated filer
o
|
|
Smaller reporting company
o
|
|
|
|
(Do not check if a smaller reporting company)
|
|
|||
Indicate by check mark whether the registrant is a shell company (as defined in Rule 12b-2 of the Act). Yes
¨
No
þ
As of
November 30, 2013
, the last business day of the most recently completed second fiscal quarter, shares held by non-affiliates of the registrant had an aggregate market value of $14,236,029,018 based on the closing price reported for such date on the NASDAQ Global Select Market.
As of
June 30, 2014
, 363,099,317 shares of the registrant’s common stock, $.01 par value, were outstanding.
Documents Incorporated by Reference
Portions of the registrant’s definitive proxy statement to be issued in connection with its Annual Meeting of Stockholders to be held on or about
October 15, 2014
, to the extent not set forth herein, are incorporated by reference into Part III, Items 10 through 14, inclusive.
PAYCHEX, INC.
INDEX TO FORM 10-K
For the fiscal year ended
May 31, 2014
|
|
Description
|
Page
|
|
|
PART I
|
|||
|
Cautionary Note Regarding Forward-Looking Statements Pursuant to the United States Private Securities Litigation Reform Act of 1995
|
1
|
|
|
|
Item 1
|
Business
|
2
|
|
|
Item 1A
|
Risk Factors
|
8
|
|
|
Item 1B
|
Unresolved Staff Comments
|
10
|
|
|
Item 2
|
Properties
|
11
|
|
|
Item 3
|
Legal Proceedings
|
11
|
|
|
Item 4
|
Mine Safety Disclosures
|
11
|
|
|
PART II
|
|||
|
Item 5
|
Market for Registrant’s Common Equity, Related Stockholder Matters and Issuer Purchases of Equity Securities
|
11
|
|
|
Item 6
|
Selected Financial Data
|
14
|
|
|
Item 7
|
Management’s Discussion and Analysis of Financial Condition and Results of Operations
|
14
|
|
|
Item 7A
|
Quantitative and Qualitative Disclosures About Market Risk
|
28
|
|
|
Item 8
|
Financial Statements and Supplementary Data
|
30
|
|
|
Item 9
|
Changes in and Disagreements with Accountants on Accounting and Financial Disclosure
|
59
|
|
|
Item 9A
|
Controls and Procedures
|
59
|
|
|
Item 9B
|
Other Information
|
60
|
|
|
PART III
|
|||
|
Item 10
|
Directors, Executive Officers and Corporate Governance
|
60
|
|
|
Item 11
|
Executive Compensation
|
61
|
|
|
Item 12
|
Security Ownership of Certain Beneficial Owners and Management and Related Stockholder Matters
|
61
|
|
|
Item 13
|
Certain Relationships and Related Transactions, and Director Independence
|
62
|
|
|
Item 14
|
Principal Accounting Fees and Services
|
62
|
|
|
PART IV
|
|||
|
Item 15
|
Exhibits and Financial Statement Schedules
|
62
|
|
|
Signatures
|
65
|
|
|
i
CAUTIONARY NOTE REGARDING FORWARD-LOOKING STATEMENTS PURSUANT TO THE UNITED STATES PRIVATE SECURITIES LITIGATION REFORM ACT OF 1995
Certain written and oral statements made by management of Paychex, Inc. and its wholly owned subsidiaries (“we,” “our,” “us,” “Paychex,” or the “Company”) may constitute “forward-looking statements” within the meaning of the safe harbor provisions of the United States (“U.S.”) Private Securities Litigation Reform Act of 1995. Forward-looking statements can be identified by such words and phrases as “we expect,” “expected to,” “estimates,” “estimated,” “current outlook,” “we look forward to,” “would equate to,” “projects,” “projections,” “projected to be,” “anticipates,” “anticipated,” “we believe,” “could be,” and other similar phrases. Examples of forward-looking statements include, among others, statements we make regarding operating performance, events, or developments that we expect or anticipate will occur in the future, including statements relating to revenue growth, earnings, earnings-per-share growth, or similar projections.
Forward-looking statements are neither historical facts nor assurances of future performance. Instead, they are based only on our current beliefs, expectations, and assumptions regarding the future of our business, future plans and strategies, projections, anticipated events and trends, the economy, and other future conditions. Because forward-looking statements relate to the future, they are subject to inherent uncertainties, risks, and changes in circumstances that are difficult to predict, many of which are outside our control. Our actual results and financial conditions may differ materially from those indicated in the forward-looking statements. Therefore, you should not place undue reliance upon any of these forward-looking statements. Important factors that could cause our actual results and financial condition to differ materially from those indicated in the forward-looking statements include, among others, the following:
|
•
|
general market and economic conditions including, among others, changes in U.S. employment and wage levels, changes to new hiring trends, legislative changes to stimulate the economy, changes in short- and long-term interest rates, changes in the fair value and the credit rating of securities held by us, and accessibility of financing;
|
|
•
|
changes in demand for our services and products, ability to develop and market new services and products effectively, pricing changes and the impact of competition;
|
|
•
|
changes in the availability of skilled workers, in particular those supporting our technology and product development;
|
|
•
|
changes in the laws regulating collection and payment of payroll taxes, professional employer organizations, and employee benefits, including retirement plans, workers’ compensation, health insurance (including health care reform legislation), state unemployment, and section 125 plans;
|
|
•
|
changes in health insurance and workers’ compensation rates and underlying claims trends;
|
|
•
|
changes in technology that adversely affect our products and services and impact our ability to provide timely enhancements to services and products;
|
|
•
|
the possibility of a security breach that disrupts operations or exposes client confidential data;
|
|
•
|
the possibility of failure of our operating facilities, computer systems, and communication systems during a catastrophic event;
|
|
•
|
the possibility of third-party service providers failing to perform their functions;
|
|
•
|
the possibility of a failure of internal controls or our inability to implement business processing improvements;
|
|
•
|
the possibility that we may be subject to liability for violations of employment or discrimination laws by our clients and acts or omissions of client employees who may be deemed to be our agents, even if we do not participate in any such acts or violations; and
|
|
•
|
potentially unfavorable outcomes related to pending legal matters.
|
Any of these factors, as well as such other factors as discussed in Part I, Item 1A Risk Factors and throughout Part II, Item 7 Management’s Discussion and Analysis of Financial Condition and Results of Operations of this Annual Report on Form 10-K (“Form 10-K”), as well as in our periodic filings with the Securities and Exchange Commission (“SEC” or “Commission”), could cause our actual results to differ materially from our anticipated results. The information provided in this Form 10-K is based upon the facts and circumstances known at this time, and any forward-looking statement made by us in this Form 10-K speaks only as of the date on which it is made. Except as required by law, we undertake no obligation to update these forward-looking statements after the date of filing of this Form 10-K with the SEC to reflect events or circumstances after such date, or to reflect the occurrence of unanticipated events.
1
|
Item 1.
|
Business
|
We are a leading provider of integrated payroll, human resource, insurance, and benefits outsourcing solutions for small- to medium-sized businesses. As of
May 31, 2014
, we serviced approximately
580,000
payroll clients. We maintain our corporate headquarters in Rochester, New York, and have more than 100 offices.
Our company was formed as a Delaware corporation in 1979. We report our results of operations and financial condition as one business segment. Our fiscal year ends May 31st.
Company Strategy
We are focused on achieving strong, long-term financial performance by:
|
•
|
providing high-quality, timely, accurate, and affordable comprehensive integrated payroll and human resource services;
|
|
•
|
delivering these services utilizing a well-trained and responsive work force through a network of local and corporate offices servicing more than 100 of the largest markets in the U.S., as well as in Germany and Brazil;
|
|
•
|
growing our client base, primarily through the efforts of our direct sales force, along with other marketing channels such as accountants, banks, national associations and franchise organizations, and search engine marketing;
|
|
•
|
continually improving client service, through leveraging our leading-edge technology, to maximize client retention;
|
|
•
|
capitalizing on the growth opportunities within our existing client base and from new clients by increasing utilization of our payroll and human resource services and products;
|
|
•
|
investing in our business through expansion of our service and product offerings to continually add value for our clients; and
|
|
•
|
supplementing our growth through strategic acquisitions when appropriate opportunities arise.
|
Services and Products
We offer a comprehensive portfolio of services and products that allow our clients to meet their diverse payroll and human resource needs. These include:
|
•
|
payroll processing;
|
|
•
|
payroll tax administration services;
|
|
•
|
employee payment services;
|
|
•
|
regulatory compliance services (new-hire reporting and garnishment processing);
|
|
•
|
Paychex HR Services;
|
|
•
|
retirement services administration;
|
|
•
|
insurance services;
|
|
•
|
online HR administration services, including time and attendance and benefit enrollment; and
|
|
•
|
other human resource services and products.
|
In the fiscal year ended May 31, 2014 ("fiscal 2014"), we also introduced additional value-added services that aid clients with certain accounting and finance needs.
By offering additional services that leverage the information gathered in the base payroll processing service, we are able to provide comprehensive outsourcing services that allow employers to expand their employee benefits offerings at an affordable cost. We mainly earn our revenue through recurring fees for services performed. Service revenue is primarily driven by the number of clients, checks or transactions per client per pay period, and utilization of ancillary services.
2
At Paychex, innovative technology meets superior customer service. The integration of service and technology allows us to meet our clients' diverse needs by providing them information and products when, where, and how they want it. Our software-as-a-service ("SaaS") solutions, operating in the cloud, allow us to offer such versatility. Our Paychex Mobile Applications add greater value and convenience for our clients and their employees by allowing them instant access and increased productivity. Our mobile apps are available for iPad
®
and Android
TM
tablets and smartphones, and allow our clients and their employees to have full access to our products, offering diverse capabilities for both the employer and employee. We offer an industry-leading, web-based report center and robust report writer. This provides a one-stop shop for standard or on-demand reporting needs, ad-hoc and customized reporting, data-extract templates, and more.
We are integrating our leading-edge technology and mobility platform with our world class customer service through the Paychex Next Generation suite of innovative products. This technology creates an integrated workforce management tool for our clients by bringing together the services those clients need, including our payroll products and various human resource and employee benefit management services.
Payroll
Payroll processing is a key aspect of our service portfolio. Our payroll service includes the calculation, preparation, and delivery of employee payroll checks; production of internal accounting records and management reports; preparation of federal, state, and local payroll tax returns; and collection and remittance of clients’ payroll obligations. Our payroll services support the small business market through our core payroll and SurePayroll, Inc. ("SurePayroll") products. Our core payroll clients can opt for our full-service customer service model through our branch operations or use Paychex Online, our secure Internet portal, which offers a suite of self-service, interactive services twenty-four hours a day, seven days a week. These services include Paychex Online Payroll
®
, Internet Time Sheet, Paychex Online Reports, and General Ledger Reporting Service. Using these services, clients can communicate payroll information, access current and historical payroll information, and transfer payroll information calculated by us to their general ledger accounting software, eliminating manual entries and improving the accuracy of bookkeeping. In addition, our SurePayroll SaaS solution offers "do-it-yourself," self-service and mobile applications for small business.
Mid-market companies typically have more sophisticated payroll and benefits needs, and are primarily serviced through our Major Market Services ("MMS") payroll product. We offer a SaaS solution, through a single, web-based portal, to meet the payroll and human resource administrative needs of our MMS clients. This allows our mid-market payroll product to be integrated with various Internet-based services offered to assist clients with their administrative human resource and payroll needs through every step of the employee life cycle. Ancillary services particularly beneficial to our MMS clients include the following:
|
•
|
Paychex HR Online, our Internet-based human resource management system, offers powerful tools for managing employee benefits, personnel information, and critical human resource compliance and reporting needs. In addition, its self-service features allow for better communication between management and employees.
|
|
•
|
BeneTrac, our employee benefits management and administration system, provides our clients a simple, accurate, and cost-effective solution for streamlined benefits management.
|
|
•
|
Paychex Time and Labor Online makes the time and attendance process more efficient. This solution can reduce time spent on preparing timesheets, minimize redundant data entry, increase awareness of critical labor information, and aid in compliance with federal time recording requirements.
|
|
•
|
Paychex Expense Manager is an integrated expense management solution that allows clients to control discretionary spending while giving employees an easy-to-use, secure tool to prepare and submit expense reports online.
|
|
•
|
Applicant tracking provides our clients with a tool to manage their recruiting process in order to better hire and retain talented employees.
|
MMS clients also have the option to select from a number of á la carte payroll and human resource ancillary services. Both core and MMS clients can opt for our comprehensive human resource and payroll outsourcing solution, Paychex HR Services. This flexibility allows our clients to define the solution that best meets their particular needs.
3
Payroll tax administration services:
Our payroll tax administration services (including Taxpay
®
) provide accurate preparation and timely filing of quarterly and year-end tax returns, as well as the electronic transfer of funds to the applicable tax or regulatory agencies (federal, state, and local). In connection with these services, we electronically collect payroll taxes from clients’ bank accounts, typically on payday, prepare and file the applicable tax returns, and remit taxes to the applicable tax or regulatory agencies on the respective due dates. These taxes are typically paid between one and 30 days after receipt of collections from clients, with some items extending to 90 days. We handle regulatory correspondence, amendments, and penalty and interest disputes, and we are subject to cash penalties imposed by tax or regulatory agencies for late filings and late or under payment of taxes.
Employee payment services:
Our employee payment services provide an employer with the option of paying their employees by direct deposit, payroll debit card, a check drawn on a Paychex account (Readychex
®
), or a check drawn on the employer’s account and electronically signed by us. For the first three methods, we electronically collect net payroll from the clients’ bank accounts, typically one business day before payday, and provide payment to the employees on payday. Our Readychex service provides a cost-effective solution that offers the benefit of convenient, one-step payroll account reconciliation for employers.
Regulatory compliance services:
We offer new-hire reporting services, which enable clients to comply with federal and state requirements to report information on newly hired employees. This information aids the government in enforcing child support orders and minimizes fraudulent unemployment and workers’ compensation insurance claims. Our garnishment processing service provides deductions from employees’ pay, forwards payments to third-party agencies, including those that require electronic payments, and tracks the obligations to fulfillment. These services enable employers to comply with legal requirements and reduce the risk of penalties.
Human Resource Services
Paychex HR Services:
We offer comprehensive human resource outsourcing solutions that provide businesses a full-service approach to the outsourcing of employer and employee administrative needs. Our Paychex HR Services offering is available through Paychex HR Solutions, an administrative services organization (“ASO”), or Paychex PEO, a professional employer organization (“PEO”). Both options offer businesses a combined package of services that includes payroll, employer compliance, human resource and employee benefits administration, risk management outsourcing, and the on-site availability of a professionally trained human resource representative. These comprehensive bundles of services are designed to make it easier for businesses to manage their payroll and related benefit costs while providing a benefits package equal to that of larger companies. Our PEO differs from the ASO in that we serve as a co-employer of the clients’ employees, provide health care coverage to PEO employees, and assume the risks and rewards of workers’ compensation insurance and certain health insurance offerings. PEO services are sold through our registered and licensed subsidiary, Paychex Business Solutions, Inc. The integration of the sales and service models of the ASO and PEO under Paychex HR Services has reduced redundancies and created more flexible options for business owners to find the solution that best meets their needs. We also offer Paychex HR Essentials, which is an ASO product that provides support to our clients over the phone or online to help manage employee-related topics. As of
May 31, 2014
, Paychex HR Services was utilized by
28,000
clients with approximately
766,000
client employees.
Retirement services administration:
Our retirement services product line offers a variety of options to clients, including 401(k) plans, 401(k) SIMPLE plans, SIMPLE IRAs, 401(k) plans with safe harbor provisions, owner-only 401(k) plans, profit sharing plans, and money purchase plans. These services provide plan implementation, ongoing compliance with government regulations, employee and employer reporting, participant and employer online access, electronic funds transfer, and other administrative services. Auto enrollment is an optional plan feature that allows employers to automatically enroll employees in their company’s 401(k) plan and increase overall plan participation. Clients have the ability to choose from a group of pre-defined fund selections or to customize their investment options within their plan. We are one of the largest 401(k) recordkeepers for small businesses in the U.S. For
fiscal 2014
and the fiscal year ended
May 31, 2013
("
fiscal 2013
"), we earned an average fee of approximately twenty to twenty-five basis points from external fund managers based on the total asset value of participants' funds. Our retirement services clients include financial advisors. As of
May 31, 2014
, retirement services covered approximately
65,000
plans and the asset value of participants' funds externally managed totaled approximately
$21.9 billion
.
4
Insurance services:
Our licensed insurance agency, Paychex Insurance Agency, Inc. (“PIA”), provides insurance through a variety of carriers. Insurance offerings include property and casualty coverage such as workers’ compensation, business-owner policies, commercial auto, and health and benefits coverage, including health, dental, vision, and life. Our insurance services simplify the insurance process to make it easy to find plans with the features and affordability to meet the client’s needs. With access to numerous top national and regional insurance carriers, our professional insurance agents enjoy a wide selection of plans from which they can best match the insurance needs of small businesses. Additionally, clients have the option to integrate their insurance plans with Paychex payroll processing for easy, accurate plan administration.
PIA also offers new comprehensive solutions to help employers and employees with certain mandates under U.S. health care reform legislation. This includes Paychex Employer Shared Responsibility Service designed to make it easier for business owners to determine if the Employer Shared Responsibility ("ESR") provision applies to them, and what actions they may need to take. We also offer our new ESR Complete Analysis and Monitoring Service for those clients that want a more robust solution. The Paychex Benefit Account product allows employers to offer Flexible Savings Accounts, Health Savings Accounts, and Health Reimbursement Accounts on a single platform with one debit card for their flexibility.
PIA has a website,
www.paychexinsurance.com
, with information and interactive tools to help educate visitors on insurance and aid in making business insurance decisions. A section on this website is designed to provide answers, information, and solutions that employers need to prepare for and take action on health care reform.
Online HR administration services:
We offer online human resource administration software products for employee benefits management and administration and time and attendance solutions. Paychex HR Online offers powerful tools for managing employee benefits, personnel information, and human resource compliance and reporting. Our time and attendance products, including our Time and Labor Online, help minimize the time spent compiling time sheet information. They allow the employer to handle multiple payroll scenarios and result in improved productivity, accuracy, and reliability in the payroll process. Our expense reporting solution is a web-based solution that provides clients with tools to manage and control the expense reporting process. The applicant tracking suite provides technology that streamlines, simplifies, and drives the applicant workflow and hiring process for companies of all sizes.
Other human resource services and products:
We offer the outsourcing of plan administration under section 125 of the Internal Revenue Code, allowing employees to use pre-tax dollars to pay for certain health insurance benefits and health and dependent care expenses not covered by insurance. All required implementation, administration, compliance, claims processing and reimbursement, and coverage tests are provided with these services. We offer state unemployment insurance services, which provide clients with prompt processing for all claims, appeals, determinations, change statements, and requests for separation documents. Other Human Resource Services products include employee handbooks, management manuals, and personnel and required regulatory forms. These products are designed to simplify clients’ office processes and enhance their employee benefits programs.
Accounting and Finance Services
We offer various accounting and finance services to small- to medium-sized businesses. Paychex Accounting Online is a cloud-based accounting service delivered through a partnership and investment in Kashoo, a leading provider of cloud accounting services. Paychex Payment Processing Services provides various options for small businesses to accept payments from customers, including credit and debit card processing, ACH and eCard processing, mobile and online payments, and point-of-sale processing. We also offer payment distribution services to help clients lower their operating costs while increasing their payroll accuracy. Through a partnership with Biz2Credit, a leading online credit resource for small businesses, we offer the Paychex Small Business Loan Resource Center, giving business owners access to over 1,200 lenders offering a variety of loan options to meet their financing needs. The accounting and finance services are in their infancy, but offer additional value-added services that small-business owners need.
Sales and Marketing
We market our services primarily through our direct sales force based in the metropolitan markets we serve, with sales representatives specializing within our portfolio of services. Our sales representatives are also supported by marketing, advertising, public relations, trade shows, and telemarketing programs. We utilize a virtual sales force to service geographical areas where we may not have a local presence. We sell ancillary services and products to both new clients and our existing client base.
5
As part of certain sales force initiatives in fiscal 2013, we added new territories and focused on market segmentation in payroll and retirement services. Within payroll, we differentiate the markets we serve between the small business market and mid-market companies. Within retirement services, we expanded our sales efforts by creating a dedicated, wholesale sales force focused solely on enhancing our relationships with financial advisors.
In addition to our direct selling and marketing efforts, we utilize relationships with existing clients, certified public accountants (“CPAs”), and banks for new client referrals. Approximately 50% of our new core payroll clients (excluding business acquisitions) come from these referral sources.
For over ten years, we have had a partnership with the American Institute of Certified Public Accountants (“AICPA”) as the preferred payroll provider for its AICPA Business Solutions
TM
Program. More than half of the CPA firms in the U.S. are enrolled and actively participating in the Paychex Partner Program from AICPA Business Solutions. Our current partnership agreement with the AICPA is in place through September 2016. We also enhanced our relationships with CPAs by partnering with various state CPA society organizations. In addition, we have a dedicated business development group to drive sales in the banking and franchise channels.
Our website, which is available at
www.paychex.com
, includes online payroll sales presentations and service and product information and is a cost-efficient tool that serves as a source of leads and new sales, while complementing the efforts of our direct sales force. This online tool allows us to market to clients and prospective clients in other geographical areas where we do not have a direct sales presence. In addition, our insurance services website, which is available at
www.paychexinsurance.com
, provides information to help small businesses navigate the insurance industry, and generates leads by allowing interested parties to get in contact with one of our professional insurance agents.
In addition, Advantage Payroll Services Inc. (“Advantage”), a wholly owned subsidiary of Paychex, Inc., has license agreements with independently owned associate offices (“Associates”), which are responsible for selling and marketing Advantage payroll services and performing certain operational functions, while Paychex and Advantage provide all centralized back-office payroll processing and payroll tax administration services. The marketing and selling by the Associates is conducted under their own logos.
Paychex also builds on its reputation as an expert in the payroll and human resources industry by providing education and assistance to clients and other interested parties. We provide free webinars, white papers, and other information on our website to aid existing and prospective clients with the impact of regulatory changes. We track current regulatory issues that impact the small business community and provide a monthly regulatory update. Our newly redesigned Paychex Accountant Knowledge Center is a free online resource available through our website that brings valuable information and time-saving online tools to accounting professionals. The BuildMyBiz website, which is available at
www.BuildMyBiz.com
, provides tools and resources for starting, growing, and managing a business.
A section of both the Paychex website,
www.paychex.com
, and our insurance services website,
www.paychexinsurance.com
, is designated to the topic of health care reform to provide answers, information, and solutions that employers need to prepare for and take action relating to the Patient Protection and Affordable Care Act of 2010 (“PPACA”) and the Health Care and Education Reconciliation Act of 2010 (together with the PPACA, the “Act”). Paychex is positioned to assist our clients and their employees as they navigate the complexity of this legislation.
Markets and Competition
We remain focused on servicing small- to medium-sized businesses based upon the growth potential that we believe exists in the markets we serve. Industry data indicates there are approximately
12 million
businesses in the geographic markets that we currently serve within the U.S. Of those businesses, greater than 99% have fewer than 100 employees and are our primary customers and target market.
We serve a diverse base of small- to medium-sized clients operating in a broad range of industries located throughout the U.S. and in Germany. We also have a joint-venture arrangement to provide payroll and human resource services in Brazil. We utilize service agreements and arrangements with clients that are generally terminable by the client at any time or upon relatively short notice. For
fiscal 2014
, client retention reached record levels, rising to approximately
82%
of our beginning client base. No single client has a material impact on total service revenue or results of operations.
6
The composition of the U.S. market and the client base we serve by number of employees is as follows:
|
Business size
(Number of employees)
|
Estimated
market distribution
(1)
|
Paychex, Inc. distribution
of client base
|
||
|
< 10
|
91%
|
65%
|
||
|
10-19
|
4%
|
17%
|
||
|
20-49
|
3%
|
12%
|
||
|
50 +
|
2%
|
6%
|
||
|
(1)
|
Based on current available market data from Dun & Bradstreet.
|
The market for payroll processing and human resource services is highly competitive and fragmented. We have one primary national competitor and we also compete with other national, regional, local, and online service providers, all of which we believe have significantly smaller client bases than us.
In addition to traditional payroll processing and human resource service providers, we compete with in-house payroll and human resource systems and departments. Payroll and human resource systems and software are sold by many vendors. Our Human Resource Services also compete with a variety of providers of human resource services, such as retirement services companies, insurance companies, and human resources and benefits consulting firms.
Competition in the payroll processing and human resource services industry is primarily based on service responsiveness, product quality and reputation, including ease of use and accessibility of technology, breadth of service and product offerings, and price. We believe we are competitive in each of these areas. We believe that our excellent customer service, together with our leading-edge technology, distinguishes us from our competitors.
Software Maintenance and Development
The ever-changing mandates of federal, state, and local tax and regulatory agencies require us to regularly update the proprietary software we utilize to provide payroll and human resource services to our clients. We are continually engaged in developing enhancements to and the maintenance of our various software platforms to meet the changing requirements of our clients and the marketplace.
We continue to enhance our Paychex Next Generation platform, with its suite of innovative products, as we believe it is a key building block to our future success. We also continue to add more capabilities to our mobile applications.
Employees
As of
May 31, 2014
, we employed approximately
12,700
people. None of our employees were covered by collective bargaining agreements.
Intellectual Property
We own or license and use a number of trademarks, trade names, copyrights, service marks, trade secrets, computer programs and software, and other intellectual property rights. Taken as a whole, our intellectual property rights are material to the conduct of our business. Where it is determined to be appropriate, we take measures to protect our intellectual property rights, including, but not limited to, confidentiality/non-disclosure agreements or policies with employees, vendors, and others; license agreements with licensees and licensors of intellectual property; and registration of certain trademarks. We believe that the “Paychex” name, trademark, and logo are of material importance to us.
7
Seasonality
There is no significant seasonality to our business. However, during our third fiscal quarter, which ends in February, the number of new payroll clients, new retirement services clients, and new Paychex HR Services worksite employees tends to be higher than during the rest of the fiscal year, primarily because many new clients prefer to start using our services at the beginning of a calendar year. In addition, calendar year-end transaction processing and client funds activity are traditionally higher during our third fiscal quarter due to clients paying year-end bonuses and requesting additional year-end services. Historically, as a result of these factors, our total revenue has been slightly higher in our third fiscal quarter, with greater sales commission expenses also reported in that quarter.
Other
We are subject to the informational and reporting requirements of the Securities Exchange Act of 1934, as amended (the “Exchange Act”). Therefore, we file periodic reports, proxy statements, and other information with the SEC. Such reports may be read and copied at the SEC’s Public Reference Room at 100 F Street NE, Washington, D.C. 20549. Information regarding the operation of the Public Reference Room may be obtained by calling the SEC at (800) SEC-0330. The SEC also maintains a website (
www.sec.gov
) that includes our reports, proxy statements, and other information.
Information about our services and products, stockholder information, press releases, and filings with the SEC can be found on our website at
www.paychex.com
. Our Form 10-Ks, Quarterly Reports on Form 10-Q, Current Reports on Form 8-K, and other SEC filings, as well as any amendments to such reports and filings, are made available, free of charge, on our website. You can access them under the Corporate tab on the Investor Relations section of our website. They are made available as soon as reasonably practical after such material is filed or furnished pursuant to Section 13(a) or 15(d) of the Exchange Act to the SEC. Also, copies of our Annual Report to Stockholders and Proxy Statement, to be issued in connection with our
2014
Annual Meeting of Stockholders, will be made available, free of charge, upon written request submitted to Paychex, Inc., c/o Corporate Secretary, 911 Panorama Trail South, Rochester, New York 14625-2396.
|
Item 1A.
|
Risk Factors
|
Our future results of operations are subject to a number of risks and uncertainties. These risks and uncertainties could cause actual results to differ materially from historical and current results, and from our projections. The risk factors described below represent our current view of some of the most important risks facing our business and are important to understanding our business. The risks described below are not the only risks we face. Additional factors not presently known to us or that we currently deem to be immaterial also may adversely affect, possibly to a material extent, our business, cash flows, financial condition, or results of operations in future periods. In addition, you should refer to the description of forward-looking statements at the beginning of Part I of this Form 10-K.
Our services may be adversely impacted by changes in government regulations and policies:
Many of our services, particularly payroll tax administration services and employee benefit plan administration services, are designed according to government regulations that continually change. Changes in regulations could affect the extent and type of benefits employers are required, or may choose, to provide employees or the amount and type of taxes employers and employees are required to pay. Such changes could reduce or eliminate the need for some of our services and substantially decrease our revenue. Added requirements could also increase our cost of doing business. Failure to educate and assist our clients regarding new or revised legislation that impacts them could have an adverse impact on our reputation. Failure by us to modify our services in a timely fashion in response to regulatory changes could have a material adverse effect on our business and results of operations.
Our clients and our business could be adversely impacted by health care reform:
The Act was enacted in March 2010 and entails sweeping health care reforms with staggered effective dates from 2010 through 2018. Many provisions of the Act require the issuance of additional guidance from the U.S. Departments of Labor and Health & Human Services, the Internal Revenue Service (the “IRS”), and the States.
8
The complexity of federal and state regulations facing employers has continued to increase, over time, including the enactment of the Act. As a service provider, we have a responsibility to our clients to help them understand their increased obligations under such regulations. Failure to provide clients with appropriate information or solutions to effectively manage their health care benefits and related costs could have an adverse impact on our reputation and a negative impact on our client base. There is no guarantee that solutions we have developed to help clients navigate health care legislation will be readily accepted by clients, which could have a material adverse impact on our insurance services business. Insurance services revenue is at risk for lower commission revenue from underwriters if clients move away from traditional insurance policies utilized in the past or as a result of pressure on commission rates, driven by restrictions on insurers as to use of premiums. Refer to the discussion on the next page regarding changes in health insurance and workers' compensation insurance rates and underlying claims trends for discussion of health care reform as it impacts our PEO.
We may not be able to keep pace with changes in technology or provide timely enhancements to our products and services:
To maintain our growth strategy, we must adapt and respond to technological advances and technological requirements of our clients. Our future success will depend on our ability to enhance capabilities and increase the performance of our internal use systems, particularly our systems that meet our clients’ requirements. We continue to make significant investments related to the development of new technology. If our systems become outdated, we may be at a disadvantage when competing in our industry. There can be no assurance that our efforts to update and integrate systems will be successful. If we do not integrate and update our systems in a timely manner, or if our investments in technology fail to provide the expected results, there could be a material adverse effect to our business and results of operations.
Our business and reputation may be affected by security breaches and other disruptions to our information technology infrastructure, which could compromise Company and personal customer information:
We rely upon information technology networks and systems to process, transmit, and store electronic information, and to support a variety of business processes. If we experience a problem with the functioning of key systems or a security breach of our systems, the resulting disruptions could have a material adverse effect on our business.
We also collect, use, and retain large amounts of personal information about our clients and their employees that is critical to the accurate and timely provision of services to our clients. This information includes bank account numbers, credit card numbers, tax return information, social security numbers, health care information, retirement account information, payroll information, and Paychex system passwords. In addition, we also collect and maintain personal information on our employees in the ordinary course of our business. As many of our services are web-based and mobile-application-based, the amount of data we store for our users on our servers has been increasing. Vulnerabilities, threats, and more sophisticated and targeted computer crime pose a risk to the security of our systems and networks, and the confidentiality, availability, and integrity of our data. We have security systems and information technology infrastructure in place designed to detect and protect against unauthorized access to such information. However, there is no guarantee that our systems and processes are adequate to protect against all security breaches. Third parties, including vendors that provide services for our operations, could also be a source of security risk to us in the event of a failure of their own security systems and infrastructure.
If our systems are disrupted or fail for any reason, or if our systems are infiltrated by unauthorized persons, both the Company and our clients could experience data loss, financial loss, harm to reputation, or significant business interruption. We may be required to incur significant costs to protect against damage caused by disruptions or security breaches in the future. Such events may expose us to unexpected liability, litigation, regulatory investigation and penalties, loss of clients’ business, unfavorable impact to business reputation, and there could be a material adverse effect on our business and results of operations.
In the event of a catastrophe, our business continuity plan may fail, which could result in the loss of client data and adversely interrupt operations:
Our operations are dependent on our ability to protect our infrastructure against damage from catastrophe or natural disaster, severe weather including events resulting from climate change, unauthorized security breach, power loss, telecommunications failure, terrorist attack, or other events that could have a significant disruptive effect on our operations. We have a business continuity plan in place in the event of system failure due to any of these events. Our business continuity plan has been tested in the past by circumstances of severe weather, including hurricanes, floods, and snowstorms, and has been successful. However, these past successes are not an indicator of success in the future. If the business continuity plan is unsuccessful in a disaster recovery scenario, we could potentially lose client data or experience material adverse interruptions to our operations or delivery of services to our clients.
We may be adversely impacted by any failure of third-party service providers to perform their functions:
As part of providing services to clients, we rely on a number of third-party service providers. These service providers include, but are not limited to, couriers used to deliver client payroll checks and banks used to electronically transfer funds from clients to their employees. Failure by these service providers, for any reason, to deliver their services in a timely manner could result in material interruptions to our operations, impact client relations, and result in significant penalties or liabilities to us.
9
We may be exposed to additional risks related to our co-employment relationship within our PEO business:
Many federal and state laws that apply to the employer-employee relationship do not specifically address the obligations and responsibilities of the “co-employment” relationship. As a result, there is a possibility that we may be subject to liability for violations of employment or discrimination laws by our clients and acts or omissions of client employees, who may be deemed to be our agents, even if we do not participate in any such acts or violations. Although our agreements with clients provide that they will indemnify us for any liability attributable to their own or their employees’ conduct, we may not be able to effectively enforce or collect such contractual obligations. In addition, we could be subject to liabilities with respect to our employee benefit plans if it were determined that we are not the “employer” under any applicable state or federal laws.
We may be adversely impacted by changes in health insurance and workers’ compensation rates and underlying claims trends:
Within our PEO business, we maintain health and workers’ compensation insurance covering worksite employees. The insurance costs are impacted by claims experience and are a significant portion of our PEO costs. If we experience a sudden or unexpected increase in claims activity, our costs could increase. In addition, in the event of expiration or cancellation of existing contracts, we may not be able to secure replacement contracts on competitive terms. Also, as a co-employer in the PEO, we assume or share many of the employer-related responsibilities associated with health care reform, which may result in increased costs. Increases in costs not incorporated into service fees timely or fully, could have a material adverse effect on our results of operations. Incorporating cost increases into service fees could also impact our ability to attract and retain clients.
Our interest earned on funds held for clients may be impacted by changes in government regulations mandating the amount of tax withheld or timing of remittance:
We receive interest income from investing client funds collected but not yet remitted to applicable tax or regulatory agencies or to client employees. A change in regulations either decreasing the amount of taxes to be withheld or allowing less time to remit taxes to applicable tax or regulatory agencies could adversely impact this interest income.
We may be adversely impacted by volatility in the financial and economic environment:
During periods of weak economic conditions, employment levels tend to decrease and interest rates may become more volatile. These conditions may impact our business due to lower transaction volumes or an increase in the number of clients going out of business. Current or potential clients may decide to reduce their spending on payroll and other outsourcing services. In addition, new business formation may be affected by an inability to obtain credit. The interest we earn on funds held for clients may decrease as a result of a decline in funds available to invest and lower interest rates. In addition, during periods of volatility in the credit markets, certain types of investments may not be available to us or may become too risky for us to invest in, further reducing the interest we may earn on client funds. Constriction in the credit markets may impact the availability of financing, even to borrowers with the highest credit ratings. Historically, we have rarely borrowed against available credit arrangements to meet liquidity needs. However, should we require additional short-term liquidity during days of large outflows of client funds, a credit constriction may limit our ability to access those funds or the flexibility to obtain them at interest rates that would be acceptable to us. If all of these financial and economic circumstances were to remain in effect for an extended period of time, there could be a material adverse effect on our results of operations.
Quantitative and qualitative disclosures about market risk:
Refer to Item 7A of this Form 10-K for a discussion on Market Risk Factors, which could have a material adverse effect on our business and results of operations.
|
Item 1B.
|
Unresolved Staff Comments
|
None.
10
|
Item 2.
|
Properties
|
We owned and leased the following properties as of
May 31, 2014
:
|
|
Square feet
|
|
|
Owned facilities:
|
||
|
Rochester, New York
|
721,000
|
|
|
Other U.S. locations
|
65,000
|
|
|
Total owned facilities
|
786,000
|
|
|
|
||
|
Leased facilities:
|
||
|
Rochester, New York
|
189,000
|
|
|
Other U.S. locations
|
2,024,000
|
|
|
Germany
|
28,000
|
|
|
Total leased facilities
|
2,241,000
|
|
|
|
||
Our facilities in Rochester, New York house various distribution, processing, and technology functions, certain ancillary functions, a telemarketing unit, and other back-office functions. Facilities outside of Rochester, New York are at various locations throughout the U.S. and Germany and house our regional, branch, and sales offices and data processing centers. These locations are concentrated in metropolitan areas. We believe that adequate, suitable lease space will continue to be available to meet our needs.
|
Item 3.
|
Legal Proceedings
|
We are subject to various claims and legal matters that arise in the normal course of our business. These include disputes or potential disputes related to breach of contract, breach of fiduciary duty, employment-related claims, tax claims, and other matters.
Our management currently believes that resolution of outstanding legal matters will not have a material adverse effect on our financial position or results of operations. However, legal matters are subject to inherent uncertainties and there exists the possibility that the ultimate resolution of these matters could have a material adverse impact on the Company’s financial position and the results of operations in the period in which any such effect is recorded.
|
Item 4.
|
Mine Safety Disclosures
|
Not applicable.
|
Item 5.
|
Market for Registrant’s Common Equity, Related Stockholder Matters and Issuer Purchases of Equity Securities
|
Our common stock trades on the NASDAQ Global Select Market under the symbol “PAYX.” Dividends have historically been paid on our common stock in August, November, February, and May. The level and continuation of future dividends are dependent on our future earnings and cash flows, and are subject to the discretion of our Board of Directors (the “Board.”)
As of
June 30, 2014
, there were
15,333
holders of record of our common stock, which includes registered holders and participants in the Paychex, Inc. Dividend Reinvestment and Stock Purchase Plan. There were also
6,997
participants in the Paychex, Inc. Employee Stock Purchase Plan and
5,261
participants in the Paychex, Inc. Employee Stock Ownership Plan.
11
The high and low sale prices for our common stock as reported on the NASDAQ Global Select Market and dividends for
fiscal 2014
and
fiscal 2013
are as follows:
|
|
|
Fiscal 2014
|
|
Fiscal 2013
|
|||||||||
|
|
|
Sales prices
|
Cash
dividends
declared per
share
|
|
Sales prices
|
Cash
dividends
declared per
share
(1)
|
|||||||
|
|
|
High
|
Low
|
High
|
Low
|
||||||||
|
First quarter
|
|
$40.84
|
$35.75
|
$0.35
|
|
$33.44
|
$29.12
|
$0.32
|
|||||
|
Second quarter
|
|
$44.01
|
$36.80
|
$0.35
|
|
$34.70
|
$31.27
|
$0.33
|
|||||
|
Third quarter
|
|
$45.95
|
$39.86
|
$0.35
|
|
$34.06
|
$30.55
|
$0.66
|
|||||
|
Fourth quarter
|
|
$43.56
|
$39.80
|
$0.35
|
|
$38.66
|
$32.73
|
—
|
|
||||
|
(1)
|
In fiscal 2013, the dividends that would typically have been paid in February 2013 and May 2013 were accelerated and paid in December 2012.
|
The closing price of our common stock as of
May 30, 2014
, as reported on the NASDAQ Global Select Market, was
$41.11
per share.
In October 2012, our Board approved a program to repurchase up to $350 million of our common stock, with authorization expiring on May 31, 2014. In May 2014, the Board approved a new program to repurchase up to
$350 million
of its common stock with authorization expiring on May 31, 2017. Shares of stock repurchased during the three months ended May 31, 2014 were retired. All shares of stock repurchased during the three months ended May 31, 2014 were purchased pursuant to the program.
The following table provides information relating to our repurchase of common stock during the three months ended May 31, 2014:
|
Period
|
Total number of shares purchased
|
Average price paid per share
|
Approximate dollar value of shares that may yet be purchased under the program
|
||||||||
|
March 1, 2014 - March 31, 2014
|
—
|
|
$
|
—
|
|
$
|
147,044,948
|
|
|||
|
April 1, 2014 - April 30, 2014
|
844,015
|
|
$
|
41.08
|
|
$
|
112,369,489
|
|
|||
|
May 1, 2014 - May 31, 2014
|
300,000
|
|
$
|
40.37
|
|
$
|
100,257,468
|
|
|||
|
Total for the period
|
1,144,015
|
|
$
|
40.90
|
|
$
|
100,257,468
|
|
|||
The following graph shows a five-year comparison of the total cumulative returns of investing $100 on
May 31, 2009
, in Paychex common stock, the S&P 500 Index, and a Peer Group Index. All comparisons of stock price performance shown assume reinvestment of dividends. We are a participant in the S&P 500 Index, a market group of companies with a larger than average market capitalization. Our Peer Group is a group of companies with comparable revenue and net income, who are in a comparable industry, or who are direct competitors of Paychex (as detailed on the next page).
12
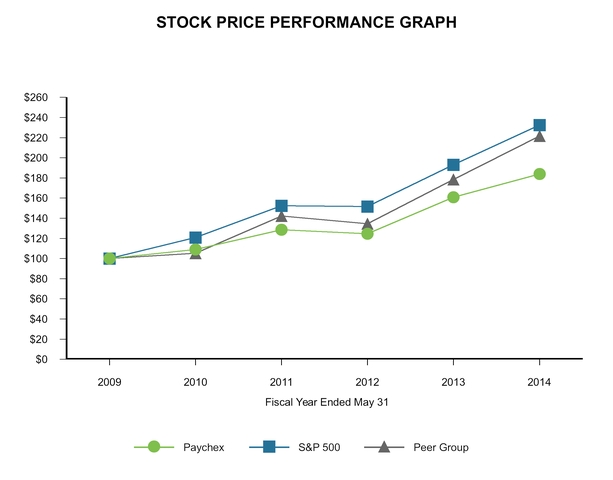
|
May 31,
|
2009
|
2010
|
2011
|
2012
|
2013
|
2014
|
||||||
|
Paychex
|
$100.00
|
$108.99
|
$128.64
|
$124.54
|
$160.94
|
$183.86
|
||||||
|
S&P 500
|
$100.00
|
$120.99
|
$152.39
|
$151.76
|
$193.15
|
$232.64
|
||||||
|
Peer Group
|
$100.00
|
$105.30
|
$142.18
|
$134.51
|
$178.37
|
$221.56
|
||||||
There can be no assurance that our stock performance will continue into the future with the same or similar trends depicted in the graph above. We will neither make nor endorse any predictions as to future stock performance.
Our Peer Group is comprised of the following companies:
|
Automatic Data Processing, Inc. (direct competitor)
|
|
Broadridge Financial Solutions, Inc.
|
|
Fiserv, Inc.
|
|
Robert Half International Inc.
|
|
The Western Union Company
|
|
Intuit Inc.
|
|
Total Systems Services, Inc.
|
|
Iron Mountain Incorporated
|
|
Global Payments Inc.
|
|
Moody’s Corporation
|
|
The Brink’s Company
|
|
H&R Block, Inc.
|
|
DST System, Inc.
|
|
TD AMERITRADE Holding Corporation
|
|
The Dun & Bradstreet Corporation
|
|
|
13
|
Item 6.
|
Selected Financial Data
|
|
In millions, except per share amounts
Year ended May 31,
|
2014
(1)
|
2013
(2)
|
2012
|
2011
|
2010
(3)
|
|||||||||||||||
|
Service revenue
|
$
|
2,478.2
|
|
$
|
2,285.2
|
|
$
|
2,186.2
|
|
$
|
2,036.2
|
|
$
|
1,945.8
|
|
|||||
|
Interest on funds held for clients
|
40.7
|
|
41.0
|
|
43.6
|
|
48.1
|
|
55.0
|
|
||||||||||
|
Total revenue
|
$
|
2,518.9
|
|
$
|
2,326.2
|
|
$
|
2,229.8
|
|
$
|
2,084.3
|
|
$
|
2,000.8
|
|
|||||
|
Operating income
|
$
|
982.7
|
|
$
|
904.8
|
|
$
|
853.9
|
|
$
|
786.4
|
|
$
|
724.8
|
|
|||||
|
Net income
|
$
|
627.5
|
|
$
|
569.0
|
|
$
|
548.0
|
|
$
|
515.3
|
|
$
|
477.0
|
|
|||||
|
Diluted earnings per share
|
$
|
1.71
|
|
$
|
1.56
|
|
$
|
1.51
|
|
$
|
1.42
|
|
$
|
1.32
|
|
|||||
|
Cash dividends per common share
|
$
|
1.40
|
|
$
|
1.31
|
|
$
|
1.27
|
|
$
|
1.24
|
|
$
|
1.24
|
|
|||||
|
Purchases of property and equipment
|
$
|
84.1
|
|
$
|
98.7
|
|
$
|
89.6
|
|
$
|
100.5
|
|
$
|
61.3
|
|
|||||
|
Cash and total corporate investments
|
$
|
936.8
|
|
$
|
874.6
|
|
$
|
790.0
|
|
$
|
671.3
|
|
$
|
656.9
|
|
|||||
|
Total assets
|
$
|
6,370.1
|
|
$
|
6,163.7
|
|
$
|
6,479.6
|
|
$
|
5,393.8
|
|
$
|
5,226.3
|
|
|||||
|
Total debt
|
$
|
—
|
|
$
|
—
|
|
$
|
—
|
|
$
|
—
|
|
$
|
—
|
|
|||||
|
Stockholders’ equity
|
$
|
1,777.0
|
|
$
|
1,773.7
|
|
$
|
1,604.5
|
|
$
|
1,496.2
|
|
$
|
1,402.0
|
|
|||||
|
Return on stockholders’ equity
|
35
|
%
|
34
|
%
|
34
|
%
|
35
|
%
|
34
|
%
|
||||||||||
|
(1)
|
With the introduction of a new health care offering within the PEO, the Company began to recognize certain PEO direct costs as operating expenses rather than as a reduction in service revenue. In the table above, this impacted service revenue and total revenue, but had no impact on operating income. Refer to the Results of Operations section of Item 7 of this Form 10-K and Note O of the Notes to Consolidated Financial Statements, contained in Item 8 of this Form 10-K, for further details on the impact to service revenue, total revenue, and operating expenses.
|
|
(2)
|
In the fourth quarter of fiscal 2013, the Company increased its tax provision related to the settlement of a state income tax matter. This reduced diluted earnings per share by approximately $0.04 per share.
|
|
(3)
|
Includes an expense charge of $18.7 million to increase the Rapid Payroll litigation reserve.
|
|
Item 7.
|
Management’s Discussion and Analysis of Financial Condition and Results of Operations
|
Management’s Discussion and Analysis of Financial Condition and Results of Operations reviews the operating results of Paychex, Inc. and its wholly owned subsidiaries (“Paychex,” “we,” “our,” or “us”) for each of the three fiscal years ended
May 31, 2014
(“
fiscal 2014
”),
May 31, 2013
(“
fiscal 2013
”), and
May 31, 2012
(“
fiscal 2012
”), and our financial condition as of
May 31, 2014
. This review should be read in conjunction with the accompanying consolidated financial statements and the related notes to consolidated financial statements contained in Item 8 of this Annual Report on Form 10-K (“Form 10-K”) and the “Risk Factors” discussed in Item 1A of this Form 10-K. Forward-looking statements in this review are qualified by the cautionary statement under the heading “Cautionary Note Regarding Forward-Looking Statements Pursuant to the United States Private Securities Litigation Reform Act of 1995” contained at the beginning of Part I of this Form 10-K.
Overview
We are a leading provider of integrated payroll, human resource, insurance, and benefits outsourcing solutions for small- to medium-sized businesses. Our payroll services and Human Resource Services (“HRS”) offer a portfolio of services and products that allow our clients to meet their diverse payroll and human resource needs. Our payroll services are the foundation of our service portfolio and include:
|
•
|
payroll processing;
|
|
•
|
payroll tax administration services;
|
|
•
|
employee payment services; and
|
|
•
|
regulatory compliance services (new-hire reporting and garnishment processing).
|
14
We support small-market companies through our core payroll and our software-as-a-service (“SaaS”) SurePayroll, Inc. (“SurePayroll”) product lines. Mid-market companies typically have more sophisticated payroll and benefits needs, and are primarily serviced through our Major Market Services (“MMS”). Our SaaS solution through our MMS platform provides human resource management, employee benefits management, time and attendance systems, online expense reporting, and applicant tracking.
Our HRS products include:
|
•
|
Paychex HR Services, under which we offer Paychex HR Solutions, our administrative services organization (“ASO”), and Paychex PEO, our professional employer organization (“PEO”). We also offer Paychex HR Essentials, an ASO product that provides support to our clients over the phone or online to help manage employee-related topics;
|
|
•
|
retirement services administration;
|
|
•
|
insurance services;
|
|
•
|
online HR administration services, including time and attendance and benefit enrollment; and
|
|
•
|
other human resource services and products.
|
Our primary goal is to support the success of our clients and their businesses through innovative technology solutions and outstanding personal service. Our business strategy is focused on strong long-term financial performance by providing high-quality, timely, accurate, and affordable services; growing our client base; increasing utilization of our ancillary services; leveraging our technology through our service organization; and expanding our product offerings. We continue to focus on driving growth in clients, revenue, and profits. We are managing our personnel costs and expenses while continuing to invest in our business, particularly in leading-edge technology. We believe these investments are critical to our success. Looking to the future, we continue to focus on investing in our products, people, and service capabilities, positioning ourselves to capitalize on opportunities for long-term growth.
Our financial results for
fiscal 2014
reflected sustained growth in our business. Payroll service revenue continued to advance with growth of
4%
for
fiscal 2014
as compared with
fiscal 2013
. Revenue per check, client base, and checks per payroll continued to show improvement. Checks per payroll increased
1.4%
for
fiscal 2014
and
1.6%
for
fiscal 2013
. HRS revenue achieved double-digit growth, primarily due to demand for our human resource outsourcing solutions. Our service execution was strong as we achieved record levels of client retention, at approximately
82%
of the beginning of the year client base.
Our financial results continue to be impacted by the interest rate environment as interest rates available on high quality financial instruments remain low. The Federal Funds rate has been at a range of zero to 0.25% since December 2008. Our combined funds held for clients and corporate investment portfolios earned an average rate of return of
1.0%
for both
fiscal 2014
and
fiscal 2013
, and
1.1%
for
fiscal 2012
.
With the introduction of a new health insurance offering within our PEO during fiscal 2014, we began classifying PEO direct costs related to certain benefit plans where the Company retains risk as operating expenses rather than a reduction in service revenue. This change, referred to as the "PEO direct cost adjustment" throughout this discussion, had no impact on operating income. Refer to the Results of Operations section of this Item 7 and Note O to the Notes to Consolidated Financial Statements, contained in Item 8 of this Form 10-K, for further details on the impact to service revenue, total revenue, and operating expenses. In evaluating HRS revenue, we historically have considered the PEO revenue net of these direct costs.
Highlights of our financial results for
fiscal 2014
, compared to
fiscal 2013
, are as follows:
|
•
|
Total service revenue increased
8%
to
$2.5 billion
(
6%
growth excluding the PEO direct cost adjustment).
|
|
◦
|
Payroll service revenue increased
4%
to
$1.6 billion
.
|
|
◦
|
HRS revenue increased
18%
to
$878.9 million
(
12%
excluding the PEO direct cost adjustment).
|
|
•
|
Interest on funds held for clients decreased
1%
to
$40.7 million
.
|
|
•
|
Total revenue increased
8%
to
$2.5 billion
(
6%
excluding the PEO direct costs adjustment).
|
|
•
|
Operating income increased
9%
to
$982.7 million
, and operating income, net of certain items, increased
9%
to
$942.0 million
. Refer to the “Non-GAAP Financial Measure” discussion below for further information on operating income, net of certain items.
|
|
•
|
|
15
|
•
|
Net income and diluted earnings per share increased
10%
to
$627.5 million
and
$1.71
per share, respectively. The growth rate for net income and diluted earnings per share was positively impacted by comparison to the prior year, which reflected settlement of a state income tax matter. This settlement reduced diluted earnings per share by approximately $0.04 per share for
fiscal 2013
.
|
|
•
|
Dividends of
$510.6 million
were paid to stockholders, representing
81%
of net income.
|
Non-GAAP Financial Measure
In addition to reporting operating income, a United States (“U.S.”) generally accepted accounting principle (“GAAP”) measure, we present operating income, net of certain items, which is a non-GAAP measure. We believe operating income, net of certain items, is an appropriate additional measure, as it is an indicator of our core business operations performance period over period. It is also the basis of the measure used internally for establishing the following year’s targets and measuring management’s performance in connection with certain performance-based compensation payments and awards. Operating income, net of certain items, excludes interest on funds held for clients. Interest on funds held for clients is an adjustment to operating income due to the volatility of interest rates, which are not within the control of management. Operating income, net of certain items, is not calculated through the application of GAAP and is not the required form of disclosure by the Securities and Exchange Commission (“SEC”). As such, it should not be considered as a substitute for the GAAP measure of operating income and, therefore, should not be used in isolation, but in conjunction with the GAAP measure. The use of any non-GAAP measure may produce results that vary from the GAAP measure and may not be comparable to a similarly defined non-GAAP measure used by other companies.
Business Outlook
Our client base totaled approximately
580,000
clients as of
May 31, 2014
, compared to approximately
570,000
clients as of
May 31, 2013
, and approximately
567,000
clients as of
May 31, 2012
. Our client base increased approximately
2%
for
fiscal 2014
, compared to approximately
1%
for both
fiscal 2013
and
fiscal 2012
.
For
fiscal 2014
, payroll services client retention was at a record level of approximately
82%
of our beginning of the year client base. Our client satisfaction results remained high, which we believe is a result of our focus on providing innovative technology solutions and outstanding personal service to our clients to maximize client retention.
Our ancillary services provide services to employers and employees beyond payroll, but effectively leverage payroll processing data and, therefore, are beneficial to our operating margin. Our online HR administration services are often included as part of the SaaS solutions for mid-market clients. The following statistics demonstrate the growth in selected HRS ancillary service offerings:
|
|
Balance at
May 31, 2014
|
Growth rates for fiscal year
|
||||||||||
|
|
2014
|
2013
|
2012
|
|||||||||
|
Paychex HR Services client employees served
|
766,000
|
|
14
|
%
|
9
|
%
|
8
|
%
|
||||
|
Paychex HR Services clients
|
28,000
|
|
13
|
%
|
10
|
%
|
8
|
%
|
||||
|
Health and benefits services applicants
|
134,000
|
|
3
|
%
|
8
|
%
|
23
|
%
|
||||
|
Retirement services plans
|
65,000
|
|
5
|
%
|
4
|
%
|
4
|
%
|
||||
We continue to position ourselves to capitalize on the opportunities arising from the shift to SaaS solutions as we invest heavily in product development relating to our SaaS capabilities and mobile applications. Our Paychex Next Generation suite of innovative products and services includes a SaaS platform that combines the latest technology with superior customer service to provide human resource administrators a streamlined and integrated approach to workforce management. With this, all Paychex services, including payroll, time and attendance, HR, benefits, training, and performance management, are accessible on a single cloud-based platform with Paychex Single Sign-On. We believe continued investment in our technology is a key building block for future success.
In
fiscal 2014
, we broadened our portfolio of value-added services, offering the following new accounting and finance services:
|
•
|
Paychex Accounting Online is a cloud-based accounting service that is being created and delivered via a strategic partnership and investment in Kashoo, a leading provider of cloud accounting services. This SaaS solution complements our industry-leading payroll and HR Solutions by expanding our suite of services for new businesses and entrepreneurs. This is a revenue sharing arrangement with Kashoo.
|
16
|
•
|
Biz2Credit is a leading online credit resource for small businesses we partnered with to offer the Paychex Small Business Loan Resource Center. This is an online resource that gives business owners access to more than 1,200 lenders offering a variety of loan options that fit their specific financing needs. This partnership underscores our commitment to help small businesses succeed by giving them access to funds they need to start, grow, and manage their business. We earn a referral fee from this partnership.
|
|
•
|
Paychex Payment Processing Services is a full suite of payment processing solutions, including credit and debit card processing, mobile and online payment services, and point-of-sale solutions, designed to meet the evolving needs of today’s small businesses. This service is being offered in partnership with Elavon, a leading global payments provider. This is a revenue sharing arrangement with Elavon.
|
We introduced our new comprehensive solutions to help employers and employees with certain mandates under U.S. health care reform legislation. These offerings include Paychex Employer Shared Responsibility Service designed to make it easier for business owners to determine if the Employer Shared Responsibility (“ESR”) provision applies to them, and what actions they may need to take. We also offer our new ESR Complete Analysis and Monitoring Services for those clients that want a more robust solution. The Paychex Benefit Account product allows employers to offer Flexible Savings Accounts, Health Savings Accounts, and Health Reimbursement Accounts on a single platform with one debit card for their flexibility. The new health care reform section on our website is designed to provide answers, information, and solutions that employers need to prepare for and take action on health care reform.
We focused on product expansion in new markets and geographies by increasing our presence in Germany and expanding into South America. We completed a business acquisition of a small payroll provider in Germany. While not material to our consolidated financial results, this acquisition will increase our revenue and client base in Germany and help us gain a greater share of the payroll market in that country. In South America, we are utilizing a joint venture arrangement in Brazil. Brazil is a significant market with a growing economy, approximately five million small businesses, and, with recent regulatory changes, a significant opportunity for outsourcing payroll and human resource services. The decision to expand into Brazil and further expand in Germany represents our focus on growth, specifically targeting product expansion through new markets and geographies.
We continue to strengthen our position as an expert in our industry by serving as a source of education and information to clients, small businesses, and other interested parties. We provide free webinars, white papers, and other information on our website to aid existing and prospective clients with the impact of regulatory changes. The Paychex Insurance Agency, Inc. website,
www.paychexinsurance.com
, helps small business owners navigate the area of insurance coverage and both this website and
www.paychex.com
have sections dedicated to the topic of health care reform.
Financial position and liquidity
Our financial position as of
May 31, 2014
remained strong with cash and total corporate investments of
$936.8 million
and no debt.
Our investment strategy focuses on protecting principal and optimizing liquidity. Yields on high quality financial instruments remain low, negatively impacting our income earned on funds held for clients and corporate investments. We invest predominately in municipal bonds including general obligation bonds, pre-refunded bonds that are secured by a U.S. government escrow, and essential services revenue bonds. During
fiscal 2014
, our primary short-term investment vehicles were high quality variable rate demand notes (“VRDNs”) and bank demand deposit accounts.
A substantial portion of our portfolio is invested in high credit quality securities with AAA and AA ratings and A-1/P-1 ratings on short-term securities. We limit the amounts that can be invested in any single issuer and invest in short- to intermediate-term instruments whose fair value is less sensitive to interest rate changes. We believe that our investments as of
May 31, 2014
were not other-than-temporarily impaired, nor has any event occurred subsequent to that date that would indicate any other-than-temporary impairment.
Our primary source of cash is our ongoing operations. Cash flow from operations was
$880.9 million
for
fiscal 2014
. Historically, we have funded our operations, capital purchases, business acquisitions, share repurchases, and dividend payments from our operating activities. Our positive cash flows in
fiscal 2014
allowed us to support our business growth and to pay substantial dividends to our stockholders. During
fiscal 2014
, dividends paid to stockholders were
81%
of net income. It is anticipated that cash and total corporate investments as of
May 31, 2014
, along with projected operating cash flows, will support our normal business operations, capital purchases, business acquisitions, share repurchases, and dividend payments for the foreseeable future.
17
For further analysis of our results of operations for fiscal years
2014
,
2013
, and
2012
, and our financial position as of
May 31, 2014
, refer to the tables and analysis in the “Results of Operations” and “Liquidity and Capital Resources” sections of this Item 7 and the discussion in the “Critical Accounting Policies” section of this Item 7.
Outlook
Our outlook for the fiscal year ending
May 31, 2015
(“
fiscal 2015
”) is based upon current market, economic and interest rate conditions continuing with no significant changes. Our expected
fiscal 2015
payroll revenue growth rate is based upon anticipated client base growth and increases in revenue per check. HRS revenue and total service revenue growth reflect the change to classify certain PEO direct costs as operating expenses and not as a reduction in service revenue.
Our
fiscal 2015
guidance is as follows:
|
Low
|
High
|
|||||||
|
Payroll service revenue
|
3
|
%
|
—
|
5
|
%
|
|||
|
HRS revenue
|
16
|
%
|
—
|
19
|
%
|
|||
|
Total service revenue
|
8
|
%
|
—
|
10
|
%
|
|||
|
Net income
|
6
|
%
|
—
|
8
|
%
|
|||
Operating income, net of certain items, as a percent of total service revenue, is expected to be in the range of
37%
to
38%
for
fiscal 2015
. The effective income tax rate for
fiscal 2015
is expected to be consistent with that experienced in fiscal 2014.
Interest on funds held for clients for
fiscal 2015
is expected to be relatively flat, as it continues to be impacted by the low interest rate environment, with funds reinvested at lower yields. The average rate of return on our combined funds held for clients and corporate investment portfolios is expected to be
0.9%
for
fiscal 2015
. As of
May 31, 2014
, the long-term investment portfolio had an average yield-to-maturity of
1.6%
and an average duration of
3.0
years. In the next twelve months, approximately
15%
of this portfolio will mature, and it is currently anticipated that these proceeds will be reinvested at an interest rate of approximately
1.6%
. Investment income is expected to benefit from ongoing investment of cash generated from operations.
Purchases of property and equipment for
fiscal 2015
are expected to be in the range of
$110 million
to
$120 million
. This includes costs for internally developed software as we continue to invest in our service supporting technology.
Fiscal 2015
depreciation expense is projected to be in the range of
$95 million
to
$100 million
, and we project amortization of intangible assets for
fiscal 2015
to be in the range of
$15 million
to
$20 million
.
Results of Operations
Summary of Results of Operations for the Fiscal Years Ended May 31:
|
In millions, except per share amounts
|
2014
|
Change
|
2013
|
Change
|
2012
|
|||||||||||||
|
Revenue:
|
||||||||||||||||||
|
Payroll service revenue
|
$
|
1,599.3
|
|
4
|
%
|
$
|
1,539.2
|
|
2
|
%
|
$
|
1,510.0
|
|
|||||
|
HRS revenue
|
878.9
|
|
18
|
%
|
746.0
|
|
10
|
%
|
676.2
|
|
||||||||
|
Total service revenue
|
2,478.2
|
|
8
|
%
|
2,285.2
|
|
5
|
%
|
2,186.2
|
|
||||||||
|
Interest on funds held for clients
|
40.7
|
|
(1
|
)%
|
41.0
|
|
(6
|
)%
|
43.6
|
|
||||||||
|
Total revenue
|
2,518.9
|
|
8
|
%
|
2,326.2
|
|
4
|
%
|
2,229.8
|
|
||||||||
|
Combined operating and SG&A expenses
|
1,536.2
|
|
8
|
%
|
1,421.4
|
|
3
|
%
|
1,375.9
|
|
||||||||
|
Operating income
|
982.7
|
|
9
|
%
|
904.8
|
|
6
|
%
|
853.9
|
|
||||||||
|
Investment income, net
|
5.4
|
|
(18
|
)%
|
6.6
|
|
4
|
%
|
6.4
|
|
||||||||
|
Income before income taxes
|
988.1
|
|
8
|
%
|
911.4
|
|
6
|
%
|
860.3
|
|
||||||||
|
Income taxes
|
360.6
|
|
5
|
%
|
342.4
|
|
10
|
%
|
312.3
|
|
||||||||
|
Effective income tax rate
|
36.5
|
%
|
37.6
|
%
|
36.3
|
%
|
||||||||||||
|
Net income
|
627.5
|
|
10
|
%
|
$
|
569.0
|
|
4
|
%
|
$
|
548.0
|
|
||||||
|
Diluted earnings per share
|
$
|
1.71
|
|
10
|
%
|
$
|
1.56
|
|
3
|
%
|
$
|
1.51
|
|
|||||
18
With the introduction of a new health insurance offering within the PEO during fiscal 2014, we began classifying PEO direct costs related to certain benefit plans where we retain risk as operating expenses rather than as a reduction in service revenue. This had no impact on operating income. The amounts reported for service revenue, total revenue, and combined operating and selling, general and administrative (“SG&A”) expenses reflect this gross presentation.
In addition to reporting the PEO revenue on a gross basis within HRS revenue as described above, a GAAP measure, we use an HRS net revenue presentation, which is a non-GAAP measure, to provide an additional view of our performance. We believe HRS net revenue provides useful information as a measure of our revenue, eliminating the cost of services provided and on a consistent basis. We use HRS net revenue in evaluating our operating results on a comparative basis, to identify trends in our business, and in evaluating the effectiveness of our business strategies. HRS net revenue is not calculated through the application of GAAP and is not the required form of disclosure by the SEC. As such, it should not be considered as a substitute for the GAAP measure and therefore, should not be used in isolation, but in conjunction with the GAAP measure. The use of any non-GAAP measure may produce results that vary from the GAAP measure and may not be comparable to a similarly defined non-GAAP measure used by other companies.
Had the direct costs of certain benefit plans been reported as a reduction in service revenue, the following would have been reflected for fiscal 2014:
|
For the twelve months ended May 31, 2014
|
% Change
|
|||||||||||||||||
|
In millions
|
As reported
|
PEO direct cost adjustment
|
HRS net revenue
|
As Reported
|
HRS net revenue
|
|||||||||||||
|
Revenue:
|
||||||||||||||||||
|
HRS revenue
|
$
|
878.9
|
|
$
|
46.8
|
|
$
|
832.1
|
|
18
|
%
|
12
|
%
|
|||||
|
Total service revenue
|
$
|
2,478.2
|
|
$
|
46.8
|
|
$
|
2,431.4
|
|
8
|
%
|
6
|
%
|
|||||
|
Total revenue
|
$
|
2,518.9
|
|
$
|
46.8
|
|
$
|
2,472.1
|
|
8
|
%
|
6
|
%
|
|||||
We invest in highly liquid, investment-grade fixed income securities and do not utilize derivative instruments to manage interest rate risk. As of
May 31, 2014
, we had no exposure to high-risk or illiquid investments and had insignificant exposure to European investments. Details regarding our combined funds held for clients and corporate investment portfolios are as follows:
|
|
Year ended May 31,
|
|||||||||||
|
$ in millions
|
2014
|
2013
|
2012
|
|||||||||
|
Average investment balances:
|
||||||||||||
|
Funds held for clients
|
$
|
3,877.0
|
|
$
|
3,715.6
|
|
$
|
3,584.3
|
|
|||
|
Corporate investments
|
888.2
|
|
756.9
|
|
685.9
|
|
||||||
|
Total
|
$
|
4,765.2
|
|
$
|
4,472.5
|
|
$
|
4,270.2
|
|
|||
|
Average interest rates earned (exclusive of net realized gains):
|
||||||||||||
|
Funds held for clients
|
1.0
|
%
|
1.1
|
%
|
1.2
|
%
|
||||||
|
Corporate investments
|
0.7
|
%
|
0.8
|
%
|
0.9
|
%
|
||||||
|
Combined funds held for clients and corporate investments
|
1.0
|
%
|
1.0
|
%
|
1.1
|
%
|
||||||
|
Total net realized gains
|
$
|
0.6
|
|
$
|
0.9
|
|
$
|
1.0
|
|
|||
|
$ in millions
As of May 31,
|
2014
|
2013
|
2012
|
|||||||||
|
Net unrealized gains on available-for-sale securities
(1)
|
$
|
34.5
|
|
$
|
34.7
|
|
$
|
59.5
|
|
|||
|
Federal Funds rate
(2)
|
0.25
|
%
|
0.25
|
%
|
0.25
|
%
|
||||||
|
Total fair value of available-for-sale securities
|
$
|
3,391.4
|
|
$
|
3,691.4
|
|
$
|
3,059.0
|
|
|||
|
Weighted-average duration of available-for-sale securities in years
(3)
|
3.0
|
|
3.1
|
|
3.0
|
|
||||||
|
Weighted-average yield-to-maturity of available-for-sale securities
(3)
|
1.6
|
%
|
1.8
|
%
|
2.2
|
%
|
||||||
|
(1)
|
The net unrealized gain on our investment portfolios was approximately
$26.9 million
as of
July 16, 2014
.
|
19
|
(2)
|
The Federal Funds rate was a range of zero to 0.25% as of
May 31, 2014
,
2013
, and
2012
.
|
|
(3)
|
These items exclude the impact of VRDNs, as they are tied to short-term interest rates.
|
Payroll service revenue:
Payroll service revenue was
$1.6 billion
for
fiscal 2014
and
$1.5 billion
for
fiscal 2013
, reflecting growth of
4%
and
2%
, respectively, compared to the prior fiscal year periods. Both
fiscal 2014
and
fiscal 2013
revenue benefited from increases in revenue per check, client base, and checks per payroll. Revenue per check was positively impacted by price increases, partially offset by discounting, together with increased product penetration. For
fiscal 2014
, our total payroll client base growth was approximately
2%
, compared to 1% for both
fiscal 2013
and
fiscal 2012
. Checks per payroll have increased for seventeen consecutive quarters. Payroll service revenue for
fiscal 2013
was modestly affected by the impact of Hurricane Sandy in the fall of 2012 and one less payroll processing day overall due to the leap year in fiscal 2012. Client retention reached record levels for
fiscal 2014
, at approximately
82%
of the beginning of the year client base, compared to exceeding 81% of the beginning of the year client base in the prior year.
Human Resource Services revenue:
HRS revenue was
$878.9 million
for
fiscal 2014
and
$746.0 million
for
fiscal 2013
, reflecting growth of
18%
and
10%
, respectively compared to the prior fiscal year. Excluding the impact of the PEO direct cost adjustment, HRS revenue would have increased 12% for
fiscal 2014
.
The growth for
fiscal 2014
and
fiscal 2013
in HRS revenue was driven primarily by client base growth, particularly in Paychex HR Services, retirement services, and online HR administration products. Our online HR administration products contributed to growth through sales success for SaaS solutions. The most significant contributors, all of which increased by high single or low double-digit percentages, are as follows:
|
•
|
Paychex HR Services revenue was positively impacted for both years by growth in both clients and client employees.
Fiscal 2013
growth was also impacted by price increases. During the second half of
fiscal 2014
, we introduced a new health care option, a minimum premium plan, within our PEO product. For
fiscal 2014
, the PEO experienced growing demand contributing to the increase in the growth rate for Paychex HR Services revenue. The rate of growth for Paychex HR Services revenue for
fiscal 2013
was tempered by a lower average number of client employees within our PEO. During the second half of
fiscal 2013
, the PEO business stabilized and its results strengthened as the year progressed.
|
|
•
|
Retirement services revenue benefited from growth in the number of plans, price increases, and an increase in the average asset value of retirement services participants' funds for both
fiscal 2014
and
fiscal 2013
. This growth was partially offset by the impact from a shift in the mix of assets within these funds to investments that earn lower fees from external managers.
|
|
•
|
Insurance services revenue growth for both
fiscal 2014
and
fiscal 2013
was the result of increases in premiums and clients for workers' compensation insurance services. We experienced growth in health and benefits services applicants, though at moderating rates. Health and benefits revenue has also experienced higher revenue from other insurance policies, such as dental, vision, disability, and life.
|
|
•
|
Our online HR administration products, including time and attendance and benefit enrollment, contributed to growth through strong sales of SaaS solutions.
|
HRS product key statistics are as follows:
|
$ in billions
As of May 31,
|
2014
|
Change
|
2013
|
Change
|
2012
|
|||||||||||||
|
Paychex HR Services client employees served
|
766,000
|
|
14
|
%
|
672,000
|
|
9
|
%
|
615,000
|
|
||||||||
|
Paychex HR Services clients
|
28,000
|
|
13
|
%
|
25,000
|
|
10
|
%
|
23,000
|
|
||||||||
|
Health and benefits services applicants
|
134,000
|
|
3
|
%
|
131,000
|
|
8
|
%
|
121,000
|
|
||||||||
|
Retirement services plans
|
65,000
|
|
5
|
%
|
62,000
|
|
4
|
%
|
59,000
|
|
||||||||
|
Asset value of retirement services participants’ funds
|
$
|
21.9
|
|
13
|
%
|
$
|
19.3
|
|
23
|
%
|
$
|
15.7
|
|
|||||
Total service revenue:
Total service revenue increased
8%
for
fiscal 2014
and
5%
for
fiscal 2013
, attributable to the factors previously discussed. Excluding the impact of the PEO direct costs adjustment, service revenue would have increased
6%
for
fiscal 2014
.
20
Interest on funds held for clients:
Interest on funds held for clients decreased
1%
for
fiscal 2014
and
6%
for
fiscal 2013
compared to the respective prior year periods. These declines were the result of lower average interest rates earned, partially offset by an increase in average investment balances. The lower average interest rates were the result of lower yields on high quality financial instruments. For
fiscal 2013
, the average interest rate earned was also impacted by the mix of investments in the short-term portfolio, with more invested in tax-exempt securities. Tax-exempt securities typically earn a lower pre-tax rate of return, but are expected to generate lower income tax expense on interest earned.
Average investment balances for funds held for clients increased
4%
for both
fiscal 2014
and
fiscal 2013
. The increase for
fiscal 2014
was largely due to the expiration of certain payroll tax cuts on December 31, 2012, which resulted in higher employee social security withholdings. In addition, the average investment balances for both
fiscal 2014
and
fiscal 2013
benefited from increases in checks per payroll and client base, and wage inflation.
Refer to the “Market Risk Factors” section, contained in Item 7A of this Form 10-K, for more information on changing interest rates.
Combined operating and SG&A expenses:
The following table summarizes total combined operating and SG&A expenses for fiscal years:
|
In millions
|
2014
|
Change
|
2013
|
Change
|
2012
|
|||||||||||||
|
Compensation-related expenses
|
$
|
1,003.9
|
|
5
|
%
|
$
|
955.8
|
|
4
|
%
|
$
|
920.8
|
|
|||||
|
Depreciation and amortization
|
105.0
|
|
7
|
%
|
98.2
|
|
—
|
%
|
97.8
|
|
||||||||
|
Other expenses
|
380.5
|
|
4
|
%
|
367.4
|
|
3
|
%
|
357.3
|
|
||||||||
|
PEO direct cost adjustment
|
46.8
|
|
100
|
%
|
—
|
|
na
|
|
—
|
|
||||||||
|
Total expenses
|
$
|
1,536.2
|
|
8
|
%
|
$
|
1,421.4
|
|
3
|
%
|
$
|
1,375.9
|
|
|||||
Total expenses increased
8%
for
fiscal 2014
and
3%
for
fiscal 2013
. Excluding the PEO direct cost adjustment, growth in total expenses for
fiscal 2014
would have been
5%
. The increases in total expenses were primarily in compensation-related expenses. For
fiscal 2014
, compensation-related expenses increased due to higher wages and performance-based compensation costs. The increase in wages was largely related to investments in product development and supporting technology, as well as sales force investment initiatives that began in fiscal 2013. For
fiscal 2013
, compensation-related expenses were impacted by increased headcount in areas supporting our development of technology, and higher employee benefit-related costs, partially offset by the impact of improvements in operations productivity with related lower headcount. As of
May 31, 2014
, we had approximately
12,700
employees, compared with
12,400
employees as of both
May 31, 2013
and
May 31, 2012
.
Depreciation expense is primarily related to buildings, furniture and fixtures, data processing equipment, and software. Increases in depreciation expense were due to capital expenditures as we invested in technology and continued to grow our business. The higher growth rate for
fiscal 2014
was related to additional internally developed software related to our Paychex Next Generation platform that was placed in service during the year. Amortization of intangible assets is primarily related to client list acquisitions, which are amortized using either straight-line or accelerated methods.
Other expenses include items such as delivery, forms and supplies, communications, travel and entertainment, equipment costs, professional services, and other costs incurred to support our business. Higher equipment costs within information technology and higher professional services supporting our technology development contributed to the increases in other expenses for both
fiscal 2014
and
fiscal 2013
.
Operating income:
Operating income increased
9%
for
fiscal 2014
and
6%
for
fiscal 2013
. The fluctuations in operating income were attributable to the factors previously discussed.
Operating income, net of certain items, is as follows for fiscal years:
|
In millions
|
2014
|
Change
|
2013
|
Change
|
2012
|
|||||||||||||
|
Operating income
|
$
|
982.7
|
|
9
|
%
|
$
|
904.8
|
|
6
|
%
|
$
|
853.9
|
|
|||||
|
Excluding: Interest on funds held for clients
|
(40.7
|
)
|
(1
|
)%
|
(41.0
|
)
|
(6
|
)%
|
(43.6
|
)
|
||||||||
|
Operating income, net of certain items
|
$
|
942.0
|
|
9
|
%
|
$
|
863.8
|
|
7
|
%
|
$
|
810.3
|
|
|||||
|
Operating income, net of certain items, as a percent of service revenue
(1)
|
38.0
|
%
|
37.8
|
%
|
37.1
|
%
|
||||||||||||
21
|
(1)
|
Operating income, net of certain items, as a percent of service revenue (“operating margin”) for fiscal 2014 is based on service revenue numbers as reported. Excluding the impact of the PEO direct cost adjustment, operating margin for fiscal 2014 would have been 38.7%.
|
Refer to the previous discussion of operating income, net of certain items, in the “Non-GAAP Financial Measure” section on page 16.
Investment income, net:
Investment income, net, primarily represents earnings from our cash and cash equivalents and investments in available-for-sale securities. Investment income does not include interest on funds held for clients, which is included in total revenue. Investment income, net, decreased
18%
for
fiscal 2014
and increased
4%
for
fiscal 2013
. The decrease in investment income, net, for
fiscal 2014
was the result of lower average interest rates earned on investments, partially offset by an increase in average investment balances. The increase in investment income for
fiscal 2013
was primarily the result of higher average investment balances. Average investment balances increased
17%
for
fiscal 2014
and
10%
for
fiscal 2013
. The increases were the result of investment of cash generated from operations.
Income taxes:
Our effective income tax rate was
36.5%
for
fiscal 2014
compared to
37.6%
for
fiscal 2013
and
36.3%
for
fiscal 2012
. The higher effective tax rate for
fiscal 2013
was the result of the settlement of a state income tax matter. Refer to Note I of the Notes to Consolidated Financial Statements, contained in Item 8 of this Form 10-K, for additional disclosures on income taxes.
Net income and earnings per share:
Net income increased
10%
to
$627.5 million
for
fiscal 2014
and
4%
to
$569.0 million
for
fiscal 2013
. Diluted earnings per share increased
10%
to
$1.71
per share for
fiscal 2014
and
3%
to
$1.56
per share for
fiscal 2013
. These fluctuations were attributable to the factors previously discussed. The settlement of a state income tax matter reduced diluted earnings per share by approximately $0.04 per share for fiscal 2013.
Liquidity and Capital Resources
Our financial position as of
May 31, 2014
remained strong with cash and total corporate investments of
$936.8 million
and no debt. We believe that our investments as of
May 31, 2014
were not other-than-temporarily impaired, nor has any event occurred subsequent to that date that would indicate any other-than-temporary impairment. We anticipate that cash and total corporate investments as of
May 31, 2014
, along with projected operating cash flows, will support our normal business operations, capital purchases, business acquisitions, share repurchases, and dividend payments for the foreseeable future.
Commitments and Contractual Obligations
Lines of credit:
As of
May 31, 2014
, we had unused borrowing capacity available under uncommitted, secured, short-term lines of credit at market rates of interest with financial institutions as follows:
|
Financial institution
|
Amount available
|
Expiration date
|
|
JP Morgan Chase Bank, N.A.
|
$350 million
|
February 28, 2015
|
|
Bank of America, N.A.
|
$250 million
|
February 28, 2015
|
|
PNC Bank, National Association
|
$150 million
|
February 28, 2015
|
|
Wells Fargo Bank, National Association
|
$150 million
|
February 28, 2015
|
Our credit facilities are evidenced by promissory notes and are secured by separate pledge security agreements by and between Paychex, Inc. and each of the financial institutions (the “Lenders”), pursuant to which we have granted each of the Lenders a security interest in certain of our investment securities accounts. The collateral is maintained in a pooled custody account pursuant to the terms of a control agreement and is to be administered under an intercreditor agreement among the Lenders. Under certain circumstances, individual Lenders may require that collateral be transferred from the pooled account into segregated accounts for the benefit of such individual Lenders.
The primary uses of the lines of credit would be to meet short-term funding requirements related to deposit account overdrafts and client fund obligations arising from electronic payment transactions on behalf of our clients in the ordinary course of business, if necessary. No amounts were outstanding against these lines of credit during
fiscal 2014
or as of
May 31, 2014
.
Certain of the financial institutions are also parties to our credit facility and irrevocable standby letters of credit, which are discussed below.
22
Credit facility
: In June 2013, we entered into a committed, unsecured, five-year syndicated credit facility, expiring on June 21, 2018. Under the credit facility, Paychex of New York LLP (the “Borrower”) may, subject to certain restrictions, borrow up to $500 million to meet short-term funding requirements. The obligations under this facility have been guaranteed by us and certain of our subsidiaries. The outstanding obligations under this credit facility will bear interest at competitive rates to be elected by the Borrower. Upon expiration of the commitment in June 2018, any borrowings outstanding will mature and be payable on such date.
There were no amounts outstanding under this credit facility as of
May 31, 2014
. During
fiscal 2014
, we borrowed against this facility, for one day each, as follows:
|
$ in millions
Fiscal quarter
|
Amount borrowed
|
Interest rate
|
|||||
|
First quarter
|
$
|
25.0
|
|
3.25
|
%
|
||
|
Second quarter
|
$
|
175.0
|
|
3.25
|
%
|
||
Certain lenders under this credit facility, and their respective affiliates, have performed, and may in the future perform for us and our subsidiaries, various commercial banking, investment banking, underwriting, and other financial advisory services, for which they have received, and will continue to receive in the future, customary fees and expenses.
Letters of credit:
As of
May 31, 2014
, we had irrevocable standby letters of credit outstanding totaling
$43.0 million
, required to secure commitments for certain insurance policies. The letters of credit expire at various dates between
July 2014 and April 2015
, and are collateralized by securities held in our investment portfolios. No amounts were outstanding on these letters of credit during
fiscal 2014
or as of
May 31, 2014
. Subsequent to
May 31, 2014
, the letter of credit expiring in
July 2014
was renewed, at the same terms and amount, and will expire in
July 2015
.
Other commitments:
We have entered into various operating leases and purchase obligations that, under GAAP, are not reflected on the Consolidated Balance Sheets as of
May 31, 2014
. The table below summarizes our estimated annual payment obligations under these commitments as of
May 31, 2014
:
|
|
Payments due by period
|
|||||||||||||||||||
|
In millions
|
Total
|
Less than
1 year
|
1-3 years
|
4-5 years
|
More than
5 years
|
|||||||||||||||
|
Operating leases
(1)
|
$
|
129.2
|
|
$
|
37.5
|
|
$
|
52.9
|
|
$
|
27.6
|
|
$
|
11.2
|
|
|||||
|
Purchase obligations
(2)
|
88.9
|
|
61.3
|
|
26.8
|
|
0.5
|
|
0.3
|
|
||||||||||
|
Total
|
$
|
218.1
|
|
$
|
98.8
|
|
$
|
79.7
|
|
$
|
28.1
|
|
$
|
11.5
|
|
|||||
|
(1)
|
Operating leases are primarily for office space and equipment used in our branch operations.
|
|
(2)
|
Purchase obligations include our estimate of the minimum outstanding commitments under purchase orders to buy goods and services and legally binding contractual arrangements with future payment obligations. Included in the total purchase obligations is
$16.0 million
of commitments to purchase capital assets. Amounts actually paid under certain of these arrangements may be different due to variable components of these agreements.
|
The liability for uncertain tax positions, including interest and net of federal benefits, was approximately
$29.8 million
as of
May 31, 2014
. Refer to Note I of the Notes to Consolidated Financial Statements, contained in Item 8 of this Form 10-K, for more information on income taxes. We are not able to reasonably estimate the timing of future cash flows related to this liability and have excluded it from the table above.
Certain deferred compensation plan obligations and other long-term liabilities reported in our Consolidated Balance Sheets amounting to
$56.6 million
are excluded from the table above because the timing of actual payments cannot be specifically or reasonably determined due to the variability in assumptions required to project the timing of future payments.
Advantage Payroll Services Inc. (“Advantage”) has license agreements with independently owned associate offices (“Associates”), which are responsible for selling and marketing Advantage payroll services and performing certain operational functions, while Paychex and Advantage provide all centralized back-office payroll processing and payroll tax administration services. Under these arrangements, Advantage pays the Associates commissions based on processing activity for the related clients. When we acquired Advantage, there were fifteen Associates. Over the past few years, arrangements with some Associates have been discontinued, and there are currently fewer than ten Associates. Since the actual amounts of future payments are uncertain, obligations under these arrangements are not included in the table above. Commission expense for the Associates for fiscal years
2014
,
2013
, and
2012
was
$14.4 million
,
$12.6 million
, and
$11.7 million
, respectively.
23
In the normal course of business, we make representations and warranties that guarantee the performance of services under service arrangements with clients. Historically, there have been no material losses related to such guarantees. In addition, we have entered into indemnification agreements with our officers and directors, which require us to defend and, if necessary, indemnify these individuals for certain pending or future legal claims as they relate to their services provided to us.
We currently self-insure the deductible portion of various insured exposures under certain employee benefit plans. Our estimated loss exposure under these insurance arrangements is recorded in other current liabilities on our Consolidated Balance Sheets. Historically, the amounts accrued have not been material and are not material as of the reporting date. We also maintain insurance coverage in addition to our purchased primary insurance policies for gap coverage for employment practices liability, errors and omissions, warranty liability, theft and embezzlement, cyber threats, and acts of terrorism; and capacity for deductibles and self-insured retentions through our captive insurance company.
Off-Balance Sheet Arrangements
As part of our ongoing business, we do not participate in transactions with unconsolidated entities which would have been established for the purpose of facilitating off-balance sheet arrangements or other limited purposes. We do maintain investments as a limited partner in low-income housing projects that are not considered part of our ongoing operations. These investments are accounted for under the equity method of accounting and are less than 1% of our total assets as of
May 31, 2014
.
Operating Cash Flow Activities
|
|
Year ended May 31,
|
|||||||||||
|
In millions
|
2014
|
2013
|
2012
|
|||||||||
|
Net income
|
$
|
627.5
|
|
$
|
569.0
|
|
$
|
548.0
|
|
|||
|
Non-cash adjustments to net income
|
198.6
|
|
183.3
|
|
175.1
|
|
||||||
|
Cash provided by/(used in) changes in operating assets and liabilities
|
54.8
|
|
(77.0
|
)
|
(16.5
|
)
|
||||||
|
Net cash provided by operating activities
|
$
|
880.9
|
|
$
|
675.3
|
|
$
|
706.6
|
|
|||
The increase in our operating cash flows for
fiscal 2014
compared to
fiscal 2013
is primarily the result of higher net income, adjusted for non-cash items, and fluctuations in our operating assets and liabilities. The decrease in our operating cash flows for
fiscal 2013
compared to
fiscal 2012
resulted mainly from fluctuations in operating assets and liabilities, partially offset by higher net income adjusted for non-cash items. Non-cash adjustments to net income increased for both years, driven largely by higher amortization of premiums on available-for-sale securities as the Company has increased its holdings of longer-duration investments. The fluctuations in our operating assets and liabilities between periods were primarily related to the timing of collections from clients and payments for compensation, PEO payroll, income tax, and other liabilities. Income taxes contributed significantly to these fluctuations as a result of a higher prepaid income tax position as of May 31, 2013 that arose from the federal benefit on the settlement of a state tax matter during fiscal 2013.
Investing Cash Flow Activities
|
|
Year ended May 31,
|
|||||||||||
|
In millions
|
2014
|
2013
|
2012
|
|||||||||
|
Net change in funds held for clients and corporate investment activities
|
$
|
(211.4
|
)
|
$
|
306.8
|
|
$
|
(1,147.4
|
)
|
|||
|
Purchases of property and equipment
|
(84.1
|
)
|
(98.7
|
)
|
(89.6
|
)
|
||||||
|
Acquisition of businesses, net of cash acquired
|
(9.3
|
)
|
(21.3
|
)
|
(6.0
|
)
|
||||||
|
Purchases of other assets
|
(11.3
|
)
|
(5.1
|
)
|
(1.3
|
)
|
||||||
|
Net cash (used in)/provided by investing activities
|
$
|
(316.1
|
)
|
$
|
181.7
|
|
$
|
(1,244.3
|
)
|
|||
Funds held for clients and corporate investments:
Funds held for clients consist of short-term funds and available-for-sale securities. Corporate investments are primarily comprised of available-for-sale securities. The portfolio of funds held for clients and corporate investments is detailed in Note E of the Notes to Consolidated Financial Statements, contained in Item 8 of this Form 10-K.
24
The fluctuation in the net change in funds held for clients and corporate investment activities is largely due to timing within the client funds portfolio. For
fiscal 2014
, there was not a significant fluctuation due to timing of fiscal year-ends. The net cash outflow for
fiscal 2014
is related to more purchases of short-term and available-for-sale securities resulting from higher average collections from clients. For fiscal 2013 and fiscal 2012, there was a significant timing impact. There was a large cash outflow on Friday,
May 31, 2013
that required the liquidation of funds held in the funds held for clients short-term cash equivalents portion of the portfolio, resulting in positive cash flow from investing activities for
fiscal 2013
. There was a large inflow of collections on Thursday, May 31, 2012 that was invested primarily in short-term investments on that date reflecting a large cash outflow from investing activities for fiscal 2012. See further discussion of this timing in the financing cash flows discussion of net change in client fund obligations. Our net cash inflow from funds held for clients and corporate investment activities for
fiscal 2013
was partially offset by higher purchases than sales of VRDN securities during the year.
In general, fluctuations in net funds held for clients and corporate investment activities primarily relate to timing of purchases, sales, or maturities of investments. The amount of funds held for clients will vary based upon the timing of collection of client funds, and the related remittance of funds to applicable tax or regulatory agencies for payroll tax administration services and to employees of clients utilizing employee payment services. Additional discussion of interest rates and related risks is included in the “Market Risk Factors” section, contained in Item 7A of this Form 10-K.
Purchases of long-lived assets:
To support our continued client and ancillary product growth, purchases of property and equipment were made for data processing equipment and software, and for the expansion and upgrade of various operating facilities. During fiscal years
2014
,
2013
, and
2012
, we purchased approximately
$4.7 million
,
$6.5 million
, and
$2.6 million
, respectively, of data processing equipment and software from EMC Corporation. The Chairman, President, and Chief Executive Officer of EMC Corporation is a member of our Board of Directors (the “Board”).
During fiscal years
2014
,
2013
, and
2012
, we paid, net of cash acquired,
$9.3 million
,
$21.3 million
, and
$6.0 million
, respectively, for immaterial business acquisitions.
Financing Cash Flow Activities
|
|
Year ended May 31,
|
|||||||||||
|
In millions, except per share amounts
|
2014
|
2013
|
2012
|
|||||||||
|
Net change in client fund obligations
|
$
|
127.4
|
|
$
|
(454.6
|
)
|
$
|
980.5
|
|
|||
|
Dividends paid
|
(510.6
|
)
|
(476.7
|
)
|
(460.5
|
)
|
||||||
|
Repurchases of common shares
|
(249.7
|
)
|
—
|
|
—
|
|
||||||
|
Equity activity related to stock-based awards
|
113.3
|
|
72.8
|
|
7.5
|
|
||||||
|
Net cash (used in)/provided by financing activities
|
$
|
(519.6
|
)
|
$
|
(858.5
|
)
|
$
|
527.5
|
|
|||
|
Cash dividends per common share
|
$
|
1.40
|
|
$
|
1.31
|
|
$
|
1.27
|
|
|||
Net change in client fund obligations:
The client fund obligations liability will vary based on the timing of collecting client funds, and the related required remittance of funds to applicable tax or regulatory agencies for payroll tax administration services and to employees of clients utilizing employee payment services. Collections from clients are typically remitted from one to 30 days after receipt, with some items extending to 90 days.
The fluctuations in net change in client fund obligations for the years presented is primarily the result of timing of collections and remittances.
May 31, 2014
fell on a Saturday and
May 31, 2013
fell on a Friday. Friday is a large cash outflow day for direct deposit funds, partially offset by tax payment funds collected on that day. Therefore, timing did not impact the net change in client obligations for fiscal 2014.
May 31, 2012
fell on a Thursday, which is a large collection day for direct pay funds. These funds were then paid out on Friday, June 1, 2012. Therefore, timing is the primary reason for the fluctuation in these amounts for fiscal 2013 and fiscal 2012. In addition, the fluctuations were impacted by overall trends in client fund balances, which were
4%
higher on average for
fiscal 2014
than
fiscal 2013
and
4%
higher on average for
fiscal 2013
than for
fiscal 2012
.
Dividends paid:
In July 2013, the Board increased our quarterly dividend to stockholders by 6% to $0.35 per share from $0.33 per share. In October 2012, the Board increased our quarterly dividend to stockholders by 3% to $0.33 per share from $0.32 per share. In October 2011, the Board increased our quarterly dividend by 3% to $0.32 per share from $0.31 per share. The dividends paid as a percentage of net income totaled
81%
,
84%
, and
84%
for fiscal years
2014
,
2013
, and
2012
, respectively. The payment of future dividends is dependent on our future earnings and cash flow, and is subject to the discretion of our Board.
25
Repurchases of common shares:
In October 2012, the Board approved a stock repurchase program to purchase up to
$350 million
of Paychex common stock, with authorization for this program expiring in May 2014. During
fiscal 2014
, we repurchased
6.2 million
shares for a total of
$249.7 million
. In May 2014, the Board approved a new program to repurchase up to
$350 million
of Paychex common stock, with authorization expiring in May 2017.
Equity activity related to stock-based awards:
The increase in activity related to stock-based awards for
fiscal 2014
compared to
fiscal 2013
was largely driven by an increase in proceeds from exercise of stock options. Common shares acquired through exercise of stock options were
3.4 million
shares,
2.4 million
shares, and
0.2 million
shares for fiscal years
2014
,
2013
, and
2012
, respectively. Refer to Note D of the Notes to Consolidated Financial Statements, contained in Item 8 of this Form 10-K, for additional disclosures on our stock-based compensation plans.
Other
Recently adopted accounting pronouncements:
Refer to Note A of the Notes to Consolidated Financial Statements, contained in Item 8 of this Form 10-K, for a discussion of recently adopted accounting pronouncements.
Recently issued accounting pronouncements:
Refer to Note A of the Notes to Consolidated Financial Statements, contained in Item 8 of this Form 10-K, for a discussion of recently issued accounting pronouncements.
Critical Accounting Policies
Note A of the Notes to Consolidated Financial Statements, contained in Item 8 of this Form 10-K, discusses the significant accounting policies of Paychex. Our discussion and analysis of our financial condition and results of operations are based upon our consolidated financial statements, which have been prepared in accordance with U.S. GAAP. The preparation of these financial statements requires us to make estimates, judgments, and assumptions that affect reported amounts of assets, liabilities, revenue, and expenses. On an ongoing basis, we evaluate the accounting policies and estimates used to prepare the consolidated financial statements. We base our estimates on historical experience, future expectations, and assumptions believed to be reasonable under current facts and circumstances. Actual amounts and results could differ from these estimates. Certain accounting policies that are deemed critical to our results of operations or financial position are discussed below.
Revenue recognition:
Service revenue is recognized in the period services are rendered and earned under service arrangements with clients where service fees are fixed or determinable and collectibility is reasonably assured. Certain processing services are provided under annual service arrangements with revenue recognized ratably over the service period. Our service revenue is largely attributable to processing services where the fee is based on a fixed amount per processing period or a fixed amount per processing period plus a fee per employee or transaction processed. The revenue earned from delivery service for the distribution of certain client payroll checks and reports is included in service revenue, and the costs for delivery are included in operating expenses on the Consolidated Statements of Income and Comprehensive Income.
For certain of our service offerings, we receive advance payments for set-up fees from our clients. We defer revenue associated with these advance payments and the related costs over the expected life of clients.
PEO revenue is included in service revenue and is reported net of certain direct costs billed and incurred, which include wages, taxes, and certain benefit premiums. In fiscal 2014, with the addition of a new health care offering within the PEO, direct costs related to certain benefit plans where the Company retains risk were classified as operating expenses rather than as a reduction in service revenue.
Interest on funds held for clients is earned primarily on funds that are collected from clients before due dates for payroll tax administration services and for employee payment services, and invested until remittance to the applicable tax or regulatory agencies or client employees. These collections from clients are typically remitted from one to 30 days after receipt, with some items extending to 90 days. The interest earned on these funds is included in total revenue on the Consolidated Statements of Income and Comprehensive Income because the collecting, holding, and remitting of these funds are critical components of providing these services. Interest on funds held for clients also includes net realized gains and losses from the sales of available-for-sale securities.
26
PEO insurance services:
As part of the PEO service, we offer workers’ compensation insurance and health insurance to client companies for the benefit of client employees. Workers' compensation insurance is provided under a fully insured high deductible workers’ compensation policy with a national insurance carrier. Workers’ compensation insurance reserves are established to provide for the estimated costs of paying claims up to per occurrence liability limits. In establishing the workers' compensation insurance reserves, we use an independent actuarial estimate of undiscounted future cash payments that would be made to settle the claims.
Estimating the ultimate cost of future claims is an uncertain and complex process based upon historical loss experience and actuarial loss projections, and is subject to change due to multiple factors, including economic trends, changes in legal liability law, and damage awards, all of which could materially impact the reserves as reported in the consolidated financial statements. Accordingly, workers' compensation final claim settlements may vary from the present estimates, particularly when those payments may not occur until well into the future.
With respect to our PEO health insurance, we offer various health insurance plans that take the form of either fully insured fixed cost plans with various national insurance carriers or a fully insured minimum premium insurance arrangement with coverage provided through a single national carrier. Under the minimum premium arrangement, our health benefits insurance reserves are established to provide for the payment of claims liability charges in accordance with our service contract with the carrier. The claims liability charges include estimates for reported losses, plus amounts for those claims incurred but not reported, and estimates of certain expenses associated with processing and settling the claims.
We regularly review the adequacy of our estimated insurance reserves. Adjustments to previously established reserves are reflected in the results of operations for the period in which the adjustment is identified. Such adjustments could possibly be significant, reflecting any variety of new and adverse or favorable trends.
Goodwill and other intangible assets:
Goodwill is not amortized, but instead is tested for impairment on an annual basis and between annual tests if an event occurs or circumstances change in a way to indicate that there has been a potential decline in the fair value of a reporting unit. We have the option to perform a qualitative assessment to determine if it is more-likely-than-not that the fair value of a reporting unit has declined below its carrying value. This assessment considers various financial, macroeconomic, industry, and reporting unit specific qualitative factors. Our business is largely homogeneous and, as a result, goodwill is associated with one reporting unit. We perform our annual impairment testing in our fiscal fourth quarter. Based on the results of our reviews, no impairment loss was recognized in the results of operations for fiscal years
2014
,
2013
, or
2012
. Subsequent to this review, there have been no events or circumstances that indicate any potential impairment of our goodwill balance.
We also test intangible assets for potential impairment when events or changes in circumstances indicate that the carrying value may not be recoverable.
Stock-based compensation costs:
All stock-based awards to employees, including grants of stock options, are recognized as compensation costs in our consolidated financial statements based on their fair values measured as of the date of grant. We estimate the fair value of stock option grants using a Black-Scholes option pricing model. This model requires various assumptions as inputs including expected volatility of the Paychex stock price and expected option life. We estimate volatility based on a combination of historical volatility using stock prices over a period equal to the expected option life and implied market volatility. Expected option life is estimated based on historical exercise behavior. We periodically reassess our assumptions as well as our choice of valuation model, and will reconsider use of this model if additional information becomes available in the future indicating that another model would provide a more accurate estimate of fair value, or if characteristics of future grants would warrant such a change.
We are required to estimate forfeitures and only record compensation costs for those awards that are expected to vest. Our assumptions for forfeitures were determined based on type of award and historical experience. Forfeiture assumptions are adjusted at the point in time a significant change is identified, with any adjustment recorded in the period of change, and the final adjustment at the end of the requisite service period to equal actual forfeitures.
The assumptions of volatility, expected option life, and forfeitures all require significant judgment and are subject to change in the future due to factors such as employee exercise behavior, stock price trends, and changes to type or provisions of stock-based awards. Any change in one or more of these assumptions could have a material impact on the estimated fair value of a future award.
Refer to Note D of the Notes to Consolidated Financial Statements, contained in Item 8 of this Form 10-K, for further discussion of our stock-based compensation plans.
27
Income taxes:
We account for deferred taxes by recognition of deferred tax assets and liabilities for the expected future tax consequences of events that have been included in the consolidated financial statements or tax returns. Under this method, deferred tax assets and liabilities are determined based on the difference between the financial statement and tax basis of assets and liabilities using enacted tax rates in effect for the year in which the differences are expected to reverse. We record a deferred tax asset related to the stock-based compensation costs recognized for certain stock-based awards. At the time of exercise of non-qualified stock options or vesting of stock awards, we account for the resulting tax deduction by reducing our accrued income tax liability with an offset to the deferred tax asset and any excess of the tax benefit over the deferred tax asset as an increase to additional paid-in capital. We currently have a sufficient pool of excess tax benefits in additional paid-in capital to absorb any deficiency in tax benefits that fall short of the related deferred tax asset related to stock-based awards.
We maintain a reserve for uncertain tax positions. We evaluate tax positions taken or expected to be taken in a tax return for recognition in our consolidated financial statements. Prior to recording the related tax benefit in our consolidated financial statements, we must conclude that tax positions will be more-likely-than-not to be sustained, assuming those positions will be examined by taxing authorities with full knowledge of all relevant information. The benefit recognized in our consolidated financial statements is the amount we expect to realize after examination by taxing authorities. If a tax position drops below the more-likely-than-not standard, the benefit can no longer be recognized. Assumptions, judgment, and the use of estimates are required in determining if the more-likely-than-not standard has been met when developing the provision for income taxes and in determining the expected benefit. A change in the assessment of the more-likely-than-not standard could materially impact our results of operations or financial position. Refer to Note I of the Notes to Consolidated Financial Statements, contained in Item 8 of this Form 10-K, for further discussion of our reserve for uncertain tax positions.
|
Item 7A.
|
Quantitative and Qualitative Disclosures About Market Risk
|
Market Risk Factors
Changes in interest rates and interest rate risk:
Funds held for clients are primarily comprised of short-term funds and available-for-sale securities. Corporate investments are primarily comprised of available-for-sale securities. As a result of our investing activities, we are exposed to changes in interest rates that may materially affect our results of operations and financial position. Changes in interest rates will impact the earnings potential of future investments and will cause fluctuations in the fair value of our longer-term available-for-sale securities. We follow an investment strategy of protecting principal and optimizing liquidity. A substantial portion of our portfolios is invested in high credit quality securities with AAA and AA ratings and A-1/P-1 ratings on short-term securities. We invest predominately in municipal bonds including general obligation bonds, pre-refunded bonds that are secured by a U.S. government escrow, and essential services revenue bonds. We limit the amounts that can be invested in any single issuer and invest in short- to intermediate-term instruments whose fair value is less sensitive to interest rate changes. We manage the available-for-sale securities to a benchmark duration of two and one-half to three and three-quarters years.
During
fiscal 2014
, our primary short-term investment vehicles were VRDNs and bank demand deposit accounts. We have no exposure to high-risk or illiquid investments such as auction rate securities, sub-prime mortgage securities, asset-backed securities or asset-backed commercial paper, collateralized debt obligations, enhanced cash or cash plus mutual funds, or structured investment vehicles (SIVs). We have insignificant exposure to European investments. We have not and do not utilize derivative financial instruments to manage our interest rate risk.
During
fiscal 2014
, the average interest rate earned on our combined funds held for clients and corporate investment portfolios was
1.0%
, compared with
1.0%
for
fiscal 2013
and
1.1%
for
fiscal 2012
. When interest rates are falling, the full impact of lower interest rates will not immediately be reflected in net income due to the interaction of short- and long-term interest rate changes. During a falling interest rate environment, the decreases in interest rates decrease earnings from our short-term investments, and over time decrease earnings from our longer-term available-for-sale securities. Earnings from the available-for-sale securities, which as of
May 31, 2014
had an average duration of
3.0
years, would not reflect decreases in interest rates until the investments are sold or mature and the proceeds are reinvested at lower rates. In the next twelve months, approximately
15%
of our available-for-sale portfolio will mature, and it is currently anticipated that these proceeds will be reinvested at a lower average interest rate of approximately
1.6%
.
The amortized cost and fair value of available-for-sale securities that had stated maturities as of
May 31, 2014
are shown below by contractual maturity. Expected maturities can differ from contractual maturities because borrowers may have the right to prepay obligations without prepayment penalties.
28
|
|
May 31, 2014
|
|||||||
|
In millions
|
Amortized
cost
|
Fair
value
|
||||||
|
Maturity date:
|
||||||||
|
Due in one year or less
|
$
|
392.0
|
|
$
|
394.3
|
|
||
|
Due after one year through three years
|
759.8
|
|
776.0
|
|
||||
|
Due after three years through five years
|
764.1
|
|
774.3
|
|
||||
|
Due after five years
|
1,441.0
|
|
1,446.8
|
|
||||
|
Total
|
$
|
3,356.9
|
|
$
|
3,391.4
|
|
||
VRDNs are primarily categorized as due after five years in the table above as the contractual maturities on these securities are typically 20 to 30 years. Although these securities are issued as long-term securities, they are priced and traded as short-term instruments because of the liquidity provided through the tender feature.
The Federal Funds rate remained at a range of zero to 0.25% throughout fiscal years
2014
,
2013
, and
2012
.
Calculating the future effects of changing interest rates involves many factors. These factors include, but are not limited to:
|
•
|
daily interest rate changes;
|
|
•
|
seasonal variations in investment balances;
|
|
•
|
actual duration of short-term and available-for-sale securities;
|
|
•
|
the proportion of taxable and tax-exempt investments;
|
|
•
|
changes in tax-exempt municipal rates versus taxable investment rates, which are not synchronized or simultaneous; and
|
|
•
|
financial market volatility and the resulting effect on benchmark and other indexing interest rates.
|
Subject to these factors and under normal financial market conditions, a 25-basis-point change in taxable interest rates generally affects our tax-exempt interest rates by approximately 17 basis points. Under normal financial market conditions, the impact to earnings from a 25-basis-point change in short-term interest rates would be approximately
$4.5 million
, after taxes, for a twelve-month period. Such a basis point change may or may not be tied to changes in the Federal Funds rate.
Our total investment portfolio (funds held for clients and corporate investments) averaged approximately
$4.8 billion
for
fiscal 2014
. Our anticipated allocation is approximately 45% invested in short-term securities and VRDNs with an average duration of less than 30 days, and 55% invested in available-for-sale securities with an average duration of two and one-half to three and three-quarters years.
The combined funds held for clients and corporate available-for-sale securities reflected a net unrealized gain of
$34.5 million
as of
May 31, 2014
, compared with an unrealized gain of
$34.7 million
as of
May 31, 2013
. Refer to Note F of the Notes to Consolidated Financial Statements, contained in Item 8 of this Form 10-K, for additional disclosures on fair value.
During
fiscal 2014
, the net unrealized gain/(loss) on our investment portfolios ranged from an unrealized loss of
$12.8 million
to an unrealized gain of
$42.7 million
. During
fiscal 2013
, the net unrealized gain on our investment portfolios ranged from
$34.7 million
to
$64.1 million
. The net unrealized gain on our investment portfolios was approximately
$26.9 million
as of
July 16, 2014
.
As of
May 31, 2014
and
2013
, we had
$3.4 billion
and
$3.7 billion
, respectively, invested in available-for-sale securities at fair value. The weighted-average yield-to-maturity was
1.6%
and
1.8%
as of
May 31, 2014
and
2013
, respectively. The weighted-average yield-to-maturity excludes available-for-sale securities tied to short-term interest rates such as the VRDNs. Assuming a hypothetical decrease in both short-term and longer-term interest rates of 25 basis points, the resulting potential increase in fair value for our portfolio of available-for-sale securities as of
May 31, 2014
, would be approximately
$20.0 million
. Conversely, a corresponding increase in interest rates would result in a comparable decrease in fair value. This hypothetical increase or decrease in the fair value of the portfolio would be recorded as an adjustment to the portfolio’s recorded value, with an offsetting amount recorded in stockholders’ equity. These fluctuations in fair value would have no related or immediate impact on the results of operations, unless any declines in fair value were considered to be other-than-temporary and an impairment loss recognized.
29
Credit risk:
We are exposed to credit risk in connection with these investments through the possible inability of borrowers to meet the terms of their bonds. We regularly review our investment portfolios to determine if any investment is other-than-temporarily impaired due to changes in credit risk or other potential valuation concerns. We believe that the investments we held as of
May 31, 2014
were not other-than-temporarily impaired. While
$395.2 million
of our available-for-sale securities had fair values that were below amortized cost, we believe that it is probable that the principal and interest will be collected in accordance with the contractual terms, and that the unrealized loss of
$3.0 million
was due to changes in interest rates and was not due to increased credit risk or other valuation concerns. Substantially all of the securities in an unrealized loss position as of
May 31, 2014
and
2013
held an AA rating or better. We do not currently intend to sell these investments until the recovery of their amortized cost basis or maturity, and further believe that it is not more-likely-than-not that we will be required to sell these investments prior to that time. Our assessment that an investment is not other-than-temporarily impaired could change in the future due to new developments or changes in our strategies or assumptions related to any particular investment.
|
Item 8.
|
Financial Statements and Supplementary Data
|
TABLE OF CONTENTS
|
Description
|
Page
|
|
|
Report on Management’s Assessment of Internal Control Over Financial Reporting
|
31
|
|
|
Reports of Independent Registered Public Accounting Firms
|
32
|
|
|
Consolidated Statements of Income and Comprehensive Income for the Years Ended May 31, 2014, 2013, and 2012
|
34
|
|
|
Consolidated Balance Sheets as of May 31, 2014 and 2013
|
35
|
|
|
Consolidated Statements of Stockholders’ Equity for the Years Ended May 31, 2014, 2013, and 2012
|
36
|
|
|
Consolidated Statements of Cash Flows for the Years Ended May 31, 2014, 2013, and 2012
|
37
|
|
|
Notes to Consolidated Financial Statements
|
38
|
|
|
Schedule II — Valuation and Qualifying Accounts for the Years Ended May 31, 2014, 2013, and 2012
|
59
|
|
30
REPORT ON MANAGEMENT’S ASSESSMENT OF
INTERNAL CONTROL OVER FINANCIAL REPORTING
Management of Paychex, Inc. (the “Company”) is responsible for establishing and maintaining adequate internal control over financial reporting as such term is defined in Rules 13a-15(f) and 15d-15(f) under the Securities Exchange Act of 1934, as amended. The Company’s internal control over financial reporting is designed to provide reasonable assurance regarding the reliability of financial reporting and the preparation of the financial statements for external purposes in accordance with generally accepted accounting principles.
Because of its inherent limitations, internal control over financial reporting may not prevent or detect misstatements. Also, projections of any evaluation of effectiveness to future periods are subject to the risk that controls may become inadequate because of changes in conditions, or that the degree of compliance with the policies or procedures may deteriorate.
Management assessed the effectiveness of the Company’s internal control over financial reporting as of
May 31, 2014
. In making this assessment, management used the criteria set forth by the Committee of Sponsoring Organizations of the Treadway Commission in “Internal Control — Integrated Framework” (1992). Based on our assessment, management determined that the Company maintained effective internal control over financial reporting as of
May 31, 2014
.
The Company’s independent registered public accounting firm, PricewaterhouseCoopers LLP, is appointed by the Company’s Audit Committee. PricewaterhouseCoopers LLP has audited the Consolidated Financial Statements included in this Annual Report on Form 10-K and the effectiveness of the Company's internal control over financial reporting as of
May 31, 2014
, and as a part of their integrated audit, has issued their report, included herein, on the effectiveness of the Company’s internal control over financial reporting.
|
/s/ Martin Mucci
Martin Mucci
President and Chief Executive Officer
|
|
/s/ Efrain Rivera
Efrain Rivera
Senior Vice President, Chief Financial Officer, and Treasurer
|
31
REPORT OF INDEPENDENT REGISTERED PUBLIC ACCOUNTING FIRM
To the Board of Directors and Stockholders of Paychex, Inc.
In our opinion, the accompanying consolidated balance sheet as of May 31, 2014 and the related consolidated
statements of income and comprehensive income, of stockholders’ equity, and of cash flows for the year then ended present fairly, in all material respects, the financial position of Paychex, Inc. and its subsidiaries as of May 31, 2014, and the results of their operations and their cash flows for the year then ended in conformity with accounting principles generally accepted in the United States of America. In addition, in our opinion, the financial statement schedule listed in the index appearing under Item 8 for the year ended May 31, 2014 presents fairly, in all material respects, the information set forth therein when read in conjunction with the related consolidated financial statements. Also in our opinion, the Company maintained, in all material respects, effective internal control over financial reporting as of May 31, 2014, based on criteria established in
Internal Control - Integrated Framework (1992)
issued by the Committee of Sponsoring Organizations of the Treadway Commission (COSO). The Company's management is responsible for these financial statements and financial statement schedule, for maintaining effective internal control over financial reporting and for its assessment of the effectiveness of internal control over financial reporting, included in the accompanying
Report on Management’s Assessment of Internal Control Over Financial Reporting. Our responsibility is to express opinions on these financial statements, on the financial statement schedule, and on the Company's internal control over financial reporting based on our integrated audit. We conducted our audit in accordance with the standards of the Public Company Accounting Oversight Board (United States). Those standards require that we plan and perform the audit to obtain reasonable assurance about whether the financial statements are free of material misstatement and whether effective internal control over financial reporting was maintained in all material respects. Our audit of the financial statements included examining, on a test basis, evidence supporting the amounts and disclosures in the financial statements, assessing the accounting principles used and significant estimates made by management, and evaluating the overall financial statement presentation. Our audit of internal control over financial reporting included obtaining an understanding of internal control over financial reporting, assessing the risk that a material weakness exists, and testing and evaluating the design and operating effectiveness of internal control based on the assessed risk. Our audit also included performing such other procedures as we considered necessary in the circumstances. We believe that our audit provides a reasonable basis for our opinions.
A company’s internal control over financial reporting is a process designed to provide reasonable assurance regarding the reliability of financial reporting and the preparation of financial statements for external purposes in accordance with generally accepted accounting principles. A company’s internal control over financial reporting includes those policies and procedures that (i) pertain to the maintenance of records that, in reasonable detail, accurately and fairly reflect the transactions and dispositions of the assets of the company; (ii) provide reasonable assurance that transactions are recorded as necessary to permit preparation of financial statements in accordance with generally accepted accounting principles, and that receipts and expenditures of the company are being made only in accordance with authorizations of management and directors of the company; and (iii) provide reasonable assurance regarding prevention or timely detection of unauthorized acquisition, use, or disposition of the company’s assets that could have a material effect on the financial statements.
Because of its inherent limitations, internal control over financial reporting may not prevent or detect misstatements. Also, projections of any evaluation of effectiveness to future periods are subject to the risk that controls may become inadequate because of changes in conditions, or that the degree of compliance with the policies or procedures may deteriorate.
/s/ PricewaterhouseCoopers LLP
PricewaterhouseCoopers LLP
Rochester, New York
July 22, 2014
32
REPORT OF INDEPENDENT REGISTERED PUBLIC ACCOUNTING FIRM
The Board of Directors
and Stockholders of Paychex, Inc.
We have audited the accompanying consolidated balance sheet of Paychex, Inc. as of May 31, 2013, and the related consolidated statements of income and comprehensive income, stockholders’ equity, and cash flows for each of the two years in the period ended May 31, 2013. Our audits also included the financial statement schedules listed in the Index at Item 15(a) for the years ended May 31, 2013 and 2012. These financial statements and schedules are the responsibility of the Company's management. Our responsibility is to express an opinion on these financial statements and schedules based on our audits.
We conducted our audits in accordance with the standards of the Public Company Accounting Oversight Board (United States). Those standards require that we plan and perform the audit to obtain reasonable assurance about whether the financial statements are free of material misstatement. An audit includes examining, on a test basis, evidence supporting the amounts and disclosures in the financial statements. An audit also includes assessing the accounting principles used and significant estimates made by management, as well as evaluating the overall financial statement presentation. We believe that our audits provide a reasonable basis for our opinion.
In our opinion, the financial statements referred to above present fairly, in all material respects, the consolidated financial position of Paychex, Inc. at May 31, 2013, and the consolidated results of its operations and its cash flows for each of the two years in the period ended May 31, 2013, in conformity with U.S. generally accepted accounting principles. Also, in our opinion, the related financial statement schedules for the years ended May 31, 2013 and 2012, when considered in relation to the basic financial statements taken as a whole, present fairly in all material respects the information set forth therein.
/s/ Ernst & Young LLP
Rochester, New York
July 22, 2013
33
PAYCHEX, INC.
In millions, except per share amounts
|
Year ended May 31,
|
2014
|
2013
|
2012
|
|||||||||
|
Revenue:
|
||||||||||||
|
Service revenue
|
$
|
2,478.2
|
|
$
|
2,285.2
|
|
$
|
2,186.2
|
|
|||
|
Interest on funds held for clients
|
40.7
|
|
41.0
|
|
43.6
|
|
||||||
|
Total revenue
|
2,518.9
|
|
2,326.2
|
|
2,229.8
|
|
||||||
|
Expenses:
|
||||||||||||
|
Operating expenses
|
732.5
|
|
671.3
|
|
670.1
|
|
||||||
|
Selling, general and administrative expenses
|
803.7
|
|
750.1
|
|
705.8
|
|
||||||
|
Total expenses
|
1,536.2
|
|
1,421.4
|
|
1,375.9
|
|
||||||
|
Operating income
|
982.7
|
|
904.8
|
|
853.9
|
|
||||||
|
Investment income, net
|
5.4
|
|
6.6
|
|
6.4
|
|
||||||
|
Income before income taxes
|
988.1
|
|
911.4
|
|
860.3
|
|
||||||
|
Income taxes
|
360.6
|
|
342.4
|
|
312.3
|
|
||||||
|
Net income
|
$
|
627.5
|
|
$
|
569.0
|
|
$
|
548.0
|
|
|||
|
Other comprehensive (loss)/income, net of tax:
|
||||||||||||
|
Unrealized (losses)/gains on securities, net of tax
|
(0.5
|
)
|
(15.7
|
)
|
0.2
|
|
||||||
|
Total other comprehensive (loss)/income, net of tax
|
(0.5
|
)
|
(15.7
|
)
|
0.2
|
|
||||||
|
Comprehensive income
|
$
|
627.0
|
|
$
|
553.3
|
|
$
|
548.2
|
|
|||
|
Basic earnings per share
|
$
|
1.72
|
|
$
|
1.56
|
|
$
|
1.51
|
|
|||
|
Diluted earnings per share
|
$
|
1.71
|
|
$
|
1.56
|
|
$
|
1.51
|
|
|||
|
Weighted-average common shares outstanding
|
364.5
|
|
363.8
|
|
362.4
|
|
||||||
|
Weighted-average common shares outstanding, assuming dilution
|
366.1
|
|
364.7
|
|
363.0
|
|
||||||
|
Cash dividends per common share
|
$
|
1.40
|
|
$
|
1.31
|
|
$
|
1.27
|
|
|||
See Notes to Consolidated Financial Statements.
34
PAYCHEX, INC.
In millions, except per share amount
|
As of May 31,
|
2014
|
2013
|
||||||
|
Assets
|
||||||||
|
Cash and cash equivalents
|
$
|
152.5
|
|
$
|
107.3
|
|
||
|
Corporate investments
|
398.7
|
|
398.2
|
|
||||
|
Interest receivable
|
36.3
|
|
32.4
|
|
||||
|
Accounts receivable, net of allowance for doubtful accounts
|
149.4
|
|
133.4
|
|
||||
|
Deferred income taxes
|
12.0
|
|
2.3
|
|
||||
|
Prepaid income taxes
|
17.2
|
|
49.9
|
|
||||
|
Prepaid expenses and other current assets
|
46.7
|
|
36.6
|
|
||||
|
Current assets before funds held for clients
|
812.8
|
|
760.1
|
|
||||
|
Funds held for clients
|
4,198.6
|
|
4,072.5
|
|
||||
|
Total current assets
|
5,011.4
|
|
4,832.6
|
|
||||
|
Long-term corporate investments
|
385.6
|
|
369.1
|
|
||||
|
Property and equipment, net of accumulated depreciation
|
342.2
|
|
346.0
|
|
||||
|
Intangible assets, net of accumulated amortization
|
40.6
|
|
45.2
|
|
||||
|
Goodwill
|
540.3
|
|
533.9
|
|
||||
|
Deferred income taxes
|
37.1
|
|
34.1
|
|
||||
|
Other long-term assets
|
12.9
|
|
2.8
|
|
||||
|
Total assets
|
$
|
6,370.1
|
|
$
|
6,163.7
|
|
||
|
Liabilities
|
||||||||
|
Accounts payable
|
$
|
48.8
|
|
$
|
42.7
|
|
||
|
Accrued compensation and related items
|
171.7
|
|
138.2
|
|
||||
|
Deferred revenue
|
6.9
|
|
5.2
|
|
||||
|
Deferred income taxes
|
6.6
|
|
8.1
|
|
||||
|
Other current liabilities
|
37.8
|
|
34.3
|
|
||||
|
Current liabilities before client fund obligations
|
271.8
|
|
228.5
|
|
||||
|
Client fund obligations
|
4,167.1
|
|
4,039.7
|
|
||||
|
Total current liabilities
|
4,438.9
|
|
4,268.2
|
|
||||
|
Accrued income taxes
|
28.6
|
|
19.7
|
|
||||
|
Deferred income taxes
|
69.0
|
|
53.3
|
|
||||
|
Other long-term liabilities
|
56.6
|
|
48.8
|
|
||||
|
Total liabilities
|
4,593.1
|
|
4,390.0
|
|
||||
|
Commitments and contingencies — Note M
|
|
|
|
|
||||
|
Stockholders’ equity
|
||||||||
|
Common stock, $0.01 par value; Authorized: 600.0 shares;
Issued and outstanding: 363.0 shares as of May 31, 2014,
and 365.4 shares as of May 31, 2013, respectively
|
3.6
|
|
3.7
|
|
||||
|
Additional paid-in capital
|
794.4
|
|
659.5
|
|
||||
|
Retained earnings
|
957.5
|
|
1,088.5
|
|
||||
|
Accumulated other comprehensive income
|
21.5
|
|
22.0
|
|
||||
|
Total stockholders’ equity
|
1,777.0
|
|
1,773.7
|
|
||||
|
Total liabilities and stockholders’ equity
|
$
|
6,370.1
|
|
$
|
6,163.7
|
|
||
See Notes to Consolidated Financial Statements.
35
PAYCHEX, INC.
CONSOLIDATED STATEMENTS OF STOCKHOLDERS’ EQUITY
In millions
|
|
Common stock
|
Additional
paid-in
capital
|
Retained
earnings
|
Accumulated
other
comprehensive
income
|
|
||||||||||||||||||
|
|
Shares
|
Amount
|
Total
|
||||||||||||||||||||
|
Balance as of May 31, 2011
|
362.1
|
|
$
|
3.6
|
|
$
|
535.6
|
|
$
|
919.5
|
|
$
|
37.5
|
|
$
|
1,496.2
|
|
||||||
|
Net income
|
548.0
|
|
548.0
|
|
|||||||||||||||||||
|
Unrealized gains on securities, net of tax
|
0.2
|
|
0.2
|
|
|||||||||||||||||||
|
Cash dividends declared
|
(460.5
|
)
|
(460.5
|
)
|
|||||||||||||||||||
|
Stock-based compensation
|
23.1
|
|
23.1
|
|
|||||||||||||||||||
|
Stock-based award transactions
|
0.5
|
|
2.4
|
|
(4.9
|
)
|
(2.5
|
)
|
|||||||||||||||
|
Balance as of May 31, 2012
|
362.6
|
|
3.6
|
|
561.1
|
|
1,002.1
|
|
37.7
|
|
1,604.5
|
|
|||||||||||
|
Net income
|
569.0
|
|
569.0
|
|
|||||||||||||||||||
|
Unrealized losses on securities, net of tax
|
(15.7
|
)
|
(15.7
|
)
|
|||||||||||||||||||
|
Cash dividends declared
|
(476.7
|
)
|
(476.7
|
)
|
|||||||||||||||||||
|
Stock-based compensation
|
22.9
|
|
22.9
|
|
|||||||||||||||||||
|
Stock-based award transactions
|
2.8
|
|
0.1
|
|
75.5
|
|
(5.9
|
)
|
69.7
|
|
|||||||||||||
|
Balance as of May 31, 2013
|
365.4
|
|
3.7
|
|
659.5
|
|
1,088.5
|
|
22.0
|
|
1,773.7
|
|
|||||||||||
|
Net income
|
627.5
|
|
627.5
|
|
|||||||||||||||||||
|
Unrealized losses on securities, net of tax
|
(0.5
|
)
|
(0.5
|
)
|
|||||||||||||||||||
|
Cash dividends declared
|
(510.6
|
)
|
(510.6
|
)
|
|||||||||||||||||||
|
Repurchases of common shares
|
(6.2
|
)
|
(0.1
|
)
|
(11.2
|
)
|
(238.4
|
)
|
(249.7
|
)
|
|||||||||||||
|
Stock-based compensation
|
26.4
|
|
26.4
|
|
|||||||||||||||||||
|
Stock-based award transactions
|
3.8
|
|
119.7
|
|
(9.5
|
)
|
110.2
|
|
|||||||||||||||
|
Balance as of May 31, 2014
|
363.0
|
|
$
|
3.6
|
|
$
|
794.4
|
|
$
|
957.5
|
|
$
|
21.5
|
|
$
|
1,777.0
|
|
||||||
See Notes to Consolidated Financial Statements.
36
PAYCHEX, INC.
In millions
|
Year ended May 31,
|
2014
|
2013
|
2012
|
|||||||||
|
Operating activities
|
||||||||||||
|
Net income
|
$
|
627.5
|
|
$
|
569.0
|
|
$
|
548.0
|
|
|||
|
Adjustments to reconcile net income to net cash provided by operating activities:
|
||||||||||||
|
Depreciation and amortization on property and equipment and intangible assets
|
105.0
|
|
98.2
|
|
97.8
|
|
||||||
|
Amortization of premiums and discounts on available-for-sale securities
|
70.3
|
|
56.2
|
|
42.5
|
|
||||||
|
Stock-based compensation costs
|
26.3
|
|
22.8
|
|
22.9
|
|
||||||
|
(Benefit)/provision for deferred income taxes
|
(4.9
|
)
|
5.3
|
|
11.7
|
|
||||||
|
Provision for allowance for doubtful accounts
|
2.5
|
|
1.7
|
|
1.2
|
|
||||||
|
Net realized gains on sales of available-for-sale securities
|
(0.6
|
)
|
(0.9
|
)
|
(1.0
|
)
|
||||||
|
Changes in operating assets and liabilities:
|
||||||||||||
|
Interest receivable
|
(3.9
|
)
|
(1.8
|
)
|
(1.2
|
)
|
||||||
|
Accounts receivable
|
(18.2
|
)
|
8.3
|
|
17.6
|
|
||||||
|
Prepaid expenses and other current assets
|
22.5
|
|
(45.6
|
)
|
(9.4
|
)
|
||||||
|
Accounts payable and other current liabilities
|
45.1
|
|
(16.6
|
)
|
(26.9
|
)
|
||||||
|
Net change in other assets and liabilities
|
9.3
|
|
(21.3
|
)
|
3.4
|
|
||||||
|
Net cash provided by operating activities
|
880.9
|
|
675.3
|
|
706.6
|
|
||||||
|
Investing activities
|
||||||||||||
|
Purchases of available-for-sale securities
|
(29,850.5
|
)
|
(28,332.8
|
)
|
(10,180.5
|
)
|
||||||
|
Proceeds from sales and maturities of available-for-sale securities
|
30,080.6
|
|
27,620.2
|
|
9,817.4
|
|
||||||
|
Net change in funds held for clients’ money market securities and other cash equivalents
|
(441.5
|
)
|
1,019.4
|
|
(784.3
|
)
|
||||||
|
Purchases of property and equipment
|
(84.1
|
)
|
(98.7
|
)
|
(89.6
|
)
|
||||||
|
Acquisition of businesses, net of cash acquired
|
(9.3
|
)
|
(21.3
|
)
|
(6.0
|
)
|
||||||
|
Purchases of other assets
|
(11.3
|
)
|
(5.1
|
)
|
(1.3
|
)
|
||||||
|
Net cash (used in)/provided by investing activities
|
(316.1
|
)
|
181.7
|
|
(1,244.3
|
)
|
||||||
|
Financing activities
|
||||||||||||
|
Net change in client fund obligations
|
127.4
|
|
(454.6
|
)
|
980.5
|
|
||||||
|
Dividends paid
|
(510.6
|
)
|
(476.7
|
)
|
(460.5
|
)
|
||||||
|
Repurchases of common shares
|
(249.7
|
)
|
—
|
|
—
|
|
||||||
|
Equity activity related to stock-based awards
|
113.3
|
|
72.8
|
|
7.5
|
|
||||||
|
Net cash (used in)/provided by financing activities
|
(519.6
|
)
|
(858.5
|
)
|
527.5
|
|
||||||
|
Increase/(decrease) in cash and cash equivalents
|
45.2
|
|
(1.5
|
)
|
(10.2
|
)
|
||||||
|
Cash and cash equivalents, beginning of fiscal year
|
107.3
|
|
108.8
|
|
119.0
|
|
||||||
|
Cash and cash equivalents, end of fiscal year
|
$
|
152.5
|
|
$
|
107.3
|
|
$
|
108.8
|
|
|||
See Notes to Consolidated Financial Statements.
37
PAYCHEX, INC.
NOTES TO CONSOLIDATED FINANCIAL STATEMENTS
Note A — Description of Business, Basis of Presentation, and Significant Accounting Policies
Description of business:
Paychex, Inc. and its wholly owned subsidiaries (the “Company” or “Paychex”) is a leading provider of integrated payroll, human resource, insurance, and benefits outsourcing solutions for small- to medium-sized businesses in the United States (“U.S.”). The Company also has a subsidiary in Germany.
Paychex, a Delaware corporation formed in 1979, reports as one segment. Substantially all of the Company’s revenue is generated within the U.S. The Company also generates revenue within Germany, which was less than one percent of its total revenue for each of the years ended
May 31, 2014
(“
fiscal 2014
”),
2013
(“
fiscal 2013
”), and
2012
(“
fiscal 2012
”). Long-lived assets in Germany are insignificant in relation to total long-lived assets of the Company as of
May 31, 2014
and
May 31, 2013
.
Total revenue is comprised of service revenue and interest on funds held for clients. Service revenue is comprised primarily of the payroll and Human Resource Services (“HRS”) portfolios of services and products. Payroll service revenue is earned primarily from payroll processing, payroll tax administration services, employee payment services, and other ancillary services. Payroll processing services include the calculation, preparation, and delivery of employee payroll checks; production of internal accounting records and management reports; preparation of federal, state, and local payroll tax returns; and collection and remittance of clients’ payroll obligations.
In connection with the automated payroll tax administration services, the Company electronically collects payroll taxes from clients’ bank accounts, typically on payday, prepares and files the applicable tax returns, and remits taxes to the applicable tax or regulatory agencies on the respective due dates. These taxes are typically paid between one and 30 days after receipt of collections from clients, with some items extending to 90 days. The Company handles regulatory correspondence, amendments, and penalty and interest disputes, and is subject to cash penalties imposed by tax or regulatory agencies for late filings and late or under payment of taxes. With employee payment services, employers are offered the option of paying their employees by direct deposit, payroll debit card, a check drawn on a Paychex account (Readychex
®
), or a check drawn on the employer’s account and electronically signed by Paychex. For the first three methods, Paychex electronically collects net payroll from the clients’ bank accounts, typically one business day before payday, and provides payment to the employees on payday.
In addition to service fees paid by clients, the Company earns interest on funds held for clients that are collected before due dates and invested until remittance to the applicable tax or regulatory agencies or client employees. The funds held for clients and related client fund obligations are included in the Consolidated Balance Sheets as current assets and current liabilities, respectively. The amount of funds held for clients and related client fund obligations varies significantly during the year.
The HRS portfolio of services and products provides small- to medium-sized businesses with retirement services administration, insurance services, online HR administration services, and other human resource services and products. Paychex HR Services is available through Paychex HR Solutions, an administrative services organization (“ASO” ), and Paychex PEO, a professional employer organization (“PEO”). Both options offer businesses a combined package of services that includes payroll, employer compliance, human resource and employee benefits administration, risk management outsourcing, and the on-site availability of a professionally trained human resource services representative, among other services. These comprehensive bundles of services are designed to make it easier for businesses to manage their payroll and related benefits costs while providing a benefits package equal to that of larger companies. The PEO differs from the ASO in that Paychex serves as a co-employer of the clients’ employees, offers health care coverage to PEO client employees, and assumes the risks and rewards of workers’ compensation insurance and certain health insurance products. PEO services are sold through the Company’s registered and licensed subsidiary, Paychex Business Solutions, Inc. Paychex HR Essentials is an ASO product that provides support to the Company’s clients over the phone or online to help manage employee-related topics.
Basis of presentation:
The consolidated financial statements include the accounts of Paychex, Inc. and its wholly owned subsidiaries. All intercompany accounts and transactions have been eliminated in consolidation. The Company has evaluated subsequent events for potential recognition and/or disclosure through the date of issuance of these financial statements.
Cash and cash equivalents:
Cash and cash equivalents consist of available cash, money market securities, and other investments with a maturity of three months or less at acquisition.
38
Accounts receivable, net of allowance for doubtful accounts:
Accounts receivable balances are shown on the Consolidated Balance Sheets net of the allowance for doubtful accounts of
$1.5 million
as of
May 31, 2014
and
$1.0 million
as of
May 31, 2013
. Accounts receivable are written off and charged against the allowance for doubtful accounts when the Company has exhausted all collection efforts without success. No single client had a material impact on total accounts receivable, service revenue, or results of operations.
Funds held for clients and corporate investments:
Marketable securities included in funds held for clients and corporate investments consist primarily of securities classified as available-for-sale and are recorded at fair value obtained from an independent pricing service. The funds held for clients portfolio also includes cash, money market securities, and short-term investments. Unrealized gains and losses, net of applicable income taxes, are reported as other comprehensive income in the Consolidated Statements of Income and Comprehensive Income. Realized gains and losses on the sale of available-for-sale securities are determined by specific identification of the cost basis of each security. On the Consolidated Statements of Income and Comprehensive Income, realized gains and losses from their respective portfolios are included in interest on funds held for clients and investment income, net.
Concentrations:
Substantially all of the Company’s deposited cash is maintained at large well-capitalized (as defined by their regulators) financial institutions. These deposits may exceed the amount of any insurance provided. All of the Company’s deliverable securities, primarily municipal bond securities, are held in custody with certain of the aforementioned financial institutions, for which that institution bears the risk of custodial loss. Non-deliverable securities, primarily time deposits and money market funds, are restricted to well-capitalized financial institutions.
Property and equipment, net of accumulated depreciation:
Property and equipment is stated at cost, less accumulated depreciation. Depreciation is based on the estimated useful lives of property and equipment using the straight-line method. The estimated useful lives of depreciable assets are generally:
|
Category
|
|
Depreciable life
|
|
Buildings and improvements
|
|
Ten to 35 years or the remaining life, whichever is shorter
|
|
Data processing equipment
|
|
Three to five years
|
|
Furniture, fixtures, and equipment
|
|
Three to seven years
|
|
Leasehold improvements
|
|
Ten years or the life of the lease, whichever is shorter
|
Normal and recurring repairs and maintenance costs are charged to expense as incurred. The Company reviews the carrying value of property and equipment for impairment when events or changes in circumstances indicate that the carrying value of such assets may not be recoverable.
Software development and enhancements:
Expenditures for software purchases and software developed for internal use are capitalized and depreciated on a straight-line basis over the estimated useful lives, which are generally three to five years. Software developed as part of the Company's main processing platform is depreciated over fifteen years. For software developed for internal use, certain costs are capitalized, including external direct costs of materials and services associated with developing or obtaining the software, and payroll and payroll-related costs for employees who are directly associated with internal-use software projects. Capitalization of these costs ceases no later than the point at which the project is substantially complete and ready for its intended use. Costs associated with preliminary project stage activities, training, maintenance, and other post-implementation stage activities are expensed as incurred. The carrying value of software and development costs is reviewed for impairment when events or changes in circumstances indicate that the carrying value of such assets may not be recoverable.
Goodwill and other intangible assets, net of accumulated amortization:
The Company has recorded goodwill in connection with the acquisitions of businesses. Goodwill is not amortized, but instead is tested for impairment on an annual basis and between annual tests if an event occurs or circumstances change in a way to indicate that there has been a potential decline in the fair value of a reporting unit. Impairment is determined by comparing the estimated fair value of a reporting unit to its carrying amount, including goodwill. The Company has the option to perform a qualitative assessment to determine if it is more-likely-than-not that the fair value of a reporting unit has declined below its carrying value. This assessment considers various financial, macroeconomic, industry, and reporting unit specific qualitative factors. The Company’s business is largely homogeneous and, as a result, goodwill is associated with one reporting unit. The Company performs its annual impairment testing in its fiscal fourth quarter. Based on the results of the Company’s reviews, no impairment loss was recognized in the results of operations for fiscal years
2014
,
2013
, or
2012
. Subsequent to the latest review, there have been no events or circumstances that indicate any potential impairment of the Company’s goodwill balance.
39
Intangible assets are comprised primarily of client list acquisitions and are reported net of accumulated amortization on the Consolidated Balance Sheets. Intangible assets are amortized over periods generally ranging from three to twelve years. Client lists use the sum of the years digits method, while other intangible assets use the straight-line method of amortization. The Company tests intangible assets for potential impairment when events or changes in circumstances indicate that the carrying value of such assets may not be recoverable.
Revenue recognition:
Service revenue is recognized in the period services are rendered and earned under service arrangements with clients where service fees are fixed or determinable and collectibility is reasonably assured. Certain processing services are provided under annual service arrangements with revenue recognized ratably over the service period. The Company’s service revenue is largely attributable to processing services where the fee is based on a fixed amount per processing period or a fixed amount per processing period plus a fee per employee or transaction processed. The revenue earned from delivery service for the distribution of certain client payroll checks and reports is included in service revenue, and the costs for the delivery are included in operating expenses on the Consolidated Statements of Income and Comprehensive Income.
For certain of the Company's service offerings, it receives advance payments for set-up fees from its clients. The Company defers revenue associated with these advance payments and the related costs over the expected life of its clients.
PEO revenue is included in service revenue and is reported net of certain direct pass-through costs billed and incurred, which primarily include payroll wages, payroll taxes, and certain benefit premiums. In fiscal 2014, with the addition of a new health care offering within the PEO, direct costs related to certain benefit plans where the Company retains risk were classified as operating expenses rather than as a reduction in service revenue. Direct pass-through costs billed and incurred that were a reduction in service revenue were
$3.4 billion
,
$3.0 billion
, and
$3.3 billion
for fiscal years 2014, 2013, and 2012, respectively.
Interest on funds held for clients is earned primarily on funds that are collected from clients before due dates for payroll tax administration services and for employee payment services, and invested until remittance to the applicable tax or regulatory agencies or client employees. The interest earned on these funds is included in total revenue on the Consolidated Statements of Income and Comprehensive Income because the collecting, holding, and remitting of these funds are components of providing these services. Interest on funds held for clients also includes net realized gains and losses from the sales of available-for-sale securities.
PEO insurance services:
As part of the PEO service, the Company offers workers’ compensation insurance and health insurance to client companies for the benefit of client employees. Workers' compensation insurance is provided under a fully insured high deductible workers’ compensation policy with a national insurance carrier. Workers’ compensation insurance reserves are established to provide for the estimated costs of paying claims up to per occurrence liability limits. In establishing the workers' compensation insurance reserves, the Company uses an independent actuarial estimate of undiscounted future cash payments that would be made to settle the claims.
Estimating the ultimate cost of future claims is an uncertain and complex process based upon historical loss experience and actuarial loss projections, and is subject to change due to multiple factors, including economic trends, changes in legal liability law, and damage awards, all of which could materially impact the reserves as reported in the consolidated financial statements. Accordingly, workers' compensation insurance final claim settlements may vary from the present estimates, particularly when those payments may not occur until well into the future.
The Company’s maximum individual claims liability was $1.0 million under both its fiscal 2014 and fiscal 2013 workers' compensation policies. As of May 31, 2014 and May 31, 2013, the Company had recorded current liabilities of
$8.5 million
and
$6.8 million
, respectively, and long-term liabilities of
$16.0 million
and
$13.7 million
, respectively, on its Consolidated Balance Sheets for workers’ compensation costs.
With respect to the PEO health insurance, the Company offers various health insurance plans that take the form of either fully insured fixed cost plans with various national insurance carriers or a fully insured minimum premium insurance arrangement with coverage provided through a single national carrier. Under the minimum premium arrangement, the Company's health benefits insurance reserves are established to provide for the payment of claims liability charges in accordance with its service contract with the carrier. The claims liability charges include estimates for reported losses, plus amounts for those claims incurred but not reported, and estimates of certain expenses associated with processing and settling the claims. The Company's maximum individual claims liability was $0.3 million under its fiscal 2014 minimum premium health insurance plan. Amounts accrued related to the health benefits insurance reserves are considered immaterial as of May 31, 2014.
40
The Company regularly reviews the adequacy of its estimated insurance reserves. Adjustments to previously established reserves are reflected in the results of operations for the period in which the adjustment is identified. Such adjustments could possibly be significant, reflecting any variety of new and adverse or favorable trends.
Stock-based compensation costs:
All stock-based awards to employees are recognized as compensation costs in the consolidated financial statements based on their fair values measured as of the date of grant. The Company estimates the fair value of stock option grants using a Black-Scholes option pricing model. This model requires various assumptions as inputs including expected volatility of the Paychex stock price and expected option life. Volatility is estimated based on a combination of historical volatility, using stock prices over a period equal to the expected option life, and implied market volatility. Expected option life is estimated based on historical exercise behavior. The Company periodically reassesses its assumptions as well as its choice of valuation model. The Company will reconsider use of this model if additional information becomes available in the future indicating that another model would provide a more accurate estimate of fair value, or if characteristics of future grants would warrant such a change.
The fair value of stock awards is determined based on the stock price at the date of grant. For grants that do not accrue dividends or dividend equivalents, the fair value is the stock price reduced by the present value of estimated dividends over the vesting period or performance period.
The Company is required to estimate forfeitures and only record compensation costs for those awards that are expected to vest. The assumptions for forfeitures were determined based on type of award and historical experience. Forfeiture assumptions are adjusted at the point in time a significant change is identified, with any adjustment recorded in the period of change, and the final adjustment at the end of the requisite service period to equal actual forfeitures.
The assumptions of volatility, expected option life, and forfeitures all require significant judgment and are subject to change in the future due to factors such as employee exercise behavior, stock price trends, and changes to type or provisions of stock-based awards. Any material change in one or more of these assumptions could have an impact on the estimated fair value of a future award.
Refer to Note D for further discussion of the Company’s stock-based compensation plans.
Income taxes:
The Company accounts for deferred taxes by recognition of deferred tax assets and liabilities for the expected future tax consequences of events that have been included in the consolidated financial statements or tax returns. Under this method, deferred tax assets and liabilities are determined based on the difference between the financial statement and tax basis of assets and liabilities, using enacted tax rates in effect for the year in which the differences are expected to reverse. The Company records a deferred tax asset related to the stock-based compensation costs recognized for certain stock-based awards. At the time of the exercise of non-qualified stock options or vesting of stock awards, the Company accounts for the resulting tax deduction by reducing its accrued income tax liability with an offset to the deferred tax asset and any excess of the tax benefit over the deferred tax asset as an increase to additional paid-in capital. The Company currently has a sufficient pool of excess tax benefits in additional paid-in capital to absorb any deficiency in tax benefits that fall short of the related deferred tax asset related to stock-based awards.
The Company also maintains a reserve for uncertain tax positions. The Company evaluates tax positions taken or expected to be taken in a tax return for recognition in its consolidated financial statements. Prior to recording the related tax benefit in the consolidated financial statements, the Company must conclude that tax positions will be more-likely-than-not to be sustained, assuming those positions will be examined by taxing authorities with full knowledge of all relevant information. The benefit recognized in the consolidated financial statements is the amount the Company expects to realize after examination by taxing authorities. If a tax position drops below the more-likely-than-not standard, the benefit can no longer be recognized. Assumptions, judgment, and the use of estimates are required in determining if the more-likely-than-not standard has been met when developing the provision for income taxes and in determining the expected benefit. A change in the assessment of the more-likely-than-not standard could materially impact the Company’s results of operations or financial position. The Company’s reserve for uncertain tax positions, including interest and net of federal benefits, was
$29.8 million
as of
May 31, 2014
and
$19.8 million
as of
May 31, 2013
. Refer to Note I for further discussion of the Company’s reserve for uncertain tax positions.
Use of estimates:
The preparation of financial statements in conformity with U.S. generally accepted accounting principles (“GAAP”) requires management to make estimates, judgments, and assumptions that affect reported amounts of assets, liabilities, revenue, and expenses during the reporting period. Actual amounts and results could differ from these estimates.
41
Recently adopted accounting pronouncements:
Effective June 1, 2013, the Company adopted Accounting Standards Update (“ASU”) 2012-02, “Intangibles – Goodwill and Other (Topic 350): Testing Indefinite-Lived Intangible Assets for Impairment,” issued by the Financial Accounting Standards Board (“FASB”). This updated guidance allows companies the option to first assess qualitative factors to determine if it is more-likely-than-not that an indefinite-lived intangible asset might be impaired and whether it is necessary to perform the quantitative impairment test. The Company currently does not have any indefinite-lived intangible assets other than goodwill, so adoption of this guidance did not have a material effect on its consolidated financial statements.
Effective June 1, 2013, the Company adopted ASU 2013-02, “Comprehensive Income (Topic 220): Reporting of Amounts Reclassified Out of Accumulated Other Comprehensive Income.” This authoritative guidance requires the reporting of the effect of significant reclassifications out of accumulated other comprehensive income on the respective line items in net income. There are no changes to the components that are recognized in net income or other comprehensive income. Adoption of this guidance did not have a material effect on the Company's consolidated financial statements.
Recently issued accounting pronouncements:
In June 2014, the FASB issued ASU No. 2014-12, “Compensation—Stock Compensation (Topic 718): Accounting for Share-Based Payments When the Terms of an Award Provide That a Performance Target Could Be Achieved after the Requisite Service Period (a consensus of the FASB Emerging Issues Task Force).” This guidance requires a performance target that affects vesting and that could be achieved after the requisite service period to be treated as a performance condition. The current accounting standard for stock-based compensation as it applies to awards with performance conditions should be applied. This guidance is effective for fiscal years, including interim reporting periods, beginning after December 15, 2015, and is applicable to the Company's fiscal year beginning June 1, 2016. The Company is currently evaluating this guidance, but does not anticipate it will have a material impact to its consolidated financial statements.
In May 2014, the FASB issued ASU No. 2014-09, “Revenue from Contracts with Customers (Topic 606).” This guidance supersedes current guidance on revenue recognition in Topic 605, “Revenue Recognition.” In addition, there are disclosure requirements related to the nature, amount, timing, and uncertainty of revenue recognition. This guidance will be effective for annual reporting periods beginning after December 15, 2016, including interim reporting periods, and will be required to be applied retrospectively. Early application of the guidance is not permitted. This guidance is applicable to the Company's fiscal year beginning June 1, 2017. The Company is currently evaluating this guidance and any potential impact to its consolidated financial statements.
In January 2014, the FASB issued ASU 2014-01, “Investments – Equity Method and Joint Ventures (Topic 323): Accounting for Investments in Qualified Affordable Housing Projects (a consensus of the FASB Emerging Issues Task Force).” This ASU permits a company to make an accounting policy election to account for investments in qualified affordable housing projects under a new proportional amortization method. If such an election is not made, the ASU requires use of the equity or cost method for investments. The ASU is effective for fiscal years, and interim periods within those years, beginning after December 15, 2014, with early adoption permitted. The Company currently accounts for its investments in qualified affordable housing projects using the equity method for investments and does not anticipate that this ASU will have a material effect on its consolidated financial statements.
In July 2013, the FASB issued ASU 2013-11, “Income Taxes (Topic 740): Presentation of an Unrecognized Tax Benefit When a Net Operating Loss Carryforward, a Similar Tax Loss, or a Tax Credit Carryforward Exists (a consensus of the FASB Emerging Issues Task Force).” This ASU provides explicit guidance regarding the presentation in the statement of financial position of an unrecognized tax benefit when net operating losses or tax credit carryforwards exist. It is effective for fiscal years, and interim periods within those years, beginning after December 15, 2013, with early adoption permitted, and is applicable to the Company's fiscal year beginning June 1, 2014. The Company does not anticipate that the adoption of this guidance will have a material effect on its consolidated financial statements.
Other recent authoritative guidance issued by the FASB (including technical corrections to the FASB Accounting Standards Codification), the American Institute of Certified Public Accountants, and the Securities and Exchange Commission (“SEC”) did not, or are not expected to have a material effect on the Company’s consolidated financial statements.
42
Note B — Basic and Diluted Earnings Per Share
Basic and diluted earnings per share were calculated as follows:
|
|
Year ended May 31,
|
|||||||||||
|
In millions, except per share amounts
|
2014
|
2013
|
2012
|
|||||||||
|
Basic earnings per share:
|
||||||||||||
|
Net income
|
$
|
627.5
|
|
$
|
569.0
|
|
$
|
548.0
|
|
|||
|
Weighted-average common shares outstanding
|
364.5
|
|
363.8
|
|
362.4
|
|
||||||
|
Basic earnings per share
|
$
|
1.72
|
|
$
|
1.56
|
|
$
|
1.51
|
|
|||
|
Diluted earnings per share:
|
||||||||||||
|
Net income
|
$
|
627.5
|
|
$
|
569.0
|
|
$
|
548.0
|
|
|||
|
Weighted-average common shares outstanding
|
364.5
|
|
363.8
|
|
362.4
|
|
||||||
|
Dilutive effect of common share equivalents
|
1.6
|
|
0.9
|
|
0.6
|
|
||||||
|
Weighted-average common shares outstanding, assuming dilution
|
366.1
|
|
364.7
|
|
363.0
|
|
||||||
|
Diluted earnings per share
|
$
|
1.71
|
|
$
|
1.56
|
|
$
|
1.51
|
|
|||
|
Weighted-average anti-dilutive common share equivalents
|
0.7
|
|
6.5
|
|
9.9
|
|
||||||
Weighted-average common share equivalents that had an anti-dilutive impact are excluded from the computation of diluted earnings per share.
In October 2012, the Company announced a program to repurchase up to
$350 million
of its common stock with authorization expiring on May 31, 2014. During
fiscal 2014
, the Company repurchased
6.2 million
shares for
$249.7 million
under this program. Shares repurchased were retired. In May 2014, the Company announced that its Board of Directors (the “Board”) approved a new program to repurchase up to
$350 million
of the Company's common stock with authorization expiring on May 31, 2017.
Note C — Investment Income, Net
Investment income, net, consisted of the following items:
|
Year ended May 31,
|
||||||||||||
|
In millions
|
2014
|
2013
|
2012
|
|||||||||
|
Interest income on corporate funds
|
$
|
6.9
|
|
$
|
6.7
|
|
$
|
6.5
|
|
|||
|
Interest expense
|
(1.1
|
)
|
(0.1
|
)
|
(0.1
|
)
|
||||||
|
Net loss from equity-method investments
|
(0.4
|
)
|
—
|
|
—
|
|
||||||
|
Investment income, net
|
$
|
5.4
|
|
$
|
6.6
|
|
$
|
6.4
|
|
|||
Note D — Stock-Based Compensation Plans
The Paychex, Inc. 2002 Stock Incentive Plan, as amended and restated (the “2002 Plan”), effective on October 13, 2010 upon its approval by the Company’s stockholders, authorizes grants of up to
39.1 million
shares of the Company’s common stock. As of
May 31, 2014
, there were
20.2 million
shares available for future grants under the 2002 Plan.
All stock-based awards to employees are recognized as compensation costs in the consolidated financial statements based on their fair values measured as of the date of grant. These costs are recognized as an expense in the Consolidated Statements of Income and Comprehensive Income on a straight-line basis over the requisite service period and increase additional paid-in capital.
Stock-based compensation expense was $
26.3 million
, $
22.8 million
, and $
22.9 million
for fiscal years
2014
,
2013
, and
2012
, respectively. Related income tax benefits recognized were $
10.1 million
, $
8.5 million
, and $
8.3 million
for the respective fiscal years. Capitalized stock-based compensation costs related to the development of internal use software for these same fiscal years were not significant.
43
As of
May 31, 2014
, the total unrecognized compensation cost related to all unvested stock-based awards was $
52.4 million
and is expected to be recognized over a weighted-average period of
2.9
years.
Black-Scholes fair value assumptions:
The fair value of stock option grants and performance stock options was estimated at the date of grant using a Black-Scholes option pricing model. The weighted-average assumptions used for valuation under the Black-Scholes model are as follows:
|
|
Year ended May 31,
|
|||||||||||||||||||||||
|
|
2014
|
2013
|
2012
|
2014
|
2013
|
2012
|
||||||||||||||||||
|
|
Performance stock options
|
Stock options
|
||||||||||||||||||||||
|
Risk-free interest rate
|
1.5
|
%
|
0.7
|
%
|
1.9
|
%
|
2.0
|
%
|
1.0
|
%
|
2.2
|
%
|
||||||||||||
|
Dividend yield
|
3.9
|
%
|
4.1
|
%
|
4.2
|
%
|
4.1
|
%
|
4.3
|
%
|
4.2
|
%
|
||||||||||||
|
Volatility factor
|
.20
|
|
.22
|
|
.24
|
|
.22
|
|
.23
|
|
.24
|
|
||||||||||||
|
Expected option life in years
|
4.5
|
|
4.8
|
|
5.8
|
|
6.4
|
|
6.4
|
|
6.4
|
|
||||||||||||
|
Weighted-average grant-date fair value of stock options granted (per share)
|
$
|
3.85
|
|
$
|
3.55
|
|
$
|
4.35
|
|
$
|
4.90
|
|
$
|
3.77
|
|
$
|
4.46
|
|
||||||
Risk-free interest rates are yields for zero coupon U.S. Treasury notes maturing approximately at the end of the expected option life. The estimated volatility factor is based on a combination of historical volatility, using stock prices over a period equal to the expected option life, and implied market volatility. The expected option life is based on historical exercise behavior.
The Company has determined that the Black-Scholes option pricing model, as well as the underlying assumptions used in its application, are appropriate in estimating the fair value of its stock option grants. The Company periodically assesses its assumptions as well as its choice of valuation model, and will reconsider use of this model if additional information becomes available in the future indicating that another model would provide a more accurate estimate of fair value, or if characteristics of future grants would warrant such a change.
Stock options:
Stock options entitle the holder to purchase, at the end of the vesting term, a specified number of shares of Paychex common stock at an exercise price per share set equal to the closing market price of the common stock on the date of grant. All stock options have a contractual life of
ten
years from the date of the grant and a vesting schedule as established by the Board. The Company issues new shares of common stock to satisfy stock option exercises. Non-qualified stock option grants to officers and outside directors are typically approved by the Board in July. Non-qualified stock option grants to officers and employees granted prior to July 2010 vest
20%
, per annum while grants to the Board prior to October 2010 vested
one-third
per annum. Grants of non-qualified stock options to officers beginning in July 2010 vest
25%
per annum. Grants to members of the Board beginning in October 2010 vest
after one year
.
The Company had granted stock options to virtually all non-management employees with at least
ninety
days of service, with the last broad-based grant in October 2006. As of May 31, 2014,
0.4 million
shares remain outstanding on this grant.
The following table summarizes stock option activity for the year ended
May 31, 2014
:
|
In millions, except per share amounts
|
Shares subject
to options
|
Weighted-average
exercise price
per share
|
Weighted-average
remaining
contractual term
(years)
|
Aggregate
intrinsic value
(1)
|
|||||||||
|
Outstanding as of May 31, 2013
|
8.0
|
|
$
|
34.17
|
|
||||||||
|
Granted
|
0.9
|
|
$
|
38.52
|
|
||||||||
|
Exercised
|
(3.4
|
)
|
$
|
35.51
|
|
||||||||
|
Forfeited
|
—
|
|
$
|
29.26
|
|
||||||||
|
Expired
|
(0.1
|
)
|
$
|
38.11
|
|
||||||||
|
Outstanding as of May 31, 2014
|
5.4
|
|
$
|
34.00
|
|
5.3
|
$
|
38.7
|
|
||||
|
Exercisable as of May 31, 2014
|
3.4
|
|
$
|
33.87
|
|
3.6
|
$
|
24.7
|
|
||||
(1)
Market price of the underlying stock as of
May 31, 2014
less the exercise price.
44
Other information pertaining to stock option grants is as follows:
|
|
Year ended May 31,
|
|||||||||||
|
In millions, except per share amounts
|
2014
|
2013
|
2012
|
|||||||||
|
Total intrinsic value of stock options exercised
|
$
|
18.9
|
|
$
|
7.8
|
|
$
|
0.8
|
|
|||
|
Total grant-date fair value of stock options vested
|
$
|
3.0
|
|
$
|
3.0
|
|
$
|
10.4
|
|
|||
Performance stock options:
In July 2011, the Board approved a special award of performance-based stock options under a Long-Term Incentive Plan. Subsequent grants of this award have been made upon hire of new officers. Under this award, stock options were granted to officers with vesting dependent on achievement against long-term strategic and financial objectives. The awards will vest in full if performance targets for the fiscal year ending May 31, 2016 are achieved, with acceleration of up to one-half of the award if performance targets are achieved for fiscal 2014. Based on results for fiscal 2014,
23.5%
of the award vested in July 2014.
The following table summarizes performance stock option activity for the year ended
May 31, 2014
:
|
In millions, except per share amounts
|
Shares subject
to options
|
Weighted-average
exercise price per
share
|
Weighted-average
remaining
contractual term
(years)
|
Aggregate
intrinsic value
(2)
|
|||||||||
|
Outstanding as of May 31, 2013
|
2.7
|
|
$
|
30.95
|
|
||||||||
|
Granted
(1)
|
0.1
|
|
$
|
36.66
|
|
||||||||
|
Exercised
|
—
|
|
$
|
—
|
|
||||||||
|
Forfeited
|
—
|
|
$
|
—
|
|
||||||||
|
Expired
|
—
|
|
$
|
—
|
|
||||||||
|
Outstanding as of May 31, 2014
|
2.8
|
|
$
|
31.25
|
|
7.4
|
$
|
27.8
|
|
||||
|
Exercisable as of May 31, 2014
|
—
|
|
$
|
—
|
|
0.0
|
$
|
—
|
|
||||
|
(1)
|
Performance stock options granted assuming achievement of performance goals at target. Actual amount of shares to be earned may differ from this amount.
|
|
(2)
|
Market price of the underlying stock as of
May 31, 2014
less the exercise price.
|
Restricted stock units:
The Board grants restricted stock units (“RSUs”) to non-officer management. An RSU is an agreement to issue shares at the time of vesting with no associated exercise cost. For each unit granted, the holder will receive one share of stock at the time of vesting. RSUs do not have voting rights or earn dividend equivalents during the vesting period. These awards vest
20%
per annum over
five
years with a small population of awards vesting on the fourth anniversary of the grant date. The fair value of RSUs is equal to the closing market price of the underlying common stock as of the date of grant, adjusted for the present value of expected dividends over the vesting period.
The following table summarizes RSU activity for the year ended
May 31, 2014
:
|
In millions, except per share amounts
|
RSUs
|
Weighted-average
grant-date
fair value per
share
|
Weighted-average
remaining vesting
period (years)
|
Aggregate
intrinsic value
(1)
|
|||||||||
|
Nonvested as of May 31, 2013
|
1.6
|
|
$
|
26.29
|
|
||||||||
|
Granted
|
0.7
|
|
$
|
36.37
|
|
||||||||
|
Vested
|
(0.5
|
)
|
$
|
25.65
|
|
||||||||
|
Forfeited
|
(0.1
|
)
|
$
|
29.39
|
|
||||||||
|
Nonvested as of May 31, 2014
|
1.7
|
|
$
|
30.52
|
|
3.0
|
$
|
70.5
|
|
||||
|
(1)
|
Intrinsic value for RSUs is the market price of the underlying stock as of
May 31, 2014
.
|
45
Other information pertaining to RSUs is as follows:
|
|
Year ended May 31,
|
|||||||||||
|
In millions, except per share amounts
|
2014
|
2013
|
2012
|
|||||||||
|
Weighted-average grant-date fair value of RSUs granted
|
$
|
36.37
|
|
$
|
28.59
|
|
$
|
27.67
|
|
|||
|
Total intrinsic value of RSUs vested
|
$
|
18.3
|
|
$
|
15.5
|
|
$
|
11.0
|
|
|||
|
Total grant-date fair value of RSUs vested
|
$
|
12.1
|
|
$
|
13.4
|
|
$
|
9.5
|
|
|||
Restricted stock awards:
The Board has approved grants of restricted stock awards to the Company’s officers and outside directors. All shares underlying awards of restricted stock are restricted in that they are not transferable until they vest. The recipients of the restricted stock have voting rights and earn dividends, which are paid to the recipient at the time of vesting of the awards. If the recipient leaves Paychex prior to the vesting date for any reason, the shares of restricted stock and the dividends accrued on those shares will be forfeited and returned to Paychex.
For restricted stock awards granted to officers prior to July 2010, the shares vest upon the
fifth anniversary
of the grant date provided the recipient is still an employee of the Company on that date. These awards have a provision for the acceleration of vesting based on achievement of performance targets established by the Board. If the established targets are met for a fiscal year, up to one-third of the award may vest. If all the targets are met for three consecutive years, the award will be fully vested. Beginning in July 2010, time-vested restricted stock awards were granted to officers, which vest one-third per annum. For grants to outside directors prior to October 2010, the shares vested on the
third anniversary
of the grant date. Beginning in October 2010, restricted stock granted to outside directors vest on the
one-year anniversary
of the grant date. The fair value of restricted stock awards is equal to the closing market price of the underlying common stock as of the date of grant and is expensed over the requisite service period on a straight-line basis.
The following table summarizes restricted stock activity for the year ended
May 31, 2014
:
|
In millions, except per share amounts
|
Restricted
shares
|
Weighted-average
grant-date
fair value per
share
|
|||||
|
Nonvested as of May 31, 2013
|
0.2
|
|
$
|
29.83
|
|
||
|
Granted
|
0.1
|
|
$
|
38.53
|
|
||
|
Vested
|
(0.1
|
)
|
$
|
30.22
|
|
||
|
Forfeited
|
—
|
|
$
|
—
|
|
||
|
Nonvested as of May 31, 2014
|
0.2
|
|
$
|
33.55
|
|
||
Other information pertaining to restricted stock follows:
|
|
Year ended May 31,
|
|||||||||||
|
In millions, except per share amounts
|
2014
|
2013
|
2012
|
|||||||||
|
Weighted-average grant-date fair value of restricted stock granted
|
$
|
38.53
|
|
$
|
31.76
|
|
$
|
30.69
|
|
|||
|
Total grant-date fair value of restricted stock vested
|
$
|
3.3
|
|
$
|
2.1
|
|
$
|
3.2
|
|
|||
Performance shares:
Beginning in July 2010, the Board approved grants of restricted performance shares to officers. These awards have a
two
year performance period, after which the amount of restricted shares earned will be determined based on achievement against established performance targets. The restricted shares earned will then be subject to a
one
year service period. Performance shares do not have voting rights or earn dividend equivalents during the performance period. The fair value of performance shares is equal to the closing market price of the underlying common stock as of the date of grant, adjusted for the present value of expected dividends over the performance period.
46
The following table summarizes performance share activity for the year ended
May 31, 2014
:
|
In millions, except per share amounts
|
Performance
shares
|
Weighted-average
grant-date
fair value
per share
|
|||||
|
Nonvested as of May 31, 2013
|
0.4
|
|
$
|
27.89
|
|
||
|
Granted
(1)
|
0.2
|
|
$
|
35.69
|
|
||
|
Vested
|
(0.1
|
)
|
$
|
23.98
|
|
||
|
Forfeited
|
—
|
|
$
|
—
|
|
||
|
Nonvested as of May 31, 2014
|
0.5
|
|
$
|
31.61
|
|
||
|
(1)
|
Performance shares granted assuming achievement of performance goals at target. Actual amount of shares to be earned may differ from this amount.
|
Non-compensatory employee benefit plan:
The Company offers an Employee Stock Purchase Plan to all employees under which the Company’s common stock can be purchased through a payroll deduction with no discount to the market price and no look-back provision. All transactions occur directly through the Company’s transfer agent and no brokerage fees are charged to employees, except for when stock is sold. The plan has been deemed non-compensatory and therefore, no stock-based compensation costs have been recognized for fiscal years
2014
,
2013
, or
2012
related to this plan.
Note E — Funds Held for Clients and Corporate Investments
Funds held for clients and corporate investments are as follows:
|
|
May 31, 2014
|
|||||||||||||||
|
In millions
|
Amortized
cost
|
Gross
unrealized
gains
|
Gross
unrealized
losses
|
Fair
value
|
||||||||||||
|
Type of issue:
|
||||||||||||||||
|
Funds held for clients money market securities and other cash equivalents
|
$
|
1,579.2
|
|
$
|
—
|
|
$
|
—
|
|
$
|
1,579.2
|
|
||||
|
Available-for-sale securities:
|
||||||||||||||||
|
General obligation municipal bonds
|
1,605.4
|
|
25.0
|
|
(1.9
|
)
|
1,628.5
|
|
||||||||
|
Pre-refunded municipal bonds
(1)
|
140.4
|
|
2.4
|
|
—
|
|
142.8
|
|
||||||||
|
Revenue municipal bonds
|
858.8
|
|
10.1
|
|
(1.1
|
)
|
867.8
|
|
||||||||
|
Variable rate demand notes
|
752.3
|
|
—
|
|
—
|
|
752.3
|
|
||||||||
|
Total available-for-sale securities
|
3,356.9
|
|
37.5
|
|
(3.0
|
)
|
3,391.4
|
|
||||||||
|
Other
|
10.6
|
|
1.7
|
|
—
|
|
12.3
|
|
||||||||
|
Total funds held for clients and corporate investments
|
$
|
4,946.7
|
|
$
|
39.2
|
|
$
|
(3.0
|
)
|
$
|
4,982.9
|
|
||||
|
|
May 31, 2013
|
|||||||||||||||
|
In millions
|
Amortized
cost
|
Gross
unrealized
gains
|
Gross
unrealized
losses
|
Fair
value
|
||||||||||||
|
Type of issue:
|
||||||||||||||||
|
Funds held for clients money market securities and other cash equivalents
|
$
|
1,137.7
|
|
$
|
—
|
|
$
|
—
|
|
$
|
1,137.7
|
|
||||
|
Available-for-sale securities:
|
||||||||||||||||
|
General obligation municipal bonds
|
1,432.9
|
|
27.4
|
|
(3.5
|
)
|
1,456.8
|
|
||||||||
|
Pre-refunded municipal bonds
(1)
|
201.0
|
|
2.9
|
|
—
|
|
203.9
|
|
||||||||
|
Revenue municipal bonds
|
746.1
|
|
10.1
|
|
(2.2
|
)
|
754.0
|
|
||||||||
|
Variable rate demand notes
|
1,276.7
|
|
—
|
|
—
|
|
1,276.7
|
|
||||||||
|
Total available-for-sale securities
|
3,656.7
|
|
40.4
|
|
(5.7
|
)
|
3,691.4
|
|
||||||||
|
Other
|
9.5
|
|
1.2
|
|
—
|
|
10.7
|
|
||||||||
|
Total funds held for clients and corporate investments
|
$
|
4,803.9
|
|
$
|
41.6
|
|
$
|
(5.7
|
)
|
$
|
4,839.8
|
|
||||
47
|
(1)
|
Pre-refunded municipal bonds are secured by an escrow fund of U.S. government obligations.
|
Included in money market securities and other cash equivalents as of
May 31, 2014
and
May 31, 2013
are money market funds and bank demand deposit accounts. Also included in money market securities and other cash equivalents as of
May 31, 2014
were short-term municipal bonds and commercial paper.
Classification of investments on the Consolidated Balance Sheets is as follows:
|
May 31,
|
||||||||
|
In millions
|
2014
|
2013
|
||||||
|
Funds held for clients
|
$
|
4,198.6
|
|
$
|
4,072.5
|
|
||
|
Corporate investments
|
398.7
|
|
398.2
|
|
||||
|
Long-term corporate investments
|
385.6
|
|
369.1
|
|
||||
|
Total funds held for clients and corporate investments
|
$
|
4,982.9
|
|
$
|
4,839.8
|
|
||
The Company’s available-for-sale securities reflected a net unrealized gain of
$34.5 million
as of
May 31, 2014
compared with a net unrealized gain of
$34.7 million
as of
May 31, 2013
. Included in the net unrealized gain total as of
May 31, 2014
and
May 31, 2013
, there were, respectively,
98
and
147
available-for-sale securities in an unrealized loss position. The securities in an unrealized loss position were as follows:
|
|
May 31, 2014
|
||||||||||||||||||||||
|
Less than twelve months
|
More than twelve months
|
Total
|
|||||||||||||||||||||
|
In millions
|
Gross
unrealized
losses
|
Fair
value
|
Gross
unrealized
losses
|
Fair
Value
|
Gross
unrealized
losses
|
Fair
Value
|
|||||||||||||||||
|
Type of issue:
|
|||||||||||||||||||||||
|
General obligation municipal bonds
|
$
|
(0.1
|
)
|
$
|
69.6
|
|
$
|
(1.8
|
)
|
$
|
164.0
|
|
$
|
(1.9
|
)
|
$
|
233.6
|
|
|||||
|
Pre-refunded municipal bonds
|
—
|
|
1.7
|
|
—
|
|
—
|
|
—
|
|
1.7
|
|
|||||||||||
|
Revenue municipal bonds
|
—
|
|
47.5
|
|
(1.1
|
)
|
112.4
|
|
(1.1
|
)
|
159.9
|
|
|||||||||||
|
Total
|
$
|
(0.1
|
)
|
$
|
118.8
|
|
$
|
(2.9
|
)
|
$
|
276.4
|
|
$
|
(3.0
|
)
|
$
|
395.2
|
|
|||||
|
|
May 31, 2013
|
||||||||||||||||||||||
|
Less than twelve months
|
More than twelve months
|
Total
|
|||||||||||||||||||||
|
In millions
|
Gross
unrealized
losses
|
Fair
value
|
Gross
unrealized
losses
|
Fair
Value
|
Gross
unrealized
losses
|
Fair
Value
|
|||||||||||||||||
|
Type of issue:
|
|||||||||||||||||||||||
|
General obligation municipal bonds
|
$
|
(3.5
|
)
|
$
|
349.2
|
|
$
|
—
|
|
$
|
—
|
|
$
|
(3.5
|
)
|
$
|
349.2
|
|
|||||
|
Pre-refunded municipal bonds
|
—
|
|
3.1
|
|
—
|
|
—
|
|
—
|
|
3.1
|
|
|||||||||||
|
Revenue municipal bonds
|
(2.2
|
)
|
225.3
|
|
—
|
|
2.1
|
|
(2.2
|
)
|
227.4
|
|
|||||||||||
|
Total
|
$
|
(5.7
|
)
|
$
|
577.6
|
|
$
|
—
|
|
$
|
2.1
|
|
$
|
(5.7
|
)
|
$
|
579.7
|
|
|||||
48
The Company regularly reviews its investment portfolios to determine if any investment is other-than-temporarily impaired due to changes in credit risk or other potential valuation concerns. The Company believes that the investments held as of
May 31, 2014
that had unrealized losses of
$3.0 million
were not other-than-temporarily impaired. The Company believes that it is probable that the principal and interest will be collected in accordance with contractual terms, and that the unrealized losses on these securities were due to changes in interest rates and were not due to increased credit risk or other valuation concerns. A substantial portion of the securities in an unrealized loss position as of
May 31, 2014
and
May 31, 2013
held an AA rating or better. The Company does not intend to sell these investments until the recovery of their amortized cost basis or maturity, and further believes that it is not more-likely-than-not that it will be required to sell these investments prior to that time. The Company’s assessment that an investment is not other-than-temporarily impaired could change in the future due to new developments or changes in the Company’s strategies or assumptions related to any particular investment.
Realized gains and losses from the sale of available-for-sale securities were as follows:
|
|
Year ended May 31,
|
|||||||||||
|
In millions
|
2014
|
2013
|
2012
|
|||||||||
|
Gross realized gains
|
$
|
0.6
|
|
$
|
0.9
|
|
$
|
1.0
|
|
|||
|
Gross realized losses
|
—
|
|
—
|
|
—
|
|
||||||
|
Net realized gains
|
$
|
0.6
|
|
$
|
0.9
|
|
$
|
1.0
|
|
|||
The amortized cost and fair value of available-for-sale securities that had stated maturities as of
May 31, 2014
are shown below by contractual maturity. Expected maturities can differ from contractual maturities because borrowers may have the right to prepay obligations without prepayment penalties.
|
|
May 31, 2014
|
|||||||
|
In millions
|
Amortized
cost
|
Fair
value
|
||||||
|
Maturity date:
|
||||||||
|
Due in one year or less
|
$
|
392.0
|
|
$
|
394.3
|
|
||
|
Due after one year through three years
|
759.8
|
|
776.0
|
|
||||
|
Due after three years through five years
|
764.1
|
|
774.3
|
|
||||
|
Due after five years
|
1,441.0
|
|
1,446.8
|
|
||||
|
Total
|
$
|
3,356.9
|
|
$
|
3,391.4
|
|
||
Variable rate demand notes are primarily categorized as due after five years in the table above as the contractual maturities on these securities are typically 20 to 30 years. Although these securities are issued as long-term securities, they are priced and traded as short-term instruments because of the liquidity provided through the tender feature.
Note F — Fair Value Measurements
Fair value is defined as the price that would be received to sell an asset or paid to transfer a liability (an exit price) in an orderly transaction between market participants at the measurement date. The accounting standards related to fair value measurements include a hierarchy for information and valuations used in measuring fair value that is broken down into three levels based on reliability, as follows:
|
•
|
Level 1 valuations are based on quoted prices in active markets for identical instruments that the Company can access at the measurement date.
|
|
•
|
Level 2 valuations are based on inputs other than quoted prices included in Level 1 that are observable for the instrument, either directly or indirectly, for substantially the full term of the asset or liability including the following:
|
|
◦
|
quoted prices for similar, but not identical, instruments in active markets;
|
|
◦
|
quoted prices for identical or similar instruments in markets that are not active;
|
|
◦
|
inputs other than quoted prices that are observable for the instrument; or
|
|
◦
|
inputs that are derived principally from or corroborated by observable market data by correlation or other means.
|
|
•
|
Level 3 valuations are based on information that is unobservable and significant to the overall fair value measurement.
|
49
The carrying values of cash and cash equivalents, including money market securities, accounts receivable, net of allowance for doubtful accounts, and accounts payable approximate fair value due to the short maturities of these instruments. Marketable securities included in funds held for clients and corporate investments consist primarily of securities classified as available-for-sale and are recorded at fair value on a recurring basis.
The Company’s financial assets and liabilities measured at fair value on a recurring basis were as follows:
|
|
May 31, 2014
|
|||||||||||||||
|
In millions
|
Carrying
value
(Fair value)
|
Quoted
prices in
active
markets
(Level 1)
|
Significant
other
observable
inputs
(Level 2)
|
Significant
unobservable
inputs
(Level 3)
|
||||||||||||
|
Assets:
|
||||||||||||||||
|
Cash equivalents:
|
||||||||||||||||
|
Commercial paper
|
$
|
6.0
|
|
$
|
—
|
|
$
|
6.0
|
|
$
|
—
|
|
||||
|
General obligation municipal bonds
|
10.9
|
|
—
|
|
10.9
|
|
—
|
|
||||||||
|
Pre-refunded municipal bonds
|
31.2
|
|
—
|
|
31.2
|
|
—
|
|
||||||||
|
Revenue municipal bonds
|
17.7
|
|
—
|
|
17.7
|
|
—
|
|
||||||||
|
Total cash equivalents
|
$
|
65.8
|
|
$
|
—
|
|
$
|
65.8
|
|
$
|
—
|
|
||||
|
Available-for-sale securities:
|
||||||||||||||||
|
General obligation municipal bonds
|
$
|
1,628.5
|
|
$
|
—
|
|
$
|
1,628.5
|
|
$
|
—
|
|
||||
|
Pre-refunded municipal bonds
|
142.8
|
|
—
|
|
142.8
|
|
—
|
|
||||||||
|
Revenue municipal bonds
|
867.8
|
|
—
|
|
867.8
|
|
—
|
|
||||||||
|
Variable rate demand notes
|
752.3
|
|
—
|
|
752.3
|
|
—
|
|
||||||||
|
Total available-for-sale securities
|
$
|
3,391.4
|
|
$
|
—
|
|
$
|
3,391.4
|
|
$
|
—
|
|
||||
|
Other
|
$
|
12.3
|
|
$
|
12.3
|
|
$
|
—
|
|
$
|
—
|
|
||||
|
Liabilities:
|
||||||||||||||||
|
Other long-term liabilities
|
$
|
12.3
|
|
$
|
12.3
|
|
$
|
—
|
|
$
|
—
|
|
||||
|
|
May 31, 2013
|
|||||||||||||||
|
In millions
|
Carrying
value
(Fair value)
|
Quoted
prices in
active
markets
(Level 1)
|
Significant
other
observable
inputs
(Level 2)
|
Significant
unobservable
inputs
(Level 3)
|
||||||||||||
|
Assets:
|
||||||||||||||||
|
Available-for-sale securities:
|
||||||||||||||||
|
General obligation municipal bonds
|
$
|
1,456.8
|
|
$
|
—
|
|
$
|
1,456.8
|
|
$
|
—
|
|
||||
|
Pre-refunded municipal bonds
|
203.9
|
|
—
|
|
203.9
|
|
—
|
|
||||||||
|
Revenue municipal bonds
|
754.0
|
|
—
|
|
754.0
|
|
—
|
|
||||||||
|
Variable rate demand notes
|
1,276.7
|
|
—
|
|
1,276.7
|
|
—
|
|
||||||||
|
Total available-for-sale securities
|
$
|
3,691.4
|
|
$
|
—
|
|
$
|
3,691.4
|
|
$
|
—
|
|
||||
|
Other
|
$
|
10.7
|
|
$
|
10.7
|
|
$
|
—
|
|
$
|
—
|
|
||||
|
Liabilities:
|
||||||||||||||||
|
Other long-term liabilities
|
$
|
10.7
|
|
$
|
10.7
|
|
$
|
—
|
|
$
|
—
|
|
||||
In determining the fair value of its assets and liabilities, the Company predominately uses the market approach. Commercial paper is included in Level 2 because it may not trade on a daily basis. Available-for-sale securities and short-term municipal securities included in Level 2 are valued utilizing inputs obtained from an independent pricing service. To determine the fair value of the Company’s Level 2 investments, a variety of inputs are utilized, including benchmark yields, reported trades, non-binding broker/dealer quotes, issuer spreads, two-sided markets, benchmark securities, bids, offers, reference data, new issue data, and monthly payment information. The Company reviews the values generated by the independent pricing service for reasonableness by comparing the valuations received from the independent pricing service to valuations from at least one other observable source for a sample of securities. The Company has not adjusted the prices obtained from the independent pricing service.
50
Assets included as other are mutual fund investments, consisting of participants’ eligible deferral contributions under the Company’s non-qualified and unfunded deferred compensation plans. The related liability is reported as other long-term liabilities. The mutual funds are valued based on quoted market prices in active markets.
The preceding methods described may produce a fair value calculation that may not be indicative of net realizable value or reflective of future fair values. Furthermore, although the Company believes its valuation methods are appropriate and consistent with other market participants, the use of different methodologies or assumptions to determine the fair value of certain financial instruments could result in a different fair value measurement at the reporting date.
Note G — Property and Equipment, Net of Accumulated Depreciation
The components of property and equipment, at cost, consisted of the following:
|
|
May 31,
|
|||||||
|
In millions
|
2014
|
2013
|
||||||
|
Land and improvements
|
$
|
8.1
|
|
$
|
8.1
|
|
||
|
Buildings and improvements
|
101.1
|
|
99.2
|
|
||||
|
Data processing equipment
|
180.8
|
|
175.6
|
|
||||
|
Software
|
344.8
|
|
290.1
|
|
||||
|
Furniture, fixtures, and equipment
|
145.0
|
|
145.2
|
|
||||
|
Leasehold improvements
|
101.7
|
|
99.5
|
|
||||
|
Construction in progress
|
25.3
|
|
32.8
|
|
||||
|
Total property and equipment, gross
|
906.8
|
|
850.5
|
|
||||
|
Less: Accumulated depreciation
|
564.6
|
|
504.5
|
|
||||
|
Property and equipment, net of accumulated depreciation
|
$
|
342.2
|
|
$
|
346.0
|
|
||
Depreciation expense was $
89.1 million
, $
79.2 million
, and $
74.8 million
for fiscal years
2014
,
2013
, and
2012
, respectively.
Note H — Goodwill and Intangible Assets, Net of Accumulated Amortization
The Company had goodwill balances on its Consolidated Balance Sheets of
$540.3 million
as of
May 31, 2014
, and
$533.9 million
as of
May 31, 2013
. The increase in goodwill since
May 31, 2013
was the result of an immaterial business acquisition.
The Company has certain intangible assets with finite lives. The components of intangible assets, at cost, consisted of the following:
|
|
May 31,
|
|||||||
|
In millions
|
2014
|
2013
|
||||||
|
Client lists
|
$
|
240.9
|
|
$
|
231.0
|
|
||
|
Other intangible assets
|
2.6
|
|
2.4
|
|
||||
|
Total intangible assets, gross
|
243.5
|
|
233.4
|
|
||||
|
Less: Accumulated amortization
|
202.9
|
|
188.2
|
|
||||
|
Intangible assets, net of accumulated amortization
|
$
|
40.6
|
|
$
|
45.2
|
|
||
During
fiscal 2014
, the Company acquired intangible assets with weighted-average amortization periods as follows: customer lists —
7.4
years; other intangible assets —
3.0
years; and total —
7.3
years. Amortization expense relating to intangible assets was
$15.9 million
,
$19.0 million
, and
$23.0 million
for fiscal years
2014
,
2013
, and
2012
, respectively.
51
The estimated amortization expense for the next five fiscal years relating to intangible asset balances is as follows:
|
In millions
Year ending May 31,
|
Estimated amortization expense
|
|||
|
2015
|
$
|
13.4
|
|
|
|
2016
|
9.9
|
|
||
|
2017
|
7.3
|
|
||
|
2018
|
4.9
|
|
||
|
2019
|
2.9
|
|
||
Note I — Income Taxes
The components of deferred tax assets and liabilities are as follows:
|
|
May 31,
|
|||||||
|
In millions
|
2014
|
2013
|
||||||
|
Deferred tax assets:
|
||||||||
|
Compensation and employee benefit liabilities
|
$
|
18.7
|
|
$
|
16.3
|
|
||
|
Other current liabilities
|
6.9
|
|
6.3
|
|
||||
|
Tax credit carry forward
|
38.3
|
|
35.3
|
|
||||
|
Depreciation
|
8.3
|
|
8.5
|
|
||||
|
Stock-based compensation
|
21.1
|
|
24.6
|
|
||||
|
Other
|
15.4
|
|
16.6
|
|
||||
|
Gross deferred tax assets
|
108.7
|
|
107.6
|
|
||||
|
Deferred tax liabilities:
|
||||||||
|
Capitalized software
|
50.1
|
|
45.8
|
|
||||
|
Depreciation
|
12.2
|
|
20.2
|
|
||||
|
Goodwill and Intangible assets
|
46.7
|
|
41.0
|
|
||||
|
Revenue not subject to current taxes
|
12.6
|
|
11.7
|
|
||||
|
Unrealized gains on available-for-sale securities
|
13.2
|
|
13.3
|
|
||||
|
Other
|
0.4
|
|
0.6
|
|
||||
|
Gross deferred tax liabilities
|
135.2
|
|
132.6
|
|
||||
|
Net deferred tax liability
|
$
|
(26.5
|
)
|
$
|
(25.0
|
)
|
||
The deferred tax asset related to tax credit carry forward consists of alternative minimum tax credits, which may be carried forward indefinitely.
The components of the provision for income taxes are as follows:
|
|
Year ended May 31,
|
|||||||||||
|
In millions
|
2014
|
2013
|
2012
|
|||||||||
|
Current:
|
||||||||||||
|
Federal
|
$
|
314.5
|
|
$
|
274.2
|
|
$
|
259.8
|
|
|||
|
State
|
51.0
|
|
62.9
|
|
40.8
|
|
||||||
|
Total current
|
365.5
|
|
337.1
|
|
300.6
|
|
||||||
|
Deferred:
|
||||||||||||
|
Federal
|
(3.5
|
)
|
5.5
|
|
9.3
|
|
||||||
|
State
|
(1.4
|
)
|
(0.2
|
)
|
2.4
|
|
||||||
|
Total deferred
|
(4.9
|
)
|
5.3
|
|
11.7
|
|
||||||
|
Provision for income taxes
|
$
|
360.6
|
|
$
|
342.4
|
|
$
|
312.3
|
|
|||
52
A reconciliation of the U.S. federal statutory tax rate to the Company’s effective income tax rate is as follows:
|
|
Year ended May 31,
|
||||||||
|
|
2014
|
2013
|
2012
|
||||||
|
Federal statutory tax rate
|
35.0
|
%
|
35.0
|
%
|
35.0
|
%
|
|||
|
Increase/(decrease) resulting from:
|
|||||||||
|
State income taxes, net of federal tax benefit
|
3.3
|
%
|
3.0
|
%
|
3.3
|
%
|
|||
|
Tax settlement
|
—
|
%
|
1.5
|
%
|
—
|
%
|
|||
|
Tax-exempt municipal bond interest
|
(1.5
|
)%
|
(1.7
|
)%
|
(1.8
|
)%
|
|||
|
Other items
|
(0.3
|
)%
|
(0.2
|
)%
|
(0.2
|
)%
|
|||
|
Effective income tax rate
|
36.5
|
%
|
37.6
|
%
|
36.3
|
%
|
|||
Uncertain income tax positions:
The Company is subject to U.S. federal income tax, numerous local and state tax jurisdictions within the U.S., and income taxes in Germany. The Company maintains a reserve for uncertain tax positions. As of
May 31, 2014
and
May 31, 2013
, the total reserve for uncertain tax positions, including interest and net of federal benefits, was $
29.8 million
and $
19.8 million
, respectively. As of
May 31, 2014
and
May 31, 2013
, $
28.6 million
and $
19.7 million
of the total reserves for uncertain tax positions, including interest and net of federal benefits, were included in long-term liabilities on the Consolidated Balance Sheets.
A reconciliation of the beginning and ending amounts of the Company’s gross unrecognized tax benefits, not including interest or other potential offsetting effects, is as follows:
|
|
Year ended May 31,
|
|||||||||||
|
In millions
|
2014
|
2013
|
2012
|
|||||||||
|
Balance as of beginning of fiscal year
|
$
|
26.7
|
|
$
|
41.7
|
|
$
|
41.2
|
|
|||
|
Additions for tax positions of the current year
|
11.2
|
|
28.5
|
|
0.4
|
|
||||||
|
Additions for tax positions of prior years
|
4.2
|
|
12.2
|
|
1.3
|
|
||||||
|
Reductions for tax positions of prior years
|
(1.8
|
)
|
(0.5
|
)
|
(0.1
|
)
|
||||||
|
Settlements with tax authorities
|
—
|
|
(55.0
|
)
|
(0.7
|
)
|
||||||
|
Expiration of the statute of limitations
|
(0.3
|
)
|
(0.2
|
)
|
(0.4
|
)
|
||||||
|
Balance as of end of fiscal year
|
$
|
40.0
|
|
$
|
26.7
|
|
$
|
41.7
|
|
|||
In May 2013, the Company executed a closing agreement that resolved tax matters related to the audits by New York State for the fiscal year ended May 31, 2004 (“fiscal 2004”) through the fiscal year ended May 31, 2011(“fiscal 2011”). As a result, the reserve for uncertain tax positions was increased by $
21.2 million
in May 2013. The resolution and execution of the closing agreement in May 2013 on the open tax matters for fiscal 2004 through fiscal 2011 impacted the Company's effective income tax rate for fiscal 2013, as noted in the reconciliation of the U.S. federal statutory rate to the Company's effective income tax rate.
The reserve as of
May 31, 2014
substantially relates to uncertain tax positions for state income tax matters. The Company believes the reserve for uncertain tax positions, including interest and net of federal benefits, of $
29.8 million
as of
May 31, 2014
adequately covers open tax years and uncertain tax positions up to and including
fiscal 2014
for major taxing jurisdictions. As of
May 31, 2014
, $
24.6 million
of the $
29.8 million
unrecognized tax benefits, if recognized, would impact the Company’s effective income tax rate. As of
May 31, 2013
, $
14.6 million
of the $
19.8 million
unrecognized tax benefits, if recognized, would have impacted the Company’s effective income tax rate.
The Company has concluded all U.S. federal income tax matters through the fiscal year ended May 31, 2010.
Fiscal 2013
is currently under audit by the IRS and fiscal years 2011, 2012, and 2014 are subject to potential audit. With limited exception, state income tax audits by taxing authorities are closed through the fiscal year ended May 31, 2009, primarily due to expiration of the statute of limitations.
The Company continues to follow its policy of recognizing interest and penalties accrued on tax positions as a component of income taxes on the Consolidated Statements of Income and Comprehensive Income. The amount of accrued interest and penalties associated with the Company’s tax positions is immaterial to the Consolidated Balance Sheets. The amount of interest and penalties recognized for fiscal years
2014
,
2013
, and
2012
was immaterial to the Company’s results of operations.
53
Note J — Accumulated Other Comprehensive Income
The change in unrealized gains and losses, net of applicable taxes, related to available-for-sale securities is the primary component reported in accumulated other comprehensive income in the Consolidated Balance Sheets. The changes in accumulated other comprehensive income are as follows:
|
|
Year ended May 31,
|
|||||||||||
|
In millions
|
2014
|
2013
|
2012
|
|||||||||
|
Beginning balance
|
$
|
22.0
|
|
$
|
37.7
|
|
$
|
37.5
|
|
|||
|
Other comprehensive (loss)/income:
|
||||||||||||
|
Unrealized holding gains/(losses)
|
0.3
|
|
(24.1
|
)
|
1.3
|
|
||||||
|
Income tax (expense)/benefit related to unrealized holding gains/(losses)
|
(0.4
|
)
|
9.0
|
|
(0.4
|
)
|
||||||
|
Reclassification adjustment for the net gain on sale of available-for-sale securities realized in net income
|
(0.6
|
)
|
(0.9
|
)
|
(1.0
|
)
|
||||||
|
Income tax expense on reclassification adjustment for the net gain on sale of available-for-sale securities
|
0.2
|
|
0.3
|
|
0.3
|
|
||||||
|
Total other comprehensive (loss)/income, net of tax
|
(0.5
|
)
|
(15.7
|
)
|
0.2
|
|
||||||
|
Ending balance
|
$
|
21.5
|
|
$
|
22.0
|
|
$
|
37.7
|
|
|||
The total tax impact in other comprehensive (loss)/income was tax expense of
$0.2 million
, tax benefit of
$9.3 million
, and tax expense of
$0.1 million
for fiscal years
2014
,
2013
, and
2012
, respectively. Reclassification adjustments out of accumulated other comprehensive income are for realized gains on the sales of available-for-sale securities and impacted interest on funds held for clients on the Consolidated Statements of Income and Comprehensive Income.
Note K — Supplemental Cash Flow Information
Income taxes paid were
$317.8 million
,
$371.0 million
, and
$301.4 million
for fiscal years
2014
,
2013
, and
2012
, respectively.
Lease incentives received in the form of tenant allowances and free rent were
$6.7 million
,
$6.4 million
, and
$12.8 million
for fiscal years
2014
,
2013
, and
2012
, respectively.
Note L — Employee Benefit Plans
401(k) plan:
The Company maintains a contributory savings plan that qualifies under section 401(k) of the Internal Revenue Code. The Paychex, Inc. 401(k) Incentive Retirement Plan (the “Plan”) allows all employees to immediately participate in the salary deferral portion of the Plan, contributing up to a maximum of 50% of their salary, subject to Internal Revenue Service limitations. Employees who have completed
one
year of service are eligible to receive a company matching contribution, when such contribution is in effect. The Company provided matching contributions as follows: 50% of up to 8% of eligible pay that an employee contributed to the Plan, effective for pay dates on or after November 15, 2013; 50% of up to 6% of eligible pay that an employee contributed to the Plan between February 2012 and November 2013; and 50% of up to 4% of eligible pay that an employee contributed to the Plan between January 2011 and February 2012. Company contributions to the Plan for fiscal years
2014
,
2013
, and
2012
were
$16.4 million
,
$13.1 million
, and
$10.3 million
, respectively.
The Plan is 100% participant directed. Plan participants can fully diversify their portfolios by choosing from any or all investment fund choices in the Plan. Transfers in and out of investment funds, including the Paychex, Inc. Employee Stock Ownership Plan (“ESOP”) Stock Fund, are not restricted, with the exception of certain restricted trading periods for individuals designated as insiders as specified in the Company’s Insider Trading Policy. The Company match contribution, when in effect, follows the same fund elections as the employee compensation deferrals.
54
Deferred compensation plans:
The Company offers non-qualified and unfunded deferred compensation plans to a select group of key employees, executive officers, and outside directors. Eligible employees are provided with the opportunity to defer up to 50% of their annual base salary and bonus and outside directors may defer 100% of their Board cash compensation. Gains and losses are credited based on the participant’s election of a variety of investment choices. The Company does not match any participant deferral or guarantee its return. Distributions are paid at one of the following dates selected by the participant: the participant’s termination date, the date the participant retires from any active employment, or a designated specific date. The amounts accrued under these plans were
$12.3 million
and
$10.7 million
as of
May 31, 2014
and
May 31, 2013
, respectively, and are reflected in other long-term liabilities on the accompanying Consolidated Balance Sheets.
Note M — Commitments and Contingencies
Lines of credit:
As of
May 31, 2014
, the Company had unused borrowing capacity available under uncommitted, secured, short-term lines of credit at market rates of interest with financial institutions as follows:
|
Financial institution
|
Amount available
|
Expiration date
|
|
JP Morgan Chase Bank, N.A.
|
$350 million
|
February 28, 2015
|
|
Bank of America, N.A.
|
$250 million
|
February 28, 2015
|
|
PNC Bank, National Association
|
$150 million
|
February 28, 2015
|
|
Wells Fargo Bank, National Association
|
$150 million
|
February 28, 2015
|
The credit facilities are evidenced by promissory notes and are secured by separate pledge security agreements by and between Paychex and each of the financial institutions (the “Lenders”), pursuant to which the Company has granted each of the Lenders a security interest in certain investment securities accounts. The collateral is maintained in a pooled custody account pursuant to the terms of a control agreement and is to be administered under an intercreditor agreement among the Lenders. Under certain circumstances, individual Lenders may require that collateral be transferred from the pooled account into segregated accounts for the benefit of such individual Lenders.
The primary uses of the lines of credit would be to meet short-term funding requirements related to deposit account overdrafts and client fund obligations arising from electronic payment transactions on behalf of clients in the ordinary course of business, if necessary.
No
amounts were outstanding against these lines of credit during fiscal
2014
or as of
May 31, 2014
.
Certain of the financial institutions are also parties to the Company’s credit facility and irrevocable standby letters of credit, which are discussed below.
Credit facility
: In June 2013, the Company entered into a committed, unsecured,
five
-year syndicated credit facility, expiring on
June 21, 2018
. Under the credit facility, Paychex of New York LLP (the “Borrower”) may, subject to certain restrictions, borrow up to
$500 million
to meet short-term funding requirements. The obligations under this facility have been guaranteed by the Company and certain of its subsidiaries. The outstanding obligations under this credit facility will bear interest at competitive rates to be elected by the Borrower. Upon expiration of the commitment in June 2018, any borrowings outstanding will mature and be payable on such date.
There were
no
amounts outstanding under this credit facility as of
May 31, 2014
. During
fiscal 2014
, the Company borrowed against this facility, for one day each, as follows:
|
$ in millions
Fiscal quarter
|
Amount borrowed
|
Interest rate
|
|||||
|
First quarter
|
$
|
25.0
|
|
3.25
|
%
|
||
|
Second quarter
|
$
|
175.0
|
|
3.25
|
%
|
||
55
Certain lenders under this credit facility, and their respective affiliates, have performed, and may in the future perform for the Company and its subsidiaries, various commercial banking, investment banking, underwriting, and other financial advisory services, for which they have received, and will continue to receive in the future, customary fees and expenses.
Letters of credit:
The Company had irrevocable standby letters of credit outstanding totaling
$43.0 million
and
$36.8 million
as of
May 31, 2014
and
May 31, 2013
, respectively, required to secure commitments for certain insurance policies. The letters of credit expire at various dates between
July 2014 and April 2015
, and are collateralized by securities held in the Company’s investment portfolios.
No
amounts were outstanding on these letters of credit during fiscal
2014
or as of
May 31, 2014
. Subsequent to
May 31, 2014
, the letter of credit expiring in
July 2014
was renewed, with the same terms and amount, and will expire in
July 2015
.
Contingencies:
The Company is subject to various claims and legal matters that arise in the normal course of its business. These include disputes or potential disputes related to breach of contract, breach of fiduciary duty, employment-related claims, tax claims, and other matters.
The Company’s management currently believes that resolution of outstanding legal matters will not have a material adverse effect on the Company’s financial position or results of operations. However, legal matters are subject to inherent uncertainties and there exists the possibility that the ultimate resolution of these matters could have a material adverse impact on the Company’s financial position and the results of operations in the period in which any such effect is recorded.
Lease commitments:
The Company leases office space and data processing equipment under terms of various operating leases. Rent expense for fiscal years
2014
,
2013
, and
2012
was
$39.1 million
,
$39.9 million
, and
$43.0 million
, respectively. As of
May 31, 2014
, future minimum lease payments under various non-cancelable operating leases with terms of more than one year are as follows:
|
In millions
Year ending May 31,
|
Minimum lease payments
|
|||
|
2015
|
$
|
37.5
|
|
|
|
2016
|
29.0
|
|
||
|
2017
|
23.9
|
|
||
|
2018
|
17.0
|
|
||
|
2019
|
10.6
|
|
||
|
Thereafter
|
11.2
|
|
||
Other commitments:
As of
May 31, 2014
, the Company had outstanding commitments under purchase orders and legally binding contractual arrangements with minimum future payment obligations of approximately
$88.9 million
, including
$16.0 million
of commitments to purchase capital assets. These minimum future payment obligations relate to the following fiscal years:
|
In millions
Year ending May 31,
|
Minimum payment obligation
|
|||
|
2015
|
$
|
61.3
|
|
|
|
2016
|
16.6
|
|
||
|
2017
|
10.2
|
|
||
|
2018
|
0.3
|
|
||
|
2019
|
0.2
|
|
||
|
Thereafter
|
0.3
|
|
||
In the normal course of business, the Company makes representations and warranties that guarantee the performance of services under service arrangements with clients. Historically, there have been no material losses related to such guarantees. In addition, the Company has entered into indemnification agreements with its officers and directors, which require the Company to defend and, if necessary, indemnify these individuals for certain pending or future claims as they relate to their services provided to the Company.
56
Paychex currently self-insures the deductible portion of various insured exposures under certain employee benefit plans. The Company’s estimated loss exposure under these insurance arrangements is recorded in other current liabilities on the Consolidated Balance Sheets. Historically, the amounts accrued have not been material and are not material as of the reporting date. The Company also maintains insurance coverage in addition to its purchased primary insurance policies for gap coverage for employment practices liability, errors and omissions, warranty liability, theft and embezzlement, cyber threats, and acts of terrorism; and capacity for deductibles and self-insured retentions through its captive insurance company.
Note N — Related Parties
During fiscal years
2014
,
2013
, and
2012
, the Company purchased approximately
$4.7 million
,
$6.5 million
, and
$2.6 million
, respectively, of data processing equipment and software from EMC Corporation. The Chairman, President, and Chief Executive Officer of EMC Corporation is a member of the Company’s Board.
During fiscal years
2014
,
2013
, and
2012
, the Company purchased approximately
$1.3 million
,
$1.6 million
, and
$1.8 million
, respectively, of office supplies from Staples, Inc. The Vice Chairman of Staples, Inc. is a member of the Company’s Board.
Note O — Quarterly Financial Data (Unaudited)
In millions, except per share amounts
With the introduction of a new health insurance offering within the PEO during fiscal 2014, the Company began classifying PEO direct costs related to certain benefit plans where the Company retains risk as operating expenses rather than as a reduction in service revenue. This had no impact on operating income. The amounts below for service revenue and total revenue for fiscal 2014 reflect this change in classification.
|
|
Three Months Ended
|
|
||||||||||||||||||
|
Fiscal 2014
|
August 31
|
November 30
|
February 28
|
May 31
|
Full Year
|
|||||||||||||||
|
Service revenue
(1)
|
$
|
603.1
|
|
$
|
606.4
|
|
$
|
639.9
|
|
$
|
628.8
|
|
$
|
2,478.2
|
|
|||||
|
Interest on funds held for clients
|
10.0
|
|
10.0
|
|
10.5
|
|
10.2
|
|
40.7
|
|
||||||||||
|
Total revenue
(1)
|
613.1
|
|
616.4
|
|
650.4
|
|
639.0
|
|
2,518.9
|
|
||||||||||
|
Operating income
|
255.1
|
|
248.6
|
|
250.7
|
|
228.3
|
|
982.7
|
|
||||||||||
|
Investment income, net
|
1.2
|
|
1.3
|
|
1.5
|
|
1.4
|
|
5.4
|
|
||||||||||
|
Income before income taxes
|
256.3
|
|
249.9
|
|
252.2
|
|
229.7
|
|
988.1
|
|
||||||||||
|
Income taxes
|
93.5
|
|
91.2
|
|
92.1
|
|
83.8
|
|
360.6
|
|
||||||||||
|
Net income
|
$
|
162.8
|
|
$
|
158.7
|
|
$
|
160.1
|
|
$
|
145.9
|
|
$
|
627.5
|
|
|||||
|
Basic earnings per share
(2)
|
$
|
0.45
|
|
$
|
0.43
|
|
$
|
0.44
|
|
$
|
0.40
|
|
$
|
1.72
|
|
|||||
|
Diluted earnings per share
(2)
|
$
|
0.44
|
|
$
|
0.43
|
|
$
|
0.44
|
|
$
|
0.40
|
|
$
|
1.71
|
|
|||||
|
Weighted-average common shares outstanding
|
365.3
|
|
364.9
|
|
364.2
|
|
363.5
|
|
364.5
|
|
||||||||||
|
Weighted-average common shares outstanding, assuming dilution
|
366.7
|
|
366.4
|
|
365.8
|
|
365.3
|
|
366.1
|
|
||||||||||
|
Cash dividends per common share
|
$
|
0.35
|
|
$
|
0.35
|
|
$
|
0.35
|
|
$
|
0.35
|
|
$
|
1.40
|
|
|||||
|
Total net realized gains
(3)
|
$
|
0.2
|
|
$
|
—
|
|
$
|
0.3
|
|
$
|
0.1
|
|
$
|
0.6
|
|
|||||
57
|
|
Three Months Ended
|
|
||||||||||||||||||
|
Fiscal 2013
|
August 31
|
November 30
|
February 28
|
May 31
(4)
|
Full Year
|
|||||||||||||||
|
Service revenue
|
$
|
568.1
|
|
$
|
559.4
|
|
$
|
582.4
|
|
$
|
575.3
|
|
$
|
2,285.2
|
|
|||||
|
Interest on funds held for clients
|
10.1
|
|
10.0
|
|
10.9
|
|
10.0
|
|
41.0
|
|
||||||||||
|
Total revenue
|
578.2
|
|
569.4
|
|
593.3
|
|
585.3
|
|
2,326.2
|
|
||||||||||
|
Operating income
|
238.0
|
|
230.0
|
|
225.0
|
|
211.8
|
|
904.8
|
|
||||||||||
|
Investment income, net
|
1.9
|
|
1.9
|
|
1.4
|
|
1.4
|
|
6.6
|
|
||||||||||
|
Income before income taxes
|
239.9
|
|
231.9
|
|
226.4
|
|
213.2
|
|
911.4
|
|
||||||||||
|
Income taxes
|
86.8
|
|
84.0
|
|
81.9
|
|
89.7
|
|
342.4
|
|
||||||||||
|
Net income
|
$
|
153.1
|
|
$
|
147.9
|
|
$
|
144.5
|
|
$
|
123.5
|
|
$
|
569.0
|
|
|||||
|
Basic earnings per share
(2)
|
$
|
0.42
|
|
$
|
0.41
|
|
$
|
0.40
|
|
$
|
0.34
|
|
$
|
1.56
|
|
|||||
|
Diluted earnings per share
(2)
|
$
|
0.42
|
|
$
|
0.41
|
|
$
|
0.40
|
|
$
|
0.34
|
|
$
|
1.56
|
|
|||||
|
Weighted-average common shares outstanding
|
363.0
|
|
363.6
|
|
363.8
|
|
364.6
|
|
363.8
|
|
||||||||||
|
Weighted-average common shares outstanding, assuming dilution
|
363.8
|
|
364.4
|
|
364.6
|
|
365.9
|
|
364.7
|
|
||||||||||
|
Cash dividends per common share
(5)
|
$
|
0.32
|
|
$
|
0.33
|
|
$
|
0.66
|
|
$
|
—
|
|
$
|
1.31
|
|
|||||
|
Total net realized gains
(3)
|
$
|
0.2
|
|
$
|
0.1
|
|
$
|
0.6
|
|
$
|
—
|
|
$
|
0.9
|
|
|||||
|
(1)
|
The amounts reported for service revenue and total revenue for the first through third quarters of fiscal 2014 differ from that reported in the Company's Quarterly Reports on Form 10-Q (“Form 10-Q”), as a result of the PEO direct cost adjustment. There was no impact to operating income from this change. The correction for the PEO direct cost adjustment was not material to any prior interim period in fiscal 2014. Service revenue, as reported in the Company's Form 10-Qs was
$597.9 million
,
$600.5 million
, and
$626.0 million
for the first, second, and third fiscal quarters of fiscal 2014, respectively. Total revenue, as reported in the Company's Form 10-Qs was
$607.9 million
,
$610.5 million
, and
$636.5 million
for the first, second, and third fiscal quarters of fiscal 2014, respectively.
|
|
(2)
|
Each quarter is a discrete period and the sum of the four quarters’ basic and diluted earnings per share amounts may not equal the full year amount.
|
|
(3)
|
Total net realized gains on the combined funds held for clients and corporate investment portfolios.
|
|
(4)
|
In the fourth quarter of fiscal 2013, the Company increased its tax provision related to the settlement of a state income tax matter. This reduced diluted earnings per share by approximately
$0.04
per share.
|
|
(5)
|
In fiscal 2013, the Company accelerated the payment of dividends to December 2012. These dividends would have normally been paid in February 2013 and May 2013.
|
58
Schedule II — Valuation and Qualifying Accounts
PAYCHEX, INC.
CONSOLIDATED FINANCIAL STATEMENT SCHEDULE
FOR THE YEAR ENDED MAY 31,
(In millions)
|
Description
|
Balance as of
beginning
of fiscal year
|
Additions
charged to
expenses
|
(Deductions from)/ additions
to other accounts
(1)
|
Costs and
deductions
(2)
|
Balance as
of end
of fiscal year
|
|||||||||||||||
|
2014
|
||||||||||||||||||||
|
Allowance for doubtful accounts
|
$
|
1.0
|
|
$
|
2.5
|
|
$
|
—
|
|
$
|
2.0
|
|
$
|
1.5
|
|
|||||
|
Reserve for client fund losses
|
$
|
2.4
|
|
$
|
2.2
|
|
$
|
—
|
|
$
|
2.7
|
|
$
|
1.9
|
|
|||||
|
2013
|
||||||||||||||||||||
|
Allowance for doubtful accounts
|
$
|
1.2
|
|
$
|
1.7
|
|
$
|
—
|
|
$
|
1.9
|
|
$
|
1.0
|
|
|||||
|
Reserve for client fund losses
|
$
|
2.1
|
|
$
|
2.7
|
|
$
|
—
|
|
$
|
2.4
|
|
$
|
2.4
|
|
|||||
|
2012
|
||||||||||||||||||||
|
Allowance for doubtful accounts
|
$
|
2.1
|
|
$
|
1.2
|
|
$
|
—
|
|
$
|
2.1
|
|
$
|
1.2
|
|
|||||
|
Reserve for client fund losses
|
$
|
3.1
|
|
$
|
2.3
|
|
$
|
(0.7
|
)
|
$
|
2.6
|
|
$
|
2.1
|
|
|||||
|
(1)
|
Amounts related to business acquisitions.
|
|
(2)
|
Uncollectible amounts written off, net of recoveries.
|
|
Item 9.
|
Changes in and Disagreements with Accountants on Accounting and Financial Disclosure
|
None.
|
Item 9A.
|
Controls and Procedures
|
Disclosure Controls and Procedures:
Disclosure controls and procedures are designed with the objective of ensuring that information required to be disclosed in the Company’s reports filed under the Exchange Act, such as this report, is recorded, processed, summarized and reported within the time periods specified in the SEC’s rules and forms. Disclosure controls and procedures are also designed with the objective of ensuring that such information is accumulated and communicated to the Company’s management, including the Company’s principal executive officer and principal financial officer, as appropriate, to allow timely decisions regarding required disclosure.
Conclusion Regarding the Effectiveness of Disclosure Controls and Procedures:
As of the end of the period covered by this report, the Company carried out an evaluation, under the supervision and with the participation of the Company’s principal executive officer and principal financial officer, of the effectiveness of disclosure controls and procedures as defined in Rules 13a-15(e) and 15d-15(e) of the Exchange Act. Based on such evaluation, the Company’s principal executive officer and principal financial officer have concluded that as of May 31, 2014, the end of the period covered by this report, the Company’s disclosure controls and procedures were effective.
Changes in Internal Controls Over Financial Reporting:
The Company also carried out an evaluation of the internal control over financial reporting to determine whether any changes occurred during the quarter ended May 31, 2014. Based on such evaluation, there have been no changes in the Company’s internal controls over financial reporting that occurred during the Company’s most recently completed fiscal quarter ended
May 31, 2014
, that materially affected, or are reasonably likely to materially affect, the Company’s internal control over financial reporting.
Internal Control Over Financial Reporting:
The Report on Management’s Assessment of Internal Control Over Financial Reporting and the Report of Independent Registered Public Accounting Firm are incorporated herein by reference from Part II, Item 8 of this Form 10-K.
59
|
Item 9B.
|
Other Information
|
None.
|
Item 10.
|
Directors, Executive Officers and Corporate Governance
|
The following table shows the executive officers of the Company as of
May 31, 2014
, and information regarding their positions and business experience. Such executive officers hold principal policy-making powers at the Company.
|
Name
|
Age
|
Position and business experience
|
||
|
Martin Mucci
|
54
|
Mr. Mucci has served as President and Chief Executive Officer of the Company since September 2010. Mr. Mucci joined the Company in 2002 as Senior Vice President, Operations. Prior to joining Paychex, he held senior level positions with Frontier Telephone of Rochester, a telecommunications company, during his 20-year career. Mr. Mucci is a director of Cbeyond, Inc. He is a member of the Upstate New York Advisory Board of the Federal Reserve Bank of New York and is a Trustee Emeritus of St. John Fisher College. He also serves as a director of the Company and is chairman of the Executive Committee.
|
||
|
Efrain Rivera
|
57
|
Mr. Rivera joined Paychex in June 2011 as Senior Vice President, Chief Financial Officer, and Treasurer. Prior to joining the Company, Mr. Rivera served as Vice President of Finance and Administration for Houghton College since 2009. He previously served for over twenty years with Bausch & Lomb Incorporated, a world leader in the development, manufacture, and marketing of eye health products, most recently as Corporate Vice President and Chief Financial Officer from 2007 to 2009.
|
||
|
Mark A. Bottini
|
53
|
Mr. Bottini joined Paychex in October 2011 as Senior Vice President of Sales. From 2008 to 2011, Mr. Bottini served as Vice President of Sales for Ricoh, North America, a provider of advanced office technology and innovative document imaging products, services, and software. He assumed his most recent position with Ricoh when Ricoh acquired IKON Office Solutions, Inc. During his nearly 20 years with IKON, Mr. Bottini served in a variety of sales leadership and field management roles.
|
||
|
John B. Gibson
|
48
|
Mr. Gibson joined Paychex in May 2013 as Senior Vice President of Service. Prior to joining the Company, Mr. Gibson served as President and Chief Executive Officer for AlphaStaff, a national provider of human resource outsourcing services to small and medium-sized businesses. Prior to joining AlphaStaff in 2010, Mr. Gibson was President of the HR Management Division of Convergys, a global leader in technology, outsourcing, and business services. From 2004 to 2007, he served as Senior Vice President of Global Operations and Client Services of Convergys.
|
||
|
Michael E. Gioja
|
56
|
Mr. Gioja was named Senior Vice President of Information Technology, Product Management, and Development in July 2011. Mr. Gioja has been with the Company since November 2008 as Vice President of Product Management, subsequently adding development and information technology to his responsibilities. Previously, he was Chief Information Officer and Executive Vice President of Products and Services for Workstream, Inc., a provider of on-demand enterprise talent management solutions and services.
|
||
60
|
Name
|
Age
|
Position and business experience
|
||
|
Kevin N. Hill
|
55
|
Mr. Hill was named Vice President of Insurance and Human Resource Solutions Services in October 2011. He joined Paychex in April 2008 as Vice President of Insurance Operations, and took on the role of Vice President of Insurance Sales and Operations in 2010. Mr. Hill also serves as President of Paychex Insurance Agency, Inc., and has executive leadership responsibility for BeneTrac. In July 2011, he also took on leadership of the PEO and the HR Services operations organizations. Prior to joining Paychex, Mr. Hill was President and Chief Operating Officer of Excellus BlueCross BlueShield. Mr. Hill held various executive positions during his ten years with Excellus BlueCross BlueShield.
|
||
|
Stephanie L. Schaeffer
|
44
|
Ms. Schaeffer was named Vice President and Chief Legal Officer in January 2006. In 2011, she was appointed Corporate Secretary. She joined Paychex in 2000 as Corporate Counsel and was promoted to Director of Legal Affairs in 2004. In her current role, she is responsible for overseeing all of the Company's legal functions, including litigation, corporate governance, and regulatory matters.
|
||
|
Jennifer Vossler
|
51
|
Ms. Vossler joined the Company in May 2009 as Vice President and Controller. Prior to joining the Company, she served as Vice President and Corporate Controller, and held various executive and senior management positions during her eleven years at Bausch & Lomb Incorporated. Previously in her career, she held leadership roles with a global facilities management outsourcing company and a public accounting firm.
|
||
|
Laurie L. Zaucha
|
49
|
Ms. Zaucha joined the Company in March 2011 and was named Vice President of Human Resources and Organizational Development. Prior to joining the Company, she served as Senior Vice President of Human Resources for Paetec Holding Corp., a Fortune 1000 telecommunications company, from 2007 to 2011. From 2003 to 2007, she held various executive positions at Bausch & Lomb Incorporated.
|
||
The additional information required by this item is set forth in the Company’s Definitive Proxy Statement for its
2014
Annual Meeting of Stockholders, anticipated to be held on or about
October 15, 2014
, in the sections “PROPOSAL 1 — ELECTION OF DIRECTORS FOR A ONE-YEAR TERM,” “CORPORATE GOVERNANCE,” “SECTION 16(a) BENEFICIAL OWNERSHIP REPORTING COMPLIANCE,” and “CODE OF BUSINESS ETHICS AND CONDUCT” and is incorporated herein by reference.
|
Item 11.
|
Executive Compensation
|
The information required by this item is set forth in the Company’s Definitive Proxy Statement for its
2014
Annual Meeting of Stockholders, anticipated to be held on or about
October 15, 2014
, in the sections “COMPENSATION DISCUSSION AND ANALYSIS,” “NAMED EXECUTIVE OFFICER COMPENSATION,” and “DIRECTOR COMPENSATION FOR THE FISCAL YEAR ENDED
MAY 31, 2014
,” and is incorporated herein by reference.
|
Item 12.
|
Security Ownership of Certain Beneficial Owners and Management and Related Stockholder Matters
|
The information required by this item is set forth below and in the Company’s Definitive Proxy Statement for its
2014
Annual Meeting of Stockholders, anticipated to be held on or about
October 15, 2014
, under the section “BENEFICIAL OWNERSHIP OF PAYCHEX COMMON STOCK,” and is incorporated herein by reference.
The Company maintains equity compensation plans in the form of stock incentive plans. Under the Paychex, Inc. 2002 Stock Incentive Plan, as amended and restated (the “2002 Plan”), non-qualified or incentive stock options, restricted stock, restricted stock units, performance shares, and performance stock options have been awarded to employees and the Board. The 2002 Plan was adopted on July 7, 2010 by the Board and became effective upon stockholder approval at the Company’s Annual Meeting of Stockholders held on October 13, 2010. Refer to Note D of the Notes to Consolidated Financial Statements, contained in Item 8 of this Form 10-K, for more information on the Company’s stock incentive plans.
61
The following table details information on securities authorized for issuance under the Company’s stock incentive plans as of
May 31, 2014
:
|
In millions, except per share amounts
|
Number of
securities to be
issued upon
exercise of
outstanding options
|
Weighted-average
exercise price of
outstanding options
|
Number of
securities
remaining available
for future issuance
under equity
compensation plans
|
|||
|
Equity compensation plans approved by security holders
(1)
|
8.2
|
$33.06
|
20.2
|
|||
|
(1)
|
Amounts include performance stock options granted, assuming achievement of performance goals at target. Actual amount of shares to be earned may differ from the target amount.
|
|
Item 13.
|
Certain Relationships and Related Transactions, and Director Independence
|
The information required by this item is set forth in the Company’s Definitive Proxy Statement for its
2014
Annual Meeting of Stockholders, anticipated to be held on or about
October 15, 2014
, under the sub-headings “Board Meetings and Committees” and “Policy on Transactions with Related Persons” within the section “CORPORATE GOVERNANCE,” and is incorporated herein by reference.
|
Item 14.
|
Principal Accounting Fees and Services
|
The information required by this item is set forth in the Company’s Definitive Proxy Statement for its
2014
Annual Meeting of Stockholders, anticipated to be held on or about
October 15, 2014
, under the section “PROPOSAL 3 — RATIFICATION OF SELECTION OF INDEPENDENT REGISTERED PUBLIC ACCOUNTING FIRM,” and is incorporated herein by reference.
|
Item 15.
|
Exhibits and Financial Statement Schedules
|
|
(a)
|
Financial Statements, Financial Statement Schedules, and Exhibits
|
|||
|
1.
|
Financial Statements
See Financial Statements and Supplementary Data Table of Contents at page 30.
|
|||
|
2.
|
Financial Statement Schedules
|
|||
|
Financial statement schedules required to be filed by Item 8 of this Form 10-K include Schedule II — Valuation and Qualifying Accounts. See Financial Statements and Supplementary Data Table of Contents at page 30. All other schedules are omitted as the required matter is not present, the amounts are not significant, or the information is shown in the financial statements or the notes thereto.
|
||||
|
3.
|
Exhibits
|
|||
|
(3)(a)
|
Restated Certificate of Incorporation, incorporated herein by reference from Exhibit 3(a) to the Company’s Form 10-K filed with the Commission on July 20, 2004.
|
|||
|
(3)(b)
|
Bylaws, as amended, incorporated herein by reference from Exhibit 3(b) to the Company’s Form 10-K filed with the Commission on July 21, 2006.
|
|||
|
#
|
(10.1)
|
Paychex, Inc. 2002 Stock Incentive Plan (as amended and restated effective October 13, 2010), incorporated herein by reference from Exhibit 4.1 to the Company’s Registration Statement on Form S-8, No. 333-170871.
|
||
|
#
|
(10.2)
|
Paychex, Inc. 2002 Stock Incentive Plan (as amended and restated effective October 12, 2005) Award Agreement for Non-Qualified Stock Options, incorporated herein by reference from Exhibit 10.3 to the Company’s Form 8-K filed with the Commission on October 17, 2005.
|
||
|
#
|
(10.3)
|
Paychex, Inc. 2002 Stock Incentive Plan (as amended and restated effective October 12, 2005) Restricted Stock Award Agreement, incorporated herein by reference from Exhibit 10.1 to the Company’s Form 8-K filed with the Commission on July 16, 2008.
|
||
62
|
#
|
(10.4)
|
Paychex, Inc. 2002 Stock Incentive Plan (as amended and restated effective October 12, 2005) Form of Non-Qualified Stock Option Award Agreement, incorporated herein by reference from Exhibit 10.2 to the Company’s Form 8-K filed with the Commission on July 16, 2008.
|
||
|
#
|
(10.5)
|
Paychex, Inc. 2002 Stock Incentive Plan (as amended and restated effective October 12, 2005) Form of Restricted Stock Unit Award Agreement, incorporated herein by reference from Exhibit 10(n) to the Company’s Form 10-K filed with the Commission on July 18, 2008.
|
||
|
#
|
(10.6)
|
Paychex, Inc. 2002 Stock Incentive Plan (as amended and restated effective October 12, 2005) Form of Non-Qualified Stock Option Agreement for Directors, incorporated herein by reference from Exhibit 10(q) to the Company’s Form 10-K filed with the Commission on July 18, 2008.
|
||
|
#
|
(10.7)
|
Paychex, Inc. 2002 Stock Incentive Plan (as amended and restated effective October 12, 2005) Form of Restricted Stock Award Agreement (Officer), incorporated herein by reference from Exhibit 10.16 to the Company’s Form 10-K filed with the Commission on July 20, 2009.
|
||
|
#
|
(10.8)
|
Paychex, Inc. 2002 Stock Incentive Plan (as amended and restated effective October 12, 2005) 2009 Non-Qualified Stock Option Award Agreement (Special Grant), incorporated herein by reference from Exhibit 10.17 to the Company’s Form 10-K filed with the Commission on July 20, 2009.
|
||
|
#
|
(10.9)
|
Paychex, Inc. 2002 Stock Incentive Plan (as amended and restated effective October 12, 2005) Form of Restricted Stock Award Agreement (Officer), incorporated herein by reference from Exhibit 10.18 to the Company’s Form 10-K filed with the Commission on July 16, 2010.
|
||
|
#
|
(10.10)
|
Paychex, Inc. 2002 Stock Incentive Plan (as amended and restated effective October 12, 2005) Form of Non-Qualified Stock Option Award Agreement (Officer), incorporated herein by reference from Exhibit 10.19 to the Company’s Form 10-K filed with the Commission on July 16, 2010.
|
||
|
#
|
(10.11)
|
Paychex, Inc. 2002 Stock Incentive Plan (as amended and restated effective October 12, 2005) Form of Officer Performance Incentive Award Agreement (Long Term), incorporated herein by reference from Exhibit 10.20 to the Company’s Form 10-K filed with the Commission on July 16, 2010.
|
||
|
#
|
(10.12)
|
Paychex, Inc. 2002 Stock Incentive Plan (as amended and restated effective October 13, 2010) Form of Non-Qualified Stock Option Award Agreement (Board), incorporated herein by reference from Exhibit 10.20 to the Company’s Form 10-K filed with the Commission on July 15, 2011.
|
||
|
#
|
(10.13)
|
Paychex, Inc. 2002 Stock Incentive Plan (as amended and restated effective October 13, 2010) Form of Restricted Stock Award Agreement (Board), incorporated herein by reference from Exhibit 10.21 to the Company’s Form 10-K filed with the Commission on July 15, 2011.
|
||
|
#
|
(10.14)
|
Paychex, Inc. 2002 Stock Incentive Plan (as amended and restated effective October 13, 2010) Form of Restricted Stock Unit (Special Retention) Award Agreement, incorporated herein by reference from Exhibit 10.22 to the Company’s Form 10-K filed with the Commission on July 15, 2011.
|
||
|
#
|
(10.15)
|
Paychex, Inc. 2002 Stock Incentive Plan (as amended and restated effective October 13, 2010) Form of Non-Qualified Stock Option Award Agreement (Officer) Long Term Incentive Program (“LTIP”), incorporated herein by reference from Exhibit 10.23 to the Company’s Form 10-K filed with the Commission on July 15, 2011.
|
||
|
#
|
(10.16)
|
Paychex, Inc. Change In Control Plan, incorporated herein by reference from Exhibit 10.24 to the Company’s Form 10-K filed with the Commission on July 15, 2011.
|
||
|
#
|
(10.17)
|
Paychex, Inc. Form of Performance Award Incentive Program, incorporated herein by reference from Exhibit 10.25 to the Company’s Form 10-K filed with the Commission on July 15, 2011.
|
||
|
#
|
(10.18)
|
Form of Indemnity Agreement for Directors and Officers, incorporated herein by reference from Exhibit 10.1 to the Company’s Form 10-Q filed with the Commission on March 28, 2012.
|
||
|
#
|
(10.19)
|
Paychex, Inc. Board Deferred Compensation Plan, incorporated herein by reference from Exhibit 10.29 to the Company’s Form 10-K filed with the Commission on July 20, 2009.
|
||
|
#
|
(10.20)
|
Paychex, Inc. Employee Deferred Compensation Plan, incorporated herein by reference from Exhibit 10.30 to the Company’s Form 10-K filed with the Commission on July 20, 2009.
|
||
|
(10.21)
|
Stock Purchase Plan Engagement Agreement between Paychex, Inc. and JP Morgan Securities LLC, dated as of March 26, 2013, incorporated herein by reference from Exhibit 10.1 to the Company’s Form 8-K filed with the Commission on March 29, 2013.
|
|||
|
*
|
(21.1)
|
Subsidiaries of the Registrant.
|
||
|
*
|
(23.1)
|
Consent of Independent Registered Public Accounting Firm, PricewaterhouseCoopers LLP.
|
||
|
*
|
(23.2)
|
Consent of Independent Registered Public Accounting Firm, Ernst & Young LLP.
|
||
|
*
|
(24.1)
|
Power of Attorney.
|
||
|
*
|
(31.1)
|
Certification Pursuant to Section 302 of the Sarbanes-Oxley Act of 2002.
|
||
|
*
|
(31.2)
|
Certification Pursuant to Section 302 of the Sarbanes-Oxley Act of 2002.
|
||
63
|
*
|
(32.1)
|
Certification Pursuant to 18 U.S.C. Section 1350, as Adopted Pursuant to Section 906 of the Sarbanes-Oxley Act of 2002.
|
||
|
*
|
(32.2)
|
Certification Pursuant to 18 U.S.C. Section 1350, as Adopted Pursuant to Section 906 of the Sarbanes-Oxley Act of 2002.
|
||
|
*
|
101.INS
|
XBRL instance document.
|
||
|
*
|
101.SCH
|
XBRL taxonomy extension schema document.
|
||
|
*
|
101.CAL
|
XBRL taxonomy extension calculation linkbase document.
|
||
|
*
|
101.LAB
|
XBRL taxonomy label linkbase document.
|
||
|
*
|
101.PRE
|
XBRL taxonomy extension presentation linkbase document.
|
||
|
*
|
101.DEF
|
XBRL taxonomy extension definition linkbase document.
|
||
|
*
|
Exhibit filed with this report.
|
|
#
|
Management contract or compensatory plan.
|
64
SIGNATURES
Pursuant to the requirements of Section 13 or 15(d) of the Securities Exchange Act of 1934, the registrant has duly caused this report to be signed on its behalf by the undersigned, thereunto duly authorized, on
July 22, 2014
.
PAYCHEX, INC.
By:
/s/ Martin Mucci
Martin Mucci
President and Chief Executive Officer
Pursuant to the requirements of the Securities Exchange Act of 1934, this report has been signed below by the following persons on behalf of the registrant and in the capacities indicated on
July 22, 2014
.
/s/ Martin Mucci
Martin Mucci, President and
Chief Executive Officer, and Director
(Principal Executive Officer)
/s/ Efrain Rivera
Efrain Rivera, Senior Vice President, Chief Financial Officer, and Treasurer
(Principal Financial Officer)
B. Thomas Golisano*, Chairman of the Board
Joseph G. Doody*, Director
David J. S. Flaschen*, Director
Phillip Horsley*, Director
Grant M. Inman*, Director
Pamela A. Joseph*, Director
Joseph M. Tucci*, Director
Joseph Velli*, Director
*By:
/s/ Martin Mucci
Martin Mucci, as Attorney-in-Fact
65
TABLE OF CONTENTS
Part IItem 1. BusinessItem 1A. Risk FactorsItem 1B. Unresolved Staff CommentsItem 2. PropertiesItem 3. Legal ProceedingsItem 4. Mine Safety DisclosuresPart IIItem 5. Market For Registrant S Common Equity, Related Stockholder Matters and Issuer Purchases Of Equity SecuritiesItem 6. Selected Financial DataItem 7. Management S Discussion and Analysis Of Financial Condition and Results Of OperationsItem 7A. Quantitative and Qualitative Disclosures About Market RiskItem 8. Financial Statements and Supplementary DataItem 9. Changes in and Disagreements with Accountants on Accounting and Financial DisclosureItem 9A. Controls and ProceduresItem 9B. Other InformationPart IIIItem 10. Directors, Executive Officers and Corporate GovernanceItem 11. Executive CompensationItem 12. Security Ownership Of Certain Beneficial Owners and Management and Related Stockholder MattersItem 13. Certain Relationships and Related Transactions, and Director IndependenceItem 14. Principal Accounting Fees and ServicesPart IVItem 15. Exhibits and Financial Statement Schedules