PBF ENERGY INC.
10-Ks and 10-Qs
|
|
|
|
|
|
|
|
|
|
|
|
|
|
|
|
|
|
|
|
|
|
|
|
|
|
|
|
|
|
|
|
|
|
|
|
|
|
|
|
|
|
|
|
|
|
|
UNITED STATES
SECURITIES AND EXCHANGE COMMISSION
Washington, D.C. 20549
FORM 10-K
(Mark one)
|
x
ANNUAL REPORT PURSUANT TO SECTION 13 OR 15(d) OF THE SECURITIES EXCHANGE ACT OF 1934
|
For the fiscal year ended:
December 31, 2018
Or
|
¨
TRANSITION REPORT PURSUANT TO SECTION 13 OR 15(d) OF THE SECURITIES EXCHANGE ACT OF 1934
|
For the transition period from to
Commission File Number: 001-35764
Commission File Number: 333-206728-02
PBF ENERGY INC.
PBF ENERGY COMPANY LLC
(Exact name of registrant as specified in its charter)
|
DELAWARE
DELAWARE
|
45-3763855
61-1622166
|
|
|
(State or other jurisdiction of
incorporation or organization)
|
(I.R.S. Employer
Identification No.)
|
|
|
One Sylvan Way, Second Floor
Parsippany, New Jersey |
07054
|
|
|
(Address of principal executive offices)
|
(Zip Code)
|
|
Registrants’ telephone number, including area code: (973) 455-7500
Securities registered pursuant to Section 12(b) of the Act:
|
Title of Each Class
|
Name of Each Exchange on Which Registered
|
|
|
Class A Common Stock, $0.001 par value
|
New York Stock Exchange
|
|
Securities registered pursuant to Section 12(g) of the Act: None.
Indicate by check mark if the registrant is a well-known seasoned issuer, as defined in Rule 405 of the Securities Act.
PBF Energy Inc.
x
Yes
¨
No
PBF Energy Company LLC
¨
Yes
x
No
Indicate by check mark if the registrant is not required to file reports pursuant to Section 13 or Section 15(d) of the Act.
PBF Energy Inc.
¨
Yes
x
No
PBF Energy Company LLC
¨
Yes
x
No
Indicate by check mark whether the registrant (1) has filed all reports required to be filed by Section 13 or 15(d) of the Securities Exchange Act of 1934 during the preceding 12 months (or for such shorter period that the registrant was required to file such reports); and (2) has been subject to such filing requirements for the past 90 days.
PBF Energy Inc.
x
Yes
¨
No
PBF Energy Company LLC
x
Yes
¨
No
Indicate by check mark whether the registrant has submitted electronically every Interactive Data File required to be submitted and posted pursuant to Rule 405 of Regulation S-T (§232.405 of this chapter) during the preceding 12 months (or for such shorter period that the registrant was required to submit and post such files).
PBF Energy Inc.
x
Yes
¨
No
PBF Energy Company LLC
x
Yes
¨
No
Indicate by check mark if disclosure of delinquent filers pursuant to Item 405 of Regulation S-K (§229.405 of this chapter) is not contained herein, and will not be contained, to the best of registrant’s knowledge, in definitive proxy or information statements incorporated by reference in Part III of this Form 10-K or any amendment to this Form 10-K.
PBF Energy Inc.
x
PBF Energy Company LLC
x
Indicate by check mark whether the registrant is a large accelerated filer, an accelerated filer, a non-accelerated filer, a smaller reporting company or an emerging growth company. See the definitions of “large accelerated filer,” “accelerated filer,” “smaller reporting company” and “emerging growth company” in Rule 12b-2 of the Exchange Act.
|
PBF Energy Inc.
|
Large accelerated
filer x |
Accelerated filer
¨
|
Non-accelerated filer
¨
|
Smaller reporting
company ¨ |
Emerging growth company
¨
|
|||||
|
PBF Energy Company LLC
|
Large accelerated
filer ¨ |
Accelerated filer
¨
|
Non-accelerated filer
x
|
Smaller reporting
company ¨ |
Emerging growth company
¨
|
|||||
If an emerging growth company, indicate by check mark if the registrant has elected not to use the extended transition period for complying with any new or revised financial accounting standards provided pursuant to Section 13(a) of the Exchange Act.
PBF Energy Inc.
¨
PBF Energy Company LLC
¨
Indicate by check mark whether the registrant is a shell company (as defined in Rule 12b-2 of the Exchange Act).
PBF Energy Inc.
¨
Yes
x
No
PBF Energy Company LLC
¨
Yes
x
No
The aggregate market value of the Common Stock of PBF Energy Inc. held by non-affiliates as of June 30, 2018 was
$4,728,225,380
based upon the New York Stock Exchange Composite Transaction closing price.
As of
February 19, 2019
, PBF Energy Inc. had outstanding
119,845,901
shares of Class A common stock and
20
shares of Class B common stock. PBF Energy Inc. is the sole managing member of, and owner of an equity interest representing approximately
99.0%
of the outstanding economic interest in PBF Energy Company LLC as of
December 31, 2018
. There is no trading in the membership interest of PBF Energy Company LLC and therefore an aggregate market value based on such is not determinable. PBF Energy Company LLC has no common stock outstanding.
DOCUMENTS INCORPORATED BY REFERENCE
PBF Energy Inc. intends to file with the Securities and Exchange Commission a definitive Proxy Statement for its Annual Meeting of Stockholders within 120 days after
December 31, 2018
. Portions of the Proxy Statement are incorporated by reference in Part III of this Form 10-K to the extent stated herein.
PBF ENERGY INC. AND PBF ENERGY COMPANY LLC
TABLE OF CONTENTS
|
PART I
|
|||
|
PART II
|
|||
|
PART III
|
|||
|
PART IV
|
|||
2
GLOSSARY OF SELECTED TERMS
Unless otherwise noted or indicated by context, the following terms used in this Annual Report on Form 10-K have the following meanings:
“AB32”
refers to the greenhouse gas emission control regulations in the state of California to comply with Assembly Bill 32.
“ASCI”
refers to the Argus Sour Crude Index, a pricing index used to approximate market prices for sour, heavy crude oil.
“Bakken”
refers to both a crude oil production region generally covering North Dakota, Montana and Western Canada, and the crude oil that is produced in that region.
“barrel”
refers to a common unit of measure in the oil industry, which equates to 42 gallons.
“blendstocks”
refers to various compounds that are combined with gasoline or diesel from the crude oil refining process to make finished gasoline and diesel; these may include natural gasoline, FCC unit gasoline, ethanol, reformate or butane, among others.
“bpd”
refers to an abbreviation for barrels per day.
“CAA”
refers to the Clean Air Act.
“CAM Pipeline”
or
“CAM Connection Pipeline”
refers to the Clovelly-Alliance-Meraux pipeline in Louisiana.
“CARB”
refers to the California Air Resources Board; gasoline and diesel fuel sold in the state of California are regulated by CARB and require stricter quality and emissions reduction performance than required by other states.
“catalyst”
refers to a substance that alters, accelerates, or instigates chemical changes, but is not produced as a product of the refining process.
“coke”
refers to a coal-like substance that is produced from heavier crude oil fractions during the refining process.
“complexity”
refers to the number, type and capacity of processing units at a refinery, measured by the Nelson Complexity Index, which is often used as a measure of a refinery’s ability to process lower quality crude in an economic manner.
“crack spread”
refers to a simplified calculation that measures the difference between the price for light products and crude oil. For example, we reference (a) the 2-1-1 crack spread, which is a general industry standard utilized by our Delaware City, Paulsboro and Chalmette refineries that approximates the per barrel refining margin resulting from processing two barrels of crude oil to produce one barrel of gasoline and one barrel of heating oil or ULSD and (b) the 4-3-1 crack spread, which is a benchmark utilized by our Toledo and Torrance refineries that approximates the per barrel refining margin resulting from processing four barrels of crude oil to produce three barrels of gasoline and one-half barrel of jet fuel and one-half barrel of ULSD.
“Dated Brent”
refers to Brent blend oil, a light, sweet North Sea crude oil, characterized by an API gravity of 38° and a sulfur content of approximately 0.4 weight percent that is used as a benchmark for other crude oils.
“distillates”
refers primarily to diesel, heating oil, kerosene and jet fuel.
3
“DNREC”
refers to the Delaware Department of Natural Resources and Environmental Control.
“downstream”
refers to the downstream sector of the energy industry generally describing oil refineries, marketing and distribution companies that refine crude oil and sell and distribute refined products. The opposite of the downstream sector is the upstream sector, which refers to exploration and production companies that search for and/or produce crude oil and natural gas underground or through drilling or exploratory wells.
“EPA”
refers to the United States Environmental Protection Agency.
“Ethanol Permit”
refers to a Coastal Zone Act permit for ethanol.
“ethanol”
refers to a clear, colorless, flammable oxygenated liquid. Ethanol is typically produced chemically from ethylene, or biologically from fermentation of various sugars from carbohydrates found in agricultural crops. It is used in the United States as a gasoline octane enhancer and oxygenate.
“feedstocks”
refers to crude oil and partially refined petroleum products that are processed and blended into refined products.
“FASB”
refers to the Financial Accounting Standards Board which develops U.S. generally accepted accounting principles.
“FCC”
refers to fluid catalytic cracking.
“FCU”
refers to fluid coking unit.
“FERC”
refers to the Federal Energy Regulatory Commission.
“GAAP”
refers to U.S. generally accepted accounting principles developed by the Financial Accounting Standards Board for nongovernmental entities.
“GHG”
refers to the greenhouse gas carbon dioxide.
“Group I base oils or lubricants”
refers to conventionally refined products characterized by sulfur content less than 0.03% with a viscosity index between 80 and 120. Typically, these products are used in a variety of automotive and industrial applications.
“heavy crude oil”
refers to a relatively inexpensive crude oil with a low API gravity characterized by high relative density and viscosity. Heavy crude oils require greater levels of processing to produce high value products such as gasoline and diesel.
“IDRs”
refers to incentive distribution rights.
“IPO”
refers to the initial public offering of PBF Energy Class A common stock which closed on December 18, 2012.
“J. Aron”
refers to J. Aron & Company, a subsidiary of The Goldman Sachs Group, Inc.
“KV”
refers to Kilovolts.
“LCM”
refers to a GAAP requirement for inventory to be valued at the lower of cost or market.
“light crude oil”
refers to a relatively expensive crude oil with a high API gravity characterized by low relative density and viscosity. Light crude oils require lower levels of processing to produce high value products such as gasoline and diesel.
4
“light products”
refers to the group of refined products with lower boiling temperatures, including gasoline and distillates.
“light-heavy differential”
refers to the price difference between light crude oil and heavy crude oil.
“LLS”
refers to Light Louisiana Sweet benchmark for crude oil reflective of Gulf coast economics for light sweet domestic and foreign crudes.
“LPG”
refers to liquefied petroleum gas.
“Maya”
refers to Maya crude oil, a heavy, sour crude oil characterized by an API gravity of approximately 22° and a sulfur content of approximately 3.3 weight percent that is used as a benchmark for other heavy crude oils.
“MLP”
refers to the master limited partnership.
“MMBTU”
refers to million British thermal units.
“MMSCFD”
refers to million standard cubic feet per day.
“MOEM Pipeline”
refers to a pipeline that originates at a terminal in Empire, Louisiana approximately 30 miles north of the mouth of the Mississippi River. The MOEM Pipeline is 14 inches in diameter, 54 miles long and transports crude from South Louisiana to the Chalmette refinery and transports Heavy Louisiana Sweet (HLS) and South Louisiana Intermediate (SLI) crude.
“MW”
refers to Megawatt.
“Nelson Complexity Index”
refers to the complexity of an oil refinery as measured by the Nelson Complexity Index, which is calculated on an annual basis by the Oil and Gas Journal. The Nelson Complexity Index assigns a complexity factor to each major piece of refinery equipment based on its complexity and cost in comparison to crude distillation, which is assigned a complexity factor of 1.0. The complexity of each piece of refinery equipment is then calculated by multiplying its complexity factor by its throughput ratio as a percentage of crude distillation capacity. Adding up the complexity values assigned to each piece of equipment, including crude distillation, determines a refinery’s complexity on the Nelson Complexity Index. A refinery with a complexity of 10.0 on the Nelson Complexity Index is considered ten times more complex than crude distillation for the same amount of throughput.
“NYH”
refers to the New York Harbor market value of petroleum products.
“NYMEX”
refers to the New York Mercantile Exchange.
“NYSE”
refers to the New York Stock Exchange.
“PADD”
refers to Petroleum Administration for Defense Districts.
“Platts”
refers to Platts, a division of The McGraw-Hill Companies.
“PPM”
refers to parts per million.
“RINS”
refers to renewable fuel credits required for compliance with the Renewable Fuel Standard.
“refined products”
refers to petroleum products, such as gasoline, diesel and jet fuel, that are produced by a refinery.
“sour crude oil”
refers to a crude oil that is relatively high in sulfur content, requiring additional processing to remove the sulfur. Sour crude oil is typically less expensive than sweet crude oil.
5
“Saudi Aramco”
refers to Saudi Arabian Oil Company.
“SEC”
refers to the United States Securities and Exchange Commission.
“Sunoco”
refers to Sunoco, LLC.
“sweet crude oil”
refers to a crude oil that is relatively low in sulfur content, requiring less processing to remove the sulfur than sour crude oil. Sweet crude oil is typically more expensive than sour crude oil.
“Syncrude”
refers to a blend of Canadian synthetic oil, a light, sweet crude oil, typically characterized by API gravity between 30° and 32° and a sulfur content of approximately 0.1-0.2 weight percent.
“TCJA”
refers to the U.S. government comprehensive tax legislation enacted on December 22, 2017 and commonly referred to as the Tax Cuts and Jobs Act.
“throughput”
refers to the volume processed through a unit or refinery.
“turnaround”
refers to a periodically required shutdown and comprehensive maintenance event to refurbish and maintain a refinery unit or units that involves the inspection of such units and occurs generally on a periodic cycle.
“ULSD”
refers to ultra-low-sulfur diesel.
“Valero”
refers to Valero Energy Corporation.
“WCS”
refers to Western Canadian Select, a heavy, sour crude oil blend typically characterized by API gravity between 20° and 22° and a sulfur content of approximately 3.5 weight percent that is used as a benchmark for heavy Western Canadian crude oil.
“WTI”
refers to West Texas Intermediate crude oil, a light, sweet crude oil, typically characterized by API gravity between 38° and 40° and a sulfur content of approximately 0.3 weight percent that is used as a benchmark for other crude oils.
“WTS”
refers to West Texas Sour crude oil, a sour crude oil characterized by API gravity between 30° and 33° and a sulfur content of approximately 1.28 weight percent that is used as a benchmark for other sour crude oils.
“yield”
refers to the percentage of refined products that is produced from crude oil and other feedstocks.
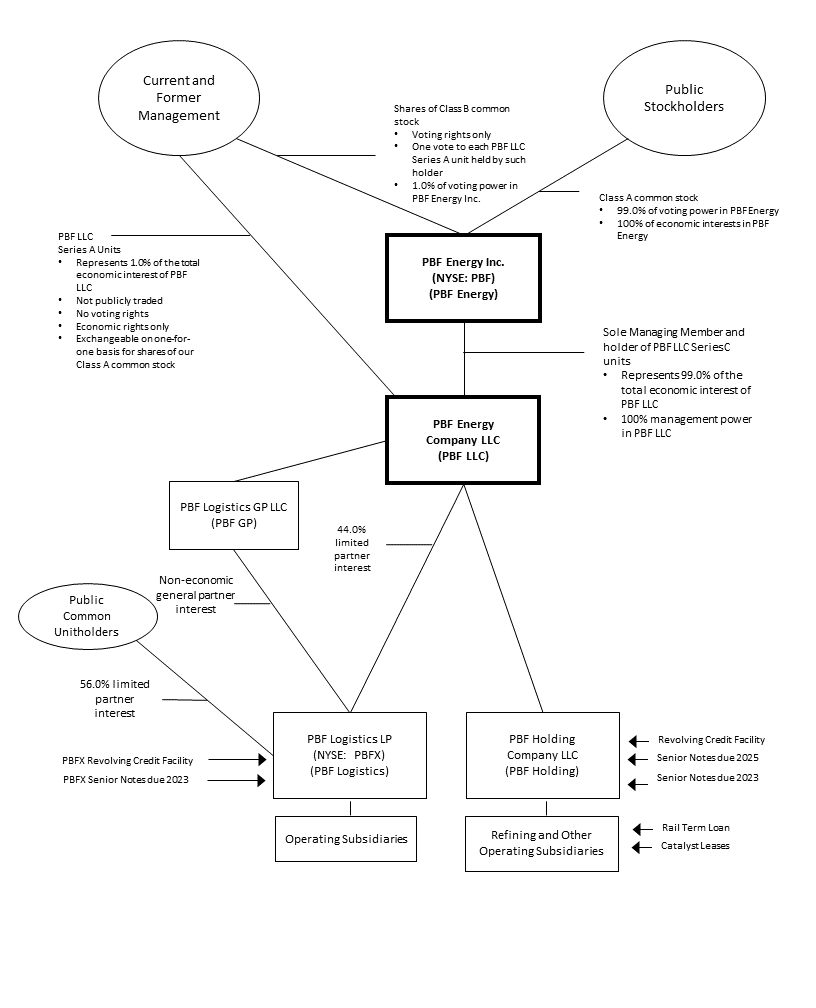
Explanatory Note
This Annual Report on Form 10-K is filed by PBF Energy Inc. (“PBF Energy”) and PBF Energy Company LLC (“PBF LLC”). Each Registrant hereto is filing on its own behalf all of the information contained in this report that relates to such Registrant. Each Registrant hereto is not filing any information that does not relate to such Registrant, and therefore makes no representation as to any such information. PBF Energy is a holding company whose primary asset is an equity interest in PBF LLC. PBF Energy is the sole managing member of, and owner of an equity interest representing approximately
99.0%
of the outstanding economic interests in PBF LLC as of
December 31, 2018
. PBF Energy operates and controls all of the business and affairs and consolidates the financial results of PBF LLC and its subsidiaries. PBF LLC is a holding company for the companies that directly and indirectly own and operate the business. As of
December 31, 2018
, PBF LLC also holds a
44.0%
limited partner interest, a non-economic general partner interest and all of the incentive distribution rights in PBFX, a publicly-traded master limited partnership (“MLP”).
6
PART I
This Annual Report on Form 10-K is filed by PBF Energy and PBF LLC. Discussions or areas of this report that either apply only to PBF Energy or PBF LLC are clearly noted in such sections. Unless the context indicates otherwise, the terms “Company”, “we,” “us,” and “our” refer to both PBF Energy and PBF LLC and its consolidated subsidiaries, including PBF Holding Company LLC (“PBF Holding”), PBF Investments LLC (“PBF Investments”), Toledo Refining Company LLC (“Toledo Refining” or “TRC”), Paulsboro Refining Company LLC (“Paulsboro Refining” or “PRC”), Delaware City Refining Company LLC (“Delaware City Refining” or “DCR”), Chalmette Refining, L.L.C. (“Chalmette Refining”), PBF Western Region LLC (“PBF Western Region”), Torrance Refining Company LLC (“Torrance Refining”), Torrance Logistics Company LLC (“Torrance Logistics”), PBF Logistics GP LLC (“PBF GP”) and PBF Logistics LP (“PBFX”).
In this Annual Report on Form 10-K, we make certain forward-looking statements, including statements regarding our plans, strategies, objectives, expectations, intentions, and resources, under the safe harbor provisions of the Private Securities Litigation Reform Act of 1995 to the extent such statements relate to the operations of an entity that is not a limited liability company or a partnership. You should read our forward-looking statements together with our disclosures under the heading: “Cautionary Statement for the Purpose of Safe Harbor Provisions of the Private Securities Litigation Reform Act of 1995.” When considering forward-looking statements, you should keep in mind the risk factors and other cautionary statements set forth in this Annual Report on Form 10-K under “Risk Factors” in Item 1A.
7
ITEM. 1 BUSINESS
Overview and Corporate Structure
We are one of the largest independent petroleum refiners and suppliers of unbranded transportation fuels, heating oil, petrochemical feedstocks, lubricants and other petroleum products in the United States. We sell our products throughout the Northeast, Midwest, Gulf Coast and West Coast of the United States, as well as in other regions of the United States, Canada and Mexico and are able to ship products to other international destinations. We were formed in 2008 to pursue acquisitions of crude oil refineries and downstream assets in North America. As of
December 31, 2018
, we own and operate five domestic oil refineries and related assets, which we acquired in 2010, 2011, 2015 and 2016. Our refineries have a combined processing capacity, known as throughput, of approximately 900,000 barrels per day (“bpd”), and a weighted-average Nelson Complexity Index of 12.2. We operate in two reportable business segments: Refining and Logistics.
PBF Energy was formed on November 7, 2011 and is a holding company whose primary asset is a controlling equity interest in PBF LLC. We are the sole managing member of PBF LLC and operate and control all of the business and affairs of PBF LLC. We consolidate the financial results of PBF LLC and its subsidiaries and record a noncontrolling interest in our consolidated financial statements representing the economic interests of the members of PBF LLC other than PBF Energy. PBF LLC is a holding company for the companies that directly or indirectly own and operate our business. PBF Holding is a wholly-owned subsidiary of PBF LLC and is the parent company for our refining operations. PBF Energy, through its ownership of PBF LLC, also consolidates the financial results of PBFX and records a noncontrolling interest for the economic interests in PBFX held by the public common unitholders of PBFX.
As of
December 31, 2018
, PBF Energy held
119,895,422
PBF LLC Series C Units and our current and former executive officers and directors and certain employees and others held
1,206,325
PBF LLC Series A Units (we refer to all of the holders of the PBF LLC Series A Units as “the members of PBF LLC other than PBF Energy”). As a result, the holders of PBF Energy’s issued and outstanding shares of its Class A common stock have approximately
99.0%
of the voting power in PBF Energy, and the members of PBF LLC other than PBF Energy through their holdings of Class B common stock have approximately
1.0%
of the voting power in PBF Energy.
On May 14, 2014, PBFX completed its initial public offering (the “PBFX Offering”). As of
December 31, 2018
, PBF LLC held a
44.0%
limited partner interest (consisting of
19,953,631
common units) in PBFX, with the remaining
56.0%
limited partner interest held by the public unitholders. PBF LLC also owned all of the incentive distribution rights (“IDRs”) and indirectly owns a non-economic general partner interest in PBFX through its wholly-owned subsidiary, PBF Logistics GP LLC (“PBF GP”), the general partner of PBFX. On February 13, 2019, PBFX entered into an Equity Restructuring Agreement (the “IDR Restructuring Agreement”) with PBF GP, pursuant to which the IDRs held by PBF LLC will be canceled and converted into newly issued PBFX common units (the “IDR Restructuring”). Prior to the IDR Restructuring, the IDRs entitled PBF LLC to receive increasing percentages, up to a maximum of 50.0%, of the cash PBFX distributed from operating surplus in excess of $0.345 per unit per quarter. The IDR Restructuring is expected to close on February 28, 2019. Subsequent to the closing of the IDR Restructuring, the IDRs will be canceled, no future distributions will be made to PBF LLC with respect to the IDRs and the newly issued common units will be entitled to normal distributions. As a result of the payment on May 31, 2017 by PBFX of its distribution for the first quarter of 2017, the financial tests required for conversion of all of PBFX’s previously outstanding subordinated units into common units were satisfied. In addition, all of PBFX’s subordinated units, which were owned by PBF LLC, converted on a one-for-one basis into common units effective June 1, 2017. The conversion of the subordinated units did not impact the amount of cash distributions paid by PBFX or the total number of its outstanding units. The subordinated units were issued by PBFX in connection with the PBFX Offering.
8
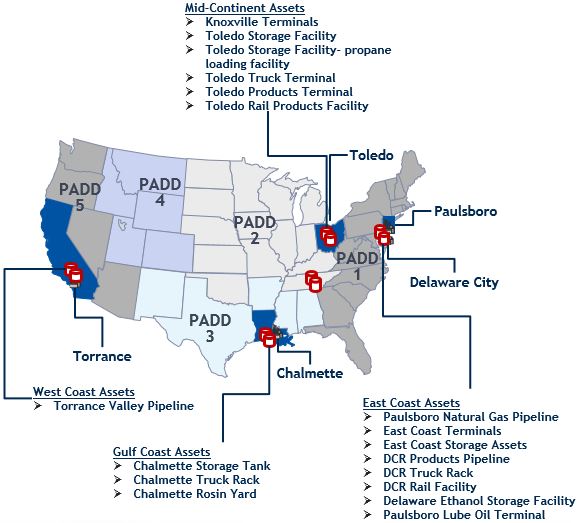
The following map details the locations of our refineries and the location of PBFX’s assets (each as defined below):
9
Refining
Our five refineries are located in Delaware City, Delaware, Paulsboro, New Jersey, Toledo, Ohio, New Orleans, Louisiana and Torrance, California. Each refinery is briefly described in the table below:
|
Refinery
|
Region
|
Nelson Complexity Index
|
Throughput Capacity (in barrels per day)
|
PADD
|
Crude Processed
(1)
|
Source
(1)
|
|||
|
Delaware City
|
East Coast
|
11.3
|
|
190,000
|
|
1
|
|
light sweet through heavy sour
|
water, rail
|
|
Paulsboro
|
East Coast
|
13.2
|
|
180,000
|
|
1
|
|
light sweet through heavy sour
|
water
|
|
Toledo
|
Mid-Continent
|
9.2
|
|
170,000
|
|
2
|
|
light sweet
|
pipeline, truck, rail
|
|
Chalmette
|
Gulf Coast
|
12.7
|
|
189,000
|
|
3
|
|
light sweet through heavy sour
|
water, pipeline
|
|
Torrance
|
West Coast
|
14.9
|
|
155,000
|
|
5
|
|
medium and heavy
|
pipeline, water, truck
|
________
(1)
Reflects the typical crude and feedstocks and related sources utilized under normal operating conditions and prevailing market environments.
Logistics
PBFX is a fee-based, growth-oriented, publicly-traded Delaware master limited partnership (“MLP”) formed by PBF Energy to own or lease, operate, develop and acquire crude oil and refined petroleum products terminals, pipelines, storage facilities and similar logistics assets. PBFX engages in the receiving, handling, storage and transferring of crude oil, refined products, natural gas and intermediates from sources located throughout the United States and Canada for PBF Energy in support of certain of its refineries, as well as for third-party customers. As of
December 31, 2018
, a substantial majority of PBFX’s revenue is derived from long-term, fee-based commercial agreements with PBF Holding, which include minimum volume commitments, for receiving, handling, storing and transferring crude oil, refined products and natural gas. PBF Energy also has agreements with PBFX that establish fees for certain general and administrative services and operational and maintenance services provided by PBF Holding to PBFX. These transactions, other than those with third parties, are eliminated by us in consolidation.
On April 16, 2018, PBFX’s wholly-owned subsidiary, PBF Logistics Products Terminals LLC (“PLPT”), completed the purchase of two refined product terminals located in Knoxville, Tennessee, which include product tanks, pipeline connections to the Colonial Pipeline Company and Plantation Pipe Line Company pipeline systems and truck loading facilities (the “Knoxville Terminals”) from Cummins Terminals, Inc. (“Cummins”).
On July 16, 2018, PBFX entered into four contribution agreements with PBF LLC pursuant to which PBF LLC contributed to PBFX certain of its subsidiaries (the “Development Assets Contribution Agreements”). Pursuant to the Development Assets Contribution Agreements, PBF LLC contributed to PBFX all of the issued and outstanding limited liability company interests of: Toledo Rail Logistics Company LLC (“TRLC”), whose assets consist of a loading and unloading rail facility located at PBF Holding’s Toledo Refinery (the “Toledo Rail Products Facility”); Chalmette Logistics Company LLC (“CLC”), whose assets consist of a truck loading rack facility (the “Chalmette Truck Rack”) and a rail yard facility (the “Chalmette Rosin Yard”), both of which are located at PBF Holding’s Chalmette Refinery; Paulsboro Terminaling Company LLC (“PTC”), whose assets consist of a lube oil terminal facility located at PBF Holding’s Paulsboro Refinery (the “Paulsboro Lube Oil Terminal”); and DCR Storage and Loading Company LLC (“DSLC”), whose assets consist of an ethanol storage facility located at PBF Holding’s Delaware City Refinery (the “Delaware Ethanol Storage Facility” and collectively with the Toledo Rail
10
Products Facility, the Chalmette Truck Rack, the Chalmette Rosin Yard, and the Paulsboro Lube Oil Terminal, the “Development Assets”). The acquisition of the Development Assets closed on July 31, 2018.
On October 1, 2018, PBFX completed the purchase of CPI Operations LLC (the “East Coast Storage Assets Acquisition”), a subsidiary of Crown Point International, LLC (“Crown Point”). The East Coast Storage Assets consist of a storage facility with related infrastructure and equipment and other idled assets located on the Delaware River near Paulsboro, New Jersey.
See “Item 1A. Risk Factors” and “Item 13. Certain Relationships and Related Transactions, and Director Independence.”
Available Information
Our website address is www.pbfenergy.com. Information contained on our website is not part of this Annual Report on Form 10-K. Our annual reports on Form 10-K, quarterly reports on Form 10-Q, current reports on Form 8-K, and any other materials filed with (or furnished to) the U.S. Securities and Exchange Commission (SEC) by us are available on our website (under “Investors”) free of charge, soon after we file or furnish such material. In this same location, we also post our corporate governance guidelines, code of business conduct and ethics, and the charters of the committees of our board of directors. These documents are available free of charge in print to any stockholder that makes a written request to the Secretary, PBF Energy Inc., One Sylvan Way, Second Floor, Parsippany, New Jersey 07054.
11
The diagram below depicts our organizational structure as of
December 31, 2018
:
12
Operating Segments
We operate in two reportable business segments: Refining and Logistics. Our five oil refineries, including certain related logistics assets that are not owned by PBFX, are engaged in the refining of crude oil and other feedstocks into petroleum products, and are aggregated into the Refining segment. PBFX operates certain logistics assets such as crude oil and refined petroleum products terminals, pipelines and storage facilities. Certain of PBFX’s assets were previously operated and owned by various subsidiaries of PBF Holding and were acquired by PBFX in a series of transactions since its inception. PBFX is reported in the Logistics segment. A substantial majority of PBFX’s revenue is derived from long-term, fee based commercial agreements with PBF Holding and its subsidiaries and these intersegment related revenues are eliminated in consolidation. See “Note 20 - Segment Information” of our Notes to Consolidated Financial Statements, for detailed information on our operating results by business segment.
Refining Segment
We own and operate five refineries providing geographic and market diversity. We produce a variety of products at each of our refineries, including gasoline, ULSD, heating oil, jet fuel, lubricants, petrochemicals and asphalt. We sell our products throughout the Northeast, Midwest, Gulf Coast and West Coast of the United States, as well as in other regions of the United States, Canada and Mexico, and are able to ship products to other international destinations.
Delaware City Refinery
Overview.
The Delaware City refinery is located on an approximately 5,000-acre site, with access to waterborne cargoes and an extensive distribution network of pipelines, barges and tankers, truck and rail. Delaware City is a fully integrated operation that receives crude via rail at its crude unloading facilities, or ship or barge at its docks located on the Delaware River. The crude and other feedstocks are stored in an extensive tank farm prior to processing. In addition, there is a 15-lane, 76,000 bpd capacity truck loading rack located adjacent to the refinery and a 23-mile interstate pipeline that are used to distribute clean products, which were sold to PBFX in conjunction with its acquisition of the DCR Products Pipeline and Truck Rack (as defined in “Note 3 - PBF Logistics LP” of our Notes to Consolidated Financial Statements) in May 2015.
As a result of its configuration and process units, Delaware City has the capability of processing a slate of heavy crudes with a high concentration of high sulfur crudes and is one of the largest and most complex refineries on the East Coast. The Delaware City refinery is one of two heavy crude coking refineries, the other being our Paulsboro refinery, on the East Coast of the United States with coking capacity equal to approximately 25% of crude capacity.
The Delaware City refinery primarily processes a variety of medium to heavy, sour crude oils, but can run light, sweet crude oils as well. The refinery has large conversion capacity with its 82,000 bpd fluid catalytic cracking unit (“FCC unit”), 47,000 bpd fluid coking unit and 18,000 bpd hydrocracking unit with vacuum distillation.
13
The following table approximates the Delaware City refinery’s major process unit capacities. Unit capacities are shown in barrels per stream day.
|
Refinery Units
|
Nameplate
Capacity
|
||
|
Crude Distillation Unit
|
190,000
|
|
|
|
Vacuum Distillation Unit
|
102,000
|
|
|
|
Fluid Catalytic Cracking Unit
|
82,000
|
|
|
|
Hydrotreating Units
|
160,000
|
|
|
|
Hydrocracking Unit
|
18,000
|
|
|
|
Catalytic Reforming Unit
|
43,000
|
|
|
|
Benzene / Toluene Extraction Unit
|
15,000
|
|
|
|
Butane Isomerization Unit
|
6,000
|
|
|
|
Alkylation Unit
|
11,000
|
|
|
|
Polymerization Unit
|
16,000
|
|
|
|
Fluid Coking Unit
|
47,000
|
|
|
Feedstocks and Supply Arrangements.
We source our crude oil needs for Delaware City primarily through short-term and spot market agreements.
Refined Product Yield and Distribution.
The Delaware City refinery predominantly produces gasoline, jet fuel, ULSD and ultra-low sulfur heating oil as well as certain other products. We market and sell all of our refined products independently to a variety of customers on the spot market or through term agreements.
Inventory Intermediation Agreement.
On June 26, 2013, we entered into an Inventory Intermediation Agreement (the “Inventory Intermediation Agreement”) with J. Aron & Company, a subsidiary of The Goldman Sachs Group, Inc. (“J. Aron”) to support the operations of the Delaware City refinery, which commenced upon the termination of the previous product offtake agreement. Pursuant to such Inventory Intermediation Agreement, J. Aron purchases the Products (as defined in “Item 1A - Risk Factors”) produced and delivered into the refinery’s storage tanks on a daily basis. J. Aron further agrees to sell to us on a daily basis the Products delivered out of the refinery’s storage tanks. On certain dates subsequent to the inception of the Inventory Intermediation Agreements, we and our subsidiary, DCR, entered into amendments to the amended and restated inventory intermediation agreement (as amended, the “Amended Delaware Intermediation Agreement”) with J. Aron pursuant to which certain terms of the Inventory Intermediation Agreements were amended, including, among other things, pricing and an extension of the term. The most recent of these amendments was executed on September 8, 2017 which extended the term to July 1, 2019, which term may be further extended by mutual consent of the parties to July 1, 2020. At expiration, we will have to repurchase the inventories outstanding under the Amended Delaware Intermediation Agreement at that time.
Tankage Capacity.
The Delaware City refinery has total storage capacity of approximately 10.0 million barrels. Of the total, approximately 3.6 million barrels of storage capacity are dedicated to crude oil and other feedstock storage with the remaining 6.4 million barrels allocated to finished products, intermediates and other products.
Energy and Other Utilities.
Under normal operating conditions, the Delaware City refinery consumes approximately 65,000 MMBTU per day of natural gas supplied via pipeline from third parties. The Delaware City refinery has a 280 MW power plant located on site that consists of two natural gas-fueled turbines with combined capacity of approximately 140 MW and four turbo generators with combined nameplate capacity of approximately 140 MW. Collectively, this power plant produces electricity in excess of Delaware City’s refinery load of approximately 90 MW. Excess electricity is sold into the Pennsylvania-New Jersey-Maryland, or PJM, grid. Steam is primarily produced by a combination of three dedicated boilers, two heat recovery steam generators on the gas turbines, and is supplemented by secondary boilers at the FCC and Coker. Hydrogen is provided via the refinery’s
14
steam methane reformer and continuous catalytic reformer. During 2018, we signed an agreement with a third-party for the construction and subsequent lease of a new 25 million cubic feet per day hydrogen facility (the “Hydrogen Facility”) which is expected to be completed in the first quarter of 2020. Upon completion, the Hydrogen Facility will provide us with additional complex crude processing capabilities.
Paulsboro Refinery
Overview.
The Paulsboro refinery is located on approximately 950 acres on the Delaware River in Paulsboro, New Jersey, near Philadelphia and approximately 30 miles away from Delaware City. Paulsboro receives crude and feedstocks via its marine terminal on the Delaware River. Paulsboro is one of two operating refineries on the East Coast with coking capacity, the other being our Delaware City refinery. The Paulsboro refinery primarily processes a variety of medium and heavy, sour crude oils but can run light, sweet crude oils as well.
The following table approximates the Paulsboro refinery’s major process unit capacities. Unit capacities are shown in barrels per stream day.
|
Refinery Units
|
Nameplate
Capacity
|
||
|
Crude Distillation Units
|
168,000
|
|
|
|
Vacuum Distillation Units
|
83,000
|
|
|
|
Fluid Catalytic Cracking Unit
|
55,000
|
|
|
|
Hydrotreating Units
|
141,000
|
|
|
|
Catalytic Reforming Unit
|
32,000
|
|
|
|
Alkylation Unit
|
11,000
|
|
|
|
Lube Oil Processing Unit
|
12,000
|
|
|
|
Delayed Coking Unit
|
27,000
|
|
|
|
Propane Deasphalting Unit
|
11,000
|
|
|
Feedstocks and Supply Arrangements
. We have a contract with Saudi Aramco pursuant to which we have purchased up to approximately 100,000 bpd of crude oil from Saudi Aramco that is processed at Paulsboro. The crude purchased under this contract is priced off the ASCI.
Refined Product Yield and Distribution.
The Paulsboro refinery predominantly produces gasoline, diesel fuels and jet fuel and also manufactures Group I base oils or lubricants and asphalt. We market and sell all of our refined products independently to a variety of customers on the spot market or through term agreements under which we sell approximately 35% of our Paulsboro refinery’s gasoline production.
Inventory Intermediation Agreement.
On June 26, 2013, we entered into an Inventory Intermediation Agreement with J. Aron to support the operations of the Paulsboro refinery, which commenced upon the termination of the previous product offtake agreement. Pursuant to such Inventory Intermediation Agreement, J. Aron purchases the Products produced and delivered into the refinery’s storage tanks on a daily basis. J. Aron further agrees to sell to us on a daily basis the Products delivered out of the refinery’s storage tanks. On certain dates subsequent to the inception of the Inventory Intermediation Agreements, we and our subsidiary, PRC, entered into amendments to the amended and restated inventory intermediation agreement (as amended, the “Amended Paulsboro Intermediation Agreement”) with J. Aron pursuant to which certain terms of the Inventory Intermediation Agreements were amended, including, among other things, pricing and an extension of the term. The most recent of these amendments was executed on September 8, 2017 which extended the term to December 31, 2019, which may be further extended by mutual consent of the parties to December 31, 2020. At expiration, we will be required to repurchase the inventories outstanding under the Amended Paulsboro Intermediation Agreement at that time.
Tankage Capacity.
The Paulsboro refinery has total storage capacity of approximately 7.5 million barrels. Of the total, approximately 2.1 million barrels are dedicated to crude oil storage with the remaining 5.4 million barrels allocated to finished products, intermediates and other products.
15
Energy and Other Utilities.
Under normal operating conditions, the Paulsboro refinery consumes approximately 40,000 MMBTU per day of natural gas supplied via pipeline from third parties. The Paulsboro refinery is mostly self-sufficient for electrical power through a mix of gas and steam turbine generators. The Paulsboro refinery generation typically supplies about 57 MW of the total 63 MW total refinery load. There are circumstances where available generation is greater than the total refinery load, but the Paulsboro refinery does not typically export power to the utility grid. If necessary, supplemental electrical power is available on a guaranteed basis from the local utility. The Paulsboro refinery is connected to the grid via three separate 69KV aerial feeders and has the ability to run entirely on imported power. Steam is produced in three boilers and a heat recovery steam generator fed by the exhaust from the gas turbine. In addition, there are a number of waste heat boilers and furnace stack economizers throughout the refinery that supplement the steam generation capacity. Backup capability is provided by package boilers. The Paulsboro refinery’s current hydrogen needs are met by the hydrogen supply from the reformer. In addition, the refinery employs a standalone steam methane reformer. This ancillary hydrogen plant is utilized as a back-up source of hydrogen for the refinery’s process units.
Toledo Refinery
Overview
. The Toledo refinery primarily processes a slate of light, sweet crudes from Canada, the Mid-Continent, the Bakken region and the U.S. Gulf Coast. The Toledo refinery is located on a 282-acre site near Toledo, Ohio, approximately 60 miles from Detroit. Crude is delivered to the Toledo refinery through three primary pipelines: (1) Enbridge from the north, (2) Capline from the south and (3) Mid-Valley from the south. Crude is also delivered to a nearby terminal by rail and from local sources by truck to a truck unloading facility within the refinery.
The following table approximates the Toledo refinery’s major process unit capacities. Unit capacities are shown in barrels per stream day.
|
Refinery Units
|
Nameplate
Capacity
|
||
|
Crude Distillation Unit
|
170,000
|
|
|
|
Fluid Catalytic Cracking Unit
|
79,000
|
|
|
|
Hydrotreating Units
|
95,000
|
|
|
|
Hydrocracking Unit
|
45,000
|
|
|
|
Catalytic Reforming Units
|
45,000
|
|
|
|
Alkylation Unit
|
10,000
|
|
|
|
Polymerization Unit
|
7,000
|
|
|
|
UDEX Unit
|
16,300
|
|
|
Feedstocks and Supply Arrangements.
We source our crude oil needs for Toledo primarily through short-term and spot market agreements.
Refined Product Yield and Distribution.
Toledo produces finished products including gasoline and ULSD, in addition to a variety of high-value petrochemicals including benzene, toluene, xylene, nonene and tetramer. Toledo is connected, via pipelines, to an extensive distribution network throughout Ohio, Illinois, Indiana, Kentucky, Michigan, Pennsylvania and West Virginia. The finished products are transported on pipelines owned by Sunoco Logistics Partners L.P. and Buckeye Partners. In addition, we have proprietary connections to a variety of smaller pipelines and spurs that help us optimize our clean products distribution. A significant portion of Toledo’s gasoline and ULSD are distributed through the approximately 36 terminals in this network.
16
We have an agreement with Sunoco whereby Sunoco purchases gasoline and distillate products representing approximately one-third of the Toledo refinery’s gasoline and distillates production. The agreement had an initial three-year term, subject to certain early termination rights. In March 2017, the agreement was renewed and extended for a two-year term. We are currently in the process of negotiating a renewal of this agreement. We sell the bulk of the petrochemicals produced at the Toledo refinery through short-term contracts or on the spot market and the majority of the petrochemical distribution is done via rail.
Tankage Capacity.
The Toledo refinery has total storage capacity of approximately 4.5 million barrels. The Toledo refinery receives its crude through pipeline connections and a truck rack. Of the total, approximately 1.3 million barrels are dedicated to crude oil storage with the remaining 3.2 million barrels allocated to intermediates and products. A portion of storage capacity dedicated to crude oil and finished products was sold to PBFX in conjunction with its acquisition of the Toledo Storage Facility (as defined in “Note 3 - PBF Logistics LP” of our Notes to Consolidated Financial Statements) in December 2014.
Energy and Other Utilities.
Under normal operating conditions, the Toledo refinery consumes approximately 20,000 MMBTU per day of natural gas supplied via pipeline from third parties. The Toledo refinery purchases its electricity from the PJM grid and has a long-term contract to purchase hydrogen and steam from a local third-party supplier. In addition to the third-party steam supplier, Toledo consumes a portion of the steam that is generated by its various process units.
Chalmette Refinery
Overview
. The Chalmette refinery is located on a 400-acre site near New Orleans, Louisiana. It is a dual-train coking refinery and is capable of processing both light and heavy crude oil through its 189,000 bpd crude units and downstream units. Chalmette Refining owns 100% of the MOEM Pipeline, providing access to the Empire Terminal, as well as the CAM Connection Pipeline, providing access to the Louisiana Offshore Oil Port facility through a third-party pipeline. Chalmette Refining also owns 80% of each of the Collins Pipeline Company and T&M Terminal Company, both located in Collins, Mississippi, which provide a clean products outlet for the refinery to the Plantation and Colonial Pipelines. In addition, there is also a marine terminal capable of importing waterborne feedstocks and loading or unloading finished products; a clean products truck rack which provides access to local markets; and a crude and product storage facility.
The following table approximates the Chalmette refinery’s major process unit capacities. Unit capacities are shown in barrels per stream day.
|
Refinery Units
|
Nameplate
Capacity
|
||
|
Crude Distillation Units
|
189,000
|
|
|
|
Fluid Catalytic Cracking Unit
|
72,000
|
|
|
|
Hydrotreating Units
|
186,000
|
|
|
|
Delayed Coker
|
29,000
|
|
|
|
Catalytic Reforming Unit
|
40,000
|
|
|
|
Alkylation Unit
|
15,000
|
|
|
Feedstocks and Supply Arrangements.
We source our crude oil and feedstock needs for Chalmette through connections to the CAM and MOEM pipelines as well as our marine terminal. On November 1, 2015, we entered into a market-based crude supply agreement with Petróleos de Venezuela S.A. (“PDVSA”) that has a ten-year term with a renewal option for an additional five years, subject to certain early termination rights. The pricing for the crude supply is market based and is agreed upon on a quarterly basis by both parties. We have not sourced crude oil under this agreement since the third quarter of 2017 as PDVSA has suspended deliveries due to the parties’ inability to agree to mutually acceptable payment terms.
17
Refined Product Yield and Distribution.
The Chalmette refinery predominantly produces gasoline and diesel fuels and also manufactures high-value petrochemicals including benzene and xylene. Products produced at the Chalmette refinery are transferred to customers through pipelines, the marine terminal and truck rack. The majority of our clean products are delivered to customers via pipelines. Our ownership of the Collins Pipeline and T&M Terminal provides Chalmette with strategic access to Southeast and East Coast markets through third-party logistics.
Tankage Capacity.
Chalmette has a total tankage capacity of approximately 8.1 million barrels. Of this total, approximately 2.6 million barrels are allocated to crude oil storage with the remaining 5.5 million barrels allocated to intermediates and products.
Energy and Other Utilities.
Under normal operating conditions, the Chalmette refinery consumes approximately 30,000 MMBTU per day of natural gas supplied via pipeline from third parties. The Chalmette refinery purchases its electricity from a local utility and has a long-term contract to purchase hydrogen and steam from third-party suppliers.
Coker Project
: The Chalmette refinery is currently in the process of restarting its idled 12,000 barrel per day coker unit to increase the refinery’s long-term feedstock flexibility and be positioned to benefit from potential dislocations in the price for heavy and high-sulfur feedstocks. The unit is expected to be in service by the end of 2019 and is expected to increase the refinery’s total coking capacity to approximately 42,000 barrels per day.
Torrance Refinery
Acquisition.
On July 1, 2016, we acquired from ExxonMobil and its subsidiary, Mobil Pacific Pipe Line Company, the Torrance refinery and related logistics assets (collectively, the “Torrance Acquisition”).
Overview
. The Torrance refinery is located on 750 acres in Torrance, California. It is a high-conversion crude, delayed-coking refinery. It is capable of processing both heavy and medium crude oil through its crude unit and downstream units. In addition to refining assets, the Torrance Acquisition included a number of high-quality logistics assets including a sophisticated network of crude and products pipelines, product distribution terminals and refinery crude and product storage facilities. The most significant logistics asset is a crude gathering and transportation system which delivers San Joaquin Valley crude oil directly from the field to the refinery. Additionally, included in the transaction are several pipelines which provide access to sources of crude oil including the Ports of Long Beach and Los Angeles, as well as clean product outlets with a direct pipeline that supplies jet fuel to the Los Angeles airport.
The following table approximates the Torrance refinery’s major process unit capacities. Unit capacities are shown in barrels per stream day.
|
Refinery Units
|
Nameplate
Capacity
|
||
|
Crude Distillation Unit
|
155,000
|
|
|
|
Vacuum Distillation Unit
|
102,000
|
|
|
|
Fluid Catalytic Cracking Unit
|
88,000
|
|
|
|
Hydrotreating Units
|
151,000
|
|
|
|
Hydrocracking Unit
|
23,000
|
|
|
|
Alkylation Unit
|
27,000
|
|
|
|
Delayed Coker
|
53,000
|
|
|
Feedstocks and Supply Arrangements.
The Torrance refinery primarily processes a variety of medium and heavy crude oils. In connection with the closing of the Torrance Acquisition, we entered into a crude supply agreement with ExxonMobil for approximately 60,000 bpd of crude oil that can be processed at our Torrance refinery. This crude supply agreement has a five-year term with an automatic renewal feature unless either party gives thirty-six months prior written notice. Additionally, we obtain crude and feedstocks from other sources through connections to third-party pipelines as well as ship docks and truck racks.
18
Refined Product Yield and Distribution.
The Torrance refinery predominantly produces gasoline, jet fuel and diesel fuels. Products produced at the Torrance refinery are transferred to customers through pipelines, the marine terminal and truck rack. The majority of clean products are delivered to customers via pipelines. Concurrently with the acquisition of the refinery on July 1, 2016, we entered into an offtake agreement with ExxonMobil pursuant to which ExxonMobil purchases up to 50% of our gasoline production. This offtake agreement had an initial term of three years and was scheduled to automatically renew for another three-year term unless either party provided six-months written notice of its intent to terminate the agreement. This contract has been terminated and will not be renewed upon expiration on July 1, 2019. On a prospective basis, we will market and sell all of our refined products independently to a variety of customers either on the spot market or through term agreements.
Tankage Capacity.
Torrance has a total tankage capacity of approximately 8.6 million barrels. Of this total, approximately 2.1 million barrels are allocated to crude oil storage with the remaining 6.5 million barrels allocated to intermediates and products.
Energy and Other Utilities.
Under normal operating conditions, the Torrance refinery consumes approximately 45,000 MMBTU per day of natural gas supplied via pipeline from third parties. The Torrance refinery generates some power internally using a combination of steam and gas turbines and purchases any additional needed power from the local utility. The Torrance refinery has a long-term contract to purchase hydrogen from a third-party supplier.
Logistics Segment
We formed PBFX, a publicly-traded MLP, to own or lease, operate, develop and acquire crude oil and refined petroleum products terminals, pipelines, storage facilities and similar logistics assets. PBFX’s operations are aggregated into the Logistics segment. PBFX engages in the receiving, handling, storage and transferring of crude oil, refined products, natural gas and intermediates from sources located throughout the United States and Canada for PBF Energy in support of its refineries, as well as for third-party customers. A substantial majority of PBFX’s revenues is derived from long-term, fee-based commercial agreements with PBF Holding, which include minimum volume commitments for receiving, handling, storing and transferring crude oil, refined products and natural gas. PBFX’s third-party revenue is primarily derived from its third-party acquisitions. PBF Energy also has agreements with PBFX that establish fees for certain general and administrative services and operational and maintenance services provided by PBF Holding to PBFX. These transactions, other than those with third parties, are eliminated by PBF Energy and PBF LLC in consolidation.
As of
December 31, 2018
, PBFX’s assets consist of the following:
|
Asset
|
Capacity
|
Products Handled
|
Location Supported
|
|
Transportation and Terminaling
|
|||
|
DCR Rail Terminal (a)(b)
|
130,000 bpd unloading capacity
|
Crude
|
Delaware City and Paulsboro refineries
|
|
DCR West Rack (a)(b)
|
40,000 bpd unloading capacity
|
Crude
|
Delaware City and Paulsboro refineries
|
|
Toledo Truck Terminal (a)
|
22,500 bpd unloading capacity
|
Crude
|
Toledo refinery
|
|
Toledo Storage Facility - propane loading facility (a)
|
11,000 bpd throughput capacity
|
Propane
|
Toledo refinery
|
|
DCR Products Pipeline (a)
|
125,000 bpd pipeline capacity
|
Refined products
|
Delaware City refinery
|
|
DCR Truck Rack (a)
|
76,000 bpd throughput capacity
|
Gasoline, distillates and LPGs
|
Delaware City refinery
|
19
|
East Coast Terminals
|
various throughput capacity and approximately 4.2 million barrel aggregate shell capacity
|
Refined products
|
Delaware City and Paulsboro refineries
|
|
Torrance Valley Pipeline (a)
|
110,000 bpd pipeline capacity
|
Crude
|
Torrance refinery
|
|
Paulsboro Natural Gas Pipeline (a)
|
60,000 dth/d pipeline capacity
|
Natural gas
|
Paulsboro refinery
|
|
Toledo Products Terminal
|
various throughput capacity and 110,000 barrel aggregate shell capacity
|
Refined products
|
Toledo refinery
|
|
Knoxville Terminals
|
various throughput capacity and 520,000 barrel aggregate shell capacity
|
Gasoline, distillates and LPGs
|
Chalmette refinery
|
|
Toledo Rail Products Facility (a)(c)
|
16,000 bpd loading capacity
|
Crude, LPGs, gasoline and distillates
|
Toledo refinery
|
|
Chalmette Truck Rack (a)(c)
|
20,000 bpd loading capacity
|
Gasoline and distillates
|
Chalmette refinery
|
|
Chalmette Rosin Yard (a)(c)
|
17,000 bpd unloading capacity
|
LPGs
|
Chalmette refinery
|
|
Paulsboro Lube Oil Terminal (a)(c)
|
various throughput capacity and 229,000 barrel aggregate shell capacity
|
Lubes
|
Paulsboro refinery
|
|
Delaware Ethanol Storage Facility (a)(c)
|
various throughput capacity and 100,000 barrel aggregate shell capacity
|
Ethanol
|
Delaware refinery
|
|
Storage
|
|||
|
Toledo Storage Facility (a)
|
approximately 3.9 million barrel aggregate shell capacity (d)
|
Crude, refined products and intermediates
|
Toledo refinery
|
|
Chalmette Storage Tank
|
625,000 barrel shell capacity
|
Crude
|
Chalmette refinery
|
|
East Coast Storage Assets
|
approximately 4.0 million barrel aggregate shell capacity (e)
|
Crude, feedstock and asphalt
|
Delaware City and Paulsboro refineries
|
___________________
|
(a)
|
These assets represent the assets that PBFX acquired from PBF LLC.
|
|
(b)
|
These assets are collectively referred to as the “DCR Rail Facility”.
|
|
(c)
|
These assets are collectively referred to as the “Development Assets”.
|
|
(d)
|
Of the approximately 3.9 million barrel aggregate shell capacity, approximately 1.3 million barrels are dedicated to crude and approximately 2.6 million barrels are allocated to refined products and intermediates.
|
|
(e)
|
Of the approximately 4.0 million barrel aggregate shell capacity, approximately 3.0 million barrels are dedicated to crude and feedstock and approximately 1.0 million barrels are allocated to asphalt.
|
20
Transactions with PBFX
Since the inception of PBFX in 2014, PBF LLC and PBFX have entered into a series of drop-down transactions. Such transactions occurring in the three years ended
December 31, 2018
are discussed below.
On August 31, 2016, PBFX entered into a contribution agreement (the “TVPC Contribution Agreement”) between PBFX and PBF LLC. Pursuant to the TVPC Contribution Agreement, PBFX acquired from PBF LLC 50% of the issued and outstanding limited liability company interests of TVPC, whose assets consist of the San Joaquin Valley Pipeline system (which was acquired as a part of the Torrance Acquisition). The total consideration paid to PBF LLC was $175.0 million, which was funded by PBFX with $20.0 million of cash on hand, $76.2 million in proceeds from the sale of marketable securities, and $78.8 million in net proceeds from the PBFX equity offering in August 2016.
On February 15, 2017, PBFX entered into the PNGPC Contribution Agreement between PBFX and PBF LLC. Pursuant to the PNGPC Contribution Agreement, PBF LLC contributed to PBFX’s wholly-owned subsidiary, PBFX Operating Company LLC (“PBFX Op Co”), all of the issued and outstanding limited liability company interests of PNGPC. PNGPC owns and operates an existing interstate natural gas pipeline that originates in Delaware County, Pennsylvania, at an interconnection with Texas Eastern pipeline that runs under the Delaware River and terminates at the delivery point to PBF Holding’s Paulsboro refinery, and is subject to regulation by the FERC. In connection with the PNGPC Contribution Agreement, PBFX constructed a new 24” pipeline to replace the existing pipeline, which commenced services in August 2017. In consideration for the PNGPC limited liability company interests, PBFX delivered to PBF LLC (i) an $11.6 million intercompany promissory note in favor of Paulsboro Refining Company LLC, a wholly-owned subsidiary of PBF Holding, (ii) an expansion rights and right of first refusal agreement in favor of PBF LLC with respect to the Paulsboro Natural Gas Pipeline and (iii) an assignment and assumption agreement with respect to certain outstanding litigation involving PNGPC and the existing pipeline.
Effective February 2017, PBF Holding and PBFX Op Co entered into a ten-year storage services agreement under which PBFX, through PBFX Op Co, began providing storage services to PBF Holding commencing on November 1, 2017 upon the completion of the construction of a new crude tank with a shell capacity of 625,000 barrels at PBF Holding’s Chalmette Refinery. PBFX Op Co and Chalmette Refining have entered into a twenty-year lease for the premises upon which the tank is located and a project management agreement pursuant to which Chalmette Refining managed the construction of the tank.
On July 16, 2018, PBFX entered into the Development Assets Contribution Agreements with PBF LLC. Pursuant to the Development Asset Contribution Agreements, PBF LLC contributed all of the issued and outstanding limited liability company interests of the Development Assets to PBFX effective July 31, 2018. In consideration for the Development Assets limited liability company interests, PBFX delivered to PBF LLC total consideration of
$31.6 million
consisting of 1,494,134 common units of PBFX.
In connection with the foregoing transactions, PBF Holding entered into commercial agreements with PBFX entities for the provision of services which require minimum monthly throughput volumes. Subsequent to the transactions described above, as of
December 31, 2018
, PBF LLC holds a
44.0%
limited partner interest in PBFX consisting of
19,953,631
common units.
PBFX IDR Restructuring Agreement
On February 13, 2019, PBFX entered into the IDR Restructuring Agreement with PBF GP, pursuant to which the IDRs held by PBF LLC will be canceled and converted into 10,000,000 newly issued common units. The IDR Restructuring is expected to close on February 28, 2019. Subsequent to the closing of the IDR Restructuring, no distributions will be made to PBF LLC with respect to the IDRs and the newly issued common units will be entitled to normal distributions.
21
Principal Products
Our refineries make various grades of gasoline, distillates (including diesel fuel, jet fuel and ULSD) and other products from crude oil, other feedstocks, and blending components. We sell these products through our commercial accounts, and sales with major oil companies. For the years ended
December 31, 2018
,
2017
and
2016
, gasoline and distillates accounted for
84.7%
,
84.1%
and
88.0%
of our revenues, respectively.
Customers
We sell a variety of refined products to a diverse customer base. The majority of our refined products are primarily sold through short-term contracts or on the spot market. However, we do have product offtake arrangements for a portion of our clean products. For the years ended
December 31, 2018
,
2017
and
2016
,
no
single customer accounted for 10% or more of our revenues, respectively. As of
December 31, 2018
and
December 31, 2017
, no single customer accounted for 10% or more of our total trade accounts receivable.
Seasonality
Demand for gasoline and diesel is generally higher during the summer months than during the winter months due to seasonal increases in highway traffic and construction work. Decreased demand during the winter months can lower gasoline and diesel prices. As a result, our operating results for the first and fourth calendar quarters may be lower than those for the second and third calendar quarters of each year. Refining margins remain volatile and our results of operations may not reflect these historical seasonal trends. Additionally, the degree of seasonality may differ by the geographic areas in which we operate. Most of the effects of seasonality on PBFX’s operating results are mitigated through fee-based commercial agreements with us that include minimum volume commitments.
Competition
The refining business is very competitive. We compete directly with various other refining companies on the East, Gulf and West Coasts and in the Mid-Continent, with integrated oil companies, with foreign refiners that import products into the United States and with producers and marketers in other industries supplying alternative forms of energy and fuels to satisfy the requirements of industrial, commercial and individual consumers. Some of our competitors have expanded the capacity of their refineries and internationally new refineries are coming on line which could also affect our competitive position.
Profitability in the refining industry depends largely on refined product margins, which can fluctuate significantly, as well as crude oil prices and differentials between the prices of different grades of crude oil, operating efficiency and reliability, product mix and costs of product distribution and transportation. Certain of our competitors that have larger and more complex refineries may be able to realize lower per-barrel costs or higher margins per barrel of throughput. Several of our principal competitors are integrated national or international oil companies that are larger and have substantially greater resources. Because of their integrated operations and larger capitalization, these companies may be more flexible in responding to volatile industry or market conditions, such as shortages of feedstocks or intense price fluctuations. Refining margins are frequently impacted by sharp changes in crude oil costs, which may not be immediately reflected in product prices.
The refining industry is highly competitive with respect to feedstock supply. Unlike certain of our competitors that have access to proprietary controlled sources of crude oil production available for use at their own refineries, we obtain all of our crude oil and substantially all other feedstocks from unaffiliated sources. The availability and cost of crude oil and feedstock are affected by global supply and demand. We have no crude oil reserves and are not engaged in the exploration or production of crude oil. We believe, however, that we will be able to obtain adequate crude oil and other feedstocks at generally competitive prices for the foreseeable future.
22
Our complex refinery system and sourcing optionality may position us favorably to benefit from changes in certain market conditions and governmental or industry regulations, such as the pending requirement from the International Maritime Organization (“IMO”) related to the reduction in sulfur content of marine fuels to a maximum of 0.5% effective January 1, 2020. Due to our relative refinery complexity and ample coking capacity, we anticipate being able to favorably capture the benefit from potential product margin uplift associated with an increase in demand for low sulfur fuel or a widening of the discount on high-sulfur feedstocks as a result of the new IMO regulations.
Corporate Offices
We currently lease approximately 58,000 square feet for our principal corporate offices in Parsippany, New Jersey. The lease for our principal corporate offices expires in 2022. Functions performed in the Parsippany office include overall corporate management, refinery and HSE management, planning and strategy, corporate finance, commercial operations, logistics, contract administration, marketing, investor relations, governmental affairs, accounting, tax, treasury, information technology, legal and human resources support functions.
We lease approximately 4,000 square feet for our regional corporate office in Long Beach, California. The lease for our Long Beach office expires in 2021. Functions performed in the Long Beach office include overall regional corporate management, planning and strategy, commercial operations, logistics, contract administration, marketing and governmental affairs.
We lease approximately 5,000 square feet for our regional corporate office in The Woodlands, Texas. The lease for The Woodlands office expires in 2022. Functions performed in The Woodlands include pipeline control center operations and logistics operations, engineering and regulatory support functions.
Employees
As of
December 31, 2018
, we had approximately
3,266
employees, of which
1,625
are covered by collective bargaining agreements. Our hourly employees are covered by collective bargaining agreements through the United Steel Workers (“USW”), the Independent Oil Workers (“IOW”) and the International Brotherhood of Electrical Workers (“IBEW”). We consider our relations with the represented employees to be satisfactory.
|
Location
|
Number of employees
|
Employees covered by collective bargaining agreements
|
Collective bargaining agreements
|
Expiration date
|
||||||
|
Headquarters
|
379
|
|
—
|
|
N/A
|
N/A
|
||||
|
Delaware City refinery
|
559
|
|
377
|
|
USW
|
January 2022
|
||||
|
Paulsboro refinery
|
470
|
|
291
|
|
IOW
|
March 2022
|
||||
|
Toledo refinery
|
528
|
|
331
|
|
USW
|
February 2022
|
||||
|
Chalmette refinery
|
562
|
|
264
|
|
USW
|
January 2022
|
||||
|
Torrance refinery
|
578
|
|
288
|
|
USW
IBEW
|
January 2022*
January 2022
|
||||
|
Torrance logistics
|
108
|
|
45
|
|
USW
|
January 2022*
April 2021
|
||||
|
PBFX
|
82
|
|
29
|
|
USW
|
February 2022
April 2021
|
||||
|
Total employees
|
3,266
|
|
1,625
|
|
||||||
* Tentative agreement has been reached and upon ratification and execution will extend the collective bargaining agreement related to Torrance refinery and Torrance logistics employees covered under the USW agreement through January 2022.
23
Executive Officers of the Registrant
The following is a list of our executive officers as of
February 21, 2019
:
|
Name
|
Age (as of December 31, 2018)
|
Position
|
|||
|
Thomas J. Nimbley
|
67
|
|
Chief Executive Officer and Chairman of the Board of Directors
|
||
|
Matthew C. Lucey
|
45
|
|
President
|
||
|
Erik Young
|
41
|
|
Senior Vice President, Chief Financial Officer
|
||
|
Paul Davis
|
56
|
|
President, Western Region
|
||
|
Thomas L. O’Connor
|
46
|
|
Senior Vice President, Commercial
|
||
|
Herman Seedorf
|
67
|
|
Senior Vice President, Refining
|
||
|
Trecia Canty
|
49
|
|
Senior Vice President, General Counsel & Corporate Secretary
|
||
Thomas J. Nimbley
has served as our Chief Executive Officer since June 2010 and on our Board of Directors since October 2014. He has served as the Chairman of our Board since July 2016. He was our Executive Vice President, Chief Operating Officer from March 2010 through June 2010. In his capacity as our Chief Executive Officer, Mr. Nimbley also serves as a director and the Chief Executive Officer of certain of our subsidiaries and our affiliates, including Chairman of the Board of PBF GP. Prior to joining us, Mr. Nimbley served as a Principal for Nimbley Consultants LLC from June 2005 to March 2010, where he provided consulting services and assisted on the acquisition of two refineries. He previously served as Senior Vice President and head of Refining for Phillips Petroleum Company (“Phillips”) and subsequently Senior Vice President and head of Refining for ConocoPhillips (“ConocoPhillips”) domestic refining system (13 locations) following the merger of Phillips and Conoco Inc. Before joining Phillips at the time of its acquisition of Tosco Corporation (“Tosco”) in September 2001, Mr. Nimbley served in various positions with Tosco and its subsidiaries starting in April 1993.
Matthew C. Lucey
has served as our President since January 2015 and was our Executive Vice President from April 2014 to December 2014. Mr. Lucey served as our Senior Vice President, Chief Financial Officer from April 2010 to March 2014. Mr. Lucey joined us as our Vice President, Finance in April 2008. Mr. Lucey is also a director of certain of our subsidiaries, including PBF GP. Prior thereto, Mr. Lucey served as a Managing Director of M.E. Zukerman & Co., a New York-based private equity firm specializing in several sectors of the broader energy industry, from 2001 to 2008. Before joining M.E. Zukerman & Co., Mr. Lucey spent six years in the banking industry.
Erik Young
has served as our Senior Vice President and Chief Financial Officer since April 2014 after joining us in December 2010 as Director, Strategic Planning where he was responsible for both corporate development and capital markets initiatives. Mr. Young is also a director of certain of our subsidiaries, including PBF GP. Prior to joining the Company, Mr. Young spent eleven years in corporate finance, strategic planning and mergers and acquisitions roles across a variety of industries. He began his career in investment banking before joining J.F. Lehman & Company, a private equity investment firm, in 2001.
Paul Davis
has served as our President, PBF Energy Western Region LLC since September 2017. Mr. Davis joined us in April of 2012 and held various executive roles in our commercial operations, including Co-Head of Commercial, prior to serving as Senior Vice President, Western Region Commercial Operations from September 2015 to September 2017. Previously, Mr. Davis was responsible for managing the U.S. clean products commercial operations for Hess Energy Trading Company from 2006 to 2012. Prior to that, Mr. Davis was responsible for Premcor’s U.S. Midwest clean products disposition group. Mr. Davis has over 29 years of experience in commercial operations in crude oil and refined products, including 16 years with the ExxonMobil Corporation in various operational and commercial positions, including sourcing refinery feedstocks and crude oil and the disposition of refined petroleum products, as well as optimization roles within refineries.
24
Thomas L. O’Connor
has served as our Senior Vice President, Commercial since September 2015. Mr. O’Connor joined us as Senior Vice President in September 2014 with responsibility for business development and growing the business of PBFX, and from January to September 2015, served as our Co-Head of commercial activities. Prior to joining us, Mr. O’Connor worked at Morgan Stanley since 2000 in various positions, most recently as a Managing Director and Global Head of Crude Oil Trading and Global Co-Head of Oil Flow Trading. Prior to joining Morgan Stanley, Mr. O’Connor worked for Tosco from 1995 to 2000 in the Atlantic Basin Fuel Oil and Feedstocks group.
Herman Seedorf
serves as our Senior Vice President of Refining. Mr. Seedorf originally joined us in February of 2011 as the Delaware City Refinery Plant Manager and became Senior Vice President, Eastern Region Refining, in September of 2013. Prior to 2011, Mr. Seedorf served as the refinery manager of the Wood River Refinery in Roxana, Illinois, and also as an officer of the joint venture between ConocoPhillips and Cenovus Energy Inc. Mr. Seedorf’s oversight responsibilities included the development and execution of the multi-billion dollar upgrade project which enabled the expanded processing of Canadian crude oils. He also served as the refinery manager of the Bayway Refinery in Linden, New Jersey for four years during the time period that it was an asset of Tosco. Mr. Seedorf began his career in the petroleum industry with Exxon Corporation (“Exxon”) in 1980.
Trecia Canty
has served as our Senior Vice President, General Counsel and Secretary since September 2015. In her role, Ms. Canty is responsible for the legal department and outside counsel, which provide a broad range of support for the Company’s business activities, including corporate governance, compliance, litigations and mergers and acquisitions. Previously, Ms. Canty was named Vice President, Senior Deputy General Counsel and Assistant Secretary in October 2014 and led our commercial and finance legal operations since joining us in November 2012. Ms. Canty is also a director of certain of our subsidiaries. Prior to joining us, Ms. Canty served as Associate General Counsel, Corporate and Assistant Secretary of Southwestern Energy Company, where her responsibilities included finance and mergers and acquisitions, securities and corporate compliance and corporate governance. She also provided legal support to the midstream marketing and logistics businesses. Prior to joining Southwestern Energy Company in 2004, she was an associate with Cleary, Gottlieb, Steen & Hamilton.
Environmental, Health and Safety Matters
Our refineries, pipelines and related operations are subject to extensive and frequently changing federal, state and local laws and regulations, including, but not limited to, those relating to the discharge of materials into the environment or that otherwise relate to the protection of the environment, waste management and the characteristics and the compositions of fuels. Compliance with existing and anticipated laws and regulations can increase the overall cost of operating the refineries, including remediation, operating costs and capital costs to construct, maintain and upgrade equipment and facilities. Permits are also required under these laws for the operation of our refineries, pipelines and related operations and these permits are subject to revocation, modification and renewal. Compliance with applicable environmental laws, regulations and permits will continue to have an impact on our operations, results of operations and capital requirements. We believe that our current operations are in substantial compliance with existing environmental laws, regulations and permits
.
In connection with the Paulsboro refinery acquisition, we assumed certain environmental remediation obligations. The Paulsboro environmental liability of
$11.0 million
recorded as of
December 31, 2018
(
$10.3 million
as of
December 31, 2017
) represents the present value of expected future costs discounted at a rate of 8.0%. The current portion of the environmental liability is recorded in Accrued expenses and the non-current portion is recorded in Other long-term liabilities. As of
December 31, 2018
and
December 31, 2017
, this liability is self-guaranteed by us.
In connection with the acquisition of the Delaware City assets, Valero Energy Corporation (“Valero”) remains responsible for certain pre-acquisition environmental obligations up to
$20.0 million
and the predecessor to Valero in ownership of the refinery retains other historical obligations.
25
In connection with the acquisition of the Delaware City assets and the Paulsboro refinery, the Company and Valero purchased ten year, $75.0 million environmental insurance policies to insure against unknown environmental liabilities at each site. In connection with the Toledo refinery acquisition, Sunoco, Inc. (R&M) remains responsible for environmental remediation for conditions that existed on the closing date for twenty years from March 1, 2011, subject to certain limitations.
In connection with the acquisition of the Chalmette refinery, we obtained
$3.9
million in financial assurance (in the form of a surety bond) to cover estimated potential site remediation costs associated with an agreed to Administrative Order of Consent with the United States Environmental Protection Agency (“EPA”). The estimated cost assumes remedial activities will continue for a minimum of thirty years. Further, in connection with the acquisition of the Chalmette refinery, we purchased a ten year,
$100.0
million environmental insurance policy to insure against unknown environmental liabilities at the refinery. At the time we acquired the Chalmette refinery it was subject to a Consolidated Compliance Order and Notice of Potential Penalty (the “Order”) issued by the Louisiana Department of Environmental Quality (“LDEQ”) covering deviations from 2009 and 2010. Chalmette Refining and LDEQ subsequently entered into a dispute resolution agreement to negotiate the resolution of deviations on or before December 31, 2014. On May 18, 2018 the Order was settled by LDEQ and the Chalmette refinery for an administrative penalty of
$741,000
, of which
$100,000
has been paid in cash and the remainder has been spent on beneficial environmental projects.
The Delaware City refinery appealed a Notice of Penalty Assessment and Secretary’s Order issued in March 2017, including a
$150,000
fine, alleging violation of a 2013 Secretary’s Order authorizing crude oil shipment by barge. The Delaware Department of Natural Resources and Environmental Control (the “DNREC”) determined that the Delaware City refinery had violated the order by failing to make timely and full disclosure to DNREC about the nature and extent of those shipments, and had misrepresented the number of shipments that went to other facilities. The Penalty Assessment and Secretary’s Order conclude that the 2013 Secretary’s Order was violated by the refinery by shipping crude oil from the Delaware City terminal to three locations other than the Paulsboro refinery, on 15 days in 2014, making a total of 17 separate barge shipments containing approximately 35.7 million gallons of crude oil in total. On April 28, 2017, the Delaware City refinery appealed the Notice of Penalty Assessment and Secretary’s Order. On March 5, 2018, Notice of Penalty Assessment was settled by DNREC, the Delaware Attorney General and Delaware City refinery for
$100,000
. The Delaware City refinery made no admissions with respect to the alleged violations and agreed to request a Coastal Zone Act status decision prior to making crude oil shipments to destinations other than Paulsboro. The Coastal Zone Act status decision request was submitted to DNREC and the outstanding appeal was withdrawn as required under the settlement agreement.
On December 28, 2016, DNREC issued a Coastal Zone Act permit (the “Ethanol Permit”) to DCR allowing the utilization of existing tanks and existing marine loading equipment at their existing facilities to enable denatured ethanol to be loaded from storage tanks to marine vessels and shipped to offsite facilities. On January 13, 2017, the issuance of the Ethanol Permit was appealed by two environmental groups. On February 27, 2017, the Coastal Zone Industrial Board (the “Coastal Zone Board”) held a public hearing and dismissed the appeal, determining that the appellants did not have standing. The appellants filed an appeal of the Coastal Zone Board’s decision with the Delaware Superior Court (the “Superior Court”) on March 30, 2017. On January 19, 2018, the Superior Court rendered an Opinion regarding the decision of the Coastal Zone Board to dismiss the appeal of the Ethanol Permit for the ethanol project. The Judge determined that the record created by the Coastal Zone Board was insufficient for the Superior Court to make a decision, and therefore remanded the case back to the Coastal Zone Board to address the deficiency in the record. Specifically, the Superior Court directed the Coastal Zone Board to address any evidence concerning whether the appellants’ claimed injuries would be affected by the increased quantity of ethanol shipments. On remand, the Coastal Zone Board met on January 28, 2019 and reversed its previous decision on standing, ruling that the appellants have standing to appeal the issuance of the Ethanol Permit. DCR is currently evaluating its appeal options.
26
At the time we acquired the Toledo refinery, EPA had initiated an investigation into the compliance of the refinery with EPA standards governing flaring pursuant to Section 114 of the Clean Air Act. On February 1, 2013, EPA issued an Amended Notice of Violation, and on September 20, 2013, EPA issued a Notice of Violation and Finding of Violation to Toledo refinery, alleging certain violations of the Clean Air Act at its Plant 4 and Plant 9 flares since the acquisition of the refinery on March 1, 2011. Toledo refinery and EPA subsequently entered into tolling agreements pending settlement discussions. Although the resolution has not been finalized, the civil administrative penalty is anticipated to be approximately
$645,000
including supplemental environmental projects. To the extent the administrative penalty exceeds such amount, it is not expected to be material to us.
In connection with the acquisition of the Torrance refinery and related logistics assets, we assumed certain pre-existing environmental liabilities totaling
$130.8
million as of
December 31, 2018
(
$136.5
million as of
December 31, 2017
), related to certain environmental remediation obligations to address existing soil and groundwater contamination and monitoring activities and other clean-up activities, which reflects the current estimated cost of the remediation obligations. The current portion of the environmental liability is recorded in Accrued expenses and the non-current portion is recorded in Other long-term liabilities in our consolidated balance sheet. In addition, in connection with the acquisition of the Torrance refinery and related logistics assets, we purchased a ten year, $100.0 million environmental insurance policy to insure against unknown environmental liabilities. Furthermore, in connection with the acquisition, we assumed responsibility for certain specified environmental matters that occurred prior to our ownership of the refinery and the logistics assets, including specified incidents and/or notices of violations (“NOVs”) issued by regulatory agencies in various years before our ownership, including the Southern California Air Quality Management District (“SCAQMD”) and the Division of Occupational Safety and Health of the State of California (“Cal/OSHA”).
In connection with the acquisition of the Torrance refinery and related logistics assets, we agreed to take responsibility for NOV No. P63405 that ExxonMobil had received from the SCAQMD for Title V deviations that are alleged to have occurred in 2015. On August 14, 2018, we received a letter from SCAQMD offering to settle this NOV for
$515,250
. We are currently in communication with SCAQMD to resolve this NOV.
Subsequent to the acquisition, further NOVs were issued by the SCAQMD, Cal/OSHA, the City of Torrance, the City of Torrance Fire Department and the Los Angeles County Sanitation District related to alleged operational violations, emission discharges and/or flaring incidents at the refinery and the logistics assets both before and after our acquisition. EPA in November 2016 conducted a Risk Management Plan (“RMP”) inspection following the acquisition related to Torrance operations and issued preliminary findings in March 2017 concerning RMP potential operational violations. We are currently in communication with EPA to resolve the RMP preliminary findings. EPA and the California Department of Toxic Substances Control (“DTSC”) in December 2016 conducted a Resource Conservation and Recovery Act (“RCRA”) inspection following the acquisition related to Torrance operations and also issued in March 2017 preliminary findings concerning RCRA potential operational violations. In April 2017, EPA referred the RCRA preliminary findings to DTSC for final resolution. On March 1, 2018, we received a notice of intent to sue from Environmental Integrity Project, on behalf of Environment California, under RCRA with respect to the alleged violations from EPA’s and DTSC’s December 2016 inspection. On March 2, 2018, DTSC issued an order to correct alleged RCRA violations relating to the accumulation of oil bearing materials in roll off bins during 2016 and 2017. On June 14, 2018, the Torrance refinery and DTSC reached settlement regarding the oil bearing materials in the form of a stipulation and order, wherein the Torrance refinery agreed that it would recycle or properly dispose of the oil bearing materials by the end of 2018 and pay an administrative penalty of
$150,000
. The Torrance refinery has complied with these requirements. Following this settlement, in June 2018, DTSC referred the remaining alleged RCRA violations from EPA’s and DTSC’s December 2016 inspection to the California Attorney General for final resolution. The Torrance refinery and the California Attorney General are in discussions to resolve these remaining alleged RCRA violations. Other than the
$150,000
DTSC administrative penalty, no other settlement or penalty demands have been received to date with respect to any of the other NOVs, preliminary findings, or order that are in excess of
$100,000
. As the ultimate outcomes are uncertain, we cannot currently estimate the final amount or timing of their resolution, but any such amount is not expected to have a material impact on our financial position, results of operations or cash flows, individually or in the aggregate.
27
In connection with the PBFX Plains Asset Purchase (as defined in “Note 4 - Acquisitions” of our Notes to Consolidated Financial Statements), PBFX is responsible for the environmental remediation costs for conditions that existed on the closing date up to a maximum of
$250,000
per year for ten years, with Plains All American Pipeline, L.P. remaining responsible for any and all additional costs above such amounts during such period. The recorded environmental liability associated with the PBFX Plains Asset Purchase as of
December 31, 2018
and
December 31, 2017
was
$1.6 million
and
$1.9 million
, respectively.
In connection with the Knoxville Terminal Purchase (as defined in “Note 4 - Acquisitions” of our Notes to Consolidated Financial Statements), PBFX and Cummins purchased a ten-year,
$30.0 million
environmental insurance policy against unknown environmental liabilities. PBFX did not assume, and is currently not aware of, any material pre-existing environmental obligations. Additionally, the seller remains responsible for pre-acquisition environmental obligations up to a specified amount for a specified period of time.
In connection with the East Coast Storage Assets Acquisition (as defined in “Note 4 - Acquisitions” of our Notes to Consolidated Financial Statements), PBFX purchased a ten-year,
$30.0 million
environmental insurance policy against unknown environmental liabilities. Additionally, the seller remains responsible for pre-acquisition environmental obligations up to a specified amount for a specified period of time. The recorded environmental liability associated with the East Coast Storage Assets Acquisition as of December 31, 2018 was
$885,000
.
Applicable Federal and State Regulatory Requirements
Our operations and many of the products we manufacture are subject to certain specific requirements of the Clean Air Act (the “CAA”) and related state and local regulations. The CAA contains provisions that require capital expenditures for the installation of certain air pollution control devices at our refineries. Subsequent rule making authorized by the CAA or similar laws or new agency interpretations of existing rules, may necessitate additional expenditures in future years.
In 2010, New York State adopted a Low-Sulfur Heating Oil mandate that, beginning July 1, 2012, requires all heating oil sold in New York State to contain no more than 15 parts per million (“PPM”) sulfur. Since July 1, 2012, other states in the Northeast market began requiring heating oil sold in their state to contain no more than 15 PPM sulfur. Currently, all of the Northeastern states and Washington DC have adopted sulfur controls on heating oil. As of July 1, 2018, most of the Northeastern states require heating oil with 15 PPM or less sulfur (except for Pennsylvania and Maryland - where less than 500 PPM sulfur is required). All of the heating oil we currently produce meet these specifications. The mandate and other requirements do not currently have a material impact on our financial position, results of operations or cash flows.
EPA issued the final Tier 3 Gasoline standards on March 3, 2014 under the CAA. This final rule establishes more stringent vehicle emission standards and further reduces the sulfur content of gasoline starting in January 2017. The new standard is set at 10 PPM sulfur in gasoline on an annual average basis starting January 1, 2017, with a credit trading program to provide compliance flexibility. EPA responded to industry comments on the proposed rule and maintained the per gallon sulfur cap on gasoline at the existing 80 PPM cap. The refineries are complying with these new requirements as planned, either directly or using flexibility provided by sulfur credits generated or purchased in advance as an economic optimization. The standards set by the new rule are not expected to have a material impact on our financial position, results of operations or cash flows.
We are required to comply with the Renewable Fuel Standard (“RFS”) implemented by EPA, which sets annual quotas for the quantity of renewable fuels (such as ethanol) that must be blended into motor fuels consumed in the United States. In July 2018, EPA issued proposed amendments to the RFS program regulations that would establish annual percentage standards for cellulosic biofuel, biomass-based diesel, advanced biofuel, and renewable fuels that would apply to all gasoline and diesel produced in the U.S. or imported in the year 2019. In addition, the separate proposal includes a proposed biomass-based diesel applicable volume for 2020. It is likely that RIN production will continue to be lower than needed forcing obligated parties, such as us, to purchase cellulosic waiver credits or purchase excess RINs from suppliers on the open market.
28
In addition, on November 26, 2018 EPA finalized revisions to an existing air regulation concerning Maximum Achievable Control Technologies (“MACT”) for Petroleum Refineries. The regulation requires additional continuous monitoring systems for eligible process safety valves relieving to atmosphere, minimum flare gas heat (Btu) content, and delayed coke drum vent controls to be installed by January 30, 2019. In addition, a program for ambient fence line monitoring for benzene was implemented prior to the deadline of January 30, 2018. We are in the process of implementing the requirements of this regulation. The regulation does not have a material impact on our financial position, results of operations or cash flows.
EPA published a Final Rule to the Clean Water Act (“CWA”) Section 316(b) in August 2014 regarding cooling water intake structures, which includes requirements for petroleum refineries. The purpose of this rule is to prevent fish from being trapped against cooling water intake screens (impingement) and to prevent fish from being drawn through cooling water systems (entrainment). Facilities will be required to implement Best Technology Available (“BTA”) as soon as possible, but state agencies have the discretion to establish implementation time lines. We continue to evaluate the impact of this regulation, and at this time do not anticipate it having a material impact on our financial position, results of operations or cash flows.
As a result of the Torrance Acquisition, we are subject to greenhouse gas emission control regulations in the state of California pursuant to Assembly Bill 32 (“AB32”). AB32 imposes a statewide cap on greenhouse gas emissions, including emissions from transportation fuels, with the aim of returning the state to 1990 emission levels by 2020. AB32 is implemented through two market mechanisms including the Low Carbon Fuel Standard (“LCFS”) and Cap and Trade, which was extended for an additional ten years to 2030 in July 2017. We are responsible for the AB32 obligations related to the Torrance refinery beginning on July 1, 2016 and must purchase emission credits to comply with these obligations. Additionally, in September 2016, the state of California enacted Senate Bill 32 (“SB32”) which further reduces greenhouse gas emissions targets to 40 percent below 1990 levels by 2030.
However, subsequent to the acquisition, we are recovering the majority of these costs from our customers, and as such do not expect this obligation to materially impact our financial position, results of operations, or cash flows. To the degree there are unfavorable changes to AB32 or SB32 regulations or we are unable to recover such compliance costs from customers, these regulations could have a material adverse effect on our financial position, results of operations, and cash flows.
We are subject to obligations to purchase RINs. On February 15, 2017, we received a notification that EPA records indicated that PBF Holding used potentially invalid RINs that were in fact verified under EPA’s RIN Quality Assurance Program (“QAP”) by an independent auditor as QAP A RINs. Under the regulations, use of potentially invalid QAP A RINs provided the user with an affirmative defense from civil penalties provided certain conditions are met. We have asserted the affirmative defense and if accepted by EPA will not be required to replace these RINs and will not be subject to civil penalties under the program. It is reasonably possible that EPA will not accept our defense and may assess penalties in these matters but any such amount is not expected to have a material impact on our financial position, results of operations or cash flows.
As of January 1, 2011, we are required to comply with EPA’s Control of Hazardous Air Pollutants From Mobile Sources, or MSAT2, regulations on gasoline that impose reductions in the benzene content of our produced gasoline. We purchase benzene credits to meet these requirements. Our planned capital projects will reduce the amount of benzene credits that we need to purchase. In addition, the renewable fuel standards mandate the blending of prescribed percentages of renewable fuels (e.g., ethanol and biofuels) into our produced gasoline and diesel. These new requirements, other requirements of the CAA and other presently existing or future environmental regulations may cause us to make substantial capital expenditures as well as the purchase of credits at significant cost, to enable our refineries to produce products that meet applicable requirements.
The federal Comprehensive Environmental Response, Compensation and Liability Act of 1980 (“CERCLA”), also known as “Superfund,” imposes liability, without regard to fault or the legality of the original conduct, on certain classes of persons who are considered to be responsible for the release of a “hazardous substance” into the environment. These persons include the current or former owner or operator of the disposal site or sites where the release occurred and companies that disposed of or arranged for the disposal of the hazardous substances.
29
Under CERCLA, such persons may be subject to joint and several liability for investigation and the costs of cleaning up the hazardous substances that have been released into the environment, for damages to natural resources and for the costs of certain health studies. As discussed more fully above, certain of our sites are subject to these laws and we may be held liable for investigation and remediation costs or claims for natural resource damages. It is not uncommon for neighboring landowners and other third parties to file claims for personal injury and property damage allegedly caused by hazardous substances or other pollutants released into the environment. Analogous state laws impose similar responsibilities and liabilities on responsible parties. In our current normal operations, we have generated waste, some of which falls within the statutory definition of a “hazardous substance” and some of which may have been disposed of at sites that may require cleanup under Superfund.
As is the case with all companies engaged in industries similar to ours, we face potential exposure to future claims and lawsuits involving environmental matters. These matters include soil and water contamination, air pollution, personal injury and property damage allegedly caused by substances which we manufactured, handled, used, released or disposed of.
Current and future environmental regulations are expected to require additional expenditures, including expenditures for investigation and remediation, which may be significant, at our refineries and at our other facilities. To the extent that future expenditures for these purposes are material and can be reasonably determined, these costs are disclosed and accrued.
Our operations are also subject to various laws and regulations relating to occupational health and safety. We maintain safety training and maintenance programs as part of our ongoing efforts to ensure compliance with applicable laws and regulations. Compliance with applicable health and safety laws and regulations has required and continues to require substantial expenditures.
We cannot predict what additional health, safety and environmental legislation or regulations will be enacted or become effective in the future or how existing or future laws or regulations will be administered or interpreted with respect to our operations. Compliance with more stringent laws or regulations or adverse changes in the interpretation of existing requirements or discovery of new information such as unknown contamination could have an adverse effect on the financial position and the results of our operations and could require substantial expenditures for the installation and operation of systems and equipment that we do not currently possess
.
30
ITEM 1A. RISK FACTORS
Risks Relating to Our Business and Industry
You should carefully read the risks and uncertainties described below. The risks and uncertainties described below are not the only ones facing our company. Additional risks and uncertainties may also impair our business operations. If any of the following risks actually occur, our business, financial condition, results of operations or cash flows would likely suffer. In that case, the trading price of PBF Energy Class A common stock could fall.
The price volatility of crude oil, other feedstocks, blendstocks, refined products and fuel and utility services may have a material adverse effect on our revenues, profitability, cash flows and liquidity.
Our revenues, profitability, cash flows and liquidity from operations depend primarily on the margin above operating expenses (including the cost of refinery feedstocks, such as crude oil, intermediate partially refined petroleum products, and natural gas liquids that are processed and blended into refined products) at which we are able to sell refined products. Refining is primarily a margin-based business and, to increase profitability, it is important to maximize the yields of high value finished products while minimizing the costs of feedstock and operating expenses. When the margin between refined product prices and crude oil and other feedstock costs contracts, our earnings, profitability and cash flows are negatively affected. Refining margins historically have been volatile, and are likely to continue to be volatile, as a result of a variety of factors, including fluctuations in the prices of crude oil, other feedstocks, refined products and fuel and utility services. An increase or decrease in the price of crude oil will likely result in a similar increase or decrease in prices for refined products; however, there may be a time lag in the realization, or no such realization, of the similar increase or decrease in prices for refined products. The effect of changes in crude oil prices on our refining margins therefore depends in part on how quickly and how fully refined product prices adjust to reflect these changes.
In addition, the nature of our business requires us to maintain substantial crude oil, feedstock and refined product inventories. Because crude oil, feedstock and refined products are commodities, we have no control over the changing market value of these inventories. Our crude oil, feedstock and refined product inventories are valued at the lower of cost or market value under the last-in-first-out (“LIFO”) inventory valuation methodology. If the market value of our crude oil, feedstock and refined product inventory declines to an amount less than our LIFO cost, we would record a write-down of inventory and a non-cash impact to cost of products and other. For example, during the year ended
December 31, 2018
, we recorded an adjustment to value our inventories to the lower of cost or market which
decreased
income from operations and net income by
$351.3
million and
$259.9
million, respectively, reflecting the net change in the lower of cost or market (“LCM”) inventory reserve from
$300.5
million at
December 31, 2017
to
$651.7
million at
December 31, 2018
.
Prices of crude oil, other feedstocks, blendstocks, and refined products depend on numerous factors beyond our control, including the supply of and demand for crude oil, other feedstocks, gasoline, diesel, ethanol, asphalt and other refined products. Such supply and demand are affected by a variety of economic, market, environmental and political conditions.
Our direct operating expense structure also impacts our profitability. Our major direct operating expenses include employee and contract labor, maintenance and energy. Our predominant variable direct operating cost is energy, which is comprised primarily of fuel and other utility services. The volatility in costs of fuel, principally natural gas, and other utility services, principally electricity, used by our refineries and other operations affect our operating costs. Fuel and utility prices have been, and will continue to be, affected by factors outside our control, such as supply and demand for fuel and utility services in both local and regional markets. Natural gas prices have historically been volatile and, typically, electricity prices fluctuate with natural gas prices. Future increases in fuel and utility prices may have a negative effect on our refining margins, profitability and cash flows.
31
Our profitability is affected by crude oil differentials and related factors, which fluctuate substantially.
A significant portion of our profitability is derived from the ability to purchase and process crude oil feedstocks that historically have been less expensive than benchmark crude oils, such as the heavy, sour crude oils processed at our Delaware City, Paulsboro, Chalmette and Torrance refineries. For our Toledo refinery, aside from recent crude differential volatility, purchased crude prices have historically been slightly above the WTI benchmark, however, such crude slate typically results in favorable refinery production yield. For all locations, these crude oil differentials can vary significantly from quarter to quarter depending on overall economic conditions and trends and conditions within the markets for crude oil and refined products. Any change in these crude oil differentials may have an impact on our earnings. Our rail investment and strategy to acquire cost advantaged Mid-Continent and Canadian crude, which are priced based on WTI, could be adversely affected when the Dated Brent/WTI or related differentials narrow. A narrowing of the WTI/Dated Brent differential may result in our Toledo refinery losing a portion of its crude oil price advantage over certain of our competitors, which negatively impacts our profitability. In addition, efforts in Canada to control the imbalance between its production and capacity to export crude may continue to result in price volatility and the narrowing of the WTI/WCS differential, which is a proxy for the difference between light U.S. and heavy Canadian crude oil, and may reduce our refining margins and adversely affect our profitability and earnings. Divergent views have been expressed as to the expected magnitude of changes to these crude differentials in future periods. Any continued or further narrowing of these differentials could have a material adverse effect on our business and profitability.
Additionally, governmental and regulatory actions, including continued resolutions by the Organization of the Petroleum Exporting Countries to restrict crude oil production levels and executive actions by the current U.S. presidential administration to advance certain energy infrastructure projects such as the Keystone XL pipeline, may continue to impact crude oil prices and crude oil differentials. Any increase in crude oil prices or unfavorable movements in crude oil differentials due to such actions or changing regulatory environment may negatively impact our ability to acquire crude oil at economical prices and could have a material adverse effect on our business and profitability.
A significant interruption or casualty loss at any of our refineries and related assets could reduce our production, particularly if not fully covered by our insurance. Failure by one or more insurers to honor its coverage commitments for an insured event could materially and adversely affect our future cash flows, operating results and financial condition.
Our business currently consists of owning and operating five refineries and related assets. As a result, our operations could be subject to significant interruption if any of our refineries were to experience a major accident, be damaged by severe weather or other natural disaster, or otherwise be forced to shut down or curtail production due to unforeseen events, such as acts of God, nature, orders of governmental authorities, supply chain disruptions impacting our crude rail facilities or other logistical assets, power outages, acts of terrorism, fires, toxic emissions and maritime hazards. Any such shutdown or disruption would reduce the production from that refinery. There is also risk of mechanical failure and equipment shutdowns both in general and following unforeseen events. Further, in such situations, undamaged refinery processing units may be dependent on or interact with damaged sections of our refineries and, accordingly, are also subject to being shut down. In the event any of our refineries is forced to shut down for a significant period of time, it would have a material adverse effect on our earnings, our other results of operations and our financial condition as a whole.
As protection against these hazards, we maintain insurance coverage against some, but not all, such potential losses and liabilities. We may not be able to maintain or obtain insurance of the type and amount we desire at reasonable rates. As a result of market conditions, premiums and deductibles for certain of our insurance policies may increase substantially. In some instances, certain insurance could become unavailable or available only for reduced amounts of coverage. For example, coverage for hurricane damage can be limited, and coverage for terrorism risks can include broad exclusions. If we were to incur a significant liability for which we were not fully insured, it could have a material adverse effect on our financial position.
32
Our insurance program includes a number of insurance carriers. Significant disruptions in financial markets could lead to a deterioration in the financial condition of many financial institutions, including insurance companies and, therefore, we may not be able to obtain the full amount of our insurance coverage for insured events.
Our refineries are subject to interruptions of supply and distribution as a result of our reliance on pipelines and railroads for transportation of crude oil and refined products.
Our Toledo, Chalmette and Torrance refineries receive a significant portion of their crude oil through pipelines. These pipelines include the Enbridge system, Capline and Mid-Valley pipelines for supplying crude to our Toledo refinery, the MOEM and CAM pipelines for supplying crude to our Chalmette refinery and the San Joaquin Pipeline, San Ardo and Coastal Pipeline systems for supplying crude to our Torrance refinery. Additionally, our Toledo, Chalmette and Torrance refineries deliver a significant portion of the refined products through pipelines. These pipelines include pipelines such as the Sunoco Logistics Partners L.P. and Buckeye Partners L.P. pipelines at Toledo, the Collins Pipeline at our Chalmette refinery and Jet Pipeline to the Los Angeles International Airport, the Product Pipeline to Vernon and the Product Pipeline to Atwood at our Torrance refinery. We could experience an interruption of supply or delivery, or an increased cost of receiving crude oil and delivering refined products to market, if the ability of these pipelines to transport crude oil or refined products is disrupted because of accidents, weather interruptions, governmental regulation, terrorism, other third-party action or casualty or other events.
The Delaware City rail unloading facilities and our recently acquired East Coast Storage Assets, allow our East Coast refineries to source WTI-based crudes from Western Canada and the Mid-Continent, which may provide significant cost advantages versus traditional Brent-based international crudes in certain market environments. Any disruptions or restrictions to our supply of crude by rail due to problems with third-party logistics infrastructure or operations or as a result of increased regulations, could increase our crude costs and negatively impact our results of operations and cash flows.
In addition, due to the common carrier regulatory obligation applicable to interstate oil pipelines, capacity allocation among shippers can become contentious in the event demand is in excess of capacity. Therefore, nominations by new shippers or increased nominations by existing shippers may reduce the capacity available to us. Any prolonged interruption in the operation or curtailment of available capacity of the pipelines that we rely upon for transportation of crude oil and refined products could have a further material adverse effect on our business, financial condition, results of operations and cash flows.
Regulation of emissions of greenhouse gases could force us to incur increased capital and operating costs and could have a material adverse effect on our results of operations and financial condition.
Both houses of Congress have actively considered legislation to reduce emissions of greenhouse gases (“GHGs”), such as carbon dioxide and methane, including proposals to: (i) establish a cap and trade system, (ii) create a federal renewable energy or “clean” energy standard requiring electric utilities to provide a certain percentage of power from such sources, and (iii) create enhanced incentives for use of renewable energy and increased efficiency in energy supply and use. In addition, EPA is taking steps to regulate GHGs under the existing federal Clean Air Act (the “CAA”). EPA has already adopted regulations limiting emissions of GHGs from motor vehicles, addressing the permitting of GHG emissions from stationary sources, and requiring the reporting of GHG emissions from specified large GHG emission sources, including refineries. These and similar regulations could require us to incur costs to monitor and report GHG emissions or reduce emissions of GHGs associated with our operations. In addition, various states, individually as well as in some cases on a regional basis, have taken steps to control GHG emissions, including adoption of GHG reporting requirements, cap and trade systems and renewable portfolio standards (such as AB32 regulations in California). Efforts have also been undertaken to delay, limit or prohibit EPA and possibly state action to regulate GHG emissions, and it is not possible at this time to predict the ultimate form, timing or extent of federal or state regulation. In addition, it is currently uncertain how the current presidential administration will address GHG emissions. In the event we do incur increased costs as a result of increased efforts to control GHG emissions, we may not be able to pass on any of these costs to our customers. Such requirements also could adversely affect demand for the refined petroleum products that we produce. Any increased costs or reduced demand could materially and adversely affect our business and results of operation.
33
Requirements to reduce emissions could result in increased costs to operate and maintain our facilities as well as implement and manage new emission controls and programs put in place. For example, AB32 in California requires the state to reduce its GHG emissions to 1990 levels by 2020. Additionally, in September 2016, the state of California enacted Senate Bill 32 which further reduces greenhouse gas emissions targets to 40 percent below 1990 levels by 2030. Two regulations implemented to achieve these goals are Cap-and-Trade and the Low Carbon Fuel Standard (“LCFS”). In 2012, the California Air Resource Board (“CARB”) implemented Cap-and-Trade. This program currently places a cap on GHGs and we are required to acquire a sufficient number of credits to cover emissions from our refineries and our in-state sales of gasoline and diesel. In 2009, CARB adopted the LCFS, which requires a 10% reduction in the carbon intensity of gasoline and diesel by 2020. Compliance is achieved through blending lower carbon intensity biofuels into gasoline and diesel or by purchasing credits. Compliance with each of these programs is facilitated through a market-based credit system. If sufficient credits are unavailable for purchase or we are unable to pass through costs to our customers, we have to pay a higher price for credits or if we are otherwise unable to meet our compliance obligations, our financial condition and results of operations could be adversely affected.
Our hedging activities may limit our potential gains, exacerbate potential losses and involve other risks.
We may enter into commodity derivatives contracts to hedge our crude price risk or crack spread risk with respect to a portion of our expected gasoline and distillate production on a rolling basis or to hedge our exposure to the price of natural gas, which is a significant component of our refinery operating expenses. Consistent with that policy we may hedge some percentage of our future crude and natural gas supply. We may enter into hedging arrangements with the intent to secure a minimum fixed cash flow stream on the volume of products hedged during the hedge term and to protect against volatility in commodity prices. Our hedging arrangements may fail to fully achieve these objectives for a variety of reasons, including our failure to have adequate hedging arrangements, if any, in effect at any particular time and the failure of our hedging arrangements to produce the anticipated results. We may not be able to procure adequate hedging arrangements due to a variety of factors. Moreover, such transactions may limit our ability to benefit from favorable changes in crude oil, refined product and natural gas prices. In addition, our hedging activities may expose us to the risk of financial loss in certain circumstances, including instances in which:
|
•
|
the volumes of our actual use of crude oil or natural gas or production of the applicable refined products is less than the volumes subject to the hedging arrangement;
|
|
•
|
accidents, interruptions in feedstock transportation, inclement weather or other events cause unscheduled shutdowns or otherwise adversely affect our refineries, or those of our suppliers or customers;
|
|
•
|
changes in commodity prices have a material impact on collateral and margin requirements under our hedging arrangements, resulting in us being subject to margin calls;
|
|
•
|
the counterparties to our derivative contracts fail to perform under the contracts; or
|
|
•
|
a sudden, unexpected event materially impacts the commodity or crack spread subject to the hedging arrangement.
|
As a result, the effectiveness of our hedging strategy could have a material impact on our financial results. See “Item 7. Management’s Discussion and Analysis of Financial Condition and Results of Operations—Quantitative and Qualitative Disclosures About Market Risk.”
In addition, these hedging activities involve basis risk. Basis risk in a hedging arrangement occurs when the price of the commodity we hedge is more or less variable than the index upon which the hedged commodity is based, thereby making the hedge less effective. For example, a NYMEX index used for hedging certain volumes of our crude oil or refined products may have more or less variability than the actual cost or price we realize for such crude oil or refined products. We may not hedge all the basis risk inherent in our hedging arrangements and derivative contracts.
34
We may have capital needs for which our internally generated cash flows and other sources of liquidity may not be adequate.
If we cannot generate sufficient cash flows or otherwise secure sufficient liquidity to support our short-term and long-term capital requirements, we may not be able to meet our payment obligations or our future debt obligations, comply with certain deadlines related to environmental regulations and standards, or pursue our business strategies, including acquisitions, in which case our operations may not perform as we currently expect. We have substantial short-term capital needs and may have substantial long term capital needs. Our short-term working capital needs are primarily related to financing certain of our crude oil and refined products inventory not covered by our various supply and Inventory Intermediation Agreements. Pursuant to the Inventory Intermediation Agreements, J. Aron purchases and holds title to certain of the intermediate and finished products (the “Products”) produced by the Delaware City and Paulsboro refineries (the “Refineries”) and delivered into the tanks at the refineries (or at other locations outside of the refineries as agreed upon by both parties). Furthermore, J. Aron agrees to sell the intermediate and finished products back to us as they are discharged out of the refineries’ tanks (or other locations outside of the refineries as agreed upon by both parties). We market and sell the finished products independently to third parties.
If we cannot adequately handle our crude oil and feedstock requirements or if we are required to obtain our crude oil supply at our other refineries without the benefit of the existing supply arrangements or the applicable counterparty defaults in its obligations, our crude oil pricing costs may increase as the number of days between when we pay for the crude oil and when the crude oil is delivered to us increases. Termination of our Inventory Intermediation Agreements with J. Aron would require us to finance our refined products inventory covered by the agreements at terms that may not be as favorable. Additionally, we are obligated to repurchase from J. Aron all volumes of products located at the refineries’ storage tanks (or at other locations outside of the refineries as agreed upon by both parties) upon termination of these agreements, which may have a material adverse impact on our working capital and financial condition. Further, if we are not able to market and sell our finished products to credit worthy customers, we may be subject to delays in the collection of our accounts receivable and exposure to additional credit risk. Such increased exposure could negatively impact our liquidity due to our increased working capital needs as a result of the increase in the amount of crude oil inventory and accounts receivable we would have to carry on our consolidated balance sheet. Our long-term needs for cash include those to support ongoing capital expenditures for equipment maintenance and upgrades during turnarounds at our refineries and to complete our routine and normally scheduled maintenance, regulatory and security expenditures.
In addition, from time to time, we are required to spend significant amounts for repairs when one or more processing units experiences temporary shutdowns. We continue to utilize significant capital to upgrade equipment, improve facilities, and reduce operational, safety and environmental risks. In connection with the Paulsboro and Torrance acquisitions, we assumed certain significant environmental obligations, and may similarly do so in future acquisitions. We will likely incur substantial compliance costs in connection with new or changing environmental, health and safety regulations. See “Item 7. Management’s Discussion and Analysis of Financial Condition.” Our liquidity condition will affect our ability to satisfy any and all of these needs or obligations.
We may not be able to obtain funding on acceptable terms or at all because of volatility and uncertainty in the credit and capital markets. This may hinder or prevent us from meeting our future capital needs.
In the past, global financial markets and economic conditions have been, and may again be, subject to disruption and volatile due to a variety of factors, including uncertainty in the financial services sector, low consumer confidence, falling commodity prices, geopolitical issues and generally weak economic conditions. In addition, the fixed income markets have experienced periods of extreme volatility that have negatively impacted market liquidity conditions. As a result, the cost of raising money in the debt and equity capital markets has increased substantially at times while the availability of funds from those markets diminished significantly. In particular, as a result of concerns about the stability of financial markets generally, which may be subject to unforeseen disruptions, the cost of obtaining money from the credit markets may increase as many lenders and institutional investors increase interest rates, enact tighter lending standards, refuse to refinance existing debt on similar terms or at all and reduce or, in some cases, cease to provide funding to borrowers. Due to these factors, we cannot be
35
certain that new debt or equity financing will be available on acceptable terms. If funding is not available when needed, or is available only on unfavorable terms, we may be unable to meet our obligations as they come due. Moreover, without adequate funding, we may be unable to execute our growth strategy, complete future acquisitions, take advantage of other business opportunities or respond to competitive pressures, any of which could have a material adverse effect on our revenues and results of operations.
Competition from companies who produce their own supply of feedstocks, have extensive retail outlets, make alternative fuels or have greater financial and other resources than we do could materially and adversely affect our business and results of operations.
Our refining operations compete with domestic refiners and marketers in regions of the United States in which we operate, as well as with domestic refiners in other regions and foreign refiners that import products into the United States. In addition, we compete with other refiners, producers and marketers in other industries that supply their own renewable fuels or alternative forms of energy and fuels to satisfy the requirements of our industrial, commercial and individual consumers. Certain of our competitors have larger and more complex refineries, and may be able to realize lower per-barrel costs or higher margins per barrel of throughput. Several of our principal competitors are integrated national or international oil companies that are larger and have substantially greater resources than we do and access to proprietary sources of controlled crude oil production. Unlike these competitors, we obtain substantially all of our feedstocks from unaffiliated sources. We are not engaged in the petroleum exploration and production business and therefore do not produce any of our crude oil feedstocks. We do not have a retail business and therefore are dependent upon others for outlets for our refined products. Because of their integrated operations and larger capitalization, these companies may be more flexible in responding to volatile industry or market conditions, such as shortages of crude oil supply and other feedstocks or intense price fluctuations.
Newer or upgraded refineries will often be more efficient than our refineries, which may put us at a competitive disadvantage. We have taken significant measures to maintain our refineries including the installation of new equipment and redesigning older equipment to improve our operations. However, these actions involve significant uncertainties, since upgraded equipment may not perform at expected throughput levels, the yield and product quality of new equipment may differ from design specifications and modifications may be needed to correct equipment that does not perform as expected. Any of these risks associated with new equipment, redesigned older equipment or repaired equipment could lead to lower revenues or higher costs or otherwise have an adverse effect on future results of operations and financial condition. Over time, our refineries or certain refinery units may become obsolete, or be unable to compete, because of the construction of new, more efficient facilities by our competitors.
A portion of our workforce is unionized, and we may face labor disruptions that would interfere with our operations.
At Delaware City, Toledo, Chalmette and Torrance, most hourly employees are covered by a collective bargaining agreement through the USW. The agreements with the USW covering the Delaware City refinery and Chalmette refinery are scheduled to expire in January 2022, the agreement with the USW covering Toledo is scheduled to expire in February 2022, the agreement with the USW covering certain Torrance Logistics employees is scheduled to expire in April 2021 and the agreements with the USW covering certain PBFX employees are scheduled to expire in April 2021 and February 2022. The agreements with the USW covering the represented employees at the Torrance refinery and Torrance logistics facilities expired in January 2019, with a tentative agreement in place that would extend the respective collective bargaining agreement expiration dates through January 2022 subject to an affirmative ratification vote and execution. Similarly, at the Paulsboro refinery, hourly employees are represented by the IOW under a contract scheduled to expire in March 2022. Future negotiations as our collective agreements expire may result in labor unrest for which a strike or work stoppage is possible. Strikes and/or work stoppages could negatively affect our operational and financial results and may increase operating expenses at the refineries.
36
Any political instability, military strikes, sustained military campaigns, terrorist activity, or changes in foreign policy could have a material adverse effect on our business, results of operations and financial condition.
Any political instability, military strikes, sustained military campaigns, terrorist activity, or changes in foreign policy in areas or regions of the world where we acquire crude oil and other raw materials or sell our refined petroleum products may affect our business in unpredictable ways, including forcing us to increase security measures and causing disruptions of supplies and distribution markets. We may also be subject to United States trade and economic sanctions laws, which change frequently as a result of foreign policy developments, and which may necessitate changes to our crude oil acquisition activities. Further, like other industrial companies, our facilities may be the target of terrorist activities. Any act of war or terrorism that resulted in damage to any of our refineries or third-party facilities upon which we are dependent for our business operations could have a material adverse effect on our business, results of operations and financial condition.
Economic turmoil in the global financial system or an economic slowdown or recession in the future may have an adverse impact on the refining industry.
Our business and profitability are affected by the overall level of demand for our products, which in turn is affected by factors such as overall levels of economic activity and business and consumer confidence and spending. In the past, declines in global economic activity and consumer and business confidence and spending significantly reduced the level of demand for our products. In addition, macroeconomic trends, such as economic recession, inflation, unemployment and interest rates can affect the level of demand for our products. Reduced demand for our products may have an adverse impact on our business, financial condition, results of operations and cash flows. In addition, downturns in the economy impact the demand for refined fuels and, in turn, result in excess refining capacity. Refining margins are impacted by changes in domestic and global refining capacity, as increases in refining capacity can adversely impact refining margins, earnings and cash flows.
Our business is indirectly exposed to risks faced by our suppliers, customers and other business partners. The impact on these constituencies of the risks posed by economic turmoil in the global financial system could include interruptions or delays in the performance by counterparties to our contracts, reductions and delays in customer purchases, delays in or the inability of customers to obtain financing to purchase our products and the inability of customers to pay for our products. Any of these events may have an adverse impact on our business, financial condition, results of operations and cash flows.
We must make substantial capital expenditures on our operating facilities to maintain their reliability and efficiency. If we are unable to complete capital projects at their expected costs and/or in a timely manner, or if the market conditions assumed in our project economics deteriorate, our financial condition, results of operations or cash flows could be materially and adversely affected.
Delays or cost increases related to capital spending programs involving engineering, procurement and construction of new facilities (or improvements and repairs to our existing facilities and equipment, including turnarounds) could adversely affect our ability to achieve targeted internal rates of return and operating results. Such delays or cost increases may arise as a result of unpredictable factors in the marketplace, many of which are beyond our control, including:
|
•
|
denial or delay in obtaining regulatory approvals and/or permits;
|
|
•
|
unplanned increases in the cost of construction materials or labor;
|
|
•
|
disruptions in transportation of modular components and/or construction materials;
|
|
•
|
severe adverse weather conditions, natural disasters or other events (such as equipment malfunctions, explosions, fires or spills) affecting our facilities, or those of vendors and suppliers;
|
|
•
|
shortages of sufficiently skilled labor, or labor disagreements resulting in unplanned work stoppages;
|
|
•
|
market-related increases in a project’s debt or equity financing costs; and/or
|
|
•
|
non-performance or force majeure by, or disputes with, vendors, suppliers, contractors or sub-contractors involved with a project.
|
37
Our refineries contain many processing units, a number of which have been in operation for many years. Equipment, even if properly maintained, may require significant capital expenditures and expenses to keep it operating at optimum efficiency. One or more of the units may require unscheduled downtime for unanticipated maintenance or repairs that are more frequent than our scheduled turnarounds for such units. Scheduled and unscheduled maintenance could reduce our revenues during the period of time that the units are not operating.
Our forecasted internal rates of return are also based upon our projections of future market fundamentals, which are not within our control, including changes in general economic conditions, available alternative supply and customer demand. Any one or more of these factors could have a significant impact on our business. If we were unable to make up the delays associated with such factors or to recover the related costs, or if market conditions change, it could materially and adversely affect our financial position, results of operations or cash flows.
Acquisitions that we may undertake in the future involve a number of risks, any of which could cause us not to realize the anticipated benefits.
We may not be successful in acquiring additional assets, and any acquisitions that we do consummate may not produce the anticipated benefits or may have adverse effects on our business and operating results. We may selectively consider strategic acquisitions in the future within the refining and mid-stream sector based on performance through the cycle, advantageous access to crude oil supplies, attractive refined products market fundamentals and access to distribution and logistics infrastructure. Our ability to do so will be dependent upon a number of factors, including our ability to identify acceptable acquisition candidates, consummate acquisitions on acceptable terms, successfully integrate acquired assets and obtain financing to fund acquisitions and to support our growth and many other factors beyond our control. Risks associated with acquisitions include those relating to the diversion of management time and attention from our existing business, liability for known or unknown environmental conditions or other contingent liabilities and greater than anticipated expenditures required for compliance with environmental, safety or other regulatory standards or for investments to improve operating results, and the incurrence of additional indebtedness to finance acquisitions or capital expenditures relating to acquired assets. We may also enter into transition services agreements in the future with sellers of any additional refineries we acquire. Such services may not be performed timely and effectively, and any significant disruption in such transition services or unanticipated costs related to such services could adversely affect our business and results of operations. In addition, it is likely that, when we acquire refineries, we will not have access to the type of historical financial information that we will require regarding the prior operation of the refineries. As a result, it may be difficult for investors to evaluate the probable impact of significant acquisitions on our financial performance until we have operated the acquired refineries for a substantial period of time.
Our business may suffer if any of our senior executives or other key employees discontinues employment with us. Furthermore, a shortage of skilled labor or disruptions in our labor force may make it difficult for us to maintain labor productivity.
Our future success depends to a large extent on the services of our senior executives and other key employees. Our business depends on our continuing ability to recruit, train and retain highly qualified employees in all areas of our operations, including engineering, accounting, business operations, finance and other key back-office and mid-office personnel. Furthermore, our operations require skilled and experienced employees with proficiency in multiple tasks. The competition for these employees is intense, and the loss of these executives or employees could harm our business. If any of these executives or other key personnel resigns or becomes unable to continue in his or her present role and is not adequately replaced, our business operations could be materially adversely affected.
Our commodity derivative activities could result in period-to-period earnings volatility.
We do not currently apply hedge accounting to any of our commodity derivative contracts and, as a result, unrealized gains and losses will be charged to our earnings based on the increase or decrease in the market value of such unsettled positions. These gains and losses may be reflected in our income statement in periods that differ from when the settlement of the underlying hedged items are reflected in our income statement. Such derivative
38
gains or losses in earnings may produce significant period-to-period earnings volatility that is not necessarily reflective of our underlying operational performance.
Derivatives legislation, including compliance with the Dodd-Frank Act, could have an adverse effect on our business, including our ability to use derivatives contracts to reduce the effect of commodity price, interest rate and other risks associated with our business.
The United States Congress in 2010 passed the Dodd-Frank Wall Street Reform and Consumer Protection Act (the “Dodd-Frank Act”) which, among other things, established federal oversight and regulation of the over-the-counter derivatives market and entities that participate in that market. In connection with the Dodd-Frank Act, the Commodity Futures Trading Commission, or the CFTC, has established rules to set position limits for certain futures and option contracts, and for swaps that are their economic equivalent, in the major energy markets. The legislation and related regulations require us to comply with margin requirements and with certain clearing and trade-execution requirements if we are in scope and do not otherwise satisfy certain specific exceptions. The legislation and related regulations could significantly increase the cost of regulatory compliance as well as derivatives contracts (including through requirements to post collateral), materially alter the terms of derivatives contracts, reduce the availability of derivatives to protect against risks we encounter and reduce our ability to monetize or restructure our existing derivatives contracts. If we fail to comply with applicable regulations or the costs of compliance becomes prohibitive, our results of operations may become more volatile and our cash flows may be less predictable, which could adversely affect our ability to plan for and fund capital expenditures. Any of these consequences could have a material adverse effect on us, our financial condition and our results of operations.
We may incur significant liability under, or costs and capital expenditures to comply with, environmental and health and safety regulations, which are complex and change frequently.
Our operations are subject to federal, state and local laws regulating, among other things, the use and/or handling of petroleum and other regulated materials, the emission and discharge of materials into the environment, waste management, and remediation of discharges of petroleum and petroleum products, characteristics and composition of gasoline and distillates and other matters otherwise relating to the protection of the environment and the health and safety of the surrounding community. For example, the SCAQMD is currently considering further regulations on, or potentially banning the use of, modified hydrofluoric acid, also known as MHF, in Southern California. We utilize MHF as an alkylation catalyst in the manufacturing of gasoline at our Torrance refinery. If MHF usage is limited or restricted by the SCAQMD, our current Torrance refinery operations would be adversely affected, which could have a material adverse effect on our business, financial condition, cash flows and results of operations. Our operations are also subject to extensive laws and regulations relating to occupational health and safety.
We cannot predict what additional environmental, health and safety legislation or regulations may be adopted in the future, or how existing or future laws or regulations may be administered or interpreted with respect to our operations. Many of these laws and regulations have become increasingly stringent over time, and the cost of compliance with these requirements can be expected to increase over time.
Certain environmental laws impose strict, and in certain circumstances, joint and several, liability for costs of investigation and cleanup of spills, discharges or releases on owners and operators of, as well as persons who arrange for treatment or disposal of regulated materials at, contaminated sites. Under these laws, we may incur liability or be required to pay penalties for past contamination, and third parties may assert claims against us for damages allegedly arising out of any past or future contamination. The potential penalties and clean-up costs for past or future spills, discharges or releases, the failure of prior owners of our facilities to complete their clean-up obligations, the liability to third parties for damage to their property, or the need to address newly-discovered information or conditions that may require a response could be significant, and the payment of these amounts could have a material adverse effect on our business, financial condition, cash flows and results of operations.
39
Environmental clean-up and remediation costs of our sites and environmental litigation could decrease our net cash flow, reduce our results of operations and impair our financial condition.
We are subject to liability for the investigation and clean-up of environmental contamination at each of the properties that we own or operate and at off-site locations where we arrange for the treatment or disposal of regulated materials. We may become involved in litigation or other proceedings related to the foregoing. If we were to be held responsible for damages in any such litigation or proceedings, such costs may not be covered by insurance and may be material. Historical soil and groundwater contamination has been identified at our refineries. Currently, remediation projects for such contamination are underway in accordance with regulatory requirements at our refineries. In connection with the acquisitions of certain of our refineries and logistics assets, the prior owners have retained certain liabilities or indemnified us for certain liabilities, including those relating to pre-acquisition soil and groundwater conditions, and in some instances we have assumed certain liabilities and environmental obligations, including certain existing and potential remediation obligations. If the prior owners fail to satisfy their obligations for any reason, or if significant liabilities arise in the areas in which we assumed liability, we may become responsible for remediation expenses and other environmental liabilities, which could have a material adverse effect on our business, financial condition, results of operations and cash flow. As a result, in addition to making capital expenditures or incurring other costs to comply with environmental laws, we also may be liable for significant environmental litigation or for investigation and remediation costs and other liabilities arising from the ownership or operation of these assets by prior owners, which could materially adversely affect our business, financial condition, results of operations and cash flow. See “Item 7. Management’s Discussion and Analysis of Financial Condition and Results of Operations—Contractual Obligations and Commitments” and “Item 1. Business—Environmental, Health and Safety Matters.”
We may also face liability arising from current or future claims alleging personal injury or property damage due to exposure to chemicals or other regulated materials, such as asbestos, benzene, silica dust and petroleum hydrocarbons, at or from our facilities. We may also face liability for personal injury, property damage, natural resource damage or clean-up costs for the alleged migration of contamination from our properties. A significant increase in the number or success of these claims could materially adversely affect our business, financial condition, results of operations and cash flow.
Our operations could be disrupted if our critical information systems are hacked or fail, causing increased expenses and loss of sales.
Our business is highly dependent on financial, accounting and other data processing systems and other communications and information systems, including our enterprise resource planning tools. We process a large number of transactions on a daily basis and rely upon the proper functioning of computer systems. If a key system was hacked or otherwise interfered with by an unauthorized access, or was to fail or experience unscheduled downtime for any reason, even if only for a short period, our operations and financial results could be affected adversely. Our systems could be damaged or interrupted by a security breach, cyber-attack, human error, fraud, fire, flood, power loss, telecommunications failure or similar event. We have a formal disaster recovery plan in place, but this plan may not prevent delays or other complications that could arise from an information systems failure.
As the frequency of attempted cyber-attacks has increased in recent years, we have taken several actions to enhance our strategy to address and monitor cyber related risks. We have instituted a cybersecurity team that is dedicated and responsible for the design and execution of our cyber-risk management strategy. However, there can be no assurance that these efforts will be effective to prevent cyber attacks or other interruptions of, or damage to, our key systems, business or operations, or that our business interruption insurance will compensate us adequately for losses that may occur, which could materially, adversely affect our business, financial condition, results of operations and cash flows.
40
Product liability claims and litigation could adversely affect our business and results of operations.
Product liability is a significant commercial risk. Substantial damage awards have been made in certain jurisdictions against manufacturers and resellers based upon claims for injuries and property damage caused by the use of or exposure to various products. Failure of our products to meet required specifications or claims that a product is inherently defective could result in product liability claims from our shippers and customers, and also arise from contaminated or off-specification product in commingled pipelines and storage tanks and/or defective fuels. Product liability claims against us could have a material adverse effect on our business or results of operations.
Climate change could have a material adverse impact on our operations and adversely affect our facilities.
Some scientists have concluded that increasing concentrations of GHGs in the Earth’s atmosphere may produce climate changes that have significant physical effects, such as increased frequency and severity of storms, droughts, floods and other climatic events. We believe the issue of climate change will likely continue to receive scientific and political attention, with the potential for further laws and regulations that could materially adversely affect our ongoing operations.
In addition, as many of our facilities are located near coastal areas, rising sea levels may disrupt our ability to operate those facilities or transport crude oil and refined petroleum products. Extended periods of such disruption could have an adverse effect on our results of operation. We could also incur substantial costs to protect or repair these facilities.
Renewable fuels mandates may reduce demand for the refined fuels we produce, which could have a material adverse effect on our results of operations and financial condition. The market prices for RINs have been volatile and may harm our profitability.
Pursuant to the Energy Policy Act of 2005 and the Energy Independence and Security Act of 2007, EPA has issued Renewable Fuel Standards, or RFS, implementing mandates to blend renewable fuels into the petroleum fuels produced and sold in the United States. Under RFS, the volume of renewable fuels that obligated refineries must blend into their finished petroleum fuels increases annually over time until 2022. In addition, certain states have passed legislation that requires minimum biodiesel blending in finished distillates. On October 13, 2010, EPA raised the maximum amount of ethanol allowed under federal law from 10% to 15% for cars and light trucks manufactured since 2007. The maximum amount allowed under federal law currently remains at 10% ethanol for all other vehicles. Existing laws and regulations could change, and the minimum volumes of renewable fuels that must be blended with refined petroleum fuels may increase. Because we do not produce renewable fuels, increasing the volume of renewable fuels that must be blended into our products displaces an increasing volume of our refinery’s product pool, potentially resulting in lower earnings and profitability. In addition, in order to meet certain of these and future EPA requirements, we may be required to purchase RINs, which may have fluctuating costs. We incurred approximately
$143.9 million
in RINs costs during the year ended
December 31, 2018
as compared to
$293.7 million
and
$347.5 million
during the years ended
December 31, 2017
and
2016
, respectively. The fluctuations in our RINs costs are due primarily to volatility in prices for ethanol-linked RINs and increases in our production of on-road transportation fuels since 2012. Our RINs purchase obligation is dependent on our actual shipment of on-road transportation fuels domestically and the amount of blending achieved which can cause variability in our profitability.
Our pipelines are subject to federal and/or state regulations, which could reduce profitability and the amount of cash we generate.
Our transportation activities are subject to regulation by multiple governmental agencies. The regulatory burden on the industry increases the cost of doing business and affects profitability. Additional proposals and proceedings that affect the oil industry are regularly considered by Congress, the states, the Federal Energy Regulatory Commission, the United States Department of Transportation, and the courts. We cannot predict when or whether any such proposals may become effective or what impact such proposals may have. Projected operating costs related to our pipelines reflect the recurring costs resulting from compliance with these regulations, and these
41
costs may increase due to future acquisitions, changes in regulation, changes in use, or discovery of existing but unknown compliance issues.
We are subject to strict laws and regulations regarding employee and process safety, and failure to comply with these laws and regulations could have a material adverse effect on our results of operations, financial condition and profitability.
We are subject to the requirements of the Occupational Safety & Health Administration, or OSHA, and comparable state statutes that regulate the protection of the health and safety of workers. In addition, OSHA requires that we maintain information about hazardous materials used or produced in our operations and that we provide this information to employees, state and local governmental authorities, and local residents. Failure to comply with OSHA requirements, including general industry standards, process safety standards and control of occupational exposure to regulated substances, could have a material adverse effect on our results of operations, financial condition and the cash flows of the business if we are subjected to significant fines or compliance costs.
Compliance with and changes in tax laws could adversely affect our performance.
We are subject to extensive tax liabilities, including federal, state, local and foreign taxes such as income, excise, sales/use, payroll, franchise, property, gross receipts, withholding and ad valorem taxes. New tax laws and regulations and changes in existing tax laws and regulations are continuously being enacted or proposed that could result in increased expenditures for tax liabilities in the future. These liabilities are subject to periodic audits by the respective taxing authorities, which could increase our tax liabilities. Subsequent changes to our tax liabilities as a result of these audits may also subject us to interest and penalties. There can be no certainty that our federal, state, local or foreign taxes could be passed on to our customers.
Furthermore, the Tax Cuts and Jobs Act (“TCJA”) that was enacted on December 22, 2017 made significant permanent and temporary amendments to the Internal Revenue Code of 1986, including a reduction in corporate income taxes, elimination of the corporate minimum tax, the immediate expensing of certain capital investments, allowing for an indefinite carryforward of tax net operating losses incurred in tax years beginning after December 31, 2017 and fundamentally changing the taxation of multinational entities. Additionally, the TCJA potentially limits the amount of interest expense currently deductible, provides for a transition tax for previously unrepatriated foreign earnings, provides for current taxation of certain foreign income, a minimum tax on low-taxed foreign earnings, and new measures to deter base erosion. Certain of the amendments included in the TCJA and the regulations promulgated thereunder may adversely affect our business, result of operations and financial condition.
Changes in accounting standards issued by the FASB could have a material effect on our balance sheet, revenue and result of operations, and could require a significant expenditure of time, attention and resources, especially by senior management.
Our accounting and financial reporting policies conform to GAAP, which are periodically revised and/or expanded. The application of accounting principles is also subject to varying interpretations over time. Accordingly, we are required to adopt new or revised accounting standards or comply with revised interpretations that are issued from time to time by various parties, including accounting standard setters and those who interpret the standards, such as the FASB and the SEC and our independent registered public accounting firm. Such new financial accounting standards may result in significant changes that could adversely affect our business, financial condition, cash flow and results of operations.
Refer to “Note 2 - Summary of Significant Accounting Policies” of our Notes to Consolidated Financial Statements for further discussion of new accounting standards, including the implementation status and potential impact to our consolidated financial statements.
42
Changes in our credit profile could adversely affect our business.
Changes in our credit profile could affect the way crude oil suppliers view our ability to make payments and induce them to shorten the payment terms for our purchases or require us to post security or letters of credit prior to payment. Due to the large dollar amounts and volume of our crude oil and other feedstock purchases, any imposition by our suppliers of more burdensome payment terms on us may have a material adverse effect on our liquidity and our ability to make payments to our suppliers. This, in turn, could cause us to be unable to operate one or more of our refineries at full capacity.
Changes in laws or standards affecting the transportation of North American crude oil by rail could significantly impact our operations, and as a result cause our costs to increase.
Investigations into past rail accidents involving the transport of crude oil have prompted government agencies and other interested parties to call for increased regulation of the transport of crude oil by rail including in the areas of crude oil constituents, rail car design, routing of trains and other matters. Regulation governing shipments of petroleum crude oil by rail requires shippers to properly test and classify petroleum crude oil and further requires shippers to treat Class 3 petroleum crude oil transported by rail in tank cars as a Packing Group I or II hazardous material only, which creates further classification and testing requirements, along with more severe penalties for violations. The DOT issued additional rules and regulations that require rail carriers to provide certain notifications to State agencies along routes utilized by trains over a certain length carrying crude oil, enhance safety training standards under the Rail Safety Improvement Act of 2008, require each railroad or contractor to develop and submit a training program to perform regular oversight and annual written reviews and establish enhanced tank car standards and operational controls for high-hazard flammable trains. These rules and any further changes in law, regulations or industry standards that require us to reduce the volatile or flammable constituents in crude oil that is transported by rail, alter the design or standards for rail cars we use, change the routing or scheduling of trains carrying crude oil, or any other changes that detrimentally affect the economics of delivering North American crude oil by rail to our, or subsequently to third-party, refineries, could increase our costs, which could have a material adverse effect on our financial condition, results of operations, cash flows and our ability to service our indebtedness.
We could incur substantial costs or disruptions in our business if we cannot obtain or maintain necessary permits and authorizations or otherwise comply with health, safety, environmental and other laws and regulations.
Our operations require numerous permits and authorizations under various laws and regulations. These authorizations and permits are subject to revocation, renewal or modification and can require operational changes to limit impacts or potential impacts on the environment and/or health and safety. A violation of authorization or permit conditions or other legal or regulatory requirements could result in substantial fines, criminal sanctions, permit revocations, injunctions, and/or facility shutdowns. In addition, major modifications of our operations could require modifications to our existing permits or upgrades to our existing pollution control equipment. Any or all of these matters could have a negative effect on our business, results of operations and cash flows.
We may incur significant liability under, or costs and capital expenditures to comply with, environmental and health and safety regulations, which are complex and change frequently.
Our operations are subject to federal, state and local laws regulating, among other things, the handling of petroleum and other regulated materials, the emission and discharge of materials into the environment, waste management, and remediation of discharges of petroleum and petroleum products, characteristics and composition of gasoline and distillates and other matters otherwise relating to the protection of the environment. Our operations are also subject to extensive laws and regulations relating to occupational health and safety.
We cannot predict what additional environmental, health and safety legislation or regulations may be adopted in the future, or how existing or future laws or regulations may be administered or interpreted with respect to our operations. Many of these laws and regulations are becoming increasingly stringent, and the cost of compliance with these requirements can be expected to increase over time.
43
Certain environmental laws impose strict, and in certain circumstances joint and several liability for, costs of investigation and cleanup of such spills, discharges or releases on owners and operators of, as well as persons who arrange for treatment or disposal of regulated materials at contaminated sites. Under these laws, we may incur liability or be required to pay penalties for past contamination, and third parties may assert claims against us for damages allegedly arising out of any past or future contamination. The potential penalties and clean-up costs for past or future releases or spills, the failure of prior owners of our facilities to complete their clean-up obligations, the liability to third parties for damage to their property, or the need to address newly-discovered information or conditions that may require a response could be significant, and the payment of these amounts could have a material adverse effect on our business, financial condition and results of operations.
Risks Related to Our Indebtedness
Our indebtedness could adversely affect our financial condition and prevent us from fulfilling our obligations under our indebtedness.
Our indebtedness may significantly affect our financial flexibility in the future. As of
December 31, 2018
, we have total debt of
$1,974.7 million
, excluding deferred debt issuance costs of
$41.0 million
and our PBF LLC Affiliate note payable with PBF Energy that eliminates in consolidation at the PBF Energy level, and we could incur an additional
$1,420.1 million
under our credit facilities. We may incur additional indebtedness in the future. Our strategy includes executing future refinery and logistics acquisitions. Any significant acquisition would likely require us to incur additional indebtedness in order to finance all or a portion of such acquisition. The level of our indebtedness has several important consequences for our future operations, including that:
|
•
|
a portion of our cash flow from operations will be dedicated to the payment of principal of, and interest on, our indebtedness and will not be available for other purposes;
|
|
•
|
under certain circumstances, covenants contained in our existing debt arrangements limit our ability to borrow additional funds, dispose of assets and make certain investments;
|
|
•
|
in certain circumstances these covenants also require us to meet or maintain certain financial tests, which may affect our flexibility in planning for, and reacting to, changes in our industry, such as being able to take advantage of acquisition opportunities when they arise;
|
|
•
|
our ability to obtain additional financing for working capital, capital expenditures, acquisitions, general corporate and other purposes may be limited; and
|
|
•
|
we may be at a competitive disadvantage to those of our competitors that are less leveraged; and we may be more vulnerable to adverse economic and industry conditions.
|
Our indebtedness increases the risk that we may default on our debt obligations, certain of which contain cross-default and/or cross-acceleration provisions. Our, and our subsidiaries’, ability to meet future principal obligations will be dependent upon our future performance, which in turn will be subject to general economic conditions, industry cycles and financial, business and other factors affecting our operations, many of which are beyond our control. Our business may not continue to generate sufficient cash flow from operations to repay our indebtedness. If we are unable to generate sufficient cash flow from operations, we may be required to sell assets, to refinance all or a portion of our indebtedness or to obtain additional financing. Refinancing may not be possible and additional financing may not be available on commercially acceptable terms, or at all.
Despite our level of indebtedness, we and our subsidiaries may be able to incur substantially more debt, which could exacerbate the risks described above.
We and our subsidiaries may be able to incur additional indebtedness in the future including additional secured or unsecured debt. Although our debt instruments and financing arrangements contain restrictions on the incurrence of additional indebtedness, these restrictions are subject to a number of qualifications and exceptions, and the indebtedness incurred in compliance with these restrictions could be substantial. To the extent new debt is added to our currently anticipated debt levels, the leverage risks described above would increase. Also, these restrictions do not prevent us from incurring obligations that do not constitute indebtedness.
44
Restrictive covenants in our debt instruments may limit our ability to undertake certain types of transactions.
Various covenants in our debt instruments and other financing arrangements may restrict our and our subsidiaries’ financial flexibility in a number of ways. Our indebtedness subjects us to financial and other restrictive covenants, including restrictions on our ability to incur additional indebtedness, place liens upon assets, pay dividends or make certain other restricted payments and investments, consummate certain asset sales or asset swaps, conduct businesses other than our current businesses, or sell, assign, transfer, lease, convey or otherwise dispose of all or substantially all of our assets. Some of these debt instruments also require our subsidiaries to satisfy or maintain certain financial tests in certain circumstances. Our subsidiaries’ ability to meet these financial tests can be affected by events beyond our control and they may not meet such tests.
Provisions in our indentures could discourage an acquisition of us by a third-party.
Certain provisions of our indentures could make it more difficult or more expensive for a third-party to acquire us. Upon the occurrence of certain transactions constituting a “change in control” as described in the indentures governing the Senior Notes and PBFX Senior Notes (both of which are defined below), holders of our notes could require us to repurchase all outstanding notes at 101% of the principal amount thereof, plus accrued and unpaid interest, if any, at the date of repurchase.
Our future credit ratings could adversely affect the cost of our borrowing as well as our ability to obtain credit in the future.
Our Senior Notes (as defined below) are rated BB by Standard & Poor’s Rating Services and B1 by Moody’s Investors Service. Any adverse effect on our credit rating may increase our cost of borrowing or hinder our ability to raise financing in the capital markets, which would impair our ability to grow our business and make cash distributions to our shareholders.
Risks Related to Our Organizational Structure and PBF Energy Class A Common Stock
PBF Energy is the managing member of PBF LLC and its only material asset is its interest in PBF LLC. Accordingly, PBF Energy depends upon distributions from PBF LLC and its subsidiaries to pay its taxes, meet its other obligations and/or pay dividends in the future.
PBF Energy is a holding company and all of its operations are conducted through subsidiaries of PBF LLC. PBF Energy has no independent means of generating revenue and no material assets other than its ownership interest in PBF LLC. We depend on the earnings and cash flow of our subsidiaries to meet our obligations, including our indebtedness, tax liabilities and obligations to make payments under a tax receivable agreement entered into with PBF LLC Series A and PBF LLC Series B unitholders (the “Tax Receivable Agreement”). If we do not receive such cash distributions, dividends or other payments from our subsidiaries, we may be unable to meet our obligations and/or pay dividends.
PBF Energy, as the sole managing partner of PBF LLC, may cause PBF LLC to make distributions to its members in an amount sufficient to enable PBF Energy to cover all applicable taxes at assumed tax rates, to make payments owed by PBF Energy under the Tax Receivable Agreement, and to pay other obligations and dividends, if any, declared by PBF Energy. To the extent we need funds and any of our subsidiaries is restricted from making such distributions under applicable law or regulation or under the terms of our financing or other contractual arrangements, or is otherwise unable to provide such funds, such restrictions could materially adversely affect our liquidity and financial condition.
The new PBF Holding asset-based revolving credit agreement (the “Revolving Credit Facility”), the PBF Holding 7.00% senior notes due 2023 (the “2023 Senior Notes”), the PBF Holding 7.25% senior notes due 2025 (the “2025 Senior Notes”, and together with the 2023 Senior Notes, the “Senior Notes”), and certain of our other outstanding debt arrangements include a restricted payment covenant, which restricts the ability of PBF Holding to make distributions to us, and we anticipate our future debt will contain a similar restriction. PBFX’s five-year,
$500.0
million amended and restated revolving credit facility (the “PBFX Revolving Credit Facility”) and PBFX’s
45
indenture governing its PBFX 2023 Senior Notes (as defined in Item 7. Management’s Discussion and Analysis) also contain covenants that limit or restrict PBFX’s ability and the ability of its restricted subsidiaries to make distributions and other restricted payments and restrict PBFX’s ability to incur liens and enter into burdensome agreements. In addition, there may be restrictions on payments by our subsidiaries under applicable laws, including laws that require companies to maintain minimum amounts of capital and to make payments to stockholders only from profits. For example, PBF Holding is generally prohibited under Delaware law from making a distribution to a member to the extent that, at the time of the distribution, after giving effect to the distribution, liabilities of the limited liability company (with certain exceptions) exceed the fair value of its assets, and PBFX is subject to a similar prohibition. As a result, we may be unable to obtain that cash to satisfy our obligations and make payments to PBF Energy stockholders, if any.
The rights of other members of PBF LLC may conflict with the interests of PBF Energy Class A common stockholders.
The interests of the other members of PBF LLC, which include current and former directors and officers, may not in all cases be aligned with PBF Energy Class A common stockholders’ interests. For example, these members may have different tax positions which could influence their positions, including regarding whether and when we dispose of assets and whether and when we incur new or refinance existing indebtedness, especially in light of the existence of the Tax Receivable Agreement. In addition, the structuring of future transactions may take into consideration these tax or other considerations even where no similar benefit would accrue to PBF Energy Class A common stockholders or us. See “Certain Relationships and Related Transactions—IPO Related Agreements” in our
2019
Proxy Statement.
Under the Tax Receivable Agreement, PBF Energy is required to pay the former and current holders of PBF LLC Series A Units and PBF LLC Series B Units for certain realized or assumed tax benefits PBF Energy may claim arising in connection with prior offerings and future exchanges of PBF LLC Series A Units for shares of its Class A Common Stock and related transactions. The indentures governing the Senior Notes allow PBF LLC, under certain circumstances, to make distributions sufficient for PBF Energy to pay its obligation under the Tax Receivable Agreement, and such amounts are expected to be substantial.
PBF Energy is party to a Tax Receivable Agreement that provides for the payment from time to time by PBF Energy to the current and former holders of PBF LLC Series A Units and PBF LLC Series B Units of 85% of the benefits, if any, that PBF Energy is deemed to realize as a result of (i) the increases in tax basis resulting from its acquisitions of PBF LLC Series A Units, including such acquisitions in connection with its prior offerings or in the future and (ii) certain other tax benefits related to its entering into the Tax Receivable Agreement, including tax benefits attributable to payments under the Tax Receivable Agreement. See “Item 13. Certain Relationships and Related Transactions, and Director Independence.”
We expect that the payments that PBF Energy may make under the Tax Receivable Agreement will be substantial. As of
December 31, 2018
, PBF Energy has recognized a liability for the Tax Receivable Agreement of
$373.5 million
reflecting PBF Energy’s estimate of the undiscounted amounts that it expects to pay under the agreement due to exchanges that occurred prior to that date, and to range over the next five years from approximately
$15.0 million
to
$65.0 million
per year and decline thereafter. Future payments by PBF Energy in respect of subsequent exchanges of PBF LLC Series A Units would be in addition to these amounts and are expected to be material as well. If PBF Energy does not have taxable income, PBF Energy generally is not required (absent a change of control or circumstances requiring an early termination payment) to make payments under the Tax Receivable Agreement for that taxable year because no benefit will have been actually realized. However, any tax benefits that do not result in realized benefits in a given tax year will likely generate tax attributes that may be utilized to generate benefits in previous or future tax years. The utilization of such tax attributes will result in payments under the Tax Receivable Agreement. The foregoing numbers are merely estimates based on assumptions that are subject to change due to various factors, including, among other factors, the timing of exchanges of PBF LLC Series A Units for shares of PBF Energy Class A common stock as contemplated by the Tax Receivable Agreement, the price of PBF Energy Class A common stock at the time of such exchanges, the extent to which such exchanges are taxable, and the amount and timing of PBF Energy’s income. The actual payments under the
46
Tax Receivable Agreement could differ materially. It is possible that future transactions or events could increase or decrease the actual tax benefits realized and the corresponding Tax Receivable Agreement payments. There may be a material negative effect on our liquidity if, as a result of timing discrepancies or otherwise, (i) the payments under the Tax Receivable Agreement exceed the actual benefits PBF Energy realizes in respect of the tax attributes subject to the Tax Receivable Agreement, and/or (ii) distributions to PBF Energy by PBF LLC are not sufficient to permit PBF Energy, after it has paid its taxes and other obligations, to make payments under the Tax Receivable Agreement. The payments under the Tax Receivable Agreement are not conditioned upon any recipient’s continued ownership of us.
In certain cases, payments by PBF Energy under the Tax Receivable Agreement may be accelerated and/or significantly exceed the actual benefits it realizes in respect of the tax attributes subject to the Tax Receivable Agreement. These provisions may deter a change in control of the Company.
The Tax Receivable Agreement provides that upon certain changes of control, or if, at any time, PBF Energy elects an early termination of the Tax Receivable Agreement, PBF Energy’s (or its successor’s) obligations with respect to exchanged or acquired PBF LLC Series A Units (whether exchanged or acquired before or after such transaction) would be based on certain assumptions, including (i) that PBF Energy would have sufficient taxable income to fully utilize the deductions arising from the increased tax deductions and tax basis and other benefits related to entering into the Tax Receivable Agreement and (ii) that the subsidiaries of PBF LLC will sell certain nonamortizable assets (and realize certain related tax benefits) no later than a specified date. Moreover, in each of these instances, PBF Energy would be required to make an immediate payment equal to the present value (at a discount rate equal to LIBOR plus 100 basis points) of the anticipated future tax benefits (based on the foregoing assumptions). Accordingly, payments under the Tax Receivable Agreement may be made years in advance of the actual realization, if any, of the anticipated future tax benefits and may be significantly greater than the actual benefits PBF Energy realizes in respect of the tax attributes subject to the Tax Receivable Agreement. Assuming that the market value of a share of PBF Energy Class A common stock equals
$32.67
per share (the closing price on
December 31, 2018
) and that LIBOR were to be
1.85%
, we estimate that, as of
December 31, 2018
the aggregate amount of these accelerated payments would have been approximately
$327.7
million if triggered immediately on such date. In these situations, PBF Energy’s obligations under the Tax Receivable Agreement could have a substantial negative impact on our liquidity. PBF Energy may not be able to finance its obligations under the Tax Receivable Agreement and its existing indebtedness may limit its subsidiaries’ ability to make distributions to PBF Energy to pay these obligations. These provisions may deter a potential sale of our Company to a third-party and may otherwise make it less likely that a third-party would enter into a change of control transaction with us.
Moreover, payments under the Tax Receivable Agreement will be based on the tax reporting positions that PBF Energy determines in accordance with the Tax Receivable Agreement. PBF Energy will not be reimbursed for any payments previously made under the Tax Receivable Agreement if the Internal Revenue Service subsequently disallows part or all of the tax benefits that gave rise to such prior payments. As a result, in certain circumstances, payments could be made under the Tax Receivable Agreement that are significantly in excess of the benefits that PBF Energy actually realized in respect of (i) the increases in tax basis resulting from our purchases or exchanges of PBF LLC Series A Units and (ii) certain other tax benefits related to PBF Energy entering into the Tax Receivable Agreement, including tax benefits attributable to payments under the Tax Receivable Agreement.
PBF Energy cannot assure you that it will continue to declare dividends or have the available cash to make dividend payments.
Although PBF Energy currently intends to continue to pay quarterly cash dividends on its Class A common stock, the declaration, amount and payment of any dividends will be at the sole discretion of our board of directors. PBF Energy is not obligated under any applicable laws, its governing documents or any contractual agreements with its existing and prior owners or otherwise to declare or pay any dividends or other distributions (other than the obligations of PBF LLC to make tax distributions to its members). Our board of directors may take into account, among other things, general economic conditions, our financial condition and operating results, our available cash and current and anticipated cash needs, capital requirements, plans for expansion, including acquisitions, tax, legal, regulatory and contractual restrictions and implications, including under our subsidiaries’ outstanding debt
47
documents, and such other factors as our board of directors may deem relevant in determining whether to declare or pay any dividend. Because PBF Energy is a holding company with no material assets (other than the equity interests of its direct subsidiary), its cash flow and ability to pay dividends is dependent upon the financial results and cash flows of its indirect subsidiaries PBF Holding and PBFX and their respective operating subsidiaries and the distribution or other payment of cash to it in the form of dividends or otherwise. The direct and indirect subsidiaries of PBF Energy are separate and distinct legal entities and have no obligation to make any funds available to it other than in the case of certain intercompany transactions. As a result, if PBF Energy does not declare or pay dividends you may not receive any return on an investment in PBF Energy Class A common stock unless you sell PBF Energy Class A common stock for a price greater than that which you paid for it.
Anti-takeover and certain other provisions in our certificate of incorporation and bylaws and Delaware law may discourage or delay a change in control.
Our certificate of incorporation and bylaws contain provisions which could make it more difficult for stockholders to effect certain corporate actions. Among other things, these provisions:
|
•
|
authorize the issuance of undesignated preferred stock, the terms of which may be established and the shares of which may be issued without stockholder approval;
|
|
•
|
prohibit stockholder action by written consent;
|
|
•
|
restrict certain business combinations with stockholders who obtain beneficial ownership of a certain percentage of our outstanding common stock;
|
|
•
|
provide that special meetings of stockholders may be called only by the chairman of the board of directors, the chief executive officer or the board of directors, and establish advance notice procedures for the nomination of candidates for election as directors or for proposing matters that can be acted upon at stockholder meetings; and
|
|
•
|
provide that our stockholders may only amend our bylaws with the approval of 75% or more of all of the outstanding shares of our capital stock entitled to vote.
|
These anti-takeover provisions and other provisions of Delaware law may have the effect of delaying or deterring a change of control of our company. Certain provisions could also discourage proxy contests and make it more difficult for you and other stockholders to elect directors of your choosing and to cause us to take other corporate actions you desire. These provisions could limit the price that certain investors might be willing to pay in the future for shares of PBF Energy Class A common stock.
The market price of PBF Energy Class A common stock may be volatile, which could cause the value of your investment to decline.
The market price of PBF Energy Class A common stock may be highly volatile and could be subject to wide fluctuations due to a number of factors including:
|
•
|
variations in actual or anticipated operating results or dividends, if any, to stockholders;
|
|
•
|
changes in, or failure to meet, earnings estimates of securities analysts;
|
|
•
|
market conditions in the oil refining industry and volatility in commodity prices;
|
|
•
|
the impact of disruptions to crude or feedstock supply to any of our refineries, including disruptions due to problems with third-party logistics infrastructure;
|
|
•
|
litigation and government investigations;
|
|
•
|
the timing and announcement of any potential acquisitions and subsequent impact of any future acquisitions on our capital structure, financial condition or results of operations;
|
|
•
|
changes or proposed changes in laws or regulations or differing interpretations or enforcement thereof;
|
|
•
|
general economic and stock market conditions; and
|
|
•
|
the availability for sale, or sales by PBF Energy or its senior management, of a significant number of shares of its Class A common stock in the public market.
|
48
In addition, the stock markets generally may experience significant volatility, often unrelated to the operating performance of the individual companies whose securities are publicly-traded. These and other factors may cause the market price of PBF Energy Class A common stock to decrease significantly, which in turn would adversely affect the value of your investment.
In the past, following periods of volatility in the market price of a company’s securities, stockholders have often instituted class action securities litigation against those companies. Such litigation, if instituted, could result in substantial costs and a diversion of management’s attention and resources, which could significantly harm our profitability and reputation.
Risks Related to Our Ownership of PBFX
We depend upon PBFX for a substantial portion of our refineries’ logistics needs and have obligations for minimum volume commitments in our commercial agreements with PBFX.
We depend on PBFX to receive, handle, store and transfer crude oil, petroleum products and natural gas for us from our operations and sources located throughout the United States and Canada in support of certain of our refineries under long-term, fee-based commercial agreements with our subsidiaries. These commercial agreements have an initial term ranging from one to fifteen years and generally include minimum quarterly commitments and inflation escalators. If we fail to meet the minimum commitments during any calendar quarter, we will be required to make a shortfall payment quarterly to PBFX equal to the volume of the shortfall multiplied by the applicable fee.
PBFX’s operations are subject to all of the risks and operational hazards inherent in receiving, handling, storing and transferring crude oil, petroleum products and natural gas, including: damages to its facilities, related equipment and surrounding properties caused by floods, fires, severe weather, explosions and other natural disasters and acts of terrorism; mechanical or structural failures at PBFX’s facilities or at third-party facilities on which its operations are dependent; curtailments of operations relative to severe seasonal weather; inadvertent damage to our facilities from construction, farm and utility equipment; and other hazards. Any of these events or factors could result in severe damage or destruction to PBFX’s assets or the temporary or permanent shut-down of PBFX’s facilities. If PBFX is unable to serve our logistics needs, our ability to operate our refineries and receive crude oil and distribute products could be adversely impacted, which could adversely affect our business, financial condition and results of operations.
In addition, as of
December 31, 2018
, PBF LLC owns
19,953,631
common units representing
44.0%
limited partner interest in PBFX. The inability of PBFX to continue operations, perform under its commercial arrangements with our subsidiaries or the occurrence of any of these risks or operational hazards, could also adversely impact the value of our investment in PBFX and, because PBFX is a consolidated entity, our business, financial condition and results of operations.
PBF Energy will be required to pay taxes on its share of taxable income from PBF LLC and its other subsidiary flow-through entities (including PBFX), regardless of the amount of cash distributions PBF Energy receives from PBF LLC.
The holders of limited liability company interests in PBF LLC, including PBF Energy, generally have to include for purposes of calculating their U.S. federal, state and local income taxes their share of any taxable income of PBF LLC, regardless of whether such holders receive cash distributions from PBF LLC. PBF Energy ultimately may not receive cash distributions from PBF LLC equal to its share of the taxable income of PBF LLC or even equal to the actual tax due with respect to that income. For example, PBF LLC is required to include in taxable income PBF LLC’s allocable share of PBFX’s taxable income and gains (such share to be determined pursuant to the partnership agreement of PBFX), regardless of the amount of cash distributions received by PBF LLC from PBFX, and such taxable income and gains will flow-through to PBF Energy to the extent of its allocable share of the taxable income of PBF LLC. As a result, at certain times, the amount of cash otherwise ultimately available
49
to PBF Energy on account of its indirect interest in PBFX may not be sufficient for PBF Energy to pay the amount of taxes it will owe on account of its indirect interests in PBFX.
If PBFX was to be treated as a corporation, rather than as a partnership, for U.S. federal income tax purposes or if PBFX was otherwise subject to entity-level taxation, PBFX’s cash available for distribution to its unitholders, including to us, would be reduced, likely causing a substantial reduction in the value of units, including the units held by us.
The present U.S. federal income tax treatment of publicly-traded partnerships, including PBFX, or an investment in its common units may be modified by administrative, legislative or judicial interpretation at any time. For example, from time to time the U.S. Congress considers substantive changes to the existing federal income tax laws that would affect publicly-traded partnerships. Any modification to the U.S. federal income tax laws and interpretations thereof may or may not be applied retroactively and could make it more difficult or impossible for PBFX to meet the exception to be treated as a partnership for U.S. federal income tax purposes. We are unable to predict whether any of these changes, or other proposals, will ultimately be enacted. Any such changes could negatively impact the value of an investment in PBFX common units.
If PBFX were treated as a corporation for U.S. federal income tax purposes, it would pay U.S. federal income tax on income at the corporate tax rate, which is currently a maximum of 21% under the TCJA, and would likely be liable for state income tax at varying rates. Distributions to PBFX unitholders would generally be taxed again as corporate distributions, and no income, gains, losses, deductions or credits would flow through to PBFX unitholders. Because taxes would be imposed upon PBFX as a corporation, the cash available for distribution to PBFX unitholders would be substantially reduced. Therefore, PBFX’s treatment as a corporation would result in a material reduction in the anticipated cash flow and after-tax return to PBFX unitholders, likely causing a substantial reduction in the value of the units.
All of the executive officers and a majority of the directors of PBF GP are also current or former officers or directors of PBF Energy. Conflicts of interest could arise as a result of this arrangement.
PBF Energy indirectly owns and controls PBF GP, and appoints all of its officers and directors. All of the executive officers and a majority of the directors of PBF GP are also current or former officers or directors of PBF Energy. These individuals will devote significant time to the business of PBFX. Although the directors and officers of PBF GP have a fiduciary duty to manage PBF GP in a manner that is beneficial to PBF Energy, as directors and officers of PBF GP they also have certain duties to PBFX and its unitholders. Conflicts of interest may arise between PBF Energy and its affiliates, including PBF GP, on the one hand, and PBFX and its unitholders, on the other hand. In resolving these conflicts of interest, PBF GP may favor its own interests and the interests of PBFX over the interests of PBF Energy. In certain circumstances, PBF GP may refer any conflicts of interest or potential conflicts of interest between PBFX, on the one hand, and PBF Energy, on the other hand, to its conflicts committee (which must consist entirely of independent directors) for resolution, which conflicts committee must act in the best interests of the public unitholders of PBFX. As a result, PBF GP may manage the business of PBFX in a way that may differ from the best interests of PBF Energy or its stockholders.
ITEM 1B. UNRESOLVED STAFF COMMENTS
None.
ITEM 2. PROPERTIES
See “Item 1. Business”.
50
ITEM 3. LEGAL PROCEEDINGS
On July 24, 2013, DNREC issued a Notice of Administrative Penalty Assessment and Secretary’s Order to Delaware City Refining for alleged air emission violations that occurred during the re-start of the refinery in 2011 and subsequent to the re-start. The penalty assessment seeks
$460,200
in penalties and
$69,030
in cost recovery for DNREC’s expenses associated with investigation of the incidents. We dispute the amount of the penalty assessment and allegations made in the order, and are in discussions with DNREC to resolve the assessment. It is possible that DNREC will assess a penalty in this matter but any such amount is not expected to be material to us.
At the time we acquired the Chalmette refinery it was subject to the Order issued by LDEQ covering deviations from 2009 and 2010. Chalmette Refining and LDEQ subsequently entered into a dispute resolution agreement to negotiate the resolution of deviations on or before December 31, 2014. On May 18, 2018 the Order was settled by LDEQ and the Chalmette refinery for an administrative penalty of
$741,000
, of which
$100,000
has been paid in cash and the remainder has been spent on beneficial environmental projects.
On April 7, 2015, DNREC issued a NOV (W-15-SWD-01) alleging violations of the Delaware City refinery’s NPDES discharge permit during the period between December 12, 2014 through January 4, 2015. On March 5, 2018, a settlement agreement was finalized resolving the alleged violations contained in the April 7, 2015 Notice of Violation, as well as additional alleged violations occurring during the period between January 2014 through January 2018. Pursuant to this settlement agreement, the Delaware City refinery was either going to pay a penalty of
$30,000
and fund an approved Environmental Improvement Project (“EIP”) in the amount of
$88,000
, or pay a penalty in the amount of
$118,000
. A cost recovery payment of
$7,433
will be assessed in either case. The Delaware City refinery has elected to pay the
$30,000
penalty and fund the EIP in the amount of
$88,000
. The Delaware City refinery has paid the penalty and the cost recovery payment and will fund the approved EIP as soon as the project scope is finalized.
The Delaware City refinery appealed a Notice of Penalty Assessment and Secretary’s Order issued in March 2017, including a
$150,000
fine, alleging violation of a 2013 Secretary’s Order authorizing crude oil shipment by barge. DNREC determined that the Delaware City refinery had violated the order by failing to make timely and full disclosure to DNREC about the nature and extent of those shipments, and had misrepresented the number of shipments that went to other facilities. The Penalty Assessment and Secretary’s Order conclude that the 2013 Secretary’s Order was violated by the refinery by shipping crude oil from the Delaware City terminal to three locations other than the Paulsboro refinery, on 15 days in 2014, making a total of 17 separate barge shipments containing approximately 35.7 million gallons of crude oil in total. On April 28, 2017, the Delaware City refinery appealed the Notice of Penalty Assessment and Secretary’s Order. On March 5, 2018, Notice of Penalty Assessment was settled by DNREC, the Delaware Attorney General and Delaware City refinery for
$100,000
. The Delaware City refinery made no admissions with respect to the alleged violations and agreed to request a Coastal Zone Act status decision prior to making crude oil shipments to destinations other than Paulsboro. The Delaware City refinery has paid the penalty. The Coastal Zone Act status decision request was submitted to DNREC and the outstanding appeal was withdrawn as required under the settlement agreement.
51
On December 28, 2016, DNREC issued the Ethanol Permit to DCR allowing the utilization of existing tanks and existing marine loading equipment at their existing facilities to enable denatured ethanol to be loaded from storage tanks to marine vessels and shipped to offsite facilities. On January 13, 2017, the issuance of the Ethanol Permit was appealed by two environmental groups. On February 27, 2017, the Coastal Zone Board held a public hearing and dismissed the appeal, determining that the appellants did not have standing. The appellants filed an appeal of the Coastal Zone Board’s decision with the Superior Court on March 30, 2017. On January 19, 2018, the Superior Court rendered an Opinion regarding the decision of the Coastal Zone Board to dismiss the appeal of the Ethanol Permit for the ethanol project. The judge determined that the record created by the Coastal Zone Board was insufficient for the Superior Court to make a decision, and therefore remanded the case back to the Coastal Zone Board to address the deficiency in the record. Specifically, the Superior Court directed the Coastal Zone Board to address any evidence concerning whether the appellants’ claimed injuries would be affected by the increased quantity of ethanol shipments. On remand, the Coastal Zone Board met on January 28, 2019 and reversed its previous decision on standing, ruling that the appellants have standing to appeal the issuance of the Ethanol Permit. DCR is currently evaluating its appeal options.
At the time we acquired the Toledo refinery, EPA had initiated an investigation into the compliance of the refinery with EPA standards governing flaring pursuant to Section 114 of the Clean Air Act. On February 1, 2013, EPA issued an Amended NOV, and on September 20, 2013, EPA issued a NOV and Finding of Violation to Toledo refinery, alleging certain violations of the Clean Air Act at its Plant 4 and Plant 9 flares since the acquisition of the refinery on March 1, 2011. Toledo refinery and EPA subsequently entered into tolling agreements pending settlement discussions. Although the resolution has not been finalized, the civil administrative penalty is anticipated to be approximately
$645,000
including supplemental environmental projects. To the extent the administrative penalty exceeds such amount, it is not expected to be material to us.
In connection with the acquisition of the Torrance refinery and related logistics assets, we assumed certain pre-existing environmental liabilities related to certain environmental remediation obligations to address existing soil and groundwater contamination and monitoring activities, which reflect the estimated cost of the remediation obligations. In addition, in connection with the acquisition of the Torrance refinery and related logistics assets, we purchased a ten year, $100.0 million environmental insurance policy to insure against unknown environmental liabilities. Furthermore, in connection with the acquisition, we assumed responsibility for certain specified environmental matters that occurred prior to our ownership of the refinery and logistics assets, including specified incidents and/or NOVs issued by regulatory agencies in various years before our ownership, including the SCAQMD and Cal/OSHA. In connection with the acquisition of the Torrance refinery and related logistics assets, we agreed to take responsibility for NOV No. P63405 that ExxonMobil had received from the SCAQMD for Title V deviations that are alleged to have occurred in 2015. On August 14, 2018, we received a letter from SCAQMD offering to settle this NOV for
$515,250
. We are currently in communication with SCAQMD to resolve this NOV.
Subsequent to the acquisition, further NOVs were issued by the SCAQMD, Cal/OSHA, the City of Torrance, the City of Torrance Fire Department, and the Los Angeles County Sanitation District related to alleged operational violations, emission discharges and/or flaring incidents at the refinery and the logistics assets both before and after our acquisition. EPA in November 2016 conducted a RMP inspection following the acquisition related to Torrance operations and issued preliminary findings in March 2017 concerning RMP potential operational violations. The Company is currently in communication with EPA to resolve the RMP preliminary findings. EPA and DTSC in December 2016 conducted a RCRA inspection following the acquisition related to Torrance operations and also issued in March 2017 preliminary findings concerning RCRA potential operational violations. In April 2017, EPA referred the RCRA preliminary findings to DTSC for final resolution. On March 1, 2018, we received a notice of intent to sue from Environmental Integrity Project, on behalf of Environment California, under RCRA with respect to the alleged RCRA violations from December 2016 EPA’s and DTSC’s inspection. On March 2, 2018, DTSC issued an order to correct alleged RCRA violations relating to the accumulation of oil bearing materials in roll off bins during 2016 and 2017. On June 14, 2018, the Torrance refinery and DTSC reached settlement regarding the oil bearing materials in the form of a stipulation and order, wherein the Torrance refinery agreed that it would recycle or properly dispose of the oil bearing materials by the end of 2018 and pay an administrative penalty of
$150,000
. The Torrance refinery has complied with these requirements. Following this settlement, in June 2018,
52
DTSC referred the remaining alleged RCRA violations from EPA’s and DTSC’s December 2016 inspection to the California Attorney General for final resolution. The Torrance refinery and the California Attorney General are in discussions to resolve these alleged remaining RCRA violations. Other than the
$150,000
DTSC administrative penalty, no other settlement or penalty demands have been received to date with respect to any of the other NOVs, preliminary findings, or order that are in excess of
$100,000
. As the ultimate outcomes are uncertain, we cannot currently estimate the final amount or timing of their resolution but any such amount is not expected to have a material impact on our financial position, results of operations or cash flows, individually or in the aggregate.
On September 2, 2011, prior to our ownership of the Chalmette refinery, the plaintiff in
Vincent Caruso, et al. v. Chalmette Refining, L.L.C.
, filed an action on behalf of himself and potentially several thousand other Louisiana residents who live or own property in St. Bernard Parish and Orleans Parish and whose property was allegedly contaminated and who allegedly suffered any property damages and clean-up costs as a result of an emission of spent catalyst from the Chalmette refinery on September 6, 2010. Plaintiffs claim to have suffered injuries, symptoms, and property damage as a result of the release, although the trial court has limited recovery to property damages and clean-up expenses. Plaintiffs seek to recover unspecified damages, interest and costs. In 2016, there was a mini-trial for four plaintiffs for property damage relating to home and vehicle cleaning and the trial court rendered judgment awarding damages related to the cost for home cleaning and vehicle cleaning to the four plaintiffs. The trial court found Chalmette Refining and co-defendant Eaton Corporation (“Eaton”), to be solidarily liable for the damages. Chalmette Refining and Eaton filed an appeal in August 2016 of the judgment on the mini-trial and on June 28, 2017, the appellate court unanimously reversed the judgment awarding damages to the plaintiffs, and plaintiffs request for rehearing was later denied. The parties reached a comprehensive settlement of this matter on December 3, 2018, which received final court approval on January 17, 2019. We presently believe this matter will not have a material impact on our financial position, results of operations or cash flows.
On December 5, 1990, prior to our ownership of the Chalmette refinery, the plaintiff in
Adam Thomas, et al. v. Exxon Mobil Corporation and Chalmette Refining, L.L.C.,
filed an action on behalf of himself and potentially thousands of other individuals in St. Bernard Parish and Orleans Parish who were allegedly exposed to hydrogen sulfide and sulfur dioxide as a result of more than 100 separate flaring events that occurred between 1989 and 2007. This litigation is proceeding as a mass action with individually named plaintiffs as a result of a 2008 trial court decision, affirmed by the court of appeals, that denied class certification. The plaintiffs claim to have suffered physical injuries, property damage, and other damages as a result of the releases. Plaintiffs seek to recover unspecified compensatory and punitive damages, interest, and costs. Although no trial date has been set by the state trial court, the parties are preparing for a mini-trial of up to 10 plaintiffs, relating to 5 separate flaring events that occurred between 2002 and 2007. Because of the number of potential claimants is unknown and the differing events underlying the claims, the potential amount of the claims is not determinable. It is possible that an adverse outcome may have a material adverse effect on our financial position, results of operations, or cash flows.
On February 17, 2017, in
Arnold Goldstein, et al. v. Exxon Mobil Corporation, et al.
, we and PBF Energy Company LLC, and our subsidiaries, PBF Energy Western Region LLC and Torrance Refining Company LLC and the manager of our Torrance refinery along with Exxon Mobil Corporation were named as defendants in a class action and representative action complaint filed on behalf of Arnold Goldstein, John Covas, Gisela Janette La Bella and others similarly situated. The complaint was filed in the Superior Court of the State of California, County of Los Angeles and alleges negligence, strict liability, ultrahazardous activity, a continuing private nuisance, a permanent private nuisance, a continuing public nuisance, a permanent public nuisance and trespass resulting from the February 18, 2015 electrostatic precipitator (“ESP”) explosion at the Torrance refinery which was then owned and operated by ExxonMobil. The operation of the Torrance refinery by the PBF entities subsequent to our acquisition in July 2016 is also referenced in the complaint. To the extent that plaintiffs’ claims relate to the ESP explosion, Exxon has retained responsibility for any liabilities that would arise from the lawsuit pursuant to the agreement relating to the acquisition of the Torrance refinery. On July 2, 2018, the Court granted leave to plaintiffs’ to file a Second Amended Complaint alleging groundwater contamination. With the filing of the Second Amended Complaint, Plaintiffs’ added an additional plaintiff. As this matter is in the class certification phase, we cannot currently estimate the amount or the timing of its resolution. We presently believe the outcome will not have a material impact on our financial position, results of operations or cash flows.
53
On September 18, 2018, in
Michelle Kendig and Jim Kendig, et al. v. ExxonMobil Oil Corporation, et al
., PBF Energy Limited and Torrance Refining Company LLC along with ExxonMobil Oil Corporation and ExxonMobil Pipeline Company were named as defendants in a class action and representative action complaint filed on behalf of Michelle Kendig, Jim Kendig and others similarly situated. The complaint was filed in the Superior Court of the State of California, County of Los Angeles and alleges failure to authorize and permit uninterrupted rest and meal periods, failure to furnish accurate wage statements, violation of the Private Attorneys General Act and violation of the California Unfair Business and Competition Law. Plaintiffs seek to recover unspecified economic damages, statutory damages, civil penalties provided by statute, disgorgement of profits, injunctive relief, declaratory relief, interest, attorney’s fees and costs. To the extent that plaintiffs’ claims accrued prior to July 1, 2016, ExxonMobil has retained responsibility for any liabilities that would arise from the lawsuit pursuant to the agreement relating to the acquisition of the Torrance refinery and logistics assets. On October 26, 2018, the matter was removed to the Federal Court, California Central District. As this matter is in the class certification phase, we cannot currently estimate the amount or the timing of its resolution. We presently believe the outcome will not have a material impact on our financial position, results of operations or cash flows.
On September 7, 2018, in
Jeprece Roussell, et al
.
v. PBF Consultants, LLC, et
al.
, the Plaintiff filed an action in the 19th Judicial District Court for the Parish of East Baton Rouge, alleges numerous causes of action, including wrongful death, premises liability, negligence, and gross negligence against PBF Holding Company LLC, PBFX Operating Company LLC, Chalmette Refining, L.L.C., two individual employees of the Chalmette Refinery (“the PBF Defendants”), two entities, PBF Consultants, LLC and PBF Investments, LLC that are Louisiana companies that are not associated with our companies, as well as Clean Harbors, Inc. and Clean Harbors Environmental Services, Inc. (collectively, “Clean Harbors”), Mr. Roussell’s employer. Mr. Roussell was fatally injured on March 31, 2018 while performing clay removal work activities inside a clay treating vessel located at the Chalmette Refinery. Plaintiff seeks unspecified compensatory damages for pain and suffering, past and future mental anguish, impairment, past and future economic loss, attorney’s fees and court costs. The PBF Defendants have issued a tender of defense and indemnity to Clean Harbors and its insurer pursuant to indemnity obligations contained in the associated services agreement. On September 25, 2018, the PBF Defendants filed an Answer in the state court action denying the allegations. On October 10, 2018, the PBF Defendants filed to remove the case to the United States District Court for the Middle District of Louisiana. On November 9, 2018, Plaintiff filed a motion to remand the matter back to state court and the PBF Defendants filed a response on November 30, 2018. On December 21, 2018, Plaintiff filed a motion for leave to file a reply memorandum and the reply memorandum was filed December 27, 2018. As this matter was recently filed, we cannot currently estimate the amount or the timing of its resolution. We presently believe the outcome will not have a material impact on our financial position, results of operations or cash flows.
We are subject to obligations to purchase RINs. On February 15, 2017, we received notification that EPA records indicated that PBF Holding used potentially invalid RINs that were in fact verified under EPA’s RIN Quality Assurance Program (“QAP”) by an independent auditor as QAP A RINs. Under the regulations use of potentially invalid QAP A RINs provided the user with an affirmative defense from civil penalties provided certain conditions are met. We have asserted the affirmative defense and if accepted by EPA will not be required to replace these RINs and will not be subject to civil penalties under the program. It is reasonably possible that EPA will not accept our defense and may assess penalties in these matters but any such amount is not expected to have a material impact on our financial position, results of operations or cash flows.
54
CERCLA, also known as “Superfund,” imposes liability, without regard to fault or the legality of the original conduct, on certain classes of persons who are considered to be responsible for the release of a “hazardous substance” into the environment. These persons include the current or former owner or operator of the disposal site or sites where the release occurred and companies that disposed of or arranged for the disposal of the hazardous substances. Under CERCLA, such persons may be subject to joint and several liability for investigation and the costs of cleaning up the hazardous substances that have been released into the environment, for damages to natural resources and for the costs of certain health studies. As discussed more fully above, certain of our sites are subject to these laws and we may be held liable for investigation and remediation costs or claims for natural resource damages. It is not uncommon for neighboring landowners and other third parties to file claims for personal injury and property damage allegedly caused by hazardous substances or other pollutants released into the environment. Analogous state laws impose similar responsibilities and liabilities on responsible parties. In our current normal operations, we have generated waste, some of which falls within the statutory definition of a “hazardous substance” and some of which may have been disposed of at sites that may require cleanup under Superfund.
ITEM 4. MINE SAFETY DISCLOSURE
None.
55
PART II
ITEM 5. MARKET FOR REGISTRANT’S COMMON EQUITY, RELATED STOCKHOLDER MATTERS, AND ISSUER PURCHASES OF EQUITY SECURITIES
Market Information
PBF Energy Class A common stock trades on the New York Stock Exchange under the symbol “PBF.” PBF Energy Class B common stock is not publicly-traded.
As of
February 19, 2019
there were 173 holders of record of PBF Energy Class A common stock and
20
holders of record of PBF Energy Class B common stock.
Dividend and Distribution Policy
Subject to the following paragraphs, PBF Energy currently intends to continue to pay quarterly cash dividends of approximately $0.30 per share on its Class A common stock. The declaration, amount and payment of this and any other future dividends on shares of Class A common stock will be at the sole discretion of PBF Energy’s board of directors.
PBF Energy is a holding company and has no material assets other than its ownership interests of PBF LLC. In order for PBF Energy to pay any dividends, it needs to cause PBF LLC to make distributions to it and the holders of PBF LLC Series A Units, and PBF LLC needs to cause PBF Holding and/or PBFX to make distributions to it, in at least an amount sufficient to cover cash dividends, if any, declared by PBF Energy. Each of PBF Holding and PBFX is generally prohibited under Delaware law from making a distribution to a member to the extent that, at the time of the distribution, after giving effect to the distribution, liabilities of the limited liability company (with certain exceptions) exceed the fair value of its assets. As a result, PBF LLC may be unable to obtain cash from PBF Holding and/or PBFX to satisfy its obligations and make distributions to PBF Energy for dividends, if any, to PBF Energy’s stockholders. If PBF LLC makes such distributions to PBF Energy, the holders of PBF LLC Series A Units will also be entitled to receive pro rata distributions.
The ability of PBF Holding to pay dividends and make distributions to PBF LLC is, and in the future may be, limited by covenants in its Revolving Credit Facility, the Senior Notes (each as defined in “Item 7. Management’s Discussion and Analysis of Financial Condition and Results of Operations”) and other debt instruments. Subject to certain exceptions, the Revolving Credit Facility and the indentures governing the Senior Notes prohibit PBF Holding from making distributions to PBF LLC if certain defaults exist. In addition, both the indentures and the Revolving Credit Facility contain additional restrictions limiting PBF Holding’s ability to make distributions to PBF LLC.
PBFX intends to make a minimum quarterly distribution to the holders of its common units, including PBF LLC, of at least $0.30 per unit, or $1.20 per unit on an annualized basis, to the extent PBFX has sufficient cash from operations after the establishment of cash reserves and the payment of costs and expenses, including reimbursements of expenses to PBFX’s general partner. However, there is no guarantee that PBFX will pay the minimum quarterly distribution or any amount on the units we own in any quarter. Even if PBFX’s cash distribution policy is not modified or revoked, the amount of distributions paid under the policy and the decision to make any distribution is determined by its general partner, taking into consideration the terms of PBFX’s partnership agreement and debt facilities.
56
PBF Holding made
$52.6 million
in distributions to PBF LLC during the year ended
December 31, 2018
. PBF LLC used
$141.3 million
, which included
$39.5 million
distributed from PBF Holding, to make four separate non-tax distributions of
$0.30
per unit ($1.20 per unit in total) to its members, of which
$139.3 million
was distributed to PBF Energy and the balance was distributed to PBF LLC’s other members. PBF Energy used this
$139.3 million
to pay four separate equivalent cash dividends of
$0.30
per share of its Class A common stock on March 14, 2018, May 30, 2018, August 30, 2018 and November 30, 2018. There were no tax distributions to PBF LLC members in 2018. In addition, PBFX made aggregate quarterly distributions of
$100.1
million (
$1.97
per unit) during the year ended
December 31, 2018
to holders of its common units, of which
$50.6
million was paid to PBF LLC including payments related to IDRs.
Prior to the IDR Restructuring, PBF LLC owned all of the IDRs of PBFX. The IDRs entitled PBF LLC to receive increasing percentages, up to a maximum of 50.0%, of the cash PBFX distributed from operating surplus in excess of $0.345 per unit per quarter. The maximum distribution of 50.0% included distributions paid to PBF LLC on its partnership interest. The maximum distribution of 50.0% did not include any distributions that PBF LLC previously received on common units that it owns. PBFX made IDR payments of
$12.7
million and $7.6 million to PBF LLC based on its distributions for the years ended
December 31, 2018
and 2017, respectively. Subsequent to the closing of the IDR Restructuring, the IDRs will be canceled, no distributions will be made to PBF LLC with respect to IDRs and the newly issued common units will be entitled to normal distributions.
PBF LLC expects to continue to make tax distributions to its members in accordance with its amended and restated limited liability company agreement.
57
Stock Performance Graph
In accordance with SEC rules, the information contained in the Stock Performance Graph below shall not be deemed to be “soliciting material,” or to be “filed” with the SEC, or subject to the SEC’s Regulation 14A or 14C, other than as provided under Item 201(e) of Regulation S-K, or to the liabilities of Section 18 of the Securities Exchange Act of 1934, as amended, except to the extent that we specifically request that the information be treated as soliciting material or specifically incorporate it by reference into a document filed under the Securities Act of 1933, as amended
.
This performance graph and the related textual information are based on historical data and are not indicative of future performance. The following line graph compares the cumulative total return on an investment in our common stock against the cumulative total return of the S&P 500 Composite Index and an index of peer companies (that we selected) for the periods commencing December 31, 2013 through
December 31, 2018
. Our peer group consists of the following companies that are engaged in refining operations in the U.S.: CVR Energy Inc., Delek US Holdings Inc., HollyFrontier Corp, Marathon Petroleum Corp, Phillips 66 and Valero Energy Corp.
|
12/31/2013
|
12/31/2014
|
12/31/2015
|
12/31/2016
|
12/31/2017
|
12/31/2018
|
||||||||||||||||||
|
PBF Energy Inc. Class A Common Stock
|
$
|
100.00
|
|
$
|
88.58
|
|
$
|
127.21
|
|
$
|
101.07
|
|
$
|
134.99
|
|
$
|
128.32
|
|
|||||
|
S&P 500
|
100.00
|
|
113.69
|
|
115.26
|
|
129.05
|
|
157.22
|
|
150.33
|
|
|||||||||||
|
Peer Group
|
100.00
|
|
96.28
|
|
118.80
|
|
121.27
|
|
161.06
|
|
143.37
|
|
|||||||||||
58
Recent Sales of Unregistered Securities—Exchange of PBF LLC Series A Units for PBF Energy Class A Common Stock
In the fourth quarter of
2018
, there were no exchanges of PBF LLC Series A Units for shares of PBF Energy Class A common stock in transactions exempt from registration under Section 4(2) of the Securities Act. No exchanges were made by any of our directors or executive officers.
Share Repurchase Program
Our Board of Directors previously authorized the repurchase of up to $300.0 million of PBF Energy Class A common stock (as amended from time to time, the “Repurchase Program”), which expired on September 30, 2018 and was not renewed. These repurchases were made from time to time through various methods, including open market transactions, block trades, accelerated share repurchases, privately negotiated transactions or otherwise, certain of which might have been effected through Rule 10b5-1 and Rule 10b-18 plans. The timing and number of shares repurchased depended on a variety of factors, including price, capital availability, legal requirements and economic and market conditions. We were not obligated to purchase any shares under the Repurchase Program, and repurchases could be suspended or discontinued at any time without prior notice.
There were no repurchases of PBF Energy Class A Common Stock during the fourth quarter of 2018. For the period of time from the inception of the Repurchase Program through its expiration date, we purchased 6,050,717 shares for $150.8 million.
59
ITEM 6. SELECTED FINANCIAL DATA
The following tables present selected historical consolidated financial data of PBF Energy and PBF LLC. The selected historical consolidated financial data as of
December 31, 2018
and
2017
and for each of the three years in the period ended
December 31, 2018
, have been derived from our audited financial statements, included in “Item 8. Financial Statements and Supplementary Data.” The selected historical consolidated financial data as of
December 31,
2016
,
2015
and
2014
and for the years ended December 31,
2015
and
2014
have been derived from the audited financial statements of PBF Energy and PBF LLC not included in this Annual Report on Form 10-K. As a result of the Chalmette and Torrance acquisitions, the historical consolidated financial results of PBF Energy and PBF LLC only include the results of operations for the Chalmette and Torrance refineries from November 1, 2015 and July 1, 2016 forward, respectively.
The historical consolidated financial data and other statistical data presented below should be read in conjunction with “Item 7. Management’s Discussion and Analysis of Financial Condition and Results of Operations” and our consolidated financial statements and the related notes thereto, included in “Item 8. Financial Statements and Supplementary Data.”
The consolidated financial information may not be indicative of our future financial condition, results of operations or cash flows.
60
|
|
Year Ended December 31,
|
|||||||||||||||||||
|
PBF Energy
|
2018
|
2017
|
2016
|
2015
|
2014
|
|||||||||||||||
|
(in thousands, except share and per share data)
|
||||||||||||||||||||
|
Revenues
|
$
|
27,186,093
|
|
$
|
21,786,637
|
|
$
|
15,920,424
|
|
$
|
13,123,929
|
|
$
|
19,828,155
|
|
|||||
|
Cost and expenses:
|
||||||||||||||||||||
|
Cost of products and other
|
24,503,393
|
|
18,863,621
|
|
13,598,341
|
|
11,481,614
|
|
18,471,203
|
|
||||||||||
|
Operating expenses (excluding depreciation and amortization expense as reflected below)
(1)
|
1,720,959
|
|
1,684,435
|
|
1,422,751
|
|
902,808
|
|
881,046
|
|
||||||||||
|
Depreciation and amortization expense
|
359,126
|
|
277,992
|
|
216,341
|
|
187,729
|
|
166,799
|
|
||||||||||
|
Cost of sales
|
26,583,478
|
|
20,826,048
|
|
15,237,433
|
|
12,572,151
|
|
19,519,048
|
|
||||||||||
|
General and administrative expenses (excluding depreciation and amortization expense as reflected below)
(1)(2)
|
276,955
|
|
214,547
|
|
166,319
|
|
181,266
|
|
146,661
|
|
||||||||||
|
Depreciation and amortization expense
|
10,634
|
|
12,964
|
|
5,835
|
|
9,688
|
|
13,583
|
|
||||||||||
|
(Gain) loss on sale of asset
|
(43,094
|
)
|
1,458
|
|
11,374
|
|
(1,004
|
)
|
(895
|
)
|
||||||||||
|
Total cost and expenses
|
26,827,973
|
|
21,055,017
|
|
15,420,961
|
|
12,762,101
|
|
19,678,397
|
|
||||||||||
|
Income from operations
|
358,120
|
|
731,620
|
|
499,463
|
|
361,828
|
|
149,758
|
|
||||||||||
|
Other income (expense):
|
||||||||||||||||||||
|
Change in Tax Receivable Agreement liability
|
13,893
|
|
250,922
|
|
12,908
|
|
18,150
|
|
2,990
|
|
||||||||||
|
Change in fair value of catalyst leases
|
5,587
|
|
(2,247
|
)
|
1,422
|
|
10,184
|
|
3,969
|
|
||||||||||
|
Debt extinguishment costs
|
—
|
|
(25,451
|
)
|
—
|
|
—
|
|
—
|
|
||||||||||
|
Interest expense, net
|
(169,911
|
)
|
(154,427
|
)
|
(150,045
|
)
|
(106,187
|
)
|
(98,764
|
)
|
||||||||||
|
Other non-service components of net periodic benefit cost
(1)
|
1,109
|
|
(1,402
|
)
|
(580
|
)
|
(1,717
|
)
|
(2,094
|
)
|
||||||||||
|
Income before income taxes
|
208,798
|
|
799,015
|
|
363,168
|
|
282,258
|
|
55,859
|
|
||||||||||
|
Income tax expense (benefit)
|
33,507
|
|
315,584
|
|
137,650
|
|
86,725
|
|
(22,412
|
)
|
||||||||||
|
Net income
|
175,291
|
|
483,431
|
|
225,518
|
|
195,533
|
|
78,271
|
|
||||||||||
|
Less: net income attributable to noncontrolling interests
|
46,976
|
|
67,914
|
|
54,707
|
|
49,132
|
|
116,508
|
|
||||||||||
|
Net income (loss) attributable to PBF Energy Inc. stockholders
|
$
|
128,315
|
|
$
|
415,517
|
|
$
|
170,811
|
|
$
|
146,401
|
|
$
|
(38,237
|
)
|
|||||
|
Weighted-average shares of Class A common stock outstanding:
|
||||||||||||||||||||
|
Basic
|
115,190,262
|
|
109,779,407
|
|
98,334,302
|
|
88,106,999
|
|
74,464,494
|
|
||||||||||
|
Diluted
|
118,773,606
|
|
113,898,845
|
|
103,606,709
|
|
94,138,850
|
|
74,464,494
|
|
||||||||||
|
Net income (loss) available to Class A common stock per share:
|
||||||||||||||||||||
|
Basic
|
$
|
1.11
|
|
$
|
3.78
|
|
$
|
1.74
|
|
$
|
1.66
|
|
$
|
(0.51
|
)
|
|||||
|
Diluted
|
$
|
1.10
|
|
$
|
3.73
|
|
$
|
1.74
|
|
$
|
1.65
|
|
$
|
(0.51
|
)
|
|||||
|
Dividends per common share
|
$
|
1.20
|
|
$
|
1.20
|
|
$
|
1.20
|
|
$
|
1.20
|
|
$
|
1.20
|
|
|||||
|
Balance sheet data (at end of period) :
|
||||||||||||||||||||
|
Total assets
|
$
|
8,005,415
|
|
$
|
8,117,993
|
|
$
|
7,621,927
|
|
$
|
6,105,124
|
|
$
|
5,164,008
|
|
|||||
|
Total debt
(3)
|
1,974,726
|
|
2,226,109
|
|
2,180,700
|
|
1,881,637
|
|
1,260,349
|
|
||||||||||
|
Total equity
|
3,248,479
|
|
2,902,949
|
|
2,570,684
|
|
2,095,857
|
|
1,693,316
|
|
||||||||||
|
Other financial data :
|
||||||||||||||||||||
|
Capital expenditures
(4)
|
$
|
733,887
|
|
$
|
727,035
|
|
$
|
1,612,871
|
|
$
|
981,080
|
|
$
|
631,332
|
|
|||||
61
|
Year Ended December 31,
|
||||||||||||||||||||
|
PBF LLC
|
2018
|
2017
|
2016
|
2015
|
2014
|
|||||||||||||||
|
(in thousands)
|
||||||||||||||||||||
|
Revenues
|
$
|
27,186,093
|
|
$
|
21,786,637
|
|
$
|
15,920,424
|
|
$
|
13,123,929
|
|
$
|
19,828,155
|
|
|||||
|
Cost and expenses:
|
||||||||||||||||||||
|
Cost of products and other
|
24,503,393
|
|
18,863,621
|
|
13,598,341
|
|
11,481,614
|
|
18,471,203
|
|
||||||||||
|
Operating expenses (excluding depreciation and amortization expense as reflected below)
(1)
|
1,720,959
|
|
1,684,435
|
|
1,422,751
|
|
902,808
|
|
881,046
|
|
||||||||||
|
Depreciation and amortization expense
|
359,126
|
|
277,992
|
|
216,341
|
|
187,729
|
|
166,799
|
|
||||||||||
|
Cost of sales
|
26,583,478
|
|
20,826,048
|
|
15,237,433
|
|
12,572,151
|
|
19,519,048
|
|
||||||||||
|
General and administrative expenses (excluding depreciation and amortization expense as reflected below)
(1)(2)
|
275,205
|
|
214,222
|
|
166,119
|
|
180,310
|
|
146,592
|
|
||||||||||
|
Depreciation and amortization expense
|
10,634
|
|
12,964
|
|
5,835
|
|
9,688
|
|
13,583
|
|
||||||||||
|
(Gain) loss on sale of assets
|
(43,094
|
)
|
1,458
|
|
11,374
|
|
(1,004
|
)
|
(895
|
)
|
||||||||||
|
Total cost and expenses
|
26,826,223
|
|
21,054,692
|
|
15,420,761
|
|
12,761,145
|
|
19,678,328
|
|
||||||||||
|
Income from operations
|
359,870
|
|
731,945
|
|
499,663
|
|
362,784
|
|
149,827
|
|
||||||||||
|
Other income (expense):
|
||||||||||||||||||||
|
Change in fair value of catalyst leases
|
5,587
|
|
(2,247
|
)
|
1,422
|
|
10,184
|
|
3,969
|
|
||||||||||
|
Debt extinguishment costs
|
—
|
|
(25,451
|
)
|
—
|
|
—
|
|
—
|
|
||||||||||
|
Interest expense, net
|
(178,421
|
)
|
(162,383
|
)
|
(155,819
|
)
|
(109,411
|
)
|
(100,352
|
)
|
||||||||||
|
Other non-service components of net periodic benefit cost
(1)
|
1,109
|
|
(1,402
|
)
|
(580
|
)
|
(1,717
|
)
|
(2,094
|
)
|
||||||||||
|
Income before income taxes
|
188,145
|
|
540,462
|
|
344,686
|
|
261,840
|
|
51,350
|
|
||||||||||
|
Income tax expense (benefit)
|
7,999
|
|
(10,783
|
)
|
23,689
|
|
648
|
|
—
|
|
||||||||||
|
Net income
|
180,146
|
|
551,245
|
|
320,997
|
|
261,192
|
|
51,350
|
|
||||||||||
|
Less: net income attributable to noncontrolling interests
|
42,308
|
|
51,168
|
|
40,109
|
|
34,880
|
|
14,740
|
|
||||||||||
|
Net income attributable to PBF Energy Company LLC
|
$
|
137,838
|
|
$
|
500,077
|
|
$
|
280,888
|
|
$
|
226,312
|
|
$
|
36,610
|
|
|||||
|
Balance sheet data (at end of period) :
|
||||||||||||||||||||
|
Total assets
|
$
|
7,953,036
|
|
$
|
8,038,985
|
|
$
|
7,133,492
|
|
$
|
5,501,167
|
|
$
|
4,525,920
|
|
|||||
|
Total debt
(3)
|
2,300,808
|
|
2,518,953
|
|
2,370,793
|
|
2,096,261
|
|
1,370,103
|
|
||||||||||
|
Total equity
|
3,219,249
|
|
2,878,503
|
|
2,487,820
|
|
1,909,395
|
|
1,652,837
|
|
||||||||||
|
Other financial data :
|
||||||||||||||||||||
|
Capital expenditures
(4)
|
$
|
733,887
|
|
$
|
727,035
|
|
$
|
1,612,871
|
|
$
|
981,080
|
|
$
|
631,332
|
|
|||||
——————————
|
(1)
|
Amounts disclosed include the retrospective adjustments recorded as part of the adoption of ASU 2017-07, “Compensation—Retirement Benefits (Topic 715): Improving the Presentation of Net Periodic Pension Cost and Net Periodic Postretirement Benefit Cost”. As part of the adoption of this ASU in 2018, other non-service components of the net periodic benefit cost are disclosed separately outside of income (loss) from operations with retrospective adjustments made to the amounts previously recorded within Operating expenses and General and administrative expenses for all periods presented. Refer to “Note 2 - Summary of Significant Accounting Policies” of our Notes to Consolidated Financial Statements for further details.
|
|
(2)
|
Includes acquisition related expenses consisting primarily of consulting and legal expenses related to completed and other pending and non-consummated acquisitions of
$2.9 million
,
$1.0 million
,
$17.5 million
and
$5.8 million
in 2018, 2017, 2016 and 2015, respectively.
|
62
|
(3)
|
Total debt, excluding debt issuance costs, includes current maturities, note payable and our Delaware Economic Development Authority Loan (which was fully converted to a grant as of December 31, 2016). PBF LLC debt also includes an affiliate note payable to PBF Energy which eliminates in consolidation at the PBF Energy level.
|
|
(4)
|
Includes expenditures for acquisitions, construction in progress, property, plant and equipment (including railcar purchases), deferred turnaround costs and other assets, excluding the proceeds from sales of assets.
|
63
ITEM 7. MANAGEMENT’S DISCUSSION AND ANALYSIS OF FINANCIAL CONDITION AND RESULTS OF OPERATIONS
The following review of our results of operations and financial condition should be read in conjunction with “Item 1. Business”, “Item 1A. Risk Factors”, “Item 2. Properties”, “Item 6. Selected Financial Data,” and “Item 8. Financial Statements and Supplementary Data,” respectively, included in this Annual Report on Form 10-K.
CAUTIONARY STATEMENT FOR THE PURPOSE OF SAFE HARBOR PROVISIONS OF THE PRIVATE SECURITIES LITIGATION REFORM ACT OF 1995
This Annual Report on Form 10-K contains certain “forward-looking statements,” as defined in the Private Securities Litigation Reform Act of 1995 (“PSLRA”), of expected future developments that involve risks and uncertainties. You can identify forward-looking statements because they contain words such as “believes,” “expects,” “may,” “should,” “seeks,” “approximately,” “intends,” “plans,” “estimates,” “anticipates” or similar expressions that relate to our strategy, plans or intentions. All statements we make relating to our estimated and projected earnings, margins, costs, expenditures, cash flows, growth rates and financial results or to our strategies, objectives, intentions, resources and expectations regarding future industry trends are forward-looking statements made under the safe harbor of the PSLRA except to the extent such statements relate to the operations of a partnership or limited liability company. In addition, we, through our senior management, from time to time make forward-looking public statements concerning our expected future operations and performance and other developments. These forward-looking statements are subject to risks and uncertainties that may change at any time, and, therefore, our actual results may differ materially from those that we expected. We derive many of our forward-looking statements from our operating budgets and forecasts, which are based upon many detailed assumptions. While we believe that our assumptions are reasonable, we caution that it is very difficult to predict the impact of known factors, and, of course, it is impossible for us to anticipate all factors that could affect our actual results.
Important factors that could cause actual results to differ materially from our expectations, which we refer to as “cautionary statements,” are disclosed under “Item 1A. Risk Factors,” and “Item 7. Management’s Discussion and Analysis of Financial Condition and Results of Operations” and elsewhere in this Annual Report on Form 10-K. All forward-looking information in this Annual Report on Form 10-K and subsequent written and oral forward-looking statements attributable to us, or persons acting on our behalf, are expressly qualified in their entirety by the cautionary statements. Some of the factors that we believe could affect our results include:
•
supply, demand, prices and other market conditions for our products, including volatility in commodity prices;
•
the effects of competition in our markets;
•
changes in currency exchange rates, interest rates and capital costs;
•
adverse developments in our relationship with both our key employees and unionized employees;
•
our ability to operate our businesses efficiently, manage capital expenditures and costs (including general and administrative expenses) and generate earnings and cash flow;
•
o
ur indebtedness;
•
our expectations and timing with respect to our acquisition activity and whether such acquisitions are accretive or dilutive to shareholders;
•
our expectations with respect to our capital improvement and turnaround projects;
•
our supply and inventory intermediation arrangements expose us to counterparty credit and performance risk;
•
termination of our Inventory Intermediation Agreements with J. Aron, which could have a material adverse effect on our liquidity, as we would be required to finance our intermediate and refined products inventory covered by the agreements. Additionally, we are obligated to repurchase from J. Aron certain intermediates and finished products located at the Paulsboro and Delaware City refineries’ storage tanks upon termination of these agreements;
•
restrictive covenants in our indebtedness that may adversely affect our operational flexibility;
•
payments by PBF Energy to the current and former holders of PBF LLC Series A Units and PBF LLC Series B Units under PBF Energy’s Tax Receivable Agreement for certain tax benefits we may claim;
•
our assumptions regarding payments arising under PBF Energy’s Tax Receivable Agreement and other arrangements relating to our organizational structure are subject to change due to various factors, including, among other factors, the timing of exchanges of PBF LLC Series A Units for shares of PBF Energy Class A common stock as contemplated
64
by the Tax Receivable Agreement, the price of PBF Energy Class A common stock at the time of such exchanges, the extent to which such exchanges are taxable, and the amount and timing of our income;
•
the impact of disruptions to crude or feedstock supply to any of our refineries, including disruptions due to problems at PBFX or with third-party logistics infrastructure or operations, including pipeline, marine and rail transportation;
•
the possibility that we might reduce or not make further dividend payments;
•
the inability of our subsidiaries to freely pay dividends or make distributions to us;
•
the impact of current and future laws, rulings and governmental regulations, including the implementation of rules and regulations regarding transportation of crude oil by rail;
•
the impact of the newly enacted federal income tax legislation on our business;
•
the effectiveness of our crude oil sourcing strategies, including our crude by rail strategy and related commitments;
•
adverse impact related to regulation by the federal government lifting the restrictions on exporting U.S. crude oil;
•
adverse impacts from changes in our regulatory environment, such as the effects of compliance with the California Global Warming Solutions Act (also referred to as “AB32”), or from actions taken by environmental interest groups;
•
market risks related to the volatility in the price of RINs required to comply with the Renewable Fuel Standards and GHG emission credits required to comply with various GHG emission programs, such as AB32;
•
our ability to successfully integrate recently completed acquisitions into our business and realize the benefits from such acquisitions;
•
liabilities arising from recent acquisitions that are unforeseen or exceed our expectations;
•
risk associated with the operation of PBFX as a separate, publicly-traded entity;
•
potential tax consequences related to our investment in PBFX; and
•
any decisions we continue to make with respect to our energy-related logistical assets that may be transferred to PBFX.
We caution you that the foregoing list of important factors may not contain all of the material factors that are important to you. In addition, in light of these risks and uncertainties, the matters referred to in the forward-looking statements contained in this Annual Report on Form 10-K may not in fact occur. Accordingly, investors should not place undue reliance on those statements.
Our forward-looking statements speak only as of the date of this Annual Report on Form 10-K. Except as required by applicable law, including the securities laws of the United States, we do not intend to update or revise any forward-looking statements. All subsequent written and oral forward-looking statements attributable to us or persons acting on our behalf are expressly qualified in their entirety by the foregoing.
Executive Summary
Our business operations are conducted by PBF LLC and its subsidiaries. We were formed in March 2008 to pursue the acquisitions of crude oil refineries and downstream assets in North America. We currently own and operate five domestic oil refineries and related assets located in Delaware City, Delaware, Paulsboro, New Jersey, Toledo, Ohio, New Orleans, Louisiana and Torrance, California. Our refineries have a combined processing capacity, known as throughput, of approximately 900,000 bpd, and a weighted average Nelson Complexity Index of 12.2. We operate in two reportable business segments: Refining and Logistics. Our five oil refineries are all engaged in the refining of crude oil and other feedstocks into petroleum products, and are aggregated into the Refining segment. PBFX operates certain logistical assets such as crude oil and refined petroleum products terminals, pipelines, and storage facilities, which are aggregated into the Logistics segment.
Factors Affecting Comparability
Our results over the past three years have been affected by the following events, the understanding of which will aid in assessing the comparability of our period to period financial performance and financial condition.
65
Early Return of Railcars
On September 30, 2018, we agreed to voluntarily return a portion of railcars under an operating lease in order to rationalize certain components of our railcar fleet based on prevailing market conditions in the crude oil by rail market. Under the terms of the lease amendment, we will pay agreed amounts in lieu of satisfaction of return conditions (the “early termination penalty”) and will pay a reduced rental fee over the remaining term of the lease. Certain of these railcars were idle as of September 30, 2018 and the remaining railcars were taken out of service during the fourth quarter of 2018 and subsequently fully returned to the lessor. As a result, we recognized an expense of
$52.3 million
for the year ended December 31, 2018 included within Cost of sales consisting of (i) a
$40.3 million
charge for the early termination penalty and (ii) a
$12.0 million
charge related to the remaining lease payments associated with the railcars identified within the amended lease, all of which were idled and out of service as of December 31, 2018.
Torrance Land Sale
On August 7, 2018, we closed on a third-party sale of a parcel of real property acquired as part of the Torrance Refinery, but not part of the refinery itself. The sale resulted in a gain of approximately $43.8 million included within (Gain) loss on sale of assets within the Consolidated Statements of Operations.
PBF Energy Inc. Public Offerings
As a result of the initial public offering and related reorganization transactions, PBF Energy became the sole managing member of PBF LLC with a controlling voting interest in PBF LLC and its subsidiaries. Effective with completion of the initial public offering, PBF Energy consolidates the financial results of PBF LLC and its subsidiaries and records a noncontrolling interest in its consolidated financial statements representing the economic interests of PBF LLC unitholders other than PBF Energy. Additionally, a series of secondary offerings were made subsequent to our IPO whereby funds affiliated with The Blackstone Group L.P. (“Blackstone”) and First Reserve Management L.P. (“First Reserve”) sold their interests in us. As a result of these secondary offerings, Blackstone and First Reserve no longer hold any PBF LLC Series A units.
On August 14, 2018, PBF Energy completed a public offering of an aggregate of 6,000,000 shares of PBF Energy Class A common stock for net proceeds of $287.3 million, after deducting underwriting discounts and commissions and other offering expenses (the “August 2018 Equity Offering”).
On December 19, 2016, PBF Energy completed a public offering of an aggregate of 10,000,000 shares of PBF Energy Class A common stock for net proceeds of $274.3 million, after deducting underwriting discounts and commissions and other offering expenses (the “December 2016 Equity Offering”).
As of
December 31, 2018
, including the offerings described above, PBF Energy owns
119,895,422
PBF LLC Series C Units and our current and former executive officers and directors and certain employees and others beneficially own
1,206,325
PBF LLC Series A Units, and the holders of our issued and outstanding shares of PBF Energy Class A common stock have
99.0%
of the voting power in us and the members of PBF LLC other than PBF Energy through their holdings of Class B common stock have the remaining
1.0%
of the voting power in us.
PBFX Equity Offerings
On July 30, 2018, PBFX closed on a common unit purchase agreement with certain funds managed by Tortoise Capital Advisors, L.L.C. providing for the issuance and sale in a registered direct offering (the “Registered Direct Offering”) of an aggregate of 1,775,750 common units for net proceeds of approximately $34.8 million.
On August 17, 2016, PBFX completed a public offering of an aggregate of 4,000,000 common units, and granted the underwriter an option to purchase an additional 600,000 common units, of which 375,000 units were subsequently purchased on September 14, 2016, for total net proceeds of $86.8 million, after deducting underwriting discounts and commissions and other offering expenses.
66
On April 5, 2016, PBFX completed a public offering of an aggregate of 2,875,000 common units, including 375,000 common units that were sold pursuant to the full exercise by the underwriter of its option to purchase additional common units, for net proceeds of $51.6 million, after deducting underwriting discounts and commissions and other offering expenses.
As a result of the PBFX equity offerings, as of
December 31, 2018
, PBF LLC held a
44.0%
limited partner interest in PBFX and owned all of PBFX’s IDRs, with the remaining
56.0%
limited partner interest owned by public common unitholders. Immediately following the closing of the IDR Restructuring, the IDRs will be canceled and PBF LLC will hold an approximately 54.1% limited partner interest in PBFX.
PBFX Assets and Transactions
PBFX’s assets consist of various logistics assets (as described in “Item 1. Business”). Apart from certain third-party acquisitions, PBFX’s revenue is derived from long-term, fee-based commercial agreements with subsidiaries of PBF Holding, which include minimum volume commitments, for receiving, handling, transferring and storing crude oil, refined products and natural gas. These transactions are eliminated by PBF Energy and PBF LLC in consolidation.
Since the inception of PBFX in 2014, PBF LLC and PBFX have entered into a series of drop-down transactions. Such transactions and third-party acquisitions made by PBFX occurring in the three years ended
December 31, 2018
are discussed below.
On July 16, 2018, PBFX entered into an agreement with Crown Point to purchase its wholly-owned subsidiary, CPI Operations LLC for total consideration of approximately
$127.0 million
, including working capital and the Contingent Consideration (as defined in “Note 4 - Acquisitions” of our Notes to Consolidated Financial Statements), comprised of an initial payment at closing of
$75.0 million
with a remaining $32.0 million balance being payable one year after closing. The East Coast Storage Assets Acquisition closed on October 1, 2018.
On July 16, 2018, PBFX entered into the Development Assets Contribution Agreements between PBFX and PBF LLC, pursuant to which PBFX acquired from PBF LLC all of the issued and outstanding limited liability company interests of the Development Assets. The acquisition of the Development Assets closed on July 31, 2018 for total consideration of
$31.6 million
consisting of 1,494,134 common units representing limited partner interests in PBFX, issued to PBF LLC (the “Development Assets Acquisition”).
On April 16, 2018, PBFX completed the purchase of Knoxville Terminals from Cummins Terminals, Inc. for total cash consideration of $58.0 million, excluding working capital adjustments (the “Knoxville Terminals Purchase”). The transaction was financed through a combination of cash on hand and borrowings under the PBFX Revolving Credit Facility.
On February 15, 2017, we entered into the Chalmette Storage Services Agreement under which PBFX, through PBFX Op Co, assumed construction of the Chalmette Storage Tank. The Chalmette Storage Tank commenced operations in November 2017 upon completion of construction.
On February 15, 2017, PBFX entered into the PNGPC Contribution Agreement between PBFX and PBF LLC, pursuant to which PBFX Op Co acquired from PBF LLC all of the issued and outstanding limited liability company interests of PNGPC. PNGPC owns and operates an existing interstate natural gas pipeline. In August 2017, PBFX Op Co completed the construction of a new pipeline which replaced the existing pipeline and commenced services.
On August 31, 2016, PBFX acquired from PBF LLC 50% of the issued and outstanding limited liability company interests of TVPC, whose assets consist of the Torrance Valley Pipeline.
On April 29, 2016, PBFX’s wholly-owned subsidiary, PBF Logistics Products Terminals LLC, completed the purchase of the four refined products terminals in the greater Philadelphia region (the “East Coast Terminals”) from an affiliate of Plains All American Pipeline, L.P.
67
PBF Holding Revolving Credit Facility
On May 2, 2018, PBF Holding and certain of its wholly-owned subsidiaries, as borrowers or subsidiary guarantors, replaced our existing asset-based revolving credit agreement dated as of August 15, 2014 (the “August 2014 Revolving Credit Agreement”) with the Revolving Credit Facility. Among other things, the Revolving Credit Facility increased the maximum commitment available to PBF Holding from $2.6 billion to $3.4 billion, extended the maturity date to May 2023, and redefined certain components of the Borrowing Base, as defined in the agreement governing the Revolving Credit Facility (the “Revolving Credit Agreement”), to make more funding available for working capital and other general corporate purposes. In addition, an accordion feature allows for commitments of up to $3.5 billion. The commitment fees on the unused portion, the interest rate on advances and the fees for letters of credit are consistent with the August 2014 Revolving Credit Agreement and further described in “Note 9 - Credit Facility and Debt” of our Notes to Consolidated Financial Statements.
There were no outstanding borrowings on the revolver as of
December 31, 2018
. At
December 31, 2017
and December 31, 2016, there was
$350.0 million
outstanding under the August 2014 Revolving Credit Agreement, respectively.
PBFX Revolving Credit Facility
On July 30, 2018, PBFX entered into the PBFX Revolving Credit Facility with Wells Fargo Bank, National Association, as administrative agent, and a syndicate of lenders. The PBFX Revolving Credit Facility amended and restated the May 2014 PBFX Revolving Credit Facility. Among other things, the amended PBFX Revolving Credit Facility increased the maximum commitment available to PBFX from $360.0 million to $500.0 million and extended the maturity date to July 2023. PBFX has the ability to increase the maximum amount of the PBFX Revolving Credit Facility by an aggregate amount of up to $250.0 million to a total facility size of $750.0 million, subject to receiving increased commitments from the lenders or other financial institutions and satisfaction of certain conditions. The commitment fees on the unused portion, the interest rate on advances, and the fees for letters of credit are consistent with the May 2014 PBFX Revolving Credit Facility. The PBFX Revolving Credit Facility is guaranteed by a guaranty of collection from PBF LLC. During 2018, PBFX borrowed $126.3 million, net including borrowings for the Knoxville Terminals Purchase and the East Coast Storage Assets Acquisition.
The outstanding balance under the PBFX revolving credit facility was
$156.0 million
and
$29.7 million
as of
December 31, 2018
and
December 31, 2017
, respectively.
Senior Notes
On May 30, 2017, PBF Holding and PBF Finance issued $725.0 million, in aggregate, principal amount of the 2025 Senior Notes. We used the net proceeds of $711.6 million to fund the cash tender offer (the “Tender Offer”) for any and all of the outstanding 8.25% senior secured notes due 2020 (the “2020 Senior Secured Notes”), to pay the related redemption price and accrued and unpaid interest for any 2020 Senior Secured Notes that remained outstanding after the completion of the Tender Offer, and for general corporate purposes. As described in “Note 9 - Credit Facility and Debt” of our Notes to Consolidated Financial Statements, upon the satisfaction and discharge of the 2020 Senior Secured Notes in connection with the closing of the Tender Offer and the redemption, the 2023 Senior Notes became unsecured and certain covenants were modified, as provided for in the indenture governing the 2023 Senior Notes and related documents.
On October 6, 2017, PBFX issued $175.0 million in aggregate principal amount of 6.875% Senior Notes due 2023 (the “new PBFX 2023 Senior Notes” and, together with the initial PBFX 2023 Senior Notes, the “PBFX 2023 Senior Notes”). The new PBFX 2023 Senior Notes were issued at 102% of face value with an effective rate of 6.442% and were issued under the indenture governing the initial PBFX 2023 Senior Notes dated May 12, 2015. PBFX used the net proceeds from the offering of the new PBFX 2023 Senior Notes to repay a portion of the PBFX Revolving Credit Facility and for general capital purposes.
68
PBF Rail Term Loan
On December 22, 2016, PBF Rail Logistics Company LLC (“PBF Rail”) entered into a
$35.0 million
term loan (the “PBF Rail Term Loan”) with a bank previously party to the Rail Facility. The PBF Rail Term Loan amortizes monthly over its five-year term and bears interest at the one month LIBOR plus the margin as defined in the agreement governing the PBF Rail Term Loan (the “Rail Credit Agreement”). As security for the PBF Rail Term Loan, PBF Rail pledged, among other things: (i) certain Eligible Railcars (ii) the Debt Service Reserve Account (as defined in the Rail Credit Agreement); and (iii) PBF Holding’s member interest in PBF Rail. Additionally, the Rail Credit Agreement contains customary terms, events of default and covenants for transactions of this nature. PBF Rail may at any time repay the PBF Rail Term Loan without penalty in the event that railcars collateralizing the loan are sold, scrapped or otherwise removed from the collateral pool.
The outstanding balance under the PBF Rail Term Loan was
$21.6 million
and
$28.4 million
as of
December 31, 2018
and
December 31, 2017
, respectively.
Torrance Acquisition
On July 1, 2016, we acquired from ExxonMobil and its subsidiary, Mobil Pacific Pipeline Company, the Torrance refinery and related logistics assets. The Torrance refinery, located on 750 acres in Torrance, California, is a high-conversion 155,000 bpd, delayed-coking refinery with a Nelson Complexity Index of 14.9. The facility is strategically positioned in Southern California with advantaged logistics connectivity that offers flexible raw material sourcing and product distribution opportunities primarily in the California, Las Vegas and Phoenix area markets. The Torrance Acquisition increased our total throughput capacity to approximately 900,000 bpd.
In addition to refining assets, the Torrance Acquisition included a number of high-quality logistics assets consisting of a sophisticated network of crude and products pipelines, product distribution terminals and refinery crude and product storage facilities. The most significant of the logistics assets is a 189-mile crude gathering and transportation system which delivers San Joaquin Valley crude oil directly from the field to the refinery. Additionally, included in the transaction were several pipelines which provide access to sources of crude oil including the Ports of Long Beach and Los Angeles, as well as clean product outlets with a direct pipeline supplying jet fuel to the Los Angeles airport. The Torrance refinery also has crude and product storage facilities with approximately 8.6 million barrels of shell capacity.
The purchase price for the assets was approximately $521.4 million in cash after post-closing purchase price adjustments, plus working capital of $450.6 million. The final purchase price and fair value allocation were completed as of June 30, 2017. The transaction was financed through a combination of cash on hand, including proceeds from certain equity offerings, and borrowings under our August 2014 Revolving Credit Agreement.
Inventory Intermediation Agreements
On certain dates subsequent to the inception of the Inventory Intermediation Agreements, we and our subsidiaries, DCR and PRC, entered into amendments to the amended and restated inventory intermediation agreement (as amended, the “Inventory Intermediation Agreements”) with J. Aron pursuant to which certain terms of the inventory intermediation agreements were amended, including, among other things, pricing and an extension of the term. The most recent of these was on September 8, 2017 which extends the term of the Inventory Intermediation Agreement relating to DCR and PRC to July 1, 2019 and December 31, 2019, respectively, which terms may be further extended by mutual consent of the parties to July 1, 2020 and December 31, 2020, respectively.
Pursuant to each Inventory Intermediation Agreement, J. Aron continues to purchase and hold title to the Products produced by the Refineries, and delivered into tanks at the Refineries. Furthermore, J. Aron agrees to sell the Products back to the Refineries as the Products are discharged out of the Refineries’ tanks. J. Aron has the right to store the Products purchased in tanks under the Inventory Intermediation Agreements and will retain these storage rights for the term of the agreements. PBF Holding continues to market and sell the Products independently to third parties.
69
Renewable Fuels Standard
We are subject to obligations to purchase RINs required to comply with the Renewable Fuels Standard. Our overall RINs obligation is based on a percentage of domestic shipments of on-road fuels as established by EPA. To the degree we are unable to blend the required amount of biofuels to satisfy our RINs obligation, RINs must be purchased on the open market to avoid penalties and fines. We record our RINs obligation on a net basis in Accrued expenses when our RINs liability is greater than the amount of RINs earned and purchased in a given period and in Prepaid and other current assets when the amount of RINs earned and purchased is greater than the RINs liability. We incurred approximately
$143.9 million
in RINs costs during the year ended
December 31, 2018
as compared to
$293.7 million
and
$347.5 million
during the years ended
December 31, 2017
and
2016
, respectively. The fluctuations in RINs costs are due primarily to volatility in prices for ethanol-linked RINs and increases in our production of on-road transportation fuels since 2012. Our RINs purchase obligation is dependent on our actual shipment of on-road transportation fuels domestically and the amount of blending achieved.
Crude Oil Acquisition Agreements
We have a contract with Saudi Aramco pursuant to which we have been purchasing up to approximately 100,000 bpd of crude oil from Saudi Aramco that is processed at our Paulsboro refinery. In connection with the Chalmette Acquisition we entered into a contract with PDVSA for the supply of 40,000 to 60,000 bpd of crude oil that can be processed at any of our East or Gulf Coast refineries. We have not sourced crude oil under this agreement since the third quarter of 2017 as PDVSA has suspended deliveries due to the parties’ inability to agree to mutually acceptable payment terms
.
In connection with the closing of the Torrance Acquisition, we entered into a crude supply agreement with ExxonMobil for approximately 60,000 bpd of crude oil that can be processed at our Torrance refinery. We currently purchase all of our crude and feedstock needs independently from a variety of suppliers on the spot market or through term agreements for our Delaware City and Toledo refineries.
Tax Receivable Agreement
In connection with PBF Energy’s initial public offering, PBF Energy entered into a Tax Receivable Agreement pursuant to which PBF Energy is required to pay the members of PBF LLC, who exchange their units for PBF Energy Class A common stock or whose units PBF Energy purchases, approximately 85% of the cash savings in income taxes that PBF Energy realizes as a result of the increase in the tax basis of its interest in PBF LLC, including tax benefits attributable to payments made under the Tax Receivable Agreement. PBF Energy has recognized, as of
December 31, 2018
, a liability for the Tax Receivable Agreement of
$373.5 million
, reflecting its estimate of the undiscounted amounts that it expects to pay under the agreement due to exchanges including those in connection with its IPO and its secondary offerings. PBF Energy’s estimate of the Tax Receivable Agreement liability is based, in part, on forecasts of future taxable income over the anticipated life of its future business operations, assuming no material changes in the relevant tax law. Periodically, it may adjust the liability based, in part, on an updated estimate of the amounts that it expects to pay, using assumptions consistent with those used in its concurrent estimate of the deferred tax asset valuation allowance. For example, PBF Energy must adjust the estimated Tax Receivable Agreement liability each time it purchases PBF LLC Series A Units or upon an exchange of PBF LLC Series A Units for PBF Energy Class A common stock. These periodic adjustments to the tax receivable liability, if any, are recorded in general and administrative expense and may result in adjustments to its income tax expense and deferred tax assets and liabilities. As a result of the reduction of the corporate tax rate to 21% as part of the TCJA, the liability associated with the Tax Receivable Agreement was reduced. Accordingly, the deferred tax assets associated with the payments made or expected to be made were also reduced.
Share Repurchase Program
Our Board of Directors previously authorized the repurchase of up to
$300.0
million of PBF Energy Class A common stock. On September 26, 2016, our Board of Directors approved a two year extension to the existing Repurchase Program. As a result of the extension, the Repurchase Program ran through September 30, 2018 but was not renewed further or thereafter. There were no repurchases of PBF Energy Class A common stock during the year ended
December 31, 2018
. For the period of time from the inception of the Repurchase Program through its expiration date, we purchased
6,050,717
shares of PBF Energy Class A common stock for
$150.8
million through open market transactions.
These repurchases were made from time to time through various methods, including open market transactions, block trades, accelerated share repurchases, privately negotiated transactions or otherwise, certain of which might have been effected through Rule 10b5-1 and Rule 10b-18 plans. The timing and number of shares repurchased depended on a variety of factors, including price, capital availability, legal requirements and economic and market conditions. We were not obligated to purchase any shares under the Repurchase Program, and repurchases might have been suspended or discontinued at any time without prior notice.
70
Factors Affecting Operating Results
Overview
Our earnings and cash flows from operations are primarily affected by the relationship between refined product prices and the prices for crude oil and other feedstocks. The cost to acquire crude oil and other feedstocks and the price of refined petroleum products ultimately sold depends on numerous factors beyond our control, including the supply of, and demand for, crude oil, gasoline, diesel and other refined petroleum products, which, in turn, depend on, among other factors, changes in global and regional economies, weather conditions, global and regional political affairs, production levels, the availability of imports, the marketing of competitive fuels, pipeline capacity, prevailing exchange rates and the extent of government regulation. Our revenue and income from operations fluctuate significantly with movements in industry refined petroleum product prices, our materials cost fluctuate significantly with movements in crude oil prices and our other operating expenses fluctuate with movements in the price of energy to meet the power needs of our refineries. In addition, the effect of changes in crude oil prices on our operating results is influenced by how the prices of refined products adjust to reflect such changes.
Crude oil and other feedstock costs and the prices of refined petroleum products have historically been subject to wide fluctuation. Expansion and upgrading of existing facilities and installation of additional refinery distillation or conversion capacity, price volatility, governmental regulations, international political and economic developments and other factors beyond our control are likely to continue to play an important role in refining industry economics. These factors can impact, among other things, the level of inventories in the market, resulting in price volatility and a reduction or increase in product margins. Moreover, the industry typically experiences seasonal fluctuations in demand for refined petroleum products, such as for gasoline and diesel, during the summer driving season and for home heating oil during the winter.
Benchmark Refining Margins
In assessing our operating performance, we compare the refining margins (revenue less materials cost) of each of our refineries against a specific benchmark industry refining margin based on crack spreads. Benchmark refining margins take into account both crude and refined petroleum product prices. When these prices are combined in a formula they provide a single value—a gross margin per barrel—that, when multiplied by throughput, provides an approximation of the gross margin generated by refining activities.
The performance of our East Coast refineries generally follows the Dated Brent (NYH) 2-1-1 benchmark refining margin. Our Toledo refinery generally follows the WTI (Chicago) 4-3-1 benchmark refining margin. Our Chalmette refinery generally follows the LLS (Gulf Coast) 2-1-1 benchmark refining margin. Our Torrance refinery generally follows the ANS (West Coast) 4-3-1 benchmark refining margin.
While the benchmark refinery margins presented below under “Results of Operations—Market Indicators” are representative of the results of our refineries, each refinery’s realized gross margin on a per barrel basis will differ from the benchmark due to a variety of factors affecting the performance of the relevant refinery to its corresponding benchmark. These factors include the refinery’s actual type of crude oil throughput, product yield differentials and any other factors not reflected in the benchmark refining margins, such as transportation costs, storage costs, credit fees, fuel consumed during production and any product premiums or discounts, as well as inventory fluctuations, timing of crude oil and other feedstock purchases, a rising or declining crude and product pricing environment and commodity price management activities. As discussed in more detail below, each of our refineries, depending on market conditions, has certain feedstock-cost and product-value advantages and disadvantages as compared to the refinery’s relevant benchmark.
Credit Risk Management
Credit risk refers to the risk that a counterparty will default on its contractual obligations resulting in financial loss to us. Our exposure to credit risk is reflected in the carrying amount of the receivables that are presented in our consolidated balance sheet. To minimize credit risk, all customers are subject to extensive credit verification procedures and extensions of credit above defined thresholds are to be approved by the senior management. Our intention is to trade only with recognized creditworthy third parties. In addition, receivable balances are monitored on an ongoing basis. We also limit the risk of bad debts by obtaining security such as guarantees or letters of credit.
71
Other Factors
We currently source our crude oil for our refineries on a global basis through a combination of market purchases and short-term purchase contracts, and through our crude oil supply agreements. We believe purchases based on market pricing has given us flexibility in obtaining crude oil at lower prices and on a more accurate “as needed” basis. Since our Paulsboro and Delaware City refineries access their crude slates from the Delaware River via ship or barge and through our rail facilities at Delaware City, these refineries have the flexibility to purchase crude oils from the Mid-Continent and Western Canada, as well as a number of different countries. We have not sourced crude oil under our crude supply arrangement with PDVSA since the third quarter of 2017 as PDVSA has suspended deliveries due to our inability to agree to mutually acceptable payment terms.
In the past several years, we expanded and upgraded the existing on-site railroad infrastructure at the Delaware City refinery. Currently, crude oil delivered by rail to this facility is consumed at our Delaware City and Paulsboro refineries. The Delaware City rail unloading facilities, and our recently acquired East Coast Storage Assets, allow our East Coast refineries to source WTI-based crude oils from Western Canada and the Mid-Continent, which we believe, at times, may provide cost advantages versus traditional Brent-based international crude oils. In support of this rail strategy, we have at times entered into agreements to lease or purchase crude railcars. Certain of these railcars were subsequently sold to a third-party, which has leased the railcars back to us for periods of between four and seven years. In subsequent periods, we have sold or returned railcars to optimize our railcar portfolio. As discussed in “Note 8 - Accrued expenses” of our Notes to Consolidated Financial Statements, on September 30, 2018, we agreed to voluntarily return a portion of railcars under an operating lease in order to rationalize certain components of our railcar fleet based on prevailing market conditions in the crude oil by rail market. Under the terms of the lease amendment, we agreed to pay an early termination penalty and will pay a reduced rental fee over the remaining term of the lease. Our railcar fleet, at times, provides transportation flexibility within our crude oil sourcing strategy that allows our East Coast refineries to process cost advantaged crude from Canada and the Mid-Continent.
Our operating cost structure is also important to our profitability. Major operating costs include costs relating to employees and contract labor, energy, maintenance and environmental compliance, and emission control regulations, including the cost of RINs required for compliance with the Renewable Fuels Standard. The predominant variable cost is energy, in particular, the price of utilities, natural gas and electricity.
Our operating results are also affected by the reliability of our refinery operations. Unplanned downtime of our refinery assets generally results in lost margin opportunity and increased maintenance expense. The financial impact of planned downtime, such as major turnaround maintenance, is managed through a planning process that considers such things as the margin environment, the availability of resources to perform the needed maintenance and feed logistics, whereas unplanned downtime does not afford us this opportunity.
Refinery-Specific Information
The following section includes refinery-specific information related to our operations, crude oil differentials, ancillary costs, and local premiums and discounts.
Delaware City Refinery.
The benchmark refining margin for the Delaware City refinery is calculated by assuming that two barrels of Dated Brent crude oil are converted into one barrel of gasoline and one barrel of diesel. We calculate this benchmark using the NYH market value of reformulated blendstock for oxygenate blending (“RBOB”) and ultra-low sulfur diesel (“ULSD”) against the market value of Dated Brent and refer to the benchmark as the Dated Brent (NYH) 2-1-1 benchmark refining margin. Our Delaware City refinery has a product slate of approximately 55% gasoline, 32% distillate, 2% high-value petrochemicals, with the remaining portion of the product slate comprised of lower-value products (5% petroleum coke, 3% LPGs, 2% black oil and 1% other). For this reason, we believe the Dated Brent (NYH) 2-1-1 is an appropriate benchmark industry refining margin. The majority of Delaware City revenues are generated off NYH-based market prices.
The Delaware City refinery’s realized gross margin on a per barrel basis has historically differed from the Dated Brent (NYH) 2-1-1 benchmark refining margin due to the following factors:
•
the Delaware City refinery processes a slate of primarily medium and heavy sour crude oils, which has constituted approximately 55% to 65% of total throughput. The remaining throughput consists of sweet crude oil and other feedstocks and blendstocks. In addition, we have the capability to process a significant volume of light, sweet crude oil depending on market conditions. Our total throughput costs have historically priced at a discount to Dated Brent; and
72
•
as a result of the heavy, sour crude slate processed at Delaware City, we produce lower value products including sulfur, carbon dioxide and petroleum coke. These products are priced at a significant discount to RBOB and ULSD.
Paulsboro Refinery.
The benchmark refining margin for the Paulsboro refinery is calculated by assuming that two barrels of Dated Brent crude oil are converted into one barrel of gasoline and one barrel of diesel. We calculate this benchmark using the NYH market value of RBOB and ULSD diesel against the market value of Dated Brent and refer to the benchmark as the Dated Brent (NYH) 2-1-1 benchmark refining margin. Our Paulsboro refinery has a product slate of approximately 42% gasoline, 33% distillate and 4% high-value Group I lubricants, with the remaining portion of the product slate comprised of lower-value products (14% black oil, 3% petroleum coke, 2% LPGs and 2% other). For this reason, we believe the Dated Brent (NYH) 2-1-1 is an appropriate benchmark industry refining margin. The majority of Paulsboro revenues are generated off NYH-based market prices.
The Paulsboro refinery’s realized gross margin on a per barrel basis has historically differed from the Dated Brent (NYH) 2-1-1 benchmark refining margin due to the following factors:
•
the Paulsboro refinery processes a slate of primarily medium and heavy sour crude oils, which has historically constituted approximately 75% to 85% of total throughput. The remaining throughput consists of sweet crude oil and other feedstocks and blendstocks;
•
as a result of the heavy, sour crude slate processed at Paulsboro, we produce lower value products including sulfur and petroleum coke. These products are priced at a significant discount to RBOB and ULSD; and
•
the Paulsboro refinery produces Group I lubricants which carry a premium sales price to RBOB and ULSD.
Toledo Refinery.
The benchmark refining margin for the Toledo refinery is calculated by assuming that four barrels of WTI crude oil are converted into three barrels of gasoline, one-half barrel of ULSD and one-half barrel of jet fuel. We calculate this refining margin using the Chicago market values of conventional blendstock for oxygenate blending (“CBOB”) and ULSD and the United States Gulf Coast value of jet fuel against the market value of WTI and refer to this benchmark as the WTI (Chicago) 4-3-1 benchmark refining margin. Our Toledo refinery has a product slate of approximately 55% gasoline, 33% distillate, 5% high-value petrochemicals (including nonene, tetramer, benzene, xylene and toluene) with the remaining portion of the product slate comprised of lower-value products (4% LPGs and 3% other). For this reason, we believe the WTI (Chicago) 4-3-1 is an appropriate benchmark industry refining margin. The majority of Toledo revenues are generated off Chicago-based market prices.
The Toledo refinery’s realized gross margin on a per barrel basis has historically differed from the WTI (Chicago) 4-3-1 benchmark refining margin due to the following factors:
•
the Toledo refinery processes a slate of domestic sweet and Canadian synthetic crude oil. Historically, Toledo’s blended average crude costs have differed from the market value of WTI crude oil;
•
the Toledo refinery configuration enables it to produce more barrels of product than throughput which generates a pricing benefit; and
•
the Toledo refinery generates a pricing benefit on some of its refined products, primarily its petrochemicals.
Chalmette Refinery.
The benchmark refining margin for the Chalmette refinery is calculated by assuming two barrels of Light Louisiana Sweet (“LLS”) crude oil are converted into one barrel of gasoline and one barrel of diesel. We calculate this benchmark using the US Gulf Coast market value of 87 conventional gasoline and ULSD against the market value of LLS and refer to this benchmark as the LLS (Gulf Coast) 2-1-1 benchmark refining margin. Our Chalmette refinery has a product slate of approximately 50% gasoline and 30% distillate, with the remaining portion of the product slate comprised of lower-value products (10% black oil, 4% petroleum coke, 3% LPGs and 3% other). For this reason, we believe the LLS (Gulf Coast) 2-1-1 is an appropriate benchmark industry refining margin. The majority of Chalmette revenues are generated off Gulf Coast-based market prices.
The Chalmette refinery’s realized gross margin on a per barrel basis has historically differed from the LLS (USGC) 2-1-1 benchmark refining margin due to the following factors:
•
the Chalmette refinery has generally processed a slate of primarily medium and heavy sour crude oils, which has historically constituted approximately 55% to 65% of total throughput. The remaining throughput consists of sweet crude oil and other feedstocks and blendstocks; and
73
•
as a result of the heavy, sour crude slate processed at Chalmette, we produce lower-value products including sulfur and petroleum coke. These products are priced at a significant discount to 87 conventional gasoline and ULSD.
The PRL (pre-treater, reformer, light ends) project was completed in 2017 which has increased high-octane, ultra-low sulfur reformate and chemicals production. The new crude oil tank was also commissioned in 2017 and is allowing additional gasoline and diesel exports, reduced RINs compliance costs and lower crude ship demurrage costs.
Additionally, we are in the process of restarting our idled 12,000 barrel per day coker unit to increase the refinery’s long-term feedstock flexibility and to be better positioned to benefit from potential dislocations in the price for heavy and high-sulfur feedstocks. The unit is expected to be in service by the end of 2019 and will increase the refinery’s total coking capacity to approximately 42,000 barrels per day.
Torrance Refinery.
The benchmark refining margin for the Torrance refinery is calculated by assuming that four barrels of Alaskan North Slope (“ANS”) crude oil are converted into three barrels of gasoline, one-half barrel of diesel and one-half barrel of jet fuel. We calculate this benchmark using the West Coast Los Angeles market value of California reformulated blendstock for oxygenate blending (CARBOB), California Air Resources Board (CARB) diesel and jet fuel and refer to the benchmark as the ANS (WCLA) 4-3-1 benchmark refining margin. Our Torrance refinery has a product slate of approximately 60% gasoline and 26% distillate with the remaining portion of the product slate comprised of lower-value products (9% petroleum coke, 2% LPG, 2% black oil and 1% other). For this reason, we believe the ANS (West Coast) 4-3-1 is an appropriate benchmark industry refining margin. The majority of Torrance revenues are generated off West Coast Los Angeles-based market prices.
The Torrance refinery’s realized gross margin on a per barrel basis has historically differed from the ANS (WCLA) 4-3-1 benchmark refining margin due to the following factors:
•
the Torrance refinery has generally processed a slate of primarily heavy sour crude oils, which has historically constituted approximately 80% to 90% of total throughput. The Torrance crude slate has the lowest API gravity (typically an American Petroleum Institute (“API”) gravity of less than 20 degrees) of all of our refineries. The remaining throughput consists of other feedstocks and blendstocks; and
•
as a result of the heavy, sour crude slate processed at Torrance, we produce lower-value products including petroleum coke and sulfur. These products are priced at a significant discount to gasoline and diesel.
74
Results of Operations
The tables below reflect our consolidated financial and operating highlights for the years ended
December 31, 2018
,
2017
and
2016
(amounts in thousands, except per share data). Differences between the results of operations of PBF Energy and PBF LLC primarily pertain to income tax expense, interest expense and non-controlling interest as shown below. Earnings per share information applies only to the financial results of PBF Energy. We operate in two reportable business segments: Refining and Logistics. Our oil refineries, excluding the assets owned by PBFX, are all engaged in the refining of crude oil and other feedstocks into petroleum products, and are aggregated into the Refining segment. PBFX is a publicly-traded MLP that operates certain logistical assets such as crude oil and refined petroleum products terminals, pipelines and storage facilities. PBFX’s operations are aggregated into the Logistics segment. We do not separately discuss our results by individual segments as, apart from PBFX’s third-party acquisitions, our Logistics segment did not have any significant third-party revenue and a significant portion of its operating results eliminate in consolidation.
|
PBF Energy
|
Year Ended December 31,
|
|||||||||||
|
|
2018
|
2017
|
2016
|
|||||||||
|
Revenues
|
$
|
27,186,093
|
|
$
|
21,786,637
|
|
$
|
15,920,424
|
|
|||
|
Cost and expenses:
|
||||||||||||
|
Cost of products and other
|
24,503,393
|
|
18,863,621
|
|
13,598,341
|
|
||||||
|
Operating expenses (excluding depreciation and amortization expense as reflected below)
|
1,720,959
|
|
1,684,435
|
|
1,422,751
|
|
||||||
|
Depreciation and amortization expense
|
359,126
|
|
277,992
|
|
216,341
|
|
||||||
|
Cost of sales
|
26,583,478
|
|
20,826,048
|
|
15,237,433
|
|
||||||
|
General and administrative expenses (excluding depreciation and amortization expense as reflected below)
|
276,955
|
|
214,547
|
|
166,319
|
|
||||||
|
Depreciation and amortization expense
|
10,634
|
|
12,964
|
|
5,835
|
|
||||||
|
(Gain) loss on sale of assets
|
(43,094
|
)
|
1,458
|
|
11,374
|
|
||||||
|
Total cost and expenses
|
26,827,973
|
|
21,055,017
|
|
15,420,961
|
|
||||||
|
Income from operations
|
358,120
|
|
731,620
|
|
499,463
|
|
||||||
|
Other income (expense):
|
||||||||||||
|
Change in Tax Receivable Agreement liability
|
13,893
|
|
250,922
|
|
12,908
|
|
||||||
|
Change in fair value of catalyst leases
|
5,587
|
|
(2,247
|
)
|
1,422
|
|
||||||
|
Debt extinguishment costs
|
—
|
|
(25,451
|
)
|
—
|
|
||||||
|
Interest expense, net
|
(169,911
|
)
|
(154,427
|
)
|
(150,045
|
)
|
||||||
|
Other non-service components of net periodic benefit cost
|
1,109
|
|
(1,402
|
)
|
(580
|
)
|
||||||
|
Income before income taxes
|
208,798
|
|
799,015
|
|
363,168
|
|
||||||
|
Income tax expense
|
33,507
|
|
315,584
|
|
137,650
|
|
||||||
|
Net income
|
175,291
|
|
483,431
|
|
225,518
|
|
||||||
|
Less: net income attributable to noncontrolling interests
|
46,976
|
|
67,914
|
|
54,707
|
|
||||||
|
Net income attributable to PBF Energy Inc. stockholders
|
$
|
128,315
|
|
$
|
415,517
|
|
$
|
170,811
|
|
|||
|
Consolidated gross margin
|
$
|
602,615
|
|
$
|
960,589
|
|
$
|
682,991
|
|
|||
|
Gross refining margin
(1)
|
$
|
2,419,389
|
|
$
|
2,676,651
|
|
$
|
2,143,449
|
|
|||
|
Net income available to Class A common stock per share:
|
||||||||||||
|
Basic
|
$
|
1.11
|
|
$
|
3.78
|
|
$
|
1.74
|
|
|||
|
Diluted
|
$
|
1.10
|
|
$
|
3.73
|
|
$
|
1.74
|
|
|||
——————————
(1) See Non-GAAP Financial Measures below.
75
|
PBF LLC
|
Year Ended December 31,
|
|||||||||||
|
2018
|
2017
|
2016
|
||||||||||
|
Revenues
|
$
|
27,186,093
|
|
$
|
21,786,637
|
|
$
|
15,920,424
|
|
|||
|
Cost and expenses:
|
||||||||||||
|
Cost of products and other
|
24,503,393
|
|
18,863,621
|
|
13,598,341
|
|
||||||
|
Operating expenses (excluding depreciation and amortization expense as reflected below)
|
1,720,959
|
|
1,684,435
|
|
1,422,751
|
|
||||||
|
Depreciation and amortization expense
|
359,126
|
|
277,992
|
|
216,341
|
|
||||||
|
Cost of sales
|
26,583,478
|
|
20,826,048
|
|
15,237,433
|
|
||||||
|
General and administrative expenses (excluding depreciation and amortization expense as reflected below)
|
275,205
|
|
214,222
|
|
166,119
|
|
||||||
|
Depreciation and amortization expense
|
10,634
|
|
12,964
|
|
5,835
|
|
||||||
|
(Gain) loss on sale of assets
|
(43,094
|
)
|
1,458
|
|
11,374
|
|
||||||
|
Total cost and expenses
|
26,826,223
|
|
21,054,692
|
|
15,420,761
|
|
||||||
|
Income from operations
|
359,870
|
|
731,945
|
|
499,663
|
|
||||||
|
Other income (expense):
|
||||||||||||
|
Change in fair value of catalyst leases
|
5,587
|
|
(2,247
|
)
|
1,422
|
|
||||||
|
Debt extinguishment costs
|
—
|
|
(25,451
|
)
|
—
|
|
||||||
|
Interest expense, net
|
(178,421
|
)
|
(162,383
|
)
|
(155,819
|
)
|
||||||
|
Other non-service components of net periodic benefit cost
|
1,109
|
|
(1,402
|
)
|
(580
|
)
|
||||||
|
Income before income taxes
|
188,145
|
|
540,462
|
|
344,686
|
|
||||||
|
Income tax expense (benefit)
|
7,999
|
|
(10,783
|
)
|
23,689
|
|
||||||
|
Net income
|
180,146
|
|
551,245
|
|
320,997
|
|
||||||
|
Less: net income attributable to noncontrolling interests
|
42,308
|
|
51,168
|
|
40,109
|
|
||||||
|
Net income attributable to PBF Energy Company LLC
|
$
|
137,838
|
|
$
|
500,077
|
|
$
|
280,888
|
|
|||
76
Operating Highlights
|
|
Year Ended December 31,
|
|||||||||||
|
|
2018
|
2017
|
2016
|
|||||||||
|
Key Operating Information
|
||||||||||||
|
Production (bpd in thousands)
|
854.5
|
|
802.9
|
|
734.3
|
|
||||||
|
Crude oil and feedstocks throughput (bpd in thousands)
|
849.7
|
|
807.4
|
|
727.7
|
|
||||||
|
Total crude oil and feedstocks throughput (millions of barrels)
|
310.0
|
|
294.7
|
|
266.4
|
|
||||||
|
Consolidated gross margin per barrel of throughput
|
$
|
1.94
|
|
$
|
3.25
|
|
$
|
2.56
|
|
|||
|
Gross refining margin, excluding special items, per barrel of throughput
(1)
|
$
|
9.09
|
|
$
|
8.08
|
|
$
|
6.09
|
|
|||
|
Refinery operating expense, per barrel of throughput
|
$
|
5.34
|
|
$
|
5.52
|
|
$
|
5.22
|
|
|||
|
Crude and feedstocks (% of total throughput)
(2)
|
||||||||||||
|
Heavy
|
36
|
%
|
34
|
%
|
26
|
%
|
||||||
|
Medium
|
30
|
%
|
30
|
%
|
37
|
%
|
||||||
|
Light
|
21
|
%
|
21
|
%
|
25
|
%
|
||||||
|
Other feedstocks and blends
|
13
|
%
|
15
|
%
|
12
|
%
|
||||||
|
Total throughput
|
100
|
%
|
100
|
%
|
100
|
%
|
||||||
|
Yield (% of total throughput)
|
||||||||||||
|
Gasoline and gasoline blendstocks
|
50
|
%
|
50
|
%
|
50
|
%
|
||||||
|
Distillates and distillate blendstocks
|
32
|
%
|
30
|
%
|
31
|
%
|
||||||
|
Lubes
|
1
|
%
|
1
|
%
|
1
|
%
|
||||||
|
Chemicals
|
2
|
%
|
2
|
%
|
3
|
%
|
||||||
|
Other
|
16
|
%
|
16
|
%
|
15
|
%
|
||||||
|
Total yield
|
101
|
%
|
99
|
%
|
100
|
%
|
||||||
——————————
(1) See Non-GAAP Financial Measures below.
(2) We define heavy crude oil as crude oil with American Petroleum Institute (API) gravity less than 24 degrees. We define medium crude oil as crude oil with API gravity between 24 and 35 degrees. We define light crude oil as crude oil with API gravity higher than 35 degrees.
77
The table below summarizes certain market indicators relating to our operating results as reported by Platts.
|
|
Year Ended December 31,
|
|||||||||||
|
|
2018
|
2017
|
2016
|
|||||||||
|
(dollars per barrel, except as noted)
|
||||||||||||
|
Dated Brent crude oil
|
$
|
71.34
|
|
$
|
54.18
|
|
$
|
43.91
|
|
|||
|
West Texas Intermediate (WTI) crude oil
|
$
|
65.20
|
|
$
|
50.79
|
|
$
|
43.34
|
|
|||
|
Light Louisiana Sweet (LLS) crude oil
|
$
|
70.23
|
|
$
|
54.02
|
|
$
|
45.03
|
|
|||
|
Alaska North Slope (ANS) crude oil
|
$
|
71.54
|
|
$
|
54.43
|
|
$
|
43.67
|
|
|||
|
Crack Spreads
|
||||||||||||
|
Dated Brent (NYH) 2-1-1
|
$
|
13.17
|
|
$
|
14.74
|
|
$
|
13.49
|
|
|||
|
WTI (Chicago) 4-3-1
|
$
|
14.84
|
|
$
|
15.88
|
|
$
|
12.38
|
|
|||
|
LLS (Gulf Coast) 2-1-1
|
$
|
12.30
|
|
$
|
13.57
|
|
$
|
10.75
|
|
|||
|
ANS (West Coast) 4-3-1
|
$
|
15.48
|
|
$
|
17.43
|
|
$
|
16.46
|
|
|||
|
Crude Oil Differentials
|
||||||||||||
|
Dated Brent (foreign) less WTI
|
$
|
6.14
|
|
$
|
3.39
|
|
$
|
0.56
|
|
|||
|
Dated Brent less Maya (heavy, sour)
|
$
|
8.70
|
|
$
|
7.16
|
|
$
|
7.36
|
|
|||
|
Dated Brent less WTS (sour)
|
$
|
13.90
|
|
$
|
4.37
|
|
$
|
1.42
|
|
|||
|
Dated Brent less ASCI (sour)
|
$
|
4.64
|
|
$
|
3.66
|
|
$
|
3.92
|
|
|||
|
WTI less WCS (heavy, sour)
|
$
|
26.93
|
|
$
|
12.24
|
|
$
|
12.57
|
|
|||
|
WTI less Bakken (light, sweet)
|
$
|
2.86
|
|
$
|
(0.26
|
)
|
$
|
1.32
|
|
|||
|
WTI less Syncrude (light, sweet)
|
$
|
6.84
|
|
$
|
(1.74
|
)
|
$
|
(2.01
|
)
|
|||
|
WTI less LLS (light, sweet)
|
$
|
(5.03
|
)
|
$
|
(3.23
|
)
|
$
|
(1.69
|
)
|
|||
|
WTI less ANS (light, sweet)
|
$
|
(6.34
|
)
|
$
|
(3.63
|
)
|
$
|
(0.33
|
)
|
|||
|
Natural gas (dollars per MMBTU)
|
$
|
3.07
|
|
$
|
3.02
|
|
$
|
2.55
|
|
|||
2018
Compared to
2017
Overview—
Net income for PBF Energy was
$175.3 million
for the year ended
December 31, 2018
compared to net income of
$483.4 million
for the year ended
December 31, 2017
. PBF LLC net income was
$180.1 million
for the year ended
December 31, 2018
compared to net income of
$551.2 million
for the year ended
December 31, 2017
. Net income attributable to PBF Energy stockholders was
$128.3 million
, or
$1.10
per diluted share, for the year ended
December 31, 2018
(
$1.10
per share on a fully-exchanged, fully-diluted basis based on adjusted fully-converted net income, or
$3.26
per share on a fully-exchanged, fully-diluted basis based on adjusted fully-converted net income excluding special items, as described below in Non-GAAP Financial Measures) compared to net income attributable to PBF Energy stockholders of
$415.5 million
, or
$3.73
per diluted share, for the year ended
December 31, 2017
(
$3.73
per share on a fully-exchanged, fully-diluted basis based on adjusted fully-converted net income, or
$1.14
per share on a fully-exchanged, fully-diluted basis based on adjusted fully-converted net income excluding special items, as described below in Non-GAAP Financial Measures). The net income attributable to PBF Energy stockholders represents PBF Energy’s equity interest in PBF LLC’s pre-tax income, less applicable income tax expense. PBF Energy’s weighted-average equity interest in PBF LLC was
98.3%
and
96.6%
for the years ended
December 31, 2018
and
2017
, respectively.
Our results for the year ended
December 31, 2018
were negatively impacted by special items consisting of a non-cash, pre-tax LCM inventory adjustment of approximately
$351.3 million
, or
$259.9 million
net of tax, and the early return of certain leased railcars, resulting in a pre-tax charge of
$52.3 million
, or
$38.7 million
net of tax. These unfavorable impacts were partially offset by special items related to a pre-tax benefit associated with the change in the Tax Receivable Agreement liability of
$13.9 million
, or
$10.3 million
net of tax, and a pre-tax gain on the Torrance land sale of
$43.8 million
, or
$32.4 million
net of tax. Our results for the year ended
December 31, 2017
were positively impacted by special items consisting of a non-cash, pre-tax LCM inventory adjustment of approximately
$295.5 million
, or
$178.5 million
net of tax, and a pre-tax benefit of $250.9 million, or $151.5 million net of tax related to the change in our Tax Receivable Agreement liability. These favorable impacts were partially offset by special items related to pre-tax debt extinguishment costs of $25.5 million, or $15.4 million net of tax, related to the redemption of the 2020 Senior Secured Notes and the enactment of the TCJA resulting in a net tax expense of $20.2 million associated with the remeasurement of the Tax Receivable Agreement associated deferred tax assets and related reduction of our deferred tax liabilities.
78
Excluding the impact of these special items, our results were positively impacted by favorable movements in crude differentials, higher throughput volumes and barrels sold across the majority of our refineries and reduced regulatory compliance costs, offset by lower crack spreads realized at the majority of our refineries, which were favorably impacted in the prior year by the hurricane-related effect on refining margins due to tightening product inventories, specifically distillates. Our results for the year ended
December 31, 2018
were negatively impacted by higher general and administrative costs and increased depreciation and amortization expense.
Revenues—
Revenues totaled
$27.2 billion
for the year ended
December 31, 2018
compared to
$21.8 billion
for the year ended
December 31, 2017
,
an increase
of approximately
$5.4 billion
or
24.8%
. Revenues per barrel were
$77.08
and
$64.90
for the years ended
December 31, 2018
and
2017
, respectively, an increase of
18.8%
directly related to higher hydrocarbon commodity prices. For the year ended
December 31, 2018
, the total throughput rates at our East Coast, Mid-Continent, Gulf Coast and West Coast refineries averaged approximately
344,700
bpd,
149,600
bpd,
185,600
bpd and
169,800
bpd, respectively. For the year ended
December 31, 2017
, the total throughput rates at our East Coast, Mid-Continent, Gulf Coast and West Coast refineries averaged approximately
338,200
bpd,
145,200
bpd,
184,500
bpd and
139,500
bpd, respectively. The throughput rates at our East Coast, Mid-Continent and West Coast refineries were higher in the year ended
December 31, 2018
compared to the same period in 2017. Throughput rates at our Gulf Coast refinery was in line with the prior year despite planned downtimes during the first half of 2018. The throughput rates at our East Coast refineries increased due to planned downtime at our Delaware City refinery during 2017, whereas our Mid-Continent refinery ran at modestly higher rates during the year, taking advantage of a relatively strong margin environment. The throughput rates at our West Coast refinery increased due to planned downtime in the prior year as part of the first significant turnaround of the refinery under our ownership and improved refinery performance experienced in the current year. For the year ended
December 31, 2018
, the total refined product barrels sold at our East Coast, Mid-Continent, Gulf Coast and West Coast refineries averaged approximately
372,700
bpd,
161,800
bpd,
233,700
bpd and
198,100
bpd, respectively. For the year ended
December 31, 2017
, the total refined product barrels sold at our East Coast, Mid-Continent, Gulf Coast and West Coast refineries averaged approximately
363,800
bpd,
160,400
bpd,
227,200
bpd and
168,300
bpd, respectively. Total refined product barrels sold were higher than throughput rates, reflecting sales from inventory as well as sales and purchases of refined products outside the refineries.
Consolidated Gross Margin—
Consolidated gross margin totaled
$602.6 million
for the year ended
December 31, 2018
, compared to
$960.6 million
for the year ended
December 31, 2017
,
a decrease
of
$358.0 million
. Gross refining margin (as described below in Non-GAAP Financial Measures) totaled
$2,419.4 million
, or
$7.79
per barrel of throughput, for the year ended
December 31, 2018
compared to
$2,676.7 million
, or
$9.08
per barrel of throughput, for the year ended
December 31, 2017
, a decrease of approximately
$257.3 million
. Gross refining margin excluding special items totaled
$2,823.0 million
, or
$9.09
per barrel of throughput, for the year ended December 31, 2018 compared to
$2,381.1 million
, or
$8.08
per barrel of throughput, for the year ended December 31, 2017, an increase of
$441.9 million
.
Consolidated gross margin and gross refining margin were negatively impacted in the current year by special items. For the year ended
December 31, 2018
, special items impacting our margin calculations included a non-cash LCM inventory adjustment of approximately
$351.3 million
on a net basis, resulting from a decrease in crude oil and refined product prices in comparison to the prices at the end of 2017 and a
$52.3 million
charge resulting from costs associated with the early return of certain leased railcars. The non-cash LCM inventory adjustment increased consolidated gross margin and gross refining margin by approximately
$295.5 million
in the year ended
December 31, 2017
. Excluding the impact of special items, consolidated gross margin and gross refining margin increased due to generally favorable movements in crude differentials and higher throughput volumes and barrels sold across all of our refineries.
Additionally, our results continue to be impacted by significant costs to comply with RFS, although at a reduced level from the prior year. Total RFS costs were
$143.9 million
for the year ended
December 31, 2018
in comparison to
$293.7 million
for the year ended
December 31, 2017
.
Average industry margins were weaker during the year ended December 31, 2018 in comparison to the prior year, primarily as a result of 2017 being favorably impacted by the hurricane-related effect on refining margins in the second half of the year due to tightening product inventories, specifically distillates. Crude oil differentials were generally favorable in comparison to the prior year, with beneficial differentials experienced across the East Coast and Mid-Continent, partially offset by marginally unfavorable impacts related to our refinery specific crude slate in the Gulf and West Coast.
On the East Coast, the Dated Brent (NYH) 2-1-1 industry crack spread was approximately
$13.17
per barrel, or
10.7%
lower, in the year ended
December 31, 2018
, as compared to
$14.74
per barrel in the same period in
2017
. Our margins were positively impacted from our refinery specific slate on the East Coast by an improving Dated Brent/WTI differential, which increased
$2.75
per barrel in comparison to the prior year and increases in the Dated Brent/Maya and WTI/Bakken differentials, which increased
$1.54
per barrel and
$3.12
per barrel, respectively, in comparison to the prior
79
year. In addition, the WTI/WCS differential widened significantly to
$26.93
per barrel in 2018 compared to
$12.24
in 2017, which favorably impacted our cost of heavy Canadian crude.
Across the Mid-Continent, the WTI (Chicago) 4-3-1 industry crack spread was
$14.84
per barrel, or
6.5%
lower, in the year ended
December 31, 2018
, as compared to
$15.88
per barrel in the same period in
2017
. Our margins were positively impacted from our refinery specific slate in the Mid-Continent by an improving WTI/Bakken differential, which was approximately
$2.86
per barrel in the year ended
December 31, 2018
, as compared to a premium of
$0.26
per barrel in the same period in
2017
. Additionally, the WTI/Syncrude differential averaged a discount of
$6.84
per barrel for the year ended
December 31, 2018
as compared to a premium of
$1.74
per barrel in the same period in
2017
.
In the Gulf Coast, the LLS (Gulf Coast) 2-1-1 industry crack spread was
$12.30
per barrel, or
9.4%
lower, in the year ended
December 31, 2018
as compared to
$13.57
per barrel in the same period in
2017
. Margins in the Gulf Coast were negatively impacted from our refinery specific slate by a declining WTI/LLS differential, which averaged a premium of
$5.03
for the year ended
December 31, 2018
as compared to an average premium of
$3.23
experienced in the prior year.
On the West Coast, the ANS (West Coast) 4-3-1 industry crack spread was
$15.48
per barrel, or
11.2%
lower, in the year ended
December 31, 2018
as compared to
$17.43
per barrel in the same period in
2017
. Margins on the West Coast were negatively impacted from our refinery specific slate by a declining WTI/ANS differential, which averaged a premium of
$6.34
for the year ended
December 31, 2018
as compared to an average premium of
$3.63
experienced in the prior year.
Favorable movements in these benchmark crude differentials typically result in lower crude costs and positively impact our earnings, while reductions in these benchmark crude differentials typically result in higher crude costs and negatively impact our earnings.
Operating Expenses
— Operating expenses totaled
$1,721.0 million
for the year ended
December 31, 2018
compared to
$1,684.4 million
for the year ended
December 31, 2017
, an
increase
of approximately
$36.5 million
, or
2.2%
. Of the total
$1,721.0 million
of operating expenses for the year ended
December 31, 2018
,
$1,654.7 million
, or
$5.34
per barrel of throughput, related to expenses incurred by the Refining segment, while the remaining approximately
$66.2 million
related to expenses incurred by the Logistics segment (
$1,626.4 million
or
$5.52
per barrel of throughput, and
$58.0 million
of operating expenses for the year ended
December 31, 2017
related to the Refining and Logistics segment, respectively). Decreases in operating expenses on a per barrel basis were driven by increased system reliability and our focused efforts on reducing operating costs. The increase in operating expenses overall in comparison to the prior year was mainly attributable to higher energy and utility costs as a result of higher natural gas pricing and overall increased throughput. This increase was slightly offset by a decrease in supplies and materials due to our Torrance refinery experiencing higher costs in 2017 related to its turnaround. Operating expenses related to our Logistics segment were generally consistent with the prior year and consist of costs related to the operation and maintenance of PBFX’s assets.
General and Administrative Expenses
— General and administrative expenses totaled
$277.0 million
for the year ended
December 31, 2018
, compared to
$214.5 million
for the year ended
December 31, 2017
,
an increase
of
$62.4 million
or
29.1%
. The increase in general and administrative expenses for the year ended
December 31, 2018
in comparison to the year ended
December 31, 2017
primarily related to higher employee-related expenses, including incentive compensation and retirement benefits. Our general and administrative expenses are comprised of the personnel, facilities and other infrastructure costs necessary to support our refineries and related logistical assets.
(Gain) Loss on Sale of Assets
— There was a net gain of
$43.1 million
for the year ended
December 31, 2018
mainly attributable to a
$43.8 million
gain related to the Torrance land sale. There was a loss of
$1.5 million
for the year ended
December 31, 2017
relating to the sale of non-operating refining assets.
Depreciation and Amortization Expense
— Depreciation and amortization expense totaled
$369.8 million
for the year ended
December 31, 2018
(including
$359.1 million
recorded within Cost of sales) compared to
$291.0 million
for the year ended
December 31, 2017
(including
$278.0 million
recorded within Cost of sales),
an increase
of
$78.8 million
. The increase was a result of additional depreciation expense associated with a general increase in our fixed asset base due to capital projects and turnarounds completed during 2018 and 2017, which included the first significant Torrance refinery turnaround under our ownership.
Change in Tax Receivable Agreement Liability
—
Change in the Tax Receivable Agreement liability for the year ended
December 31, 2018
represented a gain of
$13.9 million
compared to a gain of
$250.9 million
for the year ended
December 31, 2017
.
Change in Fair Value of Catalyst Leases
— Change in the fair value of catalyst leases represented a gain of
$5.6 million
for the year ended
December 31, 2018
, compared to a loss of
$2.2 million
for the year ended
December 31, 2017
.
80
These gains and losses relate to the change in value of the precious metals underlying the sale and leaseback of our refineries’ precious metal catalysts, which we are obligated to return or repurchase at fair market value on the lease termination dates.
Debt extinguishment costs—
Debt extinguishment costs of
$25.5 million
incurred for the year ended
December 31, 2017
relate to nonrecurring charges associated with debt refinancing activity calculated based on the difference between the carrying value of the 2020 Senior Secured Notes on the date that they were reacquired and the amount for which they were reacquired. There were no such costs incurred in the year ended
December 31, 2018
.
Interest Expense, net—
PBF Energy interest expense totaled
$169.9 million
for the year ended
December 31, 2018
, compared to
$154.4 million
for the year ended
December 31, 2017
,
an increase
of
$15.5 million
. This net increase is mainly attributable to the interest costs associated with the issuance of the new PBFX 2023 Senior Notes in October 2017 and higher borrowings under the PBFX Revolving Credit Facility. Interest expense includes interest on long-term debt including the PBFX credit facilities, costs related to the sale and leaseback of our precious metals catalyst, financing costs associated with the Inventory Intermediation Agreements with J. Aron, letter of credit fees associated with the purchase of certain crude oils, the amortization of deferred financing costs and the amortization of discounted liabilities. PBF LLC interest expense totaled
$178.4 million
and
$162.4 million
for the year ended
December 31, 2018
and
December 31, 2017
, respectively (inclusive of $8.5 million and $8.0 million, respectively, of incremental interest expense on the affiliate note payable with PBF Energy that eliminates in consolidation).
Income Tax Expense—
PBF LLC is organized as a limited liability company and PBFX is an MLP, both of which are treated as “flow-through” entities for federal income tax purposes and therefore are not subject to income tax. However, two subsidiaries of Chalmette Refining and our Canadian subsidiary are treated as C-Corporations for income tax purposes and may incur income taxes with respect to their earnings, as applicable. The members of PBF LLC are required to include their proportionate share of PBF LLC’s taxable income or loss, which includes PBF LLC’s allocable share of PBFX’s pre-tax income or loss, on their respective tax returns. PBF LLC generally makes distributions to its members, per the terms of PBF LLC’s amended and restated limited liability company agreement, related to such taxes on a pro-rata basis. PBF Energy recognizes an income tax expense or benefit in our consolidated financial statements based on PBF Energy’s allocable share of PBF LLC’s pre-tax income or loss, which was approximately
98.3%
and
96.6%
, on a weighted-average basis for the years ended
December 31, 2018
and
2017
, respectively. PBF Energy’s consolidated financial statements do not reflect any benefit or provision for income taxes on the pre-tax income or loss attributable to the noncontrolling interests in PBF LLC or PBFX (although, as described above, PBF LLC must make tax distributions to all its members on a pro-rata basis). PBF Energy’s effective tax rate, excluding the impact of noncontrolling interest, for the years ended
December 31, 2018
and
2017
was
16.0%
and
39.5%
, respectively, reflecting discrete tax items primarily related to return to provision adjustments pertaining to equity compensation and the impact of the TCJA which, among other things, reduced the U.S federal corporate tax rate from 35% to 21%.
Noncontrolling Interest—
PBF Energy is the sole managing member of, and has a controlling interest in, PBF LLC. As the sole managing member of PBF LLC, PBF Energy operates and controls all of the business and affairs of PBF LLC and its subsidiaries. PBF Energy consolidates the financial results of PBF LLC and its subsidiaries, including PBFX. With respect to the consolidation of PBF LLC, the Company records a noncontrolling interest for the economic interest in PBF LLC held by members other than PBF Energy, and with respect to the consolidation of PBFX, the Company records a noncontrolling interest for the economic interests in PBFX held by the public unitholders of PBFX, and with respect to the consolidation of PBF Holding, the Company records a 20% noncontrolling interest for the ownership interests in two subsidiaries of Chalmette Refining held by a third-party. The total noncontrolling interest on the consolidated statements of operations represents the portion of the Company’s earnings or loss attributable to the economic interests held by members of PBF LLC other than PBF Energy, by the public common unitholders of PBFX and by the third-party stockholder of certain of Chalmette Refining’s subsidiaries. The total noncontrolling interest on the consolidated balance sheet represents the portion of the Company’s net assets attributable to the economic interests held by the members of PBF LLC other than PBF Energy, by the public common unitholders of PBFX and by the third-party stockholders of the two Chalmette Refining subsidiaries. PBF Energy’s weighted-average equity noncontrolling interest ownership percentage in PBF LLC for the years ended
December 31, 2018
and
2017
was approximately
1.7%
and
3.4%
, respectively. The carrying amount of the noncontrolling interest on our consolidated balance sheet attributable to the noncontrolling interest is not equal to the noncontrolling interest ownership percentage due to the effect of income taxes and related agreements that pertain solely to PBF Energy.
81
2017
Compared to
2016
Overview— PBF Energy net income was
$483.4 million
for the year ended
December 31, 2017
compared to net income of
$225.5 million
for the year ended
December 31, 2016
. PBF LLC net income was
$551.2 million
for the year ended
December 31, 2017
compared to net income of
$321.0 million
for the year ended
December 31, 2016
. Net income attributable to PBF Energy stockholders was
$415.5 million
, or
$3.73
per diluted share, for the year ended
December 31, 2017
(
$3.73
per share on a fully-exchanged, fully-diluted basis based on adjusted fully-converted net income, or net income of
$1.14
per share on a fully-exchanged, fully- diluted basis based on adjusted fully-converted net income excluding special items, as described below in Non-GAAP Financial Measures) compared to net income attributable to PBF Energy stockholders of
$170.8 million
, or
$1.74
per diluted share, for the year ended
December 31, 2016
(
$1.74
per share on a fully-exchanged, fully-diluted basis based on adjusted fully-converted net income, or a net loss of
$1.41
per share on a fully-exchanged, fully-diluted basis based on adjusted fully-converted net loss excluding special items, as described below in Non-GAAP Financial Measures). The net income or loss attributable to PBF Energy represents PBF Energy’s equity interest in PBF LLC’s pre-tax income (loss), less applicable income tax expense. PBF Energy’s weighted-average equity interest in PBF LLC was
96.6%
and
95.3%
for the years ended
December 31, 2017
and
2016
, respectively.
Our results for the year ended
December 31, 2017
were positively impacted by special items including a non-cash pre-tax LCM inventory adjustment of approximately
$295.5
million, or
$178.5
million net of tax, and a pre-tax benefit of $250.9 million, or $151.5 million net of tax, related to the change in PBF Energy Tax Receivable Agreement liability. Our results for the year ended
December 31, 2016
were positively impacted by special items consisting of a pre-tax LCM inventory adjustment of approximately
$521.3
million, or
$317.7
million net of tax, and a pre-tax benefit of
$12.9
million, or
$7.8
million net of tax related to the change in PBF Energy Tax Receivable Agreement liability. Our results for the year ended
December 31, 2017
were also impacted by special items related to pre-tax debt extinguishment costs of $25.5 million, or $15.4 million net of tax related to the redemption of the 2020 Senior Secured Notes and the enactment of the TCJA resulting in a net tax expense of
$193.5
million associated with the remeasurement of Tax Receivable Agreement associated deferred tax assets and a net tax benefit of
$173.3
million for the reduction of our deferred tax liabilities.
Excluding the impact of these special items, our results were positively impacted by higher throughput volumes at the majority of our refineries and higher crack spreads realized at each of our refineries, which were impacted by the hurricane-related reduction in refining throughput in the Gulf Coast region and tightening product inventories, specifically distillates, in the second half of the year as well as lower costs to comply with the RFS. Notably, we benefited from the improved operating performance of our Chalmette and Torrance refineries.
Revenues—
Revenues totaled
$21.8 billion
for the year ended
December 31, 2017
compared to
$15.9 billion
for the year ended
December 31, 2016
,
an increase
of approximately
$5.9 billion
, or
36.8%
. Revenues per barrel were
$64.90
and
$59.77
for the years ended
December 31, 2017
and
2016
, respectively, an increase of
8.6%
directly related to higher hydrocarbon commodity prices. For the year ended
December 31, 2017
, the total throughput rates at our East Coast, Mid-Continent, Gulf Coast and West Coast refineries averaged approximately
338,200
bpd,
145,200
bpd,
184,500
bpd and
139,500
bpd, respectively. For the year ended
December 31, 2016
, the total throughput rates at our East Coast, Mid-Continent and Gulf Coast refineries averaged approximately
327,000
bpd,
159,100
bpd and
169,300
bpd, respectively. For the period from its acquisition on July 1, 2016 through
December 31, 2016
, our West Coast refinery’s throughput averaged 143,900 bpd. The throughput rates at our East Coast and Gulf Coast refineries were higher in
2017
compared to
2016
. Our West Coast refinery was not acquired until the beginning of the third quarter of 2016. The decrease in throughput rates at our West Coast refinery in 2017 compared to 2016 is primarily due to planned downtime at our Torrance refinery for its first significant turnaround under our ownership, which was completed early in the third quarter of 2017. However, our West Coast refinery throughput averaged
164,000
bpd for the last six months of the year upon completion of the turnaround. For the year ended
December 31, 2017
, the total refined product barrels sold at our East Coast, Mid-Continent, Gulf Coast and West Coast refineries averaged approximately
363,800
bpd,
160,400
bpd,
227,200
bpd and
168,300
bpd, respectively. For the year ended
December 31, 2016
, the total refined product barrels sold at our East Coast, Mid-Continent and Gulf Coast refineries averaged approximately
364,100
bpd,
171,800
bpd and
206,400
bpd, respectively. For the period from its acquisition on July 1, 2016 through December 31, 2016, the total refined product barrels sold at our West Coast refinery averaged
179,200
bpd. Total refined product barrels sold were higher than throughput rates, reflecting sales from inventory as well as sales and purchases of refined products outside the refineries
.
Consolidated Gross Margin—
Consolidated gross margin totaled
$960.6 million
for the year ended
December 31, 2017
, compared to
$683.0 million
for the year ended
December 31, 2016
,
an increase
of
$277.6 million
. Gross refining margin (as defined below in Non-GAAP Financial Measures) totaled
$2,676.7 million
, or
$9.08
per barrel of throughput (
$2,381.1 million
or
$8.08
per barrel of throughput excluding the impact of special items), for the year ended
December 31, 2017
compared to
$2,143.4 million
, or
$8.05
per barrel of throughput (
$1,622.1 million
or
$6.09
per barrel of throughput
82
excluding the impact of special items), for the year ended
December 31, 2016
, an increase of approximately
$533.2 million
or an increase of approximately
$759.0 million
excluding special items.
Consolidated gross margin and gross refining margin increased due to improved crack spreads across each of our refineries, reduced costs to comply with the RFS and positive margin contributions from our Torrance refinery following its first significant turnaround under our ownership, which was completed early in the third quarter of 2017. Costs to comply with our obligation under the RFS totaled
$255.2 million
for the year ended December 31, 2017 (excluding our West Coast refinery, whose cost to comply with RFS totaled
$38.5 million
for the year ended December 31, 2017) compared to
$325.3 million
for the year ended December 31, 2016 (excluding our West Coast refinery, whose costs to comply with RFS totaled
$22.2 million
for the year ended December 31, 2016). In addition, gross margin and gross refining margin were positively impacted by a non-cash LCM inventory adjustment of approximately
$295.5 million
on a net basis resulting from an increase in crude oil and refined product prices in comparison to the prices at the end of 2016. The non-cash LCM inventory adjustment increased consolidated gross margin and gross refining margin by approximately
$521.3 million
in the year ended
December 31, 2016
.
Average industry refining margins in the Mid-Continent were stronger during the year ended
December 31, 2017
, as compared to the same period in
2016
. The WTI (Chicago) 4-3-1 industry crack spread was
$15.88
per barrel or
28.3%
higher, in the year ended
December 31, 2017
, as compared to
$12.38
per barrel in the same period in
2016
. Our margins were unfavorably impacted by our refinery specific crude slate in the Mid-Continent which was impacted by a declining WTI/Bakken differential partially offset by an improving WTI/Syncrude differential, which averaged a premium of
$1.74
per barrel for the year ended
December 31, 2017
as compared to a premium of
$2.01
per barrel in the same period in
2016
.
On the East Coast, the Dated Brent (NYH) 2-1-1 industry crack spread was approximately
$14.74
per barrel, or
9.3%
higher, in the year ended
December 31, 2017
as compared to
$13.49
per barrel in the same period in
2016
. The Dated Brent/WTI differential was
$2.83
higher in the year ended
December 31, 2017
, as compared to the same period in
2016
, partially offset by year over year decreases in the Dated Brent/Maya differential and WTI/Bakken differential of
$0.20
and
$1.58
, respectively.
Gulf Coast industry refining margins improved during the year ended
December 31, 2017
as compared to the same period in
2016
. The LLS (Gulf Coast) 2-1-1 industry crack spread was
$13.57
per barrel, or
26.2%
higher, in the year ended
December 31, 2017
as compared to
$10.75
per barrel in the same period in
2016
. Crude differentials weakened with the WTI/LLS differential averaging a premium of
$3.23
per barrel during the year ended
December 31, 2017
as compared to a premium of
$1.69
per barrel in the same period of
2016
.
Additionally, we benefited from improvements in the West Coast industry refining margins during the year ended
December 31, 2017
as compared to the same period in
2016
. The ANS (West Coast) 4-3-1 industry crack spread was
$17.43
per barrel, or
5.9%
higher, in the year ended
December 31, 2017
as compared to
$16.46
per barrel in the same period in
2016
. Partially offsetting the improved crack spreads, crude differentials weakened with the WTI/ANS differential averaging a premium of
$3.63
per barrel during the year ended
December 31, 2017
as compared to a premium of
$0.33
per barrel in the same period of
2016
. As the Torrance refinery was not acquired until the beginning of the third quarter of
2016
, we did not benefit from the contribution of this refinery for the full twelve months of the prior year.
Favorable movements in these benchmark crude differentials typically result in lower crude costs and positively impact our earnings, while reductions in these benchmark crude differentials typically result in higher crude costs and negatively impact our earnings.
Operating Expenses
— Operating expenses totaled
$1,684.4 million
for the year ended
December 31, 2017
compared to
$1,422.8 million
for the year ended
December 31, 2016
, an
increase
of
$261.7 million
, or
18.4%
. Of the total
$1,684.4 million
of operating expenses, approximately
$1,626.4 million
, or
$5.52
per barrel of throughput, related to expenses incurred by the Refining segment, while the remaining
$58.0 million
related to expenses incurred by the Logistics segment (
$1,390.1 million
or
$5.22
per barrel, and $32.6 million of operating expenses for the year ended
December 31, 2016
related to the Refining and Logistics segment respectively). The
increase
in operating expenses was mainly attributable to the operating expenses associated with our Torrance refinery and related logistics assets, which were included in our results for the year ended
December 31, 2017
as compared with only six months of 2016. For the year ended
December 31, 2017
the Torrance refinery and related logistics assets incurred operating expenses of approximately
$475.9 million
in comparison to
$250.5 million
for the period from its acquisition on July 1, 2016 to December 31, 2016. Total operating expenses at our refineries, excluding our Torrance refinery, increased slightly for the year ended
December 31, 2017
, primarily due to higher energy costs and maintenance costs. The increase in energy costs was mainly due to higher natural gas prices while the increase in maintenance costs was mainly due to timing of repairs. The operating expenses related to the Logistics segment consists of costs related to the operation and maintenance of PBFX’s assets, which were higher
83
primarily as a result of current period expenses related to certain assets including the Toledo Products Terminal and Torrance Valley Pipeline, which were not in service for the full comparable period in
2016
, and higher operating expenses associated with the East Coast Terminals.
General and Administrative Expenses—
General and administrative expenses totaled
$214.5 million
for the year ended
December 31, 2017
, compared to
$166.3 million
for the year ended
December 31, 2016
,
an increase
of
$48.2 million
or
29.0%
. The increase in general and administrative expenses primarily relates to increased employee related expenses of
$58.2 million
driven by higher incentive compensation costs in the year ended
December 31, 2017
as compared to the same period in
2016
, attributable to higher average employee headcount and better operating performance. These increases were partially offset by lower costs associated with acquisition and integration related activities which were approximately
$8.6 million
lower in the year ended
December 31, 2017
as compared to the same period in
2016
. Our general and administrative expenses are comprised of the personnel, facilities and other infrastructure costs necessary to support our refineries and related logistical assets.
Loss (gain) on Sale of Assets
— There was a loss of
$1.5 million
on sale of assets for the year ended
December 31, 2017
relating to non-operating refinery assets. There was a loss of
$11.4 million
for the year ended
December 31, 2016
relating to the sale of non-operating refining assets.
Depreciation and Amortization Expense
— Depreciation and amortization expense totaled
$291.0 million
for the year ended
December 31, 2017
(including
$278.0 million
recorded within Cost of sales) compared to
$222.2 million
for the year ended
December 31, 2016
(including
$216.3 million
recorded within Cost of sales), an
increase
of
$68.8 million
. The
increase
was a result of additional depreciation expense associated with the assets acquired in the Torrance Acquisition and a general increase in our fixed asset base due to capital projects and turnarounds completed during
2017
and
2016
.
Change in Tax Receivable Agreement Liability
—
Change in the Tax Receivable Agreement liability for the year ended
December 31, 2017
represented a gain of
$250.9 million
as compared to a gain of
$12.9 million
for the year ended
December 31, 2016
.This gain was primarily a result of the TCJA enacted in December 2017 and related remeasurement of the liability based on the decrease in the federal tax rate from 35% to 21%.
Change in Fair Value of Catalyst Leases
— Change in the fair value of catalyst leases represented a loss of
$2.2 million
for the year ended
December 31, 2017
, compared to a gain of
$1.4 million
for the year ended
December 31, 2016
. These gains and losses relate to the change in value of the precious metals underlying the sale and leaseback of our refineries’ precious metal catalysts, which we are obligated to return or repurchase at fair market value on the lease termination dates.
Debt extinguishment costs—
Debt extinguishment costs of
$25.5 million
incurred in the year ended
December 31, 2017
relate to nonrecurring charges associated with debt refinancing activity calculated based on the difference between the carrying value of the 2020 Senior Secured Notes on the date that they were reacquired and the amount for which they were reacquired. There were no such costs in the same period of
2016
.
Interest Expense, net—
Interest expense totaled
$154.4 million
for the year ended
December 31, 2017
, compared to
$150.0 million
for the year ended
December 31, 2016
,
an increase
of
$4.4 million
. This net increase is attributable to higher average borrowings under our August 2014 Revolving Credit Agreement partially offset by lower interest expense on a portion of our senior notes that were refinanced in May 2017 (see “Note 9 - Credit Facility and Debt” of our Notes to the Consolidated Financial Statements, for additional details). Interest expense includes interest on long-term debt including the PBFX credit facilities, costs related to the sale and leaseback of our precious metals catalyst, financing costs associated with the Inventory Intermediation Agreements with J. Aron, letter of credit fees associated with the purchase of certain crude oils, and the amortization of deferred financing costs. PBF LLC interest expense totaled
$162.4 million
and
$155.8 million
for the years ended
December 31, 2017
and
2016
, respectively (inclusive of $8.0 million and $5.8 million, respectively, of incremental interest expense on the affiliate note payable with PBF Energy that eliminates in consolidation at the PBF Energy level).
Income Tax Expense—
PBF LLC is organized as a limited liability company and PBFX is an MLP, both of which are treated as “flow-through” entities for federal income tax purposes and therefore are not subject to income tax. However, two subsidiaries of Chalmette Refining and our Canadian subsidiary are treated as C-Corporations for income tax purposes and may incur income taxes with respect to their earnings, as applicable. The members of PBF LLC are required to include their proportionate share of PBF LLC’s taxable income or loss, which includes PBF LLC’s allocable share of PBFX’s pre-tax income or loss, on their respective tax returns. PBF LLC generally makes distributions to its members, per the terms of PBF LLC’s amended and restated limited liability company agreement, related to such taxes on a pro-rata basis. PBF Energy recognizes an income tax expense or benefit in our consolidated financial statements based on PBF Energy’s allocable share of PBF LLC’s pre-tax income or loss, which was approximately
96.6%
and
95.3%
, on a weighted-average
84
basis for the years ended
December 31, 2017
and
2016
, respectively. PBF Energy’s consolidated financial statements do not reflect any benefit or provision for income taxes on the pre-tax income or loss attributable to the noncontrolling interests in PBF LLC or PBFX (although, as described above, PBF LLC must make tax distributions to all its members on a pro-rata basis). PBF Energy’s effective tax rate, including the impact of noncontrolling interest, for the years ended
December 31, 2017
and
2016
was
39.5%
and
37.9%
, respectively, reflecting tax adjustments for discrete items and the impact of the TCJA which, among other things, reduced the U.S. federal corporate tax rate from 35% percent to 21% percent.
Noncontrolling Interests—
PBF Energy is the sole managing member of, and has a controlling interest in, PBF LLC. As the sole managing member of PBF LLC, PBF Energy operates and controls all of the business and affairs of PBF LLC and its subsidiaries. PBF Energy consolidates the financial results of PBF LLC and its subsidiaries, including PBFX. With respect to the consolidation of PBF LLC, the Company records a noncontrolling interest for the economic interest in PBF LLC held by members other than PBF Energy, and with respect to the consolidation of PBFX, the Company records a noncontrolling interest for the economic interests in PBFX held by the public unitholders of PBFX, and with respect to the consolidation of PBF Holding, the Company records a
20%
noncontrolling interest for the ownership interests in two subsidiaries of Chalmette Refining held by a third-party. The total noncontrolling interest on the consolidated statement of operations represents the portion of the Company’s earnings or loss attributable to the economic interests held by members of PBF Energy other than PBF Energy and by the public common unitholders of PBFX and by the third-party holder of certain of Chalmette Refining’s subsidiaries. The total noncontrolling interest on the consolidated balance sheet represents the portion of the Company’s net assets attributable to the economic interests held by the members of PBF LLC other than PBF Energy, by the public common unitholders of PBFX and by the third-party stockholder of T&M Terminal Company and Collins Pipeline Company. PBF Energy’s weighted-average equity noncontrolling interest ownership percentage in PBF LLC for the years ended
December 31, 2017
and
2016
was approximately
3.4%
and
4.7%
, respectively. The carrying amount of the noncontrolling interest on our consolidated balance sheet attributable to the noncontrolling interest is not equal to the noncontrolling interest ownership percentage due to the effect of income taxes and related agreements that pertain solely to PBF Energy.
Non-GAAP Financial Measures
Management uses certain financial measures to evaluate our operating performance that are calculated and presented on the basis of methodologies other than in accordance with GAAP (“Non-GAAP”). These measures should not be considered a substitute for, or superior to, measures of financial performance prepared in accordance with GAAP, and our calculations thereof may not be comparable to similarly entitled measures reported by other companies. Such Non-GAAP financial measures are presented only in the context of PBF Energy’s results and are not presented or discussed in respect to PBF LLC.
Special Items
The Non-GAAP measures presented include Adjusted Fully-Converted Net Income excluding special items, EBITDA excluding special items and gross refining margin excluding special items. Special items presented for the year ended December 31, 2018 relate to an LCM inventory adjustment, changes in the Tax Receivable Agreement liability, gain on the sale of assets related to the Torrance land sale and charges associated with the early return of certain leased railcars. Special items for the year ended December 31, 2017 relate to an LCM inventory adjustment, changes in the Tax Receivable Agreement liability, debt extinguishment costs, a net tax benefit related to the TCJA enactment and a net tax expense associated with the remeasurement of Tax Receivable Agreement associated deferred tax assets. See “Notes to Non-GAAP Financial Measures” below for more details on all special items disclosed. Although we believe that Non-GAAP financial measures, excluding the impact of special items, provide useful supplemental information to investors regarding the results and performance of our business and allow for helpful period-over-period comparisons, such Non-GAAP measures should only be considered as a supplement to, and not as a substitute for, or superior to, the financial measures prepared in accordance with GAAP.
Adjusted Fully-Converted Net Income and Adjusted Fully-Converted Net Income (Loss) Excluding Special Items
PBF Energy utilizes results presented on an Adjusted Fully-Converted basis that reflects an assumed exchange of all PBF LLC Series A Units for shares of PBF Energy Class A common stock. In addition, we present results on an Adjusted Fully-Converted basis excluding special items as described above. We believe that these Adjusted Fully-Converted measures, when presented in conjunction with comparable GAAP measures, are useful to investors to compare PBF Energy results across different periods and to facilitate an understanding of our operating results.
85
Neither Adjusted Fully-Converted Net Income nor Adjusted Fully-Converted Net Income (Loss) excluding special items should be considered an alternative to net income presented in accordance with GAAP. Adjusted Fully-Converted Net Income and Adjusted Fully-Converted Net Income (Loss) excluding special items presented by other companies may not be comparable to our presentation, since each company may define these terms differently. The differences between Adjusted Fully-Converted and GAAP results are as follows:
|
1
|
Assumed exchange of all PBF LLC Series A Units for shares of PBF Energy Class A common stock
. As a result of the assumed exchange of all PBF LLC Series A Units, the noncontrolling interest related to these units is converted to controlling interest. Management believes that it is useful to provide the per-share effect associated with the assumed exchange of all PBF LLC Series A Units.
|
|
2
|
Income Taxes
. Prior to PBF Energy’s IPO, PBF Energy was organized as a limited liability company treated as a “flow-through” entity for income tax purposes, and even after PBF Energy’s IPO, not all of our earnings are subject to corporate-level income taxes. Adjustments have been made to the Adjusted Fully-Converted tax provisions and earnings to assume that we had adopted our post-IPO corporate tax structure for all periods presented and are taxed as a C-corporation in the U.S. at the prevailing corporate rates. These assumptions are consistent with the assumption in clause 1 above that all PBF LLC Series A Units are exchanged for shares of PBF Energy Class A common stock, as the assumed exchange would change the amount of PBF Energy’s earnings that are subject to corporate income tax.
|
86
The following table reconciles PBF Energy Adjusted Fully-Converted results with its results presented in accordance with GAAP for the years ended
December 31, 2018
,
2017
and
2016
(in thousands, except share and per share amounts):
|
|
Year Ended December 31,
|
|||||||||||
|
|
2018
|
2017
|
2016
|
|||||||||
|
Net income attributable to PBF Energy Inc. stockholders
|
$
|
128,315
|
|
$
|
415,517
|
|
$
|
170,811
|
|
|||
|
Less: Income allocated to participating securities
|
748
|
|
1,043
|
|
—
|
|
||||||
|
Income available to PBF Energy Inc. stockholders - basic
|
127,567
|
|
414,474
|
|
170,811
|
|
||||||
|
Add: Net income attributable to noncontrolling interest
(1)
|
4,668
|
|
16,746
|
|
14,903
|
|
||||||
|
Less: Income tax expense
(2)
|
(1,214
|
)
|
(6,633
|
)
|
(5,821
|
)
|
||||||
|
Adjusted fully-converted net income
|
$
|
131,021
|
|
$
|
424,587
|
|
$
|
179,893
|
|
|||
|
Special Items:
(3)
|
||||||||||||
|
Add: Non-cash LCM inventory adjustment
|
351,278
|
|
(295,532
|
)
|
(521,348
|
)
|
||||||
|
Add: Change in Tax Receivable Agreement liability
|
(13,893
|
)
|
(250,922
|
)
|
(12,908
|
)
|
||||||
|
Add: Debt extinguishment costs
|
—
|
|
25,451
|
|
—
|
|
||||||
|
Add: Net tax benefit related to the TCJA
|
—
|
|
(173,346
|
)
|
—
|
|
||||||
|
Add: Net tax expense on remeasurement of Tax Receivable Agreement associated deferred tax assets
|
—
|
|
193,499
|
|
—
|
|
||||||
|
Add: Gain on Torrance land sale
|
(43,761
|
)
|
—
|
|
—
|
|
||||||
|
Add: Early railcar return expense
|
52,313
|
|
—
|
|
—
|
|
||||||
|
Less: Recomputed income taxes on special items
|
(89,944
|
)
|
206,364
|
|
208,686
|
|
||||||
|
Adjusted fully-converted net income (loss) excluding special items
|
$
|
387,014
|
|
$
|
130,101
|
|
$
|
(145,677
|
)
|
|||
|
Weighted-average shares outstanding of PBF Energy Inc.
|
115,190,262
|
|
109,779,407
|
|
98,334,302
|
|
||||||
|
Conversion of PBF LLC Series A Units
(4)
|
1,938,089
|
|
3,823,783
|
|
4,865,133
|
|
||||||
|
Common stock equivalents
(5)
|
1,645,255
|
|
295,655
|
|
407,274
|
|
||||||
|
Fully-converted shares outstanding—diluted
|
118,773,606
|
|
113,898,845
|
|
103,606,709
|
|
||||||
|
Diluted net income per share
|
$
|
1.10
|
|
$
|
3.73
|
|
$
|
1.74
|
|
|||
|
Adjusted fully-converted net income per fully exchanged, fully diluted shares outstanding
|
$
|
1.10
|
|
$
|
3.73
|
|
$
|
1.74
|
|
|||
|
Adjusted fully-converted net income (loss) excluding special items per fully exchanged, fully diluted shares outstanding
|
$
|
3.26
|
|
$
|
1.14
|
|
$
|
(1.41
|
)
|
|||
——————————
See Notes to Non-GAAP Financial Measures.
Gross Refining Margin and Gross Refining Margin Excluding Special Items
Gross refining margin is defined as consolidated gross margin excluding refinery depreciation, refinery operating expense, and gross margin of PBFX. We believe both gross refining margin and gross refining margin excluding special items are important measures of operating performance and provide useful information to investors because they are helpful metric comparisons to the industry refining margin benchmarks, as the refining margin benchmarks do not include a charge for refinery operating expenses and depreciation. In order to assess our operating performance, we compare our gross refining margin (revenue less cost of products and other) to industry refining margin benchmarks and crude oil prices as defined in the table below.
Neither gross refining margin nor gross refining margin excluding special items should be considered an alternative to consolidated gross margin, income from operations, net cash flows from operating activities or any other measure of financial performance or liquidity presented in accordance with GAAP. Gross refining margin and gross refining margin excluding special items presented by other companies may not be comparable to our presentation, since each company may define these terms differently. The following table presents our GAAP calculation of gross margin and a reconciliation of gross refining margin to the most directly comparable GAAP financial measure, consolidated gross margin, on a historical basis, as applicable, for each of the periods indicated (in thousands, except per barrel amounts):
87
|
Year Ended December 31,
|
|||||||||||||||||||||
|
2018
|
2017
|
2016
|
|||||||||||||||||||
|
$
|
per barrel of throughput
|
$
|
per barrel of throughput
|
$
|
per barrel of throughput
|
||||||||||||||||
|
Calculation of consolidated gross margin:
|
|||||||||||||||||||||
|
Revenues
|
$
|
27,186,093
|
|
$
|
87.67
|
|
$
|
21,786,637
|
|
$
|
73.92
|
|
$
|
15,920,424
|
|
$
|
59.77
|
|
|||
|
Less: Cost of Sales
|
26,583,478
|
|
85.73
|
|
20,826,048
|
|
70.67
|
|
15,237,433
|
|
57.21
|
|
|||||||||
|
Consolidated gross margin
|
$
|
602,615
|
|
$
|
1.94
|
|
$
|
960,589
|
|
$
|
3.25
|
|
$
|
682,991
|
|
$
|
2.56
|
|
|||
|
Reconciliation of consolidated gross margin to gross refining margin:
|
|||||||||||||||||||||
|
Consolidated gross margin
|
$
|
602,615
|
|
$
|
1.94
|
|
$
|
960,589
|
|
$
|
3.25
|
|
$
|
682,991
|
|
$
|
2.56
|
|
|||
|
Add: PBFX operating expense
|
84,410
|
|
0.27
|
|
66,443
|
|
0.23
|
|
41,317
|
|
0.15
|
|
|||||||||
|
Add: PBFX depreciation expense
|
29,417
|
|
0.09
|
|
23,721
|
|
0.08
|
|
12,337
|
|
0.05
|
|
|||||||||
|
Less: Revenues of PBFX
|
(281,511
|
)
|
(0.91
|
)
|
(254,813
|
)
|
(0.86
|
)
|
(187,335
|
)
|
(0.70
|
)
|
|||||||||
|
Add: Refinery operating expense
|
1,654,749
|
|
5.34
|
|
1,626,440
|
|
5.52
|
|
1,390,134
|
|
5.22
|
|
|||||||||
|
Add: Refinery depreciation expense
|
329,709
|
|
1.06
|
|
254,271
|
|
0.86
|
|
204,005
|
|
0.77
|
|
|||||||||
|
Gross refining margin
|
$
|
2,419,389
|
|
$
|
7.79
|
|
$
|
2,676,651
|
|
$
|
9.08
|
|
$
|
2,143,449
|
|
$
|
8.05
|
|
|||
|
Special Items:
(3)
|
|||||||||||||||||||||
|
Add: Non-cash LCM inventory adjustment
|
351,278
|
|
1.13
|
|
(295,532
|
)
|
(1.00
|
)
|
(521,348
|
)
|
(1.96
|
)
|
|||||||||
|
Add: Early railcar return expense
|
52,313
|
|
0.17
|
|
—
|
|
—
|
|
—
|
|
—
|
|
|||||||||
|
Gross refining margin excluding special items
|
$
|
2,822,980
|
|
$
|
9.09
|
|
$
|
2,381,119
|
|
$
|
8.08
|
|
$
|
1,622,101
|
|
$
|
6.09
|
|
|||
——————————
See Notes to Non-GAAP Financial Measures.
EBITDA, EBITDA Excluding Special Items and Adjusted EBITDA
Our management uses EBITDA (earnings before interest, income taxes, depreciation and amortization), EBITDA excluding special items and Adjusted EBITDA as measures of operating performance to assist in comparing performance from period to period on a consistent basis and to readily view operating trends, as a measure for planning and forecasting overall expectations and for evaluating actual results against such expectations, and in communications with our board of directors, creditors, analysts and investors concerning our financial performance. Our outstanding indebtedness for borrowed money and other contractual obligations also include similar measures as a basis for certain covenants under those agreements which may differ from the Adjusted EBITDA definition described below.
EBITDA, EBITDA excluding special items and Adjusted EBITDA are not presentations made in accordance with GAAP and our computation of EBITDA, EBITDA excluding special items and Adjusted EBITDA may vary from others in our industry. In addition, Adjusted EBITDA contains some, but not all, adjustments that are taken into account in the calculation of the components of various covenants in the agreements governing our senior notes and other credit facilities. EBITDA, EBITDA excluding special items and Adjusted EBITDA should not be considered as alternatives to income from operations or net income as measures of operating performance. In addition, EBITDA, EBITDA excluding special items and Adjusted EBITDA are not presented as, and should not be considered, an alternative to cash flows from operations as a measure of liquidity. Adjusted EBITDA is defined as EBITDA before adjustments for items such as stock-based compensation expense, the non-cash change in the fair value of catalyst leases, the write down of inventory to the LCM, changes in the liability for Tax Receivable Agreement due to factors out of PBF Energy’s control such as changes in tax rates, debt extinguishment costs related to refinancing activities and certain other non-cash items. Other companies, including other companies in our industry, may calculate EBITDA, EBITDA excluding special items and Adjusted EBITDA differently than we do, limiting their usefulness as comparative measures. EBITDA, EBITDA excluding special items and Adjusted EBITDA also have limitations as analytical tools and should not be considered in isolation, or as a substitute for
88
analysis of our results as reported under GAAP. Some of these limitations include that EBITDA, EBITDA excluding special items and Adjusted EBITDA:
|
•
|
do not reflect depreciation expense or our cash expenditures, or future requirements, for capital expenditures or contractual commitments;
|
|
•
|
do not reflect changes in, or cash requirements for, our working capital needs;
|
|
•
|
do not reflect our interest expense, or the cash requirements necessary to service interest or principal payments, on our debt;
|
|
•
|
do not reflect realized and unrealized gains and losses from certain hedging activities, which may have a substantial impact on our cash flow;
|
|
•
|
do not reflect certain other non-cash income and expenses; and
|
|
•
|
exclude income taxes that may represent a reduction in available cash.
|
The following tables reconcile net income as reflected in PBF Energy’s results of operations to EBITDA, EBITDA excluding special items and Adjusted EBITDA for the periods presented (in thousands):
|
Year Ended December 31,
|
|||||||||||||
|
2018
|
2017
|
2016
|
|||||||||||
|
Reconciliation of net income to EBITDA and EBITDA excluding special items:
|
|||||||||||||
|
Net income
|
$
|
175,291
|
|
$
|
483,431
|
|
$
|
225,518
|
|
||||
|
Add: Depreciation and amortization expense
|
369,760
|
|
290,956
|
|
222,176
|
|
|||||||
|
Add: Interest expense, net
|
169,911
|
|
154,427
|
|
150,045
|
|
|||||||
|
Add: Income tax expense
|
33,507
|
|
315,584
|
|
137,650
|
|
|||||||
|
EBITDA
|
$
|
748,469
|
|
$
|
1,244,398
|
|
$
|
735,389
|
|
||||
|
Special Items:
(3)
|
|||||||||||||
|
Add: Non-cash LCM inventory adjustment
|
351,278
|
|
(295,532
|
)
|
(521,348
|
)
|
|||||||
|
Add: Change in Tax Receivable Agreement liability
|
(13,893
|
)
|
(250,922
|
)
|
(12,908
|
)
|
|||||||
|
Add: Debt extinguishment costs
|
—
|
|
25,451
|
|
—
|
|
|||||||
|
Add: Gain on Torrance land sale
|
(43,761
|
)
|
—
|
|
—
|
|
|||||||
|
Add: Early railcar return expense
|
52,313
|
|
—
|
|
—
|
|
|||||||
|
EBITDA excluding special items
|
$
|
1,094,406
|
|
$
|
723,395
|
|
$
|
201,133
|
|
||||
|
Reconciliation of EBITDA to Adjusted EBITDA:
|
|
||||||||||||
|
EBITDA
|
$
|
748,469
|
|
$
|
1,244,398
|
|
$
|
735,389
|
|
||||
|
Add: Stock based compensation
|
25,969
|
|
26,848
|
|
22,656
|
|
|||||||
|
Add: Net non-cash change in fair value of catalyst leases
|
(5,587
|
)
|
2,247
|
|
(1,422
|
)
|
|||||||
|
Add: Non-cash LCM inventory adjustment
(3)
|
351,278
|
|
(295,532
|
)
|
(521,348
|
)
|
|||||||
|
Add: Change in Tax Receivable Agreement liability
(3)
|
(13,893
|
)
|
(250,922
|
)
|
(12,908
|
)
|
|||||||
|
Add: Debt extinguishment costs
(3)
|
—
|
|
25,451
|
|
—
|
|
|||||||
|
Adjusted EBITDA
|
$
|
1,106,236
|
|
$
|
752,490
|
|
$
|
222,367
|
|
||||
——————————
See Notes to Non-GAAP Financial Measures.
89
Notes to Non-GAAP Financial Measures
The following notes are applicable to the Non-GAAP Financial Measures above:
|
(1)
|
Represents the elimination of the noncontrolling interest associated with the ownership by the members of PBF LLC other than PBF Energy, as if such members had fully exchanged their PBF LLC Series A Units for shares of PBF Energy Class A common stock.
|
|
(2)
|
Represents an adjustment to reflect PBF Energy’s annualized statutory corporate tax rate of approximately 26.0%, 39.6% and 39.1% for the
2018
,
2017
and
2016
periods, respectively, applied to the net income attributable to noncontrolling interest for all periods presented. The adjustment assumes the full exchange of existing PBF LLC Series A Units as described in (1) above. Our statutory tax rates were reduced in 2018 as a result of the TCJA enactment.
|
|
(3)
|
Special items:
|
LCM inventory adjustment
- LCM is a GAAP requirement related to inventory valuation that mandates inventory to be stated at the lower of cost or market. Our inventories are stated at the lower of cost or market. Cost is determined using the last-in, first-out (“LIFO”) inventory valuation methodology, in which the most recently incurred costs are charged to cost of sales and inventories are valued at base layer acquisition costs. Market is determined based on an assessment of the current estimated replacement cost and net realizable selling price of the inventory. In periods where the market price of our inventory declines substantially, cost values of inventory may exceed market values. In such instances, we record an adjustment to write down the value of inventory to market value in accordance with GAAP. In subsequent periods, the value of inventory is reassessed and an LCM inventory adjustment is recorded to reflect the net change in the LCM inventory reserve between the prior period and the current period. The net impact of these LCM inventory adjustments are included in the Refining segment’s income from operations, but are excluded from the operating results presented in the table below in order to make such information comparable between periods.
The following table includes the lower of cost or market inventory reserve as of each date presented (in thousands):
|
2018
|
2017
|
2016
|
|||||||||
|
January 1,
|
$
|
300,456
|
|
$
|
595,988
|
|
$
|
1,117,336
|
|
||
|
December 31,
|
651,734
|
|
300,456
|
|
595,988
|
|
|||||
The following table includes the corresponding impact of changes in the LCM inventory reserve on income from operations and net income for the periods presented (in thousands):
|
Year Ended December 31,
|
|||||||||||
|
2018
|
2017
|
2016
|
|||||||||
|
Net LCM inventory adjustment (charge) benefit in income from operations
|
$
|
(351,278
|
)
|
$
|
295,532
|
|
$
|
521,348
|
|
||
|
Net LCM inventory adjustment (charge) benefit in net income
|
(259,946
|
)
|
178,475
|
|
317,704
|
|
|||||
Change in Tax Receivable Agreement liability
- During the year ended
December 31, 2018
PBF Energy recorded a change in Tax Receivable Agreement liability that increased income before income taxes and net income by
$13.9 million
and
$10.3 million
, respectively. During the year ended
December 31, 2017
PBF Energy recorded a change in the Tax Receivable Agreement liability that increased income before taxes and net income by
$250.9
million and
$151.5
million, respectively. During the year ended
December 31, 2016
PBF Energy recorded a change in Tax Receivable Agreement liability that increased income before income taxes and net income by $12.9 million and $7.8 million, respectively. The changes in the Tax Receivable Agreement liabilities reflect charges or benefits attributable to changes in PBF Energy’s obligation under the Tax Receivable Agreement due to factors out of our control such as changes in tax rates.
Gain on Torrance land sale
- During the year ended
December 31, 2018
we recorded a gain on the sale of a parcel of real property acquired as part of the Torrance refinery, but not part of the refinery itself. The gain increased income from operations and net income by
$43.8 million
and
$32.4 million
, respectively. There was no such gain in the years ended
December 31, 2017
and
December 31, 2016
.
90
Early Return of Railcars
- During the year ended
December 31, 2018
we recognized certain expenses within Cost of sales associated with the voluntary early return of certain leased railcars. These charges decreased income from operations and net income by
$52.3 million
and
$38.7 million
, respectively. There were no such expenses in the years ended
December 31, 2017
and
December 31, 2016
.
Debt Extinguishment Costs
- During the year ended
December 31, 2017
, we recorded pre-tax debt extinguishment costs of $25.5 million related to the redemption of the 2020 Senior Secured Notes. These nonrecurring charges decreased net income by $15.4 million for the year ended
December 31, 2017
. There were no such costs in the years ended
December 31, 2018
and
December 31, 2016
.
TCJA Enactment
- We recorded a one-time adjustment in 2017 to deferred tax assets and liabilities in relation to the TCJA. The prior year net income tax expense impact of $20.2 million consisted of a net tax expense of $193.5 million associated with the remeasurement of the Tax Receivable Agreement associated deferred tax assets and a net tax benefit of $173.3 million for the reduction of our deferred tax liabilities as a result of the TCJA.
Recomputed Income taxes on special items
- The income tax impact of the special items, other than TCJA related items, were calculated using the tax rates shown in (2) above.
|
(4)
|
Represents an adjustment to weighted-average diluted shares outstanding to assume the full exchange of existing PBF LLC Series A Units as described in (1) above.
|
|
(5)
|
Represents weighted-average diluted shares outstanding assuming the conversion of all common stock equivalents, including options and warrants for PBF LLC Series A Units and performance share units and options for shares of PBF Energy Class A common stock as calculated under the treasury stock method (to the extent the impact of such exchange would not be anti-dilutive) for the years ended
December 31, 2018
,
2017
and
2016
, respectively. Common stock equivalents exclude the effects of options and warrants to purchase
1,293,242
,
6,820,275
and
5,701,750
shares of PBF Energy Class A common stock and PBF LLC Series A Units because they are anti-dilutive for the years ended
December 31, 2018
,
2017
and
2016
, respectively.
|
Liquidity and Capital Resources
Overview
Our primary sources of liquidity are our cash flows from operations and borrowing availability under our credit facilities, as described below. We believe that our cash flows from operations and available capital resources will be sufficient to meet our and our subsidiaries capital expenditure, working capital needs, dividend payments, debt service and share repurchase program requirements, as well as our obligations under the Tax Receivable Agreement, for the next twelve months. However, our ability to generate sufficient cash flow from operations depends, in part, on petroleum oil market pricing and general economic, political and other factors beyond our control. We are in compliance as of
December 31, 2018
with all of the covenants, including financial covenants, in all of our debt agreements.
Cash Flow Analysis
Cash Flows from Operating Activities
Net cash
provided by
operating activities was
$837.9 million
for the
year
ended
December 31, 2018
compared to net cash provided by operating activities of
$685.9 million
for the
year
ended
December 31, 2017
. Our operating cash flows for the
year
ended
December 31, 2018
included our net income of
$175.3 million
, depreciation and amortization of
$378.6 million
, deferred income tax expense of
$32.7 million
, pension and other post-retirement benefits costs of
$47.4 million
, a net non-cash charge of
$351.3 million
relating to an LCM inventory adjustment, stock-based compensation of
$26.0 million
, partially offset by a gain on sale of assets of
$43.1 million
, net non-cash charges relating to the change in the fair value of our inventory repurchase obligations of
$31.8 million
, change in the Tax Receivable Agreement liability of
$13.9 million
and changes in the fair value of our catalyst leases of
$5.6 million
. In addition, net changes in operating assets and liabilities reflected uses of cash of approximately
$79.0 million
driven by the timing of inventory purchases, payments for accrued expenses and accounts payable and collections of accounts receivables. Our operating cash flows for the year ended
December 31, 2017
included our net income of
$483.4 million
, deferred income tax expense of
$313.8 million
, depreciation and amortization of
$299.9 million
, pension and other post-retirement benefits costs of
$42.2 million
, stock-based compensation of
$26.8 million
, debt extinguishment costs related to the refinancing of our 2020 Senior Secured Notes of
$25.5 million
, the change in the fair value of our inventory repurchase obligations of
$13.8 million
, changes in
91
the fair value of our catalyst leases of
$2.2 million
and a loss on the sale of assets of
$1.5 million
, partially offset by change in the Tax Receivable Agreement liability of
$250.9 million
, and net non-cash benefits relating to an LCM inventory adjustment of
$295.5 million
. In addition, net changes in operating assets and liabilities reflected sources of cash of approximately
$23.2 million
driven by the timing of inventory purchases, payments for accrued expenses and accounts payable and collections of accounts receivable.
Net cash
provided by
operating activities was
$685.9 million
for the
year
ended
December 31, 2017
compared to net cash
provided by
operating activities of
$651.9 million
for the
year
ended
December 31, 2016
. Our operating cash flows for the year ended
December 31, 2016
included our net income of
$225.5 million
, depreciation and amortization of
$232.9 million
, deferred income taxes of
$244.8 million
, the change in the fair value of our inventory repurchase obligations of
$29.5 million
, pension and other post-retirement benefits costs of
$38.0 million
, stock-based compensation of
$22.7 million
and a loss on the sale of assets of
$11.4 million
, partially offset by net non-cash benefits relating to an LCM inventory adjustment of
$521.3 million
, change in the Tax Receivable Agreement liability of
$12.9 million
and changes in the fair value of our catalyst leases of
$1.4 million
. In addition, net changes in operating assets and liabilities reflected sources of cash of approximately
$382.9 million
driven by the timing of inventory purchases, payments for accrued expenses and accounts payable and collections of accounts receivable
.
Cash Flows from Investing Activities
Net cash
used in
investing activities was
$685.6 million
for the
year
ended
December 31, 2018
compared to
$687.0 million
for the
year
ended
December 31, 2017
. The net cash flows
used in
investing activities for the
year
ended
December 31, 2018
was comprised of cash outflows of
$317.5 million
for capital expenditures, expenditures for refinery turnarounds of
$266.0 million
, expenditures for other assets of
$17.1 million
, expenditures for the acquisition of the East Coast Storage Assets by PBFX of
$75.0 million
and expenditures for the acquisition of the Knoxville Terminals by PBFX of
$58.4 million
, partially offset by proceeds of
$48.3 million
related to the Torrance land sale. Net cash used in investing activities for the
year
ended
December 31, 2017
was comprised of cash outflows of
$306.7 million
for capital expenditures, expenditures for refinery turnarounds of
$379.1 million
, expenditures for other assets of
$31.1 million
and expenditures for the acquisition of Toledo Products Terminal by PBFX of
$10.1 million
, partially offset by
$40.0 million
of net maturities of marketable securities.
Net cash
used in
investing activities was
$687.0 million
for the year ended
December 31, 2017
compared to
$1,393.9 million
for the year ended
December 31, 2016
. Net cash
used in
investing activities for the year ended
December 31, 2016
was comprised of cash outflows of
$971.9 million
used to fund the Torrance Acquisition, capital expenditures totaling
$298.7 million
, expenditures for turnarounds of
$198.7 million
, expenditures for other assets of
$42.5 million
, cash consideration of
$98.4 million
used to fund the PBFX Plains Asset Purchase, and final net working capital settlement of
$2.7 million
associated with the acquisition of the Chalmette refinery, partially offset by
$194.2 million
of net maturities of marketable securities and
$24.7 million
in proceeds from the sale of assets.
Cash Flows from Financing Activities
Net cash
used in
financing activities was
$128.1 million
for the
year
ended
December 31, 2018
compared to net cash
used in
financing activities of
$172.1 million
for the
year
ended
December 31, 2017
. For the
year
ended
December 31, 2018
, net cash
used in
financing activities consisted primarily of distributions and dividends of
$189.2 million
, principal amortization payments of the PBF Rail Term Loan of
$6.8 million
, repayment of the note payable of
$5.6 million
, settlements of precious metal catalyst leases of
$9.1 million
, taxes paid for net settlement of equity-based compensation of
$5.3 million
, deferred financing costs of
$16.2 million
, repurchases of our common stock in connection with tax withholding obligations upon the vesting of certain restricted stock awards of
$8.2 million
and net repayments of our Revolving Credit Facility of
$350.0 million
, partially offset by
$287.3 million
in net proceeds from the August 2018 Equity Offering,
$34.8 million
in net proceeds from the issuance of PBFX common units, net borrowings from the PBFX Revolver Credit Facility of
$126.3 million
and proceeds from stock options exercised of
$14.0 million
. For the
year
ended
December 31, 2017
, net cash
used in
financing activities consisted of distributions and dividends of
$181.6 million
, full repayment of the PBFX Term Loan of
$39.7 million
, net repayments of the PBFX Revolver of
$159.5 million
, payments of principal under the PBF Rail Term Loan of
$6.6 million
, deferred financing costs related to the PBFX Senior Notes of
$3.7 million
, repayment of the note payable of
$1.2 million
and repurchases of our common stock in connection with tax withholding obligations upon the vesting of certain restricted stock awards of
$1.0 million
, partially offset by the proceeds from the issuance of the new PBFX 2023 Senior Notes of
$178.5 million
, cash proceeds of
$21.4 million
from the issuance of the 2025 Senior Notes net of cash paid to redeem the 2020 Senior Secured Notes and related issuance costs, proceeds from precious metals catalyst leases of
$10.8 million
and proceeds from stock options exercised of
$10.5 million
. Additionally, during the year ended
December 31, 2017
, we borrowed and repaid
$490.0 million
under our August 2014 Revolving Credit Agreement resulting in no net change to amounts outstanding for the year ended
December 31, 2017
.
92
Net cash
used in
financing activities was
$172.1 million
for the year ended
December 31, 2017
compared to net cash
provided by
financing activities of
$544.0 million
for the year ended
December 31, 2016
. For the year ended
December 31, 2016
, net cash
provided by
financing activities consisted primarily of
$138.4 million
in proceeds from the issuance of PBFX common units, net proceeds from the August 2014 Revolving Credit Agreement of
$350.0 million
,
$275.3 million
in proceeds from the December 2016 Equity Offering, net proceeds from the PBFX Revolving Credit Facility of
$164.7 million
, proceeds from the PBF Rail Term Loan of
$35.0 million
and proceeds from precious metals catalyst leases of
$15.6 million
, partially offset by distributions and dividends of
$172.2 million
, repayments on the PBFX Term Loan of
$194.5 million
, repayments on the Rail Facility of $67.5 million and repurchases of our common stock in connection with tax withholding obligations upon the vesting of certain restricted stock awards totaling
$0.7 million
.
The cash flow activity of PBF LLC for the years ended
December 31, 2018
,
December 31, 2017
and
December 31, 2016
is materially consistent with that of PBF Energy discussed above, other than changes in deferred income taxes and certain working capital items, which are different from PBF Energy due to certain tax related items not applicable to PBF LLC. Additionally, PBF LLC reflects net proceeds of
$44.2 million
and
$102.8 million
for the years ended
December 31, 2018
and 2017, respectively, and net repayments of
$24.5 million
for the year ended
December 31, 2016
, related to an affiliate loan with PBF Energy, included in cash flows from financing activities, which eliminates in consolidation at PBF Energy.
93
Capitalization
Our capital structure was comprised of the following as of
December 31, 2018
(in millions):
|
December 31, 2018
|
|||
|
Debt, including current maturities:
|
|||
|
PBF LLC debt
|
|||
|
Affiliate note payable
|
$
|
326.1
|
|
|
PBF Holding debt
|
|||
|
2025 Senior Notes
|
725.0
|
|
|
|
2023 Senior Notes
|
500.0
|
|
|
|
PBF Rail Term Loan
|
21.6
|
|
|
|
Catalyst leases
|
44.3
|
|
|
|
PBF Holding debt
|
1,290.9
|
|
|
|
PBFX debt
|
|||
|
PBFX 2023 Senior Notes
|
525.0
|
|
|
|
PBFX Revolving Credit Facility
|
156.0
|
|
|
|
PBFX debt
|
681.0
|
|
|
|
Unamortized deferred financing costs
|
(41.0
|
)
|
|
|
Unamortized premium on PBFX 2023 Senior Notes
|
2.8
|
|
|
|
Total PBF LLC debt, net of unamortized deferred financing costs and premium
|
2,259.8
|
|
|
|
Less: Affiliate note payable
|
(326.1
|
)
|
|
|
Total PBF Energy debt, net of unamortized deferred financing costs and premium
(1)
|
$
|
1,933.7
|
|
|
Total PBF Energy Equity
|
$
|
3,248.5
|
|
|
Total PBF Energy Capitalization
(2)
|
$
|
5,182.2
|
|
|
Total PBF Energy Debt to Capitalization Ratio
|
37
|
%
|
|
_______________________________________________
(1) Excludes the PBF LLC affiliate note payable that is eliminated at the PBF Energy level.
(2) Total Capitalization refers to the sum of debt, excluding intercompany debt, plus total Equity.
At December 31, 2017, our total PBF Energy debt to capitalization ratio was 43%.
2018 Debt Transactions
PBF Holding Revolving Credit Facility
On May 2, 2018, PBF Holding and certain of our wholly-owned subsidiaries, as borrowers or subsidiary guarantors, replaced the August 2014 Revolving Credit Agreement with the Revolving Credit Facility. Among other things, the Revolving Credit Facility increased the maximum commitment available to us from $2.6 billion to $3.4 billion, extended the maturity date to May 2023, and redefined certain components of the Borrowing Base (as defined in the Revolving Credit Agreement) to make more funding available for working capital and other general corporate purposes. Borrowings under the Revolving Credit Facility bear interest at the Alternative Base Rate plus the Applicable Margin or at the Adjusted LIBOR Rate plus the Applicable Margin, all as defined in the Revolving Credit Agreement and further described in “Note 9 - Credit Facility and Debt” of our Notes to Consolidated Financial Statements. In addition, an accordion feature allows for commitments of up to
$3.5 billion
. The LC Participation Fee ranges from
1.00%
to
1.75%
depending on the Company’s corporate credit rating and the Fronting Fee is capped at
0.25%
.
The Revolving Credit Agreement contains customary covenants and restrictions on the activities of PBF Holding and its subsidiaries, including, but not limited to, limitations on the incurrence of additional indebtedness, liens, negative pledges, guarantees, investments, loans, asset sales, mergers and acquisitions, prepayment of other debt, distributions, dividends and the repurchase of capital stock, transactions with affiliates and the ability of PBF Holding to change the nature of its business or its fiscal year; all as defined in the Revolving Credit Agreement.
94
In addition, the Revolving Credit Agreement has a financial covenant which requires that if at any time Excess Availability (as defined in the Revolving Credit Agreement) is less than the greater of (i) 10% of the lesser of the then existing Borrowing Base and the then aggregate Revolving Commitments of the Lenders (the “Financial Covenant Testing Amount”), and (ii) $100.0 million, and until such time as Excess Availability is greater than the Financial Covenant Testing Amount and $100.0 million for a period of 12 or more consecutive days, PBF Holding will not permit the Consolidated Fixed Charge Coverage Ratio (as defined in the Revolving Credit Agreement) and determined as of the last day of the most recently completed quarter, to be less than 1.0 to 1.0. Previously the requirement was 1.1 to 1.0.
PBF Holding’s obligations under the Revolving Credit Facility are (a) guaranteed by each of its domestic operating subsidiaries that are not Excluded Subsidiaries (as defined in the Revolving Credit Agreement) and (b) secured by a lien on (i) PBF LLC’s equity interest in PBF Holding and (ii) certain assets of PBF Holding and the subsidiary guarantors, including all deposit accounts (other than zero balance accounts, cash collateral accounts, trust accounts and/or payroll accounts, all of which are excluded from the definition of collateral), all accounts receivable, all hydrocarbon inventory (other than the intermediate and finished products owned by J. Aron pursuant to the Inventory Intermediation Agreements) and to the extent evidencing, governing, securing or otherwise related to the foregoing, all general intangibles, chattel paper, instruments, documents, letter of credit rights and supporting obligations; and all products and proceeds of the foregoing.
PBFX Revolving Credit Facility
On July 30, 2018, PBFX entered into the PBFX Revolving Credit Facility with Wells Fargo Bank, National Association, as administrative agent, and a syndicate of lenders. The PBFX Revolving Credit Facility amended and restated the existing PBFX revolving credit facility entered into in connection with the closing of the PBFX IPO. Among other things, the PBFX Revolving Credit Facility increased the maximum commitment available to PBFX from $360.0 million to $500.0 million, and extended the maturity date to July 2023. PBFX has the ability to further increase the maximum availability by an additional $250.0 million to a total commitment of $750.0 million, subject to receiving increased commitments from lenders or other financial institutions and satisfaction of certain conditions. Borrowings under the PBFX Credit Facility bear interest either at the Alternative Base Rate plus the Applicable Margin or at LIBOR Rate plus the Applicable Margin, all as defined in the agreement governing the PBFX Revolving Credit Facility (the “PBFX Revolving Credit Agreement”) and further described in “Note 9 - Credit Facility and Debt” of our Notes to Consolidated Financial Statements.
The PBFX Revolving Credit Agreement contains affirmative and negative covenants customary for revolving credit facilities of this nature which, among other things, limit or restrict PBFX’s ability and the ability of its restricted subsidiaries to incur or guarantee debt, incur liens, make investments, make restricted payments, amend material contracts, engage in certain business activities, engage in mergers, consolidations and other organizational changes, sell, transfer or otherwise dispose of assets, enter into burdensome agreements, or enter into transactions with affiliates on terms which are not at arm’s length.
Additionally, commencing with the Measurement Period ending September 30, 2018, PBFX is required to maintain (a) Consolidated Interest Coverage of at least 2.50 to 1.00, (b) Consolidated Total Leverage of not greater than 4.50 to 1.00 and (c) Consolidated Senior Secured Leverage of not greater than 3.50 to 1.00 (all terms as defined in the PBFX Revolving Credit Agreement).
The PBFX Revolving Credit Agreement contains events of default customary for transactions of their nature, including, but not limited to (and subject to grace periods where applicable), the failure to pay any principal, interest or fees when due, failure to perform or observe any covenant contained in the PBFX Revolving Credit Agreement or related documentation, any representation or warranty made in the agreements or related documentation being untrue in any material respect when made, default under certain material debt agreements, commencement of bankruptcy or other insolvency proceedings, certain changes in PBFX’s ownership or the ownership or board composition of PBF GP and material judgments or orders. Upon the occurrence and during the continuation of an event of default under the PBFX Revolving Credit Agreement, the lenders may, among other things, terminate their commitments, declare any outstanding loans to be immediately due and payable and/or exercise remedies against PBFX and the collateral as may be available to the lenders under the PBFX Revolving Credit Agreement and related documentation or applicable law.
On April 16, 2018, PBFX completed the Knoxville Terminals Purchase for total cash consideration of
$58.0 million
, excluding working capital adjustments, which was primarily financed through advances under the PBFX Revolving Credit Facility.
95
On October 1, 2018, PBFX completed the East Coast Storage Assets Acquisition for total consideration of
$127.0 million
, including working capital and the Contingent Consideration, comprised of an initial payment at closing of
$75.0 million
with the balance being payable one year after closing. The consideration was financed through a combination of cash on hand and borrowings under the PBFX Revolving Credit Facility.
Revolving Credit Facilities Overview
Our primary sources of liquidity are cash flows from operations with additional sources available under borrowing capacity from our revolving lines of credit. As of December 31,
2018
, PBF Energy had
$597.3 million
of cash and cash equivalents,
no
outstanding balance under the Revolving Credit Facility and
$156.0 million
outstanding under the PBFX Revolving Credit Facility. We believe available capital resources will be adequate to meet our capital expenditure, working capital and debt service requirements. We had available capacity under revolving credit facilities as follows at
December 31, 2018
(in millions):
|
Total Commitment
|
Amount Borrowed as of December 31, 2018
|
Outstanding Letters of Credit
|
Available Capacity
|
Expiration date
|
||||||||||||||
|
Revolving Credit Facility (a)
|
$
|
3,400.0
|
|
$
|
—
|
|
$
|
400.7
|
|
$
|
1,080.1
|
|
May 2023
|
|||||
|
PBFX Revolving Credit Facility
|
500.0
|
|
156.0
|
|
4.0
|
|
340.0
|
|
July 2023
|
|||||||||
|
Total Credit Facilities
|
$
|
3,900.0
|
|
$
|
156.0
|
|
$
|
404.7
|
|
$
|
1,420.1
|
|
||||||
___________________________________
|
(a)
|
The amount available for borrowings and letters of credit under the Revolving Credit Facility is calculated according to a “borrowing base” formula based on (i) 90% of the book value of Eligible Accounts with respect to investment grade obligors
plus
(ii) 85% of the book value of Eligible Accounts with respect to non-investment grade obligors
plus
(iii) 80% of the cost of Eligible Hydrocarbon Inventory
plus
(iv) 100% of Cash and Cash Equivalents in deposit accounts subject to a control agreement, in each case as defined in the Revolving Credit Agreement. The borrowing base is subject to customary reserves and eligibility criteria and in any event cannot exceed $3.400 billion.
|
Additional Information on Indebtedness
Our debt, including our revolving credit facilities, term loans and senior notes, include certain typical financial covenants and restrictions on our subsidiaries’ ability to, among other things, incur or guarantee new debt, engage in certain business activities including transactions with affiliates and asset sales, make investments or distributions, engage in mergers or pay dividends in certain circumstances. These covenants are subject to a number of important exceptions and qualifications. For further discussion of our indebtedness and these covenants and restrictions, see “Note 9 - Credit Facility and Debt” of our Notes to Consolidated Financial Statements.
PBF Holding and PBFX were in compliance with their respective covenants as of
December 31, 2018
.
Cash Balances
As of
December 31, 2018
, PBF Energy and PBF LLC cash and cash equivalents totaled
$597.3 million
and
$596.0 million
, respectively.
Liquidity
As of
December 31, 2018
, our total liquidity was approximately
$1,677.4 million
, compared to total liquidity of approximately
$1,442.0 million
as of
December 31, 2017
. Our total liquidity is equal to the amount of excess availability under the Revolving Credit Facility, which includes PBF Energy cash balance at
December 31, 2018
. In addition, as of
December 31, 2018
PBFX had approximately
$340.0 million
of borrowing capacity under the PBFX Revolving Credit Facility in comparison to
$326.7 million
as of
December 31, 2017
. The PBFX Revolving Credit Facility is available to fund working capital, acquisitions, distributions, capital expenditures, and other general corporate purposes incurred by PBFX.
Working Capital
PBF Energy’s working capital at
December 31, 2018
was approximately
$1,102.4 million
, consisting of
$3,236.9 million
in total current assets and
$2,134.5 million
in total current liabilities. PBF Energy’s working capital at
December 31, 2017
was
$1,384.0 million
, consisting of
$3,803.0 million
in total current assets and
$2,418.9 million
in total current liabilities. PBF LLC’s working capital at
December 31, 2018
was approximately
$1,081.4 million
, consisting of
$3,235.1 million
in total current assets and
$2,153.7 million
in total current liabilities. PBF LLC’s working capital at
December 31, 2017
was
$1,351.7 million
, consisting of
$3,780.2 million
in total current assets and
$2,428.5 million
in total current liabilities. Working capital has decreased during the year ended
December 31, 2018
primarily as a result of capital
96
expenditures, including turnaround costs, PBFX acquisitions and dividend and distributions, partially offset by positive earnings, proceeds from the August 2018 Equity Offering, proceeds from the PBFX Registered Direct Offering, and proceeds from the Torrance land sale.
Crude and Feedstock Supply Agreements
Certain of our purchases of crude oil under our agreements with foreign national oil companies require that we post letters of credit and arrange for shipment. We pay for the crude when invoiced, at which time the letters of credit are lifted. We have a contract with Saudi Aramco pursuant to which we have been purchasing up to approximately 100,000 bpd of crude oil from Saudi Aramco that is processed at our Paulsboro refinery. In connection with the Chalmette Acquisition we entered into a contract with PDVSA for the supply of 40,000 to 60,000 bpd of crude oil that can be processed at any of our East or Gulf Coast refineries. We have not sourced crude oil under this agreement since the third quarter of 2017 as PDVSA has suspended deliveries due to the parties’ inability to agree to mutually acceptable payment terms
.
In connection with the closing of the Torrance Acquisition, we entered into a crude supply agreement with ExxonMobil for approximately 60,000 bpd of crude oil that can be processed at our Torrance refinery. We currently purchase all of our crude and feedstock needs independently from a variety of suppliers on the spot market or through term agreements for our Delaware City and Toledo refineries.
Inventory Intermediation Agreements
On May 4, 2017 and September 8, 2017, PBF Holding and its subsidiaries, DCR and PRC, entered into amendments to the Inventory Intermediation Agreements with J. Aron, pursuant to which certain terms of the existing inventory intermediation agreements were amended, including, among other things, pricing and an extension of the terms. As a result of the amendments (i) the Inventory Intermediation Agreement by and among J. Aron, PBF Holding and PRC relating to the Paulsboro refinery extends the term to December 31, 2019, which term may be further extended by mutual consent of the parties to December 31, 2020 and (ii) the Inventory Intermediation Agreement by and among J. Aron, PBF Holding and DCR relating to the Delaware City refinery extends the term to July 1, 2019, which term may be further extended by mutual consent of the parties to July 1, 2020.
Pursuant to each Inventory Intermediation Agreement, J. Aron continues to purchase and hold title to the Products produced by the Refineries, and delivered into tanks at the Refineries. Furthermore, J. Aron agrees to sell the Products back to the Refineries as the Products are discharged out of the Refineries’ tanks. J. Aron has the right to store the Products purchased in tanks under the Inventory Intermediation Agreements and will retain these storage rights for the term of the agreements. PBF Holding continues to market and sell independently to third parties.
At
December 31, 2018
, the LIFO value of intermediates and finished products owned by J. Aron included within Inventory in our consolidated balance sheet was
$334.7 million
. We accrue a corresponding liability for such intermediates and finished products.
Capital Spending
Capital spending was
$733.9 million
for the
year
ended
December 31, 2018
, which primarily included turnaround costs, safety related enhancements, facility improvements at the refineries, the PBFX Knoxville Terminals Purchase and the PBFX East Coast Storage Asset Acquisition. Excluding PBFX, we currently expect to spend an aggregate of approximately
$625.0 million
to
$675.0 million
in net capital expenditures during 2019 for facility improvements and refinery maintenance and turnarounds, the majority of which is expected to be incurred during the first six months of 2019. Significant capital spending plans for 2019, excluding PBFX, include turnarounds of the coker at our Torrance refinery, the coker at our Delaware City refinery and the crude unit at our Paulsboro refinery, as well as expenditures to meet environmental and regulatory requirements. Capital spending plans also include strategic capital expenditures for the restart of the idled Chalmette refinery coker and the Delaware City refinery hydrogen plant. In addition, PBFX expects to spend an aggregate of approximately $27.5 to $32.5 million in net capital expenditures during 2019.
97
Contractual Obligations and Commitments
The following table summarizes our material contractual payment obligations as of
December 31, 2018
(in thousands). The table below does not include any contractual obligations with PBFX as these related party transactions are eliminated upon consolidation of our financial statements.
|
Payments due by period
|
||||||||||||||||||||
|
Total
|
Less than
1 year
|
1-3 Years
|
3-5 Years
|
More than
5 years
|
||||||||||||||||
|
PBF Energy:
|
||||||||||||||||||||
|
Long-term debt
(a)
|
$
|
1,974,726
|
|
$
|
31,368
|
|
$
|
34,539
|
|
$
|
1,183,819
|
|
$
|
725,000
|
|
|||||
|
Interest payments on debt facilities
(a)
|
723,843
|
|
134,044
|
|
266,617
|
|
244,338
|
|
78,844
|
|
||||||||||
|
Operating leases
(b)
|
414,871
|
|
144,004
|
|
143,647
|
|
46,050
|
|
81,170
|
|
||||||||||
|
Purchase obligations
(c)
:
|
||||||||||||||||||||
|
Crude and Feedstock Supply and Inventory Intermediation Agreements
|
4,980,498
|
|
2,374,498
|
|
2,579,756
|
|
26,244
|
|
—
|
|
||||||||||
|
Other Supply and Capacity Agreements
|
690,102
|
|
189,821
|
|
146,467
|
|
97,030
|
|
256,784
|
|
||||||||||
|
Construction obligations
|
90,210
|
|
90,210
|
|
—
|
|
—
|
|
—
|
|
||||||||||
|
Environmental obligations
(d)
|
151,080
|
|
6,942
|
|
24,004
|
|
23,160
|
|
96,974
|
|
||||||||||
|
Pension and post-retirement obligations
(e)
|
237,393
|
|
12,241
|
|
25,659
|
|
25,004
|
|
174,489
|
|
||||||||||
|
Tax Receivable Agreement obligation
(f)
|
373,512
|
|
—
|
|
133,200
|
|
42,300
|
|
198,012
|
|
||||||||||
|
Deferred payment for East Coast Storage Assets Acquisition
(g)
|
32,000
|
|
32,000
|
|
—
|
|
—
|
|
—
|
|
||||||||||
|
East Coast Assets Acquisition Contingent Consideration
(g)
|
27,978
|
|
—
|
|
18,340
|
|
9,638
|
|
—
|
|
||||||||||
|
Total contractual cash obligations for PBF Energy
|
$
|
9,696,213
|
|
$
|
3,015,128
|
|
$
|
3,372,229
|
|
$
|
1,697,583
|
|
$
|
1,611,273
|
|
|||||
|
Adjustments for PBF LLC:
|
||||||||||||||||||||
|
Less: Tax Receivable Agreement obligation
(h)
|
(373,512
|
)
|
—
|
|
(133,200
|
)
|
(42,300
|
)
|
(198,012
|
)
|
||||||||||
|
Add: Affiliate note payable
(h)
|
326,082
|
|
—
|
|
326,082
|
|
—
|
|
—
|
|
||||||||||
|
Total contractual cash obligations for PBF LLC
|
$
|
9,648,783
|
|
$
|
3,015,128
|
|
$
|
3,565,111
|
|
$
|
1,655,283
|
|
$
|
1,413,261
|
|
|||||
(a) Long-term Debt and Interest Payments on Debt Facilities
Long-term obligations represent (i) the repayment of the outstanding borrowings under the Revolving Credit Facility; (ii) the repayment of indebtedness incurred in connection with the Senior Notes; (iii) the repayment of our catalyst lease obligations on their maturity dates; (iv) the repayment of outstanding amounts under the PBFX Revolving Credit Facility and the PBFX Senior Notes; and (v) the repayment of outstanding amounts under the PBF Rail Term Loan. PBF Energy’s contractual obligations exclude the
$326.1 million
PBF LLC affiliate note payable, which bears interest at
2.5%
, is due in 2020 and eliminates in consolidation at the PBF Energy level.
Interest payments on debt facilities include cash interest payments on the Senior Notes, PBFX Revolving Credit Facility, PBFX Senior Notes, catalyst lease obligations, PBF Rail Term Loan, plus cash payments for the commitment fees on the unused portion on our revolving credit facilities and letter of credit fees on the letters of credit outstanding at
December 31, 2018
. With the exception of our catalyst leases and PBF Rail Term Loan, we have no long-term debt maturing before 2023 as of
December 31, 2018
.
On May 2, 2018, PBF Holding and certain of our wholly-owned subsidiaries, as borrowers or subsidiary guarantors, replaced the August 2014 Revolving Credit Agreement with the Revolving Credit Facility. Among other things, the Revolving Credit Facility increased the maximum commitment available to us from $2.6 billion to $3.4 billion, extended the maturity date to May 2023, and redefined certain components of the Borrowing Base (as defined in the Revolving Credit Agreement) to make more funding available for working capital needs and other general corporate purposes.
On July 30, 2018, PBFX entered into the PBFX Revolving Credit Facility. Among other things, the PBFX Revolving Credit Facility increased the maximum commitment available to PBFX from $360.0 million to $500.0 million, and extended the maturity date to July 2023. PBFX has the ability to further increase the maximum availability by an additional $250.0 million to a total facility size of $750.0 million, subject to receiving increased commitments from the lenders or other financial institutions and satisfaction of certain conditions.
98
(b) Operating Leases
We enter into operating leases in the normal course of business, some of these leases provide us with the option to renew the lease or purchase the leased item. Future operating lease obligations would change if we chose to exercise renewal options and if we enter into additional operating lease agreements. Certain of our lease obligations contain a fixed and variable component. The table above reflects the fixed component of our lease obligations. The variable component could be significant. As described in “Note 2 - Summary of Significant Accounting Policies” of our Notes to Consolidated Financial Statements, we adopted new guidance on leases effective January 1, 2019 which will bring substantially all leases with initial terms of over twelve months onto our consolidated balance sheet. Our operating lease obligations are further explained in “Note 13 - Commitments and Contingencies” of our Notes to Consolidated Financial Statements.
Included within our operating leases section of the contractual obligations and commitments are our obligations related to our leased railcar fleet. In support of our rail strategy, we have at times entered into agreements to lease or purchase crude railcars. Certain of these railcars were subsequently sold to third parties, which have leased the railcars back to us for periods of between four and seven years. As discussed in “Note 8 - Accrued Expenses” of our notes to Consolidated Financial Statements, on September 30, 2018, we agreed to voluntarily return a portion of railcars under an operating lease in order to rationalize certain components of our railcar fleet based on prevailing market conditions in the crude oil by rail market. Under the terms of the lease amendment, we agreed to pay an early termination penalty in lieu of satisfaction of return conditions (the “early termination penalty”) and will pay a reduced rental fee over the remaining term of the lease totaling $52.3 million. As of December 31, 2018,
$30.4 million
of our total $52.3 million charge has not yet been paid and is included within the table above.
Additionally, we enter into contractual obligations with third parties for the right to use property for locating pipelines and accessing certain of our assets (also referred to as land easements) in the normal course of business. Our obligations regarding such land easements are included within Operating Leases in the table above. As described in “Note 2 - Summary of Significant Accounting Policies” of our Notes to Consolidated Financial Statements, we elected the practical expedient to not evaluate land easements for lease consideration under the new lease guidance adopted on January 1, 2019.
(c) Purchase Obligations
We have obligations to repurchase certain intermediates and refined products under separate inventory intermediation agreements with J. Aron as further explained in “Note 2 - Summary of Significant Accounting Policies”, “Note 5 - Inventories” and “Note 8 - Accrued Expenses” of our Notes to Consolidated Financial Statements. Additionally, purchase obligations under “Crude and Feedstock Supply and Inventory Intermediation Agreements” include commitments to purchase crude oil from certain counterparties under supply agreements entered into to ensure adequate supplies of crude oil for our refineries. These obligations are based on aggregate minimum volume commitments at
2018
year end market prices.
Payments under “Other Supply and Capacity Agreements” include contracts for the transportation of crude oil and supply of hydrogen, steam, or natural gas to certain of our refineries, contracts for the treatment of wastewater, and contracts for pipeline capacity. We enter into these contracts to facilitate crude oil deliveries and to ensure an adequate supply of energy or essential services to support our refinery operations. Substantially all of these obligations are based on fixed prices. Certain agreements include fixed or minimum volume requirements, while others are based on our actual usage. The amounts included in this table are based on fixed or minimum quantities to be purchased and the fixed or estimated costs based on market conditions as of
December 31, 2018
.
(d) Environmental Obligations
In connection with certain of our refinery and logistics acquisitions, we have assumed certain environmental remediation obligations to address matters that were outstanding at the time of such acquisitions. In addition, in connection with most of these acquisitions, we have purchased environmental insurance policies to insure against unknown environmental liabilities at each site. The obligations in the table above reflect our best estimate in cost and tenure to remediate our outstanding obligations and are further discussed in “Note 13 - Commitments and Contingencies” of our Notes to Consolidated Financial Statements.
|
(e)
|
Pension and Post-retirement Obligations
|
Pension and post-retirement obligations include only those amounts we expect to pay out in benefit payments and are further explained in “Note 17 - Employee Benefit Plans” of our Notes to Consolidated Financial Statements.
99
|
(f)
|
Tax Receivable Agreement Obligations
|
The table above reflects PBF Energy’s estimated timing of payments under the Tax Receivable Agreement, including the impact of the TCJA, assuming that we earn sufficient taxable income to realize all tax benefits that are subject to the Tax Receivable Agreement as of
December 31, 2018
. Refer to “Note 13 - Commitments and Contingencies” of our Notes to Consolidated Financial Statement for further discussion of the Tax Receivable Agreement.
(g) Deferred payment for East Coast Storage Assets Acquisition and related Contingent Consideration
The aggregate purchase price for the East Coast Storage Assets Acquisition was
$127.0 million
, including working capital and the Contingent Consideration, which was comprised of an initial payment at closing of approximately
$75.0 million
with a remaining
$32.0 million
balance being payable one year after closing. The acquisition also included an earn-out provision totaling an estimated
$28.0 million
payable to the seller annually starting in 2020.
|
(h)
|
Affiliate Note Payable
|
As described in “Note 10 - Affiliate Note Payable - PBF LLC” of our Notes to Consolidated Financial Statements, as of
December 31, 2018
, PBF LLC had an outstanding note payable with PBF Energy for an aggregate principal amount of
$326.1 million
. The note has an interest rate of
2.5%
and a 5-year term, payable in March 2020, but may be prepaid in whole or in part at any time, at the option of PBF LLC without penalty or premium. This affiliate note payable is a cash obligation of PBF LLC only and eliminates in consolidation for PBF Energy.
Tax Distributions
PBF LLC is required to make periodic tax distributions to the members of PBF LLC, including PBF Energy, pro rata in accordance with their respective percentage interests for such period (as determined under the amended and restated limited liability company agreement of PBF LLC), subject to available cash and applicable law and contractual restrictions (including pursuant to our debt instruments) and based on certain assumptions. Generally, these tax distributions will be an amount equal to our estimate of the taxable income of PBF LLC for the year multiplied by an assumed tax rate equal to the highest effective marginal combined U.S. federal, state and local income tax rate prescribed for an individual or corporate resident in New York, New York (taking into account the nondeductibility of certain expenses). If, with respect to any given calendar year, the aggregate periodic tax distributions were less than the actual taxable income of PBF LLC multiplied by the assumed tax rate, PBF LLC will make a “true up” tax distribution, no later than March 15 of the following year, equal to such difference, subject to the available cash and borrowings of PBF LLC. As these distributions are conditional they have been excluded from the table above.
Off-Balance Sheet Arrangements
We have no off-balance sheet arrangements as of
December 31, 2018
, other than outstanding letters of credit of approximately
$404.7 million
and operating leases. As described in “Note 2 - Summary of Significant Accounting Policies” of our Notes to Consolidated Financial Statements, we adopted new guidance on leases effective January 1, 2019, which will require us to record substantially all leases with initial terms of over twelve months onto our consolidated balance sheet.
Critical Accounting Policies
The following summary provides further information about our critical accounting policies that involve critical accounting estimates and should be read in conjunction with “Note 2 - Summary of Significant Accounting Policies” of our Notes to Consolidated Financial Statements, “Item 8. Financial Statements and Supplementary Data.” The following accounting policies involve estimates that are considered critical due to the level of subjectivity and judgment involved, as well as the impact on our financial position and results of operations. We believe that all of our estimates are reasonable. Unless otherwise noted, estimates of the sensitivity to earnings that would result from changes in the assumptions used in determining our estimates is not practicable due to the number of assumptions and contingencies involved, and the wide range of possible outcomes.
Inventory
Inventories are carried at the lower of cost or market. The cost of crude oil, feedstocks, blendstocks and refined products is determined under the LIFO method using the dollar value LIFO method with increments valued based on average cost during the year. The cost of supplies and other inventories is determined principally on the weighted average cost method. In addition, the use of the LIFO inventory method may result in increases or decreases to cost of sales in years that inventory volumes decline as the result of charging cost of sales with LIFO inventory costs generated in prior
100
periods. At
December 31, 2018
and
2017
, market values had fallen below historical LIFO inventory costs and, as a result, we recorded lower of cost or market inventory valuation reserves of
$651.7 million
and
$300.5 million
, respectively. The lower of cost or market inventory valuation reserve, or a portion thereof, is subject to reversal as a reduction to cost of products sold in subsequent periods as inventories giving rise to the reserve are sold, and a new reserve is established. Such a reduction to cost of products sold could be significant if inventory values return to historical cost price levels. Additionally, further decreases in overall inventory values could result in additional charges to cost of products sold should the lower of cost or market inventory valuation reserve be increased.
Environmental Matters
Liabilities for future clean-up costs are recorded when environmental assessments and/or clean-up efforts are probable and the costs can be reasonably estimated. Other than for assessments, the timing and magnitude of these accruals generally are based on the completion of investigations or other studies or a commitment to a formal plan of action. Environmental liabilities are based on best estimates of probable future costs using currently available technology and applying current regulations, as well as our own internal environmental policies. The actual settlement of our liability for environmental matters could materially differ from our estimates due to a number of uncertainties such as the extent of contamination, changes in environmental laws and regulations, potential improvements in remediation technologies and the participation of other responsible parties. Additionally, in connection with the Torrance Acquisition on July 1, 2016, we assumed certain pre-existing environmental liabilities. While we believe that our current estimates of the amounts and timing of the costs related to the remediation of these liabilities are reasonable, we have had limited experience with these environmental obligations due to our short operating history. It is possible that our estimates of the costs and duration of the environmental remediation activities related to these liabilities could materially change.
Business Combinations
We use the acquisition method of accounting for the recognition of assets acquired and liabilities assumed in business combinations at their estimated fair values as of the date of acquisition. Any excess consideration transferred over the estimated fair values of the identifiable net assets acquired is recorded as goodwill. Significant judgment is required in estimating the fair value of assets acquired. As a result, in the case of significant acquisitions, we obtain the assistance of third-party valuation specialists in estimating fair values of tangible and intangible assets based on available historical information and on expectations and assumptions about the future, considering the perspective of marketplace participants. While management believes those expectations and assumptions are reasonable, they are inherently uncertain. Unanticipated market or macroeconomic events and circumstances may occur, which could affect the accuracy or validity of the estimates and assumptions.
Deferred Turnaround Costs
Refinery turnaround costs, which are incurred in connection with planned major maintenance activities at our refineries, are capitalized when incurred and amortized on a straight-line basis over the period of time estimated until the next turnaround occurs (generally three to five years). While we believe that the estimates of time until the next turnaround are reasonable, it should be noted that factors such as competition, regulation or environmental matters could cause us to change our estimates thus impacting amortization expense in the future.
Derivative Instruments
We are exposed to market risk, primarily related to changes in commodity prices for the crude oil and feedstocks we use in the refining process as well as the prices of the refined products we sell. The accounting treatment for commodity contracts depends on the intended use of the particular contract and on whether or not the contract meets the definition of a derivative. Non-derivative contracts are recorded at the time of delivery.
All derivative instruments that are not designated as normal purchases or sales are recorded in our consolidated balance sheet as either assets or liabilities measured at their fair values. Changes in the fair value of derivative instruments that either are not designated or do not qualify for hedge accounting treatment or normal purchase or normal sale accounting are recognized in income. Contracts qualifying for the normal purchases and sales exemption are accounted for upon settlement. We elect fair value hedge accounting for certain derivatives associated with our inventory repurchase obligations.
Derivative accounting is complex and requires management judgment in the following respects: identification of derivatives and embedded derivatives; determination of the fair value of derivatives; identification of hedge relationships; assessment and measurement of hedge ineffectiveness; and election and designation of the normal purchases and sales exception. All of these judgments, depending upon their timing and effect, can have a significant impact on earnings.
101
Income Taxes and Tax Receivable Agreement
As a result of the PBF Energy’s acquisition of PBF LLC Series A Units or exchanges of PBF LLC Series A Units for PBF Energy Class A common stock, it expects to benefit from amortization and other tax deductions reflecting the step up in tax basis in the acquired assets. Those deductions will be allocated to PBF Energy and will be taken into account in reporting its taxable income. As a result of a federal income tax election made by PBF LLC, applicable to a portion of PBF Energy’s acquisition of PBF LLC Series A Units, the income tax basis of the assets of PBF LLC, underlying a portion of the units PBF Energy acquired, has been adjusted based upon the amount that PBF Energy paid for that portion of its PBF LLC Series A Units. PBF Energy entered into the Tax Receivable Agreement (as defined in “Note 13 - Commitments and Contingencies” of the Notes to our Consolidated Financial Statements) which provides for the payment by PBF Energy equal to 85% of the amount of the benefits, if any, that it is deemed to realize as a result of (i) increases in tax basis and (ii) certain other tax benefits related to entering into the Tax Receivable Agreement, including tax benefits attributable to payments under the Tax Receivable Agreement. As a result of these transactions, PBF Energy’s tax basis in its share of PBF LLC’s assets will be higher than the book basis of these same assets. This resulted in a deferred tax asset of
$306.2 million
as of
December 31, 2018
, of which the majority is expected to be realized over 10 years as the tax basis of these assets is amortized.
Deferred taxes are provided using a liability method, whereby deferred tax assets are recognized for deductible temporary differences and deferred tax liabilities are recognized for taxable temporary differences. Temporary differences represent the differences between the reported amounts of assets and liabilities and their tax bases. Deferred tax assets are reduced by a valuation allowance when, in the opinion of management, it is more likely than not that some portion or all of the deferred tax assets will not be realized. Deferred tax assets and liabilities are adjusted for the effect of changes in tax laws and rates on the date of enactment. We recognize tax benefits for uncertain tax positions only if it is more likely than not that the position is sustainable based on its technical merits. Interest and penalties on uncertain tax positions are included as a component of the provision for income taxes on the consolidated statements of operations. As a result of the reduction of the corporate federal tax rate to 21% as part of the TCJA, the liability associated with the Tax Receivable Agreement was reduced. Accordingly, the deferred tax assets associated with the payments made or expected to be made related to the Tax Receivable Agreement liability were also reduced.
Pursuant to the Tax Receivable Agreement PBF Energy entered into at the time of its initial public offering, it is required to pay the current and former PBF LLC Series A unitholders, who exchange their units for PBF Energy stock or whose units we purchase, approximately 85% of the cash savings in income taxes that PBF Energy is deemed to realize as a result of the increase in the tax basis of its interest in PBF LLC, including tax benefits attributable to payments made under the Tax Receivable Agreement. These payment obligations are of PBF Energy and not of PBF LLC or any of its subsidiaries. PBF Energy has recognized a liability for the Tax Receivable Agreement reflecting its estimate of the undiscounted amounts that it expects to pay under the agreement. PBF Energy’s estimate of the Tax Receivable Agreement liability is based, in part, on forecasts of future taxable income over the anticipated life of PBF Energy’s future business operations, assuming no material changes in the relevant tax law. The assumptions used in the forecasts are subject to substantial uncertainty about PBF Energy’s future business operations and the actual payments that it is required to make under the Tax Receivable Agreement could differ materially from its current estimates. PBF Energy must adjust the estimated Tax Receivable Agreement liability each time we purchase PBF LLC Series A Units or upon an exchange of PBF LLC Series A Units for PBF Energy Class A common stock. Such adjustments will be based on forecasts of future taxable income and PBF Energy’s future business operations at the time of such purchases or exchanges. Periodically, PBF Energy may adjust the liability based on an updated estimate of the amounts that it expects to pay, using assumptions consistent with those used in its concurrent estimate of the deferred tax asset valuation allowance. These periodic adjustments to the Tax Receivable Agreement liability, if any, are recorded in general and administrative expense and may result in adjustments to our income tax expense and deferred tax assets and liabilities.
Recent Accounting Pronouncements
Refer to “Note 2 - Summary of Significant Accounting Policies” of our Notes to Consolidated Financial Statements, for Recently Issued Accounting Pronouncements.
ITEM 7A. QUANTITATIVE AND QUALITATIVE DISCLOSURES ABOUT MARKET RISK
We are exposed to market risks, including changes in commodity prices and interest rates. Our primary commodity price risk is associated with the difference between the prices we sell our refined products and the prices we pay for crude oil and other feedstocks. We may use derivative instruments to manage the risks from changes in the prices of crude oil and refined products, natural gas, interest rates, or to capture market opportunities.
102
Commodity Price Risk
Our earnings, cash flow and liquidity are significantly affected by a variety of factors beyond our control, including the supply of, and demand for, crude oil, other feedstocks, refined products and natural gas. The supply of and demand for these commodities depend on, among other factors, changes in domestic and foreign economies, weather conditions, domestic and foreign political affairs, planned and unplanned downtime in refineries, pipelines and production facilities, production levels, the availability of imports, the marketing of competitive and alternative fuels, and the extent of government regulation. As a result, the prices of these commodities can be volatile. Our revenues fluctuate significantly with movements in industry refined product prices, our cost of sales fluctuates significantly with movements in crude oil and feedstock prices and our operating expenses fluctuate with movements in the price of natural gas. We manage our exposure to these commodity price risks through our supply and offtake agreements as well as through the use of various commodity derivative instruments.
We may use non-trading derivative instruments to manage exposure to commodity price risks associated with the purchase or sale of crude oil and feedstocks, finished products and natural gas outside of our supply and offtake agreements. The derivative instruments we use include physical commodity contracts and exchange-traded and over-the-counter financial instruments. We mark-to-market our commodity derivative instruments and recognize the changes in their fair value in our statements of operations.
At
December 31, 2018
and
2017
, we had gross open commodity derivative contracts representing
7.4 million
barrels and
24.3 million
barrels, respectively, with an unrealized net gain of
$7.2 million
and net loss of
$74.3 million
, respectively. The open commodity derivative contracts as of
December 31, 2018
expire at various times during 2019.
We carry inventories of crude oil, intermediates and refined products (“hydrocarbon inventories”) on our consolidated balance sheet, the values of which are subject to fluctuations in market prices. Our hydrocarbon inventories totaled approximately
30.5 million
barrels and
30.1 million
barrels at
December 31, 2018
and
December 31, 2017
, respectively. The average cost of our hydrocarbon inventories was approximately
$78.78
and
$80.21
per barrel on a LIFO basis at
December 31, 2018
and
December 31, 2017
, respectively, excluding the net impact of LCM inventory adjustments of approximately
$651.7 million
and
$300.5 million
, respectively. If market prices of our inventory decline to a level below our average cost, we may be required to write down the carrying value of our hydrocarbon inventories to market.
Our predominant variable operating cost is energy, which is comprised primarily of natural gas and electricity. We are therefore sensitive to movements in natural gas prices. Assuming normal operating conditions, we annually consume a total of between 68 million and 73 million MMBTUs of natural gas amongst our five refineries as of
December 31, 2018
. Accordingly, a $1.00 per MMBTU change in natural gas prices would increase or decrease our natural gas costs by approximately $68.0 million to $73.0 million.
Compliance Program Price Risk
We are exposed to market risks related to the volatility in the price of RINs required to comply with the RFS. Our overall RINs obligation is based on a percentage of our domestic shipments of on-road fuels as established by EPA. To the degree we are unable to blend the required amount of biofuels to satisfy our RINs obligation, we must purchase RINs on the open market. To mitigate the impact of this risk on our results of operations and cash flows we may purchase RINs when the price of these instruments is deemed favorable.
In addition, we are exposed to risks associated with complying with federal and state legislative and regulatory measures to address greenhouse gas and other emissions. Requirements to reduce emissions could result in increased costs to operate and maintain our facilities as well as implement and manage new emission controls and programs put in place. For example, AB32 in California requires the state to reduce its GHG emissions to 1990 levels by 2020.
103
Interest Rate Risk
The maximum commitment under our Revolving Credit Facility is
$3.4
billion. Borrowings under the Revolving Credit Facility bear interest either at the Alternative Base Rate plus the Applicable Margin or at Adjusted LIBOR plus the Applicable Margin, all as defined in the Revolving Credit Agreement. If this facility was fully drawn, a 1.0% change in the interest rate would increase or decrease our interest expense by approximately $20.6 million annually.
The PBFX Revolving Credit Facility, with a maximum commitment of
$500.0 million
, bears interest either at the Alternative Base Rate plus the Applicable Margin or at Adjusted LIBOR plus the Applicable Margin, all as defined in the PBFX Revolving Credit Agreement. If this facility was fully drawn, a 1.0% change in the interest rate would increase or decrease our interest expense by approximately $3.9 million annually.
In addition, the PBF Rail Term Loan, which bears interest at a variable rate, had an outstanding principal balance of
$21.6 million
at
December 31, 2018
. A 1.0% change in the interest rate would increase or decrease our interest expense by approximately
$0.2 million
annually, assuming the current outstanding principal balance on the PBF Rail Term Loan remained outstanding.
We also have interest rate exposure in connection with our Inventory Intermediation Agreements under which we pay a time value of money charge based on LIBOR.
Credit Risk
We are subject to risk of losses resulting from nonpayment or nonperformance by our counterparties. We continue to closely monitor the creditworthiness of customers to whom we grant credit and establish credit limits in accordance with our credit policy.
Concentration Risk
For the years ended
December 31, 2018
,
2017
and
2016
,
no
single customer accounted for 10% or more of our total sales.
No
single customer accounted for 10% or more of our total trade accounts receivable as of
December 31, 2018
and
2017
, respectively.
ITEM 8. FINANCIAL STATEMENTS AND SUPPLEMENTARY DATA
The information required by this item is set forth beginning on page F-1 of this Annual Report on Form 10-K.
ITEM 9. CHANGES IN AND DISAGREEMENTS WITH ACCOUNTANTS ON ACCOUNTING AND FINANCIAL DISCLOSURE
None.
ITEM 9A. CONTROLS AND PROCEDURES
Disclosure Controls and Procedures
PBF Energy and PBF LLC conducted separate evaluations under the supervision and with the participation of each company’s management, including the principal executive officer and principal financial officer, of the effectiveness of the disclosure controls and procedures (as defined in Rule 13a-15(e) under the Securities Exchange Act of 1934 as amended (the “Exchange Act”)) as of the end of the period covered by this report. Based upon these
104
evaluations, the principal executive officer and principal financial officer, in each case, concluded that the disclosure controls and procedures are effective.
Management’s Report on Internal Control over Financial Reporting - PBF Energy
PBF Energy’s management is responsible for establishing and maintaining adequate internal control over financial reporting as defined in Rule 13a-15(f) of the Exchange Act. PBF Energy’s internal control system is designed to provide reasonable assurance regarding the reliability of financial reporting and the preparation of financial statements for external purposes in accordance with generally accepted accounting principles in the United States of America. Due to its inherent limitations, internal control over financial reporting may not prevent or detect misstatements. Therefore, even those systems determined to be effective can provide only reasonable assurance with respect to financial statement preparation and presentation.
Management assessed the effectiveness of PBF Energy’s internal control over financial reporting as of
December 31, 2018
, using the criteria set forth by the Committee of Sponsoring Organizations of the Treadway Commission in Internal Control — Integrated Framework (2013). Based on such assessment, management concluded that as of
December 31, 2018
, PBF Energy’s internal control over financial reporting is effective.
Management’s Report on Internal Control over Financial Reporting - PBF LLC
PBF LLC’s management is responsible for establishing and maintaining adequate internal control over financial reporting as defined in Rule 13a-15(f) of the Exchange Act. PBF LLC’s internal control system is designed to provide reasonable assurance regarding the reliability of financial reporting and the preparation of financial statements for external purposes in accordance with generally accepted accounting principles in the United States of America. Due to its inherent limitations, internal control over financial reporting may not prevent or detect misstatements. Therefore, even those systems determined to be effective can provide only reasonable assurance with respect to financial statement preparation and presentation.
Management assessed the effectiveness of PBF LLC’s internal control over financial reporting as of
December 31, 2018
, using the criteria set forth by the Committee of Sponsoring Organizations of the Treadway Commission in Internal Control — Integrated Framework (2013). Based on such assessment, management concluded that as of
December 31, 2018
, PBF LLC’s internal control over financial reporting is effective.
Auditor Attestation Report
Our independent registered public accounting firm has issued an attestation report on the effectiveness of PBF Energy’s internal control over financial reporting, which is on page
F-
4 of this report.
Changes in Internal Control Over Financial Reporting
There has been no change in PBF Energy’s or PBF LLC’s internal control over financial reporting during the quarter ended
December 31, 2018
that has materially affected, or is reasonably likely to materially affect PBF Energy’s or PBF LLC’s internal control over financial reporting.
ITEM 9B. OTHER INFORMATION
None.
105
PART III
ITEM 10. DIRECTORS, EXECUTIVE OFFICERS AND CORPORATE GOVERNANCE
The information required under this Item will be contained in our
2019
Proxy Statement, incorporated herein by reference.
We have adopted a Code of Business Conduct and Ethics that applies to our principal executive officer, principal financial officer and principal accounting officer. The Code of Business Conduct and Ethics is available on our website at
www.pbfenergy.com
under the heading “Investors”. Any amendments to the Code of Business Conduct and Ethics or any grant of a waiver from the provisions of the Code of Business Conduct and Ethics requiring disclosure under applicable Securities and Exchange Commission rules will be disclosed on the Company’s website.
See also Executive Officers of the Registrant under “Item 1. Business” of this Annual Report on Form 10-K.
ITEM 11. EXECUTIVE COMPENSATION
The information required under this Item will be contained in our
2019
Proxy Statement, incorporated herein by reference.
ITEM 12. SECURITY OWNERSHIP OF CERTAIN BENEFICIAL OWNERS AND MANAGEMENT AND RELATED STOCKHOLDER MATTERS
Information required by this Item, including Securities Authorized for Issuance Under Equity Compensation Plans, will be contained in our
2019
Proxy Statement, incorporated herein by reference.
ITEM 13. CERTAIN RELATIONSHIPS AND RELATED TRANSACTIONS, AND DIRECTOR INDEPENDENCE
The information required under this Item will be contained in our
2019
Proxy Statement, incorporated herein by reference.
ITEM 14. PRINCIPAL ACCOUNTING FEES AND SERVICES
The information required under this Item will be contained in our
2019
Proxy Statement, incorporated herein by reference.
106
PART IV
ITEM 15. EXHIBITS AND FINANCIAL STATEMENT SCHEDULES
(a) 1. Financial Statements.
The consolidated financial statements of PBF Energy Inc., PBF Energy Company LLC and their subsidiaries, required by Part II, Item 8, are included in Part IV of this report. See Index to Consolidated Financial Statements beginning on page F-1.
2. Financial Statement Schedules and Other Financial Information
. No financial statement schedules are submitted because either they are not applicable or because the required information is included in the consolidated financial statements or notes thereto.
3. Exhibits
. Filed as part of this Annual Report on Form 10-K are the following exhibits:
|
Number
|
|
Description
|
|
Contribution Agreement dated as of February 15, 2017 by and between PBF Energy Company LLC and PBF Logistics LP (incorporated by reference to Exhibit 2.1 of PBF Energy Inc.’s Current Report on Form 8-K (File No. 001-35764) filed on February 22, 2017).
|
||
|
Contribution Agreement dated as of August 31, 2016 by and between PBF Energy Company LLC and PBF Logistics LP (incorporated by reference to Exhibit 2.1 filed with PBF Energy Inc.’s Current Report on Form 8-K dated September 7, 2016 (File No. 001-35764)).
|
||
|
Contribution Agreement dated as of February 15, 2017 by and between PBF Energy Company LLC and PBF Logistics LP (incorporated by reference to Exhibit 2.1 filed with PBF Energy Inc.’s Current Report on Form 8-K dated February 22, 2017 (File No. 001-35764)).
|
||
|
Purchase Agreement dated as of January 29, 2016 by and between PBF Logistics Products Terminals LLC and Plains Products Terminals LLC (incorporated by reference to Exhibit 2.1 filed with PBF Logistics LP’s Current Report on Form 8-K dated February 4, 2016 (File No. 001-36446)).
|
||
|
Sale and Purchase Agreement by and between PBF Holding Company LLC and ExxonMobil Oil Corporation and its subsidiary, Mobil Pacific Pipeline Company as of September 29, 2015 (incorporated by reference to Exhibit 2.1 filed with PBF Energy Inc.’s Current Report on Form 8-K dated October 1, 2015 (File No. 001-35764)).
|
||
|
Sale and Purchase Agreement by and between PBF Holding Company LLC, ExxonMobil Oil Corporation, Mobil Pipe Line Company and PDV Chalmette, L.L.C. as of June 17, 2015 (incorporated by reference to Exhibit 2.1 filed with PBF Energy Inc.’s Current Report on Form 8-K dated June 17, 2015 (File No. 001-35764)).
|
||
|
Purchase and Sale Agreement dated July 16, 2018, among Crown Point International, LLC, as Seller, PBF Logistics LP, as Purchaser and, CPI Operations LLC, for the limited purposes set forth therein (incorporated by reference to Exhibit 2.1 filed with PBF Logistics LP’s Current Report on Form 8-K dated July 20, 2018 (File No. 001-36446)).
|
||
|
Amended and Restated Certificate of Incorporation of PBF Energy Inc. (incorporated by reference to Exhibit 3.1 filed with PBF Energy Inc.’s Amendment No. 4 to Registration Statement on Form S-1 (Registration No. 333-177933)).
|
||
|
Amended and Restated Bylaws of PBF Energy Inc. (incorporated by reference to Exhibit 3.1 filed with PBF Energy Inc.’s Current Report on Form 8-K dated February 15, 2017 (File No. 001-35764)).
|
||
|
Indenture dated as of May 30, 2017, among PBF Holding Company LLC, PBF Finance Corporation, the Guarantors named on the signature pages thereto, Wilmington Trust, National Association, as Trustee and Deutsche Bank Trust Company Americas, as Paying Agent, Registrar, Transfer Agent and Authenticating Agent and Form of 7.25% Senior Note (included as Exhibit A) (incorporated by reference to Exhibit 4.1 of PBF Energy Inc.’s Current Report on Form 8-K (File No. 001-35764) filed on May 30, 2017).
|
||
107
|
Indenture dated May 12, 2015, among PBF Logistics LP, PBF Logistics Finance Corporation, the Guarantors named therein and Deutsche Bank Trust Company Americas, as Trustee and Form of Note (included as Exhibit A) (incorporated by reference to Exhibit 4.1 filed with PBF Energy Inc.’s Current Report on Form 8-K dated May 18, 2015 (File No. 001-35764)).
|
||
|
Supplemental Indenture dated June 19, 2015, among PBF Logistics LP, PBF Logistics Finance Corporation, the Guarantors named therein and Deutsche Bank Trust Company Americas, as trustee (incorporated by reference to Exhibit 4.2 filed with PBF Logistics LP’s Registration Statement on Form S-4 (Registration No. 333-206728)).
|
||
|
Second Supplemental Indenture dated June 28, 2016, among PBF Products Terminals LLC, PBF Logistics LP, PBF Logistics Finance Corporation, and Deutsche Bank Trust Company Americas, as trustee (incorporated by reference to Exhibit 4.2 filed with PBF Logistics LP’s Quarterly Report on Form 10-Q dated August 4, 2016 (File No. 001-36446)).
|
||
|
Third Supplemental Indenture dated as of October 24, 2016, among Torrance Valley Pipeline Company LLC, PBFX Operating Company LLC, PBF Logistics LP, PBF Logistics Finance Corporation, and Deutsche Bank Trust Company Americas, as trustee (incorporated by reference herein to Exhibit 4.8 to the Annual Report on Form 10-K (File No. 001-36446) filed on February 24, 2017).
|
||
|
Fourth Supplemental Indenture dated as of March 13, 2017, among Paulsboro Natural Gas Pipeline Company LLC, PBF Logistics LP, PBF Logistics Finance Corporation, and Deutsche Bank Trust Company Americas, as trustee (incorporated by reference herein to Exhibit 4.2 to the Quarterly Report on Form 10-Q for the quarter ended March 31, 2017 (File No. 001-36446) filed on May 4, 2017).
|
||
|
Fifth Supplemental Indenture dated October 6, 2017, among PBF Logistics LP, PBF Logistics Finance Corporation, the Guarantors named therein and Deutsche Bank Trust Company Americas, as Trustee (incorporated by reference to Exhibit 4.1 of PBF Energy Inc.’s Current Report on Form 8-K (File No. 001-35764) filed on October 6, 2017).
|
||
|
Sixth Supplemental Indenture dated as of September 11, 2018, among DCR Storage and Loading LLC, Chalmette Logistics Company LLC, Toledo Rail Logistics Company LLC, Paulsboro Terminaling Company LLC, PBF Logistics LP, PBF Logistics Finance Corporation, and Deutsche Bank Trust Company Americas, as trustee (incorporated by reference to Exhibit 4.1 filed with PBF Logistics LP’s Quarterly Report on Form 10-Q dated October 31, 2018 (File No. 001-36446)).
|
||
|
Joinder Agreement dated May 26, 2016, among PBF Logistics Products Terminals LLC and Wells Fargo Bank, National Association, as Administrative Agent (incorporated by reference to Exhibit 4.1 filed with PBF Logistics LP’s Quarterly Report on Form 10-Q dated August 4, 2016 (File No. 001-36446)).
|
||
|
Amended and Restated Registration Rights Agreement of PBF Energy Inc. dated as of December 12, 2012 (incorporated by reference to Exhibit 4.1 filed with PBF Energy Inc.’s Current Report on Form 8-K dated December 18, 2012 (File No. 001-35764)).
|
||
|
PBF Energy Inc. Amended and Restated 2012 Equity Incentive Plan (incorporated by reference to DEF 14A filed with PBF Energy Inc.’s Proxy Statement dated March 22, 2016 (File No. 001-35764)).
|
||
|
PBF Energy Inc. Amended and Restated 2017 Equity Incentive Plan (incorporated by reference to Appendix A to PBF Energy Inc.’s Definitive Proxy Statement on Schedule 14A filed on April 13, 2018 (File No. 001-35764)).
|
||
|
Form of PBF Energy Non-Qualified Stock Option Agreement under the Amended and Restated PBF Energy Inc. 2017 Equity Incentive Plan (incorporated by reference to Exhibit 10.1 filed with PBF Energy Inc.’s Current Report on Form 8-K dated November 2, 2018 (File No. 001-35764)).
|
||
108
|
Form of PBF Energy Performance Share Unit Award Agreement under the Amended and Restated PBF Energy Inc. 2017 Equity Incentive Plan (incorporated by reference to Exhibit 10.2 filed with PBF Energy Inc.’s Current Report on Form 8-K dated November 2, 2018 (File No. 001-35764)).
|
||
|
Form of PBF Energy Performance Unit Award Agreement under the Amended and Restated PBF Energy Inc. 2017 Equity Incentive Plan (incorporated by reference to Exhibit 10.3 filed with PBF Energy Inc.’s Current Report on Form 8-K dated November 2, 2018 (File No. 001-35764)).
|
||
|
Form of Non-Qualified Stock Option Agreement under the PBF Energy Inc. 2012 Equity Incentive Plan (incorporated by reference to Exhibit 10.28 filed with PBF Energy Inc.’s Amendment No. 6 to Registration Statement on Form S-1 (Registration No. 333-177933)).
|
||
|
Form of Restricted Stock Award Agreement for Non- Employee Directors under the PBF Energy Inc. 2012 Equity Incentive Plan. (incorporated by reference to Exhibit 10.1 filed with PBF Energy Inc.’s Quarterly Report on Form 10-Q dated November 7, 2014 (File No. 001-35764)).
|
||
|
Form of 2016 Restricted Stock Award Agreement for Non-Employee Directors under PBF Energy Inc. 2012 Equity Incentive Plan (incorporated by reference to Exhibit 10.1 filed with PBF Energy Inc.’s Quarterly Report on Form 10-Q dated May 5, 2016 (File No. 001-35764)).
|
||
|
Form of Restricted Stock Agreement for Employees, under PBF Energy Inc. 2012 Equity Incentive Plan (incorporated by reference to Exhibit 10.1 filed with PBF Energy Inc.’s Quarterly Report on Form 10-Q dated November 4, 2016 (File No. 001-35764)).
|
||
|
Form of Restricted Stock Agreement for Directors under the PBF Energy Inc. 2017 Equity Incentive Plan (incorporated by reference to Exhibit 10.4 filed with PBF Energy Inc.’s Quarterly Report on Form 10-Q dated August 3, 2017 (File No. 001-35764)).
|
||
|
Form of 2017 Equity Incentive Plan Restricted Stock Agreement (incorporated by reference to Exhibit 10.1 of PBF Energy Inc.’s Current Report on Form 8-K (File No. 001-35764) filed on October 31, 2017).
|
||
|
Form of 2017 Equity Incentive Plan Non-Qualified Stock Agreement (incorporated by reference to Exhibit 10.2 of PBF Energy Inc.’s Current Report on Form 8-K (File No. 001-35764) filed on October 31, 2017).
|
||
|
Amended and Restated Restricted Stock Agreement for non-employee Directors under the PBF Energy Inc. 2017 Equity Incentive Plan. (incorporated by reference to Exhibit 10.3 of PBF Energy Inc.’s Annual Report on Form 10-K (File No. 001-35764) filed on February 23, 2018).
|
||
|
Form of Amended and Restated Restricted Stock Agreement, under PBF Energy Inc. 2017 Equity Incentive Plan (incorporated by reference to Exhibit 10.7 of PBF Energy Inc.’s Annual Report on Form 10-K (File No. 001-35764) filed on February 23, 2018).
|
||
|
Form of Amended and Restated Non-Qualified Stock Option Agreement under the PBF Energy Inc. 2017 Equity Incentive Plan (incorporated by reference to Exhibit 10.1 filed with PBF Energy Inc.’s Current Report on Form 8-K dated February 16, 2018 (File No. 001-35764)).
|
||
|
Fifth Amended and Restated Operation and Management Services and Secondment Agreement dated as of February 28, 2017 among PBF Holding Company LLC, Delaware City Refining Company LLC, Toledo Refining Company LLC, Torrance Refining Company LLC, Torrance Logistics Company LLC, PBF Logistics GP LLC , PBF Logistics LP, Delaware City Terminaling Company LLC, Delaware Pipeline Company LLC, Delaware City Logistics Company LLC, Toledo Terminaling Company LLC, PBFX Operating Company LLC, Paulsboro Refining Company LLC, Paulsboro Natural Gas Pipeline Company LLC and Chalmette Refining L.L.C. (incorporated by reference to Exhibit 10.1 of PBF Energy Inc.’s Current Report on Form 8-K (File No. 001-35764) filed on March 3, 2017).
|
||
|
Transportation Services Agreement dated as of August 31, 2016 among PBF Holding Company LLC and Torrance Valley Pipeline Company LLC (incorporated by reference to Exhibit 10.3 filed with PBF Energy Inc.’s Current Report on Form 8-K dated September 7, 2016 (File No. 001-35764)).
|
||
109
|
Pipeline Service Order dated as of August 31, 2016, by and between Torrance Valley Pipeline Company LLC, and PBF Holding Company LLC (incorporated by reference to Exhibit 10.4 filed with PBF Energy Inc.’s Current Report on Form 8-K dated September 7, 2016 (File No. 001-35764)).
|
||
|
Pipeline Service Order dated as of August 31, 2016, by and between Torrance Valley Pipeline Company LLC, and PBF Holding Company LLC (incorporated by reference to Exhibit 10.5 filed with PBF Energy Inc.’s Current Report on Form 8-K dated September 7, 2016 (File No. 001-35764)).
|
||
|
Dedicated Storage Service Order dated as of August 31, 2016, by and between Torrance Valley Pipeline Company LLC, and PBF Holding Company LLC (incorporated by reference to Exhibit 10.6 filed with PBF Energy Inc.’s Current Report on Form 8-K dated September 7, 2016 (File No. 001-35764)).
|
||
|
Throughput Storage Service Order dated as of August 31, 2016, by and between Torrance Valley Pipeline Company LLC, and PBF Holding Company LLC (incorporated by reference to Exhibit 10.7 filed with PBF Energy Inc.’s Current Report on Form 8-K dated September 7, 2016 (File No. 001-35764)).
|
||
|
Senior Secured Revolving Credit Agreement dated as of May 2, 2018 (incorporated by reference to Exhibit 10.1 filed with PBF Energy Inc.’s Current Report on Form 8-K dated May 7, 2018 (File No. 001-35764)).
|
||
|
Fifth Amended and Restated Omnibus Agreement dated as of July 31, 2018, among PBF Holding Company LLC, PBF Energy Company LLC, PBF Logistics GP LLC and PBF Logistics LP (incorporated by reference to Exhibit 10.2 filed with PBF Logistics LP’s Quarterly Report on Form 10-Q dated October 31, 2018 (File No. 001-36446)).
|
||
|
Sixth Amended and Restated Operation and Management Services and Secondment Agreement dated as of July 31, 2018, among PBF Holding Company LLC, Delaware City Refining Company LLC, Toledo Refining Company LLC, Torrance Refining Company LLC, Torrance Logistics Company LLC, Chalmette Refining L.L.C., Paulsboro Refining Company LLC, PBF Logistics GP LLC, PBF Logistics LP, DCR Storage and Loading LLC, Delaware City Terminaling Company LLC, Toledo Terminaling Company LLC, Delaware Pipeline Company LLC, Delaware City Logistics Company LLC, Paulsboro Terminaling Company LLC, Paulsboro Natural Gas Pipeline Company LLC, Toledo Rail Logistics Company LLC, Chalmette Logistics Company LLC and PBFX Operating Company LLC (incorporated by reference to Exhibit 10.3 filed with PBF Logistics LP’s Quarterly Report on Form 10-Q dated October 31, 2018 (File No. 001-36446)).
|
||
|
Joinder Agreement dated as of September 7, 2018, among DCR Storage and Loading LLC, Chalmette Logistics Company LLC, Toledo Rail Logistics Company LLC, Paulsboro Terminaling Company LLC and Wells Fargo Bank, National Association, as Administrative Agent (incorporated by reference to Exhibit 10.4 filed with PBF Logistics LP’s Quarterly Report on Form 10-Q dated October 31, 2018 (File No. 001-36446)).
|
||
|
Delaware Pipeline Services Agreement dated as of May 15, 2015 among PBF Holding Company LLC and Delaware Pipeline Company LLC (incorporated by reference to Exhibit 10.3 filed with PBF Energy Inc.’s Current Report on Form 8-K dated May 12, 2015 (File No. 001-35764)).
|
||
|
Delaware City Truck Loading Services Agreement dated as of May 15, 2015 among PBF Holding Company LLC and Delaware City Logistics Company LLC (incorporated by reference to Exhibit 10.4 filed with PBF Energy Inc.’s Current Report on Form 8-K dated May 12, 2015 (File No. 001-35764)).
|
||
|
Inventory Intermediation Agreement dated as of May 29, 2015 (as amended) between J. Aron & Company and PBF Holding Company LLC and Paulsboro Refining Company LLC (incorporated by reference to Exhibit 10.9 filed with PBF Energy Inc.’s Quarterly Report on Form 10-Q dated August 6, 2015 (File No. 001-35764)).
|
||
|
Inventory Intermediation Agreement dated as of May 29, 2015 (as amended) between J. Aron & Company and PBF Holding Company LLC and Delaware City Refining Company LLC (incorporated by reference to Exhibit 10.10 filed with PBF Energy Inc.’s Quarterly Report on Form 10-Q dated August 6, 2015 (File No. 001-35764)).
|
||
110
|
Amendment to the Inventory Intermediation Agreement dated as of May 4, 2017, among J. Aron & Company, PBF Holding Company LLC and Paulsboro Refining Company LLC (incorporated by reference to Exhibit 10.1 filed with PBF Energy Inc.’s Quarterly Report on Form 10-Q dated August 3, 2017 (File No. 001-35764)).
|
||
|
Amendment to the Inventory Intermediation Agreement dated as of May 4, 2017, among J. Aron & Company, PBF Holding Company LLC and Delaware City Refining Company LLC (incorporated by reference to Exhibit 10.2 filed with PBF Energy Inc.’s Quarterly Report on Form 10-Q dated August 3, 2017 (File No. 001-35764)).
|
||
|
Amendment to the Inventory Intermediation Agreement dated as of September 8, 2017, among J. Aron & Company, PBF Holding Company LLC and Delaware City Refining Company LLC (incorporated by reference to Exhibit 10.2 of PBF Energy Inc.’s Current Report on Form 8-K/A (File No. 001-35764) filed on September 18, 2017).
|
||
|
Amendment to the Inventory Intermediation Agreement dated as of September 8, 2017, among J. Aron & Company, PBF Holding Company LLC and Paulsboro Refining Company LLC (incorporated by reference to Exhibit 10.1 of PBF Energy Inc.’s Current Report on Form 8-K/A (File No. 001-35764) filed on September 18, 2017).
|
||
|
Delaware City Rail Terminaling Services Agreement, dated as of May 14, 2014 (incorporated by reference to Exhibit 10.4 filed with PBF Energy Inc.’s Current Report on Form 8-K dated May 14, 2014 (File No. 001-35764)).
|
||
|
10.35
|
Amended and Restated Toledo Truck Unloading & Terminaling Agreement effective as of June 1, 2014 (incorporated by reference to Exhibit 10.10 filed with PBF Energy Inc.’s Quarterly Report on Form 10-Q dated August 7, 2014 (File No. 001-35764)).
|
|
|
Assignment and Amendment of Amended and Restated Toledo Truck Unloading & Terminaling Agreement dated as of December 12, 2014 by and between PBF Holding Company LLC, PBF Logistics LP and Toledo Terminaling Company LLC (incorporated by reference to Exhibit 10.4 filed with PBF Logistics LP’s Current Report on Form 8-K dated December 16, 2014 (File No. 001-36446)).
|
||
|
Lease Agreement dated as of February 15, 2017 by and between PBFX Operating Company LLC and Chalmette Refining, L.L.C. (incorporated by reference to Exhibit 10.3 of PBF Energy Inc.’s Current Report on Form 8-K (File No. 001-35764) filed on February 22, 2017).
|
||
|
Storage Services Agreement dated as of February 15, 2017 by and between PBFX Operating Company LLC and PBF Holding Company LLC (incorporated by reference to Exhibit 10.1 of PBF Energy Inc.’s Current Report on Form 8-K (File No. 001-35764) filed on February 22, 2017).
|
||
|
Amended and Restated Guaranty of Collection, dated as of October 6, 2017 (incorporated by reference to Exhibit 10.1 of PBF Energy Inc.’s Current Report on Form 8-K (File No. 001-35764) filed on October 6, 2017).
|
||
|
Reaffirmation Agreement, dated as of December 5, 2014, by PBF Energy Company LLC with respect to the Amended and Restated Guaranty of Collection (incorporated by reference to Exhibit 10.8.1 filed with PBF Energy Inc.’s Quarterly Report on Form 10-Q dated August 6, 2015 (File No. 001-35764)).
|
||
|
Designation of Other Guaranteed Revolving Credit Obligations, dated as of December 12, 2014 with respect to the Amended and Restated Guaranty of Collection (incorporated by reference to Exhibit 10.8.2 filed with PBF Energy Inc.’s Quarterly Report on Form 10-Q dated August 6, 2015 (File No. 001-35764)).
|
||
|
Amended and Restated Revolving Credit Agreement dated as of July 30, 2018, among PBF Logistics LP, the lender party hereto and Wells Fargo Bank, National Association as Administrative Agent (incorporated by reference to Exhibit 10.1 filed with PBF Energy Inc.’s Current Report on Form 8-K dated August 2, 2018 (File No. 001-35764)).
|
||
|
Second Amended and Restated Agreement of Limited Partnership of PBF Logistics LP dated as of September 15, 2014 (incorporated by reference to Exhibit 3.1 filed with PBF Logistics LP’s Current Report on Form 8-K dated September 19, 2014 (File No. 001-36446)).
|
||
111
|
Amended and Restated Delaware City Rail Terminaling Services Agreement (incorporated by reference to Exhibit 10.1 filed with PBF Logistics LP’s Quarterly Report on Form 10-Q dated May 3, 2018 (File No. 001-36446)).
|
||
|
Amended and Restated Delaware City West Ladder Rack Terminaling Services Agreement (incorporated by reference to Exhibit 10.2 filed with PBF Logistics LP’s Quarterly Report on Form 10-Q dated May 3, 2018 (File No. 001-36446)).
|
||
|
Storage and Terminaling Services Agreement dated as of December 12, 2014 among PBF Holding Company LLC and Toledo Terminaling Company LLC (incorporated by reference to Exhibit 10.3 to the Current Report on Form 8-K filed on December 16, 2014 (File No. 001-36446)).
|
||
|
Amended and Restated Limited Liability Company Agreement of PBF Energy Company LLC (incorporated by reference to Exhibit 10.1 filed with PBF Energy Inc.’s Current Report on Form 8-K dated December 18, 2012 (File No. 001-35764)).
|
||
|
Exchange Agreement, dated as of December 12, 2012 (incorporated by reference to Exhibit 10.3 filed with PBF Energy Inc.’s Current Report on Form 8-K dated December 18, 2012 (File No. 001-35764)).
|
||
|
Tax Receivable Agreement, dated as of December 12, 2012 (incorporated by reference to Exhibit 10.2 filed with PBF Energy Inc.’s Current Report on Form 8-K dated December 18, 2012 (File No. 001-35764)).
|
||
|
Restated Warrant and Purchase Agreement between PBF Energy Company LLC and the officers party thereto, as amended (incorporated by reference to Exhibit 10.17 filed with PBF Energy Inc.’s Amendment No. 4 to Registration Statement on Form S-1 (Registration No. 333-177933)).
|
||
|
Form of Indemnification Agreement between PBF Energy Inc. and each of the executive officers and directors of PBF Energy Inc. (incorporated by reference to Exhibit 10.5 filed with PBF Energy Inc.’s Current Report on Form 8-K dated December 18, 2012 (File No. 001-35764)).
|
||
|
PBF Logistics LP 2014 Long-Term Incentive Plan, adopted as of May 14, 2014 (incorporated by reference to Exhibit 10.8 filed with PBF Logistics LP’s Current Report on Form 8-K dated May 14, 2014 (File No. 001-36446)).
|
||
|
Form of Phantom Unit Agreement for Employees, under the PBF Logistics LP 2014 Long-Term Incentive Plan (incorporated by reference to Exhibit 10.8 filed with PBF Logistics LP’s Registration Statement on Form S-1, as amended, originally filed on April 22, 2014 (File No. 333-195024)).
|
||
|
Form of Phantom Unit Agreement for Non-Employee Directors, under the PBF Logistics LP 2014 Long-Term Incentive Plan (incorporated by reference to Exhibit 10.7 filed with PBF Logistics LP’s Registration Statement on Form S-1, as amended originally filed on April 22, 2014 (File No. 333-195024)).
|
||
|
Form of Indemnification Agreement between PBF Logistics LP, PBF Logistics GP LLC and each of the executive officers and directors of PBF Logistics LP and PBF Logistics GP LLC (incorporated by reference to Exhibit 10.11 filed with PBF Logistics LP’s Registration Statement on Form S-1, as amended, originally filed on April 22, 2014 (File No. 333-195024)).
|
||
|
Employment Agreement dated as of September 4, 2014 between PBF Investments LLC and Thomas O’Connor (incorporated by reference to Exhibit 10.9 filed with PBF Energy Inc.’s Annual Report on Form 10-K dated February 29, 2016 (File No. 001-35764)).
|
||
|
Employment Agreement dated as of April 1, 2014 between PBF Investments LLC and Timothy Paul Davis (incorporated by reference to Exhibit 10.4 filed with PBF Energy Inc.’s Quarterly Report on Form 10-Q dated May 7, 2014 (File No. 001-35764)).
|
||
|
Employment Agreement dated as of April 1, 2014 between PBF Investments LLC and Erik Young. (incorporated by reference to Exhibit 10.2 filed with PBF Energy Inc.’s Quarterly Report on Form 10-Q dated May 7, 2014 (File No. 001-35764)).
|
||
112
|
Amended and Restated Employment Agreement dated as of December 17, 2012, between PBF Investments LLC and Thomas J. Nimbley (incorporated by reference to Exhibit 10.8 filed with PBF Energy Inc.’s Current Report on Form 8-K dated December 18, 2012 (File No. 001-35764)).
|
||
|
Second Amended and Restated Employment Agreement, dated as of December 17, 2012, between PBF Investments LLC and Matthew C. Lucey (incorporated by reference to Exhibit 10.9 filed with PBF Energy Inc.’s Current Report on Form 8-K dated December 18, 2012 (File No. 001-35764)).
|
||
|
Subsidiaries of PBF Energy and PBF Energy Company LLC
|
||
|
Consent of Deloitte & Touche LLP
|
||
|
Consent of Deloitte & Touche LLP
|
||
|
Power of Attorney (included on signature page)
|
||
|
Certification by Chief Executive Officer of PBF Energy Inc. pursuant to Rule 13a-14(a)/15d-14(a), as adopted pursuant to Section 302 of the Sarbanes-Oxley Act of 2002
|
||
|
Certification by Chief Financial Officer of PBF Energy Inc. pursuant to Rule 13a-14(a)/15d-14(a), as adopted pursuant to Section 302 of the Sarbanes-Oxley Act of 2002
|
||
|
Certification by Chief Executive Officer of PBF Energy Company LLC pursuant to Rule 13a-14(a)/15d-14(a), as adopted pursuant to Section 302 of the Sarbanes-Oxley Act of 2002
|
||
|
Certification by Chief Financial Officer of PBF Energy Company LLC pursuant to Rule 13a-14(a)/15d-14(a), as adopted pursuant to Section 302 of the Sarbanes-Oxley Act of 2002
|
||
|
Certification by Chief Executive Officer of PBF Energy Inc. pursuant to 18 U.S.C. Section 1350, as adopted pursuant to Section 906 of the Sarbanes-Oxley Act of 2002
|
||
|
Certification by Chief Financial Officer of PBF Energy Inc. pursuant to 18 U.S.C. Section 1350, as adopted pursuant to Section 906 of the Sarbanes-Oxley Act of 2002
|
||
|
Certification by Chief Executive Officer of PBF Energy Company LLC pursuant to 18 U.S.C. Section 1350, as adopted pursuant to Section 906 of the Sarbanes-Oxley Act of 2002
|
||
|
Certification by Chief Financial Officer of PBF Energy Company LLC pursuant to 18 U.S.C. Section 1350, as adopted pursuant to Section 906 of the Sarbanes-Oxley Act of 2002
|
||
|
101.INS
|
XBRL Instance Document.
|
|
|
101.SCH
|
XBRL Taxonomy Extension Schema Document.
|
|
|
101.CAL
|
XBRL Taxonomy Extension Calculation Linkbase Document.
|
|
|
101.DEF
|
XBRL Taxonomy Extension Definition Linkbase Document.
|
|
|
101.LAB
|
XBRL Taxonomy Extension Label Linkbase Document.
|
|
|
101.PRE
|
XBRL Taxonomy Extension Presentation Linkbase Document.
|
|
——————————
113
|
*
|
Filed herewith.
|
|
**
|
Indicates management compensatory plan or arrangement.
|
|
†
|
Confidential treatment has been granted by the SEC as to certain portions, which portions have been omitted and filed separately with the SEC.
|
|
(1)
|
This exhibit should not be deemed to be “filed” for purposes of Section 18 of the Exchange Act.
|
114
PBF ENERGY INC. AND PBF ENERGY COMPANY LLC
INDEX TO CONSOLIDATED FINANCIAL STATEMENTS
|
|
||
|
PBF Energy Inc.
|
||
|
PBF Energy Company LLC
|
||
F-1
REPORT OF INDEPENDENT REGISTERED PUBLIC ACCOUNTING FIRM
To the Board of Directors and Stockholders of PBF Energy Inc. and subsidiaries
Opinion on the Financial Statements
We have audited the accompanying consolidated balance sheets of PBF Energy Inc. and subsidiaries (the "Company") as of December 31, 2018 and 2017, the related consolidated statements of operations, comprehensive income, changes in equity, and cash flows, for each of the three years in the period ended December 31, 2018, and the related notes (collectively referred to as the "financial statements"). In our opinion, the financial statements present fairly, in all material respects, the financial position of the Company as of December 31, 2018 and 2017, and the results of its operations and its cash flows for each of the three years in the period ended December 31, 2018, in conformity with accounting principles generally accepted in the United States of America.
We have also audited, in accordance with the standards of the Public Company Accounting Oversight Board (United States) (PCAOB), the Company's internal control over financial reporting as of December 31, 2018, based on criteria established in
Internal Control - Integrated Framework (2013)
issued by the Committee of Sponsoring Organizations of the Treadway Commission and our report dated February 21, 2019, expressed an unqualified opinion on the Company's internal control over financial reporting.
Basis for Opinion
These financial statements are the responsibility of the Company's management. Our responsibility is to express an opinion on the Company's financial statements based on our audits. We are a public accounting firm registered with the PCAOB and are required to be independent with respect to the Company in accordance with the U.S. federal securities laws and the applicable rules and regulations of the Securities and Exchange Commission and the PCAOB.
We conducted our audits in accordance with the standards of the PCAOB. Those standards require that we plan and perform the audit to obtain reasonable assurance about whether the financial statements are free of material misstatement, whether due to error or fraud. Our audits included performing procedures to assess the risks of material misstatement of the financial statements, whether due to error or fraud, and performing procedures that respond to those risks. Such procedures included examining, on a test basis, evidence regarding the amounts and disclosures in the financial statements. Our audits also included evaluating the accounting principles used and significant estimates made by management, as well as evaluating the overall presentation of the financial statements. We believe that our audits provide a reasonable basis for our opinion.
/s/ Deloitte & Touche LLP
Parsippany, New Jersey
February 21, 2019
We have served as the Company's auditor since 2011.
F- 2
REPORT OF INDEPENDENT REGISTERED PUBLIC ACCOUNTING FIRM
To PBF Energy Inc., the Managing Member of PBF Energy Company LLC
Opinion on the Financial Statements
We have audited the accompanying consolidated balance sheets of PBF Energy Company LLC and subsidiaries (the "Company") as of December 31, 2018 and 2017, the related consolidated statements of operations, comprehensive income, changes in equity, and cash flows, for each of the three years in the period ended December 31, 2018, and the related notes (collectively referred to as the "financial statements"). In our opinion, the financial statements present fairly, in all material respects, the financial position of the Company as of December 31, 2018 and 2017, and the results of its operations and its cash flows for each of the three years in the period ended December 31, 2018, in conformity with
accounting principles generally accepted in the United States of America.
Basis for Opinion
These financial statements are the responsibility of the Company's management. Our responsibility is to express an opinion on the Company's financial statements based on our audits. We are a public accounting firm registered with the Public Company Accounting Oversight Board (United States) (PCAOB) and are required to be independent with respect to the Company in accordance with the U.S. federal securities laws and the applicable rules and regulations of the Securities and Exchange Commission and the PCAOB.
We conducted our audits in accordance with the standards of the PCAOB. Those standards require that we plan and perform the audit to obtain reasonable assurance about whether the financial statements are free of material misstatement, whether due to error or fraud. The Company is not required to have, nor were we engaged to perform, an audit of its internal control over financial reporting. As part of our audits, we are required to obtain an understanding of internal control over financial reporting but not for the purpose of expressing an opinion on the effectiveness of the Company’s internal control over financial reporting. Accordingly, we express no such opinion.
Our audits included performing procedures to assess the risks of material misstatement of the financial statements, whether due to error or fraud, and performing procedures that respond to those risks. Such procedures included examining, on a test basis, evidence regarding the amounts and disclosures in the financial statements. Our audits also included evaluating the accounting principles used and significant estimates made by management, as well as evaluating the overall presentation of the financial statements. We believe that our audits provide a reasonable basis for our opinion.
/s/ Deloitte & Touche LLP
Parsippany, New Jersey
February 21, 2019
We have served as the Company's auditor since 2011.
F- 3
REPORT OF INDEPENDENT REGISTERED PUBLIC ACCOUNTING FIRM
To the Board of Directors and Stockholders of PBF Energy Inc. and subsidiaries
Opinion on Internal Control over Financial Reporting
We have audited the internal control over financial reporting of PBF Energy Inc. and subsidiaries (the “Company”) as of December 31, 2018, based on criteria established in
Internal Control - Integrated Framework (2013)
issued by the Committee of Sponsoring Organizations of the Treadway Commission (COSO). In our opinion, the Company maintained, in all material respects, effective internal control over financial reporting as of December 31, 2018, based on criteria established in
Internal Control - Integrated Framework (2013)
issued by COSO.
We have also audited, in accordance with the standards of the Public Company Accounting Oversight Board (United States) (PCAOB), the consolidated financial statements as of and for the year ended December 31, 2018, of the Company and our report dated February 21, 2019, expressed an unqualified opinion on those financial statements.
Basis for Opinion
The Company’s management is responsible for maintaining effective internal control over financial reporting and for its assessment of the effectiveness of internal control over financial reporting, included in the accompanying Management’s Report on Internal Control over Financial Reporting. Our responsibility is to express an opinion on the Company’s internal control over financial reporting based on our audit. We are a public accounting firm registered with the PCAOB and are required to be independent with respect to the Company in accordance with the U.S. federal securities laws and the applicable rules and regulations of the Securities and Exchange Commission and the PCAOB.
We conducted our audit in accordance with the standards of the PCAOB. Those standards require that we plan and perform the audit to obtain reasonable assurance about whether effective internal control over financial reporting was maintained in all material respects. Our audit included obtaining an understanding of internal control over financial reporting, assessing the risk that a material weakness exists, testing and evaluating the design and operating effectiveness of internal control based on the assessed risk, and performing such other procedures as we considered necessary in the circumstances. We believe that our audit provides a reasonable basis for our opinion.
Definition and Limitations of Internal Control over Financial Reporting
A company’s internal control over financial reporting is a process designed to provide reasonable assurance regarding the reliability of financial reporting and the preparation of financial statements for external purposes in accordance with generally accepted accounting principles. A company’s internal control over financial reporting includes those policies and procedures that (1) pertain to the maintenance of records that, in reasonable detail, accurately and fairly reflect the transactions and dispositions of the assets of the company; (2) provide reasonable assurance that transactions are recorded as necessary to permit preparation of financial statements in accordance with generally accepted accounting principles, and that receipts and expenditures of the company are being made only in accordance with authorizations of management and directors of the company; and (3) provide reasonable assurance regarding prevention or timely detection of unauthorized acquisition, use, or disposition of the company’s assets that could have a material effect on the financial statements.
Because of its inherent limitations, internal control over financial reporting may not prevent or detect misstatements. Also, projections of any evaluation of effectiveness to future periods are subject to the risk that controls may become inadequate because of changes in conditions, or that the degree of compliance with the policies or procedures may deteriorate.
/s/
Deloitte & Touche LLP
Parsippany, New Jersey
February 21, 2019
F- 4
PBF ENERGY INC.
CONSOLIDATED BALANCE SHEETS
(in thousands, except share and per share data)
|
December 31,
2018 |
December 31,
2017 |
||||||
|
ASSETS
|
|||||||
|
Current assets:
|
|||||||
|
Cash and cash equivalents (PBFX: $19,908 and $19,664, respectively)
|
$
|
597,286
|
|
$
|
573,021
|
|
|
|
Accounts receivable
|
718,207
|
|
952,552
|
|
|||
|
Inventories
|
1,865,831
|
|
2,213,797
|
|
|||
|
Prepaid and other current assets
|
55,608
|
|
63,589
|
|
|||
|
Total current assets
|
3,236,932
|
|
3,802,959
|
|
|||
|
Property, plant and equipment, net (PBFX: $862,117 and $684,488, respectively)
|
3,820,892
|
|
3,479,213
|
|
|||
|
Deferred tax assets
|
48,500
|
|
53,638
|
|
|||
|
Deferred charges and other assets, net
|
899,091
|
|
782,183
|
|
|||
|
Total assets
|
$
|
8,005,415
|
|
$
|
8,117,993
|
|
|
|
LIABILITIES AND EQUITY
|
|||||||
|
Current liabilities:
|
|
||||||
|
Accounts payable
|
$
|
488,432
|
|
$
|
578,551
|
|
|
|
Accrued expenses
|
1,623,619
|
|
1,814,854
|
|
|||
|
Deferred revenue
|
20,086
|
|
8,933
|
|
|||
|
Note payable
|
—
|
|
5,621
|
|
|||
|
Current debt
|
2,378
|
|
10,987
|
|
|||
|
Total current liabilities
|
2,134,515
|
|
2,418,946
|
|
|||
|
Long-term debt (PBFX: $673,324 and $548,793, respectively)
|
1,931,316
|
|
2,175,042
|
|
|||
|
Payable to related parties pursuant to Tax Receivable Agreement
|
373,512
|
|
362,142
|
|
|||
|
Deferred tax liabilities
|
40,365
|
|
33,155
|
|
|||
|
Other long-term liabilities
|
277,228
|
|
225,759
|
|
|||
|
Total liabilities
|
4,756,936
|
|
5,215,044
|
|
|||
|
Commitments and contingencies (Note 13)
|
|
|
|||||
|
Equity:
|
|||||||
|
PBF Energy Inc. equity
|
|||||||
|
Class A common stock, $0.001 par value, 1,000,000,000 shares authorized,119,874,191 shares outstanding at December 31, 2018, 110,565,531 shares outstanding at December 31, 2017
|
105
|
|
95
|
|
|||
|
Class B common stock, $0.001 par value, 1,000,000 shares authorized, 20 shares outstanding at December 31, 2018, 25 shares outstanding at December 31, 2017
|
—
|
|
—
|
|
|||
|
Preferred stock, $0.001 par value, 100,000,000 shares authorized, no shares outstanding at December 31, 2018 and 2017
|
—
|
|
—
|
|
|||
|
Treasury stock, at cost, 6,274,261 shares outstanding at December 31, 2018 and 6,132,884 shares outstanding at December 31, 2017
|
(160,800
|
)
|
(152,585
|
)
|
|||
|
Additional paid in capital
|
2,633,750
|
|
2,277,739
|
|
|||
|
Retained earnings
|
225,838
|
|
236,786
|
|
|||
|
Accumulated other comprehensive loss
|
(22,428
|
)
|
(25,381
|
)
|
|||
|
Total PBF Energy Inc. equity
|
2,676,465
|
|
2,336,654
|
|
|||
|
Noncontrolling interest
|
572,014
|
|
566,295
|
|
|||
|
Total equity
|
3,248,479
|
|
2,902,949
|
|
|||
|
Total liabilities and equity
|
$
|
8,005,415
|
|
$
|
8,117,993
|
|
|
See notes to consolidated financial statements.
F- 5
PBF ENERGY INC.
CONSOLIDATED STATEMENTS OF OPERATIONS
(in thousands, except share and per share data)
|
Year Ended December 31,
|
|||||||||||
|
2018
|
2017
|
2016
|
|||||||||
|
Revenues
|
$
|
27,186,093
|
|
$
|
21,786,637
|
|
$
|
15,920,424
|
|
||
|
Cost and expenses:
|
|||||||||||
|
Cost of products and other
|
24,503,393
|
|
18,863,621
|
|
13,598,341
|
|
|||||
|
Operating expenses (excluding depreciation and amortization expense as reflected below)
|
1,720,959
|
|
1,684,435
|
|
1,422,751
|
|
|||||
|
Depreciation and amortization expense
|
359,126
|
|
277,992
|
|
216,341
|
|
|||||
|
Cost of sales
|
26,583,478
|
|
20,826,048
|
|
15,237,433
|
|
|||||
|
General and administrative expenses (excluding depreciation and amortization expense as reflected below)
|
276,955
|
|
214,547
|
|
166,319
|
|
|||||
|
Depreciation and amortization expense
|
10,634
|
|
12,964
|
|
5,835
|
|
|||||
|
(Gain) loss on sale of assets
|
(43,094
|
)
|
1,458
|
|
11,374
|
|
|||||
|
Total cost and expenses
|
26,827,973
|
|
21,055,017
|
|
15,420,961
|
|
|||||
|
Income from operations
|
358,120
|
|
731,620
|
|
499,463
|
|
|||||
|
Other income (expense):
|
|||||||||||
|
Change in Tax Receivable Agreement liability
|
13,893
|
|
250,922
|
|
12,908
|
|
|||||
|
Change in fair value of catalyst leases
|
5,587
|
|
(2,247
|
)
|
1,422
|
|
|||||
|
Debt extinguishment costs
|
—
|
|
(25,451
|
)
|
—
|
|
|||||
|
Interest expense, net
|
(169,911
|
)
|
(154,427
|
)
|
(150,045
|
)
|
|||||
|
Other non-service components of net periodic benefit cost
|
1,109
|
|
(1,402
|
)
|
(580
|
)
|
|||||
|
Income before income taxes
|
208,798
|
|
799,015
|
|
363,168
|
|
|||||
|
Income tax expense
|
33,507
|
|
315,584
|
|
137,650
|
|
|||||
|
Net income
|
175,291
|
|
483,431
|
|
225,518
|
|
|||||
|
Less: net income attributable to noncontrolling interests
|
46,976
|
|
67,914
|
|
54,707
|
|
|||||
|
Net income attributable to PBF Energy Inc. stockholders
|
$
|
128,315
|
|
$
|
415,517
|
|
$
|
170,811
|
|
||
|
Weighted-average shares of Class A common stock outstanding
|
|||||||||||
|
Basic
|
115,190,262
|
|
109,779,407
|
|
98,334,302
|
|
|||||
|
Diluted
|
118,773,606
|
|
113,898,845
|
|
103,606,709
|
|
|||||
|
Net income available to Class A common stock per share:
|
|||||||||||
|
Basic
|
$
|
1.11
|
|
$
|
3.78
|
|
$
|
1.74
|
|
||
|
Diluted
|
$
|
1.10
|
|
$
|
3.73
|
|
$
|
1.74
|
|
||
See notes to consolidated financial statements.
F- 6
PBF ENERGY INC.
CONSOLIDATED STATEMENTS OF COMPREHENSIVE INCOME
(in thousands)
|
Year Ended December 31,
|
|||||||||||
|
2018
|
2017
|
2016
|
|||||||||
|
Net income
|
$
|
175,291
|
|
$
|
483,431
|
|
$
|
225,518
|
|
||
|
Other comprehensive income:
|
|
|
|||||||||
|
Unrealized loss on available for sale securities
|
(108
|
)
|
(24
|
)
|
(42
|
)
|
|||||
|
Net gain (loss) on pension and other post-retirement benefits
|
3,091
|
|
(950
|
)
|
(2,550
|
)
|
|||||
|
Total other comprehensive income (loss)
|
2,983
|
|
(974
|
)
|
(2,592
|
)
|
|||||
|
Comprehensive income
|
178,274
|
|
482,457
|
|
222,926
|
|
|||||
|
Less: comprehensive income attributable to noncontrolling interests
|
47,006
|
|
67,882
|
|
54,618
|
|
|||||
|
Comprehensive income attributable to PBF Energy Inc. stockholders
|
$
|
131,268
|
|
$
|
414,575
|
|
$
|
168,308
|
|
||
See notes to consolidated financial statements.
F- 7
PBF ENERGY INC.
CONSOLIDATED STATEMENTS OF CHANGES IN EQUITY
(in thousands, except share data)
|
|
Class A
Common Stock |
Class B
Common Stock |
Additional
Paid-in Capital |
Retained
Earnings |
Accumulated
Other Comprehensive Loss |
Treasury Stock
|
Noncontrolling
Interest |
Total
Equity |
||||||||||||||||||||||
|
|
Shares
|
Amount
|
Shares
|
Amount
|
Shares
|
Amount
|
||||||||||||||||||||||||
|
Balance, January 1, 2016
|
97,781,933
|
|
$
|
93
|
|
28
|
|
$
|
—
|
|
$
|
1,904,751
|
|
$
|
(83,454
|
)
|
$
|
(23,289
|
)
|
6,056,719
|
|
$
|
(150,804
|
)
|
$
|
448,560
|
|
$
|
2,095,857
|
|
|
Comprehensive income
|
—
|
|
—
|
|
—
|
|
—
|
|
—
|
|
170,811
|
|
(2,503
|
)
|
—
|
|
—
|
|
54,618
|
|
222,926
|
|
||||||||
|
Exercise of warrants and options
|
11,650
|
|
—
|
|
—
|
|
—
|
|
1,058
|
|
—
|
|
—
|
|
—
|
|
—
|
|
(172
|
)
|
886
|
|
||||||||
|
Distributions to PBF Energy Company LLC members
|
—
|
|
—
|
|
—
|
|
—
|
|
—
|
|
(15,219
|
)
|
—
|
|
—
|
|
—
|
|
(6,728
|
)
|
(21,947
|
)
|
||||||||
|
Distributions to PBF Logistics LP public unitholders
|
—
|
|
—
|
|
—
|
|
—
|
|
—
|
|
—
|
|
—
|
|
—
|
|
—
|
|
(33,714
|
)
|
(33,714
|
)
|
||||||||
|
Stock-based compensation
|
320,458
|
|
—
|
|
—
|
|
—
|
|
18,296
|
|
—
|
|
—
|
|
—
|
|
—
|
|
4,360
|
|
22,656
|
|
||||||||
|
Dividends ($1.20 per common share)
|
—
|
|
—
|
|
—
|
|
—
|
|
—
|
|
(117,486
|
)
|
—
|
|
—
|
|
—
|
|
—
|
|
(117,486
|
)
|
||||||||
|
Issuance of additional PBFX common units
|
—
|
|
—
|
|
—
|
|
—
|
|
54,944
|
|
—
|
|
—
|
|
—
|
|
—
|
|
83,434
|
|
138,378
|
|
||||||||
|
Effects of equity offerings and exchanges of PBF LLC Series A Units on deferred tax assets and liabilities and tax receivable agreement obligation
|
—
|
|
—
|
|
—
|
|
—
|
|
(2,613
|
)
|
—
|
|
—
|
|
—
|
|
—
|
|
—
|
|
(2,613
|
)
|
||||||||
|
Exchange of PBF Energy Company LLC Series A Units for PBF Energy Class A common stock
|
1,090,006
|
|
—
|
|
—
|
|
—
|
|
—
|
|
—
|
|
—
|
|
—
|
|
—
|
|
—
|
|
—
|
|
||||||||
|
December equity offering
|
10,000,000
|
|
1
|
|
—
|
|
—
|
|
275,299
|
|
—
|
|
—
|
|
—
|
|
—
|
|
—
|
|
275,300
|
|
||||||||
|
Treasury stock purchases
|
—
|
|
—
|
|
—
|
|
—
|
|
—
|
|
—
|
|
—
|
|
31,244
|
|
(743
|
)
|
—
|
|
(743
|
)
|
||||||||
|
Other
|
—
|
|
—
|
|
—
|
|
—
|
|
(5,947
|
)
|
496
|
|
1,353
|
|
—
|
|
—
|
|
(4,718
|
)
|
(8,816
|
)
|
||||||||
|
Balance, December 31, 2016
|
109,204,047
|
|
$
|
94
|
|
28
|
|
$
|
—
|
|
$
|
2,245,788
|
|
$
|
(44,852
|
)
|
$
|
(24,439
|
)
|
6,087,963
|
|
$
|
(151,547
|
)
|
$
|
545,640
|
|
$
|
2,570,684
|
|
|
Comprehensive Income
|
—
|
|
—
|
|
—
|
|
—
|
|
—
|
|
415,517
|
|
(942
|
)
|
—
|
|
—
|
|
67,882
|
|
482,457
|
|
||||||||
|
Exercise of warrants and options
|
462,500
|
|
1
|
|
—
|
|
—
|
|
10,532
|
|
—
|
|
—
|
|
—
|
|
—
|
|
(598
|
)
|
9,935
|
|
||||||||
|
Distributions to PBF Energy Company LLC members
|
—
|
|
—
|
|
—
|
|
—
|
|
—
|
|
—
|
|
—
|
|
—
|
|
—
|
|
(4,584
|
)
|
(4,584
|
)
|
||||||||
|
Distributions to PBF Logistics LP public unitholders
|
—
|
|
—
|
|
—
|
|
—
|
|
—
|
|
—
|
|
—
|
|
—
|
|
—
|
|
(44,636
|
)
|
(44,636
|
)
|
||||||||
|
Stock-based compensation
|
702,404
|
|
—
|
|
—
|
|
—
|
|
21,503
|
|
—
|
|
—
|
|
—
|
|
—
|
|
5,345
|
|
26,848
|
|
||||||||
|
Dividends ($1.20 per common share)
|
—
|
|
—
|
|
—
|
|
—
|
|
—
|
|
(131,783
|
)
|
—
|
|
—
|
|
—
|
|
—
|
|
(131,783
|
)
|
||||||||
|
Effects of equity offerings and exchanges of PBF LLC Series A Units on deferred tax assets and liabilities and tax receivable agreement obligation
|
—
|
|
—
|
|
—
|
|
—
|
|
(1,139
|
)
|
—
|
|
—
|
|
—
|
|
—
|
|
—
|
|
(1,139
|
)
|
||||||||
|
Exchange of PBF Energy Company LLC Series A Units for PBF Energy Class A common stock
|
196,580
|
|
—
|
|
(3
|
)
|
—
|
|
—
|
|
—
|
|
—
|
|
—
|
|
—
|
|
—
|
|
—
|
|
||||||||
|
Treasury stock purchases
|
—
|
|
—
|
|
—
|
|
—
|
|
—
|
|
—
|
|
—
|
|
44,921
|
|
(1,038
|
)
|
—
|
|
(1,038
|
)
|
||||||||
|
Other
|
—
|
|
—
|
|
—
|
|
—
|
|
1,055
|
|
(2,096
|
)
|
—
|
|
—
|
|
—
|
|
(2,754
|
)
|
(3,795
|
)
|
||||||||
|
Balance, December 31, 2017
|
110,565,531
|
|
$
|
95
|
|
25
|
|
$
|
—
|
|
$
|
2,277,739
|
|
$
|
236,786
|
|
$
|
(25,381
|
)
|
6,132,884
|
|
$
|
(152,585
|
)
|
$
|
566,295
|
|
$
|
2,902,949
|
|
See notes to consolidated financial statements.
F- 8
PBF ENERGY INC.
CONSOLIDATED STATEMENTS OF CHANGES IN EQUITY (Continued)
(in thousands, except share data)
|
Class A
Common Stock
|
Class B
Common Stock
|
Additional
Paid-in
Capital
|
Retained
Earnings
|
Accumulated
Other
Comprehensive
Loss
|
Treasury Stock
|
Noncontrolling
Interest
|
Total
Equity
|
|||||||||||||||||||||||
|
Shares
|
Amount
|
Shares
|
Amount
|
Shares
|
Amount
|
|||||||||||||||||||||||||
|
Balance, December 31, 2017
|
110,565,531
|
|
$
|
95
|
|
25
|
|
$
|
—
|
|
$
|
2,277,739
|
|
$
|
236,786
|
|
$
|
(25,381
|
)
|
6,132,884
|
|
$
|
(152,585
|
)
|
$
|
566,295
|
|
$
|
2,902,949
|
|
|
Comprehensive Income (loss)
|
—
|
|
—
|
|
—
|
|
—
|
|
—
|
|
128,315
|
|
2,953
|
|
—
|
|
—
|
|
47,006
|
|
178,274
|
|
||||||||
|
Exercise of warrants and options
|
708,091
|
|
1
|
|
—
|
|
—
|
|
13,964
|
|
—
|
|
—
|
|
—
|
|
—
|
|
—
|
|
13,965
|
|
||||||||
|
Taxes paid for net settlement of equity-based compensation
|
—
|
|
—
|
|
—
|
|
—
|
|
(4,775
|
)
|
—
|
|
—
|
|
—
|
|
—
|
|
(568
|
)
|
(5,343
|
)
|
||||||||
|
Distributions to PBF Energy Company LLC members
|
—
|
|
—
|
|
—
|
|
—
|
|
—
|
|
—
|
|
—
|
|
—
|
|
—
|
|
(2,086
|
)
|
(2,086
|
)
|
||||||||
|
Distributions to PBF Logistics LP public unitholders
|
—
|
|
—
|
|
—
|
|
—
|
|
—
|
|
—
|
|
—
|
|
—
|
|
—
|
|
(49,532
|
)
|
(49,532
|
)
|
||||||||
|
Stock-based compensation
|
43,311
|
|
—
|
|
—
|
|
—
|
|
19,697
|
|
—
|
|
—
|
|
—
|
|
—
|
|
5,757
|
|
25,454
|
|
||||||||
|
Dividends ($1.20 per common share)
|
—
|
|
—
|
|
—
|
|
—
|
|
—
|
|
(139,263
|
)
|
—
|
|
—
|
|
—
|
|
—
|
|
(139,263
|
)
|
||||||||
|
Issuance of additional PBFX common units
|
—
|
|
—
|
|
—
|
|
—
|
|
28,564
|
|
—
|
|
—
|
|
—
|
|
—
|
|
6,256
|
|
34,820
|
|
||||||||
|
Effects of exchanges of PBF LLC Series A Units on deferred tax assets and liabilities and tax receivable agreement obligation
|
—
|
|
—
|
|
—
|
|
—
|
|
(4,926
|
)
|
—
|
|
—
|
|
—
|
|
—
|
|
—
|
|
(4,926
|
)
|
||||||||
|
Exchange of PBF Energy Company LLC Series A Units for PBF Energy Class A common stock
|
2,698,635
|
|
3
|
|
(5
|
)
|
—
|
|
—
|
|
—
|
|
—
|
|
—
|
|
—
|
|
—
|
|
3
|
|
||||||||
|
August 2018 Equity Offering
|
6,000,000
|
|
6
|
|
—
|
|
—
|
|
287,278
|
|
—
|
|
—
|
|
—
|
|
—
|
|
—
|
|
287,284
|
|
||||||||
|
Treasury stock purchases
|
(141,377
|
)
|
—
|
|
—
|
|
—
|
|
8,215
|
|
—
|
|
—
|
|
141,377
|
|
(8,215
|
)
|
—
|
|
—
|
|
||||||||
|
Other
|
—
|
|
—
|
|
—
|
|
—
|
|
7,994
|
|
—
|
|
—
|
|
—
|
|
—
|
|
(1,114
|
)
|
6,880
|
|
||||||||
|
Balance, December 31, 2018
|
119,874,191
|
|
$
|
105
|
|
20
|
|
$
|
—
|
|
$
|
2,633,750
|
|
$
|
225,838
|
|
$
|
(22,428
|
)
|
6,274,261
|
|
$
|
(160,800
|
)
|
$
|
572,014
|
|
$
|
3,248,479
|
|
See notes to consolidated financial statements.
F- 9
PBF ENERGY INC.
CONSOLIDATED STATEMENTS OF CASH FLOWS
(in thousands)
|
Year Ended December 31,
|
|||||||||||
|
2018
|
2017
|
2016
|
|||||||||
|
Cash flows from operating activities:
|
|||||||||||
|
Net income
|
$
|
175,291
|
|
$
|
483,431
|
|
$
|
225,518
|
|
||
|
Adjustments to reconcile net income to net cash provided by operating activities:
|
|||||||||||
|
Depreciation and amortization
|
378,596
|
|
299,860
|
|
232,948
|
|
|||||
|
Stock-based compensation
|
25,969
|
|
26,848
|
|
22,656
|
|
|||||
|
Change in fair value of catalyst leases
|
(5,587
|
)
|
2,247
|
|
(1,422
|
)
|
|||||
|
Deferred income taxes
|
32,741
|
|
313,833
|
|
244,758
|
|
|||||
|
Change in Tax Receivable Agreement liability
|
(13,893
|
)
|
(250,922
|
)
|
(12,908
|
)
|
|||||
|
Non-cash change in inventory repurchase obligations
|
(31,790
|
)
|
13,779
|
|
29,453
|
|
|||||
|
Non-cash lower of cost or market inventory adjustment
|
351,278
|
|
(295,532
|
)
|
(521,348
|
)
|
|||||
|
Debt extinguishment costs
|
—
|
|
25,451
|
|
—
|
|
|||||
|
Pension and other post-retirement benefit costs
|
47,381
|
|
42,242
|
|
37,986
|
|
|||||
|
(Gain) loss on sale of assets
|
(43,094
|
)
|
1,458
|
|
11,374
|
|
|||||
|
Changes in operating assets and liabilities:
|
|||||||||||
|
Accounts receivable
|
234,345
|
|
(332,377
|
)
|
(165,416
|
)
|
|||||
|
Inventories
|
(3,312
|
)
|
(54,705
|
)
|
236,602
|
|
|||||
|
Prepaid and other current assets
|
10,107
|
|
73,526
|
|
(54,341
|
)
|
|||||
|
Accounts payable
|
(111,667
|
)
|
34,604
|
|
217,566
|
|
|||||
|
Accrued expenses
|
(227,111
|
)
|
359,549
|
|
217,820
|
|
|||||
|
Deferred revenue
|
11,153
|
|
(4,359
|
)
|
9,249
|
|
|||||
|
Payable to related parties pursuant to Tax Receivable Agreement
|
—
|
|
—
|
|
(50,771
|
)
|
|||||
|
Other assets and liabilities
|
7,531
|
|
(53,072
|
)
|
(27,790
|
)
|
|||||
|
Net cash provided by operating activities
|
$
|
837,938
|
|
$
|
685,861
|
|
$
|
651,934
|
|
||
|
Cash flows from investing activities:
|
|||||||||||
|
Expenditures for property, plant and equipment
|
(317,459
|
)
|
(306,681
|
)
|
(298,737
|
)
|
|||||
|
Expenditures for deferred turnaround costs
|
(266,028
|
)
|
(379,114
|
)
|
(198,664
|
)
|
|||||
|
Expenditures for other assets
|
(17,055
|
)
|
(31,143
|
)
|
(42,506
|
)
|
|||||
|
Acquisition of Torrance refinery and related logistics assets
|
—
|
|
—
|
|
(971,932
|
)
|
|||||
|
Chalmette Acquisition working capital settlement
|
—
|
|
—
|
|
(2,659
|
)
|
|||||
|
Acquisition of Toledo Products Terminal by PBFX
|
—
|
|
(10,097
|
)
|
—
|
|
|||||
|
Acquisition of Knoxville Terminal by PBFX
|
(58,356
|
)
|
—
|
|
—
|
|
|||||
|
Acquisition of East Coast Storage Assets by PBFX
|
(74,989
|
)
|
—
|
|
—
|
|
|||||
|
PBFX Plains Asset Purchase
|
—
|
|
—
|
|
(98,373
|
)
|
|||||
|
Proceeds from sale of assets
|
48,290
|
|
—
|
|
24,692
|
|
|||||
|
Purchase of marketable securities
|
—
|
|
(75,036
|
)
|
(1,909,965
|
)
|
|||||
|
Maturities of marketable securities
|
—
|
|
115,060
|
|
2,104,209
|
|
|||||
|
Net cash used in investing activities
|
$
|
(685,597
|
)
|
$
|
(687,011
|
)
|
$
|
(1,393,935
|
)
|
||
See notes to consolidated financial statements.
F- 10
PBF ENERGY INC.
CONSOLIDATED STATEMENTS OF CASH FLOWS (Continued)
(in thousands)
|
Year Ended December 31,
|
|||||||||||
|
Cash flows from financing activities:
|
2018
|
2017
|
2016
|
||||||||
|
Net proceeds from issuance of PBF Energy Class A common stock
|
$
|
287,284
|
|
$
|
—
|
|
$
|
275,300
|
|
||
|
Net proceeds from issuance of PBFX common units
|
34,820
|
|
—
|
|
138,378
|
|
|||||
|
Dividend payments
|
(138,895
|
)
|
(131,686
|
)
|
(117,486
|
)
|
|||||
|
Distributions to PBFX public unitholders
|
(48,187
|
)
|
(43,510
|
)
|
(32,806
|
)
|
|||||
|
Distributions to PBF Energy Company LLC members other than PBF Energy
|
(2,086
|
)
|
(4,584
|
)
|
(21,947
|
)
|
|||||
|
Distribution to T&M and Collins shareholders
|
—
|
|
(1,800
|
)
|
—
|
|
|||||
|
Proceeds from 2025 Senior Notes
|
—
|
|
725,000
|
|
—
|
|
|||||
|
Cash paid to extinguish 2020 Senior Secured Notes
|
—
|
|
(690,209
|
)
|
—
|
|
|||||
|
Proceeds from revolver borrowings
|
—
|
|
490,000
|
|
550,000
|
|
|||||
|
Repayments of revolver borrowings
|
(350,000
|
)
|
(490,000
|
)
|
(200,000
|
)
|
|||||
|
Repayments of Rail Facility revolver borrowings
|
—
|
|
—
|
|
(67,491
|
)
|
|||||
|
Proceeds from PBF Rail Term Loan
|
—
|
|
—
|
|
35,000
|
|
|||||
|
Repayments of PBF Rail Term Loan
|
(6,812
|
)
|
(6,633
|
)
|
—
|
|
|||||
|
Proceeds from PBFX revolver borrowings
|
170,000
|
|
20,000
|
|
194,700
|
|
|||||
|
Repayments of PBFX revolver borrowings
|
(43,700
|
)
|
(179,500
|
)
|
(30,000
|
)
|
|||||
|
Repayments of PBFX Term Loan borrowings
|
—
|
|
(39,664
|
)
|
(194,536
|
)
|
|||||
|
Proceeds from 2023 PBFX Senior Notes
|
—
|
|
178,500
|
|
—
|
|
|||||
|
Repayments of note payable
|
(5,621
|
)
|
(1,210
|
)
|
—
|
|
|||||
|
Catalyst lease settlements
|
(9,108
|
)
|
10,830
|
|
15,586
|
|
|||||
|
Taxes paid for net settlement of equity-based compensation
|
(5,343
|
)
|
—
|
|
—
|
|
|||||
|
Proceeds from stock options exercised
|
13,965
|
|
10,532
|
|
—
|
|
|||||
|
Purchases of treasury stock
|
(8,215
|
)
|
(1,038
|
)
|
(743
|
)
|
|||||
|
Deferred financing costs and other
|
(16,178
|
)
|
(17,131
|
)
|
—
|
|
|||||
|
Net cash (used in) provided by financing activities
|
$
|
(128,076
|
)
|
$
|
(172,103
|
)
|
$
|
543,955
|
|
||
|
Net increase (decrease) in cash and cash equivalents
|
24,265
|
|
(173,253
|
)
|
(198,046
|
)
|
|||||
|
Cash and equivalents, beginning of period
|
573,021
|
|
746,274
|
|
944,320
|
|
|||||
|
Cash and equivalents, end of period
|
$
|
597,286
|
|
$
|
573,021
|
|
$
|
746,274
|
|
||
|
Supplemental cash flow disclosures
|
|||||||||||
|
Non-cash activities:
|
|||||||||||
|
Accrued and unpaid capital expenditures
|
$
|
90,210
|
|
$
|
26,805
|
|
$
|
35,595
|
|
||
|
Deferred payment for PBFX East Coast Storage Assets Acquisition
|
30,900
|
|
—
|
|
—
|
|
|||||
|
East Coast Storage Assets Acquisition contingent consideration
|
21,100
|
|
—
|
|
—
|
|
|||||
|
Note payable issued for purchase of property, plant and equipment
|
—
|
|
6,831
|
|
—
|
|
|||||
|
Conversion of Delaware Economic Development Authority loan to grant
|
—
|
|
—
|
|
4,000
|
|
|||||
|
Cash paid during year for:
|
|||||||||||
|
Interest, net of capitalized interest of $9,469, $7,156 and $8,452 in 2018, 2017 and 2016, respectively
|
$
|
164,405
|
|
$
|
166,538
|
|
$
|
137,599
|
|
||
|
Income taxes
|
699
|
|
—
|
|
3,841
|
|
|||||
See notes to consolidated financial statements.
F- 11
PBF ENERGY COMPANY LLC AND SUBSIDIARIES
CONSOLIDATED BALANCE SHEETS
(in thousands, except unit data)
|
December 31,
2018 |
December 31,
2017 |
||||||
|
ASSETS
|
|||||||
|
Current assets:
|
|||||||
|
Cash and cash equivalents (PBFX: $19,908 and $19,664, respectively)
|
$
|
596,021
|
|
$
|
562,036
|
|
|
|
Accounts receivable
|
718,207
|
|
952,552
|
|
|||
|
Inventories
|
1,865,831
|
|
2,213,797
|
|
|||
|
Prepaid and other current assets
|
55,069
|
|
51,799
|
|
|||
|
Total current assets
|
3,235,128
|
|
3,780,184
|
|
|||
|
Property, plant and equipment, net (PBFX: $862,117 and $684,488, respectively)
|
3,820,892
|
|
3,479,213
|
|
|||
|
Deferred charges and other assets, net
|
897,016
|
|
779,588
|
|
|||
|
Total assets
|
$
|
7,953,036
|
|
$
|
8,038,985
|
|
|
|
LIABILITIES AND EQUITY
|
|||||||
|
Current liabilities:
|
|||||||
|
Accounts payable
|
$
|
488,432
|
|
$
|
578,551
|
|
|
|
Accrued expenses
|
1,642,790
|
|
1,824,394
|
|
|||
|
Deferred revenue
|
20,086
|
|
8,933
|
|
|||
|
Note payable
|
—
|
|
5,621
|
|
|||
|
Current debt
|
2,378
|
|
10,987
|
|
|||
|
Total current liabilities
|
2,153,686
|
|
2,428,486
|
|
|||
|
Long-term debt (PBFX: $673,324 and $548,793, respectively)
|
1,931,316
|
|
2,175,042
|
|
|||
|
Affiliate note payable
|
326,082
|
|
292,844
|
|
|||
|
Deferred tax liabilities
|
40,365
|
|
33,155
|
|
|||
|
Other long-term liabilities
|
277,228
|
|
225,845
|
|
|||
|
Total liabilities
|
4,728,677
|
|
5,155,372
|
|
|||
|
Commitments and contingencies (Note 13)
|
|
|
|||||
|
Series B Units, 1,000,000 issued and outstanding, no par or stated value
|
5,110
|
|
5,110
|
|
|||
|
PBF Energy Company LLC equity:
|
|||||||
|
Series A Units, 1,206,325 and 3,767,464 issued and outstanding at December 31, 2018 and 2017, no par or stated value
|
20,162
|
|
40,058
|
|
|||
|
Series C Units, 119,895,422 and 110,586,762 issued and outstanding at December 31, 2018 and 2017, no par or stated value
|
2,009,788
|
|
1,654,999
|
|
|||
|
Treasury stock, at cost
|
(160,800
|
)
|
(152,585
|
)
|
|||
|
Retained Earnings
|
914,285
|
|
906,875
|
|
|||
|
Accumulated other comprehensive loss
|
(23,953
|
)
|
(26,936
|
)
|
|||
|
Total PBF Energy Company LLC equity
|
2,759,482
|
|
2,422,411
|
|
|||
|
Noncontrolling interest
|
459,767
|
|
456,092
|
|
|||
|
Total equity
|
3,219,249
|
|
2,878,503
|
|
|||
|
Total liabilities, Series B units and equity
|
$
|
7,953,036
|
|
$
|
8,038,985
|
|
|
See notes to consolidated financial statements.
F- 12
PBF ENERGY COMPANY LLC AND SUBSIDIARIES
CONSOLIDATED STATEMENTS OF OPERATIONS
(in thousands)
|
Year Ended December 31,
|
|||||||||||
|
2018
|
2017
|
2016
|
|||||||||
|
Revenues
|
$
|
27,186,093
|
|
$
|
21,786,637
|
|
$
|
15,920,424
|
|
||
|
Cost and expenses:
|
|||||||||||
|
Cost of products and other
|
24,503,393
|
|
18,863,621
|
|
13,598,341
|
|
|||||
|
Operating expenses (excluding depreciation and amortization expense as reflected below)
|
1,720,959
|
|
1,684,435
|
|
1,422,751
|
|
|||||
|
Depreciation and amortization expense
|
359,126
|
|
277,992
|
|
216,341
|
|
|||||
|
Cost of sales
|
26,583,478
|
|
20,826,048
|
|
15,237,433
|
|
|||||
|
General and administrative expenses (excluding depreciation and amortization expense as reflected below)
|
275,205
|
|
214,222
|
|
166,119
|
|
|||||
|
Depreciation and amortization expense
|
10,634
|
|
12,964
|
|
5,835
|
|
|||||
|
(Gain) loss on sale of assets
|
(43,094
|
)
|
1,458
|
|
11,374
|
|
|||||
|
Total cost and expenses
|
26,826,223
|
|
21,054,692
|
|
15,420,761
|
|
|||||
|
Income from operations
|
359,870
|
|
731,945
|
|
499,663
|
|
|||||
|
Other income (expense):
|
|||||||||||
|
Change in fair value of catalyst leases
|
5,587
|
|
(2,247
|
)
|
1,422
|
|
|||||
|
Debt extinguishment costs
|
—
|
|
(25,451
|
)
|
—
|
|
|||||
|
Interest expense, net
|
(178,421
|
)
|
(162,383
|
)
|
(155,819
|
)
|
|||||
|
Other non-service components of net periodic benefit cost
|
1,109
|
|
(1,402
|
)
|
(580
|
)
|
|||||
|
Income before income taxes
|
188,145
|
|
540,462
|
|
344,686
|
|
|||||
|
Income tax expense (benefit)
|
7,999
|
|
(10,783
|
)
|
23,689
|
|
|||||
|
Net income
|
180,146
|
|
551,245
|
|
320,997
|
|
|||||
|
Less: net income attributable to noncontrolling interests
|
42,308
|
|
51,168
|
|
40,109
|
|
|||||
|
Net income attributable to PBF Energy Company LLC
|
$
|
137,838
|
|
$
|
500,077
|
|
$
|
280,888
|
|
||
See notes to consolidated financial statements.
F- 13
PBF ENERGY COMPANY LLC AND SUBSIDIARIES
CONSOLIDATED STATEMENTS OF COMPREHENSIVE INCOME
(in thousands)
|
Year Ended December 31,
|
|||||||||||
|
2018
|
2017
|
2016
|
|||||||||
|
Net income
|
$
|
180,146
|
|
$
|
551,245
|
|
$
|
320,997
|
|
||
|
Other comprehensive income:
|
|
|
|||||||||
|
Unrealized loss on available for sale securities
|
(108
|
)
|
(24
|
)
|
(42
|
)
|
|||||
|
Net gain (loss) on pension and other post-retirement benefits
|
3,091
|
|
(950
|
)
|
(2,550
|
)
|
|||||
|
Total other comprehensive income (loss)
|
2,983
|
|
(974
|
)
|
(2,592
|
)
|
|||||
|
Comprehensive income
|
183,129
|
|
550,271
|
|
318,405
|
|
|||||
|
Less: comprehensive income attributable to noncontrolling interests
|
42,308
|
|
51,168
|
|
40,109
|
|
|||||
|
Comprehensive income attributable to PBF Energy Company LLC
|
$
|
140,821
|
|
$
|
499,103
|
|
$
|
278,296
|
|
||
See notes to consolidated financial statements.
F- 14
PBF ENERGY COMPANY LLC AND SUBSIDIARIES
CONSOLIDATED STATEMENTS OF CHANGES IN EQUITY
(in thousands, except unit data)
|
|
Series A
|
Series C
|
Accumulated
Other Comprehensive Income (Loss) |
Retained
Earnings |
Noncontrolling
Interest |
Treasury Stock
|
Total Member’s
Equity |
||||||||||||||||||
|
|
Units
|
Amount
|
Units
|
Amount
|
|||||||||||||||||||||
|
Balance, January 1, 2016
|
4,985,358
|
|
$
|
51,061
|
|
97,781,933
|
|
$
|
1,271,770
|
|
$
|
(24,770
|
)
|
$
|
404,596
|
|
$
|
357,542
|
|
$
|
(150,804
|
)
|
$
|
1,909,395
|
|
|
Comprehensive income
|
—
|
|
—
|
|
—
|
|
—
|
|
(2,592
|
)
|
280,888
|
|
40,109
|
|
—
|
|
318,405
|
|
|||||||
|
Exercise of Series A warrants and options
|
25,550
|
|
(8,173
|
)
|
11,650
|
|
8,001
|
|
—
|
|
—
|
|
—
|
|
—
|
|
(172
|
)
|
|||||||
|
Exchange of Series A units for PBF Energy Class A common stock
|
(1,090,006
|
)
|
—
|
|
1,090,006
|
|
1,058
|
|
—
|
|
—
|
|
—
|
|
—
|
|
1,058
|
|
|||||||
|
Purchase of Series C units in connection with the PBF Energy December 2016 Equity Offering
|
—
|
|
—
|
|
10,000,000
|
|
275,300
|
|
—
|
|
—
|
|
—
|
|
—
|
|
275,300
|
|
|||||||
|
Distribution to members
|
—
|
|
—
|
|
—
|
|
—
|
|
—
|
|
(139,433
|
)
|
(33,714
|
)
|
—
|
|
(173,147
|
)
|
|||||||
|
Issuance of additional PBFX common units
|
—
|
|
—
|
|
—
|
|
54,944
|
|
—
|
|
—
|
|
83,434
|
|
—
|
|
138,378
|
|
|||||||
|
Grant of restricted shares
|
—
|
|
—
|
|
320,458
|
|
743
|
|
—
|
|
—
|
|
—
|
|
—
|
|
743
|
|
|||||||
|
Stock-based compensation
|
—
|
|
—
|
|
—
|
|
18,296
|
|
—
|
|
—
|
|
4,360
|
|
—
|
|
22,656
|
|
|||||||
|
Treasury stock purchases
|
—
|
|
—
|
|
—
|
|
—
|
|
—
|
|
—
|
|
—
|
|
(743
|
)
|
(743
|
)
|
|||||||
|
Other
|
—
|
|
75
|
|
—
|
|
24
|
|
1,400
|
|
(790
|
)
|
(4,762
|
)
|
—
|
|
(4,053
|
)
|
|||||||
|
Balance, December 31, 2016
|
3,920,902
|
|
42,963
|
|
109,204,047
|
|
1,630,136
|
|
(25,962
|
)
|
545,261
|
|
446,969
|
|
(151,547
|
)
|
2,487,820
|
|
|||||||
|
Comprehensive Income
|
—
|
|
—
|
|
—
|
|
—
|
|
(974
|
)
|
500,077
|
|
51,168
|
|
—
|
|
550,271
|
|
|||||||
|
Exercise of Series A warrants and options
|
64,373
|
|
(598
|
)
|
462,500
|
|
—
|
|
—
|
|
—
|
|
—
|
|
—
|
|
(598
|
)
|
|||||||
|
Exchange of Series A units for PBF Energy Class A common stock
|
(196,580
|
)
|
(2,307
|
)
|
196,580
|
|
2,307
|
|
—
|
|
—
|
|
—
|
|
—
|
|
—
|
|
|||||||
|
Redemption of Series A Units by PBF Energy
|
(21,231
|
)
|
—
|
|
21,231
|
|
—
|
|
—
|
|
—
|
|
—
|
|
—
|
|
—
|
|
|||||||
|
Distribution to members
|
—
|
|
—
|
|
—
|
|
—
|
|
—
|
|
(136,367
|
)
|
(46,436
|
)
|
—
|
|
(182,803
|
)
|
|||||||
|
Grant of restricted shares
|
—
|
|
—
|
|
702,404
|
|
1,038
|
|
—
|
|
—
|
|
—
|
|
—
|
|
1,038
|
|
|||||||
|
Stock-based compensation
|
—
|
|
—
|
|
—
|
|
21,503
|
|
—
|
|
—
|
|
5,345
|
|
—
|
|
26,848
|
|
|||||||
|
Treasury stock purchases
|
—
|
|
—
|
|
—
|
|
—
|
|
—
|
|
—
|
|
—
|
|
(1,038
|
)
|
(1,038
|
)
|
|||||||
|
Other
|
—
|
|
—
|
|
—
|
|
15
|
|
—
|
|
(2,096
|
)
|
(954
|
)
|
—
|
|
(3,035
|
)
|
|||||||
|
Balance, December 31, 2017
|
3,767,464
|
|
$
|
40,058
|
|
110,586,762
|
|
$
|
1,654,999
|
|
$
|
(26,936
|
)
|
$
|
906,875
|
|
$
|
456,092
|
|
$
|
(152,585
|
)
|
$
|
2,878,503
|
|
See notes to consolidated financial statements.
F- 15
PBF ENERGY COMPANY LLC AND SUBSIDIARIES
CONSOLIDATED STATEMENTS OF CHANGES IN EQUITY (Continued)
(in thousands, except share data)
|
Series A
|
Series C
|
Accumulated
Other Comprehensive Income (Loss) |
Retained
Earnings
|
Noncontrolling
Interest
|
Treasury Stock
|
Total Member’s
Equity
|
|||||||||||||||||||
|
Units
|
Amount
|
Units
|
Amount
|
||||||||||||||||||||||
|
Balance, December 31, 2017
|
3,767,464
|
|
$
|
40,058
|
|
110,586,762
|
|
$
|
1,654,999
|
|
$
|
(26,936
|
)
|
$
|
906,875
|
|
$
|
456,092
|
|
$
|
(152,585
|
)
|
$
|
2,878,503
|
|
|
Comprehensive Income
|
—
|
|
—
|
|
—
|
|
—
|
|
2,983
|
|
137,838
|
|
42,308
|
|
—
|
|
183,129
|
|
|||||||
|
Exercise of Series A warrants and options
|
137,496
|
|
(2,594
|
)
|
708,091
|
|
(5,942
|
)
|
—
|
|
—
|
|
—
|
|
—
|
|
(8,536
|
)
|
|||||||
|
Exchange of Series A units for PBF Energy Class A common stock
|
(2,698,635
|
)
|
(17,302
|
)
|
2,698,635
|
|
17,302
|
|
—
|
|
—
|
|
—
|
|
—
|
|
—
|
|
|||||||
|
Distribution to members
|
—
|
|
—
|
|
—
|
|
—
|
|
—
|
|
(141,349
|
)
|
(49,532
|
)
|
—
|
|
(190,881
|
)
|
|||||||
|
Issuance of additional PBFX common units
|
—
|
|
—
|
|
—
|
|
28,564
|
|
—
|
|
—
|
|
6,256
|
|
—
|
|
34,820
|
|
|||||||
|
Stock-based compensation
|
—
|
|
—
|
|
43,311
|
|
19,697
|
|
—
|
|
—
|
|
5,757
|
|
—
|
|
25,454
|
|
|||||||
|
Purchase of Series C units in connection with the August 2018 Equity Offering
|
—
|
|
—
|
|
6,000,000
|
|
287,284
|
|
—
|
|
—
|
|
—
|
|
—
|
|
287,284
|
|
|||||||
|
Treasury stock purchases
|
—
|
|
—
|
|
(141,377
|
)
|
8,215
|
|
—
|
|
—
|
|
—
|
|
(8,215
|
)
|
—
|
|
|||||||
|
Other
|
—
|
|
—
|
|
—
|
|
(331
|
)
|
—
|
|
10,921
|
|
(1,114
|
)
|
—
|
|
9,476
|
|
|||||||
|
Balance, December 31, 2018
|
1,206,325
|
|
$
|
20,162
|
|
119,895,422
|
|
$
|
2,009,788
|
|
$
|
(23,953
|
)
|
$
|
914,285
|
|
$
|
459,767
|
|
$
|
(160,800
|
)
|
$
|
3,219,249
|
|
See notes to consolidated financial statements.
F- 16
PBF ENERGY COMPANY LLC AND SUBSIDIARIES
CONSOLIDATED STATEMENTS OF CASH FLOWS
(in thousands)
|
Year Ended December 31,
|
|||||||||||
|
2018
|
2017
|
2016
|
|||||||||
|
Cash flows from operating activities:
|
|||||||||||
|
Net income
|
$
|
180,146
|
|
$
|
551,245
|
|
$
|
320,997
|
|
||
|
Adjustments to reconcile net income to net cash provided by operating activities:
|
|||||||||||
|
Depreciation and amortization
|
378,596
|
|
299,860
|
|
232,948
|
|
|||||
|
Stock-based compensation
|
25,969
|
|
26,848
|
|
22,656
|
|
|||||
|
Change in fair value of catalyst leases
|
(5,587
|
)
|
2,247
|
|
(1,422
|
)
|
|||||
|
Deferred income taxes
|
7,233
|
|
(12,526
|
)
|
19,802
|
|
|||||
|
Non-cash change in inventory repurchase obligations
|
(31,790
|
)
|
13,779
|
|
29,453
|
|
|||||
|
Non-cash lower of cost or market inventory adjustment
|
351,278
|
|
(295,532
|
)
|
(521,348
|
)
|
|||||
|
Debt extinguishment costs
|
—
|
|
25,451
|
|
—
|
|
|||||
|
Pension and other post-retirement benefit costs
|
47,381
|
|
42,242
|
|
37,986
|
|
|||||
|
(Gain) loss on sale of assets
|
(43,094
|
)
|
1,458
|
|
11,374
|
|
|||||
|
Changes in operating assets and liabilities:
|
|||||||||||
|
Accounts receivable
|
234,345
|
|
(332,377
|
)
|
(165,416
|
)
|
|||||
|
Inventories
|
(3,312
|
)
|
(54,705
|
)
|
236,602
|
|
|||||
|
Prepaid and other current assets
|
(1,144
|
)
|
(9,908
|
)
|
15,072
|
|
|||||
|
Accounts payable
|
(111,667
|
)
|
34,634
|
|
217,536
|
|
|||||
|
Accrued expenses
|
(226,292
|
)
|
358,527
|
|
222,805
|
|
|||||
|
Deferred revenue
|
11,153
|
|
(4,359
|
)
|
9,249
|
|
|||||
|
Other assets and liabilities
|
7,442
|
|
(52,915
|
)
|
(18,322
|
)
|
|||||
|
Net cash provided by operating activities
|
$
|
820,657
|
|
$
|
593,969
|
|
$
|
669,972
|
|
||
|
Cash flows from investing activities:
|
|||||||||||
|
Expenditures for property, plant and equipment
|
(317,459
|
)
|
(306,681
|
)
|
(298,737
|
)
|
|||||
|
Expenditures for deferred turnaround costs
|
(266,028
|
)
|
(379,114
|
)
|
(198,664
|
)
|
|||||
|
Expenditures for other assets
|
(17,055
|
)
|
(31,143
|
)
|
(42,506
|
)
|
|||||
|
Acquisition of Torrance refinery and related logistics assets
|
—
|
|
—
|
|
(971,932
|
)
|
|||||
|
Chalmette Acquisition working capital settlement
|
—
|
|
—
|
|
(2,659
|
)
|
|||||
|
Acquisition of Toledo Products Terminal by PBFX
|
—
|
|
(10,097
|
)
|
—
|
|
|||||
|
Acquisition of Knoxville Terminal by PBFX
|
(58,356
|
)
|
—
|
|
—
|
|
|||||
|
Acquisition of East Coast Storage Assets by PBFX
|
(74,989
|
)
|
—
|
|
—
|
|
|||||
|
PBFX Plains Asset Purchase
|
—
|
|
—
|
|
(98,373
|
)
|
|||||
|
Proceeds from sale of assets
|
48,290
|
|
—
|
|
24,692
|
|
|||||
|
Purchase of marketable securities
|
—
|
|
(75,036
|
)
|
(1,909,965
|
)
|
|||||
|
Maturities of marketable securities
|
—
|
|
115,060
|
|
2,104,209
|
|
|||||
|
Net cash used in investing activities
|
$
|
(685,597
|
)
|
$
|
(687,011
|
)
|
$
|
(1,393,935
|
)
|
||
See notes to consolidated financial statements.
F- 17
PBF ENERGY COMPANY LLC AND SUBSIDIARIES
CONSOLIDATED STATEMENTS OF CASH FLOWS (Continued)
(in thousands)
|
Year Ended December 31,
|
|||||||||||
|
Cash flows from financing activities:
|
2018
|
2017
|
2016
|
||||||||
|
Proceeds from issuance of PBF LLC Series C units
|
$
|
287,284
|
|
$
|
—
|
|
$
|
275,300
|
|
||
|
Net proceeds from issuance of PBFX common units
|
34,820
|
|
—
|
|
138,378
|
|
|||||
|
Distributions to PBF Energy Company LLC members
|
(140,981
|
)
|
(136,270
|
)
|
(139,682
|
)
|
|||||
|
Distributions to PBFX public unitholders
|
(48,187
|
)
|
(43,510
|
)
|
(32,806
|
)
|
|||||
|
Distribution to T&M and Collins shareholders
|
—
|
|
(1,800
|
)
|
—
|
|
|||||
|
Proceeds from 2025 Senior Notes
|
—
|
|
725,000
|
|
—
|
|
|||||
|
Cash paid to extinguish 2020 Senior Secured Notes
|
—
|
|
(690,209
|
)
|
—
|
|
|||||
|
Proceeds from revolver borrowings
|
—
|
|
490,000
|
|
550,000
|
|
|||||
|
Repayments of revolver borrowings
|
(350,000
|
)
|
(490,000
|
)
|
(200,000
|
)
|
|||||
|
Repayments of Rail Facility revolver borrowings
|
—
|
|
—
|
|
(67,491
|
)
|
|||||
|
Proceeds from PBF Rail Term Loan
|
—
|
|
—
|
|
35,000
|
|
|||||
|
Repayments of PBF Rail Term Loan
|
(6,812
|
)
|
(6,633
|
)
|
—
|
|
|||||
|
Proceeds from PBFX revolver borrowings
|
170,000
|
|
20,000
|
|
194,700
|
|
|||||
|
Repayments of PBFX revolver borrowings
|
(43,700
|
)
|
(179,500
|
)
|
(30,000
|
)
|
|||||
|
Repayments of PBFX Term Loan borrowings
|
—
|
|
(39,664
|
)
|
(194,536
|
)
|
|||||
|
Proceeds from 2023 PBFX Senior Notes
|
—
|
|
178,500
|
|
—
|
|
|||||
|
Proceeds from affiliate loan with PBF Energy Inc.
|
44,159
|
|
102,751
|
|
—
|
|
|||||
|
Repayment of affiliate loan with PBF Energy Inc.
|
—
|
|
—
|
|
(24,531
|
)
|
|||||
|
Repayments of note payable
|
(5,621
|
)
|
(1,210
|
)
|
—
|
|
|||||
|
Catalyst lease settlements
|
(9,108
|
)
|
10,830
|
|
15,586
|
|
|||||
|
Taxes paid for net settlement of equity-based compensation
|
(8,700
|
)
|
—
|
|
—
|
|
|||||
|
Proceeds from stock options exercised
|
164
|
|
—
|
|
—
|
|
|||||
|
Purchases of treasury stock
|
(8,215
|
)
|
(1,038
|
)
|
(743
|
)
|
|||||
|
Deferred financing costs and other
|
(16,178
|
)
|
(17,131
|
)
|
886
|
|
|||||
|
Net cash (used in) provided by financing activities
|
$
|
(101,075
|
)
|
$
|
(79,884
|
)
|
$
|
520,061
|
|
||
|
Net increase (decrease) in cash and cash equivalents
|
33,985
|
|
(172,926
|
)
|
(203,902
|
)
|
|||||
|
Cash and equivalents, beginning of period
|
562,036
|
|
734,962
|
|
938,864
|
|
|||||
|
Cash and equivalents, end of period
|
$
|
596,021
|
|
$
|
562,036
|
|
$
|
734,962
|
|
||
|
Supplemental cash flow disclosures
|
|||||||||||
|
Non-cash activities:
|
|||||||||||
|
Accrued and unpaid capital expenditures
|
$
|
90,210
|
|
$
|
26,805
|
|
$
|
35,595
|
|
||
|
Deferred payment for PBFX East Coast Storage Assets Acquisition
|
30,900
|
|
—
|
|
—
|
|
|||||
|
East Coast Storage Assets Acquisition contingent consideration
|
21,100
|
|
—
|
|
—
|
|
|||||
|
Note payable issued for purchase of property, plant and equipment
|
—
|
|
6,831
|
|
—
|
|
|||||
|
Conversion of Delaware Economic Development Authority loan to grant
|
—
|
|
—
|
|
4,000
|
|
|||||
|
Cash paid during year for:
|
|||||||||||
|
Interest, net of capitalized interest of $9,469, $7,156 and $8,452 in 2018, 2017 and 2016, respectively
|
$
|
164,405
|
|
$
|
166,538
|
|
$
|
137,599
|
|
||
|
Income taxes
|
596
|
|
—
|
|
2,449
|
|
|||||
See notes to consolidated financial statements.
F- 18
PBF ENERGY INC. AND PBF ENERGY COMPANY LLC
NOTES TO CONSOLIDATED FINANCIAL STATEMENTS
(IN THOUSANDS, EXCEPT SHARE, UNIT, PER SHARE, PER UNIT AND BARREL DATA)
1. DESCRIPTION OF THE BUSINESS AND BASIS OF PRESENTATION
Description of the Business
PBF Energy Inc. (“PBF Energy”) was formed as a Delaware corporation on November 7, 2011 and is the sole managing member of PBF Energy Company LLC (“PBF LLC”), a Delaware limited liability company, with a controlling interest in PBF LLC and its subsidiaries. PBF Energy consolidates the financial results of PBF LLC and its subsidiaries and records a noncontrolling interest in its consolidated financial statements representing the economic interests of PBF LLC’s members other than PBF Energy (refer to “Note 15 - Noncontrolling Interests”).
PBF Energy holds a 99.0% economic interest in PBF LLC as of December 31, 2018 through its ownership of PBF LLC Series C Units, which are held solely by PBF Energy. Holders of PBF LLC Series A Units, which are held by parties other than PBF Energy (“the members of PBF LLC other than PBF Energy”), hold the remaining 1.0% economic interest in PBF LLC. The PBF LLC Series C Units rank on parity with the PBF LLC Series A Units as to distribution rights, voting rights and rights upon liquidation, winding up or dissolution. In addition, the amended and restated limited liability company agreement of PBF LLC provides that any PBF LLC Series A Units acquired by PBF Energy will automatically be reclassified as PBF LLC Series C Units in connection with such acquisition.
PBF LLC, together with its consolidated subsidiaries, owns and operates oil refineries and related facilities in North America. PBF Holding Company LLC (“PBF Holding”) is a wholly-owned subsidiary of PBF LLC. PBF Investments LLC (“PBF Investments”), Toledo Refining Company LLC (“Toledo Refining” or “TRC”), Paulsboro Refining Company LLC (“Paulsboro Refining” or “PRC”), Delaware City Refining Company LLC (“Delaware City Refining” or “DCR”), Chalmette Refining, L.L.C. (“Chalmette Refining”), PBF Western Region LLC (“PBF Western Region”), Torrance Refining Company LLC (“Torrance Refining”) and Torrance Logistics Company LLC are PBF LLC’s principal operating subsidiaries and are all wholly-owned subsidiaries of PBF Holding. Discussions or areas of the Notes to Consolidated Financial Statements that either apply only to PBF Energy or PBF LLC are clearly noted in such footnotes.
At
December 31, 2018
, PBF LLC also held a
44.0%
limited partner interest and all of the incentive distribution rights in PBF Logistics LP (“PBFX”), a publicly-traded master limited partnership (“MLP”) (refer to “Note 3 - PBF Logistics LP”). PBF Logistics GP LLC (“PBF GP”) owns the noneconomic general partner interest and serves as the general partner of PBFX and is wholly-owned by PBF LLC. PBF Energy, through its ownership of PBF LLC, consolidates the financial results of PBFX and its subsidiaries and records a noncontrolling interest in its consolidated financial statements representing the economic interests of PBFX’s unitholders other than PBF LLC (refer to “Note 15 - Noncontrolling Interests”). Collectively, PBF Energy and its consolidated subsidiaries, including PBF LLC, PBF Holding, PBF GP and PBFX are referred to hereinafter as the “Company” unless the context otherwise requires.
Substantially all of the Company’s operations are in the United States. The Company operates in
two
reportable business segments: Refining and Logistics. The Company’s oil refineries are all engaged in the refining of crude oil and other feedstocks into petroleum products, and are aggregated into the Refining segment. PBFX is a publicly-traded MLP that was formed to operate logistical assets such as crude oil and refined petroleum products terminals, pipelines and storage facilities. The Logistics segment consists solely of PBFX’s operations. To generate earnings and cash flows from operations, the Company is primarily dependent upon processing crude oil and selling refined petroleum products at margins sufficient to cover fixed and variable costs and other expenses. Crude oil and refined petroleum products are commodities; and factors that are largely out of the Company’s control can cause prices to vary over time. The resulting potential margin volatility can have a material effect on the Company’s financial position, earnings and cash flow.
Public Offerings
In connection with certain of the secondary offerings completed in 2015, 2014 and 2013, investment funds associated with the initial investors in PBF LLC exchanged all of their PBF LLC Series A Units for an equal number of shares of PBF Energy Class A common stock which were subsequently sold to the public and, accordingly, no
F- 19
PBF ENERGY INC. AND PBF ENERGY COMPANY LLC
NOTES TO CONSOLIDATED FINANCIAL STATEMENTS
(IN THOUSANDS, EXCEPT SHARE, UNIT, PER SHARE, PER UNIT AND BARREL DATA)
longer hold any PBF LLC Series A Units. The holders of PBF LLC Series B Units, which include certain current and former executive officers of PBF Energy, had the right to receive a portion of the proceeds of the sale of the PBF Energy Class A common stock by the investment funds associated with the initial investors in PBF LLC. PBF Energy did not receive any proceeds from any of the secondary offerings.
The Company completed follow-on equity offerings that were made to the public as follows:
|
•
|
On October 13, 2015, PBF Energy completed a public offering of an aggregate of
11,500,000
shares of its Class A common stock, including
1,500,000
shares of its Class A common stock that was sold pursuant to the exercise of an over-allotment option, for net proceeds of
$344,000
, after deducting underwriting discounts and commissions and other offering expenses (the “October 2015 Equity Offering”).
|
|
•
|
On December 19, 2016, PBF Energy completed a public offering of an aggregate of
10,000,000
shares of its Class A common stock for net proceeds of
$274,300
, after deducting underwriting discounts and commissions and other offering expenses (the “December 2016 Equity Offering”).
|
|
•
|
On August 14, 2018, PBF Energy completed a public offering of an aggregate of
6,000,000
shares of its Class A common stock for net proceeds of
$287,284
, after deducting underwriting discounts and commissions and other offering expenses (the “August 2018 Equity Offering”).
|
As a result of the equity offerings described above and certain other transactions such as stock option exercises, as of
December 31, 2018
, PBF Energy owned
119,895,422
PBF LLC Series C Units and the Company’s current and former executive officers and directors and certain employees and others beneficially owned
1,206,325
PBF LLC Series A Units. As of
December 31, 2018
, the holders of PBF Energy’s issued and outstanding shares of Class A common stock have
99.0%
of the voting power in the Company and the members of PBF LLC other than PBF Energy through their holdings of Class B common stock have the remaining
1.0%
of the voting power in the Company.
Tax Receivable Agreement
PBF LLC intends to have an election under Section 754 of the Internal Revenue Code (the “Code”) in effect for each taxable year in which an exchange of PBF LLC Series A Units for PBF Energy Class A common stock as described above occurs, which may result in an adjustment to the tax basis of the assets of PBF LLC at the time of an exchange of PBF LLC Series A Units. As a result of both the initial purchase of PBF LLC Series A Units from the PBF LLC Series A unitholders in connection with the IPO and subsequent exchanges, PBF Energy will become entitled to a proportionate share of the existing tax basis of the assets of PBF LLC. In addition, the purchase of PBF LLC Series A Units and subsequent exchanges have resulted in and are expected to continue to result in increases in the tax basis of the assets of PBF LLC that otherwise would not have been available. Both this proportionate share and these increases in tax basis may reduce the amount of tax that PBF Energy would otherwise be required to pay in the future. These increases in tax basis may also decrease gains (or increase losses) on future dispositions of certain capital assets to the extent tax basis is allocated to those capital assets.
F- 20
PBF ENERGY INC. AND PBF ENERGY COMPANY LLC
NOTES TO CONSOLIDATED FINANCIAL STATEMENTS
(IN THOUSANDS, EXCEPT SHARE, UNIT, PER SHARE, PER UNIT AND BARREL DATA)
2. SUMMARY OF SIGNIFICANT ACCOUNTING POLICIES
Principles of Consolidation and Presentation
These consolidated financial statements include the accounts of PBF Energy and subsidiaries in which PBF Energy has a controlling interest. All intercompany accounts and transactions have been eliminated in consolidation.
Cost Classifications
Cost of products and other consists of the cost of crude oil, other feedstocks, blendstocks and purchased refined products and the related in-bound freight and transportation costs.
Operating expenses (excluding depreciation and amortization) consists of direct costs of labor, maintenance and services, utilities, property taxes, environmental compliance costs and other direct operating costs incurred in connection with our refining operations. Such expenses exclude depreciation related to refining and logistics assets that are integral to the refinery production process, which is presented separately as Depreciation and amortization expense as a component of Cost of sales on the Company’s consolidated statements of operations.
Reclassification
Certain amounts previously reported in the Company’s consolidated financial statements for prior periods have been reclassified to conform to the
2018
presentation. These reclassifications include certain details about the Company’s adoption of ASU 2017-07, further explained below, under Recently Adopted Accounting Guidance.
Use of Estimates
The preparation of the financial statements in conformity with accounting principles generally accepted in the United States (“GAAP”) requires management to make estimates and assumptions that affect the reported amounts of assets, liabilities, revenues and expenses and the related disclosures. Actual results could differ from those estimates.
Business Combinations
We use the acquisition method of accounting for the recognition of assets acquired and liabilities assumed in business combinations at their estimated fair values as of the date of acquisition. Any excess consideration transferred over the estimated fair values of the identifiable net assets acquired is recorded as goodwill. Significant judgment is required in estimating the fair value of assets acquired. As a result, in the case of significant acquisitions, we obtain the assistance of third-party valuation specialists in estimating fair values of tangible and intangible assets based on available historical information and on expectations and assumptions about the future, considering the perspective of marketplace participants. While management believes those expectations and assumptions are reasonable, they are inherently uncertain. Unanticipated market or macroeconomic events and circumstances may occur, which could affect the accuracy or validity of the estimates and assumptions.
Cash and Cash Equivalents
The Company considers all highly liquid investments with original maturities of three months or less to be cash equivalents. The carrying amount of the cash equivalents approximates fair value due to the short-term maturity of those instruments.
Marketable Securities
Debt or equity securities are classified into the following reporting categories: held-to-maturity, trading or available-for-sale securities. The Company does not routinely sell marketable securities prior to their scheduled maturity dates. Some of the Company’s investments may be held and restricted for the purpose of funding future capital expenditures and acquisitions. Such investments are classified as available-for-sale marketable securities as they may occasionally be sold prior to their scheduled maturity dates due to the unexpected timing of cash needs. The
F- 21
PBF ENERGY INC. AND PBF ENERGY COMPANY LLC
NOTES TO CONSOLIDATED FINANCIAL STATEMENTS
(IN THOUSANDS, EXCEPT SHARE, UNIT, PER SHARE, PER UNIT AND BARREL DATA)
carrying value of these marketable securities approximates fair value and is measured using Level 1 inputs (as defined below).
The marketable securities were fully liquidated as of December 31, 2017 and the PBFX Term Loan (as defined in “Note 9 - Credit Facility and Debt”) that they collateralized was repaid in full during the year ended December 31, 2017.
Concentrations of Credit Risk
For the years ended
December 31, 2018
,
2017
and
2016
no
single customer amounted to greater than or equal to
10%
of the Company’s revenues.
No
single customer accounted for
10%
or more of our total trade accounts receivable as of
December 31, 2018
or
December 31, 2017
.
Revenue, Deferred Revenue and Accounts Receivable
Prior to January 1, 2018, the Company recognized revenue from customers when all of the following criteria were met: (i) persuasive evidence of an exchange arrangement existed, (ii) delivery had occurred or services had been rendered, (iii) the buyer’s price was fixed or determinable and (iv) collectability was reasonably assured. Amounts billed in advance of the period in which the service was rendered or product delivered were recorded as deferred revenue. Effective January 1, 2018, the Company adopted ASC 606, as defined below under “Recently Adopted Accounting Guidance”. As a result, the Company has changed its accounting policy for the recognition of revenue from contracts with customers. Revenues are recognized when control of the promised goods or services is transferred to the customers, in an amount that reflects the consideration the Company expects to be entitled to in exchange for those goods or services. Refer to “Note 18 - Revenues” for further discussion of the Company’s revenue recognition policy, including deferred revenues and the practical expedients elected as part of the transition to ASC 606.
On May 4, 2017 and September 8, 2017, PBF Holding and its subsidiaries, DCR and PRC, entered into amendments to the inventory intermediation agreements (as amended, the “Inventory Intermediation Agreements”) with J. Aron & Company, a subsidiary of The Goldman Sachs Group, Inc. (“J. Aron”), pursuant to which certain terms of the existing inventory intermediation agreements were amended, including, among other things, pricing and an extension of the terms. As a result of the amendments (i) the Inventory Intermediation Agreement by and among J. Aron, PBF Holding and PRC relating to the Paulsboro refinery extends the term to December 31, 2019, which term may be further extended by mutual consent of the parties to December 31, 2020 and (ii) the Inventory Intermediation Agreement by and among J. Aron, PBF Holding and DCR relating to the Delaware City refinery extends the term to July 1, 2019, which term may be further extended by mutual consent of the parties to July 1, 2020.
Pursuant to each Inventory Intermediation Agreement, J. Aron continues to purchase and hold title to certain of the intermediate and finished products (the “Products”) produced by the Paulsboro and Delaware City refineries (the “Refineries”), respectively, and delivered into tanks at the Refineries. Furthermore, J. Aron agrees to sell the Products back to the Refineries as the Products are discharged out of the Refineries’ tanks. These purchases and sales are settled monthly at the daily market prices related to those products. These transactions are considered to be made in contemplation of each other and, accordingly, do not result in the recognition of a sale when title passes from the refineries to J. Aron. Additionally, J. Aron has the right to store the Products purchased in tanks under the Inventory Intermediation Agreements and will retain these storage rights for the term of the agreements. PBF Holding continues to market and sell the Products independently to third parties.
Accounts receivable are carried at invoiced amounts. An allowance for doubtful accounts is established, if required, to report such amounts at their estimated net realizable value. In estimating probable losses, management reviews accounts that are past due and determines if there are any known disputes. There was
no
allowance for doubtful accounts at
December 31, 2018
and
2017
.
F- 22
PBF ENERGY INC. AND PBF ENERGY COMPANY LLC
NOTES TO CONSOLIDATED FINANCIAL STATEMENTS
(IN THOUSANDS, EXCEPT SHARE, UNIT, PER SHARE, PER UNIT AND BARREL DATA)
Excise taxes on sales of refined products that are collected from customers and remitted to various governmental agencies are reported on a net basis.
Inventory
Inventories are carried at the lower of cost or market. The cost of crude oil, feedstocks, blendstocks and refined products are determined under the last-in first-out (“LIFO”) method using the dollar value LIFO method with increments valued based on average purchase prices during the year. The cost of supplies and other inventories is determined principally on the weighted average cost method.
Property, Plant and Equipment
Property, plant and equipment additions are recorded at cost. The Company capitalizes costs associated with the preliminary, pre-acquisition and development/construction stages of a major construction project. The Company capitalizes the interest cost associated with major construction projects based on the effective interest rate of total borrowings. The Company also capitalizes costs incurred in the acquisition and development of software for internal use, including the costs of software, materials, consultants and payroll-related costs for employees incurred in the application development stage.
Depreciation is computed using the straight-line method over the following estimated useful lives:
|
Process units and equipment
|
5-25 years
|
|
Pipeline and equipment
|
5-25 years
|
|
Buildings
|
25 years
|
|
Computers, furniture and fixtures
|
3-7 years
|
|
Leasehold improvements
|
20 years
|
|
Railcars
|
50 years
|
Maintenance and repairs are charged to operating expenses as they are incurred. Improvements and betterments, which extend the lives of the assets, are capitalized.
Deferred Charges and Other Assets, Net
Deferred charges and other assets include refinery turnaround costs, catalyst, precious metal catalysts, linefill, deferred financing costs and intangible assets. Refinery turnaround costs, which are incurred in connection with planned major maintenance activities, are capitalized when incurred and amortized on a straight-line basis over the period of time estimated to lapse until the next turnaround occurs (generally
3
to
5
years).
Precious metal catalysts, linefill and certain other intangibles are considered indefinite-lived assets as they are not expected to deteriorate in their prescribed functions. Such assets are assessed for impairment in connection with the Company’s review of its long-lived assets as indicators of impairment develop.
Deferred financing costs are capitalized when incurred and amortized over the life of the loan (generally
1
to
8 years
).
Intangible assets with finite lives primarily consist of emission credits, permits and customer relationships and are amortized over their estimated useful lives (generally
1
to
10 years
).
Long-Lived Assets and Definite-Lived Intangibles
The Company reviews its long-lived assets for impairment whenever events or changes in circumstances indicate the carrying value may not be recoverable. Impairment is evaluated by comparing the carrying value of the long-lived assets to the estimated undiscounted future cash flows expected to result from use of the assets and their
F- 23
PBF ENERGY INC. AND PBF ENERGY COMPANY LLC
NOTES TO CONSOLIDATED FINANCIAL STATEMENTS
(IN THOUSANDS, EXCEPT SHARE, UNIT, PER SHARE, PER UNIT AND BARREL DATA)
ultimate disposition. If such analysis indicates that the carrying value of the long-lived assets is not considered to be recoverable, the carrying value is reduced to the fair value.
Impairment assessments inherently involve judgment as to assumptions about expected future cash flows and the impact of market conditions on those assumptions. Although management utilizes assumptions that it believes are reasonable, future events and changing market conditions may impact management’s assumptions, which could produce different results.
Asset Retirement Obligations
The Company records an asset retirement obligation at fair value for the estimated cost to retire a tangible long-lived asset at the time the Company incurs that liability, which is generally when the asset is purchased, constructed, or leased. The Company records the liability when it has a legal or contractual obligation to incur costs to retire the asset and when a reasonable estimate of the fair value of the liability can be made. If a reasonable estimate cannot be made at the time the liability is incurred, the Company will record the liability when sufficient information is available to estimate the liability’s fair value. Certain of the Company’s asset retirement obligations are based on its legal obligation to perform remedial activity at its refinery sites when it permanently ceases operations of the long-lived assets. The Company therefore considers the settlement date of these obligations to be indeterminable. Accordingly, the Company cannot calculate an associated asset retirement liability for these obligations at this time. The Company will measure and recognize the fair value of these asset retirement obligations when the settlement date is determinable.
Environmental Matters
Liabilities for future remediation costs are recorded when environmental assessments and/or remedial efforts are probable and the costs can be reasonably estimated. Other than for assessments, the timing and magnitude of these accruals generally are based on the completion of investigations or other studies or a commitment to a formal plan of action. Environmental liabilities are based on best estimates of probable future costs using currently available technology and applying current regulations, as well as the Company’s own internal environmental policies. The measurement of environmental remediation liabilities may be discounted to reflect the time value of money if the aggregate amount and timing of cash payments of the liabilities are fixed or reliably determinable. The actual settlement of the Company’s liability for environmental matters could materially differ from its estimates due to a number of uncertainties such as the extent of contamination, changes in environmental laws and regulations, potential improvements in remediation technologies and the participation of other responsible parties.
Stock-Based Compensation
Stock-based compensation includes the accounting effect of options to purchase PBF Energy Class A common stock granted by the Company to certain employees, Series A warrants issued or granted by PBF LLC to employees in connection with their acquisition of PBF LLC Series A units, options to acquire Series A units of PBF LLC granted by PBF LLC to certain employees, Series B units of PBF LLC that were granted to certain members of management and restricted PBF LLC Series A Units and restricted PBF Energy Class A common stock granted to certain directors and officers. The estimated fair value of the options to purchase PBF Energy Class A common stock and the PBF LLC Series A warrants and options is based on the Black-Scholes option pricing model and the fair value of the PBF LLC Series B units is estimated based on a Monte Carlo simulation model. The estimated fair value is amortized as stock-based compensation expense on a straight-line method over the vesting period and included in General and administrative expense with forfeitures recognized in the period they occur.
Additionally, stock-based compensation includes unit-based compensation provided to certain officers, non-employee directors and seconded employees of PBFX’s general partner, PBF GP, or its affiliates, consisting of PBFX phantom units. The fair value of PBFX’s phantom units are measured based on the fair market value of the underlying common units on the date of grant based on the common
unit closing price on the grant date. The estimated fair value of PBFX’s phantom units is amortized over the vesting period using the straight-line method. Awards vest over a
four
year service period. The phantom unit awards may be settled in common units, cash or a
F- 24
PBF ENERGY INC. AND PBF ENERGY COMPANY LLC
NOTES TO CONSOLIDATED FINANCIAL STATEMENTS
(IN THOUSANDS, EXCEPT SHARE, UNIT, PER SHARE, PER UNIT AND BARREL DATA)
combination of both. Expenses related to unit-based compensation are also included in General and administrative expenses with forfeitures recognized in the period they occur.
Beginning in 2018, PBF Energy granted performance share awards and performance unit awards to certain officers of the Company. Both types of awards have a
three
-year performance cycle and the payout for each, which ranges from
0%
to
200%
, is based on the relative ranking of the total shareholder return (“TSR”) of PBF Energy’s common stock as compared to the TSR of a selected group of industry peer companies over an average of four measurement periods. The performance share and performance unit awards are each measured at fair value based on Monte Carlo simulation models. The performance share awards will be settled in PBF Energy Class A common stock and are accounted for as equity awards and the performance unit awards will be settled in cash and are accounted for as liability awards.
Income Taxes
As a result of the PBF Energy’s acquisition of PBF LLC Series A Units or exchanges of PBF LLC Series A Units for PBF Energy Class A common stock, PBF Energy expects to benefit from amortization and other tax deductions reflecting the step up in tax basis in the acquired assets. Those deductions will be allocated to PBF Energy and will be taken into account in reporting PBF Energy’s taxable income. As a result of a federal income tax election made by PBF LLC, applicable to a portion of PBF Energy’s acquisition of PBF LLC Series A Units, the income tax basis of the assets of PBF LLC, underlying a portion of the units PBF Energy acquired, has been adjusted based upon the amount that PBF Energy paid for that portion of its PBF LLC Series A Units. PBF Energy entered into the Tax Receivable Agreement (as defined in “Note 13 - Commitments and Contingencies”) which provides for the payment by PBF Energy equal to
85%
of the amount of the benefits, if any, that PBF Energy is deemed to realize as a result of (i) increases in tax basis and (ii) certain other tax benefits related to entering into the Tax Receivable Agreement, including tax benefits attributable to payments under the Tax Receivable Agreement. As a result of these transactions, PBF Energy’s tax basis in its share of PBF LLC’s assets will be higher than the book basis of these same assets. This resulted in a deferred tax asset of
$306,231
as of
December 31, 2018
, of which the majority is expected to be realized over
10 years
as the tax basis of these assets is amortized.
Deferred taxes are provided using a liability method, whereby deferred tax assets are recognized for deductible temporary differences and deferred tax liabilities are recognized for taxable temporary differences. Temporary differences represent the differences between the reported amounts of assets and liabilities and their tax bases. Deferred tax assets are reduced by a valuation allowance when, in the opinion of management, it is more likely than not that some portion or all of the deferred tax assets will not be realized. Deferred tax assets and liabilities are adjusted for the effect of changes in tax laws and rates on the date of enactment. PBF Energy recognizes tax benefits for uncertain tax positions only if it is more likely than not that the position is sustainable based on its technical merits. Interest and penalties on uncertain tax positions are included as a component of the provision for income taxes on the consolidated statements of operations. As a result of the reduction of the corporate federal tax rate to
21%
as part of the Tax Cuts and Jobs Act (the “TCJA”), the liability associated with the Tax Receivable Agreement was reduced. Accordingly, the deferred tax assets associated with the payments made or expected to be made related to the Tax Receivable Agreement liability were also reduced.
The Federal tax returns for all years since 2015 and state tax returns for all years since 2013 to 2016 (see “Note 19 - Income Taxes”) are subject to examination by the respective tax authorities.
Net Income Per Share
Net income per share is calculated by dividing the net income available to PBF Energy Class A common stockholders by the weighted average number of shares of PBF Energy Class A common stock outstanding during the period. Diluted net income per share is calculated by dividing the net income available to PBF Energy Class A common stockholders, adjusted for the net income attributable to the noncontrolling interest and the assumed income tax expense thereon, by the weighted average number of PBF Energy Class A common shares outstanding during the period adjusted to include the assumed exchange of all PBF LLC Series A units outstanding for PBF Energy Class A common stock, if applicable under the if converted method, and the potentially dilutive effect of outstanding
F- 25
PBF ENERGY INC. AND PBF ENERGY COMPANY LLC
NOTES TO CONSOLIDATED FINANCIAL STATEMENTS
(IN THOUSANDS, EXCEPT SHARE, UNIT, PER SHARE, PER UNIT AND BARREL DATA)
options to purchase shares of PBF Energy Class A common stock, performance share awards and options and warrants to purchase PBF LLC Series A Units, subject to forfeiture utilizing the treasury stock method.
Pension and Other Post-Retirement Benefits
The Company recognizes an asset for the overfunded status or a liability for the underfunded status of its pension and post-retirement benefit plans. The funded status is recorded within Other long-term liabilities or assets. Changes in the plans’ funded status are recognized in other comprehensive income in the period the change occurs.
Fair Value Measurement
A fair value hierarchy (Level 1, Level 2, or Level 3) is used to categorize fair value amounts based on the quality of inputs used to measure fair value. Accordingly, fair values derived from Level 1 inputs utilize quoted prices in active markets for identical assets or liabilities. Fair values derived from Level 2 inputs are based on quoted prices for similar assets and liabilities in active markets, and inputs other than quoted prices that are either directly or indirectly observable for the asset or liability. Level 3 inputs are unobservable inputs for the asset or liability, and include situations where there is little, if any, market activity for the asset or liability.
The Company uses appropriate valuation techniques based on the available inputs to measure the fair values of its applicable assets and liabilities. When available, the Company measures fair value using Level 1 inputs because they generally provide the most reliable evidence of fair value. In some valuations, the inputs may fall into different levels in the hierarchy. In these cases, the asset or liability level within the fair value hierarchy is based on the lowest level of input that is significant to the fair value measurements.
Financial Instruments
The estimated fair value of financial instruments has been determined based on the Company’s assessment of available market information and appropriate valuation methodologies. The Company’s non-derivative financial instruments that are included in current assets and current liabilities are recorded at cost in the consolidated balance sheets. The estimated fair value of these financial instruments approximates their carrying value due to their short-term nature. Derivative instruments are recorded at fair value in the consolidated balance sheets.
The Company’s commodity contracts are measured and recorded at fair value using Level 1 inputs based on quoted prices in an active market, Level 2 inputs based on quoted market prices for similar instruments, or Level 3 inputs based on third-party sources and other available market based data. The Company’s catalyst lease obligation and derivatives related to the Company’s crude oil and feedstocks and refined product purchase obligations are measured and recorded at fair value using Level 2 inputs on a recurring basis, based on observable market prices for similar instruments.
Derivative Instruments
The Company is exposed to market risk, primarily related to changes in commodity prices for the crude oil and feedstocks used in the refining process as well as the prices of the refined products sold. The accounting treatment for commodity contracts depends on the intended use of the particular contract and on whether or not the contract meets the definition of a derivative.
All derivative instruments, not designated as normal purchases or sales, are recorded in the consolidated balance sheet as either assets or liabilities measured at their fair values. Changes in the fair value of derivative instruments that either are not designated or do not qualify for hedge accounting treatment or normal purchase or normal sale accounting are recognized currently in earnings. Contracts qualifying for the normal purchase and sales exemption are accounted for upon settlement. Cash flows related to derivative instruments that are not designated or do not qualify for hedge accounting treatment are included in operating activities.
The Company designates certain derivative instruments as fair value hedges of a particular risk associated with a recognized asset or liability. At the inception of the hedge designation, the Company documents the relationship
F- 26
PBF ENERGY INC. AND PBF ENERGY COMPANY LLC
NOTES TO CONSOLIDATED FINANCIAL STATEMENTS
(IN THOUSANDS, EXCEPT SHARE, UNIT, PER SHARE, PER UNIT AND BARREL DATA)
between the hedging instrument and the hedged item, as well as its risk management objective and strategy for undertaking various hedge transactions. Derivative gains and losses related to these fair value hedges, including hedge ineffectiveness, are recorded in cost of sales along with the change in fair value of the hedged asset or liability attributable to the hedged risk. Cash flows related to derivative instruments that are designated as fair value hedges are included in operating activities.
Economic hedges are hedges not designated as fair value or cash flow hedges for accounting purposes that are used to (i) manage price volatility in certain refinery feedstock and refined product inventories, and (ii) manage price volatility in certain forecasted refinery feedstock purchases and refined product sales. These instruments are recorded at fair value and changes in the fair value of the derivative instruments are recognized currently in cost of sales.
Derivative accounting is complex and requires management judgment in the following respects: identification of derivatives and embedded derivatives, determination of the fair value of derivatives, documentation of hedge relationships, assessment and measurement of hedge ineffectiveness and election and designation of the normal purchases and sales exception. All of these judgments, depending upon their timing and effect, can have a significant impact on the Company’s earnings.
Recently Adopted Accounting Guidance
In May 2014, the Financial Accounting Standard Board (“FASB”) issued Accounting Standards Update (“ASU”) No. 2014-09 (Topic 606) “Revenue from Contracts with Customers.” (“ASC 606”). ASC 606 supersedes the revenue recognition requirements in Accounting Standards Codification 605 “Revenue Recognition” (“ASC 605”), and requires entities to recognize revenue when control of the promised goods or services is transferred to customers at an amount that reflects the consideration to which the entity expects to be entitled to in exchange for those goods or services. The Company adopted ASC 606 as of January 1, 2018 using the modified retrospective transition method. See “Note 18 - Revenues” for further details.
In March 2017, the FASB issued ASU No. 2017-07, “Compensation—Retirement Benefits (Topic 715): Improving the Presentation of Net Periodic Pension Cost and Net Periodic Postretirement Benefit Cost” (“ASU 2017-07”), which provides guidance to improve the reporting of net periodic benefit cost in the income statement and on the components eligible for capitalization in assets. Under the new guidance, employers present the service cost component of net periodic benefit cost in the same income statement line item(s) as other employee compensation costs arising from services rendered during the period. Only the service cost component will be eligible for capitalization in assets. Additionally, under this guidance, employers will present the other non-service components of the net periodic benefit cost separately from the line item(s) that includes the service cost and outside of any subtotal of income from operations, if one is presented. Employers will apply the guidance on the presentation of the components of net periodic benefit cost in the income statement retrospectively. The guidance limiting the capitalization of net periodic benefit cost in assets to the service cost component will be applied prospectively. The guidance includes a practical expedient allowing entities to estimate amounts for comparative periods using the information previously disclosed in their pension and other postretirement benefit plan note to the financial statements. The Company adopted ASU 2017-07 effective January 1, 2018 and applied the new guidance retrospectively in the Consolidated Statements of Operations. Income and expense amounts related to non-service components of net periodic benefit cost, historically recorded within Operating expenses and General and administrative expenses, have been recorded within Other income (expense). For the years ended December 31, 2018, 2017 and 2016 the Company recorded income of
$1,109
, expense of
$1,402
and expense of
$580
, respectively, related to the non-service components of net periodic benefit cost.
In May 2017, the FASB issued ASU No. 2017-09, “Compensation—Stock Compensation (Topic 718): Scope of Modification Accounting” (“ASU 2017-09”), which provides guidance to increase clarity and reduce both diversity in practice and cost and complexity when applying the existing accounting guidance on changes to the terms or conditions of a share-based payment award. The amendments in ASU 2017-09 require an entity to account for the effects of a modification unless all the following are met: (i) the fair value of the modified award is the same as the fair value of the original award immediately before the original award is modified; (ii) the vesting conditions
F- 27
PBF ENERGY INC. AND PBF ENERGY COMPANY LLC
NOTES TO CONSOLIDATED FINANCIAL STATEMENTS
(IN THOUSANDS, EXCEPT SHARE, UNIT, PER SHARE, PER UNIT AND BARREL DATA)
of the modified award are the same as the vesting conditions of the original award immediately before the original award is modified; and (iii) the classification of the modified award as an equity instrument or a liability instrument is the same as the classification of the original award immediately before the original award is modified. The guidance in ASU 2017-09 should be applied prospectively. The Company adopted the amendments in this ASU effective January 1, 2018. The Company’s adoption of this guidance did not materially impact its consolidated financial statements.
Recently Issued Accounting Pronouncements
In February 2016, the FASB issued ASU No. 2016-02, “Leases (Topic 842)” (“ASU 2016-02”), to increase the transparency and comparability about leases among entities. Additional ASUs have been issued subsequent to ASU 2016-02 to provide supplementary clarification and implementation guidance for leases related to, among other things, the application of certain practical expedients, the rate implicit in the lease, lessee reassessment of lease classification, lessor reassessment of lease term and purchase options, variable payments that depend on an index or rate and certain transition adjustments (collectively, the Company refers to ASU 2016-02 and these additional ASUs as the “Updated Lease Guidance”). The Updated Lease Guidance requires lessees to recognize a lease liability and a corresponding lease asset for virtually all lease contracts. It also requires additional disclosures about leasing arrangements. The Company has adopted the Updated Lease Guidance effective January 1, 2019, using a modified retrospective approach whereby a cumulative effect adjustment will be recognized upon adoption and the Updated Lease Guidance will be applied prospectively.
The Company has completed its evaluation of the provisions of the Updated Lease Guidance, including the adoption of certain practical expedients allowed. The significant practical expedients adopted include the following:
|
•
|
The Company elected the practical expedient to apply the transition approach as of the beginning of the period of adoption and not restate comparative periods;
|
|
•
|
The Company elected to utilize the “package of three” expedients, as defined in the Updated Lease Guidance, whereby it did not reassess whether contracts existing prior to the effective date contain leases, nor did it reassess lease classification determinations nor whether initial direct costs qualify for capitalization;
|
|
•
|
The Company elected the practical expedient to not capitalize any leases with initial terms of less than twelve months on its consolidated balance sheet;
|
|
•
|
The Company elected the practical expedient to not separate lease and non-lease components; and
|
|
•
|
The Company elected the practical expedient to continue to account for land easements (also known as “rights of way”) that were not previously accounted for as leases consistent with prior accounting until such contracts are modified or replaced, at which time they would be assessed for lease classification under the Updated Lease Guidance.
|
The Company has successfully completed the implementation of a lease software system and has refined business processes and controls to address the new standard. The Company is currently developing its lease disclosures and enhancing its accounting systems to enable the preparation of such disclosures beginning with its quarterly reporting on Form 10-Q for the period ending March 31, 2019. As of the date of implementation on January 1, 2019, the impact of the adoption of the Updated Lease Guidance is estimated to result in the recognition of a right of use asset and lease payable obligation on the Company’s consolidated balance sheet of approximately
$225,000
to
$275,000
. Subsequent to adoption, the Company does not anticipate the impact on its results and cash flows to be material.
In August 2017, the FASB issued ASU No. 2017-12, “Derivatives and Hedging (Topic 815): Targeted Improvements to Accounting for Hedging Activities” (“ASU 2017-12”). The amendments in ASU 2017-12 more closely align the results of cash flow and fair value hedge accounting with risk management activities in the consolidated financial statements. The amendments expand the ability to hedge nonfinancial and financial risk components, reduce complexity in fair value hedges of interest rate risk, eliminate the requirement to separately measure and report hedge ineffectiveness, and eases certain hedge effectiveness assessment requirements. The guidance in ASU 2017-12 should be applied using a modified retrospective approach. The guidance in ASU 2017-12 also provides
F- 28
PBF ENERGY INC. AND PBF ENERGY COMPANY LLC
NOTES TO CONSOLIDATED FINANCIAL STATEMENTS
(IN THOUSANDS, EXCEPT SHARE, UNIT, PER SHARE, PER UNIT AND BARREL DATA)
transition relief to make it easier for entities to apply certain amendments to existing hedges (including fair value hedges) where the hedge documentation needs to be modified. The presentation and disclosure requirements of ASU 2017-12 should be applied prospectively. The Company adopted the amendments in this ASU effective January 1, 2019, which did not have a material impact on its consolidated financial statements and related disclosures.
In June 2018, the FASB issued ASU No. 2018-07, “Compensation - Stock Compensation (Topic 718): Targeted Improvements to Non-employee Share-Based Payment Accounting” (“ASU 2018-07”). ASU 2018-07 expands the scope of Topic 718, Compensation-Stock Compensation, to include share-based payment transactions for acquiring goods and services from nonemployees. As a result, nonemployee share-based transactions will be measured by estimating the fair value of the equity instruments at the grant date, taking into consideration the probability of satisfying performance conditions. In addition, ASU 2018-07 also clarifies that any share-based payment awards issued to customers should be evaluated under ASC 606, Revenue from Contracts with Customers. The Company adopted the amendments in this ASU effective January 1, 2019, which did not have a material impact on its consolidated financial statements and related disclosures.
In August 2018, the FASB issued ASU No. 2018-14, “Compensation - Retirement Benefits - Defined Benefit Plans - General (Subtopic 715-20)”, to improve the effectiveness of disclosures in the notes to financial statements by facilitating clear communication of the information required by GAAP that is most important to users of each entity’s financial statements. The amendments in this ASU modify the disclosure requirements for employers that sponsor defined benefit pension or other postretirement plans. Additionally, the amendments in this ASU remove disclosures that no longer are considered cost beneficial, clarify the specific requirements of disclosures, and add disclosure requirements identified as relevant. The amendments in this ASU are effective for fiscal years ending after December 15, 2020, for public business entities and for fiscal years ending after December 15, 2021, for all other entities. Early adoption is permitted for all entities. The Company is currently evaluating the impact of this new standard on its consolidated financial statements and related disclosures.
3. PBF LOGISTICS LP
PBFX is a fee-based, growth-oriented, publicly-traded Delaware MLP formed by PBF Energy to own or lease, operate, develop and acquire crude oil and refined petroleum products terminals, pipelines, storage facilities and similar logistics assets. PBFX engages in the receiving, handling, storage and transferring of crude oil, refined products, natural gas and intermediates from sources located throughout the United States and Canada for PBF Energy in support of its refineries, as well as for third-party customers. As of
December 31, 2018
, a substantial majority of PBFX’s revenue is derived from long-term, fee-based commercial agreements with PBF Holding, which include minimum volume commitments, for receiving, handling, storing and transferring crude oil, refined products and natural gas. PBF Energy also has agreements with PBFX that establish fees for certain general and administrative services and operational and maintenance services provided by PBF Holding to PBFX. These transactions, other than those with third parties, are eliminated by PBF Energy and PBF LLC in consolidation.
PBFX, a variable interest entity, is consolidated by PBF Energy through its ownership of PBF LLC. PBF LLC, through its ownership of PBF GP, has the sole ability to direct the activities of PBFX that most significantly impact its economic performance. PBF LLC is considered to be the primary beneficiary of PBFX for accounting purposes.
Since it’s inception in 2014, PBFX has entered in a series of transactions including drop-down transactions, acquisitions, and offerings. Such transactions occurring in the three years ended
December 31, 2018
are discussed below.
Offerings
On May 14, 2014, PBFX completed its initial public offering of
15,812,500
common units. On April 5, 2016, PBFX completed a public offering of an aggregate of
2,875,000
of its common units, including
375,000
common units that were sold pursuant to the full exercise by the underwriter of its option to purchase additional common
F- 29
PBF ENERGY INC. AND PBF ENERGY COMPANY LLC
NOTES TO CONSOLIDATED FINANCIAL STATEMENTS
(IN THOUSANDS, EXCEPT SHARE, UNIT, PER SHARE, PER UNIT AND BARREL DATA)
units, for net proceeds of
$51,625
, after deducting underwriting discounts and commissions and other offering expenses (the “April 2016 PBFX Equity Offering”).
On August 17, 2016, PBFX completed a public offering of an aggregate of
4,000,000
common units and granted the underwriter an option to purchase an additional
600,000
common units, of which
375,000
units were subsequently purchased on September 14, 2016, for total net proceeds of
$86,753
, after deducting underwriting discounts and commissions and other offering expenses (the “August 2016 PBFX Equity Offering” and, together with the April 2016 PBFX Offering, the “2016 PBFX Offerings”).
On July 30, 2018, PBFX closed on a common unit purchase agreement with certain funds managed by Tortoise Capital Advisors, L.L.C. providing for the issuance and sale in a registered direct offering (the “Registered Direct Offering”) of an aggregate of
1,775,750
of its common units for net proceeds of approximately
$34,820
.
August 2016 Drop-down Transaction
On August 31, 2016, PBFX entered into a contribution agreement (the “TVPC Contribution Agreement”) between PBFX and PBF LLC. Pursuant to the TVPC Contribution Agreement, PBFX acquired from PBF LLC
50%
of the issued and outstanding limited liability company interests of Torrance Valley Pipeline Company LLC (“TVPC”), whose assets consist of the San Joaquin Valley Pipeline system (which was acquired as a part of the Torrance Acquisition, as defined in “Note 4 - Acquisitions”), including the M55, M1 and M70 pipeline systems including pipeline stations with storage capacity and truck unloading capability (collectively, the “Torrance Valley Pipeline”). The total consideration paid to PBF LLC was
$175,000
, which was funded by PBFX with
$20,000
of cash on hand,
$76,200
in proceeds from the sale of marketable securities, and
$78,800
in net proceeds from the PBFX August 2016 Equity Offering. PBFX borrowed an additional
$76,200
under the PBFX Revolving Credit Facility, which was used to repay
$76,200
of the PBFX Term Loan (as defined in “Note 9 - Credit Facility and Debt”) in order to release
$76,200
in marketable securities that had collateralized the PBFX Term Loan.
February 2017 Drop-down Transaction
On February 15, 2017, PBFX entered into a contribution agreement (the “PNGPC Contribution Agreement”) between PBFX and PBF LLC. Pursuant to the PNGPC Contribution Agreement, PBF LLC contributed to PBFX’s wholly-owned subsidiary PBFX Operating Company LLC (“PBFX Op Co”) all of the issued and outstanding limited liability company interests of Paulsboro Natural Gas Pipeline Company LLC (“PNGPC”). PNGPC owns and operates an existing interstate natural gas pipeline that originates in Delaware County, Pennsylvania, at an interconnection with Texas Eastern pipeline that runs under the Delaware River and terminates at the delivery point to PBF Holding’s Paulsboro refinery, and is subject to regulation by the Federal Energy Regulatory Commission (“FERC”). In connection with the PNGPC Contribution Agreement, PBFX constructed a new pipeline to replace the existing pipeline, which commenced services in August 2017 (the “Paulsboro Natural Gas Pipeline”). In consideration for the PNGPC limited liability company interests, PBFX delivered to PBF LLC (i) an
$11,600
intercompany promissory note in favor of Paulsboro Refining Company LLC, a wholly-owned subsidiary of PBF Holding (the “Promissory Note”), (ii) an expansion rights and right of first refusal agreement in favor of PBF LLC with respect to the Paulsboro Natural Gas Pipeline and (iii) an assignment and assumption agreement with respect to certain outstanding litigation involving PNGPC and the existing pipeline.
Chalmette Storage Tank Lease
Effective February 2017, PBF Holding and PBFX Op Co entered into a
ten
-year storage services agreement (the “Chalmette Storage Services Agreement”), under which PBFX, through PBFX Op Co, assumed construction of a crude oil storage tank at PBF Holding's Chalmette Refinery (the “Chalmette Storage Tank”), commencing on November 1, 2017 upon the completion of construction of the Chalmette Storage Tank. PBFX Op Co and Chalmette Refining have entered into a
twenty
-year lease for the premises upon which the tank is located and a project management agreement pursuant to which Chalmette Refining managed the construction of the tank, which expired upon the completion of the Chalmette Storage Tank in November 2017.
F- 30
PBF ENERGY INC. AND PBF ENERGY COMPANY LLC
NOTES TO CONSOLIDATED FINANCIAL STATEMENTS
(IN THOUSANDS, EXCEPT SHARE, UNIT, PER SHARE, PER UNIT AND BARREL DATA)
Knoxville Terminals Purchase
On April 16, 2018, PBFX completed the purchase of
two
refined product terminals located in Knoxville, Tennessee, which include product tanks, pipeline connections to the Colonial and Plantation pipeline systems and truck loading facilities with
nine
loading bays (the “Knoxville Terminals”) from Cummins Terminals, Inc. (“Cummins”) for total cash consideration of approximately
$58,000
, excluding working capital adjustments (the “Knoxville Terminals Purchase”). The transaction was financed through a combination of cash on hand and borrowings under the PBFX Revolving Credit Facility.
July 2018 Drop-down Transaction
On July 16, 2018, PBFX entered into
four
contribution agreements with PBF LLC (the “Development Assets Contribution Agreements”). Pursuant to the Development Asset Contribution Agreements, PBF LLC contributed all of the issued and outstanding limited liability company interests of: Toledo Rail Logistics Company LLC (“TRLC”), whose assets consist of a loading and unloading rail facility located at the Toledo refinery (the “Toledo Rail Products Facility”); Chalmette Logistics Company LLC (“CLC”), whose assets consist of a truck loading rack facility (the “Chalmette Truck Rack”) and a rail yard facility (the “Chalmette Rosin Yard”), both of which are located at the Chalmette refinery; Paulsboro Terminaling Company LLC (“PTC”), whose assets consist of a lube oil terminal facility located at the Paulsboro refinery (the “Paulsboro Lube Oil Terminal”); and DCR Storage and Loading Company LLC (“DSLC”), whose assets consist of an ethanol storage facility located at the Delaware City refinery (the “Delaware Ethanol Storage Facility” and collectively with the Toledo Rail Products Facility, the Chalmette Truck Rack, the Chalmette Rosin Yard, and the Paulsboro Lube Oil Terminal, the “Development Assets”), to PBFX Op Co effective July 31, 2018. In consideration for the Development Assets limited liability company interests, PBFX delivered to PBF LLC total consideration of
$31,586
, consisting of
1,494,134
common units of PBFX (the “Development Asset Acquisition”).
East Coast Storage Assets Acquisition
On July 16, 2018, PBFX entered into an agreement with Crown Point International, LLC (“Crown Point”) to purchase its wholly-owned subsidiary, CPI Operations LLC, whose assets include a storage facility with related infrastructure and equipment and other idled assets located on the Delaware River near Paulsboro, New Jersey (the “East Coast Storage Assets”). The East Coast Storage Assets Acquisition closed on October 1, 2018 and is further described in “Note 4 - Acquisitions”.
As of
December 31, 2018
, PBF LLC held a
44.0%
limited partner interest in PBFX (consisting of
19,953,631
common units), with the remaining
56.0%
limited partner interest held by the public unitholders. PBF LLC also owned all of the incentive distribution rights (“IDRs”) and indirectly owns a non-economic general partner interest in PBFX through its wholly-owned subsidiary, PBF GP, the general partner of PBFX. On February 13, 2019, PBFX entered into an Equity Restructuring Agreement (the “IDR Restructuring Agreement”) with PBF GP, pursuant to which the IDRs held by PBF LLC will be canceled and converted into newly issued PBFX common units (the “IDR Restructuring”). Prior to the IDR Restructuring, the IDRs entitled PBF LLC to receive increasing percentages, up to a maximum of
50.0%
, of the cash PBFX distributed from operating surplus in excess of
$0.345
per unit per quarter. As a result of the payment on May 31, 2017 by PBFX of its distribution for the first quarter of 2017, the financial tests required for conversion of all of PBFX’s previously outstanding subordinated units into common units were satisfied. As a result, all of PBFX’s subordinated units, which were owned by PBF LLC, converted on a
one
-for-one basis into common units effective June 1, 2017. The conversion of the subordinated units did not impact the amount of cash distributions paid by PBFX or the total number of its outstanding units. The subordinated units were issued by PBFX in connection with its initial public offering in May 2014.
F- 31
PBF ENERGY INC. AND PBF ENERGY COMPANY LLC
NOTES TO CONSOLIDATED FINANCIAL STATEMENTS
(IN THOUSANDS, EXCEPT SHARE, UNIT, PER SHARE, PER UNIT AND BARREL DATA)
4. ACQUISITIONS
East Coast Storage Assets Acquisition
On October 1, 2018, PBFX closed the East Coast Storage Assets Acquisition, which had been contemplated by an agreement dated as of July 16, 2018 between PBFX and Crown Point. The East Coast Storage Assets consist of a storage facility with multi-use storage capacity, an Aframax-capable marine facility, a rail facility, a truck terminal, equipment, contracts and certain other idled assets located on the Delaware River near Paulsboro, New Jersey. PBFX is currently in the process of restarting certain of the acquired idled assets in connection with a third-party commercial agreement.
The aggregate purchase price for the East Coast Storage Assets Acquisition was
$126,989
, including working capital and the Contingent Consideration (as defined below), which was comprised of an initial payment at closing of approximately
$75,000
with a remaining
$32,000
balance being payable one year after closing. Additionally, the East Coast Storage Assets Acquisition includes an earn-out provision related to an existing commercial agreement with a third-party, based on the future results of restarting certain of the acquired idled assets (the “Contingent Consideration”). The consideration was financed through a combination of cash on hand and borrowings under the PBFX Revolving Credit Facility. The fair value allocation is subject to adjustment pending completion of the final purchase valuation, which was in process as of December 31, 2018.
PBFX accounted for the East Coast Storage Assets Acquisition as a business combination under GAAP whereby PBFX recognizes assets acquired and liabilities assumed at their estimated fair values as of the date of acquisition.
The total purchase consideration and the estimated fair values of the assets and liabilities at the acquisition date were as follows:
|
Purchase Price
|
|||
|
Gross purchase price*
|
$
|
105,900
|
|
|
Estimated working capital adjustments
|
(11
|
)
|
|
|
Contingent consideration**
|
21,100
|
|
|
|
Total consideration
|
$
|
126,989
|
|
* Includes
$30,900
net present value payable of
$32,000
due to Crown Point one year after closing.
** Contingent consideration is included in “Other long-term liabilities” within the Consolidated Balance Sheets.
The following table summarizes the estimated amounts recognized for assets acquired and liabilities assumed as of the acquisition date:
|
Fair Value Allocation
|
|||
|
Accounts receivable
|
$
|
436
|
|
|
Prepaid and other current assets
|
1,770
|
|
|
|
Property, plant and equipment
|
114,406
|
|
|
|
Intangible assets*
|
13,300
|
|
|
|
Accounts payable and Accrued expenses
|
(2,173
|
)
|
|
|
Other long-term liabilities
|
(750
|
)
|
|
|
Estimated fair value of net assets acquired
|
$
|
126,989
|
|
* Intangible assets are included in “Deferred charges and other assets” within the Consolidated Balance Sheets.
PBFX’s agreement entered into with Crown Point includes an earn-out provision related to an existing commercial agreement with a third-party, based on the future results of restarting certain of the acquired idled assets acquired. Pursuant to the agreement, PBFX and Crown Point will share equally in the future operating profits of the restarted assets, as defined in the agreement, over a contractual term of up to approximately
three
years starting in 2020. PBFX recorded the earn-out provision as Contingent Consideration based on its estimated fair value at acquisition
F- 32
PBF ENERGY INC. AND PBF ENERGY COMPANY LLC
NOTES TO CONSOLIDATED FINANCIAL STATEMENTS
(IN THOUSANDS, EXCEPT SHARE, UNIT, PER SHARE, PER UNIT AND BARREL DATA)
date. This amount of
$21,100
was recorded within Other long-term liabilities, based on anticipated payments of
$27,978
, which are discounted over the
three
-year contractual period starting in 2020.
The Company’s consolidated financial statements for the year ended
December 31, 2018
include the results of operations of the East Coast Storage Assets since October 1, 2018, during which period the East Coast Storage Assets contributed third-party revenue of
$5,918
, and net income of
$787
. On an unaudited, pro forma basis, the revenues and net income of the Company, assuming the acquisition had occurred on January 1, 2017, for the periods indicated, are shown below. The unaudited pro forma information does not purport to present what the Company’s actual results would have been had the East Coast Storage Assets Acquisition occurred on January 1, 2017, nor is the financial information indicative of the results of future operations. The unaudited pro forma financial information includes the depreciation and amortization expense related to the East Coast Storage Assets Acquisition and interest expense associated with the related financing.
|
Year Ended
December 31, 2018
|
Year Ended
December 31, 2017
|
||||||
|
(Unaudited)
|
|||||||
|
PBF Energy
|
|||||||
|
Pro forma revenues
|
$
|
27,203,516
|
|
$
|
21,800,716
|
|
|
|
Pro forma net income attributable to PBF Energy Inc. stockholders
|
124,615
|
|
400,762
|
|
|||
|
Pro forma net income available to Class A common stock per share:
|
|||||||
|
Basic
|
$
|
1.08
|
|
$
|
3.64
|
|
|
|
Diluted
|
$
|
1.07
|
|
$
|
3.60
|
|
|
|
PBF LLC
|
|||||||
|
Pro forma revenues
|
$
|
27,203,516
|
|
$
|
21,800,716
|
|
|
|
Pro forma net income attributable to PBF LLC
|
130,235
|
|
451,626
|
|
|||
Torrance Acquisition
On July 1, 2016, the Company acquired from ExxonMobil Oil Corporation and its subsidiary, Mobil Pacific Pipe Line Company, the Torrance refinery and related logistics assets (collectively, the “Torrance Acquisition”). While the Company’s consolidated financial statements for both the years ended December 31, 2018 and 2017 include the results of operations of Torrance Refining, the final working capital settlement for the Torrance Acquisition was finalized in the second quarter of 2017. Additionally, certain acquisition related costs for the Torrance Acquisition were recorded in the first and second quarter of 2017.
The aggregate purchase price for the Torrance Acquisition was
$521,350
in cash after post-closing purchase price adjustments, plus final working capital of
$450,582
. In addition, the Company assumed certain pre-existing environmental and regulatory emission credit obligations in connection with the Torrance Acquisition. The transaction was financed through a combination of cash on hand, including proceeds from certain equity offerings, and borrowings under the Revolving Credit Facility.
The total purchase consideration and the fair values of the assets and liabilities at the acquisition date were as follows:
|
Purchase Price
|
|||
|
Gross purchase price
|
$
|
537,500
|
|
|
Working capital
|
450,582
|
|
|
|
Post close purchase price adjustments
|
(16,150
|
)
|
|
|
Total consideration
|
$
|
971,932
|
|
F- 33
PBF ENERGY INC. AND PBF ENERGY COMPANY LLC
NOTES TO CONSOLIDATED FINANCIAL STATEMENTS
(IN THOUSANDS, EXCEPT SHARE, UNIT, PER SHARE, PER UNIT AND BARREL DATA)
The following table summarizes the amounts recognized for assets acquired and liabilities assumed as of the acquisition date:
|
Fair Value Allocation
|
|||
|
Inventories
|
$
|
404,542
|
|
|
Prepaid and other current assets
|
982
|
|
|
|
Property, plant and equipment
|
704,633
|
|
|
|
Deferred charges and other assets, net
|
68,053
|
|
|
|
Accounts payable
|
(2,688
|
)
|
|
|
Accrued expenses
|
(64,137
|
)
|
|
|
Other long-term liabilities
|
(139,453
|
)
|
|
|
Fair value of net assets acquired
|
$
|
971,932
|
|
The Company’s consolidated financial statements for the years ended
December 31, 2018
and
2017
include the results of operations of the Torrance refinery for the full year. The Company’s consolidated financial statements for the year ended December 31, 2016 include the results of operations of the Torrance refinery since July 1, 2016 during which period the Torrance refinery contributed revenues of
$1,977,204
and net income of
$86,394
. On an unaudited pro forma basis, the revenues and net income of the Company assuming the Torrance Acquisition had occurred on January 1, 2015, are shown below. The unaudited pro forma information does not purport to present what the Company’s actual results would have been had the acquisition occurred on January 1, 2015, nor is the financial information indicative of the results of future operations. The unaudited pro forma financial information includes the depreciation and amortization expense related to the Torrance Acquisition and interest expense associated with the related financing.
|
Year ended December 31,
|
|||
|
(Unaudited)
|
2016
|
||
|
PBF Energy
|
|||
|
Pro forma revenues
|
$
|
16,999,435
|
|
|
Pro forma net income (loss) attributable to PBF Energy Inc. stockholders
|
50,779
|
|
|
|
Pro forma net income (loss) available to PBF Energy Class A common stock per share:
|
|||
|
Basic
|
$
|
0.52
|
|
|
Diluted
|
$
|
0.51
|
|
|
PBF LLC
|
|||
|
Pro forma revenues
|
$
|
16,999,435
|
|
|
Pro forma net income attributable to PBF LLC
|
160,856
|
|
|
PBFX Plains Asset Purchase
On April 29, 2016, PBFX’s wholly-owned subsidiary, PBF Logistics Products Terminals LLC, purchased
four
refined products terminals in the greater Philadelphia region (the “East Coast Terminals”) from an affiliate of Plains All American Pipeline, L.P., including product storage tanks, pipeline connections to the Colonial Pipeline Company, Buckeye Partners, Sunoco Logistics Partners and other proprietary pipeline systems, truck loading lanes and marine facilities capable of handling barges and ships (the “PBFX Plains Asset Purchase”). This acquisition expands PBFX’s storage and terminaling footprint and introduces third-party customers to its revenue base. The final purchase price and fair value allocation of the East Coast Terminals were completed as of December 31, 2016. The aggregate purchase price for the PBFX Plains Asset Purchase was
$100,000
, less working capital adjustments.
F- 34
PBF ENERGY INC. AND PBF ENERGY COMPANY LLC
NOTES TO CONSOLIDATED FINANCIAL STATEMENTS
(IN THOUSANDS, EXCEPT SHARE, UNIT, PER SHARE, PER UNIT AND BARREL DATA)
The total purchase consideration and the fair values of the assets and liabilities at the acquisition date were as follows:
|
Purchase Price
|
|||
|
Gross purchase price
|
$
|
100,000
|
|
|
Working capital adjustments
|
(1,627
|
)
|
|
|
Total consideration
|
$
|
98,373
|
|
The following table summarizes the amounts recognized for assets acquired and liabilities assumed as of the acquisition date:
|
Fair Value Allocation
|
|||
|
Prepaid and other current assets
|
$
|
4,221
|
|
|
Property, plant and equipment
|
99,342
|
|
|
|
Accounts payable and Accrued expenses
|
(3,174
|
)
|
|
|
Other long-term liabilities
|
(2,016
|
)
|
|
|
Fair value of net assets acquired
|
$
|
98,373
|
|
The results of operations of the East Coast Terminals are included in the Company’s consolidated financial statements for the full years ended
December 31, 2018
and
2017
. The Company’s consolidated financial statements for the year ended December 31, 2016 include the results of operations of the East Coast Terminals since the PBFX Plains Asset Purchase on April 29, 2016 during which period the East Coast Terminals contributed third-party revenues of
$11,871
and net income of
$1,830
. On an unaudited pro forma basis, the revenues and net income of the Company assuming the acquisition had occurred on January 1, 2015, are shown below. The unaudited pro forma information does not purport to present what the Company’s actual results would have been had the PBFX Plains Asset Purchase occurred on January 1, 2015, nor is the financial information indicative of the results of future operations. The unaudited pro forma financial information includes the depreciation and amortization expense attributable to the PBFX Plains Asset Purchase and interest expense associated with related financing.
|
Year ended December 31,
|
|||
|
(Unaudited)
|
2016
|
||
|
PBF Energy
|
|||
|
Pro forma revenues
|
$
|
15,927,218
|
|
|
Pro forma net income attributable to PBF Energy Inc. stockholders
|
174,393
|
|
|
|
Pro forma net income available to PBF Energy Class A common stock per share:
|
|||
|
Basic
|
$
|
1.77
|
|
|
Diluted
|
$
|
1.77
|
|
|
PBF LLC
|
|||
|
Pro forma revenues
|
$
|
15,927,218
|
|
|
Pro forma net income attributable to PBF LLC
|
284,470
|
|
|
Acquisition Expenses
The Company incurred acquisition related costs consisting primarily of consulting and legal expenses related to completed, pending and non-consummated acquisitions of
$2,896
,
$1,021
and
$17,510
in the years ended
December 31, 2018
,
2017
and
2016
, respectively. These costs are included in the consolidated statement of operations in general and administrative expenses.
F- 35
PBF ENERGY INC. AND PBF ENERGY COMPANY LLC
NOTES TO CONSOLIDATED FINANCIAL STATEMENTS
(IN THOUSANDS, EXCEPT SHARE, UNIT, PER SHARE, PER UNIT AND BARREL DATA)
5. INVENTORIES
Inventories consisted of the following:
|
December 31, 2018
|
|||||||||||
|
Titled Inventory
|
Inventory Intermediation Arrangements
|
Total
|
|||||||||
|
Crude oil and feedstocks
|
$
|
1,044,824
|
|
$
|
—
|
|
$
|
1,044,824
|
|
||
|
Refined products and blendstocks
|
1,026,921
|
|
334,708
|
|
1,361,629
|
|
|||||
|
Warehouse stock and other
|
111,112
|
|
—
|
|
111,112
|
|
|||||
|
$
|
2,182,857
|
|
$
|
334,708
|
|
$
|
2,517,565
|
|
|||
|
Lower of cost or market adjustment
|
(557,187
|
)
|
(94,547
|
)
|
(651,734
|
)
|
|||||
|
Total inventories
|
$
|
1,625,670
|
|
$
|
240,161
|
|
$
|
1,865,831
|
|
||
|
December 31, 2017
|
|||||||||||
|
Titled Inventory
|
Inventory Intermediation Arrangements
|
Total
|
|||||||||
|
Crude oil and feedstocks
|
$
|
1,073,093
|
|
$
|
—
|
|
$
|
1,073,093
|
|
||
|
Refined products and blendstocks
|
1,030,817
|
|
311,477
|
|
1,342,294
|
|
|||||
|
Warehouse stock and other
|
98,866
|
|
—
|
|
98,866
|
|
|||||
|
$
|
2,202,776
|
|
$
|
311,477
|
|
$
|
2,514,253
|
|
|||
|
Lower of cost or market adjustment
|
(232,652
|
)
|
(67,804
|
)
|
(300,456
|
)
|
|||||
|
Total inventories
|
$
|
1,970,124
|
|
$
|
243,673
|
|
$
|
2,213,797
|
|
||
Inventory under inventory intermediation arrangements included certain light finished products sold to counterparties and stored in the Paulsboro and Delaware City refineries’ storage facilities in connection with the Inventory Intermediation Agreements with J. Aron.
During the year ended
December 31, 2018
, the Company recorded an adjustment to value its inventories to the lower of cost or market which decreased income from operations by
$351,278
, reflecting the net change in the lower of cost or market (“LCM”) inventory reserve from
$300,456
at
December 31, 2017
to
$651,734
at
December 31, 2018
. During the year ended
December 31, 2017
, the Company recorded an adjustment to value its inventories to the lower of cost or market which increased income from operations by
$295,532
, reflecting the net change in the LCM inventory reserve from
$595,988
at
December 31, 2016
to
$300,456
at
December 31, 2017
.
An actual valuation of inventories valued under the LIFO method is made at the end of each year based on inventory levels and costs at that time. We recorded a pre-tax charge related to a LIFO layer decrement of
$21,881
and
$4,940
in the Refining segment during the years ended
December 31, 2018
and
2017
, respectively.
F- 36
PBF ENERGY INC. AND PBF ENERGY COMPANY LLC
NOTES TO CONSOLIDATED FINANCIAL STATEMENTS
(IN THOUSANDS, EXCEPT SHARE, UNIT, PER SHARE, PER UNIT AND BARREL DATA)
6. PROPERTY, PLANT AND EQUIPMENT, NET
Property, plant and equipment, net consisted of the following:
|
December 31,
2018 |
December 31,
2017 |
|||||||
|
Land
|
$
|
351,536
|
|
$
|
352,812
|
|
||
|
Process units, pipelines and equipment
|
3,741,133
|
|
3,414,372
|
|
||||
|
Buildings and leasehold improvements
|
58,211
|
|
51,915
|
|
||||
|
Computers, furniture and fixtures
|
126,929
|
|
110,968
|
|
||||
|
Construction in progress
|
328,111
|
|
172,270
|
|
||||
|
4,605,920
|
|
4,102,337
|
|
|||||
|
Less—Accumulated depreciation
|
(785,028
|
)
|
(623,124
|
)
|
||||
|
Total property, plant and equipment, net
|
$
|
3,820,892
|
|
$
|
3,479,213
|
|
||
Depreciation expense for the years ended
December 31, 2018
,
2017
and
2016
was
$162,174
,
$146,978
and
$116,629
, respectively. The Company capitalized
$9,469
and
$7,156
in interest during
2018
and
2017
, respectively, in connection with construction in progress.
Torrance Land Sale
On August 2018, the Company closed on a third-party sale of a parcel of real property acquired as part of the Torrance Refinery, but not part of the refinery itself. The sale resulted in a gain of
$43,761
included within (Gain) loss on sale of assets within the Consolidated Statements of Operations.
F- 37
PBF ENERGY INC. AND PBF ENERGY COMPANY LLC
NOTES TO CONSOLIDATED FINANCIAL STATEMENTS
(IN THOUSANDS, EXCEPT SHARE, UNIT, PER SHARE, PER UNIT AND BARREL DATA)
7. DEFERRED CHARGES AND OTHER ASSETS, NET
Deferred charges and other assets, net consisted of the following:
|
PBF Energy
|
December 31,
2018 |
December 31,
2017 |
|||||
|
Deferred turnaround costs, net
|
$
|
673,107
|
|
$
|
560,403
|
|
|
|
Catalyst, net
|
124,290
|
|
131,019
|
|
|||
|
Environmental credits
|
37,811
|
|
42,452
|
|
|||
|
Intangible assets, net
|
25,648
|
|
537
|
|
|||
|
Linefill
|
19,485
|
|
19,485
|
|
|||
|
Pension plan assets
|
9,694
|
|
9,593
|
|
|||
|
Other
|
9,056
|
|
18,694
|
|
|||
|
Total deferred charges and other assets, net
|
$
|
899,091
|
|
$
|
782,183
|
|
|
|
PBF LLC
|
December 31,
2018 |
December 31,
2017 |
|||||
|
Deferred turnaround costs, net
|
$
|
673,107
|
|
$
|
560,403
|
|
|
|
Catalyst, net
|
124,290
|
|
131,019
|
|
|||
|
Environmental credits
|
37,811
|
|
42,452
|
|
|||
|
Intangible assets, net
|
25,648
|
|
537
|
|
|||
|
Linefill
|
19,485
|
|
19,485
|
|
|||
|
Pension plan assets
|
9,694
|
|
9,593
|
|
|||
|
Other
|
6,981
|
|
16,099
|
|
|||
|
Total deferred charges and other assets, net
|
$
|
897,016
|
|
$
|
779,588
|
|
|
Catalyst, net includes
$73,079
and
$73,967
of indefinitely-lived precious metal catalysts as of
December 31, 2018
and
December 31, 2017
, respectively.
The Company recorded amortization expense related to deferred turnaround costs, catalyst and intangible assets of
$207,586
,
$143,978
and
$105,547
for the years ended
December 31, 2018
,
2017
and
2016
respectively.
Intangible assets, net primarily consists of customer relationships, permits and emission credits. Our net balance as of December 31, 2018 and December 31, 2017 is shown below.
|
December 31,
2018 |
December 31,
2017 |
|||||||
|
Intangible assets - gross
|
$
|
29,528
|
|
$
|
3,996
|
|
||
|
Accumulated amortization
|
(3,880
|
)
|
(3,459
|
)
|
||||
|
Intangible assets - net
|
$
|
25,648
|
|
$
|
537
|
|
||
F- 38
PBF ENERGY INC. AND PBF ENERGY COMPANY LLC
NOTES TO CONSOLIDATED FINANCIAL STATEMENTS
(IN THOUSANDS, EXCEPT SHARE, UNIT, PER SHARE, PER UNIT AND BARREL DATA)
8. ACCRUED EXPENSES
Accrued expenses consisted of the following:
|
PBF Energy
|
December 31,
2018 |
December 31,
2017 |
|||||
|
Inventory-related accruals
|
$
|
846,270
|
|
$
|
1,151,810
|
|
|
|
Inventory intermediation arrangements
|
249,442
|
|
244,287
|
|
|||
|
Excise and sales tax payable
|
149,358
|
|
118,515
|
|
|||
|
Accrued salaries and benefits
|
89,808
|
|
58,589
|
|
|||
|
Accrued capital expenditures
|
60,622
|
|
18,765
|
|
|||
|
Accrued transportation costs
|
53,579
|
|
64,400
|
|
|||
|
Accrued utilities
|
49,851
|
|
42,189
|
|
|||
|
Deferred payment - East Coast Storage Assets Acquisition
|
30,900
|
|
—
|
|
|||
|
Renewable energy credit and emissions obligations
|
27,052
|
|
26,231
|
|
|||
|
Accrued refinery maintenance and support costs
|
19,046
|
|
35,674
|
|
|||
|
Accrued interest
|
12,092
|
|
14,080
|
|
|||
|
Environmental liabilities
|
7,020
|
|
8,289
|
|
|||
|
Customer deposits
|
5,594
|
|
16,133
|
|
|||
|
Other
|
22,985
|
|
15,892
|
|
|||
|
Total accrued expenses
|
$
|
1,623,619
|
|
$
|
1,814,854
|
|
|
|
PBF LLC
|
December 31,
2018 |
December 31,
2017 |
|||||
|
Inventory-related accruals
|
$
|
846,270
|
|
$
|
1,151,810
|
|
|
|
Inventory intermediation arrangements
|
249,442
|
|
244,287
|
|
|||
|
Excise and sales tax payable
|
149,358
|
|
118,515
|
|
|||
|
Accrued salaries and benefits
|
89,808
|
|
58,589
|
|
|||
|
Accrued capital expenditures
|
60,622
|
|
18,765
|
|
|||
|
Accrued transportation costs
|
53,579
|
|
64,400
|
|
|||
|
Accrued utilities
|
49,851
|
|
42,189
|
|
|||
|
Deferred payment - East Coast Storage Assets Acquisition
|
30,900
|
|
—
|
|
|||
|
Accrued interest
|
29,907
|
|
23,419
|
|
|||
|
Renewable energy credit and emissions obligations
|
27,052
|
|
26,231
|
|
|||
|
Accrued refinery maintenance and support costs
|
19,046
|
|
35,674
|
|
|||
|
Environmental liabilities
|
7,020
|
|
8,289
|
|
|||
|
Customer deposits
|
5,594
|
|
16,133
|
|
|||
|
Other
|
24,341
|
|
16,093
|
|
|||
|
Total accrued expenses
|
$
|
1,642,790
|
|
$
|
1,824,394
|
|
|
F- 39
PBF ENERGY INC. AND PBF ENERGY COMPANY LLC
NOTES TO CONSOLIDATED FINANCIAL STATEMENTS
(IN THOUSANDS, EXCEPT SHARE, UNIT, PER SHARE, PER UNIT AND BARREL DATA)
The Company has the obligation to repurchase certain intermediates and finished products that are held in the Company’s refinery storage tanks at the Delaware City and Paulsboro refineries in accordance with the Inventory Intermediation Agreements with J. Aron. As of
December 31, 2018
and December 31, 2017, a liability is recognized for the Inventory Intermediation Agreements and is recorded at market price for the J. Aron owned inventory held in the Company’s storage tanks under the Inventory Intermediation Agreements, with any change in the market price being recorded in Cost of products and other.
The Company is subject to obligations to purchase Renewable Identification Numbers (“RINs”) required to comply with the Renewable Fuels Standard. The Company’s overall RINs obligation is based on a percentage of domestic shipments of on-road fuels as established by Environmental Protection Agency (“EPA”). To the degree the Company is unable to blend the required amount of biofuels to satisfy its RINs obligation, RINs must be purchased on the open market to avoid penalties and fines. The Company records its RINs obligation on a net basis in Accrued expenses when its RINs liability is greater than the amount of RINs earned and purchased in a given period and in Prepaid and other current assets when the amount of RINs earned and purchased is greater than the RINs liability. In addition, the Company is subject to obligations to comply with federal and state legislative and regulatory measures, including regulations in the state of California pursuant to Assembly Bill 32 (“AB32”), to address environmental compliance and greenhouse gas and other emissions. These requirements include incremental costs to operate and maintain our facilities as well as to implement and manage new emission controls and programs. Renewable energy credit and emissions obligations fluctuate with the volume of applicable product sales and timing of credit purchases.
Early Return of Railcars
On September 30, 2018, the Company agreed to voluntarily return a portion of railcars under an operating lease in order to rationalize certain components of its railcar fleet based on prevailing market conditions in the crude oil by rail market. Under the terms of the lease amendment, the Company will pay agreed amounts in lieu of satisfaction of return conditions (the “early termination penalty”) and will pay a reduced rental fee over the remaining term of the lease. Certain of these railcars are idle and the remaining railcars were taken out of service during the fourth quarter of 2018 and subsequently fully returned to the lessor. As a result, the Company recognized an expense of
$52,313
for year ended December 31, 2018 included within Cost of sales consisting of (i) a
$40,313
charge for the early termination penalty and (ii) a
$12,000
charge related to the remaining lease payments associated with the portion of railcars within the amended lease, that were idled and out of service as of December 31, 2018. As of December 31, 2018,
$7,106
of these payments are anticipated to be paid within the next twelve months and are included within the inventory-related accruals category above.
F- 40
PBF ENERGY INC. AND PBF ENERGY COMPANY LLC
NOTES TO CONSOLIDATED FINANCIAL STATEMENTS
(IN THOUSANDS, EXCEPT SHARE, UNIT, PER SHARE, PER UNIT AND BARREL DATA)
9. CREDIT FACILITY AND DEBT
Long-term debt outstanding consisted of the following:
|
December 31,
2018 |
December 31,
2017 |
|||||||
|
Revolving Credit Facility
|
$
|
—
|
|
$
|
350,000
|
|
||
|
PBFX Revolving Credit Facility
|
156,000
|
|
29,700
|
|
||||
|
PBFX 2023 Senior Notes
|
527,819
|
|
528,374
|
|
||||
|
2025 Senior Notes
|
725,000
|
|
725,000
|
|
||||
|
2023 Senior Notes
|
500,000
|
|
500,000
|
|
||||
|
PBF Rail Term Loan
|
21,554
|
|
28,366
|
|
||||
|
Catalyst leases
|
44,353
|
|
59,048
|
|
||||
|
1,974,726
|
|
2,220,488
|
|
|||||
|
Less—Current debt
|
(2,378
|
)
|
(10,987
|
)
|
||||
|
Unamortized deferred financing costs
|
(41,032
|
)
|
(34,459
|
)
|
||||
|
Long-term debt
|
$
|
1,931,316
|
|
$
|
2,175,042
|
|
||
PBF Holding Revolving Credit Facility
Prior to entering into a new revolving credit facility in May of 2018 as discussed further below, PBF Holding’s previous asset-based credit agreement dated as of August 15, 2014 (the “August 2014 Revolving Credit Agreement”), among other things, had a maximum commitment of
$2,635,000
, a maturity date of August 2019 and an accordion feature that allowed for increases in the aggregate commitment of up to
$2,750,000
. The sublimit for letters of credit was
$1,500,000
. The LC Participation Fee ranged from
1.25%
to
2.0%
depending on the Company’s senior secured debt rating and the Fronting Fee was equal to
0.25%
. At the option of PBF Holding, borrowings bore interest at the Alternate Base Rate plus the Applicable Margin or the Adjusted LIBOR Rate plus the Applicable Margin, all as defined in the August 2014 Revolving Credit Agreement. The Applicable Margin ranged from
0.50%
to
1.25%
for Alternative Base Rate Loans and from
1.50%
to
2.25%
for Adjusted LIBOR Rate Loans, in each case depending on the Company’s senior secured debt rating.
On May 2, 2018, PBF Holding and certain of its wholly-owned subsidiaries, as borrowers or subsidiary guarantors, replaced the August 2014 Revolving Credit Agreement with a new asset-based revolving credit agreement (the “Revolving Credit Facility"). The Revolving Credit Facility has a maximum commitment of
$3,400,000
, a maturity date of May 2023 and redefines certain components of the Borrowing Base, as defined in the agreement governing the Revolving Credit Facility (the “Revolving Credit Agreement”), to make more funding available for working capital needs and other general corporate purposes. Borrowings under the Revolving Credit Facility bear interest at the Alternative Base Rate plus the Applicable Margin or at the Adjusted LIBOR Rate plus the Applicable Margin (all as defined in the Revolving Credit Agreement). The Applicable Margin ranges from
0.25%
to
1.00%
for Alternative Base Rate Loans and from
1.25%
to
2.00%
for Adjusted LIBOR Rate Loans, in each case depending on the Company’s corporate credit rating. In addition, an accordion feature allows for commitments of up to
$3,500,000
. The LC Participation Fee ranges from
1.00%
to
1.75%
depending on the Company’s corporate credit rating and the Fronting Fee is capped at
0.25%
.
The Revolving Credit Agreement contains customary covenants and restrictions on the activities of PBF Holding and its subsidiaries, including, but not limited to, limitations on incurring additional indebtedness, liens, negative pledges, guarantees, investments, loans, asset sales, mergers and acquisitions, prepayment of other debt, distributions, dividends and the repurchase of capital stock, transactions with affiliates and the ability of PBF Holding to change the nature of its business or its fiscal year; all as defined in the Revolving Credit Agreement.
F- 41
PBF ENERGY INC. AND PBF ENERGY COMPANY LLC
NOTES TO CONSOLIDATED FINANCIAL STATEMENTS
(IN THOUSANDS, EXCEPT SHARE, UNIT, PER SHARE, PER UNIT AND BARREL DATA)
In addition, the Revolving Credit Agreement has a financial covenant which requires that if at any time Excess Availability, as defined in the Revolving Credit Agreement, is less than the greater of (i)
10%
of the lesser of the then existing Borrowing Base and the then aggregate Revolving Commitments of the Lenders (the “Financial Covenant Testing Amount”), and (ii)
$100,000
, and until such time as Excess Availability is greater than the Financial Covenant Testing Amount and
$100,000
for a period of 12 or more consecutive days, PBF Holding will not permit the Consolidated Fixed Charge Coverage Ratio, as defined in the Revolving Credit Agreement and determined as of the last day of the most recently completed quarter, to be less than
1.0
to
1.0
.
PBF Holding’s obligations under the Revolving Credit Facility are (a) guaranteed by each of its domestic operating subsidiaries that are not Excluded Subsidiaries (as defined in the Revolving Credit Agreement) and (b) secured by a lien on (i) PBF LLC’s equity interest in PBF Holding and (ii) certain assets of PBF Holding and the subsidiary guarantors, including all deposit accounts (other than zero balance accounts, cash collateral accounts, trust accounts and/or payroll accounts, all of which are excluded from the definition of collateral), all accounts receivable, all hydrocarbon inventory (other than the intermediate and finished products owned by J. Aron pursuant to the Inventory Intermediation Agreements) and to the extent evidencing, governing, securing or otherwise related to the foregoing, all general intangibles, chattel paper, instruments, documents, letter of credit rights and supporting obligations; and all products and proceeds of the foregoing.
There was
no
outstanding balance under the Revolving Credit Facility as of
December 31, 2018
. At
December 31, 2017
, there was
$350,000
outstanding under the August 2014 Revolving Credit Agreement. Issued letters of credit were
$400,695
and
$586,274
as of
December 31, 2018
and
2017
, respectively.
PBFX Credit Facilities
On May 14, 2014, in connection with the closing of the PBFX Offering, PBFX entered into a
five
-year,
$275,000
senior secured revolving credit facility (the “2014 PBFX Revolving Credit Facility”) and a
three
-year,
$300,000
term loan facility (the “PBFX Term Loan”), each with the administrative agent and a syndicate of lenders. The PBFX Term Loan was fully repaid as of December 31, 2017. The 2014 PBFX Revolving Credit Facility was increased from
$275,000
to
$325,000
in December 2014 and from
$325,000
to
$360,000
in May 2016.
On July 30, 2018, PBFX replaced the 2014 PBFX Revolving Credit Facility with a
$500,000
amended and restated revolving credit facility (as amended, the “PBFX Revolving Credit Facility”).
The PBFX Revolving Credit Facility is available to fund working capital, acquisitions, distributions, capital expenditures, and other general partnership purposes and is guaranteed by a guaranty of collection from PBF LLC. PBFX has the ability to increase the maximum amount of the PBFX Revolving Credit Facility by up to
$250,000
to a total facility size of
$750,000
, subject to receiving increased commitments from the lenders or other financial institutions and satisfaction of certain conditions. The PBFX Revolving Credit Facility includes a
$75,000
sublimit for standby letters of credit and a
$25,000
sublimit for swingline loans. Obligations under the PBFX Revolving Credit Facility are guaranteed by PBFX’s restricted subsidiaries, and are secured by a first priority lien on PBFX’s assets and those of PBFX’s restricted subsidiaries. The maturity date of the PBFX Revolving Credit Facility is July 30, 2023, but may be extended for
one
year on up to
two
occasions, subject to certain customary terms and conditions. Borrowings under the PBFX Revolving Credit Facility bear interest at the Alternative Base Rate plus the Applicable Margin or the Adjusted LIBOR Rate plus an Applicable Margin, all as defined in the agreement governing the PBFX Revolving Credit Facility (the “PBFX Revolving Credit Agreement”). The Applicable Margin ranges from
0.75%
to
1.75%
for Alternative Base Rate Loans and from
1.75%
to
2.75%
for Adjusted LIBOR Rate Loans in each case depending on PBFX’s Consolidated Total Leverage Ratio, as defined in the PBFX Revolving Credit Agreement.
The PBFX Revolving Credit Agreement contains affirmative and negative covenants customary for revolving credit facilities of this nature which, among other things, limit or restrict PBFX’s ability and the ability of its restricted subsidiaries to incur or guarantee debt, incur liens, make investments, make restricted payments, amend material contracts, engage in certain business activities, engage in mergers, consolidations and other organizational
F- 42
PBF ENERGY INC. AND PBF ENERGY COMPANY LLC
NOTES TO CONSOLIDATED FINANCIAL STATEMENTS
(IN THOUSANDS, EXCEPT SHARE, UNIT, PER SHARE, PER UNIT AND BARREL DATA)
changes, sell, transfer or otherwise dispose of assets, enter into burdensome agreements, or enter into transactions with affiliates on terms which are not at arm’s length.
Additionally, commencing with the Measurement Period ending September 30, 2018, PBFX is required to maintain (a) Consolidated Interest Coverage Ratio of at least
2.50
to
1.00
; (b) Consolidated Total Leverage Ratio of not greater than
4.50
to
1.00
; and (c) Consolidated Senior Secured Leverage Ratio of not greater than
3.50
to
1.00
(all terms as defined in the PBFX Revolving Credit Agreement).
The PBFX Revolving Credit Agreement contains events of default customary for transactions of their nature, including, but not limited to (and subject to any applicable grace periods when applicable), the failure to pay any principal, interest or fees when due, failure to perform or observe any covenant contained in the PBFX Revolving Credit Agreement or related documentation, any representation or warranty made in the agreements or related documentation being untrue in any material respect when made, default under certain material debt agreements, commencement of bankruptcy or other insolvency proceedings, certain changes in PBFX’s ownership or the ownership or board composition of PBF GP and material judgments or orders. Upon the occurrence and during the continuation of an event of default under the PBFX Revolving Credit Agreement, the lenders may, among other things, terminate their commitments, declare any outstanding loans to be immediately due and payable and/or exercise remedies against PBFX and the collateral as may be available to the lenders under the PBFX Revolving Credit Agreement and related documentation or applicable law.
During 2018 PBFX used advances under the PBFX Revolving Credit Facility or the 2014 PBFX Revolving Credit Facility to fund the Knoxville Terminals Purchase, the East Coast Storage Asset Acquisition and other capital expenditures and working capital requirements.
The PBFX Revolving Credit Facility may be repaid, from time-to-time, without penalty. As of
December 31, 2018
, there were
$156,000
of borrowings and
$4,010
of letters of credit outstanding. At
December 31, 2017
, there were
$29,700
of borrowings and
$3,610
of letters of credit outstanding under the PBFX Revolving Credit Facility.
PBFX 2023 Senior Notes
On May 12, 2015, PBFX entered into an indenture among the Partnership, PBF Logistics Finance Corporation, a Delaware corporation and wholly-owned subsidiary of the Partnership (“PBF Finance”, and together with the Partnership, the “Issuers”), the Guarantors named therein and Deutsche Bank Trust Company Americas, as Trustee, under which the Issuers issued
$350,000
in aggregate principal amount of
6.875%
Senior Notes due 2023 (the “PBFX Senior Notes”). The initial purchasers in the offering purchased
$330,090
aggregate principal amount of PBFX Senior Notes pursuant to a private placement transaction conducted under Rule 144A and Regulation S of the Securities Act of 1933, as amended, and certain of PBF Energy’s officers and directors and their affiliates and family members purchased the remaining
$19,910
aggregate principal amount of PBFX Senior Notes in a separate private placement transaction. The Issuers received net proceeds of approximately
$343,000
from the offering after deducting the initial purchasers’ discount and offering expenses, and used such proceeds to pay
$88,000
of the cash consideration due in connection with the DCR Products Pipeline and Truck Rack Acquisition and to repay
$255,000
of outstanding indebtedness under the PBFX Revolving Credit Facility.
On October 6, 2017, PBFX issued
$175,000
in aggregate principal amount of
6.875%
Senior Notes due 2023 (the “New PBFX 2023 Senior Notes”). The New PBFX 2023 Senior Notes were issued at
102%
of face value, or an effective interest rate of
6.442%
. Furthermore, the New PBFX 2023 Senior Notes were issued under the indenture governing the
6.875%
Senior Notes issued on May 12, 2015 (the “initial PBFX 2023 Senior Notes” and, together with the New PBFX 2023 Senior Notes, the “PBFX 2023 Senior Notes”). The New PBFX 2023 Senior Notes are treated as a single series with the initial PBFX 2023 Senior Notes and have the same terms except that (i) the New PBFX 2023 Senior Notes were subject to a separate registration rights agreement, and (ii) the New PBFX 2023 Senior Notes were issued initially under CUSIP numbers different from the initial PBFX 2023 Senior Notes. PBFX used the net proceeds from the offering of the New PBFX 2023 Senior Notes to repay a portion of the PBFX Revolving Credit Facility and for general capital purposes.
F- 43
PBF ENERGY INC. AND PBF ENERGY COMPANY LLC
NOTES TO CONSOLIDATED FINANCIAL STATEMENTS
(IN THOUSANDS, EXCEPT SHARE, UNIT, PER SHARE, PER UNIT AND BARREL DATA)
PBF LLC agreed to a limited guarantee of collection of the principal amount of the PBFX 2023 Senior Notes, but is not otherwise subject to the covenants of the indenture. The PBFX 2023 Senior Notes are general senior unsecured obligations of the Issuers and are equal in right of payment with all of the Issuers’ existing and future senior indebtedness, including amounts outstanding under the PBFX Revolving Credit Facility. The PBFX 2023 Senior Notes are effectively subordinated to all of the Issuers’ and the Guarantors’ existing and future secured debt, including the PBFX Revolving Credit Facility, to the extent of the value of the assets securing that secured debt and will be structurally subordinated to all indebtedness of PBFX’s subsidiaries that do not guarantee the PBFX 2023 Senior Notes. The PBFX 2023 Senior Notes will be senior to any future subordinated indebtedness the Issuers may incur.
The PBFX indenture contains customary terms, events of default and covenants for transactions of this nature. These covenants include limitations on PBFX’s and its restricted subsidiaries’ ability to, among other things: (i) make investments; (ii) incur additional indebtedness or issue preferred units; (iii) pay dividends or make distributions on units or redeem or repurchase its subordinated debt; (iv) create liens; (v) incur dividend or other payment restrictions affecting subsidiaries; (vi) sell assets; (vii) merge or consolidate with other entities; and (viii) enter into transactions with affiliates. These covenants are subject to a number of important limitations and exceptions.
PBFX has optional redemption rights to repurchase all or a portion of the PBFX 2023 Senior Notes at varying prices which are no less than
100%
of the principal amount, plus accrued and unpaid interest. The holders of the PBFX 2023 Senior Notes have repurchase options exercisable only upon a change in control, certain asset dispositions, or in event of default as defined in the indenture.
The outstanding balances under the PBFX 2023 Senior Notes were
$525,000
as of
December 31, 2018
and
December 31, 2017
, respectively.
Senior Notes
On February 9, 2012, PBF Holding and PBF Holding’s wholly-owned subsidiary, PBF Finance Corporation, completed the offering of
$675,500
aggregate principal amount of
8.25%
Senior Secured Notes due 2020 (the “2020 Senior Secured Notes”). The net proceeds, after deducting the original issue discount, the initial purchasers’ discounts and commissions, and the fees and expenses of the offering, were used to repay certain outstanding indebtedness plus accrued interest, as well as to reduce the outstanding balance of the August 2014 Revolving Credit Agreement.
On November 24, 2015, PBF Holding and PBF Holding’s wholly-owned subsidiary, PBF Finance Corporation, completed an offering of
$500,000
in aggregate principal amount of
7.00%
Senior Secured Notes due 2023 (the “2023 Senior Notes”, and together with the 2020 Senior Secured Notes, the “Senior Secured Notes”). The net proceeds from this offering were approximately
$490,000
after deducting the initial purchasers’ discount and offering expenses. The Issuers used the proceeds for general corporate purposes, including funding a portion of the purchase price for the acquisition of the Torrance refinery and related logistics assets.
The Senior Secured Notes were secured on a first-priority basis by substantially all of the present and future assets of PBF Holding and its subsidiaries (other than assets securing the Revolving Credit Facility). Payment of the Senior Secured Notes is jointly and severally guaranteed by substantially all of PBF Holding’s subsidiaries. PBF Holding has optional redemption rights to repurchase all or a portion of the Senior Secured Notes at varying prices no less than
100%
of the principal amounts of the notes plus accrued and unpaid interest. The holders of the Senior Secured Notes have repurchase options exercisable only upon a change in control, certain asset sale transactions, or in event of a default as defined in the indenture agreement.
In addition, the Senior Secured Notes contain customary terms, events of default and covenants for an issuer of non-investment grade debt securities including limitations on PBF Holding’s and its restricted subsidiaries’ ability to, among other things, (1) incur additional indebtedness or issue certain preferred stock; (2) make equity distributions; (3) pay dividends on or repurchase capital stock or make other restricted payments; (4) enter into
F- 44
PBF ENERGY INC. AND PBF ENERGY COMPANY LLC
NOTES TO CONSOLIDATED FINANCIAL STATEMENTS
(IN THOUSANDS, EXCEPT SHARE, UNIT, PER SHARE, PER UNIT AND BARREL DATA)
transactions with affiliates; (5) create liens; (6) engage in mergers and consolidations or otherwise sell all or substantially all of its assets; (7) designate subsidiaries as unrestricted subsidiaries; (8) make certain investments; and (9) limit the ability of restricted subsidiaries to make payments to PBF Holding.
At all times after (a) a covenant suspension event (which requires that the Senior Secured Notes have investment grade ratings from both Moody’s Investment Services, Inc. and Standard & Poor’s), or (b) a Collateral Fall-Away Event, as defined in the indenture, the Senior Secured Notes will become unsecured.
On May 30, 2017, PBF Holding entered into an Indenture (the “Indenture”) among PBF Holding and PBF Holding’s wholly-owned subsidiary, PBF Finance Corporation (“PBF Finance” and, together with PBF Holding, the “Issuers”), the guarantors named therein (collectively the “Guarantors”) and Wilmington Trust, National Association, as Trustee, under which the Issuers issued
$725,000
in aggregate principal amount of
7.25%
senior notes due 2025 (the “2025 Senior Notes”). The Issuers received net proceeds of approximately
$711,576
from the offering after deducting the initial purchasers’ discount and offering expenses, all of which was used to fund the cash tender offer (the “Tender Offer”) for any and all of its outstanding 2020 Senior Secured Notes, to pay the related redemption price and accrued and unpaid interest for any 2020 Senior Secured Notes which remained outstanding after the completion of the Tender Offer, and for general corporate purposes. The difference between the carrying value of the 2020 Senior Secured Notes on the date they were reacquired and the amount for which they were reacquired has been classified as debt extinguishment costs in the consolidated statements of operations.
The 2025 Senior Notes are guaranteed by substantially all of PBF Holding’s subsidiaries. The 2025 Senior Notes and guarantees are senior unsecured obligations which rank equal in right of payment with all of the Issuers’ and the Guarantors’ existing and future senior indebtedness, including PBF Holding’s Revolving Credit Facility and 2023 Senior Notes. The 2025 Senior Notes and the guarantees rank senior in right of payment to the Issuers’ and the Guarantors’ existing and future indebtedness that is expressly subordinated in right of payment thereto. The 2025 Senior Notes and the guarantees are effectively subordinated to any of the Issuers’ and the Guarantors’ existing or future secured indebtedness (including the Revolving Credit Facility) to the extent of the value of the collateral securing such indebtedness. The 2025 Senior Notes and the guarantees are structurally subordinated to any existing or future indebtedness and other obligations of the Issuers’ non-guarantor subsidiaries.
PBF Holding has optional redemption rights to repurchase all or a portion of the 2025 Senior Notes at varying prices which are no less than
100%
of the principal amount plus accrued and unpaid interest. The holders of the 2025 Senior Notes have repurchase options exercisable only upon a change in control, certain asset sale transactions, or in event of a default as defined in the Indenture. In addition, the 2025 Senior Notes contain customary terms, events of default and covenants for an issuer of non-investment grade debt securities that limit certain types of additional debt, equity issuances, and payments. Many of these covenants will cease to apply or will be modified if the 2025 Senior Notes are rated investment grade.
Upon the satisfaction and discharge of the 2020 Senior Secured Notes in connection with the closing of the Tender Offer and the redemption described above, a Collateral Fall-Away Event under the indenture governing the 2023 Senior Notes occurred on May 30, 2017, and the 2023 Senior Notes became unsecured and certain covenants were modified, as provided for in the indenture governing the 2023 Senior Notes and related documents.
The 2025 Senior Notes and the 2023 Senior Notes are collectively referred to as the “Senior Notes”.
PBF Rail Term Loan
On December 22, 2016, PBF Rail Logistics Company LLC (“PBF Rail”) entered into a
$35,000
term loan (the “PBF Rail Term Loan”) with a bank previously party to the Rail Facility. The PBF Rail Term Loan amortizes monthly over its
five
year term and bears interest at a rate equal to one month LIBOR plus the margin as defined in the agreement governing the PBF Rail Term Loan (the “Rail Credit Agreement”). As security for the PBF Rail Term Loan, PBF Rail pledged, among other things: (i) certain Eligible Railcars; (ii) the Debt Service Reserve Account (as defined in the Rail Credit Agreement); and (iii) PBF Holding’s membership interest in PBF Rail. Additionally, the Rail Credit Agreement contains customary terms, events of default and covenants for transactions
F- 45
PBF ENERGY INC. AND PBF ENERGY COMPANY LLC
NOTES TO CONSOLIDATED FINANCIAL STATEMENTS
(IN THOUSANDS, EXCEPT SHARE, UNIT, PER SHARE, PER UNIT AND BARREL DATA)
of this nature. PBF Rail may at any time repay the PBF Rail Term Loan without penalty in the event that railcars securing the loan are sold, scrapped or otherwise removed from the collateral pool.
The outstanding balances under the PBF Rail Term Loan were
$21,554
and
$28,366
as of
December 31, 2018
and
2017
, respectively.
Precious Metal Catalyst Leases
Certain subsidiaries of the Company have entered into agreements whereby such subsidiary sold a portion of its precious metal catalysts to a major commercial bank and then leased back the precious metal catalysts. The volume of the precious metal catalysts and the lease rate are fixed over the term of each lease. At maturity, the Company must repurchase the precious metal catalysts in question at its then fair market value. The Company believes that there is a substantial market for precious metal catalysts and that it will be able to release such catalysts at maturity. The Company treated these transactions as financing arrangements, and the lease payments are recorded as interest expense over the agreements’ terms. The Company has elected the fair value option for accounting for its catalyst lease repurchase obligations as the Company’s liability is directly impacted by the change in value of the underlying catalysts. The fair value of these repurchase obligations as reflected in the fair value of long-term debt outstanding table below is measured using Level 2 inputs.
Details on the catalyst leases at each of the Company’s refineries as of
December 31, 2018
are included in the following table:
|
Annual lease fee
|
Annual interest rate
|
Expiration date
|
|||||||
|
Paulsboro catalyst lease
|
$
|
140
|
|
2.20
|
%
|
December 2019
(2)
|
|||
|
Delaware City catalyst lease
|
$
|
210
|
|
1.95
|
%
|
October 2019
(2)
|
|||
|
Delaware City catalyst lease - Palladium
|
$
|
30
|
|
2.05
|
%
|
October 2019
(2)
|
|||
|
Delaware City bridge lease
|
$
|
29
|
|
2.10
|
%
|
February 2019
(1)
|
|||
|
Toledo catalyst lease
|
$
|
178
|
|
1.75
|
%
|
June 2020
|
|||
|
Toledo bridge lease
|
$
|
22
|
|
2.10
|
%
|
April 2019
(1)
|
|||
|
Chalmette catalyst lease
|
$
|
97
|
|
2.10
|
%
|
October 2021
|
|||
|
Chalmette catalyst lease
|
$
|
171
|
|
2.20
|
%
|
November 2019
(2)
|
|||
|
Chalmette bridge lease
|
$
|
4
|
|
2.15
|
%
|
April 2019
(1)
|
|||
|
Torrance catalyst lease
|
$
|
143
|
|
1.78
|
%
|
July 2019
(2)
|
|||
__________________
(1) During 2018 Delaware City Refining, Toledo Refining and Chalmette Refining entered into
three
new platinum bridge leases which will expire in 2019. These leases are payable at maturity and are not anticipated to be renewed. The total outstanding balance related to these bridge leases as of
December 31, 2018
was
$2,378
and is included in Current debt in the Company’s consolidated balance sheet.
(2) These catalyst leases are included in Long-term debt as of
December 31, 2018
as the Company has the ability and intent to finance this debt through availability under other credit facilities if the catalyst leases are not renewed at maturity.
Note Payable
In connection with the purchase of a waste water treatment facility servicing the Toledo refinery completed on September 28, 2017, the Company issued a short-term promissory note payable in the amount of
$6,831
due June 30, 2018. Payments of
$403
on the note were made monthly with a balloon payment of
$3,200
paid at maturity. The note payable was fully repaid as of
December 31, 2018
.
F- 46
PBF ENERGY INC. AND PBF ENERGY COMPANY LLC
NOTES TO CONSOLIDATED FINANCIAL STATEMENTS
(IN THOUSANDS, EXCEPT SHARE, UNIT, PER SHARE, PER UNIT AND BARREL DATA)
Debt Maturities
Debt maturing in the next five years and thereafter is as follows:
|
Year Ending December 31,
|
|
||
|
2019
|
$
|
31,368
|
|
|
2020
|
8,633
|
|
|
|
2021
|
25,906
|
|
|
|
2022
|
—
|
|
|
|
2023
|
1,183,819
|
|
|
|
Thereafter
|
725,000
|
|
|
|
$
|
1,974,726
|
|
|
10. AFFILIATE NOTE PAYABLE - PBF LLC
As of
December 31, 2018
and
December 31, 2017
, PBF LLC had an outstanding note payable with PBF Energy for an aggregate principal amount of
$326,082
and
$292,844
, respectively. The note has an interest rate of
2.5%
and a
5
-year term, payable on March 18, 2020, but may be prepaid in whole or in part at any time, at the option of PBF LLC without penalty or premium.
11. OTHER LONG-TERM LIABILITIES
Other long-term liabilities consisted of the following:
|
PBF Energy
|
December 31,
2018 |
December 31,
2017 |
||||||
|
Environmental liabilities
|
137,215
|
|
140,403
|
|
||||
|
Defined benefit pension plan liabilities
|
$
|
74,972
|
|
$
|
63,579
|
|
||
|
Early railcar return liability
|
23,315
|
|
—
|
|
||||
|
East Coast Storage Assets Contingent Consideration
|
21,567
|
|
—
|
|
||||
|
Post-retirement medical plan liabilities
|
19,345
|
|
21,527
|
|
||||
|
Other
|
814
|
|
250
|
|
||||
|
Total other long-term liabilities
|
$
|
277,228
|
|
$
|
225,759
|
|
||
12. RELATED PARTY TRANSACTIONS
Pursuant to the amended and restated limited liability company agreement of PBF LLC, the holders of PBF LLC Series B Units are entitled to an interest in the amounts received by the investment funds associated with the initial investors in PBF LLC in excess of their original investment in the form of PBF LLC distributions and from the shares of PBF Energy Class A Common Stock issuable to such investment funds (for their own account and on behalf of the holders of PBF LLC Series B Units) upon an exchange, and the proceeds from the sale of such shares. Such proceeds received by the investment funds associated with the initial investors in PBF LLC are distributed to the holders of the PBF LLC Series B Units in accordance with the distribution percentages specified in the PBF LLC amended and restated limited liability company agreement. There were
no
distributions to PBF LLC Series B unitholders for the years ended
December 31, 2018
and
December 31, 2017
. The total amount distributed to the PBF LLC Series B unitholders for the year ended
December 31, 2016
was
$6,152
.
F- 47
PBF ENERGY INC. AND PBF ENERGY COMPANY LLC
NOTES TO CONSOLIDATED FINANCIAL STATEMENTS
(IN THOUSANDS, EXCEPT SHARE, UNIT, PER SHARE, PER UNIT AND BARREL DATA)
13. COMMITMENTS AND CONTINGENCIES
Lease and Other Commitments
The Company leases office space, office equipment, refinery facilities and equipment, and railcars under non-cancelable operating leases, with terms ranging from
one
to
twenty
years, subject to certain renewal options as applicable. Total rent expense was
$132,436
,
$125,433
and
$129,768
for the years ended
December 31, 2018
,
2017
and
2016
, respectively. The Company is party to agreements which provide for the treatment of wastewater and the supply of hydrogen and steam for certain of its refineries. The Company made purchases of
$68,613
,
$64,050
and
$53,364
under these supply agreements for the years ended
December 31, 2018
,
2017
and
2016
, respectively.
The fixed and determinable amounts of the obligations under these agreements and total minimum future annual rentals, exclusive of related costs, are approximately:
|
Year Ending December 31,
|
|||
|
2019
|
$
|
125,464
|
|
|
2020
|
103,738
|
|
|
|
2021
|
67,699
|
|
|
|
2022
|
45,446
|
|
|
|
2023
|
38,049
|
|
|
|
Thereafter
|
204,452
|
|
|
|
Total obligations
|
$
|
584,848
|
|
Employment Agreements
PBF Investments (“PBFI”) has entered into amended and restated employment agreements with members of executive management and certain other key personnel that include automatic annual renewals, unless canceled. Under some of the agreements, certain of the executives would receive a lump sum payment of between
one and a half
to
2.99
times their base salary and continuation of certain employee benefits for the same period upon termination by the Company “Without Cause”, or by the employee “For Good Reason”, or upon a “Change in Control”, as defined in the agreements. Upon death or disability, certain of the Company’s executives, or their estates, would receive a lump sum payment of at least
one half
of their base salary.
Environmental Matters
The Company’s refineries, pipelines and related operations are subject to extensive and frequently changing federal, state and local laws and regulations, including, but not limited to, those relating to the discharge of materials into the environment or that otherwise relate to the protection of the environment, waste management and the characteristics and the compositions of fuels. Compliance with existing and anticipated laws and regulations can increase the overall cost of operating the refineries, including remediation, operating costs and capital costs to construct, maintain and upgrade equipment and facilities.
In connection with the Paulsboro refinery acquisition, the Company assumed certain environmental remediation obligations. The Paulsboro environmental liability of
$10,961
recorded as of
December 31, 2018
(
$10,282
as of
December 31, 2017
) represents the present value of expected future costs discounted at a rate of
8.0%
. At
December 31, 2018
the undiscounted liability totaled
$17,807
and the Company expects to make aggregate payments for this liability of
$5,932
over the next
five years
. The current portion of the environmental liability is recorded in Accrued expenses and the non-current portion is recorded in Other long-term liabilities. As of
December 31, 2018
and
December 31, 2017
, this liability is self-guaranteed by the Company.
In connection with the acquisition of the Delaware City assets, Valero Energy Corporation (“Valero”) remains responsible for certain pre-acquisition environmental obligations up to
$20,000
and the predecessor to Valero in ownership of the refinery retains other historical obligations.
F- 48
PBF ENERGY INC. AND PBF ENERGY COMPANY LLC
NOTES TO CONSOLIDATED FINANCIAL STATEMENTS
(IN THOUSANDS, EXCEPT SHARE, UNIT, PER SHARE, PER UNIT AND BARREL DATA)
In connection with the acquisition of the Delaware City assets and the Paulsboro refinery, the Company and Valero purchased
ten
year,
$75,000
environmental insurance policies to insure against unknown environmental liabilities at each site. In connection with the Toledo refinery acquisition, Sunoco, Inc. (R&M) remains responsible for environmental remediation for conditions that existed on the closing date for
twenty years
from March 1, 2011, subject to certain limitations.
In connection with the acquisition of the Chalmette refinery, the Company obtained
$3,936
in financial assurance (in the form of a surety bond) to cover estimated potential site remediation costs associated with an agreed to Administrative Order of Consent with EPA. The estimated cost assumes remedial activities will continue for a minimum of
thirty
years. Further, in connection with the acquisition of the Chalmette refinery, the Company purchased a
ten
year,
$100,000
environmental insurance policy to insure against unknown environmental liabilities at the refinery. At the time the Company acquired the Chalmette refinery it was subject to a Consolidated Compliance Order and Notice of Potential Penalty (the “Order”) issued by the Louisiana Department of Environmental Quality (“LDEQ”) covering deviations from 2009 and 2010. Chalmette Refining and LDEQ subsequently entered into a dispute resolution agreement to negotiate the resolution of deviations on or before December 31, 2014. On May 18, 2018 the Order was settled by LDEQ and the Chalmette refinery for an administrative penalty of
$741
, of which
$100
has been paid in cash and the remainder has been spent on beneficial environmental projects.
The Delaware City refinery appealed a Notice of Penalty Assessment and Secretary’s Order issued in March 2017, including a
$150
fine, alleging violation of a 2013 Secretary’s Order authorizing crude oil shipment by barge. DNREC determined that the Delaware City refinery had violated the order by failing to make timely and full disclosure to DNREC about the nature and extent of those shipments, and had misrepresented the number of shipments that went to other facilities. The Penalty Assessment and Secretary’s Order conclude that the 2013 Secretary’s Order was violated by the refinery by shipping crude oil from the Delaware City terminal to three locations other than the Paulsboro refinery, on 15 days in 2014, making a total of
17
separate barge shipments containing approximately
35.7
million gallons of crude oil in total. On April 28, 2017, the Delaware City refinery appealed the Notice of Penalty Assessment and Secretary’s Order. On March 5, 2018, Notice of Penalty Assessment was settled by DNREC, the Delaware Attorney General and Delaware City refinery for
$100
. The Delaware City refinery made no admissions with respect to the alleged violations and agreed to request a Coastal Zone Act status decision prior to making crude oil shipments to destinations other than Paulsboro. The Delaware City refinery has paid the penalty. The Coastal Zone Act status decision request was submitted to DNREC and the outstanding appeal was withdrawn as required under the settlement agreement.
On December 28, 2016, DNREC issued a Coastal Zone Act permit (the “Ethanol Permit”) to DCR allowing the utilization of existing tanks and existing marine loading equipment at their existing facilities to enable denatured ethanol to be loaded from storage tanks to marine vessels and shipped to offsite facilities. On January 13, 2017, the issuance of the Ethanol Permit was appealed by
two
environmental groups. On February 27, 2017, the Coastal Zone Industrial Board (the “Coastal Zone Board”) held a public hearing and dismissed the appeal, determining that the appellants did not have standing. The appellants filed an appeal of the Coastal Zone Board’s decision with the Delaware Superior Court (the “Superior Court”) on March 30, 2017. On January 19, 2018, the Superior Court rendered an Opinion regarding the decision of the Coastal Zone Board to dismiss the appeal of the Ethanol Permit for the ethanol project. The Judge determined that the record created by the Coastal Zone Board was insufficient for the Superior Court to make a decision, and therefore remanded the case back to the Coastal Zone Board to address the deficiency in the record. Specifically, the Superior Court directed the Coastal Zone Board to address any evidence concerning whether the appellants’ claimed injuries would be affected by the increased quantity of ethanol shipments. On remand, the Coastal Zone Board met on January 28, 2019 and reversed its previous decision on standing, ruling that the appellants have standing to appeal the issuance of the Ethanol Permit. DCR is currently evaluating its appeal options.
At the time the Company acquired the Toledo refinery, EPA had initiated an investigation into the compliance of the refinery with EPA standards governing flaring pursuant to Section 114 of the Clean Air Act. On February 1, 2013, EPA issued an Amended Notice of Violation, and on September 20, 2013, EPA issued a Notice of Violation and Finding of Violation to Toledo refinery, alleging certain violations of the Clean Air Act at its Plant 4 and Plant
F- 49
PBF ENERGY INC. AND PBF ENERGY COMPANY LLC
NOTES TO CONSOLIDATED FINANCIAL STATEMENTS
(IN THOUSANDS, EXCEPT SHARE, UNIT, PER SHARE, PER UNIT AND BARREL DATA)
9 flares since the acquisition of the refinery on March 1, 2011. Toledo refinery and EPA subsequently entered into tolling agreements pending settlement discussions. Although the resolution has not been finalized, the civil administrative penalty is anticipated to be approximately
$645
including supplemental environmental projects. To the extent the administrative penalty exceeds such amount, it is not expected to be material to the Company.
In connection with the acquisition of the Torrance refinery and related logistics assets, the Company assumed certain pre-existing environmental liabilities totaling
$130,817
as of
December 31, 2018
(
$136,487
as of
December 31, 2017
), related to certain environmental remediation obligations to address existing soil and groundwater contamination and monitoring activities and other clean-up activities, which reflects the current estimated cost of the remediation obligations. The Company expects to make aggregate payments for this liability of
$46,189
over the next
five
years. The current portion of the environmental liability is recorded in Accrued expenses and the non-current portion is recorded in Other long-term liabilities. In addition, in connection with the acquisition of the Torrance refinery and related logistics assets, the Company purchased a
ten
year,
$100,000
environmental insurance policy to insure against unknown environmental liabilities. Furthermore, in connection with the acquisition, the Company assumed responsibility for certain specified environmental matters that occurred prior to the Company’s ownership of the refinery and the logistics assets, including specified incidents and/or notices of violations (“NOVs”) issued by regulatory agencies in various years before the Company’s ownership, including the Southern California Air Quality Management District (“SCAQMD”) and the Division of Occupational Safety and Health of the State of California (“Cal/OSHA”).
In connection with the acquisition of the Torrance refinery and related logistics assets, the Company agreed to take responsibility for NOV No. P63405 that ExxonMobil had received from the SCAQMD for Title V deviations that are alleged to have occurred in 2015. On August 14, 2018, the Company received a letter from SCAQMD offering to settle this NOV for
$515
. The Company is currently in communication with SCAQMD to resolve this NOV.
Subsequent to the acquisition, further NOVs were issued by the SCAQMD, Cal/OSHA, the City of Torrance, the City of Torrance Fire Department, and the Los Angeles County Sanitation District related to alleged operational violations, emission discharges and/or flaring incidents at the refinery and the logistics assets both before and after the Company’s acquisition. EPA in November 2016 conducted a Risk Management Plan (“RMP”) inspection following the acquisition related to Torrance operations and issued preliminary findings in March 2017 concerning RMP potential operational violations. The Company is currently in communication with EPA to resolve the RMP preliminary findings. EPA and the California Department of Toxic Substances Control (“DTSC”) in December 2016 conducted a Resource Conservation and Recovery Act (“RCRA”) inspection following the acquisition related to Torrance operations and also issued in March 2017 preliminary findings concerning RCRA potential operational violations. In April 2017, EPA referred the RCRA preliminary findings to DTSC for final resolution. On March 1, 2018, the Company received a notice of intent to sue from Environmental Integrity Project, on behalf of Environment California, under RCRA with respect to the alleged violations from EPA’s and DTSC’s December 2016 inspection. On March 2, 2018, DTSC issued an order to correct alleged RCRA violations relating to the accumulation of oil bearing materials in roll off bins during 2016 and 2017. On June 14, 2018, the Torrance refinery and DTSC reached settlement regarding the oil bearing materials in the form of a stipulation and order, wherein the Torrance refinery agreed that it would recycle or properly dispose of the oil bearing materials by the end of 2018 and pay an administrative penalty of
$150
. The Torrance refinery has complied with these requirements. Following this settlement, in June 2018, DTSC referred the remaining alleged RCRA violations from EPA’s and DTSC’s December 2016 inspection to the California Attorney General for final resolution. The Torrance refinery and the California Attorney General are in discussions to resolve these remaining alleged RCRA violations. Other than the
$150
DTSC administrative penalty, no other settlement or penalty demands have been received to date with respect to any of the other NOVs, preliminary findings, or order that are in excess of
$100
. As the ultimate outcomes are uncertain, the Company cannot currently estimate the final amount or timing of their resolution but any such amount is not expected to have a material impact on the Company’s financial position, results of operations or cash flows, individually or in the aggregate.
F- 50
PBF ENERGY INC. AND PBF ENERGY COMPANY LLC
NOTES TO CONSOLIDATED FINANCIAL STATEMENTS
(IN THOUSANDS, EXCEPT SHARE, UNIT, PER SHARE, PER UNIT AND BARREL DATA)
In connection with the PBFX Plains Asset Purchase, PBFX is responsible for the environmental remediation costs for conditions that existed on the closing date up to a maximum of
$250
per year for
ten
years, with Plains All American Pipeline, L.P. remaining responsible for any and all additional costs above such amounts during such period. The environmental liability of
$1,570
recorded as of
December 31, 2018
(
$1,923
as of
December 31, 2017
) represents the present value of expected future costs discounted at a rate of
1.83%
. At
December 31, 2018
the undiscounted liability is
$1,698
and PBFX expects to make aggregate payments for this liability of
$1,250
over the next
five
years. The current portion of the environmental liability is recorded in Accrued expenses and the non-current portion is recorded in Other long-term liabilities.
In connection with the Knoxville Terminal Purchase, PBFX and Cummins purchased a
ten
-year,
$30,000
environmental insurance policy against unknown environmental liabilities. PBFX did not assume, and is currently not aware of, any material pre-existing environmental obligations. Additionally, the seller remains responsible for pre-acquisition environmental obligations up to a specified amount for a specified period of time.
In connection with the East Coast Storage Assets Acquisition, PBFX purchased a
ten
-year,
$30,000
environmental insurance policy against unknown environmental liabilities. Additionally, the seller remains responsible for pre-acquisition environmental obligations up to a specified amount for a specified period of time. The recorded environmental liability associated with the East Coast Storage Assets Acquisition as of
December 31, 2018
was
$885
.
Applicable Federal and State Regulatory Requirements
The Company’s operations and many of the products it manufactures are subject to certain specific requirements of the Clean Air Act (the “CAA”) and related state and local regulations. The CAA contains provisions that require capital expenditures for the installation of certain air pollution control devices at the Company’s refineries. Subsequent rule making authorized by the CAA or similar laws or new agency interpretations of existing rules, may necessitate additional expenditures in future years.
In 2010, New York State adopted a Low-Sulfur Heating Oil mandate that, beginning July 1, 2012, requires all heating oil sold in New York State to contain no more than
15
parts per million (“PPM”) sulfur. Since July 1, 2012, other states in the Northeast market began requiring heating oil sold in their state to contain no more than
15
PPM sulfur. Currently, all of the Northeastern states and Washington DC have adopted sulfur controls on heating oil. As of July 1, 2018 most of the Northeastern states require heating oil with
15
PPM or less sulfur (except for Pennsylvania and Maryland - where less than
500
PPM sulfur is required). All of the heating oil the Company currently produces meets these specifications. The mandate and other requirements do not currently have a material impact on the Company’s financial position, results of operations or cash flows.
EPA issued the final Tier 3 Gasoline standards on March 3, 2014 under the CAA. This final rule establishes more stringent vehicle emission standards and further reduces the sulfur content of gasoline starting in January 2017. The new standard is set at
10
PPM sulfur in gasoline on an annual average basis starting January 1, 2017, with a credit trading program to provide compliance flexibility. EPA responded to industry comments on the proposed rule and maintained the per gallon sulfur cap on gasoline at the existing
80
PPM cap. The refineries are complying with these new requirements as planned, either directly or using flexibility provided by sulfur credits generated or purchased in advance as an economic optimization. The standards set by the new rule are not expected to have a material impact on the Company’s financial position, results of operations or cash flows.
The Company is required to comply with the Renewable Fuel Standard (“RFS”) implemented by EPA, which sets annual quotas for the quantity of renewable fuels (such as ethanol) that must be blended into motor fuels consumed in the United States. In July 2018, EPA issued proposed amendments to the RFS program regulations that would establish annual percentage standards for cellulosic biofuel, biomass-based diesel, advanced biofuel, and renewable fuels that would apply to all gasoline and diesel produced in the U.S. or imported in the year 2019. In addition, the separate proposal includes a proposed biomass-based diesel applicable volume for 2020. It is likely that RIN production will continue to be lower than needed forcing obligated parties, such as the Company, to purchase cellulosic waiver credits or purchase excess RINs from suppliers on the open market.
F- 51
PBF ENERGY INC. AND PBF ENERGY COMPANY LLC
NOTES TO CONSOLIDATED FINANCIAL STATEMENTS
(IN THOUSANDS, EXCEPT SHARE, UNIT, PER SHARE, PER UNIT AND BARREL DATA)
In addition, on November 26, 2018 EPA finalized revisions to an existing air regulation concerning Maximum Achievable Control Technologies (“MACT”) for Petroleum Refineries. The regulation requires additional continuous monitoring systems for eligible process safety valves relieving to atmosphere, minimum flare gas heat (Btu) content, and delayed coke drum vent controls to be installed by January 30, 2019. In addition, a program for ambient fence line monitoring for benzene was implemented prior to the deadline of January 30, 2018. The Company is in the process of implementing the requirements of this regulation. The regulation does not have a material impact on the Company’s financial position, results of operations or cash flows.
EPA published a Final Rule to the Clean Water Act (“CWA”) Section 316(b) in August 2014 regarding cooling water intake structures, which includes requirements for petroleum refineries. The purpose of this rule is to prevent fish from being trapped against cooling water intake screens (impingement) and to prevent fish from being drawn through cooling water systems (entrainment). Facilities will be required to implement Best Technology Available (“BTA”) as soon as possible, but state agencies have the discretion to establish implementation time lines. The Company continues to evaluate the impact of this regulation, and at this time does not anticipate it having a material impact on the Company’s financial position, results of operations or cash flows.
As a result of the Torrance Acquisition, the Company is subject to greenhouse gas emission control regulations in the state of California pursuant to AB32. AB32 imposes a statewide cap on greenhouse gas emissions, including emissions from transportation fuels, with the aim of returning the state to 1990 emission levels by 2020. AB32 is implemented through two market mechanisms including the Low Carbon Fuel Standard (“LCFS”) and Cap and Trade, which was extended for an additional
ten
years to 2030 in July 2017. The Company is responsible for the AB32 obligations related to the Torrance refinery beginning on July 1, 2016 and must purchase emission credits to comply with these obligations. Additionally, in September 2016, the state of California enacted Senate Bill 32 (“SB32”) which further reduces greenhouse gas emissions targets to
40 percent
below 1990 levels by 2030.
However, subsequent to the acquisition, the Company is recovering the majority of these costs from its customers, and as such does not expect this obligation to materially impact the Company’s financial position, results of operations, or cash flows. To the degree there are unfavorable changes to AB32 or SB32 regulations or the Company is unable to recover such compliance costs from customers, these regulations could have a material adverse effect on our financial position, results of operations and cash flows.
The Company is subject to obligations to purchase RINs. On February 15, 2017, the Company received a notification that EPA records indicated that PBF Holding used potentially invalid RINs that were in fact verified under EPA’s RIN Quality Assurance Program (“QAP”) by an independent auditor as QAP A RINs. Under the regulations, use of potentially invalid QAP A RINs provided the user with an affirmative defense from civil penalties provided certain conditions are met. The Company has asserted the affirmative defense and if accepted by EPA will not be required to replace these RINs and will not be subject to civil penalties under the program. It is reasonably possible that EPA will not accept the Company’s defense and may assess penalties in these matters but any such amount is not expected to have a material impact on the Company’s financial position, results of operations or cash flows.
As of January 1, 2011, the Company is required to comply with EPA’s Control of Hazardous Air Pollutants From Mobile Sources, or MSAT2, regulations on gasoline that impose reductions in the benzene content of its produced gasoline. The Company purchases benzene credits to meet these requirements. The Company’s planned capital projects will reduce the amount of benzene credits that it needs to purchase. In addition, the renewable fuel standards mandate the blending of prescribed percentages of renewable fuels (e.g., ethanol and biofuels) into the Company’s produced gasoline and diesel. These new requirements, other requirements of the CAA and other presently existing or future environmental regulations may cause the Company to make substantial capital expenditures as well as the purchase of credits at significant cost, to enable its refineries to produce products that meet applicable requirements.
The federal Comprehensive Environmental Response, Compensation and Liability Act of 1980 (“CERCLA”), also known as “Superfund,” imposes liability, without regard to fault or the legality of the original conduct, on certain classes of persons who are considered to be responsible for the release of a “hazardous substance” into the environment. These persons include the current or former owner or operator of the disposal site or sites where the
F- 52
PBF ENERGY INC. AND PBF ENERGY COMPANY LLC
NOTES TO CONSOLIDATED FINANCIAL STATEMENTS
(IN THOUSANDS, EXCEPT SHARE, UNIT, PER SHARE, PER UNIT AND BARREL DATA)
release occurred and companies that disposed of or arranged for the disposal of the hazardous substances. Under CERCLA, such persons may be subject to joint and several liability for investigation and the costs of cleaning up the hazardous substances that have been released into the environment, for damages to natural resources and for the costs of certain health studies. As discussed more fully above, certain of the Company’s sites are subject to these laws and the Company may be held liable for investigation and remediation costs or claims for natural resource damages. It is not uncommon for neighboring landowners and other third parties to file claims for personal injury and property damage allegedly caused by hazardous substances or other pollutants released into the environment. Analogous state laws impose similar responsibilities and liabilities on responsible parties. In the Company’s current normal operations, it has generated waste, some of which falls within the statutory definition of a “hazardous substance” and some of which may have been disposed of at sites that may require cleanup under Superfund.
The Company is also currently subject to certain other existing environmental claims and proceedings. The Company believes that there is only a remote possibility that future costs related to any of these other known contingent liability exposures would have a material impact on its financial position, results of operations or cash flows.
PBF LLC Limited Liability Company Agreement
The holders of limited liability company interests in PBF LLC, including PBF Energy, generally have to include for purposes of calculating their U.S. federal, state and local income taxes their share of any taxable income of PBF LLC, regardless of whether such holders receive cash distributions from PBF LLC. PBF Energy ultimately may not receive cash distributions from PBF LLC equal to its share of such taxable income or even equal to the actual tax due with respect to that income. For example, PBF LLC is required to include in taxable income PBF LLC’s allocable share of PBFX’s taxable income and gains (such share to be determined pursuant to the partnership agreement of PBFX), regardless of the amount of cash distributions received by PBF LLC from PBFX, and such taxable income and gains will flow-through to PBF Energy to the extent of its allocable share of the taxable income of PBF LLC. As a result, at certain times, the amount of cash otherwise ultimately available to PBF Energy on account of its indirect interest in PBFX may not be sufficient for PBF Energy to pay the amount of taxes it will owe on account of its indirect interests in PBFX.
Taxable income of PBF LLC generally is allocated to the holders of PBF LLC units (including PBF Energy) pro-rata in accordance with their respective share of the net profits and net losses of PBF LLC. In general, PBF LLC is required to make periodic tax distributions to the members of PBF LLC, including PBF Energy, pro-rata in accordance with their respective percentage interests for such period (as determined under the amended and restated limited liability company agreement of PBF LLC), subject to available cash and applicable law and contractual restrictions (including pursuant to our debt instruments) and based on certain assumptions. Generally, these tax distributions are required to be in an amount equal to our estimate of the taxable income of PBF LLC for the year multiplied by an assumed tax rate equal to the highest effective marginal combined U.S. federal, state and local income tax rate prescribed for an individual or corporate resident in New York, New York (taking into account the nondeductibility of certain expenses). If, with respect to any given calendar year, the aggregate periodic tax distributions were less than the actual taxable income of PBF LLC multiplied by the assumed tax rate, PBF LLC is required to make a “true up” tax distribution, no later than March 15 of the following year, equal to such difference, subject to the available cash and borrowings of PBF LLC. PBF LLC generally obtains funding to pay its tax distributions by causing PBF Holding to distribute cash to PBF LLC and from distributions it receives from PBFX.
F- 53
PBF ENERGY INC. AND PBF ENERGY COMPANY LLC
NOTES TO CONSOLIDATED FINANCIAL STATEMENTS
(IN THOUSANDS, EXCEPT SHARE, UNIT, PER SHARE, PER UNIT AND BARREL DATA)
Tax Receivable Agreement
PBF Energy entered into a tax receivable agreement with the PBF LLC Series A and PBF LLC Series B unitholders (the “Tax Receivable Agreement”) that provides for the payment by PBF Energy to such persons of an amount equal to
85%
of the amount of the benefits, if any, that PBF Energy is deemed to realize as a result of (i) increases in tax basis, as described below, and (ii) certain other tax benefits related to entering into the Tax Receivable Agreement, including tax benefits attributable to payments under the Tax Receivable Agreement. For purposes of the Tax Receivable Agreement, the benefits deemed realized by PBF Energy will be computed by comparing the actual income tax liability of PBF Energy (calculated with certain assumptions) to the amount of such taxes that PBF Energy would have been required to pay had there been no increase to the tax basis of the assets of PBF LLC as a result of purchases or exchanges of PBF LLC Series A Units for shares of PBF Energy Class A common stock and had PBF Energy not entered into the Tax Receivable Agreement. The term of the Tax Receivable Agreement will continue until all such tax benefits have been utilized or expired unless: (i) PBF Energy exercises its right to terminate the Tax Receivable Agreement, (ii) PBF Energy breaches any of its material obligations under the Tax Receivable Agreement or (iii) certain changes of control occur, in which case all obligations under the Tax Receivable Agreement will generally be accelerated and due as calculated under certain assumptions.
The payment obligations under the Tax Receivable Agreement are obligations of PBF Energy and not of PBF LLC, PBF Holding or PBFX. In general, PBF Energy expects to obtain funding for these annual payments from PBF LLC, primarily through tax distributions, which PBF LLC makes on a pro-rata basis to its owners. Such owners include PBF Energy, which holds a
99.0%
and
96.7%
interest in PBF LLC as of
December 31, 2018
and
December 31, 2017
, respectively. PBF LLC generally obtains funding to pay its tax distributions by causing PBF Holding to distribute cash to PBF LLC and from distributions it receives from PBFX.
As a result of the reduction of the corporate federal tax rate to 21% as part of the TCJA, the liability associated with the Tax Receivable Agreement was reduced. Accordingly, the deferred tax assets associated with the payments made or expected to be made related to the Tax Receivable Agreement liability were also reduced.
As of
December 31, 2018
and
December 31, 2017
, PBF Energy has recognized a liability for the Tax Receivable Agreement of
$373,512
and
$362,142
, respectively, reflecting the estimate of the undiscounted amounts that the Company expects to pay under the agreement.
F- 54
PBF ENERGY INC. AND PBF ENERGY COMPANY LLC
NOTES TO CONSOLIDATED FINANCIAL STATEMENTS
(IN THOUSANDS, EXCEPT SHARE, UNIT, PER SHARE, PER UNIT AND BARREL DATA)
14. STOCKHOLDERS’ AND MEMBERS’ EQUITY STRUCTURE
PBF Energy Capital Structure
Class A Common Stock
Holders of Class A common stock are entitled to receive dividends when and if declared by the Board of Directors out of funds legally available therefore, subject to any statutory or contractual restrictions on the payment of dividends and to any restrictions on the payment of dividends imposed by the terms of any outstanding preferred stock. Upon the Company’s dissolution or liquidation or the sale of all or substantially all of the assets, after payment in full of all amounts required to be paid to creditors and to the holders of preferred stock having liquidation preferences, if any, the holders of shares of Class A common stock will be entitled to receive pro rata remaining assets available for distribution. Holders of shares of Class A common stock do not have preemptive, subscription, redemption or conversion rights.
Class B Common Stock
Holders of shares of Class B common stock are entitled, without regard to the number of shares of Class B common stock held by such holder, to
one
vote for each PBF LLC Series A Unit beneficially owned by such holder. Accordingly, the members of PBF LLC other than PBF Energy collectively have a number of votes in PBF Energy that is equal to the aggregate number of PBF LLC Series A Units that they hold.
Holders of shares of Class A common stock and Class B common stock vote together as a single class on all matters presented to stockholders for their vote or approval, except as otherwise required by applicable law.
Holders of Class B common stock do not have any right to receive dividends or to receive a distribution upon a liquidation or winding up of PBF Energy.
Preferred Stock
Authorized preferred stock may be issued in one or more series, with designations, powers and preferences as shall be designated by the Board of Directors.
PBF LLC Capital Structure
PBF LLC Series A Units
The allocation of profits and losses and distributions to PBF LLC Series A unitholders is governed by the Limited Liability Company Agreement of PBF LLC. These allocations are made on a pro rata basis with PBF LLC Series C Units. PBF LLC Series A unitholders do not have voting rights.
PBF LLC Series B Units
The PBF LLC Series B Units are intended to be “profit interests” within the meaning of Revenue Procedures 93-27 and 2001-43 of the Internal Revenue Service and have a stated value of
zero
at issuance. The PBF LLC Series B Units are held by certain of the Company’s current and former officers, have no voting rights and are designed to increase in value only after the Company’s financial sponsors achieve certain levels of return on their investment in PBF LLC Series A Units. Accordingly, the amounts paid to the holders of PBF LLC Series B Units, if any, will reduce only the amounts otherwise payable to the PBF LLC Series A Units held by the Company’s financial sponsors, and will not reduce or otherwise impact any amounts payable to PBF Energy (the holder of PBF LLC Series C Units), the holders of the Company’s Class A common stock or any other holder of PBF LLC Series A Units. The maximum number of PBF LLC Series B Units authorized to be issued is
1,000,000
.
F- 55
PBF ENERGY INC. AND PBF ENERGY COMPANY LLC
NOTES TO CONSOLIDATED FINANCIAL STATEMENTS
(IN THOUSANDS, EXCEPT SHARE, UNIT, PER SHARE, PER UNIT AND BARREL DATA)
PBF LLC Series C Units
The PBF LLC Series C Units rank on a parity with the PBF LLC Series A Units as to distribution rights, voting rights and rights upon liquidation, winding up or dissolution. PBF LLC Series C Units are held solely by PBF Energy.
Treasury Stock
The Company’s Board of Directors previously authorized the repurchase of up to
$300,000
of the PBF Energy Class A common stock (as amended from time to time, the “Repurchase Program”). From the inception of the Repurchase Program through its expiration date, the Company has purchased approximately
6,050,717
shares of the PBF Energy Class A common stock through open market transactions under the Repurchase Program, for a total of
$150,804
. The Repurchase Program expired on September 30, 2018 and was not renewed.
These repurchases were made from time to time through various methods, including open market transactions, block trades, accelerated share repurchases, privately negotiated transactions or otherwise, certain of which may be effected through Rule 10b5-1 and Rule 10b-18 plans. The timing and number of shares repurchased depended on a variety of factors, including price, capital availability, legal requirements and economic and market conditions. The Company was not obligated to purchase any shares under the Repurchase Program, and repurchases might have been suspended or discontinued at any time without prior notice.
The Company also records PBF Energy Class A common stock surrendered to cover income tax withholdings for certain directors and employees and others pursuant to the vesting of certain awards under the Company’s equity-based compensation plans as treasury shares.
15. NONCONTROLLING INTERESTS
Noncontrolling Interest in PBF LLC
PBF Energy is the sole managing member of, and has a controlling interest in, PBF LLC. As the sole managing member of PBF LLC, PBF Energy operates and controls all of the business and affairs of PBF LLC and its subsidiaries. PBF Energy’s interest in PBF LLC was approximately
99.0%
and
96.7%
as of
December 31, 2018
and
2017
, respectively.
PBF Energy consolidates the financial results of PBF LLC and its subsidiaries, and records a noncontrolling interest for the economic interest in PBF Energy held by the members of PBF LLC other than PBF Energy. Noncontrolling interest on the consolidated statements of operations includes the portion of net income or loss attributable to the economic interest in PBF Energy held by the members of PBF LLC other than PBF Energy. Noncontrolling interest on the consolidated balance sheets represents the portion of net assets of PBF Energy attributable to the members of PBF LLC other than PBF Energy.
F- 56
PBF ENERGY INC. AND PBF ENERGY COMPANY LLC
NOTES TO CONSOLIDATED FINANCIAL STATEMENTS
(IN THOUSANDS, EXCEPT SHARE, UNIT, PER SHARE, PER UNIT AND BARREL DATA)
The noncontrolling interest ownership percentages in PBF LLC as of the completion dates of each of the equity offerings and as of the years ended
December 31, 2018
,
2017
and
2016
are calculated as follows:
|
Holders of
PBF LLC Series A Units |
Outstanding Shares
of PBF Energy Class A Common Stock |
Total
|
||||||
|
January 1, 2016
|
4,985,358
|
|
97,781,933
|
|
102,767,291
|
|
||
|
4.9
|
%
|
95.1
|
%
|
100
|
%
|
|||
|
December 19, 2016 - Equity offering
|
4,120,902
|
|
109,004,047
|
|
113,124,949
|
|
||
|
3.6
|
%
|
96.4
|
%
|
100
|
%
|
|||
|
December 31, 2016
|
3,920,902
|
|
109,204,047
|
|
113,124,949
|
|
||
|
3.5
|
%
|
96.5
|
%
|
100
|
%
|
|||
|
December 31, 2017
|
3,767,464
|
|
110,565,531
|
|
114,332,995
|
|
||
|
3.3
|
%
|
96.7
|
%
|
100
|
%
|
|||
|
August 14, 2018 - Equity offering
|
1,206,325
|
|
119,852,874
|
|
121,059,199
|
|
||
|
1.0
|
%
|
99.0
|
%
|
100
|
%
|
|||
|
December 31, 2018
|
1,206,325
|
|
119,874,191
|
|
121,080,516
|
|
||
|
1.0
|
%
|
99.0
|
%
|
100
|
%
|
|||
Noncontrolling Interest in PBFX
PBF LLC held a
44.0%
limited partner interest in PBFX and owned all of PBFX’s IDRs, with the remaining
56.0%
limited partner interest owned by public common unitholders as of
December 31, 2018
. PBF LLC is also the sole member of PBF GP, the general partner of PBFX. As noted in “Note 3 - PBF Logistics LP”, pursuant to the IDR Restructuring, the IDRs held by PBF LLC will be canceled and converted into newly issued common units.
PBF Energy, through its ownership of PBF LLC, consolidates the financial results of PBFX, and records a noncontrolling interest for the economic interest in PBFX held by the public common unitholders. Noncontrolling interest on the consolidated statements of operations includes the portion of net income or loss attributable to the economic interest in PBFX held by the public common unitholders of PBFX other than PBF Energy (through its ownership in PBF LLC). Noncontrolling interest on the consolidated balance sheets includes the portion of net assets of PBFX attributable to the public common unitholders of PBFX.
F- 57
PBF ENERGY INC. AND PBF ENERGY COMPANY LLC
NOTES TO CONSOLIDATED FINANCIAL STATEMENTS
(IN THOUSANDS, EXCEPT SHARE, UNIT, PER SHARE, PER UNIT AND BARREL DATA)
The noncontrolling interest ownership percentages in PBFX as of the Registered Direct Offering, the Development Assets Acquisition and the years ended
December 31, 2018
,
2017
and
2016
are calculated as follows:
|
Units of PBFX Held by the Public
|
Units of PBFX Held by PBF LLC (Including Subordinated Units)
|
Total
|
||||||
|
January 1, 2016
|
15,924,676
|
|
18,459,497
|
|
34,384,173
|
|
||
|
46.3
|
%
|
53.7
|
%
|
100.0
|
%
|
|||
|
April 5, 2016
|
18,799,676
|
|
18,459,497
|
|
37,259,173
|
|
||
|
50.5
|
%
|
49.5
|
%
|
100.0
|
%
|
|||
|
August 17, 2016
|
22,893,472
|
|
18,459,497
|
|
41,352,969
|
|
||
|
55.4
|
%
|
44.6
|
%
|
100.0
|
%
|
|||
|
December 31, 2016
|
23,271,174
|
|
18,459,497
|
|
41,730,671
|
|
||
|
55.8
|
%
|
44.2
|
%
|
100.0
|
%
|
|||
|
December 31, 2017
|
23,441,211
|
|
18,459,497
|
|
41,900,708
|
|
||
|
55.9
|
%
|
44.1
|
%
|
100.0
|
%
|
|||
|
July 30, 2018 - Registered Direct Offering
|
25,391,037
|
|
18,459,497
|
|
43,850,534
|
|
||
|
57.9
|
%
|
42.1
|
%
|
100.0
|
%
|
|||
|
July 31, 2018 - Development Assets consideration
|
25,391,037
|
|
19,953,631
|
|
45,344,668
|
|
||
|
56.0
|
%
|
44.0
|
%
|
100.0
|
%
|
|||
|
December 31, 2018
|
25,395,032
|
|
19,953,631
|
|
45,348,663
|
|
||
|
56.0
|
%
|
44.0
|
%
|
100.0
|
%
|
|||
Noncontrolling Interest in PBF Holding
In connection with the Chalmette Acquisition, PBF Holding recorded noncontrolling interests in two subsidiaries of Chalmette Refining. PBF Holding, through Chalmette Refining, owns an
80%
ownership interest in both Collins Pipeline Company and T&M Terminal Company. The Company recorded a noncontrolling interest in the earnings of these subsidiaries of
$44
and
$95
for the years ended
December 31, 2018
and
2017
, respectively.
F- 58
PBF ENERGY INC. AND PBF ENERGY COMPANY LLC
NOTES TO CONSOLIDATED FINANCIAL STATEMENTS
(IN THOUSANDS, EXCEPT SHARE, UNIT, PER SHARE, PER UNIT AND BARREL DATA)
Changes in Equity and Noncontrolling Interests
On August 14, 2018, PBF Energy completed a public offering of an aggregate of
6,000,000
shares of its Class A common stock (the “August 2018 Equity Offering”) for net proceeds of
$287,284
, after deducting underwriting discounts and commissions and other offering expenses.
The following tables summarize the changes in equity for the controlling and noncontrolling interests of PBF Energy for the years ended
December 31, 2018
,
2017
and
2016
:
|
PBF Energy
|
PBF Energy
Inc. Equity |
Noncontrolling
Interest in PBF LLC |
Noncontrolling Interest in PBF Holding
|
Noncontrolling
Interest in PBFX |
Total Equity
|
||||||||||||||
|
Balance at January 1, 2018
|
$
|
2,336,654
|
|
$
|
110,203
|
|
$
|
10,808
|
|
$
|
445,284
|
|
$
|
2,902,949
|
|
||||
|
Comprehensive income
|
131,268
|
|
4,698
|
|
44
|
|
42,264
|
|
178,274
|
|
|||||||||
|
Dividends and distributions
|
(139,263
|
)
|
(2,086
|
)
|
—
|
|
(49,532
|
)
|
(190,881
|
)
|
|||||||||
|
Effects of equity offerings and exchanges of PBF LLC Series A Units on deferred tax assets and liabilities and tax receivable agreement obligation
|
(4,926
|
)
|
—
|
|
—
|
|
—
|
|
(4,926
|
)
|
|||||||||
|
Issuance of additional PBFX common units
|
28,564
|
|
—
|
|
—
|
|
6,256
|
|
34,820
|
|
|||||||||
|
Stock-based compensation
|
19,697
|
|
—
|
|
—
|
|
5,757
|
|
25,454
|
|
|||||||||
|
August 2018 Equity Offering
|
287,284
|
|
—
|
|
—
|
|
—
|
|
287,284
|
|
|||||||||
|
Exercise of PBF LLC and PBF Energy options and warrants, net
|
13,965
|
|
—
|
|
—
|
|
—
|
|
13,965
|
|
|||||||||
|
Taxes paid for net settlement of equity-based compensation
|
(4,775
|
)
|
(568
|
)
|
—
|
|
—
|
|
(5,343
|
)
|
|||||||||
|
Other
|
7,997
|
|
—
|
|
—
|
|
(1,114
|
)
|
6,883
|
|
|||||||||
|
Balance at December 31, 2018
|
$
|
2,676,465
|
|
$
|
112,247
|
|
$
|
10,852
|
|
$
|
448,915
|
|
$
|
3,248,479
|
|
||||
|
PBF Energy
|
PBF Energy
Inc. Equity |
Noncontrolling
Interest in PBF LLC |
Noncontrolling Interest in PBF Holding
|
Noncontrolling
Interest in PBFX |
Total Equity
|
||||||||||||||
|
Balance at January 1, 2017
|
$
|
2,025,044
|
|
$
|
98,671
|
|
$
|
12,513
|
|
$
|
434,456
|
|
$
|
2,570,684
|
|
||||
|
Comprehensive income
|
414,575
|
|
16,714
|
|
95
|
|
51,073
|
|
482,457
|
|
|||||||||
|
Dividends and distributions
|
(131,783
|
)
|
(4,584
|
)
|
(1,800
|
)
|
(44,636
|
)
|
(182,803
|
)
|
|||||||||
|
Stock-based compensation
|
21,503
|
|
—
|
|
—
|
|
5,345
|
|
26,848
|
|
|||||||||
|
Exercise of PBF LLC options and warrants, net
|
10,533
|
|
(598
|
)
|
—
|
|
—
|
|
9,935
|
|
|||||||||
|
Effects of exchanges of PBF LLC Series A Units on deferred tax assets and liabilities and tax receivable agreement obligation
|
(1,139
|
)
|
—
|
|
—
|
|
—
|
|
(1,139
|
)
|
|||||||||
|
Treasury stock purchases
|
(1,038
|
)
|
—
|
|
—
|
|
—
|
|
(1,038
|
)
|
|||||||||
|
Other
|
(1,041
|
)
|
—
|
|
—
|
|
(954
|
)
|
(1,995
|
)
|
|||||||||
|
Balance at December 31, 2017
|
$
|
2,336,654
|
|
$
|
110,203
|
|
$
|
10,808
|
|
$
|
445,284
|
|
$
|
2,902,949
|
|
||||
F- 59
PBF ENERGY INC. AND PBF ENERGY COMPANY LLC
NOTES TO CONSOLIDATED FINANCIAL STATEMENTS
(IN THOUSANDS, EXCEPT SHARE, UNIT, PER SHARE, PER UNIT AND BARREL DATA)
|
PBF Energy
|
PBF Energy
Inc. Equity |
Noncontrolling
Interest in PBF LLC |
Noncontrolling Interest in PBF Holding
|
Noncontrolling
Interest in PBFX |
Total Equity
|
||||||||||||||
|
Balance at January 1, 2016
|
$
|
1,647,297
|
|
$
|
91,018
|
|
$
|
17,225
|
|
$
|
340,317
|
|
$
|
2,095,857
|
|
||||
|
Comprehensive income
|
168,308
|
|
14,509
|
|
269
|
|
39,840
|
|
222,926
|
|
|||||||||
|
Dividends and distributions
|
(132,705
|
)
|
(6,728
|
)
|
—
|
|
(33,714
|
)
|
(173,147
|
)
|
|||||||||
|
Stock-based compensation
|
18,296
|
|
—
|
|
—
|
|
4,360
|
|
22,656
|
|
|||||||||
|
Issuance of additional PBFX common units
|
54,944
|
|
—
|
|
—
|
|
83,434
|
|
138,378
|
|
|||||||||
|
Exercise of PBF LLC options and warrants, net
|
1,058
|
|
(172
|
)
|
—
|
|
—
|
|
886
|
|
|||||||||
|
Effects of equity offerings and exchanges of PBF LLC Series A Units on deferred tax assets and liabilities and tax receivable agreement obligation
|
(2,613
|
)
|
—
|
|
—
|
|
—
|
|
(2,613
|
)
|
|||||||||
|
December 2016 Equity Offering
|
275,300
|
|
—
|
|
—
|
|
—
|
|
275,300
|
|
|||||||||
|
Treasury stock purchases
|
(743
|
)
|
—
|
|
—
|
|
—
|
|
(743
|
)
|
|||||||||
|
Other
|
(4,098
|
)
|
44
|
|
(4,981
|
)
|
219
|
|
(8,816
|
)
|
|||||||||
|
Balance at December 31, 2016
|
$
|
2,025,044
|
|
$
|
98,671
|
|
$
|
12,513
|
|
$
|
434,456
|
|
$
|
2,570,684
|
|
||||
The following tables summarize the changes in equity for the controlling and noncontrolling interests of PBF LLC for the years ended
December 31, 2018
,
2017
, and
2016
respectively:
|
PBF LLC
|
PBF Energy Company LLC Equity
|
Noncontrolling Interest in PBF Holding
|
Noncontrolling
Interest in PBFX |
Total Equity
|
|||||||||||
|
Balance at January 1, 2018
|
$
|
2,422,411
|
|
$
|
10,808
|
|
$
|
445,284
|
|
$
|
2,878,503
|
|
|||
|
Comprehensive income
|
140,821
|
|
44
|
|
42,264
|
|
183,129
|
|
|||||||
|
Dividends and distributions
|
(141,349
|
)
|
—
|
|
(49,532
|
)
|
(190,881
|
)
|
|||||||
|
Issuance of additional PBFX common units
|
28,564
|
|
—
|
|
6,256
|
|
34,820
|
|
|||||||
|
Stock-based compensation
|
19,697
|
|
—
|
|
5,757
|
|
25,454
|
|
|||||||
|
Exercise of PBF LLC and PBF Energy options and warrants, net
|
(8,536
|
)
|
—
|
|
—
|
|
(8,536
|
)
|
|||||||
|
Issuance of Series C units in connection with the August 2018 Equity Offering
|
287,284
|
|
—
|
|
—
|
|
287,284
|
|
|||||||
|
Other
|
10,590
|
|
—
|
|
(1,114
|
)
|
9,476
|
|
|||||||
|
Balance at December 31, 2018
|
$
|
2,759,482
|
|
$
|
10,852
|
|
$
|
448,915
|
|
$
|
3,219,249
|
|
|||
|
PBF LLC
|
PBF Energy Company LLC Equity
|
Noncontrolling Interest in PBF Holding
|
Noncontrolling
Interest in PBFX |
Total Equity
|
|||||||||||
|
Balance at January 1, 2017
|
$
|
2,040,851
|
|
$
|
12,513
|
|
$
|
434,456
|
|
$
|
2,487,820
|
|
|||
|
Comprehensive income
|
499,103
|
|
95
|
|
51,073
|
|
550,271
|
|
|||||||
|
Dividends and distributions
|
(136,367
|
)
|
(1,800
|
)
|
(44,636
|
)
|
(182,803
|
)
|
|||||||
|
Grant of restricted shares
|
1,038
|
|
—
|
|
—
|
|
1,038
|
|
|||||||
|
Stock-based compensation
|
21,503
|
|
—
|
|
5,345
|
|
26,848
|
|
|||||||
|
Exercise of PBF LLC options and warrants, net
|
(598
|
)
|
—
|
|
—
|
|
(598
|
)
|
|||||||
|
Treasury stock purchases
|
(1,038
|
)
|
—
|
|
—
|
|
(1,038
|
)
|
|||||||
|
Other
|
(2,081
|
)
|
—
|
|
(954
|
)
|
(3,035
|
)
|
|||||||
|
Balance at December 31, 2017
|
$
|
2,422,411
|
|
$
|
10,808
|
|
$
|
445,284
|
|
$
|
2,878,503
|
|
|||
F- 60
PBF ENERGY INC. AND PBF ENERGY COMPANY LLC
NOTES TO CONSOLIDATED FINANCIAL STATEMENTS
(IN THOUSANDS, EXCEPT SHARE, UNIT, PER SHARE, PER UNIT AND BARREL DATA)
|
PBF LLC
|
PBF Energy Company LLC Equity
|
Noncontrolling Interest in PBF Holding
|
Noncontrolling
Interest in PBFX |
Total Equity
|
|||||||||||
|
Balance at January 1, 2016
|
$
|
1,551,853
|
|
$
|
17,225
|
|
$
|
340,317
|
|
$
|
1,909,395
|
|
|||
|
Comprehensive income
|
278,296
|
|
269
|
|
39,840
|
|
318,405
|
|
|||||||
|
Dividends and distributions
|
(139,433
|
)
|
—
|
|
(33,714
|
)
|
(173,147
|
)
|
|||||||
|
Issuance of additional PBFX common units
|
54,944
|
|
—
|
|
83,434
|
|
138,378
|
|
|||||||
|
Grant of restricted shares
|
743
|
|
—
|
|
—
|
|
743
|
|
|||||||
|
Stock-based compensation
|
18,296
|
|
—
|
|
4,360
|
|
22,656
|
|
|||||||
|
Exercise of PBF LLC options and warrants, net
|
886
|
|
—
|
|
—
|
|
886
|
|
|||||||
|
Issuance of Series C units in connection with the December 2016 Equity Offering
|
275,300
|
|
—
|
|
—
|
|
275,300
|
|
|||||||
|
Treasury stock purchases
|
(743
|
)
|
—
|
|
—
|
|
(743
|
)
|
|||||||
|
Other
|
709
|
|
(4,981
|
)
|
219
|
|
(4,053
|
)
|
|||||||
|
Balance at December 31, 2016
|
$
|
2,040,851
|
|
$
|
12,513
|
|
$
|
434,456
|
|
$
|
2,487,820
|
|
|||
Comprehensive Income
Comprehensive income includes net income and other comprehensive income (loss) arising from activity related to the Company’s defined employee benefit plan and unrealized gain (loss) on available-for-sale securities. The following table summarizes the allocation of total comprehensive income of PBF Energy between the controlling and noncontrolling interests for the year ended
December 31, 2018
:
|
PBF Energy
|
Attributable to
PBF Energy Inc. stockholders
|
Noncontrolling
Interests
|
Total
|
|||||||||
|
Net income
|
$
|
128,315
|
|
$
|
46,976
|
|
$
|
175,291
|
|
|||
|
Other comprehensive income (loss):
|
||||||||||||
|
Unrealized loss on available for sale securities
|
(107
|
)
|
(1
|
)
|
(108
|
)
|
||||||
|
Amortization of defined benefit plans unrecognized net gain
|
3,060
|
|
31
|
|
3,091
|
|
||||||
|
Total other comprehensive income
|
2,953
|
|
30
|
|
2,983
|
|
||||||
|
Total comprehensive income
|
$
|
131,268
|
|
$
|
47,006
|
|
$
|
178,274
|
|
|||
The following table summarizes the allocation of total comprehensive income of PBF Energy between the controlling and noncontrolling interests for the year ended
December 31, 2017
:
|
PBF Energy
|
Attributable to
PBF Energy Inc. stockholders
|
Noncontrolling
Interest
|
Total
|
|||||||||
|
Net income
|
$
|
415,517
|
|
$
|
67,914
|
|
$
|
483,431
|
|
|||
|
Other comprehensive loss:
|
||||||||||||
|
Unrealized loss on available for sale securities
|
(23
|
)
|
(1
|
)
|
(24
|
)
|
||||||
|
Amortization of defined benefit plans unrecognized net loss
|
(919
|
)
|
(31
|
)
|
(950
|
)
|
||||||
|
Total other comprehensive loss
|
(942
|
)
|
(32
|
)
|
(974
|
)
|
||||||
|
Total comprehensive income
|
$
|
414,575
|
|
$
|
67,882
|
|
$
|
482,457
|
|
|||
F- 61
PBF ENERGY INC. AND PBF ENERGY COMPANY LLC
NOTES TO CONSOLIDATED FINANCIAL STATEMENTS
(IN THOUSANDS, EXCEPT SHARE, UNIT, PER SHARE, PER UNIT AND BARREL DATA)
The following table summarizes the allocation of total comprehensive income of PBF Energy between the controlling and noncontrolling interests for the year ended
December 31, 2016
:
|
PBF Energy
|
Attributable to
PBF Energy Inc. stockholders
|
Noncontrolling
Interest
|
Total
|
|||||||||
|
Net income
|
$
|
170,811
|
|
$
|
54,707
|
|
$
|
225,518
|
|
|||
|
Other comprehensive loss:
|
||||||||||||
|
Unrealized loss on available for sale securities
|
(41
|
)
|
(1
|
)
|
(42
|
)
|
||||||
|
Amortization of defined benefit plans unrecognized net loss
|
(2,462
|
)
|
(88
|
)
|
(2,550
|
)
|
||||||
|
Total other comprehensive loss
|
(2,503
|
)
|
(89
|
)
|
(2,592
|
)
|
||||||
|
Total comprehensive income
|
$
|
168,308
|
|
$
|
54,618
|
|
$
|
222,926
|
|
|||
The following table summarizes the allocation of total comprehensive income of PBF LLC between the controlling and noncontrolling interests for the year ended
December 31, 2018
:
|
PBF LLC
|
Attributable to
PBF LLC
|
Noncontrolling
Interests
|
Total
|
|||||||||
|
Net income
|
$
|
137,838
|
|
$
|
42,308
|
|
$
|
180,146
|
|
|||
|
Other comprehensive income (loss):
|
||||||||||||
|
Unrealized loss on available for sale securities
|
(108
|
)
|
—
|
|
(108
|
)
|
||||||
|
Amortization of defined benefit plans unrecognized net gain
|
3,091
|
|
—
|
|
3,091
|
|
||||||
|
Total other comprehensive income
|
2,983
|
|
—
|
|
2,983
|
|
||||||
|
Total comprehensive income
|
$
|
140,821
|
|
$
|
42,308
|
|
$
|
183,129
|
|
|||
The following table summarizes the allocation of total comprehensive income of PBF LLC between the controlling and noncontrolling interests for the year ended
December 31, 2017
:
|
PBF LLC
|
Attributable to
PBF LLC |
Noncontrolling
Interest
|
Total
|
|||||||||
|
Net income
|
$
|
500,077
|
|
$
|
51,168
|
|
$
|
551,245
|
|
|||
|
Other comprehensive loss:
|
||||||||||||
|
Unrealized loss on available for sale securities
|
(24
|
)
|
—
|
|
(24
|
)
|
||||||
|
Amortization of defined benefit plans unrecognized net loss
|
(950
|
)
|
—
|
|
(950
|
)
|
||||||
|
Total other comprehensive loss
|
(974
|
)
|
—
|
|
(974
|
)
|
||||||
|
Total comprehensive income
|
$
|
499,103
|
|
$
|
51,168
|
|
$
|
550,271
|
|
|||
The following table summarizes the allocation of total comprehensive income of PBF LLC between the controlling and noncontrolling interests for the year ended
December 31, 2016
:
|
PBF LLC
|
Attributable to
PBF LLC |
Noncontrolling
Interest
|
Total
|
|||||||||
|
Net income
|
$
|
280,888
|
|
$
|
40,109
|
|
$
|
320,997
|
|
|||
|
Other comprehensive loss:
|
||||||||||||
|
Unrealized loss on available for sale securities
|
(42
|
)
|
—
|
|
(42
|
)
|
||||||
|
Amortization of defined benefit plans unrecognized net loss
|
(2,550
|
)
|
—
|
|
(2,550
|
)
|
||||||
|
Total other comprehensive loss
|
(2,592
|
)
|
—
|
|
(2,592
|
)
|
||||||
|
Total comprehensive income
|
$
|
278,296
|
|
$
|
40,109
|
|
$
|
318,405
|
|
|||
F- 62
PBF ENERGY INC. AND PBF ENERGY COMPANY LLC
NOTES TO CONSOLIDATED FINANCIAL STATEMENTS
(IN THOUSANDS, EXCEPT SHARE, UNIT, PER SHARE, PER UNIT AND BARREL DATA)
16. STOCK-BASED COMPENSATION
Stock-based compensation expense included in general and administrative expenses consisted of the following:
|
|
Years Ended December 31,
|
|||||||||||
|
|
2018
|
2017
|
2016
|
|||||||||
|
PBF Energy options
|
$
|
11,545
|
|
$
|
9,369
|
|
$
|
11,020
|
|
|||
|
PBF Energy restricted shares
|
7,460
|
|
12,134
|
|
7,276
|
|
||||||
|
PBF Energy performance awards
|
1,207
|
|
—
|
|
—
|
|
||||||
|
PBFX phantom units
|
5,757
|
|
5,345
|
|
4,360
|
|
||||||
|
$
|
25,969
|
|
$
|
26,848
|
|
$
|
22,656
|
|
||||
PBF LLC Series A warrants and options
PBF LLC granted compensatory warrants to employees of the Company in connection with their purchase of Series A units in PBF LLC. The warrants grant the holder the right to purchase PBF LLC Series A Units. One-quarter of the PBF LLC Series A compensatory warrants were exercisable at the date of grant and the remaining three-quarters become exercisable over equal annual installments on each of the first
three
anniversaries of the grant date subject to acceleration in certain circumstances. They are exercisable for
ten years
from the date of grant. The remaining warrants became fully exercisable in connection with the IPO of PBF Energy.
In addition, options to purchase PBF LLC Series A units were granted to certain employees, management and directors. Options vest over equal annual installments on each of the first three anniversaries of the grant date subject to acceleration in certain circumstances. The options are exercisable for
ten years
from the date of grant.
The Company did not issue PBF LLC Series A Unit compensatory warrants or options in
2018
,
2017
or
2016
.
The following table summarizes activity for PBF LLC Series A compensatory warrants and options for the years ended
December 31, 2018
,
2017
and
2016
:
|
Number of
PBF LLC
Series A
Compensatory
Warrants
and Options
|
Weighted
Average
Exercise Price
|
Weighted
Average
Remaining
Contractual
Life
(in years)
|
||||||||
|
Stock Based Compensation, Outstanding at January 1, 2016
|
640,779
|
|
$
|
10.59
|
|
5.46
|
|
|||
|
Exercised
|
(27,833
|
)
|
10.00
|
|
—
|
|
||||
|
Forfeited
|
—
|
|
—
|
|
—
|
|
||||
|
Outstanding at December 31, 2016
|
612,946
|
|
$
|
10.62
|
|
4.47
|
|
|||
|
Exercised
|
(126,634
|
)
|
10.17
|
|
—
|
|
||||
|
Forfeited
|
—
|
|
—
|
|
—
|
|
||||
|
Outstanding at December 31, 2017
|
486,312
|
|
$
|
10.73
|
|
3.52
|
|
|||
|
Exercised
|
(243,700
|
)
|
10.62
|
|
—
|
|
||||
|
Forfeited
|
—
|
|
—
|
|
—
|
|
||||
|
Outstanding at December 31, 2018
|
242,612
|
|
$
|
10.85
|
|
2.64
|
|
|||
|
Exercisable and vested at December 31, 2018
|
242,612
|
|
$
|
10.85
|
|
2.64
|
|
|||
|
Exercisable and vested at December 31, 2017
|
486,312
|
|
$
|
10.73
|
|
3.52
|
|
|||
|
Exercisable and vested at December 31, 2016
|
612,946
|
|
$
|
10.62
|
|
4.47
|
|
|||
|
Expected to vest at December 31, 2018
|
242,612
|
|
$
|
10.85
|
|
2.64
|
|
|||
F- 63
PBF ENERGY INC. AND PBF ENERGY COMPANY LLC
NOTES TO CONSOLIDATED FINANCIAL STATEMENTS
(IN THOUSANDS, EXCEPT SHARE, UNIT, PER SHARE, PER UNIT AND BARREL DATA)
The total intrinsic value of stock options both outstanding and exercisable at
December 31, 2018
and
December 31, 2017
was
$5,290
and
$12,016
, respectively. The total intrinsic value of stock options exercised during the years ended
December 31, 2018
,
2017
, and
2016
was
$7,487
,
$2,301
, and
$461
, respectively.
There was
no
unrecognized compensation expense related to PBF LLC Series A warrants and options at
December 31, 2018
or
2017
.
Prior to 2014, members of management of the Company had also purchased non-compensatory Series A warrants in PBF LLC with an exercise price of
$10.00
per unit, all of which were immediately exercisable. During the year ended
December 31, 2018
,
19,400
non-compensatory warrants were exercised. There were
no
non-compensatory warrants exercised during
December 31, 2017
. At
December 31, 2018
and
2017
, there were
13,319
and
32,719
non-compensatory warrants outstanding, respectively.
PBF LLC Series B Units
PBF LLC Series B Units were issued and allocated to certain members of management during the years ended December 31, 2011 and 2010. One-quarter of the PBF LLC Series B Units vested at the time of grant and the remaining three-quarters vested in equal annual installments on each of the first
three
anniversaries of the grant date, subject to accelerated vesting upon certain events. The Series B Units fully vested during the year ended December 31, 2013. There was no activity related to the Series B units for the years ended
December 31, 2018
,
2017
or
2016
.
PBF Energy options and restricted stock
The Company grants awards of PBF Energy Class A common stock under its equity incentive plans which authorize the granting of various stock and stock-related awards to directors, employees, prospective employees and non-employees. Awards include options to purchase shares of PBF Energy Class A common stock and restricted PBF Energy Class A common stock that vest over a period determined by the plans.
The PBF Energy options and restricted PBF Energy Class A common stock vest in equal annual installments on each of the first
four
anniversaries of the grant date subject to acceleration in certain circumstances. The options are exercisable for
ten years
from the date of grant.
The following table summarizes activity for PBF Energy restricted stock for the years ended
December 31, 2018
,
2017
and
2016
.
|
Number of
PBF Energy Restricted Class A Common Stock |
Weighted Average
Grant Date
Fair Value
|
||||||
|
Nonvested at January 1, 2016
|
294,880
|
|
$
|
30.87
|
|
||
|
Granted
|
360,820
|
|
22.44
|
|
|||
|
Vested
|
(134,331
|
)
|
31.43
|
|
|||
|
Forfeited
|
—
|
|
—
|
|
|||
|
Nonvested at December 31, 2016
|
521,369
|
|
$
|
24.89
|
|
||
|
Granted
|
762,425
|
|
25.86
|
|
|||
|
Vested
|
(172,978
|
)
|
24.99
|
|
|||
|
Forfeited
|
(15,100
|
)
|
24.18
|
|
|||
|
Nonvested at December 31, 2017
|
1,095,716
|
|
$
|
25.56
|
|
||
|
Granted
|
58,830
|
|
47.24
|
|
|||
|
Vested
|
(345,073
|
)
|
26.13
|
|
|||
|
Forfeited
|
(15,519
|
)
|
24.18
|
|
|||
|
Nonvested at December 31, 2018
|
793,954
|
|
$
|
26.88
|
|
||
F- 64
PBF ENERGY INC. AND PBF ENERGY COMPANY LLC
NOTES TO CONSOLIDATED FINANCIAL STATEMENTS
(IN THOUSANDS, EXCEPT SHARE, UNIT, PER SHARE, PER UNIT AND BARREL DATA)
Unrecognized compensation expense related to PBF Energy Restricted Class A Common Stock at
December 31, 2018
was $10,280, which will be recognized from 2019 through 2022.
The estimated fair value of PBF Energy options granted during the years ended December 31,
2018
,
2017
and
2016
was determined using the Black-Scholes pricing model with the following weighted average assumptions:
|
December 31, 2018
|
December 31, 2017
|
December 31, 2016
|
||||||||||
|
Expected life (in years)
|
6.25
|
|
6.25
|
|
6.25
|
|
||||||
|
Expected volatility
|
35.8
|
%
|
39.5
|
%
|
39.7
|
%
|
||||||
|
Dividend yield
|
3.49
|
%
|
4.58
|
%
|
4.73
|
%
|
||||||
|
Risk-free rate of return
|
2.82
|
%
|
2.09
|
%
|
1.42
|
%
|
||||||
|
Exercise price
|
$
|
35.25
|
|
$
|
26.52
|
|
$
|
26.18
|
|
|||
The following table summarizes activity for PBF Energy options for the years ended
December 31, 2018
,
2017
and
2016
.
|
Number of
PBF Energy Class A Common Stock Options |
Weighted
Average Exercise Price |
Weighted
Average Remaining Contractual Life (in years) |
||||||||
|
Stock-based awards, outstanding at January 1, 2016
|
4,256,375
|
|
$
|
27.89
|
|
8.32
|
|
|||
|
Granted
|
1,792,000
|
|
26.18
|
|
10.00
|
|
||||
|
Exercised
|
(11,250
|
)
|
25.86
|
|
—
|
|
||||
|
Forfeited
|
(66,500
|
)
|
28.74
|
|
—
|
|
||||
|
Outstanding at December 31, 2016
|
5,970,625
|
|
$
|
27.37
|
|
8.02
|
|
|||
|
Granted
|
1,638,075
|
|
26.52
|
|
10.00
|
|
||||
|
Exercised
|
(462,500
|
)
|
25.65
|
|
—
|
|
||||
|
Forfeited
|
(263,425
|
)
|
27.71
|
|
—
|
|
||||
|
Outstanding at December 31, 2017
|
6,882,775
|
|
$
|
27.27
|
|
7.82
|
|
|||
|
Granted
|
2,500,742
|
|
35.25
|
|
10.00
|
|
||||
|
Exercised
|
(884,878
|
)
|
27.57
|
|
—
|
|
||||
|
Forfeited
|
(141,981
|
)
|
33.49
|
|
—
|
|
||||
|
Outstanding at December 31, 2018
|
8,356,658
|
|
$
|
29.60
|
|
7.48
|
|
|||
|
Exercisable and vested at December 31, 2018
|
3,531,066
|
|
$
|
27.39
|
|
6.27
|
|
|||
|
Exercisable and vested at December 31, 2017
|
2,958,875
|
|
$
|
27.58
|
|
6.77
|
|
|||
|
Exercisable and vested at December 31, 2016
|
2,271,375
|
|
$
|
27.23
|
|
7.21
|
|
|||
|
Expected to vest at December 31, 2018
|
8,356,658
|
|
$
|
29.60
|
|
7.48
|
|
|||
The total estimated fair value of PBF Energy options granted in
2018
and
2017
was
$23,892
and
$10,913
and the weighted average per unit fair value was
$9.55
and
$6.66
. The total intrinsic value of stock options outstanding and exercisable at
December 31, 2018
, was
36,523
and
19,355
, respectively. The total intrinsic value of stock options outstanding and exercisable at
December 31, 2017
, was
$56,656
and
$23,665
, respectively. The total intrinsic value of stock options exercised during the years ended
December 31, 2018
and
2017
was
$12,445
and
$2,365
, respectively.
Unrecognized compensation expense related to PBF Energy options at
December 31, 2018
was
$33,162
, which will be recognized from 2019 through 2022.
F- 65
PBF ENERGY INC. AND PBF ENERGY COMPANY LLC
NOTES TO CONSOLIDATED FINANCIAL STATEMENTS
(IN THOUSANDS, EXCEPT SHARE, UNIT, PER SHARE, PER UNIT AND BARREL DATA)
PBF Energy Performance Awards
Performance Share Awards
In October 2018, the Company granted
179,072
performance share awards, with a weighted average grant date fair value of
$50.23
, to certain officers of the Company which have a
three
-year performance period from January 1, 2018 through December 31, 2020 (“Performance Cycle”). The payout for the performance share units is based on the relative ranking of the TSR of PBF Energy’s common stock as compared to the TSR of a selected group of industry peer companies over an average of four measurement periods. The performance share units will vest on December 31, 2020, subject to forfeiture or acceleration under certain circumstances set forth in the award agreement.
The performance share awards are issued under PBF Energy’s 2017 equity compensation plan and are settled in PBF Energy’s common stock at the end of the performance cycle. The number of shares distributed will range from zero to 200 percent of the number of performance share units granted based on the Company’s achievement of prescribed TSR rankings relative to its peers during the applicable performance measurement periods in the Performance Cycle plus additional shares of Common Stock may be awarded at vesting with respect to the computed value of dividend equivalents accrued during such performance measurement. The performance share awards are accounted for as equity awards, for which the fair value was determined on the grant date by application of a Monte Carlo simulation model. For the year ended
December 31, 2018
there have been
no
forfeitures of performance share awards.
The performance share awards grant date fair value was calculated using a Monte Carlo valuation model with the following assumptions:
|
Risk-free interest rate
|
2.89
|
%
|
|
|
Dividend yield
|
2.95
|
%
|
|
|
Expected volatility
|
39.04
|
%
|
|
The risk-free interest rate for the remaining performance period as of the grant date is based on a linear interpolation of published yields of traded U.S. Treasury Interest-Only STRIP Bonds. The dividend yield assumption is based on the annualized most recent quarterly dividend divided by the stock price on the grant date. The assumption for the expected volatility of the Company’s stock price reflects the average of PBF Energy’s common stock historical and implied volatility.
As of
December 31, 2018
, unrecognized compensation cost related to performance share unit awards was
$8,303
, which is expected to be recognized over a weighted average period of two years.
Performance Unit awards
In October 2018, the Company granted
7,279,188
performance unit awards, with a fair value of
$0.92
at December 31, 2018, to certain officers of the Company. The Performance Cycle and payout methodology for the performance unit awards is consistent with that of the performance share units. The performance units will vest on December 31, 2020, subject to forfeiture or acceleration under certain circumstances set forth in the award agreement.
F- 66
PBF ENERGY INC. AND PBF ENERGY COMPANY LLC
NOTES TO CONSOLIDATED FINANCIAL STATEMENTS
(IN THOUSANDS, EXCEPT SHARE, UNIT, PER SHARE, PER UNIT AND BARREL DATA)
The performance unit awards are dollar denominated with a target value of
$1.00
, with actual payout of up to
$2.00
per unit (or
200
percent of target). The performance unit awards are settled in cash based on the payout amount determined at the end of the performance cycle. The Company accounts for the performance unit awards as liability awards which the Company recorded at fair market value on the date of grant. Subsequently, the performance unit awards will be marked-to-market at the end of each fiscal quarter by application of a Monte Carlo simulation model. For the year ended
December 31, 2018
there have been
no
forfeitures of performance unit awards.
As of
December 31, 2018
, unrecognized compensation cost related to performance unit awards was
$6,182
, which is expected to be recognized over a weighted average period of
two
years.
PBFX Phantom Units
PBF GP’s board of directors adopted the PBF Logistics LP 2014 Long-Term Incentive Plan (the “PBFX LTIP”) in connection with the completion of the PBFX Offering. The PBFX LTIP is for the benefit of employees, consultants, service providers and non-employee directors of the general partner and its affiliates.
In the years ended
December 31, 2018
,
2017
and
2016
, PBFX issued phantom unit awards under the PBFX LTIP to certain directors, officers and employees of our general partner or its affiliates as compensation. The fair value of each phantom unit on the grant date is equal to the market price of PBFX’s common unit on that date. The estimated fair value of PBFX’s phantom units is amortized over the vesting period of
four years
, using the straight-line method. Total unrecognized compensation cost related to PBFX’s nonvested phantom units totaled
$7,032
and
$6,662
as of
December 31, 2018
and
2017
, respectively, which is expected to be recognized over a weighted-average period of
four years
. The fair value of nonvested service phantom units outstanding as of
December 31, 2018
and
2017
, totaled
$14,714
and
$13,845
, respectively.
A summary of PBFX’s unit award activity for the years ended
December 31, 2018
,
2017
and
2016
is set forth below:
|
Number of Phantom Units
|
Weighted Average
Grant Date
Fair Value
|
||||||
|
Nonvested at January 1, 2016
|
403,375
|
|
$
|
25.06
|
|
||
|
Granted
|
284,854
|
|
19.95
|
|
|||
|
Vested
|
(116,349
|
)
|
25.24
|
|
|||
|
Forfeited
|
(7,000
|
)
|
23.20
|
|
|||
|
Nonvested at December 31, 2016
|
564,880
|
|
$
|
22.47
|
|
||
|
Granted
|
319,940
|
|
20.97
|
|
|||
|
Vested
|
(217,171
|
)
|
23.15
|
|
|||
|
Forfeited
|
(24,875
|
)
|
21.23
|
|
|||
|
Nonvested at December 31, 2017
|
642,774
|
|
$
|
21.54
|
|
||
|
Granted
|
328,052
|
|
19.95
|
|
|||
|
Vested
|
(233,993
|
)
|
22.71
|
|
|||
|
Forfeited
|
(20,125
|
)
|
18.81
|
|
|||
|
Nonvested at December 31, 2018
|
716,708
|
|
$
|
20.53
|
|
||
The PBFX LTIP provides for the issuance of distribution equivalent rights (“DERs”) in connection with phantom unit awards. A DER entitles the participant, upon vesting of the related phantom units, to a mandatory cash payments equal to the product of the number of vested phantom unit awards and the cash distribution per common unit paid by PBFX to its common unitholders. Cash payments made in connection with DERs are charged to partners’ equity, accrued and paid upon vesting.
F- 67
PBF ENERGY INC. AND PBF ENERGY COMPANY LLC
NOTES TO CONSOLIDATED FINANCIAL STATEMENTS
(IN THOUSANDS, EXCEPT SHARE, UNIT, PER SHARE, PER UNIT AND BARREL DATA)
17. EMPLOYEE BENEFIT PLANS
Defined Contribution Plan
The Company’s defined contribution plan covers all employees. Employees are eligible to participate as of the first day of the month following
30 days
of service. Participants can make basic contributions up to
50 percent
of their annual salary subject to Internal Revenue Service limits. The Company matches participants’ contributions at the rate of
200 percent
of the first
3 percent
of each participant’s total basic contribution based on the participant’s total annual salary. The Company’s contribution to the qualified defined contribution plans was
$26,310
,
$23,321
and
$19,746
for the years ended December 31,
2018
,
2017
and
2016
, respectively.
Defined Benefit and Post-Retirement Medical Plans
The Company sponsors a noncontributory defined benefit pension plan (the “Qualified Plan”) with a policy to fund pension liabilities in accordance with the limits imposed by the Employee Retirement Income Security Act of 1974 (“ERISA”) and Federal income tax laws. In addition, the Company sponsors a supplemental pension plan covering certain employees, which provides incremental payments that would have been payable from the Company’s principal pension plan, were it not for limitations imposed by income tax regulations (the “Supplemental Plan”). The funded status is measured as the difference between plan assets at fair value and the projected benefit obligation which is to be recognized in the consolidated balance sheet. The plan assets and benefit obligations are measured as of the consolidated balance sheet date.
The non-union Delaware City employees and all Paulsboro, Toledo, Chalmette and Torrance employees became eligible to participate in the Company’s defined benefit plans as of the respective acquisition dates. The union Delaware City employees became eligible to participate in the Company’s defined benefit plans upon commencement of normal operations. The Company did not assume any of the employees’ pension liability accrued prior to the respective acquisitions.
The Company formed the Post-Retirement Medical Plan on December 31, 2010 to provide health care coverage continuation from date of retirement to age
65
for qualifying employees associated with the Paulsboro acquisition. The Company credited the qualifying employees with their prior service under Valero which resulted in the recognition of a liability for the projected benefit obligation. The Post-Retirement Medical Plan was amended during 2013 to include all corporate employees, amended in 2014 to include Delaware City and Toledo employees, amended in 2015 to include Chalmette employees and amended in 2016 to include Torrance employees.
F- 68
PBF ENERGY INC. AND PBF ENERGY COMPANY LLC
NOTES TO CONSOLIDATED FINANCIAL STATEMENTS
(IN THOUSANDS, EXCEPT SHARE, UNIT, PER SHARE, PER UNIT AND BARREL DATA)
The changes in the benefit obligation, the changes in fair value of plan assets, and the funded status of the Company’s Pension and Post-Retirement Medical Plans as of and for the years ended
December 31, 2018
and
2017
were as follows:
|
|
Pension Plans
|
Post-Retirement
Medical Plan
|
||||||||||||||
|
|
2018
|
2017
|
2018
|
2017
|
||||||||||||
|
Change in benefit obligation:
|
||||||||||||||||
|
Benefit obligation at beginning of year
|
$
|
185,231
|
|
$
|
135,508
|
|
$
|
21,527
|
|
$
|
22,740
|
|
||||
|
Service cost
|
47,344
|
|
40,572
|
|
1,148
|
|
1,263
|
|
||||||||
|
Interest cost
|
5,793
|
|
4,336
|
|
620
|
|
688
|
|
||||||||
|
Plan amendments
|
—
|
|
462
|
|
—
|
|
—
|
|
||||||||
|
Plan settlements
|
—
|
|
(4,881
|
)
|
—
|
|
—
|
|
||||||||
|
Benefit payments
|
(7,214
|
)
|
(4,034
|
)
|
(562
|
)
|
(693
|
)
|
||||||||
|
Actuarial (gain) loss
|
(12,811
|
)
|
13,268
|
|
(3,388
|
)
|
(2,471
|
)
|
||||||||
|
Projected benefit obligation at end of year
|
$
|
218,343
|
|
$
|
185,231
|
|
$
|
19,345
|
|
$
|
21,527
|
|
||||
|
Change in plan assets:
|
||||||||||||||||
|
Fair value of plan assets at beginning of year
|
$
|
121,652
|
|
$
|
75,367
|
|
$
|
—
|
|
$
|
—
|
|
||||
|
Actual return on plan assets
|
(6,148
|
)
|
14,019
|
|
—
|
|
—
|
|
||||||||
|
Benefits paid
|
(7,214
|
)
|
(4,034
|
)
|
(562
|
)
|
(693
|
)
|
||||||||
|
Plan settlements
|
—
|
|
(4,881
|
)
|
—
|
|
—
|
|
||||||||
|
Employer contributions
|
35,081
|
|
41,181
|
|
562
|
|
693
|
|
||||||||
|
Fair value of plan assets at end of year
|
$
|
143,371
|
|
$
|
121,652
|
|
$
|
—
|
|
$
|
—
|
|
||||
|
Reconciliation of funded status:
|
||||||||||||||||
|
Fair value of plan assets at end of year
|
$
|
143,371
|
|
$
|
121,652
|
|
$
|
—
|
|
$
|
—
|
|
||||
|
Less benefit obligations at end of year
|
218,343
|
|
185,231
|
|
19,345
|
|
21,527
|
|
||||||||
|
Funded status at end of year
|
$
|
(74,972
|
)
|
$
|
(63,579
|
)
|
$
|
(19,345
|
)
|
$
|
(21,527
|
)
|
||||
The accumulated benefit obligations for the Company’s Pension Plans exceed the fair value of the assets of those plans at
December 31, 2018
and
2017
. The accumulated benefit obligation for the defined benefit plans approximated
$184,531
and
$148,011
at
December 31, 2018
and
2017
, respectively.
F- 69
PBF ENERGY INC. AND PBF ENERGY COMPANY LLC
NOTES TO CONSOLIDATED FINANCIAL STATEMENTS
(IN THOUSANDS, EXCEPT SHARE, UNIT, PER SHARE, PER UNIT AND BARREL DATA)
Benefit payments, which reflect expected future services that the Company expects to pay are as follows for the years ended December 31:
|
Pension Benefits
|
Post-Retirement
Medical Plan
|
|||||||
|
2019
|
$
|
11,155
|
|
$
|
1,342
|
|
||
|
2020
|
13,039
|
|
1,605
|
|
||||
|
2021
|
16,570
|
|
1,726
|
|
||||
|
2022
|
19,991
|
|
1,761
|
|
||||
|
2023
|
19,228
|
|
1,746
|
|
||||
|
Years 2024-2028
|
136,559
|
|
9,121
|
|
||||
The Company’s funding policy for its defined benefit plans is to contribute amounts sufficient to meet legal funding requirements, plus any additional amounts that may be appropriate considering the funded status of the plans, tax consequences, the cash flow generated by the Company and other factors. The Company plans to contribute approximately
$34,000
to the Company’s Pension Plans during
2019
.
The components of net periodic benefit cost were as follows for the years ended
December 31, 2018
,
2017
and
2016
:
|
|
Pension Benefits
|
Post-Retirement
Medical Plan
|
||||||||||||||||||||||
|
|
2018
|
2017
|
2016
|
2018
|
2017
|
2016
|
||||||||||||||||||
|
Components of net periodic benefit cost:
|
||||||||||||||||||||||||
|
Service cost
|
$
|
47,344
|
|
$
|
40,572
|
|
$
|
36,359
|
|
$
|
1,148
|
|
$
|
1,263
|
|
$
|
1,047
|
|
||||||
|
Interest cost
|
5,793
|
|
4,336
|
|
3,096
|
|
620
|
|
688
|
|
528
|
|
||||||||||||
|
Expected return on plan assets
|
(8,540
|
)
|
(5,766
|
)
|
(4,681
|
)
|
—
|
|
—
|
|
—
|
|
||||||||||||
|
Settlement loss recognized
|
—
|
|
993
|
|
—
|
|
—
|
|
—
|
|
—
|
|
||||||||||||
|
Amortization of prior service cost
|
85
|
|
53
|
|
53
|
|
646
|
|
646
|
|
541
|
|
||||||||||||
|
Amortization of actuarial loss
|
285
|
|
452
|
|
1,043
|
|
—
|
|
—
|
|
—
|
|
||||||||||||
|
Net periodic benefit cost
|
$
|
44,967
|
|
$
|
40,640
|
|
$
|
35,870
|
|
$
|
2,414
|
|
$
|
2,597
|
|
$
|
2,116
|
|
||||||
Lump sum payments made by the Supplemental Plan to employees retiring in 2018 did not exceed the Plan’s total service and interest costs expected for 2018. Lump sum payments made by the Supplemental Plan to employees retiring in 2017 exceeded the Plan’s total service and interest costs expected for 2017. Settlement losses are required to be recorded when lump sum payments exceed total service and interest costs. As a result, the 2017 pension expense included a settlement expense related to our cumulative lump sum payments made during the year ended December 31, 2017.
F- 70
PBF ENERGY INC. AND PBF ENERGY COMPANY LLC
NOTES TO CONSOLIDATED FINANCIAL STATEMENTS
(IN THOUSANDS, EXCEPT SHARE, UNIT, PER SHARE, PER UNIT AND BARREL DATA)
The pre-tax amounts recognized in other comprehensive income (loss) for the years ended
December 31, 2018
,
2017
and
2016
were as follows:
|
|
Pension Benefits
|
Post-Retirement
Medical Plan
|
||||||||||||||||||||||
|
|
2018
|
2017
|
2016
|
2018
|
2017
|
2016
|
||||||||||||||||||
|
Prior service costs
|
$
|
—
|
|
$
|
462
|
|
$
|
—
|
|
$
|
—
|
|
$
|
—
|
|
$
|
2,524
|
|
||||||
|
Net actuarial loss (gain)
|
1,877
|
|
5,015
|
|
176
|
|
(3,388
|
)
|
(2,471
|
)
|
1,487
|
|
||||||||||||
|
Amortization of losses and prior service cost
|
(826
|
)
|
(1,410
|
)
|
(1,096
|
)
|
(646
|
)
|
(646
|
)
|
(541
|
)
|
||||||||||||
|
Total changes in other comprehensive income (loss)
|
$
|
1,051
|
|
$
|
4,067
|
|
$
|
(920
|
)
|
$
|
(4,034
|
)
|
$
|
(3,117
|
)
|
$
|
3,470
|
|
||||||
The pre-tax amounts in accumulated other comprehensive income (loss) as of
December 31, 2018
, and
2017
that have not yet been recognized as components of net periodic costs were as follows:
|
Pension Benefits
|
Post-Retirement
Medical Plan
|
|||||||||||||||
|
2018
|
2017
|
2018
|
2017
|
|||||||||||||
|
Prior service costs
|
$
|
(799
|
)
|
$
|
(885
|
)
|
$
|
(4,691
|
)
|
$
|
(5,337
|
)
|
||||
|
Net actuarial (loss) gain
|
(24,136
|
)
|
(22,544
|
)
|
3,981
|
|
593
|
|
||||||||
|
Total
|
$
|
(24,935
|
)
|
$
|
(23,429
|
)
|
$
|
(710
|
)
|
$
|
(4,744
|
)
|
||||
The following pre-tax amounts included in accumulated other comprehensive income (loss) as of
December 31, 2018
are expected to be recognized as components of net periodic benefit cost during the year ended December 31,
2019
:
|
Pension Benefits
|
Post-Retirement
Medical Plan
|
|||||||
|
Amortization of prior service costs
|
$
|
(86
|
)
|
$
|
(646
|
)
|
||
|
Amortization of net actuarial (loss) gain
|
(180
|
)
|
135
|
|
||||
|
Total
|
$
|
(266
|
)
|
$
|
(511
|
)
|
||
The weighted average assumptions used to determine the benefit obligations as of
December 31, 2018
, and
2017
were as follows:
|
|
Qualified Plan
|
Supplemental Plan
|
Post-Retirement Medical Plan
|
|||||||||||||||
|
|
2018
|
2017
|
2018
|
2017
|
2018
|
2017
|
||||||||||||
|
Discount rate - benefit obligations
|
4.22
|
%
|
3.58
|
%
|
4.17
|
%
|
3.55
|
%
|
3.99
|
%
|
3.33
|
%
|
||||||
|
Rate of compensation increase
|
4.55
|
%
|
4.53
|
%
|
5.00
|
%
|
5.00
|
%
|
—
|
|
—
|
|
||||||
F- 71
PBF ENERGY INC. AND PBF ENERGY COMPANY LLC
NOTES TO CONSOLIDATED FINANCIAL STATEMENTS
(IN THOUSANDS, EXCEPT SHARE, UNIT, PER SHARE, PER UNIT AND BARREL DATA)
The weighted average assumptions used to determine the net periodic benefit costs for the years ended
December 31, 2018
,
2017
and
2016
were as follows:
|
Qualified Plan
|
Supplemental Plan
|
Post-Retirement Medical Plan
|
||||||||||||||||
|
2018
|
2017
|
2016
|
2018
|
2017
|
2016
|
2018
|
2017
|
2016
|
||||||||||
|
Discount rates:
|
||||||||||||||||||
|
Effective rate for service cost
|
3.62%
|
4.15%
|
4.15%
|
3.58%
|
4.17%
|
4.17%
|
3.59%
|
4.10%
|
4.10%
|
|||||||||
|
Effective rate for interest cost
|
3.21%
|
3.38%
|
3.38%
|
3.15%
|
3.20%
|
3.20%
|
2.97%
|
3.11%
|
3.11%
|
|||||||||
|
Effective rate for interest on service cost
|
3.32%
|
3.59%
|
3.59%
|
3.24%
|
3.63%
|
3.63%
|
3.46%
|
3.84%
|
3.84%
|
|||||||||
|
Expected long-term rate of return on plan assets
|
6.25%
|
6.50%
|
7.00%
|
N/A
|
N/A
|
N/A
|
N/A
|
N/A
|
N/A
|
|||||||||
|
Rate of compensation increase
|
4.53%
|
4.81%
|
4.81%
|
5.00%
|
5.50%
|
5.50%
|
N/A
|
N/A
|
N/A
|
|||||||||
The assumed health care cost trend rates as of
December 31, 2018
and
2017
were as follows:
|
|
Post-Retirement
Medical Plan
|
|||||
|
|
2018
|
2017
|
||||
|
Health care cost trend rate assumed for next year
|
5.8
|
%
|
6.0
|
%
|
||
|
Rate to which the cost trend rate was assumed to decline (the ultimate trend rate)
|
4.5
|
%
|
4.5
|
%
|
||
|
Year that the rate reaches the ultimate trend rate
|
2038
|
|
2038
|
|
||
Assumed health care cost trend rates have a significant effect on the amounts reported for retiree health care plans. A one percentage-point change in assumed health care cost trend rates would have the following effects on the medical post-retirement benefits:
|
1%
Increase
|
1%
Decrease
|
|||||||
|
Effect on total service and interest cost components
|
$
|
11
|
|
$
|
(10
|
)
|
||
|
Effect on accumulated post-retirement benefit obligation
|
237
|
|
(226
|
)
|
||||
F- 72
PBF ENERGY INC. AND PBF ENERGY COMPANY LLC
NOTES TO CONSOLIDATED FINANCIAL STATEMENTS
(IN THOUSANDS, EXCEPT SHARE, UNIT, PER SHARE, PER UNIT AND BARREL DATA)
The table below presents the fair values of the assets of the Company’s Qualified Plan as of
December 31, 2018
and
2017
by level of fair value hierarchy. Assets categorized in Level 2 of the hierarchy consist of collective trusts and are measured at fair value based on the closing net asset value (“NAV”) as determined by the fund manager and reported daily. As noted above, the Company’s post-retirement medical plan is funded on a pay-as-you-go basis and has no assets.
|
|
Fair Value Measurements Using
NAV as Practical Expedient
(Level 2)
|
|||||||
|
|
December 31,
|
|||||||
|
|
2018
|
2017
|
||||||
|
Equities:
|
||||||||
|
Domestic equities
|
$
|
34,800
|
|
$
|
36,582
|
|
||
|
Developed international equities
|
19,201
|
|
17,236
|
|
||||
|
Emerging market equities
|
10,263
|
|
8,474
|
|
||||
|
Global low volatility equities
|
11,437
|
|
9,983
|
|
||||
|
Fixed-income
|
59,680
|
|
45,469
|
|
||||
|
Real Estate
|
7,905
|
|
—
|
|
||||
|
Cash and cash equivalents
|
85
|
|
3,908
|
|
||||
|
Total
|
$
|
143,371
|
|
$
|
121,652
|
|
||
The Company’s investment strategy for its Qualified Plan is to achieve a reasonable return on assets that supports the plan’s interest credit rating, subject to a moderate level of portfolio risk that provides liquidity. Consistent with these financial objectives as of
December 31, 2018
, the plan’s target allocations for plan assets are
54%
invested in equity securities,
40%
fixed income investments and
6%
in real estate. Equity securities include international stocks and a blend of U.S. growth and value stocks of various sizes of capitalization. Fixed income securities include bonds and notes issued by the U.S. government and its agencies, corporate bonds, and mortgage-backed securities. The aggregate asset allocation is reviewed on an annual basis.
The overall expected long-term rate of return on plan assets for the Qualified Plan is based on the Company’s view of long-term expectations and asset mix.
F- 73
PBF ENERGY INC. AND PBF ENERGY COMPANY LLC
NOTES TO CONSOLIDATED FINANCIAL STATEMENTS
(IN THOUSANDS, EXCEPT SHARE, UNIT, PER SHARE, PER UNIT AND BARREL DATA)
18. REVENUES
Adoption of ASC 606, “Revenue from Contracts with Customers”
Prior to January 1, 2018, the Company recognized revenue from customers when all of the following criteria were met: (i) persuasive evidence of an exchange arrangement existed, (ii) delivery had occurred or services had been rendered, (iii) the buyer’s price was fixed or determinable and (iv) collectability was reasonably assured. Amounts billed in advance of the period in which the service was rendered or product delivered were recorded as deferred revenue.
Effective January 1, 2018, the Company adopted ASC 606. As a result, the Company has changed its accounting policy for the recognition of revenue from contracts with customers as detailed below.
The Company adopted ASC 606 using the modified retrospective method, which has been applied for the
year ended December 31, 2018
. The Company has applied ASC 606 only to those contracts that were not complete as of January 1, 2018. As such, the financial information for prior periods has not been adjusted and continues to be reported under ASC 605. The Company did not record a cumulative effect adjustment upon initially applying ASC 606 as there was not a significant impact upon adoption; however, the details of significant qualitative and quantitative disclosure changes upon implementing ASC 606 are detailed below.
Revenue Recognition
Revenues are recognized when control of the promised goods or services is transferred to our customers, in an amount that reflects the consideration we expect to be entitled to in exchange for those goods or services.
As described in “Note 20 - Segment Information”, the Company’s business consists of the Refining Segment and Logistics Segment. The following table provides information relating to the Company’s revenues for each product or group of similar products or services by segment for the periods presented.
|
Year Ended December 31,
|
||||||||||||
|
2018
|
2017
|
2016
|
||||||||||
|
Refining Segment:
|
||||||||||||
|
Gasoline and distillates
|
$
|
23,032,567
|
|
$
|
18,316,079
|
|
$
|
14,017,350
|
|
|||
|
Feedstocks and other
|
1,372,343
|
|
1,215,693
|
|
374,800
|
|
||||||
|
Asphalt and blackoils
|
1,592,936
|
|
1,162,339
|
|
699,966
|
|
||||||
|
Chemicals
|
842,768
|
|
770,491
|
|
554,392
|
|
||||||
|
Lubricants
|
321,465
|
|
305,101
|
|
260,358
|
|
||||||
|
Total Revenues
|
$
|
27,162,079
|
|
$
|
21,769,703
|
|
$
|
15,906,866
|
|
|||
|
Logistics Segment:
|
||||||||||||
|
Logistics
|
283,440
|
|
257,588
|
|
189,006
|
|
||||||
|
Total revenue prior to eliminations
|
$
|
27,445,519
|
|
$
|
22,027,291
|
|
$
|
16,095,872
|
|
|||
|
Elimination of intercompany revenue
|
(259,426
|
)
|
(240,654
|
)
|
(175,448
|
)
|
||||||
|
Total Revenues
|
$
|
27,186,093
|
|
$
|
21,786,637
|
|
$
|
15,920,424
|
|
|||
The majority of the Company’s revenues are generated from the sale of refined petroleum products reported in the Refining segment. These revenues are largely based on the current spot (market) prices of the products sold, which represent consideration specifically allocable to the products being sold on a given day, and the Company recognizes those revenues upon delivery and transfer of title to the products to our customers. The time at which delivery and transfer of title occurs is the point when the Company’s control of the products is transferred to the Company’s customers and when its performance obligation to its customers is fulfilled. Delivery and transfer of title are specifically agreed to between the Company and customers within the contracts. The Refining segment also has contracts which contain fixed pricing, tiered pricing, minimum volume features with makeup periods, or other factors that have not materially been affected by ASC 606.
F- 74
PBF ENERGY INC. AND PBF ENERGY COMPANY LLC
NOTES TO CONSOLIDATED FINANCIAL STATEMENTS
(IN THOUSANDS, EXCEPT SHARE, UNIT, PER SHARE, PER UNIT AND BARREL DATA)
Logistics segment revenue is generated by charging fees for crude oil and refined products terminaling, storing and pipeline services based on the greater of contractual minimum volume commitments, as applicable, or the delivery of actual volumes based on contractual rates applied to throughput or storage volumes. A majority of the Company’s logistics revenues are generated between intercompany transactions and are eliminated in consolidation.
Deferred Revenues
The Company records deferred revenues when cash payments are received or are due in advance of performance, including amounts which are refundable. Deferred revenue was
$20,086
and
$8,933
as of
December 31, 2018
and
December 31, 2017
, respectively. Fluctuations in the deferred revenue balance are primarily driven by the timing and extent of cash payments received or due in advance of satisfying the Company’s performance obligations.
The Company’s payment terms vary by type and location of customers and the products offered. The period between invoicing and when payment is due is not significant (i.e. generally within two months). For certain products or services and customer types, the Company requires payment before the products or services are delivered to the customer.
Significant Judgment and Practical Expedients
For performance obligations related to sales of products, the Company has determined that customers are able to direct the use of, and obtain substantially all of the benefits from, the products at the point in time that the products are delivered. The Company has determined that the transfer of control upon delivery to the customer’s requested destination accurately depicts the transfer of goods. Upon the delivery of the products and transfer of control, the Company generally has the present right to payment and the customers bear the risks and rewards of ownership of the products. The Company has elected the practical expedient to not disclose the value of unsatisfied performance obligations for (i) contracts with an original expected length of one year or less and (ii) contracts for which the Company recognizes revenue at the amount to which it has the right to invoice for services performed.
19. INCOME TAXES
PBF Energy is required to file federal and applicable state corporate income tax returns and recognizes income taxes on its pre-tax income, which to-date has consisted primarily of its share of PBF LLC’s pre-tax income (see “Note 14 - Stockholders’ and Members’ Equity Structure”). PBF LLC is organized as a limited liability company and PBFX is an MLP, both of which are treated as “flow-through” entities for federal income tax purposes and therefore are not subject to income taxes apart from the income tax attributable to the two subsidiaries acquired in connection with the acquisition of Chalmette Refining and PBF Holding’s wholly-owned Canadian subsidiary, PBF Ltd., that are treated as C-Corporations for income tax purposes.
Tax Cuts and Jobs Act
On December 22, 2017, the U.S. government enacted comprehensive tax legislation commonly referred to as the TCJA. The TCJA makes broad and complex changes to the U.S. tax code, including, but not limited to, (1) reducing the U.S. federal corporate tax rate from 35 percent to 21 percent; (2) requiring companies to pay a one-time transition tax on certain unrepatriated earnings of foreign subsidiaries (the “Transition Tax”); (3) generally eliminating U.S. federal income taxes on dividends from foreign subsidiaries; (4) requiring a current inclusion in U.S. federal taxable income of certain earnings of controlled foreign corporations; (5) eliminating the corporate alternative minimum tax (“AMT”) and changing how existing AMT credits can be realized; (6) creating the base erosion anti-abuse tax (“BEAT”), a new minimum tax; (7) creating a new limitation on deductible interest expense; and (8) changing rules related to uses and limitations of net operating loss carryforwards created in tax years beginning after December 31, 2017.
F- 75
PBF ENERGY INC. AND PBF ENERGY COMPANY LLC
NOTES TO CONSOLIDATED FINANCIAL STATEMENTS
(IN THOUSANDS, EXCEPT SHARE, UNIT, PER SHARE, PER UNIT AND BARREL DATA)
In connection with the enactment of the TCJA, PBF Energy recorded a net tax expense of
$20,153
in the year ending December 31, 2017 as further discussed below. The other legislative areas within TCJA, such as the Transition Tax and the Global Low-Taxed Intangible Income, did not have a material impact on the provision for income taxes. Additionally, the new legislation did not have any impact on the need for a valuation allowance. Given the Company’s reversing taxable temporary differences and history of generating book income, no valuation allowances have been provided for all periods presented. The Company has completed its accounting for the impact of the TCJA and has recorded no additional material items.
The income tax provision in the PBF Energy consolidated statements of operations consists of the following:
|
|
Year Ended
December 31, 2018 |
Year Ended
December 31, 2017 |
Year Ended
December 31, 2016 |
||||||||
|
Current expense (benefit):
|
|||||||||||
|
Federal
|
$
|
766
|
|
$
|
1,534
|
|
$
|
(87,829
|
)
|
||
|
Foreign
|
—
|
|
75
|
|
—
|
|
|||||
|
State
|
—
|
|
142
|
|
(19,279
|
)
|
|||||
|
Total current
|
766
|
|
1,751
|
|
(107,108
|
)
|
|||||
|
|
|
||||||||||
|
Deferred expense (benefit):
|
|||||||||||
|
Federal
|
18,693
|
|
250,042
|
|
205,502
|
|
|||||
|
Foreign
|
7,221
|
|
(3,595
|
)
|
(8,412
|
)
|
|||||
|
State
|
6,827
|
|
67,386
|
|
47,668
|
|
|||||
|
Total deferred
|
32,741
|
|
313,833
|
|
244,758
|
|
|||||
|
Total provision for income taxes
|
$
|
33,507
|
|
$
|
315,584
|
|
$
|
137,650
|
|
||
F- 76
PBF ENERGY INC. AND PBF ENERGY COMPANY LLC
NOTES TO CONSOLIDATED FINANCIAL STATEMENTS
(IN THOUSANDS, EXCEPT SHARE, UNIT, PER SHARE, PER UNIT AND BARREL DATA)
The difference between PBF Energy’s effective income tax rate and the United States statutory rate is reconciled below:
|
Year Ended
December 31, 2018 |
Year Ended
December 31, 2017 |
Year Ended
December 31, 2016 |
||||||
|
Provision at Federal statutory rate
|
21.0
|
%
|
35.0
|
%
|
35.0
|
%
|
||
|
Increase (decrease) attributable to flow-through of certain tax adjustments:
|
||||||||
|
State income taxes (net of federal income tax)
|
5.0
|
%
|
4.6
|
%
|
4.6
|
%
|
||
|
Nondeductible/nontaxable items
|
1.0
|
%
|
0.2
|
%
|
0.1
|
%
|
||
|
Manufacturer’s benefit deduction
|
—
|
%
|
—
|
%
|
1.9
|
%
|
||
|
Rate differential from foreign jurisdictions
|
0.9
|
%
|
0.3
|
%
|
1.5
|
%
|
||
|
Provision to return adjustment
|
(4.0
|
)%
|
—
|
%
|
(0.4
|
)%
|
||
|
Adjustment to deferred tax assets and liabilities for change in tax rates
|
—
|
%
|
2.8
|
%
|
1.7
|
%
|
||
|
Stock-based compensation
|
(2.6
|
)%
|
—
|
%
|
—
|
%
|
||
|
Other
|
(0.6
|
)%
|
0.3
|
%
|
0.2
|
%
|
||
|
Effective tax rate
|
20.7
|
%
|
43.2
|
%
|
44.6
|
%
|
||
PBF Energy’s effective income tax rate for the years ended
December 31, 2018
,
2017
and
2016
, including the impact of income attributable to noncontrolling interests of
$46,976
,
$67,914
and
$54,707
, respectively, was
16.0%
,
39.5%
and
37.9%
, respectively.
For the year ended December 31, 2018, the main drivers of PBF Energy’s reduced effective tax rate related to the treatment of stock-based compensation excess tax benefits under recently adopted ASU No. 2017-09, “Compensation—Stock Compensation”, and the provision to return adjustments primarily attributable to the state business mix apportionment.
During 2017, PBF Energy made a one-time adjustment to deferred tax assets and liabilities in relation to the TCJA. The net result of the adjustment was a charge of approximately
$20,153
, or an increase to the tax rate of
2.8%
. Under GAAP, PBF Energy is required to recognize the effect of the TCJA in the period of enactment. As such, net income tax expense recorded in 2017 consisted of a net tax expense of
$193,499
associated with the remeasurement of Tax Receivable Agreement associated deferred tax assets and a net tax benefit of
$173,346
for the reduction of our deferred tax liabilities as a result of the TCJA.
For years starting before January 1, 2018, the Company’s foreign earnings are taxed at a lower income tax rate as compared to its domestic operations. Accordingly, the Company recognized an income tax expense in 2017 as its foreign entity’s operations resulted in a loss.
Adjustments to deferred tax assets and liabilities for changes in tax rates in 2016 were a result of changes in business mix, including the 2016 acquisition of the Torrance refinery and related logistics assets in California.
F- 77
PBF ENERGY INC. AND PBF ENERGY COMPANY LLC
NOTES TO CONSOLIDATED FINANCIAL STATEMENTS
(IN THOUSANDS, EXCEPT SHARE, UNIT, PER SHARE, PER UNIT AND BARREL DATA)
For financial reporting purposes, income (loss) before income taxes attributable to PBF Energy Inc. stockholders includes the following components:
|
Year Ended
December 31, 2018 |
Year Ended
December 31, 2017 |
Year Ended
December 31, 2016 |
|||||||||
|
United States
|
$
|
134,318
|
|
$
|
749,559
|
|
$
|
343,875
|
|
||
|
Foreign
|
27,504
|
|
(18,458
|
)
|
(35,414
|
)
|
|||||
|
Total income before income taxes attributable to PBF Energy Inc. stockholders
|
$
|
161,822
|
|
$
|
731,101
|
|
$
|
308,461
|
|
||
A summary of the components of PBF Energy’s deferred tax assets and deferred tax liabilities consists of the following:
|
December 31, 2018
|
December 31, 2017
|
||||||
|
Deferred tax assets
|
|||||||
|
Purchase interest step-up
|
$
|
306,231
|
|
$
|
325,405
|
|
|
|
Inventory
|
46,958
|
|
—
|
|
|||
|
Pension, employee benefits and compensation
|
55,103
|
|
40,455
|
|
|||
|
Hedging
|
3,127
|
|
24,175
|
|
|||
|
Net operating loss carry forwards
|
134,672
|
|
137,887
|
|
|||
|
Environmental liabilities
|
38,121
|
|
38,388
|
|
|||
|
Other
|
2,749
|
|
3,709
|
|
|||
|
Total deferred tax assets
|
586,961
|
|
570,019
|
|
|||
|
Valuation allowances
|
—
|
|
—
|
|
|||
|
Total deferred tax assets, net
|
586,961
|
|
570,019
|
|
|||
|
|
|||||||
|
Deferred tax liabilities
|
|||||||
|
Property, plant and equipment
|
578,826
|
|
528,336
|
|
|||
|
Inventory
|
—
|
|
21,200
|
|
|||
|
Total deferred tax liabilities
|
578,826
|
|
549,536
|
|
|||
|
Net deferred tax assets
|
$
|
8,135
|
|
$
|
20,483
|
|
|
As of December 31, 2018, PBF Energy has federal and state income tax net operating loss carry forwards of
$546,053
and
$300,956
, respectively. The federal net operating loss carry forward was generated in years prior to 2018 and expires in varying amounts through 2037. The state net operating loss carry forwards expire at various dates from 2028 through 2038. The Company has not recorded any valuation allowances against these assets, as it is deemed “more likely than not” that the deferred tax assets will be realized, based on the Company’s historical earnings, forecasted income, and the reversal of temporary differences.
F- 78
PBF ENERGY INC. AND PBF ENERGY COMPANY LLC
NOTES TO CONSOLIDATED FINANCIAL STATEMENTS
(IN THOUSANDS, EXCEPT SHARE, UNIT, PER SHARE, PER UNIT AND BARREL DATA)
The reported income tax expense (benefit) in the PBF LLC consolidated statements of operations consists of the following:
|
|
Year Ended
December 31, 2018 |
Year Ended
December 31, 2017 |
Year Ended
December 31, 2016 |
||||||||
|
Current income tax expense (benefit)
|
$
|
766
|
|
$
|
1,743
|
|
$
|
3,887
|
|
||
|
Deferred income tax (benefit) expense
|
7,233
|
|
(12,526
|
)
|
19,802
|
|
|||||
|
Total income tax expense (benefit)
|
$
|
7,999
|
|
$
|
(10,783
|
)
|
$
|
23,689
|
|
||
During the preparation of the financial statements for the first quarter of 2016, management determined that the deferred income tax liabilities for PBF Ltd. were understated for prior periods. For the three months ended March 31, 2016, the Company incurred
$30,602
of deferred tax expense and
$121
of current tax expense relating to a correction of prior periods.
Income tax years that remain subject to examination by material jurisdictions, where an examination has not already concluded are all years including and subsequent to:
|
United States
|
|
|
Federal
|
2015
|
|
New Jersey
|
2013
|
|
Michigan
|
2014
|
|
Delaware
|
2015
|
|
Indiana
|
2015
|
|
Pennsylvania
|
2015
|
|
New York
|
2015
|
|
Louisiana
|
2015
|
|
California
|
2016
|
The Company does not have any unrecognized tax benefits.
F- 79
PBF ENERGY INC. AND PBF ENERGY COMPANY LLC
NOTES TO CONSOLIDATED FINANCIAL STATEMENTS
(IN THOUSANDS, EXCEPT SHARE, UNIT, PER SHARE, PER UNIT AND BARREL DATA)
20. SEGMENT INFORMATION
The Company’s operations are organized into
two
reportable segments, Refining and Logistics. Operations that are not included in the Refining and Logistics segments are included in Corporate. Intersegment transactions are eliminated in the consolidated financial statements and are included in Eliminations.
Refining
The Company’s Refining segment includes the operations of its five refineries, including certain related logistics assets that are not owned by PBFX. The Company’s refineries are located in Delaware City, Delaware, Paulsboro, New Jersey, Toledo, Ohio, New Orleans, Louisiana and Torrance, California. The refineries produce unbranded transportation fuels, heating oil, petrochemical feedstocks, lubricants and other petroleum products in the United States. The Company purchases crude oil, other feedstocks and blending components from various third-party suppliers. The Company sells products throughout the Northeast, Midwest, Gulf Coast and West Coast of the United States, as well as in other regions of the United States and Canada, and is able to ship products to other international destinations.
Logistics
The Company’s Logistics segment is comprised of PBFX, a publicly-traded MLP, formed to own or lease, operate, develop and acquire crude oil and refined petroleum products terminals, pipelines, storage facilities and similar logistics assets. PBFX’s assets primarily consist of rail and truck terminals and unloading racks, tank farms and pipelines that were acquired from or contributed by PBF LLC and are located at, or nearby, the Company’s refineries. PBFX provides various rail, truck and marine terminaling services, pipeline transportation services and storage services to PBF Holding and/or its subsidiaries and third-party customers through fee-based commercial agreements. PBFX currently does not generate significant third-party revenue and intersegment related-party revenues are eliminated in consolidation. From a PBF Energy and PBF LLC perspective, the Company’s chief operating decision maker evaluates the Logistics segment as a whole without regard to any of PBFX’s individual operating segments.
The Company evaluates the performance of its segments based primarily on income from operations. Income from operations includes those revenues and expenses that are directly attributable to management of the respective segment. The Logistics segment’s revenues include intersegment transactions with the Company’s Refining segment at prices the Company believes are substantially equivalent to the prices that could have been negotiated with unaffiliated parties with respect to similar services. Activities of the Company’s business that are not included in the
two
operating segments are included in Corporate. Such activities consist primarily of corporate staff operations and other items that are not specific to the normal operations of the
two
operating segments. The Company does not allocate non-operating income and expense items, including income taxes, to the individual segments. The Refinery segment’s operating subsidiaries and PBFX are primarily pass-through entities with respect to income taxes.
Total assets of each segment consist of property, plant and equipment, inventories, cash and cash equivalents, accounts receivables and other assets directly associated with the segment’s operations. Corporate assets consist primarily of deferred tax assets, property, plant and equipment and other assets not directly related to the Company’s refinery and logistic operations.
Disclosures regarding the Company’s reportable segments with reconciliations to consolidated totals for the years ended
December 31, 2018
,
2017
and
2016
are presented below. In connection with the contribution by PBF LLC of the limited liability interests of the Development Assets to PBFX, the accompanying segment information has been retrospectively adjusted to include the historical results of the Development Assets in the Logistics segment for all periods presented prior to such contribution. Additionally, in connection with the adoption of ASU 2017-07, the accompanying segment information has been retrospectively adjusted for all periods presented, to reflect the reclassification of certain net periodic benefit costs from Operating expenses and General and administrative expenses to Other income (expense).
F- 80
PBF ENERGY INC. AND PBF ENERGY COMPANY LLC
NOTES TO CONSOLIDATED FINANCIAL STATEMENTS
(IN THOUSANDS, EXCEPT SHARE, UNIT, PER SHARE, PER UNIT AND BARREL DATA)
|
PBF Energy
|
Year Ended December 31, 2018
|
||||||||||||||||||
|
Refining
|
Logistics
|
Corporate
|
Eliminations
|
Consolidated Total
|
|||||||||||||||
|
Revenues
|
$
|
27,162,079
|
|
$
|
283,440
|
|
$
|
—
|
|
$
|
(259,426
|
)
|
$
|
27,186,093
|
|
||||
|
Depreciation and amortization expense
|
329,317
|
|
29,809
|
|
10,634
|
|
—
|
|
369,760
|
|
|||||||||
|
Income (loss) from operations
(1)
|
498,287
|
|
143,870
|
|
(266,218
|
)
|
(17,819
|
)
|
358,120
|
|
|||||||||
|
Interest expense, net
|
7,601
|
|
43,033
|
|
119,277
|
|
—
|
|
169,911
|
|
|||||||||
|
Capital expenditures
(2)
|
552,020
|
|
175,696
|
|
6,171
|
|
—
|
|
733,887
|
|
|||||||||
|
Year Ended December 31, 2017
|
|||||||||||||||||||
|
Refining
|
Logistics
|
Corporate
|
Eliminations
|
Consolidated Total
|
|||||||||||||||
|
Revenues
|
$
|
21,769,703
|
|
$
|
257,588
|
|
$
|
—
|
|
$
|
(240,654
|
)
|
$
|
21,786,637
|
|
||||
|
Depreciation and amortization expense
|
253,588
|
|
24,404
|
|
12,964
|
|
—
|
|
290,956
|
|
|||||||||
|
Income (loss) from operations
(1)
|
814,033
|
|
143,379
|
|
(211,227
|
)
|
(14,565
|
)
|
731,620
|
|
|||||||||
|
Interest expense, net
|
4,695
|
|
33,363
|
|
116,369
|
|
—
|
|
154,427
|
|
|||||||||
|
Capital expenditures
(3)
|
633,294
|
|
90,258
|
|
3,483
|
|
—
|
|
727,035
|
|
|||||||||
|
Year Ended December 31, 2016
|
|||||||||||||||||||
|
Refining
|
Logistics
|
Corporate
|
Eliminations
|
Consolidated Total
|
|||||||||||||||
|
Revenues
|
$
|
15,906,866
|
|
$
|
189,006
|
|
$
|
—
|
|
$
|
(175,448
|
)
|
$
|
15,920,424
|
|
||||
|
Depreciation and amortization expense
|
200,935
|
|
15,406
|
|
5,835
|
|
—
|
|
222,176
|
|
|||||||||
|
Income (loss) from operations
|
557,839
|
|
105,240
|
|
(157,937
|
)
|
(5,679
|
)
|
499,463
|
|
|||||||||
|
Interest expense, net
|
2,938
|
|
30,433
|
|
116,674
|
|
—
|
|
150,045
|
|
|||||||||
|
Capital expenditures
(4)
|
1,468,696
|
|
123,946
|
|
20,229
|
|
—
|
|
1,612,871
|
|
|||||||||
|
Balance at December 31, 2018
|
|||||||||||||||||||
|
Refining
|
Logistics
|
Corporate
|
Eliminations
|
Consolidated Total
|
|||||||||||||||
|
Total assets
(5)
|
$
|
6,988,059
|
|
$
|
956,353
|
|
$
|
98,055
|
|
$
|
(37,052
|
)
|
$
|
8,005,415
|
|
||||
|
Balance at December 31, 2017
|
|||||||||||||||||||
|
Refining
|
Logistics
|
Corporate
|
Eliminations
|
Consolidated Total
|
|||||||||||||||
|
Total assets
(5)
|
$
|
7,287,384
|
|
$
|
748,215
|
|
$
|
123,211
|
|
$
|
(40,817
|
)
|
$
|
8,117,993
|
|
||||
|
PBF LLC
|
Year Ended December 31, 2018
|
||||||||||||||||||
|
Refining
|
Logistics
|
Corporate
|
Eliminations
|
Consolidated Total
|
|||||||||||||||
|
Revenues
|
$
|
27,162,079
|
|
$
|
283,440
|
|
$
|
—
|
|
$
|
(259,426
|
)
|
$
|
27,186,093
|
|
||||
|
Depreciation and amortization expense
|
329,317
|
|
29,809
|
|
10,634
|
|
—
|
|
369,760
|
|
|||||||||
|
Income (loss) from operations
(1)
|
498,287
|
|
143,870
|
|
(264,468
|
)
|
(17,819
|
)
|
359,870
|
|
|||||||||
|
Interest expense, net
|
7,601
|
|
43,033
|
|
127,787
|
|
—
|
|
178,421
|
|
|||||||||
|
Capital expenditures
(2)
|
552,020
|
|
175,696
|
|
6,171
|
|
—
|
|
733,887
|
|
|||||||||
|
Year Ended December 31, 2017
|
|||||||||||||||||||
|
Refining
|
Logistics
|
Corporate
|
Eliminations
|
Consolidated Total
|
|||||||||||||||
|
Revenues
|
$
|
21,769,703
|
|
$
|
257,588
|
|
$
|
—
|
|
$
|
(240,654
|
)
|
$
|
21,786,637
|
|
||||
|
Depreciation and amortization expense
|
253,588
|
|
24,404
|
|
12,964
|
|
—
|
|
290,956
|
|
|||||||||
|
Income (loss) from operations
(1)
|
814,033
|
|
143,379
|
|
(210,902
|
)
|
(14,565
|
)
|
731,945
|
|
|||||||||
|
Interest expense, net
|
4,695
|
|
33,363
|
|
124,325
|
|
—
|
|
162,383
|
|
|||||||||
|
Capital expenditures
(3)
|
633,294
|
|
90,258
|
|
3,483
|
|
—
|
|
727,035
|
|
|||||||||
F- 81
PBF ENERGY INC. AND PBF ENERGY COMPANY LLC
NOTES TO CONSOLIDATED FINANCIAL STATEMENTS
(IN THOUSANDS, EXCEPT SHARE, UNIT, PER SHARE, PER UNIT AND BARREL DATA)
|
Year Ended December 31, 2016
|
|||||||||||||||||||
|
Refining
|
Logistics
|
Corporate
|
Eliminations
|
Consolidated Total
|
|||||||||||||||
|
Revenues
|
$
|
15,906,866
|
|
$
|
189,006
|
|
$
|
—
|
|
$
|
(175,448
|
)
|
$
|
15,920,424
|
|
||||
|
Depreciation and amortization expense
|
200,935
|
|
15,406
|
|
5,835
|
|
—
|
|
222,176
|
|
|||||||||
|
Income (loss) from operations
|
557,839
|
|
105,240
|
|
(157,737
|
)
|
(5,679
|
)
|
499,663
|
|
|||||||||
|
Interest expense, net
|
2,938
|
|
30,433
|
|
122,448
|
|
—
|
|
155,819
|
|
|||||||||
|
Capital expenditures
(4)
|
1,468,696
|
|
123,946
|
|
20,229
|
|
—
|
|
1,612,871
|
|
|||||||||
|
Balance at December 31, 2018
|
|||||||||||||||||||
|
Refining
|
Logistics
|
Corporate
|
Eliminations
|
Consolidated Total
|
|||||||||||||||
|
Total assets
(5)
|
$
|
6,988,059
|
|
$
|
956,353
|
|
$
|
45,676
|
|
$
|
(37,052
|
)
|
$
|
7,953,036
|
|
||||
|
Balance at December 31, 2017
|
|||||||||||||||||||
|
Refining
|
Logistics
|
Corporate
|
Eliminations
|
Consolidated Total
|
|||||||||||||||
|
Total assets
(5)
|
$
|
7,287,384
|
|
$
|
748,215
|
|
$
|
44,203
|
|
$
|
(40,817
|
)
|
$
|
8,038,985
|
|
||||
|
(1)
|
The Logistics segment includes
100%
of the income from operations of TVPC as TVPC is consolidated by PBFX. PBFX records net income attributable to noncontrolling interest for the
50%
equity interest in TVPC held by PBF Holding. PBF Holding (included in the Refining segment) records equity income in investee related to its
50%
noncontrolling ownership interest in TVPC. For the purposes of the Company’s consolidated financial statements, PBF Holding’s equity income in investee and PBFX’s net income attributable to noncontrolling interest eliminate in consolidation.
|
|
(2)
|
The Logistics segment includes capital expenditures of
$58,356
for the PBFX acquisition of the Knoxville Terminals on April 16, 2018 and
$74,989
for the PBFX acquisition of the East Coast Storage Assets on October 1, 2018.
|
|
(3)
|
The Logistics segment includes capital expenditures of
$10,097
for the PBFX acquisition of the Toledo Products Terminal on April 17, 2017.
|
|
(4)
|
The Refining segment includes capital expenditures of
$971,932
related to the acquisition of the Torrance refinery and related logistics assets that was completed in the third quarter of 2016. Additionally, the Refining segment includes capital expenditures of
$2,659
for the working capital settlement related to the acquisition of the Chalmette refinery that was finalized in the first quarter of 2016. The Logistics segment includes
$98,373
for the PBFX Plains Asset Purchase that was completed in the second quarter of 2016.
|
|
(5)
|
The Logistics segment includes
100%
of the assets of TVPC as TVPC is consolidated by PBFX. PBFX records a noncontrolling interest for the
50%
equity interest in TVPC held by PBF Holding. PBF Holding (included in the Refining segment) records an equity investment in TVPC reflecting its noncontrolling ownership interest. For the purposes of the Company’s consolidated financial statements, PBFX’s noncontrolling interest in TVPC and PBF Holding’s equity investment in TVPC eliminate in consolidation.
|
F- 82
PBF ENERGY INC. AND PBF ENERGY COMPANY LLC
NOTES TO CONSOLIDATED FINANCIAL STATEMENTS
(IN THOUSANDS, EXCEPT SHARE, UNIT, PER SHARE, PER UNIT AND BARREL DATA)
21. NET INCOME PER SHARE OF PBF ENERGY
The following table sets forth the computation of basic and diluted net income per share of PBF Energy Class A common stock attributable to PBF Energy for the periods presented:
|
Year Ended December 31,
|
|||||||||||
|
Basic Earnings Per Share:
|
2018
|
2017
|
2016
|
||||||||
|
Allocation of earnings:
|
|||||||||||
|
Net income attributable to PBF Energy Inc. stockholders
|
$
|
128,315
|
|
$
|
415,517
|
|
$
|
170,811
|
|
||
|
Less: Income allocated to participating securities
|
748
|
|
1,043
|
|
—
|
|
|||||
|
Income available to PBF Energy Inc. stockholders - basic
|
$
|
127,567
|
|
$
|
414,474
|
|
$
|
170,811
|
|
||
|
Denominator for basic net income per PBF Energy Class A common share-weighted average shares
|
115,190,262
|
|
109,779,407
|
|
98,334,302
|
|
|||||
|
Basic net income attributable to PBF Energy per Class A common share
|
$
|
1.11
|
|
$
|
3.78
|
|
$
|
1.74
|
|
||
|
Diluted Earnings Per Share:
|
|||||||||||
|
Numerator:
|
|||||||||||
|
Income available to PBF Energy Inc. stockholders - basic
|
$
|
127,567
|
|
$
|
414,474
|
|
$
|
170,811
|
|
||
|
Plus: Net income attributable to noncontrolling interest
(1)
|
4,668
|
|
16,746
|
|
14,903
|
|
|||||
|
Less: Income tax expense on net income attributable to noncontrolling interest
(1)
|
(1,214
|
)
|
(6,633
|
)
|
(5,821
|
)
|
|||||
|
Numerator for diluted net income per Class A common share - net income attributable to PBF Energy Inc. stockholders
(1)
|
$
|
131,021
|
|
$
|
424,587
|
|
$
|
179,893
|
|
||
|
Denominator
(1)
:
|
|||||||||||
|
Denominator for basic net income per PBF Energy Class A common share-weighted average shares
|
115,190,262
|
|
109,779,407
|
|
98,334,302
|
|
|||||
|
Effect of dilutive securities:
|
|
||||||||||
|
Conversion of PBF LLC Series A Units
|
1,938,089
|
|
3,823,783
|
|
4,865,133
|
|
|||||
|
Common stock equivalents
(2)
|
1,645,255
|
|
295,655
|
|
407,274
|
|
|||||
|
Denominator for diluted net income per PBF Energy Class A common share-adjusted weighted average shares
|
118,773,606
|
|
113,898,845
|
|
103,606,709
|
|
|||||
|
Diluted net income attributable to PBF Energy Inc. stockholders per Class A common share
|
$
|
1.10
|
|
$
|
3.73
|
|
$
|
1.74
|
|
||
F- 83
PBF ENERGY INC. AND PBF ENERGY COMPANY LLC
NOTES TO CONSOLIDATED FINANCIAL STATEMENTS
(IN THOUSANDS, EXCEPT SHARE, UNIT, PER SHARE, PER UNIT AND BARREL DATA)
——————————
|
(1)
|
The diluted earnings per share calculation generally assumes the conversion of all outstanding PBF LLC Series A Units to PBF Energy Class A common stock. The net income attributable to PBF Energy, used in the numerator of the diluted earnings per share calculation is adjusted to reflect the net income, as well as the corresponding income tax (based on a
26.0%
,
39.6%
and
39.1%
annualized statutory corporate tax rate for the years ended December 31,
2018
,
2017
and
2016
) attributable to the converted units.
|
|
(2)
|
Represents an adjustment to weighted-average diluted shares outstanding to assume the full exchange of common stock equivalents, including options and warrants for PBF LLC Series A Units and performance share units and options for shares of PBF Energy Class A common stock as calculated under the treasury stock method (to the extent the impact of such exchange would not be anti-dilutive). Common stock equivalents exclude the effects of options and warrants to purchase
1,293,242
,
6,820,275
and
5,701,750
shares of PBF Energy Class A common stock and PBF LLC Series A Units because they are anti-dilutive for
the years ended December 31, 2018, 2017 and 2016
, respectively.
|
22. FAIR VALUE MEASUREMENTS
The tables below present information about the Company’s financial assets and liabilities measured and recorded at fair value on a recurring basis and indicate the fair value hierarchy of the inputs utilized to determine the fair values as of
December 31, 2018
and
2017
.
We have elected to offset the fair value amounts recognized for multiple derivative contracts executed with the same counterparty; however, fair value amounts by hierarchy level are presented on a gross basis in the tables below. We have posted cash margin with various counterparties to support hedging and trading activities. The cash margin posted is required by counterparties as collateral deposits and cannot be offset against the fair value of open contracts except in the event of default. We have no derivative contracts that are subject to master netting arrangements that are reflected gross on the consolidated balance sheet.
|
As of December 31, 2018
|
||||||||||||||||||||||
|
Fair Value Hierarchy
|
||||||||||||||||||||||
|
Level 1
|
Level 2
|
Level 3
|
Total Gross Fair Value
|
Effect of Counter-party Netting
|
Net Carrying Value on Balance Sheet
|
|||||||||||||||||
|
Assets:
|
||||||||||||||||||||||
|
Money market funds
|
$
|
16,702
|
|
$
|
—
|
|
$
|
—
|
|
$
|
16,702
|
|
N/A
|
|
$
|
16,702
|
|
|||||
|
Commodity contracts
|
1,230
|
|
8,872
|
|
|
10,102
|
|
(2,895
|
)
|
7,207
|
|
|||||||||||
|
Derivatives included with inventory intermediation agreement obligations
|
—
|
|
24,069
|
|
—
|
|
24,069
|
|
—
|
|
24,069
|
|
||||||||||
|
Liabilities:
|
||||||||||||||||||||||
|
Commodity contracts
|
2,685
|
|
210
|
|
—
|
|
2,895
|
|
(2,895
|
)
|
—
|
|
||||||||||
|
Catalyst lease obligations
|
—
|
|
44,353
|
|
—
|
|
44,353
|
|
—
|
|
44,353
|
|
||||||||||
F- 84
PBF ENERGY INC. AND PBF ENERGY COMPANY LLC
NOTES TO CONSOLIDATED FINANCIAL STATEMENTS
(IN THOUSANDS, EXCEPT SHARE, UNIT, PER SHARE, PER UNIT AND BARREL DATA)
|
As of December 31, 2017
|
||||||||||||||||||||||
|
Fair Value Hierarchy
|
||||||||||||||||||||||
|
Level 1
|
Level 2
|
Level 3
|
Total Gross Fair Value
|
Effect of Counter-party Netting
|
Net Carrying Value on Balance Sheet
|
|||||||||||||||||
|
Assets:
|
||||||||||||||||||||||
|
Money market funds
|
$
|
4,730
|
|
$
|
—
|
|
$
|
—
|
|
$
|
4,730
|
|
N/A
|
|
$
|
4,730
|
|
|||||
|
Commodity contracts
|
10,031
|
|
357
|
|
—
|
|
10,388
|
|
(10,388
|
)
|
—
|
|
||||||||||
|
Liabilities:
|
||||||||||||||||||||||
|
Commodity contracts
|
51,673
|
|
33,035
|
|
—
|
|
84,708
|
|
(10,388
|
)
|
74,320
|
|
||||||||||
|
Catalyst lease obligations
|
—
|
|
59,048
|
|
—
|
|
59,048
|
|
—
|
|
59,048
|
|
||||||||||
|
Derivatives included with inventory intermediation agreement obligations
|
—
|
|
7,721
|
|
—
|
|
7,721
|
|
—
|
|
7,721
|
|
||||||||||
F- 85
PBF ENERGY INC. AND PBF ENERGY COMPANY LLC
NOTES TO CONSOLIDATED FINANCIAL STATEMENTS
(IN THOUSANDS, EXCEPT SHARE, UNIT, PER SHARE, PER UNIT AND BARREL DATA)
The valuation methods used to measure financial instruments at fair value are as follows:
|
•
|
Money market funds categorized in Level 1 of the fair value hierarchy are measured at fair value based on quoted market prices and included within Cash and cash equivalents.
|
|
•
|
The commodity contracts categorized in Level 1 of the fair value hierarchy are measured at fair value based on quoted prices in an active market. The commodity contracts categorized in Level 2 of the fair value hierarchy are measured at fair value using a market approach based upon future commodity prices for similar instruments quoted in active markets.
|
|
•
|
The commodity contracts categorized in Level 3 of the fair value hierarchy consist of commodity price swap contracts that relate to forecasted purchases of crude oil for which quoted forward market prices are not readily available due to market illiquidity. The forward prices used to value these swaps were derived using broker quotes, prices from other third-party sources and other available market based data.
|
|
•
|
The derivatives included with inventory intermediation agreement obligations and the catalyst lease obligations are categorized in Level 2 of the fair value hierarchy and are measured at fair value using a market approach based upon commodity prices for similar instruments quoted in active markets.
|
Non-qualified pension plan assets are measured at fair value using a market approach based on published net asset values of mutual funds as a practical expedient. As of
December 31, 2018
and
2017
,
$9,694
and
$9,593
, respectively, were included within Deferred charges and other assets, net for these non-qualified pension plan assets.
The table below summarizes the changes in fair value measurements of commodity contracts categorized in Level 3 of the fair value hierarchy:
|
Year Ended December 31,
|
|||||||
|
2018
|
2017
|
||||||
|
Balance at beginning of period
|
$
|
—
|
|
$
|
(84
|
)
|
|
|
Purchases
|
—
|
|
—
|
|
|||
|
Settlements
|
—
|
|
45
|
|
|||
|
Unrealized gain (loss) included in earnings
|
—
|
|
39
|
|
|||
|
Transfers into Level 3
|
—
|
|
—
|
|
|||
|
Transfers out of Level 3
|
—
|
|
—
|
|
|||
|
Balance at end of period
|
$
|
—
|
|
$
|
—
|
|
|
There were no transfers between levels during the
years ended
December 31, 2018
and
2017
, respectively.
F- 86
PBF ENERGY INC. AND PBF ENERGY COMPANY LLC
NOTES TO CONSOLIDATED FINANCIAL STATEMENTS
(IN THOUSANDS, EXCEPT SHARE, UNIT, PER SHARE, PER UNIT AND BARREL DATA)
Fair value of debt
The table below summarizes the fair value and carrying value of debt as of
December 31, 2018
and
2017
.
|
December 31, 2018
|
December 31, 2017
|
||||||||||||||
|
Carrying
value
|
Fair
value
|
Carrying
value
|
Fair
value
|
||||||||||||
|
2025 Senior Notes
(a)
|
$
|
725,000
|
|
$
|
688,420
|
|
$
|
725,000
|
|
$
|
763,945
|
|
|||
|
2023 Senior Notes
(a) (e)
|
500,000
|
|
479,387
|
|
500,000
|
|
522,101
|
|
|||||||
|
PBFX 2023 Senior Notes
(a)
|
527,819
|
|
515,336
|
|
528,374
|
|
544,118
|
|
|||||||
|
PBF Rail Term Loan
(b)
|
21,554
|
|
21,554
|
|
28,366
|
|
28,366
|
|
|||||||
|
Catalyst leases
(c)
|
44,353
|
|
44,353
|
|
59,048
|
|
59,048
|
|
|||||||
|
PBFX Revolving Credit Facility
(b) (d)
|
156,000
|
|
156,000
|
|
29,700
|
|
29,700
|
|
|||||||
|
Revolving Credit Facility
(b)
|
—
|
|
—
|
|
350,000
|
|
350,000
|
|
|||||||
|
1,974,726
|
|
1,905,050
|
|
2,220,488
|
|
2,297,278
|
|
||||||||
|
Less - Current debt
(c)
|
(2,378
|
)
|
(2,378
|
)
|
(10,987
|
)
|
(10,987
|
)
|
|||||||
|
Less - Unamortized deferred financing costs
|
(41,032
|
)
|
n/a
|
|
(34,459
|
)
|
n/a
|
|
|||||||
|
Long-term debt
|
$
|
1,931,316
|
|
$
|
1,902,672
|
|
$
|
2,175,042
|
|
$
|
2,286,291
|
|
|||
(a) The estimated fair value, categorized as a Level 2 measurement, was calculated based on the present value of future expected payments utilizing implied current market interest rates based on quoted prices of the Senior Notes and PBFX 2023 Senior Notes.
(b) The estimated fair value approximates carrying value, categorized as a Level 2 measurement, as these borrowings bear interest based upon short-term floating market interest rates.
(c) Catalyst leases are valued using a market approach based upon commodity prices for similar instruments quoted in active markets and are categorized as a Level 2 measurement. The Company has elected the fair value option for accounting for its catalyst lease repurchase obligations as the Company’s liability is directly impacted by the change in fair value of the underlying catalyst. During 2017 Delaware City Refining entered into
two
platinum bridge leases which were settled during the second quarter of 2018. During 2018 Delaware City Refining, Toledo Refining and Chalmette Refining entered into three new platinum bridge leases which will expire in 2019. The bridge leases are payable at maturity and are not anticipated to be renewed. The total outstanding balance related to these bridge leases as of
December 31, 2018
was
$2,378
and is included in Current debt in the Company’s consolidated balance sheet.
(d) On October 1, 2018, PBFX borrowed
$75,000
to fund the East Coast Storage Acquisition. Refer to “Note 3 - PBF Logistics LP” for more details.
(e) As discussed in “Note 9 - Credit Facility and Debt”, these notes became unsecured following the Collateral Fall-Away Event on May 30, 2017.
F- 87
PBF ENERGY INC. AND PBF ENERGY COMPANY LLC
NOTES TO CONSOLIDATED FINANCIAL STATEMENTS
(IN THOUSANDS, EXCEPT SHARE, UNIT, PER SHARE, PER UNIT AND BARREL DATA)
23. DERIVATIVES
The Company uses derivative instruments to mitigate certain exposures to commodity price risk. The Company entered into the Inventory Intermediation Agreements that contain purchase obligations for certain volumes of intermediates and refined products. The purchase obligations related to intermediates and refined products under these agreements are derivative instruments that have been designated as fair value hedges in order to hedge the commodity price volatility of certain refinery inventory. The fair value of these purchase obligation derivatives is based on market prices of the underlying intermediates and refined products. The level of activity for these derivatives is based on the level of operating inventories.
As of
December 31, 2018
, there were
3,350,166
barrels of intermediates and refined products (
3,000,142
barrels at
December 31, 2017
) outstanding under these derivative instruments designated as fair value hedges. These volumes represent the notional value of the contract.
The Company also enters into economic hedges primarily consisting of commodity derivative contracts that are not designated as hedges and are used to manage price volatility in certain crude oil and feedstock inventories as well as crude oil, feedstock, and refined product sales or purchases. The objective in entering into economic hedges is consistent with the objectives discussed above for fair value hedges. As of
December 31, 2018
, there were
5,801,000
barrels of crude oil and
1,609,000
barrels of refined products (
22,348,000
and
1,989,000
, respectively, as of
December 31, 2017
), outstanding under short and long term commodity derivative contracts not designated as hedges representing the notional value of the contracts.
The following tables provide information about the fair values of these derivative instruments as of
December 31, 2018
and
December 31, 2017
and the line items in the consolidated balance sheet in which the fair values are reflected.
|
Description
|
Balance Sheet Location
|
Fair Value
Asset/(Liability)
|
||
|
Derivatives designated as hedging instruments:
|
||||
|
December 31, 2018:
|
||||
|
Derivatives included with the inventory intermediation agreement obligations
|
Accrued expenses
|
$
|
24,069
|
|
|
December 31, 2017:
|
||||
|
Derivatives included with the inventory intermediation agreement obligations
|
Accrued expenses
|
$
|
(7,721
|
)
|
|
Derivatives not designated as hedging instruments:
|
||||
|
December 31, 2018:
|
||||
|
Commodity contracts
|
Accounts receivable
|
$
|
7,207
|
|
|
December 31, 2017:
|
||||
|
Commodity contracts
|
Accrued expenses
|
$
|
(74,320
|
)
|
F- 88
PBF ENERGY INC. AND PBF ENERGY COMPANY LLC
NOTES TO CONSOLIDATED FINANCIAL STATEMENTS
(IN THOUSANDS, EXCEPT SHARE, UNIT, PER SHARE, PER UNIT AND BARREL DATA)
The following table provides information about the gains or losses recognized
in income on these derivative instruments and the line items in the consolidated statements of operations in which such gains and losses are reflected.
|
Description
|
Location of Gain or (Loss) Recognized in
Income on Derivatives
|
Gain or (Loss)
Recognized in
Income on Derivatives
|
||
|
Derivatives designated as hedging instruments:
|
||||
|
For the year ended December 31, 2018:
|
||||
|
Derivatives included with the inventory intermediation agreement obligations
|
Cost of products and other
|
$
|
31,790
|
|
|
For the year ended December 31, 2017:
|
||||
|
Derivatives included with the inventory intermediation agreement obligations
|
Cost of products and other
|
$
|
(13,779
|
)
|
|
For the year ended December 31, 2016
|
||||
|
Derivatives included with the inventory intermediation agreement obligations
|
Cost of products and other
|
$
|
(29,453
|
)
|
|
Derivatives not designated as hedging instruments:
|
||||
|
For the year ended December 31, 2018:
|
||||
|
Commodity contracts
|
Cost of products and other
|
$
|
(123,770
|
)
|
|
For the year ended December 31, 2017:
|
||||
|
Commodity contracts
|
Cost of products and other
|
$
|
(85,443
|
)
|
|
For the year ended December 31, 2016
|
||||
|
Commodity contracts
|
Cost of products and other
|
$
|
(55,557
|
)
|
|
Hedged items designated in fair value hedges:
|
||||
|
For the year ended December 31, 2018:
|
||||
|
Intermediate and refined product inventory
|
Cost of products and other
|
$
|
(31,790
|
)
|
|
For the year ended December 31, 2017:
|
||||
|
Intermediate and refined product inventory
|
Cost of products and other
|
$
|
13,779
|
|
|
For the year ended December 31, 2016
|
||||
|
Intermediate and refined product inventory
|
Cost of products and other
|
$
|
29,453
|
|
The Company had
no
ineffectiveness related to the fair value hedges as of
December 31, 2018
,
2017
and
2016
.
F- 89
PBF ENERGY INC. AND PBF ENERGY COMPANY LLC
NOTES TO CONSOLIDATED FINANCIAL STATEMENTS
(IN THOUSANDS, EXCEPT SHARE, UNIT, PER SHARE, PER UNIT AND BARREL DATA)
24. SUBSEQUENT EVENTS
PBFX IDR Restructuring Agreement
On February 13, 2019, PBFX entered into the IDR Restructuring Agreement with PBF GP, pursuant to which the IDRs held by PBF LLC will be canceled and converted into
10,000,000
newly issued PBFX common units. The IDR Restructuring is expected to close on February 28, 2019. Subsequent to the close of the IDR Restructuring,
no
distributions will be made to PBF LLC with respect to the IDRs and the newly issued common units will be entitled to normal distributions.
Dividend Declared
On February 14, 2019, PBF Energy announced a dividend of
$0.30
per share on outstanding PBF Energy Class A common stock. The dividend is payable on March 14, 2019 to PBF Energy Class A common stockholders of record as of February 28, 2019.
PBFX Distributions
On February 14, 2019 the Board of Directors of PBF GP announced a distribution of
$0.5050
per unit on outstanding common units of PBFX. The distribution is payable on March 14, 2019 to PBFX unitholders of record as of March 1, 2019.
F- 90
PBF ENERGY INC. AND PBF ENERGY COMPANY LLC
QUARTERLY FINANCIAL DATA
(unaudited, in thousands, except per share data)
The following table summarizes quarterly financial data for the years ended
December 31, 2018
and
2017
.
|
PBF Energy
|
2018 Quarter Ended
|
|||||||||||||||
|
|
March 31
|
June 30
|
September 30
|
December 31
|
||||||||||||
|
Revenues
|
$
|
5,802,776
|
|
$
|
7,444,083
|
|
$
|
7,646,360
|
|
$
|
6,292,874
|
|
||||
|
Income (loss) from operations
|
95,660
|
|
422,263
|
|
286,433
|
|
(446,236
|
)
|
||||||||
|
Net income (loss)
|
41,811
|
|
287,687
|
|
192,466
|
|
(346,673
|
)
|
||||||||
|
Net income (loss) attributable to PBF Energy Inc. stockholders
|
30,366
|
|
272,153
|
|
179,538
|
|
(353,742
|
)
|
||||||||
|
Earnings (loss) per common share - assuming dilution
|
$
|
0.27
|
|
$
|
2.37
|
|
$
|
1.50
|
|
$
|
(2.97
|
)
|
||||
|
PBF Energy
|
2017 Quarter Ended
|
|||||||||||||||
|
|
March 31
|
June 30
|
September 30
|
December 31
|
||||||||||||
|
Revenues
|
$
|
4,754,473
|
|
$
|
5,017,225
|
|
$
|
5,478,951
|
|
$
|
6,535,988
|
|
||||
|
Income (loss) from operations
|
795
|
|
(111,048
|
)
|
587,260
|
|
254,613
|
|
||||||||
|
Net income (loss)
|
(20,030
|
)
|
(104,151
|
)
|
347,226
|
|
260,386
|
|
||||||||
|
Net income (loss) attributable to PBF Energy Inc. stockholders
|
(31,077
|
)
|
(109,663
|
)
|
314,365
|
|
241,892
|
|
||||||||
|
Earnings (loss) per common share -assuming dilution
|
$
|
(0.29
|
)
|
$
|
(1.01
|
)
|
$
|
2.85
|
|
$
|
2.14
|
|
||||
|
PBF LLC
|
2018 Quarter Ended
|
|||||||||||||||
|
|
March 31
|
June 30
|
September 30
|
December 31
|
||||||||||||
|
Revenues
|
$
|
5,802,776
|
|
$
|
7,444,083
|
|
$
|
7,646,360
|
|
$
|
6,292,874
|
|
||||
|
Income (loss) from operations
|
95,912
|
|
422,704
|
|
286,759
|
|
(445,505
|
)
|
||||||||
|
Net income (loss)
|
51,743
|
|
385,622
|
|
244,913
|
|
(502,132
|
)
|
||||||||
|
Net income (loss) attributable to PBF Energy Company LLC
|
41,586
|
|
376,196
|
|
234,379
|
|
(514,323
|
)
|
||||||||
|
PBF LLC
|
2017 Quarter Ended
|
|||||||||||||||
|
|
March 31
|
June 30
|
September 30
|
December 31
|
||||||||||||
|
Revenues
|
$
|
4,754,473
|
|
$
|
5,017,225
|
|
$
|
5,478,951
|
|
$
|
6,535,988
|
|
||||
|
Income (loss) from operations
|
831
|
|
(110,976
|
)
|
587,308
|
|
254,782
|
|
||||||||
|
Net income (loss)
|
(41,853
|
)
|
(183,778
|
)
|
553,077
|
|
223,799
|
|
||||||||
|
Net income (loss) attributable to PBF Energy Company LLC
|
(54,756
|
)
|
(195,894
|
)
|
538,345
|
|
212,382
|
|
||||||||
During the three months ended
December 31, 2018
, the Company recorded an adjustment to value its inventories to the lower of cost or market which resulted in a net pre-tax income charge of
$651,734
reflecting the change in the LCM inventory reserve from
no
LCM inventory reserve at September 30, 2018 to
$651,734
at
December 31, 2018
. During the three months ended
December 31, 2017
, the Company recorded an adjustment to the lower of cost or market which resulted in a net pre-tax income benefit of
$197,589
reflecting the change in the LCM inventory reserve from
$498,045
at September 30,
2017
to approximately
$300,456
at
December 31, 2017
.
F- 91
ITEM 16. FORM 10-K SUMMARY
Not applicable.
SIGNATURES
Pursuant to the requirements of Section 13 or 15(d) of the Securities Exchange Act of 1934, each registrant has duly caused this report to be signed on its behalf by the undersigned, thereunto duly authorized.
|
PBF ENERGY INC.
(Registrant)
|
||
|
By:
|
|
/s/ Thomas J. Nimbley
|
|
|
(Thomas J. Nimbley)
|
|
|
|
Chief Executive Officer
(Principal Executive Officer)
|
|
Date:
February 21, 2019
|
PBF ENERGY COMPANY LLC
(Registrant) |
||
|
By:
|
|
/s/ Thomas J. Nimbley
|
|
|
(Thomas J. Nimbley)
|
|
|
|
Chief Executive Officer
(Principal Executive Officer) |
|
Date:
February 21, 2019
POWER OF ATTORNEY
Each of the officers and directors of PBF Energy Inc., whose signature appears below, in so signing, also makes, constitutes and appoints each of Erik Young, Matthew Lucey and Trecia Canty, and each of them, his true and lawful attorneys-in-fact, with full power and substitution, for him in any and all capacities, to execute and cause to be filed with the SEC any and all amendments to this Annual Report on Form 10-K, with exhibits thereto and other documents connected therewith and to perform any acts necessary to be done in order to file such documents, and hereby ratifies and confirms all that said attorneys-in-fact or their substitute or substitutes may do or cause to be done by virtue hereof.
Pursuant to the requirements of the Securities Exchange Act of 1934, this report has been signed below by the following persons on behalf of the registrant and in the capacities and on the dates indicated.
|
Signature
|
|
Title
|
|
Date
|
|
/s/ Thomas J. Nimbley
|
Chief Executive Officer and Chairman of the Board
|
February 21, 2019
|
||
|
(Thomas J. Nimbley)
|
|
of Directors (Principal Executive Officer)
|
|
|
|
/s/ Erik Young
|
Senior Vice President, Chief Financial Officer
|
February 21, 2019
|
||
|
(Erik Young)
|
|
(Principal Financial Officer)
|
|
|
|
/s/ John Barone
|
Chief Accounting Officer
|
February 21, 2019
|
||
|
(John Barone)
|
|
(Principal Accounting Officer)
|
|
|
|
/s/ Spencer Abraham
|
|
Director
|
|
February 21, 2019
|
|
(Spencer Abraham)
|
|
|
||
|
/s/ Wayne A. Budd
|
|
Director
|
|
February 21, 2019
|
|
(Wayne A. Budd)
|
|
|
||
|
/s/ Gene Edwards
|
|
Director
|
|
February 21, 2019
|
|
(Gene Edwards)
|
|
|
||
|
/s/ William Hantke
|
|
Director
|
February 21, 2019
|
|
|
(William Hantke)
|
|
|||
|
/s/ Edward F. Kosnik
|
|
Director
|
February 21, 2019
|
|
|
(Edward F. Kosnik)
|
|
|||
|
/s/ Robert J. Lavinia
|
|
Director
|
February 21, 2019
|
|
|
(Robert J. Lavinia)
|
|
|||
|
/s/ Kimberly S. Lubel
|
|
Director
|
February 21, 2019
|
|
|
(Kimberly S. Lubel)
|
|
|||
|
/s/ George E. Ogden
|
|
Director
|
February 21, 2019
|
|
|
(George E.Ogden)
|
|
|||
POWER OF ATTORNEY
Each of the officers of PBF Energy Company LLC, whose signature appears below, in so signing, also makes, constitutes and appoints each of Erik Young, Matthew Lucey and Trecia Canty, and each of them, his true and lawful attorneys-in-fact, with full power and substitution, for him in any and all capacities, to execute and cause to be filed with the SEC any and all amendments to this Annual Report on Form 10-K, with exhibits thereto and other documents connected therewith and to perform any acts necessary to be done in order to file such documents, and hereby ratifies and confirms all that said attorneys-in-fact or their substitute or substitutes may do or cause to be done by virtue hereof.
Pursuant to the requirements of the Securities Exchange Act of 1934, this report has been signed below by the following persons on behalf of the registrant and in the capacities and on the dates indicated.
|
Signature
|
|
Title
|
|
Date
|
|
/s/ Thomas J. Nimbley
|
Chief Executive Officer
|
February 21, 2019
|
||
|
(Thomas J. Nimbley)
|
|
(Principal Executive Officer)
|
|
|
|
/s/ Erik Young
|
Senior Vice President, Chief Financial Officer
|
February 21, 2019
|
||
|
(Erik Young)
|
|
(Principal Financial Officer)
|
|
|
|
/s/ John Barone
|
Chief Accounting Officer
|
February 21, 2019
|
||
|
(John Barone)
|
|
(Principal Accounting Officer)
|
|
|
|
Managing Member:
|
|
|
February 21, 2019
|
|
|
PBF Energy Inc.
|
|
|
||
|
/s/ Trecia Canty
|
|
Senior Vice President, General Counsel & Corporate
|
|
February 21, 2019
|
|
(Trecia Canty)
|
|
Secretary
|
|
|
TABLE OF CONTENTS
Part IItem 1A. Risk FactorsItem 1B. Unresolved Staff CommentsItem 2. PropertiesItem 3. Legal ProceedingsItem 4. Mine Safety DisclosurePart IIItem 5. Market For Registrant S Common Equity, Related Stockholder Matters, and Issuer Purchases Of Equity SecuritiesItem 6. Selected Financial DataItem 7. Management S Discussion and Analysis Of Financial Condition and Results Of OperationsItem 7A. Quantitative and Qualitative Disclosures About Market RiskItem 8. Financial Statements and Supplementary DataItem 9. Changes in and Disagreements with Accountants on Accounting and Financial DisclosureItem 9A. Controls and ProceduresItem 9B. Other InformationPart IIIItem 10. Directors, Executive Officers and Corporate GovernanceItem 11. Executive CompensationItem 12. Security Ownership Of Certain Beneficial Owners and Management and Related Stockholder MattersItem 13. Certain Relationships and Related Transactions, and Director IndependenceItem 14. Principal Accounting Fees and ServicesPart IVItem 15. Exhibits and Financial Statement SchedulesItem 16. Form 10-k Summary