PITNEY BOWES INC /DE/
10-Ks and 10-Qs
|
|
|
|
|
|
|
|
|
|
|
|
|
|
|
|
|
|
|
|
|
|
|
|
|
|
|
|
|
|
|
|
|
|
|
|
|
|
|
|
|
|
|
|
|
|
|
|
|
|
|
|
|
UNITED STATES
SECURITIES AND EXCHANGE COMMISSION
WASHINGTON, D.C. 20549
FORM 10-K
ANNUAL REPORT PURSUANT TO SECTION 13 OR 15(d) OF THE SECURITIES EXCHANGE ACT OF 1934
For the fiscal year ended
December 31, 2018
Commission file number: 1-3579
PITNEY BOWES INC.
|
Incorporated in Delaware
|
I.R.S. Employer Identification No. 06-0495050
|
|
3001 Summer Street, Stamford, CT 06926
|
|
|
(203) 356-5000
|
|
Securities registered pursuant to Section 12(b) of the Act:
|
Title of Each Class
|
Name of Each Exchange on Which Registered
|
|
|
Common Stock, $1 par value per share
|
New York Stock Exchange
|
|
|
$2.12 Convertible Cumulative Preference Stock (no par value)
|
New York Stock Exchange
|
|
Securities registered pursuant to Section 12(g) of the Act:
4% Convertible Cumulative Preferred Stock ($50 par value)
Indicate by check mark if the registrant is a well-known seasoned issuer, as defined in Rule 405 of the Securities Act. Yes
þ
No
¨
Indicate by check mark if the registrant is not required to file reports pursuant to Section 13 or Section 15(d) of the Act. Yes
¨
No
þ
Indicate by check mark whether the registrant (1) has filed all reports required to be filed by Section 13 or 15(d) of the Securities Exchange Act of 1934 during the preceding 12 months (or for such shorter period that the registrant was required to file such reports), and (2) has been subject to such filing requirements for the past 90 days. Yes
þ
No
¨
Indicate by check marks whether the registrant has submitted electronically on its corporate website, if any, every Interactive Data File required to be submitted pursuant to Rule 405 of Regulation S-T (section 232.405 of this chapter) during the preceding 12 months (or for such shorter period that the registrant was required to submit such files) Yes
þ
No
¨
Indicate by check mark if disclosure of delinquent filers pursuant to Item 405 of Regulation S-K (section 229.405 of this chapter) is not contained herein, and will not be contained, to the best of registrant's knowledge, in definitive proxy or information statements incorporated by reference in Part III of this Form 10-K or any amendment to this Form 10-K.
¨
Indicate by check mark whether the registrant is a large accelerated filer, an accelerated filer, a non-accelerated filer, a smaller reporting company, or an emerging growth company. See definition of
"
large accelerated filer,
"
"
accelerated filer,
"
"
smaller reporting company,
"
and "emerging growth company" in Rule 12b-2 of the Exchange Act.
|
Large accelerated filer
þ
|
Accelerated filer
¨
|
Non-accelerated filer
¨
|
|
Smaller reporting company
¨
|
Emerging growth company
¨
|
|
If an emerging growth company, indicate by check mark whether the registrant has elected not to use the extended transition period for complying with new or revised financial accounting standards provided pursuant to Section 7(a)(2)(B) of the Securities Act.
¨
Indicate by check mark whether the registrant is a shell company (as defined in Rule 12b-2 of the Act). Yes
¨
No
þ
As of June 30,
2018
, the aggregate market value of the registrant's common stock held by non-affiliates of the registrant was
$1.6 billion
based on the closing sale price as reported on the New York Stock Exchange.
Number of shares of common stock, $1 par value, outstanding as of close of business on
January 31, 2019
:
188,243,432
shares.
DOCUMENTS INCORPORATED BY REFERENCE
Portions of the registrant's proxy statement to be filed with the Securities and Exchange Commission (the Commission) no later than 120 days after our fiscal year end and to be delivered to stockholders in connection with the Annual Meeting of Stockholders to be held
May 6, 2019
, are incorporated by reference in Part III of this Form 10-K.
1
PITNEY BOWES INC.
TABLE OF CONTENTS
|
|
|
Page Number
|
|
PART I
|
|
|
|
Item 1.
|
||
|
Item 1A.
|
||
|
Item 1B.
|
||
|
Item 2.
|
||
|
Item 3.
|
||
|
Item 4.
|
||
|
PART II
|
||
|
Item 5.
|
||
|
Item 6.
|
||
|
Item 7.
|
||
|
Item 7A.
|
||
|
Item 8.
|
||
|
Item 9.
|
||
|
Item 9A.
|
||
|
Item 9B.
|
||
|
PART III
|
||
|
Item 10.
|
||
|
Item 11.
|
||
|
Item 12.
|
||
|
Item 13.
|
||
|
Item 14.
|
||
|
PART IV
|
||
|
Item 15.
|
||
|
Item 16.
|
||
|
|
|
|
2
PART I
Forward-Looking Statements
This Annual Report on Form 10-K (Annual Report) contains statements that are forward-looking. We want to caution readers that any forward-looking statements within the meaning of Section 27A of the Securities Act of 1933 and Section 21E of the Securities Exchange Act of 1934 may change based on various factors. These forward-looking statements are based on current expectations and assumptions that are subject to risks and uncertainties and actual results could differ materially. Words such as "estimate," "target," "project," "plan," "believe," "expect," "anticipate," "intend" and similar expressions may identify such forward-looking statements. We undertake no obligation to publicly update or revise any forward-looking statements, whether as a result of new information, future events or otherwise, except as required by law. Forward-looking statements in this Annual Report on Form 10-K speak only as of the date hereof, and forward-looking statements in documents attached that are incorporated by reference speak only as of the date of those documents.
Although we believe that the expectations reflected in any of our forward-looking statements are reasonable, actual results could differ materially from those projected or assumed in any of our forward-looking statements. Our future financial condition and results of operations, as well as any forward-looking statements, are subject to change and to inherent risks and uncertainties, such as those disclosed or incorporated by reference in our filings with the Securities and Exchange Commission. Factors which could cause future financial performance to differ materially from the expectations as expressed in any forward-looking statement made by or on our behalf include, without limitation:
|
•
|
declining physical mail volumes
|
|
•
|
changes in postal regulations or changes in, or loss of, our contractual relationships with the U.S. Postal Service (USPS) or posts in other major markets
|
|
•
|
competitive factors, including pricing pressures; technological developments and the introduction of new products and services by competitors
|
|
•
|
the United Kingdom's likely exit from the European Union (Brexit)
|
|
•
|
our success in developing and marketing new products and services and obtaining regulatory approvals, if required
|
|
•
|
changes in banking regulations or the loss of our Industrial Bank charter
|
|
•
|
changes in labor conditions and transportation costs
|
|
•
|
macroeconomic factors, including global and regional business conditions that adversely impact customer demand, foreign currency exchange rates and interest rates
|
|
•
|
changes in global political conditions and international trade policies, including the imposition or expansion of trade tariffs
|
|
•
|
the continued availability and security of key information technology systems and the cost to comply with information security requirements and privacy laws
|
|
•
|
a breach of security, including a cyber-attack or other comparable event
|
|
•
|
third-party suppliers' ability to provide products and services required by our clients
|
|
•
|
our success at managing the relationships with outsource providers, including the costs of outsourcing functions and operations
|
|
•
|
capital market disruptions or credit rating downgrades that adversely impact our ability to access capital markets at reasonable costs
|
|
•
|
our success at managing customer credit risk
|
|
•
|
integrating newly acquired businesses, including operations and product and service offerings
|
|
•
|
the loss of some of our larger clients in our Commerce Services group
|
|
•
|
intellectual property infringement claims
|
|
•
|
significant changes in pension, health care and retiree medical costs
|
|
•
|
income tax adjustments or other regulatory levies from tax audits and changes in tax laws, rulings or regulations
|
|
•
|
the use of the postal system for transmitting harmful biological agents, illegal substances or other terrorist attacks
|
|
•
|
acts of nature
|
Further information about factors that could materially affect us, including our results of operations and financial condition, is contained in Item 1A. "Risk Factors" in this Annual Report.
3
ITEM 1. BUSINESS
General
Pitney Bowes Inc. (we, us, our, or the company), is a global technology company offering innovative products and solutions that help our clients navigate the complex world of commerce. We offer customer information management, location intelligence and customer engagement products and solutions to help our clients market to their customers, and shipping, mailing, fulfillment, returns and cross-border ecommerce products and solutions that enable the sending of parcels and packages across the globe. Clients around the world rely on our products, solutions and services. Pitney Bowes Inc. was incorporated in the state of Delaware in 1920. For more information about us, our products, services and solutions, visit
www.pb.com
.
Business Segments
Our business is organized around three distinct sets of solutions -- Commerce Services, Small and Medium Business Solutions (SMB Solutions), and Software Solutions.
Commerce Services
Our Commerce Services group includes our cross-border solutions, shipping solutions, fulfillment, delivery and return services and presort services. The Commerce Services group includes our Global Ecommerce and Presort Services segments.
Global Ecommerce
Global Ecommerce includes our cross-border ecommerce solutions, domestic retail and ecommerce shipping solutions and fulfillment, delivery and return services. Global Ecommerce provides a full suite of domestic and cross-border solutions that help businesses of all sizes conduct commerce and participate in the parcel journey from “Anywhere to Everywhere™”. It is our technology, services and industry expertise that have made us an industry leader in global ecommerce. We offer a unified ecommerce platform of capabilities for cross-border, marketplaces and shipping that center around the consumer, from simple solutions that allow a customer to print shipping labels to full service solutions from time of order to time of delivery and return. With our proprietary technology, we are able to manage all aspects of the international shopping and shipping experience, including multi-currency pricing, payment processing, fraud management, calculation of all duty, tax and shipping costs at checkout, compliance with product restrictions, export complexities and documentation requirements for customs clearance and brokerage and global logistics services. Our cross-border ecommerce software platforms are utilized by direct merchants as well as major online marketplaces enabling millions of parcels to be shipped worldwide. Our platform also connects retailers to marketplaces around the world, opening new markets and expanding existing markets for their goods.
Our shipping management solutions enable clients to reduce transportation and logistics costs, select the best carrier based on need and cost, improve delivery times and track packages in real-time. Powered by our shipping application programming interface (API) technology, an integral part of the Pitney Bowes Commerce Cloud, we can provide easy access to shipping and tracking services that can be easily integrated into any web application such as online shopping carts or ecommerce sites and provide guaranteed delivery times and flexible payment options. We do not perform the physical shipping function; however, our technology allows users to select the best shipper based on need and cost.
Presort Services
We are a workshare partner of the USPS and national outsource provider of mail sortation services that allow clients to qualify large volumes of First-Class Mail, Marketing Mail and Bound and Packet Mail (Standard Flats and Bound Printed Matter) for postal worksharing discounts. We process over 16 billion pieces of mail annually through our network of operating centers throughout the United States. Our Presort Services network and fully-customized proprietary technology provides clients with end-to-end solutions from pick up at their location to delivery into the postal system network, expedited mail delivery and optimal postage savings.
Small and Medium Business Solutions
We are a global leader in providing a full range of equipment, technology, supplies and services that enable our clients to efficiently create mail, evidence postage and help simplify and save on the sending, tracking and receiving of mail, flats and parcels. We are a leading global provider of sending systems and technology. Our cloud enabled infrastructure provides software-as-a-service (SaaS) offerings delivered online and via connected or mobile devices. Our latest offerings are designed on an open platform architecture that leverages partnerships with other innovative companies as well as an ecosystem of developers to deliver new value to our clients. Within the SMB Solutions group is the North America Mailing segment, comprised of the sending operations in the U.S. and Canada, and the International Mailing segment, comprised of all other sending businesses globally.
4
We will begin offering expanded third-party leasing solutions to our existing SMB client base in the United States in 2019. Under this program, in addition to leasing options for our mailing equipment products, we will offer leasing alternatives for our existing SMB client base to lease other manufacturers' equipment to meet their business needs.
Software Solutions
Within Software Solutions, we offer data, customer information management, location intelligence and customer engagement solutions. These solutions are delivered as on-premise licenses or on-demand/SaaS applications.
Data solutions enable businesses to identify addresses, locations, businesses and individuals. Our address-centric approach provides us the ability to verify, standardize, locate and enrich both physical and digital addresses with actionable insights. The quality and accuracy of data is foundational to many business processes, including the identification and mitigation of risk and fraud, the onboarding of and marketing to customers and potential customers, and helping organizations better serve their customers.
Customer information management solutions help businesses identify high-value customers and prospects, develop a deep and broad understanding of their customers and provide a single view of the customer in context to their location, relationships and influence. By understanding who their customers are, and what they do, businesses can in turn understand preferences and purchasing behaviors, detect fraudulent activity and increase marketing effectiveness and services. We are one of the market leaders in the data quality segment. Large corporations and government agencies rely on our products in complex, high-volume, transactional environments to support their business processes.
Location intelligence solutions enable businesses to understand the complex relationships between location, geographic and other forms of data to drive business decisions and customer experiences. Our location intelligence solutions use predictive analytics and location, geographic and socio-demographic data to add context and insight, making it possible to pinpoint the best placement for retail sites, improve risk assessment and efficiently deploy infrastructure resources to better serve their customers, solve business problems, deliver location-based services and drive business growth.
Customer engagement solutions enable businesses to communicate with their customers in more personalized and relevant ways that enhance customer interactions across the entire customer lifecycle. Through personalized, impactful and timely physical and digital interactions, businesses can improve customer satisfaction, reduce support costs and drive sales. Our customer engagement solutions enable businesses to create connected experiences that positively influence future consumer behavior and generate business growth.
Seasonality
As our business continues to transform and shipping becomes a bigger part of our financial performance, a larger percentage of our revenue and earnings will be earned in the fourth quarter relative to the other quarters, driven primarily by the impact of the holiday season on Commerce Services.
Client Service
We provide call-center, online and on-site support services for our products and solutions. Most of our support services are provided under maintenance contracts.
Sales and Marketing
We market our products, solutions and services through a direct and inside sales force, global and regional partner channels, direct mailings and web-based offerings.
Competition
All of our businesses face competition from a number of companies. Our competitors range from large, multinational companies that compete against many of our businesses to smaller, more narrowly focused regional and local firms. We compete on the basis of technology and innovation; breadth of product offerings; our ability to design and tailor solutions to specific client needs; performance; client service and support; price; quality and brand.
We must continue to invest in our current technologies, products and solutions, and in the development of new technologies, products and solutions in order to maintain and improve our competitive position. We will encounter new competitors as we transition to higher value markets and offerings and enter new markets.
5
A summary of the competitive environment for each of our business segments is as follows:
Global Ecommerce
The market for international ecommerce software and fulfillment services is highly fragmented and includes competitors of various sizes, including companies with greater financial resources than us. Some of these competitors specialize in point solutions or freight forwarding services, are full-service ecommerce business process outsourcers and online marketplaces with international logistic support, or major global delivery services companies. We also see a competitive threat from companies who can offer both domestic and cross-border solutions in a single package which creates leverage for those competitors on pricing. The principal competitive factors include reliability, functionality, ease of integration and use, scalability, innovation, support services and price. We compete based on the accuracy, reliability and scalability of our platform and logistics services, our ability to provide clients and their customers a one-stop full-service ecommerce experience and the ability to provide a more customized shipping solution to smaller businesses than some of our larger competitors in the industry. We also compete, within shipping solutions, with a wide range of technology providers who help make shipping easier and more cost-effective. There are established players in the marketplace as well as many small companies offering negotiated carrier rates (primarily with the USPS). The principal competitive factors include technology stability and reliability, innovation, access to preferred shipping rates and ease of integration with existing systems.
Presort Services
We face competition from regional and local presort providers, cooperatives of multiple local presort providers, consolidators and service bureaus that offer presort solutions as part of a larger bundle of outsourcing services. While not necessarily competitors in the traditional sense, large mail owners have the capability to presort their own mailings in-house. The principal competitive factors include innovative service, delivery speed, tracking and reporting, industry expertise and economies of scale. Our competitive advantages include our extensive network of presort facilities capable of processing significant volumes and our innovative and proprietary technology that enables us to provide our clients with reliable, secure and precise services offering maximum postage discounts.
North America Mailing and International Mailing
We face significant competition from other mail equipment and software providers, companies that offer products and services as alternative means of message communications and those that offer shipping and mailing products and services through on-line solutions. Additionally, as competitive alternative communication methods in comparison to mail grow, our SMB Solutions operations could be affected. We differentiate ourselves in many areas including: software and hardware solutions; pricing; available financing and payment offerings; product reliability; support services; industry knowledge and expertise and attractiveness of alternative communication methods. Our competitive advantage includes our breadth of physical and web-based digital offerings, customer service and our extensive knowledge of the shipping and mailing industry. Through our wholly owned subsidiary, The Pitney Bowes Bank (the Bank), we offer a revolving credit solution to our clients in the United States that enables them to pay the rental fee for certain mailing equipment and to purchase postage, services and supplies. The Bank also provides an interest-bearing deposit solution to those clients who prefer to prepay postage. We also provide similar revolving credit solutions to our clients in Canada and the U.K., but not through the Bank. Our financing operations face competition, in varying degrees, from large, diversified financial institutions, including leasing companies, commercial finance companies and commercial banks, as well as small, specialized firms. Not all our competitors are able to offer these financing and payment solutions to their customers and we believe these solutions differentiate us from our competitors and are a source of competitive advantage. The Bank is chartered as an Industrial Bank under the laws of the State of Utah, and is regulated by the Federal Deposit Insurance Corporation (FDIC) and the Utah Department of Financial Institutions.
Software Solutions
We operate in several highly competitive and rapidly evolving markets and face competition ranging from large global companies that offer a broad suite of solutions to smaller, more narrowly-focused companies that can design very targeted solutions. The principal competitive factors include reliability, functionality, ease of integration and use, scalability, innovation, support and price. We compete based on the accuracy, breadth, scalability and processing speed of our products and solutions, our geocoding and reverse geocoding capabilities, our expertise in address validation, and our ability to identify rapidly changing customer needs and develop technologies and solutions to meet these changing needs.
Financing Solutions
We offer a variety of solutions that enable clients to finance equipment and product purchases, make rental and lease payments, replenish postage and purchase supplies. As product and service offerings evolve, we continually evaluate whether there are appropriate financing solutions to offer our clients. We establish credit approval limits and procedures based on the credit quality of the client and the type of product or service provided to control risk in extending credit to clients. In addition, we utilize a systematic decision program for certain leases. This program is designed to facilitate low dollar transactions by utilizing historical payment patterns and behaviors of clients with
6
similar credit characteristics. This program defines criteria under which we will accept a client without performing a more detailed credit investigation, such as maximum equipment cost, a client's time in business and payment experience.
We closely monitor the portfolio by analyzing industry sectors and delinquency trends by product line, industry and client to ensure reserve levels and credit policies reflect current trends. Management continues to closely monitor credit lines and collection resources and revise credit policies as necessary to be more selective in managing the portfolio.
In 2019, we will begin offering expanded third-party leasing solutions to our existing SMB client base in the United States. Under this program, we will offer leasing alternatives for our existing SMB client base to lease other manufacturers' equipment to meet their business needs. By offering this program to our existing SMB clients, we will be able to leverage our extensive credit review and history of these clients to establish credit limits and control risk.
Research, Development and Intellectual Property
We invest in research and development activities to develop new products and solutions, enhance the effectiveness and functionality of existing products and solutions and deliver high value technology, innovative software and differentiated services in high value segments of the market. As a result of our historical research and development efforts, we have been awarded a number of patents with respect to several of our innovations and products. However, as we transition our business to more software and service-based offerings and patent laws make it more difficult to obtain patent protection, we now rely more on trade secrets and confidentiality. Our businesses are not materially dependent on any one patent or license or group of related patents or licenses.
Third-party Suppliers
We depend on third-party suppliers for a variety of services and product components and other vendors to enable our product and shipping solutions. In certain instances, we rely on single-sourced or limited-sourced suppliers and vendors around the world because the relationship is advantageous due to quality, price, or there are no alternative sources. We believe that our available sources for services, components, supplies and manufacturing are adequate.
Regulatory Matters
We are subject to the regulations of postal authorities worldwide related to product specifications of our postage meters. Our Presort Services business practices are also subject to regulations of the USPS. The operations of the Bank and certain company affiliates that provide services to the Bank are subject to the regulations of the Utah Department of Financial Institutions and the FDIC. We are also subject to transportation, customs and trade regulations worldwide related to our cross-border shipping services and regulations concerning data privacy and security for our businesses that use, process and store certain personal, confidential or proprietary data.
Employees and Employee Relations
At
December 31, 2018
, we have approximately 13,300 employees worldwide. We believe that we maintain strong relationships with our employees. Management keeps employees informed of decisions and encourages and implements employee suggestions whenever practicable.
Available Information
Our Annual Reports on Form 10-K, Quarterly Reports on Form 10-Q, Current Reports on Form 8-K and any amendments thereto filed with, or furnished to, the Securities and Exchange Commission (the SEC), are available, free of charge, through the Investor Relations section of our website at
www.pb.com/investorrelations
or from the SEC's website at
www.sec.gov,
as soon as reasonably practicable after these reports are electronically filed with, or furnished to, the SEC. The other information found on our website is not part of this or any other report we file with or furnish to the SEC.
7
Executive Officers of the Registrant
Our executive officers are:
|
Name
|
Age
|
Title
|
Executive
Officer Since
|
|||
|
Marc B. Lautenbach
|
57
|
President and Chief Executive Officer
|
2012
|
|||
|
Jason C. Dies
|
49
|
Executive Vice President and President, SMB Solutions
|
2017
|
|||
|
Daniel J. Goldstein
|
57
|
Executive Vice President and Chief Legal Officer and Corporate Secretary
|
2010
|
|||
|
Robert Guidotti
|
61
|
Executive Vice President and President, Software Solutions
|
2016
|
|||
|
Roger J. Pilc
|
51
|
Executive Vice President and Chief Innovation Officer
|
2013
|
|||
|
Lila Snyder
|
46
|
Executive Vice President and President, Commerce Services
|
2016
|
|||
|
Christoph Stehmann
|
56
|
Executive Vice President, International SMB Solutions
|
2016
|
|||
|
Stanley J. Sutula III
|
53
|
Executive Vice President and Chief Financial Officer
|
2017
|
|||
|
Johnna G. Torsone
|
68
|
Executive Vice President and Chief Human Resources Officer
|
1993
|
|||
There are no family relationships among the above officers. All of the officers have served in various executive positions with the company for at least the past five years except as described below:
Mr. Dies was appointed to the office of Executive Vice President and President, SMB Solutions in October 2017. He joined the company in 2015 as President, Document Messaging Technologies (DMT). Prior to joining the company, Mr. Dies was employed at IBM where he held several leadership positions in North America, Europe, and Asia across diverse business units.
Mr. Guidotti was appointed Executive Vice President and President, Software Solutions in January 2016. Before joining Pitney Bowes, Mr. Guidotti held a series of executive positions at IBM including General Manager, Software Sales where he was responsible for the $23 billion worldwide Software portfolio.
Ms. Snyder was elected to the office of Executive Vice President and President, Commerce Services in January 2016. She joined the company in November 2013 as President, DMT and became President, Global Ecommerce in June 2015. Prior to joining Pitney Bowes, Ms. Snyder was a Partner at McKinsey & Company, Inc. In her 15 years at McKinsey, she focused on serving clients in the technology, media and communications sectors and was the leader of McKinsey's Stamford office.
Mr. Sutula joined the company as Executive Vice President and Chief Financial Officer in February 2017. Prior to joining the company, Mr. Sutula was employed at IBM for 28 years where he held several leadership positions in the United States and Europe. Most recently, Mr. Sutula was Vice President and Controller.
ITEM 1A. RISK FACTORS
Our operations face certain risks that should be considered in evaluating our business. We manage and mitigate these risks on a proactive basis, including through the use of an enterprise risk management program. Nevertheless, the following risk factors, some of which may be beyond our control, could materially impact our business, financial condition, results of operations, brand and reputation, and may cause future results to be materially different than our current expectations. These risk factors are not intended to be all inclusive.
Significant disruptions to postal operations or adverse changes to our relationships with posts in the United States or elsewhere could adversely affect our financial results.
We are dependent on a healthy postal sector in the geographic markets where we operate both our mailing and shipping businesses, particularly in the United States. A significant portion of our revenue also depends on our contractual relationships with posts. Changes in the financial viability of the major posts, or the statutes and regulations determining how they operate, or changes in our contractual relationships with these posts, could materially adversely affect the financial performance of the businesses we conduct with them.
8
We are subject to postal regulations and processes, which could adversely affect our financial results.
A significant portion of our business is subject to regulation and oversight by the USPS and posts in other major markets. These postal authorities have the power to regulate our current products and services and regulate and approve many of our new or future product and service offerings. If our new or future product and service offerings are not approved, if there are significant conditions to approval or, if regulations on our existing products or services are changed, our financial performance could be adversely impacted.
If we are not able to respond to the continuing decline in the volume of physical mail delivered via traditional postal services, our financial performance could be adversely impacted.
Traditional mail volumes continue to decline and impact our current and future financial results. However, we have employed, and will continue to employ, strategies to stabilize the mailing business, including introducing new digital product and service offerings and providing clients broader access to products and services through online and direct sales channels. There is no guarantee that these offerings will be widely accepted in the marketplace, and they will likely face competition from existing and emerging alternative products and services.
Further, an accelerated or sudden decline in physical mail volumes could have an adverse effect on our mailing business. An accelerated or sudden decline could result from, among other things, changes in communication behavior, technologies, reductions to the Universal Service Obligation (USO) under which national posts, including the USPS, deliver to every address in a country with similar pricing and frequency, and legislation or regulations that mandate electronic substitution, prohibit certain types of mailings, increase the difficulty of using information or materials in the mail, or impose higher taxes or fees on postal services.
If we are not successful at meeting the continuing challenges faced in our mailing business, or if physical mail volumes were to experience an accelerated or sudden decline, our financial performance could be adversely impacted.
If we or our suppliers are unable to protect our information technology systems against misappropriation of data, or breaches of security resulting from cyberattacks or other similar events, our operations could be disrupted, our reputation may be harmed, the confidentiality of our data and intellectual property may be violated, and we could be subject to legal liability or regulatory enforcement action.
We depend on the security of our and our suppliers' information technology systems to support numerous business processes and activities, to support and service our clients and to support consumer transactions and postal services. Several of our businesses use, process and store proprietary information and personal, sensitive or confidential data relating to consumers and our businesses, clients and employees. Privacy laws and similar regulations in many jurisdictions where we do business require that we take significant steps to safeguard such information, and legal requirements continue to evolve. The scope of the laws that may be applicable to us is often uncertain and may be conflicting, particularly with respect to foreign laws. For example, the European Union’s General Data Protection Regulation (GDPR), which became effective in May 2018, greatly increases the jurisdictional reach of European Union law and adds a broad array of requirements for handling personal data, including the public disclosure of significant data breaches to supervisory authorities and affected parties. Other countries have enacted or are enacting data localization laws that require data to stay within their borders. All of these evolving compliance and operational requirements impose significant costs that are likely to increase over time.
There are numerous risks to cybersecurity and privacy, including individual and groups of criminal hackers, industrial espionage, denial of service attacks, computer viruses, vandalism and employee errors and/or malfeasance. These cyber threats are constantly evolving, thereby increasing the difficulty of detecting and successfully defending against them. We have security systems and procedures in place designed to ensure the continuous and uninterrupted performance of our information technology systems and to protect against unauthorized access to information. We also require our suppliers who host our information technology systems or have access to sensitive data to have appropriate security measures in place. However, there is no guarantee that these security measures will prevent or detect the unauthorized access by experienced computer programmers, hackers or others. Successful breaches could, among other things, result in the unauthorized disclosure, theft and misuse of company, client, consumer and employee sensitive and confidential information, disrupt the performance of our information technology systems and deny services to our clients. Additionally, we could be exposed to potential liability, litigation, governmental inquiries, investigations or regulatory enforcement actions, our brand and reputation damaged, and we could be subject to the payment of fines or other penalties, legal claims by our clients and significant remediation costs. Although we maintain insurance coverage relating to cybersecurity incidents, we may incur costs or financial losses that are either not insured against or not fully covered through our insurance.
As we increase our reliance on cloud-based applications for both our internal and external services, if we or our suppliers encounter unforeseen interruptions or difficulties in the operation of those applications, our operations could be disrupted, our reputation and relationships may be harmed and our financial performance may be impacted.
Our business relies upon the continuous and uninterrupted performance of our, and our suppliers', cloud-based applications and systems to support numerous business processes, to service our clients and to support consumer transactions and postal services. Our applications and systems, and those of our partners, may be subject to interruptions due to technological errors, system capacity constraints, software
9
errors or defects, human errors, computer or communications failures, power loss, adverse acts of nature and other unexpected events. We have business continuity and disaster recovery plans in place to protect our business operations in case of such events and we also require our suppliers to have the same. Nonetheless, there can be no guarantee that these plans will function as designed. If we are unable to limit interruptions or successfully correct them in a timely manner or at all, it could result in lost revenue, loss of critical data, significant expenditures of capital, a delay or loss in market acceptance of our services and damage to our reputation, brand and relationships, any of which could have an adverse effect on our business and financial performance.
We depend on third-party suppliers and outsource providers and our business could be adversely affected if we fail to manage these vendors effectively.
We depend on third-party suppliers and outsource providers for a variety of services and product components, the hosting of our software-as-a-service offerings, the logistics portion of our ecommerce business, and some non-core functions and operations. Some of our suppliers may also be our competitors in other contexts. In certain instances, we rely on single-sourced or limited-sourced suppliers and outsourcing vendors around the world because doing so is advantageous due to quality, price or lack of alternative sources. If production or services were interrupted, or these third-party suppliers choose to terminate their relationship with us or make material changes to their businesses or if certain of their costs were to increase and we were not able to find alternate suppliers, we could experience significant disruptions in manufacturing and operations (including product shortages, higher freight costs and re-engineering costs) as well as increased costs in the logistics portion of our ecommerce business. If outsourcing services were interrupted, not performed, or the performance was poor, our ability to process, record and report transactions with our clients, consumers and other constituents could be impacted. Such interruptions, including a cybersecurity event, in the provision of supplies and/or services could impact our ability to meet client demand, damage our reputation and client relationships and adversely affect our financial performance.
The transformation of our businesses to more digital and commerce services will result in a decline in our overall profit margins. If we cannot increase our volumes while at the same time reduce our costs, our financial performance could be impacted.
As we transform our businesses to more digital and commerce services, the revenue contribution from our Commerce Services segments have increased relative to our SMB Solutions and Software Solutions segments and is expected to continue to increase in the future. The profit margins in Commerce Services are lower than the profit margins in SMB Solutions and Software Solutions. Additionally, rising labor and transportation costs have a bigger impact on profit margins in Commerce Services as compared to SMB Solutions and Software Solutions because in Commerce Services we rely on a significant number of hourly workers at our facilities and on third parties to transport packages on behalf of our clients. Margin improvement within Commerce Services is highly dependent on increasing volumes and lowering costs. Accordingly, if we cannot obtain sufficient scale by increasing our volumes while at the same time reducing our costs in Commerce Services significantly enough to improve profit margins, our overall financial performance could be adversely impacted.
Future credit rating downgrades or capital market disruptions could adversely affect our ability to maintain adequate liquidity to provide competitive financing services to our clients and to fund various discretionary priorities.
Our financing activities include, among other things, providing competitive financing offerings to our clients and funding various discretionary priorities, such as business investments, strategic acquisitions, dividend payments and share repurchases. We fund these activities through a combination of cash generated from operations, deposits held at the Bank and access to capital markets. Our ability to access the U.S. capital markets and the associated cost of borrowing is dependent upon our credit ratings and is subject to capital market volatility. Given our current credit rating, we may not have immediate or sufficient access to the U.S. capital markets, and when we do access the U.S. capital markets, we may experience reduced financial or strategic flexibility as well as higher costs. To support our long-term strategic initiatives, our leverage may continue to increase, which could result in further credit rating downgrades. A significant decline in cash flows, further credit rating downgrades, material capital market disruptions, significant withdrawals by depositors at the Bank, adverse changes to our industrial loan charter or an increase in our credit default swap spread could impact our ability to maintain adequate liquidity to provide competitive finance offerings to our clients, refinance maturing debt and fund other financing activities, which in turn, could adversely affect our financial performance.
The international nature of our Global Ecommerce business exposes us to increased customs and regulatory risks from cross-border transactions and foreign exchange rate fluctuations. The loss of any of our largest clients in our Global Ecommerce segment could have a material adverse effect on the segment.
Our Global Ecommerce segment is subject to significant trade regulations, taxes, and duties throughout the world. Any changes to these regulations could potentially impose increased documentation and delivery requirements, increase costs, delay delivery times, and subject us to additional liabilities, which could negatively impact our ability to compete in international markets and adversely impact our financial performance.
The sales generated from many of our clients’ internationally focused websites running on our platform are exposed to foreign exchange rate fluctuations. Currently, our platforms are located in the U.S., U.K. and Australia and a majority of consumers making purchases
10
through these platforms are in a limited number of foreign countries. A strengthening of the U.S. Dollar or British Pound relative to currencies in the countries where we do the most business impacts our ability to compete internationally as the cost of similar international products improves relative to the cost of U.S. and U.K. retailers' products. A strong U.S. Dollar or British Pound would likely result in a decrease in international sales volumes, which would adversely affect the segment's revenue and profitability.
The Global Ecommerce segment receives a large portion of its revenue from a relatively small number of clients and business partners. The loss of any of these larger clients or business partners, or a substantial reduction in their use of our products or services, could have a material adverse effect on the revenue and profitability of the segment. There can be no assurance that our larger clients and business partners will continue to utilize our products or services at current levels, or that we would be able to replace any of these clients or business partners with others who can generate revenue at current levels.
Our international operations may be adversely impacted by the United Kingdom's likely exit from the European Union.
In March 2017, the U.K. issued a formal notification of its intention to leave the European Union (EU). The U.K. is expected to exit the EU (Brexit) on March 29, 2019, unless an extension is agreed upon by the parties. Approximately 12% of our consolidated revenue is generated from counties in the EU, including the U.K. Although the ultimate outcome of Brexit is unknown, the effects of Brexit may adversely impact global economic conditions, contribute to instability in global financial and foreign exchange markets, impact trade and commerce, including the imposition of additional tariffs and duties and require additional documentation and inspection checks of the movement of goods between the U.K. and EU countries, leading to delays at ports of entry and departure. In particular, Brexit may have an adverse effect on cross-border ecommerce both into and out of the U.K. Brexit may also affect our supply chain for our International Mailing segment. Any of these and other changes, implications or consequences of Brexit could adversely affect our financial performance.
Our operations may be negatively impacted by the recent developments in trade policies and tariffs.
We source certain parts and components used in our mailing products from manufacturers located outside of the U.S. and we sell certain of our products to customers located outside the U.S. The U.S. Administration has increased tariffs on certain goods imported into the U.S. from countries that we source parts and components from and has raised the possibility of imposing significant additional tariff increases. The announcement of tariffs on imported goods has triggered actions by certain foreign governments and may trigger additional actions by those and other foreign governments. These types of bilateral tariffs could materially increase the cost of certain import products, impact or limit the availability of such products, and/or decrease demand for certain of our products, which could adversely affect our financial performance. The tariffs already imposed have increased our costs and if such tariffs are increased any further, it will increase our costs even more.
Our business depends on our ability to attract and retain employees at a reasonable cost to meet the needs of our business and to consistently deliver highly differentiated competitive offerings.
Given the rapid growth of the ecommerce industry, there has been intense competition for employees in the shipping, transportation and logistics industry, including drivers and factory employees. There is also significant competition for the talent needed to continue to develop our products. If we are unable to find and retain sufficient employees at a reasonable cost, or if the compensation required grows too rapidly, it may adversely affect our financial performance.
Our inability to obtain and protect our intellectual property and defend against claims of infringement by others may negatively impact our financial performance.
Our businesses are not materially dependent on any one patent or license or group of related patents and licenses; however, our business success depends in part upon protecting our intellectual property rights, including proprietary technology developed or obtained through acquisitions. We rely on copyrights, patents, trademarks and trade secrets and other intellectual property laws to establish and protect our proprietary rights. As we transition our business to more software and service-based offerings, product clearance and patent protection of these innovations are more difficult to obtain and we face increased risk of patent infringement assertions. If we are unable to protect our intellectual property rights, our competitive position may suffer which could adversely affect our revenue and profitability. The continued evolution of patent law and the nature of our innovation work may affect the number of patents we are able to receive for our development efforts.
From time to time, third-parties may claim that we, our clients, or our suppliers, have infringed their intellectual property rights. These claims, if successful, may require us to redesign affected products, enter into costly settlement or license agreements, pay damage awards, or face a temporary or permanent injunction prohibiting us from marketing or selling certain products
.
11
If we fail to comply with government contracting regulations, our financial performance, brand name and reputation could suffer.
We have a significant number of contracts with governmental entities, including the USPS. Government contracts are subject to extensive and complex procurement laws and regulations, along with regular audits and investigations by government agencies. If one or more government agencies discovers contractual noncompliance in the course of an audit or investigation, we may be subject to various civil or criminal penalties and administrative sanctions, which could include the termination of the contract, reimbursement of payments received, fines and debarment from doing business with one or more governments. Any of these events could not only affect us financially, but also adversely affect our brand and reputation.
We may not fully realize the anticipated benefits of strategic acquisitions and divestitures which may harm our financial performance.
As we transition our business to sustainable long-term growth, we may make strategic acquisitions or divest certain businesses. These actions may involve significant risks and uncertainties, which could have an adverse effect on our financial performance, including:
|
•
|
difficulties in achieving anticipated benefits or synergies;
|
|
•
|
difficulties in integrating any newly acquired businesses and operations, including combining product and service offerings and entering new markets, or reducing fixed costs previously associated with divested businesses;
|
|
•
|
the loss of key employees or clients of businesses acquired or divested;
|
|
•
|
significant charges for employee severance and other restructuring costs, legal, accounting and financial advisory fees; and
|
|
•
|
possible goodwill and asset impairment charges as divestitures and changes in our business model may adversely affect the recoverability of certain long-lived assets and valuation of our operating segments.
|
Our capital investments to develop new products and offerings or expand our current operations may not yield the anticipated benefits.
As we transform the company’s businesses, we are making significant capital investments in new products, services, and facilities. If we are not successful in these new product or service introductions at the levels anticipated when making the investments, there may be an adverse effect on our financial performance.
Our operational costs could increase from changes in environmental regulations, or we could be subject to significant liabilities.
We are subject to various federal, state, local and foreign environmental protection laws and regulations around the world, including without limitation, those related to the manufacture, distribution, use, packaging, labeling, recycling or disposal of our products or the products of our clients for whom we perform services. Environmental rules concerning products and packaging can have a significant impact on the cost of operations or affect our ability to do business in certain countries. We are also subject to laws concerning use, discharge or disposal of materials. All of these laws are complex, change frequently and have tended to become more stringent over time. If we are found to have violated these laws, we could be fined, criminally charged, otherwise sanctioned by regulators, or we could be subject to liability and clean-up costs. These risks can apply to both current and legacy operations and sites. From time to time, we may be involved in litigation over these issues. The amount and timing of costs under environmental laws are difficult to predict and there can be no assurance that these costs will not have an adverse effect on our financial performance.
ITEM 1B. UNRESOLVED STAFF COMMENTS
None.
ITEM 2. PROPERTIES
We own or lease numerous facilities worldwide, which house general offices, including our corporate headquarters located in Stamford, Connecticut, sales offices, service locations, data centers, call centers and parcel and mail processing facilities. Our research and development facilities are located in Noida and Pune, India and Shelton, Connecticut. Management believes that our facilities are in good operating condition and adequate for our current business needs.
12
ITEM 3. LEGAL PROCEEDINGS
In the ordinary course of business, we are routinely defendants in, or party to, a number of pending and threatened legal actions. These may involve litigation by or against us relating to, among other things, contractual rights under vendor, insurance or other contracts; intellectual property or patent rights; equipment, service, payment or other disputes with clients; or disputes with employees. Some of these actions may be brought as a purported class action on behalf of a purported class of employees, clients or others.
In August 2018, the Company, certain of its directors, officers and several banks who served as underwriters, were named as defendants in City of Livonia Retiree Health and Disability Benefits Plan v. Pitney Bowes Inc. et al.
,
a putative class action lawsuit filed in Connecticut state court. The complaint asserts claims under the Securities Act of 1933, as amended, on behalf of those who purchased notes issued by the Company in connection with a September 13, 2017 offering, alleging, among other things, that the Company failed to make certain disclosures relating to components of its third quarter 2017 performance at the time of the notes offering. The complaint seeks compensatory damages and other relief. In addition, in December 2018 and then in February 2018 certain of the Company’s officers and directors were named as defendants in two virtually identical derivative actions purportedly brought on behalf of the Company, Clem v. Lautenbach et al. and Devolin v. Lautenbach et al. These two actions, both filed by the same counsel in Connecticut state court allege, among other things, breaches of fiduciary duty relating to these same disclosures, and seek compensatory damages and other relief derivatively for the benefit of the Company. Although litigation outcomes are inherently unpredictable, we believe these matters are without merit and intend to defend them vigorously. A reasonable estimate of the amount of any possible loss or range of loss cannot be made at this time.
ITEM 4. MINE SAFETY DISCLOSURES
Not applicable.
13
PART II
ITEM 5. MARKET FOR THE COMPANY'S COMMON EQUITY, RELATED STOCKHOLDER MATTERS AND ISSUER PURCHASES OF EQUITY SECURITIES
Our common stock is traded under the symbol "PBI" and is principally traded on the New York Stock Exchange (NYSE). At
January 31, 2019
, we had
14,808
common stockholders of record.
Share Repurchases
We periodically repurchase shares of our common stock to manage the dilution created by shares issued under employee stock plans and for other purposes. During 2018, we did not repurchase any shares of our common stock. On February 4, 2019, the Board of Directors authorized an additional $100 million share repurchase giving us the ability to repurchase up to $121 million of our common stock.
Stock Performance Graph
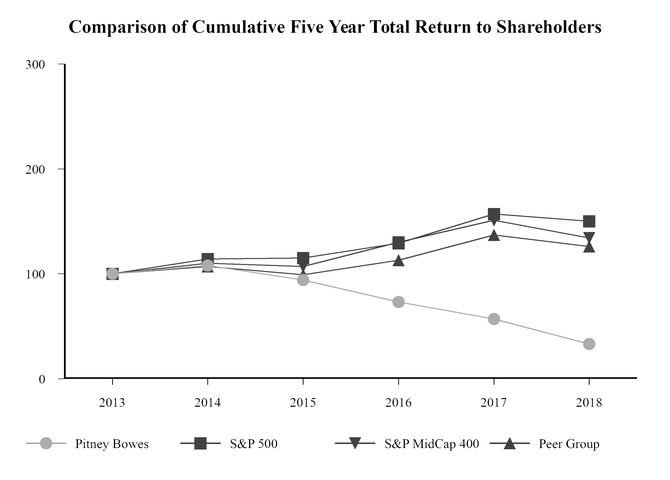
Our peer group is comprised of: Alliance Data Systems Corporation, Deluxe Corporation, Diebold, Incorporated, EchoStar Corp., Fidelity National Information Services, Inc., Fiserv, Inc., NCR Corp., NetApp Inc., Pitney Bowes Inc., R.R. Donnelley & Sons Company, Rockwell Automation Inc., Teradata Corp., Unisys Corporation, The Western Union Company and Xerox Corporation.
The accompanying graph shows the annual change in the value of a $100 investment in Pitney Bowes Inc., the Standard and Poor's (S&P) 500 Composite Index, the S&P MidCap 400 and the peer group over a five-year period assuming the reinvestment of dividends. On a total return basis, a $100 investment on
December 31, 2013
in Pitney Bowes Inc., the S&P 500 Composite Index, the S&P MidCap 400 and the peer group would have been worth
$33
,
$150
,
$134
, and
$126
respectively, on
December 31, 2018
.
All information is based upon data independently provided to us by Standard & Poor's Corporation and is derived from their official total return calculation. Total return for the S&P 500 and S&P MidCap 400 Composite Indexes and each peer group is based on market capitalization, weighted for each year. The stock price performance is not necessarily indicative of future stock price performance.
14
ITEM 6. SELECTED FINANCIAL DATA
The following table of selected financial data should be read in conjunction with the more detailed consolidated financial statements and related notes thereto included in Item 8 of this Form 10-K. Effective January 1, 2018, we adopted ASU 2014-09,
Revenue from Contracts with Customers
on a modified retrospective basis with a cumulative effect adjustment at the date of initial application. Accordingly, periods prior to January 1, 2018, have not been restated and are presented under the prior guidance (see Note 1 to the Consolidated Financial Statements). Also during 2018, we sold our Document Messaging Technology production mail business and supporting software (the Production Mail Business) and the operating results of the Production Mail Business have been reclassified as a discontinued operation (see Note 4 to the Consolidated Financial Statements).
|
Years Ended December 31,
|
|||||||||||||||||||
|
2018
|
2017
|
2016
|
2015
|
2014
|
|||||||||||||||
|
Total revenue
|
$
|
3,522,380
|
|
$
|
3,123,272
|
|
$
|
2,981,323
|
|
$
|
3,135,234
|
|
$
|
3,326,373
|
|
||||
|
Amounts attributable to common stockholders:
|
|||||||||||||||||||
|
Income from continuing operations
|
$
|
199,978
|
|
$
|
221,362
|
|
$
|
75,769
|
|
$
|
363,623
|
|
$
|
246,951
|
|
||||
|
Income from discontinued operations
|
23,687
|
|
39,978
|
|
17,036
|
|
44,320
|
|
86,804
|
|
|||||||||
|
Net income - Pitney Bowes Inc.
|
$
|
223,665
|
|
$
|
261,340
|
|
$
|
92,805
|
|
$
|
407,943
|
|
$
|
333,755
|
|
||||
|
Basic earnings per share attributable to common stockholders
(1)
:
|
|
||||||||||||||||||
|
Continuing operations
|
$
|
1.07
|
|
$
|
1.19
|
|
$
|
0.40
|
|
$
|
1.82
|
|
$
|
1.22
|
|
||||
|
Discontinued operations
|
0.13
|
|
0.21
|
|
0.09
|
|
0.22
|
|
0.43
|
|
|||||||||
|
Net income - Pitney Bowes Inc.
|
$
|
1.19
|
|
$
|
1.40
|
|
$
|
0.49
|
|
$
|
2.04
|
|
$
|
1.65
|
|
||||
|
Diluted earnings per share attributable to common stockholders
(1)
:
|
|||||||||||||||||||
|
Continuing operations
|
$
|
1.06
|
|
$
|
1.18
|
|
$
|
0.40
|
|
$
|
1.81
|
|
$
|
1.21
|
|
||||
|
Discontinued operations
|
0.13
|
|
0.21
|
|
0.09
|
|
0.22
|
|
0.43
|
|
|||||||||
|
Net income - Pitney Bowes Inc.
|
$
|
1.19
|
|
$
|
1.39
|
|
$
|
0.49
|
|
$
|
2.03
|
|
$
|
1.64
|
|
||||
|
Cash dividends paid per share of common stock
|
$
|
0.75
|
|
$
|
0.75
|
|
$
|
0.75
|
|
$
|
0.75
|
|
$
|
0.75
|
|
||||
|
Balance sheet data:
|
|||||||||||||||||||
|
December 31,
|
|||||||||||||||||||
|
2018
|
2017
|
2016
|
2015
|
2014
|
|||||||||||||||
|
Total assets
|
$
|
5,972,903
|
|
$
|
6,687,420
|
|
$
|
5,837,133
|
|
$
|
6,123,132
|
|
$
|
6,476,599
|
|
||||
|
Long-term debt
|
$
|
3,066,073
|
|
$
|
3,559,278
|
|
$
|
2,750,405
|
|
$
|
2,489,583
|
|
$
|
2,904,024
|
|
||||
|
Total debt
|
$
|
3,265,608
|
|
$
|
3,830,335
|
|
$
|
3,364,890
|
|
$
|
2,950,668
|
|
$
|
3,228,903
|
|
||||
|
Noncontrolling interests (Preferred stockholders' equity in subsidiaries)
|
$
|
—
|
|
$
|
—
|
|
$
|
—
|
|
$
|
296,370
|
|
$
|
296,370
|
|
||||
|
(1)
|
The sum of earnings per share may not equal the totals due to rounding.
|
15
ITEM 7.
MANAGEMENT'S DISCUSSION AND ANALYSIS OF FINANCIAL CONDITION AND RESULTS OF
OPERATIONS
The following discussion and analysis should be read in conjunction with our risk factors, consolidated financial statements and related notes. This discussion and analysis contains forward-looking statements based on management's current expectations, estimates and projections and involves risks and uncertainties. Actual results may differ significantly from those currently expressed in our forward-looking statements as a result of various factors, including those factors described under "Forward-Looking Statements" and "Risk Factors" contained elsewhere in this Annual Report. All table amounts are presented in millions of dollars, except per share data.
Overview
We continue to make solid progress in our transformation to higher growth markets that align with our focus on reducing the complexity of mailing and shipping. In line with our transformation and strategic focus on shipping, we sold our Production Mail Business in July 2018. Proceeds from the sale were approximately $340 million and were used primarily to repay debt.
Financial Results Summary - Twelve Months Ended December 31:
|
2018
|
2017
|
Change
|
||||||
|
Revenue
|
$
|
3,522
|
|
$
|
3,123
|
|
13
|
%
|
|
Segment earnings before interest and taxes (EBIT)
|
$
|
623
|
|
$
|
661
|
|
(6
|
)%
|
|
Income from continuing operations
|
$
|
200
|
|
$
|
221
|
|
(10
|
)%
|
|
Net income
|
$
|
224
|
|
$
|
261
|
|
(14
|
)%
|
|
Earnings per share from continuing operations - diluted
|
$
|
1.06
|
|
$
|
1.18
|
|
(10
|
)%
|
|
Net cash provided by operations
|
$
|
392
|
|
$
|
496
|
|
(21
|
)%
|
Revenue increased
13%
over the prior year, representing the second consecutive year of overall revenue growth. The increase in revenue was driven by growth of 47% in Commerce Services, as Global Ecommerce increased 85% and Presort Services grew 4%. Revenue in our SMB Solutions business declined 6%, but we continue to see stabilization in the decline in recurring stream revenues. Software Solutions revenue increased 3%, primarily due to higher data license revenue.
Segment earnings before interest and taxes declined 6% largely due to the overall portfolio shift to higher growth, but lower margin, digital and shipping solutions and continued investments in Commerce Services. Commerce Services EBIT declined 48% primarily due to higher labor and transportation costs and the cost of a marketing mail pilot program in Presort Services. SMB EBIT declined 2% primarily due to declining revenues partially offset by cost savings. Software Solutions EBIT increased 39% primarily due to higher data license revenue and cost savings. Segment EBIT is determined by deducting from segment revenue the related costs and expenses attributable to the segment. Segment EBIT excludes interest, taxes, general corporate expenses, restructuring charges and other items not allocated to a particular business segment. See Note 3 to the Consolidated Financial Statements for a reconciliation of Segment EBIT to net income reported on a GAAP basis.
Income from continuing operations declined 10% from the prior year driven by lower overall margins as our portfolio continues to shift to higher growth, but lower margin businesses, and a $32 million non-cash pension settlement charge, partially offset by lower selling, general and administrative costs and lower restructuring costs.
During the year, we received net proceeds of $270 million from the sale of the Production Mail Business and repatriated $550 million of cash from our foreign subsidiaries. Cash was used to repay
$570 million
of debt, pay dividends of
$140 million
to our stockholders, and invest
$191 million
in capital expenditures. Cash and cash equivalents at December 31, 2018 was $867 million.
Outlook
We will continue to execute our transformation strategy around our three core principles: invest in offerings that reduce the complexity of mailing and shipping for our clients; continue to focus on operational excellence initiatives to reduce costs; and integrate and leverage technologies across the enterprise.
We expect revenue to grow as we continue to transform the portfolio to higher growth businesses. Within Global Ecommerce, we expect revenue growth from the expansion of our domestic parcel and fulfillment business, growth in domestic shipping solutions and cross sale opportunities of our cross-border products. Higher volumes of bound and packet mail are expected to generate revenue growth at Presort Services.
16
In SMB Solutions, we expect continued declines in revenue due to lower mail volumes and lower lease opportunities. However, we expect the magnitude of the decline to be mitigated by the continued success of our SendPro C-Series product in North America and planned launches in several international markets and the introduction of new services and products, including expanded third-party finance offerings and value-added shipping capabilities.
Within Software Solutions, revenue growth will be driven by a combination of sales opportunities from our indirect channel, software and data license deals, SaaS revenue and maintenance revenue.
We will begin offering expanded third-party finance offerings to our existing SMB client base in the United States in 2019. Under this program, in addition to leasing options for our mailing equipment products, we will offer financing alternatives to lease other manufacturers' equipment to meet their business needs. We expect that cash flows will be reduced by $50 million to $70 million in 2019 as we invest in the origination of third-party equipment leases and build a finance receivable portfolio.
We expect continued progress in our efforts to improve productivity and reduce spend. Over the last five years, we have transformed to a more digital operating model and have reduced our cost structure. Last year, we announced our intention to reduce gross spend by $200 million over a 24-month period. We recognized over $150 million of this target in 2018 and expect to recognize the remainder in 2019. A large portion of these gross savings has been, and will continue to be, reinvested in the business, particularly in Commerce Services and our third-party financing initiative. We are also addressing immediate challenges such as higher labor and transportation costs.
In January 2019, we sold the direct operations and moved to a dealer model in six smaller markets within International Mailing. The impact on 2019 revenue is estimated to be about $40 million and the impact on earnings will not be significant. Proceeds from the sale were not material.
As our business continues to transform to higher growth markets, we need to increase our financial flexibility to be able to pursue opportunities in growth markets and create value for our shareholders. Accordingly, our Board of Directors approved a first quarter 2019 dividend on our common stock of $0.05 per share; down from our historical $0.1875 quarterly dividend per share, and authorized an incremental $100 million share repurchase. These changes in our capital allocation strategy more appropriately reflect our business profile today and are designed to provide a competitive return to our shareholders while ensuring financial flexibility to support our long-term growth strategy.
17
RESULTS OF OPERATIONS
Revenue by source and the related cost of revenue are shown in the following tables:
|
Revenue
|
% change
|
||||||||||||||||||||||
|
Years Ended December 31,
|
Actual
|
Constant Currency
|
|||||||||||||||||||||
|
2018
|
2017
|
2016
|
2018
|
2017
|
2018
|
2017
|
|||||||||||||||||
|
Equipment sales
|
$
|
430
|
|
$
|
477
|
|
$
|
480
|
|
(10
|
)%
|
(1
|
)%
|
(10
|
)%
|
(1
|
)%
|
||||||
|
Supplies
|
218
|
|
231
|
|
242
|
|
(6
|
)%
|
(4
|
)%
|
(7
|
)%
|
(4
|
)%
|
|||||||||
|
Software
|
341
|
|
332
|
|
326
|
|
3
|
%
|
2
|
%
|
3
|
%
|
2
|
%
|
|||||||||
|
Rentals
|
363
|
|
384
|
|
410
|
|
(5
|
)%
|
(6
|
)%
|
(6
|
)%
|
(7
|
)%
|
|||||||||
|
Financing
|
315
|
|
331
|
|
366
|
|
(5
|
)%
|
(10
|
)%
|
(5
|
)%
|
(10
|
)%
|
|||||||||
|
Support services
|
293
|
|
300
|
|
329
|
|
(2
|
)%
|
(9
|
)%
|
(3
|
)%
|
(9
|
)%
|
|||||||||
|
Business services
|
1,562
|
|
1,068
|
|
828
|
|
46
|
%
|
29
|
%
|
46
|
%
|
29
|
%
|
|||||||||
|
Total revenue
|
$
|
3,522
|
|
$
|
3,123
|
|
$
|
2,981
|
|
13
|
%
|
5
|
%
|
12
|
%
|
5
|
%
|
||||||
|
Cost of Revenue
|
||||||||||||||||||||
|
Years Ended December 31,
|
||||||||||||||||||||
|
|
2018
|
2017
|
2016
|
|||||||||||||||||
|
|
$
|
% of revenue
|
$
|
% of revenue
|
$
|
% of revenue
|
||||||||||||||
|
Cost of equipment sales
|
$
|
182
|
|
42.2
|
%
|
$
|
201
|
|
42.2
|
%
|
$
|
203
|
|
42.3
|
%
|
|||||
|
Cost of supplies
|
61
|
|
27.9
|
%
|
66
|
|
28.7
|
%
|
66
|
|
27.1
|
%
|
||||||||
|
Cost of software
|
101
|
|
29.5
|
%
|
95
|
|
28.6
|
%
|
96
|
|
29.5
|
%
|
||||||||
|
Cost of rentals
|
86
|
|
23.8
|
%
|
83
|
|
21.5
|
%
|
74
|
|
18.1
|
%
|
||||||||
|
Financing interest expense
|
49
|
|
15.5
|
%
|
51
|
|
15.3
|
%
|
55
|
|
15.1
|
%
|
||||||||
|
Cost of support services
|
168
|
|
57.3
|
%
|
164
|
|
54.7
|
%
|
166
|
|
50.5
|
%
|
||||||||
|
Cost of business services
|
1,246
|
|
79.8
|
%
|
773
|
|
72.4
|
%
|
569
|
|
68.7
|
%
|
||||||||
|
Total cost of revenue
|
$
|
1,893
|
|
53.7
|
%
|
$
|
1,433
|
|
45.9
|
%
|
$
|
1,229
|
|
41.2
|
%
|
|||||
The discussion below may also refer to revenue growth on a constant currency basis. Constant currency measures exclude the impact of changes in foreign currency exchange rates since the prior period under comparison and are intended to provide a better understanding of the underlying revenue performance excluding the impacts of currency exchange rates on reported revenue. Constant currency change is calculated by converting the current period non-U.S. dollar denominated revenue using the prior year’s exchange rate. Where constant currency measures are not provided, the actual change and constant currency change are the same.
Equipment sales
Equipment sales decreased
10%
in
2018
compared to
2017
, primarily due to:
|
•
|
8% from lower equipment sales in North America Mailing reflecting a decline in sales of our higher-end products; and
|
|
•
|
2% from lower equipment sales in International Mailing, primarily due to lower sales in the U.K. and France.
|
Cost of equipment sales as a percentage of equipment sales revenue of
42.2%
was flat to prior year.
Equipment sales decreased
1%
in
2017
compared to
2016
primarily due to:
|
•
|
2% from lower equipment sales in International Mailing particularly in Europe; partially offset by
|
|
•
|
1% from higher equipment sales in North America Mailing reflecting a favorable comparison to the 2016 period, which was impacted by the implementation of the enterprise business platform.
|
Cost of equipment sales as a percentage of equipment sales revenue of
42.2%
was consistent with the prior year.
Supplies
Supplies revenue decreased
6%
on a reported basis and
7%
on a constant currency basis in 2018 compared to 2017, driven by a 4% decline North America Mailing and 3% decline in International Mailing due to a global decline in installed mailing equipment and postage volumes. Cost of supplies as a percentage of supplies revenue improved to
27.9%
in 2018 compared to
28.7%
due to a favorable mix of sales in North America Mailing.
18
Supplies revenue decreased
4%
in 2017 compared to 2016 primarily from a decline in installed mailing equipment and postage volumes in North America Mailing. Cost of supplies as a percentage of supplies revenue increased to
28.7%
primarily due to higher mix of lower margin products.
Software
Software revenue increased
3%
in 2018 compared to 2017 primarily due to higher data licensing revenue. Cost of software as a percentage of software revenue increased to
29.5%
in 2018 as data licenses have slightly lower margins than traditional software licenses due to royalty payments that are made on data licenses.
Software revenue increased
2%
in 2017 compared to 2016 primarily due to higher software licensing, data and SaaS revenue. Cost of software as a percentage of software revenue decreased to
28.6%
primarily due to the increase in high margin licensing revenue and cost reduction initiatives.
Rentals
Rentals revenue decreased
5%
(
6%
on a constant currency basis) in 2018 compared to 2017 and
6%
(
7%
on a constant currency basis) in 2017 compared to 2016 primarily due to a declining meter population.
Cost of rentals as a percentage of rentals revenue increased to
23.8%
in 2018 and increased to
21.5%
in 2017 primarily due to higher scrapping costs associated with retiring aging meters.
Financing
Financing revenue decreased
5%
in 2018 compared to 2017 and
10%
in 2017 compared to 2016 primarily due to a declining portfolio and lower fees.
We allocate a portion of our total borrowing costs to financing interest expense. In computing financing interest expense, we assume an 8:1 debt to equity leverage ratio and apply our overall effective interest rate to the average outstanding finance receivables.
Support Services
Support services revenue decreased
2%
(
3%
on a constant currency basis) in 2018 compared to 2017 and
9%
in 2017 compared to 2016 primarily due to a worldwide decline in installed mailing equipment. Cost of support services as a percentage of support services revenue increased to
57.3%
in 2018 and increased to
54.7%
in 2017 primarily due to the decline in support services revenue.
Business Services
Business services revenue increased
46%
in 2018 compared to 2017 primarily due to:
|
•
|
39% from the acquisition of Newgistics;
|
|
•
|
5% from growth in Global Ecommerce driven by higher revenue from shipping solutions, partially offset by lower cross-border revenue due to lower volumes; and
|
|
•
|
2% from higher volumes of mail processed in Presort Services.
|
Cost of business services as a percentage of business services revenue increased to
79.8%
in 2018 primarily due to continued investment in Global Ecommerce, higher labor and transportation costs in Commerce Services of $40 million driven by increased competition for labor and transportation resources due to the rapid growth in Ecommerce and $8 million from the launch of a marketing mail pilot program in Presort Services.
Business services revenue increased
29%
in 2017 compared to 2016 primarily due to:
|
•
|
17% from the acquisition of Newgistics;
|
|
•
|
9% from growth in Global Ecommerce due to higher cross-border and retail volumes; and
|
|
•
|
3% from higher volumes of mail processed in Presort Services.
|
Cost of business services as a percentage of business services revenue increased to
72.4%
in 2017 primarily due to continued investment in our Global Ecommerce segment and the additional costs of Newgistics.
Selling, general and administrative (SG&A)
SG&A expense
decreased
4%
, or
$48 million
, in 2018 compared to 2017, despite $51 million of incremental expenses from the acquisition of Newgistics. The underlying decrease in SG&A was primarily due to lower employee related expenses of $38 million, lower marketing and advertising spend of $34 million, and other operating expense cost reductions as a result of our cost savings initiatives.
SG&A expense
increased
3%
, or
$31 million
, in 2017 compared to 2016. Contributing to this increase was higher compensation-related costs of $28 million due to the reinstatement of our annual variable compensation program and higher stock-based compensation expense. Each of these programs are tied to our performance against pre-established targets and costs in 2016 were significantly lower than in
19
2017. Additionally, expenses in Global Ecommerce were $21 million higher as we continue to invest in the business, we incurred $17 million of additional expense from Newgistics, $9 million of higher marketing expenses, $9 million of higher residual losses on leased equipment due to the timing of trade-up activity and $9 million of acquisition transaction costs, primarily related to Newgistics. Offsetting these increases was approximately $63 million of benefits from productivity initiatives and a $6 million pre-tax gain from the sale of technology. Additionally, 2017 included loan forgiveness income of $10 million and a favorable state sales tax adjustment of $5 million.
Restructuring charges and asset impairments, net
In 2018, restructuring charges and asset impairments of
$27 million
consisted of $25 million of restructuring related charges and $2 million of asset impairment charges. In 2017, restructuring charges and asset impairments of
$56 million
consisted of $52 million of restructuring related charges and $4 million of asset impairment charges. In 2016, restructuring charges and asset impairments of
$60 million
consisted of $45 million of restructuring related charges and $15 million of asset impairment charges, primarily from a loss of $5 million from the sale of a facility and an impairment charge of $4 million related to another facility.
Goodwill impairment
In 2016, we recorded a non-cash goodwill impairment charge of
$148 million
associated with our Software Solutions reporting unit.
Other components of net pension and postretirement cost
In connection with the disposition of the Production Mail Business and certain other actions, we incurred a pre-tax, non-cash pension settlement charge of $45 million in the fourth quarter of 2018. We recognized $32 million of this charge in other components of net pension and postretirement cost and the remaining $13 million in income from discontinued operations, net of tax.
Other expense
Other expense for 2018 and 2017 represents a loss on the early extinguishment of debt.
Income taxes
The effective tax rate was 5.8% and 0.2% for the year ended December 31, 2018 and 2017, respectively. On December 22, 2017, the Tax Cuts and Jobs Act of 2017 (the Act) was signed into law making significant changes to the Internal Revenue Code. Changes included, but were not limited to, a federal corporate income tax rate decrease from 35% to 21% effective January 1, 2018, the transition of U.S. international taxation from a worldwide tax system to a territorial system by creating a minimum tax on earnings of foreign subsidiaries and a one-time transition tax on the mandatory deemed repatriation of post-1986 cumulative foreign earnings.
In accordance with the Act, the tax provision at December 31, 2017 included a net provisional one-time non-cash benefit of $39 million, comprised of a provisional $130 million benefit from the remeasurement of net U.S. deferred tax liabilities arising from a lower U.S. tax rate, offset by a provisional $91 million charge related primarily to the U.S. tax on unremitted post-1986 earnings of our foreign subsidiaries. The effective tax rate for
2017
also included tax benefits of $
30 million
from the resolution of certain tax examinations.
Staff Accounting Bulletin No. 118 (SAB 118) was issued to address the application of U.S. GAAP in situations when a registrant does not have the necessary information available, prepared, or analyzed (including computations) in reasonable detail to complete the accounting for certain income tax effects of the Act. SAB 118 provided registrants up to one year to complete the analysis, computations and accounting for the impact of the Act on their consolidated financial statements.
We completed our analysis and measurement of the impact of the Act. Our tax provision for the year ended December 31, 2018 includes an adjustment to the provisional tax recorded of $37 million, comprised of a $13 million benefit related to the remeasurement of certain deferred tax assets and liabilities and a $24 million decrease in the U.S. tax on unremitted post-1986 earnings of our foreign subsidiaries. The effective tax rate for
2018
also includes a benefit of $17 million from the resolution of certain tax examinations.
See Note 15 to the Consolidated Financial Statements for further information.
Income from discontinued operations
Income from discontinued operations includes net income and a gain on sale of our Production Mail Business. See Note 4 to the Consolidated Financial Statements for further information.
Preferred stock dividends of subsidiaries attributable to noncontrolling interests
We redeemed all of the PBIH Preferred Stock in November 2016.
20
Business Segments
In January 2018, we revised our business reporting groups to reflect how we manage these groups and clients served in each market. We formed the Commerce Services group to include our Global Ecommerce and Presort Services segments. Additionally, we classified the operating results of the Production Mail Business to discontinued operations and have recast segment operating results for prior years to conform to the current year presentation. The principal products and services of each of our reportable segments are as follows:
Commerce Services:
Global Ecommerce:
Includes the worldwide revenue and related expenses from cross-border ecommerce transactions, domestic retail and ecommerce shipping solutions and fulfillment, delivery and return services.
Presort Services
: Includes revenue and related expenses from sortation services that allow clients to qualify large volumes of First Class Mail, Marketing Mail and Bound and Packet Mail (Standard Flats and Bound Printed Matter) for postal worksharing discounts.
Small & Medium Business (SMB) Solutions:
North America Mailing
: Includes the revenue and related expenses from mailing and shipping solutions, financing, services and supplies for small and medium businesses to efficiently create mail, evidence postage and help simplify and save on the sending, tracking and receiving of letters, parcels and flats in the U.S. and Canada.
International Mailing
: Includes the revenue and related expenses from mailing and shipping solutions, financing, services and supplies for small and medium businesses to efficiently create mail, evidence postage and help simplify and save on the sending, tracking and receiving of letters, parcels and flats in areas outside the U.S. and Canada.
Software Solutions:
Includes the worldwide revenue and related expenses from the licensing of customer engagement, customer information, location intelligence software, data solutions and related support services.
Management uses segment earnings before interest and taxes (EBIT) to measure profitability and performance at the segment level and believes that it provides a useful measure of operating performance and underlying trends of the businesses. We determine segment EBIT by deducting from segment revenue the related costs and expenses attributable to the segment. Segment EBIT excludes interest, taxes, general corporate expenses, restructuring charges and other items not allocated to a particular business segment. Segment EBIT may not be indicative of our overall consolidated performance and should be read in conjunction with our consolidated results of operations. Due to acquisition activity in Commerce Services, we are also providing segment earnings before interest, taxes, depreciation and amortization (EBITDA) as a supplemental non-GAAP measure of profit and operational performance for each segment. See Note 3 to the Consolidated Financial Statements for a reconciliation of segment EBIT to net income.
Revenue and EBIT by business segment are presented in the tables below. The sum of the individual segments in the tables above may not equal the totals due to rounding.
|
Revenue
|
% change
|
||||||||||||||||||||||
|
Years Ended December 31,
|
Actual
|
Constant Currency
|
|||||||||||||||||||||
|
2018
|
2017
|
2016
|
2018
|
2017
|
2018
|
2017
|
|||||||||||||||||
|
Global Ecommerce
|
$
|
1,023
|
|
$
|
552
|
|
$
|
339
|
|
85
|
%
|
63
|
%
|
85
|
%
|
63
|
%
|
||||||
|
Presort Services
|
516
|
|
498
|
|
476
|
|
4
|
%
|
5
|
%
|
4
|
%
|
5
|
%
|
|||||||||
|
Commerce Services
|
1,539
|
|
1,050
|
|
815
|
|
47
|
%
|
29
|
%
|
46
|
%
|
29
|
%
|
|||||||||
|
North America Mailing
|
1,275
|
|
1,357
|
|
1,429
|
|
(6
|
)%
|
(5
|
)%
|
(6
|
)%
|
(5
|
)%
|
|||||||||
|
International Mailing
|
368
|
|
384
|
|
412
|
|
(4
|
)%
|
(7
|
)%
|
(7
|
)%
|
(6
|
)%
|
|||||||||
|
SMB Solutions
|
1,643
|
|
1,742
|
|
1,841
|
|
(6
|
)%
|
(5
|
)%
|
(6
|
)%
|
(5
|
)%
|
|||||||||
|
Software Solutions
|
341
|
|
332
|
|
325
|
|
3
|
%
|
2
|
%
|
3
|
%
|
2
|
%
|
|||||||||
|
Total Revenue
|
$
|
3,522
|
|
$
|
3,123
|
|
$
|
2,981
|
|
13
|
%
|
5
|
%
|
12
|
%
|
5
|
%
|
||||||
21
|
EBIT
|
|||||||||||||||||
|
Years Ended December 31,
|
% change
|
||||||||||||||||
|
2018
|
2017
|
2016
|
2018
|
2017
|
|||||||||||||
|
Global Ecommerce
|
$
|
(32
|
)
|
$
|
(18
|
)
|
$
|
3
|
|
(81
|
)%
|
>(100)%
|
|
||||
|
Presort Services
|
74
|
|
98
|
|
95
|
|
(24
|
)%
|
2
|
%
|
|||||||
|
Commerce Services
|
41
|
|
80
|
|
98
|
|
(48
|
)%
|
(19
|
)%
|
|||||||
|
North America Mailing
|
470
|
|
499
|
|
595
|
|
(6
|
)%
|
(16
|
)%
|
|||||||
|
International Mailing
|
64
|
|
49
|
|
45
|
|
32
|
%
|
7
|
%
|
|||||||
|
SMB Solutions
|
534
|
|
547
|
|
640
|
|
(2
|
)%
|
(15
|
)%
|
|||||||
|
Software Solutions
|
47
|
|
34
|
|
22
|
|
39
|
%
|
53
|
%
|
|||||||
|
Total segment EBIT
|
$
|
623
|
|
$
|
661
|
|
$
|
761
|
|
(6
|
)%
|
(13
|
)%
|
||||
|
EBITDA
|
|||||||||||||||||
|
Years Ended December 31,
|
% change
|
||||||||||||||||
|
2018
|
2017
|
2016
|
2018
|
2017
|
|||||||||||||
|
Global Ecommerce
|
$
|
29
|
|
$
|
19
|
|
$
|
34
|
|
53
|
%
|
(44
|
)%
|
||||
|
Presort Services
|
101
|
|
124
|
|
123
|
|
(19
|
)%
|
1
|
%
|
|||||||
|
Commerce Services
|
129
|
|
143
|
|
157
|
|
(9
|
)%
|
(9
|
)%
|
|||||||
|
North America Mailing
|
539
|
|
563
|
|
655
|
|
(4
|
)%
|
(14
|
)%
|
|||||||
|
International Mailing
|
80
|
|
67
|
|
65
|
|
19
|
%
|
3
|
%
|
|||||||
|
SMB Solutions
|
618
|
|
630
|
|
720
|
|
(2
|
)%
|
(12
|
)%
|
|||||||
|
Software Solutions
|
57
|
|
43
|
|
37
|
|
32
|
%
|
16
|
%
|
|||||||
|
Total segment EBITDA
|
804
|
|
816
|
|
913
|
|
(1
|
)%
|
(11
|
)%
|
|||||||
|
Less: Segment depreciation and amortization
|
182
|
|
156
|
|
153
|
|
17
|
%
|
2
|
%
|
|||||||
|
Total segment EBIT
|
$
|
623
|
|
$
|
661
|
|
$
|
761
|
|
(6
|
)%
|
(13
|
)%
|
||||
Global Ecommerce
Global Ecommerce revenue increased
85%
in 2018 compared to 2017. Excluding Newgistics, Global Ecommerce revenue increased 13% driven by higher revenue from shipping solutions, partially offset by lower cross-border revenue due to lower volumes.
EBIT in 2018 was a loss of
$32 million
compared to a loss of
$18 million
in 2017. The increase in EBIT loss was primarily due to higher amortization expense of $12 million due to a full year of amortization related to Newgistics, higher transportation and labor costs of $6 million due to increased competition for labor and transportation resources as a result of the rapid growth in Ecommerce, partially offset by higher revenue.
Global Ecommerce revenue increased
63%
in 2017 compared to 2016 primarily due to:
|
•
|
41% from the acquisition of Newgistics;
|
|
•
|
12% from higher domestic ecommerce shipping revenues;
|
|
•
|
6% from higher cross-border marketplace volumes, particularly in the UK; and
|
|
•
|
4% from higher retail volumes.
|
EBIT was a loss of
18 million
in 2017 primarily due to investments in market growth opportunities and additional amortization expense from the acquisition of Newgistics.
Presort Services
Presort Services revenue increased
4%
in 2018 compared to 2017 primarily due to higher volumes of First Class mail, Standard Class mail and bound and packet mail processed. Revenue increased
5%
in 2017 compared to 2016 primarily due to higher volumes and revenue per piece of mail processed.
22
EBIT decreased
24%
in 2018 compared to 2017 primarily due to higher labor and transportation costs of $34 million due to increased competition for labor and transportation resources and $8 million from the launch of a marketing mail pilot program. EBIT increased
2%
in 2017 compared to 2016 primarily due to higher revenue.
North America Mailing
North America Mailing revenue decreased
6%
in 2018 compared to 2017 primarily due to:
|
•
|
3% from lower equipment sales due to a decline in top of the line products;
|
|
•
|
2% from declines in rentals and support services revenue; and
|
|
•
|
1% from lower financing revenue.
|
EBIT decreased
6%
primarily due to the decline in revenue and sales of top of the line products partially offset by lower expenses.
North America Mailing revenue decreased
5%
in 2017 compared to 2016 primarily due to:
|
•
|
3% from declines in rentals and support services revenue due to a decline in installed mailing equipment and lower postage volumes; and
|
|
•
|
2% from lower financing revenue primarily due to a declining lease portfolio and lower fee income.
|
EBIT decreased
16%
primarily due to the decline in revenue and margins.
International Mailing
International Mailing revenue declined
4%
in 2018 compared to 2017. On a constant currency basis, revenue declined
7%
primarily due to:
|
•
|
4% from lower stream revenues resulting from a lower installed meter base, declining postage volumes and a declining lease portfolio; and
|
|
•
|
3% from lower equipment sales, primarily in the U.K., France and Italy, partly offset by higher sales in Germany.
|
EBIT increased
32%
in 2018 compared to 2017 primarily due to lower expenses.
International Mailing revenue declined
7%
in 2017 compared to 2016. On a constant currency basis, revenue decreased
6%
primarily due to:
|
•
|
3% from lower equipment sales particularly in Europe; and
|
|
•
|
3% from declines in rentals, financing and support services revenue resulting from a decline in installed mailing equipment and the lease portfolio.
|
EBIT increased
7%
in 2017 compared to 2016, primarily due to higher equipment margins and lower expenses.
Software Solutions
Software revenue increased
3%
in 2018 compared to 2017 primarily due to higher data licensing revenue. EBIT increased
39%
primarily due to lower expenses resulting from cost saving initiatives.
Software revenue increased
2%
in 2017 compared to 2016 primarily due to higher software licensing, data and SaaS revenue. EBIT increased
53%
primarily due to an increase in high margin licensing revenue.
23
LIQUIDITY AND CAPITAL RESOURCES
We believe that existing cash and investments, cash generated from operations and borrowing capacity through the capital markets will be sufficient to support our current cash needs, including discretionary uses such as capital investments, strategic acquisitions, dividends and share repurchases. Cash and cash equivalents and short-term investments were
$927 million
at
December 31, 2018
and
$1,058 million
at
December 31, 2017
. We continuously review our credit profile through published credit ratings and the credit default swap market. We also monitor the creditworthiness of those banks acting as derivative counterparties, depository banks or credit providers.
Cash and cash equivalents held by our foreign subsidiaries were
$189 million
and
$608 million
at
December 31, 2018
and
December 31, 2017
, respectively. During 2018, we repatriated over $550 million of cash to the U.S. from our foreign subsidiaries and used a portion of these proceeds to repay debt. Cash and cash equivalents held by our foreign subsidiaries are generally used to support the liquidity needs of these subsidiaries.
Cash Flow Summary
The change in cash and cash equivalents is as follows:
|
Years Ended December 31,
|
|||||||||||
|
2018
|
2017
|
2016
|
|||||||||
|
Net cash provided by operating activities
|
$
|
392
|
|
$
|
496
|
|
$
|
496
|
|
||
|
Net cash provided by (used in) investing activities
|
260
|
|
(663
|
)
|
(116
|
)
|
|||||
|
Net cash (used in) provided by financing activities
|
(766
|
)
|
368
|
|
(230
|
)
|
|||||
|
Effect of exchange rate changes on cash and cash equivalents
|
(25
|
)
|
44
|
|
(27
|
)
|
|||||
|
Change in cash and cash equivalents
(1)
|
$
|
(140
|
)
|
$
|
244
|
|
$
|
124
|
|
||
(1)
Amounts may not foot due to rounding.
Operating activities
Cash flows from operations decreased
$104 million
in
2018
compared to
2017
, primarily due to:
|
•
|
Lower cash from discontinued operations of $58 million; and
|
|
•
|
Lower cash of $45 million from changes in working capital.
|
Cash flows from operations were flat in 2017 compared to 2016 as lower restructuring and pension contribution payments were offset by changes in working capital.
Investing activities
In 2018, investing activities provided $260 million of cash. Sources of cash include gross proceeds of $340 million from the sale of the Production Mail Business and $106 million from investment activities as we liquidated a portion of our investment portfolio to raise cash to support the launch of our enhanced third-party financing offerings. Cash was used to fund capital expenditures of $191 million. The increase in capital expenditures in 2018 compared to 2017 was primarily due to investments in Commerce Services to build new fulfillment and returns distribution facilities and increase automation at our Presort facilities.
In 2017, we used $663 million of cash in investing activities primarily for the acquisition of Newgistics for $471 million and capital expenditures of $168 million.
In 2016, we used $116 million of cash investing activities primarily for capital expenditures of $159 million and acquisitions of $38 million. These uses were offset by a source of $75 million from the timing of investment activities.
Financing activities
In 2018, we used $766 million of cash in financing activities primarily to repay $570 million of debt, pay dividends of $140 million and the settlement of a $46 million timing difference between our investing excess cash at the subsidiary level and the funding of an intercompany cash transfer at December 31, 2017. In 2017, cash from financing activities was $368 million primarily from the issuance of debt of $1,437 million partially offset by debt repayments of $965 million and dividend payments of $139 million. In 2016, cash of $230 million was used in financing activities primarily to repay debt of $461 million, redeem noncontrolling interests for $300 million, repurchase stock for $197 million and pay dividends of $141 million. We also received proceeds of $895 million from the issuance of debt.
24
Debt and Capitalization
We are a "Well-Known Seasoned Issuer" within the meaning of Rule 405 under the Securities Act, which allows us to issue debt securities, preferred stock, preference stock, common stock, purchase contracts, depositary shares, warrants and units in an expedited fashion. We have a committed credit facility of $1 billion that expires in January 2021. As of December 31, 2018 we have not drawn upon the credit facility.
A portion of our debt financing requires compliance with certain financial covenants. The agreements associated with these financial obligations have been amended on occasion to adjust the terms of those covenants for limited time periods. At December 31, 2018, we were in compliance with all financial covenants. For more information on our financial covenants refer to our exhibits.
We have term loans of
$200 million
maturing in 2019 and a total of
$2.3 billion
of debt maturing within the next five years. We fully expect to be able to fund these maturities with cash or by refinancing through the U.S. capital markets. However, our ability to access the U.S. capital markets is dependent upon our credit ratings and is subject to capital market volatility. Given our current credit rating, we may not have immediate or sufficient access to the U.S. capital markets, and when we do access the U.S. capital markets, we may experience reduced flexibility and higher costs.
2018 Activity
In the second quarter of 2018, Standard & Poor's lowered our corporate credit rating from BBB- to BB+. As a result, the stated interest rate on certain of our long term debt issuances increased 0.25% (see Note 13 to the Consolidated Financial Statements).
During 2018, we redeemed the $300 million 6.25% notes due March 2019 and recorded an $8 million loss on the early redemption of debt. We also repaid the $250 million 5.6% notes that matured in March 2018 and $20 million of principal on our term loans. Finally, pursuant to an extension option, the maturity of our $150 million term loan was extended to August 2019.
2017 Activity
In September 2017, we issued $300 million of 3.625% Notes due September 2020 and $400 million of 4.7% Notes due April 2023. Interest is payable semi-annually and is subject to adjustment from time to time based on changes in our credit ratings. Both of these notes may be redeemed, at our option, in whole or in part, at any time at par plus accrued, unpaid interest and a make-whole amount, if any.
In September 2017, we also borrowed $350 million under term loan agreements. The new term loans consist of a $200 million term loan that bears interest at the applicable Eurodollar Rate plus 1.5% and matures in September 2020 and a $150 million term loan that bears interest at the applicable Eurodollar Rate plus 1.125% and matures in August 2018, but includes an option to extend the maturity by one year. For the fourth quarter of 2017, the effective interest rate for the $200 million term loan was 2.78% and the effective interest rate for the $150 million term loan was 2.49%. The interest rates on these term loans are subject to adjustment from time to time based on changes in our credit ratings.
In May 2017, we issued $400 million of 3.875% Notes. Interest is payable semi-annually and is subject to adjustment based on changes in our credit ratings. The notes mature in May 2022, but may be redeemed, at our option, in whole or in part, at any time at par plus accrued, unpaid interest and a make-whole amount, if any. Subsequent to the issuance of these notes, we experienced a change in our credit rating, resulting in an increase in the fixed rate of 0.25% to 4.125%.
In 2017, we repaid a $150 million term loan, the $385 million of 5.75% Notes due in September 2017 and early redeemed the $350 million 4.75% Notes that were due May 2018. Additionally, bondholders of the 5.25% Notes due 2037 caused us to redeem $79 million of the outstanding notes.
Share Repurchases and Dividends
We did not repurchase shares during 2018 or 2017 and repurchased $197 million of our common shares during 2016. We paid dividends to our common stockholders of
$140 million
(
$0.75
per share),
$139 million
(
$0.75
per share) and
$141 million
(
$0.75
per share) in
2018
,
2017
and
2016
, respectively. Each quarter, our Board of Directors considers our recent and projected earnings and other capital needs and priorities in deciding whether to approve the payment, as well as the amount of a dividend. There are no material restrictions on our ability to declare dividends.
In February 2019, the Board of Directors approved a first quarter dividend of $0.05 per share and authorized an additional $100 million share repurchase giving us the ability to repurchase up to $121 million of our shares. Subject to market conditions, we will begin to opportunistically repurchase shares as soon as practical and intend to utilize approximately half of this authorization within the first half of 2019.
25
Contractual Obligations
The following table summarizes our known contractual obligations at
December 31, 2018
and the effect that such obligations are expected to have on our liquidity and cash flow in future periods:
|
Payments due in
|
|||||||||||||||||||
|
Total
|
2019
|
2020-2021
|
2022-2023
|
After 2023
|
|||||||||||||||
|
Debt maturities
|
$
|
3,296
|
|
$
|
200
|
|
$
|
1,330
|
|
$
|
800
|
|
$
|
966
|
|
||||
|
Interest payments on debt
(1)
|
1,120
|
|
154
|
|
251
|
|
139
|
|
576
|
|
|||||||||
|
Noncancelable operating lease obligations
|
231
|
|
48
|
|
76
|
|
45
|
|
62
|
|
|||||||||
|
Purchase obligations (2)
|
168
|
|
163
|
|
4
|
|
1
|
|
—
|
|
|||||||||
|
Pension plan contributions (3)
|
22
|
|
22
|
|
—
|
|
—
|
|
—
|
|
|||||||||
|
Retiree medical payments (4)
|
137
|
|
17
|
|
32
|
|
28
|
|
60
|
|
|||||||||
|
Total
|
$
|
4,974
|
|
$
|
604
|
|
$
|
1,693
|
|
$
|
1,013
|
|
$
|
1,664
|
|
||||
The amount and period of future payments related to our income tax uncertainties cannot be reliably estimated and are not included in the above table. See Note 15 to the Consolidated Financial Statements for further details.
|
(1)
|
Assumes all debt is held to maturity.
|
|
(2)
|
Includes unrecorded agreements to purchase goods and services that are enforceable and legally binding upon us and that specify all significant terms, including fixed or minimum quantities to be purchased; fixed, minimum or variable price provisions; and the approximate timing of the transaction. Purchase obligations exclude agreements that are cancelable without penalty.
|
|
(3)
|
Represents the amount of contributions we anticipate making to our pension plans during 2019. We will assess our funding alternatives as the year progresses and this amount is subject to change.
|
|
(4)
|
Our retiree health benefit plans are nonfunded plans and cash contributions are made each year to cover medical claims costs incurred. The amounts reported in the above table represent our estimate of future payments.
|
Off-Balance Sheet Arrangements
At
December 31, 2018
, we had no off-balance sheet arrangements that have, or are reasonably likely to have, a material current or future effect on our financial condition, results of operations or liquidity.
26
Critical Accounting Estimates
The preparation of our financial statements in conformity with GAAP requires management to make estimates and assumptions about certain items that affect the reported amounts of assets, liabilities, revenues, expenses and accompanying disclosures, including the disclosure of contingent assets and liabilities. The accounting policies below have been identified by management as those accounting policies that are most critical to our financial statements due to the estimates and assumptions required. Management believes that the estimates and assumptions used are reasonable and appropriate based on the information available at the time the financial statements were prepared; however, actual results could differ from those estimates and assumptions. See Note 1 to the Consolidated Financial Statements for a summary of our accounting policies.
Revenue recognition
We derive revenue from multiple sources including sales, rentals, financing and services. Certain transactions are consummated at the same time and can therefore generate revenue from multiple sources. The most common form of these arrangements involve a sale or noncancelable lease of equipment, a meter rental and an equipment maintenance agreement. We are required to determine whether each product and service within the contract should be treated as separate performance obligation (unit of accounting) for revenue recognition purposes. We recognize revenue for performance obligations when control of the products or services is transferred to the customer. Transfer of control may occur at a point in time or over time, depending on the nature of the contract and the performance obligation.
Revenue is allocated among performance obligations based on relative "standalone selling prices" (SSP), which is the price we would sell the good or service to a customer on a separate basis. SSP are established for each performance obligation at the inception of the contract and can be observable prices or estimated. Revenue is allocated to the meter rental and equipment maintenance agreement elements using their respective observable selling prices charged in standalone and renewal transactions. For a sale transaction, the SSP of the equipment is based on a range of observable selling prices in standalone transactions. For a lease transaction, revenue is allocated to the equipment based on the present value of the remaining minimum lease payments accounted for as a sales type lease at inception. The amount allocated to equipment is compared to the range of selling prices in standalone transactions during the period to ensure the allocated equipment amount approximates average selling prices. We recognize revenue on non-lease transactions when control of the equipment transfers to the customer, which is upon delivery for customer installable models and upon installation or customer acceptance for other models.
We also have contracts that contain only performance obligations to deliver software licenses and software related products and services, which may include maintenance and support services, data, training and integration services. As a majority of our software and data license products are considered “right to use”, we recognize revenue when control is transferred to the customer, which is generally upon delivery or acceptance for those licenses requiring significant integration or customization. Revenue from license renewals is recognized at the beginning of the license term. Revenue for software maintenance is recognized on a ratable basis over the contract term. We allocate the transaction price based on relative standalone selling prices, which are generally based on observable selling prices in standalone transactions for our data products, maintenance and professional services. We estimate the standalone selling prices for our software licenses using the residual approach, as the selling prices are highly variable and observable standalone selling prices exist for the other goods and services in the contract.
Pension benefits
The valuation of our pension assets and obligations and the calculation of net periodic pension expense are dependent on assumptions and estimates relating to, among other things, the discount rate (interest rate used to discount the future estimated liability) and the expected rate of return on plan assets. These assumptions are evaluated and updated annually.
The discount rate for our largest plan, the U.S. Qualified Pension Plan (the U.S. Plan) is determined by matching the expected cash flows associated with our benefit obligation to a pool of corporate long-term, high-quality fixed income debt instruments available as of the measurement date. The discount rate for our largest foreign plan, the U.K. Qualified Pension Plan (the U.K. Plan), is determined by using a model that discounts each year's estimated benefit payments by an applicable spot rate derived from a yield curve created from a large number of high quality corporate bonds. The discount rate used in the determination of net periodic pension expense for 2018 was 3.69% for the U.S. Plan and 2.4% for the U.K. Plan. For 2019, the discount rate used in the determination of net periodic pension expense for the U.S. Plan and the U.K. Plan will be 4.34% and 2.65%, respectively. A 0.25% change in the discount rate would impact annual pension expense by less than $1 million for both the U.S. Plan and the U.K. Plan, and the projected benefit obligation of the U.S. Plan and U.K. Plan by $38 million and $22 million, respectively.
Pension assets are exposed to various risks such as interest rate, market and credit risks. We invest our pension plan assets in a variety of investment securities in accordance with our strategic asset allocation policy. The expected return on plan assets is based on historical and expected future returns for current and targeted asset allocations for each asset class in the investment portfolio, adjusted for historical and expected experience of active portfolio management results, as compared to the benchmark returns. The expected rate of return on plan assets used in the determination of net periodic pension expense for 2018 was 7.0% for the U.S. Plan and 6.25% for the U.K. Plan.
27
For 2019, the expected rate of return on plan assets used in the determination of net periodic pension expense for the U.S. Plan will be 6.75% and the U.K. Plan will be 6.25%. A 0.25% change in the expected rate of return on plan assets would impact annual pension expense for the U.S. Plan by $3 million and the U.K. Plan by $1 million.
Actual pension plan results that differ from our assumptions and estimates are accumulated and amortized primarily over the life expectancy of plan participants and affect future pension expense. Net pension expense is also based on a market-related valuation of plan assets where differences between the actual and expected return on plan assets are recognized in the calculation of the market-related value of assets over a five-year period. Plan benefits for participants in a majority of our U.S. and foreign pension plans are frozen.
See Note 14 to the Consolidated Financial Statements for further information about our pension plans.
Residual value of leased assets
Equipment residual values are determined at the inception of the lease using estimates of fair value at the end of the lease term. Residual value estimates impact the determination of whether a lease is classified as an operating lease or a sales-type lease. Fair value estimates of equipment at the end of the lease term are based on historical experience, forecasted supply and demand for our products, product retirement and product launch plans, client behavior, regulatory changes, remanufacturing strategies, used equipment markets, competition and technological changes.
We evaluate residual values on an annual basis or sooner if circumstances warrant. Declines in estimated residual values considered "other-than-temporary" are recognized immediately. Increases in estimated future residual values are not recognized until the equipment is remarketed. If the actual residual value of leased assets were 10% lower than management's current estimates, pre-tax income would be
$7 million
lower.
Allowances for doubtful accounts and credit losses
Finance receivables are comprised of sales-type lease receivables and unsecured revolving loan receivables. We provide an allowance for probable credit losses based on historical loss experience, the nature and volume of our portfolios, adverse situations that may affect a client's ability to pay, prevailing economic conditions and our ability to manage the collateral.
Total allowance for credit losses as a percentage of finance receivables was
1%
at both
December 31, 2018
and 2017. Holding all other assumptions constant, a 0.25% change in the allowance rate at
December 31, 2018
would have reduced pre-tax income by
$4 million
.
Accounts receivable are generally due within 30 days after the invoice date. Accounts deemed uncollectible are written off against the allowance after all collection efforts have been exhausted and management deems the account to be uncollectible. We believe that our accounts receivable credit risk is low because of the geographic and industry diversification of our clients and small account balances for most of our clients.
The allowance for doubtful accounts as a percentage of receivables was
4%
at
December 31, 2018
and
3%
at
December 31, 2017
. Holding all other assumptions constant, a 0.25% change in the allowance rate at
December 31, 2018
would have reduced pre-tax income by
$1 million
.
Income taxes and valuation allowance
We are subject to income taxes in the U.S. and numerous foreign jurisdictions. Our annual tax rate is based on income, statutory tax rates, tax reserve changes and tax planning opportunities available to us in the various jurisdictions in which we operate. Significant judgment is required in determining the annual tax rate and in evaluating our tax positions. We regularly assess the likelihood of tax adjustments in each of the tax jurisdictions in which we have operations and account for the related financial statement implications. Tax reserves have been established that we believe to be appropriate given the possibility of tax adjustments. Determining the appropriate level of tax reserves requires us to exercise judgment regarding the uncertain application of tax laws. The amount of reserves is adjusted when information becomes available or when an event occurs indicating a change in the reserve is appropriate. Future changes in tax reserve requirements could have a material impact on our financial condition or results of operations.
Significant judgment is also required in determining the amount of deferred tax assets that will ultimately be realized and corresponding deferred tax asset valuation allowance. When estimating the necessary valuation allowance, we consider all available evidence for each jurisdiction including historical operating results, estimates of future taxable income and the feasibility of ongoing tax planning strategies. If new information becomes available that would alter our estimate of the amount of deferred tax assets that will ultimately be realized, we adjust the valuation allowance through income tax expense.
28
Impairment review
Long-lived and finite-lived intangible assets are reviewed for impairment whenever events or changes in circumstances indicate that the carrying amount may not be fully recoverable. The estimated future undiscounted cash flows expected to result from the use and eventual disposition of the assets is compared to the carrying value. We derive the cash flow estimates from our long-term business plans and historical experience. If the sum of the undiscounted cash flows is less than the asset's carrying value, an impairment charge is recorded for an amount by which the carrying value exceeds its fair value. The fair value of the impaired asset is determined using probability weighted expected cash flow estimates, quoted market prices when available and appraisals, as appropriate. Changes in the estimates and assumptions incorporated in our impairment assessment could materially affect the determination of fair value and the associated impairment charge.
Goodwill is tested annually for impairment at the reporting unit level during the fourth quarter or sooner when circumstances indicate an impairment may exist. The impairment test for goodwill determines the fair value of each reporting unit and compares it to the reporting unit's carrying value, including goodwill. If the fair value of a reporting unit is less than its carrying value, an impairment loss is recognized for the difference, not to exceed the carrying amount of goodwill.
Significant estimates and assumptions are used in our goodwill impairment review including the identification of reporting units, assigning assets and liabilities, including goodwill, to reporting units and determining the fair value of each reporting unit. The fair value of each reporting unit is determined based on a combination of techniques, including the present value of future cash flows, multiples of competitors and multiples from sales of like businesses. The assumptions used to estimate fair value are based on projections incorporated in our current operating plans as well as other available information. Our operating plans include significant assumptions and estimates associated with sales growth, profitability, cash flows and capital spending. The determination of fair value also incorporates a risk-adjusted discount rate and other assumptions that market participants may use. Changes in any of these estimates or assumptions could materially affect the determination of fair value and the associated goodwill impairment assessment for each reporting unit. Potential events and circumstances, such as the inability to acquire new clients, downward pressures on pricing and rising interest rates could have an adverse impact on our assumptions and result in non-cash impairment charges in future periods.
During the fourth quarter, we conducted our annual impairment review of all our reporting units. Based on the results of this review, we concluded that the estimated fair value of each of our reporting units were substantially in excess of their respective carrying values.
Stock-based compensation expense
We recognize compensation cost for stock-based awards based on the estimated fair value of the award. The fair value of certain stock awards is determined using a Black-Scholes valuation model or Monte Carlo simulation model. These models require assumptions regarding the expected stock price volatility, risk-free interest rate, expected life of the award and dividend yield. The expected stock price volatility is based on historical price changes of our stock. The risk-free interest rate is based on U.S. Treasuries with a term equal to the expected life of the stock award. The expected life of the award and dividend yield are based on historical experience.
We believe that the valuation techniques and the underlying assumptions are appropriate in determining the fair value of stock-based awards. If factors change causing our assumptions to change, our stock-based compensation expense could be different in the future. In addition, we estimate an expected forfeiture rate and recognize expense only for those shares expected to vest. If the actual forfeiture rate is different from our estimate, stock-based compensation expense recorded in the period could be adversely impacted.
Restructuring
We make estimates and assumptions in determining the amount and timing of expenses related to our restructuring actions. If the actual amounts differ from our estimates, the amount and timing of the restructuring charges could be impacted. On a quarterly basis, we update our estimates of future remaining obligations and costs associated with all restructuring actions and compare these updated estimates to our current restructuring reserves, and make adjustments if necessary.
Loss contingencies
In the ordinary course of business, we are routinely defendants in, or party to, a number of pending and threatened legal actions. On a quarterly basis, we review the status of each significant matter and assess the potential financial exposure. If the potential loss from any claim or legal action is considered probable and can be reasonably estimated, we establish a liability for the estimated loss. The assessment of the ultimate outcome of each claim or legal action and the determination of the potential financial exposure requires significant judgment. Estimates of potential liabilities for claims or legal actions are based only on information that is available at that time. As additional information becomes available, we may revise our estimates, and these revisions could have a material impact on our results of operations and financial position.
29
Legal and Regulatory Matters
See Legal Proceedings in Item 3 for information regarding our legal proceedings and
Other Tax Matters
in Note 15 to the Consolidated Financial Statements for regulatory matters regarding our tax returns.
Foreign Currency Exchange
During 2018, 19% of our consolidated revenue was from operations outside the United States. The functional currency for most of our foreign operations is the local currency. Changes in the value of the U.S. dollar relative to the currencies of countries in which we operate impact our reported assets, liabilities, revenue and expenses. Exchange rate fluctuations can also impact the settlement of intercompany receivables and payables between our subsidiaries in different countries. The translation of foreign currencies to the U.S. dollar did not have a material impact on revenues for the years ended
December 31, 2018
, 2017 and 2016.
ITEM 7A. QUANTITATIVE AND QUALITATIVE DISCLOSURES ABOUT MARKET RISK
We are exposed to the impact of interest rate changes and foreign currency fluctuations. Our objective in managing exposure to foreign currency is to reduce the volatility in earnings and cash flows associated with fluctuations in foreign currency exchange rates on transactions denominated in foreign currencies. Accordingly, we enter into forward contracts, which change in value as foreign currency exchange rates change, and are intended to offset the corresponding change in value of the underlying external and intercompany transactions. The principal currencies actively hedged are the British Pound, Canadian Dollar and the Euro.
At
December 31, 2018
,
81%
of our debt was fixed rate obligations with a weighted average interest rate of
4.7%
. Variable rate debt had a weighted average interest rate of
4.0%
at
December 31, 2018
. A one-percentage point change in the effective interest rate of our variable rate debt would not have had a material impact on our 2018 pre-tax income.
We employ established policies and procedures governing the use of financial instruments to manage our exposure to such risks and do not enter into foreign currency or interest rate transactions for speculative purposes.
We utilize a "Value-at-Risk" (VaR) model to determine the potential loss in fair value from changes in market conditions. The VaR model utilizes a "Monte Carlo" simulation approach and assumes normal market conditions, a 95% confidence level and a one-day holding period. The model includes all of our public debt and foreign exchange derivative contracts. The model excludes all anticipated transactions, firm commitments and accounts receivables and payables denominated in foreign currencies, which certain of these instruments are intended to hedge. The VaR model is a risk analysis tool and does not purport to represent actual losses in fair value that will be incurred, nor does it consider the potential effect of favorable changes in market factors.
During
2018
and
2017
, our maximum potential one-day loss in fair value of our exposure to foreign exchange rates and interest rates, using the Monte Carlo simulation approach and the variance/co-variance technique, respectively,
was not material.
ITEM 8. FINANCIAL STATEMENTS AND SUPPLEMENTARY DATA
See "Index to Consolidated Financial Statements and Supplemental Data" in this Form 10-K.
ITEM 9. CHANGES IN AND DISAGREEMENTS WITH ACCOUNTANTS ON ACCOUNTING AND FINANCIAL DISCLOSURE
None.
ITEM 9A. CONTROLS AND PROCEDURES
Evaluation of Disclosure Controls and Procedures
We maintain disclosure controls and procedures (as defined in Rule 13a-15(e) and Rule 15d-15(e) under the Securities Exchange Act of 1934, as amended (the Exchange Act)), that are designed to reasonably assure that information required to be disclosed in reports filed or submitted under the Exchange Act is recorded, processed, summarized and reported within the time periods specified in the Securities and Exchange Commission’s rules and forms, and to reasonably assure that such information is accumulated and communicated to management, including our Chief Executive Officer (CEO) and Chief Financial Officer (CFO), to allow timely decisions regarding required disclosure.
Any system of controls and procedures, no matter how well designed and operated, can provide only reasonable (and not absolute) assurance of achieving the desired control objectives. Management, under the direction of our CEO and CFO, evaluated the effectiveness of the design and operation of our disclosure controls and procedures as required by Rule 13a-15 or Rule 15d-15 under the Exchange
30
Act. Notwithstanding this caution, the CEO and CFO have reasonable assurance that the disclosure controls and procedures were effective as of
December 31, 2018
.
Management's Report on Internal Control over Financial Reporting
Management is responsible for establishing and maintaining adequate internal control over financial reporting as defined in Rules 13a-15(f) and 15d-15(f) under the Exchange Act. Management assessed the effectiveness of the internal control over financial reporting as of
December 31, 2018
. In making this assessment, management used the criteria set forth by the Committee of Sponsoring Organizations of the Treadway Commission (COSO) in
Internal Control - Integrated Framework (2013)
. Based on its assessment, management concluded that, as of
December 31, 2018
, the internal control over financial reporting was effective based on the criteria issued by COSO in
Internal Control - Integrated Framework (2013)
.
The effectiveness of our internal control over financial reporting as of
December 31, 2018
has been audited by PricewaterhouseCoopers LLP, an independent registered public accounting firm, as stated in their report in this Form 10-K.
Changes in Internal Control over Financial Reporting
There have been no changes in our internal control over financial reporting during the three months ended
December 31, 2018
, that have materially affected, or are reasonably likely to materially affect, such internal control over financial reporting.
ITEM 9B. OTHER INFORMATION
None.
31
PART III
ITEM 10. DIRECTORS, EXECUTIVE OFFICERS AND CORPORATE GOVERNANCE
Other than information regarding our executive officers disclosed in Part I of this Annual Report, the information required by this Item is incorporated by reference to our Proxy Statement to be filed in connection with the
2019
Annual Meeting of Stockholders.
Code of Ethics
We have Business Practices Guidelines (BPG) that apply to all our officers and other employees and a Code of Business Conduct and Ethics (the Code) that applies to our Board of Directors. The BPG and the Code are posted on our corporate governance website located at
www.pb.com/us/our-company/leadership-and-governance/corporate-governance.html.
Amendments to either the BPG or the Code and any waiver from a provision of the BPG or the Code requiring disclosure will be disclosed on our corporate governance website.
Audit Committee - Audit Committee Financial Expert
The information regarding the Audit Committee, its members and the Audit Committee financial experts is incorporated by reference to our Proxy Statement to be filed in connection with the 2019 Annual Meeting of Stockholders.
ITEM 11. EXECUTIVE COMPENSATION
The information required by this Item is incorporated by reference to our Proxy Statement to be filed in connection with the
2019
Annual Meeting of Stockholders.
ITEM 12. SECURITY OWNERSHIP OF CERTAIN BENEFICIAL OWNERS AND MANAGEMENT AND RELATED STOCKHOLDER MATTERS
EQUITY COMPENSATION PLAN INFORMATION TABLE
The following table provides information as of
December 31, 2018
regarding the number of shares of common stock that may be issued under our equity compensation plans.
|
Plan Category
|
(a)
Number of securities to be issued upon exercise of outstanding options, warrants and rights
|
(b)
Weighted-average exercise price of outstanding options, warrants and rights
|
(c)
Number of securities remaining available for future issuance under equity compensation plans excluding securities reflected in column (a)
|
||||||
|
Equity compensation plans approved by security holders
|
13,593,156
|
|
$15.30
|
14,411,742
|
|
||||
|
Equity compensation plans not approved by security holders
|
—
|
|
—
|
|
—
|
|
|||
|
Total
|
13,593,156
|
|
$15.30
|
14,411,742
|
|
||||
Other than information regarding securities authorized for issuance under equity compensation plans, the information required by this Item is incorporated by reference to our Proxy Statement to be filed in connection with the
2019
Annual Meeting of Stockholders.
ITEM 13. CERTAIN RELATIONSHIPS, RELATED TRANSACTIONS AND DIRECTOR INDEPENDENCE
The information required by this Item is incorporated by reference to our Proxy Statement to be filed in connection with the
2019
Annual Meeting of Stockholders.
ITEM 14. PRINCIPAL ACCOUNTANT FEES AND SERVICES
The information required by this Item is incorporated by reference to our Proxy Statement to be filed in connection with the
2019
Annual Meeting of Stockholders.
32
PART IV
ITEM 15. EXHIBITS AND FINANCIAL STATEMENT SCHEDULES
|
(a)(1) Consolidated Financial Statements and Schedules
|
Page Number in Form 10-K
|
|
Consolidated Statements of Income for the years ended December 31, 2018, 2017 and 2016
|
|
|
Consolidated Statements of Comprehensive Income for the years ended December 31, 2018, 2017 and 2016
|
|
|
Consolidated Balance Sheets at December 31, 2018 and 2017
|
|
|
Consolidated Statements of Cash Flows for the years ended December 31, 2018, 2017 and 2016
|
|
|
Consolidated Statements of Stockholders' Equity (Deficit) for the years ended December 31, 2018, 2017 and 2016
|
|
|
Notes to Consolidated Financial Statements
|
|
|
Schedule II - Valuation and Qualifying Accounts and Reserves for the years ended December 31, 2018, 2017 and 2016
|
|
|
(a)(2)
|
Exhibits
|
|
Reg. S-K
exhibits
|
Description
|
Status or incorporation by reference
|
|
3(a)
|
Restated Certificate of Incorporation of Pitney Bowes Inc.
|
|
|
3(b)
|
Pitney Bowes Inc. Amended and Restated By-laws (effective May 10, 2013)
|
|
|
4(a)
|
Form of Indenture between the Company and SunTrust Bank, as Trustee
|
|
|
4(b)
|
Supplemental Indenture No. 1 dated April 18, 2003 between the Company and SunTrust Bank, as Trustee
|
|
|
4(d)
|
First Supplemental Indenture, by and among Pitney Bowes Inc., The Bank of New York, and Citibank, N.A., to the Indenture, dated as of February 14, 2005, by and between the Company and Citibank
|
|
|
10(a) *
|
Retirement Plan for Directors of Pitney Bowes Inc.
|
|
|
10(b.3) *
|
Pitney Bowes Inc. Directors' Stock Plan (Amended and Restated effective May 12, 2014)
|
|
|
10(c) *
|
Pitney Bowes Stock Plan (as amended and restated as of January 1, 2002)
|
|
|
10(d) *
|
Pitney Bowes Inc. 2007 Stock Plan (as amended November 7, 2009)
|
|
|
10(e) *
|
Pitney Bowes Inc. Key Employees' Incentive Plan (as amended and restated February 4, 2019)
|
|
|
10(f) *
|
Pitney Bowes Severance Plan (as amended and restated as of January 1, 2008)
|
|
|
10(g) *
|
Pitney Bowes Senior Executive Severance Policy (as amended and restated as of February 4, 2019)
|
|
|
10(h) *
|
Pitney Bowes Inc. Deferred Incentive Savings Plan for the Board of Directors, as amended and restated effective January 1, 2009
|
|
|
10(i) *
|
Pitney Bowes Inc. Deferred Incentive Savings Plan as amended and restated effective January 1, 2009
|
|
33
|
Reg. S-K
exhibits |
Description
|
Status or incorporation by reference
|
|
10(j) *
|
Pitney Bowes Inc. 1998 U.K. S.A.Y.E. Stock Option Plan
|
|
|
10(k) *
|
Form of Long Term Incentive Award Agreement
|
|
|
10(l) **
|
Agreement and Plan of Merger, dated as of September 6, 2017, among Pitney Bowes Inc., Neutron Acquisition Corp., NGS Holdings, Inc. and Littlejohn Fund IV, L.P., solely in its capacity as stockholder representative
|
|
|
10(m)*
|
Pitney Bowes Director Equity Deferral plan dated November 8, 2013 (effective May 12, 2014)
|
|
|
10(o)*
|
Pitney Bowes Executive Equity Deferral Plan dated November 7, 2014
|
|
|
10(p)*
|
Pitney Bowes Inc. 2013 Stock Plan
|
|
|
10(q)*
|
Pitney Bowes Inc. 2018 Stock Plan
|
|
|
10(r)
|
Credit Agreement $1,000,000,000, dated as of January 6, 2015, by and among the company, JPMorgan Chase Bank, N.A., as administrative agent, and the lenders party thereto (the “Revolving Credit Agreement”).
|
|
|
10(s)
|
First Amendment to the Revolving Credit Agreement, dated as of May 31, 2017, by and among the company, JPMorgan Chase Bank, N.A., as administrative agent, and the lenders party thereto.
|
|
|
10(t)
|
Second Amendment to the Revolving Credit Agreement, dated as of September 12, 2017, by and among the company, JPMorgan Chase Bank, N.A., as administrative agent, and the lenders party thereto.
|
|
|
10(u)
|
Third Amendment to the Revolving Credit Agreement, dated as of December 14, 2018, by and among the company, JPMorgan Chase Bank, N.A. as administrative agent, and the lenders party thereto.
|
|
|
10(v)
|
Credit Agreement $300,000,000, dated as of January 5, 2016, by and among the company, JPMorgan Chase Bank, N.A., as administrative agent, and the lenders party thereto (the “$300M Term Loan”).
|
|
|
10(w)
|
First Amendment to the $300M Term Loan, dated as of September 12, 2017, by and among the company, JPMorgan Chase Bank, N.A., as administrative agent, and the lenders party thereto.
|
|
|
10(x)
|
Second Amendment to the $300M Term Loan, dated as of December 14, 2018, by and among the company, JPMorgan Chase Bank, N.A., as administrative agent, and the lenders party thereto.
|
|
|
10(y)
|
Credit Agreement $200,000,000, dated as of September 12, 2017, by and among the company, JPMorgan Chase Bank, N.A., as administrative agent, and the lenders party thereto.
|
|
|
10(z)
|
First Amendment to the $200,000,000 Term Loan, dated as of December 14, 2018, by and among the company, JPMorgan Chase Bank, N.A., as administrative agent, and the lenders party thereto.
|
|
|
10(aa)
|
Term Loan Facility $150,000,000, dated as of August 30, 2017, by and between the company and The Bank of Tokyo-Mitsubishi-UFJ, Ltd. ("$150M Term Loan")
|
|
|
10(bb)
|
First Amendment to the $150M Term Loan, dated as of December 14, 2018, by and between the company and the Bank of Tokyo-Mitsubishi-UFJ, Ltd.
|
|
|
10(cc)
|
Asset Purchase Agreement, dated April 27, 2018, between the company and Stark Acquisition Corporation (the "Asset Purchase Agreement")
|
|
|
10(dd)
|
Amendment and Supplement to Asset Purchase Agreement, dated as of July 1, 2018, between the company and DMT Solutions Global Corporation (f/k/a Stark Acquisition Corporation)
|
|
34
|
Reg. S-K
exhibits |
Description
|
Status or incorporation by reference
|
|
21
|
Subsidiaries of the registrant
|
|
|
23
|
Consent of independent registered accounting firm
|
|
|
31.1
|
Certification of Chief Executive Officer Pursuant to Rules 13a-14(a) and 15d-14(a) under the Securities Exchange Act of 1934, as amended.
|
|
|
31.2
|
Certification of Chief Financial Officer Pursuant to Rules 13a-14(a) and 15d-14(a) under the Securities Exchange Act of 1934, as amended.
|
|
|
32.1
|
Certification of Chief Executive Officer Pursuant to 18 U.S.C. Section 1350
|
|
|
32.2
|
Certification of Chief Financial Officer Pursuant to 18 U.S.C. Section 1350
|
|
|
101.INS
|
XBRL Report Instance Document
|
|
|
101.SCH
|
XBRL Taxonomy Extension Schema Document
|
|
|
101.CAL
|
XBRL Taxonomy Calculation Linkbase Document
|
|
|
101.DEF
|
XBRL Taxonomy Definition Linkbase Document
|
|
|
101.LAB
|
XBRL Taxonomy Label Linkbase Document
|
|
|
101.PRE
|
XBRL Taxonomy Presentation Linkbase Document
|
|
* The Exhibits identified above with an asterisk (*) are management contracts or compensatory plans or arrangements.
** Pursuant to Item 601(b)(2) of Regulation S-K, certain exhibits and schedules have been omitted. The registrant hereby agrees to furnish a supplementary copy of any omitted attachment to the SEC upon request.
The Company has outstanding certain other long-term indebtedness. Such long-term indebtedness does not exceed 10% of the total assets of the Company; therefore, copies of instruments defining the rights of holders of such indebtedness are not included as exhibits. The Company agrees to furnish copies of such instruments to the SEC upon request.
ITEM 16. FORM 10-K SUMMARY
None
35
|
Page Number
|
||
|
Consolidated Financial Statements of Pitney Bowes Inc.
|
||
|
Consolidated Statements of Income for the years ended December 31, 2018, 2017 and 2016
|
||
|
Consolidated Statements of Comprehensive Income for the years ended December 31, 2018, 2017 and 2016
|
||
|
Consolidated Balance Sheets at December 31, 2018 and 2017
|
||
|
Consolidated Statements of Cash Flows for the years ended December 31, 2018, 2017 and 2016
|
||
|
Consolidated Statements of Stockholders' Equity (Deficit) for the years ended December 31, 2018, 2017 and 2016
|
||
|
Financial Statement Schedule
|
||
|
Schedule II - Valuation and Qualifying Accounts and Reserves for the years ended December 31, 2018, 2017 and 2016
|
||
36
Report of Independent Registered Public Accounting Firm
To the Board of Directors and Stockholders of Pitney Bowes Inc.
Opinions on the Financial Statements and Internal Control over Financial Reporting
We have audited the accompanying consolidated balance sheets of Pitney Bowes Inc. and its subsidiaries (the “Company”) as of December 31, 2018 and December 31, 2017, and the related consolidated statements of income, of comprehensive income, of stockholders’ equity (deficit) and of cash flows for each of the three years in the period ended December 31, 2018, including the related notes and financial statement schedule listed in the index appearing under Item 15(a)(1) (collectively referred to as the “consolidated financial statements”). We also have audited the Company's internal control over financial reporting as of December 31, 2018, based on criteria established in
Internal Control - Integrated Framework
(2013) issued by the Committee of Sponsoring Organizations of the Treadway Commission (COSO).
In our opinion, the consolidated
financial statements referred to above present fairly, in all material respects, the financial position of the Company as of December 31, 2018
and December 31, 2017
,
and the results of its
operations and its
cash flows for each of the three years in the period ended December 31, 2018
in conformity with accounting principles generally accepted in the United States of America. Also in our opinion, the Company maintained, in all material respects, effective internal control over financial reporting as of December 31, 2018, based on criteria established in
Internal Control - Integrated Framework
(2013)
issued by the COSO.
Change in Accounting Principle
As discussed in Notes 1 and 2 to the consolidated financial statements, the Company changed the manner in which it accounts for revenues from contracts with customers in 2018.
Basis for Opinions
The Company's management is responsible for these consolidated financial statements, for maintaining effective internal control over financial reporting, and for its assessment of the effectiveness of internal control over financial reporting, included in Management's Report on Internal Control over Financial Reporting under Item 9A. Our responsibility is to express opinions on the Company’s consolidated financial statements and on the Company's internal control over financial reporting based on our audits. We are a public accounting firm registered with the Public Company Accounting Oversight Board (United States) (PCAOB) and are required to be independent with respect to the Company in accordance with the U.S. federal securities laws and the applicable rules and regulations of the Securities and Exchange Commission and the PCAOB.
We conducted our audits in accordance with the standards of the PCAOB. Those standards require that we plan and perform the audits to obtain reasonable assurance about whether the consolidated financial statements are free of material misstatement, whether due to error or fraud, and whether effective internal control over financial reporting was maintained in all material respects.
Our audits of the consolidated financial statements included performing procedures to assess the risks of material misstatement of the consolidated financial statements, whether due to error or fraud, and performing procedures that respond to those risks. Such procedures included examining, on a test basis, evidence regarding the amounts and disclosures in the consolidated financial statements. Our audits also included evaluating the accounting principles used and significant estimates made by management, as well as evaluating the overall presentation of the consolidated financial statements. Our audit of internal control over financial reporting included obtaining an understanding of internal control over financial reporting, assessing the risk that a material weakness exists, and testing and evaluating the design and operating effectiveness of internal control based on the assessed risk. Our audits also included performing such other procedures as we considered necessary in the circumstances. We believe that our audits provide a reasonable basis for our opinions.
Definition and Limitations of Internal Control over Financial Reporting
A company’s internal control over financial reporting is a process designed to provide reasonable assurance regarding the reliability of financial reporting and the preparation of financial statements for external purposes in accordance with generally accepted accounting principles. A company’s internal control over financial reporting includes those policies and procedures that (i) pertain to the maintenance of records that, in reasonable detail, accurately and fairly reflect the transactions and dispositions of the assets of the company; (ii) provide reasonable assurance that transactions are recorded as necessary to permit preparation of financial statements in accordance with generally accepted accounting principles, and that receipts and expenditures of the company are being made only in accordance with authorizations of management and directors of the company; and (iii) provide reasonable assurance regarding prevention or timely detection of unauthorized acquisition, use, or disposition of the company’s assets that could have a material effect on the financial statements.
37
Because of its inherent limitations, internal control over financial reporting may not prevent or detect misstatements. Also, projections of any evaluation of effectiveness to future periods are subject to the risk that controls may become inadequate because of changes in conditions, or that the degree of compliance with the policies or procedures may deteriorate.
/s/PricewaterhouseCoopers LLP
PricewaterhouseCoopers LLP
Stamford, CT
February 20, 2019
We have served as the Company’s auditor since 1934.
38
PITNEY BOWES INC.
CONSOLIDATED STATEMENTS OF INCOME
(In thousands, except per share amounts)
|
Years Ended December 31,
|
|||||||||||
|
2018
|
2017
|
2016
|
|||||||||
|
Revenue:
|
|
|
|
|
|||||||
|
Equipment sales
|
$
|
430,451
|
|
$
|
476,691
|
|
$
|
480,031
|
|
||
|
Supplies
|
218,304
|
|
231,412
|
|
241,950
|
|
|||||
|
Software
|
340,855
|
|
331,843
|
|
325,577
|
|
|||||
|
Rentals
|
363,057
|
|
384,123
|
|
410,241
|
|
|||||
|
Financing
|
314,778
|
|
330,985
|
|
366,424
|
|
|||||
|
Support services
|
293,413
|
|
299,792
|
|
329,424
|
|
|||||
|
Business services
|
1,561,522
|
|
1,068,426
|
|
827,676
|
|
|||||
|
Total revenue
|
3,522,380
|
|
3,123,272
|
|
2,981,323
|
|
|||||
|
Costs and expenses:
|
|
|
|
|
|||||||
|
Cost of equipment sales
|
181,766
|
|
201,116
|
|
203,220
|
|
|||||
|
Cost of supplies
|
60,960
|
|
66,302
|
|
65,509
|
|
|||||
|
Cost of software
|
100,681
|
|
95,033
|
|
96,151
|
|
|||||
|
Cost of rentals
|
86,330
|
|
82,703
|
|
74,457
|
|
|||||
|
Financing interest expense
|
48,857
|
|
50,665
|
|
55,241
|
|
|||||
|
Cost of support services
|
168,271
|
|
163,889
|
|
166,247
|
|
|||||
|
Cost of business services
|
1,246,084
|
|
773,052
|
|
568,509
|
|
|||||
|
Selling, general and administrative
|
1,123,116
|
|
1,170,905
|
|
1,140,100
|
|
|||||
|
Research and development
|
125,588
|
|
118,703
|
|
107,378
|
|
|||||
|
Restructuring charges and asset impairments, net
|
27,077
|
|
56,223
|
|
60,295
|
|
|||||
|
Goodwill impairment
|
—
|
|
—
|
|
148,181
|
|
|||||
|
Interest expense, net
|
110,900
|
|
113,497
|
|
88,970
|
|
|||||
|
Other components of net pension and postretirement cost
|
22,425
|
|
5,413
|
|
5,276
|
|
|||||
|
Other expense
|
7,964
|
|
3,856
|
|
—
|
|
|||||
|
Total costs and expenses
|
3,310,019
|
|
2,901,357
|
|
2,779,534
|
|
|||||
|
Income from continuing operations before income taxes
|
212,361
|
|
221,915
|
|
201,789
|
|
|||||
|
Provision for income taxes
|
12,383
|
|
553
|
|
106,975
|
|
|||||
|
Income from continuing operations
|
199,978
|
|
221,362
|
|
94,814
|
|
|||||
|
Income from discontinued operations, net of tax
|
23,687
|
|
39,978
|
|
17,036
|
|
|||||
|
Net income
|
223,665
|
|
261,340
|
|
111,850
|
|
|||||
|
Less: Preferred stock dividends of subsidiaries attributable to noncontrolling interests
|
—
|
|
—
|
|
19,045
|
|
|||||
|
Net income - Pitney Bowes Inc.
|
$
|
223,665
|
|
$
|
261,340
|
|
$
|
92,805
|
|
||
|
Amounts attributable to common stockholders:
|
|
|
|
|
|||||||
|
Income from continuing operations
|
$
|
199,978
|
|
$
|
221,362
|
|
$
|
75,769
|
|
||
|
Income from discontinued operations, net of tax
|
23,687
|
|
39,978
|
|
17,036
|
|
|||||
|
Net income - Pitney Bowes Inc.
|
$
|
223,665
|
|
$
|
261,340
|
|
$
|
92,805
|
|
||
|
Basic earnings per share attributable to common stockholders
(1)
:
|
|
|
|
|
|||||||
|
Continuing operations
|
$
|
1.07
|
|
$
|
1.19
|
|
$
|
0.40
|
|
||
|
Discontinued operations
|
0.13
|
|
0.21
|
|
0.09
|
|
|||||
|
Net income - Pitney Bowes Inc.
|
$
|
1.19
|
|
$
|
1.40
|
|
$
|
0.49
|
|
||
|
Diluted earnings per share attributable to common stockholders
(1)
:
|
|
|
|
|
|||||||
|
Continuing operations
|
$
|
1.06
|
|
$
|
1.18
|
|
$
|
0.40
|
|
||
|
Discontinued operations
|
0.13
|
|
0.21
|
|
0.09
|
|
|||||
|
Net income - Pitney Bowes Inc.
|
$
|
1.19
|
|
$
|
1.39
|
|
$
|
0.49
|
|
||
|
(1)
|
The sum of the earnings per share amounts may not equal the totals due to rounding.
|
See Notes to Consolidated Financial Statements
39
PITNEY BOWES INC.
CONSOLIDATED STATEMENTS OF COMPREHENSIVE INCOME
(In thousands)
|
Years Ended December 31,
|
|||||||||||
|
2018
|
2017
|
2016
|
|||||||||
|
Net income
|
$
|
223,665
|
|
$
|
261,340
|
|
$
|
111,850
|
|
||
|
Other comprehensive income (loss), net of tax:
|
|||||||||||
|
Foreign currency translations, net of tax of $(6,289) in 2018
|
(54,531
|
)
|
106,391
|
|
(4,464
|
)
|
|||||
|
Net unrealized gain on cash flow hedges, net of tax of $232, $678, and $1,513, respectively
|
684
|
|
1,079
|
|
2,427
|
|
|||||
|
Net unrealized gain (loss) on available for sale securities, net of tax of $(1,545), $944 and $(244), respectively
|
(5,002
|
)
|
1,477
|
|
(416
|
)
|
|||||
|
Adjustments to pension and postretirement plans, net of tax of $(13,058), $3,089 and $(17,550), respectively
|
(46,170
|
)
|
12,185
|
|
(73,141
|
)
|
|||||
|
Amortization of pension and postretirement costs, net of tax of $21,675, $13,936, and $14,430, respectively
|
64,999
|
|
26,828
|
|
24,096
|
|
|||||
|
Other comprehensive (loss) income
|
(40,020
|
)
|
147,960
|
|
(51,498
|
)
|
|||||
|
Comprehensive income
|
183,645
|
|
409,300
|
|
60,352
|
|
|||||
|
Less: Preferred stock dividends attributable to noncontrolling interests
|
—
|
|
—
|
|
19,045
|
|
|||||
|
Comprehensive income - Pitney Bowes Inc.
|
$
|
183,645
|
|
$
|
409,300
|
|
$
|
41,307
|
|
||
See Notes to Consolidated Financial Statements
40
PITNEY BOWES INC.
CONSOLIDATED BALANCE SHEETS
(In thousands, except share amounts)
|
December 31, 2018
|
December 31, 2017
|
||||||
|
ASSETS
|
|
|
|
|
|||
|
Current assets:
|
|
|
|
|
|||
|
Cash and cash equivalents
|
$
|
867,262
|
|
$
|
1,009,021
|
|
|
|
Short-term investments
|
59,391
|
|
48,988
|
|
|||
|
Accounts receivable (net of allowance of $17,617 and $14,786 respectively)
|
455,807
|
|
427,022
|
|
|||
|
Short-term finance receivables (net of allowance of $12,454 and $12,187, respectively)
|
789,661
|
|
828,003
|
|
|||
|
Inventories
|
41,964
|
|
40,769
|
|
|||
|
Current income taxes
|
5,947
|
|
58,439
|
|
|||
|
Other current assets and prepayments
|
99,332
|
|
83,293
|
|
|||
|
Assets of discontinued operations
|
4,854
|
|
334,848
|
|
|||
|
Total current assets
|
2,324,218
|
|
2,830,383
|
|
|||
|
Property, plant and equipment, net
|
410,114
|
|
373,503
|
|
|||
|
Rental property and equipment, net
|
178,099
|
|
183,956
|
|
|||
|
Long-term finance receivables (net of allowance of $7,768 and $6,446, respectively)
|
592,165
|
|
652,087
|
|
|||
|
Goodwill
|
1,766,511
|
|
1,774,645
|
|
|||
|
Intangible assets, net
|
227,137
|
|
272,186
|
|
|||
|
Noncurrent income taxes
|
61,420
|
|
59,909
|
|
|||
|
Other assets
|
413,239
|
|
540,751
|
|
|||
|
Total assets
|
$
|
5,972,903
|
|
$
|
6,687,420
|
|
|
|
LIABILITIES AND STOCKHOLDERS’ EQUITY
|
|
|
|||||
|
Current liabilities:
|
|
|
|
|
|||
|
Accounts payable and accrued liabilities
|
$
|
1,401,635
|
|
$
|
1,458,854
|
|
|
|
Current portion of long-term debt
|
199,535
|
|
271,057
|
|
|||
|
Advance billings
|
237,529
|
|
257,766
|
|
|||
|
Current income taxes
|
15,165
|
|
8,823
|
|
|||
|
Liabilities of discontinued operations
|
3,276
|
|
72,808
|
|
|||
|
Total current liabilities
|
1,857,140
|
|
2,069,308
|
|
|||
|
Deferred taxes on income
|
295,808
|
|
249,143
|
|
|||
|
Tax uncertainties and other income tax liabilities
|
39,548
|
|
102,051
|
|
|||
|
Long-term debt
|
3,066,073
|
|
3,559,278
|
|
|||
|
Other noncurrent liabilities
|
474,862
|
|
519,079
|
|
|||
|
Total liabilities
|
5,733,431
|
|
6,498,859
|
|
|||
|
Commitments and contingencies (See Note 16)
|
|
|
|
|
|||
|
Stockholders' equity:
|
|||||||
|
Cumulative preferred stock, $50 par value, 4% convertible
|
1
|
|
1
|
|
|||
|
Cumulative preference stock, no par value, $2.12 convertible
|
396
|
|
441
|
|
|||
|
Common stock, $1 par value (480,000,000 shares authorized; 323,337,912 shares issued)
|
323,338
|
|
323,338
|
|
|||
|
Additional paid-in capital
|
121,475
|
|
138,367
|
|
|||
|
Retained earnings
|
5,416,777
|
|
5,229,584
|
|
|||
|
Accumulated other comprehensive loss
|
(948,426
|
)
|
(792,173
|
)
|
|||
|
Treasury stock, at cost (135,662,830 and 136,734,174 shares, respectively)
|
(4,674,089
|
)
|
(4,710,997
|
)
|
|||
|
Total stockholders’ equity
|
239,472
|
|
188,561
|
|
|||
|
Total liabilities and stockholders’ equity
|
$
|
5,972,903
|
|
$
|
6,687,420
|
|
|
See Notes to Consolidated Financial Statements
41
PITNEY BOWES INC.
CONSOLIDATED STATEMENTS OF CASH FLOWS
(In thousands)
|
Years Ended December 31,
|
|||||||||||
|
2018
|
2017
|
2016
|
|||||||||
|
Cash flows from operating activities:
|
|
|
|
|
|||||||
|
Net income
|
$
|
223,665
|
|
$
|
261,340
|
|
$
|
111,850
|
|
||
|
Income from discontinued operations
|
(23,687
|
)
|
(39,978
|
)
|
(17,036
|
)
|
|||||
|
Restructuring payments
|
(52,974
|
)
|
(37,454
|
)
|
(62,071
|
)
|
|||||
|
Adjustments to reconcile net income to net cash provided by operating activities:
|
|
|
|
|
|||||||
|
Restructuring charges and asset impairments, net
|
27,077
|
|
56,223
|
|
60,295
|
|
|||||
|
Goodwill impairment
|
—
|
|
—
|
|
148,181
|
|
|||||
|
Depreciation and amortization
|
203,293
|
|
179,650
|
|
174,065
|
|
|||||
|
Pension plan settlement
|
31,329
|
|
—
|
|
—
|
|
|||||
|
Special pension plan contribution
|
—
|
|
—
|
|
(36,731
|
)
|
|||||
|
Loss on sale of businesses
|
—
|
|
—
|
|
5,786
|
|
|||||
|
Gain on sale of technology
|
—
|
|
(6,085
|
)
|
—
|
|
|||||
|
Gain on debt forgiveness
|
—
|
|
—
|
|
(10,000
|
)
|
|||||
|
Stock-based compensation
|
21,042
|
|
24,389
|
|
14,882
|
|
|||||
|
Deferred tax (benefit) provision
|
56,981
|
|
(25,390
|
)
|
3,467
|
|
|||||
|
Changes in operating assets and liabilities, net of acquisitions/divestitures:
|
|
|
|
|
|||||||
|
(Increase) decrease in accounts receivable
|
(35,565
|
)
|
(15,923
|
)
|
27,794
|
|
|||||
|
Decrease in finance receivables
|
79,918
|
|
125,991
|
|
119,883
|
|
|||||
|
Decrease (increase) in inventories
|
93
|
|
7,324
|
|
(2,880
|
)
|
|||||
|
(Increase) decrease in other current assets and prepayments
|
(22,609
|
)
|
9,118
|
|
(717
|
)
|
|||||
|
Decrease in accounts payable and accrued liabilities
|
(3,180
|
)
|
(13,238
|
)
|
(97,783
|
)
|
|||||
|
Increase (decrease) in current and non-current income taxes
|
(24,807
|
)
|
(14,581
|
)
|
(1,661
|
)
|
|||||
|
Decrease in advance billings
|
(21,506
|
)
|
(21,193
|
)
|
(48,432
|
)
|
|||||
|
Other, net
|
(37,705
|
)
|
(23,384
|
)
|
14,017
|
|
|||||
|
Net cash provided by operating activities: continuing operations
|
421,365
|
|
466,809
|
|
402,909
|
|
|||||
|
Net cash (used in) provided by operating activities: discontinued operations
|
(29,103
|
)
|
29,004
|
|
93,213
|
|
|||||
|
Net cash provided by operating activities
|
392,262
|
|
495,813
|
|
496,122
|
|
|||||
|
Cash flows from investing activities:
|
|
|
|
|
|||||||
|
Purchases of available-for-sale securities
|
(81,527
|
)
|
(125,055
|
)
|
(212,810
|
)
|
|||||
|
Proceeds from sales/maturities of available-for-sale securities
|
175,820
|
|
113,501
|
|
211,696
|
|
|||||
|
Net change in short-term and other investments
|
11,838
|
|
(8,285
|
)
|
75,654
|
|
|||||
|
Capital expenditures
|
(191,444
|
)
|
(168,097
|
)
|
(159,232
|
)
|
|||||
|
Proceeds from sale of assets
|
—
|
|
5,458
|
|
17,671
|
|
|||||
|
Reserve account deposits
|
21,008
|
|
10,954
|
|
(2,183
|
)
|
|||||
|
Acquisitions, net of cash acquired
|
(10,484
|
)
|
(482,853
|
)
|
(37,842
|
)
|
|||||
|
Other investing activities
|
(4,250
|
)
|
(5,750
|
)
|
(6,908
|
)
|
|||||
|
Net cash used in investing activities: continuing operations
|
(79,039
|
)
|
(660,127
|
)
|
(113,954
|
)
|
|||||
|
Net cash provided by (used in) investing activities: discontinued operations
|
338,783
|
|
(2,893
|
)
|
(1,599
|
)
|
|||||
|
Net cash provided by (used in) investing activities
|
259,744
|
|
(663,020
|
)
|
(115,553
|
)
|
|||||
|
Cash flows from financing activities:
|
|
|
|
|
|||||||
|
Proceeds from issuance of long-term debt
|
—
|
|
1,436,660
|
|
894,744
|
|
|||||
|
Principal payments of long-term obligations
|
(570,180
|
)
|
(964,550
|
)
|
(371,007
|
)
|
|||||
|
Decrease in short-term borrowings
|
—
|
|
—
|
|
(90,000
|
)
|
|||||
|
Dividends paid to stockholders
|
(140,498
|
)
|
(139,490
|
)
|
(140,608
|
)
|
|||||
|
Dividends paid to noncontrolling interests
|
—
|
|
—
|
|
(18,528
|
)
|
|||||
|
Common stock repurchases
|
—
|
|
—
|
|
(197,267
|
)
|
|||||
|
Redemption of noncontrolling interests
|
—
|
|
—
|
|
(300,000
|
)
|
|||||
|
Other financing activities
|
(55,741
|
)
|
35,127
|
|
(6,863
|
)
|
|||||
|
Net cash (used in) provided by financing activities
|
(766,419
|
)
|
367,747
|
|
(229,529
|
)
|
|||||
|
Effect of exchange rate changes on cash and cash equivalents
|
(25,381
|
)
|
43,959
|
|
(26,708
|
)
|
|||||
|
(Decrease) increase in cash and cash equivalents
|
(139,794
|
)
|
244,499
|
|
124,332
|
|
|||||
|
Cash and cash equivalents at beginning of period
|
1,009,021
|
|
764,522
|
|
640,190
|
|
|||||
|
Cash and cash equivalents at end of period
|
869,227
|
|
1,009,021
|
|
764,522
|
|
|||||
|
Less cash and cash equivalents of discontinued operations
|
1,965
|
|
—
|
|
—
|
|
|||||
|
Cash and cash equivalents of continuing operations at end of period
|
$
|
867,262
|
|
$
|
1,009,021
|
|
$
|
764,522
|
|
||
|
Cash interest paid
|
$
|
171,120
|
|
$
|
169,279
|
|
$
|
150,567
|
|
||
|
Cash income tax payments, net of refunds
|
$
|
25,906
|
|
$
|
53,247
|
|
$
|
127,299
|
|
||
See Notes to Consolidated Financial Statements
42
PITNEY BOWES INC.
CONSOLIDATED STATEMENTS OF STOCKHOLDERS' EQUITY (DEFICIT)
(In thousands)
|
Preferred
stock
|
Preference
stock
|
Common Stock
|
Additional Paid-in Capital
|
Retained earnings
|
Accumulated other comprehensive loss
|
Treasury stock
|
Total equity (deficit)
|
||||||||||||||||||||||||
|
Balance at December 31, 2015
|
$
|
1
|
|
$
|
505
|
|
$
|
323,338
|
|
$
|
161,280
|
|
$
|
5,155,537
|
|
$
|
(888,635
|
)
|
$
|
(4,573,305
|
)
|
$
|
178,721
|
|
|||||||
|
Net income - Pitney Bowes Inc.
|
—
|
|
—
|
|
—
|
|
—
|
|
92,805
|
|
—
|
|
—
|
|
92,805
|
|
|||||||||||||||
|
Other comprehensive loss
|
—
|
|
—
|
|
—
|
|
—
|
|
—
|
|
(51,498
|
)
|
—
|
|
(51,498
|
)
|
|||||||||||||||
|
Cash dividends
|
|||||||||||||||||||||||||||||||
|
Common ($0.75 per share)
|
—
|
|
—
|
|
—
|
|
—
|
|
(140,570
|
)
|
—
|
|
—
|
|
(140,570
|
)
|
|||||||||||||||
|
Preference
|
—
|
|
—
|
|
—
|
|
—
|
|
(38
|
)
|
—
|
|
—
|
|
(38
|
)
|
|||||||||||||||
|
Issuances of common stock
|
—
|
|
—
|
|
—
|
|
(27,856
|
)
|
—
|
|
—
|
|
26,886
|
|
(970
|
)
|
|||||||||||||||
|
Conversions to common stock
|
—
|
|
(22
|
)
|
—
|
|
(456
|
)
|
—
|
|
—
|
|
478
|
|
—
|
|
|||||||||||||||
|
Stock-based compensation
|
—
|
|
—
|
|
—
|
|
15,157
|
|
—
|
|
—
|
|
—
|
|
15,157
|
|
|||||||||||||||
|
Repurchase of common stock
|
—
|
|
—
|
|
—
|
|
—
|
|
—
|
|
—
|
|
(197,267
|
)
|
(197,267
|
)
|
|||||||||||||||
|
Balance at December 31, 2016
|
1
|
|
483
|
|
323,338
|
|
148,125
|
|
5,107,734
|
|
(940,133
|
)
|
(4,743,208
|
)
|
(103,660
|
)
|
|||||||||||||||
|
Net income - Pitney Bowes Inc.
|
—
|
|
—
|
|
—
|
|
—
|
|
261,340
|
|
—
|
|
—
|
|
261,340
|
|
|||||||||||||||
|
Other comprehensive loss
|
—
|
|
—
|
|
—
|
|
—
|
|
—
|
|
147,960
|
|
—
|
|
147,960
|
|
|||||||||||||||
|
Cash dividends
|
|||||||||||||||||||||||||||||||
|
Common ($0.75 per share)
|
—
|
|
—
|
|
—
|
|
—
|
|
(139,454
|
)
|
—
|
|
—
|
|
(139,454
|
)
|
|||||||||||||||
|
Preference
|
—
|
|
—
|
|
—
|
|
—
|
|
(36
|
)
|
—
|
|
—
|
|
(36
|
)
|
|||||||||||||||
|
Issuances of common stock
|
—
|
|
—
|
|
—
|
|
(33,316
|
)
|
—
|
|
—
|
|
31,338
|
|
(1,978
|
)
|
|||||||||||||||
|
Conversions to common stock
|
—
|
|
(42
|
)
|
—
|
|
(831
|
)
|
—
|
|
—
|
|
873
|
|
—
|
|
|||||||||||||||
|
Stock-based compensation
|
—
|
|
—
|
|
—
|
|
24,389
|
|
—
|
|
—
|
|
—
|
|
24,389
|
|
|||||||||||||||
|
Balance at December 31, 2017
|
1
|
|
441
|
|
323,338
|
|
138,367
|
|
5,229,584
|
|
(792,173
|
)
|
(4,710,997
|
)
|
188,561
|
|
|||||||||||||||
|
Cumulative effect of accounting changes
|
—
|
|
—
|
|
—
|
|
—
|
|
104,026
|
|
(116,233
|
)
|
—
|
|
(12,207
|
)
|
|||||||||||||||
|
Net income - Pitney Bowes Inc.
|
—
|
|
—
|
|
—
|
|
—
|
|
223,665
|
|
—
|
|
—
|
|
223,665
|
|
|||||||||||||||
|
Other comprehensive income
|
—
|
|
—
|
|
—
|
|
—
|
|
—
|
|
(40,020
|
)
|
—
|
|
(40,020
|
)
|
|||||||||||||||
|
Cash dividends
|
|||||||||||||||||||||||||||||||
|
Common ($0.75 per share)
|
—
|
|
—
|
|
—
|
|
—
|
|
(140,466
|
)
|
—
|
|
—
|
|
(140,466
|
)
|
|||||||||||||||
|
Preference
|
—
|
|
—
|
|
—
|
|
—
|
|
(32
|
)
|
—
|
|
—
|
|
(32
|
)
|
|||||||||||||||
|
Issuances of common stock
|
—
|
|
—
|
|
—
|
|
(37,030
|
)
|
—
|
|
—
|
|
35,959
|
|
(1,071
|
)
|
|||||||||||||||
|
Conversions to common stock
|
—
|
|
(45
|
)
|
—
|
|
(904
|
)
|
—
|
|
—
|
|
949
|
|
—
|
|
|||||||||||||||
|
Stock-based compensation
|
—
|
|
—
|
|
—
|
|
21,042
|
|
—
|
|
—
|
|
—
|
|
21,042
|
|
|||||||||||||||
|
Balance at December 31, 2018
|
$
|
1
|
|
$
|
396
|
|
$
|
323,338
|
|
$
|
121,475
|
|
$
|
5,416,777
|
|
$
|
(948,426
|
)
|
$
|
(4,674,089
|
)
|
$
|
239,472
|
|
|||||||
See Notes to Consolidated Financial Statements
43
PITNEY BOWES INC.
NOTES TO CONSOLIDATED FINANCIAL STATEMENTS
(Tabular amounts in thousands, except per share amounts)
1. Summary of Significant Accounting Policies
Basis of Presentation
The accompanying Consolidated Financial Statements of Pitney Bowes Inc. (we, us, our, or the company) and its wholly owned subsidiaries have been prepared in conformity with accounting principles generally accepted in the United States of America (GAAP). Intercompany transactions and balances have been eliminated. Certain prior year amounts have been reclassified to conform to the current year presentation.
We revised our December 31, 2017 balance sheet to correct the classification between tax uncertainties and other income tax liabilities and deferred taxes on income by
$14 million
related to withholding taxes on unremitted earnings of our foreign subsidiaries. The impact of this revision was not material to the prior quarters.
In July 2018, we sold our Document Messaging Technology production mail business and supporting software (the Production Mail Business) to an affiliate of Platinum Equity, LLC, a leading global private equity firm. The Production Mail Business qualified as a discontinued operation and accordingly, the assets, liabilities and results of operations of the Production Mail Business are reported as discontinued operations (see Note 4).
Use of Estimates
The preparation of financial statements in conformity with GAAP requires the use of estimates and assumptions that affect the reported amounts of assets, liabilities, revenues, expenses and accompanying disclosures, including the disclosure of contingent assets and liabilities. These estimates and assumptions are based on management's best knowledge of current events, historical experience and other information available when the financial statements are prepared. These estimates include, but are not limited to, revenue recognition for multiple element arrangements, the allocation of purchase price to assets and liabilities acquired in business combinations, goodwill and intangible asset impairment review, allowance for doubtful accounts and credit losses, residual values of leased assets, useful lives of long-lived and intangible assets, restructuring costs, pension and other postretirement costs, income tax reserves, deferred tax asset valuation allowance, stock-based compensation expense and loss contingencies. Actual results could differ from those estimates and assumptions.
Cash Equivalents and Investments
Cash equivalents include highly-liquid interest-earning investments with a maturity of three months or less at the date of purchase. Short-term investments include investments with an original maturity of greater than three months and remaining maturities of less than one year from the reporting date.
Our investment securities are primarily classified as available-for-sale and recorded at fair value, with unrealized gains and losses, excluding other-than-temporary impairments, reported in other comprehensive income, net of tax. Purchase premiums and discounts are amortized using the effective interest method over the term of the security. Gains and losses on the sale of available-for-sale securities are recorded on the trade date using the specific identification method. Investment securities that management has the positive intent and ability to hold to maturity are classified as held-to-maturity and are carried at amortized cost. Investment securities are recorded in the Consolidated Balance Sheets as cash and cash equivalents, short-term investments and other assets depending on the investment's maturity.
Accounts Receivable and Allowance for Doubtful Accounts
Accounts receivable are generally due within 30 days after the invoice date. Accounts deemed uncollectible are written off against the allowance after all collection efforts have been exhausted and management deems the account to be uncollectible. We believe that our accounts receivable credit risk is low because of the geographic and industry diversification of our clients and small account balances for most of our clients.
We estimate the probable losses on accounts receivable and provide an allowance for doubtful accounts. Our estimate is based on historical loss experience, the age of the receivables, specific troubled accounts and other currently available information. We continually evaluate the adequacy of the allowance for doubtful accounts and make adjustments as necessary.
Finance Receivables and Allowance for Credit Losses
Finance receivables are composed of sales-type lease receivables and unsecured revolving loan receivables. We estimate probable losses on finance receivables and provide an allowance for credit losses. We estimate probable losses on finance receivables based on historical loss experience, the nature and volume of our portfolios, specific troubled accounts and our ability to manage the collateral . We continually evaluate the adequacy of the allowance for credit losses and make adjustments as necessary.
44
PITNEY BOWES INC.
NOTES TO CONSOLIDATED FINANCIAL STATEMENTS
(Tabular amounts in thousands, except per share amounts)
We establish credit approval limits based on the credit quality of the client and the type of equipment financed. We discontinue revenue recognition for lease receivables that are more than 120 days past due and for unsecured loan receivables that are more than 90 days past due and resume revenue recognition when the client's payments reduce the account aging to less than 60 days past due. Finance receivables deemed uncollectible are written off against the allowance after all collection efforts have been exhausted and management deems the account to be uncollectible. We believe that our finance receivable credit risk is low because of the geographic and industry diversification of our clients and small account balances for most of our clients.
Inventories
Inventories are stated at the lower of cost or market. Cost is determined on the last-in, first-out (LIFO) basis for most U.S. inventories and on the first-in, first-out (FIFO) basis for most non-U.S. inventories.
Fixed Assets
Property, plant and equipment and rental equipment are stated at cost and depreciated principally using the straight-line method over their estimated useful lives, which are
50 years
for buildings,
10
to
20
years for building improvements,
3
to
10
years for internal use software development costs,
3
to
12
years for machinery and equipment and
4
to
6
years for rental equipment. Major improvements that add to productive capacity or extend the life of an asset are capitalized while repairs and maintenance are charged to expense as incurred. Leasehold improvements are amortized over the shorter of their estimated useful life or the remaining lease term. Fully depreciated assets are retained in fixed assets and accumulated depreciation until they are removed from service.
Intangible assets
Finite-lived intangible assets are amortized using either the straight-line method or an accelerated attrition method over their estimated useful lives of up to
15
years.
Research and Development Costs
Research and development costs include engineering costs related to research and development activities and are expensed as incurred.
Impairment Review for Long-lived and Finite-Lived Intangible Assets
Long-lived assets and finite-lived intangible assets are reviewed for impairment whenever events or changes in circumstances indicate that the carrying amount may not be fully recoverable. The estimated undiscounted future cash flows expected to result from the use and eventual disposition of the asset is compared to the asset's carrying value. If the sum of the undiscounted cash flows is less than the asset's carrying value, an impairment charge is recorded for an amount by which the asset's carrying value exceeds its fair value. The fair value of the impaired asset is determined using probability weighted expected cash flow estimates, quoted market prices when available and appraisals, as appropriate. We derive cash flow estimates from our long-term business plans and historical experience.
Impairment Review for Goodwill
Goodwill is tested annually for impairment at the reporting unit level during the fourth quarter or sooner if circumstances indicate an impairment may exist. The impairment test for goodwill determines the fair value of each reporting unit and compares it to the reporting unit's carrying value, including goodwill. If the fair value of a reporting unit is less than its carrying value an impairment loss is recognized for the difference, not to exceed the carrying amount of goodwill.
Retirement Plans
Net periodic benefit cost includes current service cost, interest cost, expected return on plan assets and the amortization of actuarial gains and losses. Actuarial gains and losses arise from actual experiences that differ from previous assumptions as well as changes in assumptions for expected return on plan assets, discount rates used to measure pension and other postretirement obligations and life expectancy. The expected return on assets is measured using the market-related value of assets, which is a calculated value that recognizes changes in the fair value of plan assets over five years. Actuarial gains and losses are recognized in other comprehensive income, net of tax, and amortized to benefit cost primarily over the life expectancy of plan participants. The funded status of pension and other postretirement benefit plans is recognized in the Consolidated Balance Sheets.
Stock-based Compensation
We primarily issue restricted stock units, non-qualified stock options and performance stock units under our stock award plans. Compensation expense for stock-based awards is measured based on the estimated fair value of the awards expected to vest and recognized on a straight-line basis over the requisite service period. The fair value of stock awards is estimated based on the fair value of our common stock on the grant date, less the present value of expected dividends or using the Black-Scholes valuation model or Monte Carlo simulation
45
PITNEY BOWES INC.
NOTES TO CONSOLIDATED FINANCIAL STATEMENTS
(Tabular amounts in thousands, except per share amounts)
model. We believe that the valuation techniques and underlying assumptions are appropriate in estimating the fair value of stock awards. The majority of stock-based compensation expense is recorded in selling, general and administrative expense. Forfeitures are estimated at the time of grant to recognize expense for those awards that are expected to vest and are based on our historical forfeiture rates.
Revenue Recognition
Effective January 1, 2018, we adopted ASU 2014-09,
Revenue from Contracts with Customers
(ASC 606)
.
We adopted this standard on the modified retrospective basis with a cumulative effect adjustment. Results for reporting periods beginning after January 1, 2018 are presented under the new guidance, while prior period amounts are not adjusted and continue to be reported in accordance with previous guidance. We applied the following practical expedients and policy elections when adopting ASC 606:
|
•
|
Costs incurred to obtain a contract with a customer are expensed if the amortization period of the asset is one year or less;
|
|
•
|
With the exception of certain services contracts, all taxes assessed by government authorities, such as sales and use taxes, value added taxes and excise tax, are excluded from the transaction price;
|
|
•
|
The transaction price is not adjusted for a significant financing component when a performance obligation is satisfied within one year;
|
|
•
|
Revenue is recognized based on the amount billable to the customer, when that amount corresponds to the value transferred to the customer;
|
|
•
|
Shipping and handling activities are accounted for as a fulfillment activity rather than a separate performance obligation; and
|
|
•
|
We reflected the aggregate effect of all modifications when identifying performance obligations and allocating transaction price.
|
We derive revenue from multiple sources including sales, rentals, financing and services. Certain transactions are consummated at the same time and can therefore generate revenue from multiple sources. The most common form of these transactions involves a sale or noncancelable lease of equipment, a meter rental and an equipment maintenance agreement. We are required to determine whether each product and service within the contract should be treated as a separate performance obligation (unit of accounting) for revenue recognition purposes. For contracts that include multiple performance obligations, the transaction price is allocated based on relative standalone selling prices (SSP) which are a range of selling prices that we would sell a good or service to a customer on a separate basis. SSP is established for each performance obligation at the inception of the contract and can be based on observable prices or estimated. The allocation of the transaction price to the various performance obligations impacts the timing of revenue recognition, but does not change the total revenue recognized. More specifically, revenue related to our offerings is recognized as follows:
Equipment Sales
We sell equipment directly to our customers and to distributors (re-sellers) throughout the world. For a sale transaction, the SSP of the equipment is based on a range of selling prices in standalone transactions. For a lease transaction, revenue is allocated to the equipment based on the present value of the remaining minimum lease payments. We recognize revenue from the sale of equipment under sales-type leases as equipment sales revenue at the inception of the lease. We do not typically offer any rights of return or stock balancing rights. We recognize revenue on non-lease transactions when control of the equipment transfers to the customer, which is upon delivery for customer installable models and upon installation or customer acceptance for other models.
Supplies Revenue
Supplies revenue is generally recognized upon delivery.
Software Revenue
We also have contracts that contain only performance obligations to deliver software licenses and software related products and services that may include maintenance and support services, data, and training and integration services. A majority of our software and data license products are considered "right to use" and are generally distinct from other promised goods and services within a contract. Revenue for right to use software and data licenses is recognized at a point in time when control has transferred to the customer, which is generally upon delivery or acceptance for those licenses requiring significant integration or customization. Revenue from renewals are recognized at the beginning of the license term.
We generally invoice customers upon delivery of our software and data licenses. Data contracts that include both data and data updates are invoiced in one or more equal installments. A contract asset is recognized on data licenses for which consideration will be received in future periods.
We allocate the transaction price based on relative standalone selling prices, which are generally based on observable selling prices in standalone transactions for our data products, maintenance and professional services. We estimate the standalone selling prices for our software licenses using the residual approach, as the selling prices are highly variable and observable standalone selling prices exist for the other goods and services in the contract.
46
PITNEY BOWES INC.
NOTES TO CONSOLIDATED FINANCIAL STATEMENTS
(Tabular amounts in thousands, except per share amounts)
We often bundle software licenses with lease contracts. Revenue is recognized upon delivery of those software licenses considered distinct and functional in nature.
Rentals Revenue
Rentals revenue includes revenue from the subscription for digital meter services, postage meters and mailing equipment. Revenue is allocated to the meter rental and equipment maintenance agreement elements using their respective selling prices charged in standalone and renewal transactions. We may invoice in advance for postage meter rentals according to the terms of the agreement. We initially defer these advanced billings and recognize rentals revenue on a straight-line basis over the invoice period. Revenues generated from financing clients for the continued use of equipment subsequent to the expiration of the original lease are recognized as rentals revenue.
We capitalize certain initial direct costs incurred in consummating a rental transaction and recognize these costs over the expected term of the agreement. At December 31, 2018 and 2017, there were
$17 million
and
$10 million
of initial direct costs included in rental property and equipment, net in the Consolidated Balance Sheets, respectively. Amortization of these costs was
$5 million
,
$5 million
and
$7 million
, for the years ended December 31, 2018, 2017 and 2016, respectively.
Financing Revenue
We provide lease financing for our products primarily through sales-type leases. We also provide revolving lines of credit to our clients for the purchase of postage and supplies. We believe that our sales-type lease portfolio contains only normal collection risk. Accordingly, we record the fair value of equipment as sales revenue, the cost of equipment as cost of sales and the minimum lease payments plus the estimated residual value as finance receivables. The difference between the finance receivable and the equipment fair value is recorded as unearned income and is amortized as income over the lease term using the interest method.
Equipment residual values are determined at inception of the lease using estimates of fair value at the end of the lease term. Fair value estimates are based primarily on historical experience. We also consider forecasted supply and demand for products, product retirement and launch plans, client behavior, regulatory changes, remanufacturing strategies, used equipment markets, competition and technological changes. We evaluate residual values on an annual basis or sooner if circumstances warrant. Declines in estimated residual values considered "other-than-temporary" are recognized immediately. Estimated increases in future residual values are not recognized until the equipment is remarketed.
Support Services Revenue
We provide support services for our equipment primarily through maintenance contracts. Revenue is allocated to the equipment maintenance agreement using selling prices charged in standalone and renewal transactions. Since we have a stand-ready obligation to provide service over the entire contract term, revenue related to these equipment maintenance agreements is recognized on a straight-line basis over the term of the agreement.
Business Services Revenue
Business services revenue includes revenue from mail processing services and ecommerce solutions from our Commerce Services segment. These services represent a series of distinct services that are similar and revenue is recognized as the services are invoiced to the customer.
We also review certain third party relationships and evaluate the appropriateness of recording revenue on a gross basis when we act as a principal in a transaction or net basis when we act as an agent between a client and vendor. We consider several factors in determining whether we are acting as principal or agent such as whether we are the primary obligor to the client, have control over the pricing and have inventory risk.
Prior to the adoption of ASC 606, for multiple element arrangements, revenue was allocated to each of the elements based on relative "selling prices" determined based on vendor specific objective evidence (VSOE). We established VSOE of selling prices based on the prices charged for each element when sold separately in standalone transactions. Revenue was allocated to the meter rental and equipment maintenance agreement elements using their respective selling prices charged in standalone and renewal transactions. For a sale transaction, revenue was allocated to the equipment based on a range of selling prices in standalone transactions. For a lease transaction, revenue was allocated to the equipment based on the present value of the remaining minimum lease payments. The amount allocated to equipment was compared to the range of selling prices in standalone transactions during the period to ensure the allocated equipment amount approximated average selling prices.
We also have multiple element arrangements containing only software and software related elements. Software related elements may include maintenance and support services, data subscriptions, training and integration services. Under these multiple element arrangements, we allocated revenue based on VSOE for software related elements and used the residual method to determine the amount of software licenses revenue. Under the residual method, the fair value of the undelivered elements was deferred and the remaining portion of the consideration was allocated to the delivered elements and recognized as revenue. The majority of our software license arrangements are bundled with maintenance and support services and we established VSOE of fair value using a bell-shaped curve analysis for
47
PITNEY BOWES INC.
NOTES TO CONSOLIDATED FINANCIAL STATEMENTS
(Tabular amounts in thousands, except per share amounts)
maintenance and support services renewal rates. If VSOE for any undelivered software element could not be determined, revenue was deferred until all deliverables were delivered or until VSOE could be determined for remaining undelivered software elements.
For software licenses that were included in a lease contract, revenue was recognized upon delivery unless the lease contract specified that the license expired at the end of the lease or the price of the software was deemed not fixed or determinable based on historical evidence of similar software leases. In those instances, revenue was recognized on a straight-line basis over the term of the lease contract.
The adoption of ASC 606 did not have a material impact on the amount or timing of recognition for our other revenue streams.
Shipping and Handling
Shipping and handling costs are recognized as incurred and recorded in cost of revenues.
Costs to Obtain a Contract
Upon the adoption of ASC 606, certain incremental costs to obtain a contract are capitalized if we expect the benefit of those costs to be realized over a period greater than one year. These costs primarily relate to sales commission on multi-year equipment and software support service contracts. These costs are amortized in a manner consistent with the timing of the related revenue over the contract performance period or longer, if renewals are expected and the renewal commission is not commensurate with the initial commission. Amortization expense for the year ended December 31, 2018 was $
15 million
. Unamortized contract costs at December 31, 2018 were
$29 million
and are included in other assets.
Deferred Marketing Costs
Prior to the adoption of ASC 606, we capitalized certain costs associated with the acquisition of new customers and recognized those costs over the expected revenue stream of eight years. Deferred marketing costs at December 31, 2017 were
$36 million
and amortization of these costs for the years ended December 31, 2017 and 2016 were
$13 million
and
$15 million
, respectively. Upon the adoption of ASC 606, marketing costs associated with the acquisition of new customers are expensed as incurred and deferred marketing costs at January 1, 2018 were written off and included in the cumulative effect of accounting change.
Restructuring Charges
Costs associated with restructuring actions include employee severance, other employee separation costs and contract termination costs, including leases. These costs are recognized when a liability is incurred, which is generally upon communication to the affected employees or exit from a leased facility, and the amount to be paid is both probable and reasonably estimable. Severance accruals are based on company policy, historical experience and negotiated settlements.
Derivative Instruments
In the normal course of business, we are exposed to the impact of changes in foreign currency exchange rates and interest rates. We limit these risks by following established risk management policies and procedures, including the use of derivatives. We use derivative instruments to limit the effects of currency exchange rate fluctuations on financial results and manage the related cost of debt. We do not use derivatives for trading or speculative purposes.
We record derivative instruments at fair value and the accounting for changes in fair value depends on the intended use of the derivative, the resulting designation and the effectiveness of the instrument in offsetting the risk exposure it is designed to hedge. To qualify as a hedge, a derivative must be highly effective in offsetting the risk designated for hedging purposes. The hedge relationship must be formally documented at inception, detailing the particular risk management objective and strategy for the hedge. The effectiveness of the hedge relationship is evaluated on a retrospective and prospective basis.
The use of derivative instruments exposes us to counterparty credit risk. To mitigate such risks, we enter into contracts only with financial institutions that meet stringent credit requirements. We regularly review our credit exposure balances and the creditworthiness of our counterparties. We have not seen a material change in the creditworthiness of our derivative counterparties.
Income Taxes
We recognize deferred tax assets and liabilities for the future tax consequences attributable to differences between the carrying amounts of assets and liabilities and their respective tax bases. Deferred tax assets and liabilities are measured using the enacted tax rates expected to apply to taxable income in the years in which those temporary differences are expected to be recovered or settled. The effect of a change in tax rates on deferred tax assets and liabilities is recognized in income in the period that includes the enactment date of such change. A valuation allowance is provided when it is more likely than not that a deferred tax asset will not be realized. In estimating the necessity and amount of a valuation allowance, we consider all available evidence for each jurisdiction including historical operating
48
PITNEY BOWES INC.
NOTES TO CONSOLIDATED FINANCIAL STATEMENTS
(Tabular amounts in thousands, except per share amounts)
results, estimates of future taxable income and the feasibility of ongoing tax planning strategies. We adjust the valuation allowance through income tax expense when new information becomes available that would alter our determination of the amount of deferred tax assets that will ultimately be realized.
Earnings per Share
Basic earnings per share is computed based on the weighted-average number of common shares outstanding during the year. Diluted earnings per share is computed based on the weighted-average number of common shares plus the dilutive effect of common stock equivalents.
Translation of Non-U.S. Currency Amounts
In general, the functional currency of our foreign operations is the local currency. Assets and liabilities of subsidiaries operating outside the U.S. are translated at rates in effect at the end of the period and revenue and expenses are translated at average monthly rates during the period. Net deferred translation gains and losses are included as a component of accumulated other comprehensive income.
Loss Contingencies
In the ordinary course of business, we are routinely defendants in, or party to, a number of pending and threatened legal actions. On a quarterly basis, we review the status of each significant matter and assess the potential financial exposure. If the potential loss from any claim or legal action is considered probable and can be reasonably estimated, we establish a liability for the estimated loss. The assessment of the ultimate outcome of each claim or legal action and the determination of the potential financial exposure requires significant judgment. Estimates of potential liabilities for claims or legal actions are based only on information that is available at that time. As additional information becomes available, we may revise our estimates, and these revisions could have a material impact on our results of operations and financial position. Legal fees are expensed as incurred.
New Accounting Pronouncements
New Accounting Pronouncements - Standards Adopted in 2018
Effective January 1, 2018, we adopted ASC 606 using the modified retrospective method with a cumulative effect adjustment at the date of the initial application. See Revenue Recognition above and Note 2 for more information on the adoption of ASC 606.
In August 2018, the Financial Accounting Standards Board (FASB) issued Accounting Standards Update (ASU) 2018-14,
Compensation-Retirement Benefits-Defined Benefit Plans-General (Subtopic 715-20): Disclosure Framework-Changes to the Disclosure Requirements for Defined Benefit Plans.
The ASU impacts disclosure requirements only. The standard is effective beginning January 1, 2021; however, we elected to adopt this standard as of December 31, 2018.
In August 2018, the FASB issued ASU 2018-13,
Fair Value Measurement (Topic 820)
. The ASU impacts only disclosure requirements of fair value measurements. The standard is effective beginning January 1, 2020; however, we elected to adopt this standard as of December 31, 2018.
In February 2018, the FASB issued ASU 2018-02,
Reclassification of Certain Tax Effects from Accumulated Other Comprehensive Income
(AOCI)
.
The ASU permits a reclassification of the disproportionate income tax effects of the 2017 Tax Cuts and Jobs Act on items within AOCI to retained earnings and requires certain new disclosures. The standard is effective beginning January 1, 2019, with early adoption permitted. We elected to adopt this standard as of December 31, 2018 and recognized the reclassification of
$116 million
from AOCI to opening retained earnings as a cumulative effect adjustment. There was
no
impact to total Stockholders' equity.
In August 2017, the FASB issued ASU 2017-12,
Derivatives and Hedging (Topic 815): Targeted Improvements to Accounting for Hedging Activities.
The ASU changes the recognition and presentation requirements of hedge accounting and reduces the cost and complexity of applying hedge accounting by easing the requirements for effectiveness testing and hedge documentation. We early adopted this standard on January 1, 2018 and there was no impact on our consolidated financial statements.
In May 2017, the FASB issued ASU 2017-09,
Scope of Modification Accounting
. The ASU provides guidance about which changes to terms and conditions of a share-based payment award require an entity to apply modification accounting. There was no impact on our consolidated financial statements from the adoption of this standard.
In March 2017, the FASB issued ASU 2017-07,
Compensation - Retirement Benefits (Topic 715): Improving the Presentation of Net Periodic Pension Cost and Net Periodic Benefit Cost.
The ASU requires the service cost component of net periodic benefit cost to be presented in the same income statement line item as other employee compensation costs. Other components of the net periodic benefit cost are to be presented separately, in an appropriately titled line item outside of any subtotal of operating income or disclosed in the
49
PITNEY BOWES INC.
NOTES TO CONSOLIDATED FINANCIAL STATEMENTS
(Tabular amounts in thousands, except per share amounts)
footnotes. The standard also limits the amount eligible for capitalization to the service cost component. We adopted this standard and prior period information has been recast to conform to the current period presentation.
In January 2017, the FASB issued ASU 2017-01,
Clarifying the Definition of a Business,
which clarifies the definition of a business with the objective of adding guidance to assist entities in evaluating whether transactions should be accounted for as an acquisition or disposal of assets or a business. We adopted this standard on January 1, 2018 and there was no impact on our consolidated financial statements.
In October 2016, the FASB issued ASU 2016-16,
Income Taxes: Intra-entity Transfers of Assets other than Inventory,
which requires tax expense to be recognized from the sale of intra-entity assets, other than inventory, when the transfer occurs, even though the effects of the transaction are eliminated in consolidation. Under previous guidance, the tax effects of transfers were deferred until the transferred asset was sold or otherwise recovered through use. We adopted this standard and recognized a cumulative effect adjustment to reduce opening retained earnings by
$3 million
.
In January 2016, the FASB issued ASU 2016-01,
Financial Instruments - Overall: Recognition and Measurement of Financial Assets and Financial Liabilities
. This standard primarily affects the accounting for equity investments, financial liabilities under the fair value option, and the presentation and disclosure requirements for financial instruments. We adopted this standard and there was no impact on our consolidated financial statements.
New Accounting Pronouncements - Standards Not Yet Adopted
In February 2016, the FASB issued ASU 2016-02,
Leases (Topic 842)
, which was subsequently amended by ASU No. 2018-10,
Codification Improvements to Topic 842, Leases
; and ASU No. 2018-11,
Targeted Improvements.
We will adopt the new lease accounting standard on January 1, 2019, using the modified retrospective transition approach of applying the standard at the beginning of the earliest comparative period presented in the financial statements. As a result, we will record a cumulative effect adjustment as of January 1, 2017, recast comparative period financial statements and provide disclosures required by the standard.
From a lessor perspective, the standard simplifies the accounting for lease modifications and aligns accounting of lease contracts with revenue recognition guidance. We will continue to classify leases as sales-type or operating, with classification affecting the pattern and classification of income recognition. We expect changes in the timing and classification of revenue related to contract modifications. We expect certain income and costs to be accelerated that were previously recognized over the life of the lease due to conclusions on lease and non-lease components. We do not expect that this standard will have a material impact on our results of operations or liquidity; and we do not expect the economics and overall profitability of our lease offerings to be materially impacted.
From a lessee perspective, the standard requires us to recognize right-of-use (ROU) assets and lease liabilities for our real estate and equipment operating leases and to provide new disclosures about our leasing activities. We will elect the short-term lease recognition exemption and will not recognize ROU assets or lease liabilities for leases with a term less than 12 months. We will also elect the practical expedient to not separate lease and non-lease components for our lessee portfolio. Upon adoption, we expect to recognize ROU assets and lease liabilities in the range of
$175 million
to
$225 million
. The impact of adopting the standard related to lessee accounting will not have a material impact on our results of operations or liquidity.
In August 2018, the FASB issued ASU 2018-15,
Intangibles - Goodwill and Other-Internal-Use Software
. The ASU aligns the requirements for capitalizing implementation costs incurred in a hosting arrangement that is a service contract with the requirements for capitalizing implementation costs incurred to develop or obtain internal-use software. The standard is effective beginning January 1, 2020, with early adoption permitted. We are currently assessing the impact this standard will have on our consolidated financial statements.
In March 2017, the FASB issued ASU 2017-08,
Receivables - Nonrefundable Fees and Other Costs (Subtopic 310-20): Premium Amortization on Purchased Callable Debt Securities
. The ASU shortens the amortization period for certain callable debt securities held at a premium, requiring the premium to be amortized to the earliest call date. The standard will be adopted on January 1, 2019 on a modified retrospective basis. The implementation of this standard will not have a material impact on our consolidated financial statements.
In June 2016, the FASB issued ASU 2016-13,
Financial Instruments - Credit Losses
. The ASU sets forth a “current expected credit loss” (CECL) model, which requires companies to measure expected credit losses for all financial instruments held at the reporting date based on historical experience, current conditions and reasonably supportable forecasts. This replaces the existing incurred loss model and is applicable to the measurement of credit losses on financial assets measured at amortized cost and applies to some off-balance sheet credit exposures. This standard is effective beginning January 1, 2020. We are currently assessing the impact this standard will have on our consolidated financial statements and disclosures.
50
PITNEY BOWES INC.
NOTES TO CONSOLIDATED FINANCIAL STATEMENTS
(Tabular amounts in thousands, except per share amounts)
2. Revenue from Contracts with Customers
Adoption of ASC 606
We recorded a net decrease to opening retained earnings of
$9 million
as of January 1, 2018 for the cumulative effect of adopting ASC 606. Significant components of this cumulative effect adjustment include:
|
•
|
The write-off of previously capitalized deferred marketing costs that did not meet the criteria for capitalization under ASC 606;
|
|
•
|
The capitalization of certain costs to obtain a contract, primarily sales commissions, that are permitted to be capitalized under ASC 606;
|
|
•
|
The establishment of deferred revenue related to the early renewal of software and data license contracts with terms beginning in 2018, as ASC 606 requires revenue recognition at the commencement of the license term;
|
|
•
|
The write-off of deferred revenues and related costs for certain software licenses bundled with a lease that are recognized at time of delivery under ASC 606; and
|
|
•
|
The write-off of advance billings related to certain software data products that are recognized upon delivery under ASC 606.
|
The impact on our consolidated financial statements as if they were presented under the prior guidance is as follows:
|
Year ended December 31, 2018
|
|||||||||||
|
As reported
|
Prior guidance
|
Increase (decrease)
|
|||||||||
|
Income Statement
|
|||||||||||
|
Total revenue
|
$
|
3,522,380
|
|
$
|
3,483,757
|
|
$
|
38,623
|
|
||
|
Equipment sales
|
$
|
430,451
|
|
$
|
432,911
|
|
$
|
(2,460
|
)
|
||
|
Software
|
$
|
340,855
|
|
$
|
297,976
|
|
$
|
42,879
|
|
||
|
Business services
|
$
|
1,561,522
|
|
$
|
1,563,318
|
|
$
|
(1,796
|
)
|
||
|
Total costs and expenses
|
$
|
3,310,019
|
|
$
|
3,318,288
|
|
$
|
(8,269
|
)
|
||
|
Cost of equipment sales
|
$
|
181,766
|
|
$
|
181,957
|
|
$
|
(191
|
)
|
||
|
Cost of software
|
$
|
100,681
|
|
$
|
96,332
|
|
$
|
4,349
|
|
||
|
Selling, general and administrative
|
$
|
1,123,116
|
|
$
|
1,135,543
|
|
$
|
(12,427
|
)
|
||
|
Income from continuing operations before taxes
|
$
|
212,361
|
|
$
|
165,469
|
|
$
|
46,892
|
|
||
The most significant impact to the Consolidated Statement of Income for the year December 31, 2018, was higher software revenue of
$43 million
primarily due to the acceleration of data subscription revenues which were previously recognized on a ratable basis and the renewal of software data licenses with a term beginning in 2018. Additionally, selling, general and administrative expenses were lower due to the deferral of certain sales commissions and lower amortization of deferred marketing costs.
51
PITNEY BOWES INC.
NOTES TO CONSOLIDATED FINANCIAL STATEMENTS
(Tabular amounts in thousands, except per share amounts)
|
December 31, 2018
|
|||||||||||
|
As reported
|
Prior guidance
|
Increase (decrease)
|
|||||||||
|
Balance Sheet
|
|||||||||||
|
Total assets
|
$
|
5,972,903
|
|
$
|
5,951,075
|
|
$
|
21,828
|
|
||
|
Accounts receivable, net
|
$
|
455,807
|
|
$
|
454,414
|
|
$
|
1,393
|
|
||
|
Other current assets and prepayments
|
$
|
99,332
|
|
$
|
90,659
|
|
$
|
8,673
|
|
||
|
Other assets
|
$
|
413,239
|
|
$
|
400,955
|
|
$
|
12,284
|
|
||
|
Total liabilities
|
$
|
5,733,431
|
|
$
|
5,737,751
|
|
$
|
(4,320
|
)
|
||
|
Accounts payable and accrued liabilities
|
$
|
1,401,635
|
|
$
|
1,396,650
|
|
$
|
4,985
|
|
||
|
Advance billings
|
$
|
237,529
|
|
$
|
252,472
|
|
$
|
(14,943
|
)
|
||
|
Other noncurrent liabilities
|
$
|
474,862
|
|
$
|
477,208
|
|
$
|
(2,346
|
)
|
||
|
Total stockholders' equity
|
$
|
239,472
|
|
$
|
213,325
|
|
$
|
26,147
|
|
||
|
Retained earnings
|
$
|
5,416,777
|
|
$
|
5,389,732
|
|
$
|
27,045
|
|
||
|
Accumulated other comprehensive loss
|
$
|
(948,426
|
)
|
$
|
(947,528
|
)
|
$
|
(898
|
)
|
||
The most significant impacts to the Consolidated Balance Sheet at December 31, 2018 were:
|
•
|
Higher other current assets and prepayments primarily due to contract assets that are recognized when data licenses are delivered in advance to the right to invoice. This was offset by lower prepaid costs related to software licenses and software data products, which are now recognized at time of delivery rather than ratably under previous guidance;
|
|
•
|
Higher other assets primarily due to contract assets that are recognized when data licenses are delivered in advance to the right to invoice;
|
|
•
|
Higher accounts payable and other accrued liabilities due to higher costs directly related to the higher data license revenue that is recorded at the time of delivery under ASC 606 rather than ratably under the previous guidance; and
|
|
•
|
Lower advance billings primarily due to our data license products for which revenue is recognized at time of delivery but invoicing occurs in future periods. Under previous guidance data subscriptions were billed in advance and recognized on a ratable basis over the contract term.
|
52
PITNEY BOWES INC.
NOTES TO CONSOLIDATED FINANCIAL STATEMENTS
(Tabular amounts in thousands, except per share amounts)
Disaggregated Revenue
The following tables disaggregate our revenue by major source:
|
Year ended December 31, 2018
|
||||||||||||||||||||||||
|
Major products/service lines
|
Global Ecommerce
|
Presort Services
|
North America Mailing
|
International Mailing
|
Software Solutions
|
Total Revenue from sales and services (ASC 606)
|
Revenue from leasing transactions and financing
|
Total Consolidated Revenue
|
||||||||||||||||
|
Equipment sales
|
$
|
—
|
|
$
|
—
|
|
$
|
59,589
|
|
$
|
52,467
|
|
$
|
—
|
|
$
|
112,056
|
|
$
|
318,395
|
|
$
|
430,451
|
|
|
Supplies
|
—
|
|
—
|
|
144,283
|
|
74,021
|
|
—
|
|
218,304
|
|
—
|
|
218,304
|
|
||||||||
|
Software
|
—
|
|
—
|
|
—
|
|
—
|
|
340,855
|
|
340,855
|
|
—
|
|
340,855
|
|
||||||||
|
Rentals
|
—
|
|
—
|
|
19,390
|
|
8,214
|
|
—
|
|
27,604
|
|
335,453
|
|
363,057
|
|
||||||||
|
Financing
|
—
|
|
—
|
|
64,279
|
|
11,508
|
|
—
|
|
75,787
|
|
238,991
|
|
314,778
|
|
||||||||
|
Support services
|
—
|
|
—
|
|
208,855
|
|
84,558
|
|
—
|
|
293,413
|
|
—
|
|
293,413
|
|
||||||||
|
Business services
|
1,022,862
|
|
515,795
|
|
16,997
|
|
5,868
|
|
—
|
|
1,561,522
|
|
—
|
|
1,561,522
|
|
||||||||
|
$
|
1,022,862
|
|
$
|
515,795
|
|
$
|
513,393
|
|
$
|
236,636
|
|
$
|
340,855
|
|
$
|
2,629,541
|
|
$
|
892,839
|
|
$
|
3,522,380
|
|
|
|
Revenue from sales and services (ASC 606)
|
$
|
1,022,862
|
|
$
|
515,795
|
|
$
|
513,393
|
|
$
|
236,636
|
|
$
|
340,855
|
|
$
|
2,629,541
|
|
$
|
—
|
|
$
|
2,629,541
|
|
|
Revenue from leasing transactions and financing
|
—
|
|
—
|
|
761,632
|
|
131,207
|
|
—
|
|
—
|
|
892,839
|
|
892,839
|
|
||||||||
|
Total revenue
|
$
|
1,022,862
|
|
$
|
515,795
|
|
$
|
1,275,025
|
|
$
|
367,843
|
|
$
|
340,855
|
|
$
|
2,629,541
|
|
$
|
892,839
|
|
$
|
3,522,380
|
|
|
Timing of revenue recognition (ASC 606)
|
||||||||||||||||||||||||
|
Products/services transferred at a point in time
|
$
|
—
|
|
$
|
—
|
|
$
|
203,872
|
|
$
|
126,488
|
|
$
|
134,360
|
|
$
|
464,720
|
|
||||||
|
Products/services transferred over time
|
1,022,862
|
|
515,795
|
|
309,521
|
|
110,148
|
|
206,495
|
|
2,164,821
|
|
||||||||||||
|
Total revenue
|
$
|
1,022,862
|
|
$
|
515,795
|
|
$
|
513,393
|
|
$
|
236,636
|
|
$
|
340,855
|
|
$
|
2,629,541
|
|
||||||
Our performance obligations are as follows:
Equipment sales and supplies
: Our performance obligations generally include the sale of mailing equipment, excluding sales-type leases, and supplies. We recognize revenue upon delivery for self-install equipment and supplies and upon acceptance or installation for other equipment. We provide a warranty that our equipment is free of defects and meets stated specifications. The warranty is not considered a separate performance obligation.
Software
: Our performance obligations include the sale of software licenses, maintenance, data products and professional services. Revenue for licenses is generally recognized upon delivery or over time for those licenses that require critical updates over the term of the contract.
Rentals
: Our performance obligations include the fees associated with postage refills for meters.
Financing
: Our performance obligations include services under our equipment replacement program. The fees received for this program are recognized ratably over the contract term.
Support Services
: Our performance obligations include providing maintenance and professional services for our North America and International mailing equipment. Contract terms range from
one
year to
five
years, depending on the term of the lease contract for the related equipment. Maintenance revenue is recognized ratably over the contract period and revenue for professional services is recognized when services are provided.
Business Services
: Our performance obligations primarily include mail processing services and ecommerce solutions. Revenue is recognized over time as the services are provided. The contract terms for these services vary, with the initial contracts in the range of
one
to
five
years followed by annual renewal periods.
Revenue from leasing transactions and financing include revenue from sales-type leases, finance income and late fees that are not accounted for under ASC 606.
53
PITNEY BOWES INC.
NOTES TO CONSOLIDATED FINANCIAL STATEMENTS
(Tabular amounts in thousands, except per share amounts)
Contract Assets and Advance Billings from Contracts with Customers
Contract assets are recorded in other current assets and prepayments (current portion) and other assets (noncurrent portion) and advance billings are recorded in advance billings (current portion) and other noncurrent liabilities (noncurrent portion) in the Consolidated Balance Sheet. The following table summarizes our contract assets and advanced billings balances:
|
December 31, 2018
|
January 1, 2018
|
Total increase (decrease)
|
|||||||||
|
Contracts assets, current portion
|
$
|
16,115
|
|
$
|
5,075
|
|
$
|
11,040
|
|
||
|
Contracts assets, noncurrent portion
|
$
|
13,092
|
|
$
|
648
|
|
$
|
12,444
|
|
||
|
Advance billings, current portion
|
$
|
185,322
|
|
$
|
209,098
|
|
$
|
(23,776
|
)
|
||
|
Advance billings, noncurrent portion
|
$
|
12,778
|
|
$
|
17,765
|
|
$
|
(4,987
|
)
|
||
Contract Assets
We record contract assets when performance obligations are satisfied in advance of invoicing the customer when the right to consideration is conditional on the satisfaction of another performance obligation within a contract. The increase in contract assets is primarily due to an increase in multiple year data contracts where the license was delivered in 2018 but the right to invoice will occur in future periods.
Advance Billings from Contracts with Customers
Advance billings are recorded when cash payments are due in advance of performance. Items in advance billings primarily relate to support services on equipment and software licenses, subscription services and certain software data products. Revenue is recognized ratably over the contract term. The net decrease in advance billings at December 31, 2018 is primarily driven by revenues recognized during the period, which includes
$190 million
of advance billings at the beginning of the period, partially offset by advance billings for the year.
Future Performance Obligations
The transaction prices allocated to future performance obligations will be recognized as follows:
|
2019
|
2020
|
2021-2023
|
Total
|
||||||||||||
|
North America Mailing
(1)
|
$
|
144,989
|
|
$
|
110,930
|
|
$
|
133,738
|
|
$
|
389,657
|
|
|||
|
International Mailing
(1)
|
37,921
|
|
24,552
|
|
38,068
|
|
100,541
|
|
|||||||
|
Software Solutions
(2)
|
66,185
|
|
38,373
|
|
22,170
|
|
126,728
|
|
|||||||
|
Total
|
$
|
249,095
|
|
$
|
173,855
|
|
$
|
193,976
|
|
$
|
616,926
|
|
|||
(1)
Revenue streams bundled with our leasing contracts, primarily maintenance and other services.
(2)
Multiple-year software maintenance contracts, certain software and data licenses and data updates.
The table above does not include revenue related to performance obligations for contracts with terms less than
12
months and expected consideration for those performance obligations where revenue is recognized based on the amount billable to the customer.
54
PITNEY BOWES INC.
NOTES TO CONSOLIDATED FINANCIAL STATEMENTS
(Tabular amounts in thousands, except per share amounts)
3. Segment Information
In January 2018, we revised our business reporting groups to reflect how we manage these groups and clients served in each market. We formed the Commerce Services group to include our Global Ecommerce and Presort Services segments. Additionally, we classified the operating results of the Production Mail Business to discontinued operations and have recast prior year segment operating results to conform to the current year presentation. The principal products and services of each reportable segment are as follows:
Commerce Services:
Global Ecommerce:
Includes the worldwide revenue and related expenses from cross-border ecommerce transactions and domestic retail and ecommerce shipping solutions and fulfillment, delivery and return services.
Presort Services
: Includes revenue and related expenses from sortation services that allow clients to qualify large volumes of First Class Mail, Marketing Mail and Bound and Packet Mail (Standard Flats and Bound Printed Matter) for postal worksharing discounts.
Small & Medium Business (SMB) Solutions:
North America Mailing
: Includes the revenue and related expenses from mailing and shipping solutions, financing, services and supplies for small and medium businesses to efficiently create mail, evidence postage and help simplify and save on the sending, tracking and receiving of letters, parcels and flats in the U.S. and Canada.
International Mailing
: Includes the revenue and related expenses from mailing and shipping solutions, financing, services and supplies for small and medium businesses to efficiently create mail, evidence postage and help simplify and save on the sending, tracking and receiving of letters, parcels and flats in areas outside the U.S. and Canada.
Software Solutions:
Includes the worldwide revenue and related expenses from the licensing of customer engagement, customer information, location intelligence software, data solutions and related support services.
Management uses segment earnings before interest and taxes (EBIT) to measure profitability and performance at the segment level and believes that it provides a useful measure of operating performance and underlying trends of the business. We determine segment EBIT by deducting from segment revenue the related costs and expenses attributable to the segment. Segment EBIT excludes interest, taxes, general corporate expenses, restructuring charges and other items not allocated to a particular business segment. Segment EBIT may not be indicative of our overall consolidated performance and therefore, should be read in conjunction with our consolidated results of operations. The following tables provide information about our reportable segments and reconciliation of segment EBIT to net income.
|
Revenues
|
|||||||||||
|
Years Ended December 31,
|
|||||||||||
|
2018
|
2017
|
2016
|
|||||||||
|
Global Ecommerce
|
$
|
1,022,862
|
|
$
|
552,242
|
|
$
|
339,320
|
|
||
|
Presort Services
|
515,795
|
|
497,901
|
|
475,582
|
|
|||||
|
Commerce Services
|
1,538,657
|
|
1,050,143
|
|
814,902
|
|
|||||
|
North America Mailing
|
1,275,025
|
|
1,357,405
|
|
1,429,027
|
|
|||||
|
International Mailing
|
367,843
|
|
384,097
|
|
412,244
|
|
|||||
|
SMB Solutions
|
1,642,868
|
|
1,741,502
|
|
1,841,271
|
|
|||||
|
Software Solutions
|
340,855
|
|
331,627
|
|
325,150
|
|
|||||
|
Total Revenue
|
$
|
3,522,380
|
|
$
|
3,123,272
|
|
$
|
2,981,323
|
|
||
|
Geographic data:
|
|||||||||||
|
United States
|
$
|
2,865,228
|
|
$
|
2,466,403
|
|
$
|
2,299,607
|
|
||
|
Outside United States
|
657,152
|
|
656,869
|
|
681,716
|
|
|||||
|
Total
|
$
|
3,522,380
|
|
$
|
3,123,272
|
|
$
|
2,981,323
|
|
||
55
PITNEY BOWES INC.
NOTES TO CONSOLIDATED FINANCIAL STATEMENTS
(Tabular amounts in thousands, except per share amounts)
|
EBIT
|
|||||||||||
|
Years Ended December 31,
|
|||||||||||
|
2018
|
2017
|
2016
|
|||||||||
|
Global Ecommerce
|
$
|
(32,379
|
)
|
$
|
(17,899
|
)
|
$
|
3,043
|
|
||
|
Presort Services
|
73,768
|
|
97,506
|
|
95,258
|
|
|||||
|
Commerce Services
|
41,389
|
|
79,607
|
|
98,301
|
|
|||||
|
North America Mailing
|
470,268
|
|
498,571
|
|
594,723
|
|
|||||
|
International Mailing
|
63,820
|
|
48,531
|
|
45,408
|
|
|||||
|
SMB Solutions
|
534,088
|
|
547,102
|
|
640,131
|
|
|||||
|
Software Solutions
|
47,094
|
|
33,818
|
|
22,119
|
|
|||||
|
Total segment EBIT
|
622,571
|
|
660,527
|
|
760,551
|
|
|||||
|
Reconciling items:
|
|
|
|
|
|||||||
|
Interest, net
|
(159,757
|
)
|
(164,162
|
)
|
(144,211
|
)
|
|||||
|
Unallocated corporate expenses
|
(180,481
|
)
|
(214,072
|
)
|
(199,954
|
)
|
|||||
|
Restructuring charges and asset impairments, net
|
(27,077
|
)
|
(56,223
|
)
|
(60,295
|
)
|
|||||
|
Goodwill impairment
|
—
|
|
—
|
|
(148,181
|
)
|
|||||
|
Pension settlement
|
(31,329
|
)
|
—
|
|
—
|
|
|||||
|
Gain on sale of technology
|
—
|
|
6,085
|
|
—
|
|
|||||
|
Transaction costs
|
(3,602
|
)
|
(6,384
|
)
|
(6,121
|
)
|
|||||
|
Other expense
|
(7,964
|
)
|
(3,856
|
)
|
—
|
|
|||||
|
Income from continuing operations before income taxes
|
212,361
|
|
221,915
|
|
201,789
|
|
|||||
|
Provision for income taxes
|
12,383
|
|
553
|
|
106,975
|
|
|||||
|
Income from discontinued operations, net of tax
|
23,687
|
|
39,978
|
|
17,036
|
|
|||||
|
Net income
|
$
|
223,665
|
|
$
|
261,340
|
|
$
|
111,850
|
|
||
|
Depreciation and amortization
|
||||||||||||
|
Years Ended December 31,
|
||||||||||||
|
2018
|
2017
|
2016
|
||||||||||
|
Global Ecommerce
|
$
|
61,046
|
|
$
|
36,662
|
|
$
|
30,607
|
|
|||
|
Presort Services
|
26,838
|
|
26,541
|
|
27,929
|
|
||||||
|
Commerce Services
|
87,884
|
|
63,203
|
|
58,536
|
|
||||||
|
North America Mailing
|
68,250
|
|
64,803
|
|
60,066
|
|
||||||
|
International Mailing
|
16,142
|
|
18,562
|
|
19,431
|
|
||||||
|
SMB Solutions
|
84,392
|
|
83,365
|
|
79,497
|
|
||||||
|
Software Solutions
|
9,540
|
|
8,978
|
|
14,621
|
|
||||||
|
Total for reportable segments
|
181,816
|
|
155,546
|
|
152,654
|
|
||||||
|
Unallocated amounts
|
21,477
|
|
24,104
|
|
21,411
|
|
||||||
|
Total depreciation and amortization
|
$
|
203,293
|
|
$
|
179,650
|
|
—
|
|
$
|
174,065
|
|
|
56
PITNEY BOWES INC.
NOTES TO CONSOLIDATED FINANCIAL STATEMENTS
(Tabular amounts in thousands, except per share amounts)
|
Capital expenditures
|
|||||||||||
|
Years Ended December 31,
|
|||||||||||
|
2018
|
2017
|
2016
|
|||||||||
|
Global Ecommerce
|
$
|
46,117
|
|
$
|
26,810
|
|
$
|
15,647
|
|
||
|
Presort Services
|
42,532
|
|
20,860
|
|
17,537
|
|
|||||
|
Commerce Services
|
88,649
|
|
47,670
|
|
33,184
|
|
|||||
|
North America Mailing
|
61,458
|
|
69,131
|
|
83,547
|
|
|||||
|
International Mailing
|
10,701
|
|
11,982
|
|
3,163
|
|
|||||
|
SMB Solutions
|
72,159
|
|
81,113
|
|
86,710
|
|
|||||
|
Software Solutions
|
4,251
|
|
9,181
|
|
4,617
|
|
|||||
|
Total for reportable segments
|
165,059
|
|
137,964
|
|
124,511
|
|
|||||
|
Unallocated amount
|
26,385
|
|
30,133
|
|
34,721
|
|
|||||
|
Total capital expenditures
|
$
|
191,444
|
|
$
|
168,097
|
|
$
|
159,232
|
|
||
|
Assets
|
|||||||||||
|
December 31,
|
|||||||||||
|
2018
|
2017
|
2016
|
|||||||||
|
Global Ecommerce
|
$
|
1,023,732
|
|
$
|
1,016,045
|
|
$
|
449,363
|
|
||
|
Presort Services
|
431,512
|
|
387,701
|
|
373,443
|
|
|||||
|
Commerce Services
|
1,455,244
|
|
1,403,746
|
|
822,806
|
|
|||||
|
North America Mailing
|
1,859,355
|
|
1,965,198
|
|
2,073,344
|
|
|||||
|
International Mailing
|
502,370
|
|
550,306
|
|
521,003
|
|
|||||
|
SMB Solutions
|
2,361,725
|
|
2,515,504
|
|
2,594,347
|
|
|||||
|
Software Solutions
|
593,050
|
|
583,549
|
|
569,414
|
|
|||||
|
Total for reportable segments
|
4,410,019
|
|
4,502,799
|
|
3,986,567
|
|
|||||
|
Cash and cash equivalents
|
867,262
|
|
1,009,021
|
|
764,522
|
|
|||||
|
Short-term investments
|
59,391
|
|
48,988
|
|
38,448
|
|
|||||
|
Assets of discontinued operations
|
4,854
|
|
334,848
|
|
317,333
|
|
|||||
|
Other corporate assets
|
631,377
|
|
791,764
|
|
730,263
|
|
|||||
|
Consolidated assets
|
$
|
5,972,903
|
|
$
|
6,687,420
|
|
$
|
5,837,133
|
|
||
|
Identifiable long-lived assets:
|
|||||||||||
|
United States
|
$
|
543,118
|
|
$
|
501,251
|
|
$
|
436,795
|
|
||
|
Outside United States
|
45,095
|
|
56,208
|
|
58,339
|
|
|||||
|
Total
|
$
|
588,213
|
|
$
|
557,459
|
|
$
|
495,134
|
|
||
57
PITNEY BOWES INC.
NOTES TO CONSOLIDATED FINANCIAL STATEMENTS
(Tabular amounts in thousands, except per share amounts)
4. Discontinued Operations
On July 2, 2018, we completed the sale of the Production Mail Business, other than in certain non-U.S. jurisdictions, to an affiliate of Platinum Equity, LLC, a leading global private equity firm. Subsequently during the last half of the year, we closed on the sale of most of the non-U.S. jurisdictions, and expect to close on the remaining non-U.S. jurisdictions in the first quarter of 2019, subject to local regulatory requirements. Cash proceeds from the sale were
$340 million
and net proceeds, after the payment of closing costs, transaction fees and taxes, were approximately
$270 million
.
In connection with the sale, we entered into Transition Services Agreements (TSAs) with the purchaser whereby we will perform certain support functions for periods of a year or less. These TSAs will not have a material effect on our financial performance.
Selected financial information of the Production Mail Business included in discontinued operations is as follows:
|
Years Ended December 31,
|
|||||||||||
|
2018
|
2017
|
2016
|
|||||||||
|
Revenue
|
$
|
211,542
|
|
$
|
426,676
|
|
$
|
425,252
|
|
||
|
Earnings from discontinued operations
|
$
|
18,952
|
|
$
|
61,074
|
|
$
|
41,880
|
|
||
|
Gain on sale
|
60,611
|
|
—
|
|
—
|
|
|||||
|
Income from discontinued operations before taxes
|
79,563
|
|
61,074
|
|
41,880
|
|
|||||
|
Tax provision
|
55,876
|
|
21,096
|
|
24,844
|
|
|||||
|
Income from discontinued operations
|
$
|
23,687
|
|
$
|
39,978
|
|
$
|
17,036
|
|
||
The gain on sale includes a
$13 million
non-cash pension settlement charge and
$11 million
of transaction costs.
The major categories of assets and liabilities of the Production Mail Business included in assets of discontinued operations and liabilities of discontinued operations are as follows:
|
December 31, 2018
|
December 31, 2017
|
||||||
|
Cash and cash equivalents
|
$
|
1,965
|
|
$
|
—
|
|
|
|
Accounts receivable, net
|
1,057
|
|
97,402
|
|
|||
|
Inventories
|
849
|
|
48,910
|
|
|||
|
Other current assets and prepayments
|
278
|
|
3,365
|
|
|||
|
Property, plant and equipment, net
|
526
|
|
5,541
|
|
|||
|
Rental property and equipment, net
|
179
|
|
1,786
|
|
|||
|
Goodwill
|
—
|
|
177,799
|
|
|||
|
Other assets
|
—
|
|
45
|
|
|||
|
Assets of discontinued operations
|
$
|
4,854
|
|
$
|
334,848
|
|
|
|
Accounts payable and accrued liabilities
|
$
|
662
|
|
$
|
36,592
|
|
|
|
Advance billings
|
593
|
|
30,607
|
|
|||
|
Other current liabilities
|
2,021
|
|
—
|
|
|||
|
Other noncurrent liabilities
|
—
|
|
5,609
|
|
|||
|
Liabilities of discontinued operations
|
$
|
3,276
|
|
$
|
72,808
|
|
|
58
PITNEY BOWES INC.
NOTES TO CONSOLIDATED FINANCIAL STATEMENTS
(Tabular amounts in thousands, except per share amounts)
5. Earnings per Share
The calculations of basic and diluted earnings per share for the years ended
December 31, 2018
,
2017
and
2016
are presented below. The sum of earnings per share amounts may not equal the totals due to rounding.
|
Years Ended December 31,
|
|||||||||||
|
2018
|
2017
|
2016
|
|||||||||
|
Numerator:
|
|
|
|
|
|
|
|||||
|
Net income from continuing operations
|
$
|
199,978
|
|
$
|
221,362
|
|
$
|
75,769
|
|
||
|
Income from discontinued operations
|
23,687
|
|
39,978
|
|
17,036
|
|
|||||
|
Net income (numerator for diluted EPS)
|
223,665
|
|
261,340
|
|
92,805
|
|
|||||
|
Less: Preference stock dividend
|
32
|
|
36
|
|
38
|
|
|||||
|
Income attributable to common stockholders (numerator for basic EPS)
|
$
|
223,633
|
|
$
|
261,304
|
|
$
|
92,767
|
|
||
|
Denominator:
|
|
|
|
|
|
|
|||||
|
Weighted-average shares used in basic EPS
|
187,277
|
|
186,332
|
|
187,945
|
|
|||||
|
Dilutive effect of common stock equivalents
|
1,105
|
|
1,103
|
|
1,030
|
|
|||||
|
Weighted-average shares used in diluted EPS
|
188,382
|
|
187,435
|
|
188,975
|
|
|||||
|
Basic earnings per share:
|
|
|
|
|
|
|
|||||
|
Continuing operations
|
$
|
1.07
|
|
$
|
1.19
|
|
$
|
0.40
|
|
||
|
Discontinued operations
|
0.13
|
|
0.21
|
|
0.09
|
|
|||||
|
Net income attributable to Pitney Bowes Inc.
|
$
|
1.19
|
|
$
|
1.40
|
|
$
|
0.49
|
|
||
|
Diluted earnings per share:
|
|
|
|
|
|
|
|||||
|
Continuing operations
|
$
|
1.06
|
|
$
|
1.18
|
|
$
|
0.40
|
|
||
|
Discontinued operations
|
0.13
|
|
0.21
|
|
0.09
|
|
|||||
|
Net income attributable to Pitney Bowes Inc.
|
$
|
1.19
|
|
$
|
1.39
|
|
$
|
0.49
|
|
||
|
Anti-dilutive options excluded from diluted earnings per share:
|
12,089
|
|
10,267
|
|
8,126
|
|
|||||
6. Inventories
Inventories are stated at the lower of cost or net realizable value. Cost is determined on the last-in, first-out (LIFO) basis for most U.S. inventories and the first-in, first-out (FIFO) basis for most non-U.S. inventories. Inventories at
December 31, 2018
and
2017
consisted of the following:
|
December 31,
|
|||||||
|
2018
|
2017
|
||||||
|
Raw materials
|
$
|
8,231
|
|
$
|
11,767
|
|
|
|
Supplies and service parts
|
21,841
|
|
21,475
|
|
|||
|
Finished products
|
14,897
|
|
13,261
|
|
|||
|
Inventory at FIFO cost, net
|
44,969
|
|
46,503
|
|
|||
|
Excess of FIFO cost over LIFO cost
|
(3,005
|
)
|
(5,734
|
)
|
|||
|
Total inventory, net
|
$
|
41,964
|
|
$
|
40,769
|
|
|
59
PITNEY BOWES INC.
NOTES TO CONSOLIDATED FINANCIAL STATEMENTS
(Tabular amounts in thousands, except per share amounts)
7. Finance Assets
Finance Receivables
Finance receivables are comprised of sales-type lease receivables and unsecured revolving loan receivables. Sales-type lease receivables are generally due in monthly, quarterly or semi-annual installments over periods ranging from
three
to
five
years. Loan receivables arise primarily from financing services offered to our clients for postage and supplies. Loan receivables are generally due each month; however, customers may rollover outstanding balances. Interest on loan receivables is recognized using the effective interest method. Annual fees are initially deferred and recognized ratably over the annual period covered. Customer acquisition costs are expensed as incurred.
Finance receivables at
December 31, 2018
and
2017
consisted of the following:
|
December 31, 2018
|
December 31, 2017
|
||||||||||||||||||||||
|
North America
|
International
|
Total
|
North America
|
International
|
Total
|
||||||||||||||||||
|
Sales-type lease receivables
|
|
|
|
|
|
|
|||||||||||||||||
|
Gross finance receivables
|
$
|
1,004,491
|
|
$
|
268,199
|
|
$
|
1,272,690
|
|
$
|
1,023,549
|
|
$
|
292,059
|
|
$
|
1,315,608
|
|
|||||
|
Unguaranteed residual values
|
53,793
|
|
12,772
|
|
66,565
|
|
74,093
|
|
14,202
|
|
88,295
|
|
|||||||||||
|
Unearned income
|
(211,683
|
)
|
(55,113
|
)
|
(266,796
|
)
|
(216,720
|
)
|
(62,325
|
)
|
(279,045
|
)
|
|||||||||||
|
Allowance for credit losses
|
(10,253
|
)
|
(2,355
|
)
|
(12,608
|
)
|
(7,721
|
)
|
(2,794
|
)
|
(10,515
|
)
|
|||||||||||
|
Net investment in sales-type lease receivables
|
836,348
|
|
223,503
|
|
1,059,851
|
|
873,201
|
|
241,142
|
|
1,114,343
|
|
|||||||||||
|
Loan receivables
|
|
|
|
|
|
|
|
|
|
|
|
|
|||||||||||
|
Loan receivables
|
300,319
|
|
29,270
|
|
329,589
|
|
339,373
|
|
34,492
|
|
373,865
|
|
|||||||||||
|
Allowance for credit losses
|
(6,777
|
)
|
(837
|
)
|
(7,614
|
)
|
(7,098
|
)
|
(1,020
|
)
|
(8,118
|
)
|
|||||||||||
|
Net investment in loan receivables
|
293,542
|
|
28,433
|
|
321,975
|
|
332,275
|
|
33,472
|
|
365,747
|
|
|||||||||||
|
Net investment in finance receivables
|
$
|
1,129,890
|
|
$
|
251,936
|
|
$
|
1,381,826
|
|
$
|
1,205,476
|
|
$
|
274,614
|
|
$
|
1,480,090
|
|
|||||
Loans receivable are due within one year. Maturities of gross sales-type lease finance receivables at
December 31, 2018
were as follows:
|
Sales-type Lease Receivables
|
|||||||||||
|
North America
|
International
|
Total
|
|||||||||
|
2019
|
$
|
469,288
|
|
$
|
108,481
|
|
$
|
577,769
|
|
||
|
2020
|
254,781
|
|
74,469
|
|
329,250
|
|
|||||
|
2021
|
163,481
|
|
48,136
|
|
211,617
|
|
|||||
|
2022
|
87,674
|
|
26,968
|
|
114,642
|
|
|||||
|
2023
|
29,086
|
|
9,143
|
|
38,229
|
|
|||||
|
Thereafter
|
181
|
|
1,002
|
|
1,183
|
|
|||||
|
Total
|
$
|
1,004,491
|
|
$
|
268,199
|
|
$
|
1,272,690
|
|
||
60
PITNEY BOWES INC.
NOTES TO CONSOLIDATED FINANCIAL STATEMENTS
(Tabular amounts in thousands, except per share amounts)
Allowance for Credit Losses
Activity in the allowance for credit losses for the years ended
December 31, 2018
,
2017
and
2016
was as follows:
|
Sales-type Lease Receivables
|
Loan Receivables
|
||||||||||||||||||
|
North
America
|
International
|
North
America
|
International
|
Total
|
|||||||||||||||
|
Balance at December 31, 2015
|
$
|
6,606
|
|
$
|
3,542
|
|
$
|
10,024
|
|
$
|
1,518
|
|
$
|
21,690
|
|
||||
|
Amounts charged to expense
|
5,136
|
|
1,161
|
|
6,238
|
|
836
|
|
13,371
|
|
|||||||||
|
Accounts written off
|
(3,495
|
)
|
(2,056
|
)
|
(7,745
|
)
|
(1,265
|
)
|
(14,561
|
)
|
|||||||||
|
Balance at December 31, 2016
|
8,247
|
|
2,647
|
|
8,517
|
|
1,089
|
|
20,500
|
|
|||||||||
|
Amounts charged to expense
|
7,544
|
|
1,280
|
|
6,273
|
|
510
|
|
15,607
|
|
|||||||||
|
Accounts written off
|
(8,070
|
)
|
(1,133
|
)
|
(7,692
|
)
|
(579
|
)
|
(17,474
|
)
|
|||||||||
|
Balance at December 31, 2017
|
7,721
|
|
2,794
|
|
7,098
|
|
1,020
|
|
18,633
|
|
|||||||||
|
Amounts charged to expense
|
7,928
|
|
1,315
|
|
6,825
|
|
532
|
|
16,600
|
|
|||||||||
|
Accounts written off
|
(5,396
|
)
|
(1,754
|
)
|
(7,146
|
)
|
(715
|
)
|
(15,011
|
)
|
|||||||||
|
Balance at December 31, 2018
|
$
|
10,253
|
|
$
|
2,355
|
|
$
|
6,777
|
|
$
|
837
|
|
$
|
20,222
|
|
||||
Aging of Receivables
The aging of finance receivables at
December 31, 2018
and
2017
was as follows:
|
Sales-type Lease Receivables
|
Loan Receivables
|
||||||||||||||||||
|
North
America
|
International
|
North
America
|
International
|
Total
|
|||||||||||||||
|
December 31, 2018
|
|
|
|
|
|
|
|
|
|
|
|||||||||
|
1 - 90 days
|
$
|
966,868
|
|
$
|
263,954
|
|
$
|
294,126
|
|
$
|
29,079
|
|
$
|
1,554,027
|
|
||||
|
> 90 days
|
37,623
|
|
4,245
|
|
6,193
|
|
191
|
|
48,252
|
|
|||||||||
|
Total
|
$
|
1,004,491
|
|
$
|
268,199
|
|
$
|
300,319
|
|
$
|
29,270
|
|
$
|
1,602,279
|
|
||||
|
Past due amounts > 90 days
|
|
|
|
|
|
|
|
|
|
|
|||||||||
|
Still accruing interest
|
$
|
7,159
|
|
$
|
1,202
|
|
$
|
1,769
|
|
$
|
72
|
|
$
|
10,202
|
|
||||
|
Not accruing interest
|
30,464
|
|
3,043
|
|
4,424
|
|
119
|
|
38,050
|
|
|||||||||
|
Total
|
$
|
37,623
|
|
$
|
4,245
|
|
$
|
6,193
|
|
$
|
191
|
|
$
|
48,252
|
|
||||
|
Sales-type Lease Receivables
|
Loan Receivables
|
||||||||||||||||||
|
North
America
|
International
|
North
America
|
International
|
Total
|
|||||||||||||||
|
December 31, 2017
|
|
|
|
|
|
|
|
|
|
|
|||||||||
|
1 - 90 days
|
$
|
971,002
|
|
$
|
286,170
|
|
$
|
330,503
|
|
$
|
34,239
|
|
$
|
1,621,914
|
|
||||
|
> 90 days
|
52,547
|
|
5,889
|
|
8,870
|
|
253
|
|
67,559
|
|
|||||||||
|
Total
|
$
|
1,023,549
|
|
$
|
292,059
|
|
$
|
339,373
|
|
$
|
34,492
|
|
$
|
1,689,473
|
|
||||
|
Past due amounts > 90 days
|
|
|
|
|
|
|
|
|
|
|
|||||||||
|
Still accruing interest
|
$
|
10,807
|
|
$
|
1,738
|
|
$
|
—
|
|
$
|
—
|
|
$
|
12,545
|
|
||||
|
Not accruing interest
|
41,740
|
|
4,151
|
|
8,870
|
|
253
|
|
55,014
|
|
|||||||||
|
Total
|
$
|
52,547
|
|
$
|
5,889
|
|
$
|
8,870
|
|
$
|
253
|
|
$
|
67,559
|
|
||||
Credit Quality
The extension of credit lines to new and existing clients uses a combination of an automated credit score, where available, and a detailed manual review of the client's financial condition and, when applicable, payment history. Once credit is granted, the payment performance of the client is managed through automated collections processes and is supplemented with direct follow up should an account become delinquent. We have robust automated collections and extensive portfolio management processes. The portfolio
61
PITNEY BOWES INC.
NOTES TO CONSOLIDATED FINANCIAL STATEMENTS
(Tabular amounts in thousands, except per share amounts)
management processes ensure that our global strategy is executed, collection resources are allocated appropriately and enhanced tools and processes are implemented as needed.
We use a third party to score the majority of the North America portfolio on a quarterly basis using a commercial credit score. We do not use a third party to score our International portfolio because the cost to do so is prohibitive, given that it is a localized process and there is no single credit score model that covers all countries.
The table below shows the North America portfolio at
December 31, 2018
and
2017
by relative risk class (low, medium, high) based on the relative scores of the accounts within each class. The relative scores are determined based on a number of factors, including the company type, ownership structure, payment history and financial information. Some accounts are not scored; however, absence of a score is not indicative of the credit quality of the account. The degree of risk, as defined by the third party, refers to the relative risk that an account may become delinquent in the next 12 month period.
|
•
|
Low risk accounts are companies with very good credit scores and are considered to approximate the top
30%
of all commercial borrowers.
|
|
•
|
Medium risk accounts are companies with average to good credit scores and are considered to approximate the middle
40%
of all commercial borrowers.
|
|
•
|
High risk accounts are companies with poor credit scores, are delinquent or are at risk of becoming delinquent and are considered to approximate the bottom
30%
of all commercial borrowers.
|
|
December 31,
|
|||||||
|
2018
|
2017
|
||||||
|
Sales-type lease receivables
|
|
|
|
|
|||
|
Low
|
$
|
834,230
|
|
$
|
819,776
|
|
|
|
Medium
|
118,945
|
|
148,000
|
|
|||
|
High
|
19,981
|
|
21,728
|
|
|||
|
Not Scored
|
31,335
|
|
34,045
|
|
|||
|
Total
|
$
|
1,004,491
|
|
$
|
1,023,549
|
|
|
|
Loan receivables
|
|
|
|
|
|||
|
Low
|
$
|
238,620
|
|
$
|
262,646
|
|
|
|
Medium
|
43,952
|
|
56,744
|
|
|||
|
High
|
5,947
|
|
6,791
|
|
|||
|
Not Scored
|
11,800
|
|
13,192
|
|
|||
|
Total
|
$
|
300,319
|
|
$
|
339,373
|
|
|
62
PITNEY BOWES INC.
NOTES TO CONSOLIDATED FINANCIAL STATEMENTS
(Tabular amounts in thousands, except per share amounts)
8. Fixed Assets
Fixed assets at
December 31, 2018
and
2017
consisted of the following:
|
December 31,
|
|||||||
|
2018
|
2017
|
||||||
|
Land
|
$
|
9,333
|
|
$
|
9,333
|
|
|
|
Buildings and improvements
|
198,025
|
|
206,752
|
|
|||
|
Capitalized software
|
283,446
|
|
224,754
|
|
|||
|
Machinery and equipment
|
718,557
|
|
688,725
|
|
|||
|
1,209,361
|
|
1,129,564
|
|
||||
|
Accumulated depreciation
|
(799,247
|
)
|
(756,061
|
)
|
|||
|
Property, plant and equipment, net
|
$
|
410,114
|
|
$
|
373,503
|
|
|
|
Rental property and equipment
|
$
|
371,908
|
|
$
|
386,039
|
|
|
|
Accumulated depreciation
|
(193,809
|
)
|
(202,083
|
)
|
|||
|
Rental property and equipment, net
|
$
|
178,099
|
|
$
|
183,956
|
|
|
Depreciation expense was
$159 million
,
$146 million
and
$134 million
for the years ended
December 31, 2018
,
2017
and
2016
, respectively.
9. Acquisitions, Intangible Assets and Goodwill
Acquisitions
In October 2017, we acquired Newgistics for
$471 million
, net of cash acquired. The results of Newgistics are included in our consolidated operating results from the date of acquisition. Our consolidated revenue for the year ended December 31, 2017 includes
$140 million
from Newgistics. On a pro forma basis, had we acquired Newgistics on January 1, 2016, revenue would have been
$341 million
and
$481 million
higher for the years ended December 31, 2017 and 2016, respectively. The impact on earnings would not have been material.
Intangible assets
Intangible assets at
December 31, 2018
and
2017
consisted of the following:
|
December 31, 2018
|
December 31, 2017
|
||||||||||||||||||||||
|
Gross
Carrying
Amount
|
Accumulated
Amortization
|
Net
Carrying
Amount
|
Gross
Carrying
Amount
|
Accumulated
Amortization
|
Net
Carrying
Amount
|
||||||||||||||||||
|
Customer relationships
|
$
|
480,837
|
|
$
|
(281,190
|
)
|
$
|
199,647
|
|
$
|
504,716
|
|
$
|
(271,066
|
)
|
$
|
233,650
|
|
|||||
|
Software & technology
|
165,088
|
|
(143,877
|
)
|
21,211
|
|
167,122
|
|
(138,724
|
)
|
28,398
|
|
|||||||||||
|
Trademarks & other
|
40,170
|
|
(33,891
|
)
|
6,279
|
|
40,649
|
|
(30,511
|
)
|
10,138
|
|
|||||||||||
|
Total intangible assets, net
|
$
|
686,095
|
|
$
|
(458,958
|
)
|
$
|
227,137
|
|
$
|
712,487
|
|
$
|
(440,301
|
)
|
$
|
272,186
|
|
|||||
Amortization expense was
$44 million
,
$34 million
and
$40 million
for the years ended
December 31, 2018
,
2017
and
2016
, respectively. The future amortization expense for intangible assets at
December 31, 2018
is as follows:
|
Year ended December 31,
|
|||
|
2019
|
$
|
40,059
|
|
|
2020
|
35,001
|
|
|
|
2021
|
30,479
|
|
|
|
2022
|
29,245
|
|
|
|
2023
|
26,100
|
|
|
|
Thereafter
|
66,253
|
|
|
|
Total
|
$
|
227,137
|
|
63
PITNEY BOWES INC.
NOTES TO CONSOLIDATED FINANCIAL STATEMENTS
(Tabular amounts in thousands, except per share amounts)
Actual amortization expense may differ from the amounts above due to, among other things, fluctuations in foreign currency exchange rates, acquisitions, divestitures and impairment charges.
Goodwill
Changes in the carrying amount of goodwill, by reporting segment, for the years ended
December 31, 2018
and
2017
are shown in the tables below.
|
Goodwill before accumulated impairment
|
Accumulated impairment
|
December 31, 2017
|
Acquisitions
|
Other
(1)
|
December 31, 2018
|
|||||||||||||||||||
|
Global Ecommerce
|
$
|
602,461
|
|
$
|
—
|
|
$
|
602,461
|
|
$
|
7,623
|
|
$
|
(653
|
)
|
$
|
609,431
|
|
||||||
|
Presort Services
|
204,781
|
|
—
|
|
204,781
|
|
2,684
|
|
—
|
|
207,465
|
|
||||||||||||
|
Commerce Services
|
807,242
|
|
—
|
|
807,242
|
|
10,307
|
|
(653
|
)
|
816,896
|
|
||||||||||||
|
North America Mailing
|
368,905
|
|
—
|
|
368,905
|
|
—
|
|
(657
|
)
|
368,248
|
|
||||||||||||
|
International Mailing
|
158,203
|
|
—
|
|
158,203
|
|
—
|
|
(10,996
|
)
|
147,207
|
|
||||||||||||
|
SMB Solutions
|
527,108
|
|
—
|
|
527,108
|
|
—
|
|
(11,653
|
)
|
515,455
|
|
||||||||||||
|
Software Solutions
|
588,476
|
|
(148,181
|
)
|
—
|
|
440,295
|
|
—
|
|
(6,135
|
)
|
434,160
|
|
||||||||||
|
Total goodwill
|
$
|
1,922,826
|
|
$
|
(148,181
|
)
|
$
|
1,774,645
|
|
$
|
10,307
|
|
$
|
(18,441
|
)
|
$
|
1,766,511
|
|
||||||
|
Goodwill before accumulated impairment
|
Accumulated impairment
|
December 31, 2016
|
Acquisitions
|
Other
(1)
|
December 31, 2017
|
||||||||||||||||||
|
Global Ecommerce
|
$
|
272,189
|
|
$
|
—
|
|
$
|
272,189
|
|
$
|
330,272
|
|
$
|
—
|
|
$
|
602,461
|
|
|||||
|
Presort Services
|
196,890
|
|
—
|
|
196,890
|
|
7,891
|
|
—
|
|
204,781
|
|
|||||||||||
|
Commerce Services
|
469,079
|
|
—
|
|
469,079
|
|
338,163
|
|
—
|
|
807,242
|
|
|||||||||||
|
North America Mailing
|
354,000
|
|
—
|
|
354,000
|
|
—
|
|
14,905
|
|
368,905
|
|
|||||||||||
|
International Mailing
|
145,566
|
|
—
|
|
145,566
|
|
—
|
|
12,637
|
|
158,203
|
|
|||||||||||
|
SMB Solutions
|
499,566
|
|
—
|
|
499,566
|
|
—
|
|
27,542
|
|
527,108
|
|
|||||||||||
|
Software Solutions
|
579,462
|
|
(148,181
|
)
|
431,281
|
|
—
|
|
9,014
|
|
440,295
|
|
|||||||||||
|
Total goodwill
|
$
|
1,548,107
|
|
$
|
(148,181
|
)
|
$
|
1,399,926
|
|
$
|
338,163
|
|
$
|
36,556
|
|
$
|
1,774,645
|
|
|||||
|
(1)
|
Primarily represents foreign currency translation adjustments.
|
10. Fair Value Measurements and Derivative Instruments
We measure certain financial assets and liabilities at fair value on a recurring basis. Fair value is a market-based measure considered from the perspective of a market participant rather than an entity-specific measure. An entity is required to classify certain assets and liabilities measured at fair value based on the following fair value hierarchy that prioritizes the inputs used to measure fair value:
|
Level 1
–
|
Unadjusted quoted prices in active markets for identical assets and liabilities.
|
|
Level 2
–
|
Quoted prices for identical assets and liabilities in markets that are not active, quoted prices for similar assets and liabilities in active markets or other inputs that are observable or can be corroborated by observable market data.
|
|
Level 3
–
|
Unobservable inputs that are supported by little or no market activity and may be derived from internally developed methodologies based on management's best estimates.
|
Financial assets and liabilities are classified in their entirety based on the lowest level of input that is significant to the fair value measurement. Our assessment of the significance of a particular input to the fair value measurement requires judgment and may affect its placement within the fair value hierarchy. The following tables show, by level within the fair value hierarchy, our financial assets and liabilities that are accounted for at fair value on a recurring basis at
December 31, 2018
and
2017
.
64
PITNEY BOWES INC.
NOTES TO CONSOLIDATED FINANCIAL STATEMENTS
(Tabular amounts in thousands, except per share amounts)
|
December 31, 2018
|
|||||||||||||||
|
Level 1
|
Level 2
|
Level 3
|
Total
|
||||||||||||
|
Assets:
|
|
|
|
|
|
|
|
|
|||||||
|
Investment securities
|
|
|
|
|
|
|
|
|
|||||||
|
Money market funds / commercial paper
|
$
|
220,756
|
|
$
|
391,891
|
|
$
|
—
|
|
$
|
612,647
|
|
|||
|
Equity securities
|
—
|
|
19,133
|
|
—
|
|
19,133
|
|
|||||||
|
Commingled fixed income securities
|
1,570
|
|
20,141
|
|
—
|
|
21,711
|
|
|||||||
|
Government and related securities
|
98,790
|
|
9,787
|
|
—
|
|
108,577
|
|
|||||||
|
Corporate debt securities
|
—
|
|
56,938
|
|
—
|
|
56,938
|
|
|||||||
|
Mortgage-backed / asset-backed securities
|
—
|
|
98,334
|
|
—
|
|
98,334
|
|
|||||||
|
Derivatives
|
|
|
|
|
|||||||||||
|
Foreign exchange contracts
|
—
|
|
2,031
|
|
—
|
|
2,031
|
|
|||||||
|
Total assets
|
$
|
321,116
|
|
$
|
598,255
|
|
$
|
—
|
|
$
|
919,371
|
|
|||
|
Liabilities:
|
|
|
|
|
|
|
|
|
|||||||
|
Derivatives
|
|
|
|
|
|
|
|
|
|||||||
|
Foreign exchange contracts
|
$
|
—
|
|
$
|
(735
|
)
|
$
|
—
|
|
$
|
(735
|
)
|
|||
|
Total liabilities
|
$
|
—
|
|
$
|
(735
|
)
|
$
|
—
|
|
$
|
(735
|
)
|
|||
|
December 31, 2017
|
|||||||||||||||
|
Level 1
|
Level 2
|
Level 3
|
Total
|
||||||||||||
|
Assets:
|
|
|
|
|
|
|
|
|
|||||||
|
Investment securities
|
|
|
|
|
|
|
|
|
|||||||
|
Money market funds / commercial paper
|
$
|
143,349
|
|
$
|
542,568
|
|
$
|
—
|
|
$
|
685,917
|
|
|||
|
Equity securities
|
—
|
|
40,717
|
|
—
|
|
40,717
|
|
|||||||
|
Commingled fixed income securities
|
1,569
|
|
4,516
|
|
—
|
|
6,085
|
|
|||||||
|
Government and related securities
|
116,041
|
|
18,587
|
|
—
|
|
134,628
|
|
|||||||
|
Corporate debt securities
|
—
|
|
75,109
|
|
—
|
|
75,109
|
|
|||||||
|
Mortgage-backed / asset-backed securities
|
—
|
|
158,202
|
|
—
|
|
158,202
|
|
|||||||
|
Derivatives
|
|
|
|
|
|
|
|
|
|||||||
|
Interest rate swap
|
—
|
|
1,776
|
|
—
|
|
1,776
|
|
|||||||
|
Foreign exchange contracts
|
—
|
|
122
|
|
—
|
|
122
|
|
|||||||
|
Total assets
|
$
|
260,959
|
|
$
|
841,597
|
|
$
|
—
|
|
$
|
1,102,556
|
|
|||
|
Liabilities:
|
|
|
|
|
|
|
|
|
|||||||
|
Derivatives
|
|
|
|
|
|
|
|
|
|||||||
|
Foreign exchange contracts
|
$
|
—
|
|
$
|
(335
|
)
|
$
|
—
|
|
$
|
(335
|
)
|
|||
|
Total liabilities
|
$
|
—
|
|
$
|
(335
|
)
|
$
|
—
|
|
$
|
(335
|
)
|
|||
65
PITNEY BOWES INC.
NOTES TO CONSOLIDATED FINANCIAL STATEMENTS
(Tabular amounts in thousands, except per share amounts)
Investment Securities
The valuation of investment securities is based on the market approach using inputs that are observable, or can be corroborated by observable data, in an active marketplace. The following information relates to our classification into the fair value hierarchy:
|
•
|
Money Market Funds / Commercial Paper:
Money market funds typically invest in government securities, certificates of deposit, commercial paper and other highly liquid, low risk securities. Money market funds are principally used for overnight deposits and are classified as Level 1 when unadjusted quoted prices in active markets are available and as Level 2 when they are not actively traded on an exchange. Direct investments in commercial paper are not listed on an exchange in an active market and are classified as Level 2.
|
|
•
|
Equity Securities:
Comprised of mutual funds investing in U.S. and foreign stocks. These mutual funds are classified as Level 2.
|
|
•
|
Commingled Fixed Income Securities:
Comprised of mutual funds that invest in a variety of fixed income securities including securities of the U.S. government and its agencies, corporate debt, mortgage-backed securities and asset-backed securities. Fair value is based on the value of the underlying investments owned by each fund, minus its liabilities, divided by the number of shares outstanding, as reported by the fund manager. These mutual funds are classified as Level 2.
|
|
•
|
Government and related securities:
Debt securities are classified as Level 1 where active, high volume trades for identical securities exist. Valuation adjustments are not applied to these securities. Debt securities valued using quoted market prices for similar securities or pricing models based on quoted market prices and trade data for comparable securities are classified as Level 2.
|
|
•
|
Corporate Debt Securities:
Corporate debt securities are valued using recently executed transactions, market price quotations where observable, or bond spreads and are classified as Level 2. The spread data used are for the same maturity as the security.
|
|
•
|
Mortgage-Backed Securities / Asset-Backed Securities:
These securities are valued based on external pricing indices or on external price/spread data when external index pricing is not observable. These securities are classified as Level 2.
|
Available-For-Sale Securities
Available-for-sale securities at
December 31, 2018
and
2017
, consisted of the following:
|
December 31, 2018
|
|||||||||||||||
|
Amortized cost
|
Gross unrealized gains
|
Gross unrealized losses
|
Estimated fair value
|
||||||||||||
|
Government and related securities
|
$
|
109,776
|
|
$
|
47
|
|
$
|
(1,336
|
)
|
$
|
108,487
|
|
|||
|
Corporate debt securities
|
58,714
|
|
4
|
|
(1,780
|
)
|
56,938
|
|
|||||||
|
Commingled fixed income securities
|
1,637
|
|
—
|
|
(67
|
)
|
1,570
|
|
|||||||
|
Mortgage-backed / asset-backed securities
|
100,186
|
|
167
|
|
(2,019
|
)
|
98,334
|
|
|||||||
|
Total
|
$
|
270,313
|
|
$
|
218
|
|
$
|
(5,202
|
)
|
$
|
265,329
|
|
|||
|
December 31, 2017
|
|||||||||||||||
|
Amortized cost
|
Gross unrealized gains
|
Gross unrealized losses
|
Estimated fair value
|
||||||||||||
|
Government and related securities
|
$
|
131,872
|
|
$
|
1,984
|
|
$
|
(1,090
|
)
|
$
|
132,766
|
|
|||
|
Corporate debt securities
|
73,612
|
|
1,724
|
|
(227
|
)
|
75,109
|
|
|||||||
|
Commingled fixed income securities
|
1,796
|
|
—
|
|
(40
|
)
|
1,756
|
|
|||||||
|
Mortgage-backed / asset-backed securities
|
158,496
|
|
1,348
|
|
(1,642
|
)
|
158,202
|
|
|||||||
|
Total
|
$
|
365,776
|
|
$
|
5,056
|
|
$
|
(2,999
|
)
|
$
|
367,833
|
|
|||
66
PITNEY BOWES INC.
NOTES TO CONSOLIDATED FINANCIAL STATEMENTS
(Tabular amounts in thousands, except per share amounts)
Investment securities in a loss position at
December 31, 2018
and
2017
were as follows:
|
December 31, 2018
|
December 31, 2017
|
||||||||||||||
|
Fair Value
|
Gross unrealized losses
|
Fair Value
|
Gross unrealized losses
|
||||||||||||
|
Greater than 12 continuous months
|
$
|
177,331
|
|
$
|
4,355
|
|
$
|
115,815
|
|
$
|
2,290
|
|
|||
|
Less than 12 continuous months
|
48,318
|
|
847
|
|
90,838
|
|
709
|
|
|||||||
|
Total
|
$
|
225,649
|
|
$
|
5,202
|
|
$
|
206,653
|
|
$
|
2,999
|
|
|||
We have not recognized an other-than-temporary impairment on any of the investment securities in an unrealized loss position because we have the ability and intent to hold these securities until recovery of the unrealized losses and expect to receive the stated principal and interest at maturity.
At
December 31, 2018
, scheduled maturities of available-for-sale securities were as follows:
|
Amortized cost
|
Estimated fair value
|
||||||
|
Within 1 year
|
$
|
49,531
|
|
$
|
49,286
|
|
|
|
After 1 year through 5 years
|
107,848
|
|
106,586
|
|
|||
|
After 5 years through 10 years
|
35,531
|
|
34,627
|
|
|||
|
After 10 years
|
77,403
|
|
74,830
|
|
|||
|
Total
|
$
|
270,313
|
|
$
|
265,329
|
|
|
The actual maturities may not coincide with scheduled maturities as certain securities contain early redemption features and/or allow for the prepayment of obligations with or without penalty.
Derivative Instruments
Foreign Exchange Contracts
We enter into foreign exchange contracts to mitigate the currency risk associated with anticipated inventory purchases between affiliates and from third parties. These contracts are designated as cash flow hedges. The effective portion of the gain or loss on cash flow hedges is included in AOCI in the period that the change in fair value occurs and is reclassified to earnings in the period that the hedged item is recorded in earnings. At
December 31, 2018
and
2017
, outstanding contracts associated with these anticipated transactions had a notional amount of
$8 million
and
$10 million
, respectively. The valuation of foreign exchange derivatives is based on a market approach using observable market inputs, such as foreign currency spot and forward rates and yield curves.
Interest Rate Swaps
We had an interest rate swap with a notional amount of
$300 million
to mitigate the interest rate risk associated with
$300 million
of variable-rate term loans. This swap matured in September 2018. While outstanding, the swap was designated as a cash flow hedge and the effective portion of the gain or loss on the cash flow hedge was included in AOCI in the period that the change in fair value occurred and reclassified to earnings in the period that the hedged item was recorded in earnings.
67
PITNEY BOWES INC.
NOTES TO CONSOLIDATED FINANCIAL STATEMENTS
(Tabular amounts in thousands, except per share amounts)
The fair value of our derivative instruments at
December 31, 2018
and
2017
was as follows:
|
December 31,
|
||||||||||
|
Designation of Derivatives
|
Balance Sheet Location
|
2018
|
2017
|
|||||||
|
Derivatives designated as hedging instruments
|
|
|
|
|
||||||
|
Foreign exchange contracts
|
Other current assets and prepayments
|
$
|
61
|
|
$
|
57
|
|
|||
|
Accounts payable and accrued liabilities
|
(104
|
)
|
(144
|
)
|
||||||
|
Interest rate swap
|
Other non-current assets
|
—
|
|
1,776
|
|
|||||
|
Derivatives not designated as hedging instruments
|
|
|
|
|
||||||
|
Foreign exchange contracts
|
Other current assets and prepayments
|
1,970
|
|
65
|
|
|||||
|
|
Accounts payable and accrued liabilities
|
(631
|
)
|
(191
|
)
|
|||||
|
|
Total derivative assets
|
2,031
|
|
1,898
|
|
|||||
|
|
Total derivative liabilities
|
(735
|
)
|
(335
|
)
|
|||||
|
|
Total net derivative asset
|
$
|
1,296
|
|
$
|
1,563
|
|
|||
The amounts included in AOCI at
December 31, 2018
will be recognized in earnings within the next 12 months. No amount of ineffectiveness was recorded in earnings for these designated cash flow hedges.
The following represents the results of cash flow hedging relationships for the years ended
December 31, 2018
and
2017
:
|
|
Years Ended December 31,
|
|||||||||||||||||
|
|
Derivative Gain (Loss)
Recognized in AOCI
(Effective Portion)
|
Location of Gain (Loss)
(Effective Portion)
|
Gain (Loss) Reclassified
from AOCI to Earnings
(Effective Portion)
|
|||||||||||||||
|
Derivative Instrument
|
2018
|
2017
|
2018
|
2017
|
||||||||||||||
|
Foreign exchange contracts
|
$
|
106
|
|
$
|
(650
|
)
|
Revenue
|
$
|
11
|
|
$
|
(179
|
)
|
|||||
|
|
|
|
|
|
Cost of sales
|
51
|
|
(32
|
)
|
|||||||||
|
Interest rate swap
|
$
|
(1,776
|
)
|
$
|
1,776
|
|
Interest Expense
|
—
|
|
—
|
|
|||||||
|
|
|
|
|
|
|
$
|
62
|
|
$
|
(211
|
)
|
|||||||
We also enter into foreign exchange contracts to minimize the impact of exchange rate fluctuations on short-term intercompany loans and related interest that are denominated in a foreign currency. The revaluation of the intercompany loans and interest and the mark-to-market adjustment on the derivatives are both recorded in earnings. All outstanding contracts at
December 31, 2018
mature over the next three months.
The following represents the results of our non-designated derivative instruments for the years ended
December 31, 2018
and
2017
:
|
|
|
Years Ended December 31,
|
||||||||
|
|
|
Derivative Gain (Loss)
Recognized in Earnings
|
||||||||
|
Derivatives Instrument
|
Location of Derivative Gain (Loss)
|
2018
|
2017
|
|||||||
|
Foreign exchange contracts
|
Selling, general and administrative expense
|
$
|
(33,453
|
)
|
$
|
(2,203
|
)
|
|||
Credit-Risk-Related Contingent Features
Certain derivative instruments contain credit-risk-related contingent features that would require us to post collateral based on a combination of our long-term senior unsecured debt ratings and the net fair value of our derivatives. At
December 31, 2018
, we were not required to post any collateral.
68
PITNEY BOWES INC.
NOTES TO CONSOLIDATED FINANCIAL STATEMENTS
(Tabular amounts in thousands, except per share amounts)
Fair Value of Financial Instruments
Our financial instruments include cash and cash equivalents, investment securities, accounts receivable, loan receivables, derivative instruments, accounts payable and debt. The carrying value for cash and cash equivalents, accounts receivable, loans receivable, and accounts payable approximate fair value. The fair value of our debt is estimated based on recently executed transactions and market price quotations. The inputs used to determine the fair value of our debt were classified as Level 2 in the fair value hierarchy. The carrying value and estimated fair value of our debt at
December 31, 2018
and
2017
was as follows:
|
December 31,
|
|||||||
|
2018
|
2017
|
||||||
|
Carrying value
|
$
|
3,265,608
|
|
$
|
3,830,335
|
|
|
|
Fair value
|
$
|
3,003,678
|
|
$
|
3,718,986
|
|
|
11. Supplemental Balance Sheet Information
The following table shows selected balance sheet information at
December 31, 2018
and
2017
:
|
December 31,
|
|||||||
|
2018
|
2017
|
||||||
|
Other assets:
|
|||||||
|
Long-term investments
|
$
|
311,417
|
|
$
|
435,612
|
|
|
|
Deferred marketing costs
|
—
|
|
35,668
|
|
|||
|
Contract assets and cost to obtain a contract
|
42,287
|
|
—
|
|
|||
|
Other
|
59,535
|
|
69,471
|
|
|||
|
Total
|
$
|
413,239
|
|
$
|
540,751
|
|
|
|
Accounts payable and accrued liabilities:
|
|||||||
|
Accounts payable
|
$
|
285,592
|
|
$
|
284,857
|
|
|
|
Customer deposits
|
700,397
|
|
693,005
|
|
|||
|
Employee related liabilities
|
230,044
|
|
251,545
|
|
|||
|
Other
|
185,602
|
|
229,447
|
|
|||
|
Total
|
$
|
1,401,635
|
|
$
|
1,458,854
|
|
|
12. Restructuring Charges and Asset Impairments
The table below shows the activity in our restructuring reserves for the years ended
December 31, 2018
and
2017
:
|
Severance and benefits costs
|
Other exit
costs
|
Total
|
|||||||||
|
Balance at December 31, 2016
|
$
|
28,234
|
|
$
|
281
|
|
$
|
28,515
|
|
||
|
Expenses, net
|
50,114
|
|
2,545
|
|
52,659
|
|
|||||
|
Cash payments
|
(36,197
|
)
|
(1,257
|
)
|
(37,454
|
)
|
|||||
|
Balance at December 31, 2017
|
42,151
|
|
1,569
|
|
43,720
|
|
|||||
|
Expenses, net
|
19,130
|
|
6,507
|
|
25,637
|
|
|||||
|
Cash payments
|
(47,640
|
)
|
(5,334
|
)
|
(52,974
|
)
|
|||||
|
Balance at December 31, 2018
|
$
|
13,641
|
|
$
|
2,742
|
|
$
|
16,383
|
|
||
The majority of the remaining restructuring reserves are expected to be paid over the next
12
-
24 months
. Due to certain international labor laws and long-term lease agreements, some payments will extend beyond
24 months
. We expect to fund these payments from cash flows from operations.
69
PITNEY BOWES INC.
NOTES TO CONSOLIDATED FINANCIAL STATEMENTS
(Tabular amounts in thousands, except per share amounts)
Asset impairment
Asset impairment charges were
$2 million
,
$4 million
, and
$15 million
in 2018, 2017, and 2016, respectively.
13. Debt
|
December 31,
|
|||||||||
|
Interest rate
|
2018
|
2017
|
|||||||
|
Notes due March 2018
|
5.60%
|
$
|
—
|
|
$
|
250,000
|
|
||
|
Notes due March 2019
|
6.25%
|
—
|
|
300,000
|
|
||||
|
Notes due September 2020
|
3.875%
|
300,000
|
|
300,000
|
|
||||
|
Notes due October 2021
|
3.875%
|
600,000
|
|
600,000
|
|
||||
|
Notes due May 2022
|
4.375%
|
400,000
|
|
400,000
|
|
||||
|
Notes due April 2023
|
4.95%
|
400,000
|
|
400,000
|
|
||||
|
Notes due March 2024
|
4.625%
|
500,000
|
|
500,000
|
|
||||
|
Notes due January 2037
|
5.25%
|
35,841
|
|
35,841
|
|
||||
|
Notes due March 2043
|
6.70%
|
425,000
|
|
425,000
|
|
||||
|
Term loans
|
Variable
|
630,000
|
|
650,000
|
|
||||
|
Other debt
|
5,297
|
|
5,476
|
|
|||||
|
Principal amount
|
3,296,138
|
|
3,866,317
|
|
|||||
|
Less: unamortized costs, net
|
30,530
|
|
35,982
|
|
|||||
|
Total debt
|
3,265,608
|
|
3,830,335
|
|
|||||
|
Less: current portion long-term debt
|
199,535
|
|
271,057
|
|
|||||
|
Long-term debt
|
$
|
3,066,073
|
|
$
|
3,559,278
|
|
|||
In 2018, Standard & Poor's lowered our corporate credit rating from BBB- to BB+ and as a result, the interest rate on certain notes and term loans increased
0.25%
.
During 2018, we repaid the
$250 million
,
5.6%
notes that matured in March 2018 and
$20 million
of principal on our term loans. We also redeemed the
$300 million
,
6.25%
notes due March 2019 and recorded an
$8 million
loss on the early redemption. In 2017, we recorded a loss of
$4 million
on the early redemption of debt. Pursuant to an extension option, we extended the maturity of a
$150 million
term loan to August 2019.
Annual maturities of outstanding debt at
December 31, 2018
are as follows:
|
2019
|
$
|
200,194
|
|
|
2020
|
730,103
|
|
|
|
2021
|
600,000
|
|
|
|
2022
|
400,000
|
|
|
|
2023
|
400,000
|
|
|
|
Thereafter
|
965,841
|
|
|
|
Total
|
$
|
3,296,138
|
|
70
PITNEY BOWES INC.
NOTES TO CONSOLIDATED FINANCIAL STATEMENTS
(Tabular amounts in thousands, except per share amounts)
14. Retirement Plans and Postretirement Medical Benefits
We provide certain retirement benefits to our U.S. employees hired prior to January 1, 2005 and to eligible employees outside the U.S. under various defined benefit retirement plans. Benefit accruals under most of our significant defined benefit plans have been frozen.
We also provide certain employer subsidized health care and employer provided life insurance benefits in the U.S. and Canada to eligible retirees and their dependents. Employees hired before January 1, 2005 in the U.S. and April 1, 2005 in Canada become eligible for retiree medical benefits after reaching age
55
and with the completion of the required service period. The cost of these benefits is recognized over the period the employee provides credited service to the company.
Retirement Plans
The benefit obligations and funded status of defined benefit pension plans are as follows:
|
United States
|
Foreign
|
||||||||||||||
|
2018
|
2017
|
2018
|
2017
|
||||||||||||
|
Accumulated benefit obligation
|
$
|
1,500,691
|
|
$
|
1,726,824
|
|
$
|
659,628
|
|
$
|
737,580
|
|
|||
|
Projected benefit obligation
|
|||||||||||||||
|
Benefit obligation - beginning of year
|
$
|
1,727,737
|
|
$
|
1,678,097
|
|
$
|
751,373
|
|
$
|
688,172
|
|
|||
|
Service cost
|
92
|
|
132
|
|
2,159
|
|
2,274
|
|
|||||||
|
Interest cost
|
61,490
|
|
68,611
|
|
18,089
|
|
18,836
|
|
|||||||
|
Plan participants' contributions
|
—
|
|
—
|
|
7
|
|
6
|
|
|||||||
|
Actuarial (gain) loss
|
(124,298
|
)
|
92,789
|
|
(41,995
|
)
|
2,098
|
|
|||||||
|
Foreign currency changes
|
—
|
|
—
|
|
(40,559
|
)
|
64,236
|
|
|||||||
|
Plan amendments
|
—
|
|
—
|
|
9,009
|
|
—
|
|
|||||||
|
Settlement / curtailment
|
(82,273
|
)
|
—
|
|
(6,703
|
)
|
—
|
|
|||||||
|
Benefits paid
|
(81,608
|
)
|
(111,892
|
)
|
(28,736
|
)
|
(24,249
|
)
|
|||||||
|
Benefit obligation - end of year
|
$
|
1,501,140
|
|
$
|
1,727,737
|
|
$
|
662,644
|
|
$
|
751,373
|
|
|||
|
Fair value of plan assets
|
|||||||||||||||
|
Fair value of plan assets - beginning of year
|
$
|
1,557,907
|
|
$
|
1,464,082
|
|
$
|
632,710
|
|
$
|
547,290
|
|
|||
|
Actual return on plan assets
|
(73,745
|
)
|
199,749
|
|
(17,043
|
)
|
46,542
|
|
|||||||
|
Company contributions
|
6,753
|
|
5,968
|
|
10,939
|
|
13,081
|
|
|||||||
|
Plan participants' contributions
|
—
|
|
—
|
|
7
|
|
6
|
|
|||||||
|
Settlement
|
(82,273
|
)
|
—
|
|
—
|
|
—
|
|
|||||||
|
Foreign currency changes
|
—
|
|
—
|
|
(35,360
|
)
|
50,040
|
|
|||||||
|
Benefits paid
|
(81,608
|
)
|
(111,892
|
)
|
(28,736
|
)
|
(24,249
|
)
|
|||||||
|
Fair value of plan assets - end of year
|
$
|
1,327,034
|
|
$
|
1,557,907
|
|
$
|
562,517
|
|
$
|
632,710
|
|
|||
|
Amounts recognized in the Consolidated Balance Sheets
|
|||||||||||||||
|
Noncurrent asset
|
$
|
277
|
|
$
|
392
|
|
$
|
14,225
|
|
$
|
19,139
|
|
|||
|
Current liability
|
(10,975
|
)
|
(8,362
|
)
|
(1,197
|
)
|
(1,188
|
)
|
|||||||
|
Noncurrent liability
|
(163,408
|
)
|
(161,860
|
)
|
(113,155
|
)
|
(136,614
|
)
|
|||||||
|
Funded status
|
$
|
(174,106
|
)
|
$
|
(169,830
|
)
|
$
|
(100,127
|
)
|
$
|
(118,663
|
)
|
|||
71
PITNEY BOWES INC.
NOTES TO CONSOLIDATED FINANCIAL STATEMENTS
(Tabular amounts in thousands, except per share amounts)
Information provided in the table below is only for pension plans with an accumulated benefit obligation in excess of plan assets at
December 31, 2018
and
2017
:
|
United States
|
Foreign
|
||||||||||||||
|
2018
|
2017
|
2018
|
2017
|
||||||||||||
|
Projected benefit obligation
|
$
|
1,500,680
|
|
$
|
1,727,292
|
|
$
|
540,798
|
|
$
|
614,371
|
|
|||
|
Accumulated benefit obligation
|
$
|
1,500,231
|
|
$
|
1,726,378
|
|
$
|
538,666
|
|
$
|
601,412
|
|
|||
|
Fair value of plan assets
|
$
|
1,326,296
|
|
$
|
1,557,069
|
|
$
|
426,446
|
|
$
|
476,825
|
|
|||
|
Pretax amounts recognized in AOCI consist of:
|
|||||||||||||||
|
United States
|
Foreign
|
||||||||||||||
|
2018
|
2017
|
2018
|
2017
|
||||||||||||
|
Net actuarial loss
|
$
|
809,836
|
|
$
|
835,265
|
|
$
|
318,474
|
|
$
|
321,914
|
|
|||
|
Prior service credit
|
(330
|
)
|
(391
|
)
|
8,496
|
|
(597
|
)
|
|||||||
|
Transition asset
|
—
|
|
—
|
|
(17
|
)
|
(24
|
)
|
|||||||
|
Total
|
$
|
809,506
|
|
$
|
834,874
|
|
$
|
326,953
|
|
$
|
321,293
|
|
|||
The components of net periodic benefit cost (income) for defined benefit pension plans were as follows:
|
United States
|
Foreign
|
||||||||||||||||||||||
|
2018
|
2017
|
2016
|
2018
|
2017
|
2016
|
||||||||||||||||||
|
Service cost
|
$
|
92
|
|
$
|
132
|
|
$
|
105
|
|
$
|
2,159
|
|
$
|
2,274
|
|
$
|
2,148
|
|
|||||
|
Interest cost
|
61,490
|
|
68,611
|
|
73,699
|
|
18,089
|
|
18,836
|
|
21,886
|
|
|||||||||||
|
Expected return on plan assets
|
(101,087
|
)
|
(97,656
|
)
|
(101,918
|
)
|
(35,687
|
)
|
(32,242
|
)
|
(32,615
|
)
|
|||||||||||
|
Amortization of net transition asset
|
—
|
|
—
|
|
—
|
|
(7
|
)
|
(8
|
)
|
(8
|
)
|
|||||||||||
|
Amortization of prior service credit
|
(60
|
)
|
(60
|
)
|
(60
|
)
|
(71
|
)
|
(71
|
)
|
(73
|
)
|
|||||||||||
|
Amortization of net actuarial loss
|
31,298
|
|
28,954
|
|
27,220
|
|
7,264
|
|
8,052
|
|
5,264
|
|
|||||||||||
|
Special termination benefits
|
—
|
|
—
|
|
—
|
|
208
|
|
—
|
|
52
|
|
|||||||||||
|
Settlement/Curtailment
|
44,665
|
|
—
|
|
2,109
|
|
(13
|
)
|
—
|
|
110
|
|
|||||||||||
|
Net periodic benefit cost (income)
|
$
|
36,398
|
|
$
|
(19
|
)
|
$
|
1,155
|
|
$
|
(8,058
|
)
|
$
|
(3,159
|
)
|
$
|
(3,236
|
)
|
|||||
In connection with the disposition of the Production Mail Business and certain other actions, a pre-tax, non-cash pension settlement charge of
$45 million
for the U.S. pension plans was incurred in 2018. We recognized
$32 million
of this charge in other components of net pension and postretirement cost and the remaining
$13 million
in income from discontinued operations, net of tax.
Other changes in plan assets and benefit obligations for defined benefit pension plans recognized in other comprehensive income were as follows:
|
United States
|
Foreign
|
||||||||||||||
|
2018
|
2017
|
2018
|
2017
|
||||||||||||
|
Net actuarial loss (gain)
|
$
|
50,534
|
|
$
|
(9,304
|
)
|
$
|
3,824
|
|
$
|
(12,202
|
)
|
|||
|
Plan amendment
|
—
|
|
—
|
|
9,009
|
|
—
|
|
|||||||
|
Amortization of net actuarial loss
|
(31,298
|
)
|
(28,954
|
)
|
(7,264
|
)
|
(8,052
|
)
|
|||||||
|
Amortization of prior service credit
|
60
|
|
60
|
|
71
|
|
71
|
|
|||||||
|
Net transition asset
|
—
|
|
—
|
|
7
|
|
8
|
|
|||||||
|
Settlement/Curtailment
|
(44,665
|
)
|
—
|
|
13
|
|
—
|
|
|||||||
|
Total recognized in other comprehensive income
|
$
|
(25,369
|
)
|
$
|
(38,198
|
)
|
$
|
5,660
|
|
$
|
(20,175
|
)
|
|||
72
PITNEY BOWES INC.
NOTES TO CONSOLIDATED FINANCIAL STATEMENTS
(Tabular amounts in thousands, except per share amounts)
Weighted-average actuarial assumptions used to determine end of year benefit obligations and net periodic benefit cost for defined benefit pension plans include:
|
2018
|
2017
|
2016
|
||||||||||||
|
United States
|
||||||||||||||
|
Used to determine benefit obligations
|
||||||||||||||
|
Discount rate
|
4.34%
|
3.69%
|
4.20%
|
|||||||||||
|
Rate of compensation increase
|
N/A
|
N/A
|
N/A
|
|||||||||||
|
Used to determine net periodic benefit cost
|
||||||||||||||
|
Discount rate
|
3.69%
|
4.20%
|
4.55%
|
|||||||||||
|
Expected return on plan assets
|
7.00%
|
6.75%
|
7.00%
|
|||||||||||
|
Rate of compensation increase
|
N/A
|
N/A
|
N/A
|
|||||||||||
|
Foreign
|
||||||||||||||
|
Used to determine benefit obligations
|
||||||||||||||
|
Discount rate
|
0.75
|
%
|
-
|
3.55%
|
0.65
|
%
|
-
|
3.35%
|
0.70
|
%
|
-
|
3.65%
|
||
|
Rate of compensation increase
|
1.50
|
%
|
-
|
2.50%
|
1.50
|
%
|
-
|
2.50%
|
1.50
|
%
|
-
|
2.50%
|
||
|
Used to determine net periodic benefit cost
|
||||||||||||||
|
Discount rate
|
0.65
|
%
|
-
|
3.35%
|
0.70
|
%
|
-
|
3.65%
|
1.15
|
%
|
-
|
3.95%
|
||
|
Expected return on plan assets
|
3.75
|
%
|
-
|
6.25%
|
3.75
|
%
|
-
|
6.25%
|
3.75
|
%
|
-
|
6.51%
|
||
|
Rate of compensation increase
|
1.50
|
%
|
-
|
3.25%
|
1.50
|
%
|
-
|
3.30%
|
1.50
|
%
|
-
|
3.50%
|
||
A discount rate is used to determine the present value of our future benefit obligations. The discount rate for our U.S. pension and postretirement medical benefit plans is determined by matching the expected cash flows associated with our benefit obligations to a pool of corporate long-term, high-quality fixed income debt instruments available as of the measurement date. The discount rate for our largest foreign plan, the U.K. Qualified Pension Plan (the U.K. Plan), is determined by using a model that discounts each year's estimated benefit payments by an applicable spot rate derived from a yield curve created from a large number of high quality corporate bonds. For our other smaller foreign pension plans, the discount rate is selected based on high-quality fixed income indices available in the country in which the plan is domiciled.
The expected return on plan assets is based on historical and expected rates of return for current and planned asset classes in the plans' investment portfolio after analyzing historical experience and future expectations of the returns and volatility of the various asset classes. The overall expected rate of return for the portfolio is based on the target asset allocation of our global pension plans, adjusted for historical and expected experience of active portfolio management results, when compared to the benchmark returns.
During
2019
, we estimate making contributions of
$11 million
to our U.S. pension plans and
$11 million
to our foreign pension plans.
Investment Strategy and Asset Allocation - U.S. Pension Plans
The investment strategy of our U.S. pension plans is to maximize returns within reasonable and prudent levels of risk, to achieve and maintain full funding of the accumulated benefit obligation and the actuarial liabilities and to earn a nominal rate of return of at least
6.75%
. The fund has established a strategic asset allocation policy to achieve these objectives. Investments are diversified across asset classes and within each class to reduce the risk of large losses and are periodically rebalanced. Derivatives, such as swaps, options, forwards and futures contracts may be used for market exposure, to alter risk/return characteristics and to manage foreign currency exposure. We do not have any significant concentrations of credit risk within the plan assets. Investment objectives and investment managers are reviewed periodically.
73
PITNEY BOWES INC.
NOTES TO CONSOLIDATED FINANCIAL STATEMENTS
(Tabular amounts in thousands, except per share amounts)
Target and actual allocations for
2019
, 2018 and
2017
for the U.S. pension plans were as follows:
|
Target allocation
|
Percent of Plan Assets at December 31,
|
|||||||
|
2019
|
2018
|
2017
|
||||||
|
Asset category
|
||||||||
|
U.S. equities
|
14
|
%
|
13
|
%
|
15
|
%
|
||
|
Non-U.S. equities
|
13
|
%
|
13
|
%
|
15
|
%
|
||
|
Fixed income
|
63
|
%
|
64
|
%
|
62
|
%
|
||
|
Real estate
|
5
|
%
|
7
|
%
|
6
|
%
|
||
|
Private equity
|
5
|
%
|
3
|
%
|
2
|
%
|
||
|
Total
|
100
|
%
|
100
|
%
|
100
|
%
|
||
Investment Strategy and Asset Allocation - Foreign Pension Plans
Our foreign pension plan assets are managed by outside investment managers and monitored regularly by local trustees and our corporate personnel. Investment strategies vary by country and plan, with each strategy tailored to achieve the expected rate of return within an acceptable or appropriate level of risk, depending upon the liability profile of plan participants, local funding requirements, investment markets and restrictions. The U.K. Plan represents
76%
of the total foreign pension assets. The U.K. pension plan's investment strategy is to maximize returns within reasonable and prudent levels of risk, to achieve and maintain full funding of the accumulated benefit obligation and the actuarial liabilities and to earn a nominal rate of return of at least
6.25%
. The fund has established a strategic asset allocation policy to achieve these objectives. Investments are diversified across asset classes and within each class to minimize the risk of large losses and are periodically rebalanced. Derivatives, such as swaps, options, forwards and futures contracts may be used for market exposure, to alter risk/return characteristics and to manage currency exposure. We do not have any significant concentrations of credit risk within the plan assets. Investment objectives and investment managers are reviewed periodically.
Target and actual asset allocations for the U.K. Plan for
2019
, 2018 and
2017
were as follows:
|
Target Allocation
|
Percent of Plan Assets at December 31,
|
|||||||
|
2019
|
2018
|
2017
|
||||||
|
Asset category
|
||||||||
|
U.K. equities
|
10
|
%
|
9
|
%
|
10
|
%
|
||
|
Non-U.K. equities
|
30
|
%
|
29
|
%
|
29
|
%
|
||
|
Fixed income
|
40
|
%
|
41
|
%
|
41
|
%
|
||
|
Real estate
|
10
|
%
|
10
|
%
|
9
|
%
|
||
|
Diversified growth
|
10
|
%
|
10
|
%
|
9
|
%
|
||
|
Cash
|
—
|
%
|
1
|
%
|
2
|
%
|
||
|
Total
|
100
|
%
|
100
|
%
|
100
|
%
|
||
The target asset allocation used to manage the investment portfolios is based on the broad asset categories shown above. The plan asset categories presented in the fair value hierarchy are subsets of the broad asset categories.
The fair value of the U.K. plan assets was
$426 million
and
$477 million
at
December 31, 2018
and
2017
, respectively, and the expected long-term weighted average rate of return on these plan assets was
6.25%
in both
2018
and
2017
.
74
PITNEY BOWES INC.
NOTES TO CONSOLIDATED FINANCIAL STATEMENTS
(Tabular amounts in thousands, except per share amounts)
Fair Value Measurements of Plan Assets
The following tables show the U.S. and foreign pension plans' assets at
December 31, 2018
and
2017
:
United States Pension Plans
|
December 31, 2018
|
|||||||||||||||
|
Level 1
|
Level 2
|
Level 3
|
Total
|
||||||||||||
|
Money market funds
|
$
|
3,498
|
|
$
|
5,759
|
|
$
|
—
|
|
$
|
9,257
|
|
|||
|
Equity securities
|
110,840
|
|
109,864
|
|
—
|
|
220,704
|
|
|||||||
|
Commingled fixed income securities
|
—
|
|
281,258
|
|
—
|
|
281,258
|
|
|||||||
|
Government and related securities
|
258,535
|
|
16,144
|
|
—
|
|
274,679
|
|
|||||||
|
Corporate debt securities
|
—
|
|
435,285
|
|
—
|
|
435,285
|
|
|||||||
|
Mortgage-backed securities /asset-backed securities
|
—
|
|
23,474
|
|
—
|
|
23,474
|
|
|||||||
|
Private equity
|
—
|
|
—
|
|
32,750
|
|
32,750
|
|
|||||||
|
Real estate
|
—
|
|
—
|
|
96,877
|
|
96,877
|
|
|||||||
|
Securities lending collateral
|
—
|
|
117,603
|
|
—
|
|
117,603
|
|
|||||||
|
Total plan assets at fair value
|
$
|
372,873
|
|
$
|
989,387
|
|
$
|
129,627
|
|
$
|
1,491,887
|
|
|||
|
Securities lending payable
|
(117,603
|
)
|
|||||||||||||
|
Cash
|
11,341
|
|
|||||||||||||
|
Other
|
(58,591
|
)
|
|||||||||||||
|
Fair value of plan assets
|
|
|
|
|
|
$
|
1,327,034
|
|
|||||||
|
December 31, 2017
|
|||||||||||||||
|
Level 1
|
Level 2
|
Level 3
|
Total
|
||||||||||||
|
Money market funds
|
$
|
8,810
|
|
$
|
9,350
|
|
$
|
—
|
|
$
|
18,160
|
|
|||
|
Equity securities
|
152,815
|
|
150,043
|
|
—
|
|
302,858
|
|
|||||||
|
Commingled fixed income securities
|
—
|
|
377,078
|
|
—
|
|
377,078
|
|
|||||||
|
Government and related securities
|
295,404
|
|
20,473
|
|
—
|
|
315,877
|
|
|||||||
|
Corporate debt securities
|
—
|
|
418,908
|
|
—
|
|
418,908
|
|
|||||||
|
Mortgage-backed securities /asset-backed securities
|
—
|
|
19,223
|
|
—
|
|
19,223
|
|
|||||||
|
Private equity
|
—
|
|
—
|
|
38,362
|
|
38,362
|
|
|||||||
|
Real estate
|
—
|
|
—
|
|
91,352
|
|
91,352
|
|
|||||||
|
Securities lending collateral
|
—
|
|
152,179
|
|
—
|
|
152,179
|
|
|||||||
|
Total plan assets at fair value
|
$
|
457,029
|
|
$
|
1,147,254
|
|
$
|
129,714
|
|
$
|
1,733,997
|
|
|||
|
Securities lending payable
|
(152,179
|
)
|
|||||||||||||
|
Cash
|
5,186
|
|
|||||||||||||
|
Other
|
(29,097
|
)
|
|||||||||||||
|
Fair value of plan assets
|
|
|
|
|
|
$
|
1,557,907
|
|
|||||||
75
PITNEY BOWES INC.
NOTES TO CONSOLIDATED FINANCIAL STATEMENTS
(Tabular amounts in thousands, except per share amounts)
Foreign Plans
|
December 31, 2018
|
|||||||||||||||
|
Level 1
|
Level 2
|
Level 3
|
Total
|
||||||||||||
|
Money market funds
|
$
|
—
|
|
$
|
11,172
|
|
$
|
—
|
|
$
|
11,172
|
|
|||
|
Equity securities
|
—
|
|
194,914
|
|
—
|
|
194,914
|
|
|||||||
|
Commingled fixed income securities
|
—
|
|
198,902
|
|
—
|
|
198,902
|
|
|||||||
|
Government and related securities
|
—
|
|
40,055
|
|
—
|
|
40,055
|
|
|||||||
|
Corporate debt securities
|
—
|
|
29,996
|
|
—
|
|
29,996
|
|
|||||||
|
Real estate
|
—
|
|
—
|
|
42,143
|
|
42,143
|
|
|||||||
|
Diversified growth funds
|
—
|
|
—
|
|
40,766
|
|
40,766
|
|
|||||||
|
Total plan assets at fair value
|
$
|
—
|
|
$
|
475,039
|
|
$
|
82,909
|
|
$
|
557,948
|
|
|||
|
Cash
|
3,903
|
|
|||||||||||||
|
Other
|
666
|
|
|||||||||||||
|
Fair value of plan assets
|
|
|
|
|
|
$
|
562,517
|
|
|||||||
|
December 31, 2017
|
|||||||||||||||
|
Level 1
|
Level 2
|
Level 3
|
Total
|
||||||||||||
|
Money market funds
|
$
|
—
|
|
$
|
13,375
|
|
$
|
—
|
|
$
|
13,375
|
|
|||
|
Equity securities
|
—
|
|
226,032
|
|
—
|
|
226,032
|
|
|||||||
|
Commingled fixed income securities
|
—
|
|
213,844
|
|
—
|
|
213,844
|
|
|||||||
|
Government and related securities
|
—
|
|
66,115
|
|
—
|
|
66,115
|
|
|||||||
|
Corporate debt securities
|
—
|
|
24,889
|
|
—
|
|
24,889
|
|
|||||||
|
Real estate
|
—
|
|
—
|
|
41,601
|
|
41,601
|
|
|||||||
|
Diversified growth funds
|
—
|
|
—
|
|
44,024
|
|
44,024
|
|
|||||||
|
Total plan assets at fair value
|
$
|
—
|
|
$
|
544,255
|
|
$
|
85,625
|
|
$
|
629,880
|
|
|||
|
Cash
|
2,203
|
|
|||||||||||||
|
Other
|
627
|
|
|||||||||||||
|
Fair value of plan assets
|
|
|
|
|
|
$
|
632,710
|
|
|||||||
The following information relates to our classification of investments into the fair value hierarchy:
|
•
|
Money Market Funds:
Money market funds typically invest in government securities, certificates of deposit, commercial paper of companies and other highly liquid, low risk securities. Money market funds are principally used for overnight deposits.
|
|
•
|
Equity Securities:
Equity securities include U.S. and foreign stocks, American Depository Receipts, preferred stock and commingled funds. There are no shares of our common stock included in the plan assets of our pension plans.
|
|
•
|
Commingled Fixed Income Securities:
Mutual funds that invest in fixed income securities of the U.S. government and its agencies, corporate debt, mortgage-backed securities and asset-backed securities. Fair value is based on the market value of the underlying investments owned by each fund, minus its liabilities, divided by the number of shares outstanding as reported by the fund manager.
|
|
•
|
Government and Related Securities:
Government and related securities include treasury notes and bonds, foreign government issues, U.S. government sponsored agency debt and commingled funds. Municipal debt securities include general obligation securities and revenue-backed securities. Fair value is based on benchmarking model derived prices to quotes market prices and trade data for identical comparable securities.
|
|
•
|
Corporate Debt Securities
: Investments are comprised of both investment grade debt and high-yield debt. The fair value of corporate debt securities is determined using recently executed transactions, market price quotations where observable, or bond spreads.
|
|
•
|
Mortgage-Backed Securities / Asset-Backed Securities
: Mortgage-backed securities (MBS) are comprised of agency-backed MBS, non-agency MBS, collateralized mortgage obligations, commercial MBS and commingled funds. These securities are valued based
|
76
PITNEY BOWES INC.
NOTES TO CONSOLIDATED FINANCIAL STATEMENTS
(Tabular amounts in thousands, except per share amounts)
on external pricing indices- external price/spread data or broker quotes. Asset-backed securities (ABS) are primarily comprised of credit card receivables, auto loan receivables, student loan receivables and Small Business Administration loans.
|
•
|
Private Equity
: Investments are comprised of units in fund-of-funds investment vehicles. Fund-of-funds consist of various private equity investments and are used in an effort to gain greater diversification. The investments are valued in accordance with the most appropriate valuation techniques.
|
|
•
|
Real Estate:
Investments include units in open-ended commingled real estate funds. Properties that comprise these funds are valued in accordance with the most appropriate valuation techniques.
|
|
•
|
Diversified Growth Funds:
Investments are comprised of units in commingled diversified growth funds. These investments are valued based on the net asset value (NAV) per unit as reported by the fund manager.
|
|
•
|
Securities Lending Fund:
Investment represents a commingled fund through our custodian's securities lending program. The U.S. pension plan lends securities that are held within the plan to other banks and/or brokers, and receives collateral, typically cash. This collateral is invested in a short-term fixed income securities commingled fund. This amount invested in the fund is offset by a corresponding liability reflected in the U.S. pension plan's net assets available for benefits.
|
Level 3 Gains and Losses
The following table summarizes the changes in the fair value of Level 3 assets for the years ended
December 31, 2018
and
2017
:
United States Pension Plans
|
MBS & ABS
|
Private equity
|
Real estate
|
Total
|
||||||||||||
|
Balance at December 31, 2016
|
$
|
1,236
|
|
$
|
49,637
|
|
$
|
87,852
|
|
$
|
138,725
|
|
|||
|
Realized gains
|
25
|
|
9,226
|
|
980
|
|
10,231
|
|
|||||||
|
Unrealized gains (losses)
|
49
|
|
(2,334
|
)
|
2,397
|
|
112
|
|
|||||||
|
Net purchases, sales and settlements
|
(1,310
|
)
|
(18,167
|
)
|
123
|
|
(19,354
|
)
|
|||||||
|
Balance at December 31, 2017
|
—
|
|
38,362
|
|
91,352
|
|
129,714
|
|
|||||||
|
Realized gains
|
—
|
|
8,264
|
|
1,001
|
|
9,265
|
|
|||||||
|
Unrealized (losses) gains
|
—
|
|
(1,409
|
)
|
4,462
|
|
3,053
|
|
|||||||
|
Net purchases, sales and settlements
|
—
|
|
(12,467
|
)
|
62
|
|
(12,405
|
)
|
|||||||
|
Balance at December 31, 2018
|
$
|
—
|
|
$
|
32,750
|
|
$
|
96,877
|
|
$
|
129,627
|
|
|||
Foreign Pension Plans
|
Real estate
|
Diversified growth funds
|
Total
|
|||||||||
|
Balance at December 31, 2016
|
$
|
34,483
|
|
$
|
36,779
|
|
$
|
71,262
|
|
||
|
Unrealized gains
|
2,159
|
|
3,551
|
|
5,710
|
|
|||||
|
Net purchases, sales and settlements
|
1,481
|
|
—
|
|
1,481
|
|
|||||
|
Foreign currency
|
3,478
|
|
3,694
|
|
7,172
|
|
|||||
|
Balance at December 31, 2017
|
41,601
|
|
44,024
|
|
85,625
|
|
|||||
|
Unrealized gains (losses)
|
1,317
|
|
(4,948
|
)
|
(3,631
|
)
|
|||||
|
Net purchases, sales and settlements
|
1,653
|
|
4,090
|
|
5,743
|
|
|||||
|
Foreign currency
|
(2,428
|
)
|
(2,400
|
)
|
(4,828
|
)
|
|||||
|
Balance at December 31, 2018
|
$
|
42,143
|
|
$
|
40,766
|
|
$
|
82,909
|
|
||
77
PITNEY BOWES INC.
NOTES TO CONSOLIDATED FINANCIAL STATEMENTS
(Tabular amounts in thousands, except per share amounts)
Nonpension Postretirement Benefits
The benefit obligation and funded status for nonpension postretirement benefit plans are as follows:
|
2018
|
2017
|
||||||
|
Benefit obligation
|
|||||||
|
Benefit obligation - beginning of year
|
$
|
188,841
|
|
$
|
189,772
|
|
|
|
Service cost
|
1,405
|
|
1,727
|
|
|||
|
Interest cost
|
6,640
|
|
7,100
|
|
|||
|
Plan participants' contributions
|
3,200
|
|
3,820
|
|
|||
|
Actuarial (gain) loss
|
(11,304
|
)
|
5,134
|
|
|||
|
Foreign currency changes
|
(1,178
|
)
|
1,066
|
|
|||
|
Curtailment
|
(533
|
)
|
—
|
|
|||
|
Benefits paid
|
(20,596
|
)
|
(19,778
|
)
|
|||
|
Benefit obligation - end of year
(1)
|
$
|
166,475
|
|
$
|
188,841
|
|
|
|
Fair value of plan assets
|
|||||||
|
Fair value of plan assets - beginning of year
|
$
|
—
|
|
$
|
—
|
|
|
|
Company contribution
|
17,396
|
|
15,958
|
|
|||
|
Plan participants' contributions
|
3,200
|
|
3,820
|
|
|||
|
Benefits paid
|
(20,596
|
)
|
(19,778
|
)
|
|||
|
Fair value of plan assets - end of year
|
$
|
—
|
|
$
|
—
|
|
|
|
Amounts recognized in the Consolidated Balance Sheets
|
|||||||
|
Current liability
|
$
|
(17,013
|
)
|
$
|
(17,712
|
)
|
|
|
Non-current liability
|
(149,463
|
)
|
(171,129
|
)
|
|||
|
Funded status
|
$
|
(166,476
|
)
|
$
|
(188,841
|
)
|
|
|
(1)
|
The benefit obligation for U.S. nonpension postretirement plans was
$154 million
and
$172 million
at
December 31, 2018
and
2017
, respectively.
|
Pretax amounts recognized in AOCI consist of:
|
2018
|
2017
|
||||||
|
Net actuarial loss
|
$
|
28,368
|
|
$
|
43,160
|
|
|
|
Prior service cost
|
823
|
|
1,466
|
|
|||
|
Total
|
$
|
29,191
|
|
$
|
44,626
|
|
|
The components of net periodic benefit cost for nonpension postretirement benefit plans were as follows:
|
2018
|
2017
|
2016
|
|||||||||
|
Service cost
|
$
|
1,405
|
|
$
|
1,727
|
|
$
|
2,046
|
|
||
|
Interest cost
|
6,640
|
|
7,100
|
|
7,969
|
|
|||||
|
Amortization of prior service cost
|
304
|
|
297
|
|
297
|
|
|||||
|
Amortization of net actuarial loss
|
3,048
|
|
3,600
|
|
3,615
|
|
|||||
|
Curtailment
|
246
|
|
—
|
|
—
|
|
|||||
|
Net periodic benefit cost
|
$
|
11,643
|
|
$
|
12,724
|
|
$
|
13,927
|
|
||
78
PITNEY BOWES INC.
NOTES TO CONSOLIDATED FINANCIAL STATEMENTS
(Tabular amounts in thousands, except per share amounts)
Other changes in plan assets and benefit obligation for nonpension postretirement benefit plans recognized in other comprehensive income were as follows:
|
2018
|
2017
|
||||||
|
Net actuarial (gain) loss
|
$
|
(11,837
|
)
|
$
|
5,134
|
|
|
|
Curtailment
|
(246
|
)
|
—
|
|
|||
|
Amortization of net actuarial loss
|
(3,048
|
)
|
(3,600
|
)
|
|||
|
Amortization of prior service cost
|
(304
|
)
|
(297
|
)
|
|||
|
Total recognized in other comprehensive income
|
$
|
(15,435
|
)
|
$
|
1,237
|
|
|
The weighted-average discount rates used to determine end of year benefit obligation and net periodic pension cost include:
|
2018
|
2017
|
2016
|
||||||
|
Discount rate used to determine benefit obligation
|
||||||||
|
U.S.
|
4.20
|
%
|
3.55
|
%
|
3.90
|
%
|
||
|
Canada
|
3.60
|
%
|
3.35
|
%
|
3.65
|
%
|
||
|
Discount rate used to determine net period benefit cost
|
||||||||
|
U.S.
|
3.55
|
%
|
3.90
|
%
|
4.20
|
%
|
||
|
Canada
|
3.35
|
%
|
3.65
|
%
|
3.95
|
%
|
||
The assumed health care cost trend rate used in measuring the accumulated postretirement benefit obligation for the U.S. plan was
7.0%
for
2018
and
7.0%
for
2017
. The assumed health care trend rate is
6.5%
for
2019
and will gradually decline to
5.0%
by the year
2025
and remain at that level thereafter. Assumed health care cost trend rates have a significant effect on the amounts reported for the health care plans.
Estimated Future Benefit Payments
The following benefit payments, which reflect expected future service, are expected to be paid.
|
Pension Benefits
|
Nonpension Benefits
|
||||||
|
Years ending December 31,
|
|||||||
|
2019
|
$
|
137,312
|
|
$
|
17,040
|
|
|
|
2020
|
131,672
|
|
16,376
|
|
|||
|
2021
|
129,641
|
|
15,783
|
|
|||
|
2022
|
128,972
|
|
14,737
|
|
|||
|
2023
|
128,774
|
|
13,706
|
|
|||
|
Thereafter
|
627,369
|
|
59,518
|
|
|||
|
$
|
1,283,740
|
|
$
|
137,160
|
|
||
Savings Plans
We offer voluntary defined contribution plans to our U.S. employees designed to help them accumulate additional savings for retirement. We provide a core contribution to all employees, regardless if they participate in the plan, and match a portion of each participating employees' contribution, based on eligible pay. Total contributions to our defined contribution plans were
$31 million
in both
2018
and
2017
.
79
PITNEY BOWES INC.
NOTES TO CONSOLIDATED FINANCIAL STATEMENTS
(Tabular amounts in thousands, except per share amounts)
15. Income Taxes
Income from continuing operations before taxes consisted of the following:
|
Years Ended December 31,
|
|||||||||||
|
2018
|
2017
|
2016
|
|||||||||
|
U.S.
|
$
|
114,982
|
|
$
|
140,574
|
|
$
|
126,856
|
|
||
|
International
|
97,379
|
|
81,341
|
|
74,933
|
|
|||||
|
Total
|
$
|
212,361
|
|
$
|
221,915
|
|
$
|
201,789
|
|
||
The provision for income taxes from continuing operations consisted of the following:
|
Years Ended December 31,
|
|||||||||||
|
2018
|
2017
|
2016
|
|||||||||
|
U.S. Federal:
|
|||||||||||
|
Current
|
$
|
(50,333
|
)
|
$
|
31,691
|
|
$
|
76,117
|
|
||
|
Deferred
|
56,715
|
|
(49,812
|
)
|
(1,979
|
)
|
|||||
|
6,382
|
|
(18,121
|
)
|
74,138
|
|
||||||
|
U.S. State and Local:
|
|||||||||||
|
Current
|
(10,489
|
)
|
(2,330
|
)
|
6,377
|
|
|||||
|
Deferred
|
(911
|
)
|
15,316
|
|
4,682
|
|
|||||
|
(11,400
|
)
|
12,986
|
|
11,059
|
|
||||||
|
International:
|
|||||||||||
|
Current
|
16,224
|
|
(3,418
|
)
|
21,014
|
|
|||||
|
Deferred
|
1,177
|
|
9,106
|
|
764
|
|
|||||
|
17,401
|
|
5,688
|
|
21,778
|
|
||||||
|
Total current
|
(44,598
|
)
|
25,943
|
|
103,508
|
|
|||||
|
Total deferred
|
56,981
|
|
(25,390
|
)
|
3,467
|
|
|||||
|
Total provision for income taxes
|
$
|
12,383
|
|
$
|
553
|
|
$
|
106,975
|
|
||
|
Effective tax rate
|
5.8
|
%
|
0.2
|
%
|
53.0
|
%
|
|||||
On December 22, 2017, the Tax Cuts and Jobs Act of 2017 (the Act) was signed into law making significant changes to the Internal Revenue Code. Changes included, but were not limited to, a federal corporate income tax rate decrease from 35% to 21% effective January 1, 2018, the transition of U.S. international taxation from a worldwide tax system to a territorial system by creating a minimum tax on earnings of foreign subsidiaries, and a one-time transition tax on the mandatory deemed repatriation of post-1986 cumulative foreign earnings. As of December 31, 2017, in accordance with the Act, we recorded a net provisional one-time non-cash benefit of
$39 million
, which was comprised of a provisional
$130 million
benefit from the remeasurement of net U.S. deferred tax liabilities arising from a lower U.S. tax rate, offset by a provisional
$91 million
charge related primarily to the U.S. tax on unremitted post-1986 earnings of our foreign subsidiaries. Staff Accounting Bulletin No. 118 (SAB 118) was issued to address the application of U.S. GAAP in situations when a registrant did not have the necessary information available, prepared, or analyzed (including computations) in reasonable detail to complete the accounting for certain income tax effects of the Act. December 22, 2018 marked the end of the measurement period for purposes of SAB 118. As such, we have completed the analysis based on legislative updates relating to the Act currently available which resulted in an adjustment to the provisional tax recorded of
$37 million
for the year ended December 31, 2018, which is comprised of a
$13 million
benefit related to the remeasurement of certain deferred tax assets and liabilities and a
$24 million
decrease in the U.S. tax on unremitted post-1986 earnings of our foreign subsidiaries.
In addition to the adjustment to the provisional tax benefits, the effective tax rate for
2018
includes a benefit of
$17 million
from the resolution of certain tax examinations. The effective tax rate for
2017
includes provisional tax benefits of $
39 million
from the Act, and tax benefits of $
30 million
from the resolution of certain tax examinations. The effective tax rate for
2016
includes tax benefits of $
15 million
from the resolution of tax examinations, a $
58 million
charge associated with the goodwill impairment charge and a $
6 million
charge for a valuation allowance on tax attribute carryovers.
80
PITNEY BOWES INC.
NOTES TO CONSOLIDATED FINANCIAL STATEMENTS
(Tabular amounts in thousands, except per share amounts)
A reconciliation of income taxes computed at the federal statutory rate and our provision for income taxes consist of the following:
|
Years Ended December 31,
|
|||||||||||
|
2018
|
2017
|
2016
|
|||||||||
|
Federal statutory provision
|
$
|
44,596
|
|
$
|
77,671
|
|
$
|
70,627
|
|
||
|
State and local income taxes
(1)
|
1,251
|
|
5,418
|
|
7,188
|
|
|||||
|
Impact of foreign operations taxed at rates other than the U.S. statutory rate
|
(1,988
|
)
|
(15,859
|
)
|
(9,236
|
)
|
|||||
|
Accrual/release of uncertain tax amounts related to foreign operations
|
(4,595
|
)
|
(17,919
|
)
|
(7,482
|
)
|
|||||
|
U.S. tax impacts of foreign income in the U.S.
|
7,683
|
|
2,778
|
|
2,929
|
|
|||||
|
Tax exempt income/reimbursement
|
—
|
|
—
|
|
(935
|
)
|
|||||
|
Tax incentives/credits/exempt income
|
2,026
|
|
(14,329
|
)
|
(9,020
|
)
|
|||||
|
Goodwill impairments
|
—
|
|
—
|
|
50,003
|
|
|||||
|
Remeasurement of U.S. deferred taxes
|
(13,121
|
)
|
(129,960
|
)
|
—
|
|
|||||
|
U.S. tax on unremitted earnings
|
(23,711
|
)
|
90,916
|
|
—
|
|
|||||
|
Other, net
|
242
|
|
1,837
|
|
2,901
|
|
|||||
|
Provision for income taxes
|
$
|
12,383
|
|
$
|
553
|
|
$
|
106,975
|
|
||
(1)
Includes release of tax uncertainties of
$(9) million
,
$(3) million
and
$(3) million
for the years ended December 31, 2018, 2017 and 2016, respectively.
Deferred tax liabilities and assets at
December 31, 2018
and
2017
consisted of the following:
|
December 31,
|
|||||||
|
2018
|
2017
|
||||||
|
Deferred tax liabilities:
|
|||||||
|
Depreciation
|
$
|
(102,726
|
)
|
$
|
(77,415
|
)
|
|
|
Deferred profit (for tax purposes) on sale to finance subsidiary
|
(41,951
|
)
|
(60,340
|
)
|
|||
|
Lease revenue and related depreciation
|
(166,544
|
)
|
(133,908
|
)
|
|||
|
Intangible assets
|
(98,707
|
)
|
(106,488
|
)
|
|||
|
Other
|
(33,353
|
)
|
(22,468
|
)
|
|||
|
Gross deferred tax liabilities
|
(443,281
|
)
|
(400,619
|
)
|
|||
|
Deferred tax assets:
|
|||||||
|
Nonpension postretirement benefits
|
42,422
|
|
48,387
|
|
|||
|
Pension
|
60,063
|
|
66,270
|
|
|||
|
Inventory and equipment capitalization
|
7,216
|
|
11,380
|
|
|||
|
Restructuring charges
|
5,064
|
|
12,476
|
|
|||
|
Long-term incentives
|
11,517
|
|
11,544
|
|
|||
|
Net operating loss
|
106,029
|
|
108,006
|
|
|||
|
Tax credit carry forwards
|
64,148
|
|
82,285
|
|
|||
|
Tax uncertainties gross-up
|
6,692
|
|
9,920
|
|
|||
|
Other
|
46,885
|
|
36,936
|
|
|||
|
Gross deferred tax assets
|
350,036
|
|
387,204
|
|
|||
|
Less: Valuation allowance
|
(142,496
|
)
|
(178,156
|
)
|
|||
|
Net deferred tax assets
|
207,540
|
|
209,048
|
|
|||
|
Total deferred taxes, net
|
$
|
(235,741
|
)
|
$
|
(191,571
|
)
|
|
81
PITNEY BOWES INC.
NOTES TO CONSOLIDATED FINANCIAL STATEMENTS
(Tabular amounts in thousands, except per share amounts)
A valuation allowance is recognized to reduce the total deferred tax assets to an amount that will more-likely-than-not be realized. The valuation allowance relates primarily to certain foreign, state and local net operating loss and tax credit carryforwards that are more-likely-than-not to expire unutilized.
We have net operating loss carryforwards of
$258 million
as of
December 31, 2018
, of which
$211 million
can be carried forward indefinitely and the remainder expire over the next
15
years. In addition, we have tax credit carryforwards of
$64 million
, of which
$50 million
can be carried forward indefinitely and the remainder expire over the next
5
to
15
years.
As of December 31, 2018, we assert that we are no longer permanently reinvested in
$724 million
of post-1986 earnings generated from non-U.S. subsidiaries, which were subject to the deemed repatriation toll charge under the Act. We continue to be permanently reinvested in our remaining undistributed earnings of
$301 million
as well as other outside basis differences. While a determination of the full liability that would be incurred if these earnings were repatriated is not practical, we have estimated the withholding taxes would be approximately
$13 million
.
Uncertain Tax Positions
A reconciliation of the amount of unrecognized tax benefits is as follows:
|
2018
|
2017
|
2016
|
|||||||||
|
Balance at beginning of year
|
$
|
89,767
|
|
$
|
124,728
|
|
$
|
139,249
|
|
||
|
Increases from prior period positions
|
88
|
|
528
|
|
—
|
|
|||||
|
Decreases from prior period positions
|
(15,145
|
)
|
(31,470
|
)
|
(21,207
|
)
|
|||||
|
Increases from current period positions
|
6,001
|
|
5,951
|
|
10,867
|
|
|||||
|
Decreases relating to settlements with tax authorities
|
(4,844
|
)
|
(6,953
|
)
|
(1,791
|
)
|
|||||
|
Reductions from lapse of applicable statute of limitations
|
(4,409
|
)
|
(3,017
|
)
|
(2,390
|
)
|
|||||
|
Balance at end of year
|
$
|
71,458
|
|
$
|
89,767
|
|
$
|
124,728
|
|
||
The amount of the unrecognized tax benefits at
December 31, 2018
,
2017
and
2016
that would affect the effective tax rate if recognized was
$65 million
,
$74 million
and
$104 million
, respectively.
On a regular basis, we conclude tax return examinations, statutes of limitations expire, and court decisions interpret tax law. We regularly assess tax uncertainties in light of these developments. As a result, it is reasonably possible that the amount of our unrecognized tax benefits will decrease in the next 12 months, and we expect this change could be up to
30%
of our unrecognized tax benefits. We recognize interest and penalties related to uncertain tax positions in our provision for income taxes. We recognized interest and penalties of less than
$(1) million
,
$(4) million
and less than
$1 million
related to uncertain tax positions in our provision for income taxes for the years ended
December 31, 2018
, 2017 and 2016 respectively. We had
$4 million
accrued for the payment of interest and penalties at
December 31, 2018
and
2017
.
Other Tax Matters
As is the case with other large corporations, our tax returns are examined each year by tax authorities in the U.S. and other global taxing jurisdictions in which we have operations. The IRS examinations of our consolidated U.S. income tax returns for tax years prior to 2015 are closed to audit; however, various post-2011 U.S. state and local tax returns are still subject to examination. In Canada, the examination of our tax filings prior to 2014 are closed to audit. Other significant jurisdictions include France, (closed through 2014), Germany, (closed through 2012) and the U.K. (except for an item under appeal, closed through 2016). We also have other less significant tax filings currently subject to examination.
We regularly assess the likelihood of tax adjustments in each of the tax jurisdictions in which we have operations and account for the related financial statement implications. We believe we have established tax reserves that are appropriate given the possibility of tax adjustments. However, determining the appropriate level of tax reserves requires judgment regarding the uncertain application of tax law and the possibility of tax adjustments. Future changes in tax reserve requirements could have a material impact, positive or negative, on our results of operations, financial position and cash flows.
82
PITNEY BOWES INC.
NOTES TO CONSOLIDATED FINANCIAL STATEMENTS
(Tabular amounts in thousands, except per share amounts)
16. Commitments and Contingencies
In the ordinary course of business, we are routinely defendants in, or party to, a number of pending and threatened legal actions. These may involve litigation by or against us relating to, among other things, contractual rights under vendor, insurance or other contracts; intellectual property or patent rights; equipment, service, payment or other disputes with clients; or disputes with employees. Some of these actions may be brought as a purported class action on behalf of a purported class of employees, clients or others. In management's opinion, it is not reasonably possible that the potential liability, if any, that may result from these actions, either individually or collectively, will have a material effect on our financial position, results of operations or cash flows. However, as litigation is inherently unpredictable, there can be no assurances in this regard.
In August 2018, the Company, certain of its directors, officers and several banks who served as underwriters, were named as defendants in City of Livonia Retiree Health and Disability Benefits Plan v. Pitney Bowes Inc. et al.
,
a putative class action lawsuit filed in Connecticut state court. The complaint asserts claims under the Securities Act of 1933, as amended, on behalf of those who purchased notes issued by the Company in connection with a September 13, 2017 offering, alleging, among other things, that the Company failed to make certain disclosures relating to components of its third quarter 2017 performance at the time of the notes offering. The complaint seeks compensatory damages and other relief. In addition, in December 2018 and then in February 2018, certain of the Company’s officers and directors were named as defendants in two virtually identical derivative actions purportedly brought on behalf of the Company, Clem v. Lautenbach et al. and Devolin v. Lautenbach et al. These two actions, both filed by the same counsel in Connecticut state court allege, among other things, breaches of fiduciary duty relating to these same disclosures, and seek compensatory damages and other relief derivatively for the benefit of the Company. Although litigation outcomes are inherently unpredictable, we believe these matters are without merit and intend to defend them vigorously. A reasonable estimate of the amount of any possible loss or range of loss cannot be made at this time.
17. Leases
We lease office space and equipment under operating lease agreements with varying terms. Certain leases require us to pay property taxes, insurance and routine maintenance and include renewal options and escalation clauses. Rent expense was
$53 million
,
$46 million
and
$45 million
in
2018
,
2017
and
2016
, respectively. Future minimum lease payments under non-cancelable operating leases at
December 31, 2018
were as follows:
|
Years ending December 31,
|
|||
|
2019
|
$
|
48,182
|
|
|
2020
|
41,366
|
|
|
|
2021
|
34,665
|
|
|
|
2022
|
26,616
|
|
|
|
2023
|
17,988
|
|
|
|
Thereafter
|
62,668
|
|
|
|
Total minimum lease payments
|
$
|
231,485
|
|
83
PITNEY BOWES INC.
NOTES TO CONSOLIDATED FINANCIAL STATEMENTS
(Tabular amounts in thousands, except per share amounts)
18. Stockholders' Equity
Preferred and Preference Stock
We have
two
classes of preferred stock issued and outstanding, the
4%
Preferred Stock (the Preferred Stock) and the
$2.12
Preference Stock (the Preference Stock)
.
The Preferred Stock is entitled to cumulative dividends of
$2
per year and can be converted into
24.24
shares of common stock, subject to adjustment, in certain events. The Preferred Stock is redeemable at our option at a price of
$50
per share, plus dividends accrued through the redemption date. We are authorized to issue
600,000
shares of Preferred Stock. There were
12
shares of Preferred Stock outstanding at both
December 31, 2018
and
2017
. There are no unpaid dividends in arrears.
The Preference Stock is entitled to cumulative dividends of
$2.12
per year and can be converted into
16.53
shares of common stock, subject to adjustment, in certain events. The Preference Stock is redeemable at our option at a price of
$28
per share. We are authorized to issue
5,000,000
shares of Preference Stock. At
December 31, 2018
and
2017
, there were
14,635 shares
and
16,301 shares
outstanding, respectively. There are no unpaid dividends in arrears.
Common and Treasury Stock
The following table summarizes the changes in shares of Common Stock outstanding and Treasury Stock:
|
Common Stock Outstanding
|
Treasury Stock
|
||||
|
Balance at December 31, 2015
|
195,521,208
|
|
127,816,704
|
|
|
|
Repurchases of common stock
|
(10,633,235
|
)
|
10,633,235
|
|
|
|
Issuance of common stock
|
767,060
|
|
(767,060
|
)
|
|
|
Conversions to common stock
|
13,685
|
|
(13,685
|
)
|
|
|
Balance at December 31, 2016
|
185,668,718
|
|
137,669,194
|
|
|
|
Issuance of common stock
|
881,480
|
|
(881,480
|
)
|
|
|
Conversions to common stock
|
53,540
|
|
(53,540
|
)
|
|
|
Balance at December 31, 2017
|
186,603,738
|
|
136,734,174
|
|
|
|
Issuance of common stock
|
1,043,809
|
|
(1,043,809
|
)
|
|
|
Conversions to common stock
|
27,535
|
|
(27,535
|
)
|
|
|
Balance at December 31, 2018
|
187,675,082
|
|
135,662,830
|
|
|
At
December 31, 2018
,
33,572,744
shares were reserved for issuance under our stock plans, dividend reinvestment program and the conversion of Preferred Stock and Preference Stock.
84
PITNEY BOWES INC.
NOTES TO CONSOLIDATED FINANCIAL STATEMENTS
(Tabular amounts in thousands, except per share amounts)
19. Accumulated Other Comprehensive Income (Loss)
Reclassifications out of accumulated other comprehensive income (loss) for the years ended
December 31, 2018
,
2017
and
2016
were as follows:
|
Amounts Reclassified from AOCI (a)
|
|||||||||||
|
Years Ended December 31,
|
|||||||||||
|
2018
|
2017
|
2016
|
|||||||||
|
Gain (loss) on cash flow hedges
|
|||||||||||
|
Revenue
|
$
|
11
|
|
$
|
(179
|
)
|
$
|
68
|
|
||
|
Cost of sales
|
51
|
|
(32
|
)
|
(222
|
)
|
|||||
|
Interest expense
|
(1,183
|
)
|
(2,028
|
)
|
(2,028
|
)
|
|||||
|
Loss on extinguishment of debt
|
(1,267
|
)
|
—
|
|
—
|
|
|||||
|
Total before tax
|
(2,388
|
)
|
(2,239
|
)
|
(2,182
|
)
|
|||||
|
Tax benefit
|
(941
|
)
|
(872
|
)
|
(850
|
)
|
|||||
|
Net of tax
|
$
|
(1,447
|
)
|
$
|
(1,367
|
)
|
$
|
(1,332
|
)
|
||
|
Gain (loss) on available for sale securities
|
|||||||||||
|
Interest income
|
$
|
3,244
|
|
$
|
(520
|
)
|
$
|
(1,126
|
)
|
||
|
Tax (benefit) provision
|
821
|
|
(201
|
)
|
(433
|
)
|
|||||
|
Net of tax
|
$
|
2,423
|
|
$
|
(319
|
)
|
$
|
(693
|
)
|
||
|
Pension and Postretirement Benefit Plans (b)
|
|||||||||||
|
Transition asset
|
$
|
7
|
|
$
|
8
|
|
$
|
8
|
|
||
|
Prior service costs
|
(173
|
)
|
(166
|
)
|
(164
|
)
|
|||||
|
Actuarial losses
|
(41,610
|
)
|
(40,606
|
)
|
(38,370
|
)
|
|||||
|
Settlement
|
(44,898
|
)
|
—
|
|
—
|
|
|||||
|
Total before tax
|
(86,674
|
)
|
(40,764
|
)
|
(38,526
|
)
|
|||||
|
Tax benefit
|
(21,675
|
)
|
(13,936
|
)
|
(14,430
|
)
|
|||||
|
Net of tax
|
$
|
(64,999
|
)
|
$
|
(26,828
|
)
|
$
|
(24,096
|
)
|
||
(a) Amounts in parentheses indicate reductions to income and increases to other comprehensive income.
|
(b)
|
Reclassified from accumulated other comprehensive loss to other components of net pension and postretirement cost. These amounts are included in net periodic costs for defined benefit pension plans and nonpension postretirement benefit plans (see Note 14 for additional details).
|
85
PITNEY BOWES INC.
NOTES TO CONSOLIDATED FINANCIAL STATEMENTS
(Tabular amounts in thousands, except per share amounts)
Changes in accumulated other comprehensive income (loss) for the years ended
December 31, 2018
,
2017
and
2016
were as follows:
|
Cash flow hedges
|
Available-for-sale securities
|
Pension and postretirement benefit plans
|
Foreign currency adjustments
|
Total
|
|||||||||||||||
|
Balance January 1, 2016
|
$
|
(3,912
|
)
|
$
|
536
|
|
$
|
(738,768
|
)
|
$
|
(146,491
|
)
|
$
|
(888,635
|
)
|
||||
|
Other comprehensive income (loss) before reclassifications (a)
|
1,095
|
|
(1,109
|
)
|
(73,141
|
)
|
(4,464
|
)
|
(77,619
|
)
|
|||||||||
|
Amounts reclassified from accumulated other comprehensive income (loss) (a), (b)
|
1,332
|
|
693
|
|
24,096
|
|
—
|
|
26,121
|
|
|||||||||
|
Net other comprehensive income (loss)
|
2,427
|
|
(416
|
)
|
(49,045
|
)
|
(4,464
|
)
|
(51,498
|
)
|
|||||||||
|
Balance at December 31, 2016
|
(1,485
|
)
|
120
|
|
(787,813
|
)
|
(150,955
|
)
|
(940,133
|
)
|
|||||||||
|
Other comprehensive income (loss) before reclassifications (a)
|
(288
|
)
|
1,158
|
|
12,185
|
|
106,391
|
|
119,446
|
|
|||||||||
|
Amounts reclassified from accumulated other comprehensive income (loss) (a), (b)
|
1,367
|
|
319
|
|
26,828
|
|
—
|
|
28,514
|
|
|||||||||
|
Net other comprehensive income (loss)
|
1,079
|
|
1,477
|
|
39,013
|
|
106,391
|
|
147,960
|
|
|||||||||
|
Balance at December 31, 2017
|
(406
|
)
|
1,597
|
|
(748,800
|
)
|
(44,564
|
)
|
(792,173
|
)
|
|||||||||
|
Cumulative effect of accounting change
|
(87
|
)
|
344
|
|
(116,490
|
)
|
—
|
|
(116,233
|
)
|
|||||||||
|
Restated balance at December 31, 2017
|
(493
|
)
|
1,941
|
|
(865,290
|
)
|
(44,564
|
)
|
(908,406
|
)
|
|||||||||
|
Other comprehensive income (loss) before reclassifications (a)
|
(763
|
)
|
(2,579
|
)
|
(46,170
|
)
|
(54,531
|
)
|
(104,043
|
)
|
|||||||||
|
Amounts reclassified from accumulated other comprehensive income (loss) (a), (b)
|
1,447
|
|
(2,423
|
)
|
64,999
|
|
—
|
|
64,023
|
|
|||||||||
|
Net other comprehensive income (loss)
|
684
|
|
(5,002
|
)
|
18,829
|
|
(54,531
|
)
|
(40,020
|
)
|
|||||||||
|
Balance at December 31, 2018
|
$
|
191
|
|
$
|
(3,061
|
)
|
$
|
(846,461
|
)
|
$
|
(99,095
|
)
|
$
|
(948,426
|
)
|
||||
(a) Amounts are net of tax. Amounts in parentheses indicate debits to AOCI.
(b) See table above for additional details of these reclassifications.
20. Stock-Based Compensation Plans
We have a long-term incentive program whereby eligible employees may be granted restricted stock units, non-qualified stock options and performance stock units. The Executive Compensation Committee of the Board of Directors administers these plans. We settle stock awards with treasury shares. At
December 31, 2018
, there were
14,411,742
shares available for future grants under our long-term incentive program.
Restricted Stock Units
Restricted stock units (RSUs) entitle the holder to shares of common stock as the units vest, typically over a
three
-year service period. The following table summarizes information about RSUs during
2018
and
2017
:
|
2018
|
2017
|
||||||||||||
|
Shares
|
Weighted average grant date fair value
|
Shares
|
Weighted average grant date fair value
|
||||||||||
|
Outstanding - beginning of the year
|
2,651,053
|
|
$
|
14.16
|
|
1,609,459
|
|
$
|
17.50
|
|
|||
|
Granted
|
1,754,098
|
|
12.36
|
|
1,995,473
|
|
13.24
|
|
|||||
|
Vested
|
(963,010
|
)
|
11.41
|
|
(784,295
|
)
|
19.42
|
|
|||||
|
Forfeited
|
(213,802
|
)
|
13.26
|
|
(169,584
|
)
|
14.76
|
|
|||||
|
Outstanding - end of the year
|
3,228,339
|
|
$
|
13.33
|
|
2,651,053
|
|
$
|
14.16
|
|
|||
The fair value of RSUs is determined based on the stock price on the grant date less the present value of expected dividends. At
December 31, 2018
, there was
$15 million
of unrecognized compensation cost related to RSUs that is expected to be recognized over a weighted-average period of
1.7 years
. The intrinsic value of RSUs outstanding at
December 31, 2018
was
$18 million
. The intrinsic value of RSUs
86
PITNEY BOWES INC.
NOTES TO CONSOLIDATED FINANCIAL STATEMENTS
(Tabular amounts in thousands, except per share amounts)
vested during
2018
,
2017
and
2016
was
$17 million
,
$26 million
and
$14 million
, respectively. The fair value of RSUs vested during
2018
,
2017
and
2016
was
$18 million
,
$14 million
and
$21 million
, respectively. During
2016
, we granted
826,546
RSUs at a weighted average fair value of
$17.20
.
Non-employee directors receive restricted stock units which are convertible into shares of common stock
one
year from date of grant. In
2018
and
2017
, we granted
131,420
and
63,090
restricted stock units, respectively, to non-employee directors.
Performance Stock Units
Performance stock units (PSUs) are stock awards where the number of shares ultimately received by the employee is conditional upon the attainment of certain performance targets as well as total shareholder return relative to peer companies. PSUs vest at the end of a
three
-year service period and the actual number of shares awarded may range from
0%
to
200%
of the target award. However, the final determination of the number of shares to be issued is made by our Board of Directors, who may reduce, but not increase, the ultimate number of shares to be awarded (negative discretion). PSUs are accounted for as variable awards until the end of the service period when the grant date is established.
The following table summarizes share information about PSUs during
2018
:
|
2018
|
2017
|
||||||||||||
|
Shares
|
Weighted average grant date fair value
|
Shares
|
Weighted average grant date fair value
|
||||||||||
|
Outstanding - beginning of the year
|
1,145,025
|
|
$
|
13.43
|
|
379,898
|
|
$
|
25.01
|
|
|||
|
Granted
|
733,148
|
|
12.64
|
|
1,073,934
|
|
10.51
|
|
|||||
|
Vested
|
(91,493
|
)
|
12.21
|
|
(258,688
|
)
|
13.17
|
|
|||||
|
Forfeited
|
(133,676
|
)
|
14.26
|
|
(50,119
|
)
|
26.10
|
|
|||||
|
Outstanding - end of the year
|
1,653,004
|
|
$
|
13.08
|
|
1,145,025
|
|
$
|
13.43
|
|
|||
Share-based compensation expense for PSUs is recognized ratably over the service period based on the number shares expected to be awarded and the fair value of an award. The fair value of PSUs is determined using a Monte Carlo simulation model. Due to the variability of these awards, significant fluctuations in share-based compensation expense for PSUs recognized from one period to the next are possible.
Stock Options
Stock options are granted at an exercise price equal to or greater than the stock price of our common stock on the grant date. Options vest ratably over
three
years and expire
ten years
from the grant date. At
December 31, 2018
, there was
$4 million
of unrecognized compensation cost related to stock options that is expected to be recognized over a weighted-average period of
1.7 years
. The intrinsic value of options outstanding and options exercisable at
December 31, 2018
was not significant. There were
no
stock option exercises in 2018, 2017 or 2016.
The following table summarizes information about stock option activity during
2018
and
2017
:
|
2018
|
2017
|
||||||||||||
|
Shares
|
Per share weighted average exercise prices
|
Shares
|
Per share weighted average exercise prices
|
||||||||||
|
Options outstanding - beginning of the year
|
10,495,039
|
|
$
|
21.67
|
|
9,122,762
|
|
$
|
27.13
|
|
|||
|
Granted
|
4,932,467
|
|
8.47
|
|
2,553,510
|
|
13.16
|
|
|||||
|
Canceled
|
(258,509
|
)
|
13.09
|
|
(63,517
|
)
|
20.34
|
|
|||||
|
Expired
|
(1,575,841
|
)
|
36.86
|
|
(1,117,716
|
)
|
46.88
|
|
|||||
|
Options outstanding - end of the year
|
13,593,156
|
|
$
|
15.30
|
|
10,495,039
|
|
$
|
21.67
|
|
|||
|
Options exercisable - end of the year
|
6,824,433
|
|
$
|
20.23
|
|
6,690,250
|
|
$
|
25.57
|
|
|||
87
PITNEY BOWES INC.
NOTES TO CONSOLIDATED FINANCIAL STATEMENTS
(Tabular amounts in thousands, except per share amounts)
The following table provides additional information about stock options outstanding and exercisable at
December 31, 2018
:
|
Options Outstanding
|
Options Exercisable
|
|||||||||||||||||||
|
Range of per share exercise prices
|
Shares
|
Per share weighted-average exercise price
|
Weighted-average remaining contractual life
|
Shares
|
Per share weighted-average exercise price
|
Weighted-average remaining contractual life
|
||||||||||||||
|
$5.99 - $13.11
|
4,537,267
|
|
$
|
8.02
|
|
9.7
|
years
|
—
|
|
$
|
—
|
|
—
|
|
||||||
|
$13.16 - $17.71
|
4,903,330
|
|
14.72
|
|
7.3
|
years
|
2,879,149
|
|
15.21
|
|
6.8
|
years
|
||||||||
|
$19.45 - $26.07
|
4,152,559
|
|
23.94
|
|
2.0
|
years
|
3,945,284
|
|
23.90
|
|
1.7
|
years
|
||||||||
|
13,593,156
|
|
$
|
15.30
|
|
6.5
|
years
|
6,824,433
|
|
$
|
20.23
|
|
3.9
|
years
|
|||||||
The fair value of stock options is determined using a Black-Scholes valuation model. The determination of fair value requires assumptions be made regarding the expected stock price volatility, risk-free interest rate, life of the award and dividend yield. The expected stock price volatility is based on historical price changes of our stock. The risk-free interest rate is based on U.S. Treasuries with a term equal to the expected life of the award. The expected life of the award and expected dividend yield are based on historical experience.
The follow table lists the weighted average of assumptions used to calculate the fair value of stock options granted during
2018
and
2017
:
|
Years Ended December 31,
|
||||||||
|
2018
|
2017
|
2016
|
||||||
|
Expected dividend yield
|
9.9
|
%
|
5.7
|
%
|
4.5
|
%
|
||
|
Expected stock price volatility
|
37.8
|
%
|
29.7
|
%
|
29.0
|
%
|
||
|
Risk-free interest rate
|
2.8
|
%
|
2.3
|
%
|
1.6
|
%
|
||
|
Expected life
|
7 years
|
|
7 years
|
|
7 years
|
|
||
|
Weighted-average fair value per option granted
|
$1.26
|
$2.00
|
$2.85
|
|||||
|
Fair value of options granted
|
$6,229
|
$5,107
|
$5,013
|
|||||
Employee Stock Purchase Plan
We maintain a non-compensatory Employee Stock Purchase Plan that enables substantially all U.S. and Canadian employees to purchase shares of our common stock at an offering price of
95%
of the average market price on the offering date. At no time will the exercise price be less than the lowest price permitted under Section 423 of the Internal Revenue Code. Employees purchased
218,424
shares and
150,629
shares in
2018
and
2017
, respectively. We have reserved
2,552,004
common shares for future purchase under the ESPP.
21. Subsequent Event
In January 2019, we sold the direct operations and moved to a dealer model in six smaller markets within International Mailing. Proceeds from the sale were not material.
88
PITNEY BOWES INC.
NOTES TO CONSOLIDATED FINANCIAL STATEMENTS
(Tabular amounts in thousands, except per share amounts)
22. Quarterly Financial Data (unaudited)
|
First
Quarter
|
Second Quarter
|
Third Quarter
|
Fourth Quarter
|
Total
|
|||||||||||||||
|
2018
|
|||||||||||||||||||
|
Revenue
|
$
|
880,948
|
|
$
|
861,436
|
|
$
|
832,856
|
|
$
|
947,140
|
|
$
|
3,522,380
|
|
||||
|
Cost of revenues
|
463,861
|
|
455,816
|
|
446,753
|
|
526,519
|
|
1,892,949
|
|
|||||||||
|
Operating expenses
|
355,798
|
|
352,156
|
|
340,974
|
|
368,142
|
|
1,417,070
|
|
|||||||||
|
Income from continuing operations before income taxes
|
61,289
|
|
53,464
|
|
45,129
|
|
52,479
|
|
212,361
|
|
|||||||||
|
Provision (benefit) for income taxes
|
16,263
|
|
6,458
|
|
(1,976
|
)
|
(8,362
|
)
|
12,383
|
|
|||||||||
|
Income from continuing operations
|
45,026
|
|
47,006
|
|
47,105
|
|
60,841
|
|
199,978
|
|
|||||||||
|
Income (loss) from discontinued operations
|
8,487
|
|
1,208
|
|
29,848
|
|
(15,856
|
)
|
23,687
|
|
|||||||||
|
Net income - Pitney Bowes Inc.
|
$
|
53,513
|
|
$
|
48,214
|
|
$
|
76,953
|
|
$
|
44,985
|
|
$
|
223,665
|
|
||||
|
Basic earnings (loss) per share
(1)
|
|||||||||||||||||||
|
Continuing operations
|
$
|
0.24
|
|
$
|
0.25
|
|
$
|
0.25
|
|
$
|
0.32
|
|
$
|
1.07
|
|
||||
|
Discontinued operations
|
0.05
|
|
0.01
|
|
0.16
|
|
(0.08
|
)
|
0.13
|
|
|||||||||
|
Net income - Pitney Bowes Inc.
|
$
|
0.29
|
|
$
|
0.26
|
|
$
|
0.41
|
|
$
|
0.24
|
|
$
|
1.19
|
|
||||
|
Diluted earnings (loss) per share
(1)
|
|||||||||||||||||||
|
Continuing operations
|
$
|
0.24
|
|
$
|
0.25
|
|
$
|
0.25
|
|
$
|
0.32
|
|
$
|
1.06
|
|
||||
|
Discontinued operations
|
0.05
|
|
0.01
|
|
0.16
|
|
(0.08
|
)
|
0.13
|
|
|||||||||
|
Net income - Pitney Bowes Inc.
|
$
|
0.28
|
|
$
|
0.26
|
|
$
|
0.41
|
|
$
|
0.24
|
|
$
|
1.19
|
|
||||
|
First
Quarter
|
Second Quarter
|
Third Quarter
|
Fourth Quarter
|
Total
|
|||||||||||||||
|
2017
|
|||||||||||||||||||
|
Revenue
|
$
|
743,180
|
|
$
|
730,413
|
|
$
|
733,273
|
|
$
|
916,406
|
|
$
|
3,123,272
|
|
||||
|
Cost of revenues
|
310,367
|
|
319,904
|
|
328,172
|
|
474,317
|
|
1,432,760
|
|
|||||||||
|
Operating expenses
|
348,307
|
|
368,258
|
|
348,836
|
|
403,196
|
|
1,468,597
|
|
|||||||||
|
Income from continuing operations before income taxes
|
84,506
|
|
42,251
|
|
56,265
|
|
38,893
|
|
221,915
|
|
|||||||||
|
Provision (benefit) for income taxes
|
27,082
|
|
790
|
|
10,828
|
|
(38,147
|
)
|
553
|
|
|||||||||
|
Income from continuing operations
|
57,424
|
|
41,461
|
|
45,437
|
|
77,040
|
|
221,362
|
|
|||||||||
|
Income from discontinued operations
|
7,709
|
|
7,440
|
|
11,921
|
|
12,908
|
|
39,978
|
|
|||||||||
|
Net income - Pitney Bowes Inc.
|
$
|
65,133
|
|
$
|
48,901
|
|
$
|
57,358
|
|
$
|
89,948
|
|
$
|
261,340
|
|
||||
|
Basic earnings per share
(1)
:
|
|||||||||||||||||||
|
Continuing operations
|
$
|
0.31
|
|
$
|
0.22
|
|
$
|
0.24
|
|
$
|
0.41
|
|
$
|
1.19
|
|
||||
|
Discontinued operations
|
0.04
|
|
0.04
|
|
0.06
|
|
0.07
|
|
0.21
|
|
|||||||||
|
Net income - Pitney Bowes Inc.
|
$
|
0.35
|
|
$
|
0.26
|
|
$
|
0.31
|
|
$
|
0.48
|
|
$
|
1.40
|
|
||||
|
Diluted earnings per share
(1):
|
|
|
|
|
|||||||||||||||
|
Continuing operations
|
$
|
0.31
|
|
$
|
0.22
|
|
$
|
0.24
|
|
$
|
0.41
|
|
$
|
1.18
|
|
||||
|
Discontinued operations
|
0.04
|
|
0.04
|
|
0.06
|
|
0.07
|
|
0.21
|
|
|||||||||
|
Net income - Pitney Bowes Inc.
|
$
|
0.35
|
|
$
|
0.26
|
|
$
|
0.31
|
|
$
|
0.48
|
|
$
|
1.39
|
|
||||
(1)
The sum of earnings per share amounts may not equal the totals due to rounding.
89
PITNEY BOWES INC.
SCHEDULE II - VALUATION AND QUALIFYING ACCOUNTS AND RESERVES
(Dollars in thousands)
|
Description
|
Balance at beginning of year
|
Additions charged to expense
|
Deductions
|
Balance at end of year
|
||||||||||||
|
Allowance for doubtful accounts
|
||||||||||||||||
|
2018
|
$
|
14,786
|
|
$
|
9,720
|
|
$
|
(6,889
|
)
|
$
|
17,617
|
|
||||
|
2017
|
$
|
13,999
|
|
$
|
8,081
|
|
$
|
(7,294
|
)
|
$
|
14,786
|
|
||||
|
2016
|
$
|
11,541
|
|
$
|
7,179
|
|
$
|
(4,721
|
)
|
$
|
13,999
|
|
||||
|
Valuation allowance for deferred tax asset
|
||||||||||||||||
|
2018
|
$
|
178,156
|
|
$
|
3,682
|
|
$
|
(39,342
|
)
|
$
|
142,496
|
|
||||
|
2017
|
$
|
127,095
|
|
$
|
53,782
|
|
$
|
(2,721
|
)
|
$
|
178,156
|
|
||||
|
2016
|
$
|
132,624
|
|
$
|
6,523
|
|
$
|
(12,052
|
)
|
$
|
127,095
|
|
||||
90
SIGNATURES
Pursuant to the requirements of Section 13 or 15(d) of the Securities Exchange Act of 1934, the Registrant has duly caused this report to be signed on its behalf by the undersigned, thereunto duly authorized.
Date:
February 20, 2019
PITNEY BOWES INC.
Registrant
By:
/s/ Marc B. Lautenbach
Marc B. Lautenbach
President and Chief Executive Officer
Pursuant to the requirements of the Securities Exchange Act of 1934, this report has been signed below by the following persons on behalf of the Registrant and in the capacities and on the dates indicated.
|
Signature
|
Title
|
Date
|
||
|
/s/ Marc B. Lautenbach
Marc B. Lautenbach
|
President and Chief Executive Officer - Director
|
February 20, 2019
|
||
|
/s/ Stanley J. Sutula III
Stanley J. Sutula III |
Executive Vice President, Chief Financial Officer (Principal Financial Officer)
|
February 20, 2019
|
||
|
/s/ Joseph R. Catapano
Joseph R. Catapano
|
Vice President, Chief Accounting Officer (Principal Accounting Officer)
|
February 20, 2019
|
||
|
/s/ Michael I. Roth
Michael I. Roth
|
Non-Executive Chairman - Director
|
February 20, 2019
|
||
|
/s/ Linda G. Alvarado
Linda G. Alvarado
|
Director
|
February 20, 2019
|
||
|
/s/ Anne M. Busquet
Anne M. Busquet
|
Director
|
February 20, 2019
|
||
|
/s/ Robert M. Dutkowsky
Robert M. Dutkowsky
|
Director
|
February 20, 2019
|
||
|
/s/ Roger Fradin
Roger Fradin
|
Director
|
February 20, 2019
|
||
|
/s/ Anne Sutherland Fuchs
Anne Sutherland Fuchs
|
Director
|
February 20, 2019
|
||
|
/s/ Mary J. Steele Guilfoile
Mary J. Steele Guilfoile
|
Director
|
February 20, 2019
|
||
|
/s/ S. Douglas Hutcheson
S. Douglas Hutcheson
|
Director
|
February 20, 2019
|
||
|
/s/ Eduardo R. Menasc
é
Eduardo R. Menascé
|
Director
|
February 20, 2019
|
||
|
/s/ Linda S. Sanford
Linda S. Sanford
|
Director
|
February 20, 2019
|
||
|
/s/ David L. Shedlarz
David L. Shedlarz
|
Director
|
February 20, 2019
|
||
|
/s/ David B. Snow, Jr.
David B. Snow, Jr.
|
Director
|
February 20, 2019
|
||
91
TABLE OF CONTENTS
Part IItem 1. BusinessItem 1A. Risk FactorsItem 1B. Unresolved Staff CommentsItem 2. PropertiesItem 3. Legal ProceedingsItem 4. Mine Safety DisclosuresPart IIItem 5. Market For The Company's Common Equity, Related Stockholder Matters and Issuer Purchases Of Equity SecuritiesItem 6. Selected Financial DataItem 7. Management's Discussion and Analysis Of Financial Condition and Results OfItem 7A. Quantitative and Qualitative Disclosures About Market RiskItem 8. Financial Statements and Supplementary DataItem 9. Changes in and Disagreements with Accountants on Accounting and Financial DisclosureItem 9A. Controls and ProceduresItem 9B. Other InformationPart IIIItem 10. Directors, Executive Officers and Corporate GovernanceItem 11. Executive CompensationItem 12. Security Ownership Of Certain Beneficial Owners and Management and Related Stockholder MattersItem 13. Certain Relationships, Related Transactions and Director IndependenceItem 14. Principal Accountant Fees and ServicesPart IVItem 15. Exhibits and Financial Statement SchedulesItem 16. Form 10-k Summary