PURE CYCLE CORP
10-Ks and 10-Qs
|
|
|
|
|
|
|
|
|
|
|
|
|
|
|
|
|
|
|
|
|
|
|
|
|
|
|
|
|
|
|
|
|
|
|
|
|
|
|
|
|
|
|
|
|
|
|
|
|
|
|
|
|
|
|
|
|
|
|
UNITED STATES
SECURITIES AND EXCHANGE COMMISSION
Washington, D.C. 20549
Form 10-K
X
ANNUAL REPORT PURSUANT TO SECTION 13 OR 15(d) OF
THE SECURITIES EXCHANGE ACT OF 1934
For the fiscal year ended August 31, 2017
TRANSITION REPORT PURSUANT TO SECTION 13 OR 15(d)
OF THE SECURITIES EXCHANGE ACT OF 1934
Commission File Number 0-8814
|
PURE CYCLE CORPORATION
|
|
|
(Exact name of registrant as specified in its charter)
|
|
|
|
|
|
Colorado
|
84-0705083
|
|
(State or other jurisdiction of incorporation
or organization)
|
(I.R.S. Employer Identification No.)
|
|
|
|
|
34501 E. Quincy Ave., Bldg. 34, Box 10
Watkins, CO 80137
|
(303) 292-3456
|
|
(Address of principal executive offices) (Zip Code)
|
(Registrant’s telephone number, including area
code)
|
|
|
|
|
Securities registered pursuant to Section 12(b) of the
Act:
|
|
|
Common Stock 1/3 of $.01 par value
|
The NASDAQ Stock Market
|
|
(Title of each class)
|
(Name of each exchange on which registered)
|
|
|
|
|
Securities registered pursuant to Section 12(g) of the Act:
NONE
|
|
|
Indicate by check mark if the registrant is a well-known seasoned
issuer, as defined in Rule 405 of the Securities Act.
Yes
[ ] No [X]
|
|
|
Indicate by check mark if the registrant is not required to file
reports pursuant to Section 13 or Section 15(d) of the Act.
Yes
[ ] No [X]
|
|
|
Indicate by check mark whether the registrant (1) has filed all
reports required to be filed by Section 13 or 15(d) of the
Securities Exchange Act of 1934 during the preceding 12 months (or
for such shorter period that the registrant was required to file
such reports), and (2) has been subject to such filing requirements
for the past 90 days.
Yes
[X] No [ ]
|
|
|
|
|
|
Indicate by check mark whether the registrant has submitted
electronically and posted on its corporate website, if any, every
Interactive Data File required to be submitted and posted pursuant
to Rule 405 of Regulation S-T (Section 232.405 of this chapter)
during the preceding 12 months (or for such shorter period that the
registrant was required to submit and post such files). Yes [X] No
[ ]
|
|
|
Indicate by check mark if disclosure of delinquent filers pursuant
to Item 405 of Regulation S-K (Section 229.405 of this
chapter) is not contained herein, and will not be contained, to the
best of registrant’s knowledge, in definitive proxy or
information statements incorporated by reference in Part III of
this Form 10-K or any amendment to this Form 10-K
[ ]
|
|
|
|
|
|
Indicate by check mark whether the registrant is a large
accelerated filer, an accelerated filer, a non-accelerated filer, a
smaller reporting company or an emerging growth company. See the
definitions of “large accelerated filer,”
“accelerated filer,” “smaller reporting
company” and “emerging growth company” in Rule
12b-2 of the Exchange Act.
Large accelerated filer [
]
Accelerated filer [X]
Non-accelerated filer [ ] (Do not check if a smaller
reporting company)
Smaller
reporting company [ ]
Emerging
growth company [ ]
If an emerging growth company, indicate by check mark if the
registrant has elected to use the extended transition period for
complying with any new or revised financial accounting standards
provided pursuant to Section 13(a) of the Exchange Act. [
]
|
|
|
Indicate by check mark whether the registrant is a shell company
(as defined in Rule 12b-2 of the Act). Yes [ ] No [X]
|
|
|
State the aggregate market value of the voting and non-voting
common equity held by non-affiliates computed by reference to the
price at which the common equity was last sold, or the average bid
and asked price of such common equity, as of the last business day
of the registrant’s most recently completed second fiscal
quarter:$87,215,786
|
|
|
|
|
|
Indicate the number of shares outstanding of each of the
registrant’s classes of common stock, as of the latest
practicable date: November 7, 2017:
23,754,098
|
|
|
|
|
|
DOCUMENTS INCORPORATED BY REFERENCE
The information required by Part III is incorporated by reference
from the registrant’s definitive proxy statement for the
Annual Meeting of Shareholders to be held in January 2018, which
will be filed with the SEC within 120 days of the close of the
fiscal year ended August 31, 2017.
|
Table of Contents
|
Item
|
|
Page
|
|
|
Part I
|
|
|
1
|
Business
|
4
|
|
1A.
|
Risk Factors
|
20
|
|
1B.
|
Unresolved Staff Comments
|
28
|
|
2
|
Properties
|
28
|
|
3
|
Legal Proceedings
|
28
|
|
4
|
Mine Safety Disclosures
|
28
|
|
|
Part II
|
|
|
5
|
Market for Registrant’s Common Equity, Related Stockholder
Matters and Issuer Purchases of Equity Securities
|
29
|
|
6
|
Selected Financial Data
|
31
|
|
7
|
Management’s Discussion and Analysis of Financial Condition
and Results of Operations
|
32
|
|
7A.
|
Quantitative and Qualitative Disclosures About Market
Risk
|
42
|
|
8
|
Consolidated Financial Statements and Supplementary
Data
|
43
|
|
9
|
Changes in and Disagreements with Accountants on Accounting and
Financial Disclosure
|
44
|
|
9A.
|
Controls and Procedures
|
44
|
|
9B.
|
Other Information
|
45
|
|
|
Part III
|
|
|
10
|
Directors, Executive Officers and Corporate Governance
|
45
|
|
11
|
Executive Compensation
|
45
|
|
12
|
Security Ownership of Certain Beneficial Owners and Management and
Related Stockholder Matters
|
45
|
|
13
|
Certain Relationships and Related Transactions and Director
Independence
|
46
|
|
14
|
Principal Accountant Fees and Services
|
46
|
|
|
Part IV
|
|
|
15
|
Exhibits and Financial Statement Schedules
|
47
|
|
16
|
Form 10-K Summary
|
47
|
|
|
Signatures
|
48
|
FORWARD-LOOKING STATEMENTS
Statements that are not historical facts contained in this Annual
Report on Form 10-K, or incorporated by reference into this Form
10-K, are
“forward-looking
statements” within the meaning of the Private Securities
Litigation Reform Act of 1995, Section 27A of the Securities
Act of 1933, as amended (the “Securities Act”), and
Section 21E of the Securities Exchange Act of 1934, as amended
(the “Exchange Act”).
The words “anticipate,”
“seek,” “project,” “future,”
“likely,” “believe,” “may,”
“should,” “could,” “will,”
“estimate,” “expect,” “plan,”
“intend” and similar expressions, as they relate to us,
are intended to identify forward-looking statements.
Forward-looking statements include statements relating to, among
other things:
●
factors
affecting demand for water;
●
our
competitive advantage;
●
plans
to develop additional water assets within the Denver
area;
●
future
water supply needs in Colorado and how such needs will be
met;
●
anticipated
increases in residential and commercial demand for water services
and competition for these services;
●
estimated
population increases in the Denver metropolitan area and the South
Platte River basin;
●
plans
for the use and development of our water assets and potential
delays;
●
plans
to provide water for drilling and hydraulic fracturing of oil and
gas wells;
●
changes
in oil and gas drilling activity on our property, on the Lowry
Range, or in the surrounding areas;
●
regional
cooperation among area water providers in the development of new
water supplies and water storage, transmission and distribution
systems as the most cost-effective way to expand and enhance
service capacities;
●
the
impact of individual housing and economic cycles on the number of
connections we can serve with our water;
●
increases
in future water tap fees;
●
negotiation
of payment terms for fees;
●
plans
for development of our Sky Ranch property;
●
the
number of units planned for the first phase of development at Sky
Ranch;
●
the
number of lots on which construction is expected to begin in the
current fiscal year;
●
capital
required and costs to develop the first phase of Sky
Ranch;
●
anticipated
revenues and margins from development of our Sky Ranch
property;
●
estimated time
period for build out of Sky Ranch and sufficiency of tap fees to
fund infrastructure costs;
●
the
impact of any downturn in the homebuilding and credit markets on
our business and financial condition;
●
the
sufficiency of our working capital and financing sources to fund
our operations;
●
estimated
supply capacity of our water assets;
●
need
for additional production capacity;
●
costs
and plans for treatment of water and wastewater;
●
plans
to use raw water, effluent water or reclaimed water for
agricultural and irrigation uses;
●
participation
in regional water projects, including “WISE” and the
timing and availability of water from WISE;
●
our
ability to assist Colorado “Front Range” water
providers in meeting current and future water needs;
●
timing
of and interpretation of Land Board royalties;
●
the
number of new water connections needed to recover the costs of our
water supplies;
●
the
adequacy of the provisions in the “Lease” for the Lowry
Range to cover present and future circumstances;
●
factors
that may impact labor and material costs;
●
loss
of key employees and hiring additional personnel for our
operations;
●
anticipated
timing and amount of, and sources of funding for (i) capital
expenditures to construct infrastructure and increase production
capacities, (ii) compliance with water, environmental and other
regulations, and (iii) operations including delivery and treatment
of water and wastewater;
●
the
ability of our deep water well enhancement tool and process to
increase efficiency of wells and our plans to market that product
to area water providers;
●
our
ability to reduce the amount of up-front construction costs for
water and wastewater systems;
1
●
ability
to generate working capital and market our water
assets;
●
plans
to sell certain farms;
●
service
life of constructed facilities;
●
use
of third parties to construct water and wastewater facilities and
Sky Ranch lot improvements;
●
plans
to utilize fixed-price contracts;
●
payment
of amounts due from the Rangeview District and the Sky Ranch
Districts;
●
estimated
property taxes;
●
utilization
of net operating losses;
●
capital
expenditures for investing in expenses and assets of the Rangeview
District;
●
the
impact of water quality, solid waste disposal and environmental
regulations on our financial condition and results of
operations;
●
environmental
clean-up at the Lowry Range by the U.S. Army Corps of
Engineers;
●
our
ability to comply with permit requirements and environmental
regulations and the cost of such compliance;
●
our
ability to meet customer demands in a sustainable and
environmentally friendly way;
●
the
recoverability of construction and acquisition costs from
rates;
●
our
belief that we are not a public utility under Colorado
law;
●
impairments
in carrying amounts of long-lived assets;
●
changes
in unrecognized tax positions;
●
plans
to retain earnings and not pay dividends;
●
forfeitures
of option grants, vesting of non-vested options and the fair value
of option awards;
●
the
effectiveness of our disclosure controls and procedures and our
internal controls over financial reporting;
●
accounting
estimates and the impact of new accounting
pronouncements;
●
future
fluctuations in the price and trading volume of our common stock;
and
●
timing
of the filing of our proxy statement.
Forward-looking statements reflect our current views with respect
to future events and are subject to certain risks, uncertainties
and assumptions.
We cannot assure you
that any of our expectations will be realized.
Our actual results could differ materially from
those in such statements. Factors that could cause actual results
to differ from those contemplated by such forward-looking
statements include, without limitation:
●
the
timing of new home construction and other development in the areas
where we may sell our water, which in turn may be impacted by
credit availability;
●
population
growth;
●
changes
in employment levels, job and personal income growth and household
debt-to-income levels;
●
changes
in consumer confidence generally and confidence of potential
homebuyers in particular;
●
the
ability of existing homeowners to sell their existing homes at
prices that are acceptable to them;
●
changes
in the supply of available new or existing homes and other housing
alternatives, such as apartments and other residential rental
property;
●
timing
of oil and gas development in the areas where we sell our
water;
●
general
economic conditions;
●
the
market price of water;
●
the
market price of oil and gas;
●
changes
in customer consumption patterns;
●
changes
in applicable statutory and regulatory requirements;
●
changes
in governmental policies and procedures, including with respect to
land use, environmental and tax matters;
●
changes
in interest rates;
●
private
and federal mortgage financing programs and lending
practices;
●
uncertainties
in the estimation of water available under decrees;
●
uncertainties
in the estimation of costs of delivery of water and treatment of
wastewater;
●
uncertainties
in the estimation of the service life of our systems;
●
uncertainties
in the estimation of costs of construction projects;
2
●
the
strength and financial resources of our competitors;
●
our
ability to find and retain skilled personnel;
●
climatic
and weather conditions, including floods, droughts and freezing
conditions;
●
labor
relations;
●
turnover
of elected and appointed officials and delays caused by political
concerns and government procedures;
●
availability
and cost of labor, material and equipment;
●
delays
in anticipated permit and construction dates;
●
engineering
and geological problems;
●
environmental
risks and regulations;
●
our
ability to raise capital;
●
our
ability to negotiate contracts with new customers;
●
uncertainties
in water court rulings; and
●
the
factors described under “Risk Factors” in this Annual
Report on Form 10-K.
We undertake no obligation, and disclaim any obligation, to
publicly update or revise any forward-looking statements, whether
as a result of new information, future events or otherwise. All
forward-looking statements are expressly qualified by this
cautionary statement.
Glossary of terms
The following terms are commonly used in the water industry and are
used throughout our annual report:
●
Acre
Foot – approximately 326,000 gallons of water, or enough
water to cover an acre of ground with one foot of water. For some
instances herein, as context dictates, the term acre feet is used
to designate an annual decreed amount of water available during a
typical year.
●
Customer
Facilities – facilities that carry potable water and
reclaimed water to customers from the retail water distribution
system (see “Retail Facilities” below) and collect
wastewater from customers and transfer it to the retail wastewater
collection system. Water and wastewater service lines, interior
plumbing, meters and other components are typical examples of
Customer Facilities. In many cases, portions of the Customer
Facilities are constructed by the developer. Customer Facilities
are typically owned and maintained by the customer.
●
Non-Tributary
Groundwater – groundwater located outside the boundaries
of any designated groundwater basins in existence on January 1,
1985, the withdrawal of which will not, within one hundred years of
continuous withdrawal, deplete the flow of a natural stream at an
annual rate greater than one-tenth of one percent of the annual
rate of withdrawal.
●
Not
Non-Tributary Groundwater – statutorily defined as
groundwater located within those portions of the Dawson, Denver,
Arapahoe, and Laramie Fox-Hill aquifers outside of designated
basins that does not meet the definition of
“non-tributary.”
●
Retail
Facilities – facilities that distribute water to and
collect wastewater from an individual subdivision or community.
Developers are typically responsible for the funding and
construction of Retail Facilities. Once we certify that the Retail
Facilities have been constructed in accordance with our design
criteria, the developer dedicates the Retail Facilities to a
quasi-municipal political subdivision of the state, and we operate
and maintain the facilities on behalf of such political
subdivision.
●
Section –
a parcel of land equal to one square mile and containing 640
acres.
3
●
SFE
– a single family equivalent unit. One SFE is a
customer – whether residential, commercial or
industrial – that imparts a demand on our water or
wastewater systems similar to the demand of a family of four
persons living in a single family house on a standard sized lot.
One SFE is assumed to have a water demand of approximately 0.4 acre
feet per year and to contribute wastewater flows of approximately
300 gallons per day.
●
Special
Facilities – facilities that are required to extend
services to an individual development and are not otherwise
classified as a typical “Wholesale Facility” or
“Retail Facility.” Temporary infrastructure required
prior to construction of permanent water and wastewater systems or
transmission pipelines to transfer water from one location to
another are examples of Special Facilities. We typically design and
construct the Special Facilities using funds provided by the
developer in addition to the normal rates, fees and charges that we
collect from our customers. We are typically responsible for the
operation and maintenance of the Special Facilities upon
completion.
●
Tributary
Groundwater – all water located in an aquifer that is
hydrologically connected to a natural stream such that depletion
has an impact on the surface stream.
●
Tributary
Surface Water – water on the surface of the ground flowing in
a stream or river system.
●
Wholesale
Facilities – facilities that serve an entire service
area or major regions or portions thereof. Wells, treatment plants,
pump stations, tanks, reservoirs, transmission pipelines, and major
sewage lift stations are typical examples of Wholesale Facilities.
We own, design, construct, operate, maintain and repair Wholesale
Facilities which are typically funded using rates, fees and charges
that we collect from our customers.
Pure Cycle Corporation, a Colorado corporation (“we,”
“us” or “our”), is a vertically integrated
water company that:
●
provides
wholesale water and wastewater services;
●
designs,
constructs, operates and maintains water and wastewater
systems;
●
supplies
untreated water for hydraulic fracturing and other
commercial/industrial uses; and
●
is
developing a master planned residential community as part of our
plan to monetize our water assets.
As a vertically integrated water company, we own or control
substantially all assets necessary to provide wholesale water and
wastewater services to our customers. We own or control the water
rights that we use to provide domestic and irrigation water to our
wholesale customers (including surface water, groundwater,
reclaimed water rights and water storage rights). We own the
infrastructure required to (i) withdraw, treat, store and deliver
water (such as wells, diversion structures, pipelines, reservoirs
and treatment facilities); (ii) collect, treat, store and reuse
wastewater; and (iii) treat and deliver reclaimed water for
irrigation use. We are principally targeting the “I-70
corridor,” a largely undeveloped area located east of
downtown Denver and south of Denver International Airport along
Interstate 70, as we expect the I-70 corridor to experience
substantial growth over the next 30 years.
We provide wholesale water and wastewater services predominantly to
two local governmental entities that in turn provide residential
and commercial water and wastewater services to communities along
the eastern slope of Colorado in the area referred to as the
“Front Range,” extending essentially from Fort Collins
on the north to Colorado Springs on the south. Our largest customer
is the Rangeview Metropolitan District (the “Rangeview
District”), which is a quasi-municipal political subdivision
of the State of Colorado. We have the exclusive right to provide
wholesale water and wastewater services to the Rangeview District
and its end-use customers pursuant to the “Rangeview Water
Agreements” and the “Off-Lowry Service Agreement”
(each defined below). Through the Rangeview District, we currently
provide wholesale service to 391 SFE water connections and 157 SFE
wastewater connections located in the Rangeview District’s
service area of southeastern metropolitan Denver in an area called
the Lowry Range and other nearby areas where we have acquired
service rights.
We supply untreated water to industrial customers for various
purposes and to oil and gas companies for hydraulic fracturing on
properties located within or adjacent to our service areas. Oil and
gas operators have leased more than 135,000 acres within and
adjacent to our service areas to explore and develop oil and gas
interests in the oil-rich Niobrara and other formations. We have
capitalized on the need for significant water supplies for
hydraulic fracturing in proximity to our existing water supplies
and infrastructure.
4
In addition to our water and wastewater operations we are
developing 931 acres of land we own along Denver’s I-70
corridor as a master planned community known as Sky Ranch. In June
2017, we entered into agreements to sell a total of 506 residential
lots at Sky Ranch to three national home builders. Pursuant to
agreements with the Rangeview District, we are the exclusive
provider of wholesale water and wastewater services to the future
residents of Sky Ranch
.
Pure Cycle Corporation was incorporated in Delaware in 1976 and
reincorporated in Colorado in 2008. Unless otherwise specified or
the context otherwise requires, all references to “we,”
“us,” or “our” are to Pure Cycle
Corporation and its subsidiaries on a consolidated basis. Pure
Cycle’s common stock trades on The NASDAQ Stock Market under
the ticker symbol “PCYO.”
5
Our Water and Land Assets
This section should be read in conjunction with
Item 1A – Risk
Factors, Item 7 – Management’s Discussion and
Analysis of Financial Condition and Results of
Operations – Critical Accounting Policies and Use of
Estimates
, and Note 4
–
Water and Land
Assets
.
The $34.6 million of capitalized water costs on our balance sheet
represents the costs of the water rights we own or have the
exclusive right to use and the related infrastructure developed to
provide wholesale water and wastewater services. Our water assets
are as follows:
|
Table A - Water Assets
|
|
|
Water Source
|
Groundwater (acre feet)
|
|
Lowry
(Rangeview Water Supply)
|
|
|
Export (1)
|
11,650
|
|
Non-Export (1)
|
12,035
|
|
Fairgrounds
|
321
|
|
Sky
Ranch
|
828
|
|
|
24,834
|
|
|
|
|
|
Surface Water (acre feet)
|
|
Lowry
(1)
|
3,300
|
|
WISE
|
500
|
|
|
3,800
|
|
|
|
|
Total
(Groundwater and Surface Water)
|
28,634
|
|
|
|
|
(1)
The combined Lowry water rights are 26,985 acre feet.
|
|
We believe we can serve approximately 60,000 SFEs.
Our service areas and water and land assets are described in
greater detail in the maps and discussion that follow:
6
The map below indicates the location
of our Denver area assets.
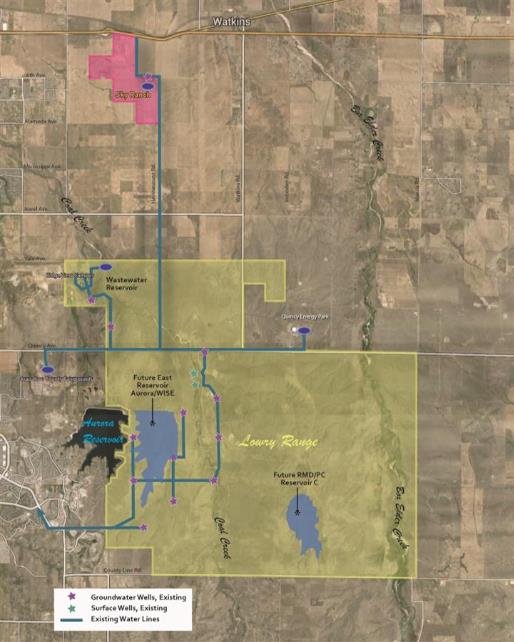
7
Rangeview Water Supply and the Lowry Range
Our Rangeview Water –
We
own or control a total of approximately 3,300 acre feet of
tributary surface water, 23,685 acre feet of non-tributary and not
non-tributary groundwater rights, and approximately 26,000 acre
feet of adjudicated reservoir sites that we refer to as our
“Rangeview Water Supply.” This water is located in the
southeast Denver metropolitan area at the “Lowry
Range,” which is owned by the State Board of Land
Commissioners (the “Land Board”) and is described
below.
Rangeview Water Agreements –
We acquired our Rangeview Water Supply in April
1996 pursuant to the following agreements:
(i)
The
1996 Amended and Restated Lease Agreement between the Land Board
and the Rangeview District, which was superseded by the 2014
Amended and Restated Lease Agreement, dated July 10, 2014 (the
“Lease”), among the Land Board, the Rangeview District
and us;
(ii)
The
Agreement for Sale of non-tributary and not non-tributary
groundwater which we can “export” from the Lowry Range
to supply water to nearby communities (this portion of the
Rangeview Water Supply is referred to as our “Export
Water”) between us and the Rangeview District (the
“Export Agreement”); and
(iii)
The
1996 Service Agreement between us and the Rangeview District for
the provision of water service to the Rangeview District’s
customers located on the Lowry Range, which was superseded by the
Amended and Restated Service Agreement, dated July 11, 2014 (the
“Lowry Service Agreement”), between us and the
Rangeview District.
Additionally, in 1997 we entered into a Wastewater Service
Agreement (the “Lowry Wastewater Agreement”) with the
Rangeview District to provide wastewater service to the Rangeview
District’s customers on the Lowry Range.
The Lease, the Export Agreement, the Lowry Service Agreement the
Lowry Wastewater Agreement, are collectively referred to as the
“Rangeview Water Agreements.”
Pursuant to the Rangeview Water Agreements, we design, construct,
operate and maintain the Rangeview District’s water and
wastewater systems to allow the Rangeview District to provide water
and wastewater service to its customers located within the
Rangeview District’s service area at the Lowry
Range.
Subject
to the terms and conditions of the Lease, we are the exclusive
water and wastewater provider on the Lowry Range, and we operate
both the water and the wastewater systems during our contract
period on behalf of the Rangeview District, which owns the
facilities for both systems. At the expiration of our contract term
in 2081, ownership of the water system facilities located on the
Lowry Range used to deliver Non-Export Water to customers will
revert to the Land Board, with the Rangeview District retaining
ownership of the wastewater facilities. Through facilities we own,
we use our Export Water, and we intend to use other supplies owned
by us, to provide wholesale water service and wastewater service to
customers located outside of the Lowry Range, including customers
of the Rangeview District and other governmental entities and
industrial and commercial customers.
Of the approximately 26,985 acre feet of water comprising our
Rangeview Water Supply, we own 11,650 acre feet of Export Water,
which consists of 10,000 acre feet of groundwater and 1,650 acre
feet of average yield surface water, pending completion by the Land
Board of documentation related to the exercise of our right to
substitute 1,650 acre feet of our groundwater for a comparable
amount of surface water. Additionally, assuming the completion of
the substitution of groundwater for surface water, we hold the
exclusive right to develop and deliver through the year 2081 the
remaining 13,685 acre feet of groundwater and approximately 1,650
acre feet of average yield surface water to customers either on or
off of the Lowry Range. The Rangeview Water Agreements also grant
us the right to use surface reservoir capacity to provide water
service to customers both on and off the Lowry Range.
The Lowry Range Property
– The Lowry Range is located in
unincorporated Arapahoe County, about 20 miles southeast of
downtown Denver. The Lowry Range is one of the largest contiguous
parcels under single ownership next to a major metropolitan area in
the United States. The Lowry Range is approximately 27,000 acres in
size or about 40 square miles of land. Of the 27,000 acres,
pursuant to our agreements with the Land Board and the Rangeview
District, we have the exclusive rights to provide water and
wastewater services to approximately 24,000 acres of the Lowry
Range.
8
Rangeview Metropolitan District –
The Rangeview District is a quasi-municipal
corporation and political subdivision of Colorado formed in 1986
for the purpose of providing water and wastewater service to the
Lowry Range and other approved areas. The Rangeview District is
governed by an elected board of directors. Eligible voters and
persons eligible to serve as directors of the Rangeview District
must own an interest in property within the boundaries of the
Rangeview District. We own certain rights and real property
interests which encompass the current boundaries of the Rangeview
District. The current directors of the Rangeview District are Mark
W. Harding, Scott E. Lehman, and James Ewing (all are employees of
Pure Cycle), and two independent board members. Pursuant to
Colorado law, directors may receive $100 for each board meeting
they attend, up to a maximum of $1,600 per year. Mr. Harding, Mr.
Lehman, and Mr. Ewing have all elected to forego these
payments
.
South Metropolitan Water Supply Authority (“SMWSA”) and
Water Infrastructure Supply Efficiency Partnership
(“WISE”) –
SMWSA is a municipal water authority in the State
of Colorado organized to pursue the acquisition and development of
new water supplies on behalf of its members, including the
Rangeview District. SMWSA members include 14 Denver area water
providers in Arapahoe and Douglas Counties. The Rangeview District
became a member of SMWSA in 2009 in an effort to participate with
other area water providers, in developing regional water supplies
along the Front Range. We entered into a Participation Agreement
with the Rangeview District on December 16, 2009, whereby we
agreed to provide funding to the Rangeview District in connection
with its membership in the SMWSA (the “SMWSA Participation
Agreement”). SMWSA members have been working with the City
and County of Denver acting through its Board of Water
Commissioners (“Denver Water”) and the City of Aurora
acting by and through its Utility Enterprise (“Aurora
Water”) on a cooperative water project known as the WISE,
which seeks to develop regional infrastructure that would
interconnect members’ water transmission systems to be able
to develop additional water supplies from the South Platte River in
conjunction with Denver Water and Aurora Water. In July 2013, the
Rangeview District together with nine other SMWSA members formed
the South Metro WISE Authority (“SMWA”) pursuant to the
South Metro WISE Authority Formation and Organizational
Intergovernmental Agreement (the “SM IGA”) to enable
its members to participate in WISE. The SM IGA specifies each
member’s pro rata share of WISE and the members’ rights
and obligations with respect to WISE. On December 31, 2013,
SMWA, Denver Water and Aurora Water entered into the Amended and
Restated WISE Partnership – Water Delivery Agreement (the
“WISE Partnership Agreement”), which provides for the
purchase and construction of certain infrastructure (pipelines,
water storage facilities, water treatment facilities, and other
appurtenant facilities) to deliver water to and among the 10
members of the SMWA, Denver Water and Aurora Water. We have entered
into the Rangeview/Pure Cycle WISE Project Financing and Service
Agreement with the Rangeview District dated November 19, 2014
(effective as of December 22, 2014), which obligates us to fund the
Rangeview District’s cost of participating in WISE (the
“WISE Financing Agreement”). In exchange for funding
the Rangeview District’s obligations in WISE, we will have
the sole right to use and reuse the Rangeview District’s
approximate 7% share of the WISE water and infrastructure to
provide water service to the Rangeview District’s customers
and to receive the revenue from such service. Upon completion of
the WISE infrastructure in 2017, we will be entitled to
approximately three million gallons per day of transmission
pipeline capacity and 500 acre feet per year of water.
In
accordance with the WISE Financing Agreement and the SMWSA
Participation Agreement, to date we have provided approximately
$3.1 million of financing to the Rangeview District to fund its
obligation to finance the purchase of infrastructure for WISE, its
obligations related to SMWSA, and the construction of a connection
to the WISE system.
We
anticipate that we will be spending the following over the next
five fiscal years to fund the Rangeview District’s purchase
of its share of the water transmission line and additional
facilities, water and related assets for WISE and to fund
operations and water deliveries related to
WISE:
|
Table B
- Estimated WISE Costs
|
|||||
|
|
For the
Fiscal Years Ended August 31,
|
||||
|
|
2018
|
2019
|
2020
|
2021
|
2022
|
|
Subscription
(Operations)
|
$
51,800
|
$
51,800
|
$
51,800
|
$
51,800
|
$
51,800
|
|
Water
Deliveries
|
232,000
|
348,000
|
493,000
|
738,000
|
897,000
|
|
Capital
(Infrastructure)
|
338,100
|
1,555,400
|
74,200
|
-
|
-
|
|
Other
|
23,600
|
86,600
|
23,600
|
68,300
|
83,200
|
|
|
$
645,500
|
$
2,041,800
|
$
642,600
|
$
858,100
|
$
1,032,000
|
9
Land Board Royalties –
Pursuant to the Rangeview Water Agreements, the
Land Board is entitled to royalty payments based on a percentage of
revenues earned from water sales that utilize water from the
Rangeview Water Supply. The calculation of royalties depends on the
water source, whether the customer is a public or private entity,
and the location of the customer. Royalties were modified in July
2014 pursuant to the terms of the Lease. The Land Board does not
receive a royalty from wastewater services.
Water Customers
–
When we develop, operate and deliver
water service utilizing water from our Rangeview Water Supply,
payments from customers generate royalties to the Land Board at a
rate of 12% of gross revenues from private customers and customers
on the Lowry Range and 10% from public entity customers. In the
event that either (i) metered production of water used on the Lowry
Range in any calendar year exceeds 13,000 acre feet or (ii) 10,000
surface acres on the Lowry Range have been rezoned to
non-agricultural use, finally platted and water tap agreements have
been entered into with respect to all improvements to be
constructed on such acreage, the Land Board may elect, at its
option, to receive, in lieu of its royalty of 12% of gross
revenues, 50% of the collective net profits (ours and the Rangeview
District’s) derived from the sale or other disposition of
water on the Lowry Range. To date neither of these conditions has
been met, and such conditions are not likely to be met any time
soon. In addition to royalties on the sale of metered water
deliveries, the Land Board will receive a royalty on the sale of
water taps at the rate of two percent, except for the sale of any
taps to Sky Ranch, of the gross amount received from the sale of a
water tap.
Sale of Water
Rights
–
In the event we sell our Export Water
right outright rather than developing and delivering water service,
royalties to the Land Board escalate based on the amount of gross
revenue we receive and are lower for sales to a water district or
similar municipal or public entity than for sales to a private
entity as noted in Table C.
|
Table C - Royalties for Sale of Export Water Rights
|
||
|
|
Royalty
Rate
|
|
|
Gross Revenues
|
Private
Entity Buyer
|
Public
Entity Buyer
|
|
$
0 - $45,000,000
|
12
%
|
10
%
|
|
$
45,000,001 - $60,000,000
|
24
%
|
20
%
|
|
$
60,000,001 - $75,000,000
|
36
%
|
30
%
|
|
$
75,000,001 - $90,000,000
|
48
%
|
40
%
|
|
Over $90,000,000
|
50
%
|
50
%
|
We are also required to pay the Land Board a minimum annual water
production fee, which is currently under negotiation, but we have
estimated the minimum fee to be approximately $45,600 per year,
which is to be credited against future royalties.
East Cherry Creek Valley System –
Pursuant to a 1982 contractual right, the
Rangeview District may purchase water produced from East Cherry
Creek Valley Water and Sanitation District’s
(“ECCV”) Land Board system. ECCV’s Land Board
system is comprised of eight wells and more than 10 miles of buried
water pipeline located on the Lowry Range. In May 2012, in order to
increase the delivery capacity and reliability of these wells, in
our capacity as the Rangeview District’s service provider and
the Export Water Contractor (as defined in the Lease among us, the
Rangeview District and the Land Board), we entered into an
agreement to operate and maintain the ECCV facilities allowing us
to utilize the system to provide water to commercial and industrial
customers, including customers providing water for drilling and
hydraulic fracturing of oil and gas wells.
Our costs associated
with the use of the ECCV system are a flat monthly fee of $8,000
per month from January 1, 2013 through December 31, 2020, and will
decrease to $3,000 per month from January 1, 2021 through April
2032. Additionally, we pay a fee per 1,000 gallons of water
produced from ECCV’s system, which is included in the water
usage fees charged to customers.
10
|
Arapahoe County Fairgrounds Agreement for Water
Service
In 2005, we entered into an Agreement for Water Service (the
“County Agreement”) with Arapahoe County to design,
construct, operate and maintain a water system for, and provide
water services to, the county for use at the Arapahoe County
fairgrounds (the “Fairgrounds”), which are located west
of the Lowry Range. Pursuant to the County Agreement, we purchased
321 acre feet of water from the county in 2008. Further details of
the arrangements with the county are described in Note 4
–
Water and Land Assets
to the accompanying financial
statements.
Pursuant to the County Agreement, we constructed and own a deep
water well, a 500,000-gallon water tank and pipelines to transport
water to the Fairgrounds. The construction of these items was
completed in our fiscal 2006, and we began providing water service
to the county in 2006.
|
|
|
Water Sales for Fracking
We provide water for hydraulic fracturing (“fracking”)
of oil and gas wells being developed in the Niobrara Formation to
and around the Land Board’s Lowry Range property and our Sky
Ranch property. Oil and gas drilling in our area is affected by the
price of oil and can vary from year to year. Wells developed in the
Niobrara Formation utilize between 10 and 20 million gallons of
water to drill and frack, which equates to selling water to between
approximately 100 and 200 homes for an entire year.
Water revenues from sales of water for the construction of well
sites and for drilling and fracking wells drilled into the Niobrara
Formation were approximately $478,000 and $600 during the fiscal
years ended August 31, 2017 and 2016, respectively. With a large
percentage of the acreage surrounding the Lowry Range in Arapahoe,
Adams, Elbert, and portions of Douglas Counties already leased by
oil companies, we anticipate providing additional water for
drilling and fracking of oil and gas wells in the future.
Previously nearly all oil and gas development was attributable to
our largest fracking customer ConocoPhillips Company
(“ConocoPhillips”). However, in the past year there
have been two other oil and gas companies acquiring lease interests
in the area and each of these companies have drilled and fracked
wells. We anticipate continued development of oil and gas wells at
the Lowry Range, Sky Ranch and the surrounding area by multiple
operators.
Service to Customers Not on the Lowry Range
Since January 2017, we have had an agreement with the Rangeview
District to be the Rangeview District’s exclusive provider of
water and wastewater services to the Rangeview District’s
customers located outside of its Lowry Range service area. This
agreement was confirmed in the Export Service Agreement, dated June
16, 2017 (the “Off-Lowry Service Agreement”), between
us and the Rangeview District. Pursuant to the Off-Lowry Service
Agreement, we design, construct, operate and maintain the Rangeview
District’s water and wastewater systems and the systems of
other communities that have service contracts with the Rangeview
District to provide water and wastewater services to the Rangeview
District’s customers that are not on the Lowry Range
(currently, Wild Pointe Ranch and Sky Ranch). In exchange for
providing water and wastewater services to the Rangeview
District’s customers that are not on the Lowry Range, we
receive 100% of water and wastewater tap fees, 98% of the water
usage fees, and 90% of the monthly wastewater service fees and
wastewater usage fees received by the Rangeview District from its
customers that are not located on the Lowry Range, after deduction
of royalties due to the Land Board, if applicable. See Rangeview
Water Supply and Lowry Range –
Land Board Royalties
above. The water usage fees to be
collected for service at Sky Ranch are the only fees that would
currently be subject to the Land Board royalty.
Wild Pointe – Elbert & Highway 86 Commercial Metropolitan
District –
In 2017, we
entered into an agreement with the Rangeview District, which had
entered into an agreement with Elbert & Highway 86 Commercial
Metropolitan District (“Elbert 86 District”) to operate
and maintain a water system for residential and commercial
customers at the Wild Pointe development in Elbert County. The
water system includes two deep water wells, a pump station,
treatment facility, storage facility, over eight miles of
transmission lines, and approximately 457 acre feet of water rights
serving the development. We provided $1.6 million in funding to
acquire the exclusive rights to operate and maintain all the water
facilities in exchange for payment of the remaining residential and
commercial tap fees and annual water use fees. Service to Wild
Pointe is governed by the Off-Lowry Service
Agreement.
11
Sky Ranch Water and Wastewater Service –
As described in more detail below, we are
developing 931 acres of land we own as a master planned
community
known
as Sky Ranch. Pursuant to the Sky Ranch Water and Wastewater
Service Agreement, dated June 19, 2017 (the “Sky Ranch
Service Agreement”), between PCY Holdings, LLC, our wholly
owned subsidiary and the owner of the Sky Ranch property
(“PCY Holdings”), and the Rangeview District, PCY
Holdings agreed to construct certain facilities necessary to
provide water and wastewater service to Sky Ranch, and the
Rangeview District agreed to provide water and wastewater services
for the Sky Ranch development. Pursuant to the Off-Lowry Service
Agreement, we are the exclusive provider of water and wastewater
services to future residents of the Sky Ranch
development.
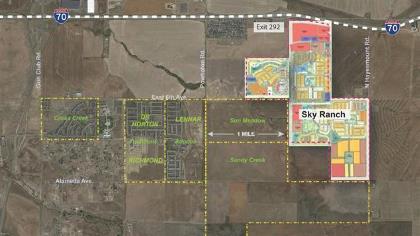
Sky Ranch Development
In 2010, we purchased approximately 931 acres of undeveloped land
located in unincorporated Arapahoe County known as Sky Ranch. Sky
Ranch is located directly adjacent to I-70, 16 miles east of
downtown Denver, four miles north of the Lowry Range, and four
miles south of Denver International Airport.
The property includes rights to approximately 830 acre feet of
water and approximately 640 acres of oil and gas mineral rights and
has been zoned for residential, commercial and retail uses that may
include up to 4,850 SFEs. Sky Ranch is zoned for 4,400 homes and
1.35 million square feet of commercial and retail property. We
currently lease the land to an area farmer on a year to year basis.
We have leased the minerals underlying the land to a major
independent exploration and production company. We have been
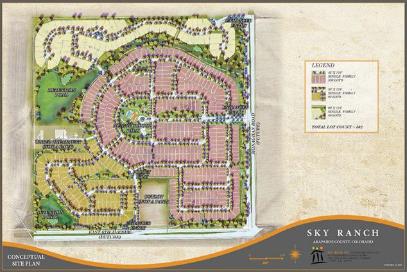
engaged in the design, permitting, engineering and development of
Sky Ranch to develop residential lots for entry-level housing
(houses costing in the $300,000 range). We plan to develop the
first phase of Sky Ranch, which will include 151 acres and 506
detached single family lots. We anticipate beginning construction
of an initial 200 lots in fiscal 2018 pursuant to the Purchase and
Sale Contracts described below.
12
In June
2017, we entered into purchase and sale agreements (collectively,
the “Purchase and Sale Contracts”) with three separate
home builders pursuant to which we agreed to sell, and each builder
agreed to purchase, a certain number (totaling 506) of
single-family, detached residential lots at the Sky Ranch property.
We will be developing finished lots for each of the three home
builders (which are lots on which homes are ready to be built that
include roads, curbs, wet and dry utilities, storm drains and other
improvements). Each builder is required to purchase water and sewer
taps for the lots from the Rangeview District, the cost of which
depends on the size of the lot, the size of the house, and the
amount of irrigated turf. Pursuant to the
Off-Lowry Service Agreement,
we will receive all of the
water tap
fees and wastewater tap fees and 90% of the monthly service fees
and usage fees for wastewater services received
by the
Rangeview District from customers at Sky Ranch. We will also
receive
98% of the usage fees for
water services received by the Rangeview District from customers at
Sky Ranch, after deduction, in most instances, of the royalty to
the Land Board related to the use of the Rangeview Water
Supply.
The
closing of the transactions contemplated by each Purchase and Sale
Contract is subject to customary closing conditions, including,
among others, the builder’s completion to its satisfaction of
a title review and other due diligence of the property, the
accuracy of the representations and warranties made by us in the
Purchase and Sale Contract, and a commitment by the title company
to issue to the builder a title policy, subject to certain
conditions. Within three business days of the execution of each
Purchase and Sale Contract, each builder paid an earnest money
deposit. Each builder had a 60-day due diligence period during
which it had the right to terminate the Purchase and Sale Contract
and receive a full refund of its earnest money deposit. The
initial due diligence period was extended; however, on
November 10, 2017, each builder completed its due diligence period
and agreed to continue with its respective Purchase and Sale
Contract. Pursuant to certain Purchase and Sale Contracts, the
builder is required to make an additional earnest money deposit or
deposits after the due diligence period and/or final approval of
the entitlements for the property. The earnest money deposit or
deposits will be applied to the payment of the purchase price of
the lots at closing in accordance with a specified takedown
schedule or be paid to us in the event of certain defaults by a
builder. Pursuant to each Purchase and Sale Contract, we must
obtain final approval of the entitlements for the property by
August 2018 (which date we may extend by six
months).
13
We are obligated pursuant to the Purchase and Sale Contracts, or
separate Lot Development Agreements (the “Lot Development
Agreements” and, together with the Purchase and Sale
Contracts, the “Builder Contracts”), to construct
infrastructure and other improvements, such as roads, curbs and
gutters, park amenities, sidewalks, street and traffic signs, water
and sanitary sewer mains and stubs, storm water management
facilities, and lot grading improvements for delivery of finished
lots to each builder. Pursuant to the Builder Contracts, we must
cause the Rangeview District to install and construct off-site
infrastructure improvements (
i.e.
, drainage and storm water retention ponds, a
wastewater reclamation facility, and wholesale water facilities)
for the provision of water and wastewater service to the property.
In conjunction with our approvals with Arapahoe County for the Sky
Ranch project, we and/or the Rangeview District and the Sky Ranch
Districts are obligated to deposit into an account the anticipated
costs to install and construct substantially all the off-site
infrastructure improvements (which include drainage, wholesale
water and wastewater, and entry roadway), which we estimate will be
approximately $10.2 million.
We estimate the total capital required to develop lots in the first
phase (506 lots) of Sky Ranch is approximately $27.8 million, and
estimate lots sales to home builders to generate $35 million
providing a margin on lots of approximately $7.2 million. Utility
revenues are derived from tap fees (which vary depending on lot
size, house size, and amount of irrigated turf) and usage fees
(which are monthly water and wastewater fees). Our current Sky
Ranch water tap fees are $26,650 (per SFE), and wastewater taps
fees are $4,659 (per SFE).
Sky Ranch Metropolitan District No. 1, 3, 4, and 5 –
The Sky Ranch Metropolitan District
Nos. 1, 3, 4 and 5 are quasi-municipal corporations and
political subdivisions of Colorado formed in 2004 for the purpose
of providing service to the approximately 930 acres of the Sky
Ranch property (the “Sky Ranch Districts”). The Sky
Ranch Districts are governed by an elected board of directors.
Eligible voters and persons eligible to serve as directors of the
Sky Ranch Districts must own an interest in property within the
boundaries of the district. We own certain rights and real property
interests which encompass the current boundaries of the districts.
The current directors of the districts are Mark W. Harding, Scott
E. Lehman, and James Ewing (all are employees of Pure Cycle), and
two independent board members. Pursuant to Colorado law, directors
may receive $100 for each board meeting they attend, up to a
maximum of $1,600 per year. Mr. Harding, Mr. Lehman, and Mr. Ewing
have all elected to forego these payments.

|
|
Oil and Gas Leases
In 2011, we entered into a three year Oil and Gas Lease (the
“O&G Lease”) and Surface Use and Damage Agreement
(the “Surface Use Agreement”) and received an up-front
payment of $1,243,400 ($1,900 per mineral acre), and a 20% of gross
proceeds royalty (less certain taxes) from the sale of any oil and
gas produced from the approximately 634 acres of mineral estate we
own at Sky Ranch. In 2014 the O&G Lease was extended for an
additional two (2) years, and we received an additional up-front
payment of $1,243,400 for the extension. The O&G Lease is now
held by production and we have been receiving royalties from the
oil and gas production from two wells drilled within our mineral
interest. During the fiscal year ended August 31, 2017, we received
$186,600 in royalties attributable to these two wells.
In 2015, we received an up-front payment of $72,000, pursuant to a
lease (which expired in fiscal 2017) for the purpose of exploring
for, developing, producing, and marketing oil and gas of 40 acres
of mineral estate we own adjacent to the Lowry Range (the
“Rangeview Lease”). In September 2017, we entered into
a three-year Paid-Up Oil and Gas Lease with Bison Oil and Gas, LLP
(the “Bison Lease”), for this 40-acre mineral estate,
and we received an up-front payment of
$167,200.
|
Arkansas
River Land and Minerals
We own three farms totaling 700 acres in the Arkansas River Valley.
The farms were acquired in order to correct dry-up covenant issues
related to water only farms and we currently lease all three farms
for dry land grazing. We intend to sell the farms in due course and
have classified the farms as long term investments. We also own
approximately 13,900 acres of mineral interests in the Arkansas
River Valley, which have an estimated value of approximately $1.4
million. We currently have no plans to sell our mineral
interests.
14
Well Enhancement and Recovery Systems
In 2007, we, along with two other parties, formed Well Enhancement
and Recovery Systems LLC (“Well Enhancement LLC”), to
develop a new deep water well enhancement tool and process that we
believe will increase the efficiency of wells completed into the
Denver Basin groundwater formations. According to results from
studies performed by an independent hydro-geologist, the well
enhancement tool effectively increased the production of the two
test wells by 80% and 83% when compared to that of nearby wells
developed in similar formations at similar depths. Based on the
positive results of the test wells, we continue to refine the
process of enhancing deep water wells and are marketing the tool to
area water providers. We currently hold a 50% interest in Well
Enhancement LLC. We have not drilled any new wells in the past
three years and have not used the tool during this period, but we
intend to continue to use the tool when we drill new water
wells.
Revenues
We generate revenues through our wholesale water and wastewater
operations predominately from three sources: (i) monthly
service and contract delivery fees, (ii) one-time water and
wastewater tap fees and construction fees, and (iii) consulting
fees. Our revenue sources and how we account for them are described
in greater detail below. We typically negotiate the payment terms
for tap fees, construction fees, and other water and wastewater
service fees with our wholesale customers as a component of our
service agreements prior to construction of the project. However,
with respect to customers on the Lowry Range, pursuant to the
Lease, the Rangeview District’s rates and charges to such
end-use customers may not exceed the average of similar rates and
charges of three nearby water providers.
i)
Monthly Service
Fees
–
Monthly wholesale water usage fees are
assessed to our customers based on actual metered deliveries to
their end-use customers each month. Water usage fees are based on a
tiered pricing structure that provides for higher prices as
customers use greater amounts of water. The water usage fees for
end-use customers on the Lowry Range are noted below in Table
D:
|
Table D - Lowry Range Tiered Water Usage Pricing
Structure
|
|||
|
|
Price
($ per thousand gallons)
|
||
|
Base
charge per SFE
|
$
32.27
|
$
30.35
|
$
30.35
|
|
0
gallons to 10,000 gallons
|
$
3.91
|
$
3.51
|
$
3.51
|
|
10,001
gallons to 20,000 gallons
|
$
5.14
|
$
5.31
|
$
5.31
|
|
20,001
gallons to 40,000 gallons
|
$
8.08
|
$
8.12
|
$
8.12
|
|
40,001
gallons and above
|
$
9.87
|
$
9.55
|
$
9.55
|
The figures in Table D reflect the amounts charged
to the Rangeview District’s end-use customers on the Lowry
Range. In exchange for providing water service to the Rangeview
District’s Lowry Range customers, we receive 98% of the usage
charges received by the Rangeview District relating to water
services after deducting the required royalty to the Land Board
(described above at Rangeview Water Supply and Lowry Range
–
Land Board
Royalties
). The amounts charged
by the Rangeview District to its end-use customers off the Lowry
Range are determined pursuant to the Rangeview District’s
service agreements with such customers and such rates may vary. In
exchange for providing water service to the Rangeview
District’s customers off the Lowry Range, we receive 98% of
the usage charges received by the Rangeview District relating to
water services after deducting any required royalty to the Land
Board. The royalty to the Land Board is required for water service
provided utilizing our Rangeview Water Supply, which includes most
of our current customers except those at Wild Pointe. In exchange
for providing wastewater services, we receive 90% of the Rangeview
District’s monthly wastewater service and usage fees, as well
as the right to use or sell the reclaimed
water.
In
addition to the tiered water usage pricing structure, we currently
charge a hydrant rate of $10.50 per thousand gallons for commercial
and industrial customers. We also collect other immaterial fees and
charges from customers and other users to cover miscellaneous
administrative and service expenses, such as application fees,
review fees and permit fees.
15
ii)
Water and Wastewater
Tap Fees and Construction Fees
–
Tap
fees are typically paid by developers in advance of construction
activities and are non-refundable. Tap fees are typically used to
fund construction of the Wholesale Facilities and defray the
acquisition costs of obtaining water rights and operating
facilities.
The
Rangeview District’s 2017 water tap fees are $24,974, and its
wastewater tap fees are $4,659.
In
exchange for providing water service to the Rangeview
District’s customers on the Lowry Range, we receive 100% of
the Rangeview District’s tap fees after deducting the two
percent royalty to the Land Board described above. In exchange for
providing water service to the Rangeview District’s customers
off the Lowry Range, we currently receive 100% of the Rangeview
District’s tap fees. If water taps are sold to customers not
located on the Lowry Range that are to be serviced utilizing the
Rangeview Water Supply (other than taps to Sky Ranch, which are
exempt), the two percent royalty to the Land Board would be
deducted from the amount we receive. In exchange for providing
wastewater services, whether to customers on or off the Lowry
Range, we receive 100% of the Rangeview District’s wastewater
tap fees.
Construction
fees are fees we receive, typically in advance, from developers for
us to build certain infrastructure such as Special Facilities which
are normally the responsibility of the developer.
iii)
Consulting Fees
– Consulting fees are fees we
receive, typically on a monthly basis, from municipalities and area
water providers along the I-70 corridor, for systems with respect
to which we provide contract operations
services.
Significant Customers
Our wholesale water and wastewater sales to the Rangeview District
pursuant to the Rangeview Water Agreements accounted for 26%, 67%
and 19% of our total water revenues for the fiscal years ended
August 31, 2017, 2016 and 2015, respectively. The Rangeview
District has one significant customer, the Ridgeview Youth Services
Center (“Ridgeview”). Pursuant to our Rangeview Water
Agreements with the Rangeview District, we are providing water to
Ridgeview on behalf of the Rangeview District. Ridgeview accounted
for 21%, 55% and 16% of our total water revenues for the fiscal
years ended August 31, 2017, 2016 and 2015,
respectively.
Our industrial water sales (i) directly and indirectly to
ConocoPhillips accounted for approximately 30%,
less
than
1% and 75% and (ii) to Bison Oil and Gas accounted
for approximately 25%, nil, and nil, of our total water revenues
for the fiscal years ended August 31, 2017, 2016 and 2015,
respectively.
Our Projected Operations
This section should be read in conjunction with
Item 1A – Risk
Factors
.
Along the Colorado Front Range, there are over 70 water providers
with varying needs for replacement and new water supplies. We
believe we are well positioned to assist certain of these providers
in meeting their current and future water needs.
We design, construct and operate our water and wastewater
facilities using advanced water purification and wastewater
treatment technologies which allow us to use our water supplies in
an efficient and environmentally sustainable manner. We plan to
develop our water and wastewater systems in stages to efficiently
meet demands in our service areas, thereby reducing the amount of
up-front capital costs required for construction of facilities. We
use third-party contractors to construct our facilities as needed.
We employ licensed water and wastewater operators to operate our
water and wastewater systems. As our systems expand, we expect to
hire additional personnel to operate our systems, which include
water production, treatment, testing, storage, distribution,
metering, billing, and operations management.
Our water and wastewater systems conjunctively use surface and
groundwater supplies and storage of raw water and highly treated
effluent supplies to provide a balanced sustainable water supply
for our wholesale customers and their end-use customers.
Integrating conservation practices and incentives together with
effective water reuse demonstrates our commitment to providing
environmentally responsible, sustainable water and wastewater
services. Water supplies and water storage reservoirs are
competitively sought throughout the west and along the Front Range
of Colorado. We believe regional cooperation among area water
providers in developing new water supplies, water storage, and
transmission and distribution systems provides the most cost
effective way of expanding and enhancing service capacities for
area water providers. We continue to discuss developing water
supplies and water storage opportunities with area water
providers.
16
We expect the development of our Rangeview Water Supply to require
a significant number of high capacity deep water wells. We
anticipate drilling separate wells into each of the three principal
aquifers located beneath the Lowry Range. Each well is intended to
deliver water to central water treatment facilities for treatment
prior to delivery to customers. Development of our Lowry Range
surface water supplies will require facilities to divert surface
water to storage reservoirs to be located on the Lowry Range and
treatment facilities to treat the water prior to introduction into
our distribution systems. Surface water diversion facilities will
be designed with capacities to divert the surface water when
available (particularly during seasonal events such as spring
run-off and summer storms) for storage in reservoirs to be
constructed on the Lowry Range. Based on preliminary engineering
estimates, the full build-out of water facilities (including
diversion structures, transmission pipelines, reservoirs, and water
treatment facilities) on the Lowry Range will cost in excess of
$412 million, based on estimated costs, and will accommodate water
service to customers located on and outside the Lowry Range. We
expect this build out to occur in phases over an extended period of
at least 50 years, and we expect that tap fees will be sufficient
to fund the infrastructure costs.
Our Denver-based supplies are a valuable, locally available
resource located near the point of use. This enables us to
incrementally develop infrastructure to produce, treat and deliver
water to customers based on their growing demands.
During fiscal 2017, we invested approximately $4.5 million to
construct pipelines that interconnect the Rangeview District, WISE,
and Sky Ranch water systems. We expect to continue to invest in
pipelines at the Sky Ranch property in anticipation of the first
phase of development. We also expect to add additional wells as
demand for water grows.
The Rangeview District is a participant in the WISE project. This
project is developing infrastructure to interconnect
providers’ water systems and to extend renewable water
sources owned by Denver Water and Aurora Water to participating
South Metro water providers, including the Rangeview District and,
through our agreements with the Rangeview District, us. This system
will diversify our sources of water and will enable providers to
move water among themselves, which will increase the reliability of
our and others’ water systems. Through the WISE Financing
Agreement, we funded the Rangeview District’s purchase of
certain rights to use existing water transmission and related
infrastructure acquired and constructed by the WISE project. We
invested approximately $198,200 in the WISE system during fiscal
2017 and have invested approximately $3.1 million to date. We
anticipate that we will be spending approximately $645,500 on this
system during fiscal 2018 and $4.6 million during the next four
years to fund the Rangeview District’s purchase of its share
of the water transmission line and additional facilities, water and
related assets for WISE and to fund operations and water deliveries
related to WISE. Timing of the investment will vary depending on
the schedule of projects within WISE.
We are in the process of developing our Sky Ranch property,
including building finished lots for home builders and building the
water and wastewater infrastructure for housing and commercial
development of the property. We currently anticipate construction
starting on the first phase of development (506 lots) in early
2018, subject to obtaining approvals and the timing of the final
engineering designs. The timing for us to develop the remaining
phases of the property will be largely dependent on the Denver real
estate market and the interest we receive from home builders and
developers. During fiscal 2017, we invested approximately $902,600
in our Sky Ranch property, which consisted of planning, preliminary
and final engineering designs, grading, erosion, sediment control,
drainage design, water and wastewater facility designs, and
construction of approximately 10 miles of new transmission
lines.
We plan to develop additional water assets within the Denver area
and are exploring opportunities to utilize our water assets in
areas adjacent to our existing water supplies.
17
Water and Growth in Colorado
Colorado has experienced a robust housing market over the past 24
months. The key drivers to housing in the area are:
●
Housing
Starts
–
From September 2016 to September 2017, annual
housing starts increased by 6%. From September 2015 to September
2016, annual housing starts increased by 24%.
●
Unemployment
–
The unemployment rate
in Colorado was 2.4% at August 31, 2017, compared to a national
unemployment rate of 4.4%. Colorado added an estimated 118,200 jobs
from August 2016 to August 2017.
●
Population
–
The Denver Regional
Council of Governments (“DRCOG”), a voluntary
association of over 50 county and municipal governments in the
Denver metropolitan area, estimates that the Denver metropolitan
area population will increase by about 38% from today’s 3.4
million people to 4.7 million people by the year 2040. A Statewide
Water Supply Initiative report by the Colorado Water Conservation
Board estimates that the South Platte River basin, which includes
the Denver metropolitan region, will grow from a current population
of 3.9 million to 4.9 million by the year 2030, while the
state’s population will increase from 5.7 million to 7.2
million.
●
Demand
–
Approximately 70% of
the state’s projected population increase is anticipated to
occur within the South Platte River basin. Significant increases in
Colorado’s population, particularly in the Denver metro
region and other areas in the water-short South Platte River basin,
together with increasing agricultural, recreational, and
environmental water demands, will intensify competition for water
supplies. The estimated population increases are expected to result
in demands for water services in excess of the current capabilities
of municipal service providers, especially during drought
conditions.
●
Supply
–
The Statewide Water
Supply Initiative estimates that population growth in the Denver
region and the South Platte River basin could result in additional
water supply demands of over 400,000 acre feet by the year
2030.
●
Development
–
Colorado law requires
property developers to demonstrate that they have sufficient water
supplies for their proposed projects before rezoning applications
will be considered. These factors indicate that water and
availability of water will continue to be critical to growth
prospects for the region and the state, and that competition for
available sources of water will continue to intensify. We focus the
marketing of our water supplies and services to developers and home
builders that are active along the Colorado Front Range as well as
other area water providers in need of additional
supplies.
Colorado’s future water supply needs will be met through
conservation, reuse and the development of new supplies. The
Rangeview District’s rules and regulations for water and
wastewater service call for adherence to strict conservation
measures, including low-flow water fixtures, high efficiency
appliances, and advanced irrigation control devices. Additionally,
our systems are designed and constructed using a dual-pipe water
distribution system to segregate the delivery of high quality
potable drinking water to our local governmental entities and their
end-use customers through one system and a second system to supply
raw or reclaimed water for irrigation demands. About one-half of
the water used by a typical Denver-area residential water customer
is used for outdoor landscape and lawn irrigation. We believe that
raw or reclaimed water supplies provide the lowest cost, most
environmentally sustainable water for outdoor irrigation. We expect
our systems to include an extensive water reclamation system in
which essentially all effluent water from wastewater treatment
plants will be reused to meet non-potable water demands. Our
dual-distribution systems demonstrate our commitment to
environmentally responsible water management policies in our water
short region.
Labor and Raw Materials
The Builder Contracts for Sky Ranch and the contracts we enter into
to design and construct water facilities are fixed-price contracts
in which we bear all or a significant portion of the risk for cost
overruns. Under these fixed-price contracts, the contract prices
that we agree to are established in part based on fixed, firm
subcontractor quotes on contracts and on cost and scheduling
estimates. These quotes may be based on a number of assumptions,
including assumptions about prices and availability of labor,
equipment and materials, and other issues.
Increased costs
or shortages of skilled labor and/or concrete, steel, pipe and
other materials could cause increases in property development costs
and delays. These shortages and delays may result in delays in the
delivery of the residential lots under development, reduced gross
margins from lot sales, or both. We plan to contract with third
parties for our labor and materials at a fixed price, which should
allow us to mitigate the risks associated with increases in the
cost of labor and building materials.
18
Competition
We negotiate individual service agreements with our governmental
customers and with their developers and/or home builders to design,
construct and operate water and wastewater systems and to provide
services to end-use customers of governmental entities and to
commercial and industrial customers. These service agreements seek
to address all aspects of the development of the water and
wastewater systems including:
(i)
the
purchase of water and wastewater taps in exchange for our
obligation to construct certain Wholesale Facilities;
(ii)
the
establishment of payment terms, timing, capacity and location of
Special Facilities (if any); and
(iii)
specific
terms related to our provision of ongoing water and wastewater
services to our local governmental customers as well as the
governmental entity’s end-use customers.
Although we have exclusive long-term water and wastewater service
contracts for 24,000 acres of the 27,000-acre Lowry Range pursuant
to the Lowry Service Agreement, providing water and wastewater
services to areas other than Wild Pointe, Sky Ranch and a portion
of the Lowry Range is subject to competition. Alternate sources of
water are available, principally from other private parties, such
as farmers or others owning water rights that have historically
been used for agriculture, and from municipalities seeking to annex
new development areas in order to increase their tax base. Our
principal competition in areas close to the Lowry Range is the City
of Aurora. Principal factors affecting competition for potential
purchasers of our Export Water include the availability of water
for the particular purpose, the cost of delivering the water to the
desired location (including the cost of required taps), and the
reliability of the water supply during drought periods. We estimate
that the water assets we own and have the exclusive right to use
have a supply capacity of approximately 60,000 SFE units, and we
believe they provide us with a significant competitive advantage
along the Front Range. Our legal rights to the Rangeview Water
Supply have been confirmed for municipal use, and our water supply
is close to Denver area water users. We believe our pricing
structure is competitive and our water portfolio is well balanced
with senior surface water rights, groundwater rights, storage
capacity and reclaimed water supplies.
Environmental, Health and Safety Regulation
Provision of water and wastewater services is subject to regulation
under the federal Safe Drinking Water Act, the Clean Water Act,
related state laws, and federal and state regulations issued under
these laws. These laws and regulations establish criteria and
standards for drinking water and for wastewater discharges. In
addition, we are subject to federal and state laws and other
regulations relating to solid waste disposal and certain other
aspects of our operations.
Environmental compliance issues may arise in the normal course of
operations or as a result of regulatory changes. We attempt to
align capital budgeting and expenditures to address these issues in
a timely manner.
Safe Drinking Water Act –
The Safe Drinking Water Act establishes criteria
and procedures for the U.S. Environmental Protection Agency (the
“EPA”) to develop national quality standards for
drinking water. Regulations issued pursuant to the Safe Drinking
Water Act and its amendments set standards on the amount of certain
microbial and chemical contaminants and radionuclides allowable in
drinking water. The State of Colorado has assumed primary
responsibility for enforcing the standards established by the Safe
Drinking Water Act and has adopted the Colorado Primary Drinking
Water Standards (5 CCR 1003-1). Current requirements for drinking
water are not expected to have a material impact on our financial
condition or results of operations as we have made and are making
investments to meet existing water quality standards. In the
future, we might be required to change our method of treating
drinking water and make additional capital investments if
additional regulations become effective.
The federal Groundwater Rule became effective December 1,
2009. This rule requires additional testing of water from well
sources and under certain circumstances requires demonstration and
maintenance of effective disinfection. In 2009, Colorado adopted
Article 13 to the Colorado Primary Drinking Water Standards to
establish monitoring and compliance criteria for the Groundwater
Rule. We have implemented measures to comply with the Groundwater
Rule.
19
Clean Water Act
–
The Clean Water Act regulates wastewater
discharges from drinking water and wastewater treatment facilities
and storm water discharges into lakes, rivers, streams, and
wetlands. The State of Colorado has assumed primary responsibility
for enforcing the standards established by the federal Clean Water
Act for wastewater discharges from domestic water and wastewater
treatment facilities and has adopted the Colorado Water Quality
Control Act and related regulations, which also regulate discharges
to groundwater. It is our policy to obtain and maintain all
required permits and approvals for discharges from our water and
wastewater facilities and to comply with all conditions of those
permits and other regulatory requirements. A program is in place to
monitor facilities for compliance with permitting, monitoring and
reporting for wastewater discharges. From time to time, discharge
violations might occur which might result in fines and penalties,
but we have no reason to believe that any such fines or penalties
are pending or will be assessed.
In the future, we anticipate changing our method of treating
wastewater, which will require future additional capital
investments, as additional regulations become effective. In 2016,
we invested $368,600 to design, permit and construct a 13 million
gallon effluent storage reservoir at our wastewater treatment
facility and have converted our facility to a zero discharge
treatment facility. We are storing the treated effluent water and
expect to use the water for agricultural and irrigation
uses.
Solid Waste Disposal –
The handling and disposal of residuals and solid
waste generated from water and wastewater treatment facilities is
governed by federal and state laws and regulations. We have a
program in place to monitor our facilities for compliance with
regulatory requirements, and we do not anticipate that costs
associated with our handling and disposal of waste material from
our water and wastewater operations will have a material impact on
our business or financial condition.
Employees
We currently have 11 full-time employees.
Available Information and Website Address
Our website address is
www.purecyclewater.com
.
We make available free of charge through our website our annual
reports on Form 10-K, quarterly reports on Form 10-Q, current
reports on Form 8-K, and all amendments to these reports as soon as
reasonably practicable after filing with the Securities and
Exchange Commission (“SEC”).
These reports and all other material we file with the SEC may be
obtained directly from the SEC’s website,
www.sec.gov/edgar/searchedgar/companysearch.html
,
under CIK code
276720
.
The contents of our website are not incorporated by reference into
this report. You may also read and copy any materials we file with
the SEC at the SEC’s Public Reference Room at 100 F Street,
NE, Washington, DC 20549. Operating information for the Public
Reference Room is available by calling the SEC at
1-800-SEC-0330.
The following section describes the material risks and
uncertainties that management believes could have a material
adverse effect on our business, financial condition, results of
operations, and the market price of our common stock. The risks
discussed below include forward-looking statements, and our actual
results may differ materially from those discussed in these
forward-looking statements. These risks should be read in
conjunction with the other information set forth in this report,
including the accompanying financial statements and notes
thereto.
Our net losses may continue and we may not have sufficient cash
flows from operations or other capital resources to pursue our
business objectives.
We have
experienced significant net losses; our cash flows from operations
have not been sufficient to fund our operations in the past; and we
have been required to raise debt and equity capital and sell assets
to remain in operation. Since 2004, we have obtained $76.2 million
through (i) the issuance of $25.2 million of common stock
(including the issuance of stock pursuant to the exercise of
options, net of expenses), (ii) the issuance of $5.2 million of
Convertible Debt, which was converted to common stock on
January 11, 2011, and (iii)
the sale of our
Arkansas River water and land for approximately $45.8 million in
cash
. Our development of the
first 250 homes in the first phase of Sky Ranch requires
significant cash expenditures of approximately $18 million before
we will generate positive cash flows from the sale of lots and
water and sewer tap fees. We expect to fund such expenditures with
cash on hand and cash flows from operations. At August 31, 2017, we
had $26 million of cash and marketable securities on hand. We
currently have a limited number of customers. If our cash on hand
and future cash flows from operations are not sufficient to fund
our operations and the significant capital expenditure requirements
to build our water delivery systems and develop Sky Ranch, we may
be forced to seek to obtain additional debt or equity capital.
Economic conditions and disruptions have previously caused
substantial volatility in capital markets, including credit markets
and the banking industry, increasing the cost and significantly
reducing the availability of financing, which may reoccur in the
future. There can be no assurance that financing will be available
on acceptable terms or at all.
20
The rates the Rangeview District is allowed to charge customers on
the Lowry Range are limited by the Lease with the Land Board and
our contract with the Rangeview District and may not be sufficient
to cover our costs of construction and operation.
The prices charged by the Rangeview
District for water service on the Lowry Range are subject to
pricing regulations set forth in the Lease with the Land Board.
Both the tap fees and usage rates and charges are capped at the
average of the rates of three nearby water providers. Annually the
Rangeview District surveys the tap fees and rates of the three
nearby providers, and the Rangeview District may adjust tap fees
and rates and charges for water service on the Lowry Range based on
the average of those charged by this group, and we receive 98% of
whatever the Rangeview District charges its customers. Our costs
associated with the construction of water delivery systems and the
production, treatment and delivery of water are subject to market
conditions and other factors, which may increase at a significantly
higher rate than that of the fees we receive from the Rangeview
District. Factors beyond our control and which cannot be predicted,
such as government regulations, insurance and labor markets,
drought, water contamination and severe weather conditions, like
tornadoes and floods, may result in additional labor and material
costs that may not be recoverable under the current rate structure.
Both increased customer demand and increased water conservation may
also impact the overall cost of our operations. If the costs for
construction and operation of our wholesale water services,
including the cost of extracting our groundwater, exceed our
revenues, we would be providing service to the Rangeview District
for use at the Lowry Range at a loss. The Rangeview District may
petition the Land Board for rate increases; however, there can be
no assurance that the Land Board would approve a rate increase
request. Further, even if a rate increase were approved, it might
not be granted in a timely manner or in an amount sufficient to
cover the expenses for which the rate increase was
sought.
Our business is subject to seasonal fluctuations and weather
conditions that could affect demand for our water service and our
revenues.
We depend on an
adequate water supply to meet the present and future demands of our
customers and their end-use customers and to continue our expansion
efforts. Conditions beyond our control may interfere with our water
supply sources. Drought and overuse may limit the availability of
water. These factors might adversely affect our ability to supply
water in sufficient quantities to our customers, and our revenues
and earnings may be adversely affected. Additionally, cool and wet
weather, as well as drought restrictions and our customers’
conservation efforts, may reduce consumption demands, adversely
affecting our revenue and earnings. Furthermore, freezing weather
may contribute to water transmission interruptions caused by pipe
and main breakage. If we experience an interruption in our water
supply, it could have a material adverse effect on our financial
condition and results of operations. Demand for our water during
the warmer months is generally greater than during cooler months
due primarily to additional requirements for water in connection
with cooling systems, irrigation systems and other outside water
use. Throughout the year, and particularly during typically warmer
months, demand will vary with temperature and rainfall levels. If
temperatures during the typically warmer months are cooler than
expected or there is more rainfall than expected, the demand for
our water may decrease and adversely affect our
revenues.
Sales to the fracking industry can fluctuate significantly.
Our water sales have been historically
highly concentrated directly and indirectly with one company
providing fracking services to the oil and gas industry on and
around the Lowry Range and our Sky Ranch property. Sales to this
customer base as well as renewals of our oil and gas leases, if
any, in the future are impacted by regulations, fracking
technologies, the success of the wells and the price of oil and
gas, among other things. Investment in oil and gas development is
dependent on the price of oil and gas. While water sales for
fracking are now increasing, we have no contractual commitment that
will ensure these sales in the future.
We are dependent on the housing market and development in our
targeted service areas for future revenues.
Providing wholesale water service using our
Colorado Front Range water supplies is our principal source of
future revenue. The timing and amount of these revenues will depend
in part on housing developments being built near our water assets.
The development of the Lowry Range, Sky Ranch and other properties
is subject to many factors that are not within our control. If
wholesale water sales are not forthcoming or development on the
Lowry Range, Sky Ranch or other properties in our targeted service
areas is delayed, we may need to use our capital resources, incur
additional short or long-term debt obligations or seek to sell
additional equity. We may not have sufficient capital resources or
be successful in obtaining additional operating capital. After
several years of significant declines in new home construction,
there have been positive market gains in the Colorado housing
market since 2013. However, if the downturn in the homebuilding and
credit markets return or if the national economy weakens and
economic concerns intensify, it could have a significant negative
impact on our business and financial condition and our plans for
future development of additional phases of Sky
Ranch.
21
Development on the Lowry Range is not within our control and is
subject to obstacles.
Development on the Lowry Range is controlled by
the Land Board, which is governed by a five-person citizen board of
commissioners representing education, agriculture, local government
and natural resources, plus one at-large commissioner, each
appointed for a four-year term by the Colorado governor and
approved by the Colorado Senate. The Land Board’s focus with
respect to issues such as development and conservation on the Lowry
Range tends to change as membership on the Land Board changes. In
addition, there are often significant delays in the adoption and
implementation of plans with respect to property administered by
the Land Board because the process involves many constituencies
with diverse interests. In the event water sales are not
forthcoming or development of the Lowry Range is delayed or
abandoned, we may need to use our capital resources, incur
additional short or long-term debt obligations or seek to sell
additional equity. We may not have sufficient capital resources or
be successful in obtaining additional operating
capital.
Because of the prior use of the Lowry Range as a military facility,
environmental clean-up may be required prior to development,
including the removal of unexploded ordnance. The U.S. Army Corps
of Engineers has been conducting unexploded ordnance removal
activities at the Lowry Range for more than 20 years. Continued
activities are dependent on federal appropriations, and the Army
Corps of Engineers has no assurance from year to year of such
appropriations for its activities at the Lowry Range.
We do not have experience with the development of real
property.
While we have
experience designing and constructing water and wastewater
facilities and maintaining and operating these facilities, we do
not have experience developing real property. We may underestimate
the capital expenditures required to develop the first phase of Sky
Ranch, including the costs of certain infrastructure improvements.
We lack experience in managing property development activities,
including the permitting and other approvals required, which may
result in delays in obtaining the necessary permits and government
approvals.
Our construction of water and wastewater projects may expose us to
certain completion, performance and financial risks.
We expect to rely on independent
contractors to construct our water and wastewater facilities and
Sky Ranch lot improvements. These construction activities may
involve risks, including shortages of materials and labor, work
stoppages, labor relations disputes, weather interference,
engineering, environmental, permitting or geological problems and
unanticipated cost increases. These issues could give rise to
delays, cost overruns or performance deficiencies, or otherwise
adversely affect the construction or operation of our water and
wastewater delivery systems and the construction and delivery of
residential lots pursuant to our Builder Contracts. In addition, we
may experience quality problems in the construction of our systems
and facilities, including equipment failures. We may not meet the
required deadlines under our Builder Contracts. We may face claims
from customers or others regarding product quality and installation
of equipment placed in service by contractors.
The Builder Contracts for Sky Ranch and for the water facilities
that we design and construct are fixed-price contracts, in which we
bear all or a significant portion of the risk for cost overruns.
Under these fixed-price contracts, contract prices are established
in part based on fixed, firm subcontractor quotes on contracts and
on cost and scheduling estimates. These estimates may be based on a
number of assumptions, including assumptions about prices and
availability of labor, equipment and materials, and other issues.
If these subcontractor quotations or cost estimates prove
inaccurate, or if circumstances change, cost overruns may occur,
and our financial results would be negatively impacted. In many
cases, the incurrence of these additional costs would not be within
our control.
Pursuant to our Builder Contracts for Sky Ranch, we guarantee
project completion of water and wastewater delivery systems and lot
improvements by a scheduled date. We also guarantee that the
project, when completed, will achieve certain performance
standards, meet certain quality specifications and satisfy certain
requirements for governmental approvals. If we fail to complete the
project as scheduled, or if we fail to meet guaranteed performance
standards or quality specifications, or obtain the required
governmental approvals, we may be held responsible for cost impacts
and/or penalties to the customer resulting from any delay or for
the costs to alter the project to achieve the performance standards
and the quality specifications and to obtain the required
government approvals. To the extent that these events occur and are
not due to circumstances for which the customer accepts
responsibility or cannot be mitigated by performance bonds or the
provisions of our agreements with contractors, the total costs of
the project would exceed our original estimates and our financial
results would be negatively impacted.
22
We are required to secure, or to have our subcontractors secure,
performance and completion bonds for certain contracts and
projects. The market environment for surety companies has become
more risk averse. We and our subcontractors secure performance and
completion bonds for our contracts from these surety companies. To
the extent we or our subcontractors are unable to obtain bonds, we
may breach existing agreements and/or not be awarded new contracts.
We may not be able to secure performance and completion bonds when
required.
We may be subject to significant potential liabilities as a result
of warranty and liability claims made against us.
Design, construction or system
failures related to our water and wastewater delivery systems could
result in injury to third parties or damage to property.
As
a property developer, we are also subject in the ordinary course of
our business to warranty claims. We are also subject to claims for
injuries that occur in the course of our property development
activities. We plan to record warranty and other reserves for the
residential lots we sell based on historical experience in our
market and our judgment of the qualitative risks associated with
the type of lots we sell. We have, and many of our subcontractors
have, general liability, property, workers’ compensation and
other business insurance. These insurance policies are intended to
protect us against a portion of our risk of loss from claims,
subject to certain self-insured retentions, deductibles and
coverage limits. However, it is possible that this insurance will
not be adequate to address all warranty and liability claims to
which we are subject. Additionally, the coverage offered and the
availability of general liability insurance for construction
defects are currently limited and policies that can be obtained are
costly and often include exclusions based upon past losses those
insurers suffered as a result of use of defective materials used by
other property developers. As a result, our subcontractors may be
unable to obtain insurance, and we may have to waive our customary
insurance requirements, which increases our and our insurers’
exposure to claims and increases the possibility that our insurance
will not be adequate to protect us for all the costs we incur.
Any losses that exceed claims against
our contractors, the performance bonds and our insurance limits at
such facilities could result in claims against us. In addition, if
there is a customer dispute regarding performance of our services,
the customer may decide to delay or withhold payment to
us.
We have a limited number of employees and may not be able to manage
the increasing demands of our expanded operations.
We have a limited number of employees
to administer our existing assets, interface with applicable
governmental bodies, market our services and plan for the
construction and development of our assets. We may not be able to
maximize the value of our assets because of our limited manpower.
We depend significantly on the services of Mark W. Harding, our
President and Chief Financial Officer. The loss of Mr. Harding
would cause a significant interruption of our operations. Further,
the execution of the Builder Contracts for Sky Ranch has increased
the size and complexity of our business. The success of our current
business and future business development and our ability to
capitalize on growth opportunities depends on our ability to
attract and retain additional experienced and qualified persons to
operate and manage our business. State regulations set the
training, experience and qualification standards required for our
employees to operate specific water and wastewater facilities.
Failure to find state-certified and qualified employees to support
the operation of our facilities could put us at risk for, among
other things, regulatory penalties (including fines and suspension
of operations), operational errors at the facilities, improper
billing and collection processes, and loss of contracts and
revenues. We may be unsuccessful in managing our assets and
growth.
Supply shortages and risks related to the demand for skilled labor
and building materials could increase costs and delay
closings.
The property development industry is highly
competitive for skilled labor and materials. Labor shortages in the
Colorado Front Range have become more acute in recent years as the
supply chain adjusts to uneven industry growth. Increased costs or
shortages of skilled labor and/or concrete, steel, pipe and other
materials could cause increases in property development costs and
delays. We are unable to pass on increases in property development
costs to home builders with whom we have already entered into
purchase and sale contracts for residential lots, as our contracts
fix the price of the lots at the time the contracts are signed,
which will be well in advance of property development. Sustained
increases in development costs may, over time, erode our
margins.
Products supplied to us and work done by subcontractors can expose
us to risks that could adversely affect our business.
We
rely on subcontractors to perform the actual property development,
and in many cases, to select and obtain concrete and other
materials. Subcontractors may use improper construction processes
or defective materials. Defective products can result in the need
to perform extensive repairs. The cost of complying with our
warranty obligations may be significant if we are unable to recover
the cost of repairs from subcontractors, materials suppliers and
insurers.
23
A failure of the water wells or distribution networks that we own
or control could result in losses and damages that may affect our
financial condition and reputation.
We distribute water through a network of pipelines
and store water in storage tanks and a pond. A failure of these
pipelines, tanks or the pond could result in injuries and damage to
property for which we may be responsible, in whole or in part. The
failure of these pipelines, tanks, or pond may also result in the
need to shut down some facilities or parts of our water
distribution network in order to conduct repairs. Such failures and
shutdowns may limit our ability to supply water in sufficient
quantities to our customers and to meet the water delivery
requirements prescribed by our contracts, which could adversely
affect our financial condition, results of operations, cash flow,
liquidity and reputation. Any business interruption or other losses
might not be covered by insurance policies or be recoverable
through rates and charges, and such losses may make it difficult
for us to secure insurance in the future at acceptable
rates.
Conflicts of interest may arise relating to the operation of the
Rangeview District and the Sky Ranch Districts.
Our officers and employees constitute 60% of the
directors of the Rangeview District and the Sky Ranch Districts.
Pure Cycle, along with our officers and employees and two unrelated
individuals, own the 40 acres that constitute the Rangeview
District and the acreage that constitutes the Sky Ranch Districts.
We have made loans to the Rangeview District to fund its
operations. At August 31, 2017, total principal and interest owed
to us by the Rangeview District was $776,400. Pursuant to our water
and wastewater service agreements with the Rangeview District, the
Rangeview District retains two percent of the revenues from the
sale of water to its end-use customers and 10% of the revenues from
the provision of wastewater services to its end-use customers.
Proceeds from the fee collections will initially be used to repay
the Rangeview District’s obligations to us, but after these
loans are repaid, the Rangeview District is not required to use the
funds to benefit Pure Cycle.
Similarly, we have made loans to and incurred expenses reimbursable
by the Sky Ranch Districts. At August 31, 2017, total
principal and interest owed to us by the Sky Ranch Districts was
$215,500. It is anticipated that these amounts will be repaid once
Sky Ranch has sold residential units and has a tax base to issue
bonds to pay for services. We have received benefits from our
activities undertaken in conjunction with these districts, but
conflicts may arise between our interests and those of the
Rangeview and Sky Ranch Districts and our officers and employees
who are acting in dual capacities in negotiating contracts to which
both we and a district are parties. We expect that the Rangeview
and Sky Ranch Districts will expand when more properties are
developed and become part of the respective districts, and our
officers and employees acting as directors of these districts will
have fiduciary obligations to those other constituents. Conflicts
may not be resolved in the best interests of the Company and our
shareholders. In addition, other landowners coming into a district
will be eligible to vote and to serve as directors of that
district. Our officers and employees may not remain as directors of
these districts, and the actions of subsequently elected boards
could have an adverse impact on our operations.
Our operations are affected by local politics and governmental
procedures that are beyond our control.
We operate in a highly political environment. We
market our water rights to municipalities and other governmental
entities run by elected or politically appointed officials. Our
principal competitors are municipalities seeking to expand their
sales tax base and other water districts. Various constituencies,
including our competitors, developers, environmental groups,
conservation groups, and agricultural interests, have competing
agendas with respect to the development of water rights in
Colorado, which means that decisions affecting our business are
based on many factors other than economic and business
considerations. Additional risks associated with dealing with
governmental entities include turnover of elected and appointed
officials, changes in policies from election to election, and a
lack of institutional history in these entities concerning their
prior courses of dealing with the Company. We spend significant
time and resources educating elected officials, local authorities
and others regarding our water rights and the benefits of
contracting with us. Political concerns and governmental procedures
and policies may hinder or delay our ability to enter into service
agreements or develop our water rights or infrastructure to deliver
our water. While we have worked to reduce the political risks in
our business through our participation as the service provider for
the Rangeview District in regional cooperative resource programs,
such as the SMWSA and its WISE partnership with Denver Water and
Aurora Water, as well as education and communication efforts and
community involvement, our efforts may be
unsuccessful.
Delays in property development may extend the time it takes us to
recover our property development costs.
We incur many costs,
such as the costs of preparing land, finishing and entitling lots,
installing roads, sewers, water systems and other utilities, taxes
and other costs related to ownership of the land, before we close
on the sale of residential lots to home builders. If the rate at
which we develop residential lots slows, we may incur additional
costs, and it may take longer for us to recover our costs. In
addition, if sales of homes on the finished lots are delayed, our
revenue from utility services will be delayed.
24
Government regulations and legal challenges may delay the closing
of the sale of our residential lots, increase our expenses or limit
other activities, which could have a negative impact on our results
of operations.
The approval of numerous governmental
authorities must be obtained in connection with our property
development activities, and these governmental authorities often
have broad discretion in exercising their approval authority. We
incur substantial costs related to compliance with legal and
regulatory requirements. Any increase in legal and regulatory
requirements may cause us to incur substantial additional costs.
Various local, state and federal statutes, ordinances, rules and
regulations concerning building, health and safety, site and
building design, environment, zoning, and similar matters apply to
and/or affect property developers like us. In addition, our ability
to obtain or renew permits or approvals and the continued
effectiveness of permits already granted or approvals already
obtained depends on factors beyond our control, such as changes in
federal, state and local policies, rules and regulations and their
interpretations and application. Furthermore, we are also subject
to various fees and charges of government authorities designed to
defray the cost of providing certain governmental services and
improvements. For example, local and state governments have broad
discretion regarding the imposition of development fees for
projects under their jurisdictions, as well as requiring
concessions or that the property developer and/or home builder
construct certain improvements to public places such as parks and
streets or fund schools.
Municipalities
or state water agencies may restrict or place moratoriums on the
availability of utilities, such as water and sewer taps, which
could have an adverse effect on our business by causing delays or
increasing our costs.
We must provide water that meets all federal and state regulatory
water quality standards and operate our water and wastewater
facilities in accordance with these standards. Future changes in
regulations governing the supply of drinking water and treatment of
wastewater may have a material adverse impact on our financial
results. With respect to service of customers on the Lowry Range,
the Rangeview District’s rates might not be sufficient to
cover the cost of compliance with additional or more stringent
requirements. If the cost of compliance were to increase, we
anticipate that the rates of the nearby water providers that the
Rangeview District uses to establish its rates and charges would
increase to reflect these cost increases, thereby allowing the
Rangeview District to increase its rates and charges. However,
these water providers may not raise their rates in an amount that
would be sufficient to enable the Rangeview District (and us) to
cover any increased compliance costs.
In
addition, there is a variety of legislation being enacted, or
considered for enactment, at the federal, state and local level
relating to energy and climate change. This legislation relates to
items such as carbon dioxide emissions control and building codes
that impose energy efficiency standards. Such environmental laws
may affect, for example, how we manage storm water runoff,
wastewater discharges and dust; how we develop or operate on
properties on or affecting resources such as wetlands, endangered
species, cultural resources, or areas subject to preservation laws;
and how we address contamination. As climate change concerns
continue to grow, compliance with legislation and regulations of
this nature are expected to become more costly. Energy-related
initiatives affect a wide variety of companies throughout the
United States and the world and, because our operations are now
dependent on significant amounts of raw materials, such as steel
and concrete, they could have an indirect adverse impact on our
operations and profitability to the extent the manufacturers and
suppliers of the materials used in the development of our
properties are burdened with expensive cap and trade and similar
energy related taxes and regulations.
It is possible that new standards could be imposed
that will require additional capital expenditures or raise our
operating costs. With respect to service of customers on the
Lowry Range, the Rangeview District’s rates might not be
sufficient to cover the cost of compliance with new requirements.
Although we would expect the rates of the nearby water providers
that the Rangeview District uses to establish its rates and charges
to increase to cover increased compliance costs, such rates may not
cover all our costs and our costs of complying with new standards
or laws could adversely affect our business, results of operations
or financial condition.
Our noncompliance with environmental
laws could result in fines and penalties, obligations to remediate,
permit revocations and other sanctions.
25
Government
agencies may initiate audits, reviews or investigations of our
business practices to ensure compliance with applicable laws and
regulations, which can cause us to incur costs or create other
disruptions in our business that can be significant. Further, we
may experience delays and increased expenses as a result of legal
challenges to our proposed development activities, whether brought
by governmental authorities or private parties.
Our Lowry Range surface water rights are “conditional
decrees” and require findings of reasonable diligence.
Our surface water interests and
reservoir sites at the Lowry Range are conditionally decreed and
are subject to a finding of reasonable diligence from the Colorado
water court every six years. To arrive at a finding of reasonable
diligence, the water court must determine that we continue to
diligently pursue the development of said water rights. If the
water court is unable to make such a finding, we could lose the
water right under review. During fiscal 2012, the Lowry Range
conditional decrees were granted their first review by the water
court, which determined that we and the Rangeview District met the
diligence criteria. The water court entered a finding of reasonable
diligence on the Lowry Range surface water decrees on February 11,
2012. Our next diligence period will be in February 2018. If the
water court does not make a determination of reasonable diligence
in 2018, it would materially adversely impact the value of our
interests in the Rangeview surface water
supply.
Contamination to our water supply may result in disruption in our
services and litigation, which could adversely affect our business,
operating results and financial condition.
Our water supplies are subject to the risk of
potential contamination, including contamination from naturally
occurring compounds, pollution from man-made sources and
intentional sabotage. Our land at Sky Ranch and a portion of the
Lowry Range have been leased for oil and gas exploration and
development. Such exploration and development could expose us to
additional contamination risks from related leaks or spills. In
addition, we handle certain hazardous materials at our water
treatment facilities, primarily sodium hypochlorite. Any failure of
our operation of the facilities or any contamination of our
supplies, including sewage spills, noncompliance with water quality
standards, hazardous materials leaks and spills, and similar events
could expose us to environmental liabilities, claims and litigation
costs. If any of these events occur, we may have to interrupt the
use of that water supply until we are able to substitute the supply
from another source or treat the contaminated supply. We cannot
assure you that we will successfully manage these issues, and
failure to do so could have a material adverse effect on our future
results of operations.
We may incur significant costs in order to treat the contaminated
source through expansion of our current treatment facilities or
development of new treatment methods. If we are unable to
substitute water supply from an uncontaminated water source, or to
adequately treat the contaminated water source in a cost-effective
manner, there may be an adverse effect on our revenues, operating
results and financial condition. The costs we incur to
decontaminate a water source or an underground water system could
be significant and could adversely affect our business, operating
results and financial condition and may not be recoverable in
rates.
We could also be held liable for consequences arising out of human
exposure to hazardous substances in our water supplies or other
environmental damage. For example, private plaintiffs could assert
personal injury or other toxic tort claims arising from the
presence of hazardous substances in our drinking water supplies.
Although we have not been a party to any environmental or
pollution-related lawsuits, such lawsuits have increased in
frequency in recent years. If we are subject to an environmental or
pollution-related lawsuit, we might incur significant legal costs,
and it is uncertain whether we would be able to recover the legal
costs from ratepayers or other third parties. Our insurance
policies may not cover or provide sufficient coverage for the costs
of these claims.
We may be adversely affected by any future decision by the Colorado
Public Utilities Commission to regulate us as a public
utility.
The Colorado Public
Utilities Commission (“CPUC”) regulates investor-owned
water companies operating for the purpose of supplying water to the
public. The CPUC regulates many aspects of public utilities’
operations, including establishing water rates and fees, initiating
inspections, enforcement and compliance activities and assisting
consumers with complaints. We do not believe we are a public
utility under Colorado law. We currently provide services by
contract mainly to the Rangeview District, which supplies the
public. Quasi-municipal metropolitan districts, such as the
Rangeview District and the Sky Ranch Districts, are exempt by
statute from regulation by the CPUC. However, the CPUC could
attempt to regulate us as a public utility. If this were to occur,
we might incur significant expense challenging the CPUC’s
assertion of jurisdiction, and we may be unsuccessful. In the
future, existing regulations may be revised or reinterpreted, and
new laws and regulations may be adopted or become applicable to us
or our facilities. If we become regulated as a public utility, our
ability to generate profits could be limited, and we might incur
significant costs associated with regulatory
compliance.
26
The Rangeview District’s and our rights under the Lease have
been challenged by third parties.
The Rangeview District’s and our rights
under the Lease have been challenged by third parties, including
the Land Board, in the past. In 2014, in connection with settling a
lawsuit filed by us and the Rangeview District against the Land
Board, the Land Board, the Rangeview District and we amended and
restated the Lease to clarify and update a number of provisions.
However, there are issues still subject to negotiation and it is
likely that during the remaining 64-year term of the Lease the
parties will disagree over interpretations of provisions in the
Lease again. The Rangeview District’s or our rights under the
Lease could be challenged in the future, which could require
potentially expensive litigation to enforce our
rights.
Our operations are concentrated in the Front Range area of
Colorado; we are subject to general economic conditions in
Colorado.
Our water assets and
operations are located solely in the Front Range area of Colorado.
Our performance could be adversely affected by economic conditions
in, and other factors relating to, Colorado, including supply and
demand for housing, zoning and other regulatory conditions. To the
extent the general economic conditions in the Front Range area of
Colorado deteriorate, the value of our assets, our results of
operations and our financial condition could be materially
adversely affected.
Natural disasters and severe weather conditions could delay the
closing of the sale of residential lots at Sky Ranch and increase
our costs, which could harm our sales and results of
operations.
We conduct our property development operations
in the Colorado Front Range, which is subject to natural disasters,
including droughts, tornadoes, wildland fires, and severe weather.
The occurrence of natural disasters or severe weather conditions in
Colorado or elsewhere could delay property development, increase
costs by delaying closings and lead to shortages of labor and
materials. If our insurance or the insurance of our subcontractors
does not fully cover business interruptions or losses resulting
from these events, our results of operations could be adversely
affected. For example, as a result of Hurricane Harvey in the Texas
Gulf Coast, the cost of pipe increased approximately 35%. This
additional cost is not clearly reimbursable by
insurance.
We could be hurt by efforts to impose liabilities or obligations on
persons with regard to labor law violations by other persons whose
employees perform contracted services.
The infrastructure
and improvements on our water and wastewater systems and on the
finished lots we sell or that we must provide pursuant to service
agreements and lot development agreements are done by employees of
subcontractors and other contract parties. We do not have the
ability to control what these contract parties pay their employees
or the work rules they impose on their employees. However, various
governmental agencies are trying to hold contract parties like us
responsible for violations of wage and hour laws and other work
related laws by firms whose employees are performing contracted-for
services. A 2016 National Labor Relations Board ruling holds that
for labor law purposes a firm could under some circumstances be
responsible as a joint employer of its contractors’ employees
even if the firm had no direct control over the employees’
terms and conditions of employment. If that ruling is upheld on
appeal, it could make us responsible for collective bargaining
obligations and labor law violations by our subcontractors.
Governmental rulings that make us responsible for labor practices
by our subcontractors could create substantial exposures for us in
situations that are not within our control.
We experience variability in our operating results on a quarterly
basis and, as a result, our historical performance may not be a
meaningful indicator of future results
. We historically have
experienced, and expect to continue to experience, variability in
quarterly results. As a result of such variability, our short-term
performance may not be a meaningful indicator of future results.
Our quarterly results of operations may continue to fluctuate in
the future as a result of a variety of factors, including, among
others, the timing of the closings of sales of residential lots and
weather-related problems.
Our stock price has been volatile in the past and may decline in
the future.
Our common stock
has experienced significant price and volume fluctuations in the
past and may experience significant fluctuations in the future
depending upon a number of factors, some of which are beyond our
control. Factors that could affect our stock price and trading
volume include, among others, the perceived prospects of our
business; differences between anticipated and actual operating
results; changes in analysts’ recommendations or projections;
the commencement and/or results of litigation and other legal
proceedings; and future sales of our common stock by us or by
significant shareholders, officers and directors. In addition,
stock markets in general have experienced price and volume
volatility from time to time, which may adversely affect the market
price of our common stock for reasons unrelated to our
performance.
27
None.
Corporate Office
Effective January 2016, we entered into an operating lease for
approximately 2,500 square feet of office and warehouse space. The
lease has a two-year term with payments of $3,000 per
month.
Water Related Assets
In addition to the water rights and adjudicated reservoir sites
that are described in
Item 1 – Our Water
and Land Assets
, we also own a
500,000-gallon water tank, 400,000-barrel storage reservoir, a
300,000-barrel storage reservoir, three deep water wells, a pump
station, and several miles of water pipeline in Arapahoe County,
Colorado. Although owned by the Rangeview District, we operate and
maintain another 500,000-gallon water tank, two deep water wells, a
pump station, three alluvial wells, the Rangeview District’s
wastewater treatment plant, and water distribution and wastewater
collection pipelines that serve customers located at the Lowry
Range. Although owned by the Elbert 86 District, we operate and
maintain two water tanks with a combined capacity of
438,000-gallons of water, two deep water wells, a pump station, and
10 miles of transmission line for the Wild Pointe development in
Elbert County. These assets are used to provide service to our
customers.
Land
We own approximately 931 acres of land known as Sky Ranch that is
described further in
Item 1 – Our Water
and Land Assets – Sky Ranch.
We own 40 acres of land that comprise the current
boundaries of the Rangeview District. We also own approximately 700
acres of land in the Arkansas River Valley, which is currently
classified as land held for sale.
None.
None.
28
Market Information
Our common stock is traded on The NASDAQ Stock Market under the
symbol “PCYO.” The high and low sales prices of our
common stock, by quarter, for the fiscal years ended August 31,
2016 and 2015 are presented below:
|
Table E - Market Information
|
||||
|
Fiscal 2017 quarters ended:
|
August
31
|
May
31
|
February
28
|
November
30
|
|
Market price of common stock
|
|
|
|
|
|
High
|
$
8.73
|
$
8.10
|
$
5.70
|
$
5.93
|
|
Low
|
$
6.55
|
$
5.20
|
$
4.90
|
$
4.60
|
|
|
|
|
|
|
|
Fiscal
2016 quarters ended:
|
August
31
|
May
31
|
February
29
|
November
30
|
|
Market price of common stock
|
|
|
|
|
|
High
|
$
5.20
|
$
4.91
|
$
5.12
|
$
5.73
|
|
Low
|
$
4.34
|
$
4.29
|
$
3.65
|
$
4.56
|
Holders
On October 17, 2017, there were 552 holders of record of our common
stock.
Dividends
We have never paid any dividends on our common stock and expect for
the foreseeable future to retain all of our capital and earnings
from operations, if any, for use in expanding and developing our
business. Any future decision as to the payment of dividends will
be at the discretion of our board of directors and will depend upon
our earnings, financial position, capital requirements, plans for
expansion and such other factors as our board of directors deems
relevant. The terms of our Series B Preferred Stock prohibit
payment of dividends on common stock unless all dividends accrued
on the Series B Preferred Stock have been paid and require
dividends to be paid on the Series B Preferred Stock if proceeds
from the sale of Export Water exceed $36,026,232. For further
discussion see Note 8 –
Shareholders’
Equity
to the accompanying
financial statements.
Performance
Graph
1
This graph compares the cumulative total return of our common stock
for the last five fiscal years with the cumulative total return for
the same period of the S&P 500 Index and a peer group
index.
2
The graph assumes the investment of
$100 in common stock in each of the indices as of the market close
on August 31 and reinvestment of all dividends.
|
|
8/12
|
8/13
|
8/14
|
8/15
|
8/16
|
8/17
|
|
|
|
|
|
|
|
|
|
Pure Cycle Corporation
|
100.00
|
260.00
|
326.00
|
250.00
|
242.00
|
362.50
|
|
S&P 500
|
100.00
|
118.70
|
148.67
|
149.38
|
168.13
|
195.43
|
|
Peer Group
|
100.00
|
119.89
|
133.12
|
139.83
|
178.40
|
213.02
|
29

1.
This
performance graph is not “soliciting material,” is not
deemed “filed” with the SEC and is not to be
incorporated by reference in any of our filings under the
Securities Act or the Exchange Act whether made before or after the
date hereof and irrespective of any general incorporation language
in any such filing.
2.
The
Peer Group consists of the following companies that have been
selected on the basis of industry focus or industry leadership:
American States Water Company, Aqua America, Inc., Artesian
Resources Corp., California Water Service Group, Connecticut Water
Service, Inc., Middlesex Water Company, SJW Corp., and The York
Water Company.
Recent Sales of Unregistered Securities; Use of Proceeds From
Registered Securities
None.
Purchase of Equity Securities By the Issuer and Affiliated
Purchasers
None.
30
|
Table F - Selected Financial Data
|
|||||
|
In thousands (except per share data)
|
For the
Fiscal Years Ended August 31,
|
||||
|
|
2017
|
2016
|
2015
|
2014
|
2013
|
|
Summary
Statement of Operations Items:
|
|
|
|
|
|
|
Total revenue
|
$
1,227.8
|
$
452.2
|
$
1,196.6
|
$
2,023.1
|
$
615.6
|
|
(Loss) income from continuing operations
|
$
(1,678.8
)
|
$
(1,230.3
)
|
$
(575.1
)
|
$
285.5
|
$
(1,227.9
)
|
|
Net loss
|
$
(1,710.9
)
|
$
(1,310.6
)
|
$
(23,127.9
)
|
$
(311.4
)
|
$
(4,150.4
)
|
|
Basic and diluted loss per share
|
$
(0.07
)
|
$
(0.06
)
|
$
(0.96
)
|
$
(0.01
)
|
$
(0.17
)
|
|
Weighted average shares outstanding
|
23,754
|
23,781
|
24,041
|
24,038
|
24,038
|
|
|
As of
August 31,
|
||||
|
Summary
Balance Sheet Information:
|
2017
|
2016
|
2015
|
2014
|
2013
|
|
Current assets
|
$
27,124.3
|
$
29,085.9
|
$
39,580.9
|
$
4,463.3
|
$
9,900.0
|
|
Total assets
|
$
69,787.6
|
$
70,879.6
|
$
73,060.9
|
$
108,173.8
|
$
108,618.3
|
|
Current liabilities
|
$
940.2
|
$
482.2
|
$
1,499.1
|
$
3,274.4
|
$
5,402.3
|
|
Long-term liabilities
|
$
1,341.3
|
$
1,399.5
|
$
1,476.4
|
$
13,868.9
|
$
65,443.5
|
|
Total liabilities
|
$
2,281.5
|
$
1,881.7
|
$
2,975.5
|
$
17,143.3
|
$
70,845.8
|
|
Equity
|
$
67,506.1
|
$
68,997.9
|
$
70,085.5
|
$
91,030.5
|
$
37,772.5
|
The following items had a significant impact on our
operations:
(a)
In
fiscal 2017, we invested $2.5 million in our water and wastewater
systems, $4.4 million for the construction of pipelines, $902,600
for the development of our Sky Ranch property, and $95,400 for the
purchase of equipment. During fiscal 2017, we had sales or
maturities of marketable securities of approximately $9.8
million.
(b)
In
fiscal 2016, we invested $923,800 in our water and wastewater
systems and $285,600 for planning and design of our Sky Ranch
property. We also purchased three farms for approximately $450,300
in order to correct dry-up covenant issues related to water-only
farms in order obtain the release of the escrow funds related to
the Company’s farm sale to Arkansas River Farms,
LLC.
(c)
In
fiscal 2015, we sold our remaining farm assets for approximately
$45.8 million, for a loss of approximately $22.3 million. In
conjunction with the sale, we repaid $4.9 million in mortgage debt
relating to the farms and we invested approximately $3.5 million
into our water systems. Financial results for the farm assets have
been reflected as discontinued operations and all prior periods
have been reclassified.
(d)
In fiscal 2014, in order to protect our farm
assets, we acquired the remaining approximately $2.6 million of the
$9.6 million in notes defaulted on by High Plains A&M, LLC
(“HP A&M”)
.
Additionally, we borrowed $1.75 million, sold
farms for $5.8 million, and invested $3.7 million in our water
systems. Additionally, we recorded an impairment of approximately
$400,000 on land and water rights held for sale, and we recorded a
gain of $1.3 million upon completing the sale of certain farms that
we previously impaired in fiscal 2012.
(e)
In
fiscal 2013, in order to protect our farm assets, we acquired
approximately $7 million of the $9.6 million in HP A&M
defaulted notes. Additionally, we sold 1,500,000 unregistered
shares of Pure Cycle common stock owned by HP A&M for $2.35 per
share, yielding approximately $3.4 million, net of
expenses.
31
Overview
The discussion and analysis below includes certain forward-looking
statements that are subject to risks, uncertainties and other
factors, as described in “Risk Factors” and elsewhere
in this Annual Report on Form 10-K, that could cause our
actual growth, results of operations, performance, financial
position and business prospects and opportunities for this fiscal
year and the periods that follow to differ materially from those
expressed in, or implied by, those forward-looking
statements.
Readers are cautioned that
forward-looking statements contained in this Form 10-K should be
read in conjunction with our disclosure under the heading
“FORWARD-LOOKING STATEMENTS” on page
1.
The following Management’s Discussion and Analysis
(“MD&A”) is intended to help the reader understand
the results of operations and our financial condition and should be
read in conjunction with the accompanying financial statements and
the notes thereto included in
Part II, Item 8
of this Annual Report on Form 10-K.
The following sections focus on the key indicators reviewed by
management in evaluating our financial condition and operating
performance, including the following:
●
Revenue
generated from water and wastewater services;
●
Expenses
associated with developing our water and land assets;
and
●
Cash
available to continue development of our land, water rights and
service agreements.
Our MD&A section includes the following items:
Our
Business
–
a general description of our business,
our services and our business strategy.
Critical Accounting
Policies and Estimates
–
a discussion of our critical
accounting policies that require critical judgments, assumptions
and estimates.
Results of
Operations
–
an
analysis of our results of operations for the
three fiscal years presented in our financial statements. We
present our discussion in the MD&A in conjunction with the
accompanying financial statements.
Liquidity, Capital
Resources and Financial Position
–
an analysis of our cash position and
cash flows, as well as a discussion of our financial
obligations.
Our Business
Pure Cycle Corporation is a Colorado corporation that provides
wholesale water and wastewater services to customers of
governmental entities and commercial and industrial customers and
is in the process of providing finished lots to national home
builders developing single family homes on its Sky Ranch land
holdings.
Our utility services include water production, storage, treatment,
bulk transmission to retail distribution systems, wastewater
collection and treatment, irrigation water treatment and
transmission, construction management, billing and collection and
emergency response. Our land operations include developing finished
lots for home builders and commercial users who develop homes and
businesses on our Sky Ranch property.
Water and Wastewater Utilities
Our utility operations position us as a vertically integrated
wholesale water and wastewater provider, which means we own or
control substantially all assets necessary to provide wholesale
water and wastewater services to our customers. This includes
owning or controlling (i) water rights which we use to provide
domestic, irrigation, and industrial water to our wholesale
customers (we own surface water, groundwater, reclaimed water
rights and storage rights), (ii) infrastructure (such as wells,
diversion structures, pipelines, reservoirs and treatment
facilities) required to withdraw, treat, store and deliver water,
(iii) infrastructure required to collect, treat, store and reuse
wastewater, and (iv) infrastructure required to treat and deliver
reclaimed water for irrigation use.
32
We currently provide wholesale water and wastewater service
predominately to two local governmental customers. Our wholesale
domestic customers are the Rangeview District and Arapahoe County.
We provide service to Rangeview District’s end-use customers
pursuant to individual Lowry Service and Off-Lowry Service
Agreements, serving 391 water connections and 157 wastewater
connections located in southeastern metropolitan Denver. In
addition to providing domestic water, we provide untreated water to
industrial customers in the oil and gas industry located in our
service areas and adjacent to our service areas for hydraulic
fracturing. Oil and gas operators have leased approximately 135,000
acres within and adjacent to our service areas for the purpose of
exploring oil and gas interests in the Niobrara and other
formations, and this activity had led to increased water
demands.
We plan to utilize our significant water assets along with our
adjudicated reservoir sites to provide wholesale water and
wastewater services to local governmental entities which in turn
will provide residential/commercial water and wastewater services
to communities along the eastern slope of Colorado in the area
generally referred to as the Front Range. Principally, we target
the I-70 corridor, which is located east of downtown Denver and
south of Denver International Airport. This area is predominately
undeveloped and is expected to experience substantial growth over
the next 30 years.
We also plan to
continue to provide water service to commercial and industrial
customers.
Land Development
Our land development services at Sky Ranch include development of
up to 4,400 single-family and multi-family homes, and over 1.6
million square feet of commercial, retail, and light industrial
development. Sky Ranch will develop in multiple phases over a
number of years. Our first phase of 151 acres is platted for 506
detached single-family residential lots. We have entered into
agreements with three national home builders for the sale of all
506 lots, development of which is anticipated to begin in early
2018, with model homes scheduled for construction in the fall of
2018. We expect to phase the development of our initial 506 lots
beginning with delivery of approximately 150 lots in 2018,
delivering an additional 100 lots in mid-2019 and the balance of
the lots to each builder depending on home sales. We estimate that
build out of our initial 506 lots will take between three and four
years.
In June
2017, we entered into purchase and sale agreements (collectively,
the “Purchase and Sale Contracts”) with three separate
home builders pursuant to which we agreed to sell, and each builder
agreed to purchase, a certain number (totaling 506) of
single-family, detached residential lots at the Sky Ranch property.
We will be developing finished lots for each of the three home
builders (which are lots on which homes are ready to be built that
include roads, curbs, wet and dry utilities, storm drains andother
improvements). Each builder is required to purchase water and sewer
taps for the lots from the Rangeview District, the cost of which
depends on the size of the lot, the size of the house, and the
amount of irrigated turf. Pursuant to the Off-Lowry Service
Agreement, we will receive all of the
water tap fees and wastewater tap fees and 90% of
the monthly service fees and usage fees for wastewater services
received
by the Rangeview District from customers at Sky
Ranch. We will also receive
98% of the
usage fees for water services received by the Rangeview District
from customers at Sky Ranch, after deduction, in most instances, of
the royalty to the Land Board related to the use of the Rangeview
Water Supply.
The closing of the transactions contemplated by each Purchase and
Sale Contract is subject to customary closing conditions,
including, among others, the builder’s completion to its
satisfaction of a title review and other due diligence of the
property, the accuracy of the representations and warranties made
by us in the Purchase and Sale Contract, and a commitment by the
title company to issue to the builder a title policy, subject to
certain conditions. Within three business days of the execution of
each Purchase and Sale Contract, each builder paid an earnest money
deposit. Each builder had a 60-day due diligence period during
which it had the right to terminate the Purchase and Sale Contract
and receive a full refund of its earnest money deposit. The
initial due diligence period was extended; however, on
November 10, 2017, each builder completed its due diligence period
and agreed to continue with its respective Purchase and Sale
Contract. Pursuant to certain Purchase and Sale Contracts, the
builder is required to make an additional earnest money deposit or
deposits after the due diligence period and/or final approval of
the entitlements for the property. The earnest money deposit or
deposits will be applied to the payment of the purchase price of
the lots at closing in accordance with a specified takedown
schedule or be paid to us in the event of certain defaults by a
builder. Pursuant to each Purchase and Sale Contract, we must
obtain final approval of the entitlements for the property by
August 2018 (which date we may extend by six months).
We are obligated pursuant to the Purchase and Sale Contracts, or
separate Lot Development Agreements (the “Lot Development
Agreements” and, together with the Purchase and Sale
Contracts, the “Builder Contracts”), to construct
infrastructure and other improvements, such as roads, curbs and
gutters, park amenities, sidewalks, street and traffic signs, water
and sanitary sewer mains and stubs, storm water management
facilities, and lot grading improvements for delivery of finished
lots to each builder. Pursuant to the Builder Contracts, we must
cause the Rangeview District to install and construct off-site
infrastructure improvements (
i.e.
, drainage and storm water retention ponds, a
wastewater reclamation facility, and wholesale water facilities)
for the provision of water and wastewater service to the property.
In conjunction with our approvals with Arapahoe County for the Sky
Ranch project, we and/or the Rangeview District and the Sky Ranch
Districts are obligated to deposit into an account the anticipated
costs to install and construct substantially all the off-site
infrastructure improvements (which include drainage, wholesale
water and wastewater, and entry roadway), which we estimate will be
approximately $10.2 million.
We estimate the total capital required to develop lots in the first
phase (506 lots) of Sky Ranch is approximately $27.8 million, and
estimate lots sales to home builders to generate $35 million
providing a margin on lots of approximately $7.2 million. Utility
revenues are derived from tap fees (which vary depending on lot
size, house size, and amount of irrigated turf) and usage fees
(which are monthly water and wastewater fees). Our current Sky
Ranch water tap fees are $26,650 (per SFE), and wastewater taps
fees are $4,659 (per SFE).
We have begun design and preliminary engineering for our second
phase which will include approximately 320 acres of residential
development and 160 acres of commercial, retail, and industrial
development along the Interstate-70 frontage. We expect to have
multiple phases being developed concurrently and would expect the
full development of the Sky Ranch project to occur over 10 –
14 years, depending on demand.
Critical Accounting Policies and Use of Estimates
The preparation of financial statements in conformity with
accounting principles generally accepted in the United States of
America (“GAAP”) requires management to make estimates
and assumptions about future events that affect the amounts
reported in the financial statements and accompanying notes. Future
events and their effects cannot be determined with absolute
certainty. Therefore, the determination of estimates requires the
exercise of judgment. Actual results inevitably will differ from
those estimates, and such differences may be material to the
financial statements.
33
The most significant accounting estimates inherent in the
preparation of our financial statements include estimates
associated with the timing of revenue recognition, the impairment
of water assets and other long-lived assets, fair value estimates
and share-based compensation. Below is a summary of these critical
accounting policies.
Revenue Recognition
Our revenues consist mainly of monthly service fees, tap fees,
construction fees, and consulting fees. As further described in
Note 2 –
Summary of Significant
Accounting Policies
to the
accompanying financial statements, proceeds from tap sales and
construction fees are deferred upon receipt and recognized in
income based on whether we own or do not own the facilities
constructed with the proceeds. We recognize tap and construction
fees derived from agreements for which we construct infrastructure
owned by others as revenue, along with the associated costs of
construction, pursuant to the percentage-of-completion method. The
percentage-of-completion method requires management to estimate the
percent of work that is completed on a particular project, which
could change materially throughout the duration of the construction
period and result in significant fluctuations in revenue recognized
during the reporting periods throughout the construction process.
During the fiscal year ended August 31, 2017, we recognized
$203,200 in tap fee revenues associated with the Wild Pointe
acquisition. We did not recognize any tap revenues during the
fiscal years ended August 31, 2016 or 2015.
Tap and construction fees derived from agreements for which we own
the infrastructure are recognized as revenue ratably over the
estimated service life of the assets constructed with said fees.
Although the cash is received up-front and most construction will
be completed within one year of receipt of the proceeds, revenue
recognition may occur over 30 years or more. Management is required
to estimate the service life, and currently the service life is
based on the estimated useful accounting life of the assets
constructed with the tap fees. The useful accounting life of the
asset is based on management’s estimation and may differ from
the actual life of the asset or the actual service life of the tap
due to a variety of factors. This is deemed a reasonable
recognition life of the revenues because the depreciation of the
assets constructed generating those revenues will therefore be
matched with the revenues.
Monthly water usage fees, monthly wastewater service fees, and
consulting fees are recognized in income each month as
earned.
Pursuant to the O&G Lease and the Rangeview Lease, we received
up-front payments which were recognized as other income on a
straight-line basis over the initial term or extension of term, as
applicable, of the leases. The up-front payments we received
subsequent to year end pursuant to the Bison Lease will be
recognized as other income on a straight-line basis over the
initial term of the Bison Lease.
Impairment of Water Assets and Other Long-Lived Assets
We review our long-lived assets for impairment whenever management
believes events or changes in circumstances indicate that the
carrying amount of an asset may not be recoverable. We measure
recoverability of assets to be held and used by a comparison of the
carrying amount of an asset to estimated future undiscounted net
cash flows we expect to be generated by the eventual use of the
asset. If such assets are considered to be impaired and therefore
the costs of the assets deemed to be unrecoverable, the impairment
to be recognized would be the amount by which the carrying amount
of the assets exceeds the estimated fair value of the
assets.
Our water assets will be utilized in the provision of water
services which inevitably will encompass many housing and economic
cycles. Our service capacities are quantitatively estimated based
on an average single family home consuming approximately 0.2 acre
feet of water per year. Average water deliveries are approximately
0.4 acre feet; however, approximately 50% or 0.2 acre feet are
returned and available for reuse. Our water supplies are legally
decreed to us through the water court. The water court decree
allocates a specific amount of water (subject to continued
beneficial use) which historically has not changed. Thus,
individual housing and economic cycles typically do not have an
impact on the number of connections we can serve with our supplies
or the amount of water legally decreed to us relating to these
supplies.
We report assets to be disposed of at the lower of the carrying
amount or fair value less costs to sell.
Our Water Rights –
We
determine the undiscounted cash flows for our Denver-based assets
by estimating tap sales to potential new developments in our
service areas and along the Front Range, using estimated future tap
fees less estimated costs to provide water services, over an
estimated development period. Actual new home development in our
service areas and the Front Range, actual future tap fees, and
actual future operating costs inevitably will vary significantly
from our estimates, which could have a material impact on our
financial statements as well as our results of operations. We
performed an impairment analysis as of August 31, 2017, and
determined there were no material changes and that our Denver-based
assets are not impaired and their costs are deemed recoverable. Our
impairment analysis is based on development occurring within areas
in which we have agreements to provide water services utilizing
water rights owned by us (e.g., Sky Ranch and the Lowry Range) as
well as in surrounding areas, including the Front Range and the
I-70 corridor. Our combined Rangeview Water Supply and Sky Ranch
water assets have a carrying value of $34.6 million as of August
31, 2017. Based on the carrying value of our water rights, the
long-term and uncertain nature of any development plans, current
tap fees of $24,974 and estimated gross margins, we estimate that
we would need to add approximately 2,300 new water connections
(requiring 4% of our portfolio) to generate net revenues sufficient
to recover the costs of our Rangeview Water Supply and Sky Ranch
water. If tap fees increase 5%, we would need to add approximately
2,200 new water taps (requiring 3.8% of our portfolio) to recover
the costs of our Rangeview Water Supply and Sky Ranch water. If tap
fees decrease 5%, we would need to add approximately 2,400 new
water taps (requiring 4.2% of our portfolio) to recover the costs
of our Rangeview Water Supply and Sky Ranch
water.
34
Although the timing of actual new home development throughout the
Front Range will impact our estimated tap sale projections, it will
not alter our water ownership, our service obligations to existing
properties or the number of SFEs we can service.
Fair Value Estimates
Fair value is defined as the price that would be received to sell
an asset or paid to transfer a liability in an orderly transaction
between market participants at the measurement date in the
principal or most advantageous market. We generally use a fair
value hierarchy that has three levels of inputs, both observable
and unobservable, with use of the lowest possible level of input to
determine fair value.
See
Note 3 –
Fair Value Measurements
to the accompanying financial
statements.
Share-based Compensation
We estimate the fair value of share-based payment awards made to
key employees and directors on the date of grant using the
Black-Scholes option-pricing model. We then expense the fair value
over the vesting period of the grant using a straight-line expense
model. The fair value of share-based payments requires management
to estimate/calculate various inputs such as the volatility
of the underlying stock, the expected dividend rate, the estimated
forfeiture rate and an estimated life of each option. We do not
expect any forfeiture of option grants; therefore, the compensation
expense has not been reduced for estimated forfeitures. These
assumptions are based on historical trends and estimated future
actions of option holders and may not be indicative of actual
events which may have a material impact on our financial
statements. For further details on share-based compensation
expense, see Note 8 –
Shareholders’
Equity
to the accompanying
financial statements.
Results of Operations
Executive Summary
The results of our operations for the fiscal years ended August 31,
2017, 2016 and 2015 were as follows:
|
Table G - Summary of Results of Operations
|
|||||||
|
|
|
|
|
Change
|
|||
|
|
Fiscal
Years Ended August 31,
|
2017-2016
|
2016-2015
|
||||
|
|
2017
|
2016
|
2015
|
$
|
%
|
$
|
%
|
|
Millions
of gallons of water delivered
|
94.6
|
33.9
|
97.5
|
60.7
|
179
%
|
(63.6
)
|
-65
%
|
|
Water
revenues generated
|
$
825,100
|
$
221,000
|
$
970,000
|
$
604,100
|
273
%
|
$
(749,000
)
|
-77
%
|
|
Water
tap fee revenue
|
217,500
|
14,300
|
14,300
|
203,200
|
1421%
|
-
|
-
|
|
Water
delivery operating costs incurred
|
|
|
|
|
|
|
|
|
(excluding depreciation and depletion)
|
$
332,400
|
$
264,400
|
$
464,900
|
$
68,000
|
26
%
|
$
(200,500
)
|
-43
%
|
|
Water delivery gross margin %
|
60
%
|
-20
%
|
52
%
|
|
|
|
|
|
|
|
|
|
|
|
|
|
|
Wastewater
treatment revenues
|
$
45,100
|
$
43,700
|
$
50,100
|
$
1,400
|
3
%
|
$
(6,400
)
|
-13
%
|
|
Wastewater
treatment operating costs incurred
|
$
28,600
|
$
29,200
|
$
66,700
|
$
(600
)
|
-2
%
|
$
(37,500
)
|
-56
%
|
|
Wastewater treatment gross margin %
|
37
%
|
33
%
|
-33
%
|
|
|
|
|
|
|
|
|
|
|
|
|
|
|
Other
income
|
$
98,600
|
$
131,700
|
$
120,700
|
$
(33,100
)
|
-25
%
|
$
11,000
|
9
%
|
|
Other
income costs incurred
|
$
61,900
|
$
68,500
|
$
55,200
|
$
(6,600
)
|
-10
%
|
$
13,300
|
24
%
|
|
Other income gross margin %
|
37
%
|
48
%
|
54
%
|
|
|
|
|
|
|
|
|
|
|
|
|
|
|
General
and administrative expenses
|
$
2,201,700
|
$
1,849,700
|
$
1,939,400
|
$
352,000
|
19
%
|
$
(89,700
)
|
-5
%
|
|
|
|
|
|
|
|
|
|
|
(Loss)
income from continuing operations
|
$
(1,678,900
)
|
$
(1,230,300
)
|
$
(575,100
)
|
$
(448,600
)
|
36
%
|
$
(655,200
)
|
114
%
|
|
Loss
from discontinued operations
|
$
(32,000
)
|
$
(80,300
)
|
$
(22,552,800
)
|
$
48,300
|
-60
%
|
$
22,472,500
|
-100
%
|
|
Net
loss
|
$
(1,710,900
)
|
$
(1,310,600
)
|
$
(23,127,900
)
|
$
(400,300
)
|
31
%
|
$
21,817,300
|
-94
%
|
Changes in Revenues and Gross Margin
We generate revenues from water and wastewater services. Water and
wastewater revenues are generated from (i) monthly wholesale water
usage fees and wastewater service fees, (ii) one-time water and
wastewater tap fees and construction fees, and (iii) consulting
fees.
35
Water and Wastewater Revenues –
Our water deliveries increased 179% in fiscal 2017
compared to fiscal 2016 and decreased 65% in fiscal 2016 compared
to fiscal 2015. Water revenues increased 273% in fiscal 2017
compared to fiscal 2016 and decreased 77% in fiscal 2016 compared
to fiscal 2015. The changes in deliveries and sales were primarily
due to the changes in demand for water to be used for oil and gas
activities – namely, fracking wells drilled into the Niobrara
Formation. Additionally, during fiscal 2017, we acquired the
service rights for the Wild Pointe water system, which increased
our revenue by $268,800 from fiscal 2016. The following table
details the sources of our water sales, the number of kgal (1,000
gallons) sold, and the average price per kgal for fiscal 2017,
fiscal 2016, and fiscal 2015.
|
Table H - Water Revenue Summary
|
|||||||||
|
|
2017
|
2016
|
2015
|
||||||
|
Customer
Type
|
Sales
(in thousands)
|
kgal
|
Average
per kgal
|
Sales
(in thousands)
|
kgal
|
Average
per kgal
|
Sales
(in thousands)
|
kgal
|
Average
per kgal
|
|
On-Site
|
$
174.6
|
26,996.1
|
$
6.47
|
$
149.1
|
26,620.8
|
$
5.60
|
$
137.3
|
20,821.7
|
$
6.59
|
|
Export-Commercial
|
106.4
|
10,020.0
|
10.62
|
71.3
|
7,216.2
|
9.88
|
50.0
|
4,158.4
|
12.02
|
|
Wild
Pointe
|
65.6
|
11,388.4
|
5.76
|
-
|
-
|
-
|
-
|
-
|
-
|
|
Industrial/Fracking
|
478.5
|
46,146.2
|
10.37
|
0.6
|
58.2
|
10.31
|
782.7
|
72,557.6
|
10.79
|
|
|
$
825.1
|
94,550.7
|
$
8.73
|
$
221.0
|
33,895.2
|
$
6.52
|
$
970.0
|
97,537.7
|
$
9.94
|
Our
gross margin on delivering water (not including depletion charges)
was 59% in fiscal 2017, negative 20% in fiscal 2016 and 52% during
fiscal 2015. The changes in our gross margins were due to changes
in demand related to water sales to the fracking industry and our
ability to offset the ECCV system costs with increased water
deliveries in fiscal 2017 and fiscal 2015.
Our wastewater fees increased 3% in fiscal 2017 compared to fiscal
2016 and decreased 13% in fiscal 2016 compared to fiscal 2015.
Wastewater fee fluctuations result from demand changes from our
only customer.
We sold 10 water taps during fiscal 2017, which generated revenues
of approximately $203,200 that are included in water tap fee sales
in the statement of comprehensive loss. We did not sell any
wastewater taps during fiscal 2017. We did not sell any water or
wastewater taps during fiscal 2016 or 2015.
Other income consisted principally of consulting fees of $98,600,
$131,700, and $85,800 for the fiscal years ended August 31, 2017,
2016, and 2015, respectively, which are recognized upon the
rendering of our services. Our consulting fees decreased 25% in
fiscal 2017 compared to fiscal 2016 and increased 54% in fiscal
2016 compared to fiscal 2015. The decrease in fees during fiscal
2017 is due to a reduction in the amount of consulting billings
from water systems we managed in fiscal 2017 compared to fiscal
2016. The increase in fees in fiscal 2016 was the result of an
increase in the number of water systems we managed in fiscal 2016
compared to fiscal 2015. During the fiscal year ended August 31,
2015, we also received income related to a cost-sharing arrangement
from our industrial water sales related to the fracking industry in
the amount of $34,900. Our margins have fluctuated as we allocated
additional staff costs to system management.
General and Administrative Expenses
Table I details significant items, and changes, included in our
General and Administrative Expenses (“G&A
Expenses”) as well as the impact that share-based
compensation has on our G&A Expenses for the fiscal years ended
August 31, 2017, 2016 and 2015, respectively.
36
|
Table I - G&A Expenses
|
|||||||
|
|
|
|
|
Change
|
|||
|
|
Fiscal
Years Ended August 31,
|
2017-2016
|
2016-2015
|
||||
|
|
2017
|
2016
|
2015
|
$
|
%
|
$
|
%
|
|
Significant
G&A Expense items:
|
|
|
|
|
|
|
|
|
Salary and salary-related expenses
|
$
1,389,700
|
$
1,084,300
|
$
1,234,100
|
$
305,400
|
28
%
|
$
(149,800
)
|
-12
%
|
|
Professional fees
|
237,000
|
250,900
|
291,400
|
(13,900
)
|
-6
%
|
(40,500
)
|
-14
%
|
|
Fees paid to directors including insurance
|
131,100
|
134,400
|
140,400
|
(3,300
)
|
-2
%
|
(6,000
)
|
-4
%
|
|
Insurance
|
29,900
|
35,900
|
31,600
|
(6,000
)
|
-17
%
|
4,300
|
14
%
|
|
Public entity related expenses
|
134,700
|
109,500
|
83,200
|
25,200
|
23
%
|
26,300
|
32
%
|
|
Consulting fees
|
11,200
|
5,700
|
18,300
|
5,500
|
96
%
|
(12,600
)
|
-69
%
|
|
Property taxes
|
7,500
|
9,200
|
7,400
|
(1,700
)
|
-18
%
|
1,800
|
24
%
|
|
All other components of G&A combined
|
260,700
|
219,800
|
133,000
|
40,900
|
19
%
|
86,800
|
65
%
|
|
G&A
Expenses as reported
|
2,201,800
|
1,849,700
|
1,939,400
|
352,100
|
19
%
|
(89,700
)
|
-5
%
|
|
Share-based
compensation
|
(233,200
)
|
(219,900
)
|
(240,000
)
|
(13,300
)
|
6
%
|
20,100
|
-8
%
|
|
G&A
Expenses less share-based compensation
|
$
1,968,600
|
$
1,629,800
|
$
1,699,400
|
$
338,800
|
21
%
|
$
(69,600
)
|
-4
%
|
|
|
|
|
|
|
|
|
|
|
Note
- salary and salary-related expenses excluding share-based
compensation:
|
|
|
|
|
|
|
|
|
Salary and salary-related expenses
|
$
1,156,500
|
$
864,400
|
$
994,100
|
$
292,100
|
34
%
|
$
(129,700
)
|
-13
%
|
Salary and Salary-Related Expenses
– Salary and salary-related expenses
increased by 28% during fiscal 2017 as compared to fiscal 2016 and
decreased by 12% during fiscal 2016 as compared to fiscal 2015. The
increase in fiscal 2017 compared to fiscal 2016 was the result of
the increase from seven to 11 employees, as a result of the
development of our Sky Ranch property and the addition of the Wild
Pointe water system. The decrease in fiscal 2016 compared to fiscal
2015 was the result of us paying lower bonuses, offset by the
addition of one operator, during fiscal 2016. As noted on the
bottom line of Table I, salary and salary-related expenses
excluding share-based compensation expenses increased 34% during
fiscal 2017 compared to fiscal 2016 and decreased 13% during fiscal
2016 compared to fiscal 2015. Share-based compensation expense
increased 6% during fiscal 2017 compared to fiscal 2016 as a result
of an increase in the number of members on the board of directors.
Share-based compensation expenses decreased 8% during fiscal 2016
compared to fiscal 2015 as a result of the complete recognition of
options issued to management during fiscal 2013, which occurred
over a period of less than 12 months during fiscal
2016.
Professional Fees (mainly legal and accounting fees)
– Professional fees decreased 6%
and 14% during fiscal 2017 compared to fiscal 2016 and fiscal 2016
compared to fiscal 2015, respectively. The decreases were primarily
the result of decreases in general legal fees in both fiscal 2017
and fiscal 2016 compared to fiscal 2016 and fiscal 2015,
respectively.
Fees Paid to Our Board of Directors
– Fees for our board in fiscal 2017 include
$55,600 for premiums related to our directors and officers
insurance policy (this amount increased by $1,200 from fiscal
2016). The remaining fiscal 2017 fees of $74,500 represent amounts
accrued to our board members for annual service, meeting attendance
fees and travel expenses, which were lower than in fiscal 2016 due
to a decrease in the number of board meetings held in 2017. Fees
for our board in fiscal 2016 include $54,400 for premiums related
to our directors and officers insurance policy (this amount
increased by $4,000 from fiscal 2015). The remaining fiscal 2016
fees of $80,000 represent amounts accrued to our board members for
annual service, meeting attendance fees and travel expenses, which
were somewhat lower than in fiscal 2015 due to a decrease in the
number of board meetings held in 2016. Fees for our board in fiscal
2015 include $50,500 for premiums related to our directors and
officers insurance policy (this amount increased by $1,000 from
fiscal 2014). The remaining fiscal 2015 fees of $89,900 represent
amounts accrued to our board members for annual service, meeting
attendance fees and travel expenses, which were higher than in
fiscal 2014 due to changing from expensing annual director fees
when paid to expensing annual director fees ratably throughout the
calendar year.
Insurance –
We maintain
policies for general liability insurance, workers’
compensation insurance, and casualty insurance to protect our
assets. Insurance expense fluctuates based on the number of
employees and premiums associated with insuring our water
systems.
Public Entity Expenses
–
Costs associated with being a corporation and costs associated with
being a publicly traded entity consist primarily of XBRL and Edgar
conversion fees, stock exchange fees, and press releases. These
costs fluctuate from year to year.
37
Consulting Fees –
Consulting fees for fiscal 2017 consisted of
$6,300 for information technology and other services and $4,900 for
valuation services. Consulting fees for fiscal 2016 consisted of
$5,000 for board advisory services and $700 related to the
development of the Sky Ranch water agreements. Consulting fees for
fiscal 2015 consisted of $10,000 for board advisory services,
$3,800 related to developing Sky Ranch, and $4,500 related to the
development of the Sky Ranch Districts.
Property Taxes
– Our
property taxes relate to our Sky Ranch and Rangeview properties and
were approximately $7,500 in fiscal 2017. These taxes are based on
estimated taxes paid in arrears and vary slightly from year to year
based on actual assessments.
Other G&A Expenses
–
Other G&A expenses include typical operating expenses related
to the maintenance of our office, business development, and travel,
and funding provided to the Rangeview District and the Sky Ranch
Districts. Other G&A increased 19% and 65% during fiscal 2017
compared to fiscal 2016 and fiscal 2016 compared to fiscal 2015,
respectively. The changes were primarily the result of the timing
of various expenses.
Other Income and Expense Items
|
Table J - Other Items
|
|||||||
|
|
|
|
|
Change
|
|||
|
|
For the
Fiscal Years Ended August 31,
|
2017-2016
|
2016-2015
|
||||
|
|
2017
|
2016
|
2015
|
$
|
%
|
$
|
%
|
|
Other
income items:
|
|
|
$
19
|
|
|
|
|
|
Oil and gas lease income, net
|
$
18,800
|
$
360,800
|
$
645,700
|
$
(342,000
)
|
-95
%
|
$
(284,900
)
|
-44
%
|
|
Oil and gas royalty income, net
|
$
186,600
|
$
343,600
|
$
412,600
|
$
(157,000
)
|
-46
%
|
$
(69,000
)
|
-17
%
|
|
Interest income
|
$
257,500
|
$
241,300
|
$
21,300
|
$
16,200
|
7
%
|
$
220,000
|
1033
%
|
|
Other
|
$
(10,500
)
|
$
3,900
|
$
22,100
|
$
(14,400
)
|
-369
%
|
$
(18,200
)
|
-82
%
|
The $18,800, $360,800, and $645,700 of oil and gas lease payments
recognized in fiscal 2017, fiscal 2016, and fiscal 2015,
respectively, primarily represent the deferred recognition of the
up-front payments received in March 2011 and February 2014, upon
the signing of the O&G Lease and Surface Use Agreement and
related extension. The amounts also represent the up-front payments
received for the Rangeview Lease. On March 10, 2011 we received an
up-front payment of $1,243,400 for the purpose of exploring for,
developing, producing and marketing oil and gas on 634 acres of
mineral estate we own at our Sky Ranch property. The oil and gas
rights under the remaining approximately 300 acres at Sky Ranch
were already owned by a third party. We deferred immediate
recognition of the up-front payment and began recognizing the
up-front payment in income over the initial three-year term of the
O&G Lease beginning March 10, 2011. During February 2014, we
received an additional payment of $1,243,400 to extend the initial
term of the O&G Lease by an additional two years through
February 2016. The income received for the extension was recognized
in income over the two-year extension term of the O&G
Lease.
The oil and gas royalty income represents amounts received pursuant
to the O&G Lease. The amount for fiscal 2015 includes royalties
from oil production from commencement of each well through August
15, 2015, which represents approximately six months of production.
The amounts for fiscal 2017 and 2016 include royalties of each well
from August 16th through August 15th, during each year,
respectively. The first well (referred to as “Sky
Ranch” in the chart below) generated oil and gas royalty
revenue of approximately $147,300, $266,600 and $321,800, 20% gross
(net of taxes), based on the Company’s 3/8
ths
interest of the total production of
this 1,280-acre pooled mineral estate during the fiscal years ended
August 31, 2017, 2016 and 2015, respectively. This 10,000-foot
horizontal well recorded production of approximately 33,600, 80,400
and 105,000 barrels of oil for the fiscal years ended August 31,
2017, 2016 and 2015, respectively. The second well (referred to as
“Property” in the chart below) generated oil and gas
royalty revenue of approximately
$41,300,
$77,000 and $90,800, 20% gross (net of taxes), based on the
Company’s 1/8
ths
interest of the total production of
this 1,280-acre pooled mineral estate during the fiscal years ended
August 31, 2017, 2016 and 2015, respectively. This 10,000-foot
horizontal well recorded production of
approximately
33,800,
73,400
and 88,600 barrels of oil for the fiscal years ended August 31,
2017, 2016 and 2015, respectively.
The following charts
detail well production and oil and gas royalties during fiscal
2015, fiscal 2016, and fiscal 2017.
38

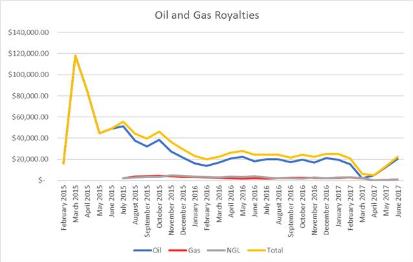
Interest income represents interest earned on the temporary
investment of capital in cash equivalents or available-for-sale
securities, interest accrued on the notes receivable from the
Rangeview District and the Sky Ranch District, and interest accrued
on the Special Facilities construction proceeds receivable from
Arapahoe County.
The
increase from fiscal 2015 compared to fiscal 2016 and fiscal 2017
is due to the receipt of interest on investments related to the
proceeds from the sale of our farms.
Other represents income we received for various easements and the
construction of infrastructure for the oil and gas industry, which
is partially offset by other non-operational expenses.
Discontinued Operations
For additional information about our discontinued operations, see
Note 2
–
Summary of Significant Account Policies
to the accompanying
financial statements.
39
The following table provides the components of discontinued
operations:
|
Table K - Discontinued Operations Statements of
Operations
|
|||
|
|
|
|
|
|
|
Fiscal years ended August 31,
|
||
|
|
2017
|
2016
|
2015
|
|
Farm
revenues
|
$
6,848
|
$
267,472
|
$
1,127,155
|
|
Farm
expenses
|
(1,298
)
|
(77,132
)
|
(126,279
)
|
|
Gross profit
|
5,550
|
190,340
|
1,000,876
|
|
|
|
|
|
|
General
and administrative expenses
|
(46,942
)
|
(313,389
)
|
(760,192
)
|
|
Operating (loss) profit
|
(41,392
)
|
(123,049
)
|
240,684
|
|
Finance
charges
|
9,367
|
38,428
|
21,710
|
|
(Loss)
gain on sale of farm assets
|
-
|
4,273
|
(22,108,145
)
|
|
Interest
expense (1)
|
-
|
-
|
(390,505
)
|
|
Interest
imputed on the Tap Participation
|
|
|
|
|
Fee payable to HP A&M (2)
|
-
|
-
|
(23,816
)
|
|
Taxes
|
|
|
(292,729
)
|
|
Loss from discontinued operations
|
$
(32,025
)
|
$
(80,348
)
|
$
(22,552,801
)
|
(1)
Interest
expense represents interest accrued related to notes we had on our
farm assets prior to the sale. All notes associated with the farms
have been paid off, and thus we no longer incur interest on such
notes.
(2)
Imputed
interest represents an estimate of the interest accrued on the Tap
Participation Fee payable to HP A&M, which was eliminated as a
result of the settlement with HP A&M during the three months
ended February 28, 2015. As a result, we stopped accruing interest
related to the Tap Participation Fee on that date.
We anticipate continued expenses through the end of calendar 2018
related to the discontinued operations. We will continue to receive
revenues for leased agricultural land and incur expenses related to
the remaining agricultural land we own and for the purpose of
collecting outstanding receivables. We intend to sell the remaining
farms that we acquired during fiscal 2016 in due
course.
Liquidity, Capital Resources and Financial Position
At August 31, 2017, our working capital, defined as current assets
less current liabilities, was $26.2 million, which includes $5.6
million in cash and cash equivalents. We believe that as of the
date of the filing of this annual report on Form 10-K and as of
August 31, 2017, we have sufficient working capital to fund our
operations for the next 12 months.
ECCV Capacity Operating System
Pursuant to a 1982 contractual right, the Rangeview District may
purchase water produced from the ECCV Land Board system, which is
comprised of eight wells and more than 10 miles of buried water
pipeline located on the Lowry Range. In May 2012, in order to
increase the delivery capacity and reliability of these wells, in
our capacity as the Rangeview District’s service provider and
the Export Water Contractor (as defined in the Lease among us, the
Rangeview District and the Land Board), we entered into an
agreement to operate and maintain the ECCV facilities, allowing us
to utilize the system to provide water to commercial and industrial
customers, including customers providing water for drilling and
hydraulic fracturing of oil and gas wells. Our costs associated
with the use of the ECCV system are a flat monthly fee of $8,000
per month from January 1, 2013 through December 31, 2020, and will
decrease to $3,000 per month from January 1, 2021 through April
2032. Additionally, we pay a fee per 1,000 gallons of water
produced from ECCV’s system, which is included in the water
usage fees charged to customers. In addition, the ECCV system costs
us approximately $1,900 per month to maintain.
South Metropolitan Water Supply Authority and WISE
SMWSA is a municipal water authority in the State of Colorado
organized to pursue the acquisition and development of new water
supplies on behalf of its members, including the Rangeview
District. Pursuant to the SMWSA Participation Agreement with the
Rangeview District, we agreed to provide funding to the Rangeview
District in connection with its membership in the SMWSA. During the
fiscal years ended August 31, 2017, 2016 and 2015, we provided
$198,200, $113,600, and $78,600, respectively, of funding to the
Rangeview District pursuant to the SMWSA Participation Agreement.
In July 2013, the Rangeview District together with nine other SMWSA
members formed an entity to enable its members to participle in
WISE and entered into an agreement that specifies each
member’s pro rata share of WISE and the members’ rights
and obligations with respect to WISE. On December 31, 2013,
SMWA, Denver Water and Aurora Water entered into the WISE
Partnership Agreement, which provides for the purchase of certain
infrastructure (pipelines, water storage facilities, water
treatment facilities, and other appurtenant facilities) to deliver
water to and among the 10 members of the SMWA, Denver Water and
Aurora Water. We have entered into the WISE Financing Agreement,
which obligates us to fund the Rangeview District’s cost of
participating in WISE. In exchange for funding the Rangeview
District’s obligations in WISE, we will have the sole right
to use and reuse the Rangeview District’s 7% share of the
WISE water and infrastructure to provide water service to the
Rangeview District’s customers and to receive the revenue
from such service. Upon completion of the WISE infrastructure in
2017, we expect to be entitled to approximately 3 million
gallons per day of transmission pipeline capacity and 500 acre feet
per year of water. In addition to the funding we have provided to
the Rangeview District pursuant to the SMWSA Participation
Agreement, to date we have provided approximately $3.1 million of
financing to the Rangeview District to fund its obligation to
finance the purchase of infrastructure for WISE and the
construction of a connection to the WISE system in accordance with
the WISE Financing Agreement. We anticipate that we will be
spending approximately $645,500 in this system during fiscal 2018
and $4.6 million during the next four years to fund the Rangeview
District’s purchase of its share of the water transmission
line and additional facilities, water and related assets for
WISE.
40
Summary Cash Flows Table
|
Table L - Summary Cash Flows
|
|||||||
|
|
|
|
|
Change
|
|||
|
|
For the
Fiscal Years Ended August 31,
|
2017-2016
|
2016-2015
|
||||
|
|
2017
|
2016
|
2015
|
$
|
%
|
$
|
%
|
|
Cash
(used in) provided by:
|
|
|
|
|
|
|
|
|
Operating acitivites
|
$
(1,052,900
)
|
$
(270,700
)
|
$
(974,100
)
|
$
(782,200
)
|
-289
%
|
$
703,400
|
-72
%
|
|
Investing activities
|
$
1,933,800
|
$
(32,119,000
)
|
$
42,531,700
|
$
34,052,800
|
-106
%
|
$
(74,650,700
)
|
-176
%
|
|
Financing activities
|
$
(2,400
)
|
$
(2,000
)
|
$
(6,218,200
)
|
$
(400
)
|
-20
%
|
$
6,216,200
|
-100
%
|
Changes in Operating Activities –
Operating activities include revenues we receive
from the sale of wholesale water and wastewater services, costs
incurred in the delivery of those services, G&A Expenses, and
depletion/depreciation expenses.
Cash used in operations in fiscal 2017 increased by $782,200, which
was primarily the result of an increase in salary and salary
related expenses and consulting expenses as compared to fiscal
2016. Cash used in operations in fiscal 2016 decreased by $703,400
compared to fiscal 2015, which was primarily the result of
receiving the remaining escrow from the sale of our farms of
approximately $1.3 million. We will continue to provide wholesale
domestic water and wastewater services to customers in our service
areas, and we will continue to operate and maintain our water and
wastewater systems with our own employees.
Changes in Investing Activities
–
Investing activities in fiscal 2017 consisted of
investments in our water and wastewater systems of approximately
$2.5 million, pipelines of approximately $4.4 million
(approximately $300 thousand was expended for the pipeline in
fiscal 2016 and was reclassified from construction in progress to
fixed assets when the pipeline was placed into service), the
development of our Sky Ranch land of approximately $900,000, and
new equipment of approximately $100,000. The investments in new
assets were offset by the sale of marketable securities of
approximately $9.8 million.
Investing activities in fiscal 2016 consisted of
the investments in our water and wastewater systems and land of
approximately $1.2 million, the purchase of equipment of
approximately $472,300, and the net investment of approximately $30
million into U.S. treasuries and certificates of
deposit.
Investing activities in fiscal 2015 consisted of
the sale of our farms, which generated proceeds of approximately
$44.6 million, and the addition of approximately $2.1 million in
water assets, which primarily consisted of the investment in WISE
of approximately $2.5 million ($1.4 million acquired through the
WISE Financing Agreement) and the addition of pipelines and other
water infrastructure of approximately $1
million.
Changes in Financing Activities
–
Financing activities in fiscal 2017 and 2016
consisted only of payments to our contingent liability holders of
approximately $2,400 and $2,000, respectively. Financing activities
in fiscal 2015 consisted primarily of payments on our promissory
notes of $8.9 million (which includes funding of the WISE Financing
Agreement entered into in December 2014) and the issuance of
approximately $2.7 million in new promissory
notes.
41
Off-Balance Sheet Arrangements
Our off-balance sheet arrangements consist entirely of the
contingent portion of the Comprehensive Amendment Agreement No. 1
(the “CAA”) which is $673,000, as described in Note 5
–
Participating Interests in
Export Water
to the
accompanying financial statements. The contingent liability is not
reflected on our balance sheet because the obligation to pay the
CAA is contingent on sales of Export Water, the amounts and timing
of which are not reasonably determinable.
Recently Adopted and Issued Accounting Pronouncements
See Note 2 –
Summary of Significant
Accounting Policies
to the
accompanying financial statements for recently adopted and issued
accounting pronouncements.
Total Contractual Cash Obligations
|
Table M - Contractual Cash Obligations
|
|||||
|
|
|
Payments
due by period
|
|||
|
|
Total
|
Less
than 1 year
|
1-3
years
|
3-5
years
|
More
than 5 years
|
|
Operating
lease obligations (a)
|
$
12,000
|
$
12,000
|
(a)
|
(a)
|
(a)
|
|
Participating
Interests in Export Water (b)
|
344,000
|
(b)
|
(b)
|
(b)
|
(b)
|
|
WISE
participation (c)
|
5,220,000
|
649,100
|
3,542,500
|
1,032,300
|
(c)
|
|
Total
|
$
5,576,000
|
$
661,100
|
$
3,542,500
|
$
1,032,300
|
$-
|
(a)
Our
only operating lease is related to our office space. We occupy
2,500 square feet at a cost of $3,000, per month, at the address
shown on the cover of this Form 10-K. We lease these premises
pursuant to a two-year operating lease agreement which expires in
December 2018 with a third party.
(b)
The
participating interests liability is payable to the CAA holders
upon the sale of Export Water; therefore, the timing of the
payments is uncertain and not reflected in the above table by
period.
(c)
Projections
for WISE participation have only been provided for the next five
fiscal years. The timing and amount of payments beyond five years
is uncertain and not reflected in the above table by
period.
General
We have limited exposure to market risks from instruments that may
impact our balance sheets, statements of comprehensive loss, and
statements of cash flows. Such exposure is due primarily to
changing interest rates.
Interest Rates
The primary objective for our investment activities is to preserve
principal while maximizing yields without significantly increasing
risk. This is accomplished by investing in diversified short-term
interest bearing investments. As of August 31, 2017, we are holding
$20.2 million in marketable securities consisting of certificates
of deposit and U.S. treasury notes. We have no investments
denominated in foreign country currencies; therefore, our
investments are not subject to foreign currency exchange rate
risk.
42
Index to Consolidated Financial Statements and Supplementary
Data
|
|
|
|
|
Page
|
|
Reports of Independent Registered Public Accounting
Firm
|
F-1
|
|
Consolidated Balance Sheets
|
F-3
|
|
Consolidated Statements of Comprehensive Loss
|
F-4
|
|
Consolidated Statements of Shareholders’ Equity
|
F-5
|
|
Consolidated Statements of Cash Flows
|
F-6
|
|
Notes to Consolidated Financial Statements
|
F-7
|
43
Report of Independent Registered Public Accounting
Firm
To the
Shareholders and Board of Directors of Pure Cycle
Corporation:
We have audited the accompanying balance sheet of Pure Cycle
Corporation (the “Company”) as of August 31, 2017, and
the related statements of comprehensive loss, shareholders' equity,
and cash flows for the year then ended August 31, 2017. We also
have audited the Company’s internal control over financial
reporting as of August 31, 2017, based on criteria established in
the 2013 Internal Control – Integrated Framework issued by
the Committee of Sponsoring Organizations of the Treadway
Commission ("COSO"). The Company’s management is responsible
for these financial statements, for maintaining effective internal
control over financial reporting, and for its assessment of the
effectiveness of internal control over financial reporting,
included in the accompanying “Management’s Annual
Report on Internal Control over Financial Reporting.” Our
responsibility is to express an opinion on these financial
statements and an opinion on the Company's internal control over
financial reporting based on our audits.
We conducted our audits in accordance with the standards of the
Public Company Accounting Oversight Board (United States). Those
standards require that we plan and perform the audits to obtain
reasonable assurance about whether the financial statements are
free of material misstatement and whether effective internal
control over financial reporting was maintained in all material
respects. Our audits of the financial statements included
examining, on a test basis, evidence supporting the amounts and
disclosures in the financial statements, assessing the accounting
principles used and significant estimates made by management, and
evaluating the overall financial statement presentation. Our audit
of internal control over financial reporting included obtaining an
understanding of internal control over financial reporting,
assessing the risk that a material weakness exists, and testing and
evaluating the design and operating effectiveness of internal
control based on the assessed risk. Our audits also included
performing such other procedures as we considered necessary in the
circumstances. We believe that our audits provide a reasonable
basis for our opinions.
A company's internal control over financial reporting is a process
designed to provide reasonable assurance regarding the reliability
of financial reporting and the preparation of financial statements
for external purposes in accordance with generally accepted
accounting principles. A company's internal control over financial
reporting includes those policies and procedures that (1) pertain
to the maintenance of records that, in reasonable detail,
accurately and fairly reflect the transactions and dispositions of
the assets of the company; (2) provide reasonable assurance that
transactions are recorded as necessary to permit preparation of
financial statements in accordance with generally accepted
accounting principles, and that receipts and expenditures ofthe
company are being made only in accordance with authorizations of
management and directors of the company; and (3) provide reasonable
assurance regarding prevention or timely detection of unauthorized
acquisition, use, or disposition of the company's assets that could
have a material effect on the financial statements.
Because of its inherent limitations, internal control over
financial reporting may not prevent or detect misstatements. Also,
projections of any evaluation of effectiveness to future periods
are subject to the risk that controls may become inadequate because
of changes in conditions, or that the degree of compliance with the
policies or procedures may deteriorate.
In our opinion, the financial statements referred to above present
fairly, in all material respects, the financial position of Pure
Cycle Corporation as of August 31, 2017, and the results of its
operations and its cash flows for the year ended August 31, 2017 in
conformity with accounting principles generally accepted in the
United States of America. Also in our opinion, the Company
maintained, in all material respects, effective internal control
over financial reporting as of August 31, 2017, based on criteria
established in the 2013 Internal Control – Integrated
Framework issued by COSO.
/s/
Crowe Horwath LLP
Denver,
Colorado
November
15,
2017
F-1
REPORT OF INDEPENDENT REGISTERED PUBLIC ACCOUNTING
FIRM
Board of Directors and Shareholders
Pure Cycle Corporation
We have audited the accompanying consolidated balance sheet of Pure
Cycle Corporation as of August 31, 2016, and the related
consolidated statements of comprehensive loss, shareholders'
equity, and cash flows for each of the years in the two-year period
ended August 31, 2016. Pure Cycle Corporation's management is
responsible for these financial statements. Our responsibility is
to express an opinion on these financial statements based on our
audits.
We conducted our audits in accordance with the standards of the
Public Company Accounting Oversight Board (United States). Those
standards require that we plan and perform the audit to obtain
reasonable assurance about whether the financial statements are
free of material misstatement. An audit includes examining, on a
test basis, evidence supporting the amounts and disclosures in the
financial statements. An audit also includes assessing the
accounting principles used and significant estimates made by
management, and evaluating the overall financial statement
presentation. We believe that our audits provide a reasonable basis
for our opinion.
In our opinion, the consolidated financial statements referred to
above present fairly, in all material respects, the financial
position of Pure Cycle Corporation as of August 31, 2016, and the
results of its operations and its cash flows for each of the years
in the two-year period ended August 31, 2016 in conformity with
accounting principles generally accepted in the United States of
America.
/s/ GHP HORWATH, P.C
Denver, Colorado
October 27, 2016
F-2
PURE
CYCLE CORPORATION
CONSOLIDATED
BALANCE SHEETS
|
ASSETS:
|
August 31, 2017
|
August 31, 2016
|
|
Current
assets:
|
|
|
|
Cash
and cash equivalents
|
$
5,575,823
|
$
4,697,288
|
|
Short-term
investments
|
20,055,345
|
23,176,450
|
|
Trade
accounts receivable, net
|
663,762
|
181,006
|
|
Sky
Ranch receivable
|
215,504
|
171,924
|
|
Prepaid
expenses
|
503,100
|
350,819
|
|
Assets
of discontinued operations
|
110,748
|
229,940
|
|
Total
current assets
|
27,124,282
|
28,807,427
|
|
|
|
|
|
Long-term
investments
|
187,975
|
6,853,276
|
|
Investments
in water and water systems, net
|
34,575,713
|
28,321,926
|
|
Land
and mineral interests
|
6,248,371
|
5,345,800
|
|
Notes
receivable - related parties, including accrued
interest
|
776,364
|
628,446
|
|
Other
assets
|
424,226
|
472,392
|
|
Assets
of discontinued operations held for sale
|
450,641
|
450,347
|
|
Total
assets
|
$
69,787,572
|
$
70,879,614
|
|
|
|
|
|
LIABILITIES:
|
|
|
|
Current
liabilities:
|
|
|
|
Accounts
payable
|
492,410
|
160,390
|
|
Accrued
liabilities
|
380,852
|
242,624
|
|
Deferred
revenues
|
55,800
|
55,800
|
|
Deferred
oil and gas lease payment
|
-
|
19,000
|
|
Liabilities
of discontinued operations
|
11,165
|
4,394
|
|
Total
current liabilities
|
940,227
|
482,208
|
|
|
|
|
|
Deferred
revenues, less current portion
|
999,688
|
1,055,491
|
|
Participating
Interests in Export Water Supply
|
341,558
|
343,966
|
|
Total
liabilities
|
2,281,473
|
1,881,665
|
|
|
|
|
|
Commitments
and contingencies
|
|
|
|
|
|
|
|
SHAREHOLDERS'
EQUITY:
|
|
|
|
Preferred
stock:
|
|
|
|
Series
B - par value $.001 per share, 25 million shares
authorized;
|
433
|
433
|
|
432,513
shares issued and outstanding (liquidation preference of
$432,513)
|
|
|
|
Common
stock:
|
|
|
|
Par
value 1/3 of $.01 per share, 40 million shares
authorized;
|
|
|
|
23,754,098
and 23,754,098 shares issued and outstanding,
respectively
|
79,185
|
79,185
|
|
Collateral
stock
|
–
|
–
|
|
Additional
paid in capital
|
171,431,486
|
171,198,241
|
|
Accumulated
other comprehensive income (loss)
|
(11,105
)
|
3,122
|
|
Accumulated
deficit
|
(103,993,900
)
|
(102,283,032
)
|
|
Total
shareholders' equity
|
67,506,099
|
68,997,949
|
|
Total
liabilities and shareholders' equity
|
$
69,787,572
|
$
70,879,614
|
See
accompanying Notes to Financial
Statements
F-3
PURE
CYCLE CORPORATION
CONSOLIDATED
STATEMENTS OF COMPREHENSIVE LOSS
|
|
For the Fiscal Years Ended August 31,
|
||
|
|
2017
|
2016
|
2015
|
|
Revenues:
|
|
|
|
|
Metered water usage
|
$
825,056
|
$
220,997
|
$
969,989
|
|
Wastewater treatment fees
|
45,106
|
43,712
|
50,076
|
|
Special facility funding recognized
|
41,508
|
41,508
|
41,508
|
|
Water tap fees recognized
|
217,515
|
14,294
|
14,294
|
|
Other income
|
98,602
|
131,650
|
120,702
|
|
Total revenues
|
1,227,787
|
452,161
|
1,196,569
|
|
|
|
|
|
|
Expenses:
|
|
|
|
|
Water service operations
|
(332,449
)
|
(264,424
)
|
(464,940
)
|
|
Wastewater service operations
|
(28,615
)
|
(29,187
)
|
(66,745
)
|
|
Other
|
(61,860
)
|
(68,478
)
|
(55,173
)
|
|
Depletion and depreciation
|
(380,382
)
|
(166,670
)
|
(172,546
)
|
|
Total cost of revenues
|
(803,306
)
|
(528,759
)
|
(759,404
)
|
|
Gross
margin
|
424,481
|
(76,598
)
|
437,165
|
|
|
|
|
|
|
General
and administrative expenses
|
(2,201,744
)
|
(1,849,743
)
|
(1,939,395
)
|
|
Depreciation
|
(353,939
)
|
(253,434
)
|
(174,717
)
|
|
Operating loss
|
(2,131,202
)
|
(2,179,775
)
|
(1,676,947
)
|
|
|
|
|
|
|
Other
income (expense):
|
|
|
|
|
Oil and gas lease income, net
|
18,765
|
360,765
|
645,720
|
|
Oil and gas royalty income, net
|
186,595
|
343,620
|
412,627
|
|
Interest income
|
257,488
|
241,279
|
21,334
|
|
Other
|
(10,489
)
|
3,852
|
22,120
|
|
Loss
from continuing operations
|
(1,678,843
)
|
(1,230,259
)
|
(575,146
)
|
|
Loss
from discontinued operations, net of taxes
|
(32,025
)
|
(80,348
)
|
(22,552,801
)
|
|
Net loss before taxes
|
(1,710,868
)
|
(1,310,607
)
|
(23,127,947
)
|
|
Taxes
|
–
|
–
|
–
|
|
Net loss
|
$
(1,710,868
)
|
$
(1,310,607
)
|
$
(23,127,947
)
|
|
Unrealized holding (losses) gains
|
(14,227
)
|
3,122
|
–
|
|
Total comprehensive loss
|
$
(1,725,095
)
|
$
(1,307,485
)
|
$
(23,127,947
)
|
|
|
|
|
|
|
Basic and diluted net loss per common share -
|
|
|
|
|
Loss from continuing operations
|
$
(0.07
)
|
$
(0.06
)
|
$
(0.03
)
|
|
Loss from discontinued operations
|
*
|
*
|
$
(0.93
)
|
|
Net loss
|
$
(0.07
)
|
$
(0.06
)
|
$
(0.96
)
|
|
|
|
|
|
|
Weighted average common shares outstanding –
|
|
|
|
|
basic and diluted
|
23,754,098
|
23,781,041
|
24,041,114
|
|
|
|
|
|
|
*
Amount is less than $.01 per share
|
|
|
|
See accompanying
Notes to Financial Statements
F-4
PURE
CYCLE CORPORATION
CONSOLIDATED
STATEMENTS OF SHAREHOLDERS' EQUITY
|
|
Preferred Stock
|
Common Stock
|
Additional
Paid-in
|
Accumulated Other
Comprehensice
|
Collateral
|
Accumulated
|
|
||
|
|
Shares
|
Amount
|
Shares
|
Amount
|
Capital
|
Income
(loss)
|
Stock
|
Deficit
|
Total
|
|
September
1, 2014 balance:
|
432,513
|
433
|
24,037,598
|
80,130
|
168,794,396
|
-
|
-
|
(77,844,478
)
|
91,030,481
|
|
Share-based
compensation
|
-
|
-
|
-
|
-
|
239,986
|
-
|
-
|
-
|
239,986
|
|
Exercise
of options
|
-
|
-
|
16,500
|
55
|
48,770
|
-
|
-
|
-
|
48,825
|
|
Reduction
in TPF due to remedies under
|
|
|
|
|
|
|
|
|
|
|
the Arkansas River Agreement
|
-
|
-
|
-
|
-
|
3,301,203
|
-
|
-
|
-
|
3,301,203
|
|
Collateral
stock
|
-
|
-
|
-
|
-
|
-
|
-
|
(1,407,000
)
|
-
|
(1,407,000
)
|
|
Net
loss
|
-
|
-
|
-
|
-
|
-
|
-
|
-
|
(23,127,947
)
|
(23,127,947
)
|
|
August
31, 2015 balance:
|
432,513
|
433
|
24,054,098
|
80,185
|
172,384,355
|
-
|
(1,407,000
)
|
(100,972,425
)
|
70,085,548
|
|
Share-based
compensation
|
-
|
-
|
-
|
-
|
219,886
|
-
|
-
|
-
|
219,886
|
|
Collateral
stock retired
|
-
|
-
|
(300,000
)
|
(1,000
)
|
(1,406,000
)
|
-
|
1,407,000
|
-
|
-
|
|
Net
loss
|
-
|
-
|
-
|
-
|
-
|
-
|
-
|
(1,310,607
)
|
(1,310,607
)
|
|
Unrealized
holding gain on investments
|
-
|
-
|
-
|
-
|
-
|
3,122
|
-
|
-
|
3,122
|
|
August
31, 2016 balance:
|
432,513
|
433
|
23,754,098
|
79,185
|
171,198,241
|
3,122
|
-
|
(102,283,032
)
|
68,997,949
|
|
Share-based
compensation
|
|
|
|
|
233,245
|
|
|
|
233,245
|
|
Net
loss
|
|
|
|
|
|
|
|
(1,710,868
)
|
(1,710,868
)
|
|
Unrealized
holding gain on investments
|
|
|
|
|
|
(14,227
)
|
|
|
(14,227
)
|
|
August
31, 2017 balance:
|
432,513
|
$
433
|
23,754,098
|
$
79,185
|
$
171,431,486
|
$
(11,105
)
|
$
-
|
$
(103,993,900
)
|
$
67,506,099
|
See
accompanying Notes to Financial Statements
F-5
PURE
CYCLE CORPORATION
CONSOLIDATED
STATEMENTS OF CASH FLOWS
|
|
For the fiscal Years Ended August 31,
|
||
|
|
2017
|
2016
|
2015
|
|
Cash
flows from operating activities:
|
|
|
|
|
Net
loss
|
$
(1,710,868
)
|
$
(1,310,607
)
|
$
(23,127,947
)
|
|
Adjustments
to reconcile net loss to net cash provided by
|
|
|
|
|
(used
in) operating activities:
|
|
|
|
|
Share-based
compensation expense
|
233,245
|
219,886
|
239,986
|
|
Depreciation,
depletion and other non-cash items
|
734,324
|
420,104
|
347,263
|
|
Investment
in Well Enhancement and Recovery Systems LLC
|
10,488
|
10,675
|
4,577
|
|
Interest
income and other non-cash items
|
(14,647
)
|
(41,114
)
|
(419
)
|
|
Interest
added to receivable from related parties
|
(34,755
)
|
(29,099
)
|
(15,493
)
|
|
Changes
in operating assets and liabilities:
|
|
|
|
|
Trade
accounts receivable
|
(482,756
)
|
(23,161
)
|
918,252
|
|
Prepaid
expenses
|
(152,281
)
|
(122,733
)
|
43,472
|
|
Note
receivable - related parties
|
(156,743
)
|
(31,633
)
|
(105,208
)
|
|
Accounts
payable and accrued liabilities
|
477,538
|
(269,428
)
|
(848,669
)
|
|
Income
taxes
|
-
|
(292,729
)
|
292,729
|
|
Deferred
revenue
|
(55,803
)
|
(55,802
)
|
(64,226
)
|
|
Deferred
income - oil and gas lease
|
(19,000
)
|
(360,765
)
|
(645,720
)
|
|
Net
cash used in operating activities from continuing
operations
|
(1,171,258
)
|
(1,886,406
)
|
(22,961,403
)
|
|
Net
cash provided by operating activities from discontinued
operations
|
118,379
|
1,615,677
|
21,987,337
|
|
Net
cash used in operating activities
|
(1,052,879
)
|
(270,729
)
|
(974,066
)
|
|
|
|
|
|
|
Cash
flows from investing activities:
|
|
|
|
|
Investments
in water, water systems and land
|
(2,486,403
)
|
(1,209,416
)
|
(2,101,253
)
|
|
Investments
in Sky Ranch pipeline
|
(4,368,196
)
|
|
|
|
Ivestments
in Sky Ranch land development
|
(902,600
)
|
|
|
|
Sales
and maturities of marketable securities
|
9,786,406
|
2,840,000
|
-
|
|
Purchase
of short-term investments
|
-
|
(25,970,721
)
|
-
|
|
Purchase
of long-term investments
|
-
|
(6,855,189
)
|
-
|
|
Purchase
of property and equipment
|
(95,385
)
|
(472,310
)
|
(17,186
)
|
|
Net
cash provided by (used in) investing activities from continuing
operations
|
1,933,822
|
(31,667,636
)
|
(2,118,439
)
|
|
Net
cash provided by (used in) investing activities from discontinued
operations
|
-
|
(451,347
)
|
44,650,149
|
|
Net
cash provided by (used in) investing activities
|
1,933,822
|
(32,118,983
)
|
42,531,710
|
|
|
|
|
|
|
Cash
flows from financing activities:
|
|
|
|
|
Proceeds
from exercise of options
|
-
|
-
|
48,825
|
|
Payment
to contingent liability holders
|
(2,408
)
|
(2,041
)
|
(8,621
)
|
|
Net
cash (used in) provided by financing activities from continuing
operations
|
(2,408
)
|
(2,041
)
|
40,204
|
|
Net
cash used in financing activities from discontinued
operations
|
-
|
-
|
(6,258,365
)
|
|
Net
cash used in financing activities
|
(2,408
)
|
(2,041
)
|
(6,218,161
)
|
|
|
|
|
|
|
Net
change in cash and cash equivalents
|
878,535
|
(32,391,753
)
|
35,339,483
|
|
Cash
and cash equivalents - beginning of year
|
4,697,288
|
37,089,041
|
1,749,558
|
|
Cash
and cash equivalents - end of year
|
$
5,575,823
|
$
4,697,288
|
$
37,089,041
|
|
|
|
|
|
|
SUPPLEMENTAL
DISCLOSURES OF NON-CASH INVESTING AND FINANCING
ACTIVITIES
|
|
|
|
|
Retirement
of collateral stock
|
$
-
|
$
1,407,000
|
$
-
|
|
Reduction
in Tap Participation Fee Liability and HP&AM
|
|
|
|
|
receivable,
collateral stock, and mineral interests received
|
|
|
|
|
as
a result of settlement of the Arkansas River Agreement
|
$
-
|
$
-
|
$
1,894,203
|
|
Assets
acquired through WISE funding obligation
|
$
-
|
$
-
|
$
1,381,004
|
See
accompanying Notes to Financial Statements
F-6
PURE
CYCLE CORPORATION
NOTES
TO CONSOLIDATED FINANCIAL STATEMENTS
August
31, 2017, 2016 and 2015
Pure Cycle Corporation (the “Company”) was incorporated
in Delaware in 1976 and reincorporated in Colorado in 2008. The
Company owns assets in the Denver, Colorado metropolitan area. The
Company is currently using its water assets located in the Denver
metropolitan area to provide wholesale water and wastewater
services to customers located in the Denver metropolitan
area.
The Company provides a full line of wholesale water and wastewater
services which includes designing and constructing water and
wastewater systems as well as operating and maintaining such
systems. The Company’s business focus is to provide wholesale
water and wastewater services, predominately to local governmental
entities, which provide services to their end-use customers
throughout the Denver metropolitan area as well as along the
Colorado Front Range.
In addition to the Company’s water and wastewater operations,
the Company is developing 931 acres of land owned by the Company
along Denver’s I-70 corridor as a master planned community
known as Sky Ranch.
As of August 31, 2017, the Company had $26.2 million of working
capital, which included $5.6 million of cash and cash
equivalents.
Principles of Consolidation
The consolidated financial statements of the Company include the
accounts of Pure Cycle Corporation and its majority-owned and
controlled subsidiaries. Intercompany accounts and transactions
have been eliminated in consolidation.
Use of Estimates
The preparation of financial statements in conformity with
accounting principles generally accepted in the United States of
America (“GAAP”) requires management to make estimates
and assumptions that affect the reported amounts of assets and
liabilities and disclosure of contingent assets and liabilities at
the date of the financial statements and the reported amounts of
revenues and expenses during the reporting period. Estimates are
used to account for certain items such as share-based compensation,
deferred tax asset valuation, and the useful lives of assets, etc.
Actual results could differ from those estimates.
Cash and Cash Equivalents
Cash and cash equivalents include all highly liquid debt
instruments with original maturities of three months or less. The
Company’s cash equivalents are comprised entirely of money
market funds maintained at a reputable financial institution. At
various times during the fiscal year ended August 31, 2017, the
Company’s main operating account exceeded federally insured
limits. The Company has never suffered a loss due to such excess
balance.
Investments
M
anagement
determines the appropriate classification of its investments in
certificates of deposit and treasury securities at the time of
purchase and reevaluates such determinations each reporting
period.
Certificates of deposit and debt securities are classified as
held-to-maturity when the Company has the positive intent and
ability to hold the securities to maturity. The Company has
$188,000 of investments classified as held-to-maturity at August
31, 2017, which represent certificates of deposit and U.S. treasury
notes with maturity dates after August 31, 2018. Securities that
the Company does not have the positive intent or ability to hold to
maturity, including certificates of deposit, debt securities and
any investments in equity securities, are classified as
available-for-sale. Securities classified as available-for-sale are
marked-to-market at each reporting period. Changes in value on such
securities are recorded as a component of
Accumulated other
comprehensive income (loss).
The cost of securities sold is based on the
specific identification method. The Company’s certificates of
deposit and treasury securities mature at various dates through
July 2018.
F-7
PURE
CYCLE CORPORATION
NOTES
TO CONSOLIDATED FINANCIAL STATEMENTS
August
31, 2017, 2016 and 2015
Concentration of Credit Risk and Fair Value
Financial instruments that potentially subject the Company to
concentrations of credit risk consist primarily of cash, cash
equivalents and investments. From time to time, the Company places
its cash in money market instruments, certificates of deposit and
U.S. government treasury obligations. To date, the Company has not
experienced significant losses on any of these
investments.
The
following methods and assumptions were used to estimate the fair
value of each class of financial instrument for which it is
practicable to estimate that value.
Cash and Cash Equivalents –
The Company’s cash
and cash equivalents are reported using the values as reported by
the financial institution where the funds are held. These
securities primarily include balances in the Company’s
operating and savings accounts. The carrying amount of cash and
cash equivalents approximate fair value.
Trade Accounts Receivable –
The Company records
accounts receivable net of allowances for uncollectible
accounts.
Investments –
The carrying amounts of investments
approximate fair value. Investments are described further in Note 3
–
Fair Value
Measurements.
Accounts Payable –
The carrying amounts of accounts
payable approximate fair value due to the relatively short period
to maturity for these instruments.
Long-Term Financial Liabilities
–
The Comprehensive Amendment
Agreement No. 1 (the “CAA”) is comprised of a recorded
balance and an off-balance sheet or “contingent”
obligation associated with the Company’s acquisition of its
“Rangeview Water Supply” (defined in
Note 4 –
Water and
Land Assets
). The amount payable is a fixed amount but is
repayable only upon the sale of “Export Water” (defined
in Note 4 –
Water
and Land Assets
). Because of the uncertainty of the sale of
Export Water, the Company has determined that the recorded balance
of the CAA does not have a determinable fair value. The CAA is
described further in Note 5 –
Participating Interests in Export
Water
.
Notes Receivable – Related Parties
–
The market value of the notes
receivable – related parties: Rangeview Metropolitan District
(the “Rangeview District”) and Sky Ranch Metropolitan
District No. 5 are not practical to estimate due to the related
party nature of the underlying transactions.
Off-Balance Sheet Instruments –
The Company’s
off-balance sheet instruments consist entirely of the contingent
portion of the CAA. Because repayment of this portion of the CAA is
contingent on the sale of Export Water, which is not reasonably
estimable, the Company has determined that the contingent portion
of the CAA does not have a determinable fair value. See further
discussion in Note 5 –
Participating Interests in Export
Water
.
Cash Flows
The Company did not have any debt during the fiscal years ended
August 31, 2017 and 2016, and therefore did not pay any interest
during the fiscal years ended August 31, 2017 and 2016. The Company
paid $441,400 in interest during the fiscal year ended August 31,
2015.
The Company did not pay any income taxes during the fiscal year
ended August 31, 2017. In the fiscal year ended August 31, 2016,
the Company paid $292,700 for alternative minimum tax the Company
owed as a result of the sale of the Company’s farm assets.
The Company did not pay any income taxes during the fiscal year
ended August 31, 2015.
Trade Accounts Receivable
The Company records accounts receivable net of allowances for
uncollectible accounts. Excluded from trade accounts receivable are
balances due from discontinued operations. The Company has not
recorded an allowance for uncollectible accounts in receivables
from continuing operations for either of the periods ended August
31, 2017 or 2016. The allowance for uncollectible accounts was
determined based on specific review of all past due
accounts.
F-8
PURE
CYCLE CORPORATION
NOTES
TO CONSOLIDATED FINANCIAL STATEMENTS
August
31, 2017, 2016 and 2015
Long-Lived Assets
The Company reviews its long-lived assets for impairment whenever
events or changes in circumstances indicate that the carrying
amount of an asset may not be recoverable. Recoverability of assets
to be held and used is measured by a comparison of the carrying
amount of an asset to future undiscounted net cash flows expected
to be generated by the eventual use of the asset. If such assets
are considered to be impaired, the impairment to be recognized is
measured by the amount by which the carrying amount of the assets
exceeds the fair value of the assets. Assets to be disposed of are
reported at the lower of the carrying amount or fair value less
costs to sell.
Capitalized Costs of Water and Wastewater Systems and Depreciation
and Depletion Charges
Costs to construct water and wastewater systems that meet the
Company’s capitalization criteria are capitalized as
incurred, including interest, and depreciated on a straight-line
basis over their estimated useful lives of up to 30 years. The
Company capitalizes design and construction costs related to
construction activities, and it capitalizes certain legal,
engineering and permitting costs relating to the adjudication and
improvement of its water assets.
The Company depletes its water assets that are being utilized on
the basis of units produced (i.e., thousands of gallons sold)
divided by the total volume of water adjudicated in the water
decrees.
Tap Participation Fee Liability and Imputed Interest
Expense
Pursuant
to the Asset Purchase Agreement dated May 10, 2006 (the "Arkansas
River Agreement") between the Company and HP A&M (formerly a
significant shareholder), the Company was obligated to pay HP
A&M a defined percentage of a defined number of water tap fees
the Company receives after the date of the Arkansas River Agreement
(the "Tap Participation Fee" or "TPF"). Prior to September 1, 2014,
the Company and HP A&M had a dispute regarding certain defaults
of HP A&M relating to the agreement. In 2014 and 2015,
the Company settled its claims against HP A&M relating to the
defaults. As a result of the settlement, during the year
ended August 31 2015, the remaining TPF liability of approximately
$3.3 million, was eliminated, which, due to the related party
nature of the transaction, was accounted for as an increase in
equity of approximately $3.3 million.
Revenue Recognition
The Company generates revenues through one line of business. Its
revenues are derived through its wholesale water and wastewater
business, which is described below.
The Company generates revenues through its wholesale water and
wastewater business predominately from three sources: (i) monthly
wholesale water usage fees and wastewater service fees, (ii)
one-time water and wastewater tap fees and construction fees, and
(iii) consulting fees. Because these items are separately
delivered, the Company accounts for each of the items separately,
as described below.
i)
Monthly wholesale
water and wastewater service fees
–
Monthly wholesale water usage charges
are assessed to the Company’s customers based on actual
metered usage each month plus a base monthly service fee assessed
per single family equivalent (“SFE”) unit served. One
SFE is a customer, whether residential, commercial or industrial,
that imparts a demand on the Company’s water or wastewater
systems similar to the demand of a family of four persons living in
a single family house on a standard sized lot. One SFE is assumed
to have a water demand of approximately 0.4 acre feet per year and
to contribute wastewater flows of approximately 300 gallons per
day. Water usage pricing uses a tiered pricing structure. The
Company recognizes wholesale water usage revenues upon delivering
water to its customers or its governmental customers’ end-use
customers, as applicable.
Revenues recognized
by the Company from the sale of “Export Water” and
other portions of its “Rangeview Water Supply” off the
Lowry Range are shown gross of royalties to the State of Colorado
Board of Land Commissioners (the “Land Board”).
Revenues recognized by the Company from the sale of water on the
Lowry Range are shown net of royalties paid to the Land Board and
amounts retained by the Rangeview District.
See further description of “Export
Water,” the “Lowry Range,” and the
“Rangeview Water Supply” in Note 4 –
Water and Land
Assets
under “Rangeview
Water Supply and Water System.”
The
Company recognizes wastewater processing revenues monthly based on
a flat monthly fee and actual usage charges. The monthly wastewater
service fees are shown net of amounts retained by the Rangeview
District. Amounts recognized for water and wastewater services
during the fiscal years ended August 31, 2017, 2016 and 2015 are
presented in the statements of comprehensive loss. Costs of
delivering water and providing wastewater service to customers are
recognized as incurred.
The Company delivered 94.6
million,
33.9 million and 97.5 million gallons of water to customers during
the fiscal years ended August 31, 2017, 2016 and 2015,
respectively.
ii)
Water and wastewater
tap fees and construction fees
–
Tap
fees, also called system development fees, are received in advance,
are non-refundable and are typically used to fund construction of
certain facilities and defray the acquisition costs of obtaining
water rights and constructing facilities to deliver water.
Construction fees are fees used by the Company to construct assets
that are typically required to be constructed by developers or home
builders and are separate from tap fees.
Proceeds
from tap fees and construction fees are deferred upon receipt and
recognized in income either upon completion of construction of
infrastructure or ratably over time, depending on whether the
Company owns the infrastructure constructed with the proceeds or a
customer owns the infrastructure constructed with the
proceeds.
F-9
PURE
CYCLE CORPORATION
NOTES
TO CONSOLIDATED FINANCIAL STATEMENTS
August
31, 2017, 2016 and 2015
Tap
and construction fees derived from agreements in which the Company
will not own the assets constructed with the fees are recognized as
revenue using the percentage-of-completion method. Costs of
construction of the assets when the Company will not own the assets
are recorded as construction costs.
Tap
and construction fees derived from agreements for which the Company
will own the infrastructure are recognized as revenues ratably over
the estimated accounting service life of the facilities
constructed, starting at completion of construction, which could be
in excess of 30 years. Costs of construction of the assets when the
Company will own the assets are capitalized and depreciated over
their estimated economic lives.
From
time to time, the Company enters into water service agreements to
provide water service to customers. The Company owns the facilities
which store, treat, and deliver the water and amortizes the cost of
these facilities over their useful lives. The Company recognized
$217,500 of tap fee revenue for the year ended August 31, 2017 and
$14,300 of tap fee revenue in each of the two fiscal years ended
August 31, 2016, and 2015. The Company recognized $41,500 of
“Special Facilities” funding as revenue in each of the
three fiscal years ended August 31, 2017, 2016, and 2015. As of
August 31, 2017, the Company has deferred recognition of $1.1
million of tap and construction revenue from customer agreements,
which will be recognized as revenue ratably through
2036.
iii)
Consulting fees
– Consulting fees are fees the
Company receives, typically on a monthly basis, from municipalities
and area water providers along the I-70 corridor, for contract
operations services. The Company recogizes consulting fees
monthly, based on a flat monthly fee plus charges for additional
work performed.
Royalty and Other Obligations
Revenues from the sale of Export Water are shown gross of royalties
payable to the Land Board. Revenues from the sale of water on the
Lowry Range are shown net of the royalties to the Land Board and
the amounts retained by the Rangeview District.
Oil and Gas Lease Payments
As further described in Note 4 –
Water and Land Assets
below, on March 10, 2011, the Company
entered into a three-year Paid-Up Oil and Gas Lease (the
“O&G Lease”) and a Surface Use and Damage Agreement
(the “Surface Use Agreement”) with Anadarko E&P
Company, L.P. (“Anadarko”), which subsequently sold the
O&G Lease to a wholly-owned subsidiary of ConocoPhillips
Company, for the purpose of exploring for, developing, producing
and marketing oil and gas on approximately 634 acres of mineral
estate owned by the Company at its Sky Ranch property. The Company
received a payment of $1,243,400 during February 2014 to extend the
O&G Lease an additional two years through February 2016, which
was recognized as income on a straight-line basis over two years
(the extension term of the O&G Lease). In addition, during the
fiscal year ended August 31, 2015, the Company received an up-front
payment of $72,000, for the purpose of exploring for, developing,
producing, and marketing oil and gas on 40 acres of mineral estate
the Company owns adjacent to the Lowry Range (the “Rangeview
Lease”). The Company recognizes the up-front payments on a
straight-line basis over the terms of the respective leases. During
the fiscal years ended August 31, 2017, 2016 and 2015, the Company
recognized $19,000, $360,800, and $645,700, respectively, of income
related to the up-front payments received pursuant to these
leases.
As of August 31, 2017, the Company recognized the remaining $19,000
of income related to the Rangeview Lease. Subsequent to August 31,
2017, the Company entered into a Paid-Up Oil and Gas Lease with
Bison Oil and Gas, LLP, for the purpose of exploring for,
developing, producing, and marketing oil and gas on the 40 acres of
mineral estate the Company owns adjacent to the Lowry Range (the
“Bison Lease”). Pursuant to the Bison Lease, on
September 20, 2017, the Company received an up-front payment of
$167,200, which will be recognized as income on a straight-line
basis over three years (the term of the Bison Lease).
F-10
PURE
CYCLE CORPORATION
NOTES
TO CONSOLIDATED FINANCIAL STATEMENTS
August
31, 2017, 2016 and 2015
During
the three months ended February 28, 2015, two wells were drilled
within the Company’s mineral interest. Beginning in March
2015, both wells were placed into service and began producing oil
and gas and accruing royalties to the Company. In May 2015, certain
gas collection infrastructure was extended to the property to allow
the collection of gas from the wells and accrual of royalties
attributable to gas production.
During
the fiscal years ended August 31, 2017, 2016 and 2015, the Company
received $186,600, $343,600 and $412,600, respe
ctively, in
royalties attributable to these two wells. The Company
classifies income from lease and royalty payments as
Other income
in the statement of
comprehensive loss as the Company does not consider these
arrangements to be an operating business
activity.
Share-based Compensation
The Company maintains a stock option plan for the benefit of its
employees and directors. The Company records share-based
compensation costs which are measured at the grant date based on
the fair value of the award and are recognized as expense over the
applicable vesting period of the stock award using the
straight-line method. The Company has adopted the alternative
transition method for calculating the tax effects of share-based
compensation which allows for a simplified method of calculating
the tax effects of employee share-based compensation. Because the
Company has a full valuation allowance on its deferred tax assets,
the granting and exercise of stock options during the fiscal years
ended August 31, 2016 and 2015 had no impact on the income tax
provisions.
The Company recognized $233,200, $219,900, and $240,000 of
share-based compensation expenses during the
fiscal
years ended August 31, 2017, 2016 and 2015,
respectively.
Income Taxes
The Company uses a “more-likely-than-not” threshold for
the recognition and de-recognition of tax positions, including any
potential interest and penalties relating to tax positions taken by
the Company. The Company does not have any significant unrecognized
tax benefits as of August 31, 2017.
The Company files income tax returns with the Internal Revenue
Service and the State of Colorado. The tax years that remain
subject to examination are fiscal 2013 through fiscal 2016. The
Company does not believe there will be any material changes in its
unrecognized tax positions over the next 12 months.
The Company’s policy is to recognize interest and penalties
accrued on any unrecognized tax benefits as a component of income
tax expense. At August 31, 2017, the Company did not have any
accrued interest or penalties associated with any unrecognized tax
benefits, nor was any interest expense recognized during the fiscal
years ended August 31, 2017, 2016 or 2015.
Discontinued Operations
In August 2015, the Company sold approximately 14,600 acres of
irrigated farm land and related Arkansas River water rights for
proceeds of approximately $44.7 million, which were substantially
all of the assets comprising the Company’s agricultural
segment. Pursuant to the terms of the purchase and sale agreement,
the Company continued to manage and receive the lease income until
December 31, 2015. As a consequence of the sale, the operating
results and the assets and liabilities of the discontinued
operations, which formerly comprised the agricultural segment, are
presented separately in the Company’s financial statements.
Summarized financial information for the discontinued agricultural
business is shown below. Prior period balances have been
reclassified to present the operations of the agricultural business
as a discontinued operation.
F-11
PURE
CYCLE CORPORATION
NOTES
TO CONSOLIDATED FINANCIAL STATEMENTS
August
31, 2017, 2016 and 2015
|
Discontinued Operations Statements of Operations
|
|||
|
|
|
|
|
|
|
Fiscal years ended August 31,
|
||
|
|
2017
|
2016
|
2015
|
|
Farm
revenues
|
$
6,800
|
$
267,500
|
$
1,127,200
|
|
Farm
expenses
|
(1,300
)
|
(77,100
)
|
(126,300
)
|
|
Gross profit
|
5,500
|
190,400
|
1,000,900
|
|
|
|
|
|
|
General
and administrative expenses
|
(46,900
)
|
(313,400
)
|
(760,200
)
|
|
Operating (loss) profit
|
(41,400
)
|
(123,000
)
|
240,700
|
|
Finance
charges
|
9,400
|
38,400
|
21,700
|
|
(Loss)
gain on sale of farm assets
|
-
|
4,300
|
(22,108,200
)
|
|
Interest
expense (1)
|
-
|
-
|
(390,500
)
|
|
Interest
imputed on the Tap Participation
|
|
|
|
|
Fee payable to HP A&M (2)
|
-
|
-
|
(23,800
)
|
|
Taxes
|
|
|
(292,700
)
|
|
Loss from discontinued operations, net of taxes
|
$
(32,000
)
|
$
(80,300
)
|
$
(22,552,800
)
|
(1) Interest
expense represents interest accrued related to notes the Company
had on its farm assets prior to the sale. All notes associated with
the farms have been paid off, and thus the Company no longer incurs
interest on such notes.
(2)
Imputed
interest represents an estimate of the interest accrued on the Tap
Participation Fee payable to High Plains A&M, LLC (“HP
A&M”), which was eliminated as a result of the settlement
with HP A&M during the three months ended February 28, 2015. As
a result, the Company no longer accrues interest related to the Tap
Participation Fee.
The Company anticipates continued expenses through the end of
calendar 2018 related to the discontinued operations. The Company
will continue to incur expenses related to the remaining
agricultural land the Company continues to own and for the purpose
of collecting outstanding receivables.
F-12
PURE
CYCLE CORPORATION
NOTES
TO CONSOLIDATED FINANCIAL STATEMENTS
August
31, 2017, 2016 and 2015
The individual assets and liabilities of the discontinued
agricultural business are combined in the captions “Assets of
discontinued operations” and “Liabilities of
discontinued operations” in the consolidated balance sheets.
The carrying amounts of the major classes of assets and liabilities
included part of the discontinued business are presented in the
following table:
|
Discontinued Operations Balance Sheets
|
||
|
|
|
|
|
|
August 31,
|
|
|
|
2017
|
2016
|
|
Assets:
|
|
|
|
Trade
accounts receivable
|
$
110,700
|
$
227,100
|
|
Land
held for sale (1)
|
450,600
|
450,300
|
|
Prepaid
expenses
|
-
|
2,900
|
|
Total
assets
|
$
561,300
|
$
680,300
|
|
|
|
|
|
Liabilities:
|
|
|
|
Accrued
liabilities
|
11,200
|
4,400
|
|
Total
liabilities
|
$
11,200
|
$
4,400
|
(1)
Land Held
for Sale.
During the fiscal
quarter ended November 30, 2015, the Company purchased three farms
totaling 700 acres for approximately $451,000. The farms were
acquired to correct dry-up covenant issues related to water only
farms to obtain the release of the escrow funds related to the
Company’s farm sale to Arkansas River Farms, LLC. The Company
intends to sell the farms in due course and has classified the
farms as long-term assets.
Loss per Common Share
Loss per common share is computed by dividing net loss by the
weighted average number of shares outstanding during each period.
Common stock options and warrants aggregating 465,600, 338,100, and
312,100 common share equivalents as of August 31, 2017, 2016 and
2015, respectively, have been excluded from the calculation of loss
per common share as their effect is anti-dilutive.
Recently Issued Accounting Pronouncements
The Company continually assesses any new accounting pronouncements
to determine their applicability. When it is determined that a new
accounting pronouncement affects the Company’s financial
reporting, the Company undertakes a study to determine the
consequence of the change to its financial statements and ensure
that there are proper controls in place to ascertain that the
Company’s financial statements properly reflect the
change.
New pronouncements assessed by the Company recently
are discussed below:
In May
2014, the Financial Accounting Standards Board (“FASB”)
issued Accounting Standards Update (“ASU”) No. 2014-09,
Revenue from Contracts with
Customers
,
(Topic
606)
that requires recognition of revenue to depict the
transfer of promised goods or services to customers in an amount
that reflects the consideration to which we expect to be entitled
in exchange for those goods or services. The FASB has also issued
several updates to ASU 2014-09. The standard supersedes U.S. GAAP
guidance on revenue recognition and requires the use of more
estimates and judgments than the present standards. It also
requires additional disclosures.
The Company is
continuing to study the impacts of this standard and its
amendments, including impacts on tap fee and other up-front revenue
payments and how impacts if any will be initially reflected at the
adoption date. The Company does not expect that revenue
recognition from on-going water sale and delivery fees and
waste water disposal fees, or consulting service contracts,
will be significantly affected but these matters are
continuing to be assessed
. The new standard is effective for
annual reporting periods beginning after December 31, 2017,
including interim reporting periods within that reporting period.
Earlier adoption is permitted.
In
August 2014, the FASB issued ASU No. 2014-15,
Presentation of Financial Statements - Going
Concern (Subtopic 205-40): Disclosure of Uncertainties about an
Entity’s Ability to Continue as a Going Concern
. ASU
2014-15 describes how an entity’s management should assess,
considering both quantitative and qualitative factors, whether
there are conditions and events that raise substantial doubt about
an entity’s ability to continue as a going concern within one
year after the date that the financial statements are issued, which
represents a change from the existing literature that requires
consideration about an entity’s ability to continue as a
going concern within one year after the balance sheet date. The
standard is effective for the Company on September 1, 2016. The
adoption of ASU 2014-15 did not have a material impact on the
Company’s financial statements.
F-13
PURE
CYCLE CORPORATION
NOTES
TO CONSOLIDATED FINANCIAL STATEMENTS
August
31, 2017, 2016 and 2015
In
April 2014, the FASB issued ASU No. 2014-08,
Presentation of Financial Statements (Topic
205) and Property, Plant, and Equipment (Topic
360):
Reporting
Discontinued Operations and Disclosures of Disposals of Components
of an Entity
. ASU 2014-08 changes the presentation and
disclosure requirements for discontinued operations. The update was
adopted by the Company in fiscal year 2016.
Fair value is defined as the price that would be received to sell
an asset or paid to transfer a liability in an orderly transaction
between market participants at the measurement date in the
principal or most advantageous market. The Company uses a fair
value hierarchy that has three levels of inputs, both observable
and unobservable, with use of the lowest possible level of input to
determine fair value.
Level 1 — Valuations for assets and liabilities traded in
active exchange markets, such as The NASDAQ Stock Market. The
Company had no Level 1 assets or liabilities as of August 31, 2017
or August 31, 2016.
Level 2 — Valuations for assets and liabilities obtained from
readily available pricing sources via independent providers for
market transactions involving similar assets or liabilities.
The Company ha
d 56 and 36 Level 2
as
sets as of August 31, 2017 and 2016, respectively, which
consist of certificates of deposit and U.S. treasury
notes.
Level 3 — Valuations for assets and liabilities that are
derived from other valuation methodologies, including discounted
cash flow models and similar techniques, and not based on market
exchange, dealer, or broker-traded transactions. Level 3 valuations
incorporate certain assumptions and projections in determining the
fair value assigned to such assets or liabilities. The Company had
one Level 3 liability, the contingent portion of the CAA, as of
August 31, 2017 and 2016. The Company has determined that the
contingent portion of the CAA does not have a determinable fair
value (see Note 5).
F-14
PURE
CYCLE CORPORATION
NOTES
TO CONSOLIDATED FINANCIAL STATEMENTS
August
31, 2017, 2016 and 2015
The Company maintains policies and procedures to value instruments
using what management believes to be the best and most relevant
data available.
Level 2 Asset – Available for Sale Securities.
The Company’s available for sale
securities are the Company’s only financial asset measured at
fair value on a recurring basis.
The fair value of the
available for sale securities is based on the values reported by
the financial institutions where the funds are held.
These securities include only
federally insured certificates of deposit and U.S.
treasuries.
The following table provides information on the assets and
liabilities measured at fair value on a recurring basis as
of
August 31, 2017
:
|
|
|
|
Fair Value Measurement Using:
|
|
|
|
|
|
|
Cost / Other
|
Quoted Prices in Active Markets for Identical Assets
|
Significant Other Observable Inputs
|
Significant Unobservable Inputs
|
Accumulated Unrealized Gains and
|
|
|
Fair Value
|
Value
|
(Level 1)
|
(Level 2)
|
(Level 3)
|
(Losses)
|
|
Certificates
of deposit
|
$
12,673,700
|
$
12,694,500
|
$
-
|
$
12,673,700
|
$
-
|
$
(20,800
)
|
|
U.S.
treasuries
|
7,381,700
|
7,372,000
|
-
|
7,381,700
|
-
|
9,700
|
|
Subtotal
|
$
20,055,400
|
$
20,066,500
|
$
-
|
$
20,055,400
|
$
-
|
$
(11,100
)
|
|
Long-term
investments
|
188,000
|
188,000
|
-
|
188,000
|
-
|
-
|
|
Total
|
$
20,243,400
|
$
20,254,500
|
$
-
|
$
20,243,400
|
$
-
|
$
(11,100
)
|
The following table provides information on the assets and
liabilities measured at fair value on a recurring basis as of
August 31, 2016:
|
|
|
|
Fair Value Measurement Using:
|
|
|
|
|
|
|
Cost / Other
|
Quoted Prices in Active Markets for Identical Assets
|
Significant Other Observable Inputs
|
Significant Unobservable Inputs
|
Accumulated Unrealized Gains and
|
|
|
Fair Value
|
Value
|
(Level 1)
|
(Level 2)
|
(Level 3)
|
(Losses)
|
|
Certificates
of deposit
|
$
6,050,500
|
$
6,054,700
|
$
-
|
$
6,050,500
|
$
-
|
$
(4,200
)
|
|
U.S.
treasuries
|
17,125,900
|
17,115,200
|
-
|
17,125,900
|
-
|
10,700
|
|
Subtotal
|
$
23,176,400
|
$
23,169,900
|
$
-
|
$
23,176,400
|
$
-
|
$
6,500
|
|
Long-term
investments
|
6,853,300
|
6,856,700
|
-
|
6,853,300
|
-
|
(3,400
)
|
|
Total
|
$
30,029,700
|
$
30,026,600
|
$
-
|
$
30,029,700
|
$
-
|
$
3,100
|
Investment in Water and Water Systems
The Company’s water and water systems consist of the
following approximate costs and accumulated depreciation and
depletion as of August 31:
|
|
August
31, 2017
|
August
31, 2016
|
||
|
|
Costs
|
Accumulated
Depreciation and Depletion
|
Costs
|
Accumulated
Depreciation and Depletion
|
|
Rangeview
water supply
|
$
14,529,600
|
$
(10,600
)
|
$
14,444,600
|
$
(9,400
)
|
|
Sky
Ranch water rights and other costs
|
6,725,000
|
(436,300
)
|
6,607,400
|
(334,500
)
|
|
Fairgrounds
water and water system
|
2,899,900
|
(974,800
)
|
2,899,900
|
(886,800
)
|
|
Rangeview
water system
|
1,639,000
|
(207,000
)
|
1,624,800
|
(152,800
)
|
|
Water
supply – other
|
4,058,900
|
(401,300
)
|
3,703,000
|
(297,800
)
|
|
Wild
Pointe service rights
|
1,631,700
|
(213,000
)
|
-
|
-
|
|
Sky
Ranch pipeline
|
4,700,000
|
(39,200
)
|
|
|
|
Construction
in progress
|
673,800
|
-
|
723,500
|
-
|
|
Totals
|
36,857,900
|
(2,282,200
)
|
30,003,200
|
(1,681,300
)
|
|
Net
investments in water and water systems
|
$
34,575,700
|
|
$
28,321,900
|
|
Depletion and Depreciation
The Company recorded $1,300, $500, and $7,000 of depletion charges
during the fiscal years ended August 31, 2017, 2016 and 2015,
respectively. During the fiscal years ended August 31, 2017 and
2016, this related entirely to the Rangeview Water Supply (defined
below).
The Company recorded $733
,000,
$419,600, and $340,300 of depreciation expense in each of the
fiscal years ended August 31, 2017, 2016 and 2015, respectively.
These figures include depreciation for other equipment not included
in the table above.
F-15
PURE
CYCLE CORPORATION
NOTES
TO CONSOLIDATED FINANCIAL STATEMENTS
August
31, 2017, 2016 and 2015
Rangeview Water Supply and Water System
The “Rangeview Water Supply” consists of 26,985 acre
feet and is a combination of tributary surface water and
groundwater rights along with certain storage rights associated
with the Lowry Range, a 27,000-acre property owned by the Land
Board located 16 miles southeast of Denver, Colorado. Approximately
$14.5 million of Investments in Water and Water Systems on the
Company’s balance sheet as of August 31, 2017, represents the
costs of assets acquired or facilities constructed to extend water
service to customers located on and off the Lowry Range. The
recorded costs of the Rangeview Water Supply include payments to
the sellers of the Rangeview Water Supply, design and construction
costs and certain direct costs related to improvements to the asset
including legal and engineering fees.
The Company acquired the Rangeview Water Supply beginning in 1996
when:
(i)
The
Rangeview District entered into the 1996 Amended and Restated Lease
Agreement with the Land Board, which owns the Lowry
Range;
(ii)
The
Company entered into the Agreement for Sale of Export Water with
the Rangeview District;
(iii)
The
Company entered into the 1996 Service Agreement with the Rangeview
District for the provision of water service to the Rangeview
District’s customers on the Lowry Range; and
(iv)
In
1997, the Company entered into the Wastewater Service Agreement
with the Rangeview District for the provision of wastewater service
to the Rangeview District’s customers on the Lowry
Range.
In July 2014, the Company, the Rangeview District and the Land
Board entered into the 2014 Amended and Restated Lease (the
“Lease”), which superseded the original 1996 lease, and
the Company and the Rangeview District entered into an Amended and
Restated Service Agreement. Collectively, the foregoing agreements,
as amended, are referred to as the “Rangeview Water
Agreements.”
Pursuant to the Rangeview Water Agreements, the Company owns 11,650
acre feet of water consisting of 10,000 acre feet of groundwater
and 1,650 acre feet of average yield surface water which can be
exported off the Lowry Range to serve area users (referred to as
“Export Water”). The 1,650 acre feet of surface rights
are subject to completion of documentation by the Land Board
related to the Company’s exercise of its right to substitute
an aggregate gross volume of 165,000 acre feet of its groundwater
for 1,650 acre feet per year of adjudicated surface water and to
use this surface water as Export Water. Additionally, assuming
completion of the substitution of groundwater for surface water,
the Company has the exclusive right to provide water and wastewater
service, through 2081, to all water users on the Lowry Range and
the right to develop an additional 13,685 acre feet of groundwater
and 1,650 acre feet of adjudicated surface water to serve customers
either on or off the Lowry Range. The Rangeview Water Agreements
also provide for the Company to use surface reservoir storage
capacity in providing water service to customers both on and off
the Lowry Range.
Services on the Lowry Range –
Pursuant to the Rangeview Water Agreements, the
Company designs, finances, constructs, operates and maintains the
Rangeview District’s water and wastewater systems to provide
service to the Rangeview District’s customers on the Lowry
Range. The Company will operate both the water and the wastewater
systems during the contract period, and the Rangeview District owns
both systems. After 2081, ownership of the water system will revert
to the Land Board, with the Rangeview District retaining ownership
of the wastewater system.
Rates and charges for all water and wastewater services on the
Lowry Range, including tap fees and usage or monthly fees, are
governed by the terms of the Rangeview Water Agreements. Rates and
charges are required to be less than the average of similar rates
and charges of three surrounding municipal water and wastewater
service providers, which are reassessed annually. Pursuant to the
Rangeview Water Agreements the Land Board receives a royalty of 10%
or 12% of gross revenues from the sale or disposition of the water
depending on the nature and location of the purchaser of the water,
except that the royalty on tap fees shall be 2% (other than taps
sold for Sky Ranch which are exempt). The Company also is required
to pay the Land Board a minimum annual water production fee, which
will offset future royalty obligations. The Company and the Land
Board are working cooperatively to clarify the calculation of the
minimum annual production fee. Pursuant to the Company’s
determination, the Company has made payments of $45,600 for each of
the past two years. The Company does not anticipate any
modification to the minimum fee to be material. The Rangeview
District retains 2% of the remaining gross revenues and the Company
receives 98% of the remaining gross revenues after the Land Board
royalty. The Land Board does not receive a royalty on wastewater
fees. The Company receives 100% of the Rangeview District’s
wastewater tap fees and 90% of the Rangeview District’s
wastewater usage fees (the Rangeview District retains the other
10%).
F-16
PURE
CYCLE CORPORATION
NOTES
TO CONSOLIDATED FINANCIAL STATEMENTS
August
31, 2017, 2016 and 2015
Export Water –
The
Company owns the Export Water and intends to use it to provide
wholesale water and wastewater services to customers off the Lowry
Range, including customers of the Rangeview District and other
governmental entities and industrial and commercial customers. The
Company will own all wholesale facilities required to extend water
and wastewater services using its Export Water. The Company
anticipates contracting with third parties for the construction of
these facilities. If the Company sells Export Water, the Company is
required to pay royalties to the Land Board ranging from 10% to 12%
of gross revenues, except that the royalty on tap fees shall be 2%
(other than taps sold for Sky Ranch which are
exempt).
Water Supply -
Other
–
The
WISE Partnership Agreement (as defined below) provides for the
purchase of certain infrastructure (i.e., pipelines, water storage
facilities, water treatment facilities, and other appurtenant
facilities) to deliver water to and among the 10 members of the
SMWA, Denver Water and Aurora Water. Certain infrastructure has
been constructed and other infrastructure will be constructed over
the next several years. During fiscal 2017, the Company
invested approximately $350,000 in
infrastructure.
The Arapahoe County Fairgrounds Water and Water System
The Company owns 321 acre feet of groundwater purchased pursuant to
its agreement with Arapahoe County. The Company plans to use this
water in conjunction with its Rangeview Water Supply in providing
water to areas outside the Lowry Range. The $2.9 million of
capitalized costs includes the costs to construct various Wholesale
and Special Facilities, including a new deep water well, a
500,000-gallon water tank and pipelines to transport water to the
Arapahoe County fairgrounds.
Service to Customers Not on the Lowry Range
Sky Ranch -
In 2010, the
Company purchased approximately 931 acres of undeveloped land known
as Sky Ranch. The property includes the rights to approximately 830
acre feet of water. The Company plans to use this water in
conjunction with its Rangeview Water Supply to provide water
service to the Rangeview District’s customers at Sky Ranch.
The $11.4 million of capitalized costs includes the costs to
acquire the water rights and to construct various facilities,
including an eight-mile pipeline, to extend service to customers at
Sky Ranch.
Total consideration for the land and water included the $7.0
million purchase price, plus direct costs and fees of $554,100. The
Company allocated the total acquisition cost to the land and water
rights based on estimates of each asset’s respective fair
value.
In
June 2017, the Company completed and placed into service its Sky
Ranch pipeline, connecting its Sky Ranch water system to
Rangeview's water system for approximately $4.7
million.
Wild Pointe -
On December 15,
2016, the Rangeview District, acting by and through its Water
Activity enterprise, and Elbert & Highway 86 Commercial
Metropolitan District, a quasi-municipal corporation and political
subdivision of the State of Colorado, acting by and through its
Water Enterprise (the “Elbert 86 District”), entered
into a Water Service Agreement (the “Wild Pointe Service
Agreement”). Subject to the conditions set forth in the Wild
Pointe Service Agreement and the terms of the Company’s
engagement by Rangeview as Rangeview’s exclusive service
provider, the Company acquired, among other things, the exclusive
right to provide water services to residential and commercial
customers in the Wild Pointe development, located in unincorporated
Elbert County, Colorado, in exchange for $1,600,000 in cash.
Pursuant to the terms of the Wild Pointe Service Agreement, the
Company, in its capacity as Rangeview’s service provider, is
responsible for providing water services to all users of water
services within the boundaries and service area of the Elbert 86
District and for operating and maintaining the Elbert 86
District’s water system. In exchange, the Company receives
100% of system development (or tap) fees from new customers and 98%
of all other fees and charges, including monthly water service
revenues, remitted to the Rangeview District by the Elbert 86
District pursuant to the Wild Pointe Service Agreement. The Elbert
86 District’s water system currently provides water service
to approximately 130 existing SFE water connections in Wild
Pointe.
O&G Leases
In 2011, the Company entered into the O&G Lease and the Surface
Use Agreement with Anadarko. Pursuant to the O&G Lease, the
Company received an up-front payment of $1,243,400 from Anadarko
for the purpose of exploring for, developing, producing and
marketing oil and gas on 634 acres of mineral estate owned by the
Company at its Sky Ranch property. The Company also received $9,000
in surface use and damage payments. In December 2012, the O&G
Lease was purchased by a wholly-owned subsidiary of ConocoPhillips
Company. The Company received an additional payment of $1,243,400
during February 2014 to extend the O&G Lease an additional two
years through February 2016. The O&G Lease is now held by
production, entitling the Company to royalties based on
production.
F-17
PURE
CYCLE CORPORATION
NOTES
TO CONSOLIDATED FINANCIAL STATEMENTS
August
31, 2017, 2016 and 2015
In September 2017, subsequent to fiscal year end, the Company
entered into a three-year Paid-Up Oil and Gas Lease with Bison Oil
and Gas, LLP, for the purpose of exploring for, developing,
producing and marketing oil and gas on 40 acres of mineral estate
owned by the Company adjacent to the Lowry Range.
Land and Mineral
Interests
As part
of the 2010 Sky Ranch acquisition the Company acquired 931 acres of
land which is valued at approximately $4.8 million.
Additionally, in fiscal 2015, as part of the settlement with HP
A&M, the Company was assigned 75% mineral interests in the
Arkansas River land. Together with the 25% mineral interests the
Company owned prior to the settlement, the Company now holds
approximately 13,900 acres of mineral interests. The Company has
valued its mineral interests at approximately
$1,425,500.
The Company acquired its Rangeview Water Supply through various
amended agreements entered into in the early 1990s. The acquisition
was consummated with the signing of the CAA in 1996. Upon entering
into the CAA, the Company recorded an initial liability of $11.1
million, which represented the cash the Company received from the
participating interest holders that was used to purchase the
Company’s Export Water (described in greater detail in Note 4
–
Water and Land
Assets
). The Company agreed to
remit a total of $31.8 million of proceeds received from the sale
of Export Water to the participating interest holders in return for
their initial $11.1 million investment. The obligation for the
$11.1 million was recorded as debt, and the remaining $20.7 million
contingent liability was not reflected on the Company’s
balance sheet because the obligation to pay this is contingent on
the sale of Export Water, the amounts and timing of which are not
reasonably determinable.
The CAA obligation is non-interest bearing, and if the Export Water
is not sold, the parties to the CAA have no recourse against the
Company. If the Company does not sell the Export Water, the holders
of the Series B Preferred Stock are also not entitled to payment of
any dividend and have no contractual recourse against the
Company.
As the proceeds from the sale of Export Water are received and the
amounts are remitted to the external CAA holders, the Company
allocates a ratable percentage of this payment to the principal
portion (the Participating Interests in Export Water
Supply
liability account), with the balance of the
payment being charged to the contingent obligation portion. Because
the original recorded liability, which was $11.1 million, was 35%
of the original total liability of $31.8 million, approximately 35%
of each payment remitted to the CAA holders is allocated to the
recorded liability account. The remaining portion of each payment,
or approximately 65%, is allocated to the contingent obligation,
which is recorded on a net revenue basis.
From time to time, the Company repurchased various portions of the
CAA obligations, which retained their original priority. The
Company did not make any CAA acquisitions during the fiscal years
ended August 31, 2017 or 2016. In July 2014, the Land Board
relinquished its approximately $2.4 million of CAA interests to the
Company as part of a settlement of the 2011 lawsuit filed by the
Company and the Rangeview District against the Land
Board.
F-18
PURE
CYCLE CORPORATION
NOTES
TO CONSOLIDATED FINANCIAL STATEMENTS
August
31, 2017, 2016 and 2015
As a
result of the acquisitions and the relinquishment by the Land
Board, the Company is currently allocated approximately 88% of the
total proceeds from the sale of Export Water after payment of the
Land Board royalty. Additionally, as a result of the
acquisitions, the relinquishment by the Land Board, and the
consideration from the cumulative sales of Export Water, as
detailed in the table below, the remaining potential third-party
obligation at August 31, 2017, is approximately $1
million
:
|
|
Export Water Proceeds
Received
|
Initial Export Water
Proceeds to Pure Cycle
|
Total Potential
Third-party Obligation
|
Participating
Interests Liability
|
Contingency
|
|
Original
balances
|
$
-
|
$
218,500
|
$
31,807,700
|
$
11,090,600
|
$
20,717,100
|
|
Activity from inception until August 31, 2014:
|
|
|
|
|
|
|
Acquisitions
|
-
|
28,042,500
|
(28,042,500
)
|
(9,790,000
)
|
(18,252,500
)
|
|
Relinquishment
|
-
|
2,386,400
|
(2,386,400
)
|
(832,100
)
|
(1,554,300
)
|
|
Option
payments - Sky Ranch
|
|
|
|
|
|
|
and
The Hills at Sky Ranch
|
110,400
|
(42,300
)
|
(68,100
)
|
(23,800
)
|
(44,300
)
|
|
Arapahoe
County tap fees (1)
|
533,000
|
(373,100
)
|
(159,900
)
|
(55,800
)
|
(104,100
)
|
|
Export
Water sale payments
|
410,500
|
(305,900
)
|
(104,600
)
|
(36,300
)
|
(68,300
)
|
|
Balance at August
31, 2015
|
1,053,900
|
29,926,100
|
1,046,200
|
352,600
|
693,600
|
|
Fiscal 2016 activity:
|
207,900
|
(183,200
)
|
(24,700
)
|
(8,600
)
|
(16,100
)
|
|
Balance at August
31, 2016
|
1,261,800
|
29,742,900
|
1,021,500
|
344,000
|
677,500
|
|
Fiscal 2017 activity:
|
|
|
|
|
|
|
Export
Water sale payments
|
58,100
|
(51,200
)
|
(6,900
)
|
(2,400
)
|
(4,500
)
|
|
Balance at August
31, 2017
|
$
1,319,900
|
$
29,691,700
|
$
1,014,600
|
$
341,600
|
$
673,000
|
(1)
The
Arapahoe County tap fees are less $34,522 in royalties paid to the
Land Board.
The CAA includes contractually established priorities which call
for payments to CAA holders in order of their priority. This means
the first payees receive their full payment before the next
priority level receives any payment and so on until full repayment.
Of
the next approximately $6.7 million of Export Water payouts, which
at current levels would occur over several years, the Company will
receive approximately $5.9 million of revenue. Thereafter,
the Company will be entitled to all but approximately $650,000 of
the proceeds from the sale of Export Water after deduction of the
Land Board royalty.
At August 31, 2017, the Company had accrued liabilities of
$381,000, of which $265,000 was for accrued compensation, $27,000
was for estimated property taxes, $48,500 was for professional fees
and the remaining $40,500 was related to operating
payables.
At August 31, 2016, the Company had accrued liabilities of
$242,600, of which $160,000 was for accrued compensation, $5,700
was for estimated property taxes, $48,000 was for professional fees
and the remaining $28,900 was related to operating
payables.
As of August 31, 2017 and 2016, the Company had no
debt.
The Participating Interests in Export Water Supply are obligations
of the Company that have no scheduled maturity dates. Therefore,
these liabilities are not disclosed in tabular format. However, the
Participating Interests in Export Water Supply are described in
Note 5 –
Participating Interests in
Export Water
.
WISE Partnership
During December 2014, the Company, through the Rangeview District,
consented to the waiver of all contingencies set forth in the
Amended and Restated WISE Partnership – Water Delivery
Agreement, dated December 31, 2013 (the “WISE Partnership
Agreement”), among the City and County of Denver acting
through its Board of Water Commissioners (“Denver
Water”), the City of Aurora acting by and through its Utility
Enterprise (“Aurora Water”), and the South Metro WISE
Authority (“SMWA”). The SMWA was formed by the
Rangeview District and nine other governmental or
quasi-governmental water providers pursuant to the South Metro WISE
Authority Formation and Organizational Intergovernmental Agreement,
dated December 31, 2013 (the “SM IGA”), to enable the
members of SMWA to participate in the regional water supply project
known as the Water Infrastructure Supply Efficiency partnership
(“WISE”) created by the WISE Partnership Agreement. The
SM IGA specifies each member’s pro rata share of WISE and the
members’ rights and obligations with respect to WISE. The
WISE Partnership Agreement provides for the purchase of certain
infrastructure (i.e., pipelines, water storage facilities, water
treatment facilities, and other appurtenant facilities) to deliver
water to and among the 10 members of the SMWA, Denver Water and
Aurora Water. Certain infrastructure has been constructed and other
infrastructure will be constructed over the next several
years. During fiscal 2017, the Company invested approximately
$350,000 in infrastructure.
F-19
PURE
CYCLE CORPORATION
NOTES
TO CONSOLIDATED FINANCIAL STATEMENTS
August
31, 2017, 2016 and 2015
By consenting to the waiver of the contingencies set forth in the
WISE Partnership Agreement, pursuant to the terms of the
Rangeview/Pure Cycle WISE Project Financing and Service Agreement
(the “WISE Financing Agreement”) between the Company
and the Rangeview District, the Company has an agreement to fund
the Rangeview District’s participation in WISE effective as
of December 22, 2014. The Company’s cost of funding the
Rangeview District’s purchase of its share of existing
infrastructure and future infrastructure for WISE and funding
operations and water deliveries related to WISE is projected to be
approximately $5.2 million over the next five years. See further
discussion in Note 14
–
Related Party
Transactions.
Operating Lease
Effective January 2016, the Company entered into an operating lease
for approximately 2,500 square feet of office and warehouse space.
The lease has a two-year term with payments of $3,000 per
month.
Preferred Stock
The Company’s non-voting Series B Preferred Stock has a
preference in liquidation of $1.00 per share less any dividends
previously paid. Additionally, the Series B Preferred Stock is
redeemable at the discretion of the Company for $1.00 per share
less any dividends previously paid. In the event that the
Company’s proceeds from sale or disposition of Export Water
rights exceed $36,026,232, the Series B Preferred Stock holders
will receive the next $432,513 of proceeds in the form of a
dividend.
Equity Compensation Plan
The Company maintains the 2014 Equity Incentive Plan (the
“2014 Equity Plan”), which was approved by shareholders
in January 2014 and became effective April 12, 2014. Executives,
eligible employees, consultants and non-employee directors are
eligible to receive options and stock grants pursuant to the 2014
Equity Plan. Pursuant to the 2014 Equity Plan, options to purchase
shares of stock and restricted stock awards can be granted with
exercise prices, vesting conditions and other performance criteria
determined by the Compensation Committee of the Board. The Company
has reserved 1.6 million shares of common stock for issuance under
the 2014 Equity Plan. Awards to purchase 62,000 shares of the
Company’s common stock have been made under the 2014 Equity
Plan. Prior to the effective date of the 2014 Equity Plan, the
Company granted stock awards to eligible participants under its
2004 Incentive Plan (the “2004 Incentive Plan”), which
expired April 11, 2014. No additional awards may be granted
pursuant to the 2004 Incentive Plan; however, awards outstanding as
of April 11, 2014, will continue to vest and expire and may be
exercised in accordance with the terms of the 2004 Incentive
Plan.
The Company estimates the fair value of share-based payment awards
on the date of grant using the Black-Scholes option-pricing model
(“Black-Scholes model”). Using the Black-Scholes model,
the value of the portion of the award that is ultimately expected
to vest is recognized as a period expense over the requisite
service period in the statement of comprehensive loss. Option
forfeitures are to be estimated at the time of grant and revised,
if necessary, in subsequent periods if actual forfeitures differ
from those estimates. The Company does not expect any forfeiture of
its option grants and therefore the compensation expense has not
been reduced for estimated forfeitures. During fiscal year 2017,
15,000 options expired. During fiscal year 2016, 10,000 options
expired. The Company attributes the value of share-based
compensation to expense using the straight-line single option
method for all options granted.
The Company’s determination of the estimated fair value of
share-based payment awards on the date of grant is affected by the
following variables and assumptions:
●
The
grant date exercise price – is the closing market price
of the Company’s common stock on the date of
grant;
●
Estimated
option lives – based on historical experience with
existing option holders;
F-20
PURE
CYCLE CORPORATION
NOTES
TO CONSOLIDATED FINANCIAL STATEMENTS
August
31, 2017, 2016 and 2015
●
Estimated
dividend rates – based on historical and anticipated
dividends over the life of the option;
●
Life
of the option – based on historical experience, option grants
have lives of between 8 and 10 years;
●
Risk-free
interest rates – with maturities that approximate the
expected life of the options granted;
●
Calculated
stock price volatility – calculated over the expected
life of the options granted, which is calculated based on the
weekly closing price of the Company’s common stock over a
period equal to the expected life of the option; and
●
Option
exercise behaviors – based on actual and projected
employee stock option exercises and forfeitures.
In January 2017, the Company granted its non-employee directors
options to purchase a combined 32,500 shares of the Company’s
common stock pursuant to the 2014 Equity Plan. All of the options
vest one year after the date of grant, and expire 10 years after
the date of grant. The Company calculated the fair value of the
options granted during January 2017 at approximately $112,700,
using the Black-Scholes model with the following variables:
weighted average exercise price of $5.10 (which was the closing
sales price of the Company’s common stock on the date of
grant); estimated option lives of 10 years; weighted average risk
free interest rate of 2.42%; weighted average stock price
volatility of 57.56%; and an estimated forfeiture rate of 0%. The
$112,700 of stock-based compensation is being expensed monthly over
the vesting periods.
In October 2016, the Company granted its President an option to
purchase 50,000 shares of the Company’s common stock pursuant
to the 2014 Equity Plan. The option vests one-third one year from
the date of grant, one-third two years from the date of grant, and
one-third three years from the date of grant. The option expires 10
years from the date of grant. The Company calculated the fair value
of this option at approximately $188,300 using the Black-Scholes
model with the following variables: weighted average exercise price
of $5.61 (which was the closing sales price of the Company’s
common stock on the date of grant); estimated option life of 10
years; estimated dividend rate of 0%; weighted average risk-free
interest rate of 1.79%; weighted average stock price volatility of
57.85%; and an estimated forfeiture rate of 0%. The $188,300 of
stock-based compensation as being expensed monthly over the vesting
period. In September 2016, the Company granted employee options to
purchase 60,000 shares of the Company’s common stock pursuant
to the 2014 Equity Plan. The options vest one-third one year from
the date of grant, one-third two years from the date of grant, and
one-third three years from the date of grant. The options expire 10
years from the date of grant. The Company calculated the fair value
of these options at approximately $222,500 using the Black-Scholes
model with the following variables: weighted average exercise price
of $5.56 (which was the closing sales price of the Company’s
common stock on the date of grant); estimated option life of 10
years; estimated dividend rate of 0%; weighted average risk-free
interest rate of 1.560%; weighted average stock price volatility of
57.81%; and an estimated forfeiture rate of 0%. The $222,500 of
stock-based compensation as being expensed monthly over the vesting
period.
In January 2016, the Company granted its non-employee directors
options to purchase a combined 36,000 shares of the Company’s
common stock pursuant to the 2014 Equity Plan. Options for 26,000
shares vest one year after the date of grant and options for 10,000
shares vest one half one year after the date of grant and one half
two years after the date of grant. All of the options expire 10
years after the date of grant. The Company calculated the fair
value of the options granted during January 2016 at approximately
$104,100, using the Black-Scholes model with the following
variables: weighted average exercise price of $4.26 (which was the
closing sales price of the Company’s common stock on the date
of grant); estimated option lives of 10 years; weighted average
risk free interest rate of 2.06%; weighted average stock price
volatility of 58.26%; and an estimated forfeiture rate of 0%. The
$104,100 of stock-based compensation is being expensed monthly over
the vesting periods.
In January 2015, the Company granted its non-employee directors
options to purchase a combined 26,000 shares of the Company’s
common stock pursuant to the 2014 Equity Plan. The options vest one
year after the date of grant and expire 10 years after the date of
grant. The Company calculated the fair value of the options granted
during January 2015 at approximately $72,000, using the
Black-Scholes model with the following variables: weighted average
exercise price of $4.17 (which was the closing sales price of the
Company’s common stock on the date of grant); estimated
option lives of 10 years; weighted average risk free interest rate
of 1.77%; weighted average stock price volatility of 57.45%; and an
estimated forfeiture rate of 0%. The $72,000 of stock-based
compensation is being expensed monthly over the vesting
periods.
F-21
PURE
CYCLE CORPORATION
NOTES
TO CONSOLIDATED FINANCIAL STATEMENTS
August
31, 2017, 2016 and 2015
During the fiscal year ended August 31, 2015, 16,500 options were
exercised. No options were exercised during the fiscal year ended
August 31, 2017 or 2016.
The following table summarizes the stock option activity for the
combined 2004 Incentive Plan and 2014 Equity Plan for the fiscal
year ended August 31, 2017:
|
|
Number
of Options
|
Weighted-Average
Exercise Price
|
Weighted-Average
Remaining Contractual Term
|
Approximate
Aggregate Intrinsic Value
|
|
Outstanding
at August 31, 2016
|
338,000
|
$
4.77
|
|
|
|
Granted
|
142,500
|
$
5.47
|
|
|
|
Exercised
|
-
|
$
-
|
|
|
|
Forfeited
or expired
|
(15,000
)
|
$
7.88
|
|
|
|
Outstanding
at August 31, 2017
|
465,500
|
$
4.88
|
6.30
|
$
1,007,740
|
|
|
|
|
|
|
|
Options
exercisable at August 31, 2017
|
318,000
|
$
4.63
|
4.98
|
$
1,358,140
|
The following table summarizes the activity and value of non-vested
options as of and for the fiscal year ended August 31,
2017:
|
|
Number
of Options
|
Weighted-Average
Grant Date Fair Value
|
|
Non-vested
options outstanding at August 31, 2016
|
36,000
|
$
2.89
|
|
Granted
|
142,500
|
3.67
|
|
Vested
|
(31,000
)
|
2.92
|
|
Forfeited
|
-
|
-
|
|
Non-vested
options outstanding at August 31, 2017
|
147,500
|
$
3.64
|
All non-vested options are expected to vest. The total fair value
of options vested during the fiscal years ended August 31, 2017,
2016 and 2015 was $90,500 $216,900, and $280,700, respectively. The
weighted average grant date fair value of options granted during
the fiscal years ended August 31, 2017, 2016 and 2015 was $3.67,
$2.89, and $2.78, respectively.
Share-based compensation expense for the fiscal years ended August
31, 2017, 2016 and 2015, was $233,200, $219,900, and $240,000,
respectively.
At August 31, 2017, the Company had unrecognized expenses relating
to non-vested options that are expected to vest totaling
$335,800.
The
weighted-average period over which these options are expected to
vest is less than three years. The Company has not recorded any
excess tax benefits to additional paid in
capital.
Warrants
As of August 31, 2017, the Company had outstanding warrants to
purchase 92 shares of common stock at an exercise price of $1.80
per share. These warrants expire six months from the earlier
of:
(i)
The
date all of the Export Water is sold or otherwise disposed
of,
(ii)
The
date the CAA is terminated with respect to the original holder of
the warrant, or
(iii)
The
date on which the Company makes the final payment pursuant to
Section 2.1(r) of the CAA.
No warrants were exercised during fiscal 2017, 2016 or
2015.
F-22
PURE
CYCLE CORPORATION
NOTES
TO CONSOLIDATED FINANCIAL STATEMENTS
August
31, 2017, 2016 and 2015
Pursuant to the Rangeview Water Agreements and an Export Service
Agreement entered into with the Rangeview District dated June 16,
2017, the Company provides water and wastewater services on the
Rangeview District’s behalf to the Rangeview District’s
customers. Sales to the Rangeview District accounted for 25%, 67%
and 19% of the Company’s total water and wastewater revenues
for the fiscal years ended August 31, 2017, 2016 and 2015,
respectively. The Rangeview District had one significant customer,
the Ridgeview Youth Services Center. The Rangeview District’s
significant customer accounted for 21%, 55%, and 16% of the
Company’s total water and wastewater revenues for the fiscal
years ended August 31, 2017, 2016 and 2015,
respectively.
Revenues from two other customers directly and indirectly
represented approximately
55%, 1%,
and 75% of the Company’s water and
wastewater revenues for the fiscal years ended August 31, 2017,
2016 and 2015, respectively. Of the two customers, one
customer represented 25%, nil, and nil of the Company's water and
wastewater revenues for the fiscal years ended August 31, 2017,
2016, and 2015, respectively, and the other customer represented
30%, 1%, and 75% of the Company's water and wastewater revenues for
the fiscal years ended August 31, 2017, 2016, and 2015,
respectively.
The Company had accounts receivable from the Rangeview District
which accounted for 50% and 74% of the Company’s trade
receivables balances at August 31, 2017 and 2016, respectively. Of
the trade receivables from the Rangeview District, approximately
50% is related to water tap sales and 50% is related to water and
wastewater service sales. The Company had accounts receivable from
one other customer of approximately 46% and 16% at August 31, 2017
and 2016, respectively. Accounts receivable from the Rangeview
District’s largest customer accounted for 19% and 63% of the
Company’s water and wastewater trade receivables as of August
31, 2017 and 2016, respectively.
Deferred income taxes reflect the tax effects of net operating loss
carryforwards and temporary differences between the carrying
amounts of assets and liabilities for financial reporting purposes
and the amounts used for income tax purposes. Significant
components of the Company’s deferred tax assets as of August
31 are as follows:
|
|
For the
Fiscal Years Ended August 31,
|
|
|
|
2017
|
2016
|
|
Deferred
tax assets:
|
|
|
|
Net operating loss carryforwards
|
$
2,893,600
|
$
2,393,200
|
|
Deferred revenue
|
316,400
|
344,300
|
|
Depreciation and depletion
|
289,200
|
247,400
|
|
Other
|
88,000
|
65,600
|
|
Valuation allowance
|
(3,587,200
)
|
(3,050,500
)
|
|
Net deferred tax asset
|
$
-
|
$
-
|
The Company has recorded a valuation allowance against the deferred
tax assets as it is more likely than not that all or some portion
of specific deferred tax assets will not be realized, primarily due
to the fact that the Company has generated a cumulative net loss
position over the past three fiscal years.
Income taxes computed using the federal statutory income tax rate
differs from our effective tax rate primarily due to the following
for the fiscal years ended August 31:
|
|
For the
Fiscal Years Ended August 31,
|
||
|
|
2017
|
2016
|
2015
|
|
Expected
benefit from federal taxes at statutory rate of 34%
|
$
(571,500
)
|
$
(420,300
)
|
$
(195,500
)
|
|
State
taxes, net of federal benefit
|
(55,500
)
|
(40,700
)
|
(19,000
)
|
|
Permanent
and other differences
|
90,300
|
84,500
|
91,900
|
|
Change
in valuation allowance
|
536,700
|
376,500
|
122,600
|
|
Total
income tax expense / (benefit)
|
$
-
|
$
-
|
$
-
|
At August 31, 2017, the Company has $7.9
million
of net operating loss carryforwards available for income tax
purposes, which expire between fiscal 2032 and
2037.
F-23
PURE
CYCLE CORPORATION
NOTES
TO CONSOLIDATED FINANCIAL STATEMENTS
August
31, 2017, 2016 and 2015
No net operating loss carryforwards expired during the fiscal years
ended August 31, 2017, 2016 or 2015.
The Company maintains a Pure Cycle Corporation 401(k) Profit
Sharing Plan (the “Plan”), a defined contribution
retirement plan for the benefit of its employees. The Plan is
currently a salary deferral only plan, and at this time the Company
does not match employee contributions. The Company pays the annual
administrative fees of the Plan, and the Plan participants pay the
investment fees. The Plan is open to all employees, age 21 or
older, who have been employees of the Company for at least six
months. During the fiscal years ended August 31, 2017, 2016 and
2015, the Company paid fees of $ 4,200, $5,000 and $3,800,
respectively, for the administration of the Plan.
The Company has historically been involved in various claims,
litigation and other legal proceedings that arise in the ordinary
course of its business. The Company records an accrual for a loss
contingency when its occurrence is probable and damages can be
reasonably estimated based on the anticipated most likely outcome
or the minimum amount within a range of possible outcomes. The
Company makes such estimates based on information known about the
claims and experience in contesting, litigating and settling
similar claims. Disclosures are also provided for reasonably
possible losses that could have a material effect on the
Company’s financial position, results of operations or cash
flows.
Prior to the sale of the Company’s agricultural assets and
the residual operations through December 31, 2015, the Company
operated primarily in two lines of business: (i) the wholesale
water and wastewater business and (ii) the agricultural
farming business. The Company has discontinued its agricultural
farming operations. Currently the Company operates its wholesale
water and wastewater services segment as its only line of business.
The wholesale water and wastewater services business includes
selling water service to customers, which is then provided by the
Company using water rights owned or controlled by the Company and
developing infrastructure to divert, treat and distribute that
water and collect, treat and reuse wastewater. As part of the
Company’s Sky Ranch development, the company is entering into
contracts for the sale of lots, see Note 16 -
Subsequent Event
for further
discussion. The Company anticipates that the real estate
sales will be a separate segment in fiscal 2018. As of and
for the year ended August 31, 2017, there were no real estate
revenues, or profit, and carrying cost of the real estate is less
than 10% of the Company’s total assets. Oil and gas
royalties and licenses, are a passive activity, and not an
operating business activity, and therefore, are not classified as a
segment.
On December 16, 2009, the Company entered into a Participation
Agreement with the Rangeview District, whereby the Company agreed
to provide funding to the Rangeview District in connection with the
Rangeview District joining the South Metro Water Supply Authority
(“SMWSA”). The Company provided funding of $198,200,
$113,600 and $78,600 for the fiscal years ended August 31, 2017,
2016, and 2015, respectively.
Through the WISE Financing Agreement, to date the Company has made
payments totaling $3,114,100 to purchase certain rights to use
existing water transmission and related infrastructure acquired by
the WISE project and to construct the connection to the WISE
system. The amounts are included in Investments in Water and Water
Systems on the Company’s balance sheet as of August 31, 2017.
The Company anticipates spending the following over the next five
fiscal years to fund the Rangeview District’s purchase of its
share of the water transmission line and additional facilities,
water and related assets for WISE and to fund operations and water
deliveries related to WISE:
|
Estimated WISE Costs
|
|||||
|
|
For the
Fiscal Years Ended August 31,
|
||||
|
|
2018
|
2019
|
2020
|
2021
|
2022
|
|
Operations
|
$
51,800
|
$
51,800
|
$
51,800
|
$
51,800
|
$
51,800
|
|
Water
Delivery
|
232,000
|
348,000
|
493,000
|
738,000
|
897,000
|
|
Capital
|
338,100
|
1,555,400
|
74,200
|
-
|
-
|
|
Other
|
23,600
|
86,600
|
23,600
|
68,300
|
83,200
|
|
|
$
645,500
|
$
2,041,800
|
$
642,600
|
$
858,100
|
$
1,032,000
|
The Company has outstanding loans of $991,900 to the Rangeview
District and Sky Ranch Districts (defined below), which are related
parties, as discussed below:
F-24
PURE
CYCLE CORPORATION
NOTES
TO CONSOLIDATED FINANCIAL STATEMENTS
August
31, 2017, 2016 and 2015
The
Rangeview District is a quasi-municipal corporation and political
subdivision of Colorado formed in 1986 for the purpose of providing
water and wastewater service to the Lowry Range and other approved
areas. The Rangeview District is governed by an elected board
of directors. Eligible voters and persons eligible to serve as a
director of Rangeview must own an interest in property within the
boundaries of Rangeview. The Company owns certain rights and real
property interests which encompass the current boundaries of
Rangeview. Sky Ranch
District
Nos. 1, 3, 4 and 5 are quasi-municipal corporations and political
subdivisions of Colorado formed for the purpose of providing
service to the Company’s Sky Ranch property (the “Sky
Ranch Districts”)
. The current directors
of the Rangeview District and Sky Ranch Districts consist of
three employees of the Company and two independent board
members.
The Rangeview District
In 1995, the Company extended a loan to the Rangeview District. The
loan provided for borrowings of up to $250,000, is unsecured, and
bears interest based on the prevailing prime rate plus 2% (6.25% at
August 31, 2017). The maturity date of the loan is December 31,
2020. Beginning in January 2014, the Rangeview District and the
Company entered into a funding agreement that allows the Company to
continue to provide funding to the Rangeview District for
day-to-day operations and accrue the funding into a note that bears
interest at a rate of 8% per annum and remains in full force and
effect for so long as the Lease remains in effect.
The $776,400 balance of the notes
receivable at August 31, 2017, includes borrowings of $393,400 and
accrued interest of $383,000. The $628,500 balance of the notes
receivable at August 31, 2016, includes borrowings of $260,200 and
accrued interest of $368,300.
Sky Ranch Metropolitan District Nos. 1, 3, 4 and 5
The Company has been providing funding to the Sky Ranch Districts.
Each year, beginning in 2012, the Company has entered into an
Operation Funding Agreement with one of the Sky Ranch Districts
obligating the Company to advance funding to the Sky Ranch District
for the operation and maintenance expenses for the then current
calendar year. All payments are subject to annual appropriations by
the Sky Ranch District in its absolute discretion. The advances by
the Company accrue interest at a rate of 8% per annum from the date
of the advance.
In November 2014, but effective as of January 1, 2014, the
Company entered into a Facilities Funding and Acquisition Agreement
with a Sky Ranch District obligating the Company to either finance
district improvements or to construct improvements on behalf of the
Sky Ranch District subject to reimbursement. Improvements subject
to this agreement are determined pursuant to a mutually agreed upon
budget. Each year in September, the parties are to mutually
determine the improvements required for the following year and
finalize a budget by the end of October. Each advance or
reimbursable expense accrues interest at a rate of 8% per annum. No
payments are required by the Sky Ranch Districts unless and until
the Sky Ranch Districts issue bonds in an amount sufficient to
reimburse the Company for all or a portion of the advances and
costs incurred.
The $215,500 balance of the receivable at August 31, 2017, includes
advances of $195,000 and accrued interest of $20,500. Upon the Sky
Ranch District’s ratification of payment, the amount was
reclassified to short-term and was recorded as part of Notes
receivable – related parties. Subsequent to fiscal year end,
the Sky Ranch District paid the outstanding note receivable to the
Company.
Nelson Pipeline Constructors LLC
On October 12, 2016, the Audit Committee of the Company’s
board of directors approved accepting a bid submitted by Nelson
Pipeline Constructors LLC to construct a pipeline connecting its
Sky Ranch water system to Rangeview’s water system for
approximately $4.2 million (the “Nelson Bid”). Nelson
Pipeline Constructors LLC is a wholly owned subsidiary of Nelson
Infrastructure Services LLC, a company in which Patrick J. Beirne
owns a 50% interest. In addition, Mr. Beirne, a director of Pure
Cycle, is Chairman and Chief Executive Officer of each of Nelson
Pipeline Constructors LLC and Nelson Infrastructure Services LLC.
Since Mr. Nelson is the 50% owner of the parent company of Nelson
Pipeline Constructors LLC, Mr. Nelson’s interest in the
transaction is approximately $2.1 million without taking into
account any profit or loss from the Nelson Bid. Pursuant to the
Company’s policies for review and approval of related party
transactions, the Nelson Bid was reviewed and approved by the Audit
Committee and by the board of directors, with Mr. Beirne
abstaining.
F-25
PURE
CYCLE CORPORATION
NOTES
TO CONSOLIDATED FINANCIAL STATEMENTS
August
31, 2017, 2016 and 2015
|
Quarterly results of operations
|
||||||||
|
|
2017
|
2016
|
||||||
|
|
Three months ended
|
Three months ended
|
||||||
|
|
30 Nov
|
28 Feb
|
31 May
|
31 Aug
|
30 Nov
|
29 Feb
|
31 May
|
31 Aug
|
|
|
(In
thousands, except per share data)
|
|||||||
|
Total
revenues
|
$
199
|
$
237
|
$
134
|
$
658
|
$
126
|
$
76
|
$
101
|
$
149
|
|
Gross
margin
|
54
|
68
|
(33
)
|
336
|
(7
)
|
(44
)
|
(34
)
|
8
|
|
Operating
loss
|
(464
)
|
(455
)
|
(631
)
|
(581
)
|
(472
)
|
(557
)
|
(533
)
|
(618
)
|
|
Discontinued
operations
|
(19
)
|
(3
)
|
(11
)
|
1
|
(3
)
|
(29
)
|
(61
)
|
13
|
|
Net
loss
|
$
(338
)
|
$
(317
)
|
$
(554
)
|
$
(501
)
|
$
(97
)
|
$
(271
)
|
$
(422
)
|
$
(521
)
|
|
|
|
|
|
|
|
|
|
|
|
Basic
and diluted
|
|
|
|
|
|
|
|
|
|
loss per share
|
$
(0.01
)
|
$
(0.01
)
|
$
(0.02
)
|
$
(0.02
)
|
*
|
$
(0.01
)
|
$
(0.02
)
|
$
(0.03
)
|
|
*
Amount is less than $.01 per share
|
|
|
|
|
|
|
|
|
The following item had a significant impact on the Company’s
net income (loss):
●
In
fiscal 2017, the Company sold approximately $478,500 ($80,300,
$141,500 and $256,700 in 2017 fiscal Q1, Q2 and Q4, respectively)
in water related to oil and gas activities as compared to nil in
fiscal 2016.
In June 2017, The Company entered into purchase and sale agreements
(collectively, the “Purchase and Sale Contracts”) with
three separate home builders pursuant to which the Company agreed
to sell, and each builder agreed to purchase, a certain number
(totaling 506) of single-family, detached residential lots at the
Sky Ranch property. Each builder is required to purchase water and
sewer taps for the lots from the Rangeview District.
The closing of the transactions contemplated by each Purchase and
Sale Contract is subject to customary closing conditions,
including, among others, the builder’s completion to its
satisfaction of a title review and other due diligence of the
property, the accuracy of the representations and warranties made
by the Company in the Purchase and Sale Contract, and a commitment
by the title company to issue to the builder a title policy,
subject to certain conditions. Each builder had a 60-day due
diligence period during which it had the right to terminate the
Purchase and Sale Contract and receive a full refund of its earnest
money deposit. The initial due diligence period was
extended. Subsequent to year end, on November 10, 2017, each
builder completed its due diligence period and agreed to continue
with its respective Purchase and Sale Contract.
The Company is obligated, pursuant to the Purchase and Sale
Contracts, or separate Lot Development Agreements (the “Lot
Development Agreements” and, together with the Purchase and
Sale Contracts, the “Builder Contracts”), to construct
infrastructure and other improvements, such as roads, curbs and
gutters, park amenities, sidewalks, street and traffic signs, water
and sanitary sewer mains and stubs, storm water management
facilities, and lot grading improvements for delivery of finished
lots to each builder. Pursuant to the Builder Contracts, the
Company must cause the Rangeview District to install and construct
off-site infrastructure improvements (
i.e.
, drainage and storm water retention ponds, a
wastewater reclamation facility, and wholesale water facilities)
for the provision of water and wastewater service to the property.
In conjunction with approvals with Arapahoe County for the Sky
Ranch project, The Company and/or the Rangeview District and the
Sky Ranch Districts are obligated to deposit into an account the
anticipated costs to install and construct substantially all the
off-site infrastructure improvements (which include drainage,
wholesale water and wastewater, and entry roadway), which is
estimated to be approximately $10.2 million.
The
Company estimates that the development of the finished lots for the
first phase (506 lots) of Sky Ranch will require an estimated total
capital of approximately $27.8 million and estimates lot sales to
home builders will generate approximately $35 million providing a
projected margin on lots of approximately $7.2
million.
The cost of developing lots together with the
sale of finished lots are expected to occur over several quarters
and the timing of cash flows will include certain milestone
deliveries, including but not limited to completion of governmental
approvals, installation of improvements, and completion of lot
deliveries. Utility revenues are derived from tap fees (which
vary depending on lot size, house size, and amount of irrigated
turf) and usage fees (which are monthly water and wastewater fees).
The current Sky Ranch water tap fees are $26,650 (per SFE), and
wastewater taps fees are $4,659 (per SFE).
F-26
As
discussed in our Current Report on Form 8-K filed on January 17,
2017, GHP Horwath, P.C. (“GHP”) resigned as our
independent registered public accounting firm. GHP resigned because
the partners and employees of GHP joined Crowe Horwath LLP
(“Crowe”). On January 16, 2017, the Audit Committee of
our board of directors engaged Crowe to serve as the independent
registered public accounting firm for the Company effective as of
that date.
During
the fiscal years ended August 31, 2015 and 2016 and through January
13, 2017, we did not have any disagreements with GHP on any matter
of accounting principles or practices, financial statement
disclosure or auditing scope or procedure, which disagreements, if
not resolved to GHP’s satisfaction, would have caused GHP to
make reference thereto in its reports on our financial statements
for the relevant periods. During the fiscal years ended August 31,
2015 and 2016 and through January 13, 2017, there were no
reportable events, as defined in Item 304(a)(1)(v) of Regulation
S-K.
(a)
Evaluation of Disclosure Controls and Procedures
We maintain disclosure controls and procedures (as such term is
defined in Rule 13a-15(e) of the Exchange Act) that are designed to
ensure that information required to be disclosed in our reports
filed or submitted to the SEC under the Exchange Act is recorded,
processed, summarized and reported within the time periods
specified by the SEC’s rules and forms, and that information
is accumulated and communicated to management, including the
principal executive and financial officer as appropriate, to allow
timely decisions regarding required disclosures. The President and
Chief Financial Officer (one person) evaluated the effectiveness of
disclosure controls and procedures as of August 31, 2017, pursuant
to Rule 13a-15(b) under the Exchange Act. Based on that evaluation,
the President and Chief Financial Officer concluded that, as of the
end of the period covered by this report, the Company’s
disclosure controls and procedures were effective. A system of
controls, no matter how well designed and operated, cannot provide
absolute assurance that the objectives of the system of controls
are met, and no evaluation of controls can provide absolute
assurance that all control issues and instances of fraud, if any,
within a company have been detected.
(b)
Management’s Report on Internal Control Over Financial
Reporting
Management is responsible for establishing and maintaining adequate
internal control over financial reporting as defined in Rule
13a-15(f) under the Exchange Act. The Exchange Act defines internal
control over financial reporting as a process designed by, or under
the supervision of, our executive and principal financial officers
and effected by our board of directors, management and other
personnel, to provide reasonable assurance regarding the
reliability of financial reporting and the preparation of financial
statements for external purposes in accordance with GAAP and
includes those policies and procedures that:
●
Pertain
to the maintenance of records that in reasonable detail accurately
and fairly reflect the transactions and dispositions of our
assets;
●
Provide
reasonable assurance that transactions are recorded as necessary to
permit preparation of financial statements in accordance with GAAP,
and that our receipts and expenditures are being made only in
accordance with authorizations of our management and our directors;
and
●
Provide
reasonable assurance regarding prevention or timely detection of
unauthorized acquisition, use or disposition of our assets that
could have a material effect on the financial
statements.
All internal control systems, no matter how well designed, have
inherent limitations. Therefore, even those systems determined to
be effective can provide only reasonable assurance with respect to
financial statement preparation and presentation. Also, projections
of any evaluation of effectiveness to future periods are subject to
the risk that controls may become inadequate because of changes in
conditions or that the degree of compliance with the policies or
procedures may deteriorate.
Management assessed the effectiveness of our internal control over
financial reporting as of August 31, 2017. In making this
assessment, we used the criteria set forth by the Committee of
Sponsoring Organizations of the Treadway Commission
(“COSO”) in Internal Control – Integrated
Framework (“2013 COSO Framework”). Based on our
assessment, we determined that, as of August 31, 2017, our internal
control over financial reporting was effective based on those
criteria.
44
(c)
R
eport of the Independent Registered Public
Accounting Firm
The
effectiveness of our internal control over financial reporting as
of August 31, 2017, has been audited by Crowe Horwath LLP, an
independent registered public accounting firm, as stated in its
attestation report which is included in Item 8
–
Consolidated
Financial Statements and Supplementary Data
of this Annual
Report on Form 10-K.
(d)
Changes in Internal Controls
No changes were made to our internal control over financial
reporting during our most recently completed fiscal quarter that
have materially affected, or are reasonably likely to materially
affect, our internal control over financial reporting.
Effective as of June 16, 2017, we entered into the Export
Service Agreement (defined herein as the “Off-Lowry Service
Agreement”) with the Rangeview District. This agreement
confirms the prior understanding of the parties that we are the
Rangeview District’s exclusive provider of water and
wastewater services for customers located outside of its Lowry
Range service area. Pursuant to the Off-Lowry Service Agreement, we
design, construct, operate and maintain the Rangeview
District’s water and wastewater systems and the systems of
other communities that have service contracts with the Rangeview
District to provide wholesale water and wastewater services to the
Rangeview District’s customers that are not on the Lowry
Range (currently, Wild Pointe Ranch and Sky Ranch).
In
accordance with the terms of the Off-Lowry Service Agreement, the
Rangeview District will pay us 100% of
water tap fees and 98% of water usage fees
received
by the Rangeview District for such services after
deducting any royalties to the Land Board, if applicable. In
addition, the Rangeview District will pay us 100% of wastewater tap
fees and 90% of monthly service and usage fees for wastewater
services received by the Rangeview District from customers off the
Lowry Range.
We are
obligated to provide such services in a commercially reasonable
manner consistent with prudent water and wastewater provider
practices in Colorado, as applicable, to meet the demands of the
Rangeview District’s customers. The Off-Lowry Service
Agreement remains in effect until all service obligations of
Rangeview to customers located outside of the Lowry Range expire or
are otherwise terminated.
Our board of directors has adopted a Code of Business Conduct and
Ethics applicable to all of our directors, officers and employees,
which is available on our website at
www.purecyclewater.com
.
We intend to disclose any amendments to or waivers from the
provisions of our Code of Business Conduct and Ethics that are
applicable to our principal executive officer, principal financial
officer or principal accounting officer and that relate to any
element of the SEC’s definition of code of ethics by posting
such information on our website, in a press release, or on a
Current Report on Form 8-K.
Information required by this item will be contained in, and is
incorporated herein by reference to, our definitive Proxy Statement
pursuant to Regulation 14A promulgated under the Exchange Act for
the Annual Meeting of Shareholders to be held in January 2018,
which is expected to be filed on or about December
8,
2017 (the “Proxy
Statement”).
The information required by this item will be included in, and is
incorporated herein by reference to, our Proxy
Statement.
The information required by this item will be included in, and is
incorporated herein by reference to, our Proxy
Statement.
45
The information required by this item will be included in, and is
incorporated herein by reference to, our Proxy
Statement.
The information required by this item will be included in, and is
incorporated herein by reference to, our Proxy
Statement.
46
|
(a)
|
Documents filed as part of this Form 10-K
|
|
(1)
|
Financial Statements
See “Index to Consolidated Financial Statements and
Supplementary Data” in
|
|
(2)
|
Financial Statement Schedules
All schedules are omitted either because they are not required or
the required information is shown in the consolidated financial
statements or notes thereto.
|
|
(3)
|
Exhibits
The exhibits listed on the accompanying “Exhibit Index”
are filed or incorporated by reference as part of this Form 10-K,
unless otherwise indicated.
|
None.
47
SIGNATURES
Pursuant to the requirements of Section 13 or 15(d) of the
Securities Exchange Act of 1934, the registrant has duly caused
this report to be signed on its behalf by the undersigned,
thereunto duly authorized.
| PURE CYCLE CORPORATION |
|
|
|
|
|
|
|
|
|
|
|
/s/
Mark
W. Harding
|
|
|
|
|
|
Mark
W. Harding, President and Chief Financial Officer
|
|
|
|
|
|
November
15, 2017
|
|
|
|
|
Pursuant to the requirements of the Securities Exchange Act of
1934, this report has been signed below by the following persons on
behalf of the registrant and in the capacities and on the dates
indicated.
|
Signature
|
|
Title
|
|
Date
|
|
/s/ Mark W. Harding
|
|
President,
Chief Financial Officer and Director
|
|
November 15, 2017
|
|
Mark W. Harding
|
|
(Principal Executive Officer, Principal Financial and Accounting
Officer)
|
|
|
|
|
|
|
|
|
|
/s/ Harrison H. Augur
|
|
|
|
|
|
Harrison H. Augur
|
|
Chairman, Director
|
|
November 15, 2017
|
|
|
|
|
|
|
|
/s/ Patrick J. Beirne
|
|
|
|
|
|
Patrick J. Beirne
|
|
Director
|
|
November 15, 2017
|
|
|
|
|
|
|
|
/s/ Arthur G. Epker III
|
|
|
|
|
|
Arthur G. Epker III
|
|
Director
|
|
November 15, 2017
|
|
|
|
|
|
|
|
/s/ Richard L. Guido
|
|
|
|
|
|
Richard L. Guido
|
|
Director
|
|
November 15, 2017
|
|
|
|
|
|
|
|
/s/ Peter C. Howell
|
|
|
|
|
|
Peter C. Howell
|
|
Director
|
|
November 15, 2017
|
48
EXHIBIT INDEX
|
Exhibit
Number
|
Description
|
|
Articles of
Incorporation of the Company. Incorporated by reference to Appendix
B to the Proxy Statement on Schedule 14A filed on December 14,
2007.
|
|
|
Bylaws
of the Company. Incorporated by reference to Appendix C to the
Proxy Statement on Schedule 14A filed on December 14,
2007.
|
|
|
Specimen Stock
Certificate. Incorporated by reference to Exhibit 4.1 to Quarterly
Report on Form 10 Q for the fiscal quarter ended February 28,
2015.
|
|
|
2004
Incentive Plan, effective April 12, 2004. Incorporated by reference
to Exhibit F to the Proxy Statement for the Annual Meeting held on
April 12, 2004. **
|
|
|
Wastewater Service
Agreement, dated January 22, 1997, by and between the Company and
the Rangeview Metropolitan District. Incorporated by reference to
Exhibit 10.3 to the Annual Report on Form 10-KSB for the fiscal
year ended August 31, 1998.
|
|
|
Comprehensive
Amendment Agreement No. 1, dated April 11, 1996, by and among Inco
Securities Corporation, the Company, the Bondholders, Gregory M.
Morey, Newell Augur, Jr., Bill Peterson, Stuart Sundlun, Alan C.
Stormo, Beverlee A. Beardslee, Bradley Kent Beardslee, Robert
Douglas Beardslee, Asra Corporation, International Properties,
Inc., and the Land Board. Incorporated by reference to Exhibit 10.7
to the Quarterly Report on Form 10-QSB for the period ended May 31,
1996.
|
|
|
Agreement for Sale
of Export Water dated April 11, 1996 by and between the Company and
the Rangeview Metropolitan District. Incorporated by reference to
Exhibit 10.3 to the Quarterly Report on Form 10-QSB for the fiscal
quarter ended May 31, 1996.
|
|
|
Bargain and Sale
Deed among the Land Board, the Rangeview Metropolitan District and
the Company dated April 11, 1996. Incorporated by reference to
Exhibit 10.18 to Amendment No. 1 to Registration Statement on Form
SB-2, filed on June 7, 2004, Registration No.
333-114568.
|
|
|
Agreement for
Water Service dated August 3, 2005 among the Company, Rangeview
Metropolitan District and Arapahoe County incorporated by reference
to Exhibit 10.24 to the Current Report on Form 8-K filed on August
4, 2005.
|
|
|
Amendment No. 1 to
Agreement for Water Service dated August 25, 2008, between the
Company and Arapahoe County. Incorporated by reference to Exhibit
10.36 to the Annual Report on Form 10-K for the fiscal year ended
August 31, 2008.
|
|
|
Paid-Up Oil and
Gas Lease dated March 14, 2011, between the Company and Anadarko
E&P Company, L.P. Incorporated by reference to Exhibit 10.1 to
the Current Report on Form 8-K filed on March 15,
2011.
|
|
|
Surface Use and
Damage Agreement dated March 14, 2011, between the Company and
Anadarko E&P Company, L.P. Incorporated by reference to Exhibit
10.2 to the Current Report on Form 8-K filed on March 15,
2011.
|
|
|
2014
Equity Incentive Plan, effective April 12, 2014. Incorporated by
reference to Appendix A to the Proxy Statement for the Annual
Meeting held on January 15, 2014. **
|
49
|
Exhibit Number
|
Description |
|
2014
Amended and Restated Lease Agreement, dated July 10, 2014, by and
between the Land Board, the Rangeview Metropolitan District, and
the Company. Incorporated by reference to Exhibit 10.2 to the
Current Report on Form 8-K filed on July 14, 2014.
|
|
|
2014
Amended and Restated Service Agreement, dated July 10, 2014, by and
between the Company and the Rangeview Metropolitan District.
Incorporated by reference to Exhibit 10.5 to the Current Report on
Form 8-K filed on July 14, 2014.
|
|
|
Rangeview/Pure
Cycle WISE Project Financing and Service Agreement, effective as of
December 22, 2014. Incorporated by reference to Exhibit 10.1 to the
Current Report on Form 8-K filed on December 30, 2014.
|
|
|
South
Metro WISE Authority Formation and Organizational Intergovernmental
Agreement, dated December 31, 2013. Incorporated by reference to
Exhibit 10.2 to Quarterly Report on Form 10-Q for the fiscal
quarter ended November 30, 2014.
|
|
|
Amended and
Restated WISE Partnership – Water Delivery Agreement, dated
December 31, 2013, among the City and County of Denver acting
through its Board of Water Commissioners, the City of Aurora acting
by and through its Utility Enterprise, and South Metro WISE
Authority. Incorporated by reference to Exhibit 10.3 to Quarterly
Report on Form 10-Q for the fiscal quarter ended November 30,
2014.
|
|
|
Agreement for
Purchase and Sale of Western Pipeline Capacity, dated November 19,
2014, among the Rangeview Metropolitan District and certain members
of the South Metro WISE Authority. Incorporated by reference to
Exhibit 10.4 to Quarterly Report on Form 10-Q for the fiscal
quarter ended November 30, 2014.
|
|
|
Water
Service Agreement by and between Rangeview Metropolitan District,
acting by and through its Water Activity Enterprise, and Elbert
& Highway 86 Commercial Metropolitan District, acting by and
through its Water Enterprise, dated as of December 15, 2016.
Incorporated by reference to Exhibit 10.1 to the Current Report on
Form 8-K filed on December 19, 2016.
|
|
|
10.18
|
Export
Service Agreement, effective as of June 16, 2017, between the
Company and the Rangeview Metropolitan District. *
|
50
|
Exhibit Number
|
Description |
|
10.19
|
Contract for
Purchase and Sale of Real Estate, dated June 27, 2017, by and
between PCY Holdings, LLC, and Richmond American Homes of Colorado,
Inc., as amended by First Amendment to Contract for Purchase and
Sale of Real Estate, dated August 28, 2017, by and between PCY
Holdings, LLC, and Richmond American Homes of Colorado, Inc., as
amended by Second Amendment to Contract for Purchase and Sale of
Real Estate, dated August 29, 2017, by and between PCY
Holdings, LLC, and Richmond American Homes of Colorado, Inc., as
amended by Third Amendment to Contract for Purchase and Sale of
Real Estate, dated September 8, 2017, by and between PCY
Holdings, LLC, and Richmond American Homes of Colorado, Inc., as
amended by Fourth Amendment to Contract for Purchase and Sale of
Real Estate, dated September 20, 2017, by and between PCY
Holdings, LLC, and Richmond American Homes of Colorado, Inc., as
amended by Fifth Amendment to Contract for Purchase and Sale of
Real Estate, dated October 6, 2017, by and between PCY
Holdings, LLC, and Richmond American Homes of Colorado, Inc., as
amended by Sixth Amendment to Contract for Purchase and Sale of
Real Estate, dated October 11, 2017, by and between PCY
Holdings, LLC, and Richmond American Homes of Colorado, Inc., as
amended by Seventh Amendment to Contract for Purchase and Sale of
Real Estate, dated October 18, 2017, by and between PCY
Holdings, LLC, and Richmond American Homes of Colorado, Inc., as
amended by Eighth Amendment to Contract for Purchase and Sale of
Real Estate, dated October 20, 2017, by and between PCY
Holdings, LLC, and Richmond American Homes of Colorado, Inc., as
amended by Ninth Amendment to Contract for Purchase and Sale of
Real Estate, dated October 20, 2017, by and between PCY
Holdings, LLC, and Richmond American Homes of Colorado, Inc., as
amended by Tenth Amendment to Contract for Purchase and Sale of
Real Estate, dated November 3, 2017, by and between PCY Holdings,
LLC, and Richmond American Homes of Colorado, Inc. *
|
|
10.20
|
Contract for
Purchase and Sale of Real Estate, dated June 27, 2017, by and
between PCY Holdings, LLC, and Taylor Morrison of Colorado, Inc.,
as amended by First Amendment to Contract for Purchase and Sale of
Real Estate, dated August 24, 2017, by and between PCY
Holdings, LLC, and Taylor Morrison of Colorado, Inc., as amended by
Second Amendment to Contract for Purchase and Sale of Real Estate,
dated September 19, 2017, by and between PCY Holdings, LLC,
and Taylor Morrison of Colorado, Inc., as amended by Third
Amendment to Contract for Purchase and Sale of Real Estate, dated
October 6, 2017, by and between PCY Holdings, LLC, and Taylor
Morrison of Colorado, Inc., as amended by Fourth Amendment to
Contract for Purchase and Sale of Real Estate, dated
October 13, 2017, by and between PCY Holdings, LLC, and Taylor
Morrison of Colorado, Inc., as amended by Fifth Amendment to
Contract for Purchase and Sale of Real Estate, dated
October 18, 2017, by and between PCY Holdings, LLC, and Taylor
Morrison of Colorado, Inc., as amended by Sixth Amendment to
Contract for Purchase and Sale of Real Estate, dated
October 20, 2017, by and between PCY Holdings, LLC, and Taylor
Morrison of Colorado, Inc., as amended by Seventh Amendment to
Contract for Purchase and Sale of Real Estate, dated
October 20, 2017, by and between PCY Holdings, LLC, and Taylor
Morrison of Colorado, Inc., as amended by Eighth Amendment to
Contract for Purchase and Sale of Real Estate, dated November 3,
2017, by and between PCY Holdings, LLC, and Taylor Morrison of
Colorado, Inc., as amended by Ninth Amendment to Contract for
Purchase and Sale of Real Estate, dated November 7, 2017, by and
between PCY Holdings, LLC, and Taylor Morrison of Colorado, Inc.
*
|
|
10.21
|
Contract for
Purchase and Sale of Real Estate, dated June 29, 2017, by and
between PCY Holdings, LLC, and KB Home Colorado Inc., as amended by
First Amendment to Contract for Purchase and Sale of Real Estate,
dated August 28, 2017, by and between PCY Holdings, LLC, and
KB Home Colorado Inc., as amended by Second Amendment to Contract
for Purchase and Sale of Real Estate, dated September 15,
2017, by and between PCY Holdings, LLC, and KB Home Colorado Inc.,
as amended by Third Amendment to Contract for Purchase and Sale of
Real Estate, dated September 28, 2017, by and between PCY
Holdings, LLC, and KB Home Colorado Inc., as amended by Fourth
Amendment to Contract for Purchase and Sale of Real Estate, dated
October 9, 2017, by and between PCY Holdings, LLC, and KB Home
Colorado Inc., as amended by Fifth Amendment to Contract for
Purchase and Sale of Real Estate, dated October 18, 2017, by
and between PCY Holdings, LLC, and KB Home Colorado Inc., as
amended by Sixth Amendment to Contract for Purchase and Sale of
Real Estate, dated October 20, 2017, by and between PCY
Holdings, LLC, and KB Home Colorado Inc., as amended by Seventh
Amendment to Contract for Purchase and Sale of Real Estate, dated
October 31, 2017, by and between PCY Holdings, LLC, and KB
Home Colorado Inc., as amended by Eighth Amendment to Contract for
Purchase and Sale of Real Estate, dated November 3, 2017, by and
between PCY Holdings, LLC, and KB Home Colorado Inc., as amended by
Ninth Amendment to Contract for Purchase and Sale of Real Estate,
dated November 7, 2017, by and between PCY Holdings, LLC, and KB
Home Colorado Inc. *
|
51
|
Exhibit Number
|
Description |
|
Letter
of GHP Horwath, P.C., dated January 13, 2017. Incorporated by
reference to Exhibit 16.1 to the Current Report on Form 8 K filed
on January 17, 2017.
|
|
|
Subsidiaries
*
|
|
|
Consent of Crowe
Horwath LLP *
|
|
|
Consent of GHP
Horwath, P.C. *
|
|
|
Certification
under Section 302 of the Sarbanes-Oxley Act of 2002. *
|
|
|
Certification
pursuant to 18 U.S.C. Section 1350, as adopted pursuant to Section
906 of the Sarbanes-Oxley Act of 2002. ***
|
|
|
101.INS
|
XBRL Instance Document.
|
|
101.SCH
|
XBRL Taxonomy Extension Schema Document. *
|
|
101.CAL
|
XBRL Taxonomy Extension Calculation Linkbase Document.
*
|
|
101.DEF
|
XBRL Taxonomy Extension Definition Linkbase Document.
*
|
|
101.LAB
|
XBRL Taxonomy Extension Label Linkbase Document. *
|
|
101.PRE
|
XBRL Taxonomy Extension Presentation Linkbase Document.
*
|
_______________________________
*
Filed
herewith
**
Indicates
management contract or compensatory plan or arrangement in which
directors or executive officers are eligible to
participate.
***
Furnished
herewith
52
TABLE OF CONTENTS
Part IItem 1 BusinessItem 1A Risk FactorsItem 1B Unresolved Staff CommentsItem 2 PropertiesItem 1 Our Water and Land AssetsItem 1 Our Water and Land Assets Sky RanchItem 3 Legal ProceedingsItem 4 Mine Safety DisclosuresPart IIItem 5 Market For Registrant S Common Equity, Related Stockholder Matters and Issuer Purchases Of Equity SecuritiesItem 6 Selected Financial DataItem 7 Management S Discussion and Analysis Of Financial Condition and Results Of OperationsPart Ii, Item 8Item 7A Quantitative and Qualitative Disclosures About Market RiskItem 8 Consolidated Financial Statements and Supplementary DataNote 1 OrganizationNote 2 Summary Of Significant Accounting PoliciesNote 3 Fair Value MeasurementsNote 4 Water and Land AssetsNote 5 Participating Interests in Export WaterNote 6 Accrued LiabilitiesNote 7 Long-term Obligations and Operating LeaseNote 8 Shareholders EquityNote 9 Significant CustomersNote 10 Income TaxesNote 11 401(k) PlanNote 12 Litigation Loss ContingenciesNote 13 Segment ReportingNote 14 Related Party TransactionsNote 15 Unaudited Quarterly Financial DataNote 16 Subsequent EventItem 9 Changes in and Disagreements with Accountants on Accounting and Financial DisclosureItem 9A Controls and ProceduresItem 9B Other InformationPart IIIItem 10 Directors, Executive Officers and Corporate GovernanceItem 11 Executive CompensationItem 12 Security Ownership Of Certain Beneficial Owners and Management and Related Stockholder MattersItem 13 Certain Relationships and Related Transactions and Director IndependenceItem 14 Principal Accountant Fees and ServicesPart IVItem 15 Exhibits and Financial Statement SchedulesItem 16 Form 10-k Summary