PATTERSON COMPANIES, INC.
10-Ks and 10-Qs
|
|
|
|
|
|
|
|
|
|
|
|
|
|
|
|
|
|
|
|
|
|
|
|
|
|
|
|
|
|
|
|
|
|
|
|
|
|
|
|
|
|
|
|
|
|
|
UNITED STATES
SECURITIES AND EXCHANGE COMMISSION
Washington, D.C. 20549
FORM 10-K
|
x
|
ANNUAL REPORT PURSUANT TO SECTION 13 OR 15(d) OF THE SECURITIES EXCHANGE ACT OF 1934
|
For the fiscal year ended
April 28, 2018
OR
|
¨
|
TRANSITION REPORT PURSUANT TO SECTION 13 OR 15(d) OF THE SECURITIES EXCHANGE ACT OF 1934
|
For the transition period from
to
Commission File No. 0-20572
PATTERSON COMPANIES, INC.
(Exact name of registrant as specified in its charter)
|
Minnesota
|
|
41-0886515
|
|
(State or other jurisdiction of
incorporation or organization)
|
|
(I.R.S. Employer
Identification No.)
|
1031 Mendota Heights Road
St. Paul, Minnesota 55120
(Address of principal executive offices including Zip Code)
Registrant’s telephone number, including area code: (651) 686-1600
Securities registered pursuant to Section 12(b) of the Act:
|
Title of each class
|
|
Name of exchange on which registered
|
|
Common Stock, par value $.01
|
|
NASDAQ Global Select Market
|
Securities registered pursuant to Section 12(g) of the Act: None
Indicate by check mark if the registrant is a well-known seasoned issuer, as defined in Rule 405 of the Securities Act. Yes
x
No
¨
Indicate by check mark if the registrant is not required to file reports pursuant to Section 13 or 15(d) of the Act. Yes
¨
No
x
Indicate by check mark whether the registrant (1) has filed all reports required to be filed by Section 13 or 15(d) of the Securities Exchange Act of 1934 during the preceding 12 months, and (2) has been subject to such filing requirements for the past 90 days. Yes
x
No
¨
Indicate by check mark whether the registrant has submitted electronically and posted on its corporate Web site, if any, every Interactive Data File required to be submitted and posted pursuant to Rule 405 of Regulation S-T (§232.405 of this chapter) during the preceding 12 months (or for such shorter period that the registrant was required to submit and post such files). Yes
x
No
¨
Indicate by check mark if disclosure of delinquent filers pursuant to Item 405 of Regulation S-K is not contained herein, and will not be contained, to the best of registrant’s knowledge, in definitive proxy or information statements incorporated by reference in Part III of this Form 10-K or any amendment to this Form 10-K.
x
Indicate by check mark whether the registrant is a large accelerated filer, an accelerated filer, a non-accelerated filer, smaller reporting company, or an emerging growth company. See definition of “large accelerated filer,” “accelerated filer,” “smaller reporting company,” and “emerging growth company” in Rule 12b-2 of the Exchange Act.
|
Large accelerated filer
|
|
x
|
|
Accelerated filer
|
|
¨
|
|
Non-accelerated filer
|
|
¨
|
|
Smaller reporting company
|
|
¨
|
|
Emerging growth company
|
|
¨
|
|
|||
If an emerging growth company, indicate by check mark if the registrant has elected not to use the extended transition period for complying with any new or revised financial accounting standards provided pursuant to Section 13(a) of the Exchange Act.
¨
Indicate by check mark whether the registrant is a shell company (as defined in Rule 12b-2 of the Exchange Act). Yes
¨
No
x
The aggregate market value of voting stock held by non-affiliates of the registrant, computed by reference to the closing sales price as quoted on the NASDAQ Global Select Market on October 28, 2017, was approximately $3,471,000,000 (For purposes of this calculation all of the registrant’s executive officers and directors are deemed affiliates of the registrant.)
As of
June 21, 2018
, there were 94,718,000 shares of Common Stock of the registrant issued and outstanding.
Documents Incorporated By Reference
Portions of the registrant’s definitive proxy statement to be filed pursuant to Regulation 14A within 120 days after the registrant’s fiscal year-end of
April 28, 2018
are incorporated by reference into Part III.
FORM 10-K INDEX
|
Page
|
|||
|
Item 1.
|
|||
|
Item 1A.
|
|||
|
Item 1B.
|
|||
|
Item 2.
|
|||
|
Item 3.
|
|||
|
Item 4.
|
|||
|
Item 5.
|
|||
|
Item 6.
|
|||
|
Item 7.
|
|||
|
Item 7A.
|
|||
|
Item 8.
|
|||
|
Item 9.
|
|||
|
Item 9A.
|
|||
|
Item 9B.
|
|||
|
Item 10.
|
|||
|
Item 11.
|
|||
|
Item 12.
|
|||
|
Item 13.
|
|||
|
Item 14.
|
|||
|
Item 15.
|
|||
|
Item 16.
|
|||
2
Certain information of a non-historical nature contained in Items 1, 2, 3 and 7 of this Form 10-K includes “forward-looking statements” within the meaning of the Private Securities Litigation Reform Act of 1995. When used in this Form 10-K, the words “anticipates,” “plans,” “believes,” “estimates,” “intends,” “expects,” “projects,” “will” and similar expressions may identify forward-looking statements, although not all forward-looking statements contain such words. Such statements, including, but not limited to, our statements regarding business strategy, growth strategy, competitive strengths, productivity and profitability enhancement, competition, new product and service introductions and liquidity and capital resources, are based on management’s beliefs, as well as on assumptions made by and information currently available to management, and involve various risks and uncertainties, some of which are beyond our control. Our actual results could differ materially from those expressed in any forward-looking statement made by us or on our behalf. Reference is made to “Risk Factors” in Item 1A and “Management’s Discussion and Analysis of Financial Condition and Results of Operations” in Item 7 of this Form 10-K, for a discussion of certain factors that could cause actual operating results to differ materially from those expressed in any forward-looking statements. In light of these risks and uncertainties, there can be no assurance that the forward-looking information will in fact prove to be accurate. We have undertaken no obligation to publicly update or revise any forward-looking statements, whether as a result of new information, future events or otherwise.
General
Patterson Companies, Inc. is a value-added specialty distributor serving the U.S. and Canadian dental supply markets and the U.S., Canadian and U.K. animal health supply markets. Patterson operates through its two strategic business units, Patterson Dental and Patterson Animal Health, offering similar products and services to different customer bases. Each business has a strong competitive position, serves a highly fragmented market that offers consolidation opportunities and offers relatively low-cost consumable supplies, which makes our value-added business proposition highly attractive to our customers. We believe that we have a strong brand identity as a value-added, full-service distributor with broad product and service offerings, having begun distributing dental supplies in 1877.
In fiscal 2018, we continued the transformation that began in June 2015, when we more than doubled the size of our animal health business through the acquisition of Animal Health International, Inc. for $1.1 billion. This acquisition added a leading production animal supply business to our preexisting companion animal supply business, resulting in the creation of our animal health segment. In August 2015, we completed the disposition of our medical rehabilitative and assistive products supply business, Patterson Medical, for $717 million; the results of that business are now presented as discontinued operations. See Note 4 to the Consolidated Financial Statements for further information about the sale of Patterson Medical.
The following table sets forth consolidated net sales (in millions) by segment.
|
Fiscal Year Ended
|
|||||||||||
|
April 28, 2018
|
April 29, 2017
|
April 30, 2016
|
|||||||||
|
Dental
|
$
|
2,196
|
|
$
|
2,390
|
|
$
|
2,476
|
|
||
|
Animal Health
|
3,243
|
|
3,160
|
|
2,862
|
|
|||||
|
Corporate
|
27
|
|
43
|
|
49
|
|
|||||
|
Consolidated net sales
|
$
|
5,466
|
|
$
|
5,593
|
|
$
|
5,387
|
|
||
See Note 12 to the Consolidated Financial Statements for further information regarding our operating income and total assets by segment.
Our strategically located fulfillment centers enable us to better serve our customers and increase our operating efficiency. This infrastructure, together with broad product and service offerings at competitive prices, and a strong commitment to customer service, enables us to be a single source of supply for our customers’ needs. Our infrastructure also allows us to provide convenient ordering and rapid, accurate and complete order fulfillment.
Electronic commerce solutions have become an integral part of dental and animal health supply and distribution relationships. Our distribution business is characterized by rapid technological developments and intense competition.
3
The continuing advancement of online commerce requires us to cost-effectively adapt to changing technologies, to enhance existing services and to develop and introduce a variety of new services to address the changing demands of consumers and our customers on a timely basis, particularly in response to competitive offerings. We believe that our tradition of reliable service, our name recognition and large customer base built on solid customer relationships, position us well to participate in this significant aspect of the distribution business. We continue to explore methods to improve and expand our Internet presence and capabilities, including our online commerce offerings and our use of various social media outlets.
Patterson became publicly traded in 1992 and is a corporation organized under the laws of the state of Minnesota. We are headquartered in St. Paul, Minnesota. Our principal executive offices are located at 1031 Mendota Heights Road, St. Paul, Minnesota, and our telephone number is (651) 686-1600. Unless the context specifically requires otherwise, the terms the “Company,” “Patterson,” “we,” “us” and “our” mean Patterson Companies, Inc., a Minnesota corporation, and its consolidated subsidiaries.
The Specialty Distribution Markets We Serve
We provide manufacturers with cost effective logistics and high-caliber sales professionals to access a geographically diverse customer base, which is critical to the supply chain for the markets we serve. We provide our customers with a vast array of value-added services, a dedicated and highly skilled sales team, and a broad selection of products through a single channel, thereby helping them efficiently manage their ordering process. Due in part to the inability of our customers to store and manage large quantities of supplies at their locations, the distribution of supplies and small equipment has been characterized by frequent, small-quantity orders, and a need for rapid, reliable and substantially-complete order fulfillment. Supplies and small equipment are generally purchased from more than one distributor, with one generally serving as the primary supplier.
We believe that consolidation within the industry will continue as distributors, particularly those with limited financial, operating and marketing resources, seek to combine with larger companies that can provide growth opportunities. This consolidation also may continue to result in distributors seeking to acquire companies that can enhance their current product and service offerings or provide opportunities to serve a broader customer base.
Dental Supply Market
The dental supply market we serve consists of a sizeable geographically dispersed number of highly fragmented dental practices. Customers range in size from sole practitioners to large group practices or service organizations. According to the American Dental Association and the Canadian Dental Association, there are approximately 198,000 dentists practicing in the U.S. and 22,000 dentists practicing in Canada, respectively. We believe the average dental practitioner purchases supplies from more than one supplier.
We believe the dental supply market continues to experience growth due to an increasing U.S. population, an aging population in North America, advances in dentistry, demand for general, preventive and specialty services, increasing demand for new technologies that allow dentists to increase productivity, demand for infection control products, and insurance coverage by dental plans.
We support dental professionals through the many stock keeping units (“SKUs”) that we offer, as well as through important value-added services, including practice management software, electronic claims processing, financial services and continuing education, all designed to help maximize a practitioner’s efficiency.
Animal Health Supply Market
The animal health supply market is a mix of production animal supply, which primarily consists of beef and dairy cattle, poultry and swine, and other food-producing animals, and companion animal supply, which primarily consists of dogs, cats and horses. Similar to the dental supply market, the animal health supply market is highly fragmented and diverse. Our production animal customers include large animal veterinarians, beef producers (cow/calf, stocker and feedlots), dairy producers, poultry producers, swine producers and retail customers. According to the American Veterinary Medical Association, there are more than 70,000 veterinarians in private practice in the U.S. and Canada. Furthermore, there are approximately 22,000 veterinarians in the U.K. practicing in veterinary outlets; however, we believe there has been a shift in the U.K. market toward consolidation of veterinary practices. National Veterinary Services Limited, our veterinary products distributor in the U.K., has the highest percentage of buying groups and corporations as customers compared to its competitors.
4
We believe the animal health supply market provides growth opportunities for us. We support our animal health customers through the distribution of biologicals, pharmaceuticals, parasiticides, supplies and equipment and by actively engaging in the development, sale and distribution of inventory, accounting and health management systems. Within the companion animal supply market, we anticipate increasing demand for veterinary services due to the following factors: the increasing number of households with companion animals, increased expenditures on animal health and preventative care, an aging pet population, advancements in animal health products and diagnostic testing, and extensive marketing programs sponsored by companion animal nutrition and pharmaceutical companies.
Product sales in the production animal supply market are impacted by volatility in commodity prices such as milk, grains, livestock and poultry. Changes in weather patterns also influence how long cattle will graze and consequently the number of days an animal is on feed during a finishing phase. In addition, changes in the general economy can shift the number of animals treated, the timing of when animals are treated, to what extent they are treated and with which products they are treated. Historically, sales in this market have been largely driven by spending on animal health products to improve productivity, weight gain and disease prevention, as well as a growing focus on safety and efficiency in livestock production. Within the production animal supply market, we anticipate an increasing demand for protein as consumption continues to increase with the growing population.
Competition
The distribution industry is highly competitive. It consists principally of national, regional and local full-service distributors, mail-order distributors and, increasingly, online commerce. To a lesser extent, we also compete with mail order distributors and buying groups. Substantially all of the products we sell are available to customers from a number of suppliers. In addition, our competitors could obtain exclusive rights from manufacturers to market particular products. Some manufacturers also sell directly to end-users, thereby eliminating or reducing our role and that of other distributors.
We compete with other distributors, as well as several manufacturers, of dental and animal health products, on the basis of price, breadth of product line, customer service and value-added products and services. To differentiate ourselves from our competition we deploy a strategy of premium customer service with multiple value-added components, a highly qualified and motivated sales force, highly-trained and experienced service technicians, an extensive breadth and mix of products and services, technology solutions allowing customers to easily access our inventory, accurate and timely delivery of product, strategic location of sales offices and fulfillment centers, and competitive pricing.
In the U.S. and Canadian dental supply market, we compete against Henry Schein, Inc., Benco Dental Supply Company, Burkhardt Dental Supply and hundreds of distributors that operate on a regional or local level, or online. Also, as noted above, some manufacturers sell directly to end users. With regard to our dental practice management software, we compete against numerous companies, including Carestream Health, Inc. and Henry Schein, Inc.
In the U.S. and Canadian animal health supply market, our primary competitors are AmerisourceBergen and Henry Schein, Inc. We also compete against a number of regional and local animal health distributors, as well as a number of manufacturers, including pharmaceutical companies that sell directly to production animal operators, animal health product retailers and veterinarians. We face significant competition in the animal health supply market in the U.K., where we compete on the basis of price and customer service with several large competitors, including Henry Schein, Inc. and AmerisourceBergen. We also compete directly with pharmaceutical companies who sell certain products or services directly to the customer. In the animal health practice management market, our primary competitors are IDEXX Laboratories, Inc. and Henry Schein, Inc.
Successful distributors are increasingly providing value-added services in addition to the products they have traditionally provided. We believe that to remain competitive we must continue to add value to the distribution channel, while removing unnecessary costs associated with product movement. Significant price reductions by our competitors could result in competitive harm. Any of these competitive pressures may materially adversely affect our operating results.
Competitive Strengths
We have more than 140 years of experience in distributing products resulting in strong awareness of the Patterson brand. Although further information regarding these competitive strengths is set forth below in the discussion of our two strategic business units, our competitive strengths include:
5
|
•
|
Broad product and service offerings at competitive prices
. We offer approximately 190,000 SKUs to our customers, including many proprietary branded products. We believe that our proprietary branded products and our competitive pricing strategy have generated a loyal customer base that is confident in our brands. Of the SKUs offered, approximately 90,000 are offered to our dental customers and approximately 100,000 are offered to our animal health customers. Our product offerings include consumables, equipment and software. Our service offerings include software and design services, repair and maintenance, and equipment financing.
|
|
•
|
Focus on customer relationships and exceptional customer service.
Our sales and marketing efforts are designed to establish and solidify customer relationships through personal visits by field sales representatives, interaction via phone with sales representatives, web-based activities including e-commerce and frequent direct marketing, emphasizing our broad product lines, competitive prices and ease of order placement. We focus on providing our customers with exceptional order fulfillment and a streamlined ordering process.
|
|
•
|
Cost-effective purchasing and efficient distribution.
We believe that cost-effective purchasing is a key element to maintaining and enhancing our position as a competitive-pricing provider of dental and animal health products. We strive to maintain optimal inventory levels to satisfy customer demand for prompt and complete order fulfillment through our distribution of products from strategically located fulfillment centers.
|
Business Strategy
Our objective is to continue to expand as a leading value-added distributor of dental and animal health products and services. To accomplish this, we will apply our competitive strengths in executing the following strategies:
|
•
|
Emphasizing our value-added, full-service capabilities
. We are positioned to meet virtually all of the needs of dental practitioners, veterinarians, production animal operators and animal health product retailers by providing a broad range of consumable supplies, technology, equipment and software and value-added services. We believe our knowledgeable sales representatives can create special relationships with customers by providing an informational link to the overall industry. Our value-added strategy is further supported by our equipment specialists who offer consultation on design, equipment requirements and financing, our service technicians who perform equipment installation, maintenance and repair services, our business development professionals who provide business tools and educational programs to our customers, and our technology advisors who provide guidance on integrating technology solutions.
|
|
•
|
Using technology to enhance customer service.
As part of our commitment to providing superior customer service, we offer our customers easy order placement. Although we offer computerized order entry systems that we believe help establish relationships with new customers and increase loyalty among existing customers, predominant platforms for ordering today include www.pattersondental.com, www.pattersonvet.com and www.animalhealthinternational.com. The use of these methods of ordering enables our sales representatives to spend more time with existing and prospective customers. Our Internet environment includes order entry, customer support for digital and our proprietary products, customer-loyalty program reports and services, and access to articles and manufacturers’ product information. We also provide real-time customer and sales information to our sales force, managers and vendors via the Internet. In addition, the Patterson Technology Center (the “PTC”) differentiates Patterson from our competition by positioning Patterson as a single-source solution for digital components. In addition to trouble-shooting through the PTC’s support center, customers can access various service capabilities offered by the PTC, including electronic claims and statement processing and system back-up capabilities.
|
|
•
|
Continuing to improve operating efficiencies.
We continue to implement programs designed to improve our operating efficiencies and allow for continued sales growth. This strategy includes our continuing investment in management information systems and consolidation and leveraging of fulfillment centers and sales branches between our operating segments. In addition, we have established shared sales branch offices in several locations.
|
|
•
|
Growing through internal expansion and acquisitions
. We intend to continue to grow by hiring established sales representatives, hiring and training skilled sales professionals, opening additional locations as needed, and acquiring other distributors in order to enter new, or more deeply penetrate existing, geographic markets, gain access to additional product lines, and expand our customer base. We believe both of our operating segments are well positioned to take advantage of expected continued consolidation in our markets.
|
6
Dental Segment - Products, Services and Sources of Supply
Patterson Dental, one of the two largest distributors of dental products in North America, has operations in the U.S. and Canada. As a full-service, value-added supplier to over approximately 100,000 dentists, dental laboratories, institutions, and other healthcare professionals, Patterson Dental provides consumable products (including infection control, restorative materials, hand instruments and sterilization products); basic and advanced technology dental equipment; exclusive, innovative technology solutions, including practice management software and e-commerce solutions; patient education systems; and office forms and stationery. Patterson Dental offers customers approximately 90,000 SKUs of which more than 3,000 are private-label products sold under the Patterson brand. Patterson Dental also offers customers a range of related services including software and design services, maintenance and repair, and equipment financing. Net sales and operating income were
$2.2 billion
and
$229 million
in fiscal
2018
, respectively.
The following table sets forth the percentage of total sales by the principal categories of products and services offered to our dental segment customers:
|
Fiscal Year Ended
|
||||||||
|
April 28, 2018
|
April 29, 2017
|
April 30, 2016
|
||||||
|
Consumable
|
57
|
%
|
56
|
%
|
56
|
%
|
||
|
Equipment and software
|
30
|
|
33
|
|
33
|
|
||
|
Other
(1)
|
13
|
|
11
|
|
11
|
|
||
|
100
|
%
|
100
|
%
|
100
|
%
|
|||
|
(1)
|
Consists of other value-added services, including software and design service, and maintenance and repair.
|
Patterson Dental obtains products from hundreds of vendors. Substantially all of our relationships with vendors are non-exclusive. In September 2017, we ended the exclusive portion of our relationship with Sirona Dental Systems to enable us to better serve the evolving needs of all of our customers and the full range of practice models, including the Dental Support Organizations (“DSOs”) that represent an increasing share of the dental market.
While Patterson Dental makes purchases from many suppliers, and there is generally more than one source of supply for most of the categories of products we sell, the concentration of business with key suppliers is considerable. In fiscal
2018
and
2017
, Patterson Dental's top ten supply vendors accounted for approximately 48% and 61% of the total cost of sales, respectively. Its top vendor accounted for 20% and 30% of the total cost of sales for fiscal
2018
and
2017
, respectively.
Animal Health Segment - Products, Services and Sources of Supply
Patterson Animal Health is a leading distributor of animal health products in the U.S., Canada and the U.K. We sell more than 100,000 SKUs sourced from over 3,000 manufacturers to over 50,000 customers in the highly fragmented animal health supply market. Products we distribute include pharmaceuticals, vaccines, parasiticides, diagnostics, prescription and non-prescription diets, nutritionals, consumable supplies, equipment and software. We offer a private label portfolio of products to veterinarians, producers, and retailers through our Aspen, First Companion and Patterson Veterinary brands. We also provide a range of value-added services to our customers. Within our companion animal supply market, our principal customers are companion-pet and equine veterinarians, veterinary clinics, public and private institutions, and shelters. In our production animal supply market, our principal customers are large animal veterinarians, production animal operators and animal health product retailers. Net sales and operating income were
$3.2 billion
and
$78 million
in fiscal
2018
, respectively.
7
The following table sets forth the percentage of total sales by the principal categories of products and services offered to our animal health segment customers:
|
Fiscal Year Ended
|
||||||||
|
April 28, 2018
|
April 29, 2017
|
April 30, 2016
|
||||||
|
Consumable
|
97
|
%
|
97
|
%
|
97
|
%
|
||
|
Equipment and software
|
2
|
|
2
|
|
2
|
|
||
|
Other
|
1
|
|
1
|
|
1
|
|
||
|
100
|
%
|
100
|
%
|
100
|
%
|
|||
Patterson Animal Health obtains products from over 3,000 vendors globally. While Patterson Animal Health makes purchases from many vendors and there is generally more than one source of supply for most of the categories of products, the concentration of business with key vendors is considerable. In fiscal
2018
and
2017
, Patterson Animal Health’s top 10 manufacturers comprised approximately 70% of the total cost of sales, and the single largest supplier comprised approximately 18% of the total cost of sales.
Sales, Marketing and Distribution
During fiscal
2018
, we sold products or services to over 150,000 customers who made one or more purchases during the year. Our customers include dentists, laboratories, institutions, other healthcare professionals, veterinarians, other animal health professionals, production animal operators and animal health product retailers. No single customer accounted for more than 10% of sales during fiscal
2018
, and we are not dependent on any single customer or geographic group of customers.
We have offices throughout the U.S. and Canada so that we can provide a presence in the market and decision-making near the customer. Patterson Animal Health also has a central office in the U.K. Our offices, or sales branches, are staffed with a complete complement of our capabilities, including sales, customer service and technical service personnel, as well as a local manager who has decision-making authority with regard to customer-related transactions and issues.
A primary component of our value-added approach is our sales force. Due to the highly fragmented nature of the markets we serve, we believe that a large sales force is necessary to reach potential customers and to provide full service. Sales representatives provide an informational link to the overall industry, assist practitioners in selecting and purchasing products and help customers efficiently manage their supply inventories. Our need for a large dedicated sales force in the U.K. is reduced due to the presence of buying groups and corporate customers as well as the significant number of orders placed electronically in the U.K.
In the U.S., customer service representatives in call centers work in tandem with our sales representatives, providing a dual coverage approach for individual customers. In addition to processing orders, customer service representatives are responsible for assisting customers with ordering, informing customers of monthly promotions, and responding to general inquiries. In the U.K., our customer service team is primarily responsible for handling customer inquiries and resolving issues.
To assist our customers with their purchasing decisions, we provide a multi-touch point shopping experience. From print to digital, this seamless experience is inclusive of products and services information. Patterson offers online and in-print showcases of our expansive merchandise and equipment offerings, including digital imaging and computer-aided design and computer-aided manufacturing ("CAD/CAM") technologies, hand-held and similar instruments, sundries, office design, e-services, repair and support assistance, as well as financial services. We also promote select products and services through our monthly magazine,
Insight
, in the U.S. and Canada, and our quarterly magazine,
The Cube
, in the U.K. Additional direct marketing tools that we utilize include customer loyalty programs, social media, and participation in trade shows.
We believe that responsive delivery of quality supplies and equipment is key to customer satisfaction. We ship consumable supplies from our strategically located fulfillment centers in the U.S. and Canada. In the U.K., orders are accepted in a centralized fulfillment center and shipped nationwide to one of our depots located throughout the country at which pre-packed orders are sorted by route for delivery to customers. Orders for consumable supplies can be
8
placed through our sales representatives, customer service representatives or electronically 24 hours a day, seven days a week. Rapid and accurate order fulfillment is another principal component of our value-added approach.
In order to assure the availability of our broad product lines for prompt delivery to customers, we must maintain sufficient inventories at our fulfillment centers. Purchasing of consumables and standard equipment is centralized, and our purchasing department uses a real-time perpetual inventory system to manage inventory levels. Our inventory consists mostly of consumable supply items and pharmaceutical products.
Geographic Information
For information on revenues and long-lived assets of our segments by geographic area, see Note 12 to the Consolidated Financial Statements.
Discontinued Operations
In August 2015, we sold Patterson Medical Holdings, Inc., our wholly owned subsidiary responsible for our medical rehabilitative and assistive products supply business known as Patterson Medical, for $717 million to Madison Dearborn Partners. For a limited period of time following the disposition, Patterson continued to provide certain transition services to Patterson Medical, as owned by Madison Dearborn Partners, pursuant to a transition services agreement. See Note 4 to the Consolidated Financial Statements for additional information.
Seasonality and Other Factors Affecting Our Business and Quarterly Results
Our business in general is not seasonal; however, there are some products that typically sell more often during the winter or summer season. In any given month, unusual weather patterns (e.g., unusually hot or cold weather) could impact the sales volumes of these products, either positively or negatively. In addition, we experience fluctuations in quarterly earnings. As a result, we may fail to meet or exceed the expectations of securities analysts and investors, which could cause our stock price to decline. Quarterly results may be materially adversely affected by a variety of factors, including:
|
•
|
timing and amount of sales and marketing expenditures;
|
|
•
|
timing of pricing changes offered by our suppliers;
|
|
•
|
timing of the introduction of new products and services by our suppliers;
|
|
•
|
changes in or availability of supplier contracts or rebate programs;
|
|
•
|
supplier rebates based upon attaining certain growth goals;
|
|
•
|
changes in the way suppliers introduce or deliver products to market;
|
|
•
|
costs of developing new applications and services;
|
|
•
|
our ability to correctly identify customer needs and preferences and predict future needs and preferences;
|
|
•
|
uncertainties regarding potential significant breaches of data security or disruptions of our information technology systems;
|
|
•
|
unexpected regulatory actions, or government regulation generally;
|
|
•
|
loss of sales representatives;
|
|
•
|
costs related to acquisitions and/or integrations of technologies or businesses;
|
|
•
|
costs associated with our self-insured insurance programs;
|
|
•
|
general market and economic conditions, as well as those specific to the supply and distribution industry and related industries;
|
|
•
|
our success in establishing or maintaining business relationships;
|
|
•
|
unexpected difficulties of manufacturers in developing and manufacturing products;
|
|
•
|
product demand and availability, or product recalls by manufacturers;
|
|
•
|
exposure to product liability and other claims in the event that the use of the products we sell results in injury;
|
|
•
|
increases in shipping costs or service issues with our third-party shippers;
|
|
•
|
fluctuations in the value of foreign currencies;
|
|
•
|
changes in interest rates;
|
|
•
|
restructuring costs;
|
|
•
|
the adoption or repeal of legislation;
|
|
•
|
changes in accounting principles; and
|
|
•
|
litigation or regulatory judgments, expenses or settlements.
|
9
Governmental Regulation
Operating, Security and Licensure Standards
Our dental and animal health supply businesses involve the distribution of pharmaceuticals and medical devices, and in this regard we are subject to various local, state, federal and foreign governmental laws and regulations applicable to the distribution of pharmaceuticals and medical devices. Among the U.S. federal laws applicable to us are the Controlled Substances Act, the Federal Food, Drug, and Cosmetic Act, as amended (the “FDC Act”), and Section 361 of the Public Health Service Act. We are also subject to comparable foreign regulations.
The FDC Act and similar foreign laws generally regulate the introduction, manufacture, advertising, labeling, packaging, storage, handling, reporting, marketing and distribution of, and record keeping for, pharmaceuticals and medical devices shipped in interstate commerce, and states may similarly regulate such activities within the state. Section 361 of the Public Health Service Act, which provides authority to prevent the spread of communicable diseases, serves as the legal basis for the U.S. Food and Drug Administration’s (“FDA”) regulation of human cells, tissues and cellular and tissue-based products, also known as “HCT/P products.”
The federal Drug Quality and Security Act of 2013 brought about significant changes with respect to pharmaceutical supply chain requirements and pre-empts state law. Title II of this measure, known as the Drug Supply Chain Security Act (“DSCSA”), is being phased in over 10 years, and is intended to build a national electronic, interoperable system to identify and trace certain prescription drugs as they are distributed in the U.S. The law’s track and trace requirements applicable to manufacturers, wholesalers, repackagers and dispensers (e.g., pharmacies) of prescription drugs took effect in January 2015. The DSCSA product tracing requirements replace the former FDA drug pedigree requirements and pre-empt state requirements that are inconsistent with, more stringent than, or in addition to, the DSCSA requirements.
The DSCSA also establishes certain requirements for the licensing and operation of prescription drug wholesalers and third party logistics providers (“3PLs”), and includes the creation of national wholesaler and 3PL licenses in cases where states do not license such entities. The DSCSA requires that wholesalers and 3PLs distribute drugs in accordance with certain standards regarding the recordkeeping, storage and handling of prescription drugs. The DSCSA requires wholesalers and 3PLs to submit annual reports to the FDA, which include information regarding each state where the wholesaler or 3PL is licensed, the name and address of each facility and contact information. According to FDA guidance, states are pre-empted from imposing any licensing requirements that are inconsistent with, less stringent than, directly related to, or covered by the standards established by federal law in this area. Current state licensing requirements will likely remain in effect until the FDA issues new regulations as directed by the DSCSA.
The Food and Drug Administration Amendments Act of 2007 and the Food and Drug Administration Safety and Innovation Act of 2012 amended the FDC Act to require the FDA to promulgate regulations to implement a unique device identification (“UDI”) system. The FDA is phasing in the implementation of the UDI regulations over seven years, generally beginning with the highest-risk devices (i.e., Class III medical devices) and ending with the lowest-risk devices. The UDI regulations require “labelers” to include unique device identifiers (“UDIs”), with a content and format prescribed by the FDA and issued under a system operated by an FDA-accredited issuing agency, on the labels and packages of medical devices, and to directly mark certain devices with UDIs. The UDI regulations also require labelers to submit certain information concerning UDI-labeled devices to the FDA, much of which information is publicly available on an FDA database, the Global Unique Device Identification Database. Regulated labelers include entities such as device manufacturers, repackagers, reprocessors and relabelers that cause a device’s label to be applied or modified, with the intent that the device will be commercially distributed without any subsequent replacement or modification of the label, and include certain of our businesses.
Under the Controlled Substances Act, as a distributor of controlled substances, we are required to obtain and renew annually registrations for our facilities from the U.S. Drug Enforcement Administration (“DEA”) permitting us to handle controlled substances. We are also subject to other statutory and regulatory requirements relating to the storage, sale, marketing, handling and distribution of such drugs, in accordance with the Controlled Substances Act and its implementing regulations, and these requirements have been subject to heightened enforcement activity in recent times. We are subject to inspection by the DEA. There have also been increasing efforts by various levels of government globally to regulate the pharmaceutical distribution system in order to prevent the introduction of counterfeit, adulterated or misbranded pharmaceuticals into the distribution system.
10
Certain of our businesses are also required to register for permits and/or licenses with, and comply with operating and security standards of, the DEA, the FDA, the U.S. Department of Health and Human Services, and various state boards of pharmacy, state health departments and/or comparable state agencies as well as comparable foreign agencies, and certain accrediting bodies depending on the type of operations and location of product distribution, manufacturing or sale. These businesses include those that distribute, manufacture and/or repackage prescription pharmaceuticals and/or medical devices and/or HCT/P products, or own pharmacy operations, or install, maintain or repair equipment. In addition, Section 301 of the National Organ Transplant Act, and a number of comparable state laws, impose civil and/or criminal penalties for the transfer of certain human tissue (for example, human bone products) for valuable consideration, while generally permitting payments for the reasonable costs incurred in procuring, processing, storing and distributing that tissue. We are also subject to foreign government regulation of such products. The DEA, the FDA and state regulatory authorities have broad inspection and enforcement powers, including the ability to suspend or limit the distribution of products by our fulfillment centers, seize or order the recall of products and impose significant criminal, civil and administrative sanctions for violations of these laws and regulations. Foreign regulations subject us to similar foreign enforcement powers. Furthermore, compliance with legal requirements has required and may in the future require us to institute voluntary recalls of products we sell, which could result in financial losses and potential reputational harm. Our customers are also subject to significant federal, state, local and foreign governmental regulation.
Certain of our businesses are subject to various additional federal, state, local and foreign laws and regulations, including with respect to the sale, transportation, storage, handling and disposal of hazardous or potentially hazardous substances, and safe working conditions.
Certain of our businesses also maintain contracts with governmental agencies and are subject to certain regulatory requirements specific to government contractors.
Antitrust
The U.S. federal government, most U.S. states and many foreign countries have antitrust laws that prohibit certain types of conduct deemed to be anti-competitive. Violations of antitrust laws can result in various sanctions, including criminal and civil penalties. Private plaintiffs also can bring, and have brought, civil lawsuits against us in the U.S. for alleged antitrust violations, including claims for treble damages. See “Item 3. Legal Proceedings” for additional information.
Health Care Fraud
Certain of our businesses are subject to federal and state (and similar foreign) health care fraud and abuse, referral and reimbursement laws and regulations with respect to their operations. Some of these laws, referred to as “false claims laws,” prohibit the submission or causing the submission of false or fraudulent claims for reimbursement to federal, state and other health care payers and programs. Other laws, referred to as “anti-kickback laws,” prohibit soliciting, offering, receiving or paying remuneration in order to induce the referral of a patient or ordering, purchasing, leasing or arranging for or recommending ordering, purchasing or leasing, of items or services that are paid for by federal, state and other health care payers and programs. The fraud and abuse laws and regulations have been subject to varying interpretations, as well as heightened enforcement activity over the past few years, and significant enforcement activity has been the result of “relators,” who serve as whistleblowers by filing complaints in the name of the U.S. (and, if applicable, particular states) under federal and state false claim laws. Under the federal False Claims Act, relators can be entitled to receive up to 30% of the total recoveries. Also, violations of the federal False Claims Act can result in treble damages. Most states have adopted similar state false claims laws, and these state laws have their own penalties which may be in addition to federal False Claims Act penalties. The U.S. Patient Protection and Affordable Care Act as amended by the Health Care and Education Reconciliation Act, each enacted in March 2010 (the “Health Care Reform Law”), significantly strengthened the federal False Claims Act and the federal Anti-Kickback Law provisions, which could lead to the possibility of increased whistleblower or relator suits, and among other things made clear that a federal Anti-Kickback Law violation can be a basis for federal False Claims Act liability.
Failure to comply with fraud and abuse laws and regulations could result in significant civil and criminal penalties and costs, including the loss of licenses and the ability to participate in federal and state health care programs, and could have a material adverse effect on our business. Also, these measures may be interpreted or applied by a prosecutorial, regulatory or judicial authority in a manner that could require us to make changes in our operations or incur substantial defense and settlement expenses. Even unsuccessful challenges by regulatory authorities or private relators could result in reputational harm and the incurring of substantial costs. In addition, many of these laws are vague or indefinite
11
and have not been interpreted by the courts, and have been subject to frequent modification and varied interpretation by prosecutorial and regulatory authorities, increasing the risk of noncompliance.
Health Care Reform
The Health Care Reform Law increased federal oversight of private health insurance plans and included a number of provisions designed to reduce Medicare expenditures and the cost of health care generally, to reduce fraud and abuse, and to provide access to increased health coverage. The continued uncertain status of the Health Care Reform Law affects our ability to plan.
A Health Care Reform Law provision, generally referred to as the Physician Payment Sunshine Act or Open Payments Program, has imposed reporting and disclosure requirements for drug and device manufacturers with regard to payments or other transfers of value made to certain practitioners (including physicians, dentists and teaching hospitals), and for such manufacturers and for group purchasing organizations, with regard to certain ownership interests held by physicians in the reporting entity. The Centers for Medicare and Medicaid Services (“CMS”) publishes information from these reports on a publicly available website, including amounts transferred and physician, dentist and teaching hospital identities.
Under the Physician Payment Sunshine Act we are required to collect and report detailed information regarding certain financial relationships we have with physicians, dentists and teaching hospitals. The Physician Payment Sunshine Act pre-empts similar state reporting laws, although we or our subsidiaries may also be required to report under certain state transparency laws that address circumstances not covered by the Physician Payment Sunshine Act, and some of these state laws, as well as the federal law, can be ambiguous. We are also subject to foreign regulations requiring transparency of certain interactions between suppliers and their customers. Our compliance with these rules imposes additional costs on us.
Regulated Software; Electronic Health Records
The FDA has become increasingly active in addressing the regulation of computer software intended for use in health care settings, and has developed and continues to develop policies on regulating clinical decision support tools and other types of software as medical devices. Certain of our businesses involve the development and sale of software and related products to support physician and dental practice management, and it is possible that the FDA or foreign government authorities could determine that one or more of our products is a medical device, which could subject us or one or more of our businesses to substantial additional requirements with respect to these products.
In addition, certain of our practice management products include electronic information technology systems that store and process personal health, clinical, financial and other sensitive information of individuals. These information technology systems may be vulnerable to breakdown, wrongful intrusions, data breaches and malicious attack, which could require us to expend significant resources to eliminate these problems and address related security concerns, and could involve claims against us by private parties and/or governmental agencies. For example, we are directly or indirectly subject to numerous and evolving federal, state, local and foreign laws and regulations that protect the privacy and security of such information, such as the privacy and security provisions of the federal Health Insurance Portability and Accountability Act of 1996, as amended, and implementing regulations (“HIPAA”). HIPAA requires, among other things, the implementation of various recordkeeping, operational, notice and other practices intended to safeguard that information, limit its use to allowed purposes and notify individuals in the event of privacy and security breaches. Failure to comply with these laws and regulations can result in substantial penalties and other liabilities.
Other health information standards, such as regulations under HIPAA, establish standards regarding electronic health data transmissions and transaction code set rules for specific electronic transactions, such as transactions involving claims submissions to third party payers. Certain of our electronic practice management products must meet these requirements. Failure to abide by electronic health data transmission standards could expose us to breach of contract claims, substantial fines, penalties and other liabilities and expenses, costs for remediation and harm to our reputation.
In addition, the European Parliament and the Council of the European Union have adopted a new pan-European General Data Protection Regulation (“GDPR”), effective from May 25, 2018, which increases privacy rights for individuals in Europe, extends the scope of responsibilities for data controllers and data processors and imposes increased requirements and potential penalties on companies offering goods or services to individuals who are located in Europe (“Data Subjects”) or monitoring the behavior of such individuals (including by companies based outside of Europe). Noncompliance can result in penalties of up to the greater of EUR 20 million, or 4% of global company
12
revenues. Individual member states may impose additional requirements and penalties as they relate to certain things such as employee personal data. Among other things, the GDPR requires with respect to data concerning Data Subjects, company accountability, consents from Data Subjects or other acceptable legal basis needed to process the personal data, prompt breach notifications within 72 hours, fairness and transparency in how the personal data is stored, used or otherwise processed, and data integrity and security, and provides rights to Data Subjects relating to modification, erasure and transporting of the personal data. Our compliance with the new regulation is likely to impose additional costs on us, and we cannot predict whether the interpretations of the requirements, or changes in our practices in response to new requirements or interpretations of the requirements, could have a material adverse effect on our business.
We also sell products and services that health care providers use to store and manage patient medical or dental records. These customers are subject to laws, regulations and industry standards, such as HIPAA and the Payment Card Industry Data Security Standards, which require that they protect the privacy and security of those records, and our products may be used as part of these customers’ comprehensive data security programs, including in connection with their efforts to comply with applicable privacy and security laws. Perceived or actual security vulnerabilities in our products or services, or the perceived or actual failure by us or our customers who use our products to comply with applicable legal requirements, may not only cause us significant reputational harm, but may also lead to claims against us by our customers and/or governmental agencies and involve substantial fines, penalties and other liabilities and expenses and costs for remediation.
International Transactions
In addition, U.S. and foreign import and export laws and regulations require us to abide by certain standards relating to the importation and exportation of products. We also are subject to certain laws and regulations concerning the conduct of our foreign operations, including the FCPA and other anti-bribery laws and laws pertaining to the accuracy of our internal books and records, as well as other types of foreign requirements similar to those imposed in the U.S.
There can be no assurance that regulations that impact our business or customers’ practices will not have a material adverse effect on our business. As a result of political, economic and regulatory influences, the health care distribution industry in the U.S. is under intense scrutiny and subject to fundamental changes. We cannot predict what further reform proposals, if any, will be adopted, when they may be adopted, or what impact they may have on us.
See “Item 1A. Risk Factors” for a discussion of additional burdens, risks and regulatory developments that may affect our results of operations and financial condition.
Proprietary Rights
We hold trademarks relating to the “Patterson®” name and logo, as well as certain other trademarks. Our U.S. trademark registrations have 10-year terms, and may be renewed for additional 10-year terms. We intend to protect our trademarks to the fullest extent practicable.
Employees
As of
April 28, 2018
, we had approximately 7,700 full-time employees. We have not experienced a shortage of qualified personnel in the past and believe that we will be able to attract such employees in the future. We believe our relations with employees to be good.
Available Information
We make available free of charge through our website,
www.pattersoncompanies.com
, our Annual Report on Form 10-K, Quarterly Reports on Form 10-Q, Current Reports on Form 8-K, statements of beneficial ownership of securities on Forms 3, 4 and 5 and amendments to these reports and statements filed or furnished pursuant to Section 13(a) and Section 16 of the Securities Exchange Act of 1934 as soon as reasonably practicable after such materials are electronically filed with, or furnished to, the U.S. Securities and Exchange Commission, or SEC. This material may be accessed by visiting the Investor Relations section of our website.
The above information is also available at the SEC’s Public Reference Room at U.S. Securities and Exchange Commission, 100 F Street, N.E., Washington, D.C. 20549, on official business days during the hours of 10:00 a.m. to
13
3:00 p.m., or obtainable by calling the SEC at 1-800-SEC-0330. In addition, the SEC maintains an Internet website at
www.sec.gov
, where the above information can be viewed.
Information relating to our corporate governance, including our Principles of Business Conduct and Code of Ethics, and information concerning executive officers, Board of Directors and Board committees, and transactions in Patterson securities by directors and officers, is available on or through our website,
www.pattersoncompanies.com
in the Investor Relations section.
Information maintained on the website is not being included as part of this Annual Report on Form 10-K.
Executive Officers of the Registrant
Set forth below is the name, age and position of the executive officers of Patterson, who are elected annually and serve at the discretion of our Board of Directors, as of
June 21, 2018
.
|
Mark S. Walchirk
|
52
|
|
President and Chief Executive Officer, Director – Patterson Companies, Inc.
|
||
|
Dennis W. Goedken
|
56
|
|
Interim Chief Financial Officer and Treasurer - Patterson Companies, Inc.
|
||
|
Donald J. Zurbay
|
50
|
|
Incoming Chief Financial Officer - Patterson Companies, Inc
|
||
|
Kevin M. Pohlman
|
55
|
|
President - Patterson Animal Health
|
||
|
Les B. Korsh
|
48
|
|
Vice President, General Counsel and Secretary - Patterson Companies, Inc.
|
||
|
Andrea Frohning
|
48
|
|
Chief Human Resources Officer - Patterson Companies, Inc.
|
||
Background of Executive Officers
Mark S. Walchirk
became our President and Chief Executive Officer in November 2017. Mr. Walchirk previously served as President of U.S. Pharmaceutical at McKesson Corporation from October 2012 to October 2017, where he held responsibility for McKesson’s U.S. Pharmaceutical sales, distribution and customer service operations. Mr. Walchirk joined McKesson in April 2001 and held various leadership positions including President of McKesson Specialty Care Solutions and Chief Operating Officer of McKesson U.S. Pharmaceutical. Before joining McKesson, he spent 13 years in medical-surgical distribution and manufacturing with Baxter Healthcare, Allegiance Healthcare and Encompass Group, holding various leadership positions in sales, marketing, operations and business development. Mr. Walchirk brings strategic and leadership experience, including healthcare services and distribution experience, to our Board.
Dennis W. Goedken
became our Interim Chief Financial Officer and Treasurer in March 2018. Mr. Goedken has spent more than 12 years with Patterson having served as Corporate Controller since 2012, and as Patterson’s Assistant Controller from 1991 to 1998. During his tenure, Mr. Goedken was integrally involved in internal audit, taking the company public and various divestitures and acquisitions. Mr. Goedken currently leads the accounting team and oversees preparation of all SEC filings. Previously, Mr. Goedken held senior finance leadership positions with Ceridian HCM, Inc. and Lifetouch Inc.
Donald J. Zurbay
has been appointed to serve as our Chief Financial Officer, effective June 29, 2018. Mr. Zurbay most recently served as Vice President and Chief Financial Officer at global medical device manufacturer St. Jude Medical, Inc. from August 2012 through the January 2017 acquisition of St. Jude Medical by Abbott Laboratories. At St. Jude Medical, Mr. Zurbay was responsible for all accounting, financial and business development activities. He joined St. Jude Medical in 2003 and held various leadership positions, including Director of Finance and Vice President and Corporate Controller. Prior to joining St. Jude Medical, Mr. Zurbay worked at PricewaterhouseCoopers for five years as an Assurance and Business Advisory Services Senior Manager. Before joining PricewaterhouseCoopers, he was a General Accounting Manager at The Valspar Corporation. Mr. Zurbay started his career at Deloitte & Touche as an auditor in 1989.
Kevin M. Pohlman
became President of Patterson Animal Health in July 2017. Mr. Pohlman joined Animal Health International, Inc., which was acquired by Patterson in 2015, in August 2001 and was previously its Vice President of Sales and Marketing. Prior to assuming that role, Mr. Pohlman was President of Corporate Sales and Marketing. Beginning in 2001, Mr. Pohlman held a variety of leadership roles, including Vice President of Dealer Sales with
14
oversight of the Marketing department until June 2011. Mr. Pohlman began his career with Pohlman Bros. Supply, a family-owned dealer and distributor of dairy equipment, animal health supplies and food plan supplies in Ohio.
Les B. Korsh
became Vice President, General Counsel and Secretary of Patterson in July 2015. Mr. Korsh served as Patterson’s Associate General Counsel since June 2014. Prior to joining Patterson, Mr. Korsh held positions as Vice President and Associate General Counsel for MoneyGram International, Inc. from May 2004 to May 2014, and was a principal in the law firm of Gray Plant Mooty, P.A. from June 1999 to May 2004. He has served as a director of the Patterson Foundation since June 2016.
Andrea Frohning
became our Chief Human Resources Officer in May 2018. Ms. Frohning joined Patterson from Snyder’s-Lance where she held the role of Senior Vice President, Chief Human Resources Officer from March 2016 to March 2018, and was responsible for leading all aspects of the company’s human resources. Prior to her tenure at Snyder’s-Lance, she was Vice President Human Resources at Crane Co. from November 2013 to February 2016. Ms. Frohning also held other human resource managerial positions at Hubbell Inc., General Electric Consumer Finance and Pepsi Bottling Group.
The risks described below could have a material adverse effect on our business, reputation, financial condition and/or the trading price of our common stock. Although it is not possible to predict or identify all such risks and uncertainties, they may include, but are not limited to, the factors discussed below. Our business operations could also be affected by additional factors that are not presently known to us or that we currently consider not to be material to our operations. You should not consider this list to be a complete statement of all risks and uncertainties. The order in which these factors appear should not be construed to indicate their relative importance or priority.
The dental and animal health supply markets are highly competitive, and we may not be able to compete successfully.
Our competitors include national, regional and local full-service distributors, mail-order distributors and, increasingly, Internet-based businesses. Some of our competitors have greater resources than we do, or operate through different sales and distribution models that could allow them to compete more successfully. For example, many of our suppliers are manufacturers, some of whom compete with us by selling directly to customers. Furthermore, Internet-based businesses may be able to offer the same product at a lower cost.
Most of our products are available from multiple sources, and our customers tend to have relationships with several different distributors who can fulfill their orders. Our competitors could obtain exclusive rights to market particular products, which we would then be unable to market. Manufacturers also could increase their efforts to sell directly to end-users and thereby eliminate or reduce the role of distributors. These suppliers could sell their products at lower prices and maintain a higher gross margin on the product sales than we can. Increased competition from any supplier of dental or animal health products could significantly reduce our market share and adversely impact our financial results.
Industry consolidation among suppliers, price competition, the unavailability of products, or the emergence of new competitors also could increase competition. There has also been increasing consolidation among manufacturers, which could have a material adverse effect on our margins and product availability. This consolidation could cause the industry to become more competitive as greater economies of scale are achieved by competitors, or as competitors with new lower cost business models are able to operate with lower prices and gross profit on products. These competitive pressures could adversely affect our sales and profitability. Our failure to compete effectively may limit and/or reduce our revenue, profitability and cash flow.
General economic conditions could adversely affect our operating results and financial condition.
Uncertain weak economic conditions in the U.S. or global economy, or an uncertain economic outlook, could materially adversely affect our operating results and financial condition. These uncertainties, including, among other things:
|
•
|
changes to laws and policies governing foreign trade;
|
|
•
|
greater restrictions on imports and exports;
|
15
|
•
|
changes in laws and policies governing health care;
|
|
•
|
tariffs and sanctions;
|
|
•
|
the United Kingdom’s vote to leave the European Union;
|
|
•
|
election results;
|
|
•
|
sovereign debt levels;
|
|
•
|
the inability of political institutions to effectively resolve actual or perceived economic, currency or budgetary crises or issues;
|
|
•
|
consumer confidence;
|
|
•
|
unemployment levels (and a corresponding increase in uninsured and underinsured population);
|
|
•
|
changes in regulatory requirements and tax regulations, including, without limitation, the Tax Cuts and Reform Act;
|
|
•
|
increases in interest rates;
|
|
•
|
availability of capital;
|
|
•
|
increases in fuel and energy costs;
|
|
•
|
the effect of inflation on our ability to procure products and our ability to increase prices over time;
|
|
•
|
changes in tax rates and the availability of certain tax deductions;
|
|
•
|
increases in healthcare costs;
|
|
•
|
the threat or outbreak of war, terrorism or public unrest; and
|
|
•
|
changes in laws and policies in countries where we do business.
|
Changes in government, government debt and/or budget crises may lead to reductions in government spending in certain countries and/or higher income or corporate taxes, which could depress spending overall. In addition, recessionary conditions and depressed levels of consumer and commercial spending may cause customers to reduce, modify, delay, or cancel purchasing our products and services, and a prolonged period of economic instability could reduce their ability to make payments. Furthermore, such conditions could cause our suppliers to reduce their production, decrease their number of product offerings, or change their terms of sale to us. Increasing commodity prices may also increase our cost of operations, either directly through increased energy costs or indirectly through what we are charged by our suppliers. Recessionary economic conditions could also cause changes in our product mix as our customers prioritize established, low-margin products rather than innovative, high-margin products, which could reduce our profit margin.
We are dependent on our relationships with our sales representatives, service technicians and our customers.
The inability to attract or retain qualified employees, particularly sales representatives and service technicians who relate directly with our customers, or our inability to build or maintain relationships with customers in the dental and animal health markets, may have an adverse effect on our business. Due to the specialized nature of many of our products and services, generally only highly qualified and trained personnel have the necessary skills to market such products and provide such services. These individuals develop relationships with our customers that could be damaged if these employees are not retained. We face intense competition for the hiring of these professionals, and many professionals in the field that may otherwise be attractive candidates for us to hire may be bound by non-competition agreements with our competitors. Any failure on our part to hire, train and retain a sufficient number of qualified professionals would damage our business.
We may be unable to successfully integrate the operations of Animal Health International, Inc. or realize targeted cost savings and other benefits of the acquisition.
In June 2015, we acquired Animal Health International, Inc. Achieving the targeted benefits of the acquisition will depend in part upon whether we can integrate Animal Health International, Inc.’s businesses in an efficient and effective manner. We may not be able to accomplish this integration process smoothly or successfully. The necessity of coordinating geographically separated organizations, systems and facilities and addressing possible differences in business backgrounds, corporate cultures and management philosophies may increase the difficulties of integration. We and Animal Health International, Inc. operate numerous systems, including those involving management information, purchasing, accounting and finance, sales, billing, and regulatory compliance. Moreover, the integration of our respective operations will require the dedication of significant management resources, which is likely to distract management’s attention from day-to-day operations. Employee uncertainty and lack of focus during the integration process may also disrupt our business and result in undesired employee attrition. An inability of management to successfully integrate the operations of the two companies could have a material adverse effect on our business, results of operations and financial condition.
16
In addition, our actual cost-savings could differ materially from our initial estimates of synergies to be realized from the Animal Health International, Inc. acquisition. Actual cost-savings, the costs required to realize the cost-savings and the source of the cost-savings could differ materially from our estimates, and we cannot assure you that we will achieve cost-savings, or that these cost-savings programs will not have other adverse effects on our business.
Finally, we may not be able to achieve the targeted operating or long-term strategic benefits of the Animal Health International, Inc. acquisition. An inability to realize the full extent of, or any of, the anticipated benefits of the Animal Health International, Inc. acquisition, as well as any delays encountered in the integration process, could have an adverse effect on our business, results of operations and financial condition.
Disruption to our distribution capabilities, including service issues with our third-party shippers, could materially adversely affect our results.
Weather, natural disaster, fire, terrorism, pandemic, strikes, geopolitical events or other reasons could impair our ability to distribute our products and conduct our business. If we are unable to manage effectively such events if they occur, there could be a material adverse effect on our business, financial condition or results of operations. Similarly, increases in service costs or service issues with our third-party shippers, including strikes or other service interruptions, could cause our operating expenses to rise and materially adversely affect our ability to deliver products on a timely basis. Our ability to provide same-day shipping and next-day delivery is an integral component of our business strategy and any significant increase in shipping rates or service interruptions could adversely impact our business, financial condition or results of operations.
Our business development efforts may suffer if we fail to provide our sales force and customers with the latest customer relationship and order management tools.
Due to generational and other trends in the dental and animal health industries, our customer base is increasingly comfortable with and reliant upon the latest technologies to manage their businesses. As part of our commitment to providing superior customer service, we offer our customers computerized order entry, customer support for digital and proprietary products, including the Patterson Technology Center, customer-loyalty program reports and services, and access to articles and manufacturers’ product information. We also provide real-time customer and sales information to our sales force, managers and vendors via the Internet to enable them to compete in the digital marketplace. Our business development efforts may suffer if we fail to keep pace with rapidly changing technologies and customer expectations.
We are dependent on our suppliers because we generally do not manufacture the products we sell.
Interruptions in supply could adversely affect our operating results. If a supplier is unable to deliver product in a timely and efficient manner, whether due to financial difficulties, natural disasters or other reasons, we could experience lost sales. We generally do not have long-term contracts with our suppliers that commit them to producing products for us and there is considerable concentration within our animal health and dental businesses with a few key suppliers. In addition, because we generally do not control the actual production of the products we sell, we may be subject to delays caused by interruption in production based on conditions outside of our control, including the failure to comply with applicable government requirements. The failure of manufacturers of products regulated by the FDA or other governmental agencies to meet these requirements, could result in product recall, cessation of sales or other market disruptions. An extended interruption in the supply of our products would have an adverse effect on our results of operations.
In addition, a portion of our products is sourced, directly or indirectly, from outside the U.S. Political or financial instability, increased tariffs, restrictions on trade, currency exchange rates, labor unrest, outbreak of pandemics or other events could slow distribution activities, affect foreign trade beyond our control and adversely affect our results of operations.
Material changes in our purchasing relationship with suppliers could have a material adverse effect on our business.
Our ability to sustain our gross profits depends, in part, on the structure of our relationship with our suppliers. Such relationships are subject to change from time to time, such as changing from a “buy/sell” to an agency relationship, or from an agency to a “buy/sell” relationship, either of which could adversely affect our revenues and operating income. Suppliers may also choose to change the method in which products are taken to market, including the possibility of creating or expanding a direct sales force or otherwise reducing their reliance on third-party distribution channels. For
17
example, a supplier may change our relationship from a complete distribution provider, including logistics and sales support, to only a logistics provider, or to only a sales support provider, or it may decide to entirely terminate its business relationship with us. A reduction in our role as a value-added service provider would result in reduced margins on product sales, which could have a material adverse effect on our business, financial condition or results of operations.
Sales of private label products entail additional risks, including the risk that such sales could adversely affect our sales of other products.
We offer certain private label products that are available exclusively from us. The sale of such products subjects us to the risks generally encountered by entities that source, market and sell private label products, including but not limited to potential product liability risks, mandatory or voluntary product recalls, potential supply chain and distribution chain disruptions, and potential intellectual property infringement risks. Any failure to adequately address some or all of these risks could have an adverse effect on our business, results of operations and financial condition. In addition, an increase in the sales of our private label products may negatively affect our sales of products owned by our suppliers which, consequently, could adversely impact certain of our supplier relationships. Our ability to locate qualified, economically stable suppliers who satisfy our requirements, and to acquire sufficient products in a timely and effective manner, is critical to ensuring, among other things, that customer confidence is not diminished. As a distribution company, any failure to develop sourcing relationships with a broad and deep supplier base could adversely affect our financial performance and erode customer loyalty.
Patterson’s continued success is substantially dependent on positive perceptions of Patterson’s reputation.
One of the reasons why customers choose to do business with Patterson and why employees choose Patterson as a place of employment is the reputation that Patterson has built over many years. To be successful in the future, Patterson must continue to preserve, grow and leverage the value of Patterson’s brand. Reputational value is based in large part on perceptions of subjective qualities. Even an isolated incident, or the aggregate effect of individually insignificant incidents, can erode trust and confidence, particularly if they result in adverse publicity, governmental investigations or litigation, and as a result, could tarnish Patterson’s brand and lead to adverse effects on our business, financial condition and results of operations.
Risks inherent in acquiring other businesses could offset the anticipated benefits of such acquisitions and we may face difficulty in efficiently and effectively integrating acquired businesses.
As a part of our business strategy, we have acquired businesses in the ordinary course and expect to continue acquiring businesses in the future. These acquisitions can involve a number of risks and challenges, any of which could cause significant operating inefficiencies and adversely affect our growth and profitability, and may not result in the benefits and revenue growth we expect. Such risks and challenges include underperformance relative to our expectations and the price paid for the acquisition; unanticipated demands on our management and operational resources; difficulty in integrating personnel, operations and systems; retention of customers of the combined businesses; assumption of contingent liabilities; acquisition-related earnings charges; and acquisition-related cybersecurity risks.
As we operate through two strategic business units, we consolidate the distribution, information technology, human resources, financial and other administrative functions of those business units jointly to meet their needs while addressing distinctions in the individual markets of those segments. We may not be able to do so effectively and efficiently.
Our ability to continue to make acquisitions will depend upon our success in identifying suitable targets, which requires substantial judgment in assessing their values, strengths, weaknesses, liabilities and potential profitability, as well as the availability of suitable candidates at acceptable prices, and whether restrictions are imposed by anti-trust or other regulations.
Our acquired technology or developed technology may not be successful in maintaining existing customers or gaining new customers, or the technology may fail to produce its intended results.
The process of acquiring or developing new technology products and solutions is inherently complex and uncertain. It requires accurate anticipation of customers’ changing needs and emerging technological trends. We must make long-term investments and commit significant resources before knowing whether these investments will eventually result in products or services that achieve customer acceptance and generate the revenue required to provide desired returns. If we fail to accurately anticipate and meet our customers’ needs through the development of new products
18
and technologies and service offerings or if we fail to adequately protect our intellectual property rights, or if our new products are not widely accepted or if our current or future products fail to meet applicable regulatory requirements, we could lose customers to our competitors and that could materially and adversely affect our results of operations and financial condition. In addition, if technology investments do not achieve the intended results, we may write-off the investments, and we face the risk of claims from system users that the systems failed to produce the intended result or negatively affected the operation of our customers’ businesses. Any such claims, even those without merit, could be expensive and time-consuming to defend, cause us to lose customers and the associated revenue, divert management’s attention and resources, or require us to pay damages.
We are subject to a variety of litigation that could adversely affect our results of operations and financial condition.
We are subject to a variety of litigation incidental to our business, including product liability claims, intellectual property claims, employment claims, commercial disputes, governmental inquiries and investigations, and other matters arising out of the ordinary course of our business, including antitrust and securities litigation. From time to time we are named as a defendant in cases as a result of our distribution of products. Additionally, purchasers of private-label products may seek recourse directly from us, rather than the ultimate product manufacturer, for product-related claims. Another potential risk we face in the distribution of our products is liability resulting from counterfeit or tainted products infiltrating the supply chain. In addition, some of the products that we transport and sell are considered hazardous materials. The improper handling of such materials or accidents involving the transportation of such materials could subject us to liability. In addition, our reputation could be adversely affected by negative publicity surrounding such events regardless of whether or not claims against us are successful. Defending against such claims may divert our management’s attention, may be expensive, and may require that we pay damage awards or settlements or become subject to equitable remedies that could adversely affect our financial condition and results of operations. A successful claim brought against us in excess of available insurance or not covered by insurance or indemnification agreements, or any claim that results in significant adverse publicity against us, could have a material adverse effect on our business and our reputation. Furthermore, the outcome of litigation is inherently uncertain.
Changes in consumer preferences could adversely affect our business.
The demand for production animal health products is heavily dependent upon consumer demand for beef, dairy, poultry and swine. The food industry in general is subject to changing consumer trends, demands and preferences. Trends within the food industry change often and our failure to anticipate, identify or react to changes in these trends could lead to, among other things, reduced demand and price reductions for our animal health products, and could have a material adverse effect on our business. Moreover, even if we do anticipate and identify these trends, we may be unable to react effectively. For example, changes in consumer diets may negatively affect consumer demand for beef, dairy, poultry and/or swine, and therefore reduce the demand for our production animal health products which could have a material adverse effect on our business.
In addition, there has been consumer concern and consumer activism with respect to the use of antibiotics and growth promotants in animal feed. A sustained campaign of negative press resulting from media or consumer advocacy groups, industry litigation, loss of export markets or other factors could adversely affect the public’s perception of the industry as a whole, or lead to reluctance by consumers to buy protein or other products. Concern over the impact of growth promotants on animal welfare could result in the removal from the market of products in that category, adversely impacting our sales. In addition, heightened consumer concern over the use of antibiotics and growth promotants in animal feed could result in increased government regulation in response to that concern. Any such event may affect the growth of the production animal market and lead to a decrease in the sales of the products we distribute, which could have a material adverse effect on our business, financial condition and results of operations.
From time to time, we experience changes in customer and product mix that affect gross margin. Changes in customer and product mix result primarily from business acquisitions, changes in customer demand, customer acquisitions, selling and marketing activities and competition. There can be no assurance that we will be able to maintain historical gross margins in the future.
Our business may be directly and indirectly affected by the cyclicality of the livestock market, including the effect of poor or unusual weather conditions, that could reduce demand for the production animal products we distribute.
19
Poor or unusual weather conditions can significantly affect the purchasing decisions of our production animal customers. The timing and quantity of rainfall are two of the most important factors in agricultural production. Drought can affect the availability and price of feed for livestock. Faced with a reduction in readily available feed or an increase in costs for such feed, our customers may decide to reduce herd size, which would ultimately decrease the demand for the products we distribute, including micro feed ingredients, animal health products, dairy sanitation solutions, as well as the development and implementation of systems for feed, health, information and production animal management.
The outbreak of an infectious disease within either the production animal or companion animal population could have a significant adverse effect on our business and our results of operations.
An outbreak of disease affecting animals, such as foot-and-mouth disease, porcine epidemic diarrhea virus, Newcastle disease, avian flu or bovine spongiform encephalopathy, commonly referred to as “mad cow disease,” could result in the widespread destruction of affected animals and consequently result in a reduction in demand for animal health products. In addition, outbreaks of these or other diseases or concerns of such diseases could create adverse publicity that may have a material adverse effect on consumer demand for meat, dairy and poultry products, and, as a result, on our customers’ demand for the products we distribute. It could also harm export markets for such products and lead to increased government regulation. The outbreak of a disease among the companion animal population which could cause a reduction in the demand for companion animals could also adversely affect our business.
Pressure from animal rights groups may subject us to additional costs to conform our practices to comply with developing standards or subject us to marketing costs to defend challenges to our current practices.
The utilization of animals in research and development and product commercialization is subject to increasing focus by animal rights activists. The activities of animal rights groups and other organizations that have protested animal based research and development programs or boycotted the products resulting from such programs could cause an interruption in our supply chain. The occurrence of material operational problems could have a material adverse effect on our business, financial condition and results of operations.
Pricing pressure from branded pharmaceutical manufacturers or adverse changes in supplier rebates could negatively affect our business.
We face pricing pressure from branded pharmaceutical manufacturers. In addition, the terms on which we purchase or sell products from many suppliers of animal health products may entitle us to receive a rebate based on the attainment of certain growth goals. Suppliers may reduce or eliminate rebates offered under their programs, or increase the growth goals or other conditions we must meet to earn rebates to levels that we cannot achieve. Increased competition either from generic or equivalent branded products could result in us failing to earn rebates that are conditioned upon achievement of growth goals. Additionally, factors outside of our control, such as customer preferences, consolidation of suppliers or supply issues, can have a material impact on our ability to achieve the growth goals established by our suppliers, which may reduce the amount of rebates we receive. The occurrence of any of these events could have an adverse impact on our results of operations.
We experience fluctuations in quarterly financial results. As a result, we may fail to meet or exceed the expectations of securities analysts and investors, which could cause our stock price to decline.
Our business is subject to quarterly fluctuations. Quarterly results may be materially adversely affected by a variety of factors, including:
|
•
|
timing and amount of sales and marketing expenditures;
|
|
•
|
timing of pricing changes offered by our suppliers;
|
|
•
|
timing of the introduction of new products and services by our suppliers;
|
|
•
|
changes in or availability of supplier contracts or rebate programs;
|
|
•
|
supplier rebates based upon attaining certain growth goals;
|
|
•
|
changes in the way suppliers introduce or deliver products to market;
|
|
•
|
costs of developing new applications and services;
|
|
•
|
our ability to correctly identify customer needs and preferences and predict future needs and preferences;
|
|
•
|
uncertainties regarding potential significant breaches of data security or disruptions of our information technology systems;
|
|
•
|
unexpected regulatory actions, or government regulation generally;
|
20
|
•
|
loss of sales representatives;
|
|
•
|
costs related to acquisitions and/or integrations of technologies or businesses;
|
|
•
|
costs associated with our self-insured insurance programs;
|
|
•
|
general market and economic conditions, as well as those specific to the supply and distribution industry and related industries;
|
|
•
|
our success in establishing or maintaining business relationships;
|
|
•
|
unexpected difficulties of manufacturers in developing and manufacturing products;
|
|
•
|
product demand and availability, or product recalls by manufacturers;
|
|
•
|
exposure to product liability and other claims in the event that the use of the products we sell results in injury;
|
|
•
|
increases in shipping costs or service issues with our third-party shippers;
|
|
•
|
fluctuations in the value of foreign currencies;
|
|
•
|
changes in interest rates;
|
|
•
|
restructuring costs;
|
|
•
|
the adoption or repeal of legislation;
|
|
•
|
changes in accounting principles; and
|
|
•
|
litigation or regulatory judgments, expenses or settlements.
|
Any change in one or more of these or other factors could cause our annual or quarterly financial results to fluctuate. If our financial results do not meet market expectations, our stock price may decline.
The formation of group purchasing organizations (“GPO”) or provider networks may place us at a competitive disadvantage.
The formation of GPOs and provider networks may shift purchasing decisions to entities or persons with whom we do not have a historical relationship. This may threaten our ability to compete effectively, which could in turn negatively impact our financial results. Although we are seeking to obtain access to lower prices demanded by GPO contracts or other contracts, and to develop relationships with provider networks and new GPOs, we cannot assure that such terms will be obtained or contracts will be executed.
We may experience competition from third-party online commerce sites.
Traditional distribution relationships are being challenged by online commerce solutions. Such competition will require us to cost-effectively adapt to changing technology, to continue to provide enhanced service offerings and to continue to differentiate our business (including with additional value-added services) to address demands of consumers and customers on a timely basis. The emergence of such competition and our inability to anticipate and effectively respond to changes on a timely basis could have a material adverse effect on our business.
Increases in over-the-counter sales of companion animal products, or sales of companion animal products from non-veterinarian sources, could adversely affect our business.
Animal health products are becoming increasingly available to consumers at competitive prices from sources other than veterinarians, including human health product pharmacies, Internet pharmacies and big-box retailers. Any increase competition from such channels could have a material adverse effect on our business, financial condition or results of operations.
Our international operations are subject to inherent risks that could adversely affect our operating results.
There are a number of risks inherent in foreign operations, including complex regulatory requirements, staffing and management complexities, import and export costs, other economic factors and political considerations, all of which are subject to unanticipated changes. Additionally, foreign operations expose us to foreign currency fluctuations. Because our financial statements are denominated in U.S. dollars, changes in currency exchange rates between the U.S. dollar and other currencies will have an impact on our income. Currency exchange rate fluctuations may adversely affect our results of operations and financial condition. Furthermore, we generally do not hedge translation exposure with respect to foreign operations.
21
The U.S. Patient Protection and Affordable Care Act as amended by the Health Care and Education Reconciliation Act (the “Health Care Reform Law”) could materially adversely affect our business.
Provisions of the Health Care Reform Law could have a material adverse effect on our business. Additionally, further federal and state proposals for health care reform in the U.S. are likely, and foreign government authorities may also adopt reforms of their health systems. We cannot predict what further reform proposals, if any, will be adopted, when they may be adopted, or what impact they may have on us. The continued uncertain status of the Health Care Reform Law affects our ability to plan.
Reporting and disclosure obligations under the Physician Payment Sunshine Act provisions of the Health Care Reform Law increase the cost of our regulatory compliance.
The Physician Payment Sunshine Act imposes reporting and disclosure requirements for drug and device manufacturers with regard to payments or other transfers of value made to certain practitioners (including physicians, dentists and teaching hospitals), and for such manufacturers and for group purchasing organizations, with regard to certain ownership interests held by physicians in the reporting entity. Under the Physician Payment Sunshine Act we are required to collect and report detailed information regarding certain financial relationships we have with physicians, dentists and teaching hospitals. We may also be required to report under certain state transparency laws that address circumstances not covered by the Physician Payment Sunshine Act, and some of these state laws, as well as the federal law, can be ambiguous. We are also subject to foreign regulations requiring transparency of certain interactions between suppliers and their customers. Our compliance with these rules imposes additional costs on us.
Failure to comply with existing and future U.S. and foreign laws and regulatory requirements, including those governing the distribution of pharmaceuticals and controlled substances, could subject us to claims or otherwise harm our business.
Our business is subject to requirements under various local, state, federal and international laws and regulations applicable to the distribution of pharmaceuticals and medical devices, and human cells, tissue and cellular and tissue-based products, also known as HCT/P products, and animal feed and supplements. Among other things, such laws, and the regulations promulgated thereunder:
|
•
|
regulate the storage and distribution, labeling, packaging, handling, reporting, record keeping, introduction, manufacturing and marketing of drugs, HCT/P products and medical devices;
|
|
•
|
subject us to inspection by the FDA and the DEA;
|
|
•
|
regulate the storage, transportation and disposal of certain of our products that are considered hazardous materials;
|
|
•
|
regulate the distribution and storage of pharmaceuticals and controlled substances;
|
|
•
|
require us to advertise and promote our drugs and devices in accordance with applicable FDA requirements;
|
|
•
|
require registration with the FDA and the DEA and various state agencies;
|
|
•
|
require record keeping and documentation of transactions involving drug products;
|
|
•
|
require us to design and operate a system to identify and report suspicious orders of controlled substances to the DEA;
|
|
•
|
require us to manage returns of products that have been recalled and subject us to inspection of our recall procedures and activities; and
|
|
•
|
impose reporting requirements if a pharmaceutical, HCT/P product or medical device causes serious illness, injury or death.
|
By way of example, we are required to hold valid DEA and state-level registrations and licenses, meet various security and operating standards and comply with the Controlled Substances Act and its accompanying regulations governing the storage, sale, marketing and handling of controlled substances. Applicable federal, state, local and foreign laws and regulations also may require us to meet various standards relating to, among other things, licensure or registration, sales and marketing practices, product integrity and supply tracking to the manufacturer of the product, personnel, privacy and security of health or other personal information, installation, maintenance and repair of equipment, and the importation and exportation of products. Our business also is subject to requirements of similar and other foreign governmental laws and regulations affecting our operations abroad.
The failure to comply with any of these regulations, or new interpretations of existing laws and regulations, or the imposition of any additional laws and regulations, could materially adversely affect our business. Allegations by a governmental body that we have not complied with these and future laws could have a material adverse effect on our
22
business. If it is determined that we have not complied with these laws, we are potentially subject to penalties including warning letters, civil and criminal penalties, mandatory recall of product, seizure of product and injunction, consent decrees, and suspension or limitation of product sale and distribution. If we enter into settlement agreements to resolve allegations of non-compliance, we could be required to make settlement payments or be subject to civil and criminal penalties, including fines and the loss of licenses. Non-compliance with government requirements could adversely affect our ability to participate in federal and state government health care programs, and damage our reputation.
If we fail to comply with laws and regulations relating to health care fraud or other laws and regulations, we could suffer penalties or be required to make significant changes to our operations, which could materially adversely affect our business.
We are subject to federal and state (and similar foreign) health care fraud and abuse, referral and reimbursement laws and regulations. Some of these laws, referred to as “false claims laws,” prohibit the submission or causing the submission of false or fraudulent claims for reimbursement to federal, state and other health care payers and programs. Other laws, referred to as “anti-kickback laws,” prohibit soliciting, offering, receiving or paying remuneration in order to induce the referral of a patient or ordering, purchasing, leasing or arranging for or recommending ordering, purchasing or leasing, of items or services that are paid for by federal, state and other health care payers and programs. Health care fraud measures may implicate, for example, our relationships with pharmaceutical manufacturers, our pricing and incentive programs for physician and dental practices, and our practice management products that offer billing-related functionality.
If we fail to comply with laws and regulations relating to the confidentiality of sensitive personal information or standards in electronic health data transmissions, we could be required to make significant changes to our products, or incur substantial fines, penalties or other liabilities.
The FDA has become increasingly active in addressing the regulation of computer software intended for use in health care settings, and has developed and continues to develop policies on regulating clinical decision support tools and other types of software as medical devices. Certain of our software and related products support practice management, and it is possible that the FDA or foreign government authorities could determine that one or more of our products is a medical device, which could subject us or one or more of our businesses to substantial additional requirements with respect to these products.
Our practice management products include electronic information technology systems that store and process personal health, clinical, financial and other sensitive information of individuals. These information technology systems may be vulnerable to breakdown, wrongful intrusions, data breaches and malicious attack, which could require us to expend significant resources to eliminate these problems and address related security concerns, and could involve claims against us by private parties and/or governmental agencies. For example, we are directly or indirectly subject to numerous federal, state, local and foreign laws and regulations that protect the privacy and security of such information, such as HIPAA. HIPAA requires, among other things, the implementation of various recordkeeping, operational, notice and other practices intended to safeguard that information, limit its use to allowed purposes and notify individuals in the event of privacy and security breaches. Failure to comply with these laws and regulations could expose us to breach of contract claims, substantial fines, penalties and other liabilities and expenses, costs for remediation and harm to our reputation. Also, evolving laws and regulations in this area could restrict the ability of our customers to obtain, use or disseminate patient information, or could require us to incur significant additional costs to re-design our products in a timely manner to reflect these legal requirements, either of which could have a material adverse effect on our results of operations.
Other health information standards, such as regulations under HIPAA, establish standards regarding electronic health data transmissions and transaction code set rules for specific electronic transactions, such as transactions involving claims submissions to third party payers. Certain of our electronic practice management products must meet these requirements. Failure to abide by electronic health data transmission standards could expose us to breach of contract claims, substantial fines, penalties and other liabilities and expenses, costs for remediation and harm to our reputation.
In addition, the European Parliament and the Council of the European Union have adopted the GDPR, effective from May 25, 2018, which increases privacy rights for individuals in Europe, extends the scope or responsibilities for data controllers and data processors and imposes increased requirements and potential penalties on companies offering goods or services to Data Subjects or monitoring the behavior of such individuals (including by companies based outside of Europe). Noncompliance can result in penalties of up to the greater of EUR 20 million, or 4% of global company revenues. Individual member states may impose additional requirements and penalties as they relate to
23
certain things such as employee personal data. Among other things, the GDPR requires with respect to data concerning Data Subjects, company accountability, consents from Data Subjects or other acceptable legal basis needed to process the personal data, prompt breach notifications within 72 hours, fairness and transparency in how the personal data is stored, used or otherwise processed, and data integrity and security, and provides rights to Data Subjects relating to modification, erasure and transporting of the personal data. Our compliance with the new regulation is likely to impose additional costs on us, and we cannot predict whether the interpretations of the requirements, or changes in our practices in response to new requirements or interpretations of the requirements, could have a material adverse effect on our business.
We also sell products and services that health care providers use to store and manage patient medical or dental records. These customers are subject to laws, regulations and industry standards, such as HIPAA and the Payment Card Industry Data Security Standards, which require that they protect the privacy and security of those records, and our products may be used as part of these customers’ comprehensive data security programs, including in connection with their efforts to comply with applicable privacy and security laws. Perceived or actual security vulnerabilities in our products or services, or the perceived or actual failure by us or our customers who use our products to comply with applicable legal or contractual requirements, may not only cause us significant reputational harm, but may also lead to claims against us by our customers and/or governmental agencies and involve substantial fines, penalties and other liabilities and expenses and costs for remediation.
Risks generally associated with our information systems and cyber-security attacks could adversely affect our results of operations.
We rely on information systems (“IS”) in our business to obtain, rapidly process, analyze and manage data to, among other things:
|
•
|
facilitate the purchase and distribution of thousands of inventory items through numerous fulfillment centers;
|
|
•
|
receive, process and ship orders on a timely basis;
|
|
•
|
accurately bill and collect from thousands of customers;
|
|
•
|
process payments to suppliers; and
|
|
•
|
provide products and services that maintain certain of our customers’ electronic medical or dental records (including protected health information of their human patients).
|
As the breadth and complexity of our IS continue to grow, we will increasingly be exposed to the risks inherent in the development, integration and ongoing operation of evolving information systems, including:
|
•
|
disruption, impairment or failure of data centers, telecommunications facilities or other key infrastructure platforms;
|
|
•
|
security breaches of, cyberattacks on and other failures or malfunctions in our critical application systems or their associated hardware; and
|
|
•
|
excessive costs, excessive delays or other deficiencies in systems development and deployment.
|
Our IS are vulnerable to natural disasters, power losses, computer viruses, telecommunication failures and other problems. In addition, information security risks have generally increased in recent years. Increased IS security threats and more sophisticated computer crime, including advanced persistent threats, pose a potential risk to the security of our IS, customers and other business partners, as well as the confidentiality, availability, and integrity of our data, customers and other business partners. Cyber threats are rapidly evolving and are becoming increasingly sophisticated. Despite our efforts to ensure the integrity of our systems, as cyber threats evolve and become more difficult to detect and successfully defend against, one or more cyber threats might defeat the measures that we or our vendors take to anticipate, detect, avoid or mitigate such threats. Certain techniques used to obtain unauthorized access, introduce malicious software, disable or degrade service, or sabotage systems may be designed to remain dormant until a triggering event and we may be unable to anticipate these techniques or implement adequate preventative measures since techniques change frequently or are not recognized until launched, and because cyberattacks can originate from a wide variety of sources. These data breaches and any unauthorized access or disclosure of our information could compromise intellectual property and expose sensitive business information. Cyber-attacks could also cause us to incur significant remediation costs, disrupt key business operations and divert attention of management and key information technology resources. A cyber-security attack that bypasses our IS security causing an IS security breach may lead to a material disruption of our IS and/or the loss of business information, which could adversely affect our business. These risks may include, among others, the following:
24
|
•
|
future results could be adversely affected due to the theft, destruction, loss, misappropriation or release of confidential data or intellectual property;
|
|
•
|
operational or business delays resulting from the disruption or damage of IS and subsequent clean-up and mitigation activities, including our ability to process orders, maintain proper levels of inventories, collect accounts receivable and disburse funds;
|
|
•
|
negative publicity resulting in reputation or brand damage with our customers, suppliers or industry peers; and
|
|
•
|
lawsuits for, or regulatory proceedings relating to, a breach of personal financial and health information belonging to our customers and their patients.
|
The materialization of any of these risks may impede the processing of data and the day-to-day management of our business and could result in the corruption, loss or unauthorized disclosure of proprietary, confidential or other data. Disaster recovery plans, where in place, might not adequately protect us in the event of a system failure. Despite any precautions we take, damage from fire, floods, hurricanes, power loss, telecommunications failures, computer viruses, break-ins and similar events at our various computer facilities could result in interruptions in the flow of data to our servers.
We also increasingly rely upon server- and Internet-based technologies to run our business and to store our data as well as our customers’ data. The use of such technologies may carry additional cyber-security risks relative to those posed by legacy technologies. Our Internet-based services also depend on our ability and the ability of our customers access the Internet. In the event of any difficulties, outages or delays by Internet service providers, we may be impeded from providing such services, which may have a material adverse effect on our business and our reputation.
Our results of operations and cash flows could be adversely affected if our IS are interrupted, damaged by unforeseen events, are subject to cyber-security attacks, or fail for any extended period of time. If our business continuity plans do not provide effective alternative processes on a timely basis, we may suffer interruptions in our ability to manage or conduct our operations, which may adversely affect our business. We may need to expend additional resources in the future to continue to protect against, or to address problems caused by, any business interruptions or data security breaches.
Breaches of information systems security could damage our reputation, disrupt operations, increase costs and/or decrease revenues.
We collect and store confidential information from customers so that they may, among other things, purchase products or services, use our software or practice management systems, enroll in promotional programs, register on our websites, engage in data conversion or otherwise communicate or interact with us. We also acquire and retain information about suppliers, employees and others in the normal course of business. We may be unable to protect sensitive data and/or the integrity of our IS. In addition, compliance with evolving privacy and information security laws and standards may result in significant additional expense due to increased investment in technology and the development of new operational processes. We could be subject to liability for failure to comply with these laws and standards, failure to protect information, or failure to respond appropriately to an incident or misuse of information, including use of information for unauthorized marketing purposes.
The products we sell are subject to market and technological obsolescence; our software products may contain undetected errors or bugs when released.
Some of the products we distribute are subject to technological obsolescence outside of our control, since we do not manufacture the majority of the products we sell. If our customers discontinue purchasing a given product, we might have to record expense related to the diminution in value of inventories we have in stock, and depending on the magnitude, that expense could adversely impact our operating results.
Furthermore, we cannot be sure that we will be successful in introducing and marketing new software, software enhancements, or e-services, or that such software, software enhancements and e-services will be released on time or accepted by the market. Our software and applicable e-services products, like software products generally, may contain undetected errors or bugs when introduced, or as new versions are released. We cannot be sure that future problems with post-release software errors or bugs will not occur. Any such defective software may result in increased expenses related to the software and could adversely affect our relationships with the customers using such software, as well as our reputation. We do not have any patents on our software or e-services, and rely upon copyright, trademark and trade secret laws, as well as contractual and common-law protections. We cannot provide assurance that such legal protections will be available or enforceable to protect our software or e-services products.
25
Volatility in the financial markets could adversely affect our operating results and financial condition.
Volatility and other disruptions in the financial markets could adversely affect the cost and availability of credit to us, as well as the cost of, and ability to sell, finance contracts we receive from customers to outside financial institutions. Reduced access to capital for our customers limits the amount of investment that they can make in their businesses, and with limited investment by the customer, our revenue from equipment sales could be adversely affected.
Our ability to make payments on our debt obligations depends on our performance.
Our ability to make scheduled payments on, or refinance, our debt obligations depends on our operational and financial performance, which is subject to general economic, financial market, competitive, regulatory and other conditions and the interest rate environment that are beyond our control. If our performance were to suffer, our access to the capital necessary to run our business may become limited.
The market price for our common stock may be highly volatile.
The market price for our common stock may be highly volatile. A variety of factors may have a significant impact on the market price of our common stock, including, but not limited to:
|
•
|
the publication of earnings estimates or other research reports and speculation in the press or investment community;
|
|
•
|
changes in our industry and competitors;
|
|
•
|
changes in government or legislation;
|
|
•
|
our financial condition, results of operations and cash flows and prospects;
|
|
•
|
stock repurchases;
|
|
•
|
activism by any single large shareholder or combination of shareholders;
|
|
•
|
any future issuances of our common stock, which may include primary offerings for cash, stock splits, issuances in connection with business acquisitions, issuances of restricted stock/units and the grant or exercise of stock options from time to time;
|
|
•
|
general market and economic conditions; and
|
|
•
|
any outbreak or escalation of hostilities in areas where we do business.
|
In addition, the NASDAQ Stock Market can experience extreme price and volume fluctuations that can be unrelated or disproportionate to the operating performance of the companies listed on NASDAQ. Broad market and industry factors may negatively affect the market price of our common stock, regardless of actual operating performance. In the past, following periods of volatility in the market price of a company’s securities, securities class action litigation has often been instituted against companies. This type of litigation, if instituted, could result in substantial costs and a diversion of management’s attention and resources, which could have a material adverse effect on our business.
Recent significant changes to our executive leadership team and any future loss of members of such team, and the resulting management transitions might harm our future operating results.
We have recently experienced significant changes to our senior leadership team. In June 2017, we announced a leadership transition involving our Chief Executive Officer. Following the service of an Interim Chief Executive Officer, our board appointed a successor Chief Executive Officer whose employment commenced in November 2017. In March 2018, we announced a leadership transition involving our Chief Financial Officer and our board has appointed a successor Chief Financial Officer whose employment commences on June 29, 2018. These types of management changes have the potential to disrupt our operations due to the operational and administrative inefficiencies, added costs, decreased employee morale, uncertainty and decreased productively among our employees, increased likelihood of turnover, and the loss of personnel with deep institutional knowledge, which could result in significant disruptions to our operations. In addition, we must successfully integrate the new executive leadership team members within our organization in order to achieve our operating objectives, and changes in key leadership positions may temporarily affect our financial performance and results of operations as new leadership becomes familiar with our business. These changes could increase the volatility of our stock price. These changes also increase our dependency on other members of the executive leadership team who remain with us. These individuals are not contractually obligated to remain employed by us and may leave at any time. Such a departure could be particularly disruptive in light of the recent transitions. In addition, the loss of any of these individuals could significantly delay, prevent the achievement of, or make it more difficult for us to pursue and execute on our business objectives, and could have an
26
adverse effect on our business, financial condition and operating results. If we are unable to mitigate these or other similar risks, our business, results of operations and financial condition may be adversely affected.
Our future success depends on our leadership development and succession planning.
Our success depends, in large part, on our ability to recruit skilled personnel and then train our personnel to support the long-term growth of our business. While our Board of Directors and management actively monitor our succession plans and processes, our business could suffer if we lose key personnel unexpectedly. In addition, competition for senior management is intense and we may not be successful in attracting and retaining key personnel.
We may experience significant disruptions in our operations resulting from our enterprise resource planning system initiatives.
We depend on our information technology systems and our financial shared services for the efficient functioning of our business, including accounting, billing, data storage, purchasing and inventory management. In addition, we have implemented an enterprise resource planning (“ERP”) system across certain significant operating locations to support our operations. The implementation of this ERP system required, and will continue to require, the investment of human and financial resources. We have incurred and expect to continue to incur additional expenses as we continue to enhance and develop our ERP system. As a result of our ERP initiatives, we may encounter difficulties in operating our business, which could disrupt our operations, including our ability to timely ship and track customer orders, determine inventory requirements, manage our supply chain, manage customer billing and otherwise adequately service our customers, and lead to increased costs and other difficulties. If we experience significant disruptions resulting from our ERP initiatives, we may not be able to repair our systems in an efficient and timely manner. Accordingly, such events may disrupt or reduce the efficiency of our entire operation and have a material adverse effect on our operating results and cash flows.
Our business could be negatively adversely affected as a result of shareholder activism.
We could face adverse consequences as a result of the actions of activist investors. Campaigns by shareholders to effect changes at publicly traded companies are sometimes led by investors seeking to increase short-term shareholder value through actions such as financial restructuring, increased debt, special dividends, stock repurchases or sales of assets or the entire company. Responding to shareholder activism or engaging in a process or proxy contest may be costly and time-consuming, disrupt our operations and divert the attention of our management team and our employees from executing our business plan, which could adversely affect our business and results of operations.
We may be required to record a significant charge to earnings if our goodwill or other intangible assets become impaired.
Our balance sheet includes goodwill and other identifiable intangible assets. If impairment of our goodwill or other identifiable intangible assets is determined, we may be required to record a significant charge to earnings in the period of such determination under U.S. generally accepted accounting principles (GAAP).
Our credit agreement contains restrictive covenants and our other debt instruments contain cross-default provisions, which limit our business and financing activities.
In order to fund our financial obligations in connection with the Animal Health International, Inc. acquisition, we entered into a credit agreement, which includes customary covenants that impose restrictions on our business and financing activities, subject to certain exceptions or the consent of our lenders, including, among other things, limits on our ability to incur additional debt, create liens, enter into merger, acquisition and divestiture transactions, pay dividends and engage in transactions with affiliates. The credit agreement contains certain customary affirmative covenants, including a requirement that we maintain a maximum consolidated leverage ratio and a minimum consolidated interest coverage ratio, and customary events of default. Our ability to comply with these covenants may be adversely affected by events beyond our control, including economic, financial and industry conditions. A breach of the credit agreement covenants may result in an event of default, which could allow our lenders to terminate the commitments under the credit agreement, declare all amounts outstanding under the credit agreement (if any), together with accrued interest, to be immediately due and payable, and exercise other rights and remedies, and, through cross-default provisions, would entitle our other lenders to accelerate their loans. If this occurs, we may not be able to refinance the accelerated indebtedness on acceptable terms, or at all, or otherwise repay the accelerated indebtedness.
27
Audits by tax authorities could result in additional tax payments for prior periods, and tax legislation could materially adversely affect our financial results and tax liabilities.
The amount of income taxes we pay is subject to ongoing audits by U.S. federal, state and local tax authorities and by non-U.S. tax authorities. If these audits result in assessments different from our reserves, our future results may include unfavorable adjustments to our tax liabilities.
We are subject to the tax laws and regulations of the U.S. federal, state and local governments, as well as foreign jurisdictions. From time to time, various legislative initiatives may be proposed that could materially adversely affect our tax positions. There can be no assurance that our effective tax rate will not be materially adversely affected by legislation resulting from these initiatives. On December 22, 2017, U.S. government enacted legislation referred to as the Tax Cuts and Jobs Act ("Tax Act"), which significantly revises the Internal Revenue Code of 1986, as amended. This law may have a significant impact on our U.S. tax liabilities. The legislation is unclear in certain respects and will require the U.S. Internal Revenue Service (“IRS”) to issue regulations and interpretations, and possibly technical corrections. While there can be no assurance as to the impact of any additional guidance by the IRS, or of any guidance that may be issued by the SEC or the Financial Accounting Standards Board relating to the Tax Act, we have recorded a provisional amount of income tax to reflect the impact of the law change based on management’s current interpretation of the new legislation. The ultimate impact of U.S. tax reform could be materially different from current estimates based on our actual results and further analysis of the new law. In addition, it is uncertain if and to what extent various states will conform to the newly enacted federal tax law.
In addition, tax laws and regulations are extremely complex and subject to varying interpretations. Although we believe that our historical tax positions are sound and consistent with applicable laws, regulations and existing precedent, they can be no assurance that our tax positions will not be challenged by relevant tax authorities or that we would be successful in any such challenge.
We are exposed to the risk of changes in interest rates.
Our balance sheet includes certain non-current assets that are sensitive to movements in short-term interest rates. The variable rates are comprised of both LIBOR and commercial paper rates plus a spread and reset on certain dates, as set forth in the respective agreements. In addition, our balance sheet includes fixed rate long-term debt, whose fair value could be adversely affected by movements in interest rates. We finance purchases by our customers using finance contracts that are issued at fixed interest rates, and sell these contracts under various funding arrangements that are priced using variable interest rates. Sudden and dramatic changes in the interest rates within relevant markets could adversely affect our results of operations.
Our governing documents, other documents to which we are a party, and Minnesota law may discourage takeovers and business combinations that our shareholders might consider to be in their best interests.
Anti-takeover provisions of our articles of incorporation, bylaws, and Minnesota law could diminish the opportunity for shareholders to participate in acquisition proposals at a price above the then current market price of our common stock. For example, while we have no present plans to issue any preferred stock, our Board of Directors, without further shareholder approval, may issue up to approximately 30 million shares of undesignated preferred stock and fix the powers, preferences, rights and limitations of such class or series, which could adversely affect the voting power of our common stock. Further, as a Minnesota corporation, we are subject to provisions of the Minnesota Business Corporation Act, or MBCA, regarding “control share acquisitions” and “business combinations.” We may, in the future, consider adopting additional anti-takeover measures. The authority of our Board of Directors to issue undesignated preferred stock and the anti-takeover provisions of the MBCA, as well as any future anti-takeover measures adopted by us, may, in certain circumstances, delay, deter or prevent takeover attempts and other changes in control of our company not approved by our Board of Directors.
In addition, our Amended and Restated Equity Incentive Plan provides that awards issued under that plan are fully vested and all restrictions on the awards lapse in the event of a change in control, as defined in such plan. Additionally, our Capital Accumulation Plan provides that on an event of acceleration, as defined in the plan, the restrictions on shares of restricted stock lapse and such stock becomes fully vested. An event of acceleration occurs if (a) a person has acquired a beneficial ownership interest in 30% or more of the voting power of our company, (b) a tender offer is made to acquire 30% or more of our company, (c) a solicitation subject to Rule 14a-11 of the Securities Exchange Act of 1934 relating to the election or removal of 50% or more of our Board of Directors occurs, or (d) our shareholders approve a merger, consolidation, share exchange, division or sale of our company’s assets. Furthermore, if the surviving
28
or acquiring company in a change in control does not assume our company’s outstanding incentive awards or provide for their equivalent substitutes, our 2015 Omnibus Incentive Plan provides for accelerated vesting of incentive awards following a change in control upon the termination of the employee’s service and in certain other circumstances, provided such event occurs within two years of a change in control.
None.
We own our principal executive offices in St. Paul, Minnesota, and the majority of our distribution facilities. Leases of other distribution and administrative facilities generally are on a long-term basis, expiring at various times, with options to renew for additional periods. Most sales offices are leased for varying and usually shorter periods, with or without renewal options. We believe our properties are in good operating condition and are suitable for the purposes for which they are being used.
Patterson Logistics Services
The majority of assets we use to distribute product are owned and operated by Patterson Logistics Services, Inc. (“PLSI”), a wholly-owned subsidiary, which operates the distribution function for the benefit of our dental and animal health segments in the U.S. PLSI also advises on the operations of our fulfillment centers outside of the U.S., but these properties are not owned by PLSI.
As of
April 28, 2018
, PLSI operated the following 13 fulfillment centers (seven primary centers) totaling 1.0 million square feet:
|
•
|
two dental fulfillment centers (Hawaii and Texas);
|
|
•
|
four animal health fulfillment centers (Alabama, Colorado and Texas (two)); and
|
|
•
|
seven fulfillment centers that distribute dental and animal health products (California, Florida, Indiana, Iowa, Pennsylvania, South Carolina and Washington).
|
Approximately 90% of the PLSI fulfillment center space is owned.
Dental
The Dental segment is headquartered in our principal executive offices, and maintains sales and administrative offices at approximately 72 locations across 43 states in the U.S. and 10 locations in Canada, the majority of which are leased. Operations in Canada are supported by fulfillment centers located in Quebec and Alberta. In addition, this segment operates the Patterson Technology Center, a 100,000 square-foot facility in Illinois.
Animal Health
In addition to the locations operated by PLSI, Patterson Animal Health has approximately 100 properties located in the U.S., Canada and the U.K., the majority of which are leased. In the U.S., these properties are in 87 locations across 27 states, and comprise fulfillment centers, storage locations, sales and administrative offices, retail stores and call centers. In Canada, operations are supported by two fulfillment centers located in Alberta and Ontario. The segment’s operations in the U.K. are supported by a primary distribution facility in Stoke-on-Trent and an additional nine depots used as secondary distribution points throughout the U.K. The headquarters for this segment are located in a leased office in Colorado.
In September 2015, we were served with a summons and complaint in an action commenced in the U.S. District Court for the Eastern District of New York, entitled SourceOne Dental, Inc. v. Patterson Companies, Inc., Henry Schein, Inc. and Benco Dental Supply Company, Civil Action No. 15-cv-05440-JMA-GRB. SourceOne, as plaintiff, alleges that, through its website, it markets and sells dental supplies and equipment to dentists. SourceOne alleges in the complaint, among other things, that we, along with the defendants Henry Schein and Benco, conspired to eliminate plaintiff as a competitor and to exclude them from the market for the marketing, distribution and sale of dental supplies and equipment in the U.S. and that defendants unlawfully agreed with one another to boycott dentists, manufacturers, and state dental
29
associations that deal with, or considered dealing with, plaintiff. Plaintiff asserts the following claims: (i) unreasonable restraint of trade in violation of state and federal antitrust laws; (ii) tortious interference with prospective business relations; (iii) civil conspiracy; and (iv) aiding and abetting the other defendants’ ongoing tortious and anticompetitive conduct. Plaintiff seeks equitable relief, compensatory and treble damages, jointly and severally, punitive damages, interest, and reasonable costs and expenses, including attorneys’ fees and expert fees. In June 2017, Henry Schein settled with SourceOne and was dismissed from this litigation with prejudice. We are vigorously defending ourselves in this litigation. We do not anticipate that this matter will have a material adverse effect on our financial statements.
Beginning in January 2016, purported antitrust class action complaints were filed against defendants Henry Schein, Inc., Benco Dental Supply Company and Patterson Companies, Inc. Although there were factual and legal variations among these complaints, each alleged that defendants conspired to foreclose and exclude competitors by boycotting manufacturers, state dental associations, and others that deal with defendants’ competitors. On February 9, 2016, the U.S. District Court for the Eastern District of New York ordered all of these actions, and all other actions filed thereafter asserting substantially similar claims against defendants, consolidated for pre-trial purposes. On February 26, 2016, a consolidated class action complaint was filed by Arnell Prato, D.D.S., P.L.L.C., d/b/a Down to Earth Dental, Evolution Dental Sciences, LLC, Howard M. May, DDS, P.C., Casey Nelson, D.D.S., Jim Peck, D.D.S., Bernard W. Kurek, D.M.D., Larchmont Dental Associates, P.C., and Keith Schwartz, D.M.D., P.A. (collectively, “putative class representatives”) in the U.S. District Court for the Eastern District of New York, entitled In re Dental Supplies Antitrust Litigation, Civil Action No. 1:16-CV-00696-BMC-GRB. Subject to certain exclusions, the putative class representatives seek to represent all persons who purchased dental supplies or equipment in the U.S. directly from any of the defendants, since August 31, 2008. In the consolidated class action complaint, putative class representatives allege a nationwide agreement among Henry Schein, Benco, Patterson and non-party Burkhart Dental Supply Company, Inc. not to compete on price. The consolidated class action complaint asserts a single count under Section 1 of the Sherman Act, and seeks equitable relief, compensatory and treble damages, jointly and severally, interest, and reasonable costs and expenses, including attorneys’ fees and expert fees. While the outcome of litigation is inherently uncertain, we believe the consolidated class action complaint is without merit, and we are vigorously defending ourselves in this litigation.
On August 31, 2012, Archer and White Sales, Inc. (“Archer”) filed a complaint against Henry Schein, Inc. as well as Danaher Corporation and its subsidiaries Instrumentarium Dental, Inc., Dental Equipment, LLC, Kavo Dental Technologies, LLC and Dental Imaging Technologies Corporation (collectively, the “Danaher Defendants”) in the United States District Court for the Eastern District of Texas, Civil Action No. 2:12-CV-00572-JRG, styled as an antitrust action under Section 1 of the Sherman Act, and the Texas Free Enterprise Antitrust Act. Archer alleges a conspiracy between Henry Schein, an unnamed company and the Danaher Defendants to terminate or limit Archer’s distribution rights. On August 1, 2017, Archer filed an amended complaint, adding Patterson Companies, Inc. and Benco Dental Supply Company as defendants, and alleging that Henry Schein, Patterson, Benco and non-defendant Burkhart Dental Supply Company, Inc. conspired to pressure and agreed to enlist their common suppliers, including the Danaher Defendants, to join a price-fixing conspiracy and boycott by reducing the distribution territory of, and eventually terminating, Archer. Archer seeks injunctive relief, and damages in an amount to be proved at trial, to be trebled with interest and costs, including attorneys’ fees, jointly and severally. On June 25, 2018, the United States Supreme Court granted certiorari to review an arbitration issue raised by the Danaher Defendants, thereby continuing the case stay implemented in March 2018. We are vigorously defending ourselves in this litigation. We do not anticipate that this matter will have a material adverse effect on our financial statements.
On August 17, 2017, IQ Dental Supply, Inc. (“IQ Dental”) filed a complaint in the United States District Court for the Eastern District of New York, entitled IQ Dental Supply, Inc. v. Henry Schein, Inc., Patterson Companies, Inc. and Benco Dental Supply Company, Case No. 2:17-cv-4834. Plaintiff alleges that it is a distributor of dental supplies and equipment, and sells dental products through an online dental distribution platform operated by SourceOne Dental, Inc. IQ Dental alleges, among other things, that defendants conspired to suppress competition from IQ Dental and SourceOne for the marketing, distribution and sale of dental supplies and equipment in the United States, and that defendants unlawfully agreed with one another to boycott dentists, manufacturers and state dental associations that deal with, or considered dealing with, plaintiff and SourceOne. Plaintiff claims that this alleged conduct constitutes unreasonable restraint of trade in violation of Section 1 of the Sherman Act, New York’s Donnelly Act and the New Jersey Antitrust Act, and also makes pendant state law claims for tortious interference with prospective business relations, civil conspiracy and aiding and abetting. Plaintiff seeks injunctive relief, compensatory, treble and punitive damages, jointly and severally, and reasonable costs and expenses, including attorneys’ fees and expert fees. On December 21, 2017, the District Court granted defendants motion to dismiss the complaint with prejudice. Plaintiff has appealed to the Fifth Circuit Court of Appeals. We are vigorously defending ourselves in this litigation. We do not anticipate that this matter will have a material adverse effect on our financial statements.
30
On February 12, 2018, the Federal Trade Commission (“FTC”) issued an administrative complaint entitled
In the Matter of Benco Dental Supply Co., Henry Schein, Inc., and Patterson Companies, Inc.
Docket No. 9379. The administrative complaint alleges “reason to believe” that Patterson and the other respondents violated Section 5 of the FTC Act, 15 U.S.C. § 45 by conspiring to refuse to offer discounted prices or otherwise negotiate with buying groups seeking to obtain supply agreements on behalf of groups of solo practitioners or small group dental practices. The administrative complaint seeks injunctive relief against Patterson, including an order to cease and desist from the conduct alleged in the complaint and a prohibition from conspiring or agreeing with any competitor or any person to refuse to provide discounts to or compete for the business of any customer. No money damages are sought. We are vigorously defending ourselves against the administrative complaint. The administrative complaint provides notice of an October 16, 2018 hearing in front of an Administrative Law Judge of the FTC in Washington, D.C. We do not anticipate this matter will have a material adverse effect on our financial statements.
On March 28, 2018, Plymouth County Retirement System (“Plymouth”) filed a federal securities class action complaint against Patterson and its former CEO Scott P. Anderson and former CFO Ann B. Gugino (together, the “Individual Defendants”) in the U.S. District Court for the District of Minnesota in a case captioned
Plymouth County Retirement System v. Patterson Companies, Inc., Scott P. Anderson and Ann B. Gugino
, Case No. 0:18-cv-008710 MJD/SER. On behalf of all persons or entities that purchased or otherwise acquired Patterson’s common stock between June 26, 2015 and February 28, 2018, Plymouth alleges that Patterson violated federal securities laws by “fail[ing] to disclose that [Patterson’s] revenue and earnings were fraudulently inflated by an illegal and fraudulent price-fixing scheme aimed at prohibiting sales to and price negotiations by GPOs [group purchasing organizations] that represented small and independent dental practices.” We vehemently deny these allegations. In its class action complaint, Plymouth asserts one count against Patterson for violating Section 10(b) of the Securities Exchange Act of 1934 and Rule 10b-5 promulgated thereunder and a second, related count against the Individual Defendants for violating Section 20(a) of the Exchange Act. Plymouth seeks compensatory damages, pre- and post-judgment interest and reasonable attorneys’ fees and experts’ witness fees and costs. Pursuant to an April 19, 2018 stipulated order, our obligation to answer, move or otherwise respond to the class action complaint is stayed pending the court’s entry of an order appointing lead plaintiffs in the litigation. While the outcome of litigation is inherently uncertain, we believe that the class action complaint is without merit, and we are vigorously defending ourselves in this litigation. We do not anticipate that this matter will have a material adverse effect on our financial statements.
From time to time, we may become a party to other legal proceedings, including, without limitation, product liability claims, intellectual property claims, employment matters, commercial disputes, governmental inquiries and investigations (which may in some cases involve our entering into settlement arrangements or consent decrees), and other matters arising out of the ordinary course of our business. While the results of any legal proceeding cannot be predicted with certainty, in our opinion none of these other pending matters is anticipated to have a material adverse effect on our financial statements.
Not applicable.
31
Market Information
Patterson’s common stock trades on the NASDAQ Global Select Market
®
under the symbol “PDCO.”
The following table sets forth the range of high and low sale prices for Patterson’s common stock for each full quarterly period within the two most recent fiscal years. Such quotations reflect inter-dealer prices, without retail mark-up, mark-down or commission, and may not necessarily represent actual transactions.
|
High
|
Low
|
Dividends
per share
|
|||||||||
|
Fiscal 2018
|
|||||||||||
|
First Quarter
|
$
|
48.30
|
|
$
|
41.75
|
|
$
|
0.26
|
|
||
|
Second Quarter
|
42.38
|
|
35.93
|
|
0.26
|
|
|||||
|
Third Quarter
|
38.52
|
|
32.07
|
|
0.26
|
|
|||||
|
Fourth Quarter
|
38.20
|
|
21.09
|
|
0.26
|
|
|||||
|
Fiscal 2017
|
|||||||||||
|
First Quarter
|
50.40
|
|
42.69
|
|
0.24
|
|
|||||
|
Second Quarter
|
49.69
|
|
42.08
|
|
0.24
|
|
|||||
|
Third Quarter
|
49.26
|
|
36.46
|
|
0.24
|
|
|||||
|
Fourth Quarter
|
46.13
|
|
40.68
|
|
0.26
|
|
|||||
Holders
On
June 21, 2018
, the number of holders on record of common stock was 1,801. The transfer agent for Patterson’s common stock is EQ Shareowner Services, 1110 Centre Pointe Curve, Suite 101, Mendota Heights, Minnesota, 55120, telephone: (800) 468-9716.
Dividends
In fiscal
2018
, a quarterly cash dividend of $0.26 per share was paid throughout the year. We expect to continue to pay a quarterly cash dividend for the foreseeable future; however, the payment of dividends is within the discretion of our Board of Directors and will depend upon our earnings, capital requirements, operating results and financial condition among other factors.
Securities Authorized for Issuance Under Equity Compensation Plans
For information relating to securities authorized for issuance under equity compensation plans, see Part III, Item 12.
Purchases of Equity Securities by the Issuer
No shares were repurchased under the stock repurchase plan during the fourth quarter of fiscal
2018
.
On March 13, 2018, the Board of Directors authorized a new $500 million share repurchase program through March 13, 2021. The new repurchase program replaced the remaining authorization from our previous plan to purchase up to 25 million shares, which was scheduled to expire on March 19, 2018.
Performance Graph
The graph below compares the cumulative total shareholder return on $100 invested at the market close on April 27, 2013, through April 28, 2018, with the cumulative return over the same time period on the same amount invested in the S&P 500 Index, the S&P 500 Healthcare Index, and a Peer Group Index, consisting of seven companies (including our company) based on the same Standard Industrial Classification Code.* The chart below the graph sets forth the actual numbers depicted on the graph. In the past we have presented line graphs comparing the cumulative total return on our common stock with the cumulative total return of the S&P 500 Index and the above-referenced Peer Group Index. This year we have also included a comparison against the S&P 500 Healthcare Index, an independently
32
prepared index that includes more than 50 companies in the healthcare industry. Next year we do not intend to include the Peer Group Index in our comparison of cumulative total return. We are changing to the S&P 500 Healthcare Index because we believe it to be a more commonly used index by large healthcare companies.
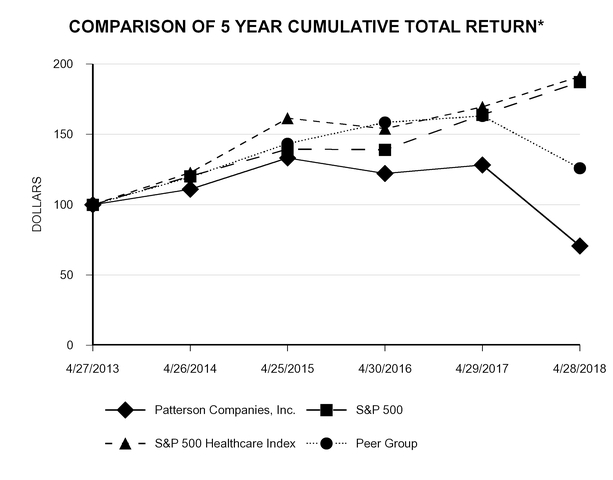
|
Fiscal Year Ending
|
|||||||||||||||||
|
4/27/2013
|
4/26/2014
|
4/25/2015
|
4/30/2016
|
4/29/2017
|
4/28/2018
|
||||||||||||
|
Patterson Companies, Inc.
|
100.00
|
|
111.01
|
|
133.20
|
|
122.21
|
|
128.19
|
|
70.64
|
|
|||||
|
S&P 500
|
100.00
|
|
120.27
|
|
139.48
|
|
139.05
|
|
163.96
|
|
187.24
|
|
|||||
|
S&P 500 Healthcare Index
|
100.00
|
|
122.74
|
|
161.45
|
|
153.99
|
|
169.52
|
|
191.01
|
|
|||||
|
Peer Group
|
100.00
|
|
119.46
|
|
143.37
|
|
158.44
|
|
162.98
|
|
125.86
|
|
|||||
|
*
|
The current composition of SIC Code 5047 – Wholesale – Medical, Dental & Hospital Equipment & Supplies – is as follows: Fuse Medical, Inc., Henry Schein, Inc., Millennium Healthcare, Inc., Owens & Minor, Inc., Cerebain Biotech Corp., Vet Online Supply, Inc. and Patterson Companies, Inc.
|
Recent Sales of Unregistered Securities
As previously disclosed, on December 1, 2017, we issued a restricted stock unit award outside our 2015 Omnibus Incentive Plan to Mark S. Walchirk, our Chief Executive Officer, as an inducement material to Mr. Walchirk’s entry into employment with Patterson. The award covers 56,481 shares of common stock and will vest, assuming continued employment, to the extent of 50% of the award on the first anniversary of the date of grant and the remaining 50% of the award on the second anniversary of the date of grant. This award was granted pursuant to NASDAQ Listing Rule 5635(c)(4) and Section 4(a)(2) of the Securities Act of 1933, as amended. Patterson intends to file a registration statement on Form S-8 to register the shares of common stock underlying this award prior to such award’s first vesting event.
33
(In thousands, except per share amounts)
|
|
Fiscal Year Ended
|
||||||||||||||||||
|
|
April 28,
2018
(2)
|
April 29,
2017
(3)
|
April 30,
2016
(4)
|
April 25,
2015
|
April 26,
2014
(5)
|
||||||||||||||
|
Statement of Income Data:
|
|||||||||||||||||||
|
Net sales
|
$
|
5,465,683
|
|
$
|
5,593,127
|
|
$
|
5,386,703
|
|
$
|
3,910,865
|
|
$
|
3,585,141
|
|
||||
|
Cost of sales
|
4,266,317
|
|
4,291,730
|
|
4,063,955
|
|
2,850,316
|
|
2,566,444
|
|
|||||||||
|
Gross profit
|
1,199,366
|
|
1,301,397
|
|
1,322,748
|
|
1,060,549
|
|
1,018,697
|
|
|||||||||
|
Operating expenses
|
979,477
|
|
1,013,469
|
|
975,035
|
|
755,963
|
|
724,971
|
|
|||||||||
|
Operating income
|
219,889
|
|
287,928
|
|
347,713
|
|
304,586
|
|
293,726
|
|
|||||||||
|
Other expense, net
|
(40,626
|
)
|
(37,047
|
)
|
(46,020
|
)
|
(30,268
|
)
|
(32,463
|
)
|
|||||||||
|
Income from continuing operations before taxes
|
179,263
|
|
250,881
|
|
301,693
|
|
274,318
|
|
261,263
|
|
|||||||||
|
Income tax expense (benefit)
|
(21,711
|
)
|
77,093
|
|
116,009
|
|
94,235
|
|
89,931
|
|
|||||||||
|
Net income from continuing operations
|
200,974
|
|
173,788
|
|
185,684
|
|
180,083
|
|
171,332
|
|
|||||||||
|
Net income (loss) from discontinued operations
|
—
|
|
(2,895
|
)
|
1,500
|
|
43,178
|
|
29,280
|
|
|||||||||
|
Net income
|
$
|
200,974
|
|
$
|
170,893
|
|
$
|
187,184
|
|
$
|
223,261
|
|
$
|
200,612
|
|
||||
|
Diluted earnings (loss) per share:
|
|||||||||||||||||||
|
Continuing operations
|
$
|
2.16
|
|
$
|
1.82
|
|
$
|
1.90
|
|
$
|
1.81
|
|
$
|
1.69
|
|
||||
|
Discontinued operations
(1)
|
—
|
|
(0.03
|
)
|
0.01
|
|
0.43
|
|
0.28
|
|
|||||||||
|
Net diluted earnings per share
|
$
|
2.16
|
|
$
|
1.79
|
|
$
|
1.91
|
|
$
|
2.24
|
|
$
|
1.97
|
|
||||
|
Weighted average shares - diluted
|
93,094
|
|
95,567
|
|
97,902
|
|
99,694
|
|
101,643
|
|
|||||||||
|
Dividends per common share
|
$
|
1.04
|
|
$
|
0.98
|
|
$
|
0.90
|
|
$
|
0.82
|
|
$
|
0.68
|
|
||||
|
Balance Sheet Data:
|
|||||||||||||||||||
|
Working capital
|
$
|
864,343
|
|
$
|
899,662
|
|
$
|
918,206
|
|
$
|
995,540
|
|
$
|
872,254
|
|
||||
|
Total assets
|
3,471,664
|
|
3,507,913
|
|
3,520,804
|
|
2,945,248
|
|
2,863,191
|
|
|||||||||
|
Total long-term debt
|
922,030
|
|
998,272
|
|
1,022,155
|
|
722,542
|
|
723,514
|
|
|||||||||
|
Stockholders’ equity
|
1,461,790
|
|
1,394,433
|
|
1,441,746
|
|
1,514,123
|
|
1,471,664
|
|
|||||||||
See the Notes to the Consolidated Financial Statements included in Item 8 of this Annual Report on Form 10-K.
|
(1)
|
Fiscal 2014 includes a pre-tax restructuring charge of $15.4 million, or $0.13 per diluted share on an after-tax basis.
|
|
(2)
|
Fiscal 2018 includes a provisional discrete net tax benefit of $76.6 million recorded related to the enactment of comprehensive tax legislation by the U.S. government. See Note 11 to the Consolidated Financial Statements for additional information.
|
|
(3)
|
Fiscal 2017 includes a pre-tax non-cash impairment charge of
$36.3
million, or $23.0 million after taxes or $0.24 per diluted share. See Note 3 to the Consolidated Financial Statements for additional information.
|
|
(4)
|
In June 2015, we acquired Animal Health International, Inc. Prior to our acquisition, Animal Health International, Inc. generated sales and earnings before interest, income taxes, depreciation and amortization of $1.5 billion and $68 million, respectively, during the 12 months ended March 2015. In connection with this acquisition, we incurred pre-tax transaction costs of $13.7 million, or $0.11 per diluted share from continuing operations on an after-tax basis. Also in fiscal 2016, we approved a one-time repatriation of approximately $200.0 million of foreign earnings. This one-time repatriation reduced the overall cost of funding the acquisition of Animal Health International, Inc. In addition, certain foreign cash at Patterson Medical was required to be repatriated as part of the sale transaction. The continuing operations tax impact of $12.3 million from the repatriation was recorded during fiscal 2016. See Note 11 to the Consolidated Financial Statements for additional information.
|
|
(5)
|
In August 2013, we acquired National Veterinary Services Limited ("NVS"), which had revenues of more than £315 million, or approximately $493 million, in its fiscal year ended June 30, 2013 prior to acquisition. NVS results beginning on the date of the acquisition are included in continuing operations.
|
34
Overview
Our financial information for fiscal
2018
is summarized in this Management’s Discussion and Analysis and the Consolidated Financial Statements and related Notes. The following background is provided to readers to assist in the review of our financial information.
We present three reportable segments: Dental, Animal Health and Corporate. Dental and Animal Health are strategic business units that offer similar products and services to different customer bases. Dental provides a virtually complete range of consumable dental products, equipment and software, turnkey digital solutions and value-added services to dentists and dental laboratories throughout North America. Animal Health is a leading, full-line distributor in North America and the U.K. of animal health products, services and technologies to both the production-animal and companion-pet markets. Our Corporate segment is comprised of general and administrative expenses, including home office support costs in areas such as information technology, finance, legal, human resources and facilities. In addition, customer financing and other miscellaneous sales are reported within Corporate results.
Operating margins of the animal health business are considerably lower than the dental business. While operating expenses run at a lower rate in the animal health business when compared to the dental business, gross margins in the animal health business are substantially lower due generally to the low margins experienced on the sale of pharmaceutical products.
We operate with a 52-53 week accounting convention with our fiscal year ending on the last Saturday in April. Fiscal 2018, 2017 and 2016 ended on
April 28, 2018
,
April 29, 2017
and
April 30, 2016
, respectively. Fiscal 2018 and 2017 consisted of 52 weeks, while fiscal 2016 consisted of 53 weeks. Fiscal 2019 will end on April 27, 2019 and will consist of 52 weeks.
We believe there are several important aspects of our business that are useful in analyzing it, including: (1) growth in the various markets in which we operate; (2) internal growth; (3) growth through acquisition; and (4) continued focus on controlling costs and enhancing efficiency. Management defines internal growth as the increase in net sales from period to period, adjusting for differences in the number of weeks in fiscal years, excluding the impact of changes in currency exchange rates, and excluding the net sales, for a period of twelve months following the transaction date, of businesses we have acquired.
FACTORS AFFECTING OUR RESULTS
Enterprise Resource Planning System Initiatives.
In the third quarter of fiscal 2017, we completed the application development stage of our enterprise resource planning ("ERP") system, and we began depreciating our investment in such system. We incurred increased depreciation and other operating expenses of approximately $25.0 million in the fiscal year ended
April 29, 2017
as compared to the fiscal year ended
April 30, 2016
related to this implementation. Depreciation and other operating expenses related to this implementation were approximately the same in fiscal 2018 and fiscal 2017.
Intangible Asset Impairment.
In fiscal 2006, we extended our exclusive North American distribution relationship with Sirona for its CEREC 3D dental restorative system. At that time, we paid a $100.0 million distribution fee to extend the existing exclusive relationship for at least a 10-year period beginning in 2007. This distribution fee has been accounted for as an intangible asset that has been amortized since 2007. Based on our November 2016 decision not to extend sales exclusivity for the full Sirona portfolio of products, we recorded a pre-tax non-cash impairment charge of $36.3 million, or $23.0 million after taxes or $0.24 per diluted share in our Dental segment in the third quarter of fiscal 2017, related to the distribution fee associated with the CEREC product component of this arrangement.
U.S. Tax Reform.
On December 22, 2017, the U.S. government enacted comprehensive tax legislation commonly referred to as the Tax Cuts and Jobs Act (“Tax Act”). The Tax Act significantly revises the future ongoing U.S. federal corporate income tax by, among other things, lowering U.S. federal corporate tax rates and implementing a territorial tax system. Effective January 1, 2018, the Tax Act reduced the U.S. federal corporate tax rate from 35.0% to 21.0%. For our fiscal year ending April 28, 2018, we utilized a blended rate of approximately 30.5%. For fiscal 2018, these impacts resulted in a provisional discrete net tax benefit of $76.6 million, which included provisional amounts of $81.9 million of tax benefit on U.S. deferred tax assets and liabilities, $4.0 million of tax expense for a one-time transition tax on unremitted foreign earnings and $1.2 million in withholding taxes paid on current year distributions.
35
Animal Health International Acquisition
. In June 2015, we completed the acquisition of Animal Health International, Inc., a leading production animal health distribution company in the U.S. Prior to our acquisition, Animal Health International, Inc. generated sales and earnings before interest, income taxes, depreciation and amortization of $1.5 billion and $68 million, respectively, during the 12 months ended March 2015. Our acquisition more than doubled the revenue of our legacy animal health business, which was previously focused on the companion animal market. Our animal health business now offers an expanded range of products and services to a broader base of customers in North America and the U.K. During fiscal 2016, we incurred $10.4 million, or $0.11 per diluted share, on an after-tax basis, of transaction costs related to the acquisition of Animal Health International, Inc.
Cash Repatriation
. In fiscal 2016, we approved a one-time repatriation of approximately $200.0 million of foreign earnings. This one-time repatriation reduced the overall cost of funding the acquisition of Animal Health International, Inc. In addition, certain foreign cash at Patterson Medical was required to be repatriated as part of the sale transaction. A continuing operations tax impact of $12.3 million from the repatriation was recorded during fiscal 2016. During fiscal 2017, we recorded a $2.4 million tax benefit related to a change in estimate of the tax impact of the cash repatriation. See Note 11 to the Consolidated Financial Statements for additional information.
Results of Operations
Fiscal
2018
Compared to Fiscal
2017
Continuing Operations
The following table summarizes our results from continuing operations as a percent of net sales from continuing operations:
|
|
Fiscal Year Ended
|
|||||||
|
|
April 28, 2018
|
April 29, 2017
|
April 30, 2016
|
|||||
|
Net sales
|
100.0
|
%
|
100.0
|
%
|
100.0
|
%
|
||
|
Cost of sales
|
78.1
|
|
76.7
|
|
75.4
|
|
||
|
Gross profit
|
21.9
|
|
23.3
|
|
24.6
|
|
||
|
Operating expenses
|
17.9
|
|
18.2
|
|
18.1
|
|
||
|
Operating income from continuing operations
|
4.0
|
|
5.1
|
|
6.5
|
|
||
|
Other income (expense)
|
(0.7
|
)
|
(0.6
|
)
|
(0.9
|
)
|
||
|
Income from continuing operations before taxes
|
3.3
|
|
4.5
|
|
5.6
|
|
||
|
Income tax expense (benefit)
|
(0.4
|
)
|
1.4
|
|
2.2
|
|
||
|
Net income from continuing operations
|
3.7
|
%
|
3.1
|
%
|
3.4
|
%
|
||
Net Sales
.
Consolidated net sales in fiscal
2018
were
$5,465.7 million
, a decrease of
2.3%
from
$5,593.1 million
in fiscal
2017
. Foreign exchange rate changes had a favorable impact of 0.5% on fiscal 2018 sales.
Dental segment sales decreased
8.1%
to
$2,196.1 million
in fiscal
2018
from
$2,390.2 million
in fiscal
2017
. Foreign exchange rate changes had a favorable impact of 0.3% on current year sales. Sales of consumables decreased
5.3%
, due primarily to the impact of our sales force realignment and ERP system initiatives. Dental equipment and software sales decreased
15.4%
, due primarily to a decrease in sales of digital technology products, which was driven by the market transition to new technology offerings, and our decision to broaden our portfolio of those offerings. Sales of other dental services and products decreased
1.2%
in fiscal
2018
.
Animal Health segment sales grew
2.6%
to
$3,242.6 million
in fiscal
2018
from
$3,159.8 million
in fiscal
2017
. Foreign exchange rate changes had a favorable impact of 0.7% on fiscal
2018
sales. Sales of certain products previously recognized on a gross basis were recognized on a net basis during fiscal
2018
, resulting in an estimated 2.1% unfavorable impact to sales.
Gross Profit
.
Consolidated gross profit margin decreased
140
basis points from the prior year to
21.9%
. Gross profit margin rates decreased in both the Dental and Animal Health segment. Unfavorable sales mix, lower rebates and a change in estimate related to year-end inventory valuations in both our Dental and Animal Health segment were the primary drivers of the decline in the gross profit margin rate. In addition, a greater percentage of sales came from our lower margin Animal Health segment during fiscal 2018, resulting in a lower consolidated gross profit margin rate.
36
Operating Expenses
. Consolidated operating expenses for fiscal
2018
were
$979.5 million
, a
3.4%
decrease from the prior year of
$1,013.5 million
. We incurred higher operating expenses during fiscal 2017 primarily as a result of the intangible asset impairment charge in our Dental segment. The decrease in consolidated operating expenses was also driven by cost containment efforts, partially offset by higher non-cash employee compensation. The consolidated operating expense ratio of
17.9%
decreased
30
basis points from the prior year due to these same factors.
Operating Income from Continuing Operations
.
Operating income from continuing operations was
$219.9 million
, or
4.0%
of net sales, in fiscal
2018
, compared to
$287.9 million
, or
5.1%
of sales, in fiscal
2017
. The decrease in operating income from continuing operations was driven by lower net sales and lower gross margins, partially offset by the intangible asset impairment charge recorded in fiscal 2017 and cost containment efforts. The decrease in operating income from continuing operations as a percent of net sales was driven by these same factors. In addition, a greater percentage of sales came from our lower margin Animal Health segment during fiscal 2018, which reduced operating income from continuing operations as a percent of net sales.
Dental segment operating income was $229.2 million for fiscal 2018, a decrease of $34.5 million from fiscal
2017
. The decrease was driven primarily by lower net sales and higher non-cash employee compensation, partially offset by the $36.3 million impairment charge recorded in fiscal 2017.
Animal Health segment operating income was $78.1 million for fiscal
2018
, a decrease of $10.1 million from fiscal
2017
. The decrease was primarily due to lower gross margins and higher non-cash employee compensation.
Corporate segment operating loss was $87.4 million for fiscal
2018
, as compared to a loss of $63.9 million for fiscal
2017
. The change was driven primarily by a decrease in the gain on sale related to our customer financing programs, as well as higher expenses due to a separation agreement with our former chief executive officer and higher non-cash employee compensation.
Other Income (Expense), Net
.
Net other expense was
$40.6 million
in fiscal
2018
, compared to
$37.0 million
in fiscal
2017
. The increase was mainly due to higher interest expense in fiscal
2018
.
Income Tax Expense (Benefit)
.
The effective income tax rate was
(12.1)%
in fiscal
2018
and
30.7%
in fiscal
2017
. The tax benefit in fiscal 2018 was primarily due to the impact of the Tax Act.
Net Income and Earnings Per Share from Continuing Operations
.
Net income from continuing operations increased
15.6%
to
$201.0 million
in fiscal
2018
, compared to
$173.8 million
in the prior year. Earnings per diluted share from continuing operations were
$2.16
in fiscal
2018
, compared to
$1.82
in the prior year. Weighted average diluted shares in fiscal
2018
were
93,094,000
, compared to
95,567,000
in the prior year. The fiscal
2018
cash dividend was
$1.04
per common share, compared to
$0.98
in the prior year.
Discontinued Operations
Net loss from discontinued operations was $0 in fiscal
2018
and
$2.9 million
in fiscal
2017
. The net loss incurred during fiscal 2017 was due to a change in estimate of the tax impact of the sale of Patterson Medical, which was completed in August 2015.
Fiscal 2017 Compared to Fiscal 2016
Continuing Operations
Net Sales
.
Consolidated net sales in fiscal 2017 were $5,593.1 million, an increase of 3.8% from $5,386.7 million in fiscal 2016. The inclusion of Animal Health International, Inc. results for approximately six additional weeks in fiscal 2017 had a 3.6% favorable impact on sales, foreign exchange rate changes had an estimated 1.7% unfavorable impact on fiscal 2017 sales, and one less week of results in fiscal 2017 had a 1.0% unfavorable impact on sales, resulting in internal growth of 2.9%.
Dental segment sales decreased 3.5% to $2,390.2 million in fiscal 2017 from $2,476.2 million in fiscal 2016. One less week of results in fiscal 2017 had an estimated 1.1% unfavorable impact on sales. Adjusting for this difference in number of weeks, sales decreased 2.4%. Sales of consumables decreased 4.1%, primarily due to having one less week of results in fiscal 2017 and to a sales force realignment in the first quarter of fiscal 2017. Dental equipment and software sales decreased 3.2%, primarily due to a decrease in sales of digital products, partially offset by increased sales of core equipment. Sales of other dental services and products decreased 1.0% in fiscal 2017.
37
Animal Health segment sales grew 10.4% to $3,159.8 million in fiscal 2017 from $2,862.2 million in fiscal 2016. Incremental sales attributed to the acquisition of Animal Health International, Inc. contributed 6.8% to this sales growth, foreign exchange rate changes had an unfavorable impact of 3.1% on fiscal 2017 sales, and one less week of results in fiscal 2017 had a 1.0% unfavorable impact on sales, resulting in internal growth of 7.7%. In addition, due to changes in certain vendor relationships, sales of certain products previously recognized on an agency basis were recognized on a buy/sell basis during fiscal 2017, resulting in a 2.5% favorable impact to sales.
Gross Profit
.
Consolidated gross profit margin decreased 130 basis points from fiscal 2016 to 23.3%. The decrease in the gross profit margin rate was predominantly the result of the inclusion of sales and cost of sales from Animal Health International, Inc. in our results for a full year in fiscal 2017, as that business traditionally has lower gross margins than our historical businesses. In addition, the Animal Health segment gross margin rate declined when compared to fiscal 2016, primarily as a result of pricing pressure from branded pharmaceutical manufacturers, execution challenges associated with integration activities in our Animal Health segment and unfavorable product mix.
Operating Expenses
. Consolidated operating expenses for fiscal 2017 were $1,013.5 million, a 3.9% increase from the prior year of $975.0 million. The increase was predominantly the result of the $36.3 million intangible asset impairment charge recognized in fiscal 2017 in our Dental segment, increased expenses related to our ERP system initiatives and the inclusion of Animal Health International, Inc. results for a full year in fiscal 2017, partially offset by reduced transaction costs related to the acquisition of Animal Health International, Inc., synergy capture in our Animal Health segment and cost containment efforts. The consolidated operating expense ratio of 18.2% decreased 10 basis points from fiscal 2016 due to these same factors.
Operating Income from Continuing Operations
.
Operating income from continuing operations was $287.9 million, or 5.1% of net sales, in fiscal 2017, compared to $347.7 million, or 6.5% of sales, in fiscal 2016. The decrease in operating income from continuing operations and operating income as a percent of sales were driven primarily by the impairment charge and increased expenses related to our ERP system initiative. The decrease in operating income as a percent of sales was mainly due to these same factors.
Dental segment operating income was $263.7 million for fiscal 2017, a decrease of $48.5 million from the prior year period. The decrease was driven primarily by the impairment charge, increased expenses related to our ERP system initiatives and lower sales volumes.
Animal Health segment operating income was $88.1 million for fiscal 2017, a decrease of $6.2 million from the prior year period. The decrease was primarily driven by lower gross margins, which decreased as a result of pricing pressure from branded pharmaceutical manufacturers, execution challenges associated with integration activities, unfavorable product mix and increased expenses related to our ERP system initiatives. Synergy capture, cost containment efforts and lower bad debt expense in fiscal 2017 partially offset these factors.
Corporate segment operating loss was $63.9 million for fiscal 2017, as compared to a loss of $58.8 million from the prior year period. The change was driven primarily by lower net sales related to our customer financing contracts and increased legal expenses, partially offset by reduced transaction costs related to the acquisition of Animal Health International, Inc.
Other Income (Expense), Net
.
Net other expense was $37.0 million in fiscal 2017, compared to $46.0 million in fiscal 2016. The decrease was mainly due to $5.2 million of accelerated debt issuance cost amortization incurred in fiscal 2016.
Income Tax Expense (Benefit)
.
The effective income tax rate was 30.7% in fiscal 2017 and 38.5% in fiscal 2016. The decrease in the rate was primarily due to the fiscal 2016 impact of cash repatriation and transaction-related costs incurred in the acquisition of Animal Health International, Inc. In addition, the fiscal 2017 rate included excess tax benefits from the adoption of Accounting Standards Update ("ASU") No. 2016-09, "Compensation - Stock Compensation (Topic 718): Improvements to Employee Share-Based Payment Accounting." ASU No. 2016-09 eliminated the additional paid-in capital pool concept and requires that excess tax benefits and tax deficiencies be recorded in the income statement when awards are settled. In fiscal 2017, we adopted ASU No. 2016-09. As a result of this adoption, we recognized $2,493 of excess tax benefits related to share-based payments in our provision for income taxes in fiscal 2017. These items were historically recorded in additional paid-in capital.
38
Net Income and Earnings Per Share from Continuing Operations
.
Net income from continuing operations decreased 6.4% to $173.8 million in fiscal 2017, compared to $185.7 million in the prior year. Earnings per diluted share from continuing operations were $1.82 in fiscal 2017, compared to $1.90 in the prior year. Weighted average diluted shares in fiscal 2017 were 95,567,000, compared to 97,902,000 in the prior year. The fiscal 2017 cash dividend was $0.98 per common share, compared to $0.90 in the prior year.
Discontinued Operations
Net loss from discontinued operations was $2.9 million in fiscal 2017, compared to net income from discontinued operations of $1.5 million in fiscal 2016. The net loss incurred during fiscal 2017 was due to a change in estimate of the tax impact of the sale of Patterson Medical.
Liquidity and Capital Resources
Patterson’s operating cash flow has been our principal source of liquidity in the last three fiscal years. During each of these fiscal years, we used our revolving credit facility as a source of liquidity in addition to operating cash flow. Net cash provided by operating activities was
$178.9 million
in fiscal
2018
, compared to
$162.7 million
in fiscal
2017
and
$156.3 million
in fiscal
2016
. Our cash flows from operating activities are primarily driven by net income from continuing operations.
Net cash flows provided by investing activities were
$17.0 million
in fiscal
2018
, compared to net cash flows provided by investing activities of
$1.2 million
in fiscal
2017
and net cash flows used in investing activities of
$400.6 million
in fiscal
2016
. Collections of deferred purchase price receivables were
$49.7 million
,
$51.4 million
and
$22.3 million
in fiscal
2018
,
2017
and
2016
, respectively.Capital expenditures were
$43.3 million
,
$47.0 million
and
$79.4 million
in fiscal
2018
,
2017
and
2016
, respectively. Significant expenditures in each year included investments in our ERP system initiatives. Fiscal 2016 included the purchase of Animal Health International, Inc. for $1,106.6 million, which was partially offset by the receipt of net cash proceeds of $714.4 million from completion of the sale of Patterson Medical. In addition, fiscal 2016 included the sale of securities of $48.7 million. We expect to use a total of approximately $75 million for capital expenditures in fiscal 2019.
In March 2018, we issued fixed-rate senior notes with an aggregate principal amount of $150.0 million, due fiscal 2028. The proceeds were used to repay $150.0 million of senior notes that came due in March 2018.
During fiscal 2016, we entered into a credit agreement ("Credit Agreement"), under which the lenders provided us with senior unsecured lending facilities of up to $1.5 billion, consisting of a $1.0 billion unsecured term loan and a $500 million unsecured revolving line of credit. In fiscal 2017, we entered into an amendment of the Credit Agreement (“Amended Credit Agreement”), consisting of a $295.1 million term loan and a $750 million revolving line of credit. Interest on borrowings is variable and is determined as a base rate plus a spread. This spread, as well as a commitment fee on the unused portion of the facility, is based on our leverage ratio, as defined in the Amended Credit Agreement. The term loan and revolving credit facilities will mature no later than January 2022.
As of
April 28, 2018
, $276.6 million of the Amended Credit Agreement unsecured term loan was outstanding at an interest rate of 3.40%, and
$16.0 million
was outstanding under the Amended Credit Agreement revolving line of credit at an interest rate of 2.95%. At April 29, 2017, $291.4 million was outstanding under the Amended Credit Agreement unsecured term loan at an interest rate of 2.24%, and $59.0 million was outstanding under the Amended Credit Agreement revolving line of credit at an interest rate of 2.19%.
Total dividends paid in fiscal
2018
,
2017
and
2016
were
$99.2 million
,
$95.9 million
and
$90.6 million
, respectively. We expect to continue to pay a quarterly cash dividend for the foreseeable future. In fiscal 2018, we repurchased 2.1 million shares of common stock for
$87.5 million
. In fiscal 2017, we repurchased 2.9 million shares of common stock for $125.4 million. In fiscal 2016, we repurchased 4.4 million shares of common stock for $200.0 million.
On March 13, 2018, the Board of Directors authorized a new $500 million share repurchase program through March 13, 2021. The new repurchase program replaced the remaining authorization from our March 2013 plan to purchase up to 25 million shares, which was scheduled to expire on March 19, 2018. As of
April 28, 2018
, $500 million remains available under the current repurchase authorization.
We have
$63.0 million
in cash and cash equivalents as of
April 28, 2018
, of which $7.9 million is in foreign bank accounts. See Note 11 to the Consolidated Financial Statements for further information regarding our intention to permanently reinvest these funds. Included in cash and cash equivalents as of
April 28, 2018
is
$35.7 million
of cash
39
collected from previously sold customer financing arrangements that have not yet been settled with the third party. See Note 7 to the Consolidated Financial Statements for further information. We expect funds generated from operations, existing cash balances and credit availability under existing debt facilities will be sufficient to meet our working capital needs and to finance anticipated expansion plans and strategic initiatives over the next fiscal year.
We expect to continue to obtain liquidity from the sale of equipment finance contracts. Patterson sells a significant portion of our finance contracts (see below) to a commercial paper funded conduit managed by a third party bank, and as a result, commercial paper is indirectly an important source of liquidity for Patterson. Patterson is allowed to participate in the conduit due to the quality of our finance contracts and our financial strength. Cash flows could be impaired if our financial strength diminishes to a level that precluded us from taking part in this facility or other similar facilities. Also, market conditions outside of our control could adversely affect the ability for us to sell the contracts.
Customer Financing Arrangements
As a convenience to our customers, we offer several different financing alternatives, including a third party program and a Patterson-sponsored program. For the third party program, we act as a facilitator between the customer and the third party financing entity with no on-going involvement in the financing transaction. Under the Patterson-sponsored program, equipment purchased by creditworthy customers may be financed up to a maximum of
$1 million
. We generally sell our customers’ financing contracts to outside financial institutions in the normal course of our business. We currently have
two
arrangements under which we sell these contracts.
First, we operate under an agreement to sell a portion of our equipment finance contracts to commercial paper conduits with The Bank of Tokyo-Mitsubishi UFJ, Ltd. ("BTMU") serving as the agent. We utilize PDC Funding, a consolidated, wholly owned subsidiary, to fulfill a requirement of participating in the commercial paper conduit. We receive the proceeds of the contracts upon sale to BTMU. The capacity under the agreement with BTMU at
April 28, 2018
was
$575 million
.
Second, we maintain an agreement with Fifth Third Bank ("Fifth Third") whereby Fifth Third purchases customers’ financing contracts. PDC Funding II, a consolidated, wholly owned subsidiary, sells financing contracts to Fifth Third. We receive the proceeds of the contracts upon sale to Fifth Third. The capacity under the agreement with Fifth Third at
April 28, 2018
was
$100 million
.
Our financing business is described in further detail in Note 7 to the Consolidated Financial Statements.
Contractual Obligations
A summary of our contractual obligations as of
April 28, 2018
follows (in thousands):
|
|
Payments due by year
|
||||||||||||||||||
|
|
Total
|
Less than
1 year
|
1-3 years
|
3-5 years
|
More than
5 years
|
||||||||||||||
|
Long-term debt principal
|
$
|
1,001,633
|
|
$
|
76,598
|
|
$
|
53,483
|
|
$
|
371,552
|
|
$
|
500,000
|
|
||||
|
Long-term debt interest
|
201,930
|
|
36,780
|
|
67,372
|
|
48,213
|
|
49,565
|
|
|||||||||
|
Operating leases
|
74,287
|
|
21,688
|
|
32,285
|
|
16,649
|
|
3,665
|
|
|||||||||
|
Total
|
$
|
1,277,850
|
|
$
|
135,066
|
|
$
|
153,140
|
|
$
|
436,414
|
|
$
|
553,230
|
|
||||
As of
April 28, 2018
our gross liability for uncertain tax positions, including interest and penalties, was $16.0 million. We are not able to reasonably estimate the amount by which the liability will increase or decrease over an extended period of time or whether a cash settlement of the liability will be required. Therefore, these amounts have been excluded from the schedule of contractual obligations.
For a more complete description of our contractual obligations, see Notes 6 and 10 to the Consolidated Financial Statements.
Outlook
40
We believe certain strategic decisions made will have an effect on our future results of operations. In the near term, we believe that our decision to not extend our exclusive relationship with Sirona for its full portfolio of products and a realignment of our sales force will have a negative effect on sales. In addition, disruptions from our ERP system initiatives could negatively impact results. While these strategic decisions are expected to impact our near-term performance, we believe that we are making the right strategic moves to facilitate growth in our two key operating businesses.
Asset Management
The following table summarizes our accounts receivable days sales outstanding (“DSO”) and average annual inventory turnover for the past three fiscal years:
|
Fiscal Year Ended
|
||||||||
|
April 28, 2018
|
April 29, 2017
|
April 30, 2016
|
||||||
|
DSO
(1)
|
53.1
|
|
55.1
|
|
49.3
|
|
||
|
Inventory turnover
|
5.2
|
|
6.0
|
|
7.1
|
|
||
|
(1)
|
Calculation includes approximately $1 million, $50 million and $18 million as of
April 28, 2018
,
April 29, 2017
and
April 30, 2016
, respectively, of receivables from finance contracts received from customers related to certain financing promotions.
|
Foreign Operations
We derive foreign sales from Dental operations in Canada, and Animal Health operations in Canada and the U.K. Fluctuations in currency exchange rates have not significantly impacted earnings, as these fluctuations impact sales, cost of sales and operating expenses. However, changes in exchange rates positively impacted net sales by $29.5 million in fiscal 2018, while they adversely affected net sales by $89.9 million and $69.4 million in fiscal 2017 and
2016
, respectively. Changes in currency exchange rates are a risk accompanying foreign operations, but this risk is not considered material with respect to our consolidated operations.
Critical Accounting Policies and Estimates
Patterson has adopted various accounting policies to prepare our consolidated financial statements in accordance with accounting principles generally accepted in the U.S. Management believes that our policies are conservative and our philosophy is to adopt accounting policies that minimize the risk of adverse events having a material impact on recorded assets and liabilities. However, the preparation of financial statements requires the use of estimates and judgments regarding the realization of assets and the settlement of liabilities based on the information available to management at the time. Changes subsequent to the preparation of the financial statements in economic, technological and competitive conditions may materially impact the recorded values of Patterson’s assets and liabilities. Therefore, the users of the financial statements should read all the notes to the Consolidated Financial Statements and be aware that conditions currently unknown to management may develop in the future. This may require a material adjustment to a recorded asset or liability to consistently apply to our significant accounting principles and policies that are discussed in Note 1 to the Consolidated Financial Statements. The financial performance and condition of Patterson may also be materially impacted by transactions and events that we have not previously experienced and for which we have not been required to establish an accounting policy or adopt a generally accepted accounting principle.
Revenue Recognition
– Revenues are generated from the sale of consumable products, equipment, software products and services, technical service parts and labor, freight and delivery charges, and other sources. Revenues are recognized when persuasive evidence of an arrangement exists, delivery has occurred or services have been rendered, the price is fixed or determinable, and there is reasonable assurance of collection of the sale. Estimates for returns, damaged goods, rebates, loyalty programs and other revenue allowances are made at the time the revenue is recognized based on the historical experience for such items. In addition to revenues generated from the distribution of consumable products under conventional arrangements (buy/sell agreements) where the full market value of the product is recorded as revenue, the animal health segment may earn a small amount of commission income for services provided under agency agreements with certain pharmaceutical manufacturers. The services generally consist of detailing the product and taking the customer’s order. The agency agreement contrasts to a buy/sell agreement in that
41
the animal health segment does not purchase and handle the product or bill and collect from the customer in an agency relationship with a vendor.
Consumable product sales are recorded upon delivery, except in those circumstances where terms of the sale are FOB shipping point, in which case sales are recorded upon shipment. Commissions under agency agreements are recorded when the services are provided.
Equipment and software product revenues are recognized upon delivery and, if necessary, installation. In those circumstances where terms of the sale are FOB shipping point, revenues are recognized when products are transferred to the shipping carrier. Revenue derived from post contract customer support for software is deferred and recognized ratably over the period in which the support is provided. Patterson provides financing for select equipment sales. See Note 7 to the Consolidated Financial Statements for more information regarding customer financing.
Other revenue, including freight and delivery charges and technical service parts and labor, is recognized when the related product revenue is recognized or when the product or services are provided to the customer.
The receivables that result from the recognition of revenue are reported net of the related allowances discussed above. Patterson maintains a valuation allowance based upon the expected collectability of receivables held. Estimates are used to determine the valuation allowance and are based on several factors, including historical collection data, economic trends and credit worthiness of customers. Receivables are written off when we determine the amounts to be uncollectible, typically upon customer bankruptcy or non-response to continuous collection efforts. The portions of receivable amounts that are not expected to be collected during the next twelve months are classified as long-term.
Patterson has a relatively large, dispersed customer base and no single customer accounts for more than 10% of consolidated net sales. In addition, the equipment sold to customers under finance contracts generally serves as collateral for the contract and the customer provides a personal guarantee as well.
Patterson Advantage Loyalty Program –
Patterson Dental provides a point-based awards program to qualifying customers involving the issuance of “Patterson Advantage dollars” which can be used toward equipment and technology purchases. Patterson Advantage dollars earned during a program year expire one year after the end of the program year. The cost and corresponding liability associated with the program is recognized as contra-revenue in accordance with ASC Topic 605-50, “Revenue Recognition-Customer Payments and Incentives.” As of
April 28, 2018
, we believe we have sufficient experience with the program to reasonably estimate the amount of Patterson Advantage dollars that will not be redeemed and thus have recorded a liability for 87% of the maximum potential amount that could be redeemed. We use the redemption recognition method, and we recognize the estimated value of unused Patterson Advantage dollars as redemptions occur. Breakage recognized was immaterial to all periods presented.
Inventory and Reserves
– Inventory consists primarily of merchandise held for sale and is stated at the lower of cost or market. Cost is determined using the last-in, first-out ("LIFO") method for all inventories, except for foreign inventories and manufactured inventories, which are valued using the first-in, first-out ("FIFO") method. We continually assess the valuation of inventories and reduce the carrying value of those inventories that are obsolete or in excess of forecasted usage to estimated realizable value. Estimates are made of the net realizable value of such inventories based on analyses and assumptions including, but not limited to, historical usage, future demand and market requirements.
Effective January 28, 2018, the Company changed its method of calculating LIFO inventories within its U.S. Animal Health business segment from the double-extension method to the link-chain method. The Company believes that the LIFO Link Chain method of inventory valuation is preferable as the LIFO Link Chain costing method provides a better matching of current costs with current revenues, provides for a LIFO adjustment more representative of the Company’s actual inflation on its inventories and conforms LIFO inventory costing method (Link Chain) with other Patterson operations that use the LIFO inventory method (Link Chain). The Company determined that it is impracticable to determine the cumulative effect of applying this change retrospectively to any periods prior to April 30, 2017 because complete records of inventory purchases are no longer available for periods prior to that date. The Company applied the change as of April 30, 2017, the earliest date practicable. The effect of the change on the results of operations for the year ended April 28, 2018 was to reduce the consolidated LIFO reserve and increase pre-tax income by $1.8 million. The effect of the change on interim periods in 2018 was not material.
Goodwill and Other Indefinite-Lived Intangible Assets
– Goodwill represents the excess of cost over the fair value of identifiable net assets of businesses acquired. We have
two
reporting units as of
April 28, 2018
; Dental and Animal Health. Our Corporate reportable segment's assets and liabilities, and net sales and expenses, are allocated to the
two
reporting units. Other indefinite-lived intangible assets include copyrights, trade names and trademarks.
42
We assess goodwill for impairment annually and whenever an event occurs or circumstances change that would indicate that the carrying amount may be impaired. If we determine that the fair value of the reporting unit may be less than its carrying amount, we evaluate goodwill using a two-step impairment test. Otherwise, we conclude that no impairment is indicated and we do not perform the two-step impairment test. In fiscal
2018
, we determined it was appropriate to perform a two-step impairment test.
The first step of the goodwill impairment test compares the book value of a reporting unit, including goodwill, with its fair value, as determined primarily by its discounted cash flows. If the book value of a reporting unit exceeds its fair value, the second step of the impairment test is performed to determine the amount of goodwill impairment loss to be recorded. The determination of fair value involves uncertainties because it requires management to make assumptions and to apply judgment to estimate industry and economic factors and the profitability of future business strategies. Patterson conducts impairment testing based on current business strategy in light of present industry and economic conditions, as well as future expectations. Additionally, in assessing goodwill for impairment, the reasonableness of the implied control premium is considered based on market capitalizations and recent market transactions.
Other indefinite-lived intangible assets are assessed for impairment by comparing the carrying value of an asset with its fair value. If the carrying value exceeds fair value, an impairment loss is recognized in an amount equal to the excess. The determination of fair value involves assumptions, including projected revenues and gross profit levels, as well as consideration of any factors that may indicate potential impairment.
In the fourth quarter of fiscal
2018
, management completed its annual goodwill and other indefinite-lived intangible asset impairment tests using the beginning of our fiscal 2018 fourth quarter as the valuation date, and determined there was
no
impairment, and that our Dental reporting unit was not at risk of failing step 1. The Animal Health reporting unit has a higher level of sensitivity to impairment as management currently assesses the various estimates and assumptions used to conduct these tests. Adverse changes to one or more of these estimates or assumptions could cause us to recognize a material impairment charge on this reporting unit. At the beginning of the fourth quarter of fiscal
2018
, the estimated fair value of the Animal Health reporting unit exceeded its book value by approximately
9%
. Subsequent to the annual test being completed, we experienced events and circumstances that indicated that the carrying amount of goodwill may be impaired. These events and circumstances included a decline in our actual earnings, a decline in our projected future earnings and a sustained decrease in our share price. As such, we tested our goodwill for impairment as of
April 28, 2018
, and determined that there was no impairment. As of
April 28, 2018
, the estimated fair value of the Animal Health reporting unit exceeded its book value by approximately 11%.
Long-Lived Assets
– Long-lived assets, including definite-lived intangible assets, are evaluated for impairment whenever events or changes in circumstances indicate that the carrying amount of the assets may not be recoverable through the estimated undiscounted future cash flows derived from such assets. Our definite-lived intangible assets primarily consist of customer relationships, trade names and trademarks. When impairment exists, the related assets are written down to fair value using level 3 inputs, as discussed further in Note 9 to the Consolidated Financial Statements. In fiscal 2017, we recorded a non-cash impairment charge of $36.3 million related to a distribution agreement intangible asset. Refer to Note 3 to the Consolidated Financial Statements for more information.
Related Party Transactions
– We have interests in a number of entities that are accounted for using the equity method. During fiscal 2018, 2017 and 2016 we made purchases of
$84.2 million
,
$55.2 million
and
$46.4 million
from these entities, respectively. During fiscal 2018, we recorded sales of
$19.7 million
to these entities.
No
sales to these entities were recorded in fiscal 2017 or 2016.
Income Taxes
– We are subject to income taxes in the U.S. and numerous foreign jurisdictions. Significant judgments are required in determining the consolidated provision for income taxes. The Tax Act, and the provisional nature of the adjustments contained therein, may create potential added uncertainties.
During the ordinary course of business, there are many transactions and calculations for which the ultimate tax determination is uncertain. As a result, we recognize tax liabilities based on estimates of whether additional taxes and interest will be due. These tax liabilities are recognized when, despite our belief that our tax return position is supportable, we believe that certain positions may not be fully sustained upon review by tax authorities. We believe that our accruals for tax liabilities are adequate for all open audit years based on our assessment of many factors including past experience and interpretations of tax law. This assessment relies on estimates and assumptions and may involve a series of complex judgments about future events. To the extent that the final tax outcome of these matters is different than the amounts recorded, such differences will impact income tax expense in the period in which such determination is made and could materially affect our financial results.
43
Valuation allowances are established for deferred tax assets if, after assessment of available positive and negative evidence, it is more likely than not that the deferred tax asset will not be fully realized. The valuation allowance reflected in the footnote disclosure relates primarily to foreign tax credit carryovers generated in fiscal 2016.
Self-insurance
– Patterson is self-insured for certain losses related to general liability, product liability, automobile, workers’ compensation and medical claims. We estimate our liabilities based upon an analysis of historical data and actuarial estimates. While current estimates are believed reasonable based on information currently available, actual results could differ and affect financial results due to changes in the amount or frequency of claims, medical cost inflation or other factors. Historically, actual results related to these types of claims have not varied significantly from estimated amounts.
Stock-based Compensation
– We recognize stock-based compensation based on certain assumptions including inputs within valuation models, estimated forfeitures and estimated performance outcomes. These assumptions require subjective judgment and changes in the assumptions can materially affect fair value estimates. Management assesses the assumptions and methodologies used to estimate forfeitures and to calculate estimated fair value of stock-based compensation on a regular basis. Circumstances may change, and additional data may become available over time, which could result in changes to these assumptions and methodologies and thereby materially impact the fair value determination or estimates of forfeitures. If factors change and we employ different assumptions, the amount of compensation expense associated with stock-based compensation may differ significantly from what was recorded in the current period.
Market Risk
We are exposed to market risk consisting of foreign currency rate fluctuations and changes in interest rates.
We are exposed to foreign currency exchange rate fluctuations in our operating statement due to transactions denominated primarily in Canadian Dollars and British Pounds. Although we are not currently involved with foreign currency hedge contracts, we continually evaluate our foreign currency exchange rate risk and the different mechanisms for use in managing such risk. A hypothetical 10% change in the value of the U.S. dollar in relation to our most significant foreign currency exposures would have changed net sales by approximately $84 million for the fiscal year ended
April 28, 2018
.
This amount is not indicative of the hypothetical net earnings impact due to the partially offsetting impact of the currency exchange movements on cost of sales and operating expenses. We estimate that if foreign currency exchange rates changed by 10%, the impact would have been approximately $7.0 million to income from continuing operations before income taxes for the fiscal year ended
April 28, 2018
.
During fiscal 2016, we entered into the Credit Agreement under which the lenders provided us with senior unsecured lending facilities of up to $1.5 billion, consisting of a $1.0 billion unsecured term loan and a $500 million unsecured revolving line of credit. In fiscal 2017, we entered into the Amended Credit Agreement, consisting of a $295.1 million term loan and a $750 million revolving line of credit. Interest on borrowings under the Amended Credit Agreement is variable. Due to the interest rate being variable, fluctuations in interest rates may impact our earnings. Based on our current level of debt, we estimate that a 100 basis point change in interest rates would have a $2.9 million annual impact on our net income from continuing operations before taxes.
Our earnings are also affected by fluctuations in short-term interest rates through the investment of cash balances and the practice of selling fixed rate equipment finance contracts under agreements with both a commercial paper conduit and a bank that provide for pricing based on variable interest rates.
When considering the exposure under the agreements whereby we sell equipment finance contracts to both a commercial paper conduit and bank, we have the ability to select pricing based on interest rates ranging from 30 day LIBOR up to twelve month LIBOR. In addition, the majority of the portfolio of installment contracts generally turns over in less than 48 months, and we can adjust the rate we charge on new customer contracts at any time. Therefore, in times where the interest rate markets are not rapidly increasing or decreasing, the average interest rate in the portfolio generally moves with the interest rate markets and thus would parallel the underlying interest rate movement of the pricing built into the sale agreements. In calculating the gain on the contract sales, we use an interest rate curve that approximates the maturity period of the then-outstanding contracts. If increases in the interest rate markets occur, the average interest rate in our contract portfolio may not increase at the same rate, resulting in a reduction of gain on the
44
contracts sales as compared to the gain that would be realized if the average interest rate in our portfolio were to increase at a more similar rate to the interest rate markets. We estimate that a 10% change in interest rates would have an approximate $2 million annual impact on our income from continuing operations before taxes.
45
REPORT OF INDEPENDENT REGISTERED PUBLIC ACCOUNTING FIRM
To the Shareholders and the Board of Directors of Patterson Companies, Inc.
Opinion on Internal Control over Financial Reporting
We have audited Patterson Companies, Inc.’s internal control over financial reporting as of April 28, 2018, based on criteria established in Internal Control - Integrated Framework issued by the Committee of Sponsoring Organizations of the Treadway Commission (2013 framework) (the COSO criteria). In our opinion, Patterson Companies, Inc. (the Company) maintained, in all material respects, effective internal control over financial reporting as of April 28, 2018, based on the COSO criteria.
We also have audited, in accordance with the standards of the Public Company Accounting Oversight Board (United States) (PCAOB), the accompanying consolidated balance sheets of the Company as of April 28, 2018 and April 29, 2017, and the related consolidated statements of income and other comprehensive income, changes in stockholders’ equity, and cash flows for each of the three years in the period ended April 28, 2018, and the related notes and the financial statement schedule listed in the Index at Item 15(a)(2) and our report dated June 27, 2018 expressed an unqualified opinion thereon.
Basis for Opinion
The Company’s management is responsible for maintaining effective internal control over financial reporting and for its assessment of the effectiveness of internal control over financial reporting included in the accompanying Management’s Annual Report on Internal Control Over Financial Reporting. Our responsibility is to express an opinion on the Company’s internal control over financial reporting based on our audit. We are a public accounting firm registered with the PCAOB and are required to be independent with respect to the Company in accordance with the U.S. federal securities laws and the applicable rules and regulations of the Securities and Exchange Commission and the PCAOB.
We conducted our audit in accordance with the standards of the PCAOB. Those standards require that we plan and perform the audit to obtain reasonable assurance about whether effective internal control over financial reporting was maintained in all material respects.
Our audit included obtaining an understanding of internal control over financial reporting, assessing the risk that a material weakness exists, testing and evaluating the design and operating effectiveness of internal control based on the assessed risk, and performing such other procedures as we considered necessary in the circumstances. We believe that our audit provides a reasonable basis for our opinion.
Definition and Limitations of Internal Control Over Financial Reporting
A company’s internal control over financial reporting is a process designed to provide reasonable assurance regarding the reliability of financial reporting and the preparation of financial statements for external purposes in accordance with generally accepted accounting principles. A company’s internal control over financial reporting includes those policies and procedures that (1) pertain to the maintenance of records that, in reasonable detail, accurately and fairly reflect the transactions and dispositions of the assets of the company; (2) provide reasonable assurance that transactions are recorded as necessary to permit preparation of financial statements in accordance with generally accepted accounting principles, and that receipts and expenditures of the company are being made only in accordance with authorizations of management and directors of the company; and (3) provide reasonable assurance regarding prevention or timely detection of unauthorized acquisition, use, or disposition of the company’s assets that could have a material effect on the financial statements.
Because of its inherent limitations, internal control over financial reporting may not prevent or detect misstatements. Also, projections of any evaluation of effectiveness to future periods are subject to the risk that controls may become inadequate because of changes in conditions, or that the degree of compliance with the policies or procedures may deteriorate.
/s/ Ernst & Young LLP
Minneapolis, Minnesota
June 27, 2018
46
REPORT OF INDEPENDENT REGISTERED PUBLIC ACCOUNTING FIRM
To the Shareholders and the Board of Directors of Patterson Companies, Inc.
Opinion on the Financial Statements
We have audited the accompanying consolidated balance sheets of Patterson Companies, Inc. (the Company) as of April 28, 2018 and April 29, 2017, and the related consolidated statements of income and other comprehensive income, changes in stockholders’ equity, and cash flows for each of the three years in the period ended April 28, 2018, and the related notes and the financial statement schedule listed in the Index at Item 15(a)(2) (collectively referred to as the “consolidated financial statements”) . In our opinion, the consolidated financial statements present fairly, in all material respects, the financial position of the Company at April 28, 2018 and April 29, 2017, and the results of its operations and its cash flows for each of the three years in the period ended April 28, 2018, in conformity with U.S. generally accepted accounting principles.
We also have audited, in accordance with the standards of the Public Company Accounting Oversight Board (United States) (PCAOB), the Company’s internal control over financial reporting as of April 28, 2018, based on criteria established in Internal Control-Integrated Framework issued by the Committee of Sponsoring Organizations of the Treadway Commission (2013 framework), and our report dated June 27, 2018 expressed an unqualified opinion thereon.
Basis for Opinion
These financial statements are the responsibility of the Company's management. Our responsibility is to express an opinion on the Company’s financial statements based on our audits. We are a public accounting firm registered with the PCAOB and are required to be independent with respect to the Company in accordance with the U.S. federal securities laws and the applicable rules and regulations of the Securities and Exchange Commission and the PCAOB.
We conducted our audits in accordance with the standards of the PCAOB. Those standards require that we plan and perform the audit to obtain reasonable assurance about whether the financial statements are free of material misstatement, whether due to error or fraud. Our audits included performing procedures to assess the risks of material misstatement of the financial statements, whether due to error or fraud, and performing procedures that respond to those risks. Such procedures included examining, on a test basis, evidence regarding the amounts and disclosures in the financial statements. Our audits also included evaluating the accounting principles used and significant estimates made by management, as well as evaluating the overall presentation of the financial statements. We believe that our audits provide a reasonable basis for our opinion.
/s/ Ernst & Young LLP
We have served as the Company’s auditor since 1985.
Minneapolis, Minnesota
June 27, 2018
47
PATTERSON COMPANIES, INC.
(In thousands, except per share amounts)
|
April 28, 2018
|
April 29, 2017
|
||||||
|
ASSETS
|
|||||||
|
Current assets:
|
|||||||
|
Cash and cash equivalents
|
$
|
62,984
|
|
$
|
94,959
|
|
|
|
Receivables, net of allowance for doubtful accounts of $9,537 and $9,342
|
826,877
|
|
884,803
|
|
|||
|
Inventory
|
779,834
|
|
711,903
|
|
|||
|
Prepaid expenses and other current assets
|
103,029
|
|
111,928
|
|
|||
|
Total current assets
|
1,772,724
|
|
1,803,593
|
|
|||
|
Property and equipment, net
|
290,590
|
|
298,452
|
|
|||
|
Long-term receivables, net
|
135,175
|
|
101,529
|
|
|||
|
Goodwill
|
815,977
|
|
813,547
|
|
|||
|
Identifiable intangibles, net
|
389,424
|
|
425,436
|
|
|||
|
Other non-current assets
|
67,774
|
|
65,356
|
|
|||
|
Total assets
|
$
|
3,471,664
|
|
$
|
3,507,913
|
|
|
|
LIABILITIES AND STOCKHOLDERS’ EQUITY
|
|||||||
|
Current liabilities:
|
|||||||
|
Accounts payable
|
$
|
610,368
|
|
$
|
616,859
|
|
|
|
Accrued payroll expense
|
69,099
|
|
56,881
|
|
|||
|
Other accrued liabilities
|
136,316
|
|
156,437
|
|
|||
|
Current maturities of long-term debt
|
76,598
|
|
14,754
|
|
|||
|
Borrowings on revolving credit
|
16,000
|
|
59,000
|
|
|||
|
Total current liabilities
|
908,381
|
|
903,931
|
|
|||
|
Long-term debt
|
922,030
|
|
998,272
|
|
|||
|
Deferred income taxes
|
152,104
|
|
191,686
|
|
|||
|
Other non-current liabilities
|
27,359
|
|
19,591
|
|
|||
|
Total liabilities
|
2,009,874
|
|
2,113,480
|
|
|||
|
Stockholders’ equity:
|
|||||||
|
Common stock, $.01 par value: 600,000 shares authorized; 94,756 and 96,534 shares issued and outstanding
|
948
|
|
966
|
|
|||
|
Additional paid-in capital
|
103,776
|
|
72,973
|
|
|||
|
Accumulated other comprehensive loss
|
(74,974
|
)
|
(92,669
|
)
|
|||
|
Retained earnings
|
1,497,766
|
|
1,481,234
|
|
|||
|
Unearned ESOP shares
|
(65,726
|
)
|
(68,071
|
)
|
|||
|
Total stockholders’ equity
|
1,461,790
|
|
1,394,433
|
|
|||
|
Total liabilities and stockholders’ equity
|
$
|
3,471,664
|
|
$
|
3,507,913
|
|
|
See accompanying notes
48
PATTERSON COMPANIES, INC.
AND OTHER COMPREHENSIVE INCOME
(In thousands, except per share amounts)
|
Fiscal Year Ended
|
|||||||||||
|
April 28, 2018
|
April 29, 2017
|
April 30, 2016
|
|||||||||
|
Net sales
|
$
|
5,465,683
|
|
$
|
5,593,127
|
|
$
|
5,386,703
|
|
||
|
Cost of sales
|
4,266,317
|
|
4,291,730
|
|
4,063,955
|
|
|||||
|
Gross profit
|
1,199,366
|
|
1,301,397
|
|
1,322,748
|
|
|||||
|
Operating expenses
|
979,477
|
|
1,013,469
|
|
975,035
|
|
|||||
|
Operating income from continuing operations
|
219,889
|
|
287,928
|
|
347,713
|
|
|||||
|
Other income (expense):
|
|||||||||||
|
Other income, net
|
6,117
|
|
6,013
|
|
4,045
|
|
|||||
|
Interest expense
|
(46,743
|
)
|
(43,060
|
)
|
(50,065
|
)
|
|||||
|
Income from continuing operations before taxes
|
179,263
|
|
250,881
|
|
301,693
|
|
|||||
|
Income tax expense (benefit)
|
(21,711
|
)
|
77,093
|
|
116,009
|
|
|||||
|
Net income from continuing operations
|
200,974
|
|
173,788
|
|
185,684
|
|
|||||
|
Net income (loss) from discontinued operations
|
—
|
|
(2,895
|
)
|
1,500
|
|
|||||
|
Net income
|
$
|
200,974
|
|
$
|
170,893
|
|
$
|
187,184
|
|
||
|
Basic earnings (loss) per share:
|
|||||||||||
|
Continuing operations
|
$
|
2.17
|
|
$
|
1.83
|
|
$
|
1.91
|
|
||
|
Discontinued operations
|
—
|
|
(0.03
|
)
|
0.02
|
|
|||||
|
Net basic earnings per share
|
$
|
2.17
|
|
$
|
1.80
|
|
$
|
1.93
|
|
||
|
Diluted earnings (loss) per share:
|
|||||||||||
|
Continuing operations
|
$
|
2.16
|
|
$
|
1.82
|
|
$
|
1.90
|
|
||
|
Discontinued operations
|
—
|
|
(0.03
|
)
|
0.01
|
|
|||||
|
Net diluted earnings per share
|
$
|
2.16
|
|
$
|
1.79
|
|
$
|
1.91
|
|
||
|
Weighted average shares:
|
|||||||||||
|
Basic
|
92,467
|
|
94,897
|
|
97,222
|
|
|||||
|
Diluted
|
93,094
|
|
95,567
|
|
97,902
|
|
|||||
|
Dividends declared per common share
|
$
|
1.04
|
|
$
|
0.98
|
|
$
|
0.90
|
|
||
|
Comprehensive income
|
|||||||||||
|
Net income
|
$
|
200,974
|
|
$
|
170,893
|
|
$
|
187,184
|
|
||
|
Foreign currency translation gain (loss)
|
15,824
|
|
(26,450
|
)
|
(9,552
|
)
|
|||||
|
Cash flow hedges, net of tax
|
1,871
|
|
1,745
|
|
1,934
|
|
|||||
|
Comprehensive income
|
$
|
218,669
|
|
$
|
146,188
|
|
$
|
179,566
|
|
||
See accompanying notes
49
PATTERSON COMPANIES, INC.
CONSOLIDATED STATEMENTS OF CHANGES IN STOCKHOLDERS’ EQUITY
(In thousands)
|
Common Stock
|
Additional
Paid-in
Capital
|
Accumulated
Other
Comprehensive
Income (Loss)
|
Retained
Earnings
|
Unearned
ESOP
Shares
|
Total
|
|||||||||||||||||||||
|
Number
|
Amount
|
|||||||||||||||||||||||||
|
Balance at April 25, 2015
|
103,278
|
|
$
|
1,033
|
|
$
|
21,026
|
|
$
|
(60,346
|
)
|
$
|
1,630,148
|
|
$
|
(77,738
|
)
|
$
|
1,514,123
|
|
||||||
|
Foreign currency translation
|
—
|
|
—
|
|
—
|
|
(9,552
|
)
|
—
|
|
—
|
|
(9,552
|
)
|
||||||||||||
|
Cash flow hedges
|
—
|
|
—
|
|
—
|
|
1,934
|
|
—
|
|
—
|
|
1,934
|
|
||||||||||||
|
Net income
|
—
|
|
—
|
|
—
|
|
—
|
|
187,184
|
|
—
|
|
187,184
|
|
||||||||||||
|
Dividends declared
|
—
|
|
—
|
|
—
|
|
—
|
|
(88,218
|
)
|
—
|
|
(88,218
|
)
|
||||||||||||
|
Common stock issued and related tax benefits
|
208
|
|
2
|
|
12,875
|
|
—
|
|
—
|
|
—
|
|
12,877
|
|
||||||||||||
|
Repurchases of common stock
|
(4,379
|
)
|
(44
|
)
|
—
|
|
—
|
|
(199,956
|
)
|
—
|
|
(200,000
|
)
|
||||||||||||
|
Stock based compensation
|
—
|
|
—
|
|
14,576
|
|
—
|
|
—
|
|
—
|
|
14,576
|
|
||||||||||||
|
ESOP activity
|
—
|
|
—
|
|
—
|
|
—
|
|
—
|
|
8,822
|
|
8,822
|
|
||||||||||||
|
Balance at April 30, 2016
|
99,107
|
|
991
|
|
48,477
|
|
(67,964
|
)
|
1,529,158
|
|
(68,916
|
)
|
1,441,746
|
|
||||||||||||
|
Foreign currency translation
|
—
|
|
—
|
|
—
|
|
(26,450
|
)
|
—
|
|
—
|
|
(26,450
|
)
|
||||||||||||
|
Cash flow hedges
|
—
|
|
—
|
|
—
|
|
1,745
|
|
—
|
|
—
|
|
1,745
|
|
||||||||||||
|
Net income
|
—
|
|
—
|
|
—
|
|
—
|
|
170,893
|
|
—
|
|
170,893
|
|
||||||||||||
|
Dividends declared
|
—
|
|
—
|
|
—
|
|
—
|
|
(93,461
|
)
|
—
|
|
(93,461
|
)
|
||||||||||||
|
Common stock issued and related tax benefits
|
282
|
|
3
|
|
6,786
|
|
—
|
|
—
|
|
—
|
|
6,789
|
|
||||||||||||
|
Repurchases of common stock
|
(2,855
|
)
|
(28
|
)
|
—
|
|
—
|
|
(125,356
|
)
|
—
|
|
(125,384
|
)
|
||||||||||||
|
Stock based compensation
|
—
|
|
—
|
|
17,710
|
|
—
|
|
—
|
|
—
|
|
17,710
|
|
||||||||||||
|
ESOP activity
|
—
|
|
—
|
|
—
|
|
—
|
|
—
|
|
845
|
|
845
|
|
||||||||||||
|
Balance at April 29, 2017
|
96,534
|
|
966
|
|
72,973
|
|
(92,669
|
)
|
1,481,234
|
|
(68,071
|
)
|
1,394,433
|
|
||||||||||||
|
Foreign currency translation
|
—
|
|
—
|
|
—
|
|
15,824
|
|
—
|
|
—
|
|
15,824
|
|
||||||||||||
|
Cash flow hedges
|
—
|
|
—
|
|
—
|
|
1,871
|
|
—
|
|
—
|
|
1,871
|
|
||||||||||||
|
Net income
|
—
|
|
—
|
|
—
|
|
—
|
|
200,974
|
|
—
|
|
200,974
|
|
||||||||||||
|
Dividends declared
|
—
|
|
—
|
|
—
|
|
—
|
|
(96,964
|
)
|
—
|
|
(96,964
|
)
|
||||||||||||
|
Common stock issued and related tax benefits
|
369
|
|
4
|
|
12,403
|
|
—
|
|
—
|
|
—
|
|
12,407
|
|
||||||||||||
|
Repurchases of common stock
|
(2,147
|
)
|
(22
|
)
|
—
|
|
—
|
|
(87,478
|
)
|
—
|
|
(87,500
|
)
|
||||||||||||
|
Stock based compensation
|
—
|
|
—
|
|
18,400
|
|
—
|
|
—
|
|
—
|
|
18,400
|
|
||||||||||||
|
ESOP activity
|
—
|
|
—
|
|
—
|
|
—
|
|
—
|
|
2,345
|
|
2,345
|
|
||||||||||||
|
Balance at April 28, 2018
|
94,756
|
|
$
|
948
|
|
$
|
103,776
|
|
$
|
(74,974
|
)
|
$
|
1,497,766
|
|
$
|
(65,726
|
)
|
$
|
1,461,790
|
|
||||||
See accompanying notes
50
PATTERSON COMPANIES, INC.
(In thousands)
|
Fiscal Year Ended
|
|||||||||||
|
April 28, 2018
|
April 29, 2017
|
April 30, 2016
|
|||||||||
|
Operating activities:
|
|||||||||||
|
Net income
|
$
|
200,974
|
|
$
|
170,893
|
|
$
|
187,184
|
|
||
|
Net income (loss) from discontinued operations
|
—
|
|
(2,895
|
)
|
1,500
|
|
|||||
|
Net income from continuing operations
|
200,974
|
|
173,788
|
|
185,684
|
|
|||||
|
Adjustments to reconcile net income from continuing operations to net cash provided by operating activities:
|
|||||||||||
|
Depreciation
|
45,115
|
|
40,004
|
|
34,315
|
|
|||||
|
Amortization
|
38,701
|
|
43,814
|
|
48,068
|
|
|||||
|
Intangible asset impairment
|
—
|
|
36,312
|
|
—
|
|
|||||
|
Bad debt expense
|
6,280
|
|
1,642
|
|
8,246
|
|
|||||
|
Non-cash employee compensation
|
36,532
|
|
19,025
|
|
28,851
|
|
|||||
|
Accelerated amortization of debt issuance costs on early retirement of debt
|
—
|
|
60
|
|
5,153
|
|
|||||
|
Deferred income taxes
|
(41,058
|
)
|
(13,713
|
)
|
(16,034
|
)
|
|||||
|
Change in assets and liabilities, net of acquired:
|
|||||||||||
|
Receivables
|
60,211
|
|
(103,181
|
)
|
(57,249
|
)
|
|||||
|
Inventory
|
(60,475
|
)
|
(961
|
)
|
(118,351
|
)
|
|||||
|
Accounts payable
|
(12,103
|
)
|
59,654
|
|
119,690
|
|
|||||
|
Accrued liabilities
|
(24,726
|
)
|
(9,009
|
)
|
(4,055
|
)
|
|||||
|
Long term receivables
|
(83,445
|
)
|
(63,976
|
)
|
(38,882
|
)
|
|||||
|
Other changes from operating activities, net
|
12,889
|
|
(17,845
|
)
|
(563
|
)
|
|||||
|
Net cash provided by operating activities- continuing operations
|
178,895
|
|
165,614
|
|
194,873
|
|
|||||
|
Net cash used in operating activities- discontinued operations
|
—
|
|
(2,895
|
)
|
(38,544
|
)
|
|||||
|
Net cash provided by operating activities
|
178,895
|
|
162,719
|
|
156,329
|
|
|||||
|
Investing activities:
|
|||||||||||
|
Additions to property and equipment
|
(43,263
|
)
|
(47,019
|
)
|
(79,354
|
)
|
|||||
|
Acquisitions and equity investments, net of cash assumed
|
—
|
|
—
|
|
(1,106,583
|
)
|
|||||
|
Collection of deferred purchase price receivables
|
49,650
|
|
51,402
|
|
22,320
|
|
|||||
|
Proceeds from sale of securities
|
—
|
|
—
|
|
48,744
|
|
|||||
|
Other investing activities
|
10,600
|
|
(3,190
|
)
|
—
|
|
|||||
|
Net cash provided by (used in) investing activities- continuing operations
|
16,987
|
|
1,193
|
|
(1,114,873
|
)
|
|||||
|
Net cash provided by investing activities- discontinued operations
|
—
|
|
—
|
|
714,239
|
|
|||||
|
Net cash provided by (used in) investing activities
|
16,987
|
|
1,193
|
|
(400,634
|
)
|
|||||
|
Financing activities:
|
|||||||||||
|
Dividends paid
|
(99,199
|
)
|
(95,910
|
)
|
(90,597
|
)
|
|||||
|
Repurchases of common stock
|
(87,500
|
)
|
(125,384
|
)
|
(200,000
|
)
|
|||||
|
Proceeds from issuance of long-term debt
|
150,000
|
|
—
|
|
1,000,000
|
|
|||||
|
Debt issuance costs
|
—
|
|
—
|
|
(11,600
|
)
|
|||||
|
Debt amendment costs
|
—
|
|
(1,266
|
)
|
—
|
|
|||||
|
Retirement of long-term debt
|
(164,754
|
)
|
(26,238
|
)
|
(682,375
|
)
|
|||||
|
Draw on (payment on) revolver
|
(43,000
|
)
|
39,000
|
|
20,000
|
|
|||||
|
Other financing activities
|
14,291
|
|
7,635
|
|
7,441
|
|
|||||
|
Net cash provided by (used in) financing activities
|
(230,162
|
)
|
(202,163
|
)
|
42,869
|
|
|||||
|
Effect of exchange rate changes on cash
|
2,305
|
|
(4,243
|
)
|
(8,371
|
)
|
|||||
|
Net decrease in cash and cash equivalents
|
(31,975
|
)
|
(42,494
|
)
|
(209,807
|
)
|
|||||
|
Cash and cash equivalents at beginning of period
|
94,959
|
|
137,453
|
|
347,260
|
|
|||||
|
Cash and cash equivalents at end of period
|
$
|
62,984
|
|
$
|
94,959
|
|
$
|
137,453
|
|
||
|
Supplemental disclosures:
|
|||||||||||
|
Income taxes paid
|
$
|
19,611
|
|
$
|
108,394
|
|
$
|
151,662
|
|
||
|
Interest paid
|
36,504
|
|
34,972
|
|
37,883
|
|
|||||
See accompanying notes
51
PATTERSON COMPANIES, INC.
NOTES TO CONSOLIDATED FINANCIAL STATEMENTS
April 28, 2018
(Dollars, except per share amounts, and shares in thousands)
1. Summary of Significant Accounting Policies
Description of Business
Patterson Companies, Inc. (referred to herein as “Patterson” or in the first person notations “we,” “our,” and “us”) is a value-added specialty distributor serving the U.S. and Canadian dental supply and the U.S., Canadian and U.K. animal health supply markets. Patterson has
three
reportable segments: Dental, Animal Health and Corporate.
Basis of Presentation
The consolidated financial statements include the accounts of our wholly owned subsidiaries. Intercompany transactions and balances have been eliminated in consolidation. The respective assets of PDC Funding Company, LLC and PDC Funding Company II, LLC would be available first and foremost to satisfy the claims of their respective creditors. There are no known creditors of PDC Funding Company, LLC or PDC Funding Company II, LLC.
Fiscal Year End
We operate with a 52-53 week accounting convention with our fiscal year ending on the last Saturday in April. Fiscal
2018
,
2017
and
2016
ended on
April 28, 2018
,
April 29, 2017
and
April 30, 2016
, respectively. Fiscal 2018 and 2017 consisted of 52 weeks, while fiscal 2016 consisted of 53 weeks. Fiscal 2019 will end on April 27, 2019 and will consist of 52 weeks.
Use of Estimates in the Preparation of Financial Statements
The preparation of financial statements in conformity with U.S. generally accepted accounting principles requires management to make estimates and assumptions that affect the reported amounts of assets and liabilities and disclosure of contingent assets and liabilities at the date of the financial statements and the reported amounts of revenues and expenses during the reporting period. Actual results could differ from those estimates.
Cash and Cash Equivalents
Cash equivalents consist primarily of investments in money market funds and government securities. The maturity of these securities at the time of purchase is
90 days
or less. All cash and cash equivalents are classified as available-for-sale and carried at fair value, which approximates cost.
Inventory
Inventory consists of merchandise held for sale and is stated at the lower of cost or market. The cost of our inventory includes the amount we pay to our suppliers to acquire inventory and freight costs incurred in connection with the delivery of product to our distribution centers and our other locations. Cost is determined using the last-in, first-out ("LIFO") method for all inventories, except for foreign inventories, which are valued using the first-in, first-out ("FIFO") method. Inventories valued at LIFO represented
84%
and
84%
of total inventories at
April 28, 2018
and
April 29, 2017
, respectively.
Effective January 28, 2018, the Company changed its method of calculating LIFO inventories within its U.S. Animal Health business segment from the double-extension method to the link-chain method. The Company believes that the LIFO Link Chain method of inventory valuation is preferable as the LIFO Link Chain costing method provides a better matching of current costs with current revenues, provides for a LIFO adjustment more representative of the Company’s actual inflation on its inventories and conforms LIFO inventory costing method (Link Chain) with other Patterson operations that use the LIFO inventory method (Link Chain). The Company determined that it is impracticable to determine the cumulative effect of applying this change retrospectively to any periods prior to April 30, 2017 because complete records of inventory purchases are no longer available for periods prior to that date. The Company applied the change as of April 30, 2017, the earliest date practicable. The effect of the change on the results of operations for the year ended April 28, 2018 was to reduce the consolidated LIFO reserve and increase pre-tax income by
$1,800
. The effect of the change on interim periods in 2018 was not material.
52
The accumulated LIFO reserve was
$82,105
at
April 28, 2018
and
$77,816
at
April 29, 2017
. We believe that inventory replacement cost exceeds the inventory balance by an amount approximating the LIFO reserve.
Property and Equipment
Property and equipment are stated at cost. Depreciation is calculated on the straight-line method over estimated useful lives of up to
39 years
for buildings or the expected remaining life of purchased buildings, the term of the lease for leasehold improvements,
3
to
10 years
for computer hardware and software, and
5
to
10 years
for furniture and equipment.
Goodwill and Other Indefinite-Lived Intangible Assets
Goodwill represents the excess of cost over the fair value of identifiable net assets of businesses acquired. We have
two
reporting units as of
April 28, 2018
; Dental and Animal Health. Our Corporate reportable segment's assets and liabilities, and net sales and expenses, are allocated to the
two
reporting units. Other indefinite-lived intangible assets include copyrights, trade names and trademarks.
We assess goodwill for impairment annually and whenever an event occurs or circumstances change that would indicate that the carrying amount may be impaired. If we determine that the fair value of the reporting unit may be less than its carrying amount, we evaluate goodwill using a two-step impairment test. Otherwise, we conclude that no impairment is indicated and we do not perform the two-step impairment test. In fiscal
2018
, we determined it was appropriate to perform a two-step impairment test.
The first step of the goodwill impairment test compares the book value of a reporting unit, including goodwill, with its fair value, as determined primarily by its discounted cash flows. If the book value of a reporting unit exceeds its fair value, the second step of the impairment test is performed to determine the amount of goodwill impairment loss to be recorded. The determination of fair value involves uncertainties because it requires management to make assumptions and to apply judgment to estimate industry and economic factors and the profitability of future business strategies. Patterson conducts impairment testing based on current business strategy in light of present industry and economic conditions, as well as future expectations. Additionally, in assessing goodwill for impairment, the reasonableness of the implied control premium is considered based on market capitalizations and recent market transactions.
Other indefinite-lived intangible assets are assessed for impairment by comparing the carrying value of an asset with its fair value. If the carrying value exceeds fair value, an impairment loss is recognized in an amount equal to the excess. The determination of fair value involves assumptions, including projected revenues and gross profit levels, as well as consideration of any factors that may indicate potential impairment.
In the fourth quarter of fiscal
2018
, management completed its annual goodwill and other indefinite-lived intangible asset impairment tests using the beginning of our fiscal 2018 fourth quarter as the valuation date, and determined there was
no
impairment, and that our Dental reporting unit was not at risk of failing step 1. The Animal Health reporting unit has a higher level of sensitivity to impairment as management currently assesses the various estimates and assumptions used to conduct these tests. Adverse changes to one or more of these estimates or assumptions could cause us to recognize a material impairment charge on this reporting unit. Subsequent to the annual test being completed, we experienced events and circumstances that indicated that the carrying amount of goodwill may be impaired. These events and circumstances included a decline in our actual earnings, a decline in our projected future earnings and a sustained decrease in our share price. As such, we tested our goodwill for impairment as of
April 28, 2018
, and determined that there was
no
impairment.
Long-Lived Assets
Long-lived assets, including definite-lived intangible assets, are evaluated for impairment whenever events or changes in circumstances indicate that the carrying amount of the assets may not be recoverable through the estimated undiscounted future cash flows derived from such assets. Our definite-lived intangible assets primarily consist of customer relationships, trade names and trademarks. When impairment exists, the related assets are written down to fair value using level 3 inputs, as discussed further in Note 9. In fiscal 2017, we recorded a non-cash impairment charge of
$36,312
related to a distribution agreement intangible asset. Refer to Note 3 for more information.
Financial Instruments
53
We account for derivative financial instruments under the provisions of Accounting Standards Codification ("ASC") Topic 815, “Derivatives and Hedging.” Our use of derivative financial instruments is generally limited to managing well-defined interest rate risks. We do not use financial instruments or derivatives for any trading purposes.
Revenue Recognition
Revenues are generated from the sale of consumable products, equipment, software products and services, technical service parts and labor, freight and delivery charges, and other sources. Revenues are recognized when persuasive evidence of an arrangement exists, delivery has occurred or services have been rendered, the price is fixed or determinable, and there is reasonable assurance of collection of the sale. Estimates for returns, damaged goods, rebates, loyalty programs and other revenue allowances are made at the time the revenue is recognized based on the historical experience for such items. In addition to revenues generated from the distribution of consumable products under conventional arrangements (buy/sell agreements) where the full market value of the product is recorded as revenue, the animal health segment may earn a small amount of commission income for services provided under agency agreements with certain pharmaceutical manufacturers. The services generally consist of detailing the product and taking the customer’s order. The agency agreement contrasts to a buy/sell agreement in that the animal health segment does not purchase and handle the product or bill and collect from the customer in an agency relationship with a vendor.
Consumable product sales are recorded upon delivery, except in those circumstances where terms of the sale are FOB shipping point, in which case sales are recorded upon shipment. Commissions under agency agreements are recorded when the services are provided.
Equipment and software product revenues are recognized upon delivery and, if necessary, installation. In those circumstances where terms of the sale are FOB shipping point, revenues are recognized when products are transferred to the shipping carrier. Revenue derived from post contract customer support for software is deferred and recognized ratably over the period in which the support is provided. Patterson provides financing for select equipment sales. See Note 7 for more information regarding customer financing.
Other revenue, including freight and delivery charges and technical service parts and labor, is recognized when the related product revenue is recognized or when the product or services are provided to the customer.
The receivables that result from the recognition of revenue are reported net of the related allowances discussed above. Patterson maintains a valuation allowance based upon the expected collectability of receivables held. Estimates are used to determine the valuation allowance and are based on several factors, including historical collection data, economic trends and credit worthiness of customers. Receivables are written off when we determine the amounts to be uncollectible, typically upon customer bankruptcy or non-response to continuous collection efforts. The portions of receivable amounts that are not expected to be collected during the next twelve months are classified as long-term.
Patterson has a relatively large, dispersed customer base and no single customer accounts for more than
10%
of consolidated net sales. In addition, the equipment sold to customers under finance contracts generally serves as collateral for the contract and the customer provides a personal guarantee as well.
Net sales do not include sales tax as we are considered a pass-through conduit for collecting and remitting sales tax.
Patterson Advantage Loyalty Program
The Dental segment provides a point-based awards program to qualifying customers involving the issuance of “Patterson Advantage dollars” which can be used toward equipment and technology purchases. Patterson Advantage dollars earned during a program year expire one year after the end of the program year. The cost and corresponding liability associated with the program are recognized as contra-revenue in accordance with ASC Topic 605-50, “Revenue Recognition-Customer Payments and Incentives.” As of
April 28, 2018
, we believe we have sufficient experience with the program to reasonably estimate the amount of Patterson Advantage dollars that will not be redeemed and thus have recorded a liability for
87%
of the maximum potential amount that could be redeemed. We use the redemption recognition method and we recognize the estimated value of unused Advantage dollars as a percentage of Patterson Advantage dollars earned. Breakage recognized was immaterial to all periods presented.
Freight and Delivery Charges
Freight and delivery charges are included in cost of sales in the consolidated statements of income.
54
Advertising
We expense all advertising and promotional costs as incurred, except for direct marketing expenses, which are expensed over the shorter of the life of the asset or one year. Total advertising and promotional expenses were
$6,926
,
$10,128
and
$12,113
for fiscal
2018
,
2017
and
2016
, respectively. There were
no
deferred direct-marketing expenses included in the consolidated balance sheets as of
April 28, 2018
and
April 29, 2017
.
Related Party Transactions
We have interests in a number of entities that are accounted for using the equity method. During fiscal 2018, 2017 and 2016 we made purchases of
$84,175
,
$55,194
and
$46,361
from these entities, respectively. During fiscal 2018, we recorded sales of
$19,743
to these entities.
No
sales to these entities were recorded in fiscal 2017 or 2016.
Income Taxes
The liability method is used to account for income tax expense. Under this method, deferred tax assets and liabilities are determined based on differences between financial reporting and tax bases of assets and liabilities and are measured using the enacted tax rates and laws that will be in effect when the differences are expected to reverse.
Valuation allowances are established for deferred tax assets if, after assessment of available positive and negative evidence, it is more likely than not that the deferred tax asset will not be fully realized.
Employee Stock Ownership Plan ("ESOP")
Compensation expense related to our defined contribution ESOP is computed based on the shares allocated method.
Self-insurance
Patterson is self-insured for certain losses related to general liability, product liability, automobile, workers’ compensation and medical claims. We estimate our liabilities based upon an analysis of historical data and actuarial estimates. While current estimates are believed reasonable based on information currently available, actual results could differ and affect financial results due to changes in the amount or frequency of claims, medical cost inflation or other factors. Historically, actual results related to these types of claims have not varied significantly from estimated amounts.
Stock-based Compensation
We recognize stock-based compensation expense based on estimated grant date fair values. The grant date fair value of stock options and stock purchases made through our Employee Stock Purchase Plan and our Capital Accumulation Plan are estimated using the Black-Scholes option pricing valuation model. The grant date fair value of performance stock units that vest upon meeting certain market conditions is estimated using the Monte Carlo valuation model. These valuations require estimates to be made including expected stock price volatility which considers historical volatility trends, implied future volatility based on certain traded options and other factors. We estimate the expected life of awards based on several factors, including types of participants, vesting schedules, contractual terms and various factors surrounding exercise behavior of different groups.
The grant date fair value of time-based restricted stock awards and restricted stock units is calculated based on the closing price of our common stock on the date of grant.
Compensation expense for all share-based payment awards is recognized over the requisite service period (or to the date a participant becomes eligible for retirement, if earlier) for awards that are expected to vest.
Comprehensive Income
Comprehensive income is computed as net income plus certain other items that are recorded directly to stockholders’ equity. Significant items included in comprehensive income are foreign currency translation adjustments and the effective portion of cash flow hedges, net of tax. Foreign currency translation adjustments do not include a provision for income tax because earnings from foreign operations are considered to be indefinitely reinvested outside the U.S. The income tax expense related to cash flow hedge losses was
$938
,
$1,057
and
$883
for fiscal
2018
,
2017
and
2016
, respectively.
Earnings Per Share ("EPS")
55
The amount of basic EPS is computed by dividing net income by the weighted average number of outstanding common shares during the period. The amount of diluted EPS is computed by dividing net income by the weighted average number of outstanding common shares and common share equivalents, when dilutive, during the period.
The following table sets forth the denominator for the computation of basic and diluted EPS. There were no material adjustments to the numerator.
|
Fiscal Year Ended
|
||||||||
|
April 28, 2018
|
April 29, 2017
|
April 30, 2016
|
||||||
|
Denominator
|
||||||||
|
Denominator for basic EPS – weighted average shares
|
92,467
|
|
94,897
|
|
97,222
|
|
||
|
Effect of dilutive securities – stock options, restricted stock and stock purchase plans
|
627
|
|
670
|
|
680
|
|
||
|
Denominator for diluted EPS – weighted average shares
|
93,094
|
|
95,567
|
|
97,902
|
|
||
Potentially dilutive securities representing
1,380
,
1,133
and
765
shares for fiscal
2018
,
2017
and
2016
, respectively, were excluded from the calculation of diluted EPS because their effects were anti-dilutive.
Recent Accounting Pronouncements
In May 2014, the Financial Accounting Standards Board ("FASB") issued Accounting Standards Update ("ASU") No. 2014-09, "Revenue from Contracts with Customers (Topic 606)". ASU No. 2014-09 supersedes the revenue recognition requirements in "Revenue Recognition (Topic 605)," and requires entities to recognize revenue in a way that depicts the transfer of promised goods or services to customers in an amount that reflects the consideration to which the entity expects to be entitled in exchange for those goods or services. In July 2015, the FASB deferred the effective date of this pronouncement by one year to December 15, 2017 for annual reporting periods beginning after that date. Companies may use either a full retrospective or a modified retrospective approach to adopt the standard. We will adopt the new guidance in the first quarter of fiscal 2019 using the modified retrospective approach. We do not expect the standard to materially affect our consolidated net earnings, financial position, or cash flows.
In July 2015, the FASB issued ASU No. 2015-11, "Inventory (Topic 330), Simplifying the Measurement of Inventory." ASU 2015-11 requires inventory measured using any method other than LIFO or the retail inventory method to be subsequently measured at the lower of cost or net realizable value, rather than at the lower of cost or market. Subsequent measurement of inventory using the LIFO and retail inventory method is unchanged. During the first quarter of fiscal 2018, we adopted ASU No. 2015-11 and it had no material impact to the consolidated financial statements.
In January 2016, the FASB issued ASU No. 2016-01, "Financial Instruments- Recognition and Measurement of Financial Assets and Financial Liabilities (Subtopic 825-10)", which amends certain aspects of recognition, measurement, presentation and disclosure of financial instruments, including the requirement to measure certain equity investments at fair value with changes in fair value recognized in net income. We are required to adopt the ASU No. 2016-01 in the first quarter of fiscal 2019. We are evaluating the impact of adopting this pronouncement.
In February 2016, the FASB issued ASU No. 2016-02, "Leases (Topic 842)," which requires lessees to recognize assets and liabilities on the balance sheet for the rights and obligations created by most leases, as well as requires additional qualitative and quantitative disclosures. We are required to adopt ASU 2016-02 in the first quarter of fiscal 2020, with early adoption permitted. We plan to adopt the new guidance in the first quarter of fiscal 2020 and are currently evaluating the impact of adopting this pronouncement.
In February 2018, the FASB issued ASU No. 2018-02, "Income Statement-Reporting Comprehensive Income (Topic 220) Reclassification of Certain Tax Effects from Accumulated Other Comprehensive Income," which will allow a reclassification from accumulated other comprehensive income to retained earnings for the tax effects that are stranded in accumulated other comprehensive income as a result of tax reform. This standard also requires certain disclosures about stranded tax effects. We are required to adopt ASU No. 2018-02 in the first quarter of fiscal 2020, with early adoption permitted, and apply it either in the period of adoption or retrospectively to each period in which the income tax effects of the tax reform related to items in accumulated other comprehensive income are recognized. We are currently evaluating the impact of adopting this pronouncement.
56
2. Cash and Cash Equivalents
At
April 28, 2018
and
April 29, 2017
, cash and cash equivalents consisted of the following:
|
April 28, 2018
|
April 29, 2017
|
||||||
|
Cash on hand
|
$
|
56,334
|
|
$
|
88,161
|
|
|
|
Money market funds
|
6,650
|
|
6,798
|
|
|||
|
Total
|
$
|
62,984
|
|
$
|
94,959
|
|
|
Cash on hand is generally in interest earning accounts.
3. Goodwill and Other Intangible Assets
The changes in the carrying value of goodwill for each of our reportable segments for the fiscal year ended
April 28, 2018
are as follows:
|
Balance at April 29, 2017
|
Activity
|
Balance at April 28, 2018
|
|||||||||
|
Dental
|
$
|
138,289
|
|
$
|
1,365
|
|
$
|
139,654
|
|
||
|
Animal Health
|
675,258
|
|
1,065
|
|
676,323
|
|
|||||
|
Corporate
|
—
|
|
—
|
|
—
|
|
|||||
|
Total
|
$
|
813,547
|
|
$
|
2,430
|
|
$
|
815,977
|
|
||
Activity in fiscal
2018
primarily consists of the impact from foreign currency translation.
Balances of other intangible assets, excluding goodwill, are as follows:
|
April 28, 2018
|
April 29, 2017
|
||||||||||||||||||||||
|
Gross
|
Accumulated Amortization
|
Net
|
Gross
|
Accumulated Amortization
|
Net
|
||||||||||||||||||
|
Unamortized - indefinite lived:
|
|||||||||||||||||||||||
|
Copyrights, trade names and trademarks
|
$
|
29,900
|
|
$
|
—
|
|
$
|
29,900
|
|
$
|
29,900
|
|
$
|
—
|
|
$
|
29,900
|
|
|||||
|
Amortized - definite lived:
|
|||||||||||||||||||||||
|
Customer relationships
|
355,488
|
|
91,374
|
|
264,114
|
|
353,237
|
|
67,483
|
|
285,754
|
|
|||||||||||
|
Trade names and trademarks
|
129,973
|
|
49,545
|
|
80,428
|
|
129,426
|
|
35,580
|
|
93,846
|
|
|||||||||||
|
Developed technology and other
|
55,326
|
|
40,344
|
|
14,982
|
|
54,209
|
|
38,273
|
|
15,936
|
|
|||||||||||
|
Total amortized intangible assets
|
540,787
|
|
181,263
|
|
359,524
|
|
536,872
|
|
141,336
|
|
395,536
|
|
|||||||||||
|
Total identifiable intangible assets
|
$
|
570,687
|
|
$
|
181,263
|
|
$
|
389,424
|
|
$
|
566,772
|
|
$
|
141,336
|
|
$
|
425,436
|
|
|||||
In fiscal 2006, we extended our exclusive North American distribution relationship with Sirona Dental Systems for its CEREC 3D dental restorative system. At that time, we paid a
$100,000
distribution fee to extend the existing exclusive relationship for at least a
10
-year beginning in 2007. This distribution fee was accounted for as an intangible asset in our Dental segment and amortized since 2007. Based on our November 2016 decision not to extend sales exclusivity for the full Sirona portfolio of products, we recorded a pre-tax non-cash impairment charge of
$36,312
in our Dental segment in the third quarter fiscal 2017, related to the distribution fee associated with the CEREC product component of this arrangement. This charge was recorded within operating expenses in the consolidated statements of income and other comprehensive income.
With respect to the amortized intangible assets, future amortization expense is expected to approximate
$36,735
,
$35,382
,
$35,266
,
$34,926
and
$34,483
for fiscal
2019
,
2020
,
2021
,
2022
and
2023
, respectively. Actual amounts of amortization expense may differ from estimated amounts due to additional intangible asset acquisitions, changes in foreign currency exchange rates, impairment of intangible assets, accelerated amortization of intangible assets and other events.
4. Discontinued Operations
57
In August 2015, we sold all of the outstanding shares of common stock of Patterson Medical Holdings, Inc., our wholly owned subsidiary responsible for our medical rehabilitative and assistive products supply business ("Patterson Medical"), for
$716,886
in cash to Madison Dearborn Partners. As additional consideration for the shares of Patterson Medical, we obtained a number of common units of the parent company of the buyer equal to
10%
of the common units outstanding at closing. Unlike the other common units, these units will only become entitled to begin participating in distributions to the common unit holders at such time, if any, as the Madison Dearborn Partners’ investor cash inflows equal or exceed
2.5
times the Madison Dearborn Partners’ investor cash outflows. These units are non-transferable.
In connection with the above described transaction, we also entered into a transition services agreement with our former subsidiary, pursuant to which Patterson Medical, as owned by Madison Dearborn Partners, paid us to provide, among other things, certain information technology, distribution, facilities, finance, tax and treasury, and human resources services. The transition services agreement ended in fiscal 2018, and we no longer provide these services.
We classified Patterson Medical’s results of operations as discontinued operations for all periods presented in the consolidated statements of income and other comprehensive income. The operations and cash flows of Patterson Medical have been eliminated from our continuing operations, which were previously recorded as the rehabilitation supply reportable segment.
5. Property and Equipment
Property and equipment consisted of the following items:
|
April 28, 2018
|
April 29, 2017
|
||||||
|
Land
|
$
|
10,227
|
|
$
|
11,518
|
|
|
|
Buildings
|
104,720
|
|
110,807
|
|
|||
|
Leasehold improvements
|
26,624
|
|
25,173
|
|
|||
|
Furniture and equipment
|
171,197
|
|
159,886
|
|
|||
|
Computer hardware and software
|
211,453
|
|
206,402
|
|
|||
|
Construction-in-progress
(1)
|
59,691
|
|
36,211
|
|
|||
|
Property and equipment, gross
|
583,912
|
|
549,997
|
|
|||
|
Accumulated depreciation
|
(293,322
|
)
|
(251,545
|
)
|
|||
|
Property and equipment, net
|
$
|
290,590
|
|
$
|
298,452
|
|
|
|
(1)
|
Includes
$43,026
and
$27,954
of unamortized computer software development costs of software to be sold as of
April 28, 2018
and
April 29, 2017
, respectively.
|
Our long-term debt consists of the following:
|
Carrying Value
|
||||||||||
|
Interest Rate
|
April 28, 2018
|
April 29, 2017
|
||||||||
|
Senior notes due fiscal 2018
(1)
|
5.75
|
%
|
$
|
—
|
|
$
|
150,000
|
|
||
|
Senior notes due fiscal 2019
(2)
|
2.95
|
%
|
60,000
|
|
60,000
|
|
||||
|
Senior notes due fiscal 2022
(2)
|
3.59
|
%
|
165,000
|
|
165,000
|
|
||||
|
Senior notes due fiscal 2024
(2)
|
3.74
|
%
|
100,000
|
|
100,000
|
|
||||
|
Senior notes due fiscal 2025
(3)
|
3.48
|
%
|
250,000
|
|
250,000
|
|
||||
|
Senior notes due fiscal 2028
(4)
|
3.79
|
%
|
150,000
|
|
—
|
|
||||
|
Term loan due fiscal 2022
(5)
|
3.40
|
%
|
276,633
|
|
291,387
|
|
||||
|
Less: Deferred debt issuance costs
|
(3,005
|
)
|
(3,361
|
)
|
||||||
|
Total debt
|
998,628
|
|
1,013,026
|
|
||||||
|
Less: Current maturities of long-term debt
|
(76,598
|
)
|
(14,754
|
)
|
||||||
|
Long-term debt
|
$
|
922,030
|
|
$
|
998,272
|
|
||||
58
|
(1)
|
Issued in March 2008.
|
|
(2)
|
Issued in December 2011.
|
|
(3)
|
Issued in March 2015.
|
|
(4)
|
Issued in March 2018.
|
|
(5)
|
Issued in June 2015, amended in January 2017. Interest rate is LIBOR plus
1.50%
as of
April 28, 2018
.
|
Future principal payments due, based on stated contractual maturities for our long-term debt, are as follows as of
April 28, 2018
:
|
Fiscal Year
|
|||
|
2019
|
$
|
76,598
|
|
|
2020
|
23,975
|
|
|
|
2021
|
29,508
|
|
|
|
2022
|
371,552
|
|
|
|
2023
|
—
|
|
|
|
Thereafter
|
500,000
|
|
|
|
Total
|
$
|
1,001,633
|
|
During fiscal 2016, we entered into a credit agreement ("Credit Agreement"), under which the lenders provided us with senior unsecured lending facilities of up to
$1,500,000
, consisting of a
$1,000,000
unsecured term loan and a
$500,000
unsecured revolving line of credit. In fiscal 2017, we entered into an amendment of the Credit Agreement (“Amended Credit Agreement”), consisting of a
$295,075
term loan and a
$750,000
revolving line of credit. Interest on borrowings is variable and is determined as a base rate plus a spread. This spread, as well as a commitment fee on the unused portion of the facility, is based on our leverage ratio, as defined in the Amended Credit Agreement. The term loan and revolving credit facilities will mature no later than January 2022.
As of
April 28, 2018
,
$276,633
of the Amended Credit Agreement unsecured term loan was outstanding at an interest rate of
3.40%
, and
$16,000
was outstanding under the Amended Credit Agreement revolving line of credit at an interest rate of
2.95%
. At
April 29, 2017
,
$291,387
was outstanding under the Amended Credit Agreement unsecured term loan at an interest rate of
2.24%
, and
$59,000
was outstanding under the Amended Credit Agreement revolving line of credit at an interest rate of
2.19%
.
In March 2018, we issued fixed-rate senior notes with an aggregate principal amount of
$150,000
, due fiscal 2028. The proceeds were used to repay
$150,000
of senior notes that came due in March 2018.
We are subject to various financial covenants under our debt agreements including the maintenance of leverage and interest coverage ratios. In the event of our default, any outstanding obligations may become due and payable immediately. We were in material compliance with the covenants under our debt agreements as of
April 28, 2018
.
7. Customer Financing
As a convenience to our customers, we offer several different financing alternatives, including a third party program and a Patterson-sponsored program. For the third party program, we act as a facilitator between the customer and the third party financing entity with no on-going involvement in the financing transaction. Under the Patterson-sponsored program, equipment purchased by creditworthy customers may be financed up to a maximum of
$1,000
. We generally sell our customers’ financing contracts to outside financial institutions in the normal course of our business. These financing arrangements are accounted for as a sale of assets under the provisions of ASC 860,
Transfers and Servicing
. We currently have
two
arrangements under which we sell these contracts.
First, we operate under an agreement to sell a portion of our equipment finance contracts to commercial paper conduits with The Bank of Tokyo-Mitsubishi UFJ, Ltd. ("BTMU") serving as the agent. We utilize PDC Funding to fulfill a requirement of participating in the commercial paper conduit. We receive the proceeds of the contracts upon sale to BTMU. At least
9.5%
of the proceeds are held by the conduit as security against eventual performance of the portfolio. This percentage can be greater and is based upon certain ratios defined in the agreement with BTMU. The capacity under the agreement with BTMU at
April 28, 2018
was
$575,000
.
59
Second, we maintain an agreement with Fifth Third Bank ("Fifth Third") whereby Fifth Third purchases customers’ financing contracts. PDC Funding II sells its financing contracts to Fifth Third. We receive the proceeds of the contracts upon sale to Fifth Third. At least
11.0%
of the proceeds are held by the conduit as security against eventual performance of the portfolio. This percentage can be greater and is based upon certain ratios defined in the agreement with Fifth Third. The capacity under the agreement with Fifth Third at
April 28, 2018
was
$100,000
.
We service the financing contracts under both arrangements, for which we are paid a servicing fee. The servicing fees we receive are considered adequate compensation for services rendered. Accordingly, no servicing asset or liability has been recorded.
The portion of the purchase price for the receivables held by the conduits is deemed a deferred purchase price receivable, which is paid to the applicable special purpose entity as payments on the customers’ financing contracts are collected by Patterson from customers. The difference between the carrying amount of the receivables sold under these programs and the sum of the cash and fair value of the deferred purchase price receivables received at time of transfer is recognized as a gain on sale of the related receivables and recorded in net sales in the consolidated statements of income and other comprehensive income. Expenses incurred related to customer financing activities are recorded in operating expenses in our consolidated statements of income and other comprehensive income.
During fiscal
2018
,
2017
and
2016
, we sold
$312,699
,
$357,965
and
$359,646
of contracts under these arrangements, respectively. We recorded net sales in the consolidated statements of income and other comprehensive income of
$13,347
,
$20,580
and
$30,123
during fiscal
2018
,
2017
and
2016
, respectively, related to these contracts sold.
Included in cash and cash equivalents in the consolidated balance sheets are
$35,741
and
$17,902
as of
April 28, 2018
and
April 29, 2017
, respectively, which represent cash collected from previously sold customer financing contracts that have not yet been settled. Included in current receivables in the consolidated balance sheets are
$46,232
, net of unearned income of
$8
, and
$124,098
, net of unearned income of
$940
, as of
April 28, 2018
and
April 29, 2017
, respectively, of finance contracts we have not yet sold. A total of
$617,610
of finance contracts receivable sold under the arrangements was outstanding at
April 28, 2018
. The deferred purchase price receivable under the arrangements was
$150,404
and
$119,798
as of
April 28, 2018
and
April 29, 2017
, respectively. Since the internal financing program began in 1994, bad debt write-offs have amounted to less than
1%
of the loans originated.
The arrangements require us to maintain a minimum current ratio and maximum leverage ratio. We were in compliance with those covenants at
April 28, 2018
.
8. Derivative Financial Instruments
We are a party to certain offsetting and identical interest rate cap agreements entered into to fulfill certain covenants of the equipment finance contract sale agreements. The interest rate cap agreements also provide a credit enhancement feature for the financing contracts sold by PDC Funding and PDC Funding II to the commercial paper conduit.
The interest rate cap agreements are canceled and new agreements are entered into periodically to maintain consistency with the dollar maximum of the sale agreements and the maturity of the underlying financing contracts. As of
April 28, 2018
, PDC Funding had purchased an interest rate cap from a bank with a notional amount of
$575,000
and a maturity date of July 2025. We sold an identical interest rate cap to the same bank. As of
April 28, 2018
, PDC Funding II had purchased an interest rate cap from a bank with a notional amount of
$100,000
and a maturity date of July 2025. We sold an identical interest rate cap to the same bank.
These interest rate cap agreements do not qualify for hedge accounting treatment and, accordingly, we record the fair value of the agreements as an asset or liability and the change as income or expense during the period in which the change occurs.
In March 2008, we entered into
two
forward starting interest rate swap agreements, each with notional amounts of
$100,000
and accounted for as cash flow hedges, to hedge interest rate fluctuations in anticipation of the issuance of the senior notes due fiscal
2015
and fiscal
2018
. Upon issuance of the hedged debt, we settled the forward starting interest rate swap agreements and recorded a
$1,000
increase, net of income taxes, to other comprehensive income (loss), which was amortized as a reduction to interest expense over the life of the related debt through the fourth quarter of 2018.
In January 2014, we entered into a forward interest rate swap agreement with a notional amount of
$250,000
and accounted for as a cash flow hedge, to hedge interest rate fluctuations in anticipation of refinancing the
5.17%
senior
60
notes due
March 25, 2015
. These notes were repaid on
March 25, 2015
and replaced with new
$250,000
3.48%
senior notes due
March 24, 2025
. A cash payment of
$29,003
was made in March 2015 to settle the interest rate swap. This amount is recorded in other comprehensive income (loss), net of tax, and is recognized as interest expense over the life of the related debt.
The following presents the fair value of derivative instruments included in the consolidated balance sheets:
|
Derivative type
|
Classification
|
April 28, 2018
|
April 29, 2017
|
||||||
|
Assets:
|
|||||||||
|
Interest rate cap agreements
|
Other noncurrent assets
|
$
|
1,613
|
|
$
|
1,188
|
|
||
|
Liabilities:
|
|||||||||
|
Interest rate cap agreements
|
Other noncurrent liabilities
|
$
|
1,613
|
|
$
|
1,188
|
|
||
The following table presents the pre-tax effect of derivative instruments in cash flow hedging relationships on the consolidated statements of income and other comprehensive income ("OCI"):
|
Amount of Gain (Loss) Reclassified from Accumulated Other Comprehensive Loss into Income (Effective Portion)
|
|||||||||||||
|
Fiscal Year Ended
|
|||||||||||||
|
Derivatives in cash flow hedging relationships
|
Income statement location
|
April 28, 2018
|
April 29, 2017
|
April 30, 2016
|
|||||||||
|
Interest rate swap
|
Interest expense
|
$
|
(2,809
|
)
|
$
|
(2,802
|
)
|
$
|
(2,817
|
)
|
|||
There were
no
gains or losses recognized in OCI on cash flow hedging derivatives in fiscal
2018
,
2017
or
2016
.
We recorded
no
ineffectiveness during fiscal
2018
,
2017
or
2016
. As of
April 28, 2018
, the estimated pre-tax portion of accumulated other comprehensive loss that is expected to be reclassified into earnings over the next twelve months is
$2,908
, which will be recorded as an increase to interest expense.
9. Fair Value Measurements
Fair value is the price at which an asset could be exchanged in a current transaction between knowledgeable, willing parties. The fair value hierarchy of measurements is categorized into one of three levels based on the lowest level of significant input used:
|
Level 1 –
|
Quoted prices in active markets for identical assets and liabilities at the measurement date.
|
|
|
Level 2 –
|
Observable inputs other than quoted prices included in Level 1, such as quoted prices for similar assets and liabilities in active markets; quoted prices for identical or similar assets and liabilities in markets that are not active; or other inputs that are observable or can be corroborated by observable market data.
|
|
|
Level 3 –
|
Unobservable inputs for which there is little or no market data available. These inputs reflect
management’s assumptions of what market participants would use in pricing the asset or liability.
|
|
Our hierarchy for assets and liabilities measured at fair value on a recurring basis is as follows:
|
April 28, 2018
|
|||||||||||||||
|
Total
|
Level 1
|
Level 2
|
Level 3
|
||||||||||||
|
Assets:
|
|||||||||||||||
|
Cash equivalents
|
$
|
6,650
|
|
$
|
6,650
|
|
$
|
—
|
|
$
|
—
|
|
|||
|
Deferred purchase price receivable
|
150,404
|
|
—
|
|
—
|
|
150,404
|
|
|||||||
|
Derivative instruments
|
1,613
|
|
—
|
|
1,613
|
|
—
|
|
|||||||
|
Total assets
|
$
|
158,667
|
|
$
|
6,650
|
|
$
|
1,613
|
|
$
|
150,404
|
|
|||
|
Liabilities:
|
|||||||||||||||
|
Derivative instruments
|
$
|
1,613
|
|
$
|
—
|
|
$
|
1,613
|
|
$
|
—
|
|
|||
61
|
April 29, 2017
|
|||||||||||||||
|
Total
|
Level 1
|
Level 2
|
Level 3
|
||||||||||||
|
Assets:
|
|||||||||||||||
|
Cash equivalents
|
$
|
6,798
|
|
$
|
6,798
|
|
$
|
—
|
|
$
|
—
|
|
|||
|
Deferred purchase price receivable
|
119,798
|
|
—
|
|
—
|
|
119,798
|
|
|||||||
|
Derivative instruments
|
1,188
|
|
—
|
|
1,188
|
|
—
|
|
|||||||
|
Total assets
|
$
|
127,784
|
|
$
|
6,798
|
|
$
|
1,188
|
|
$
|
119,798
|
|
|||
|
Liabilities:
|
|||||||||||||||
|
Derivative instruments
|
$
|
1,188
|
|
$
|
—
|
|
$
|
1,188
|
|
$
|
—
|
|
|||
Cash equivalents
– We value cash equivalents at their current market rates. The carrying value of cash equivalents approximates fair value and maturities are less than three months.
Deferred purchase price receivable
– We value the deferred purchase price receivable based on a discounted cash flow analysis using unobservable inputs, which include a forward yield curve, the estimated timing of payments and the credit quality of the underlying creditor. Significant changes in any of the significant unobservable inputs in isolation would not result in a materially different fair value estimate. The interrelationship between these inputs is insignificant.
Derivative instruments
–Our derivative instruments consist of interest rate cap agreements and interest rate swaps. These instruments are valued using inputs such as interest rates and credit spreads.
Certain assets are measured at fair value on a non-recurring basis. These assets are not measured at fair value on an ongoing basis, but are subject to fair value adjustments under certain circumstances, such as when there is evidence of impairment. In fiscal 2017, we recorded a non-cash impairment charge of
$36,312
related to a distribution agreement intangible asset. Refer to Note 3 for more information. There were
no
fair value adjustments to such assets in fiscal 2018 or 2016.
Our debt is not measured at fair value in the consolidated balance sheets. The estimated fair value of our debt as of
April 28, 2018
and
April 29, 2017
was
$989,124
and
$1,025,761
, respectively, as compared to a carrying value of
$998,628
and
$1,013,026
at
April 28, 2018
and
April 29, 2017
, respectively. The fair value of debt was measured using a discounted cash flow analysis based on expected market based yields (i.e., level 2 inputs).
The carrying amounts of receivables, net of allowances, accounts payable, and certain accrued and other current liabilities approximated fair value at
April 28, 2018
and
April 29, 2017
.
10. Lease Commitments
Patterson leases facilities for its branch office locations, a few distribution facilities, and certain equipment. These leases are accounted for as operating leases. Future minimum rental payments under noncancelable operating leases are as follows at
April 28, 2018
:
|
2019
|
$
|
21,688
|
|
|
2020
|
18,121
|
|
|
|
2021
|
14,164
|
|
|
|
2022
|
10,593
|
|
|
|
2023
|
6,056
|
|
|
|
Thereafter
|
3,665
|
|
|
|
Total
|
$
|
74,287
|
|
Rent expense was
$24,425
,
$24,502
and
$23,315
for fiscal
2018
,
2017
and
2016
, respectively.
11. Income Taxes
The effective income tax rate for the year ended
April 28, 2018
was
(12.1)%
compared to
30.7%
for year ended
April 29, 2017
.
62
The tax benefit for the year ended
April 28, 2018
was primarily due to the impact of the Tax Cuts and Jobs Act ("Tax Act"), enacted on December 22, 2017 by the U.S. government. The Tax Act significantly revises the future ongoing U.S. federal corporate income tax by, among other things, lowering the U.S. federal corporate tax rate and implementing a territorial tax system. Effective January 1, 2018, the Tax Act reduced the U.S. federal corporate tax rate from
35.0%
to
21.0%
. For the fiscal year ended
April 28, 2018
, we utilized a blended rate of approximately
30.5%
. For the fiscal year ended
April 28, 2018
, these impacts resulted in a provisional discrete net tax benefit of
$76,648
, which included provisional amounts of
$81,871
of tax benefit on U.S. deferred tax assets and liabilities,
$4,006
of tax expense for a one-time transition tax on unremitted foreign earnings and
$1,217
in withholding tax paid on current year distributions. In accordance with the Tax Act, the transition tax will be payable over an eight year period.
The legislative changes included in the Tax Act are broad and complex. We determined that the transition tax on unremitted foreign earnings is provisional because various components of the computation are unknown as of
April 28, 2018
. In addition, we determined that the impact of the U.S. federal corporate income tax rate change on the U.S. deferred tax assets and liabilities is provisional because the amount cannot be calculated until the underlying timing differences are known rather than estimated.
During the fourth quarter, and directly connected to the transition tax legislation, the Company approved a one-time repatriation of cash included in the transition tax computation. There was an approximate
$1,217
one-time cost recorded to reflect the added withholding tax cost associated with this repatriation. With the exception of this one-time repatriation, the Company will continue to apply ASC 740 based on the provisions of the tax law that were in effect immediately prior to the enactment of the new law. With regard to unremitted earnings of foreign subsidiaries generated after December 31, 2017, we do not currently provide for U.S. taxes since we intend to invest such undistributed earnings indefinitely outside of the U.S.
We continue to review the anticipated impacts of the global intangible low taxed income (“GILTI”) and base erosion and anti-abuse tax (“BEAT”) provisions which are not effective until fiscal 2019. We have not recorded any impact associated with either GILTI or BEAT for the fiscal year ended
April 28, 2018
.
The final transition impacts of the Tax Act may differ from the above estimate, possibly materially, due to, among other things, changes in interpretations of the Tax Act, any federal and/or state legislative action to address questions that arise because of the Tax Act, any changes in accounting standards for income taxes or related interpretations in response to the Tax Act, or any updates or changes to estimates we have utilized to calculate the transition impacts. The Securities and Exchange Commission has issued rules, under SAB 118, that will allow for a measurement period of up to one year after the enactment date of the Tax Act to finalize the recording of the related tax impacts.
The components of income from continuing operations before taxes are as follows:
|
Fiscal Year Ended
|
|||||||||||
|
April 28,
2018 |
April 29,
2017 |
April 30,
2016 |
|||||||||
|
Income from continuing operations before taxes
|
|||||||||||
|
United States
|
$
|
144,278
|
|
$
|
217,529
|
|
$
|
270,501
|
|
||
|
International
|
34,985
|
|
33,352
|
|
31,192
|
|
|||||
|
Total
|
$
|
179,263
|
|
$
|
250,881
|
|
$
|
301,693
|
|
||
Significant components of income tax expense (benefit) are as follows:
63
|
Fiscal Year Ended
|
|||||||||||
|
April 28,
2018 |
April 29,
2017 |
April 30,
2016 |
|||||||||
|
Current:
|
|||||||||||
|
Federal
|
$
|
5,876
|
|
$
|
72,339
|
|
$
|
105,104
|
|
||
|
Foreign
|
11,228
|
|
9,100
|
|
11,690
|
|
|||||
|
State
|
2,243
|
|
9,367
|
|
15,249
|
|
|||||
|
Total current expense
|
19,347
|
|
90,806
|
|
132,043
|
|
|||||
|
Deferred:
|
|||||||||||
|
Federal
|
(45,177
|
)
|
(11,802
|
)
|
(14,308
|
)
|
|||||
|
Foreign
|
(743
|
)
|
(28
|
)
|
323
|
|
|||||
|
State
|
4,862
|
|
(1,883
|
)
|
(2,049
|
)
|
|||||
|
Total deferred benefit
|
(41,058
|
)
|
(13,713
|
)
|
(16,034
|
)
|
|||||
|
Income tax expense (benefit)
|
$
|
(21,711
|
)
|
$
|
77,093
|
|
$
|
116,009
|
|
||
Deferred tax assets and liabilities are included in other non-current assets and deferred income taxes on the consolidated balance sheets. Significant components of Patterson’s deferred tax assets (liabilities) as of
April 28, 2018
and
April 29, 2017
are as follows:
|
April 28,
2018 |
April 29,
2017 |
||||||
|
Deferred tax assets:
|
|||||||
|
Capital accumulation plan
|
$
|
4,862
|
|
$
|
7,676
|
|
|
|
Inventory related items
|
4,407
|
|
6,236
|
|
|||
|
Bad debt allowance
|
1,052
|
|
2,317
|
|
|||
|
Stock based compensation expense
|
6,514
|
|
8,663
|
|
|||
|
Interest rate swap
|
4,712
|
|
8,656
|
|
|||
|
Foreign tax credit
|
8,472
|
|
8,917
|
|
|||
|
Other
|
11,748
|
|
14,269
|
|
|||
|
Gross deferred tax assets
|
41,767
|
|
56,734
|
|
|||
|
Less: Valuation allowance
|
(13,830
|
)
|
(14,053
|
)
|
|||
|
Total net deferred tax assets
|
27,937
|
|
42,681
|
|
|||
|
Deferred tax liabilities
|
|||||||
|
LIFO reserve
|
(19,727
|
)
|
(25,833
|
)
|
|||
|
Amortizable intangibles
|
(84,778
|
)
|
(133,037
|
)
|
|||
|
Goodwill
|
(41,635
|
)
|
(61,108
|
)
|
|||
|
Property, plant, equipment
|
(33,376
|
)
|
(14,389
|
)
|
|||
|
Total deferred tax liabilities
|
(179,516
|
)
|
(234,367
|
)
|
|||
|
Deferred net long-term income tax liability
|
$
|
(151,579
|
)
|
$
|
(191,686
|
)
|
|
At
April 28, 2018
, we had a U.S. foreign tax credit asset that will expire in
eight years
. In addition, we have deferred tax assets which would give rise to tax capital losses if triggered in the future. These losses have a
five
year carryforward period and can only be used against capital gain income. At this time, we believe that it is more likely than not that the foreign tax credit and capital loss carryforward attributes totaling
$13,830
will not be fully utilized prior to expiration. As a result, a full valuation allowance has been established against these assets.
In fiscal 2016, we approved a one-time repatriation of approximately
$200,000
of foreign earnings. This one-time repatriation reduced the overall cost of funding the acquisition of Animal Health International, Inc. In addition, certain foreign cash at Patterson Medical was required to be repatriated as part of the sale transaction. The continuing operations tax impact of
$12,300
from the repatriation was recorded in fiscal 2016. During fiscal 2017, we recorded a
$2,406
benefit related to a change in estimate of the tax impact of the cash repatriation. In addition, during the fourth quarter of fiscal 2018, and directly connected to the transition tax legislation, the Company approved a one-time repatriation of cash included in the transition tax computation. There was an approximate
$1,217
one-time cost recorded to reflect the added withholding tax cost associated with this repatriation
.
We have previously asserted that
64
our foreign earnings are permanently reinvested. Except for the repatriations described above, there is no change in our on-going assertion.
Income tax expense varies from the amount computed using the U.S. statutory rate. The reasons for this difference and the related tax effects are shown below:
|
Fiscal Year Ended
|
|||||||||||
|
April 28,
2018 |
April 29,
2017 |
April 30,
2016 |
|||||||||
|
Tax at U.S. statutory rate
|
$
|
54,674
|
|
$
|
87,807
|
|
$
|
105,593
|
|
||
|
State tax provision, net of federal benefit
|
4,650
|
|
5,217
|
|
7,364
|
|
|||||
|
Effect of foreign taxes
|
(186
|
)
|
(2,602
|
)
|
(1,195
|
)
|
|||||
|
Permanent differences
|
(4,219
|
)
|
(6,861
|
)
|
(3,693
|
)
|
|||||
|
Tax on dividends, net of foreign tax credit
|
—
|
|
(2,406
|
)
|
12,300
|
|
|||||
|
Tax reform
|
(76,648
|
)
|
—
|
|
—
|
|
|||||
|
Other
|
18
|
|
(4,062
|
)
|
(4,360
|
)
|
|||||
|
Income tax expense (benefit)
|
$
|
(21,711
|
)
|
$
|
77,093
|
|
$
|
116,009
|
|
||
We have accounted for the uncertainty in income taxes recognized in the financial statements in accordance with ASC Topic 740, “Income Taxes”. This standard clarifies the separate identification and reporting of estimated amounts that could be assessed upon audit. The potential assessments are considered unrecognized tax benefits, because, if it is ultimately determined they are unnecessary, the reversal of these previously recorded amounts will result in a beneficial impact to our financial statements.
As of
April 28, 2018
and
April 29, 2017
, Patterson’s gross unrecognized tax benefits were
$14,227
and
$14,211
, respectively. If determined to be unnecessary, these amounts (net of deferred tax assets of
$2,418
and
$3,883
, respectively, related to the tax deductibility of the gross liabilities) would decrease our effective tax rate. The gross unrecognized tax benefits are included in other long-term liabilities on the consolidated balance sheet.
A summary of the changes in the gross amounts of unrecognized tax benefits for the years ended
April 28, 2018
and
April 29, 2017
is shown below:
|
April 28,
2018 |
April 29,
2017 |
||||||
|
Balance at beginning of period
|
$
|
14,211
|
|
$
|
13,560
|
|
|
|
Additions for tax positions related to the current year
|
1,713
|
|
1,900
|
|
|||
|
Additions for tax positions of prior years
|
232
|
|
418
|
|
|||
|
Reductions for tax positions of prior years
|
(475
|
)
|
(194
|
)
|
|||
|
Statute expirations
|
(1,284
|
)
|
(1,145
|
)
|
|||
|
Settlements
|
(170
|
)
|
(328
|
)
|
|||
|
Balance at end of period
|
$
|
14,227
|
|
$
|
14,211
|
|
|
We also recognize both interest and penalties with respect to unrecognized tax benefits as a component of income tax expense. As of
April 28, 2018
and
April 29, 2017
, we had recorded
$1,764
and
$1,568
, respectively, for interest and penalties. These amounts are also included in other long-term liabilities on the consolidated balance sheet. These amounts, net of related deferred tax assets, if determined to be unnecessary, would decrease our effective tax rate. During the year ended
April 28, 2018
, we recorded as part of tax expense
$428
related to an increase in our estimated liability for interest and penalties.
Patterson files income tax returns, including returns for our subsidiaries, with federal, state, local and foreign jurisdictions. During fiscal 2018, the Internal Revenue Service (“IRS”) concluded an audit of fiscal years ended April 25, 2015 and April 30, 2016. During fiscal 2016, the IRS completed an audit of our fiscal years ended April 27, 2013 and April 27, 2014. The outcome of these audits did not have a material adverse impact on our financial statements. The IRS has either examined or waived examination for all periods up to and including our fiscal year ended April 30, 2016, resulting in these periods being closed. In addition to the IRS, periodically, state, local and foreign income tax returns are examined by various taxing authorities. We do not believe that the outcome of these various examinations will have a material adverse impact on our financial statements.
65
12. Segment and Geographic Data
We present
three
reportable segments: Dental, Animal Health and Corporate. Dental and Animal Health are strategic business units that offer similar products and services to different customer bases. Dental provides a virtually complete range of consumable dental products, equipment and software, turnkey digital solutions and value-added services to dentists, dental laboratories, institutions, and other healthcare professionals throughout North America. Animal Health is a leading, full-line distributor in North America and the U.K. of animal health products, services and technologies to both the production-animal and companion-pet markets. Our Corporate segment is comprised of general and administrative expenses, including home office support costs in areas such as information technology, finance, legal, human resources and facilities. In addition, customer financing and other miscellaneous sales are reported within Corporate results. Corporate assets consist primarily of cash and cash equivalents, accounts receivable, property and equipment and long-term receivables. We evaluate segment performance based on operating income. The costs to operate the fulfillment centers are allocated to the operating units based on the through-put of the unit.
The following tables present information about our reportable segments:
|
Fiscal Year Ended
|
|||||||||||
|
April 28,
2018 |
April 29,
2017 |
April 30,
2016 |
|||||||||
|
Net sales
|
|||||||||||
|
Dental
|
$
|
2,196,078
|
|
$
|
2,390,219
|
|
$
|
2,476,234
|
|
||
|
Animal Health
|
3,242,564
|
|
3,159,826
|
|
2,862,249
|
|
|||||
|
Corporate
|
27,041
|
|
43,082
|
|
48,220
|
|
|||||
|
Consolidated net sales
|
$
|
5,465,683
|
|
$
|
5,593,127
|
|
$
|
5,386,703
|
|
||
|
Operating income (loss)
|
|||||||||||
|
Dental
|
$
|
229,201
|
|
$
|
263,671
|
|
$
|
312,176
|
|
||
|
Animal Health
|
78,058
|
|
88,132
|
|
94,318
|
|
|||||
|
Corporate
|
(87,370
|
)
|
(63,875
|
)
|
(58,781
|
)
|
|||||
|
Consolidated operating income
|
$
|
219,889
|
|
$
|
287,928
|
|
$
|
347,713
|
|
||
|
Depreciation and amortization
|
|||||||||||
|
Dental
|
$
|
7,435
|
|
$
|
11,840
|
|
$
|
18,903
|
|
||
|
Animal Health
|
50,892
|
|
50,144
|
|
44,243
|
|
|||||
|
Corporate
|
25,489
|
|
21,834
|
|
19,237
|
|
|||||
|
Consolidated depreciation and amortization
|
$
|
83,816
|
|
$
|
83,818
|
|
$
|
82,383
|
|
||
|
April 28,
2018 |
April 29,
2017 |
||||||||||
|
Total assets
|
|||||||||||
|
Dental
|
$
|
853,555
|
|
$
|
863,970
|
|
|||||
|
Animal Health
|
2,128,800
|
|
2,119,512
|
|
|||||||
|
Corporate
|
489,309
|
|
524,431
|
|
|||||||
|
Total assets
|
$
|
3,471,664
|
|
$
|
3,507,913
|
|
|||||
The following table presents sales information by product for all of our reportable segments:
66
|
Fiscal Year Ended
|
|||||||||||
|
April 28,
2018 |
April 29,
2017 |
April 30,
2016 |
|||||||||
|
Consolidated
|
|||||||||||
|
Consumable
|
$
|
4,415,643
|
|
$
|
4,400,888
|
|
$
|
4,153,921
|
|
||
|
Equipment and software
|
709,253
|
|
834,526
|
|
857,001
|
|
|||||
|
Other
|
340,787
|
|
357,713
|
|
375,781
|
|
|||||
|
Total
|
$
|
5,465,683
|
|
$
|
5,593,127
|
|
$
|
5,386,703
|
|
||
|
Dental
|
|||||||||||
|
Consumable
|
$
|
1,251,642
|
|
$
|
1,321,764
|
|
$
|
1,378,886
|
|
||
|
Equipment and software
|
660,355
|
|
780,868
|
|
806,993
|
|
|||||
|
Other
|
284,081
|
|
287,587
|
|
290,355
|
|
|||||
|
Total
|
$
|
2,196,078
|
|
$
|
2,390,219
|
|
$
|
2,476,234
|
|
||
|
Animal Health
|
|||||||||||
|
Consumable
|
$
|
3,164,001
|
|
$
|
3,079,124
|
|
$
|
2,775,035
|
|
||
|
Equipment and software
|
48,898
|
|
53,658
|
|
50,008
|
|
|||||
|
Other
|
29,665
|
|
27,044
|
|
37,206
|
|
|||||
|
Total
|
$
|
3,242,564
|
|
$
|
3,159,826
|
|
$
|
2,862,249
|
|
||
|
Corporate
|
|||||||||||
|
Other
|
27,041
|
|
43,082
|
|
48,220
|
|
|||||
|
Total
|
$
|
27,041
|
|
$
|
43,082
|
|
$
|
48,220
|
|
||
The following tables present information by geographic area. There were no material sales between geographic areas.
|
Fiscal Year Ended
|
|||||||||||
|
April 28,
2018 |
April 29,
2017 |
April 30,
2016 |
|||||||||
|
Net sales
|
|||||||||||
|
United States
|
$
|
4,537,326
|
|
$
|
4,725,322
|
|
$
|
4,457,254
|
|
||
|
United Kingdom
|
583,057
|
|
547,968
|
|
626,603
|
|
|||||
|
Canada
|
345,300
|
|
319,837
|
|
302,846
|
|
|||||
|
Total
|
$
|
5,465,683
|
|
$
|
5,593,127
|
|
$
|
5,386,703
|
|
||
|
April 28,
2018 |
April 29,
2017 |
||||||||||
|
Property and equipment, net
|
|||||||||||
|
United States
|
$
|
278,508
|
|
$
|
286,178
|
|
|||||
|
United Kingdom
|
1,773
|
|
1,947
|
|
|||||||
|
Canada
|
10,309
|
|
10,327
|
|
|||||||
|
Total
|
$
|
290,590
|
|
$
|
298,452
|
|
|||||
13. Stockholders’ Equity
Dividends
The following table presents our declared and paid cash dividends per share on our common stock for the past three years. Dividends were declared and paid in the same period. We expect to continue paying a quarterly cash dividend into the foreseeable future.
67
|
Quarter
|
|||||||||||||||
|
Fiscal year
|
1
|
2
|
3
|
4
|
|||||||||||
|
2018
|
$
|
0.26
|
|
$
|
0.26
|
|
$
|
0.26
|
|
$
|
0.26
|
|
|||
|
2017
|
0.24
|
|
0.24
|
|
0.24
|
|
0.26
|
|
|||||||
|
2016
|
0.22
|
|
0.22
|
|
0.22
|
|
0.24
|
|
|||||||
Share Repurchases
During fiscal
2018
, we repurchased and retired
2,147
shares of our common stock for
$87,500
, or an average of
$40.75
per share. During fiscal
2017
, we repurchased and retired
2,855
shares of our common stock for
$125,384
, or an average of
$43.91
per share. During fiscal
2016
, we repurchased and retired
4,379
shares of our common stock for
$200,000
, or an average of
$45.68
per share.
On March 13, 2018, the Board of Directors authorized a new
$500,000
share repurchase program through March 13, 2021. The new repurchase program replaced the remaining authorization from our March 2013 plan to purchase up to
25,000
shares, which was scheduled to expire on March 19, 2018. As of
April 28, 2018
,
$500,000
remains available under the current repurchase authorization.
Employee Stock Ownership Plan ("ESOP")
During 1990, Patterson’s Board of Directors adopted a leveraged ESOP. In fiscal 1991, under the provisions of the plan and related financing arrangements, Patterson loaned the ESOP
$22,000
(the “1990 note”) for the purpose of acquiring its then outstanding preferred stock, which was subsequently converted to common stock. The Board of Directors determines the contribution from the Company to the ESOP annually. The contribution is used to retire a portion of the debt, which triggers a release of shares that are then allocated to the employee participants. Shares of stock acquired by the plan are allocated to each participant who has completed
1000 hours
of service during the plan year. In fiscal 2011, the final payment on the 1990 note was made and all remaining shares were released for allocation to participants.
In fiscal 2002, Patterson’s ESOP and an ESOP sponsored by the Thompson Dental Company (“Thompson”) were used to facilitate the acquisition and merger of Thompson into Patterson. The net result of this transaction was an additional loan of
$12,612
being made to the ESOP and the ESOP acquiring
666
shares of common stock. The loan bears interest at current rates but principal did not begin to amortize until fiscal 2012. Beginning in fiscal 2012 and through fiscal 2020, an annual payment of
$200
plus interest is due and in fiscal 2020, a final payment of any outstanding principal and interest balance is due. Prepayments of principal can be made at any time without penalty. Of the
666
shares issued in the transaction,
98
were previously allocated to Thompson employees. The remaining
568
shares began to be allocated in fiscal 2004 as interest was paid on the loan.
In September 2006, we entered into a third loan agreement with the ESOP and loaned
$105,000
(the “2006 note”) for the sole purpose of enabling the ESOP to purchase shares of our common stock. The ESOP purchased
3,160
shares with the proceeds from the 2006 note. Interest on the unpaid principal balance accrues at a rate equal to six-month LIBOR, with the rate resetting semi-annually. Interest payments were not required during the period from and including September 11, 2006 through April 30, 2010. On April 30, 2010, accrued and unpaid interest was added to the outstanding principal balance under the note, with interest thereafter accruing on the increased principal amount. Unpaid interest accruing after April 30, 2010 is due and payable on each successive April 30 occurring through September 10, 2026. Principal payments aren't due until September 10, 2026; however, prepayments can be made without penalty. In fiscal 2012, Patterson contributed
$20,214
to the ESOP, which then purchased
844
shares for allocation to the participants. No shares secured by the 2006 note were released prior to fiscal 2011.
At
April 28, 2018
, a total of
9,303
shares of common stock that have been allocated to participants remained in the ESOP and had a fair market value of
$216,567
. Related to the shares from the Thompson transaction, committed-to-be-released shares were
13
and suspense shares were
411
. Finally, with respect to the 2006 note, committed-to-be-released shares were
483
and suspense shares were
1,282
.
Unearned ESOP shares are not considered outstanding for the computation of earnings per share until the shares are committed for release to the participants. During fiscal
2018
,
2017
and
2016
, the compensation expense recognized related to the ESOP was
$18,132
,
$1,315
and
$11,953
, respectively.
We anticipate the allocation of the remaining suspense, or unearned, shares to occur over a period of approximately
5
to
10 years
. As of
April 28, 2018
, the fair value of all unearned shares held by the ESOP was
$40,220
. We will
68
recognize an income tax deduction as the unearned ESOP shares are released. Such deductions will be limited to the ESOP’s original cost to acquire the shares.
Dividends on allocated shares are passed through to the ESOP participants. Dividends on unallocated shares are used by the ESOP to make debt service payments on the notes due to Patterson.
14. Stock-based Compensation
The consolidated statements of income and other comprehensive income for fiscal
2018
,
2017
and
2016
include pre-tax (after-tax) stock-based compensation expense of
$18,400
(
$13,037
),
$17,710
(
$11,910
) and
$16,898
(
$11,120
). Pre-tax expense is included in operating expenses within the consolidated statements of income and other comprehensive income.
As of
April 28, 2018
, the total unrecognized compensation cost related to non-vested awards was
$30,276
, and it is expected to be recognized over a weighted average period of approximately
1.8
years.
2015 Omnibus Incentive Plan
In September 2015, our shareholders approved the 2015 Omnibus Incentive Plan ("Incentive Plan"). The aggregate number of shares of common stock that may be issued is
4,000
. The Incentive Plan authorizes various award types to be issued under the plan, including stock options, restricted stock awards, restricted stock units, stock appreciation rights, performance awards, non-employee director awards, cash-based awards and other stock-based awards. We issue new shares for stock option exercises, restricted stock award grants and also for vesting of restricted stock units and performance stock units. Awards that expire or are canceled without delivery of shares generally become available for reissuance under the plan.
At
April 28, 2018
, there were
2,115
shares available for awards under the Incentive Plan.
As a result of the approval of the Incentive Plan, awards are no longer granted under any prior equity incentive plan, but all outstanding awards previously granted under such prior plans will remain outstanding and subject to the terms of such prior plans. At
April 28, 2018
, there were
1,202
shares outstanding under prior plans.
Inducement Award
On December 1, 2017, we issued a restricted stock unit award outside our Incentive Plan to our Chief Executive Officer. The award covers
56
shares of common stock and will vest, assuming continued employment, to the extent of
50%
of the award on the first anniversary of the date of grant and the remaining
50%
of the award on the second anniversary of the date of grant.
Stock Option Awards
Stock options granted to employees expire no later than
ten years
after the date of grant. Awards typically vest over
three
or
five years
.
The fair value of stock options granted was estimated as of the grant date using a Black-Scholes option-pricing model with the following assumptions:
|
Fiscal Year Ended
|
|||||||||||
|
April 28,
2018 |
April 29,
2017 |
April 30,
2016 |
|||||||||
|
Expected dividend yield
|
2.2
|
%
|
2.0
|
%
|
1.8
|
%
|
|||||
|
Expected stock price volatility
|
21.6
|
%
|
21.2
|
%
|
25.6
|
%
|
|||||
|
Risk-free interest rate
|
1.9
|
%
|
1.2
|
%
|
2.1
|
%
|
|||||
|
Expected life (years)
|
6.6
|
|
6.6
|
|
6.7
|
|
|||||
|
Weighted average grant date fair value per share
|
$
|
8.18
|
|
$
|
8.32
|
|
$
|
9.66
|
|
||
69
The following is a summary of stock option activity:
|
Number
of
Options
|
Weighted-
Average
Exercise
Price
|
Aggregate Intrinsic
Value
|
||||||||
|
Balance as of April 29, 2017
|
1,192
|
|
$
|
52.12
|
|
|||||
|
Granted
|
200
|
|
44.09
|
|
||||||
|
Exercised
|
(9
|
)
|
36.71
|
|
||||||
|
Canceled
|
(177
|
)
|
52.90
|
|
||||||
|
Balance as of April 28, 2018
|
1,206
|
|
$
|
50.82
|
|
$
|
31
|
|
||
|
Vested or expected to vest as of April 28, 2018
|
914
|
|
$
|
49.64
|
|
$
|
31
|
|
||
|
Exercisable as of April 28, 2018
|
87
|
|
$
|
37.38
|
|
$
|
31
|
|
||
The weighted average remaining contractual lives of options outstanding and options exercisable as of
April 28, 2018
were
7.4
and
5.0
years, respectively.
Related to stock options exercised, the intrinsic value, cash received and tax benefits realized were
$88
,
$324
and
$3
, respectively, in fiscal
2018
;
$266
,
$958
and
$36
, respectively, in fiscal
2017
; and
$901
,
$3,173
and
$854
, respectively, in fiscal
2016
.
Restricted Stock
Restricted stock awards and restricted stock units granted to employees generally vest over a
five
,
seven
or
nine
year period. Certain restricted stock awards, which are held by branch managers, are subject to accelerated vesting provisions beginning
three
years after the grant date, based on certain operating goals. Restricted stock awards are also granted to non-employee directors annually and vest over
one
or
three years
. The grant date fair value of restricted stock awards and restricted stock units is based on the closing stock price on the day of the grant. The total fair value of restricted stock awards and restricted stock units that vested in fiscal
2018
,
2017
and
2016
was
$6,939
,
$8,528
and
$19,805
, respectively.
The following is a summary of restricted stock award activity:
|
Restricted Stock Awards
|
||||||
|
Shares
|
Weighted-
Average
Grant Date
Fair Value
|
|||||
|
Outstanding at April 29, 2017
|
479
|
|
$
|
38.41
|
|
|
|
Granted
|
24
|
|
37.94
|
|
||
|
Vested
|
(132
|
)
|
34.69
|
|
||
|
Forfeitures
|
(67
|
)
|
37.80
|
|
||
|
Outstanding at April 28, 2018
|
304
|
|
$
|
40.13
|
|
|
The following is a summary of restricted stock unit activity:
|
Restricted Stock Units
|
||||||
|
Shares
|
Weighted-
Average Grant Date Fair Value |
|||||
|
Outstanding at April 29, 2017
|
304
|
|
$
|
47.50
|
|
|
|
Granted
|
330
|
|
44.48
|
|
||
|
Vested
|
(43
|
)
|
47.19
|
|
||
|
Forfeitures
|
(50
|
)
|
46.80
|
|
||
|
Outstanding at April 28, 2018
|
541
|
|
$
|
45.74
|
|
|
Performance Unit Awards
70
In fiscal 2018, 2017 and 2016, we granted performance unit awards with a market-based condition to certain executives. The number of shares to be received at vesting will range from
0%
-
200%
of the target number of stock units based on Patterson's total shareholder return ("TSR") relative to the performance of companies in the S&P Midcap 400 Index measured over a
three
year period. We estimate the grant date fair value of the TSR awards using the Monte Carlo valuation model. In fiscal 2015, we granted performance unit awards, primarily to executive management, which are earned at the end of a
three
year period if certain operating goals are met. Accordingly, we recognize expense over the requisite service period based on the outcome that is probable for these awards.
No
performance unit awards vested in fiscal 2018 or 2017. The total fair value of performance unit awards that vested in fiscal 2016 was
$2,966
.
The following is a summary of performance unit award activity at target:
|
Performance Unit Awards
|
||||||
|
Shares
|
Weighted-
Average
Grant Date
Fair Value
|
|||||
|
Outstanding at April 29, 2017
|
230
|
|
$
|
50.88
|
|
|
|
Granted
|
102
|
|
45.86
|
|
||
|
Vested
|
—
|
|
—
|
|
||
|
Forfeitures and cancellations
|
(96
|
)
|
43.67
|
|
||
|
Outstanding at April 28, 2018
|
236
|
|
$
|
51.66
|
|
|
Employee Stock Purchase Plan ("ESPP")
We sponsor an ESPP under which a total of
6,750
shares have been reserved for purchase by employees. Eligible employees may purchase shares at
85%
of the lower of the fair market value of our common stock on the beginning of the annual offering period, or on the end of each quarterly purchase period, which occur on March 31, June 30, September 30 and December 31. The offering periods begin on January 1 of each calendar year and end on December 31 of each calendar year. At
April 28, 2018
, there were
670
shares available for purchase under the ESPP.
We estimate the grant date fair value of shares purchased under our ESPP using the Black-Scholes option pricing valuation model with the following weighted average assumptions:
|
Fiscal Year Ended
|
|||||||||||
|
April 28,
2018 |
April 29,
2017 |
April 30,
2016 |
|||||||||
|
Expected dividend yield
|
2.8
|
%
|
2.3
|
%
|
2.0
|
%
|
|||||
|
Expected stock price volatility
|
28.1
|
%
|
32.9
|
%
|
21.1
|
%
|
|||||
|
Risk-free interest rate
|
1.7
|
%
|
0.7
|
%
|
0.5
|
%
|
|||||
|
Expected life (years)
|
0.6
|
|
0.6
|
|
0.6
|
|
|||||
|
Weighted average grant date fair value per share
|
$
|
8.73
|
|
$
|
10.33
|
|
$
|
9.16
|
|
||
Capital Accumulation Plan ("CAP")
We also sponsor an employee CAP. A total of
6,000
shares of common stock are reserved for issuance under the CAP. Key employees of Patterson are eligible to participate by purchasing common stock through payroll deductions at
75%
of the price of the common stock at the beginning of or the end of the calendar year, whichever is lower. The shares issued are restricted stock and are held in the custody of Patterson until the restrictions lapse. The restriction period is typically
three
years from the beginning of the plan year, and shares are subject to forfeiture provisions. At
April 28, 2018
,
1,835
shares were available for purchase under the CAP.
71
We estimate the grant date fair value of shares purchased under our CAP using the Black-Scholes option pricing valuation model with the following weighted average assumptions:
|
Fiscal Year Ended
|
|||||||||||
|
April 28,
2018 |
April 29,
2017 |
April 30,
2016 |
|||||||||
|
Expected dividend yield
|
2.8
|
%
|
2.3
|
%
|
2.0
|
%
|
|||||
|
Expected stock price volatility
|
24.4
|
%
|
28.3
|
%
|
19.7
|
%
|
|||||
|
Risk-free interest rate
|
1.8
|
%
|
0.9
|
%
|
0.6
|
%
|
|||||
|
Expected life (years)
|
1.0
|
|
1.0
|
|
1.0
|
|
|||||
|
Weighted average grant date fair value per share
|
$
|
12.98
|
|
$
|
15.21
|
|
$
|
14.13
|
|
||
15. Litigation
In September 2015, we were served with a summons and complaint in an action commenced in the U.S. District Court for the Eastern District of New York, entitled SourceOne Dental, Inc. v. Patterson Companies, Inc., Henry Schein, Inc. and Benco Dental Supply Company, Civil Action No. 15-cv-05440-JMA-GRB. SourceOne, as plaintiff, alleges that, through its website, it markets and sells dental supplies and equipment to dentists. SourceOne alleges in the complaint, among other things, that we, along with the defendants Henry Schein and Benco, conspired to eliminate plaintiff as a competitor and to exclude them from the market for the marketing, distribution and sale of dental supplies and equipment in the U.S. and that defendants unlawfully agreed with one another to boycott dentists, manufacturers, and state dental associations that deal with, or considered dealing with, plaintiff. Plaintiff asserts the following claims: (i) unreasonable restraint of trade in violation of state and federal antitrust laws; (ii) tortious interference with prospective business relations; (iii) civil conspiracy; and (iv) aiding and abetting the other defendants’ ongoing tortious and anticompetitive conduct. Plaintiff seeks equitable relief, compensatory and treble damages, jointly and severally, punitive damages, interest, and reasonable costs and expenses, including attorneys’ fees and expert fees. In June 2017, Henry Schein settled with SourceOne and was dismissed from this litigation with prejudice. We are vigorously defending ourselves in this litigation. We do not anticipate that this matter will have a material adverse effect on our financial statements.
Beginning in January 2016, purported antitrust class action complaints were filed against defendants Henry Schein, Inc., Benco Dental Supply Company and Patterson Companies, Inc. Although there were factual and legal variations among these complaints, each alleged that defendants conspired to foreclose and exclude competitors by boycotting manufacturers, state dental associations, and others that deal with defendants’ competitors. On February 9, 2016, the U.S. District Court for the Eastern District of New York ordered all of these actions, and all other actions filed thereafter asserting substantially similar claims against defendants, consolidated for pre-trial purposes. On February 26, 2016, a consolidated class action complaint was filed by Arnell Prato, D.D.S., P.L.L.C., d/b/a Down to Earth Dental, Evolution Dental Sciences, LLC, Howard M. May, DDS, P.C., Casey Nelson, D.D.S., Jim Peck, D.D.S., Bernard W. Kurek, D.M.D., Larchmont Dental Associates, P.C., and Keith Schwartz, D.M.D., P.A. (collectively, “putative class representatives”) in the U.S. District Court for the Eastern District of New York, entitled In re Dental Supplies Antitrust Litigation, Civil Action No. 1:16-CV-00696-BMC-GRB. Subject to certain exclusions, the putative class representatives seek to represent all persons who purchased dental supplies or equipment in the U.S. directly from any of the defendants, since August 31, 2008. In the consolidated class action complaint, putative class representatives allege a nationwide agreement among Henry Schein, Benco, Patterson and non-party Burkhart Dental Supply Company, Inc. not to compete on price. The consolidated class action complaint asserts a single count under Section 1 of the Sherman Act, and seeks equitable relief, compensatory and treble damages, jointly and severally, interest, and reasonable costs and expenses, including attorneys’ fees and expert fees. While the outcome of litigation is inherently uncertain, we believe the consolidated class action complaint is without merit, and we are vigorously defending ourselves in this litigation.
On August 31, 2012, Archer and White Sales, Inc. (“Archer”) filed a complaint against Henry Schein, Inc. as well as Danaher Corporation and its subsidiaries Instrumentarium Dental, Inc., Dental Equipment, LLC, Kavo Dental Technologies, LLC and Dental Imaging Technologies Corporation (collectively, the “Danaher Defendants”) in the United States District Court for the Eastern District of Texas, Civil Action No. 2:12-CV-00572-JRG, styled as an antitrust action under Section 1 of the Sherman Act, and the Texas Free Enterprise Antitrust Act. Archer alleges a conspiracy between Henry Schein, an unnamed company and the Danaher Defendants to terminate or limit Archer’s distribution rights. On August 1, 2017, Archer filed an amended complaint, adding Patterson Companies, Inc. and Benco Dental Supply Company as defendants, and alleging that Henry Schein, Patterson, Benco and non-defendant Burkhart Dental Supply Company, Inc. conspired to pressure and agreed to enlist their common suppliers, including the Danaher Defendants, to join a price-fixing conspiracy and boycott by reducing the distribution territory of, and eventually terminating, Archer. Archer seeks injunctive relief, and damages in an amount to be proved at trial, to be trebled with interest and costs,
72
including attorneys’ fees, jointly and severally. On June 25, 2018, the United States Supreme Court granted certiorari to review an arbitration issue raised by the Danaher Defendants, thereby continuing the case stay implemented in March 2018. We are vigorously defending ourselves in this litigation. We do not anticipate that this matter will have a material adverse effect on our financial statements.
On August 17, 2017, IQ Dental Supply, Inc. (“IQ Dental”) filed a complaint in the United States District Court for the Eastern District of New York, entitled IQ Dental Supply, Inc. v. Henry Schein, Inc., Patterson Companies, Inc. and Benco Dental Supply Company, Case No. 2:17-cv-4834. Plaintiff alleges that it is a distributor of dental supplies and equipment, and sells dental products through an online dental distribution platform operated by SourceOne Dental, Inc. IQ Dental alleges, among other things, that defendants conspired to suppress competition from IQ Dental and SourceOne for the marketing, distribution and sale of dental supplies and equipment in the United States, and that defendants unlawfully agreed with one another to boycott dentists, manufacturers and state dental associations that deal with, or considered dealing with, plaintiff and SourceOne. Plaintiff claims that this alleged conduct constitutes unreasonable restraint of trade in violation of Section 1 of the Sherman Act, New York’s Donnelly Act and the New Jersey Antitrust Act, and also makes pendant state law claims for tortious interference with prospective business relations, civil conspiracy and aiding and abetting. Plaintiff seeks injunctive relief, compensatory, treble and punitive damages, jointly and severally, and reasonable costs and expenses, including attorneys’ fees and expert fees. On December 21, 2017, the District Court granted defendants motion to dismiss the complaint with prejudice. Plaintiff has appealed to the Fifth Circuit Court of Appeals. We are vigorously defending ourselves in this litigation. We do not anticipate that this matter will have a material adverse effect on our financial statements.
On February 12, 2018, the Federal Trade Commission (“FTC”) issued an administrative complaint entitled
In the Matter of Benco Dental Supply Co., Henry Schein, Inc., and Patterson Companies, Inc.
Docket No. 9379. The administrative complaint alleges “reason to believe” that Patterson and the other respondents violated Section 5 of the FTC Act, 15 U.S.C. § 45 by conspiring to refuse to offer discounted prices or otherwise negotiate with buying groups seeking to obtain supply agreements on behalf of groups of solo practitioners or small group dental practices. The administrative complaint seeks injunctive relief against Patterson, including an order to cease and desist from the conduct alleged in the complaint and a prohibition from conspiring or agreeing with any competitor or any person to refuse to provide discounts to or compete for the business of any customer. No money damages are sought. We are vigorously defending ourselves against the administrative complaint. The administrative complaint provides notice of an October 16, 2018 hearing in front of an Administrative Law Judge of the FTC in Washington, D.C. We do not anticipate this matter will have a material adverse effect on our financial statements.
On March 28, 2018, Plymouth County Retirement System (“Plymouth”) filed a federal securities class action complaint against Patterson and its former CEO Scott P. Anderson and former CFO Ann B. Gugino (together, the “Individual Defendants”) in the U.S. District Court for the District of Minnesota in a case captioned
Plymouth County Retirement System v. Patterson Companies, Inc., Scott P. Anderson and Ann B. Gugino
, Case No. 0:18-cv-008710 MJD/SER. On behalf of all persons or entities that purchased or otherwise acquired Patterson’s common stock between June 26, 2015 and February 28, 2018, Plymouth alleges that Patterson violated federal securities laws by “fail[ing] to disclose that [Patterson’s] revenue and earnings were fraudulently inflated by an illegal and fraudulent price-fixing scheme aimed at prohibiting sales to and price negotiations by GPOs [group purchasing organizations] that represented small and independent dental practices.” We vehemently deny these allegations. In its class action complaint, Plymouth asserts one count against Patterson for violating Section 10(b) of the Securities Exchange Act of 1934 and Rule 10b-5 promulgated thereunder and a second, related count against the Individual Defendants for violating Section 20(a) of the Exchange Act. Plymouth seeks compensatory damages, pre- and post-judgment interest and reasonable attorneys’ fees and experts’ witness fees and costs. Pursuant to an April 19, 2018 stipulated order, our obligation to answer, move or otherwise respond to the class action complaint is stayed pending the court’s entry of an order appointing lead plaintiffs in the litigation. While the outcome of litigation is inherently uncertain, we believe that the class action complaint is without merit, and we are vigorously defending ourselves in this litigation. We do not anticipate that this matter will have a material adverse effect on our financial statements.
From time to time, we may become a party to other legal proceedings, including, without limitation, product liability claims, intellectual property claims, employment matters, commercial disputes, governmental inquiries and investigations (which may in some cases involve our entering into settlement arrangements or consent decrees), and other matters arising out of the ordinary course of our business. While the results of any legal proceeding cannot be predicted with certainty, in our opinion none of these other pending matters is anticipated to have a material adverse effect on our financial statements.
73
16. Quarterly Results (unaudited)
Quarterly results are determined in accordance with the accounting policies used for annual data and include certain items based upon estimates for the entire year. All fiscal quarters include results for 13 weeks.
|
Quarter Ended
|
|||||||||||||||
|
April 28,
2018 |
January 27,
2018 (1) |
October 28,
2017 |
July 29,
2017 |
||||||||||||
|
Net sales
|
$
|
1,400,609
|
|
$
|
1,375,222
|
|
$
|
1,385,737
|
|
$
|
1,304,115
|
|
|||
|
Gross profit
|
289,839
|
|
294,736
|
|
315,743
|
|
299,048
|
|
|||||||
|
Operating income from continuing operations
|
41,251
|
|
50,046
|
|
71,759
|
|
56,833
|
|
|||||||
|
Net income from continuing operations
|
20,928
|
|
108,955
|
|
40,244
|
|
30,847
|
|
|||||||
|
Net income (loss) from discontinued operations
|
—
|
|
—
|
|
—
|
|
—
|
|
|||||||
|
Net income
|
$
|
20,928
|
|
$
|
108,955
|
|
$
|
40,244
|
|
$
|
30,847
|
|
|||
|
Basic earnings (loss) per share:
|
|||||||||||||||
|
Continuing operations
|
$
|
0.23
|
|
$
|
1.18
|
|
$
|
0.43
|
|
$
|
0.33
|
|
|||
|
Discontinued operations
|
—
|
|
—
|
|
—
|
|
—
|
|
|||||||
|
Net basic earnings per share
|
$
|
0.23
|
|
$
|
1.18
|
|
$
|
0.43
|
|
$
|
0.33
|
|
|||
|
Diluted earnings (loss) per share:
|
|||||||||||||||
|
Continuing operations
|
$
|
0.23
|
|
$
|
1.18
|
|
$
|
0.43
|
|
$
|
0.33
|
|
|||
|
Discontinued operations
|
—
|
|
—
|
|
—
|
|
—
|
|
|||||||
|
Net diluted earnings per share
|
$
|
0.23
|
|
$
|
1.18
|
|
$
|
0.43
|
|
$
|
0.33
|
|
|||
|
Quarter Ended
|
|||||||||||||||
|
April 29,
2017 |
January 28,
2017 (2) |
October 29,
2016 |
July 30,
2016 |
||||||||||||
|
Net sales
|
$
|
1,445,032
|
|
$
|
1,397,418
|
|
$
|
1,418,241
|
|
$
|
1,332,436
|
|
|||
|
Gross profit
|
335,498
|
|
329,761
|
|
318,960
|
|
317,178
|
|
|||||||
|
Operating income from continuing operations
|
96,155
|
|
46,554
|
|
79,803
|
|
65,416
|
|
|||||||
|
Net income from continuing operations
|
61,357
|
|
27,769
|
|
45,756
|
|
38,906
|
|
|||||||
|
Net income (loss) from discontinued operations
|
334
|
|
(3,229
|
)
|
—
|
|
—
|
|
|||||||
|
Net income
|
$
|
61,691
|
|
$
|
24,540
|
|
$
|
45,756
|
|
$
|
38,906
|
|
|||
|
Basic earnings (loss) per share:
|
|||||||||||||||
|
Continuing operations
|
$
|
0.65
|
|
$
|
0.29
|
|
$
|
0.48
|
|
$
|
0.41
|
|
|||
|
Discontinued operations
|
0.01
|
|
(0.03
|
)
|
—
|
|
—
|
|
|||||||
|
Net basic earnings per share
|
$
|
0.66
|
|
$
|
0.26
|
|
$
|
0.48
|
|
$
|
0.41
|
|
|||
|
Diluted earnings (loss) per share:
|
|||||||||||||||
|
Continuing operations
|
$
|
0.65
|
|
$
|
0.29
|
|
$
|
0.48
|
|
$
|
0.40
|
|
|||
|
Discontinued operations
|
—
|
|
(0.03
|
)
|
—
|
|
—
|
|
|||||||
|
Net diluted earnings per share
|
$
|
0.65
|
|
$
|
0.26
|
|
$
|
0.48
|
|
$
|
0.40
|
|
|||
|
(1)
|
In the third quarter of fiscal 2018, the Tax Act was enacted by the U.S. government. During this quarter, we recorded a provisional discrete net tax benefit of
$77,256
within net income from continuing operations. See Note 11 to the Consolidated Financial Statements for additional information.
|
|
(2)
|
In the third quarter of fiscal 2017, we recorded a pre-tax non-cash impairment charge of
$36,312
within operating income from continuing operations. See Note 3 to the Consolidated Financial Statements for additional information.
|
17. Accumulated Other Comprehensive Loss ("AOCL")
The following table summarizes the changes in AOCL as of
April 28, 2018
:
74
|
Cash Flow
Hedges
|
Currency
Translation
Adjustment
|
Total
|
|||||||||
|
AOCL at April 29, 2017
|
$
|
(14,989
|
)
|
$
|
(77,680
|
)
|
$
|
(92,669
|
)
|
||
|
Other comprehensive loss before reclassifications
|
—
|
|
15,824
|
|
15,824
|
|
|||||
|
Amounts reclassified from AOCL
|
1,871
|
|
—
|
|
1,871
|
|
|||||
|
AOCL at April 28, 2018
|
$
|
(13,118
|
)
|
$
|
(61,856
|
)
|
$
|
(74,974
|
)
|
||
The amounts reclassified from AOCL during fiscal
2018
represent gains and losses on cash flow hedges, net of taxes of
$938
. The impact to the consolidated statements of income and other comprehensive income was an increase to interest expense of
$2,809
.
None.
Evaluation of Disclosure Controls and Procedures
Under the supervision and with the participation of our management, including our Chief Executive Officer and our Chief Financial Officer, we evaluated the effectiveness of the design and operation of our disclosure controls and procedures pursuant to Rules 13a-15 and 15d-15 of the Securities and Exchange Act of 1934 (the “Exchange Act”). Based on that evaluation, the Chief Executive Officer and Chief Financial Officer concluded that our disclosure controls and procedures were effective as of
April 28, 2018
. Disclosure controls and procedures are defined by Rules 13a-15(e) and 15d-15(e) of the Exchange Act as controls and other procedures that are designed to ensure that information required to be disclosed by Patterson in reports filed with the SEC under the Exchange Act is recorded, processed, summarized and reported within the time periods specified in the SEC’s rules and forms. Disclosure controls and procedures include, without limitation, controls and procedures designed to ensure that information required to be disclosed in reports filed under the Exchange Act is accumulated and communicated to our management, including our principal executive and principal financial officers, or persons performing similar functions, as appropriate to allow timely decisions regarding required disclosure.
Management’s Annual Report on Internal Control Over Financial Reporting
The management of Patterson Companies, Inc. (the “Company”) is responsible for establishing and maintaining adequate internal control over financial reporting as defined in Rules 13a-15(f) and 15d-15(f) under the Securities Exchange Act of 1934. Our internal control system is designed to provide reasonable assurance to our management and Board of Directors regarding the reliability of financial reporting and the preparation of financial statements for external purposes in accordance with generally accepted accounting principles.
Under the supervision and with the participation of our management, including our principal executive officer and principal financial officer, we assessed the effectiveness of our internal control over financial reporting as of
April 28, 2018
, using the criteria set forth by the Committee of Sponsoring Organizations of the Treadway Commission (COSO) in
Internal Control - Integrated Framework
(2013)
.
Based on this assessment, management has concluded that our internal control over financial reporting was effective as of
April 28, 2018
. Ernst & Young LLP, the independent registered public accounting firm that audited our consolidated financial statements included in Item 8,
Financial Statements and Supplementary Data,
of this Annual Report on Form 10-K, has issued an unqualified report on our internal control over financial reporting.
75
|
/s/ Mark S. Walchirk
|
|
|
President and Chief Executive Officer
|
|
|
/s/ Dennis W. Goedken
|
|
|
Interim Chief Financial Officer and Treasurer
|
|
The report of our independent registered public accounting firm on internal control over financial reporting is included in Item 8 of this Annual Report on Form 10-K.
Changes in Internal Control Over Financial Reporting
There were no changes in our internal control over financial reporting (as defined in Rule 13a-15(f) and 15d-15(f) under the Exchange Act) that occurred during the quarter ended
April 28, 2018
that have materially affected, or are reasonably likely to materially affect, our internal control over financial reporting.
9B. OTHER INFORMATION
None.
76
Information regarding the directors of Patterson is incorporated herein by reference to the descriptions set forth under the caption “Proposal No. 1 Election of Directors” in Patterson’s Proxy Statement for its Annual Meeting of Shareholders to be held on September 17, 2018 (the “
2018
Proxy Statement”). Information regarding executive officers of Patterson is incorporated herein by reference to Item 1 of Part I of this Form 10-K under the caption “Executive Officers of the Registrant.” Information regarding compliance with Section 16(a) of the Securities Exchange Act of 1934 is incorporated herein by reference to the information set forth under the caption “Section 16(a) Beneficial Ownership Reporting Compliance” in the
2018
Proxy Statement. The information called for by Item 10, as to the audit committee and the audit committee financial expert, is set forth under the captions “Proposal No. 1 Election of Directors” and “Our Board of Directors and Committees” in the
2018
Proxy Statement and such information is incorporated by reference herein.
Code of Ethics
We have adopted Principles of Business Conduct and Code of Ethics for our Chief Executive Officer, Chief Financial Officer, Directors and all employees. Our Code of Ethics is available on our website (www.pattersoncompanies.com) under the section “Investor Relations – Corporate Governance.” We intend to satisfy the disclosure requirement of Form 8-K regarding an amendment to, or waiver from, a provision of our Code of Ethics by posting such information on our website at the address and location specified above.
Information regarding executive compensation is incorporated herein by reference to the information set forth under the caption “Executive Compensation” in the
2018
Proxy Statement. Information regarding director compensation is incorporated herein by reference to the information set forth under the caption “Non-Employee Director Compensation” in the
2018
Proxy Statement. Information regarding the compensation committee and its report is incorporated herein by reference to the information set forth under the caption “Our Board of Directors and Committees - Committee Responsibilities - Our Compensation Committee and Its Report” in the
2018
Proxy Statement.
Information regarding securities authorized for issuance under equity compensation plans is incorporated herein by reference to the information set forth under the caption “Equity Compensation Plan Information” in the
2018
Proxy Statement. Information regarding the security ownership of certain beneficial owners and management is incorporated herein by reference to the information set forth under the caption “Security Ownership of Certain Beneficial Owners and Management” in the
2018
Proxy Statement.
Information regarding transactions with related persons is incorporated herein by reference to the information set forth under the caption “Certain Relationships and Related Transactions” in the
2018
Proxy Statement. Information regarding director independence is incorporated herein by reference to the information set forth under the caption “Our Board of Directors and Committees” in the
2018
Proxy Statement.
Information relating to principal accounting fees and services and pre-approval policies and procedures is incorporated herein by reference to the information set forth under the caption “Proposal No. 4 Ratification of Selection of Independent Registered Public Accounting Firm – Principal Accountant Fees and Services” in the
2018
Proxy Statement.
77
(a)
1. Financial Statements.
The following Consolidated Financial Statements and supplementary data of Patterson and its subsidiaries are included in Part II, Item 8:
Reports of Independent Registered Public Accounting Firm
Consolidated Balance Sheets
Consolidated Statements of Income and Other Comprehensive Income
Consolidated Statement of Changes in Stockholders’ Equity
Consolidated Statements of Cash Flows
Notes to Consolidated Financial Statements
2. Financial Statement Schedules.
The following financial statement schedule is filed herewith: Schedule II – Valuation and Qualifying Accounts
Schedules other than that listed above have been omitted because they are not applicable or the required information is included in the financial statements or notes thereto.
3. Exhibits.
|
Exhibit
|
|
Document Description
|
|
3.1
|
|
|
|
3.2
|
|
|
|
4.1
|
|
|
|
10.1
|
|
|
|
10.2
|
|
|
|
10.3
|
|
|
|
10.4
|
|
|
|
10.5
|
|
|
|
10.6
|
|
|
|
10.7
|
|
|
|
10.8
|
|
|
|
10.9
|
|
|
78
|
10.10
|
|
|
|
10.11
|
|
|
|
10.12
|
||
|
10.13
|
|
|
|
10.14
|
|
|
|
10.15
|
|
|
|
10.16
|
|
|
|
10.17
|
|
|
|
10.18
|
|
|
|
10.19
|
|
|
|
10.20
|
|
|
|
10.21
|
|
|
|
10.22
|
|
|
|
10.23
|
|
|
|
10.24
|
|
|
|
10.25
|
||
79
|
10.26
|
||
|
10.27
|
||
|
10.28
|
||
|
10.29
|
||
|
10.30
|
||
|
10.31
|
||
|
10.32
|
||
|
10.33
|
||
|
10.34
|
||
|
18
|
|
|
|
21
|
|
|
|
23
|
|
|
|
31.1
|
|
|
|
31.2
|
|
|
|
32.1
|
|
|
|
32.2
|
|
|
|
101
|
|
(Filed Electronically) The following financial information from our Annual Report on Form 10-K for fiscal 2017, formatted in Extensible Business Reporting Language (XBRL): (i) the consolidated balance sheets, (ii) the consolidated statements of income, (iii) the consolidated statements of cash flows, (iv) the consolidated statements of changes in stockholders’ equity and (v) the notes to the consolidated financial statements.(*)
|
|
(*)
|
The XBRL related information in Exhibit 101 to this Annual Report on Form 10-K shall not be deemed “filed” for purposes of Section 18 of the Securities Exchange Act of 1934, as amended, or otherwise subject to liability of that section and shall not be incorporated by reference into any filing or other document pursuant to the Securities Act of 1933, as amended, except as shall be expressly set forth by specific reference in such filing or document.
|
|
**
|
Indicates management contract or compensatory plan or agreement.
|
(b) See Index to Exhibits.
(c) See Schedule II.
80
None.
81
SCHEDULE II
VALUATION AND QUALIFYING ACCOUNTS
PATTERSON COMPANIES, INC.
(In thousands)
|
Balance at
Beginning
of Period
|
Charged to
Costs and
Expenses
|
Charged
to Other
Accounts
|
Deductions
|
Balance at
End of
Period
|
|||||||||||||||
|
Year ended April 28, 2018
|
|||||||||||||||||||
|
Deducted from asset accounts:
|
|||||||||||||||||||
|
Allowance for doubtful accounts
|
$
|
9,342
|
|
$
|
6,280
|
|
$
|
—
|
|
$
|
6,085
|
|
$
|
9,537
|
|
||||
|
LIFO inventory adjustment
|
$
|
77,816
|
|
$
|
4,289
|
|
$
|
—
|
|
$
|
—
|
|
$
|
82,105
|
|
||||
|
Inventory obsolescence reserve
|
5,621
|
|
22,919
|
|
—
|
|
23,164
|
|
5,376
|
|
|||||||||
|
Total inventory reserve
|
$
|
83,437
|
|
$
|
27,208
|
|
$
|
—
|
|
$
|
23,164
|
|
$
|
87,481
|
|
||||
|
Year ended April 29, 2017
|
|||||||||||||||||||
|
Deducted from asset accounts:
|
|||||||||||||||||||
|
Allowance for doubtful accounts
|
$
|
12,008
|
|
$
|
1,825
|
|
$
|
—
|
|
$
|
4,491
|
|
$
|
9,342
|
|
||||
|
LIFO inventory adjustment
|
$
|
76,501
|
|
$
|
1,315
|
|
$
|
—
|
|
$
|
—
|
|
$
|
77,816
|
|
||||
|
Inventory obsolescence reserve
|
6,621
|
|
18,026
|
|
—
|
|
19,026
|
|
5,621
|
|
|||||||||
|
Total inventory reserve
|
$
|
83,122
|
|
$
|
19,341
|
|
$
|
—
|
|
$
|
19,026
|
|
$
|
83,437
|
|
||||
|
Year ended April 30, 2016
|
|||||||||||||||||||
|
Deducted from asset accounts:
|
|||||||||||||||||||
|
Allowance for doubtful accounts
|
$
|
7,678
|
|
$
|
8,246
|
|
$
|
1,947
|
|
$
|
5,863
|
|
$
|
12,008
|
|
||||
|
LIFO inventory adjustment
|
$
|
73,381
|
|
$
|
3,120
|
|
$
|
—
|
|
$
|
—
|
|
$
|
76,501
|
|
||||
|
Inventory obsolescence reserve
|
4,218
|
|
15,547
|
|
1,550
|
|
14,694
|
|
6,621
|
|
|||||||||
|
Total inventory reserve
|
$
|
77,599
|
|
$
|
18,667
|
|
$
|
1,550
|
|
$
|
14,694
|
|
$
|
83,122
|
|
||||
82
SIGNATURES
Pursuant to the requirements of section 13 or 15(d) of the Securities Exchange Act of 1934, the registrant has duly caused this report to be signed on its behalf by the undersigned, thereunto duly authorized.
|
PATTERSON COMPANIES, INC.
|
||||
|
Dated:
|
June 27, 2018
|
By
|
/s/ Mark S. Walchirk
|
|
|
Mark S. Walchirk
|
||||
|
President and Chief Executive Officer, Director
|
||||
Pursuant to the requirements of the Securities Exchange Act of 1934, this report has been signed below by the following persons on behalf of the registrant and in the capacities and on the dates indicated.
|
Date
|
||||
|
/s/ Mark S. Walchirk
|
President and Chief Executive Officer, Director
(Principal Executive Officer)
|
June 27, 2018
|
||
|
Mark S. Walchirk
|
||||
|
/s/ Dennis W. Goedken
|
Interim Chief Financial Officer and Treasurer (Principal Financial and Accounting Officer)
|
June 27, 2018
|
||
|
Dennis W. Goedken
|
||||
|
/s/ John D. Buck
|
Chairman of the Board
|
June 27, 2018
|
||
|
John D. Buck
|
||||
|
/s/ Alex N. Blanco
|
Director
|
June 27, 2018
|
||
|
Alex N. Blanco
|
||||
|
/s/ Jody H. Feragen
|
Director
|
June 27, 2018
|
||
|
Jody H. Feragen
|
||||
|
/s/ Robert C. Frenzel
|
Director
|
June 27, 2018
|
||
|
Robert C. Frenzel
|
||||
|
/s/ Francis J. Malecha
|
Director
|
June 27, 2018
|
||
|
Francis J. Malecha
|
||||
|
/s/ Ellen A. Rudnick
|
Director
|
June 27, 2018
|
||
|
Ellen A. Rudnick
|
||||
|
/s/ Neil A. Schrimsher
|
Director
|
June 27, 2018
|
||
|
Neil A. Schrimsher
|
||||
|
/s/ Les C. Vinney
|
Director
|
June 27, 2018
|
||
|
Les C. Vinney
|
||||
|
/s/ James W. Wiltz
|
Director
|
June 27, 2018
|
||
|
James W. Wiltz
|
||||
83
TABLE OF CONTENTS
Part IItem 1. BusinessItem 1A. Risk FactorsItem 1B. Unresolved Staff CommentsItem 2. PropertiesItem 3. Legal ProceedingsItem 4. Mine Safety DisclosuresPart IIItem 5. Market For Registrant S Common Equity, Related Stockholder Matters and Issuer Purchases Of Equity SecuritiesItem 6. Selected Consolidated Financial DataItem 7. Management S Discussion and Analysis Of Financial Condition and Results Of OperationsItem 7A. Quantitative and Qualitative Disclosures About Market RiskItem 8. Financial Statements and Supplementary DataItem 9. Changes in and Disagreements with Accountants on Accounting and Financial DisclosureItem 9A. Controls and ProceduresPart IIIItem 10. Directors, Executive Officers and Corporate GovernanceItem 11. Executive CompensationItem 12. Security Ownership Of Certain Beneficial Owners and Management and Related Stockholder MattersItem 13. Certain Relationships and Related Transactions, and Director IndependenceItem 14. Principal Accountant Fees and ServicesPart IVItem 15. Exhibits and Financial Statement SchedulesItem 16. Form 10-k Summary