PIEDMONT OFFICE REALTY TRUST, INC.
10-Ks and 10-Qs
|
|
|
|
|
|
|
|
|
|
|
|
|
|
|
|
|
|
|
|
|
|
|
|
|
|
|
|
|
|
|
|
|
|
|
|
|
|
|
|
|
|
|
|
|
|
|
|
|
|
|
|
|
|
|
|
UNITED STATES
SECURITIES AND EXCHANGE COMMISSION
Washington, D.C. 20549
_________________________________________________________
FORM 10-K
_________________________________________________________
(Mark One)
|
x
|
Annual report pursuant to Section 13 or 15(d) of the Securities Exchange Act of 1934
For the fiscal year ended December 31, 2011
|
or
|
o
|
Transition report pursuant to Section 13 or 15(d) of the Securities Exchange Act of 1934
For the transition period from to
to
|
Commission file number 001-34626
_________________________________________________________
PIEDMONT OFFICE REALTY TRUST, INC.
(Exact name of registrant as specified in its charter)
__________________________________________________________
|
Maryland
|
58-2328421
|
|
(State or other jurisdiction of incorporation or organization)
|
(I.R.S. Employer Identification Number)
|
|
11695 Johns Creek Parkway Ste. 350, Johns Creek, Georgia
|
30097
|
|
(Address of principal executive offices)
|
(Zip Code)
|
(770) 418-8800
Registrant’s telephone number, including area code
_________________________________________________________
Securities registered pursuant to Section 12 (b) of the Act:
|
Title of each class
|
Name of exchange on which registered
|
|
COMMON STOCK
|
NEW YORK STOCK EXCHANGE
|
Securities registered pursuant to Section 12 (g) of the Act:
None
(Title of Class)
Indicate by check mark if the registrant is a well-known seasoned issuer, as defined in Rule 405 of the Securities Act.
Yes
x
No
o
Indicate by check mark if the registrant is not required to file reports pursuant to Section 13 or Section 15(d) of the Act.
Yes
o
No
x
Indicate by check mark whether the registrant (1) has filed all reports required to be filed by Section 13 or 15(d) of the Securities Exchange Act of 1934 during the preceding 12 months (or for such shorter period that the registrant was required to file such reports), and (2) has been subject to such filing requirements for the past 90 days.
Yes
x
No
o
Indicate by check mark whether the registrant has submitted electronically and posted on its corporate Web site, if any, every Interactive Data File required to be submitted and posted pursuant to Rule 405 of Regulation S-T during the preceding 12 months (or for such shorter period that the registrant was required to submit and post such files).
Yes
x
No
o
Indicate by check mark if disclosure of delinquent filers pursuant to Item 405 of Regulation S-K is not contained herein, and will not be contained, to the best of registrant’s knowledge, in definitive proxy or information statements incorporated by reference in Part III of this Form 10-K or any amendment to this Form 10-K.
x
Indicate by check mark whether the registrant is a large accelerated filer, an accelerated filer, a non-accelerated filer, or a smaller reporting company (as defined in Rule 12b-2 of the Act).
Large accelerated filer
x
Accelerated filer
o
Non-accelerated filer
o
Smaller reporting company
o
Indicate by check mark whether the registrant is a shell company (as defined in Rule 12b-2 of the Exchange Act).
Yes
o
No
x
As of
June 30, 2011
, the aggregate market value of the common stock of Piedmont Office Realty Trust, Inc., held by non-affiliates was
$3,227,154,379
based on the closing price as reported on the New York Stock Exchange. As of
February 27, 2012
,
172,629,748
shares of common stock were outstanding.
Documents Incorporated by Reference:
Registrant incorporates by reference portions of the Piedmont Office Realty Trust, Inc. Definitive Proxy Statement for the 2012 Annual Meeting of Stockholders (Items 10, 11, 12, 13, and 14 of Part III) to be filed no later than
April 30, 2012
.
|
FORM 10-K
|
||||
|
PIEDMONT OFFICE REALTY TRUST, INC.
|
||||
|
TABLE OF CONTENTS
|
||||
|
PART I.
|
Page No.
|
|||
|
Item 1.
|
||||
|
Item 1A.
|
||||
|
Item 1B.
|
||||
|
Item 2.
|
||||
|
Item 3.
|
||||
|
Item 4.
|
||||
|
PART II.
|
||||
|
Item 5.
|
||||
|
Item 6.
|
||||
|
Item 7.
|
||||
|
Item 7A.
|
||||
|
Item 8.
|
||||
|
Item 9.
|
||||
|
Item 9A.
|
||||
|
Item 9B.
|
||||
|
PART III.
|
||||
|
Item 10.
|
||||
|
Item 11.
|
||||
|
Item 12.
|
||||
|
Item 13.
|
||||
|
Item 14.
|
||||
|
PART IV.
|
||||
|
Item 15.
|
||||
Certain statements contained in this Form 10-K and other written or oral statements made by or on behalf of Piedmont Office Realty Trust, Inc. (“Piedmont”) may constitute forward-looking statements within the meaning of the federal securities laws. In addition, Piedmont, or its executive officers on Piedmont’s behalf, may from time to time make forward-looking statements in reports and other documents Piedmont files with the Securities and Exchange Commission or in connection with oral statements made to the press, potential investors, or others. Statements regarding future events and developments and Piedmont’s future performance, as well as management’s expectations, beliefs, plans, estimates, or projections relating to the future, are forward-looking statements within the meaning of these laws. Forward-looking statements include statements preceded by, followed by, or that include the words “may,” “will,” “expect,” “intend,” “anticipate,” “estimate,” “believe,” “continue,” or other similar words. Examples of such statements in this report include descriptions of our real estate, financing, and operating objectives; discussions regarding future dividends; and discussions regarding the potential impact of economic conditions on our portfolio.
These statements are based on beliefs and assumptions of Piedmont’s management, which in turn are based on currently available information. Important assumptions relating to the forward-looking statements include, among others, assumptions regarding the demand for office space in the sectors in which Piedmont operates, competitive conditions, and general economic conditions. These assumptions could prove inaccurate. The forward-looking statements also involve risks and uncertainties, which could cause actual results to differ materially from those contained in any forward-looking statement. Many of these factors are beyond Piedmont’s ability to control or predict. Such factors include, but are not limited to, the following:
|
•
|
The success of our real estate strategies and investment objectives, including our ability to identify and consummate suitable acquisitions;
|
|
•
|
The demand for office space, rental rates and property values may continue to lag the general economic recovery causing our business, results of operations, cash flows, financial condition and access to capital to be adversely affected or otherwise impact performance, including the potential recognition of impairment charges;
|
|
•
|
Our $500 Million Unsecured Facility matures in 2012 and a failure to fully renew or replace this Facility could cause our business, results of operations, cash flows, financial condition and access to capital to be adversely affected;
|
|
•
|
Lease terminations or lease defaults, particularly by one of our large lead tenants;
|
|
•
|
The impact of competition on our efforts to renew existing leases or re-let space on terms similar to existing leases;
|
|
•
|
Changes in the economies and other conditions of the office market in general and of the specific markets in which we operate, particularly in Chicago, Washington, D.C., and the New York metropolitan area;
|
|
•
|
Economic and regulatory changes, including accounting standards, that impact the real estate market generally;
|
|
•
|
Additional risks and costs associated with directly managing properties occupied by government tenants;
|
|
•
|
Adverse market and economic conditions may continue to adversely affect us and could cause us to recognize impairment charges or otherwise impact our performance;
|
|
•
|
Availability of financing and our lending banks’ ability to honor existing line of credit commitments;
|
|
•
|
Costs of complying with governmental laws and regulations;
|
|
•
|
Uncertainties associated with environmental and other regulatory matters;
|
|
•
|
Potential changes in political environment and reduction in federal and/or state funding of our governmental tenants;
|
|
•
|
We are and may continue to be subject to litigation, which could have a material adverse effect on our financial condition;
|
|
•
|
Piedmont’s ability to continue to qualify as a REIT under the Internal Revenue Code (the “Code”); and
|
|
•
|
Other factors, including the risk factors discussed under Item 1A. of this Annual Report on Form 10-K.
|
Management believes these forward-looking statements are reasonable; however, undue reliance should not be placed on any forward-looking statements, which are based on current expectations. Further, forward-looking statements speak only as of the date they are made, and management undertakes no obligation to update publicly any of them in light of new information or future events.
1
General
Piedmont Office Realty Trust, Inc. (“Piedmont”) (NYSE: PDM) is a Maryland corporation that operates in a manner so as to qualify as a real estate investment trust (“REIT”) for federal income tax purposes and engages in the acquisition and ownership of commercial real estate properties throughout the United States, including properties that are under construction, are newly constructed, or have operating histories. Piedmont was incorporated in
1997
, commenced operations in
1998
, and listed its common stock on the New York Stock Exchange ("NYSE") in
February 2010
. Piedmont conducts business primarily through Piedmont Operating Partnership, L.P. (“Piedmont OP”), a Delaware limited partnership, as well as performing the management of its buildings through two wholly-owned subsidiaries, Piedmont Government Services, LLC and Piedmont Office Management, LLC. Piedmont is the sole general partner of Piedmont OP and possesses full legal control and authority over the operations of Piedmont OP. Piedmont OP owns properties directly, through wholly-owned subsidiaries and through both consolidated and unconsolidated joint ventures. References to Piedmont herein shall include Piedmont and all of its subsidiaries, including Piedmont OP and its subsidiaries and joint ventures.
Operating Objectives and Strategy
Based on its
December 31, 2011
equity market capitalization of
$2.9 billion
, Piedmont is the
fourth
largest office REIT in the United States based on comparison to the constituents of the Bloomberg U.S. Office REIT Index.
Our portfolio consists primarily of Class A commercial office buildings leased to large, credit-worthy, government and corporate tenants. As of
December 31, 2011
, approximately
82%
of our Annualized Lease Revenue (see "Information Regarding Disclosures Presented"
below) was derived from our office properties in the ten largest U.S. office markets based on rentable square footage, including premier office markets such as Chicago, Washington, D.C., the New York metropolitan area, Boston and greater Los Angeles.
For the past several years, we have been focused upon a strategy of repositioning our portfolio by reducing the number of markets we operate within and recycling the proceeds into existing key locations which we believe have the greatest potential to contribute to enterprise value over time. Since 2005 we have exited eighteen markets and plan to exit an additional eight over the next few years so that we are predominantly concentrated in the top ten markets mentioned above by 2015. We have a demonstrated capital allocation track record including transacting
$5.9 billion
and
$1.6 billion
in property acquisitions and dispositions, respectively, during our fourteen year operating history. Piedmont has maintained a low-leverage (typically around 30%) strategy which allows capacity for growth as transactional opportunities arise.
Headquartered in metropolitan Atlanta, Georgia, with local management offices in each of its major markets, Piedmont values operational excellence and was ranked fourth overall and second for REITs for number of buildings with Building Owners Management Association ("BOMA") 360 designations, a program that evaluates six major areas of building operations and management and benchmarks a building's performance against industry standards. The achievement of such a designation recognizes excellence in building operations and management. We also have focused on environmental sustainability initiatives at our properties, and approximately
72%
of our office portfolio (based on Annualized Lease Revenue) maintains Energy Star labels as of
December 31, 2011
.
We foster long-term relationships with our high-credit quality, diverse tenant base as evidenced by our
77%
tenant retention rate over the past six years. No tenant other than the U.S. government accounts for more than
6%
of our Annualized Lease Revenue and
70%
of our Annualized Lease Revenue is derived from investment grade companies or government agencies.
Information Regarding Disclosures Presented
Annualized Lease Revenue ("ALR"): ALR is calculated by multiplying (i) rental payments (defined as base rent plus operating expense reimbursements, if payable by the tenant on a monthly basis under the terms of a lease that have been executed, but excluding a) rental abatements and b) rental payments related to executed but not commenced leases for space that was covered by an existing lease), by (ii) 12. In instances in which contractual rents or operating expense reimbursements are collected on an annual, semi-annual, or quarterly basis, such amounts are multiplied by a factor of 1, 2, or 4, respectively, to calculate the annualized figure. For leases that have been executed but not commenced relating to un-leased space, ALR is calculated by multiplying (i) the monthly base rental payment (excluding abatements) plus any operating expense reimbursements for the initial month of the lease term, by (ii) 12. Unless stated otherwise, this measure excludes our
two
industrial properties and
five
unconsolidated joint venture interests.
2
In conjunction with our listing and concurrent offering in
February 2010
, we also recapitalized our common stock pursuant to a stockholder-approved amendment to our Charter (the "Recapitalization"). The Recapitalization was effected on a pro rata basis with respect to all of our stockholders and had the effect of reducing the total number of outstanding shares of our common stock without affecting any stockholder’s proportionate ownership (except for any changes resulting from the payment of cash in lieu of fractional shares). In addition, the Recapitalization created four classes of stock which were each ultimately converted into shares which were listed on the NYSE over the following twelve months with the final shares listing in January 2011.
Effective June 30, 2011, our board of directors approved Articles Supplementary and Articles of Amendment to Piedmont's Third Articles of Amendment and Restatement. Together, the Articles Supplementary and Articles of Amendment (1) reclassified and designated all of our authorized but unissued shares of Class B common stock as Class A common stock and then (2) changed the designation of our Class A common stock to Common Stock. The Articles Supplementary and Articles of Amendment were each filed with the State Department of Assessments and Taxation of Maryland on June 30, 2011 and were effective upon such filing. As a result, we now have one class of common stock. Share and per share information for all prior periods presented has been restated for the effects of the Recapitalization and subsequent reclassification and designation.
Employees
As of
December 31, 2011
, we had
116
full-time employees, with
52
of our employees working in our corporate office in Johns Creek, Georgia. Our remaining employees work in property management offices located in Atlanta, Georgia; Boston, Massachusetts; Minneapolis, Minnesota; Washington, D.C.; Tampa, Florida; Irving, Texas; Houston, Texas; Chicago, Illinois; Detroit, Michigan; and the metropolitan areas surrounding New York, New York and Los Angeles, California. These employees are involved in managing our real estate and servicing our tenants.
Competition
We compete for tenants for our high-quality assets in major U.S. markets by fostering strong tenant relationships and by providing efficient customer service including, asset management, property management, and construction management services. As the competition for high-credit-quality tenants is intense, we may be required to provide rent concessions, incur charges for tenant improvements and other inducements, or we may not be able to lease vacant space timely, all of which would adversely impact our results of operations. We compete with other buyers who are interested in properties we elect to acquire, which may result in an increase in the amount that we pay for such properties or may ultimately result in our inability to acquire such properties. We also compete with sellers of similar properties when we sell properties, which may result in our receiving lower proceeds from the disposal, or which may result in our inability to dispose of such properties due to the lack of an acceptable return.
Financial Information About Industry Segments
Our current business consists primarily of owning, managing, operating, leasing, acquiring, developing, investing in, and disposing of office real estate assets. We internally evaluate all of our real estate assets as one industry segment, and, accordingly, we do not report segment information.
Concentration of Credit Risk
We are dependent upon the ability of our current tenants to pay their contractual rent amounts as the rents become due. The inability of a tenant to pay future rental amounts would have a negative impact on our results of operations. As of
December 31, 2011
, no individual tenant, other than multiple leases which collectively represent various departments of the federal government, represents more than 10% of our future rental income under non-cancelable leases or 10% of our current year rental revenues. Apart from general uncertainties related to current, adverse economic conditions, and governmental operating deficits, we are not aware of any reason that our current tenants will not be able to pay their contractual rental amounts, in all material respects, as they become due. If certain situations prevent our tenants from paying contractual rents, this could result in a material adverse impact on our results of operations.
Other Matters
Piedmont has contracts with various governmental agencies, exclusively in the form of operating leases in buildings we own. See Item 1A. “Risk Factors” for further discussion of the risks associated with these contracts.
Additionally, as the owner of real estate assets, we are subject to environmental risks. See Item 1A. “Risk Factors” for further discussion of the risks associated with environmental concerns.
3
Web Site Address
Access to copies of each of our annual reports on Form 10-K, quarterly reports on Form 10-Q, current reports on Form 8-K, proxy statements, and other filings with the Securities and Exchange Commission (the "SEC"), including any amendments to such filings, may be obtained free of charge from the following Web site, http://www.piedmontreit.com, or directly from the SEC’s Web site at http://www.sec.gov. These filings are available promptly after we file them with, or furnish them to, the SEC.
Item 1A.
Risks Related to Our Business and Operations
Market and economic conditions remain challenging and the demand for office space, rental rates and property values may continue to lag the general economic recovery causing our business, results of operations, cash flows, financial condition and access to capital to be adversely affected.
Continuing concerns about the stability of the European economic community, widespread unemployment in the United States, the potential impact of inflation, higher taxes, and rising interest rates have tempered widespread economic recovery in the United States. The demand for office space, rental rates and property values may continue to lag the general economic recovery as these statistics are more dependent on job growth which is generally one of the last economic indicators to recover.
The volatility of the equity and debt markets generally, and concerns regarding the strength of counterparties specifically, has led many lenders to tighten, reduce, and in some cases, cease to provide credit or funding to borrowers. Such actions may adversely affect our liquidity and financial condition by limiting our ability to fully access our existing credit facility, to fully renew or replace maturing liabilities on a timely, cost-efficient basis, or to access the capital markets to meet liquidity and capital expenditure requirements.
If we do not have sufficient cash flow to continue operating our business and are unable to borrow additional funds or are unable to access our existing line of credit, we may need to find alternative ways to increase our liquidity. Such alternatives may include, without limitation, curtailing acquisitions and potential development activity, decreasing our distribution levels, disposing of one or more of our properties possibly on disadvantageous terms, or entering into or renewing leases on less favorable terms than we otherwise would and may contribute to increased lease terminations and asset impairment charges, among other effects, on our business.
Our $500 Million Unsecured Facility matures in 2012 and a failure to renew or replace this Facility could cause our business, results of operations, cash flows, financial condition and access to capital to be adversely affected.
To maintain our REIT status for U.S. federal income tax purposes, we must distribute at least 90% of our adjusted REIT taxable income to our stockholders annually, which makes us dependent upon external sources of capital. One of our primary sources of capital is access to funds under our $500 Million Unsecured Facility which matures in August 2012. Our access to these funds as well as our ability to renew this facility depend on the ability of existing and future lenders that are parties to such facility to meet their funding commitments to us. Disruptions in the global economy and the continuation of tighter credit conditions among, and potential failures of, third-party financial institutions as a result of such disruptions may have an adverse effect on the ability of our existing lenders to meet their funding obligations and the willingness of existing or future lenders to renew our facility. As a result, if one or more of the lenders fails to perform their respective funding obligations under our loans and our other lenders are not able or willing to assume such commitment, or if existing or future lenders are unwilling to renew or replace our facility, we may not have access to sufficient capital and our business, results of operations, cash flows and financial condition could be adversely affected.
Our growth will partially depend upon future acquisitions of properties, and we may not be successful in identifying and consummating suitable acquisitions that meet our investment criteria, which may impede our growth and negatively affect our results of operations.
Our business strategy involves the acquisition of primarily high-quality office properties in selected markets. These activities require us to identify suitable acquisition candidates or investment opportunities that meet our criteria and are compatible with our growth strategy. We may not be successful in identifying suitable properties or other assets that meet our acquisition criteria or in consummating acquisitions on satisfactory terms, if at all. Failure to identify or consummate acquisitions could slow our growth.
Further, we face significant competition for attractive investment opportunities from an indeterminate number of other real estate investors, including investors with significant capital resources such as domestic and foreign corporations and financial institutions, publicly traded and privately held REITs, private institutional investment funds, investment banking firms, life insurance companies
4
and pension funds. As a result of competition, we may be unable to acquire additional properties as we desire, the purchase price may be significantly elevated, or we may have to accept lease-up risk for a property with lower occupancy which could adversely affect our financial condition, results of operations, cash flows and ability to pay distributions on, and the market price of, our common stock.
We depend on tenants for our revenue, and accordingly, lease terminations and/or tenant defaults, particularly by one of our significant lead tenants, could adversely affect the income produced by our properties, which may harm our operating performance, thereby limiting our ability to make distributions to our stockholders.
The success of our investments materially depends on the financial stability of our tenants, any of whom may experience a change in their business at any time. For example, the economic conditions over the past several years may have already adversely affected or may in the future adversely affect one or more of our tenants. As a result, our tenants may delay lease commencements, decline to extend or renew their leases upon expiration, fail to make rental payments when due, or declare bankruptcy. Any of these actions could result in the termination of the tenants’ leases, or expiration of existing leases without renewal, and the loss of rental income attributable to the terminated or expired leases. In the event of a tenant default or bankruptcy, we may experience delays in enforcing our rights as a landlord and may incur substantial costs in protecting our investment and re-letting our property. If significant leases are terminated or defaulted upon, we may be unable to lease the property for the rent previously received or sell the property without incurring a loss. In addition, significant expenditures, such as mortgage payments, real estate taxes and insurance and maintenance costs, are generally fixed and do not decrease when revenues at the related property decrease.
The occurrence of any of the situations described above, particularly if it involves one of our significant lead tenants, could seriously harm our operating performance. As of
December 31, 2011
, our most substantial non-U.S. governmental lead tenants, based on ALR, were
BP Corporation
(approximately
5.7%
),
US Bancorp
(approximately
4.8%
), and the
State of New York
(approximately
3.9%
). As lead tenants, the revenues generated by the properties these tenants occupy are substantially dependent upon the financial condition of these tenants and, accordingly, any event of bankruptcy, insolvency, or a general downturn in the business of any of these tenants may result in the failure or delay of such tenant’s rental payments, which may have a substantial adverse effect on our operating performance.
We face considerable competition in the leasing market and may be unable to renew existing leases or re-let space on terms similar to the existing leases, or we may expend significant capital in our efforts to re-let space, which may adversely affect our operating results.
We have been working through a period of increased releasing activity over the past two years due to the expiration of several large leases. Each year, we compete with a number of other developers, owners, and operators of office and office-oriented, mixed-use properties to renew leases with our existing tenants and to attract new tenants. To the extent that we are able to renew leases that are scheduled to expire in the short-term or re-let such space to new tenants, heightened competition resulting from adverse market conditions may require us to utilize rent concessions and tenant improvements to a greater extent than we historically have. In addition, the economic downturn of the last several years has led to increased competition for credit worthy tenants and we may have difficulty competing with competitors who have purchased properties at depressed prices because our competitor's lower cost basis in their properties may allow them to offer space at reduced rental rates.
If our competitors offer space at rental rates below current market rates or below the rental rates we currently charge our tenants, we may lose potential tenants, and we may be pressured to reduce our rental rates below those we currently charge in order to retain tenants upon expiration of their existing leases. Even if our tenants renew their leases or we are able to re-let the space, the terms and other costs of renewal or re-letting, including the cost of required renovations, increased tenant improvement allowances, leasing commissions, declining rental rates, and other potential concessions, may be less favorable than the terms of our current leases and could require significant capital expenditures. If we are unable to renew leases or re-let space in a reasonable time, or if rental rates decline or tenant improvement, leasing commissions, or other costs increase, our financial condition, cash flows, cash available for distribution, value of our common stock, and ability to satisfy our debt service obligations could be materially adversely affected.
Some of our leases provide tenants with the right to terminate their leases early, which could have an adverse effect on our cash flow and results of operations.
Certain of our leases permit our tenants to terminate their leases as to all or a portion of the leased premises prior to their stated lease expiration dates under certain circumstances, such as providing notice by a certain date and, in some cases, paying a termination fee. In certain cases, such early terminations can be effectuated by our tenants with little or no termination fee being paid to us. As of
December 31, 2011
, approximately
19.7%
of our ALR was comprised of leases that provided tenants with early termination rights (including partial terminations and terminations of whole leases). To the extent that our tenants exercise early termination rights, our cash flow and earnings will be adversely affected, and we can provide no assurances that we will be able to generate
5
an equivalent amount of net rental income by leasing the vacated space to new third party tenants.
Our rental revenues will be significantly influenced by the economies and other conditions of the office market in general and of the specific markets in which we operate, particularly in Chicago, the New York metropolitan area and Washington, D.C., where we have high concentrations of office properties.
Because our portfolio consists primarily of office properties, we are subject to risks inherent in investments in a single property type. This concentration exposes us to the risk of economic downturns in the office sector to a greater extent than if our portfolio also included other sectors of the real estate industry. Our properties located in
Chicago
,
Washington, D.C.
and
the New York metropolitan area
account for approximately
22.4%
,
21.6%
, and
15.7%
, respectively, of our ALR. As a result, we are particularly susceptible to adverse market conditions in these particular areas, including the reduction in demand for office properties, industry slowdowns, governmental cut backs, relocation of businesses and changing demographics. Adverse economic or real estate developments in the markets in which we have a concentration of properties, or in any of the other markets in which we operate, or any decrease in demand for office space resulting from the local or national government and business climates, could adversely affect our rental revenues and operating results.
Economic, regulatory, and/or socio-economic changes that impact the real estate market generally, or that could affect patterns of use of commercial office space, may cause our operating results to suffer and decrease the value of our real estate properties.
The investment returns available from equity investments in real estate depend on the amount of income earned and capital appreciation generated by the properties, as well as the expenses incurred in connection with the properties. If our properties do not generate income sufficient to meet operating expenses, including debt service and capital expenditures, then our ability to pay distributions to our stockholders could be adversely affected. In addition, there are significant expenditures associated with an investment in real estate (such as mortgage payments, real estate taxes, and maintenance costs) that generally do not decline when circumstances reduce the income from the property. The following factors, among others, may adversely affect the operating performance and long- or short-term value of our properties:
|
•
|
changes in the national, regional, and local economic climate, particularly in markets in which we have a concentration of properties;
|
|
•
|
local office market conditions such as changes in the supply of, or demand for, space in properties similar to those that we own within a particular area;
|
|
•
|
changes in the patterns of office use due to technological advances which may make telecommuting more prevalent;
|
|
•
|
the attractiveness of our properties to potential tenants;
|
|
•
|
changes in interest rates and availability of permanent mortgage funds that may render the sale of a property difficult or unattractive or otherwise reduce returns to stockholders;
|
|
•
|
the financial stability of our tenants, including bankruptcies, financial difficulties, or lease defaults by our tenants;
|
|
•
|
changes in operating costs and expenses, including costs for maintenance, insurance, and real estate taxes, and our ability to control rents in light of such changes;
|
|
•
|
the need to periodically fund the costs to repair, renovate, and re-let space;
|
|
•
|
earthquakes, tornadoes, hurricanes and other natural disasters, civil unrest, terrorist acts or acts of war, which may result in uninsured or underinsured losses;
|
|
•
|
changes in, or increased costs of compliance with, governmental regulations, including those governing usage, zoning, the environment, and taxes; and
|
|
•
|
changes in accounting standards.
|
In addition, periods of economic slowdown or recession, rising interest rates, or declining demand for real estate could result in a general decrease in rents or an increased occurrence of defaults under existing leases, which would adversely affect our financial condition and results of operations. Any of the above factors may prevent us from generating sufficient cash flow or maintaining the value of our real estate properties.
We may face additional risks and costs associated with directly managing properties occupied by government tenants.
We currently own
nine
properties in which some or all of the tenants are federal government agencies. Lease agreements with these federal government agencies contain certain provisions required by federal law, which require, among other things, that the contractor (which is the lessor or the owner of the property) agree to comply with certain rules and regulations, including but not limited to, rules and regulations related to anti-kickback procedures, examination of records, audits and records, equal opportunity provisions, prohibitions against segregated facilities, certain executive orders, subcontractor costs or pricing data, and certain provisions intending to assist small businesses. Through one of our wholly-owned subsidiaries, we directly manage properties with federal government agency tenants and, therefore, we are subject to additional risks associated with compliance with all such federal rules and regulations. There are certain additional requirements relating to the potential application of the Employment
6
Standards Administration’s Office of Federal Contract Compliance Programs and the related requirement to prepare written affirmative action plans applicable to government contractors and subcontractors. Some of the factors used to determine whether such requirements apply to a company that is affiliated with the actual government contractor (the legal entity that is the lessor under a lease with a federal government agency) include whether such company and the government contractor are under common ownership, have common management, and are under common control. One of our wholly-owned subsidiaries is considered a government contractor, increasing the risk that requirements of these equal opportunity provisions including the requirement to prepare affirmative action plans may be determined to be applicable to us.
Adverse market and economic conditions may continue to adversely affect us and could cause us to recognize impairment charges on tangible real estate assets or otherwise impact our performance.
We continually monitor events and changes in circumstances that could indicate that the carrying value of the real estate and related lease intangible assets in which we have an ownership interest, either directly or through investments in joint ventures, may not be recoverable. When indicators of potential impairment are present which indicate that the carrying value of real estate and related lease intangible assets may not be recoverable, we assess the recoverability of these assets by determining whether the carrying value will be recovered through the undiscounted future operating cash flows expected from the use of the asset and its eventual disposition. In the event that such expected undiscounted future cash flows do not exceed the carrying value, we adjust the real estate and related lease intangible assets to their fair value and recognize an impairment loss.
Projections of expected future cash flows require management to make assumptions to estimate future market rental income amounts subsequent to the expiration of current lease agreements, property operating expenses, the number of months it takes to re-lease the property, and the number of years the property is held for investment, among other factors. The subjectivity of assumptions used in the future cash flow analysis, including discount rates, could result in an incorrect assessment of the property’s fair value and, therefore, could result in the misstatement of the carrying value of our real estate and related lease intangible assets and our net income.
Ongoing adverse market and economic conditions and market volatility will likely continue to make it difficult to value the real estate assets owned by us as well as the value of our interests in unconsolidated joint ventures and/or our goodwill and other intangible assets. As a result of current adverse market and economic conditions, there may be significant uncertainty in the valuation, or in the stability of, the cash flows, discount rates and other factors related to such assets that could result in a substantial decrease in their value. We may be required to recognize additional asset impairment charges in the future, which could materially and adversely affect our business, financial condition and results of operations.
We may invest in mezzanine debt, which is subject to increased risk of loss relative to senior mortgage loans.
We may invest in mezzanine debt. These investments, which are subordinate to the mortgage loans secured by the real property underlying the loan, are generally secured by pledges of the equity interests of the entities owning the underlying real estate. As a result, these investments involve greater risk of loss than investments in senior mortgage loans that are secured by real property since they are subordinate to the mortgage loan secured by the building and may be subordinate to the interests of other mezzanine lenders. Therefore, if the property owner defaults on its debt service obligations payable to us or on debt senior to us, or declares bankruptcy, such mezzanine loans will be satisfied only after the senior debt and the other senior mezzanine loans are paid in full, resulting in the possibility that we may be unable to recover some or all of our investment. In addition, the value of the assets securing or supporting our mezzanine debt investments could deteriorate over time due to factors beyond our control, including acts or omissions by owners, changes in business, economic or market conditions, or foreclosure, any of which could result in the recognition of impairment losses. In addition, there may be significant delays and costs associated with the process of foreclosing on the collateral securing or supporting such investments.
Adverse market and economic conditions may continue to adversely affect us and could cause us to recognize impairment charges on our goodwill, or otherwise impact our performance.
We review the value of our goodwill on an annual basis and when events or changes in circumstances indicate that the carrying value of goodwill may exceed the fair value of such assets. Such interim events could be adverse changes in legal matters or in the business climate, adverse action or assessment by a regulator, the loss of key personnel, or persistent declines in an entity’s stock price below carrying value of the entity. Volatility in the overall market could cause the price of our common stock to fluctuate and cause the carrying value of our company to exceed the estimated fair value. If that occurs, our goodwill potentially could be impaired. Impairment charges recognized in order to reduce our goodwill could materially and adversely affect our financial condition and results of operations.
7
Future acquisitions of properties may not yield anticipated returns, may result in disruptions to our business, and may strain management resources.
We intend to continue acquiring high-quality office properties, subject to the availability of attractive properties and our ability to consummate acquisitions on satisfactory terms. In deciding whether to acquire a particular property, we make certain assumptions regarding the expected future performance of that property. However, newly acquired properties may fail to perform as expected. Costs necessary to bring acquired properties up to standards established for their intended market position may exceed our expectations, which may result in the properties’ failure to achieve projected returns.
In particular, to the extent that we engage in acquisition activities, they will pose the following risks for our ongoing operations:
|
•
|
we may acquire properties or other real estate-related investments that are not initially accretive to our results upon acquisition or accept lower cash flows in anticipation of longer term appreciation, and we may not successfully manage and lease those properties to meet our expectations;
|
|
•
|
we may not achieve expected cost savings and operating efficiencies;
|
|
•
|
we may be unable to quickly and efficiently integrate new acquisitions, particularly acquisitions of portfolios of properties, into our existing operations;
|
|
•
|
management attention may be diverted to the integration of acquired properties, which in some cases may turn out to be less compatible with our operating strategy than originally anticipated;
|
|
•
|
we may not be able to support the acquired property through one of our existing property management offices and may not successfully open new satellite offices to serve additional markets;
|
|
•
|
the acquired properties may not perform as well as we anticipate due to various factors, including changes in macro-economic conditions and the demand for office space; and
|
|
•
|
we may acquire properties without any recourse, or with only limited recourse, for liabilities, whether known or unknown, such as clean-up of environmental contamination, claims by tenants, vendors or other persons against the former owners of the properties, and claims for indemnification by general partners, directors, officers, and others indemnified by the former owners of the properties.
|
We depend on key personnel, each of whom would be difficult to replace.
Our continued success depends to a significant degree upon the continued contributions of certain key personnel including, but not limited to, Donald A. Miller, CFA, Robert E. Bowers, Laura P. Moon, Raymond L. Owens, and Carroll A. Reddic, each of whom would be difficult to replace. Although we have entered into employment agreements with these key members of our executive management team, we cannot provide any assurance that any of them will remain employed by us. Our ability to retain our management team, or to attract suitable replacements should any member of the executive management team leave, is dependent on the competitive nature of the employment market. The loss of services of one or more of these key members of our management team could adversely affect our results of operations and slow our future growth. We have not obtained and do not expect to obtain “key person” life insurance on any of our key personnel.
Acquired properties may be located in new markets, where we may face risks associated with investing in an unfamiliar market.
When we acquire properties located in markets in which we do not have an established presence, we may face risks associated with a lack of market knowledge or understanding of the local economy, forging new business relationships in the area and unfamiliarity with local government and permitting procedures. As a result, the operating performance of properties acquired in new markets may be less than we anticipate, and we may have difficulty integrating such properties into our existing portfolio. In addition, the time and resources that may be required to obtain market knowledge and/or integrate such properties into our existing portfolio could divert our management’s attention from our existing business or other attractive opportunities in our concentration markets.
The illiquidity of real estate investments could significantly impede our ability to respond to adverse changes in the performance of our properties.
Because real estate investments are relatively illiquid and large-scale office properties such as many of those in our portfolio are particularly illiquid, our ability to sell promptly one or more properties in our portfolio in response to changing economic, financial, and investment conditions is limited. The real estate market is affected by many forces, such as general economic conditions, availability of financing, interest rates, and other factors, including supply and demand, that are beyond our control. Current conditions in the U.S. economy and credit markets may make it difficult to sell certain properties at attractive prices. We cannot predict whether we will be able to sell any property for the price or on the terms set by us or whether any price or other terms offered by a prospective purchaser would be acceptable to us. We also cannot predict the length of time needed to find a willing purchaser and to close the sale of a property. We may be required to expend funds to correct defects or to make improvements
8
before a property can be sold. We cannot provide any assurances that we will have funds available to correct such defects or to make such improvements. Our inability to dispose of assets at opportune times or on favorable terms could adversely affect our cash flows and results of operations, thereby limiting our ability to make distributions to stockholders.
Future terrorist attacks in the major metropolitan areas in which we own properties could significantly impact the demand for, and value of, our properties.
Our portfolio maintains significant holdings in markets such as Chicago, Washington, D.C., the New York metropolitan area, Boston, and greater Los Angeles, each of which has been, and continues to be, a high risk geographical area for terrorism and threats of terrorism. Future terrorist attacks and other acts of terrorism or war would severely impact the demand for, and value of, our properties. Terrorist attacks in and around any of the major metropolitan areas in which we own properties also could directly impact the value of our properties through damage, destruction, loss, or increased security costs, and could thereafter materially impact the availability or cost of insurance to protect against such acts. A decrease in demand could make it difficult to renew or re-lease our properties at lease rates equal to or above historical rates. To the extent that any future terrorist attacks otherwise disrupt our tenants’ businesses, it may impair our tenants’ ability to make timely payments under their existing leases with us, which would harm our operating results.
Uninsured losses or losses in excess of our insurance coverage could adversely affect our financial condition and our cash flow, and there can be no assurance as to future costs and the scope of coverage that may be available under insurance policies.
We carry comprehensive general liability, fire, extended coverage, business interruption rental loss coverage, environmental, and umbrella liability coverage on all of our properties and earthquake, wind, and flood coverage on properties in areas where such coverage is warranted. We believe the policy specifications and insured limits of these policies are adequate and appropriate given the relative risk of loss, the cost of the coverage, and industry practice. However, we may be subject to certain types of losses, those that are generally catastrophic in nature, such as losses due to wars, conventional terrorism, chemical, biological, nuclear and radiation (“CBNR”) acts of terrorism and, in some cases, earthquakes, hurricanes, and flooding, either because such coverage is not available or is not available at commercially reasonable rates. If we experience a loss that is uninsured or that exceeds policy limits, we could lose a significant portion of the capital we have invested in the damaged property, as well as the anticipated future revenue from the property. Inflation, changes in building codes and ordinances, environmental considerations, and other factors also might make it impractical or undesirable to use insurance proceeds to replace a property after it has been damaged or destroyed. In addition, if the damaged properties are subject to recourse indebtedness, we would continue to be liable for the indebtedness, even if these properties were irreparably damaged. Furthermore, we may not be able to obtain adequate insurance coverage at reasonable costs in the future, as the costs associated with property and casualty renewals may be higher than anticipated.
In addition, insurance risks associated with potential terrorism acts could sharply increase the premiums we pay for coverage against property and casualty claims. With the enactment of the Terrorism Risk Insurance Program Reauthorization Act of 2007, United States insurers cannot exclude conventional (non-CBNR) terrorism losses. These insurers must make terrorism insurance available under their property and casualty insurance policies; however, this legislation does not regulate the pricing of such insurance. In some cases, mortgage lenders have begun to insist that commercial property owners purchase coverage against terrorism as a condition of providing mortgage loans. Such insurance policies may not be available at a reasonable cost, which could inhibit our ability to finance or refinance our properties. In such instances, we may be required to provide other financial support, either through financial assurances or self-insurance, to cover potential losses. We may not have adequate coverage for such losses.
We have properties located in Southern California, an area especially susceptible to earthquakes. Collectively, these properties represent approximately
5.3%
of our ALR. Because these properties are located in close proximity to one another, an earthquake in the greater Los Angeles area could materially damage, destroy or impair the use by tenants of all of these properties. If any of our properties incurs a loss that is not fully insured, the value of that asset will be reduced by such uninsured loss. Also, to the extent we must pay unexpectedly large amounts for insurance, we could suffer reduced earnings that would result in lower distributions to our stockholders.
Should one of our insurance carriers become insolvent, we would be adversely affected.
We carry several different lines of insurance, placed with several large insurance carriers. If any one of these large insurance carriers were to become insolvent, we would be forced to replace the existing insurance coverage with another suitable carrier, and any outstanding claims would be at risk for collection. In such an event, we cannot be certain that we would be able to replace the coverage at similar or otherwise favorable terms. Replacing insurance coverage at unfavorable rates and the potential of uncollectible claims due to carrier insolvency could adversely impact our results of operations and cash flows.
9
Our current and future joint venture investments could be adversely affected by a lack of sole decision-making authority and our reliance on joint venture partners’ financial condition.
As of
December 31, 2011
, we owned interests in
five
properties representing approximately
0.7 million
rentable square feet through unconsolidated joint ventures. In the future we may enter into strategic joint ventures with institutional investors to acquire, develop, improve, or dispose of properties, thereby reducing the amount of capital required by us to make investments and diversifying our capital sources for growth. Such joint venture investments involve risks not otherwise present in a wholly-owned property, development, or redevelopment project, including the following:
|
•
|
in these investments, we do not have exclusive control over the development, financing, leasing, management, and other aspects of the project, which may prevent us from taking actions that are opposed by our joint venture partners;
|
|
•
|
joint venture agreements often restrict the transfer of a co-venturer’s interest or may otherwise restrict our ability to sell the interest when we desire or on advantageous terms;
|
|
•
|
we would not be in a position to exercise sole decision-making authority regarding the property or joint venture, which could create the potential risk of creating impasses on decisions, such as acquisitions or sales;
|
|
•
|
such co-venturer may, at any time, have economic or business interests or goals that are, or that may become, inconsistent with our business interests or goals;
|
|
•
|
such co-venturer may be in a position to take action contrary to our instructions, requests, policies or objectives, including our current policy with respect to maintaining our qualification as a REIT;
|
|
•
|
the possibility that our co-venturer in an investment might become bankrupt, which would mean that we and any other remaining co-venturers would generally remain liable for the joint venture’s liabilities;
|
|
•
|
our relationships with our co-venturers are contractual in nature and may be terminated or dissolved under the terms of the applicable joint venture agreements and, in such event, we may not continue to own or operate the interests or assets underlying such relationship or may need to purchase such interests or assets at a premium to the market price to continue ownership;
|
|
•
|
disputes between us and our co-venturers may result in litigation or arbitration that would increase our expenses and prevent our officers and directors from focusing their time and efforts on our business and could result in subjecting the properties owned by the applicable joint venture to additional risk; or
|
|
•
|
we may, in certain circumstances, be liable for the actions of our co-venturers, and the activities of a joint venture could adversely affect our ability to qualify as a REIT, even though we do not control the joint venture.
|
Any of the above might subject a property to liabilities in excess of those contemplated and thus reduce the returns to our investors.
Costs of complying with governmental laws and regulations may reduce our net income and the cash available for distributions to our stockholders.
All real property and the operations conducted on real property are subject to federal, state, and local laws and regulations relating to environmental protection and human health and safety. Tenants’ ability to operate and to generate income to pay their lease obligations may be affected by permitting and compliance obligations arising under such laws and regulations. Some of these laws and regulations may impose joint and several liability on tenants, owners, or operators for the costs to investigate or remediate contaminated properties, regardless of fault or whether the acts causing the contamination were legal. In addition, the presence of hazardous substances, or the failure to properly remediate these substances, may hinder our ability to sell, rent, or pledge such property as collateral for future borrowings.
Compliance with new laws or regulations or stricter interpretation of existing laws by agencies or the courts may require us to incur material expenditures. Future laws, ordinances, or regulations may impose material environmental liability. Additionally, our tenants’ operations, the existing condition of land when we buy it, operations in the vicinity of our properties such as the presence of underground storage tanks or activities of unrelated third parties may affect our properties. In addition, there are various local, state, and federal fire, health, life-safety, and similar regulations with which we may be required to comply, and which may subject us to liability in the form of fines or damages for noncompliance. Any material expenditures, fines, or damages we must pay will reduce our cash flows and ability to make distributions and may reduce the value of our stockholders’ investment.
As the present or former owner or operator of real property, we could become subject to liability for environmental contamination, regardless of whether we caused such contamination.
Under various federal, state, and local environmental laws, ordinances, and regulations, a current or former owner or operator of real property may be liable for the cost to remove or remediate hazardous or toxic substances, wastes, or petroleum products on, under, from, or in such property. These costs could be substantial and liability under these laws may attach whether or not the owner or operator knew of, or was responsible for, the presence of such contamination. Even if more than one person may have been responsible for the contamination, each liable party may be held entirely responsible for all of the clean-up costs incurred.
10
In addition, third parties may sue the owner or operator of a property for damages based on personal injury, natural resources, or property damage and/or for other costs, including investigation and clean-up costs, resulting from the environmental contamination. The presence of contamination on one of our properties, or the failure to properly remediate a contaminated property, could give rise to a lien in favor of the government for costs it may incur to address the contamination, or otherwise adversely affect our ability to sell or lease the property or borrow using the property as collateral. In addition, if contamination is discovered on our properties, environmental laws may impose restrictions on the manner in which property may be used or businesses may be operated, and these restrictions may require substantial expenditures or prevent us from entering into leases with prospective tenants.
Some of our properties are adjacent to or near other properties that have contained or currently contain underground storage tanks used to store petroleum products or other hazardous or toxic substances. In addition, certain of our properties are on, adjacent to, or near sites upon which others, including former owners or tenants of our properties, have engaged, or may in the future engage, in activities that have released or may have released petroleum products or other hazardous or toxic substances.
The cost of defending against claims of liability, of remediating any contaminated property, or of paying personal injury claims could reduce the amounts available for distribution to our stockholders.
As the owner of real property, we could become subject to liability for adverse environmental conditions in the buildings on our property.
Some of our properties contain asbestos-containing building materials. Environmental laws require that owners or operators of buildings containing asbestos properly manage and maintain the asbestos, adequately inform or train those who may come into contact with asbestos, and undertake special precautions, including removal or other abatement, in the event that asbestos is disturbed during building renovation or demolition. These laws may impose fines and penalties on building owners or operators who fail to comply with these requirements. In addition, environmental laws and the common law may allow third parties to seek recovery from owners or operators for personal injury associated with exposure to asbestos.
The properties also may contain or develop harmful mold or suffer from other air quality issues. Any of these materials or conditions could result in liability for personal injury and costs of remediating adverse conditions, which could have an adverse effect on our cash flows and ability to make distributions to our stockholders.
As the owner of real property, we could become subject to liability for a tenant’s failure to comply with environmental requirements regarding the handling and disposal of regulated substances and wastes or for non-compliance with health and safety requirements, which requirements are subject to change.
Some of our tenants may handle regulated substances and wastes as part of their operations at our properties. Environmental laws regulate the handling, use, and disposal of these materials and subject our tenants, and potentially us, to liability resulting from non-compliance with these requirements. The properties in our portfolio also are subject to various federal, state, and local health and safety requirements, such as state and local fire requirements. If we or our tenants fail to comply with these various requirements, we might incur governmental fines or private damage awards. Moreover, we do not know whether or the extent to which existing requirements or their enforcement will change or whether future requirements will require us to make significant unanticipated expenditures that will materially adversely impact our financial condition, results of operations, cash flows, cash available for distribution to stockholders, the market price of our common stock, and our ability to satisfy our debt service obligations. If our tenants become subject to liability for noncompliance, it could affect their ability to make rental payments to us.
We are and may continue to be subject to litigation, which could have a material adverse effect on our financial condition.
We currently are, and are likely to continue to be, subject to litigation, including claims relating to our operations, offerings, and otherwise in the ordinary course of business. Some of these claims may result in significant defense costs and potentially significant judgments against us, some of which are not, or cannot be, insured against. We generally intend to vigorously defend ourselves; however, we cannot be certain of the ultimate outcomes of currently asserted claims or of those that arise in the future. Resolution of these types of matters against us may result in our having to pay significant fines, judgments, or settlements, which, if uninsured, or if the fines, judgments, and settlements exceed insured levels, would adversely impact our earnings and cash flows, thereby impacting our ability to service debt and make quarterly distributions to our stockholders. Certain litigation or the resolution of certain litigation may affect the availability or cost of some of our insurance coverage, which could adversely impact our results of operations and cash flows, expose us to increased risks that would be uninsured, and/or adversely impact our ability to attract officers and directors.
11
We are subject to stockholder litigation against certain of our present and former directors and officers, which could exceed the coverage of our current directors’ and officers’ insurance.
We, and various of our present and former directors and officers, are involved in litigation described in “Item 3.—Legal Proceedings.” We believe that the allegations contained in these complaints are without merit and will continue to vigorously defend these actions; however, due to the uncertainties inherent in the litigation process, it is not possible to predict the ultimate outcome of these matters and the risk of material financial loss does exist. We have and may continue to incur significant defense costs associated with defending these claims.
Although we retain director and officer liability insurance, such insurance does not fully cover ongoing defense costs and there can be no assurance that it would fully cover any potential judgments against us. A successful stockholder claim in excess of our insurance coverage could adversely impact our results of operations and cash flows, impair our ability to obtain new director and officer liability insurance on favorable terms, and/or adversely impact our ability to attract directors and officers.
If we are unable to satisfy the regulatory requirements of Section 404 of the Sarbanes-Oxley Act of 2002, or if our disclosure controls or internal control over financial reporting is not effective, investors could lose confidence in our reported financial information, which could adversely affect the perception of our business and the trading price of our common stock.
The design and effectiveness of our disclosure controls and procedures and internal control over financial reporting may not prevent all errors, misstatements, or misrepresentations. Although management will continue to review the effectiveness of our disclosure controls and procedures and internal control over financial reporting, there can be no guarantee that our internal control over financial reporting will be effective in accomplishing all control objectives all of the time. Deficiencies, including any material weakness, in our internal control over financial reporting which may occur in the future could result in misstatements of our results of operations, restatements of our financial statements, a decline in the trading price of our common stock, or otherwise materially adversely affect our business, reputation, results of operations, financial condition, or liquidity.
Compliance or failure to comply with the Americans with Disabilities Act and other similar regulations could result in substantial costs.
Under the Americans with Disabilities Act, places of public accommodation must meet certain federal requirements related to access and use by disabled persons. Noncompliance could result in the imposition of fines by the federal government or the award of damages to private litigants. If we are required to make unanticipated expenditures to comply with the Americans with Disabilities Act, including removing access barriers, then our cash flows and the amounts available for distributions to our stockholders may be adversely affected. Although we believe that our properties are currently in material compliance with these regulatory requirements, we have not conducted an audit or investigation of all of our properties to determine our compliance, and we cannot predict the ultimate cost of compliance with the Americans with Disabilities Act or other legislation. If one or more of our properties is not in compliance with the Americans with Disabilities Act or other legislation, then we would be required to incur additional costs to achieve compliance. If we incur substantial costs to comply with the Americans with Disabilities Act or other legislation, our financial condition, results of operations, the market price of our common stock, cash flows, and our ability to satisfy our debt obligations and to make distributions to our stockholders could be adversely affected.
Our operating results may suffer because of potential development and construction delays and resultant increased costs and risks.
In the future, we may acquire and develop properties, including unimproved real properties, upon which we will construct improvements. We may be subject to uncertainties associated with re-zoning for development, environmental concerns of governmental entities and/or community groups, and our builders’ ability to build in conformity with plans, specifications, budgeted costs and timetables. A builder’s performance may also be affected or delayed by conditions beyond the builder’s control. Delays in completing construction could also give tenants the right to terminate preconstruction leases. We may incur additional risks when we make periodic progress payments or other advances to builders before they complete construction. These and other factors can result in increased costs of a project or loss of our investment. In addition, we will be subject to normal lease-up risks relating to newly constructed projects. We also must rely on rental income and expense projections and estimates of the fair market value of property upon completion of construction when agreeing upon a purchase price at the time we acquire the property. If our projections are inaccurate, we may pay too much for a property, and our return on our investment could suffer.
Our real estate development strategies may not be successful.
From time to time we may engage in development activities to the extent attractive development projects become available. If we engage in development activities, we will be subject to risks associated with those activities that could adversely affect our financial condition, results of operations, cash flows and ability to pay distributions on, and the market price of, our common stock, including, but not limited to:
12
|
•
|
development projects in which we have invested may be abandoned and the related investment will be impaired;
|
|
•
|
we may not be able to obtain, or may experience delays in obtaining, all necessary zoning, land-use, building, occupancy and other governmental permits and authorizations;
|
|
•
|
we may not be able to obtain land on which to develop;
|
|
•
|
we may not be able to obtain financing for development projects, or obtain financing on favorable terms;
|
|
•
|
construction costs of a project may exceed the original estimates or construction may not be concluded on schedule, making the project less profitable than originally estimated or not profitable at all (including the possibility of contract default, the effects of local weather conditions, the possibility of local or national strikes and the possibility of shortages in materials, building supplies or energy and fuel for equipment);
|
|
•
|
upon completion of construction, we may not be able to obtain, or obtain on advantageous terms, permanent financing for activities that we financed through construction loans; and
|
|
•
|
we may not achieve sufficient occupancy levels and/or obtain sufficient rents to ensure the profitability of a completed project.
|
Moreover, substantial renovation and development activities, regardless of their ultimate success, typically require a significant amount of management’s time and attention, diverting their attention from our other operations.
Risks Related to Our Organization and Structure
Our organizational documents contain provisions that may have an anti-takeover effect, which may discourage third parties from conducting a tender offer or seeking other change of control transactions that could involve a premium price for our common stock or otherwise benefit our stockholders.
Our charter and bylaws contain provisions that may have the effect of delaying, deferring, or preventing a change in control of our company (including an extraordinary transaction such as a merger, tender offer, or sale of all or substantially all of our assets) that might provide a premium price for our common stock or otherwise be in the best interest of our stockholders. These provisions include, among other things, restrictions on the ownership and transfer of our stock, advance notice requirements for stockholder nominations for directors and other business proposals, and our board of directors’ power to classify or reclassify unissued shares of common or preferred stock and issue additional shares of common or preferred stock.
In order to preserve our REIT status, our charter limits the number of shares a person may own, which may discourage a takeover that could result in a premium price for our common stock or otherwise benefit our stockholders.
Our charter, with certain exceptions, authorizes our directors to take such actions as are necessary and desirable to preserve our qualification as a REIT for federal income tax purposes. Unless exempted by our board of directors, no person may actually or constructively own more than 9.8% (by value or number of shares, whichever is more restrictive) of the outstanding shares of our common stock or the outstanding shares of any class or series of our preferred stock, which may inhibit large investors from desiring to purchase our stock. This restriction may have the effect of delaying, deferring, or preventing a change in control, including an extraordinary transaction (such as a merger, tender offer, or sale of all or substantially all of our assets) that might provide a premium price for our common stock or otherwise be in the best interest of our stockholders.
Our board of directors can take many actions without stockholder approval.
Our board of directors has overall authority to oversee our operations and determine our major corporate policies. This authority includes significant flexibility. For example, our board of directors can do the following:
|
•
|
within the limits provided in our charter, prevent the ownership, transfer, and/or accumulation of stock in order to protect our status as a REIT or for any other reason deemed to be in our best interest and the interest of our stockholders;
|
|
•
|
issue additional shares of stock without obtaining stockholder approval, which could dilute the ownership of our then-current stockholders;
|
|
•
|
amend our charter to increase or decrease the aggregate number of shares of stock or the number of shares of stock of any class or series that we have authority to issue, without obtaining stockholder approval;
|
|
•
|
classify or reclassify any unissued shares of our common or preferred stock and set the preferences, rights and other terms of such classified or reclassified shares, without obtaining stockholder approval;
|
|
•
|
employ and compensate affiliates;
|
|
•
|
direct our resources toward investments that do not ultimately appreciate over time;
|
|
•
|
change creditworthiness standards with respect to our tenants;
|
|
•
|
change our investment or borrowing policies;
|
|
•
|
determine that it is no longer in our best interest to attempt to qualify, or to continue to qualify, as a REIT; and
|
13
|
•
|
suspend, modify or terminate the dividend reinvestment plan.
|
Any of these actions could increase our operating expenses, impact our ability to make distributions, or reduce the value of our assets without giving our stockholders the right to vote.
Our charter permits our board of directors to issue stock with terms that may subordinate the rights of our common stockholders, which may discourage a third party from acquiring us in a manner that could result in a premium price for our common stock or otherwise benefit our stockholders.
Our board of directors may, without stockholder approval, issue authorized but unissued shares of our common or preferred stock and amend our charter to increase or decrease the aggregate number of shares of stock or the number of shares of stock of any class or series that we have authority to issue. In addition, our board of directors may, without stockholder approval, classify or reclassify any unissued shares of our common or preferred stock and set the preferences, rights and other terms of such classified or reclassified shares. Thus, our board of directors could authorize the issuance of preferred stock with terms and conditions that could have priority with respect to distributions and amounts payable upon liquidation over the rights of the holders of our common stock. Such preferred stock also could have the effect of delaying, deferring, or preventing a change in control, including an extraordinary transaction (such as a merger, tender offer, or sale of all or substantially all of our assets) that might provide a premium price for our common stock, or otherwise be in the best interest of our stockholders.
Our board of directors could elect for us to be subject to certain Maryland law limitations on changes in control that could have the effect of preventing transactions in the best interest of our stockholders.
Certain provisions of Maryland law may have the effect of inhibiting a third party from making a proposal to acquire us or of impeding a change of control under certain circumstances that otherwise could provide the holders of shares of our common stock with the opportunity to realize a premium over the then-prevailing market price of such shares, including:
|
•
|
“business combination” provisions that, subject to limitations, prohibit certain business combinations between us and an “interested stockholder” (defined generally as any person who beneficially owns 10% or more of the voting power of our outstanding voting stock or any affiliate or associate of ours who, at any time within the two-year period prior to the date in question, was the beneficial owner of 10% or more of the voting power of our then outstanding stock) or an affiliate thereof for five years after the most recent date on which the stockholder becomes an interested stockholder and thereafter impose supermajority voting requirements on these combinations; and
|
|
•
|
“control share” provisions that provide that “control shares” of our company (defined as shares which, when aggregated with other shares controlled by the stockholder, except solely by virtue of a revocable proxy, entitle the stockholder to exercise one of three increasing ranges of voting power in electing directors) acquired in a “control share acquisition” (defined as the direct or indirect acquisition of ownership or control of “control shares”) have no voting rights except to the extent approved by our stockholders by the affirmative vote of at least two-thirds of all the votes entitled to be cast on the matter, excluding all interested shares.
|
Our bylaws contain a provision exempting any acquisition by any person of shares of our stock from the control share acquisition statute, and our board of directors has adopted a resolution exempting any business combination with any person from the business combination statute. As a result, these provisions currently will not apply to a business combination or control share acquisition involving our company. However, our board of directors may opt into the business combination provisions and the control share provisions of Maryland law in the future.
Additionally, Maryland law permits our board of directors, without stockholder approval and regardless of what is currently provided in our charter or our bylaws, to implement takeover defenses, some of which (for example, a classified board) we do not currently employ. These provisions may have the effect of inhibiting a third party from making an acquisition proposal for our company or of delaying, deferring, or preventing a change in control of our company under circumstances that otherwise could provide the holders of our common stock with the opportunity to realize a premium over the then-current market price.
Our charter, our bylaws, the limited partnership agreement of our operating partnership, and Maryland law also contain other provisions that may delay, defer, or prevent a transaction or a change of control that might involve a premium price for our common stock or otherwise be in the best interest of our stockholders. In addition, the employment agreements with our named executive officers contain, and grants under our incentive plan also may contain, change-in-control provisions that might similarly have an anti-takeover effect, inhibit a change of our management, or inhibit in certain circumstances tender offers for our common stock or proxy contests to change our board.
14
Our rights and the rights of our stockholders to recover claims against our directors and officers are limited, which could reduce our recovery and our stockholders’ recovery against them if they negligently cause us to incur losses.
Maryland law provides that a director or officer has no liability in that capacity if he or she performs his or her duties in good faith, in a manner he or she reasonably believes to be in our best interest and with the care that an ordinarily prudent person in a like position would use under similar circumstances. Our charter eliminates our directors’ and officers’ liability to us and our stockholders for money damages except for liability resulting from actual receipt of an improper benefit or profit in money, property, or services or active and deliberate dishonesty established by a final judgment and which is material to the cause of action. Our charter and bylaws require us to indemnify our directors and officers to the maximum extent permitted by Maryland law for any claim or liability to which they may become subject or which they may incur by reason of their service as directors or officers, except to the extent that the act or omission of the director or officer was material to the matter giving rise to the proceeding and was committed in bad faith or was the result of active and deliberate dishonesty, the director or officer actually received an improper personal benefit in money, property, or services, or, in the case of any criminal proceeding, the director or officer had reasonable cause to believe that the act or omission was unlawful. As a result, we and our stockholders may have more limited rights against our directors and officers than might otherwise exist under common law, which could reduce our and our stockholders’ recovery from these persons if they act in a negligent manner. In addition, we may be obligated to fund the defense costs incurred by our directors and officers (as well as by our employees and agents) in some cases.
Risks Related to Our Common Stock
Any change in our dividend policy could have a material adverse effect on the market price of our common stock.
During the
year ended
December 31, 2011
we paid quarterly cash distributions that totaled
$1.26
per share and we have recently announced that our distribution for the first quarter of 2012 will be reduced to
$0.20
per share. Distributions are authorized and determined by our board of directors in its sole discretion and depend upon a number of factors, including:
|
•
|
cash available for distribution;
|
|
•
|
our results of operations;
|
|
•
|
our financial condition, especially in relation to our anticipated future capital needs of our properties;
|
|
•
|
the level of reserves we establish for future capital expenditures;
|
|
•
|
the distribution requirements for REITs under the Code;
|
|
•
|
the level of distributions paid by comparable listed REITs;
|
|
•
|
our operating expenses; and
|
|
•
|
other factors our board of directors deems relevant.
|
We expect to continue to pay quarterly distributions to our stockholders; however, we bear all expenses incurred by our operations, and our funds generated by operations, after deducting these expenses, may not be sufficient to cover desired levels of distributions to our stockholders. Any change in our distribution policy could have a material adverse effect on the market price of our common stock.
There are significant price and volume fluctuations in the public markets, including on the exchange which we listed our common stock.
The U.S. stock markets, including the NYSE on which our common stock is listed, have historically experienced significant price and volume fluctuations. The market price of our common stock may be highly volatile and could be subject to wide fluctuations and investors in our common stock may experience a decrease in the value of their shares, including decreases unrelated to our operating performance or prospects. If the market price of our common stock declines significantly, stockholders may be unable to resell their shares at or above their purchase price. We cannot assure stockholders that the market price of our common stock will not fluctuate or decline significantly in the future. In addition to the dividend policy risk mentioned above, some of the factors that could negatively affect our stock price or result in fluctuations in the price or trading volume of our common stock include:
|
•
|
actual or anticipated variations in our quarterly operating results;
|
|
•
|
changes in our earnings estimates or publication of research reports about us or the real estate industry, although no assurance can be given that any research reports about us will be published;
|
|
•
|
future sales of substantial amounts of our common stock by our existing or future stockholders;
|
|
•
|
increases in market interest rates, which may lead purchasers of our stock to demand a higher yield;
|
|
•
|
changes in market valuations of similar companies;
|
|
•
|
adverse market reaction to any increased indebtedness we incur in the future;
|
|
•
|
additions or departures of key personnel;
|
|
•
|
actions by institutional stockholders;
|
15
|
•
|
material, adverse litigation judgments;
|
|
•
|
speculation in the press or investment community; and
|
|
•
|
general market and economic conditions.
|
Future offerings of debt securities, which would be senior to our common stock upon liquidation, or equity securities, which would dilute our existing stockholders and may be senior to our common stock for the purposes of distributions, may adversely affect the market price of our common stock.
In the future, we may attempt to increase our capital resources by making additional offerings of debt or equity securities, including medium term notes, senior or subordinated notes and classes of preferred or common stock. Upon liquidation, holders of our debt securities and shares of preferred stock and lenders with respect to other borrowings will receive a distribution of our available assets prior to the holders of our common stock. Additional equity offerings may dilute the holdings of our existing stockholders or reduce the market price of our common stock or both. Because our decision to issue securities in any future offering will depend on market conditions and other factors beyond our control, we cannot predict or estimate the amount, timing or nature of our future offerings. Thus, our stockholders bear the risk of our future offerings reducing the market price of our common stock and diluting their proportionate ownership.
Market interest rates may have an effect on the value of our common stock.
One of the factors that investors may consider in deciding whether to buy or sell our common stock is our distribution rate as a percentage of our share price, relative to market interest rates. If market interest rates increase, prospective investors may desire a higher yield on our common stock or seek securities paying higher dividends or yields. It is likely that the public valuation of our common stock will be based primarily on our earnings and cash flows and not from the underlying appraised value of the properties themselves. As a result, interest rate fluctuations and capital market conditions can affect the market value of our common stock. For instance, if interest rates rise, it is likely that the market price of our common stock will decrease, because potential investors may require a higher dividend yield on our common stock as market rates on interest-bearing securities, such as bonds, rise.
If securities analysts do not publish research or reports about our business or if they downgrade our common stock or our sector, the price of our common stock could decline.
The trading market for our common stock relies in part on the research and reports that industry or financial analysts publish about us or our business. We do not control these analysts. Furthermore, if one or more of the analysts who do cover us downgrades our shares or our industry, or the stock of any of our competitors, the price of our shares could decline. If one or more of these analysts ceases coverage of our company, we could lose attention in the market, which in turn could cause the price of our common stock to decline.
Federal Income Tax Risks
Our failure to qualify as a REIT could adversely affect our operations and our ability to make distributions.
We are owned and operated in a manner intended to qualify us as a REIT for U.S. federal income tax purposes; however, we do not have a ruling from the IRS as to our REIT status. In addition, we own all of the common stock of a subsidiary that has elected to be treated as a REIT, and if our subsidiary REIT were to fail to qualify as a REIT, it is possible that we also would fail to qualify as a REIT unless we (or the subsidiary REIT) could qualify for certain relief provisions. Our qualification and the qualification of our subsidiary REIT as a REIT will depend on satisfaction, on an annual or quarterly basis, of numerous requirements set forth in highly technical and complex provisions of the Code for which there are only limited judicial or administrative interpretations. A determination as to whether such requirements are satisfied involves various factual matters and circumstances not entirely within our control. The fact that we hold substantially all of our assets through our operating partnership and its subsidiaries further complicates the application of the REIT requirements for us. No assurance can be given that we, or our subsidiary REIT, will qualify as a REIT for any particular year. See “Federal Income Tax Considerations—General” and “—Requirements for Qualification as a REIT.”
If we, or our subsidiary REIT, were to fail to qualify as a REIT in any taxable year for which a REIT election has been made, the non-qualifying REIT would not be allowed a deduction for dividends paid to its stockholders in computing our taxable income and would be subject to U.S. federal income tax (including any applicable alternative minimum tax) on its taxable income at corporate rates. Moreover, unless the non-qualifying REIT were to obtain relief under certain statutory provisions, the non-qualifying REIT also would be disqualified from treatment as a REIT for the four taxable years following the year during which qualification is lost. This treatment would reduce our net earnings available for investment or distribution to our stockholders because of the additional tax liability to us for the years involved. As a result of such additional tax liability, we might need to
16
borrow funds or liquidate certain investments on terms that may be disadvantageous to us in order to pay the applicable tax.
Even if we qualify as a REIT, we may incur certain tax liabilities that would reduce our cash flow and impair our ability to make distributions.
Even if we maintain our status as a REIT, we may be subject to U.S. federal income taxes or state taxes, which would reduce our cash available for distribution to our stockholders. For example, we will be subject to federal income tax on any undistributed taxable income. Further, if we fail to distribute during each calendar year at least the sum of (a) 85% of our ordinary income for such year, (b) 95% of our net capital gain income for such year, and (c) any undistributed taxable income from prior periods, we will be subject to a 4% excise tax on the excess of the required distribution over the sum of (i) the amounts actually distributed by us, plus (ii) retained amounts on which we pay income tax at the corporate level. If we realize net income from foreclosure properties that we hold primarily for sale to customers in the ordinary course of business, we must pay tax thereon at the highest corporate income tax rate, and if we sell a property, other than foreclosure property, that we are determined to have held for sale to customers in the ordinary course of business, any gain realized would be subject to a 100% “prohibited transaction” tax. The determination as to whether or not a particular sale is a prohibited transaction depends on the facts and circumstances related to that sale. We cannot guarantee that sales of our properties would not be prohibited transactions unless we comply with certain safe-harbor provisions. The need to avoid prohibited transactions could cause us to forego or defer sales of properties that might otherwise be in our best interest to sell. In addition, we own interests in certain taxable REIT subsidiaries that are subject to federal income taxation and we and our subsidiaries may be subject to state and local taxes on our income or property.
Differences between the recognition of taxable income and the actual receipt of cash could require us to sell assets or borrow funds on a short-term or long-term basis to meet the distribution requirements of the Code.
We intend to make distributions to our stockholders to comply with the requirements of the Code for REITs and to minimize or eliminate our corporate tax obligations; however, differences between the recognition of taxable income and the actual receipt of cash could require us to sell assets or borrow funds on a short-term or long-term basis to meet the distribution requirements of the Code. Certain types of assets generate substantial mismatches between taxable income and available cash, such as real estate that has been financed through financing structures which require some or all of available cash flows to be used to service borrowings. As a result, the requirement to distribute a substantial portion of our taxable income could cause us to: (1) sell assets in adverse market conditions, (2) borrow on unfavorable terms, or (3) distribute amounts that would otherwise be invested in future acquisitions, capital expenditures, or repayment of debt, in order to comply with REIT requirements. Any such actions could increase our costs and reduce the value of our common stock. Further, we may be required to make distributions to our stockholders when it would be more advantageous to reinvest cash in our business or when we do not have funds readily available for distribution. Compliance with REIT qualification requirements may, therefore, hinder our ability to operate solely on the basis of maximizing profits.
We face possible adverse changes in tax laws including changes to state tax laws regarding the treatment of REITs and their stockholders, which may result in an increase in our tax liability.
From time to time, changes in state and local tax laws or regulations are enacted, including changes to a state’s treatment of REITs and their stockholders, which may result in an increase in our tax liability. The shortfall in tax revenues for states and municipalities in recent years may lead to an increase in the frequency and size of such changes. If such changes occur, we may be required to pay additional taxes on our assets or income. These increased tax costs could adversely affect our financial condition and results of operations and the amount of cash available for payment of dividends.
Distributions made by REITs do not qualify for the reduced tax rates that apply to certain other corporate distributions.
The maximum tax rate for distributions made by corporations to individuals is generally 15% through 2012. Distributions made by REITs, however, generally are taxed at the normal rate applicable to the individual recipient rather than the 15% preferential rate. The more favorable rates applicable to regular corporate distributions could cause investors who are individuals to perceive investments in REITs to be relatively less attractive than investments in non-REIT corporations that make distributions.
A recharacterization of transactions undertaken by our operating partnership may result in lost tax benefits or prohibited transactions, which would diminish cash distributions to our stockholders, or even cause us to lose REIT status.
The IRS could recharacterize transactions consummated by our operating partnership, which could result in the income realized on certain transactions being treated as gain realized from the sale of property that is held as inventory or otherwise held primarily for the sale to customers in the ordinary course of business. In such event, such gain would constitute income from a prohibited transaction and would be subject to a 100% tax. If this were to occur, our ability to make cash distributions to our stockholders would be adversely affected. Moreover, our operating partnership may purchase properties and lease them back to the sellers of such properties. While we will use our best efforts to structure any such sale-leaseback transaction such that the lease will be
17
characterized as a “true lease,” thereby allowing us to be treated as the owner of the property for federal income tax purposes, we can give stockholders no assurance that the IRS will not attempt to challenge such characterization. In the event that any such sale-leaseback transaction is challenged and recharacterized as a financing transaction or loan for U.S. federal income tax purposes, deductions for depreciation and cost recovery relating to such property would be disallowed. If a sale-leaseback transaction were so recharacterized, the amount of our adjusted REIT taxable income could be recalculated, which might cause us to fail to meet the distribution requirement for a taxable year. We also might fail to satisfy the REIT qualification asset tests or income tests and, consequently, lose our REIT status. Even if we maintain our status as a REIT, an increase in our adjusted REIT taxable income could cause us to be subject to additional federal and state income and excise taxes. Any federal or state taxes we pay will reduce our cash available for distribution to our stockholders.
Legislative or regulatory action could adversely affect our stockholders.
In recent years, numerous legislative, judicial and administrative changes have been made to the federal income tax laws applicable to investments in REITs and similar entities. Additional changes to tax laws are likely to continue to occur in the future, and we cannot assure stockholders that any such changes will not adversely affect the taxation of a stockholder. Any such changes could have an adverse effect on an investment in our common stock. Stockholders are urged to consult with their tax advisor with respect to the status of legislative, regulatory, or administrative developments and proposals and their potential effect on an investment in common stock.
We have incurred and are likely to continue to incur mortgage and other indebtedness, which may increase our business risks.
As of
December 31, 2011
, we had total outstanding indebtedness of approximately
$1.5 billion
. We are likely to incur additional indebtedness to acquire properties or other real estate-related investments, to fund property improvements, and other capital expenditures or for other corporate purposes, such as to repurchase shares of our common stock through repurchase programs that our board of directors has authorized or to fund future distributions to our stockholders. We intend to finance sizable acquisitions by increasing our ratio of total-debt-to-gross assets ratio to a range of 30% to 40%; however, there can be no assurance that we will be successful in achieving or maintaining this ratio. Significant borrowings by us increase the risks of an investment in us. For example, if there is a shortfall between the cash flow from properties and the cash flow needed to service our indebtedness, then the amount available for distributions to stockholders may be reduced. In addition, incurring mortgage debt increases the risk of loss since defaults on indebtedness secured by a property may result in lenders initiating foreclosure actions. Although no such instances exist as of
December 31, 2011
, in those cases, we could lose the property securing the loan that is in default. For tax purposes, a foreclosure of any of our properties would be treated as a sale of the property for a purchase price equal to the outstanding balance of the debt secured by the mortgage. If the outstanding balance of the debt secured by the mortgage exceeds our tax basis in the property, we would recognize taxable income on foreclosure, but we would not receive any cash proceeds. We may give full or partial guarantees to lenders of mortgage debt on behalf of the entities that own our properties. When we give a guaranty on behalf of an entity that owns one of our properties, we will be responsible to the lender for satisfaction of the debt if it is not paid by such entity. If any mortgages or other indebtedness contain cross-collateralization or cross-default provisions, a default on a single loan could affect multiple properties. If any of our properties are foreclosed on due to a default, our ability to pay cash distributions to our stockholders will be limited.
High mortgage rates may make it difficult for us to finance or refinance properties, which could reduce the number of properties we can acquire, our net income, and the amount of cash distributions we can make.
If mortgage debt is unavailable at reasonable rates, we may not be able to finance the purchase of properties. If we place mortgage debt on properties, we run the risk of being unable to refinance the properties when the loans become due, or of being unable to refinance on favorable terms. If interest rates are higher when we refinance our properties, our income could be reduced. We may be unable to refinance properties. If any of these events occur, our cash flow could be reduced. This, in turn, could reduce cash available for distribution to our stockholders and may hinder our ability to raise more capital by issuing more stock or by borrowing more money.
Existing loan agreements contain, and future financing arrangements will likely contain, restrictive covenants relating to our operations, which could limit our ability to make distributions to our stockholders.
We are subject to certain restrictions pursuant to the restrictive covenants of our outstanding indebtedness, which may affect our distribution and operating policies and our ability to incur additional debt. Loan documents evidencing our existing indebtedness contain, and loan documents entered into in the future will likely contain, certain operating covenants that limit our ability to further mortgage the property or discontinue insurance coverage. In addition, these agreements contain financial covenants, including certain coverage ratios and limitations on our ability to incur secured and unsecured debt, make dividend payments, sell
18
all or substantially all of our assets, and engage in mergers and consolidations and certain acquisitions. Covenants under our existing indebtedness do, and under any future indebtedness likely will, restrict our ability to pursue certain business initiatives or certain acquisition transactions. In addition, failure to meet any of these covenants, including the financial coverage ratios, could cause an event of default under and/or accelerate some or all of our indebtedness, which would have a material adverse effect on us.
Increases in interest rates would increase the amount of our variable-rate debt payments and could limit our ability to pay dividends to our stockholders.
Increases in interest rates will increase our interest costs associated with any future draws that we may make on our $500 Million Unsecured Facility, which would reduce our cash flows and our ability to pay dividends to our stockholders. In addition, if we are required to repay existing debt during periods of higher interest rates, we may need to sell one or more of our investments in order to repay the debt, which might not permit realization of the maximum return on such investments.
Changes in the market environment could have adverse affects on our interest rate swap.
In conjunction with our $300 Million Unsecured Term Loan, we have entered into an interest rate swap to effectively fix our exposure to variable interest rates under the loan. To the extent interest rates are higher than our fixed rate, we would realize cash savings as compared to other market participants. However, to the extent interest rates are below our fixed rate, we incur more expense than other similar market participants, which has an adverse affect on our cash flows as compared to other market participants.
Additionally, there is counterparty risk associated with entering into an interest rate swap. Should market conditions lead to insolvency or make a merger necessary for one or more of our counterparties, or potential future counterparties, it is possible that the terms of our interest rate swap will not be honored in their current form with a replacement counterparty. The potential termination or renegotiation of the terms of the interest rate swap agreement as a result of changing counterparties through insolvency or merger could result in an adverse impact on our results of operations and cash flows.
Risks Related to Conflicts of Interest
Our Chief Executive Officer and our Chief Financial Officer will be subject to certain conflicts of interest with regard to enforcing the indemnification provisions contained in the merger agreement with our former advisor.
During 2007, we entered into a merger agreement with certain affiliates of our former advisor. Total consideration, comprised entirely of shares of our common stock was exchanged for, among other things, certain net assets of our former advisor, as well as the termination of our obligation to pay certain fees required pursuant to the terms of the in-place agreements with the former advisor. Donald A. Miller, CFA, our Chief Executive Officer and President and one of our directors, and Robert E. Bowers, our Chief Financial Officer, Executive Vice President, and Treasurer, each have an economic interest in the merger consideration due to his up to 1% ownership interest in the entity that sold us these advisor entities. Accordingly, Mr. Miller and Mr. Bowers may be subject to certain conflicts of interest with regard to enforcing indemnification provisions contained in the merger agreement.
One of our independent directors serves as a director of an entity sponsored by our former advisor. This relationship could affect his judgment with respect to enforcing the indemnification provisions contained in the merger agreement with our former advisor.
Donald S. Moss, one of our independent directors, is a director of Wells Timberland REIT. The relationship of Mr. Moss to an entity sponsored by our former advisor could affect his judgment with respect to enforcing indemnification provisions of the merger agreement with our former advisor.
There were no unresolved SEC staff comments as of
December 31, 2011
.
Overview
As of
December 31, 2011
, we owned interests in
79
office properties, plus
five
buildings owned through unconsolidated joint ventures and
two
industrial buildings. Of our office properties,
77
properties were wholly-owned and
two
properties are owned through consolidated joint ventures. Our
79
office properties are located in
18
metropolitan areas and, as of
December 31, 2011
and
2010
, these properties were
86.5%
and
89.2%
leased, respectively, with an average lease term remaining of approximately
six
years as of each period end. The
decrease
in occupancy in
2011
is primarily due to the purchase of several lower occupancy properties during 2011 which were acquired for their attractive basis and growth potential through lease-up. These decreases were
19
offset by moderate increases in the occupancy of certain properties, particularly those located in the Phoenix, Arizona markets, among others. The average rental revenue of our properties, as calculated for our properties on a consolidated, accrual basis exclusive of unconsolidated joint ventures and our industrial properties, was
$31.23
per leased square foot and
$32.02
per leased square foot for the years ended
December 31, 2011
and
2010
, respectively.
Property Statistics
The tables below include statistics for our properties that we own directly and through our consolidated joint ventures, but do not include our respective ownership interests in properties that we own through our unconsolidated joint ventures or our industrial properties. “Annualized Lease Revenue” is defined in Item 1 of this Annual Report on Form 10-K.
The following table shows lease expirations of our office portfolio as of
December 31, 2011
, during each of the next fifteen years and thereafter, assuming no exercise of renewal options or termination rights.
|
Year of Lease Expiration
|
Annualized
Lease Revenue
(in thousands)
|
Rentable Square
Feet Expiring
(in thousands)
|
Percentage of
Annualized
Lease Revenue
|
|||||||
|
Vacant
|
$
|
—
|
|
2,818
|
|
—
|
%
|
|||
|
2012
|
(1)
|
52,008
|
|
1,615
|
|
9.3
|
%
|
|||
|
2013
|
66,983
|
|
1,583
|
|
12.0
|
%
|
||||
|
2014
|
56,039
|
|
1,691
|
|
10.1
|
%
|
||||
|
2015
|
43,153
|
|
1,536
|
|
7.7
|
%
|
||||
|
2016
|
30,806
|
|
1,081
|
|
5.5
|
%
|
||||
|
2017
|
36,134
|
|
1,209
|
|
6.5
|
%
|
||||
|
2018
|
50,337
|
|
1,686
|
|
9.0
|
%
|
||||
|
2019
|
49,378
|
|
1,789
|
|
8.9
|
%
|
||||
|
2020
|
23,835
|
|
928
|
|
4.3
|
%
|
||||
|
2021
|
19,674
|
|
735
|
|
3.5
|
%
|
||||
|
2022
|
19,311
|
|
738
|
|
3.5
|
%
|
||||
|
2023
|
31,318
|
|
1,398
|
|
5.6
|
%
|
||||
|
2024
|
16,931
|
|
443
|
|
3.0
|
%
|
||||
|
2025
|
4,951
|
|
171
|
|
0.9
|
%
|
||||
|
Thereafter
|
57,045
|
|
1,521
|
|
10.2
|
%
|
||||
|
$
|
557,903
|
|
20,942
|
|
100.0
|
%
|
||||
|
(1)
|
Includes leases with an expiration date of
December 31, 2011
aggregating
288,177
square feet and Annualized Lease Revenue of
$12,131,414
.
|
The following table shows the geographic diversification of our portfolio as of
December 31, 2011
.
20
|
Location
|
Annualized
Lease Revenue
(in thousands)
|
Rentable Square
Feet
(in thousands)
|
Percentage of
Annualized
Lease Revenue
|
|||||||
|
Chicago
|
$
|
125,084
|
|
4,772
|
|
22.4
|
%
|
|||
|
Washington, D.C.
|
120,352
|
|
3,055
|
|
21.6
|
%
|
||||
|
New York
|
87,403
|
|
2,659
|
|
15.7
|
%
|
||||
|
Minneapolis
|
44,120
|
|
1,612
|
|
7.9
|
%
|
||||
|
Los Angeles
|
29,627
|
|
1,144
|
|
5.3
|
%
|
||||
|
Boston
|
25,939
|
|
1,023
|
|
4.6
|
%
|
||||
|
Dallas
|
24,138
|
|
1,276
|
|
4.3
|
%
|
||||
|
Detroit
|
17,850
|
|
930
|
|
3.2
|
%
|
||||
|
Atlanta
|
14,855
|
|
1,042
|
|
2.7
|
%
|
||||
|
Philadelphia
|
14,571
|
|
761
|
|
2.6
|
%
|
||||
|
Houston
|
13,499
|
|
463
|
|
2.4
|
%
|
||||
|
Phoenix
|
9,203
|
|
554
|
|
1.7
|
%
|
||||
|
Central & South Florida
|
7,564
|
|
476
|
|
1.4
|
%
|
||||
|
Nashville
|
7,125
|
|
312
|
|
1.3
|
%
|
||||
|
Other
|
(1)
|
16,573
|
|
863
|
|
2.9
|
%
|
|||
|
$
|
557,903
|
|
20,942
|
|
100.0
|
%
|
||||
|
(1)
|
Not more than
1%
is attributable to any individual geographic region.
|
The following table shows the tenant industry diversification of our portfolio as of
December 31, 2011
.
|
Industry
|
Annualized
Lease Revenue
(in thousands)
|
Leased Square
Footage
(in thousands)
|
Percentage of
Annualized
Lease Revenue
|
|||||||
|
Governmental Agencies
|
$
|
104,465
|
|
2,400
|
|
18.7
|
%
|
|||
|
Depository Institutions
|
49,474
|
|
1,726
|
|
8.9
|
%
|
||||
|
Business Services
|
39,582
|
|
1,393
|
|
7.1
|
%
|
||||
|
Nondepository Credit Institutions
|
31,996
|
|
1,120
|
|
5.7
|
%
|
||||
|
Petroleum Refining & Related Industries
|
31,863
|
|
776
|
|
5.7
|
%
|
||||
|
Insurance Carriers
|
28,887
|
|
1,324
|
|
5.2
|
%
|
||||
|
Engineering, Accounting, Research, Management & Related Services
|
22,654
|
|
703
|
|
4.1
|
%
|
||||
|
Chemicals & Allied Products
|
18,465
|
|
563
|
|
3.3
|
%
|
||||
|
Insurance Agents, Brokers & Services
|
18,330
|
|
604
|
|
3.3
|
%
|
||||
|
Legal Services
|
18,252
|
|
609
|
|
3.3
|
%
|
||||
|
Communications
|
17,991
|
|
610
|
|
3.2
|
%
|
||||
|
Security & Commodity Brokers, Dealers, Exchanges & Services
|
16,838
|
|
607
|
|
3.0
|
%
|
||||
|
Educational Services
|
15,534
|
|
434
|
|
2.8
|
%
|
||||
|
Food & Kindred Products
|
15,070
|
|
428
|
|
2.7
|
%
|
||||
|
Transportation Equipment
|
13,659
|
|
518
|
|
2.4
|
%
|
||||
|
Other
|
(1)
|
114,843
|
|
4,309
|
|
20.6
|
%
|
|||
|
$
|
557,903
|
|
18,124
|
|
100.0
|
%
|
||||
|
(1)
|
Not more than
2%
is attributable to any individual tenant industry.
|
21
The following table shows the tenant diversification of our portfolio as of
December 31, 2011
.
|
Location
|
Number of
Properties
|
Expiration Date(s)
(1)
|
|
Annualized
Lease Revenues
(in thousands)
(2)
|
Percentage of
Annualized
Lease Revenues
|
|||||||
|
U.S. Government
|
9
|
|
Various
|
(3)
|
$
|
73,081
|
|
13.1
|
%
|
|||
|
BP
|
(4)
|
1
|
|
2013
|
|
31,863
|
|
5.7
|
%
|
|||
|
US Bancorp
|
3
|
|
2014/2023
|
(5)
|
26,811
|
|
4.8
|
%
|
||||
|
State of New York
|
1
|
|
2019
|
|
21,568
|
|
3.9
|
%
|
||||
|
Independence Blue Cross
|
1
|
|
2023
|
|
14,571
|
|
2.6
|
%
|
||||
|
Nestle
|
1
|
|
2015
|
|
14,132
|
|
2.5
|
%
|
||||
|
Sanofi-aventis
|
2
|
|
2012
|
|
11,857
|
|
2.1
|
%
|
||||
|
GE
|
2
|
|
2027
|
|
11,453
|
|
2.1
|
%
|
||||
|
Kirkland & Ellis
|
1
|
|
2011
|
|
10,212
|
|
1.8
|
%
|
||||
|
Shaw
|
1
|
|
2018
|
|
9,782
|
|
1.8
|
%
|
||||
|
City of New York
|
1
|
|
2020
|
|
9,447
|
|
1.7
|
%
|
||||
|
Lockheed Martin
|
3
|
|
2014
|
|
9,159
|
|
1.6
|
%
|
||||
|
DDB Needham
|
1
|
|
2018
|
|
8,874
|
|
1.6
|
%
|
||||
|
Gallagher
|
1
|
|
2018
|
|
7,969
|
|
1.4
|
%
|
||||
|
Gemini
|
1
|
|
2021
|
|
7,320
|
|
1.3
|
%
|
||||
|
Caterpillar Financial
|
1
|
|
2022
|
|
7,125
|
|
1.3
|
%
|
||||
|
Marsh USA
|
1
|
|
2011
|
|
6,819
|
|
1.2
|
%
|
||||
|
Harvard University
|
2
|
|
2017
|
|
6,600
|
|
1.2
|
%
|
||||
|
KeyBank
|
2
|
|
2016
|
|
6,398
|
|
1.1
|
%
|
||||
|
Edelman
|
1
|
|
2024
|
|
6,063
|
|
1.1
|
%
|
||||
|
Raytheon
|
2
|
|
2019
|
5,939
|
|
1.1
|
%
|
|||||
|
Harcourt
|
1
|
|
2016
|
5,841
|
|
1.1
|
%
|
|||||
|
Jones Lang LaSalle
|
1
|
|
2017
|
5,641
|
|
1.0
|
%
|
|||||
|
Other
|
(6)
|
Various
|
|
239,378
|
|
42.9
|
%
|
|||||
|
$
|
557,903
|
|
100.0
|
%
|
||||||||
|
(1)
|
Represents the expiration year of the majority of the square footage leased by the tenant.
|
|
(2)
|
Approximately
70%
of our ALR is derived from investment grade companies or government agencies.
|
|
(3)
|
Various expirations ranging from 2012 to 2027.
|
|
(4)
|
BP Corporation sub-lets a majority of its leased space to Aon Corporation.
|
|
(5)
|
US Bancorp's lease at One & Two Meridian Crossings in Richfield, Minneapolis, representing approximately 337,000 square feet and $8.1 million of ALR, expires in 2023. US Bancorp's lease at US Bancorp Center in Minneapolis, Minnesota for 635,000 square feet, representing $18.7 million of ALR, expires in 2014.
|
|
(6)
|
Not more than 1% is attributable to any individual tenant.
|
Certain Restrictions Related to our Properties
Control of certain properties is limited to a certain extent because the properties are owned through joint ventures. In addition, certain of our properties are subject to ground leases and certain properties are held as collateral for debt. Refer to Schedule III listed in the index of Item 15(a) of this report, which details
three
properties subject to ground leases and
twenty-one
properties held as collateral for debt facilities as of
December 31, 2011
.
22
Assertion of Legal Action
In Re Wells Real Estate Investment Trust, Inc. Securities Litigation, Civil Action No. 1:07-cv-00862-CAP
On March 12, 2007, a stockholder filed a class action and derivative complaint in the United States District Court for the District of Maryland against, among others, Piedmont, Piedmont's previous advisors, and certain officers and directors of Piedmont. Upon motion by the defendants, the case was transferred to the United States District Court for the Northern District of Georgia on April 17, 2007.
As subsequently amended and dismissed in part, the complaint alleges violations of Section 14(a), including Rule 14a-9 thereunder, and Section 20(a) of the Securities Exchange Act of 1934, as amended (the "Exchange Act"), based upon allegations that the proxy statement for Piedmont's 2007 internalization transaction (the "Internalization") contains false and misleading statements or omits to state material facts. On February 9, 2011, the plaintiff dismissed its claim for violation of Section 20(a) of the Exchange Act.
As subsequently amended and dismissed in part, the complaint seeks, among other things, (i) certification of the class action; (ii) a judgment declaring the proxy statement false and misleading; (iii) unspecified monetary damages; (iv) to nullify any stockholder approvals obtained during the proxy process; (v) to nullify the Internalization; (vi) cancellation and rescission of any stock issued as consideration in the Internalization, or, in the alternative, rescissory damages; and (vii) the payment of reasonable attorneys' fees and experts' fees. On September 16, 2009, the court granted the plaintiff's motion for class certification.
On December 4, 2009, the parties filed motions for summary judgment. On August 2, 2010, the court entered an order denying the defendants' motion for summary judgment and granting, in part, the plaintiff's motion for partial summary judgment.
On November 17, 2011, the court issued rulings granting several of the plaintiff's pre trial motions to prohibit the defendants from introducing certain evidence, including evidence of the defendants' reliance on advice from their outside legal and financial advisors, and limiting the defendants' ability to relate their subjective views, considerations, and observations during the trial of the case.
On February 23, 2012, the court granted several of defendants' motions, including a motion for reconsideration regarding a motion plaintiff had filed seeking exclusion of certain evidence impacting damages, and motions seeking exclusion of certain evidence proposed to be submitted by plaintiff. The suit has been removed from the court's trial calendar pending resolution of a request for interlocutory appellate review of certain legal rulings made by the court.
We believe that plaintiff's allegations are without merit, and we will continue to vigorously defend this action. Due to the uncertainties inherent in the litigation process, our assessment of the merits of the claim notwithstanding, the risk of material financial loss does exist. Plaintiff is seeking damages of approximately $159 million plus prejudgment interest, which defendants dispute. There are a number of defendants in this case and the allocation of damages, if any, to Piedmont versus the other defendants (including any indemnification rights or obligations of Piedmont with respect to the other defendants) is indeterminable at this time. In addition, up to $15 million of any damages may be recoverable by Piedmont under its insurance policies.
In Re Piedmont Office Realty Trust, Inc. Securities Litigation, Civil Action No. 1:07-cv-02660-CAP
On October 25, 2007, the same stockholder mentioned above filed a second purported class action in the United States District Court for the Northern District of Georgia against Piedmont and its board of directors. The complaint attempts to assert class action claims on behalf of (i) those persons who were entitled to tender their shares pursuant to the tender offer filed with the SEC by Lex-Win Acquisition LLC, a former stockholder, on May 25, 2007, and (ii) all persons who are entitled to vote on the proxy statement filed with the SEC on October 16, 2007.
As subsequently amended and dismissed in part, the complaint alleges, among other things, violations of the federal securities laws, including Sections 14(a) and 14(e) of the Exchange Act and Rules 14a-9 and 14e-2(b) promulgated thereunder based upon allegations regarding (i) the failure to disclose certain information in our amended response to the Lex-Win tender offer and (ii) purported misstatements or omissions in our proxy statement concerning then-existing market conditions, the alternatives to a listing or extension that were explored by the defendants, the results of conversations with potential buyers as to our valuation, and certain details of our share redemption program.
On June 10, 2009, the plaintiffs filed a motion for class certification. The court granted the plaintiffs' motion for class certification on March 10, 2010. Defendants sought and received permission from the Eleventh Circuit Court of Appeals to appeal the class
23
certification order on an interlocutory basis. On April 11, 2011, the Eleventh Circuit Court of Appeals invalidated the district court's order certifying a class and remanded the case to the district court for further proceedings.
On October 21, 2011, the defendants filed a motion to dismiss the third amended complaint. The plaintiffs filed their response in opposition to the defendants' motion to dismiss on November 15, 2011. The defendants filed their reply in support of their motion to dismiss on December 9, 2011. The defendants' motion to dismiss is currently pending before the court.
Discovery is currently stayed pending resolution of the defendants' motion to dismiss.
We believe that plaintiffs' allegations are without merit, and we will continue to vigorously defend this action. Due to the uncertainties inherent in the litigation process, our assessment of the merits of the claim notwithstanding, the risk of material financial loss does exist.
Other Legal Matters
Piedmont is from time to time a party to other legal proceedings, which arise in the ordinary course of its business. We do not believe any of these ordinary course legal proceedings are reasonably likely to have a material adverse effect on our results of operations or financial condition.
Not applicable.
24
Market Information and Holders
Our common stock was listed on the New York Stock Exchange on February 10, 2010 under the symbol “PDM.” Prior to February 10, 2010, none of our common stock was listed on a national securities exchange and there was no established public trading market for such shares.
As of
February 27, 2012
, there were
20,460
co
mmon stockholders of record of our common stock.
The intra-day, high and low sales prices for Piedmont’s common stock during
2010
and
2011
were as follows:
|
|
2011 Quarters
|
||||||||||||||
|
|
First
|
Second
|
Third
|
Fourth
|
|||||||||||
|
High
|
$
|
20.64
|
|
$
|
21.11
|
|
$
|
21.32
|
|
$
|
17.67
|
|
|||
|
Low
|
$
|
18.41
|
|
$
|
18.82
|
|
$
|
15.92
|
|
$
|
14.91
|
|
|||
|
|
2010 Quarters
(1)
|
||||||||||||||
|
|
First
(1)
|
Second
|
Third
|
Fourth
|
|||||||||||
|
High
|
$
|
21.01
|
|
$
|
20.78
|
|
$
|
18.98
|
|
$
|
21.00
|
|
|||
|
Low
|
$
|
14.37
|
|
$
|
17.30
|
|
$
|
15.46
|
|
$
|
17.37
|
|
|||
|
(1)
|
As Piedmont’s stock was not listed on a national securities exchange until February 10, 2010, the high/low sales prices for first quarter 2010 are for the period February 10, 2010 through March 31, 2010.
|
Distributions
We intend to make distributions each taxable year equal to at least 90% of our taxable income and 100% of any taxable capital gains on properties sold during the year. We intend to pay regular quarterly dividend distributions to our stockholders and may choose from the following forms of payment: cash, issuance of stock, or a combination of both. Dividends will be made to those stockholders who are stockholders as of the dividend record dates.
Quarterly dividend distributions paid on all outstanding classes of common stock to our stockholders during the years ended
December 31, 2011
and
2010
are presented below, and all such dividend payments were made in cash:
|
|
2011
|
|||||||||||||||||||||
|
|
First
|
Second
|
Third
|
Fourth
|
Total
|
% of Total
Distribution
|
||||||||||||||||
|
Total cash distributed
|
$
|
54,387
|
|
$
|
54,440
|
|
$
|
54,441
|
|
$
|
54,441
|
|
$
|
217,709
|
|
|||||||
|
Per-share investment income
|
$
|
0.1922
|
|
$
|
0.1922
|
|
$
|
0.1922
|
|
$
|
0.1922
|
|
$
|
0.7688
|
|
61
|
%
|
|||||
|
Per-share return of capital
|
$
|
0.0366
|
|
$
|
0.0366
|
|
$
|
0.0366
|
|
$
|
0.0366
|
|
$
|
0.1464
|
|
12
|
%
|
|||||
|
Per-share capital gains
|
$
|
0.0862
|
|
$
|
0.0862
|
|
$
|
0.0862
|
|
$
|
0.0862
|
|
$
|
0.3448
|
|
27
|
%
|
|||||
|
Total per-share distribution
|
$
|
0.3150
|
|
$
|
0.3150
|
|
$
|
0.3150
|
|
$
|
0.3150
|
|
$
|
1.2600
|
|
100
|
%
|
|||||
|
|
2010
|
|||||||||||||||||||||
|
|
First
|
Second
|
Third
|
Fourth
|
Total
|
% of Total
Distribution
|
||||||||||||||||
|
Total cash distributed
|
$
|
53,777
|
|
$
|
54,388
|
|
$
|
54,388
|
|
$
|
54,387
|
|
$
|
216,940
|
|
|||||||
|
Per-share investment income
|
$
|
0.2172
|
|
$
|
0.2172
|
|
$
|
0.2172
|
|
$
|
0.2172
|
|
$
|
0.8688
|
|
69
|
%
|
|||||
|
Per-share return of capital
|
$
|
0.0978
|
|
$
|
0.0978
|
|
$
|
0.0978
|
|
$
|
0.0978
|
|
$
|
0.3912
|
|
31
|
%
|
|||||
|
Per-share capital gains
|
$
|
—
|
|
$
|
—
|
|
$
|
—
|
|
$
|
—
|
|
$
|
—
|
|
—
|
%
|
|||||
|
Total per-share distribution
|
$
|
0.3150
|
|
$
|
0.3150
|
|
$
|
0.3150
|
|
$
|
0.3150
|
|
$
|
1.2600
|
|
100
|
%
|
|||||
25
Performance Graph
The following graph compares the cumulative total return of Piedmont’s common stock with the S&P 500 Index, the FTSE NAREIT Equity REITs Index, and the FTSE NAREIT Equity Office Index for the period beginning on February 10, 2010 (Piedmont’s initial listing of its common stock on the NYSE) through
December 31, 2011
. The graph assumes a $100 investment in each of the indices on February 10, 2010 and the reinvestment of all dividends.
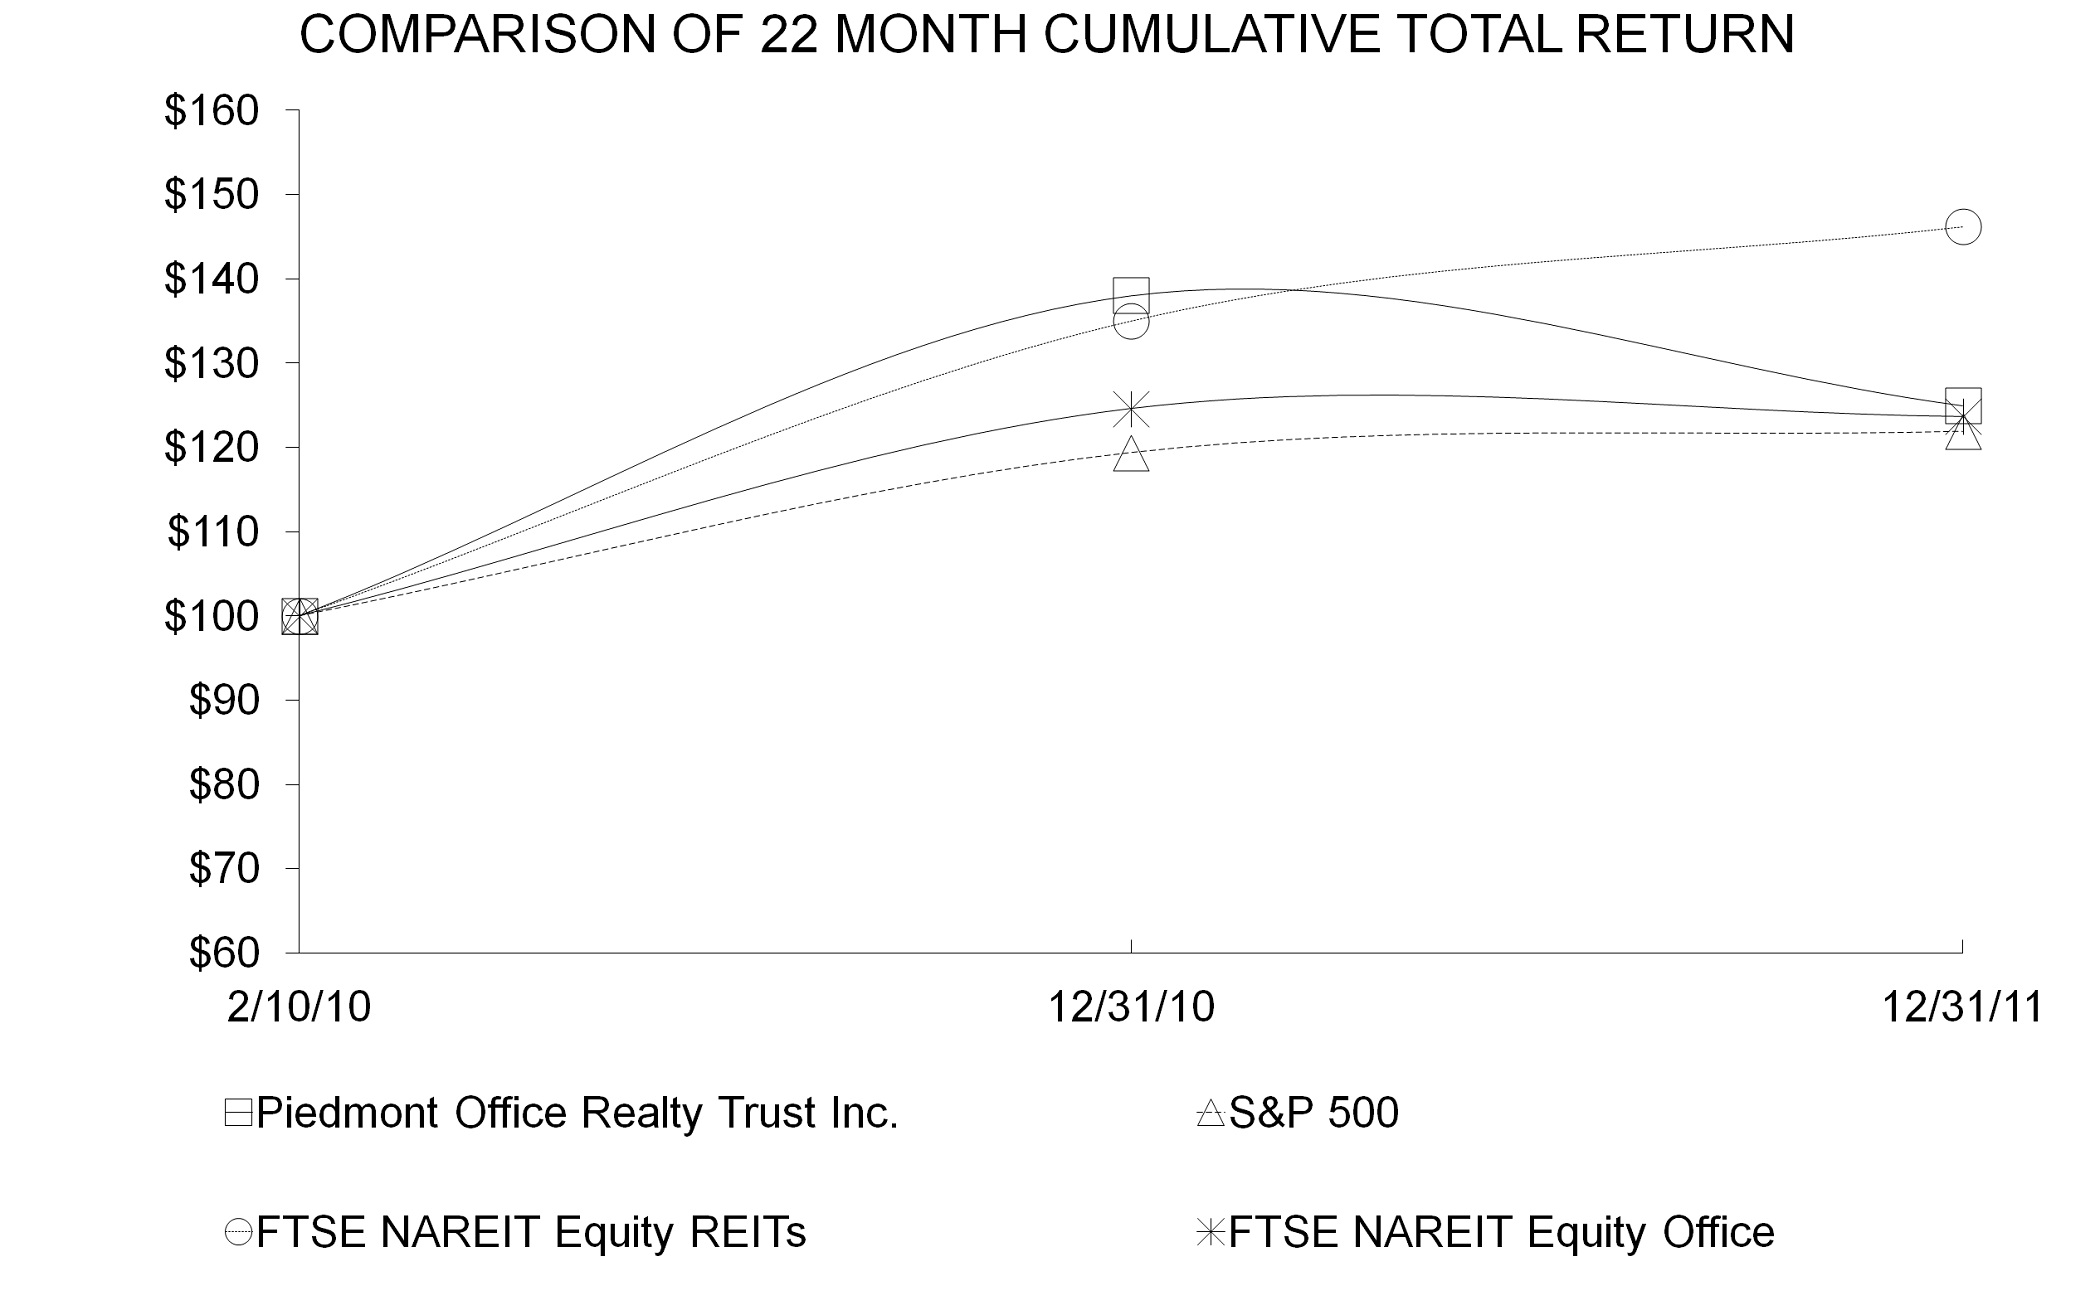
Comparison of Cumulative Total Return of One or More Companies, Peer Groups, Industry Indices, and/or Broad Markets
|
|
For the Period from
February 10, 2010
to December 31, 2011
|
||||||||
|
|
2/10/2010
|
12/31/2010
|
12/31/2011
|
||||||
|
Piedmont Office Realty Trust Inc.
|
$
|
100.00
|
|
$
|
138.02
|
|
$
|
124.94
|
|
|
S&P 500
|
$
|
100.00
|
|
$
|
119.36
|
|
$
|
121.88
|
|
|
FTSE NAREIT Equity REITs
|
$
|
100.00
|
|
$
|
134.99
|
|
$
|
146.19
|
|
|
FTSE NAREIT Equity Office
|
$
|
100.00
|
|
$
|
124.61
|
|
$
|
123.66
|
|
The performance graph above is being furnished as part of this Annual Report solely in accordance with the requirement under Rule 14a-3(b)(9) to furnish Piedmont’s stockholders with such information and, therefore, is not deemed to be filed, or incorporated by reference in any filing, by Piedmont under the Securities Act of 1933 or the Securities Exchange Act of 1934.
Purchases of Equity Securities By the Issuer and Affiliated Purchasers
During the quarter ended
December 31, 2011
, Piedmont repurchased shares of its common stock in the open market, in order to reissue such shares under its dividend reinvestment plan (the “DRP”), as well as repurchasing and retiring shares as part of our announced stock repurchase program during the fourth quarter of 2011.
Of the approximately 433,000 shares repurchased during the fourth quarter of 2011,
199,400
shares (at an average price of
$16.24
per share) related to repurchase of our common stock pursuant to our announced stock repurchase program, and
233,794
shares
26
(at an average price of
$17.45
per share) related to shares purchased and conveyed to participants in the DRP. The aggregate stock repurchases for the quarter ended December 31, 2011 are as follows:
|
Period
|
Total Number of
Shares Purchased
(in 000’s)
|
Average Price Paid
per Share
|
Total Number of
Shares Purchased
as Part of
Publicly Announced
Program
(in 000’s)
(1)
|
Maximum Approximate
Dollar Value of Shares
Available That May
Yet Be Purchased
Under the Program
(in 000’s)
(1)
|
|
|||||||||
|
October 1, 2011 to October 31, 2011
|
—
|
|
—
|
|
—
|
|
—
|
|
|
|||||
|
November 1, 2011 to November 30, 2011
|
—
|
|
—
|
|
—
|
|
—
|
|
|
|||||
|
December 1, 2011 to December 31, 2011
|
433
|
|
$
|
16.91
|
|
199
|
|
$
|
296,756
|
|
(1)
|
|||
|
Total
|
433
|
|
$
|
16.91
|
|
199
|
|
$
|
296,756
|
|
(1)
|
|||
|
(1)
|
Under our DRP, we have the option to either issue shares that we purchase in the open market or issue shares directly from Piedmont from authorized but unissued shares. Such election will take place at the settlement of each quarterly dividend in which there are participants in our DRP, and may change from quarter to quarter based on our judgment of the best use of proceeds for Piedmont. Therefore, the "Maximum Approximate Dollar Value of Shares Available That May Yet Be Purchased Under the Program" relates only to the previously announced stock repurchase program, which expires on November 2, 2013.
|
27
The following sets forth a summary of our selected financial data as of and for the years ended
December 31, 2011
,
2010
,
2009
,
2008
, and
2007
(in thousands except for per-share data). Our selected financial data is prepared in accordance with U.S. generally accepted accounting principles (“GAAP”), except as noted below.
|
2011
|
2010
|
2009
|
2008
|
2007
|
|||||||||||||||
|
Statement of Income Data
(1)
:
|
|||||||||||||||||||
|
Total revenues
|
$
|
541,642
|
|
$
|
533,040
|
|
$
|
542,652
|
|
$
|
561,563
|
|
$
|
532,127
|
|
||||
|
Property operating costs
|
$
|
208,711
|
|
$
|
196,875
|
|
$
|
207,018
|
|
$
|
203,703
|
|
$
|
200,819
|
|
||||
|
Depreciation and amortization
|
$
|
159,721
|
|
$
|
135,296
|
|
$
|
143,826
|
|
$
|
142,983
|
|
$
|
152,420
|
|
||||
|
Impairment loss on real estate assets
|
$
|
—
|
|
$
|
—
|
|
$
|
35,063
|
|
$
|
—
|
|
$
|
—
|
|
||||
|
General and administrative expenses
|
$
|
24,838
|
|
$
|
28,388
|
|
$
|
26,656
|
|
$
|
30,392
|
|
$
|
27,835
|
|
||||
|
Other income/(expense)
|
$
|
(58,853
|
)
|
$
|
(60,367
|
)
|
$
|
(66,953
|
)
|
$
|
(66,574
|
)
|
$
|
(52,131
|
)
|
||||
|
Income from continuing operations
(1)
|
$
|
89,519
|
|
$
|
112,114
|
|
$
|
63,136
|
|
$
|
117,911
|
|
$
|
98,922
|
|
||||
|
Income from discontinued operations
(1)
|
$
|
135,537
|
|
$
|
8,280
|
|
$
|
11,579
|
|
$
|
13,418
|
|
$
|
34,703
|
|
||||
|
Net income attributable to noncontrolling interest
|
$
|
(15
|
)
|
$
|
(15
|
)
|
$
|
(15
|
)
|
$
|
(15
|
)
|
$
|
(15
|
)
|
||||
|
Net income attributable to Piedmont
|
$
|
225,041
|
|
$
|
120,379
|
|
$
|
74,700
|
|
$
|
131,314
|
|
$
|
133,610
|
|
||||
|
Cash Flows:
|
|||||||||||||||||||
|
Cash flows from operations
|
$
|
270,343
|
|
$
|
275,750
|
|
$
|
281,543
|
|
$
|
296,515
|
|
$
|
282,527
|
|
||||
|
Cash flows provided by/(used in) investing activities
|
$
|
33,732
|
|
$
|
(80,194
|
)
|
$
|
(68,666
|
)
|
$
|
(191,926
|
)
|
$
|
(71,157
|
)
|
||||
|
Cash flows used in financing activities (including dividends paid)
|
$
|
(221,103
|
)
|
$
|
(148,842
|
)
|
$
|
(223,206
|
)
|
$
|
(149,272
|
)
|
$
|
(190,485
|
)
|
||||
|
Dividends paid to stockholders and distributions to noncontrolling interest
|
$
|
(220,365
|
)
|
$
|
(216,988
|
)
|
$
|
(198,951
|
)
|
$
|
(279,418
|
)
|
$
|
(283,196
|
)
|
||||
|
Per-Share Data
(1)
:
|
|||||||||||||||||||
|
Per weighted-average common share data:
|
|||||||||||||||||||
|
Income from continuing operations per share—basic
|
$
|
0.52
|
|
$
|
0.66
|
|
$
|
0.40
|
|
$
|
0.74
|
|
$
|
0.62
|
|
||||
|
Income from continuing operations per share—diluted
|
$
|
0.52
|
|
$
|
0.65
|
|
$
|
0.40
|
|
$
|
0.74
|
|
$
|
0.62
|
|
||||
|
Income from discontinued operations per share—basic and diluted
|
$
|
0.78
|
|
$
|
0.05
|
|
$
|
0.07
|
|
$
|
0.08
|
|
$
|
0.21
|
|
||||
|
Net income attributable to Piedmont per share—basic
|
$
|
1.30
|
|
$
|
0.71
|
|
$
|
0.47
|
|
$
|
0.82
|
|
$
|
0.83
|
|
||||
|
Net income attributable to Piedmont per share—diluted
|
$
|
1.30
|
|
$
|
0.70
|
|
$
|
0.47
|
|
$
|
0.82
|
|
$
|
0.83
|
|
||||
|
Dividends declared
|
$
|
1.2600
|
|
$
|
1.2600
|
|
$
|
1.2600
|
|
$
|
1.7604
|
|
$
|
1.7604
|
|
||||
|
Weighted-average shares outstanding—basic (in thousands)
|
172,765
|
|
170,753
|
|
158,419
|
|
159,586
|
|
160,698
|
|
|||||||||
|
Weighted-average shares outstanding—diluted (in thousands)
|
172,981
|
|
170,967
|
|
158,581
|
|
159,722
|
|
160,756
|
|
|||||||||
|
Balance Sheet Data (at period end):
|
|||||||||||||||||||
|
Total assets
|
$
|
4,447,834
|
|
$
|
4,373,480
|
|
$
|
4,395,345
|
|
$
|
4,557,330
|
|
$
|
4,579,746
|
|
||||
|
Total stockholders’ equity
|
$
|
2,773,428
|
|
$
|
2,773,454
|
|
$
|
2,606,882
|
|
$
|
2,702,294
|
|
$
|
2,886,991
|
|
||||
|
Outstanding debt
|
$
|
1,472,525
|
|
$
|
1,402,525
|
|
$
|
1,516,525
|
|
$
|
1,523,625
|
|
$
|
1,301,530
|
|
||||
|
Funds from Operations Data
(2)
:
|
|||||||||||||||||||
|
Net income attributable to Piedmont
|
$
|
225,041
|
|
$
|
120,379
|
|
$
|
74,700
|
|
$
|
131,314
|
|
$
|
133,610
|
|
||||
|
Depreciation of real estate assets—wholly-owned properties and unconsolidated partnerships
|
110,421
|
|
105,107
|
|
106,878
|
|
100,849
|
|
96,432
|
|
|||||||||
|
Amortization of lease costs—wholly-owned properties and unconsolidated partnerships
|
60,132
|
|
45,334
|
|
57,708
|
|
62,767
|
|
77,232
|
|
|||||||||
|
Gain on consolidation of VIE
|
(1,532
|
)
|
—
|
|
—
|
|
—
|
|
—
|
|
|||||||||
|
Loss on impairment of real estate assets—wholly-owned properties and unconsolidated partnerships
|
—
|
|
9,640
|
|
37,633
|
|
2,088
|
|
—
|
|
|||||||||
|
(Gain)/loss on sale—wholly-owned properties
|
(122,657
|
)
|
817
|
|
—
|
|
—
|
|
(20,680
|
)
|
|||||||||
|
(Gain)/loss on sale—unconsolidated partnerships
|
(116
|
)
|
(25
|
)
|
—
|
|
—
|
|
(1,129
|
)
|
|||||||||
|
Funds From Operations
(2)
|
$
|
271,289
|
|
$
|
281,252
|
|
$
|
276,919
|
|
$
|
297,018
|
|
$
|
285,465
|
|
||||
|
Acquisition costs
|
1,347
|
|
600
|
|
—
|
|
—
|
|
—
|
|
|||||||||
|
(Gain)/loss on extinguishment of debt
|
(1,039
|
)
|
—
|
|
—
|
|
—
|
|
164
|
|
|||||||||
|
Core Funds From Operations
(2)
|
$
|
271,597
|
|
$
|
281,852
|
|
$
|
276,919
|
|
$
|
297,018
|
|
$
|
285,629
|
|
||||
|
(1)
|
Prior period amounts have been adjusted to conform with the current period presentation, including classifying revenues from sold properties as discontinued operations, as well as all share and per share amounts being adjusted to give effect to the Recapitalization, for all periods presented.
|
28
|
(2)
|
Net income calculated in accordance with GAAP is the starting point for calculating Funds from Operations (“FFO”) and Core Funds From Operations (“Core FFO”). FFO and Core FFO are non-GAAP financial measures and should not be viewed as an alternative measurement of our operating performance to net income. We believe that FFO and Core FFO are beneficial indicators of the performance of an equity REIT. Specifically, FFO calculations exclude factors such as depreciation and amortization of real estate assets, losses on impairment of real estate assets (including our proportionate share of any impairment charges related to investments in unconsolidated joint ventures), and gains or losses from sales of operating real estate assets. As such factors can vary among owners of identical assets in similar conditions based on historical cost accounting and useful-life estimates, FFO and Core FFO may provide valuable comparisons of operating performance between periods and with other REITs. Management believes that accounting for real estate assets in accordance with GAAP implicitly assumes that the value of real estate assets diminishes predictably over time. Since real estate values have historically risen or fallen with market conditions, many industry investors and analysts have considered the presentation of operating results for real estate companies that use historical cost accounting to be insufficient by themselves. As a result, we believe that the use of FFO and Core FFO, together with the required GAAP presentation, provides a more complete understanding of our performance relative to our competitors and a more informed and appropriate basis on which to make decisions involving operating, financing, and investing activities. We calculate FFO in accordance with the current National Association of Real Estate Investment Trusts (“NAREIT”) definition. NAREIT currently defines FFO as net income (computed in accordance with GAAP), excluding gains or losses from sales of property and impairment charges, plus depreciation and amortization on real estate assets, and after the same adjustments for investments in unconsolidated joint ventures. However, other REITs may not define FFO in accordance with the NAREIT definition, or may interpret the current NAREIT definition differently than we do; therefore, our computation of FFO may not be comparable to such other REITs. Further, we calculate Core FFO as FFO (computed in accordance with NAREIT) excluding acquisition costs and other significant non-recurring income or charges, such as a gain on early extinguishment of debt.
|
The following discussion and analysis should be read in conjunction with the audited consolidated financial statements and notes thereto as of
December 31, 2011
and
2010
, and for the years ended
December 31, 2011
,
2010
, and
2009
included elsewhere in this Annual Report on Form 10-K. See also “Cautionary Note Regarding Forward-Looking Statements” preceding Part I of this report and “Risk Factors” set forth in Item 1A. of this report.
Overview
We are a fully integrated, self-managed real estate investment trust specializing in the acquisition, ownership, management, development, and disposition of primarily high-quality Class A office buildings located in major U.S. office markets and leased primarily to high-credit-quality tenants. We operate as a real estate investment trust for federal income tax purposes.
Our common stock became listed on the New York Stock Exchange in February of 2010 and based on our
December 31, 2011
equity market capitalization of
$2.9 billion
, Piedmont is the
fourth
largest office REIT in the United States in comparison to the constituents of the Bloomberg U.S. Office REIT Index.
Our portfolio of commercial office buildings is primarily leased to large, credit-worthy, government and corporate tenants, and the majority of our revenue is derived from our office properties in the ten largest U.S. office markets based on rentable square footage, with the most significant concentration in the premier office markets of Chicago, Washington, D.C., and the New York metropolitan area.
In conjunction with our listing and concurrent offering in
February 2010
, we also recapitalized our common stock pursuant to a stockholder-approved Recapitalization. The Recapitalization was effected on a pro rata basis with respect to all of our stockholders and had the effect of reducing the total number of outstanding shares of our common stock without affecting any stockholder’s proportionate ownership (except for any changes resulting from the payment of cash in lieu of fractional shares). In addition, the Recapitalization created four classes of stock which were each ultimately converted into shares which were listed on NYSE over the following twelve months with the final shares listing in January 2011.
Effective June 30, 2011, our board of directors approved Articles Supplementary and Articles of Amendment to Piedmont's Third Articles of Amendment and Restatement. Together, the Articles Supplementary and Articles of Amendment (1) reclassified and designated all of our authorized but unissued shares of Class B common stock as Class A common stock and then (2) changed the designation of our Class A common stock to Common Stock. The Articles Supplementary and Articles of Amendment were each filed with the State Department of Assessments and Taxation of Maryland on June 30, 2011 and were effective upon such filing. As a result, we now have one class of common stock. Share and per share information for all prior periods presented has been restated for the effects of the Recapitalization and subsequent reclassification and designation.
As of
December 31, 2011
, we owned and operated
79
office properties (excluding
five
buildings owned through unconsolidated joint ventures and
two
industrial buildings), which are located in
18
metropolitan areas. These
79
office properties comprise
20.9 million
square feet, primarily Class A commercial office space, and were
86.5%
and
89.2%
leased as of
December 31, 2011
and
2010
, respectively.
29
Liquidity and Capital Resources
We intend to use cash flows generated from the operation of our wholly-owned properties, distributions from our unconsolidated joint ventures, proceeds from selective property dispositions, and proceeds from our existing $500 Million Unsecured Facility as our primary sources of immediate liquidity. Our existing $500 Million Unsecured Facility matures in August of 2012 and we anticipate that we will seek a comparable replacement facility before the August 2012 maturity date of the existing facility. In addition, depending on the timing and volume of our property acquisition and disposition activities, we may seek other financing opportunities (such as issuance of additional equity or debt securities or additional borrowings from third-party lenders) afforded to us based on our relatively low leverage and quality asset base as additional sources of capital; however, the availability and attractiveness of terms for these sources of capital is highly dependent on market conditions. As of the time of this filing, we had
$15.0 million
outstanding under our $500 Million Unsecured Facility. As a result, we had approximately
$460.8 million
under this facility available as of the date of this filing for future borrowing (approximately
$24.2 million
of capacity is reserved as security for outstanding letters of credit required by various third parties).
We estimate that our most immediate use of capital will be to fund capital expenditures for our existing portfolio of properties. These expenditures include two types of specifically identified building improvement projects: (i) general repair and maintenance projects that we as the owner may choose to perform at any of our various properties and (ii) tenant improvement allowances and leasing commissions negotiated as part of executed leases with our tenants. Both the timing and magnitude of general repair and maintenance projects are subject to our discretion. We anticipate funding approximately
$143.8 million
in unrecorded contractual obligations for tenant improvements related to our existing lease portfolio over the respective lease term, the majority of which we estimate may be required to be funded over the next several years. For many of our leases, the timing of the actual funding of these tenant improvements is largely dependent upon tenant requests for reimbursement. In some cases, these obligations may expire with the respective lease, without further recourse to us. Finally, we also anticipate funding certain tenant improvements and leasing commissions related to anticipated re-leasing efforts for several of our large tenants as they approach their lease expiration dates in the next few years. Both the timing and magnitude of these amounts are subject to change as competitive market conditions at the time of lease negotiations dictate.
Subject to the identification and availability of attractive investment opportunities and our ability to consummate additional acquisitions on satisfactory terms, acquiring new assets compatible with our investment strategy could also be a significant use of capital. Additionally, we expect to use funds to make scheduled debt service payments and/or debt repayments when such obligations become due. Subsequent to year end we fully repaid the $140.0 million 500 W. Monroe Mortgage Loan. Our $45 million mortgage note secured by the 4250 North Fairfax building (the "4250 North Fairfax Note") also matures in June of 2012. Other than the 4250 North Fairfax Note and the $500 Million Unsecured Facility, we have no other pending debt maturities until 2014.
Our primary focus is to achieve an attractive long-term, risk-adjusted return for our stockholders. Competition to attract and retain high-credit-quality tenants remains intense due to general economic conditions. At the same time, several large leases at our properties expired in the past year or are scheduled to expire over the next three years. In some cases we have had to accept lower market driven rental rates and grant larger tenant improvement packages to renew leases or secure new tenants than a stronger economic climate might have produced. We expect the commencement of certain recently executed leases with lower rental rates and the downtime we will experience while re-tenanting certain properties to put pressure on 2012 cash flow. As a result, on February 28, 2012, our board of directors declared the quarterly dividend for the first quarter of 2012 of $0.20 per share which approximates our estimated annual taxable income for 2012 of $0.80 per share.
The amount and form of payment (cash or stock issuance) of future dividends to be paid to our stockholders will continue to be largely dependent upon (i) the amount of cash generated from our operating activities; (ii) our expectations of future cash flows; (iii) our determination of near-term cash needs for debt repayments and selective acquisitions of new properties; (iv) the timing of significant expenditures for tenant improvements and general property capital improvements; (v) long-term payout ratios for comparable companies; (vi) our ability to continue to access additional sources of capital, including potential sales of our properties; and (vii) the amount required to be distributed to maintain our status as a REIT. Given the fluctuating nature of cash flows and expenditures, we may periodically borrow funds on a short-term basis to cover timing differences in cash collections and cash receipts.
30
Results of Operations
Comparison of the year ended
December 31, 2011
vs. the year ended
December 31, 2010
Our income from continuing operations
decreased
from
2010
to
2011
primarily due to the increase in property operating costs, and increased depreciation and amortization expense associated with properties acquired during
2010
and
2011
. Although rental income increased due to properties acquired during the same period, such additional rental income was partially offset by lower rental rates and reductions in leased space at certain of our existing properties.
The following table sets forth selected data from our consolidated statements of income for the years ended
December 31, 2011
and
2010
, respectively, as well as each balance as a percentage of total revenues for the years presented (dollars in millions):
|
December 31, 2011
|
%
|
December 31, 2010
|
%
|
$ Increase
(Decrease)
|
|||||||||||||
|
Revenue:
|
|||||||||||||||||
|
Rental income
|
$
|
419.1
|
|
$
|
408.4
|
|
$
|
10.7
|
|
||||||||
|
Tenant reimbursements
|
115.9
|
|
114.8
|
|
1.1
|
|
|||||||||||
|
Property management fee revenue
|
1.6
|
|
3.2
|
|
(1.6
|
)
|
|||||||||||
|
Other rental income
|
5.0
|
|
6.7
|
|
(1.7
|
)
|
|||||||||||
|
Total revenues
|
541.6
|
|
100
|
%
|
533.1
|
|
100
|
%
|
8.5
|
|
|||||||
|
Expense:
|
|||||||||||||||||
|
Property operating costs
|
208.7
|
|
39
|
%
|
196.9
|
|
38
|
%
|
11.8
|
|
|||||||
|
Depreciation
|
104.8
|
|
19
|
%
|
97.3
|
|
18
|
%
|
7.5
|
|
|||||||
|
Amortization
|
54.9
|
|
10
|
%
|
38.0
|
|
7
|
%
|
16.9
|
|
|||||||
|
General and administrative expense
|
24.8
|
|
5
|
%
|
28.4
|
|
4
|
%
|
(3.6
|
)
|
|||||||
|
Real estate operating income
|
148.4
|
|
27
|
%
|
172.5
|
|
32
|
%
|
(24.1
|
)
|
|||||||
|
Other income (expense):
|
|||||||||||||||||
|
Interest expense
|
(65.8
|
)
|
12
|
%
|
(66.5
|
)
|
12
|
%
|
(0.7
|
)
|
|||||||
|
Interest and other income
|
2.8
|
|
—
|
%
|
3.5
|
|
1
|
%
|
(0.7
|
)
|
|||||||
|
Equity in income of unconsolidated joint ventures
|
1.6
|
|
—
|
%
|
2.6
|
|
—
|
%
|
(1.0
|
)
|
|||||||
|
Gain on consolidation of variable interest entity
|
1.5
|
|
—
|
%
|
—
|
|
—
|
%
|
1.5
|
|
|||||||
|
Gain on extinguishment of debt
|
1.0
|
|
—
|
%
|
—
|
|
—
|
%
|
1.0
|
|
|||||||
|
Income from continuing operations
|
$
|
89.5
|
|
17
|
%
|
$
|
112.1
|
|
21
|
%
|
$
|
(22.6
|
)
|
||||
|
Income from discontinued operations
|
$
|
135.5
|
|
$
|
8.3
|
|
$
|
127.2
|
|
||||||||
Revenue
Rental income for the year ended
December 31, 2011
increased
to approximately
$419.1 million
, as compared to
$408.4 million
in the prior year. Approximately $24.2 million of the variance is due to properties acquired during 2010 and 2011, as well as increased occupancy at our Piedmont Pointe I and II buildings in Bethesda, Maryland. However, this increase was partially offset by a reduction in leased space due to lease terminations, primarily at our 1201 Eye Street building in Washington, D.C., and lease expirations at our Las Colinas Corporate Center II building in Irving, Texas, and our Windy Point II building in Schaumburg, Illinois. We also experienced lower rates for leases commencing in late 2010 or subsequent to December 31, 2010, primarily related to leases at our 1200 Crown Colony Drive building in Quincy, Massachusetts and our 150 West Jefferson building in Detroit, Michigan, which further offset the aforementioned increases in rental revenues.
Tenant reimbursements
increased
from approximately
$114.8 million
for the year ended
December 31, 2010
to approximately
$115.9 million
for the year ended
December 31, 2011
primarily due to properties acquired during 2010 and 2011, which accounts for approximately $10.0 million of the increase in tenant reimbursements. This variance was largely offset by a decrease in property tax reimbursements due to successful appeals of the assessed values at several of our buildings of approximately $6.5 million as well as a reduction in leased space primarily due to a significant lease expiration at our Windy Point II building.
Other rental income is comprised primarily of income recognized for lease terminations and restructurings. Unlike the majority of our rental income, which is recognized ratably over long-term contracts, lease termination income is recognized once we have
31
completed our obligation to provide space to the tenant. Other rental income of approximately
$5.0 million
for the year ended
December 31, 2011
relates primarily to a lease termination at our 1201 Eye Street building of approximately $2.6 million, as well as lease terminations at our 1075 West Entrance Drive building in Auburn Hills, Michigan, US Bancorp Center, and our Crescent Ridge II building located in Minnetonka, Minnesota. Prior year other rental income relates primarily to a lease termination at our Chandler Forum building in Chandler, Arizona of approximately $3.4 million, as well as lease terminations at our 110 Hidden Lake Circle building in Duncan, South Carolina and our Aon Center building in Chicago, Illinois. We do not expect such income to be comparable in future periods, as it will be dependent upon the exercise of lease terminations by tenants and/or the execution of restructuring agreements that may either not be in our control, or are deemed by management to be in the best interest of the portfolio over the long term.
Expense
Property operating costs
increased
approximately
$11.8 million
for the year ended
December 31, 2011
compared to the same period in the prior year. This variance is due primarily to properties acquired during 2010 and 2011, which accounts for an approximate $14.9 million increase in property costs. This variance was partially offset by lower estimated property tax expense of approximately $3.3 million as a result of successful appeals of the assessed values at several of our buildings.
Depreciation expense
increased
approximately
$7.5 million
for the year ended
December 31, 2011
compared to the same period in the prior year. The variance is primarily attributable to properties acquired during 2010 and 2011, comprising approximately $5.3 million of the increase. Additionally, new tenant improvements and building expenditures capitalized at our existing properties subsequent to
December 31, 2010
resulted in additional depreciation expense of approximately $2.0 million.
Amortization expense
increased
approximately
$16.9 million
for the year ended
December 31, 2011
compared to the same period in the prior year. The increase is primarily attributable to properties acquired during 2010 and 2011, accounting for approximately $19.2 million of the increase, as well as acceleration of amortization expense on certain lease intangible assets related to various lease terminations at certain of our buildings. The variance is partially offset by lower amortization expense recognized for lease intangible assets that became fully amortized subsequent to
December 31, 2010
.
General and administrative expenses
decreased
approximately
$3.6 million
for the year ended
December 31, 2011
compared to the prior year. The decrease is primarily attributable to a change in our transfer agent in January 2011 and costs associated with our Recapitalization, listing of our shares on the NYSE, and other related investor support expenses in 2010. The decrease was partially offset by higher legal fees related to our defense of ongoing litigation.
Other Income (Expense)
Interest expense
decreased
approximately
$0.7 million
for the year ended
December 31, 2011
as compared to the prior year primarily due to a decrease in the weighted average interest rate for our outstanding debt in the second half of 2011 after the $250 Million Unsecured Term Loan matured in June and was replaced with borrowings on the $500 Million Unsecured Facility. This decrease was partially offset by additional interest expense related to the 500 W. Monroe Loans assumed in March 2011.
Interest and other income/(expense)
decreased
approximately
$0.7 million
for the year ended
December 31, 2011
as compared to the prior year. The variance is attributable to an increase in acquisition costs of approximately $0.7 million, due to greater building acquisition activity in the current period.
Equity in income of unconsolidated joint ventures
decreased
approximately
$1.0 million
for the year ended
December 31, 2011
as compared to the prior year as a result of the disposition of two unconsolidated joint venture properties in 2011; the 360 Interlocken building in Broomfield, Colorado, and the 47300 Kato Road building in Fremont, California. We expect equity in income of unconsolidated joint ventures to decrease as our unconsolidated joint ventures approach their stated dissolution periods.
The approximate
$1.5 million
gain on the consolidation of our VIE recognized during the year ended
December 31, 2011
is the net result of recording the estimated fair value of the net assets associated with taking ownership of the 500 W. Monroe building in Chicago, Illinois through foreclosure.
The approximate
$1.0 million
gain on the extinguishment of debt during 2011 is the result of our paying $43.9 million to the respective lenders in full satisfaction of the $45 Million 500 W. Monroe Mezzanine I Loan-A Participation. Piedmont did not incur a defeasance or yield maintenance penalty but did incur approximately $0.1 million of expense associated with the accelerated amortization of capitalized finance costs related to the loan.
Income from continuing operations per share on a fully diluted basis
decreased
from
$0.65
for the year ended
December 31, 2010
to
$0.52
for the year ended
December 31, 2011
primarily due to the increase in property operating costs, depreciation and
32
amortization expense associated with properties acquired during 2010 and 2011. Although rental income increased due to properties acquired during the same period, such rental income was negatively impacted by lower rental rates and reductions in leased space at certain of our existing properties. Additionally, we recognized non-recurring, non-cash gains of approximately
$1.5 million
and
$1.0 million
related to the consolidation of the VIE containing the 500 W. Monroe building and the early extinguishment of the $45 Million 500 W. Monroe Mezzanine I Loan- A Participation, respectively, during the year ended December 31, 2011.
Discontinued Operations
In accordance with GAAP, we have classified the operations of the 111 Sylvan Avenue building in Englewood Cliffs, New Jersey, the Eastpointe Corporate Center in Issaquah, Washington, the 5000 Corporate Court building in Holtsville, New York, and the 35 West Wacker Drive building in Chicago, Illinois as discontinued operations for all periods presented. Income from discontinued operations increased approximately $127.3 million for the year ended
December 31, 2011
compared to the same period in the prior year. We realized a combined gain on the sale of our Eastpointe Corporate Center, 5000 Corporate Court building, and the 35 West Wacker Drive building of approximately
$122.7 million
during the current period. There was no activity in the current period at the 111 Sylvan Avenue building as the property was sold in December 2010. We do not expect that income from discontinued operations will be comparable to future periods, as such income is subject to the timing and existence of future property dispositions.
Comparison of the year ended
December 31, 2010
vs. the year ended
December 31, 2009
Our income from continuing operations
increased
from
2009
to
2010
primarily due to the recognition of a non-recurring impairment charge of approximately
$35.1 million
in
2009
, and lower operating expenses at several of our buildings in
2010
, primarily related to lower estimated property tax assessments.
The following table sets forth selected data from our consolidated statements of income for the years ended
December 31, 2010
and
2009
, respectively, as well as each balance as a percentage of total revenues for the years presented (dollars in millions):
|
December 31, 2010
|
%
|
December 31, 2009
|
%
|
$ Increase
(Decrease)
|
|||||||||||||
|
Revenue:
|
|||||||||||||||||
|
Rental income
|
$
|
408.4
|
|
$
|
409.9
|
|
$
|
(1.5
|
)
|
||||||||
|
Tenant reimbursements
|
114.8
|
|
126.9
|
|
(12.1
|
)
|
|||||||||||
|
Property management fee revenue
|
3.2
|
|
3.1
|
|
0.1
|
|
|||||||||||
|
Other rental income
|
6.7
|
|
2.8
|
|
3.9
|
|
|||||||||||
|
Total revenues
|
533.1
|
|
100
|
%
|
542.7
|
|
100
|
%
|
(9.6
|
)
|
|||||||
|
Expense:
|
|||||||||||||||||
|
Property operating costs
|
196.9
|
|
39
|
%
|
207.0
|
|
38
|
%
|
(10.1
|
)
|
|||||||
|
Depreciation
|
97.3
|
|
19
|
%
|
97.5
|
|
18
|
%
|
(0.2
|
)
|
|||||||
|
Amortization
|
38.0
|
|
10
|
%
|
46.3
|
|
9
|
%
|
(8.3
|
)
|
|||||||
|
Impairment loss on real estate assets
|
—
|
|
—
|
%
|
35.1
|
|
6
|
%
|
(35.1
|
)
|
|||||||
|
General and administrative expense
|
28.4
|
|
5
|
%
|
26.7
|
|
5
|
%
|
1.7
|
|
|||||||
|
Real estate operating income
|
172.5
|
|
27
|
%
|
130.1
|
|
24
|
%
|
42.4
|
|
|||||||
|
Other income (expense):
|
|||||||||||||||||
|
Interest expense
|
(66.5
|
)
|
12
|
%
|
(71.5
|
)
|
13
|
%
|
(5.0
|
)
|
|||||||
|
Interest and other income
|
3.5
|
|
—
|
%
|
4.4
|
|
1
|
%
|
(0.9
|
)
|
|||||||
|
Equity in income of unconsolidated joint ventures
|
2.6
|
|
—
|
%
|
0.1
|
|
—
|
%
|
2.5
|
|
|||||||
|
Income from continuing operations
|
$
|
112.1
|
|
17
|
%
|
$
|
63.1
|
|
12
|
%
|
$
|
49.0
|
|
||||
|
Income from discontinued operations
|
$
|
8.3
|
|
$
|
11.6
|
|
$
|
(3.3
|
)
|
||||||||
Revenue
Rental income remained relatively flat for the year ended
December 31, 2010
, approximately
$408.4 million
, as compared to the year ended
December 31, 2009
, approximately
$409.9 million
. However, there was lower occupancy during 2010 at our Aon Center building and the 110 Hidden Lake Circle building. The unfavorable decrease was largely offset by an increase in occupancy
33
at our Glenridge Highlands Two building in Atlanta, Georgia as well as our 60 Broad Street building in New York, New York.
Tenant reimbursements
decreased
from approximately
$126.9 million
for the year ended
December 31, 2009
to approximately
$114.8 million
for the year ended
December 31, 2010
. Substantially all of the decrease is due to lower recoverable estimated property taxes as well as lower estimated tenant-requested services. The remaining variance is attributable to an overall reduction in recoverable expenses due to a partial lease termination at the Aon Center building.
Other rental income is comprised primarily of income recognized for lease terminations and restructurings. Unlike the majority of our rental income, which is recognized ratably over long-term contracts, other rental income is recognized once we have completed our obligation to provide space to the tenant. Lease terminations and restructurings of approximately
$6.7 million
for the year ended
December 31, 2010
relates primarily to a lease termination at our Chandler Forum building of approximately $3.4 million, as well as lease terminations at our 110 Hidden Lake Circle building, and our Aon Center building. For the year ended
December 31, 2009
, other rental income relates primarily to leases terminated at the Aon Center building and the 1901 Main Street building in Irvine, California of approximately $1.9 million and $0.5 million, respectively.
Expense
Property operating costs
decreased
approximately
$10.1 million
for the year ended
December 31, 2010
compared to 2009. This variance is primarily the result of successful appeals of the assessed values at several of our buildings resulting in lower estimated property tax expense of approximately $7.4 million. Lower recoverable tenant-requested services (i.e. billback expenses) of approximately $2.1 million and lower recoverable utility costs of $0.8 million also contributed to the year over year decrease.
Depreciation expense
decreased
approximately
$0.2 million
for the year ended
December 31, 2010
compared to the year ended
December 31, 2009
. The decrease in depreciation expense is largely due to an adjustment to accelerate depreciation expense on tenant improvements during 2009 related to various lease terminations at certain of our buildings, as well as lower depreciation expense during 2010 related to the reclassification of the 111 Sylvan Avenue building to held for sale in May 2010, and its subsequent disposition in December 2010. The decrease was mostly offset by an increase in other tenant improvements placed in service after
December 31, 2009
at various buildings within our portfolio, as well as the acquisition of three buildings in the latter half of 2010.
Amortization expense
decreased
approximately
$8.3 million
for the year ended
December 31, 2010
compared to the year ended
December 31, 2009
. The decrease primarily relates to lease intangible assets that have fully amortized subsequent to January 1, 2009, resulting in lower amortization of approximately $5.5 million, as well as a decrease in adjustments to accelerate amortization expense on lease intangible assets related to various lease terminations at certain of our buildings compared to 2009 of approximately $3.7 million. However, the decreases during the year ended
December 31, 2010
were partially offset by an increase in amortization related to new deferred lease acquisition costs associated with the acquisition or renewal of tenants subsequent to
December 31, 2009
, which are amortized over the life of the respective leases.
We did not recognize an impairment loss on our held-for-use, wholly-owned buildings during 2010; however, during the year ended
December 31, 2009
, we recognized an impairment loss of approximately
$35.1 million
as a result of lowering expected future rental income and reducing the intended holding periods for the Auburn Hills Corporate Center Building in Auburn Hills, Michigan, and the 1441 West Long Lake Road building in Troy, Michigan, as well as the 1111 Durham Avenue building in South Plainfield, New Jersey.
General and administrative expenses
increased
approximately
$1.7 million
for the year ended
December 31, 2010
compared to the year ended
December 31, 2009
. The variance is primarily attributable to an increase in transfer agent expenses associated with our 2010 Recapitalization, listing of our shares on the NYSE, and related investor support services of approximately $4.2 million. Also, we incurred higher employee benefit costs of approximately $1.4 million, primarily due to the new stock performance component of the 2010 Long Term Incentive Compensation Plan which effects long-term incentive compensation grants for officers and resulted in earlier recognition of expense as compared to the year
December 31, 2009
. These increases were partially offset by insurance recoveries related to our defense of ongoing litigation during the year ended
December 31, 2010
.
Other Income (Expense)
Interest expense
decreased
approximately
$5.0 million
for the year ended
December 31, 2010
compared to 2009. When we extended the $250 Million Unsecured Term Loan in June 2010, we entered into new interest rate swap agreements with four counterparties to effectively fix the rate on the $250 Million Unsecured Term Loan at 2.36% compared to the prior rate of 4.97% for the full year in 2009. The decrease is also attributable to lower net borrowings on our $500 Million Unsecured Facility during the year ended
December 31, 2010
due to the receipt of approximately $184.4 million in net offering proceeds in February 2010.
Interest and other income
decreased
approximately
$0.9 million
for the year ended
December 31, 2010
compared to the year ended
34
December 31, 2009
. The variance is attributable to a $0.8 million non-recurring settlement in the prior period of an acquisition contingency in our favor for an acquisition which closed in 2003.
Equity in income of unconsolidated joint ventures
increased
approximately
$2.5 million
for the year ended
December 31, 2010
compared to 2009. The increase was primarily a result of recognizing our proportionate share of an impairment loss on one of our unconsolidated joint ventures of approximately $2.6 million during the year ended
December 31, 2009
.
Income from continuing operations per share on a fully diluted basis increased from
$0.40
for the year ended
December 31, 2009
to
$0.65
for the year ended
December 31, 2010
for a number of reasons, including the impairment loss incurred in 2009, higher other rental income recognized during the year ended
December 31, 2010
due to lease terminations and restructurings, as well as lower operating expenses, which were primarily related to lower estimated property tax assessments at several of our buildings, and lower interest expense as compared to 2009.
Discontinued Operations
In accordance with GAAP, we have classified the operations of the 111 Sylvan Avenue building , the Eastpointe Corporate Center, the 5000 Corporate Court building, and the 35 West Wacker Drive building as discontinued operations for all periods presented. Income from discontinued operations was approximately
$8.3 million
and
$11.6 million
for the years ended
December 31, 2010
and
2009
, respectively. Although operating income was higher for the year ended
December 31, 2010
due mainly to lower property operating costs, depreciation, and amortization, these variances were more than offset by Piedmont's recognition of an impairment charge of approximately
$9.6 million
in conjunction with adjusting the 111 Sylvan Avenue building assets to estimated fair value (the sales price), less estimated costs to sell, as well as a subsequent loss on the sale of the building of approximately
$0.8 million
, which was the result of costs incurred for the substitution of another property for the 111 Sylvan Avenue building in our $350 Million Secured Pooled Facility.
Funds From Operations, Core Funds From Operations, and Adjusted Funds From Operations (“AFFO”)
Net income calculated in accordance with GAAP is the starting point for calculating FFO, Core FFO, and AFFO. FFO, Core FFO, and AFFO are non-GAAP financial measures and should not be viewed as an alternative measurement of our operating performance to net income. Management believes that accounting for real estate assets in accordance with GAAP implicitly assumes that the value of real estate assets diminishes predictably over time. Since real estate values have historically risen or fallen with market conditions, many industry investors and analysts have considered the presentation of operating results for real estate companies that use historical cost accounting to be insufficient by themselves. As a result, we believe that the use of FFO, Core FFO, and AFFO, together with the required GAAP presentation, provides a more complete understanding of our performance relative to our competitors and a more informed and appropriate basis on which to make decisions involving operating, financing, and investing activities.
We calculate FFO in accordance with the current NAREIT definition as follows: Net income (computed in accordance with GAAP), excluding gains or losses from sales of property and impairment charges (including our proportionate share of any impairment charges and/or gains or losses from sales of property related to investments in unconsolidated joint ventures), plus depreciation and amortization on real estate assets (including our proportionate share of depreciation and amortization related to investments in unconsolidated joint ventures). Other REITs may not define FFO in accordance with the NAREIT definition, or may interpret the current NAREIT definition differently than we do; therefore, our computation of FFO may not be comparable to such other REITs.
We calculate Core FFO as FFO (calculated as set forth above) less acquisition costs and other significant, non-recurring items, such as a gain on early extinguishment of debt.
We calculate AFFO as Core FFO (calculated as set forth above) exclusive of the net effects of: (i) amortization associated with deferred financing costs; (ii) depreciation of non real estate assets; (iii) straight-line lease revenue/expense; (iv) amortization of above and below-market lease intangibles; (v) stock-based and other non-cash compensation expense; (vi) amortization of mezzanine discount income; (vii) acquisition costs, and (viii) non-incremental capital expenditures (as defined below). Our proportionate share of such adjustments related to investments in unconsolidated joint ventures are also included when calculating AFFO.
Reconciliations of net income to FFO, Core FFO, and AFFO are presented below (in thousands except per share amounts):
35
|
|
2011
|
Per
Share
(1)
|
2010
|
Per
Share
(1)
|
2009
|
Per
Share
(1)
|
|||||||||||||||||
|
Net income attributable to Piedmont
|
$
|
225,041
|
|
$
|
1.30
|
|
$
|
120,379
|
|
$
|
0.70
|
|
$
|
74,700
|
|
$
|
0.47
|
|
|||||
|
Depreciation of real assets
(2)
|
110,421
|
|
0.64
|
|
105,107
|
|
0.62
|
|
106,878
|
|
0.68
|
|
|||||||||||
|
Amortization of lease-related costs
(2)
|
60,132
|
|
0.35
|
|
45,334
|
|
0.27
|
|
57,708
|
|
0.36
|
|
|||||||||||
|
Gain on consolidation of VIE
|
(1,532
|
)
|
(0.01
|
)
|
—
|
|
—
|
|
—
|
|
—
|
|
|||||||||||
|
Impairment loss on real estate assets
(2)
|
—
|
|
—
|
|
9,640
|
|
0.06
|
|
37,633
|
|
0.24
|
|
|||||||||||
|
(Gain)/loss on sale- wholly-owned properties
|
(122,657
|
)
|
(0.71
|
)
|
817
|
|
—
|
|
—
|
|
—
|
|
|||||||||||
|
Gain on sale- unconsolidated partnerships
|
(116
|
)
|
—
|
|
(25
|
)
|
—
|
|
—
|
|
—
|
|
|||||||||||
|
Funds From Operations
|
$
|
271,289
|
|
$
|
1.57
|
|
$
|
281,252
|
|
$
|
1.65
|
|
$
|
276,919
|
|
$
|
1.75
|
|
|||||
|
Adjustments:
|
|||||||||||||||||||||||
|
Acquisition costs
|
1,347
|
|
0.01
|
|
600
|
|
—
|
|
—
|
|
—
|
|
|||||||||||
|
(Gain)/loss on extinguishment of debt
|
(1,039
|
)
|
(0.01
|
)
|
—
|
|
—
|
|
—
|
|
—
|
|
|||||||||||
|
Core Funds From Operations
|
$
|
271,597
|
|
$
|
1.57
|
|
$
|
281,852
|
|
$
|
1.65
|
|
$
|
276,919
|
|
$
|
1.75
|
|
|||||
|
Adjustments:
|
|||||||||||||||||||||||
|
Deferred financing cost amortization
|
3,195
|
|
0.02
|
|
2,608
|
|
0.01
|
|
2,786
|
|
0.02
|
|
|||||||||||
|
Amortization of fair market adjustments on notes payable
|
1,413
|
|
0.01
|
|
—
|
|
—
|
|
—
|
|
—
|
|
|||||||||||
|
Depreciation of non real estate assets
|
499
|
|
—
|
|
707
|
|
—
|
|
632
|
|
—
|
|
|||||||||||
|
Straight-line effects of lease revenue
(2)
|
(9,507
|
)
|
(0.06
|
)
|
(6,088
|
)
|
(0.04
|
)
|
(997
|
)
|
(0.01
|
)
|
|||||||||||
|
Stock-based and other non-cash compensation
|
4,705
|
|
0.03
|
|
3,681
|
|
0.02
|
|
3,178
|
|
0.02
|
|
|||||||||||
|
Net effect of amortization of below-market in-place lease intangibles
(2)
|
(7,065
|
)
|
(0.04
|
)
|
(5,793
|
)
|
(0.03
|
)
|
(5,399
|
)
|
(0.03
|
)
|
|||||||||||
|
Income from amortization of discount on purchase of mezzanine loans
|
(484
|
)
|
—
|
|
(2,405
|
)
|
(0.01
|
)
|
(2,278
|
)
|
(0.01
|
)
|
|||||||||||
|
Acquisition costs
|
(1,347
|
)
|
(0.01
|
)
|
(600
|
)
|
—
|
|
—
|
|
—
|
|
|||||||||||
|
Non-incremental capital expenditures
(3)
|
(60,401
|
)
|
(0.35
|
)
|
(45,286
|
)
|
(0.26
|
)
|
(37,546
|
)
|
(0.24
|
)
|
|||||||||||
|
Adjusted Funds From Operations
|
$
|
202,605
|
|
$
|
1.17
|
|
$
|
228,676
|
|
$
|
1.34
|
|
$
|
237,295
|
|
$
|
1.50
|
|
|||||
|
Weighted-average shares outstanding – diluted
|
172,981
|
|
170,967
|
|
158,581
|
|
|||||||||||||||||
|
(1)
|
Based on weighted-average shares outstanding—diluted.
|
|
(2)
|
Includes adjustments for wholly-owned properties, as well as such adjustments for our proportionate ownership in unconsolidated joint ventures.
|
|
(3)
|
Effective July 1, 2011, Piedmont defines non-incremental capital expenditures as capital expenditures of a recurring nature related to tenant improvements and leasing commissions that do not incrementally enhance the underlying assets' income generating capacity. Tenant improvements, leasing commissions, building capital and deferred lease incentives incurred to lease space that was vacant at acquisition, leasing costs for spaces vacant for greater than one year, leasing costs for spaces at newly acquired properties for which in-place leases expire shortly after acquisition, improvements associated with the expansion of a building, and renovations that either change the underlying classification from a Class B to a Class A property or enhance the marketability of a building are excluded from this measure. All prior periods presented have been recalculated in accordance with the new definition for comparability.
|
Election as a REIT
We have elected to be taxed as a REIT under the Code and have operated as such beginning with our taxable year ended December 31, 1998. To qualify as a REIT, we must meet certain organizational and operational requirements, including a requirement to distribute at least 90% of our adjusted REIT taxable income, computed without regard to the dividends-paid deduction and by excluding net capital gains attributable to our stockholders, as defined by the Code. As a REIT, we generally will not be subject to federal income tax on income that we distribute to our stockholders. If we fail to qualify as a REIT in any taxable year, we may be subject to federal income taxes on our taxable income for that year and for the four years following the year during which qualification is lost and/or penalties, unless the IRS grants us relief under certain statutory provisions. Such an event could materially adversely affect our net income and net cash available for distribution to our stockholders. However, we believe that we are organized and
36
operate in such a manner as to qualify for treatment as a REIT and intend to continue to operate in the foreseeable future in such a manner that we will remain qualified as a REIT for federal income tax purposes. We have elected to treat Piedmont Office Holdings, Inc. (“POH”), a wholly-owned subsidiary of Piedmont, as a taxable REIT subsidiary. We perform non-customary services for tenants of buildings that we own, including real estate and non-real estate related-services; however, any earnings related to such services performed by our taxable REIT subsidiary are subject to federal and state income taxes. Furthermore during 2011, POH, through a wholly-owned subsidiary (Piedmont Power, LLC), commenced a project to install solar panels at our 400 Bridgewater Crossing building in Bridgewater, New Jersey. In addition, for us to continue to qualify as a REIT, our investments in taxable REIT subsidiaries cannot exceed 25% of the value of our total assets.
Inflation
We are exposed to inflation risk, as income from long-term leases is the primary source of our cash flows from operations. There are provisions in the majority of our tenant leases that are intended to protect us from, and mitigate the risk of, the impact of inflation. These provisions include rent steps, reimbursement billings for operating expense pass-through charges, real estate tax, and insurance reimbursements on a per square-foot basis, or in some cases, annual reimbursement of operating expenses above certain per square-foot allowance. However, due to the long-term nature of the leases, the leases may not readjust their reimbursement rates frequently enough to fully cover inflation.
Application of Critical Accounting Policies
Our accounting policies have been established to conform with GAAP. The preparation of financial statements in conformity with GAAP requires management to use judgment in the application of accounting policies, including making estimates and assumptions. These judgments affect the reported amounts of assets and liabilities and disclosure of contingent assets and liabilities at the dates of the financial statements and the reported amounts of revenue and expenses during the reporting periods. If our judgment or interpretation of the facts and circumstances relating to various transactions had been different, it is possible that different accounting policies would have been applied, thus, resulting in a different presentation of the financial statements. Additionally, other companies may utilize different estimates that may impact comparability of our results of operations to those of companies in similar businesses. The critical accounting policies outlined below have been discussed with members of the Audit Committee of the board of directors.
Investment in Real Estate Assets
We are required to make subjective assessments as to the useful lives of our depreciable assets. We consider the period of future benefit of the asset to determine the appropriate useful lives. These assessments have a direct impact on net income. The estimated useful lives of our assets by class are as follows:
|
Buildings
|
40 years
|
|
Building improvements
|
5-25 years
|
|
Land improvements
|
20-25 years
|
|
Tenant improvements
|
Shorter of economic life or lease term
|
|
Furniture, fixtures, and equipment
|
3-5 years
|
|
Intangible lease assets
|
Lease term
|
Allocation of Purchase Price of Acquired Assets
Upon the acquisition of real properties, we allocate the purchase price of properties to acquired tangible assets, consisting of land and building, and identified intangible assets and liabilities, consisting of the value of above-market and below-market leases and the value of in-place leases, based in each case on their estimated fair values.
The fair values of the tangible assets of an acquired property (which includes land and building) are determined by valuing the property as if it were vacant, and the “as-if-vacant” value is then allocated to land and building based on management’s determination of the fair value of these assets. We determine the as-if-vacant fair value of a property using methods similar to those used by independent appraisers. Factors considered by us in performing these analyses include an estimate of carrying costs during the expected lease-up periods considering current market conditions and costs to execute similar leases, including leasing commissions and other related costs. In estimating carrying costs, we include real estate taxes, insurance, and other operating expenses during the expected lease-up periods based on current market conditions.
The fair values of above-market and below-market in-place leases are recorded based on the present value (using an interest rate which reflects the risks associated with the leases acquired) of the difference between (i) the contractual amounts to be paid pursuant
37
to the in-place leases and (ii) our estimate of fair market lease rates for the corresponding in-place leases, measured over a period equal to the remaining terms of the leases, taking into consideration the probability of renewals for any below-market leases. The capitalized above-market and below-market lease values are recorded as intangible lease assets or liabilities and amortized as an adjustment to rental income over the remaining terms of the respective leases.
The fair values of in-place leases include direct costs associated with obtaining a new tenant, opportunity costs associated with lost rentals that are avoided by acquiring an in-place lease, and tenant relationships. Direct costs associated with obtaining a new tenant include commissions, tenant improvements, and other direct costs and are estimated based on our consideration of current market costs to execute a similar lease. These direct costs are included in deferred lease costs in the accompanying consolidated balance sheets and are amortized to expense over the remaining terms of the respective leases. The value of opportunity costs is calculated using the contractual amounts to be paid pursuant to the in-place leases over a market absorption period for a similar lease. Customer relationships are valued based on expected renewal of a lease or the likelihood of obtaining a particular tenant for other locations. These lease intangibles are included in intangible lease assets in the accompanying consolidated balance sheets and are amortized to expense over the remaining terms of the respective leases.
Estimating the fair values of the tangible and intangible assets requires us to estimate market lease rates, property operating expenses, carrying costs during lease-up periods, discount rates, market absorption periods, and the number of years the property is held for investment. The use of inappropriate estimates would result in an incorrect assessment of our purchase price allocations, which would impact the amount of our reported net income.
Valuation of Real Estate Assets and Investments in Joint Ventures which Hold Real Estate Assets
We continually monitor events and changes in circumstances that could indicate that the carrying amounts of the real estate and related intangible assets, both operating properties and properties under construction, in which we have an ownership interest, either directly or through investments in joint ventures, may not be recoverable. When indicators of potential impairment are present for wholly-owned properties, which indicate that the carrying amounts of real estate and related intangible assets may not be recoverable, we assess the recoverability of these assets by determining whether the carrying value will be recovered from the undiscounted future operating cash flows expected from the use of the asset and its eventual disposition. In the event that such expected undiscounted future cash flows do not exceed the carrying value, we adjust the real estate and related intangible assets to the fair value and recognize an impairment loss. For our investments in unconsolidated joint ventures, we assess the fair value of our investment, as compared to our carrying amount. If we determine that the carrying value is greater than the fair value at any measurement date, we must also determine if such a difference is temporary in nature. Value fluctuations which are “other than temporary” in nature are then recorded to adjust the carrying value to the fair value amount.
Projections of expected future cash flows require that we estimate future market rental income amounts subsequent to the expiration of current lease agreements, property operating expenses, the number of months it takes to re-lease the property, and the number of years the property is held for investment, among other factors. The subjectivity of assumptions used in the future cash flow analysis, including capitalization and discount rates, could result in an incorrect assessment of the property’s fair value and, therefore, could result in the misstatement of the carrying value of our real estate and related intangible assets and our net income attributable to Piedmont. See Note 12 and Note 17 to our accompanying consolidated financial statements for further information on previously recognized impairment charges.
Goodwill
Goodwill is the excess of cost of an acquired entity over the amounts specifically assigned to assets acquired and liabilities assumed in purchase accounting for business combinations, as well as costs incurred as part of the acquisition. We test the carrying value of our goodwill for impairment on an annual basis, or on an interim basis if an event occurs or circumstances change that would indicate the carrying amount may be impaired. Such interim circumstances may include, but are not limited to, significant adverse changes in legal factors or in the general business climate, adverse action or assessment by a regulator, unanticipated competition, the loss of key personnel, or persistent declines in an entity’s stock price below carrying value of the entity. The test prescribed by authoritative accounting guidance is a two-step test. The first step involves comparing the estimated fair value of the entity to its carrying value, including goodwill. Fair value is determined by adjusting the trading price of the stock for various factors including, but not limited to: (i) liquidity or transferability considerations, (ii) control premiums, and/or (iii) fully distributed premiums, if necessary, multiplied by the common shares outstanding. If such calculated fair value exceeds the carrying value, no further procedures or analysis is permitted or required. However, if the carrying value exceeds the calculated fair value, goodwill is potentially impaired and step two of the analysis would be required. Step two of the test involves calculating the implied fair value of goodwill by deducting the fair value of all tangible and intangible net assets of the entity from the entity’s fair value calculated in step one of the test. If the implied value of the goodwill (the remainder left after deducting the fair values of the entity from its calculated overall fair value in step one of the test) is less than the carrying value of goodwill, an impairment loss would be recognized. We have determined through the testing noted above that there are no issues of impairment related to our
38
goodwill as of
December 31, 2011
.
Investment in Variable Interest Entities
Variable Interest Entities (“VIEs”) are defined by GAAP as entities in which equity investors do not have sufficient equity at risk for the entity to finance its activities without additional subordinated financial support from other parties. If an entity is determined to be a VIE, it must be consolidated by the primary beneficiary. The primary beneficiary is the enterprise that has the power to direct the activities of the VIE that most significantly impact the VIE’s economic performance, absorbs the majority of the entity’s expected losses, or receives a majority of the entity’s expected residual returns. Generally, expected losses and expected residual returns are the anticipated negative and positive variability, respectively, in the fair value of the VIE’s net assets. When we make an investment, we assess whether the investment represents a variable interest in a VIE and, if so, whether we are the primary beneficiary of the VIE. Incorrect assumptions or assessments may result in an inaccurate determination of the primary beneficiary. The result could be the consolidation of an entity acquired or formed in the future that would otherwise not have been consolidated or the non-consolidation of such an entity that would otherwise have been consolidated.
We evaluate each investment to determine whether it represents variable interests in a VIE. Further, we evaluate the sufficiency of the entities’ equity investment at risk to absorb expected losses, and whether as a group, the equity has the characteristics of a controlling financial interest.
Interest Rate Derivatives
We periodically enter into interest rate derivative agreements to hedge our exposure to changing interest rates on variable rate debt instruments. As required by GAAP, we record all derivatives on the balance sheet at fair value. We reassess the effectiveness of our derivatives designated as cash flow hedges on a regular basis to determine if they continue to be highly effective and also to determine if the forecasted transactions remain highly probable. Currently, we do not use derivatives for trading or speculative purposes.
The changes in fair value of interest rate swap agreements designated as cash flow hedges are recorded in other comprehensive income (“OCI”), and the amounts in OCI will be reclassified to earnings when the hedged transactions occur. Changes in the fair values of derivatives designated as cash flow hedges that do not qualify for hedge accounting treatment, if any, would be recorded as gain/(loss) on interest rate swap in the consolidated statements of income. The fair value of the interest rate swap agreement is recorded as prepaid expenses and other assets or as interest rate swap liability in the accompanying consolidated balance sheets. Amounts received or paid under interest rate swap agreements are recorded as interest expense in the consolidated income statements as incurred. All of our interest rate swap agreements as of
December 31, 2011
are designated as cash flow hedges.
For interest rate cap agreements designated as cash flow hedges, we reassess the effectiveness of our interest rate caps on a regular basis to determine if they continue to be highly effective and also to determine if the forecasted transactions remain highly probable. The changes in fair value of interest rate caps designated as cash flow hedges are recorded in OCI, and the option purchase premium is amortized (reclassified from OCI to interest expense) over the life of the hedging relationship as the hedged forecasted transactions affect earnings. The reclassification is based on a schedule created at the inception of the hedge, which allocates the purchase price to the future periods the hedge is expected to benefit, based on fair value as of the inception of the hedging relationship. Due to the complexities of cash flow hedge accounting, we evaluate the cost-benefit relationship between the size of the related interest rate cap agreements and the exposure to potential fluctuations in the fair value of the interest rate caps in order to determine if effective hedge accounting will be pursued. In cases where the benefit does not outweigh the costs, we elect to use mark-to-market accounting, which adjusts the interest rate cap agreements to estimated fair value through earnings on a quarterly basis. As of
December 31, 2011
, our interest rate cap agreements were immaterial and were recorded using mark-to-market accounting.
Related-Party Transactions and Agreements
There were no related-party transactions during the three years ended
December 31, 2011
.
Off-Balance Sheet Arrangements
We are not dependent on off-balance sheet financing arrangements for liquidity. Our off-balance sheet arrangements are discussed in Note 7 “Unconsolidated Joint Ventures” and Note 13 “Commitments and Contingencies” (specifically related to
Operating Lease Obligations)
to the accompanying consolidated financial statements. The unconsolidated joint ventures in which we invest are prohibited by their governing documents from incurring debt. For further information regarding our commitments under operating lease obligations, see the notes to our accompanying consolidated financial statements, as well as the Contractual Obligations table below.
39
Contractual Obligations
Our contractual obligations as of
December 31, 2011
are as follows (in thousands):
|
Payments Due by Period
|
||||||||||||||||||||
|
Contractual Obligations
|
Total
|
Less than
1 year
|
1-3 years
|
3-5 years
|
More than
5 years
|
|||||||||||||||
|
Long-term debt
(1)
|
$
|
1,472,525
|
|
$
|
185,000
|
|
(2)
|
$
|
575,000
|
|
$
|
572,525
|
|
$
|
140,000
|
|
||||
|
Operating lease obligations
|
78,618
|
|
750
|
|
1,500
|
|
1,500
|
|
74,868
|
|
||||||||||
|
Total
|
$
|
1,551,143
|
|
$
|
185,750
|
|
$
|
576,500
|
|
$
|
574,025
|
|
$
|
214,868
|
|
|||||
|
(1)
|
Amounts include principal payments only. We made interest payments of
$66.7 million
, including interest rate swap cash settlements related to various interest rate swap agreements in force, during the year ended
December 31, 2011
and expect to pay interest in future periods on outstanding debt obligations based on the rates and terms disclosed herein and in Note 8 of our accompanying consolidated financial statements.
|
|
(2)
|
Includes the
$140 Million
500 W. Monroe Mortgage Loan, which Piedmont repaid on
January 9, 2012
.
|
Our future income, cash flows, and fair values of our financial instruments depend in part upon prevailing market interest rates. Market risk is the exposure to loss resulting from changes in interest rates, foreign currency, exchange rates, commodity prices, and equity prices. Our exposure to market risk includes interest rate fluctuations in connection with any borrowings under our $500 Million Unsecured Facility and our $300 Million Unsecured Term Loan. As a result, the primary market risk to which we believe we are exposed is interest rate risk. Many factors, including governmental monetary and tax policies, domestic and international economic and political considerations, and other factors that are beyond our control contribute to interest rate risk. Our interest rate risk management objectives are to limit the impact of interest rate changes on earnings and cash flow primarily through a low-to-moderate level of overall borrowings, as well as managing the variability in rate fluctuations on our outstanding debt. As such, a significant portion of our debt is based on fixed interest rates to hedge against instability in the credit markets, and we have effectively fixed the interest rate on our $300 Million Unsecured Term Loan through interest rate swap agreements, provided that we maintain our corporate credit rating. We do not enter into derivative or interest rate transactions for speculative purposes.
Our financial instruments consist of both fixed and variable-rate debt. As of
December 31, 2011
, our consolidated debt consisted of the following (in thousands):
|
2012
|
2013
|
2014
|
2015
|
2016
|
Thereafter
|
Total
|
|||||||||||||||||||||
|
Maturing debt:
|
|||||||||||||||||||||||||||
|
Variable rate repayments
|
$
|
140,000
|
|
(1)
|
$
|
—
|
|
$
|
—
|
|
$
|
—
|
|
$
|
—
|
|
$
|
—
|
|
$
|
140,000
|
|
|||||
|
Variable rate average interest rate
|
1.29
|
%
|
|
—
|
|
—
|
|
—
|
|
—
|
|
—
|
|
1.29
|
%
|
||||||||||||
|
Fixed rate repayments
|
$
|
45,000
|
|
|
$
|
—
|
|
$
|
575,000
|
|
$
|
105,000
|
|
$
|
467,525
|
|
(3)
|
$
|
140,000
|
|
$
|
1,332,525
|
|
||||
|
Fixed rate average interest rate
(2)
|
5.20
|
%
|
—
|
|
4.89
|
%
|
5.29
|
%
|
3.72
|
%
|
5.76
|
%
|
4.61
|
%
|
|||||||||||||
|
(1)
|
Includes the
$140 Million
500 W. Monroe Mortgage Loan, which Piedmont repaid on
January 9, 2012
.
|
|
(2)
|
See Note 8 of our accompanying consolidated financial statements for further details on our debt structure.
|
|
(3)
|
The amount includes the $300 Million Unsecured Term Loan which has a stated variable rate; however, Piedmont entered into an interest rate swap agreement which effectively fixes the rate on this loan to
2.69%
through
November 22, 2016
(provided that we maintain our corporate credit rating).
|
40
As of
December 31, 2010
, our consolidated debt consisted of the following (in thousands):
|
2011
|
2012
|
2013
|
2014
|
2015
|
Thereafter
|
Total
|
|||||||||||||||||||||
|
Maturing debt:
|
|||||||||||||||||||||||||||
|
Variable rate repayments
|
$
|
—
|
|
|
$
|
—
|
|
$
|
—
|
|
$
|
—
|
|
$
|
—
|
|
$
|
—
|
|
$
|
—
|
|
|||||
|
Variable rate average interest rate
|
—
|
|
|
—
|
|
—
|
|
—
|
|
—
|
|
—
|
|
—
|
|
||||||||||||
|
Fixed rate repayments
|
$
|
250,000
|
|
|
$
|
45,000
|
|
$
|
—
|
|
$
|
695,000
|
|
$
|
105,000
|
|
$
|
307,525
|
|
$
|
1,402,525
|
|
|||||
|
Fixed rate average interest rate
|
2.36
|
%
|
(1)
|
5.20
|
%
|
—
|
|
4.92
|
%
|
5.29
|
%
|
5.65
|
%
|
4.66
|
%
|
||||||||||||
|
(1)
|
The $250 Million Unsecured Term Loan had a stated variable rate; however, Piedmont entered into an interest rate swap agreement which effectively fixed the rate on this loan to 2.36% through June 28, 2011, and was repaid at maturity.
|
As of
December 31, 2011
and
2010
, the estimated fair value of the line of credit and notes payable above was approximately
$1.5 billion
and
$1.4 billion
, respectively. Our interest rate swap agreements in place at
December 31, 2011
and 2010 carried notional amounts totaling $300 million and $250 million, respectively and fixed interest rates of
2.69%
and 2.36%, respectively.
The variable rate debt is based on LIBOR plus a specified margin or prime as elected by us at certain intervals. An increase in the variable interest rate on the variable-rate facilities constitutes a market risk, as a change in rates would increase or decrease interest incurred and therefore cash flows available for distribution to stockholders. The current stated interest rate spread on the $500 Million Unsecured Facility is LIBOR plus
0.475%
and the current stated interest rate spread on the $140 Million 500 W. Monroe Mortgage Loan is LIBOR plus 1.008%, however, the $140 Million mortgage loan is also subject to interest rate cap agreements, which limit Piedmont's exposure to potential increases in the LIBOR rate to
2.19%
. As mentioned above, the $140 Million 500 W. Monroe Mortgage Loan was repaid in early January 2012.
A change in the interest rate on the fixed portion of our debt portfolio, or on the $300 Million Unsecured Term Loan which is effectively fixed through interest rate swaps, impacts the net financial instrument position but has no impact on interest incurred or cash flows.
As of
December 31, 2011
, a 1% change in interest rates would not have a material effect on our interest expense as our variable rate debt is limited to the $140 Million 500 W. Monroe Mortgage Loan which we repaid in early January 2012, and our $500 Million Unsecured Facility which has only
$15.0 million
outstanding as of the date of this filing.
The financial statements and supplementary data filed as part of this report are set forth on page F-1 of this report.
There were no disagreements with our independent registered public accountants during the
years ended
December 31, 2011
or
2010
.
Management’s Conclusions Regarding the Effectiveness of Disclosure Controls and Procedures
We carried out an evaluation, under the supervision and with the participation of management, including our Principal Executive Officer and Principal Financial Officer, of the effectiveness of the design and operation of our disclosure controls and procedures pursuant to Rule 13a-15(e) under the Securities Exchange Act of 1934 as of the end of the period covered by this report. Based upon that evaluation, the Principal Executive Officer and Principal Financial Officer concluded that our disclosure controls and procedures were effective as of the end of the period covered by this annual report in providing a reasonable level of assurance that information we are required to disclose in reports that we file or submit under the Securities Exchange Act of 1934 is recorded, processed, summarized and reported within the time periods in SEC rules and forms, including providing a reasonable level of
41
assurance that information required to be disclosed by us in such reports is accumulated and communicated to our management, including our Principal Executive Officer and our Principal Financial Officer, as appropriate to allow timely decisions regarding required disclosure.
Report of Management on Internal Control Over Financial Reporting
Our management is responsible for establishing and maintaining adequate internal control over financial reporting, as defined in Rules 13a-15(f) and 15d-15(f) under the Securities Exchange Act of 1934, as a process designed by, or under the supervision of, the Principal Executive Officer and Principal Financial Officer and effected by our management and other personnel to provide reasonable assurance regarding the reliability of financial reporting and the preparation of financial statements for external purposes in accordance with GAAP and includes those policies and procedures that:
|
•
|
pertain to the maintenance of records that in reasonable detail accurately and fairly reflect the transactions and disposition of our assets;
|
|
•
|
provide reasonable assurance that the transactions are recorded as necessary to permit preparation of financial statements in accordance with GAAP, and that our receipts and expenditures are being made only in accordance with authorizations of management and/or members of the board of directors; and
|
|
•
|
provide reasonable assurance regarding prevention or timely detection of unauthorized acquisition, use, or disposition of our assets that could have a material effect on the financial statements.
|
Because of the inherent limitations of internal control over financial reporting, including the possibility of human error and the circumvention or overriding of controls, material misstatements may not be prevented or detected on a timely basis. In addition, projections of any evaluation of effectiveness to future periods are subject to the risks that controls may become inadequate because of changes and conditions or that the degree of compliance with policies or procedures may deteriorate. Accordingly, even internal controls determined to be effective can provide only reasonable assurance that the information required to be disclosed in reports filed under the Securities Exchange Act of 1934 is recorded, processed, summarized, and represented within the time periods required.
Our management has assessed the effectiveness of our internal control over financial reporting at
December 31, 2011
. To make this assessment, we used the criteria for effective internal control over financial reporting described in Internal Control—Integrated Framework issued by the Committee of Sponsoring Organizations of the Treadway Commission (COSO). Based on this assessment, our management believes that, as of
December 31, 2011
, our system of internal control over financial reporting was effective.
Piedmont’s independent registered public accounting firm has issued their report on the effectiveness of Piedmont’s internal control over financial reporting, which appears in this Annual Report.
Changes in Internal Control Over Financial Reporting
There have been no significant changes in our internal control over financial reporting during the quarter ended
December 31, 2011
that have materially affected, or are reasonably likely to materially affect, our internal control over financial reporting.
None.
42
Pursuant to Paragraph G(3) of the General Instructions to Form 10-K, the information required by Part III (Items 10, 11, 12, 13, and 14) is being incorporated by reference herein from our definitive proxy statement to be filed with the SEC within 120 days of the end of the fiscal year ended
December 31, 2011
in connection with our
2012
Annual Meeting of Stockholders.
We have adopted a Code of Ethics, which is available on Piedmont’s Web site at http://www.piedmontreit.com under the “Corporate Governance” section. Any amendments to, or waivers of, the Code of Ethics will be disclosed on our Web site promptly following the date of such amendment or waiver.
The information required by Item 11 will be set forth in our definitive proxy statement to be filed with the SEC within 120 days of the end of the fiscal year ended
December 31, 2011
, and is incorporated herein by reference.
The information required by Item 12 will be set forth in our definitive proxy statement to be filed with the SEC within 120 days of the end of the fiscal year ended
December 31, 2011
, and is incorporated herein by reference.
The information required by Item 13 will be set forth in our definitive proxy statement to be filed with the SEC within 120 days of the end of the fiscal year ended
December 31, 2011
, and is incorporated herein by reference.
The information required by Item 14 will be set forth in our definitive proxy statement to be filed with the SEC within 120 days of the end of the fiscal year ended
December 31, 2011
, and is incorporated herein by reference.
43
|
(a)
|
1. The financial statements begin on page F-4 of this Annual Report on Form 10-K, and the list of the financial statements contained herein is set forth on page F-1, which is hereby incorporated by reference.
|
|
(a)
|
2. Schedule III—Real Estate Assets and Accumulated Depreciation
|
Information with respect to this item begins on page S-1 of this Annual Report on Form 10-K. Other schedules are omitted because of the absence of conditions under which they are required or because the required information is given in the financial statements or notes thereto.
|
(b)
|
The Exhibits filed in response to Item 601 of Regulation S-K are listed on the Exhibit Index attached hereto.
|
|
(c)
|
See (a) 2 above.
|
44
SIGNATURES
Pursuant to the requirements of Sections 13 or 15(d) of the Securities Exchange Act of 1934, the Registrant has duly caused this report to be signed on its behalf by the undersigned, thereunto duly authorized this
28
th
day of
February 2012
.
|
Piedmont Office Realty Trust, Inc.
|
||
|
(Registrant)
|
||
|
By:
|
|
/s/ D
ONALD
A. M
ILLER
, CFA
|
|
|
Donald A. Miller, CFA
|
|
|
|
President, Principal Executive Officer, and Director
|
|
Pursuant to the requirements of the Securities Exchange Act of 1934, this report has been signed below by the following persons on behalf of the registrant and in the capacity as and on the date indicated.
|
Signature
|
Title
|
Date
|
|
|
/s/ M
ICHAEL
R. B
UCHANAN
|
Director
|
February 28, 2012
|
|
|
Michael R. Buchanan
|
|||
|
/s/ D
ONALD
S. M
OSS
|
Director
|
February 28, 2012
|
|
|
Donald S. Moss
|
|||
|
/s/ W
ESLEY
E. C
ANTRELL
|
Director
|
February 28, 2012
|
|
|
Wesley E. Cantrell
|
|||
|
/s/ W
ILLIAM
H. K
EOGLER
, J
R
.
|
Director
|
February 28, 2012
|
|
|
William H. Keogler, Jr.
|
|||
|
/s/ J
EFFREY
L. S
WOPE
|
Director
|
February 28, 2012
|
|
|
Jeffrey L. Swope
|
|||
|
/s/ F
RANK
C. M
C
D
OWELL
|
Director
|
February 28, 2012
|
|
|
Frank C. McDowell
|
|||
|
/s/ W. W
AYNE
W
OODY
|
Chairman, and Director
|
February 28, 2012
|
|
|
W. Wayne Woody
|
|||
|
/s/ D
ONALD
A. M
ILLER
, CFA
|
President and Director
|
February 28, 2012
|
|
|
Donald A. Miller, CFA
|
(Principal Executive Officer)
|
||
|
/s/ R
OBERT
E. B
OWERS
|
Chief Financial Officer and
Executive Vice-President
|
February 28, 2012
|
|
|
Robert E. Bowers
|
(Principal Financial Officer)
|
||
|
/s/ L
AURA
P. M
OON
|
Chief Accounting Officer
|
February 28, 2012
|
|
|
Laura P. Moon
|
(Principal Accounting Officer)
|
||
|
Raymond G. Milnes, Jr.
|
Director
|
||
45
EXHIBIT INDEX
TO
2011
FORM 10-K
OF
PIEDMONT OFFICE REALTY TRUST, INC.
|
Exhibit Number
|
|
Description of Document
|
|
2.1
|
|
Agreement and Plan of Merger dated as of February 2, 2007, by and among Piedmont Office Realty Trust, Inc. (f/k/a Wells Real Estate Investment Trust, Inc.) (the “Company”), WRT Acquisition Company, LLC, WGS Acquisition Company, LLC, Wells Real Estate Funds, Inc., Wells Capital, Inc., Wells Management Company, Inc., Wells Advisory Services I, LLC, Wells Real Estate Advisory Services, Inc. and Wells Government Services, Inc. (incorporated by reference to Exhibit 2.1 to the Company’s Current Report on Form 8-K, filed on February 5, 2007)
|
|
3.1
|
|
Third Articles of Amendment and Restatement of the Company (incorporated by reference to Exhibit 3.1 to the Company’s Annual Report on Form 10-K for the year ended December 31, 2009, filed on March 16, 2010)
|
|
3.2
|
|
Articles of Amendment of the Company effective June 30, 2011 (incorporated by reference to Exhibit 3.2 to the Company's Current Report on Form 8-K filed on July 6, 2011)
|
|
3.3
|
Articles Supplementary of the Company effective June 30, 2011 (incorporated by reference to Exhibit 3.1 to the Company's Current Report on Form 8-K filed on July 6, 2011)
|
|
|
3.4
|
Amended and Restated Bylaws of Piedmont Office Realty Trust, Inc. (incorporated by reference to Exhibit 3.2 to the Company's Current Report on Form 8-K, filed on January 22, 2010)
|
|
|
10.1
|
|
Amended and Restated Joint Venture Agreement of The Fund IX, Fund X, Fund XI and REIT Joint Venture dated June 11, 1998 (incorporated by reference to Exhibit 10.4 to Post-Effective Amendment No. 2 to the Company’s Form S-11 Registration Statement (Commission File No. 333-32099), filed on July 9, 1998)
|
|
10.2
|
|
Joint Venture Agreement of Wells/Fremont Associates dated July 15, 1998, by and between Wells Development Corporation and Piedmont Operating Partnership, L.P. (f/k/a Wells Operating Partnership, L.P. (the “Operating Partnership”) (incorporated by reference to Exhibit 10.17 to Post-Effective Amendment No. 3 to the Company’s Form S-11 Registration Statement (Commission File No. 333-32099), filed on August 14, 1998)
|
|
10.3
|
|
Amended and Restated Joint Venture Partnership Agreement of Fund XI-Fund XII-REIT Joint Venture dated June 21, 1999, by and among Wells Real Estate Fund XI, L.P., Wells Real Estate Fund XII, L.P. and the Operating Partnership (incorporated by reference to Exhibit 10.29 to Amendment No. 1 to the Company’s Form S-11 Registration Statement (Commission File No. 333-83933), filed on November 17, 1999)
|
|
10.4
|
|
Joint Venture Partnership Agreement of Wells Fund XII-REIT Joint Venture Partnership dated April 10, 2000, by and between the Operating Partnership and Wells Real Estate Fund XII, L.P. (incorporated by reference to Exhibit 10.11 to Post-Effective Amendment No. 2 to the Company’s Form S-11 Registration Statement (Commission File No. 333-66657), filed on April 25, 2000)
|
|
10.5
|
|
Joint Venture Partnership Agreement of Wells Fund XIII-REIT Joint Venture Partnership dated June 27, 2001, by and between the Operating Partnership and Wells Real Estate Investment Fund XIII, L.P. (incorporated by reference to Exhibit 10.85 to Post-Effective Amendment No. 3 to the Company’s Form S-11 Registration Statement (Commission File No. 333-44900), filed on July 23, 2001)
|
|
10.6
|
|
Second Amended and Restated Limited Partnership Agreement of 35 W. Wacker Venture, L.P. dated April 27, 2000 (incorporated by reference to Exhibit 10.106 to Post-Effective Amendment No. 6 to the Company’s Form S-11 Registration Statement (Commission File No. 333-85848), filed on December 17, 2003)
|
|
10.7
|
|
First Amendment to Second Amended and Restated Limited Partnership Agreement of 35 W. Wacker Venture, L.P. dated November 6, 2003 (incorporated by reference to Exhibit 10.107 to Post-Effective Amendment No. 6 to the Company’s Form S-11 Registration Statement (Commission File No. 333-85848), filed on December 17, 2003)
|
|
10.8
|
|
Amended and Restated Limited Partnership Agreement of Wells-Buck Venture, L.P. dated November 6, 2003, by and among Wells 35 W. Wacker, LLC, Buck 35 Wacker, L.L.C. and VV USA City, L.P. (incorporated by reference to Exhibit 10.108 to Post-Effective Amendment No. 6 to the Company’s Form S-11 Registration Statement (Commission File No. 333-85848), filed on December 17, 2003)
|
46
|
10.9
|
|
Amended and Restated Promissory Note dated November 1, 2007, by 1201 Eye Street, N.W. Associates LLC in favor of Metropolitan Life Insurance Company (incorporated by reference to Exhibit 10.9 to the Company’s Form 10-K for the fiscal year ended December 31, 2007 filed on March 26, 2008)
|
|
10.10
|
|
Amended and Restated Deed of Trust, Security Agreement and Fixture Filing dated November 1, 2007, by 1201 Eye Street, N.W. Associates LLC for the benefit of Metropolitan Life Insurance Company (incorporated by reference to Exhibit 10.10 to the Company’s Form 10-K for the fiscal year ended December 31, 2007 filed on March 26, 2008)
|
|
10.11
|
|
Amended and Restated Promissory Note dated November 1, 2007, by 1225 Eye Street, N.W. Associates LLC in favor of Metropolitan Life Insurance Company (incorporated by reference to Exhibit 10.11 to the Company’s Form 10-K for the fiscal year ended December 31, 2007 filed on March 26, 2008)
|
|
10.12
|
|
Amended and Restated Deed of Trust, Security Agreement and Fixture Filing dated October 24, 2002, by 1225 Eye Street, N.W. Associates LLC for the benefit of Metropolitan Life Insurance Company (incorporated by reference to Exhibit 10.12 to the Company’s Form 10-K for the fiscal year ended December 31, 2007 filed on March 26, 2008)
|
|
10.13
|
|
Limited Liability Company Agreement of 1201 Eye Street, N.W. Associates, LLC dated September 27, 2002 (incorporated by reference to Exhibit 10.119 to Post-Effective Amendment No. 6 to the Company’s Form S-11 Registration Statement (Commission File No. 333-85848), filed on December 17, 2003)
|
|
10.14
|
|
First Amendment to Limited Liability Company Agreement of 1201 Eye Street, N.W. Associates, LLC (incorporated by reference to Exhibit 10.120 to Post-Effective Amendment No. 6 to Company’s Form S-11 Registration Statement (Commission File No. 333-85848), filed on December 17, 2003)
|
|
10.15
|
|
Limited Liability Company Agreement of 1225 Eye Street, N.W. Associates, LLC dated September 27, 2002 (incorporated by reference to Exhibit 10.121 to Post-Effective Amendment No. 6 to the Company’s Form S-11 Registration Statement (Commission File No. 333-85848), filed on December 17, 2003)
|
|
10.16
|
|
First Amendment to Limited Liability Company Associates of 1225 Eye Street, N.W. Associates, LLC (incorporated by reference to Exhibit 10.122 to Post-Effective Amendment No. 6 to the Company’s Form S-11 Registration Statement (Commission File No. 333-85848), filed on December 17, 2003)
|
|
10.17
|
|
Promissory Note dated April 20, 2004, by Wells REIT-Chicago Center Owner, LLC in favor of Metropolitan Life Insurance Company (incorporated by reference to Exhibit 10.174 to the Company’s Quarterly Report on Form 10-Q for the quarterly period ended June 30, 2004, filed on August 6, 2004)
|
|
10.18
|
|
Mortgage, Security Agreement and Fixture Filing by Wells REIT-Chicago Center Owner, LLC to Metropolitan Life Insurance Company (incorporated by reference to Exhibit 10.175 to the Company’s Form 10-Q for the quarterly period ended June 30, 2004, filed on August 6, 2004)
|
|
10.19
|
|
Loan Agreement (Multi-State) dated May 21, 2004, between Wells REIT-Austin, TX, L.P., Wells REIT—Multi-State Owner, LLC, Wells REIT-Nashville, TN, LLC and Wells REIT—Bridgewater, NJ, LLC; and Morgan Stanley Mortgage Capital Inc. (incorporated by reference to Exhibit 10.176 to the Company’s Quarterly Report on Form 10-Q for the quarterly period ended June 30, 2004, filed on August 6, 2004)
|
|
10.20
|
|
Loan Agreement (D.C. Properties) dated May 21, 2004, between Wells REIT-Independence Square, LLC and Morgan Stanley Mortgage Capital Inc. (incorporated by reference to Exhibit 10.177 to the Company’s Quarterly Report on Form 10-Q for the quarterly period ended June 30, 2004, filed on August 6, 2004)
|
|
10.21
|
|
Promissory Note dated May 5, 2005, by Wells REIT-800 Nicollett Avenue Owner, LLC. in favor of Wachovia Bank, N.A. (incorporated by reference to Exhibit 10.70 to the Company’s Quarterly Report on Form 10-Q for the quarterly period ended June 30, 2005, filed on August 5, 2005)
|
|
10.22
|
|
Fixed Rate Note dated May 4, 2005, by 4250 N. Fairfax Owner, LLC in favor of JPMorgan Chase Bank, N.A. (incorporated by reference to Exhibit 10.71 to the Company’s Quarterly Report on Form 10-Q for the quarterly period ended June 30, 2005, filed on August 5, 2005)
|
|
10.23
|
|
Amended and Restated Dividend Reinvestment Plan of the Company adopted February 24, 2011 (incorporated by reference to Exhibit 99.1 to the Company’s Current Report on Form 8-K, filed on February 24, 2011)
|
|
10.24*
|
|
Employment Agreement dated February 2, 2007, by and between the Company and Donald A. Miller, CFA (incorporated by reference to Exhibit 10.1 to the Company’s Current Report on Form 8-K, filed on February 5, 2007)
|
|
10.25*
|
Amendment Number One to Employment Agreement dated February 2, 2007, by and between the Company and Donald A. Miller, CFA (incorporated by reference to Exhibit 10.1 to the Company's Current Report on Form 8-K, filed on September 14, 2011)
|
|
47
|
10.26
|
|
Escrow Agreement dated April 16, 2007, by and among the Company, Wells Advisory Services I, LLC and SunTrust Bank (incorporated by reference to Exhibit 99.1 to the Company’s Current Report on Form 8-K, filed on April 20, 2007)
|
|
10.27
|
|
Pledge and Security Agreement dated April 16, 2007, by and between the Company, Wells Advisory Services I, LLC, WRT Acquisition Company, LLC and WGS Acquisition Company, LLC (incorporated by reference to Exhibit 99.2 to the Company’s Current Report on Form 8-K, filed on April 20, 2007)
|
|
10.28
|
|
Registration Rights Agreement dated April 16, 2007, by and among the Company, Wells Advisory Services I, LLC and Wells Capital, Inc. (incorporated by reference to Exhibit 99.5 to the Company’s Current Report on Form 8-K, filed on April 20, 2007)
|
|
10.29*
|
|
Piedmont Office Realty Trust, Inc. 2007 Omnibus Incentive Plan (f/k/a the Wells Real Estate Investment Trust, Inc. 2007 Omnibus Incentive Plan) (incorporated by reference to Exhibit 99.7 to the Company’s Current Report on Form 8-K, filed on April 20, 2007)
|
|
10.30*
|
Amendment Number One to the Piedmont Office Realty Trust, Inc. 2007 Omnibus Incentive Plan (f/k/a the Wells Real Estate Investment Trust, Inc. 2007 Omnibus Incentive Plan) (incorporated by reference to Exhibit 10.12 to the Company's Quarterly Report on Form 10-Q for the quarterly period ended June 30, 2011, filed on August 9, 2011)
|
|
|
10.31
|
|
Amendment to Agreement of Limited Partnership of the Operating Partnership, as Amended and Restated as of January 1, 2000, dated April 16, 2007 (incorporated by reference to Exhibit 99.8 to the Company’s Current Report on Form 8-K, filed on April 20, 2007)
|
|
10.32*
|
|
Employment Agreement dated April 16, 2007, by and between the Company and Robert E. Bowers (incorporated by reference to Exhibit 99.9 to the Company’s Current Report on Form 8-K, filed on April 20, 2007)
|
|
10.33*
|
|
Employment Agreement dated May 14, 2007, by and between the Company and Carroll A. “Bo” Reddic, IV (incorporated by reference to Exhibit 99.1 to the Company’s Current Report on Form 8-K, filed on May 14, 2007)
|
|
10.34*
|
|
Employment Agreement dated May 14, 2007, by and between the Company and Raymond L. Owens (incorporated by reference to Exhibit 99.2 to the Company’s Current Report on Form 8-K, filed on May 14, 2007)
|
|
10.35*
|
|
Employment Agreement dated May 14, 2007, by and between the Company and Laura P. Moon (incorporated by reference to Exhibit 99.3 to the Company’s Current Report on Form 8-K, filed on May 14, 2007)
|
|
10.36
|
|
Master Property Management, Leasing, and Construction Management Agreement dated April 16, 2007 by and among the Company, the Operating Partnership, and Wells Management Company, Inc. (incorporated by reference to Exhibit 99.10 to the Company’s Current Report on Form 8-K, filed on April 20, 2007)
|
|
10.37*
|
|
Form of Employee Deferred Stock Award Agreement for 2007 Omnibus Incentive Plan of the Company effective May 18, 2007 (incorporated by reference to Exhibit 10.82 to the Company’s Quarterly Report on Form 10-Q for the quarterly period ended June 30, 2007, filed on August 7, 2007)
|
|
10.38
|
|
Amendment to Second Amended and Restated Agreement of Limited Partnership of the Operating Partnership, as Amended and Restated as of January 1, 2000, dated August 8, 2007 (incorporated by reference to Exhibit 99.1 to the Company’s Current Report on Form 8-K, filed on August 10, 2007)
|
|
10.39
|
|
Credit Agreement dated August 31, 2007, by and among the Operating Partnership, the Company, Wachovia Capital Markets, LLC and J.P. Morgan Securities Inc., Wachovia Bank, National Association, JPMorgan Chase Bank, N.A., each of Morgan Stanley Bank, Bank of America, N.A., and PNC Bank, National Association, and the other banks signatory thereto (incorporated by reference to Exhibit 10.1 to the Company’s Current Report on Form 8-K, filed on September 7, 2007)
|
|
10.40
|
|
Term Loan Agreement, dated as of June 26, 2008, among Piedmont Operating Partnership, LP, as Borrower, Piedmont Office Realty Trust, Inc., as Parent, JP Morgan Securities, Inc. and Banc of America Securities, LLC, as Co-Lead Arrangers and Book Managers, JP Morgan Chase Bank, N.A., as Administrative Agent, Bank of America, N.A., as Syndication Agent, each of Wells Fargo Bank, N.A., Regions Bank, N.A., and US Bank N.A., as Documentation Agents, the other banks signatory thereto (incorporated by reference to Exhibit 10.1 to the Company’s Current Report on Form 8-K, filed on July 1, 2008)
|
48
|
10.41
|
Loan Agreement dated as of July 11, 2007 by and between Broadway 500 West Monroe Fee LLC (now known as Piedmont 500 West Monroe Fee LLC) (“Mortgage Borrower”) and Morgan Stanley Mortgage Capital Holdings LLC (as predecessor in interest to Wells Fargo Bank, N.A., as Trustee, for the Certificate holders of Morgan Stanley Capital I Inc. Commercial Mortgage Pass-Through Certificates Trust, Series 2007-XLF9) (“Mortgage Lender”) (incorporated by reference to Exhibit 10.1 to the Company's Quarterly Report on Form 10-Q for the quarterly period ended March 31, 2011, filed on May 5, 2011)
|
|
|
10.42
|
Promissory Note dated as of July 11, 2007 by and between Mortgage Borrower and Mortgage Lender (incorporated by reference to Exhibit 10.2 to the Company's Quarterly Report on Form 10-Q for the quarterly period ended March 31, 2011, filed on May 5, 2011)
|
|
|
10.43
|
First Omnibus Amendment to Loan Agreement and Other Loan Documents (Mortgage Loan) dated as of August 15, 2007, by and among Mortgage Borrower and Mortgage Lender (incorporated by reference to Exhibit 10.3 to the Company's Quarterly Report on Form 10-Q for the quarterly period ended March 31, 2011, filed on May 5, 2011)
|
|
|
10.44
|
Amended and Restated Promissory Note dated as of August 15, 2007, by and among Mortgage Borrower and Mortgage Lender (incorporated by reference to Exhibit 10.4 to the Company's Quarterly Report on Form 10-Q for the quarterly period ended March 31, 2011, filed on May 5, 2011)
|
|
|
10.45
|
Mezzanine A Loan Agreement dated as of July 11, 2007, by and between Broadway 500 West Monroe Mezz I LLC (now known as Piedmont 500 West Monroe Mezz I LLC) (“Mezzanine Borrower”) and Morgan Stanley Mortgage Capital Holdings LLC (as predecessor in interest to 500 W Monroe Mezz I-B, LLC and Deutsche Genossenschafts-Hypothekenbank AG) (“Mezzanine Lender”) (incorporated by reference to Exhibit 10.5 to the Company's Quarterly Report on Form 10-Q for the quarterly period ended March 31, 2011, filed on May 5, 2011)
|
|
|
10.46
|
Promissory Note (Mezzanine A Loan) dated as of July 11, 2007, by and between Mezzanine Borrower and Mezzanine Lender (incorporated by reference to Exhibit 10.6 to the Company's Quarterly Report on Form 10-Q for the quarterly period ended March 31, 2011, filed on May 5, 2011)
|
|
|
10.47
|
First Omnibus Amendment to Loan Agreement and Other Loan Documents (Mezzanine A Loan), dated August 15, 2007, by and between Mezzanine Borrower and Mezzanine Lender (incorporated by reference to Exhibit 10.7 to the Company's Quarterly Report on Form 10-Q for the quarterly period ended March 31, 2011, filed on May 5, 2011)
|
|
|
10.48
|
Amended and Restated Promissory Note (Mezzanine A Loan), dated August 15, 2007, by and between Mezzanine Borrower and Mezzanine Lender (incorporated by reference to Exhibit 10.8 to the Company's Quarterly Report on Form 10-Q for the quarterly period ended March 31, 2011, filed on May 5, 2011)
|
|
|
10.49
|
Second Omnibus Amendment to Loan Agreement and Other Loan Documents (Mezzanine A Loan), dated as of February 26, 2008, by and between Mezzanine Borrower and Mezzanine Lender (incorporated by reference to Exhibit 10.9 to the Company's Quarterly Report on Form 10-Q for the quarterly period ended March 31, 2011, filed on May 5, 2011)
|
|
|
10.50
|
Second Amended and Restated Promissory Note (Mezzanine A Loan), by and between Mezzanine Borrower and Mezzanine Lender (incorporated by reference to Exhibit 10.10 to the Company's Quarterly Report on Form 10-Q for the quarterly period ended March 31, 2011, filed on May 5, 2011)
|
|
|
10.51
|
Mezzanine A Loan Participation Agreement, dated as of February 26, 2008, by and between Mezzanine Lender, Morgan Stanley Mortgage Capital Holdings LLC (as predecessor in interest to Deutsche Genossenschafts-Hypothekenbank AG), as Participation A Holder, Morgan Stanley Mortgage Capital Holdings LLC (as predecessor in interest to 500 W Monroe Mezz I-B, LLC), as Participation B Holder, and LaSalle Bank National Association, as Custodian (incorporated by reference to Exhibit 10.11 to the Company's Quarterly Report on Form 10-Q for the quarterly period ended March 31, 2011, filed on May 5, 2011)
|
|
|
10.52
|
Term Loan Agreement, date as of November 22, 2011, among the Operating Partnership, as Borrower, the Company, as Parent, JP Morgan Securities, LLC, and Suntrust Robinson Humphrey, Inc., as Joint-Lead Arrangers and Book Runners, JPMorgan Chase Bank as Administrative Agent, Suntrust Bank as Syndication Agent, Wells Fargo Bank as Documentation Agent, the other banks signatory thereto as Lenders (incorporated by reference to Exhibit 10.1 to the Company's Current Report on Form 8-K, filed on November 29, 2011)
|
|
|
10.53*
|
2010 Long-Term Incentive Program Award Agreement (incorporated by reference to Exhibit 10.1 to the Company's Quarterly Report on Form 10-Q for the quarterly period ended September 30, 2011, filed on November 30, 2011)
|
|
|
10.54*
|
2010 Long-Term Incentive Program (incorporated by reference to Exhibit 10.2 to the Company's Quarterly Report on Form 10-Q for the quarterly period ended September 30, 2011, filed on November 30, 2011)
|
|
49
|
10.55*
|
Long-Term Incentive Program Award Agreement (incorporated by reference to Exhibit 10.3 to the Company's Quarterly Report on Form 10-Q for the quarterly period ended September 30, 2011, filed on November 30, 2011)
|
|
|
10.56*
|
Long-Term Incentive Program (incorporated by reference to Exhibit 10.4 to the Company's Quarterly Report on Form 10-Q for the quarterly period ended September 30, 2011, filed on November 30, 2011)
|
|
|
21.1
|
|
List of Subsidiaries of the Company
|
|
23.1
|
|
Consent of Ernst & Young LLP
|
|
31.1
|
|
Certification of Chief Executive Officer pursuant to Section 302 of the Sarbanes-Oxley Act of 2002
|
|
31.2
|
|
Certification of Chief Financial Officer pursuant to Section 302 of the Sarbanes-Oxley Act of 2002
|
|
32.1
|
|
Certification of Chief Executive Officer pursuant to Section 906 of the Sarbanes-Oxley Act of 2002
|
|
32.2
|
|
Certification of Chief Financial Officer pursuant to Section 906 of the Sarbanes-Oxley Act of 2002
|
|
101.INS **
|
XBRL Instance Document **
|
|
|
101.SCH **
|
XBRL Taxonomy Extension Schema **
|
|
|
101.CAL **
|
XBRL Taxonomy Extension Calculation Linkbase **
|
|
|
101.DEF **
|
XBRL Taxonomy Extension Definition Linkbase **
|
|
|
101.LAB **
|
XBRL Taxonomy Extension Label Linkbase **
|
|
|
101.PRE **
|
XBRL Taxonomy Extension Presentation Linkbase **
|
|
* Identifies each management contract or compensatory plan required to be filed.
** Furnished with this Form 10-K.
50
INDEX TO CONSOLIDATED FINANCIAL STATEMENTS
|
Financial Statements
|
Page
|
|
Financial Statement Schedule
|
|
F-1
Report of Independent Registered Public Accounting Firm
The Board of Directors and Stockholders
Piedmont Office Realty Trust, Inc.
We have audited the accompanying consolidated balance sheets of Piedmont Office Realty Trust, Inc. as of December 31, 2011 and 2010, and the related consolidated statements of income, stockholders’ equity and noncontrolling interest, and cash flows for each of the three years in the period ended December 31, 2011. Our audits also included the financial statement schedule listed in the index at Item 15(a). These financial statements are the responsibility of the Company's management. Our responsibility is to express an opinion on these financial statements based on our audits.
We conducted our audits in accordance with the standards of the Public Company Accounting Oversight Board (United States). Those standards require that we plan and perform the audit to obtain reasonable assurance about whether the financial statements are free of material misstatement. An audit includes examining, on a test basis, evidence supporting the amounts and disclosures in the financial statements. An audit also includes assessing the accounting principles used and significant estimates made by management, as well as evaluating the overall financial statement presentation. We believe that our audits provide a reasonable basis for our opinion.
In our opinion, the consolidated financial statements referred to above present fairly, in all material respects, the consolidated financial position of Piedmont Office Realty Trust, Inc. at December 31, 2011 and 2010, and the consolidated results of its operations and its cash flows for each of the three years in the period ended December 31, 2011, in conformity with U.S. generally accepted accounting principles. Also, in our opinion, the related financial statement schedule, when considered in relation to the basic financial statements taken as a whole, presents fairly in all material respects the information set forth therein.
We also have audited, in accordance with the standards of the Public Company Accounting Oversight Board (United States), Piedmont Office Realty Trust, Inc.’s internal control over financial reporting as of December 31, 2011, based on criteria established in Internal Control-Integrated Framework issued by the Committee of Sponsoring Organizations of the Treadway Commission and our report dated
February 28, 2012
expressed an unqualified opinion thereon.
Atlanta, Georgia
February 28, 2012
F-2
Report of Independent Registered Public Accounting Firm
on Internal Control Over Financial Reporting
The Board of Directors and Stockholders
Piedmont Office Realty Trust, Inc.
We have audited Piedmont Office Realty Trust, Inc.’s internal control over financial reporting as of December 31, 2011, based on criteria established in Internal Control—Integrated Framework issued by the Committee of Sponsoring Organizations of the Treadway Commission (the COSO criteria). Piedmont Office Realty Trust, Inc.’s management is responsible for maintaining effective internal control over financial reporting, and for its assessment of the effectiveness of internal control over financial reporting included in the accompanying Management's Annual Report on Internal Control Over Financial Reporting. Our responsibility is to express an opinion on the company’s internal control over financial reporting based on our audit.
We conducted our audit in accordance with the standards of the Public Company Accounting Oversight Board (United States). Those standards require that we plan and perform the audit to obtain reasonable assurance about whether effective internal control over financial reporting was maintained in all material respects. Our audit included obtaining an understanding of internal control over financial reporting, assessing the risk that a material weakness exists, testing and evaluating the design and operating effectiveness of internal control based on the assessed risk, and performing such other procedures as we considered necessary in the circumstances. We believe that our audit provides a reasonable basis for our opinion.
A company’s internal control over financial reporting is a process designed to provide reasonable assurance regarding the reliability of financial reporting and the preparation of financial statements for external purposes in accordance with generally accepted accounting principles. A company’s internal control over financial reporting includes those policies and procedures that (1) pertain to the maintenance of records that, in reasonable detail, accurately and fairly reflect the transactions and dispositions of the assets of the company; (2) provide reasonable assurance that transactions are recorded as necessary to permit preparation of financial statements in accordance with generally accepted accounting principles, and that receipts and expenditures of the company are being made only in accordance with authorizations of management and directors of the company; and (3) provide reasonable assurance regarding prevention or timely detection of unauthorized acquisition, use, or disposition of the company’s assets that could have a material effect on the financial statements.
Because of its inherent limitations, internal control over financial reporting may not prevent or detect misstatements. Also, projections of any evaluation of effectiveness to future periods are subject to the risk that controls may become inadequate because of changes in conditions, or that the degree of compliance with the policies or procedures may deteriorate.
In our opinion, Piedmont Office Realty Trust, Inc. maintained, in all material respects, effective internal control over financial reporting as of December 31, 2011, based on the COSO criteria.
We also have audited, in accordance with the standards of the Public Company Accounting Oversight Board (United States), the consolidated balance sheets of Piedmont Office Realty Trust, Inc. as of December 31, 2011 and 2010, and the related consolidated statements of income, stockholders’ equity and noncontrolling interest, and cash flows for each of the three years in the period ended December 31, 2011 of Piedmont Office Realty Trust, Inc. and our report dated
February 28, 2012
expressed an unqualified opinion thereon.
Atlanta, Georgia
February 28, 2012
F-3
PIEDMONT OFFICE REALTY TRUST, INC.
(in thousands, except share and per-share amounts)
|
December 31, 2011
|
December 31, 2010
|
||||||
|
Assets:
|
|||||||
|
Real estate assets, at cost:
|
|||||||
|
Land
|
$
|
640,196
|
|
$
|
647,653
|
|
|
|
Buildings and improvements, less accumulated depreciation of $792,342 and $744,756 as of December 31, 2011 and December 31, 2010, respectively
|
2,967,254
|
|
2,943,995
|
|
|||
|
Intangible lease assets, less accumulated amortization of $119,419 and $145,742 as of December 31, 2011 and December 31, 2010, respectively
|
79,248
|
|
74,028
|
|
|||
|
Construction in progress
|
17,353
|
|
11,152
|
|
|||
|
Total real estate assets
|
3,704,051
|
|
3,676,828
|
|
|||
|
Investments in unconsolidated joint ventures
|
38,181
|
|
42,018
|
|
|||
|
Cash and cash equivalents
|
139,690
|
|
56,718
|
|
|||
|
Tenant receivables, net of allowance for doubtful accounts of $631 and $1,298 as of December 31, 2011 and December 31, 2010, respectively
|
129,523
|
|
134,006
|
|
|||
|
Notes receivable
|
—
|
|
61,144
|
|
|||
|
Due from unconsolidated joint ventures
|
788
|
|
1,158
|
|
|||
|
Restricted cash and escrows
|
9,039
|
|
12,475
|
|
|||
|
Prepaid expenses and other assets
|
9,911
|
|
11,249
|
|
|||
|
Goodwill
|
180,097
|
|
180,097
|
|
|||
|
Deferred financing costs, less accumulated amortization of $9,214 and $11,893 as of December 31, 2011 and December 31, 2010, respectively
|
5,977
|
|
5,306
|
|
|||
|
Deferred lease costs, less accumulated amortization of $120,358 and $137,726 as of December 31, 2011 and December 31, 2010, respectively
|
230,577
|
|
192,481
|
|
|||
|
Total assets
|
$
|
4,447,834
|
|
$
|
4,373,480
|
|
|
|
Liabilities:
|
|||||||
|
Line of credit and notes payable
|
$
|
1,472,525
|
|
$
|
1,402,525
|
|
|
|
Accounts payable, accrued expenses, and accrued capital expenditures
|
122,986
|
|
112,648
|
|
|||
|
Deferred income
|
27,321
|
|
35,203
|
|
|||
|
Intangible lease liabilities, less accumulated amortization of $63,981 and $84,308 as of December 31, 2011 and December 31, 2010, respectively
|
49,037
|
|
48,959
|
|
|||
|
Interest rate swaps
|
2,537
|
|
691
|
|
|||
|
Total liabilities
|
1,674,406
|
|
1,600,026
|
|
|||
|
Commitments and Contingencies
|
—
|
|
—
|
|
|||
|
Stockholders’ Equity:
|
|||||||
|
Shares-in-trust, 150,000,000 shares authorized, none outstanding as of December 31, 2011 or December 31, 2010
|
—
|
|
—
|
|
|||
|
Preferred stock, no par value, 100,000,000 shares authorized, none outstanding as of December 31, 2011 or December 31, 2010
|
—
|
|
—
|
|
|||
|
Common stock, $.01 par value; 750,000,000 shares authorized, 172,629,748 shares issued and outstanding as of December 31, 2011; and 172,658,489 shares issued and outstanding at December 31, 2010
|
1,726
|
|
1,727
|
|
|||
|
Additional paid-in capital
|
3,663,662
|
|
3,661,308
|
|
|||
|
Cumulative distributions in excess of earnings
|
(891,032
|
)
|
(895,122
|
)
|
|||
|
Other comprehensive loss
|
(2,537
|
)
|
(691
|
)
|
|||
|
Piedmont stockholders’ equity
|
2,771,819
|
|
2,767,222
|
|
|||
|
Noncontrolling interest
|
1,609
|
|
6,232
|
|
|||
|
Total stockholders’ equity
|
2,773,428
|
|
2,773,454
|
|
|||
|
Total liabilities and stockholders’ equity
|
$
|
4,447,834
|
|
$
|
4,373,480
|
|
|
See accompanying notes.
F-4
PIEDMONT OFFICE REALTY TRUST, INC.
(in thousands, except share and per-share amounts)
|
|
Years Ended December 31,
|
||||||||||
|
|
2011
|
2010
|
2009
|
||||||||
|
Revenues:
|
|||||||||||
|
Rental income
|
$
|
419,141
|
|
$
|
408,375
|
|
$
|
409,905
|
|
||
|
Tenant reimbursements
|
115,879
|
|
114,795
|
|
126,872
|
|
|||||
|
Property management fee revenue
|
1,584
|
|
3,212
|
|
3,111
|
|
|||||
|
Other rental income
|
5,038
|
|
6,658
|
|
2,764
|
|
|||||
|
541,642
|
|
533,040
|
|
542,652
|
|
||||||
|
Expenses:
|
|||||||||||
|
Property operating costs
|
208,711
|
|
196,875
|
|
207,018
|
|
|||||
|
Depreciation
|
104,818
|
|
97,275
|
|
97,467
|
|
|||||
|
Amortization
|
54,903
|
|
38,021
|
|
46,359
|
|
|||||
|
Impairment losses on real estate assets
|
—
|
|
—
|
|
35,063
|
|
|||||
|
General and administrative
|
24,838
|
|
28,388
|
|
26,656
|
|
|||||
|
393,270
|
|
360,559
|
|
412,563
|
|
||||||
|
Real estate operating income
|
148,372
|
|
172,481
|
|
130,089
|
|
|||||
|
Other income (expense):
|
|||||||||||
|
Interest expense
|
(65,817
|
)
|
(66,486
|
)
|
(71,464
|
)
|
|||||
|
Interest and other income
|
2,774
|
|
3,486
|
|
4,407
|
|
|||||
|
Equity in income of unconsolidated joint ventures
|
1,619
|
|
2,633
|
|
104
|
|
|||||
|
Gain on consolidation of variable interest entity
|
1,532
|
|
—
|
|
—
|
|
|||||
|
Gain on extinguishment of debt
|
1,039
|
|
—
|
|
—
|
|
|||||
|
(58,853
|
)
|
(60,367
|
)
|
(66,953
|
)
|
||||||
|
Income from continuing operations
|
89,519
|
|
112,114
|
|
63,136
|
|
|||||
|
Discontinued operations:
|
|||||||||||
|
Operating income, excluding impairment loss
|
12,880
|
|
18,684
|
|
11,579
|
|
|||||
|
Impairment loss
|
—
|
|
(9,587
|
)
|
—
|
|
|||||
|
Gain/(loss) on sale of real estate assets
|
122,657
|
|
(817
|
)
|
—
|
|
|||||
|
Income from discontinued operations
|
135,537
|
|
8,280
|
|
11,579
|
|
|||||
|
Net income
|
225,056
|
|
120,394
|
|
74,715
|
|
|||||
|
Less: Net income attributable to noncontrolling interest
|
(15
|
)
|
(15
|
)
|
(15
|
)
|
|||||
|
Net income attributable to Piedmont
|
$
|
225,041
|
|
$
|
120,379
|
|
$
|
74,700
|
|
||
|
Per share information—basic:
|
|||||||||||
|
Income from continuing operations
|
$
|
0.52
|
|
$
|
0.66
|
|
$
|
0.40
|
|
||
|
Income from discontinued operations
|
0.78
|
|
0.05
|
|
0.07
|
|
|||||
|
Income attributable to noncontrolling interest
|
—
|
|
—
|
|
—
|
|
|||||
|
Net income available to common stockholders
|
$
|
1.30
|
|
$
|
0.71
|
|
$
|
0.47
|
|
||
|
Per share information—diluted:
|
|||||||||||
|
Income from continuing operations
|
$
|
0.52
|
|
$
|
0.65
|
|
$
|
0.40
|
|
||
|
Income from discontinued operations
|
0.78
|
|
0.05
|
|
0.07
|
|
|||||
|
Income attributable to noncontrolling interest
|
—
|
|
—
|
|
—
|
|
|||||
|
Net income available to common stockholders
|
$
|
1.30
|
|
$
|
0.70
|
|
$
|
0.47
|
|
||
|
Weighted-average shares outstanding—basic
|
172,764,838
|
|
170,752,520
|
|
158,419,262
|
|
|||||
|
Weighted-average shares outstanding—diluted
|
172,980,947
|
|
170,967,324
|
|
158,580,990
|
|
|||||
See accompanying notes.
F-5
PIEDMONT OFFICE REALTY TRUST, INC.
CONSOLIDATED STATEMENTS OF STOCKHOLDERS’ EQUITY
(in thousands, except per-share amounts)
|
|
Common Stock
|
Additional
Paid-In
Capital
|
Cumulative
Distributions in
Excess of Earnings
|
Redeemable
Common
Stock
|
Other
Comprehensive
Loss
|
Noncontrolling
Interest
|
Total
Stockholders’
Equity
|
|||||||||||||||||||||||
|
Shares
|
Amount
|
|||||||||||||||||||||||||||||
|
Balance, December 31, 2008
|
159,633
|
|
$
|
1,596
|
|
$
|
3,491,654
|
|
$
|
(674,326
|
)
|
$
|
(112,927
|
)
|
$
|
(8,957
|
)
|
$
|
5,254
|
|
$
|
2,702,294
|
|
|||||||
|
Issuance of common stock
|
4,284
|
|
43
|
|
107,657
|
|
—
|
|
—
|
|
—
|
|
—
|
|
107,700
|
|
||||||||||||||
|
Redemptions of common stock
|
(5,105
|
)
|
(51
|
)
|
(128,293
|
)
|
—
|
|
—
|
|
—
|
|
—
|
|
(128,344
|
)
|
||||||||||||||
|
Change in redeemable common stock outstanding
|
—
|
|
—
|
|
—
|
|
—
|
|
37,763
|
|
—
|
|
—
|
|
37,763
|
|
||||||||||||||
|
Dividends ($1.2600 per share) and distributions to noncontrolling interest
|
—
|
|
—
|
|
—
|
|
(198,935
|
)
|
—
|
|
—
|
|
(16
|
)
|
(198,951
|
)
|
||||||||||||||
|
Premium on stock sales
|
—
|
|
—
|
|
3,585
|
|
—
|
|
—
|
|
—
|
|
—
|
|
3,585
|
|
||||||||||||||
|
Shares issued under the 2007 Omnibus Incentive Plan, net of tax
|
105
|
|
1
|
|
2,565
|
|
—
|
|
—
|
|
—
|
|
—
|
|
2,566
|
|
||||||||||||||
|
Net income attributable to noncontrolling interest
|
—
|
|
—
|
|
—
|
|
—
|
|
—
|
|
—
|
|
478
|
|
478
|
|
||||||||||||||
|
Components of comprehensive income:
|
||||||||||||||||||||||||||||||
|
Net income
|
—
|
|
—
|
|
—
|
|
74,700
|
|
—
|
|
—
|
|
—
|
|
74,700
|
|
||||||||||||||
|
Net change in interest rate derivatives
|
—
|
|
—
|
|
—
|
|
—
|
|
—
|
|
5,091
|
|
—
|
|
5,091
|
|
||||||||||||||
|
Comprehensive income
|
79,791
|
|
||||||||||||||||||||||||||||
|
Balance, December 31, 2009
|
158,917
|
|
1,589
|
|
3,477,168
|
|
(798,561
|
)
|
(75,164
|
)
|
(3,866
|
)
|
5,716
|
|
2,606,882
|
|
||||||||||||||
|
Net proceeds from issuance of common stock
|
13,800
|
|
138
|
|
184,266
|
|
—
|
|
—
|
|
—
|
|
—
|
|
184,404
|
|
||||||||||||||
|
Redemptions of fractional shares of common stock
|
(200
|
)
|
(2
|
)
|
(2,900
|
)
|
—
|
|
—
|
|
—
|
|
—
|
|
(2,902
|
)
|
||||||||||||||
|
Change in redeemable common stock outstanding
|
—
|
|
—
|
|
—
|
|
—
|
|
75,164
|
|
—
|
|
—
|
|
75,164
|
|
||||||||||||||
|
Dividends to common stockholders($1.2600 per share), distributions to noncontrolling interest, and dividends reinvested
|
—
|
|
—
|
|
(33
|
)
|
(216,940
|
)
|
—
|
|
—
|
|
(15
|
)
|
(216,988
|
)
|
||||||||||||||
|
Shares issued under the 2007 Omnibus Incentive Plan, net of tax
|
141
|
|
2
|
|
2,807
|
|
—
|
|
—
|
|
—
|
|
—
|
|
2,809
|
|
||||||||||||||
|
Net income attributable to noncontrolling interest
|
—
|
|
—
|
|
—
|
|
—
|
|
—
|
|
—
|
|
531
|
|
531
|
|
||||||||||||||
|
Components of comprehensive income:
|
||||||||||||||||||||||||||||||
|
Net income
|
—
|
|
—
|
|
—
|
|
120,379
|
|
—
|
|
—
|
|
—
|
|
120,379
|
|
||||||||||||||
|
Net change in interest rate derivatives
|
—
|
|
—
|
|
—
|
|
—
|
|
—
|
|
3,175
|
|
—
|
|
3,175
|
|
||||||||||||||
|
Comprehensive income
|
123,554
|
|
||||||||||||||||||||||||||||
|
Balance, December 31, 2010
|
172,658
|
|
1,727
|
|
3,661,308
|
|
(895,122
|
)
|
—
|
|
(691
|
)
|
6,232
|
|
2,773,454
|
|
||||||||||||||
|
Stock repurchases as part of announced program (see Note 2)
|
(199
|
)
|
(2
|
)
|
—
|
|
(3,242
|
)
|
—
|
|
—
|
|
—
|
|
(3,244
|
)
|
||||||||||||||
|
Offering costs associated with issuance of common stock
|
—
|
|
—
|
|
(479
|
)
|
—
|
|
—
|
|
—
|
|
—
|
|
(479
|
)
|
||||||||||||||
|
Attribution of asset sales proceeds to noncontrolling interest
|
—
|
|
—
|
|
—
|
|
—
|
|
—
|
|
—
|
|
(2,684
|
)
|
(2,684
|
)
|
||||||||||||||
|
Dividends to common stockholders ($1.2600 per share), distributions to noncontrolling interest, and dividends reinvested
|
—
|
|
—
|
|
(249
|
)
|
(217,709
|
)
|
—
|
|
—
|
|
(2,407
|
)
|
(220,365
|
)
|
||||||||||||||
|
Shares issued under the 2007 Omnibus Incentive Plan, net of tax
|
171
|
|
1
|
|
3,082
|
|
—
|
|
—
|
|
—
|
|
—
|
|
3,083
|
|
||||||||||||||
|
Net income attributable to noncontrolling interest:
|
—
|
|
—
|
|
—
|
|
—
|
|
—
|
|
—
|
|
468
|
|
468
|
|
||||||||||||||
|
Components of comprehensive income:
|
||||||||||||||||||||||||||||||
|
Net income
|
—
|
|
—
|
|
—
|
|
225,041
|
|
—
|
|
—
|
|
—
|
|
225,041
|
|
||||||||||||||
|
Net change in interest rate derivatives
|
—
|
|
—
|
|
—
|
|
—
|
|
—
|
|
(1,846
|
)
|
—
|
|
(1,846
|
)
|
||||||||||||||
|
Comprehensive income
|
223,195
|
|
||||||||||||||||||||||||||||
|
Balance, December 31, 2011
|
172,630
|
|
$
|
1,726
|
|
$
|
3,663,662
|
|
$
|
(891,032
|
)
|
$
|
—
|
|
$
|
(2,537
|
)
|
$
|
1,609
|
|
$
|
2,773,428
|
|
|||||||
See accompanying notes.
F-6
PIEDMONT OFFICE REALTY TRUST, INC.
(in thousands)
|
|
Years Ended December 31,
|
||||||||||
|
|
2011
|
2010
|
2009
|
||||||||
|
Cash Flows from Operating Activities:
|
|||||||||||
|
Net income
|
$
|
225,056
|
|
$
|
120,394
|
|
$
|
74,715
|
|
||
|
Operating distributions received from unconsolidated joint ventures
|
2,932
|
|
4,463
|
|
4,445
|
|
|||||
|
Adjustments to reconcile net income to net cash provided by operating activities:
|
|||||||||||
|
Income attributable to noncontrolling interest- discontinued operations
|
453
|
|
516
|
|
463
|
|
|||||
|
Depreciation
|
109,730
|
|
104,490
|
|
106,073
|
|
|||||
|
Amortization of deferred financing costs and fair market value adjustments on notes payable
|
4,777
|
|
2,608
|
|
2,786
|
|
|||||
|
Other amortization
|
57,969
|
|
43,358
|
|
56,112
|
|
|||||
|
Impairment loss on real estate assets
|
—
|
|
7,041
|
|
35,063
|
|
|||||
|
Gain on extinguishment of debt
|
(1,041
|
)
|
—
|
|
—
|
|
|||||
|
Accretion of discount on notes receivable
|
(482
|
)
|
(2,400
|
)
|
(2,272
|
)
|
|||||
|
Stock compensation expense
|
4,705
|
|
3,681
|
|
2,878
|
|
|||||
|
Equity in income of unconsolidated joint ventures
|
(1,609
|
)
|
(2,633
|
)
|
(104
|
)
|
|||||
|
Gain on consolidation of variable interest entity
|
(1,532
|
)
|
—
|
|
—
|
|
|||||
|
(Gain)/loss on sale of real estate assets
|
(122,657
|
)
|
817
|
|
—
|
|
|||||
|
Changes in assets and liabilities:
|
|||||||||||
|
Increase in tenant receivables, net
|
(13,295
|
)
|
(5,564
|
)
|
(1,668
|
)
|
|||||
|
Decrease/(increase) in restricted cash and escrows
|
18,720
|
|
(11,818
|
)
|
(10,966
|
)
|
|||||
|
Increase in prepaid expenses and other assets
|
(760
|
)
|
(1,958
|
)
|
(175
|
)
|
|||||
|
Increase in accounts payable and accrued expenses
|
3,511
|
|
12,058
|
|
4,607
|
|
|||||
|
(Decrease)/increase in deferred income
|
(16,134
|
)
|
697
|
|
9,586
|
|
|||||
|
Net cash provided by operating activities
|
270,343
|
|
275,750
|
|
281,543
|
|
|||||
|
Cash Flows from Investing Activities:
|
|||||||||||
|
Investment in real estate assets and real estate related intangibles
|
(215,609
|
)
|
(114,147
|
)
|
(37,454
|
)
|
|||||
|
Cash assumed upon consolidation of variable interest entity
|
5,063
|
|
—
|
|
—
|
|
|||||
|
Investment in mezzanine debt
|
—
|
|
—
|
|
(10,000
|
)
|
|||||
|
Net sale proceeds from wholly-owned properties and consolidated joint venture
|
291,785
|
|
51,637
|
|
—
|
|
|||||
|
Net sale proceeds received from unconsolidated joint ventures
|
3,036
|
|
189
|
|
—
|
|
|||||
|
Investments in unconsolidated joint ventures
|
(151
|
)
|
(173
|
)
|
(57
|
)
|
|||||
|
Liquidation of noncontrolling interest upon sale of consolidated joint venture
|
(95
|
)
|
—
|
|
—
|
|
|||||
|
Deferred lease costs paid
|
(50,297
|
)
|
(17,700
|
)
|
(21,155
|
)
|
|||||
|
Net cash provided by/(used in) investing activities
|
33,732
|
|
(80,194
|
)
|
(68,666
|
)
|
|||||
|
Cash Flows from Financing Activities:
|
|||||||||||
|
Deferred financing costs paid
|
(3,367
|
)
|
(710
|
)
|
(93
|
)
|
|||||
|
Proceeds from line of credit and notes payable
|
829,000
|
|
25,000
|
|
181,000
|
|
|||||
|
Repayments of line of credit and notes payable
|
(822,875
|
)
|
(139,000
|
)
|
(188,100
|
)
|
|||||
|
Net proceeds from/(costs of) issuance of common stock
|
(252
|
)
|
185,774
|
|
90,581
|
|
|||||
|
Repurchases of common stock as part of announced program
|
(3,244
|
)
|
—
|
|
—
|
|
|||||
|
Redemptions of common stock
|
—
|
|
(2,918
|
)
|
(107,643
|
)
|
|||||
|
Dividends paid to stockholders and distributions to noncontrolling interest
|
(220,365
|
)
|
(216,988
|
)
|
(198,951
|
)
|
|||||
|
Net cash used in financing activities
|
(221,103
|
)
|
(148,842
|
)
|
(223,206
|
)
|
|||||
|
Net increase/(decrease) in cash and cash equivalents
|
82,972
|
|
46,714
|
|
(10,329
|
)
|
|||||
|
Cash and cash equivalents, beginning of year
|
56,718
|
|
10,004
|
|
20,333
|
|
|||||
|
Cash and cash equivalents, end of year
|
$
|
139,690
|
|
$
|
56,718
|
|
$
|
10,004
|
|
||
See accompanying notes.
F-7
PIEDMONT OFFICE REALTY TRUST, INC.
NOTES TO CONSOLIDATED FINANCIAL STATEMENTS
DECEMBER 31, 2011
,
2010
, AND
2009
1. Organization
Piedmont Office Realty Trust, Inc. (“Piedmont”) (NYSE: PDM) is a Maryland corporation that operates in a manner so as to qualify as a real estate investment trust (“REIT”) for federal income tax purposes and engages in the acquisition and ownership of commercial real estate properties throughout the United States, including properties that are under construction, are newly constructed, or have operating histories. Piedmont was incorporated in
1997
and commenced operations on
June 5, 1998
. Piedmont conducts business primarily through Piedmont Operating Partnership, L.P. (“Piedmont OP”), a Delaware limited partnership, as well as performing the management of its buildings through
two
wholly-owned subsidiaries, Piedmont Government Services, LLC and Piedmont Office Management, LLC. Piedmont is the sole general partner of Piedmont OP and possesses full legal control and authority over the operations of Piedmont OP. Piedmont OP owns properties directly, through wholly-owned subsidiaries, and through both consolidated and unconsolidated joint ventures. References to Piedmont herein shall include Piedmont and all of its subsidiaries, including Piedmont OP and its subsidiaries and joint ventures.
As of
December 31, 2011
, Piedmont owned interests in
79
office properties, plus
five
buildings owned through unconsolidated joint ventures and
two
industrial buildings. Our
79
office properties are located in
18
metropolitan areas across the United States. These office properties comprise
20.9 million
square feet of primarily Class A commercial office space, and were
86.5%
leased as of
December 31, 2011
.
2. Summary of Significant Accounting Policies
Basis of Presentation and Principles of Consolidation
Piedmont’s consolidated financial statements are prepared in accordance with U.S. generally accepted accounting principles (“GAAP”) and include the accounts of Piedmont, Piedmont’s wholly-owned subsidiaries, any variable interest entity of which Piedmont or any of its wholly-owned subsidiaries is considered the primary beneficiary, or any entity in which Piedmont or any of its wholly-owned subsidiaries owns a controlling interest. In determining whether Piedmont or Piedmont OP has a controlling interest, the following factors, among others, are considered: equity ownership, voting rights, protective rights of investors, and participatory rights of investors.
Piedmont owns interests in
three
real properties through its ownership in a consolidated joint venture, Piedmont Washington Properties, Inc. Piedmont has evaluated this entity based on the criteria outlined above and concluded that it is not a variable interest entity (“VIE”) and that Piedmont has a controlling interest in Piedmont Washington Properties, Inc. Accordingly, Piedmont’s consolidated financial statements include the accounts of Piedmont Washington Properties, Inc.
In addition, Piedmont owns interests in
five
properties through its ownership in
three
unconsolidated joint venture partnerships. Management has evaluated these joint ventures and determined that these entities are not VIEs. Although Piedmont is the majority equity participant in certain of these joint ventures, Piedmont does not have a controlling voting interest in any of them; however, Piedmont does exercise significant influence. As a result, the accounts of these joint ventures are not consolidated; but rather accounted for using the equity method of accounting in Piedmont’s consolidated financial statements.
Please refer to Note 9 for a summary of Piedmont’s interests in and consolidation treatment of its various VIEs as of
December 31, 2011
.
All inter-company balances and transactions have been eliminated upon consolidation.
Further, Piedmont has formed special purpose entities to acquire and hold real estate. Each special purpose entity is a separate legal entity and consequently the assets of the special purpose entities are not available to all creditors of Piedmont. The assets owned by these special purpose entities are being reported on a consolidated basis with Piedmont’s assets for financial reporting purposes only.
Use of Estimates
The preparation of the accompanying consolidated financial statements in conformity with GAAP requires management to make estimates and assumptions that affect the amounts reported in the accompanying consolidated financial statements and notes. Actual results could differ from those estimates.
F-8
Real Estate Assets
Real estate assets are stated at cost, as adjusted for any impairment, less accumulated depreciation. Amounts capitalized to real estate assets consist of the cost of acquisition or construction, any tenant improvements or major improvements, and betterments that extend the useful life of the related asset. All repairs and maintenance are expensed as incurred. Additionally, Piedmont capitalizes interest while the development of a real estate asset is in progress; however, no such interest was capitalized during the
three
years ended
December 31, 2011
.
Piedmont’s real estate assets are depreciated or amortized using the straight-line method over the following useful lives:
|
Buildings
|
40 years
|
|
Building improvements
|
5-25 years
|
|
Land improvements
|
20-25 years
|
|
Tenant improvements
|
Shorter of economic life or lease term
|
|
Furniture, fixtures, and equipment
|
3-5 years
|
|
Intangible lease assets
|
Lease term
|
Piedmont continually monitors events and changes in circumstances that could indicate that the carrying amounts of the real estate and related intangible assets of both operating properties and properties under construction in which Piedmont has an ownership interest, either directly or through investments in joint ventures, may not be recoverable. When indicators of potential impairment are present for wholly-owned properties, management assesses whether the respective carrying values will be recovered from the undiscounted future operating cash flows expected from the use of the asset and its eventual disposition for assets held for use, or with the estimated fair values, less costs to sell, for assets held for sale. Piedmont considers assets to be held for sale at the point at which a sale contract is executed and earnest money has become non-refundable. In the event that the expected undiscounted future cash flows for assets held for use or the estimated fair value, less costs to sell, for assets held for sale do not exceed the respective asset carrying value, management adjusts such assets to the respective estimated fair values and recognizes an impairment loss. Estimated fair values are calculated based on the following information, depending upon availability, in order of preference: (i) recently quoted market prices, (ii) market prices for comparable properties, or (iii) the present value of undiscounted cash flows, including estimated salvage value. See Note 12 for further information related to the disclosure of the estimated fair value of certain real estate assets.
For properties owned as part of an investment in unconsolidated joint ventures, Piedmont assesses the fair value of its investment as compared to its carrying amount. If Piedmont determines that the carrying value is greater than the fair value at any measurement date, Piedmont must also determine if such a difference is temporary in nature. Value fluctuations which are “other than temporary” in nature are then recorded to adjust the carrying value to the fair value amount.
Allocation of Purchase Price of Acquired Assets
Upon the acquisition of real properties, Piedmont allocates the purchase price of properties to acquired tangible assets, consisting of land and building, and identified intangible assets and liabilities, consisting of the value of above-market and below-market leases and the value of in-place leases, based in each case on their estimated fair values.
The fair values of the tangible assets of an acquired property (which includes land and building) are determined by valuing the property as if it were vacant, and the “as-if-vacant” value is then allocated to land and building based on management’s determination of the relative fair value of these assets. Management determines the as-if-vacant fair value of a property using methods similar to those used by independent appraisers. Factors considered by management in performing these analyses include an estimate of carrying costs during the expected lease-up periods considering current market conditions and costs to execute similar leases, including leasing commissions and other related costs. In estimating carrying costs, management includes real estate taxes, insurance, and other operating expenses during the expected lease-up periods based on current market conditions.
The fair values of above-market and below-market in-place leases are recorded based on the present value (using an interest rate which reflects the risks associated with the leases acquired) of the difference between (i) the contractual amounts to be paid pursuant to the in-place leases and (ii) management’s estimate of market rates for the corresponding in-place leases, measured over a period equal to the remaining terms of the leases, taking into consideration the probability of renewals for any below-market leases. The capitalized above-market and below-market lease values are recorded as intangible lease assets or liabilities and amortized as an adjustment to rental revenues over the remaining terms of the respective leases.
F-9
The fair values of in-place leases include direct costs associated with obtaining a new tenant, opportunity costs associated with lost rentals that are avoided by acquiring an in-place lease, and tenant relationships. Direct costs associated with obtaining a new tenant include commissions, tenant improvements, and other direct costs and are estimated based on management’s consideration of current market costs to execute a similar lease. These direct lease origination costs are included in deferred lease costs in the accompanying consolidated balance sheets and are amortized to expense over the remaining terms of the respective leases. The value of opportunity costs is calculated using the contractual amounts to be paid pursuant to the in-place leases over a market absorption period for a similar lease. These lease intangibles are included in intangible lease assets in the accompanying consolidated balance sheets and are amortized to expense over the remaining terms of the respective leases.
Gross intangible assets and liabilities as of
December 31, 2011
and
2010
, respectively, are as follows (in thousands):
|
December 31, 2011
|
December 31, 2010
|
||||||
|
Intangible Lease Assets:
|
|||||||
|
Above-Market In-Place Lease Assets
|
$
|
33,707
|
|
$
|
49,233
|
|
|
|
Absorption Period Costs
|
$
|
164,960
|
|
$
|
170,537
|
|
|
|
Intangible Lease Origination Costs (included in Deferred Lease Costs)
|
$
|
146,375
|
|
$
|
164,782
|
|
|
|
Intangible Lease Liabilities (Below-Market In-Place Leases)
|
$
|
113,018
|
|
$
|
133,267
|
|
|
For the
years ended
December 31, 2011
,
2010
, and
2009
, respectively, Piedmont recognized amortization of intangible lease costs as follows (in thousands):
|
2011
|
2010
|
2009
|
|||||||||
|
Amortization expense related to Intangible Lease Origination Costs and Absorption Period Costs:
|
$
|
48,013
|
|
$
|
34,660
|
|
$
|
47,188
|
|
||
|
Amortization of Above-Market and Below-Market In-Place Lease intangibles as a net increase to rental revenues:
|
$
|
7,065
|
|
$
|
5,788
|
|
$
|
5,394
|
|
||
Net intangible assets and liabilities as of
December 31, 2011
will be amortized as follows (in thousands):
|
|
Intangible Lease Assets
|
|
Liabilities
|
||||||||||||
|
|
Above-Market
In-place
Lease Assets
|
Absorption
Period Costs
|
Intangible Lease
Origination Costs
(1)
|
Below-Market
In-place Lease
Liabilities
|
|||||||||||
|
For the year ending December 31:
|
|||||||||||||||
|
2012
|
$
|
2,554
|
|
$
|
19,781
|
|
$
|
12,746
|
|
$
|
8,210
|
|
|||
|
2013
|
1,772
|
|
8,853
|
|
9,985
|
|
6,201
|
|
|||||||
|
2014
|
1,581
|
|
7,401
|
|
8,499
|
|
5,290
|
|
|||||||
|
2015
|
1,479
|
|
7,087
|
|
7,901
|
|
4,776
|
|
|||||||
|
2016
|
1,418
|
|
6,687
|
|
7,476
|
|
4,723
|
|
|||||||
|
Thereafter
|
1,094
|
|
19,541
|
|
26,729
|
|
19,837
|
|
|||||||
|
$
|
9,898
|
|
$
|
69,350
|
|
$
|
73,336
|
|
$
|
49,037
|
|
||||
|
Weighted-Average Amortization Period
|
5 years
|
|
7 years
|
|
9 years
|
|
8 years
|
|
|||||||
|
(1)
|
Intangible lease origination costs are presented as a component of deferred lease costs on Piedmont’s accompanying consolidated balance sheets.
|
Investments in Unconsolidated Joint Ventures
Although Piedmont is the majority equity participant in certain unconsolidated joint ventures, Piedmont does not have a controlling voting interest in any of the unconsolidated joint ventures. Piedmont does, however, exercise significant influence over those joint ventures. Accordingly, Piedmont’s investments in unconsolidated joint ventures are recorded using the equity method of accounting, whereby original investments are recorded at cost and subsequently adjusted for contributions, distributions, and net income/(loss) attributable to such joint ventures. Pursuant to the terms of the unconsolidated joint venture agreements, all income and distributions are allocated to the joint venture partners in accordance with their respective ownership interests. Distributions of net cash from operations are generally distributed to the joint venture partners on a quarterly basis, and are classified as cash inflows from
F-10
operating activities, as they are presumed to be returns on Piedmont’s investment in the respective joint venture. Proceeds received as the result of a sale of an asset from an unconsolidated joint venture are considered a return of Piedmont’s investment in the joint venture and classified as cash inflows from investing activities.
Cash and Cash Equivalents
Piedmont considers all highly-liquid investments purchased with an original maturity of
three
months or less to be cash equivalents. Cash equivalents include cash and short-term investments. Short-term investments are stated at cost, which approximates fair value, and consist of investments in money market accounts.
Tenant Receivables, net
Tenant receivables are comprised of rental and reimbursement billings due from tenants and the cumulative amount of future adjustments necessary to present rental income on a straight-line basis. Tenant receivables are recorded at the original amount earned, less an allowance for any doubtful accounts, which approximates fair value. Management assesses the collectibility of tenant receivables on an ongoing basis and provides for allowances as such balances, or portions thereof, become uncollectible. Piedmont adjusted the allowance for doubtful accounts by recording (recoveries of)/provisions for bad debts of approximately
$(0.4) million
,
$0.8 million
, and
($0.2) million
for the years ended
December 31, 2011
,
2010
, and
2009
, respectively, which are included in general and administrative expenses in the accompanying consolidated statements of income.
Notes Receivable
Notes receivable is solely comprised of Piedmont’s investments in mezzanine debt, which are recorded at face amount, less unamortized discount as of the date of the accompanying consolidated balance sheets. See Note 6 below for further discussion of Piedmont’s investments in mezzanine debt.
Due from Unconsolidated Joint Ventures
Due from unconsolidated joint ventures represents operating distributions due to Piedmont from its investments in unconsolidated joint ventures which have been declared but not received as of period end.
Restricted Cash and Escrows
Restricted cash and escrows are primarily comprised of the following items:
|
•
|
escrow accounts held by lenders to pay future real estate taxes, insurance, debt service, and tenant improvements;
|
|
•
|
earnest money paid in connection with future acquisitions; and
|
|
•
|
security and utility deposits paid by tenants per the terms of their respective leases.
|
Restricted cash and escrows are generally reclassified to other asset or liability accounts upon being used to purchase assets, satisfy obligations, or settle tenant obligations.
Prepaid Expenses and Other Assets
Prepaid expenses and other assets are primarily comprised of the following items:
|
•
|
prepaid property taxes, insurance and operating costs; and
|
|
•
|
equipment, furniture and fixtures, and tenant improvements for Piedmont’s corporate office space, net of accumulated depreciation.
|
Prepaid expenses and other assets will be expensed as utilized or reclassified to other asset or equity accounts upon being put into service in future periods. Balances without a future economic benefit are expensed as they are identified.
Goodwill
Goodwill is the excess of cost of an acquired entity over the amounts specifically assigned to assets acquired and liabilities assumed in purchase accounting for business combinations. Piedmont tests the carrying value of its goodwill for impairment on an annual basis, or on an interim basis if an event occurs or circumstances change that would indicate the carrying amount may be impaired. Such interim circumstances may include, but are not limited to, significant adverse changes in legal factors or in the general business climate, adverse action or assessment by a regulator, unanticipated competition, the loss of key personnel, or persistent declines in an entity’s stock price below carrying value of the entity. The test prescribed by authoritative accounting guidance is
F-11
a two-step test. The first step involves comparing the estimated fair value of the entity to its carrying value, including goodwill. Fair value is determined by adjusting the trading price of the stock for various factors including, but not limited to: (i) liquidity or transferability considerations, (ii) control premiums, and/or (iii) fully distributed premiums, if necessary, multiplied by the common shares outstanding. If such calculated fair value exceeds the carrying value, no further procedures or analysis is permitted or required. However, if the carrying value exceeds the calculated fair value, goodwill is potentially impaired and step two of the analysis would be required. Step two of the test involves calculating the implied fair value of goodwill by deducting the fair value of all tangible and intangible net assets of the entity from the entity’s fair value calculated in step one of the test. If the implied value of the goodwill (the remainder left after deducting the fair values of the entity from its calculated overall fair value in step one of the test) is less than the carrying value of goodwill, an impairment loss would be recognized.
Deferred Financing Costs
Deferred financing costs are comprised of costs incurred in connection with securing financing from third-party lenders and are capitalized and amortized to interest expense on a straight-line basis over the terms of the related financing arrangements. Piedmont recognized amortization of deferred financing costs for the
years ended
December 31, 2011
,
2010
, and
2009
of approximately
$3.2 million
,
$2.6 million
, and
$2.8 million
, respectively, which is included in interest expense in the accompanying consolidated statements of income.
Deferred Lease Costs
Deferred lease costs are comprised of costs and incentives incurred to acquire operating leases, including intangible lease origination costs, and are capitalized and amortized on a straight-line basis over the terms of the related underlying leases. Amortization of deferred leasing costs is reflected in the accompanying consolidated statements of income as follows.
|
•
|
Piedmont amortized deferred lease costs of approximately
$30.0 million
,
$26.8 million
, and
$32.6 million
for the
years ended
December 31, 2011
,
2010
, and
2009
, respectively, of which approximately
$1.3 million
,
$0.7 million
, and
$0.7 million
are related to the amortization of deferred common area maintenance costs which are recorded as property operating costs in the accompanying consolidated statements of income. The remaining amortization of deferred lease costs are recorded as amortization expense.
|
|
•
|
Piedmont recognized additional amortization of lease incentives classified as deferred lease costs of
$3.7 million
,
$3.4 million
, and
$3.4 million
, which was recorded as an adjustment to rental income for the
years ended
December 31, 2011
,
2010
, and
2009
, respectively.
|
Upon receiving notification of a tenant’s intention to terminate a lease, unamortized deferred lease costs are adjusted to net realizable value through the consolidated statement of income.
Line of Credit and Notes Payable
Certain mortgage notes included in line of credit and notes payable in the accompanying consolidated balance sheets were assumed upon the acquisition of real properties. When debt is assumed, Piedmont adjusts the loan to fair value with a corresponding adjustment to building. The fair value adjustment is amortized to interest expense over the term of the loan using the effective interest method. Amortization of such fair value adjustments was approximately
$1.4 million
,
$0
, and
$0
for the
years ended
December 31, 2011
,
2010
, and
2009
, respectively.
Interest Rate Derivatives
Piedmont periodically enters into interest rate derivative agreements to hedge its exposure to changing interest rates on variable rate debt instruments. As required by GAAP, Piedmont records all derivatives on the balance sheet at fair value. Piedmont reassesses the effectiveness of its derivatives designated as cash flow hedges on a regular basis to determine if they continue to be highly effective and also to determine if the forecasted transactions remain highly probable. Currently, Piedmont does not use derivatives for trading or speculative purposes.
The changes in fair value of interest rate swap agreements designated as cash flow hedges are recorded in other comprehensive income (“OCI”), and the amounts in OCI will be reclassified to earnings when the hedged transactions occur. Changes in the fair values of derivatives designated as cash flow hedges that do not qualify for hedge accounting treatment, if any, would be recorded as gain/(loss) on interest rate swap in the consolidated statements of income. The fair value of the interest rate swap agreement is recorded as prepaid expenses and other assets or as interest rate swap liability in the accompanying consolidated balance sheets. Amounts received or paid under interest rate swap agreements are recorded as interest expense in the consolidated income statements as incurred. All of Piedmont's interest rate swap agreements as of
December 31, 2011
are designated as cash flow hedges.
F-12
For interest rate cap agreements designated as cash flow hedges, Piedmont reassesses the effectiveness of its interest rate caps on a regular basis to determine if they continue to be highly effective and also to determine if the forecasted transactions remain highly probable. The changes in fair value of interest rate caps designated as cash flow hedges are recorded in OCI, and the option purchase premium is amortized (reclassified from OCI to interest expense) over the life of the hedging relationship as the hedged forecasted transactions affect earnings. The reclassification is based on a schedule created at the inception of the hedge, which allocates the purchase price to the future periods the hedge is expected to benefit, based on fair value as of the inception of the hedging relationship. Due to the complexities of cash flow hedge accounting, Piedmont evaluates the cost-benefit relationship between the size of the related interest rate cap agreements and the exposure to potential fluctuations in the fair value of the interest rate caps in order to determine if effective hedge accounting will be pursued. In cases where the benefit does not outweigh the costs, Piedmont elects to use mark-to-market accounting, which adjusts the interest rate cap agreements to estimated fair value through earnings on a quarterly basis. As of
December 31, 2011
, Piedmont's interest rate cap agreements were immaterial and were recorded using mark-to-market accounting.
Shares-in-trust
To date, Piedmont has not issued any shares-in-trust; however, under Piedmont’s charter, it has authority to issue a total of
150,000,000
shares-in-trust, which would be issued only in the event that there is a purported transfer of, or other change in or affecting the ownership of, Piedmont’s capital stock that would result in a violation of the ownership limits that are included in Piedmont’s charter to protect its REIT status.
Preferred Stock
To date, Piedmont has not issued any shares of preferred stock; however, Piedmont is authorized to issue up to
100,000,000
shares of one or more classes or series of preferred stock. Piedmont’s board of directors may determine the relative rights, preferences, and privileges of any class or series of preferred stock that may be issued, and can be more beneficial than the rights, preferences, and privileges attributable to Piedmont’s common stock.
Common Stock
Under Piedmont’s charter, it has authority to issue a total of
750,000,000
shares of common stock with a par value of
$0.01
per share, with the remainder allocated to additional paid in capital. Each share of common stock is entitled to one vote and participates in distributions equally. During the year ended
December 31, 2011
, the board of directors of Piedmont authorized the repurchase and retirement of up to
$300 million
of Piedmont's common stock through
November 2013
. Piedmont may repurchase the shares from time to time, in accordance with applicable securities laws, in the open market or in privately negotiated transactions. Repurchases will depend upon market conditions and other factors, and repurchases may be commenced or suspended from time to time in Piedmont's discretion, without prior notice. During the fourth quarter
2011
, Piedmont repurchased
199,400
shares pursuant to this share repurchase authorization.
Dividends
As a REIT, Piedmont is required by the Internal Revenue Code of 1986, as amended (the “Code”), to make distributions to stockholders each taxable year equal to at least
90%
of its taxable income, computed without regard to the dividends-paid deduction and by excluding net capital gains attributable to stockholders (“REIT taxable income”). Piedmont sponsors a dividend reinvestment plan ("DRP") pursuant to which common stockholders may elect (if their brokerage agreements allow) to reinvest an amount equal to the dividends declared on their common shares into additional shares of Piedmont’s common stock in lieu of receiving cash dividends. Under the DRP, Piedmont has the option to either issue shares purchased in the open market or issue shares directly from Piedmont's authorized but unissued shares, in both cases at a
2%
discount for the stockholder. Such election takes place at the settlement of each quarterly dividend in which there are participants in the DRP, and may change from quarter to quarter based on management's judgment of the best use of proceeds for Piedmont.
Noncontrolling Interest
Noncontrolling interest represents the equity interests of consolidated entities that are not owned by Piedmont. Noncontrolling interest is adjusted for contributions, distributions, and earnings (loss) attributable to the noncontrolling interest partners of the consolidated joint ventures. All earnings and distributions are allocated to the partners of the consolidated joint ventures in accordance with their respective partnership agreements. Earnings allocated to such noncontrolling interest partners are recorded as income attributable to noncontrolling interest in the accompanying consolidated statements of income.
Revenue Recognition
All leases of real estate assets held by Piedmont are classified as operating leases, and the related base rental income is generally
F-13
recognized on a straight-line basis over the terms of the respective leases. Tenant reimbursements are recognized as revenue in the period that the related operating cost is incurred. Rents and tenant reimbursements collected in advance are recorded as deferred income in the accompanying consolidated balance sheets. Other rental income, consisting primarily of lease termination fees, is recognized once Piedmont has satisfied all obligations under the related lease or lease termination agreement.
Gains on the sale of real estate assets are recognized upon completing the sale and, among other things, determining the sale price and transferring all of the risks and rewards of ownership without significant continuing involvement with the purchaser. Recognition of all or a portion of the gain would be deferred until both of these conditions are met. Losses are recognized as of the sale date.
Stock-based Compensation
Piedmont has issued restricted stock to employees and directors, as well as stock options outstanding which were granted to independent directors in prior years. The non-cash expense recognized by Piedmont related to stock-based compensation for employees is recorded as property operating costs for those employees whose job is related to property operation and as general and administrative expense for all other employees and directors in the accompanying consolidated statements of income.
Legal Fees
Piedmont recognizes legal expenses in the period in which services are rendered. Insurance reimbursements related to ongoing legal matters are recorded as a reduction of legal expense in the period that the insurance company definitively notifies Piedmont of its intent to issue payment.
Net Income Available to Common Stockholders Per Share
Net income available to common stockholders per share is calculated based on the weighted-average number of common shares outstanding during each period. Outstanding stock options have been excluded from the diluted earnings per share calculation, as their impact would be anti-dilutive. However, the incremental weighted-average shares from restricted stock awards are included in the diluted earnings per share calculation.
Income Taxes
Piedmont has elected to be taxed as a REIT under the Code, and has operated as such, beginning with its taxable year ended December 31, 1998. To qualify as a REIT, Piedmont must meet certain organizational and operational requirements, including a requirement to distribute at least
90%
of its annual REIT taxable income. As a REIT, Piedmont is generally not subject to federal income taxes. Accordingly, neither a provision nor a benefit for federal income taxes has been made in the accompanying consolidated financial statements. Piedmont is subject to certain state and local taxes related to the operations of properties in certain locations, which have been provided for in the financial statements. Additionally, Piedmont conducts certain operations through its taxable REIT subsidiary (“TRS”), Piedmont Office Holdings, Inc. These operations resulted in estimated tax payments of approximately
$6,000
for the
year ended
December 31, 2011
, which is recorded in the accompanying financial statements as general and administrative costs.
Reclassifications
Certain prior period amounts have been reclassified to conform to the current period financial statement presentation. The reclassifications relate to (i) the required presentation of income from discontinued operations for the 111 Sylvan Avenue building in Englewood Cliffs, New Jersey (sold in December 2010), the Eastpointe Corporate Center in Issaquah, Washington (sold in July 2011), the 5000 Corporate Court building in Holtsville, New York (sold in August 2011), and the 35 West Wacker Drive building in Chicago, Illinois (sold in December 2011), (ii) the disclosure of Restricted cash and escrows, which was formerly a component of Prepaid expenses and other assets, and (iii) the reclassification of Class A and Class B common shares as common stock (see Note 3 for further detail). All such reclassifications do not affect net income attributable to Piedmont as presented in previous years.
Recent Accounting Pronouncements
In May 2011, the Financial Accounting Standards Board ("FASB") issued an update related to Accounting Standards Codification Topic Fair Value Measurements and Disclosures (“ASC 820”) which converges GAAP and International Financial Reporting Standards ("IFRS") definition of “fair value”, the requirements for measuring amounts at fair value, and disclosures about these measurements. The update does not require additional fair value measurements and is not intended to establish valuation standards or affect valuation practices outside of financial reporting. The adoption of this update to ASC 820 is effective for Piedmont beginning with its first quarter 2012 interim financial statements and is not expected to have a material impact on Piedmont's
F-14
consolidated financial statements or disclosures.
In June 2011, the FASB issued a new requirement related to the presentation of Comprehensive Income ("ASC 220") intended to converge how OCI is presented under GAAP and IFRS. ASC 220 gives an entity the option to present OCI information in either a single continuous statement of comprehensive income or in two separate but consecutive statements, but eliminates the presentation of OCI in the statement of stockholders' equity. The adoption of ASC 220 is effective for Piedmont beginning with its first quarter 2012 interim financial statements, except for the specific requirement to present items that are reclassified from other comprehensive income to net income alongside their respective components of net income and other comprehensive income, which has been deferred. As the requirement pertains to presentation and disclosure only, the pronouncement is not expected to have a material impact on Piedmont's consolidated financial statements.
In September 2011, the FASB issued an amendment to ASC 350 regarding the testing of goodwill for impairment. Under the amended guidance, companies have the option to first assess qualitative factors to determine whether the existence of events or circumstances leads to a determination that is more likely than not that the fair value of a reporting unit is less than its carrying amount. If, after assessing the totality of events or circumstances, a company concludes that the estimated fair value is greater than the carrying amount, then performing the two-step impairment test is unnecessary. Although early adoption of this amendment is permitted, the adoption of the amendment to ASC 350 will be effective for Piedmont beginning with the 2012 fiscal year and is not expected to have a material impact on Piedmont's consolidated financial statements or disclosures.
3. Recapitalization, Listing and Offering of Common Stock
In conjunction with its listing and concurrent offering in
February 2010
, Piedmont also recapitalized its common stock pursuant to a stockholder-approved amendment to its Charter (the "Recapitalization"). The Recapitalization was effected on a pro rata basis with respect to all of Piedmont's stockholders and had the effect of reducing the total number of outstanding shares of its common stock without affecting any stockholder’s proportionate ownership (except for any changes resulting from the payment of cash in lieu of fractional shares). In addition, the Recapitalization created four classes of stock which were each ultimately converted into shares which were listed on the New York Stock Exchange (the "NYSE") over the following twelve months, with the final shares listing in
January 2011
.
Effective
June 30, 2011
, the board of directors of Piedmont approved Articles Supplementary and Articles of Amendment to Piedmont's Third Articles of Amendment and Restatement. Together, the Articles Supplementary and Articles of Amendment (1) reclassified and designated all of our authorized but unissued shares of Class B common stock as Class A common stock and then (2) changed the designation of its Class A common stock to Common Stock. The Articles Supplementary and Articles of Amendment were each filed with the State Department of Assessments and Taxation of Maryland on
June 30, 2011
and were effective upon such filing. As a result, we now have
one
class of common stock. Share and per share information for all prior periods presented has been restated for the effects of the Recapitalization and subsequent reclassification and designation.
4. Acquisitions of Real Estate Assets
During the
year ended
December 31, 2011
, Piedmont acquired the following properties:
|
Property
|
Metropolitan
Statistical
Area
|
Date of
Acquisition
|
Number of
Buildings
|
Rentable
Square
Feet
|
Percentage
Occupied
as of
Acquisition
|
Purchase
Price
(in millions)
|
|||||||||||
|
1200 Enclave Parkway
|
Houston, TX
|
March 30, 2011
|
1
|
|
149,654
|
|
18
|
%
|
$
|
18.5
|
|
||||||
|
500 W. Monroe
|
Chicago, IL
|
March 31, 2011
|
1
|
|
962,361
|
|
67
|
%
|
$
|
227.5
|
|
(1)
|
|||||
|
The Dupree
|
Atlanta, GA
|
April 29, 2011
|
1
|
|
137,818
|
|
83
|
%
|
$
|
20.5
|
|
||||||
|
The Medici
|
Atlanta, GA
|
June 7, 2011
|
1
|
|
152,221
|
|
22
|
%
|
$
|
13.2
|
|
||||||
|
225 and 235 Presidential Way
|
Boston, MA
|
September 13, 2011
|
2
|
|
440,130
|
|
100
|
%
|
$
|
85.3
|
|
||||||
|
400 TownPark
|
Orlando, FL
|
November 10, 2011
|
1
|
|
175,674
|
|
19
|
%
|
$
|
23.9
|
|
||||||
(1)
Piedmont acquired the 500 W. Monroe building located in downtown Chicago, Illinois through a foreclosure sale related to certain notes receivable previously held by Piedmont (see Note 6 for a more complete description of this transaction). No additional purchase consideration
F-15
was required to acquire the 500 W. Monroe building interests.
5. Tenant Receivables
Tenant receivables as of
December 31, 2011
and
2010
, respectively, are as follows (in thousands):
|
2011
|
2010
|
||||||
|
Tenant receivables, net of allowance for doubtful accounts of $631 and $1,298 as of December 31, 2011 and 2010, respectively
|
$
|
24,722
|
|
$
|
28,849
|
|
|
|
Cumulative rental revenue recognized on a straight-line basis in excess of cash received in accordance with lease terms
|
104,801
|
|
105,157
|
|
|||
|
Tenant receivables
|
$
|
129,523
|
|
$
|
134,006
|
|
|
6. Notes Receivable
Notes receivable as of
December 31, 2010
consisted solely of Piedmont’s
two
investments in mezzanine debt, both of which were secured by pledges of equity interests in the ownership of the 500 W. Monroe building.
During the year ended
December 31, 2010
,
one
of the
two
notes matured but was not repaid and was therefore declared to be in
maturity default. Piedmont initiated foreclosure proceedings and on
March 31, 2011
, Piedmont was the successful bidder at a UCC foreclosure sale allowing Piedmont to obtain control of the property, resulting in the extinguishment of other third-party loans that were subordinate to the secured position upon which Piedmont foreclosed.
As a result of obtaining control of the property, Piedmont became the primary beneficiary of the VIE containing the 500 W. Monroe building, subject to a
$140.0 million
first mortgage loan secured by the building and a
$45.0 million
mezzanine loan collateralized by an equity ownership interest in the borrower under the mezzanine loan, (together, the "500 W. Monroe Loans") (both of which Piedmont subsequently repaid- see Note 8.) As such, Piedmont recorded the fair value of all of the assets and liabilities associated with the 500 W. Monroe building, the remaining then-outstanding debt payable to third party lenders, and the interest rate cap agreements associated with the assumed debt in its consolidated financial statements in March 2011. The net result of recording the estimated fair value of the net assets upon consolidation of the VIE resulted in an approximate
$1.5 million
non-cash gain which is reflected in Piedmont’s results of operations for the
year ended
December 31, 2011
. Additionally, Piedmont recognized approximately
$2.7 million
in other income during the
year ended
December 31, 2011
related to cash representing the building’s operating cash flow during the period between the original default date in August 2010, and the consummation of the foreclosure process on
March 31, 2011
. Such income had been deferred due to the ownership uncertainties associated with legal actions related to the foreclosure proceedings.
7. Unconsolidated Joint Ventures
Investments in Unconsolidated Joint Ventures
As of
December 31, 2011
and
2010
, Piedmont owned interests in the following unconsolidated joint ventures (in thousands):
|
Name of Joint Venture
|
Properties Held by Joint Venture
|
Piedmont’s
Approximate
Ownership
Percentage
|
Net Book Value
|
||||||||||
|
|
|
|
2011
|
2010
|
|||||||||
|
Fund XIII and REIT Joint Venture
|
8560 Upland Drive Two Park Center
|
72
|
%
|
$
|
19,180
|
|
$
|
19,543
|
|
||||
|
Fund XII REIT and Joint Venture
|
4685 Investment Drive 5301 Maryland Way
|
55
|
%
|
16,329
|
|
16,688
|
|
||||||
|
Fund XI, XII and REIT Joint Venture
|
20/20
|
57
|
%
|
2,672
|
|
2,871
|
|
||||||
|
Wells/Fremont Associates
|
Property sold during 2011
|
78
|
%
|
—
|
|
2,667
|
|
||||||
|
Fund IX, X, XI, and REIT Joint Venture
|
Property sold during 2011
|
4
|
%
|
—
|
|
249
|
|
||||||
|
$
|
38,181
|
|
$
|
42,018
|
|
||||||||
F-16
Sale of Property Owned in Unconsolidated Joint Venture
During the year ended
December 31, 2011
, Wells/Fremont Associates sold the 47300 Kato Road building located in Fremont, California for a gross sales price of
$3.8 million
. Piedmont owned approximately
78%
of the joint venture, and recorded its proportionate share of the net sales proceeds and gain on sale of approximately
$2.7 million
and
$71,000
, respectively.
Also during the current period, Fund IX, X, XI and REIT Joint Venture sold the 360 Interlocken building located in Broomfield, Colorado for a gross sales price of
$9.2 million
. Piedmont owned approximately
4%
of the joint venture, and recorded its proportionate share of the net sales proceeds and gain on sale of approximately
$0.3 million
and
$45,000
, respectively.
8. Line of Credit and Notes Payable
During the
year ended
December 31, 2011
, Piedmont assumed and subsequently exercised its extension options to extend the maturity dates of the
$140 Million
500 W. Monroe Mortgage Loan and the
$45 Million
500 W. Monroe Mezzanine 1-A Loan Participation to August 9, 2012. On
November 17, 2011
, Piedmont paid
$43.9 million
to the respective lenders in full satisfaction of the
$45 Million
500 W. Monroe Mezzanine I Loan- A Participation. Piedmont did not incur a defeasance or yield maintenance penalty and recognized a gain on the early extinguishment of debt of approximately
$1.0 million
, which was net of the recognition of the remaining unamortized deferred financing costs associated with the loan of approximately
$0.1 million
. Further, on
January 9, 2012
, Piedmont repaid
$140 million
in full satisfaction of the
$140 Million
500 W. Monroe Mortgage Loan.
Effective
May 18, 2011
, Piedmont exercised its extension option on the maturity date of the
$500 Million
Unsecured Facility for one year to
August 30, 2012
upon payment of a
15
basis point extension fee. Further, on
June 28, 2011
, Piedmont repaid the
$250 Million
Unsecured Term Loan using proceeds from its
$500 Million
Unsecured Facility.
On
November 22, 2011
, Piedmont entered into an
$300 million
unsecured term loan facility (the "
$300 Million
Unsecured Term Loan") with a consortium of lenders with a term of five years, maturing on
November 22, 2016
. Additionally, Piedmont may request up to four times during the term of the agreement to establish one or more new term loan commitments up to an aggregate amount of
$200 million
, provided that no single request is less than
$25 million
. The maturity date of such additional requests, if exercised, would be coterminous with the original maturity date of the term loan agreement. The
$300 Million
Unsecured Term Loan has the option to bear interest at varying levels based on (i) the London Interbank Offered Rate (“LIBOR”) or Base Rate, defined as the greater of the prime rate, the federal funds rate plus
0.50%
, or LIBOR for a one-month period plus
1%
if a LIBOR loan has been selected, (ii) the credit rating levels issued for Piedmont, and (iii) for LIBOR loans, an interest period selected by Piedmont. The stated interest rate spread over LIBOR can vary from
1.1%
to
2.25%
based upon the then current credit rating of Piedmont, which is
1.45%
as of the closing of the facility.
In connection with obtaining the
$300 Million
Unsecured Term Loan, Piedmont entered into interest rate swap agreements with several counterparties for the full outstanding balance of the loan as of the closing date. The effective date of each interest rate swap agreement is
November 22, 2011
, and each agreement terminates on
November 22, 2016
. Piedmont will pay monthly interest at the stated rate mentioned above of LIBOR (or Base Rate) plus the applicable spread and will, in addition, pay funds to or receive funds from the counterparties depending on the level of interest rates. Therefore, after considering the terms of the swap agreements and Piedmont's current credit rating, Piedmont’s cash expenditure for interest will be effectively fixed, exclusive of changes to Piedmont's credit rating, at
2.69%
.
On
December 15, 2011
, Piedmont sold its interest in the office property known as the 35 West Wacker Drive building. The property is encumbered by a mortgage note, which was assumed by the purchaser as part of the transaction. See Note 17 for additional information.
F-17
The following table summarizes the terms of Piedmont’s indebtedness outstanding as of
December 31, 2011
and
2010
(in thousands):
|
Facility
|
Collateral
|
Rate
(1)
|
Maturity
|
Amount Outstanding
as of December 31,
|
|||||||||||
|
2011
|
2010
|
||||||||||||||
|
Secured (Fixed)
|
|||||||||||||||
|
$45.0 Million Fixed-Rate Loan
|
4250 N. Fairfax
|
5.20
|
%
|
6/1/2012
|
$
|
45,000
|
|
$
|
45,000
|
|
|||||
|
$120.0 Million 35 West Wacker Drive Mortgage Note
(2)
|
35 West Wacker Drive
|
5.10
|
%
|
1/1/2014
|
—
|
|
120,000
|
|
|||||||
|
$200.0 Million Mortgage Note
|
Aon Center
|
4.87
|
%
|
5/1/2014
|
200,000
|
|
200,000
|
|
|||||||
|
$25.0 Million Mortgage Note
|
Aon Center
|
5.70
|
%
|
5/1/2014
|
25,000
|
|
25,000
|
|
|||||||
|
$350.0 Million Secured Pooled Facility
|
Nine Property Collateralized Pool
(3)
|
4.84
|
%
|
6/7/2014
|
350,000
|
|
350,000
|
|
|||||||
|
$105.0 Million Fixed-Rate Loan
|
US Bancorp Center
|
5.29
|
%
|
5/11/2015
|
105,000
|
|
105,000
|
|
|||||||
|
$125.0 Million Fixed-Rate Loan
|
Four Property Collateralized Pool
(4)
|
5.50
|
%
|
4/1/2016
|
125,000
|
|
125,000
|
|
|||||||
|
$42.5 Million Fixed-Rate Loan
|
Las Colinas Corporate Center I & II
|
5.70
|
%
|
10/11/2016
|
42,525
|
|
42,525
|
|
|||||||
|
$140.0 Million WDC Mortgage Notes
|
1201 & 1225 Eye Street
|
5.76
|
%
|
11/1/2017
|
140,000
|
|
140,000
|
|
|||||||
|
$140.0 Million 500 W. Monroe Mortgage Loan
|
500 W. Monroe
|
LIBOR + 1.008%
|
|
(5)
|
8/9/2012
|
(6)
|
140,000
|
|
—
|
|
|||||
|
Subtotal/Weighted Average
(7)
|
4.70
|
%
|
1,172,525
|
|
1,152,525
|
|
|||||||||
|
Unsecured (Variable)
|
|||||||||||||||
|
$250 Million Unsecured Term Loan
|
LIBOR + 1.50%
|
|
6/28/2011
|
—
|
|
250,000
|
|
||||||||
|
$300 Million Unsecured Term Loan
|
LIBOR + 1.45%
|
|
(8)
|
11/22/2016
|
300,000
|
|
—
|
|
|||||||
|
$500 Million Unsecured Facility
(9)
|
—
|
%
|
8/30/2012
|
—
|
|
—
|
|
||||||||
|
Subtotal/Weighted Average
(7)
|
2.69
|
%
|
300,000
|
|
250,000
|
|
|||||||||
|
Total/ Weighted Average
(7)
|
4.29
|
%
|
$
|
1,472,525
|
|
$
|
1,402,525
|
|
|||||||
|
(1)
|
All of Piedmont’s outstanding debt as of
December 31, 2011
and
2010
is interest-only debt.
|
|
(2)
|
On
December 15, 2011
, Piedmont sold its ownership interest in the 35 West Wacker Drive building. As part of the transaction, the buyer assumed the mortgage note secured by the property.
|
|
(3)
|
Nine
property collateralized pool includes:1200 Crown Colony Drive, Braker Pointe III, 2 Gatehall Drive, the One and Two Independence Square, 2120 West End Avenue, 400 Bridgewater Crossing, 200 Bridgewater Crossing, and Fairway Center II.
|
|
(4)
|
Four
property collateralized pool includes 1430 Enclave Parkway, Windy Point I and II, and 1055 East Colorado Boulevard.
|
|
(5)
|
Subject to interest rate cap agreements, which limit Piedmont's exposure to potential increases in the LIBOR rate to
2.19%
.
|
|
(6)
|
Repaid in full on
January 9, 2012
.
|
|
(7)
|
Weighted average is based on contractual balance of outstanding debt and interest rates in the table as of
December 31, 2011
.
|
|
(8)
|
The
$300 Million
Unsecured Term Loan has a stated variable rate; however, Piedmont entered into interest rate swap agreements which effectively fix, exclusive of changes to Piedmont's credit rating, the rate on this facility to
2.69%
through
November 22, 2016
.
|
|
(9)
|
Piedmont may select from multiple interest rate options with each draw, including the prime rate and various length LIBOR locks. All LIBOR selections are subject to an additional spread (
0.475%
as of
December 31, 2011
) over the selected rate based on Piedmont’s current credit rating.
|
F-18
A summary of the aggregate maturities of Piedmont’s indebtedness as of
December 31, 2011
, is provided below (in thousands):
|
2012
|
$
|
185,000
|
|
(1)
|
|
2013
|
—
|
|
||
|
2014
|
575,000
|
|
||
|
2015
|
105,000
|
|
||
|
2016
|
467,525
|
|
||
|
Thereafter
|
140,000
|
|
||
|
Total
|
$
|
1,472,525
|
|
|
|
(1)
|
Includes the
$140 Million
500 W. Monroe Mortgage Loan, which Piedmont repaid on
January 9, 2012
.
|
Piedmont’s weighted-average interest rate as of
December 31, 2011
and
2010
, for aforementioned borrowings was approximately
4.29%
and
4.66%
, respectively. Piedmont made interest payments on all indebtedness, including interest rate swap cash settlements, of approximately
$66.7 million
,
$70.2 million
, and
$75.0 million
during the years ended
December 31, 2011
,
2010
, and
2009
, respectively.
9. Variable Interest Entities
Variable interest holders who have the power to direct the activities of the VIE that most significantly impact the entity’s economic performance and have the obligation to absorb the majority of losses of the entity or the right to receive significant benefits of the entity are considered to be the primary beneficiary and must consolidate the VIE.
A summary of Piedmont’s interests in and consolidation treatment of its VIEs as of
December 31, 2011
is as follows, (net carrying amount in millions):
F-19
|
Entity
|
Piedmont’s
%
Ownership
of Entity
|
Related
Building
|
Consolidated/
Unconsolidated
|
Net Carrying Amount as of
December 31,
2011
|
Net Carrying Amount as of
December 31,
2010
|
Primary Beneficiary
Considerations
|
||||||||||
|
1201 Eye Street NW Associates, LLC
|
49.5
|
%
|
1201 Eye
Street
|
Consolidated
|
$
|
(1.6
|
)
|
$
|
0.3
|
|
In accordance with the partnership’s governing documents, Piedmont is entitled to 100% of the cash flow of the entity and has sole discretion in directing the management and leasing activities of the building.
|
|||||
|
1225 Eye Street NW Associates, LLC
|
49.5
|
%
|
1225 Eye
Street
|
Consolidated
|
$
|
0.6
|
|
$
|
1.9
|
|
In accordance with the partnership’s governing documents, Piedmont is entitled to 100% of the cash flow of the entity and has sole discretion in directing the management and leasing activities of the building.
|
|||||
|
Wells REIT Multi-State Owner, LLC
|
100
|
%
|
1200 Crown Colony Drive
|
Consolidated
|
$
|
28.0
|
|
$
|
21.8
|
|
In accordance with a tenant's lease, if Piedmont sells the property on or before March 2013, then the tenant would be entitled to an equity participation fee.
|
|||||
|
Piedmont 500 W. Monroe Fee, LLC
|
100
|
%
|
500 W. Monroe
|
Consolidated
|
$
|
76.9
|
|
$
|
—
|
|
The Omnibus Agreement with the previous owner includes equity participation rights for the previous owner, if certain financial returns are achieved; however, Piedmont has sole decision making authority and is entitled to the economic benefits of the property until such returns are met.
|
|||||
|
Suwanee Gateway One, LLC
|
100
|
%
|
Suwanee
Gateway
One
|
Consolidated
|
$
|
7.7
|
|
$
|
7.8
|
|
The fee agreement includes equity participation rights for the incentive manager, if certain returns on investment are achieved; however, Piedmont has sole decision making authority and is entitled to the economic benefits of the property until such returns are met.
|
|||||
|
Medici Atlanta, LLC
|
100
|
%
|
The Medici
|
Consolidated
|
$
|
13.0
|
|
$
|
—
|
|
The fee agreement includes equity participation rights for the incentive manager, if certain returns on investment are achieved; however, Piedmont has sole decision making authority and is entitled to the economic benefits of the property until such returns are met.
|
|||||
|
400 TownPark, LLC
|
100
|
%
|
400 TownPark
|
Consolidated
|
$
|
23.7
|
|
$
|
—
|
|
The fee agreement includes equity participation rights for the incentive manager, if certain returns on investment are achieved; however, Piedmont has sole decision making authority and is entitled to the economic benefits of the property until such returns are met.
|
|||||
10. Derivative Instruments
Risk Management Objective of Using Derivatives
In addition to operational risks which arise in the normal course of business, Piedmont is exposed to economic risks such as interest rate, liquidity, and credit risk. In certain situations, Piedmont has entered into derivative financial instruments such as interest rate swap and interest rate cap agreements to manage interest rate risk exposure arising from variable rate debt transactions that result in the receipt or payment of future known and uncertain cash amounts, the value of which are determined by interest rates. Piedmont’s objective in using interest rate derivatives is to add stability to interest expense and to manage its exposure to interest rate movements.
Cash Flow Hedges of Interest Rate Risk
Interest rate swaps designated as cash flow hedges involve the receipt of variable-rate amounts from a counterparty in exchange for Piedmont making fixed-rate payments over the life of the agreements without exchange of the underlying notional amount.
During the
year ended
December 31, 2011
, Piedmont used interest rate swap agreements to hedge the variable cash flows associated with its
$250 Million
Unsecured Term Loan through its maturity, as well as
two
interest rate cap agreements associated with the 500 W. Monroe Loans through their original maturity (see Notes 6 and 8), both of these derivatives were designated as effective
F-20
cash flow hedges. On
July 27, 2011
, Piedmont entered into
two
new interest rate cap agreements effective on
August 15, 2011
associated with the extension of the 500 W. Monroe Loans and elected to account for the agreements under mark-to-market accounting, which adjusts the value of the agreements to estimated fair value on a quarterly basis through earnings. As such, Piedmont recognized approximately
$47,000
of expense related to mark-to-market accounting on the replacement interest rate caps during the
year ended
December 31, 2011
. On
November 21, 2011
, Piedmont entered into
four
new interest rate swap agreements to hedge the variable cash flows associated with its new
$300 Million
Unsecured Term Loan facility, and has designated the swaps as cash flow hedges of interest rate risk.
A detail of Piedmont’s interest rate derivatives outstanding as of
December 31, 2011
is as follows:
|
Interest Rate Derivatives:
|
Notional Amount
(in millions)
|
Effective Date
|
Maturity Date
|
|||||
|
Interest rate swap
|
$
|
125
|
|
11/22/2011
|
11/22/2016
|
|||
|
Interest rate swap
|
$
|
75
|
|
11/22/2011
|
11/22/2016
|
|||
|
Interest rate swap
|
$
|
50
|
|
11/22/2011
|
11/22/2016
|
|||
|
Interest rate swap
|
$
|
50
|
|
11/22/2011
|
11/22/2016
|
|||
|
Total
|
$
|
300
|
|
|||||
|
Interest rate cap
|
$
|
140
|
|
(2)
|
8/15/2011
|
8/15/2012
|
(1)
|
|
|
Interest rate cap
|
$
|
62
|
|
(3)
|
8/15/2011
|
8/15/2012
|
(1)
|
|
|
Total
|
$
|
202
|
|
|||||
|
(1)
|
Mirrors the monthly interest accrual period of the 500 W. Monroe Loans.
|
|
(2)
|
On
January 9, 2012
, Piedmont fully repaid the
$140 Million
500 W. Monroe Mortgage Loan.
|
|
(3)
|
Interest rate cap agreement is inclusive of both the
$45 Million
500 W. Monroe Mezzanine I Loan- A Participation payable to an unrelated third-party, as well as the loan participation formerly payable to Piedmont. On
November 17, 2011
, Piedmont fully repaid the
$45 Million
500 W. Monroe Mezzanine I Loan- A Participation.
|
All of Piedmont's interest rate derivative agreements outstanding through
August 9, 2011
, as well as the interest rate swap agreements entered into in conjunction with the
$300 Million
Unsecured Term Loan, were designated as cash flow hedges of interest rate risk. The effective portion of changes in the fair value of derivatives designated as, and that qualify as, cash flow hedges is recorded in OCI and is subsequently reclassified into earnings in the period that the hedged forecasted transaction affects earnings.
The effective portion of Piedmont’s derivative financial instruments (interest rate caps prior to
August 9, 2011
and all interest rate swaps outstanding during the respective periods) that was recorded in the accompanying consolidated statements of income for the
years ended
December 31, 2011
,
2010
, and
2009
, respectively, is as follows (in thousands):
|
Derivative in
Cash Flow Hedging
Relationships (Interest Rate Swaps and Caps)
|
December 31, 2011
|
December 31, 2010
|
December 31, 2009
|
||||||||
|
Amount of loss recognized in OCI on derivatives
|
$
|
3,064
|
|
$
|
1,529
|
|
$
|
2,812
|
|
||
|
Amount of previously recorded loss reclassified from accumulated OCI into interest expense
|
$
|
(1,218
|
)
|
$
|
(4,704
|
)
|
$
|
(7,903
|
)
|
||
No
gain or loss was recognized related to hedge ineffectiveness or to amounts excluded from effectiveness testing on Piedmont’s cash flow hedges during the
years ended
December 31, 2011
,
2010
, or
2009
.
Amounts reported in accumulated other comprehensive loss related to Piedmont’s derivatives are reclassified to interest expense as interest is incurred. Piedmont estimates that an additional
$2.1 million
will be reclassified from accumulated other comprehensive loss as an increase to interest expense over the next twelve months.
Please see the accompanying statements of stockholders’ equity for a rollforward of Piedmont’s Other Comprehensive Loss account. Additionally, see Note 11 for fair value disclosures of Piedmont's derivative instruments.
F-21
Credit-risk-related Contingent Features
Piedmont has agreements with its derivative counterparties that contain a provision whereby if Piedmont defaults on any of its indebtedness, including default where repayment of the indebtedness has not been accelerated by the lender, then Piedmont could also be declared in default on its derivative obligation. If Piedmont breached any of the contractual provisions of the derivative contracts, it would be required to settle its obligations under the agreements at their termination value of the fair values plus accrued interest, or approximately
$2.6 million
.
11. Fair Value Measurements
Piedmont considers its cash, accounts receivable, accounts payable, interest rate swap agreements, interest rate cap agreements, and line of credit and notes payable to meet the definition of financial instruments. The following table sets forth the carrying and estimated fair value for each of Piedmont’s financial instruments as of
December 31, 2011
and
2010
, respectively (in thousands):
|
|
As of December 31, 2011
|
|
As of December 31, 2010
|
|||||||||||||
|
Financial Instrument
|
Carrying Value
|
Estimated Fair Value
|
|
Carrying Value
|
Estimated Fair Value
|
|||||||||||
|
Cash and cash equivalents
(1)
|
$
|
139,690
|
|
$
|
139,690
|
|
|
$
|
56,718
|
|
$
|
56,718
|
|
|||
|
Tenant receivables, net
(1)
|
$
|
129,523
|
|
$
|
129,523
|
|
|
$
|
134,006
|
|
$
|
134,006
|
|
|||
|
Accounts payable
(1)
|
$
|
14,637
|
|
$
|
14,637
|
|
|
$
|
15,763
|
|
$
|
15,763
|
|
|||
|
Interest rate swap agreements
|
$
|
2,537
|
|
$
|
2,537
|
|
|
$
|
691
|
|
$
|
691
|
|
|||
|
Interest rate cap agreements
|
$
|
—
|
|
$
|
—
|
|
N/A
|
|
N/A
|
|
||||||
|
Line of credit and notes payable
|
$
|
1,472,525
|
|
$
|
1,529,811
|
|
|
$
|
1,402,525
|
|
$
|
1,428,255
|
|
|||
|
(1)
|
For the periods presented, the carrying value approximates estimated fair value.
|
Piedmont’s interest rate cap agreements discussed in Note 10 above were adjusted and carried at fair value as of
December 31, 2011
, and Piedmont's interest rate swap agreements, also discussed in Note 10 above, were adjusted and carried at fair value as of
December 31, 2011
and
2010
. The interest rate swap and interest rate cap agreements were classified as “Interest rate swap” liability and as a component of “Prepaid expenses and other assets”, respectively, in the accompanying consolidated balance sheets. The valuation of these derivative instruments, for both types of agreements, was determined using widely accepted valuation techniques including discounted cash flow analysis based on the contractual terms of the derivatives, including the period to maturity of each instrument, and uses observable market-based inputs, including interest rate curves and implied volatilities. Therefore, the fair values determined are considered to be based on significant other observable inputs (Level 2). In addition, as related to the interest rate swap agreements, Piedmont considered both its own and the respective counterparties’ risk of nonperformance in determining the fair value of its derivative financial instruments by estimating the current and potential future exposure under the derivative financial instruments that both Piedmont and the counterparties were at risk for as of the valuation date. This total expected exposure was then discounted using factors that contemplate the creditworthiness of Piedmont and the counterparties to arrive at a credit charge. This credit charge was then netted against the value of the derivative financial instruments determined using the discounted cash flow analysis described above to arrive at a total estimated fair value of the interest rate swap agreements. As of
December 31, 2011
and
2010
, the credit valuation adjustment did not comprise a material portion of the fair values of the derivative financial instruments; therefore, Piedmont believes that any unobservable inputs used to determine the fair values of its derivative financial instruments are not significant to the fair value measurements in their entirety, and does not consider either of its derivative financial instruments to be Level 3 liabilities.
12. Impairment of Certain Real Estate Assets
Piedmont recorded the following impairment charges as a component of income from continuing operations for the
years ended
December 31, 2011
,
2010
, and
2009
(in thousands):
F-22
|
2011
|
2010
|
2009
|
|||||||||
|
Impairment losses recorded in real estate operating expenses:
|
|||||||||||
|
Auburn Hills Corporate Center
|
$
|
—
|
|
|
$
|
—
|
|
$
|
10,173
|
|
|
|
1111 Durham Avenue
|
—
|
|
|
—
|
|
14,274
|
|
||||
|
1441 West Long Lake Road
|
—
|
|
|
—
|
|
10,616
|
|
||||
|
Impairment losses on real estate assets
|
$
|
—
|
|
$
|
—
|
|
(1)
|
$
|
35,063
|
|
|
|
(1)
|
During the year ended
December 31, 2010
, Piedmont recorded an impairment charge of approximately
$9.6 million
on the 111 Sylvan Avenue building as a component of discontinued operations. See Note 17 below for further detail.
|
Piedmont did not recognize an impairment loss on its held-for-use, wholly-owned buildings during the
years ended
December 31, 2011
or
2010
; however, during the
year ended
December 31, 2009
, Piedmont reduced its intended holding periods for the Auburn Hills Corporate Center building, purchased in
May 2003
and comprising approximately
119,000
square feet, and the 1441 West Long Lake Road building, purchased in
June 2000
and comprising approximately
107,000
square feet, both of which are located in the Detroit, Michigan market. During the same period, Piedmont reduced the intended holding period for the 1111 Durham Avenue building, purchased in
November 2000
and comprising approximately
237,000
square feet, located in South Plainfield New Jersey. The decision to reduce estimated future rental revenues and the holding periods for the two Detroit assets was prompted by the loss of prospective replacement tenants and overall market declines in the Detroit, Michigan market. Further, changes in management’s expectation of re-leasing prospects of the New Jersey asset, coupled with general market declines in the South Plainfield submarket, prompted the reduction of intended hold period and estimated future rental revenues during the third quarter 2009. The cumulative effect of these decisions triggered a reassessment of speculative leasing assumptions for these buildings, which entailed, among other things, evaluating market rents, leasing costs and the downtime necessary to complete necessary re-leasing activities. Based on a comparison of the projected undiscounted future cash flows with the net book value of the real estate and intangible assets, Piedmont determined that the carrying values of the assets were not recoverable and, accordingly, recorded an impairment loss on real estate assets in the amount of approximately
$35.1 million
to reduce the carrying value of the assets to their estimated fair value based upon the present value of future cash flows.
Fair Value Considerations for Property
In accordance with GAAP regarding fair value measurements, Piedmont valued the Auburn Hills Corporate Center building, the 1111 Durham Avenue building, and the 1441 West Long Lake Road building using the fair value processes and techniques prescribed by authoritative literature. The fair value measurements used in these evaluations of nonfinancial assets are considered to be Level 3 valuations within the fair value hierarchy as defined in GAAP, as there are significant unobservable inputs. Examples of inputs Piedmont utilizes in its fair value calculations are discount rates, market capitalization rates, speculative leasing rates and assumptions, timing of leases, rental concessions and leasing capital, and sales prices. The following amounts represent the detail of the adjustments recognized during the
year ended
December 31, 2009
using Level 3 inputs (in thousands):
|
Wholly-Owned Properties
|
Net Book
Value
|
Impairment
Recognized
|
Fair Value
|
||||||||
|
Auburn Hills Corporate Center
|
$
|
17,633
|
|
$
|
10,173
|
|
$
|
7,460
|
|
||
|
1111 Durham Avenue
|
27,984
|
|
14,274
|
|
13,710
|
|
|||||
|
1441 West Long Lake Road
|
17,141
|
|
10,616
|
|
6,525
|
|
|||||
|
$
|
62,758
|
|
$
|
35,063
|
|
$
|
27,695
|
|
|||
13. Commitments and Contingencies
Commitments Under Existing Lease Agreements
Certain lease agreements include provisions that, at the option of the tenant, may obligate Piedmont to provide funding for capital improvements. Under its existing lease agreements, Piedmont may be required to fund significant tenant improvements, leasing commissions, and building improvements. In addition, certain agreements contain provisions that require Piedmont to issue corporate or property guarantees to provide funding for capital improvements or other financial obligations. As of
December 31, 2011
, Piedmont anticipates funding approximately
$143.8 million
in potential unrecorded obligations for tenant improvements related to its existing lease portfolio over the respective lease terms, the majority of which Piedmont estimates may be required to be funded over the next several years. For most of Piedmont’s leases, the timing of the actual funding of these tenant improvements is largely dependent upon tenant requests for reimbursement. In some cases, these obligations may expire with the leases without further recourse to Piedmont.
F-23
Contingencies Related to Tenant Audits/Disputes
Certain lease agreements include provisions that grant tenants the right to engage independent auditors to audit their annual operating expense reconciliations. Such audits may result in the re-interpretation of language in the lease agreements which could result in the refund of previously recognized tenant reimbursement revenues, resulting in financial loss to Piedmont. Piedmont recorded additional expense related to such tenant audits/disputes of approximately
$0.7 million
,
$0.4 million
and
$1.4 million
during the years ended
December 31, 2011
,
2010
, and
2009
, respectively, as adjustments to earnings.
Letters of Credit
As of
December 31, 2011
, Piedmont was subject to the following letters of credit, which reduce the total outstanding capacity under its
$500 Million
Unsecured Facility:
|
Amount
|
Expiration of Letter of Credit
(1)
|
||
|
$14,782,820
|
February 2012
|
||
|
$9,033,164
|
June 2012
|
||
|
$382,556
|
August 2012
|
||
|
$1,231,573
|
December 2012
|
||
|
(1)
|
These letter of credit agreements contain an “evergreen” clause, which automatically renews for consecutive, one-year periods each anniversary, subject to certain limitations.
|
Operating Lease Obligations
Three
properties (the River Corporate Center building in Tempe, Arizona; the 8700 South Price Road building in Tempe, Arizona; and the 2001 NW 64
th
Street building in Ft. Lauderdale, Florida) are subject to ground leases with expiration dates ranging between
2048
and
2101
. The aggregate remaining payments required under the terms of these operating leases as of
December 31, 2011
are presented below (in thousands):
|
2012
|
$
|
750
|
|
||
|
2013
|
750
|
|
|||
|
2014
|
750
|
|
|||
|
2015
|
749
|
|
|||
|
2016
|
749
|
|
|||
|
Thereafter
|
74,870
|
|
|||
|
Total
|
$
|
78,618
|
|
||
Ground rent expense was approximately
$0.6 million
for the years ended
December 31, 2011
,
2010
, and
2009
, and is included in property operating costs in the accompanying consolidated statements of income. The net book value of the real estate assets of the related office buildings subject to operating ground leases is approximately
$26.0 million
and
$26.4 million
as of
December 31, 2011
and
2010
, respectively.
Assertion of Legal Action
Piedmont is currently party to
two
separate lawsuits, where one of the lead plaintiffs in each lawsuit is the same stockholder. The first suit was filed in March 2007, and, in general, alleges inadequate disclosures pursuant to the federal securities laws against Piedmont’s officers, directors, and advisors in connection with the transaction to internalize its management function and become a self-managed entity. The suit originally contained
thirteen
counts; however,
twelve
of those counts have subsequently been dismissed. The suit has been removed from the court's trial calendar pending resolution of a request for interlocutory appellate review of certain legal rulings made by the court. Piedmont believes that plaintiff's remaining allegation is without merit and intends to continue to vigorously defend this action; however, due to the uncertainties inherent in any litigation, Piedmont has determined that the risk of material loss associated with this lawsuit is reasonably possible. The plaintiff has claimed damages of approximately
$159 million
plus pre-judgment interest, which defendants dispute. There are a number of defendants in this case and the allocation of damages, if any, between Piedmont and any other defendants (including any indemnification rights or obligations of Piedmont with respect to the other defendants) is indeterminable at this time. Additionally, up to
$15 million
of such potential damages may be recoverable by Piedmont under its insurance policies. Therefore, Piedmont estimates the range of gross potential loss (without regard to allocations or insurance recoveries) associated with this claim to be
$0
to
$159 million
plus
F-24
pre-judgment interest.
The second lawsuit was filed in October 2007 and originally alleged
four
counts, including inadequate disclosures pursuant to the federal securities laws. To date, the court has dismissed
two
of the
four
counts in their entirety and has dismissed portions of the remaining
two
counts. On April 11, 2011, the Eleventh Circuit Court of Appeals invalidated the district court’s order certifying a class and remanded the case to the district court for further proceedings. Piedmont believes that plaintiffs' allegations are without merit, and intends to continue to vigorously defend this action. Due to the uncertainties inherent in any litigation process, Piedmont’s assessment of the merits of the case notwithstanding, the risk of material financial loss does exist; however, given that a class has not yet been established, Piedmont's current assessment of the risk of material financial loss associated with this case is that it is remote. Such assessment is subject to change in future periods as additional legal rulings are made by the court.
Please refer to Part I. Item 3 “Legal Proceedings” for a complete description of the chronology of the
two
lawsuits.
Other Legal Matters
Piedmont is from time to time a party to other legal proceedings, which arise in the ordinary course of its business. None of these ordinary course legal proceedings are reasonably likely to have a material adverse effect on results of operations or financial condition.
14. Stock Based Compensation
Deferred Stock Awards
Piedmont has granted deferred stock awards in the form of restricted stock to its employees. The awards are determined by the Compensation Committee of the board of directors of Piedmont on an annual basis and typically vest over a
three
-year period beginning on the grant date. In addition, Piedmont has adopted a multi-year performance share program for certain of its employees beginning in
2010
. Restricted shares are earned based on the relative performance of Piedmont's total stockholder return as compared with a predetermined peer group's total stockholder return over a
three
-year period. Typically, shares are not awarded until the end of the third year in the performance period and vest immediately upon award; however, the inaugural performance share program, which covers the fiscal
2010
-
2013
performance period, contains three interim performance periods whereby shares may be awarded.
A rollforward of Piedmont's deferred stock award activity for the
year ended
December 31, 2011
is as follows:
|
Unvested Deferred Stock Awards as of January 1, 2011
|
Deferred Stock Awards Granted During Fiscal Year 2011
|
Deferred Stock Awards Vested During Fiscal Year 2011
|
Deferred Stock Awards Forfeited During Fiscal Year 2011
|
Unvested Deferred Stock Awards as of December 31, 2011
|
|||||||||||||||
|
Shares
|
526,030
|
|
230,592
|
|
(241,612
|
)
|
(3,807
|
)
|
511,203
|
|
|||||||||
|
Weighted-Average Grant Date Fair Value
|
$
|
20.20
|
|
$
|
19.40
|
|
$
|
20.80
|
|
$
|
19.38
|
|
$
|
19.56
|
|
||||
F-25
A detail of Piedmont’s outstanding employee deferred stock awards as of
December 31, 2011
is as follows:
|
Date of grant
|
Type of Award
|
Net Shares
Granted
(1)
|
Grant
Date Fair
Value
|
|
Vesting Schedule
|
Unvested Shares as of
December 31, 2011
|
|||||||||
|
May 6, 2009
|
Annual Deferred Stock Award
|
135,564
|
|
$
|
22.20
|
|
Of the shares granted, 25% vested on the date of grant, and 25% vested or will vest on May 6, 2010, 2011, and 2012, respectively.
|
44,184
|
|
||||||
|
May 11, 2010
|
Fiscal Year 2010-2012 Performance Share Program
|
27,502
|
|
(2)
|
$
|
28.44
|
|
Shares vest immediately upon award.
|
135,130
|
|
(3)
|
||||
|
May 24, 2010
|
Annual Deferred Stock Award
|
180,340
|
|
$
|
18.71
|
|
Of the shares granted, 25% vested on the date of grant, and 25% vested or will vest on May 24, 2011, 2012, and 2013, respectively.
|
106,965
|
|
||||||
|
May 24, 2010
|
One-Time, Special Deferred Stock Award in Recognition of Piedmont's Initial Public Offering
|
46,440
|
|
$
|
18.71
|
|
Of the shares granted, 33.33% vested or will vest on May 24, 2011, 2012, and 2013, respectively.
|
34,912
|
|
||||||
|
April 5, 2011
|
Annual Deferred Stock Award
|
142,468
|
|
$
|
19.40
|
|
Of the shares granted, 25% vested on the date of grant, and 25% will vest on April 5, 2012, 2013, and 2014, respectively.
|
114,780
|
|
||||||
|
April 5, 2011
|
Fiscal Year 2011-2013 Performance Share Program
|
—
|
|
$
|
18.27
|
|
Shares vest immediately upon award.
|
75,232
|
|
(3)
|
|||||
|
Total
|
511,203
|
|
|||||||||||||
|
(1)
|
Amounts reflect the total grant, net of shares surrendered upon vesting to satisfy required minimum tax withholding obligations through
December 31, 2011
.
|
|
(2)
|
Represents shares granted at the end of the first interim performance period ended
December 31, 2010
.
|
|
(3)
|
Estimated based on Piedmont's cumulative total stockholder return for the respective performance period relative to a predetermined peer group's cumulative total stockholder return for the respective performance period through
December 31, 2011
. Such estimates are subject to change in future periods based on both Piedmont's and its peers' stock performance and dividends paid.
|
During the years ended
December 31, 2011
,
2010
, and
2009
, Piedmont recognized approximately
$6.5 million
,
$5.1 million
and
$3.6 million
of compensation expense and directors' fees related to stock awards, respectively, of which
$5.3 million
,
$3.7 million
and
$2.3 million
, respectively, related to the non-vested shares. During the year ended
December 31, 2011
,
170,659
shares were issued to employees, directors and officers. As of
December 31, 2011
, approximately
$4.0 million
of unrecognized compensation cost related to non-vested, share-based compensation remained, which Piedmont will record in its statements of income over a weighted-average vesting period of approximately
one
year.
15. Earnings Per Share
There are no adjustments to “Net income attributable to Piedmont” or “Income from continuing operations” for the diluted earnings per share computations.
Net income per share-basic is calculated as net income available to common stockholders divided by the weighted average number of common shares outstanding during the period. Net income per share-diluted is calculated as net income available to common stockholders divided by the diluted weighted average number of common shares outstanding during the period, including nonvested restricted stock. Diluted weighted average number of common shares is calculated to reflect the potential dilution under the treasury stock method that would occur as if the remaining unvested restricted stock awards has vested and resulted in additional common shares outstanding. The following table reconciles the denominator for the basic and diluted earnings per share computations shown on the consolidated statements of operations for the
years ended
December 2011
,
2010
, and
2009
(in thousands):
F-26
|
December 31, 2011
|
December 31, 2010
|
December 31, 2009
|
||||||
|
Weighted-average common shares—basic
|
172,765
|
|
170,753
|
|
158,419
|
|
||
|
Plus incremental weighted-average shares from time-vested conversions:
|
||||||||
|
Restricted stock awards
|
216
|
|
214
|
|
162
|
|
||
|
Weighted-average common shares—diluted
|
172,981
|
|
170,967
|
|
158,581
|
|
||
16. Operating Leases
Piedmont’s real estate assets are leased to tenants under operating leases for which the terms vary, including certain provisions to extend the lease term, options for early terminations subject to specified penalties, and other terms and conditions as negotiated. Piedmont retains substantially all of the risks and benefits of ownership of the real estate assets leased to tenants. Amounts required as security deposits vary depending upon the terms of the respective leases and the creditworthiness of the tenant, however, generally they are not significant. Therefore, exposure to credit risk is limited to the extent that the receivables exceed this amount. Security deposits related to tenant leases are included in accounts payable and accrued expenses in the accompanying consolidated balance sheets.
Piedmont’s wholly-owned and consolidated joint venture properties, excluding industrial properties, are located in
18
metropolitan areas. Based on annualized lease revenue as of
December 31, 2011
, approximately
22.4%
,
21.6%
, and
15.7%
of these real estate assets are located in metropolitan Chicago, metropolitan Washington, D.C., and New York, respectively. Furthermore, approximately
13%
of Piedmont's annualized lease revenue is generated from federal governmental agencies.
The future minimum rental income from Piedmont’s investment in real estate assets under non-cancelable operating leases, excluding industrial properties and unconsolidated joint ventures, as of
December 31, 2011
, is presented below (in thousands):
|
Years ending December 31:
|
|||||
|
2012
|
$
|
385,071
|
|
||
|
2013
|
372,971
|
|
|||
|
2014
|
326,157
|
|
|||
|
2015
|
311,957
|
|
|||
|
2016
|
272,892
|
|
|||
|
Thereafter
|
1,262,099
|
|
|||
|
Total
|
$
|
2,931,147
|
|
||
17. Discontinued Operations
Piedmont has classified the results of operations related to the following properties as discontinued operations (in thousands):
|
Building Sold
|
Location
|
Date of Sale
|
Gain/(Loss) on Sale
|
Net Sales Proceeds
|
||||||||
|
111 Sylvan Avenue
|
Englewood Cliffs, New Jersey
|
December 8, 2010
|
$
|
(817
|
)
|
$
|
51,637
|
|
||||
|
Eastpointe Corporate Center
|
Issaquah, Washington
|
July 1, 2011
|
$
|
12,152
|
|
$
|
31,704
|
|
||||
|
5000 Corporate Court
|
Holtsville, New York
|
August 31, 2011
|
$
|
14,367
|
|
$
|
36,100
|
|
||||
|
35 West Wacker Drive
(1)
|
Chicago, Illinois
|
December 15, 2011
|
$
|
96,138
|
|
$
|
223,981
|
|
||||
|
(1)
|
Piedmont sold its approximate
96.5%
ownership in the property. Transaction data above is presented at Piedmont's ownership percentage.
|
Impairment Recognized on Sold Property
In
2010
, Piedmont sold its office property known as the 111 Sylvan Avenue building, and accordingly the operational results of the property, including a
$9.6 million
impairment charge that resulted from adjusting the assets to fair value, are presented as discontinued operations in the accompanying
2010
statement of operations. The fair value measurement used in the evaluation of
F-27
this non-financial asset was considered to be a Level 1 valuation within the fair value hierarchy as defined by GAAP, as there were direct observations and transactions involving the asset (i.e. the asset was sold to a third-party purchaser).
Income from Discontinued Operations
The details comprising income from discontinued operations are presented below (in thousands):
|
|
Years Ended December 31,
|
||||||||||
|
|
2011
|
2010
|
2009
|
||||||||
|
Revenues:
|
|||||||||||
|
Rental income
|
$
|
30,839
|
|
$
|
40,159
|
|
$
|
39,909
|
|
||
|
Tenant reimbursements
|
18,566
|
|
20,348
|
|
22,323
|
|
|||||
|
Lease termination income
|
—
|
|
1,136
|
|
—
|
|
|||||
|
49,405
|
|
61,643
|
|
62,232
|
|
||||||
|
Expenses:
|
|||||||||||
|
Property operating costs
|
20,064
|
|
21,798
|
|
24,280
|
|
|||||
|
Depreciation
|
4,912
|
|
7,215
|
|
8,606
|
|
|||||
|
Amortization of deferred leasing costs
|
5,099
|
|
6,910
|
|
10,941
|
|
|||||
|
General and administrative expenses
|
67
|
|
249
|
|
127
|
|
|||||
|
30,142
|
|
36,172
|
|
43,954
|
|
||||||
|
Other income (expense):
|
|||||||||||
|
Interest expense
|
(5,931
|
)
|
(6,274
|
)
|
(6,279
|
)
|
|||||
|
Interest and other income
|
1
|
|
3
|
|
43
|
|
|||||
|
Net income attributable to noncontrolling interest
|
(453
|
)
|
(516
|
)
|
(463
|
)
|
|||||
|
(6,383
|
)
|
(6,787
|
)
|
(6,699
|
)
|
||||||
|
Operating income, excluding impairment loss and gain/(loss) on sale of real estate assets
|
12,880
|
|
18,684
|
|
11,579
|
|
|||||
|
Impairment loss
|
—
|
|
(9,587
|
)
|
—
|
|
|||||
|
Gain/(loss) on sale of real estate assets
|
122,657
|
|
(817
|
)
|
—
|
|
|||||
|
Income from discontinued operations
|
$
|
135,537
|
|
$
|
8,280
|
|
$
|
11,579
|
|
||
18. Supplemental Disclosures of Noncash Activities
Significant noncash investing and financing activities for the
years ended
December 31, 2011
,
2010
, and
2009
(in thousands) are outlined below:
|
2011
|
2010
|
2009
|
|||||||||
|
Accrued capital expenditures and deferred lease costs
|
$
|
8,218
|
|
$
|
8,047
|
|
$
|
1,848
|
|
||
|
Change in accrued offering costs related to issuance of common stock
|
$
|
227
|
|
$
|
1,370
|
|
$
|
—
|
|
||
|
Net assets assumed upon consolidation of variable interest entity, net of notes receivable previously recorded
|
$
|
188,283
|
|
$
|
—
|
|
$
|
—
|
|
||
|
Liabilities assumed upon consolidation of variable interest entity
|
$
|
191,814
|
|
$
|
—
|
|
$
|
—
|
|
||
|
Discounts applied to issuance of common stock
|
$
|
—
|
|
$
|
—
|
|
$
|
(17,392
|
)
|
||
|
Discounts reduced as result of redemptions of common stock
|
$
|
—
|
|
$
|
—
|
|
$
|
20,684
|
|
||
|
Redeemable common stock
|
$
|
—
|
|
$
|
75,164
|
|
$
|
37,763
|
|
||
F-28
19. Income Taxes
Piedmont’s income tax basis net income for the
years ended
December 31, 2011
,
2010
, and
2009
, is calculated as follows (in thousands):
|
2011
|
2010
|
2009
|
||||||||||
|
GAAP basis financial statement net income
|
$
|
225,041
|
|
$
|
120,379
|
|
|
$
|
74,700
|
|
||
|
Increase (decrease) in net income resulting from:
|
||||||||||||
|
Depreciation and amortization expense for financial reporting purposes in excess of amounts for income tax purposes
|
47,346
|
|
29,892
|
|
|
43,172
|
|
|||||
|
Rental income accrued for income tax purposes less than amounts for financial reporting purposes
|
(9,380
|
)
|
(528
|
)
|
(624
|
)
|
||||||
|
Net amortization of above/below-market lease intangibles for financial reporting purposes in excess of amounts for income tax purposes
|
(6,605
|
)
|
(5,573
|
)
|
(5,134
|
)
|
||||||
|
Gain on disposal of property for financial reporting purposes in excess of amounts for income tax purposes
|
(66,410
|
)
|
(9,254
|
)
|
|
—
|
|
|||||
|
Taxable income of Piedmont Washington Properties, Inc., in excess of amount for financial reporting purposes
|
4,515
|
|
5,096
|
|
|
5,991
|
|
|||||
|
Other expenses for financial reporting purposes in excess of amounts for income tax purposes
|
(2,072
|
)
|
9,570
|
|
44,077
|
|
(1)
|
|||||
|
Income tax basis net income, prior to dividends paid deduction
|
$
|
192,435
|
|
$
|
149,582
|
|
|
$
|
162,182
|
|
||
|
(1)
|
Includes approximately
$35.1 million
of recorded impairment loss on real estate assets for the year ended
December 31, 2009
.
|
For income tax purposes, dividends to common stockholders are characterized as ordinary income, capital gains, or as a return of a stockholder’s invested capital. The composition of Piedmont’s distributions per common share is presented below:
|
2011
|
2010
|
2009
|
||||||
|
Ordinary income
|
61
|
%
|
69
|
%
|
81
|
%
|
||
|
Capital gains
|
27
|
%
|
—
|
|
—
|
|
||
|
Return of capital
|
12
|
%
|
31
|
%
|
19
|
%
|
||
|
100
|
%
|
100
|
%
|
100
|
%
|
|||
At
December 31, 2011
, the tax basis carrying value of Piedmont’s total assets was approximately
$4.3 billion
.
Accrued interest and penalties related to uncertain tax positions are included in accounts payable, accrued expenses, and accrued capital expenditures in the accompanying consolidated balance sheets and represented approximately
$6.7 million
as of
December 31, 2011
and
2010
. Piedmont recorded no additional expense during the years ended
December 31, 2011
,
2010
, and
2009
, respectively, related to such positions. The tax years
2008
to
2011
remain open to examination by various federal and state taxing authorities.
20. Quarterly Results (unaudited)
A summary of the unaudited quarterly financial information for the
years ended
December 31, 2011
and
2010
, is presented below (in thousands, except per-share data). The amounts presented may have been restated from previous period presentations due to reclassifications related to discontinued operations
(see Note 17 for fu
rther detail).
F-29
|
|
2011
|
||||||||||||||
|
|
First
|
Second
|
Third
|
Fourth
|
|||||||||||
|
Revenues
|
$
|
132,570
|
|
$
|
137,165
|
|
$
|
134,414
|
|
$
|
137,493
|
|
|||
|
Real estate operating income
|
$
|
41,267
|
|
$
|
36,436
|
|
$
|
37,397
|
|
$
|
33,272
|
|
|||
|
Discontinued operations
|
$
|
2,755
|
|
$
|
2,645
|
|
$
|
29,475
|
|
$
|
100,662
|
|
|||
|
Net income attributable to Piedmont
|
$
|
33,967
|
|
$
|
21,027
|
|
$
|
51,026
|
|
$
|
119,021
|
|
|||
|
Basic earnings per share
|
$
|
0.20
|
|
$
|
0.12
|
|
$
|
0.30
|
|
$
|
0.68
|
|
|||
|
Diluted earnings per share
|
$
|
0.20
|
|
$
|
0.12
|
|
$
|
0.29
|
|
$
|
0.69
|
|
|||
|
Dividends per share
|
$
|
0.3150
|
|
$
|
0.3150
|
|
$
|
0.3150
|
|
$
|
0.3150
|
|
|||
|
|
2010
|
||||||||||||||
|
|
First
|
Second
|
Third
|
Fourth
|
|||||||||||
|
Revenues
|
$
|
132,545
|
|
$
|
131,147
|
|
$
|
134,116
|
|
$
|
135,232
|
|
|||
|
Real estate operating income
|
$
|
43,100
|
|
$
|
40,538
|
|
$
|
49,485
|
|
$
|
39,358
|
|
|||
|
Discontinued operations
|
$
|
4,202
|
|
$
|
(5,214
|
)
|
$
|
5,268
|
|
$
|
4,024
|
|
|||
|
Net income attributable to Piedmont
|
$
|
31,460
|
|
$
|
19,636
|
|
$
|
40,584
|
|
$
|
28,699
|
|
|||
|
Basic earnings per share
|
$
|
0.19
|
|
$
|
0.11
|
|
$
|
0.24
|
|
$
|
0.17
|
|
|||
|
Diluted earnings per share
|
$
|
0.19
|
|
$
|
0.11
|
|
$
|
0.23
|
|
$
|
0.17
|
|
|||
|
Dividends per share
|
$
|
0.3150
|
|
$
|
0.3150
|
|
$
|
0.3150
|
|
$
|
0.3150
|
|
|||
21. Subsequent events
Declaration of Dividend for the
First Quarter 2012
On
February 28, 2012
, the board of directors of Piedmont declared dividends for the
first quarter 2012
in the amount of
$0.20
(
20.00
cents) per share on its common stock to stockholders of record as of the close of business on
March 9, 2012
. Such dividends are to be paid on
March 22, 2012
.
F-30
|
|
|
|
|
Initial Cost
|
|
Gross Amount at Which
Carried at December 31, 2011
|
|
|
|
|
|||||||||||||||||||||||||||||||||||
|
Description
|
Location
|
Ownership
Percentage
|
Encumbrances
|
Land
|
Buildings and
Improvements
|
Total
|
Costs
Capitalized
Subsequent
to
Acquisition
|
Land
|
Buildings and
Improvements
|
Total
|
Accumulated
Depreciation
and
Amortization
|
Date of
Construction
|
Date
Acquired
|
Life on
which
Depreciation
and
Amortization
is Computed
(f)
|
|||||||||||||||||||||||||||||||
|
26200 ENTERPRISE WAY
|
Lake Forest, CA
|
100
|
%
|
None
|
|
$
|
4,577
|
|
$
|
—
|
|
$
|
4,577
|
|
10,419
|
|
$
|
4,768
|
|
$
|
10,227
|
|
$
|
14,996
|
|
$
|
3,507
|
|
2000
|
3/15/1999
|
0 to 40 years
|
||||||||||||||
|
3900 DALLAS PARKWAY
|
Plano, TX
|
100
|
%
|
None
|
|
1,456
|
|
20,377
|
|
21,837
|
|
2,602
|
|
1,517
|
|
22,922
|
|
24,439
|
|
8,071
|
|
1999
|
12/21/1999
|
0 to 40 years
|
|||||||||||||||||||||
|
RIVER CORPORATE CENTER
|
Tempe, AZ
|
100
|
%
|
(a)
|
|
—
|
|
16,036
|
|
16,036
|
|
683
|
|
—
|
|
16,719
|
|
16,719
|
|
5,688
|
|
1998
|
3/29/2000
|
0 to 40 years
|
|||||||||||||||||||||
|
8700 SOUTH PRICE ROAD
|
Tempe, AZ
|
100
|
%
|
(a)
|
|
—
|
|
13,272
|
|
13,272
|
|
550
|
|
—
|
|
13,822
|
|
13,822
|
|
4,577
|
|
2000
|
6/12/2000
|
0 to 40 years
|
|||||||||||||||||||||
|
1441 WEST LONG LAKE ROAD
|
Troy, MI
|
100
|
%
|
None
|
|
2,160
|
|
16,776
|
|
18,936
|
|
(6,945
|
)
|
1,202
|
|
10,789
|
|
11,991
|
|
6,246
|
|
1999
|
6/29/2000
|
0 to 40 years
|
|||||||||||||||||||||
|
1111 DURHAM AVENUE
|
South Plainfield, NJ
|
100
|
%
|
None
|
|
9,653
|
|
20,495
|
|
30,148
|
|
(11,547
|
)
|
3,728
|
|
14,873
|
|
18,601
|
|
7,462
|
|
1975
|
11/1/2000
|
0 to 40 years
|
|||||||||||||||||||||
|
1430 ENCLAVE PARKWAY (b)
|
Houston, TX
|
100
|
%
|
32,100
|
|
7,100
|
|
37,915
|
|
45,015
|
|
3,742
|
|
5,506
|
|
43,251
|
|
48,757
|
|
13,403
|
|
1994
|
12/21/2000
|
0 to 40 years
|
|||||||||||||||||||||
|
CRESCENT RIDGE II
|
Minnetonka, MN
|
100
|
%
|
None
|
|
7,700
|
|
45,154
|
|
52,854
|
|
7,523
|
|
8,021
|
|
52,356
|
|
60,377
|
|
17,716
|
|
2000
|
12/21/2000
|
0 to 40 years
|
|||||||||||||||||||||
|
1200 CROWN COLONY DRIVE (c)
|
Quincy, MA
|
100
|
%
|
20,200
|
|
11,042
|
|
40,666
|
|
51,708
|
|
148
|
|
11,042
|
|
40,814
|
|
51,856
|
|
11,956
|
|
1990
|
7/30/2001
|
0 to 40 years
|
|||||||||||||||||||||
|
5601 HIATUS ROAD
|
Tamarac, FL
|
100
|
%
|
None
|
|
3,642
|
|
10,404
|
|
14,046
|
|
650
|
|
3,642
|
|
11,054
|
|
14,696
|
|
2,892
|
|
2001
|
12/21/2001
|
0 to 40 years
|
|||||||||||||||||||||
|
WINDY POINT I
|
Schaumburg, IL
|
100
|
%
|
23,400
|
|
4,537
|
|
31,847
|
|
36,384
|
|
1,838
|
|
4,537
|
|
33,685
|
|
38,222
|
|
9,123
|
|
1999
|
12/31/2001
|
0 to 40 years
|
|||||||||||||||||||||
|
WINDY POINT II
|
Schaumburg, IL
|
100
|
%
|
40,300
|
|
3,746
|
|
55,026
|
|
58,772
|
|
100
|
|
3,746
|
|
55,126
|
|
58,872
|
|
15,240
|
|
2001
|
12/31/2001
|
0 to 40 years
|
|||||||||||||||||||||
|
SARASOTA COMMERCE CENTER II
|
Sarasota, FL
|
100
|
%
|
None
|
|
1,767
|
|
20,533
|
|
22,300
|
|
2,001
|
|
2,203
|
|
22,098
|
|
24,301
|
|
6,345
|
|
1999
|
1/11/2002
|
0 to 40 years
|
|||||||||||||||||||||
|
11695 JOHNS CREEK PARKWAY
|
Johns Creek, GA
|
100
|
%
|
None
|
|
2,080
|
|
13,572
|
|
15,652
|
|
1,636
|
|
2,081
|
|
15,207
|
|
17,288
|
|
4,065
|
|
2001
|
3/28/2002
|
0 to 40 years
|
|||||||||||||||||||||
|
3750 BROOKSIDE PARKWAY
|
Alpharetta, GA
|
100
|
%
|
None
|
|
1,561
|
|
14,207
|
|
15,768
|
|
126
|
|
1,561
|
|
14,333
|
|
15,894
|
|
3,841
|
|
2001
|
4/18/2002
|
0 to 40 years
|
|||||||||||||||||||||
|
2001 NW 64th STREET
|
Ft. Lauderdale, FL
|
100
|
%
|
(a)
|
|
—
|
|
7,172
|
|
7,172
|
|
447
|
|
—
|
|
7,619
|
|
7,619
|
|
1,903
|
|
2001
|
4/18/2002
|
0 to 40 years
|
|||||||||||||||||||||
|
90 CENTRAL STREET
|
Boxborough, MA
|
100
|
%
|
None
|
|
3,642
|
|
29,497
|
|
33,139
|
|
2,618
|
|
3,642
|
|
32,115
|
|
35,757
|
|
8,726
|
|
2001
|
5/3/2002
|
0 to 40 years
|
|||||||||||||||||||||
|
DESERT CANYON 300
|
Phoenix, AZ
|
100
|
%
|
None
|
|
2,602
|
|
24,333
|
|
26,935
|
|
304
|
|
2,602
|
|
24,637
|
|
27,239
|
|
6,307
|
|
2001
|
6/4/2002
|
0 to 40 years
|
|||||||||||||||||||||
|
6031 CONNECTION DRIVE
|
Irving, TX
|
100
|
%
|
None
|
|
3,157
|
|
43,656
|
|
46,813
|
|
2,505
|
|
3,157
|
|
46,161
|
|
49,318
|
|
11,234
|
|
1999
|
8/15/2002
|
0 to 40 years
|
|||||||||||||||||||||
|
6021 CONNECTION DRIVE
|
Irving, TX
|
100
|
%
|
None
|
|
3,157
|
|
42,662
|
|
45,819
|
|
1,397
|
|
3,157
|
|
44,059
|
|
47,216
|
|
11,357
|
|
2000
|
8/15/2002
|
0 to 40 years
|
|||||||||||||||||||||
|
6011 CONNECTION DRIVE
|
Irving, TX
|
100
|
%
|
None
|
|
3,157
|
|
29,034
|
|
32,191
|
|
2,586
|
|
3,157
|
|
31,620
|
|
34,777
|
|
8,452
|
|
1999
|
8/15/2002
|
0 to 40 years
|
|||||||||||||||||||||
|
BRAKER POINTE III (c)
|
Austin, TX
|
100
|
%
|
16,500
|
|
6,098
|
|
34,492
|
|
40,590
|
|
1
|
|
6,099
|
|
34,492
|
|
40,591
|
|
8,701
|
|
2001
|
8/15/2002
|
0 to 40 years
|
|||||||||||||||||||||
|
CHANDLER FORUM
|
Chandler, AZ
|
100
|
%
|
None
|
|
2,632
|
|
—
|
|
2,632
|
|
19,912
|
|
2,779
|
|
19,765
|
|
22,544
|
|
5,699
|
|
2003
|
9/12/2002
|
0 to 40 years
|
|||||||||||||||||||||
|
2 GATEHALL DRIVE (c)
|
Parsippany, NJ
|
100
|
%
|
42,700
|
|
9,054
|
|
96,722
|
|
105,776
|
|
158
|
|
9,054
|
|
96,880
|
|
105,934
|
|
24,170
|
|
1985
|
9/27/2002
|
0 to 40 years
|
|||||||||||||||||||||
|
350 SPECTRUM LOOP
|
Colorado
Springs, CO
|
100
|
%
|
None
|
|
2,185
|
|
24,964
|
|
27,149
|
|
(1,894
|
)
|
2,186
|
|
23,069
|
|
25,255
|
|
5,749
|
|
2001
|
9/27/2002
|
0 to 40 years
|
|||||||||||||||||||||
S- 1
|
5601 HEADQUARTERS DRIVE
|
Plano, TX
|
100
|
%
|
None
|
|
3,153
|
|
24,602
|
|
27,755
|
|
4
|
|
3,153
|
|
24,606
|
|
27,759
|
|
6,132
|
|
2001
|
9/27/2002
|
0 to 40 years
|
|||||||||||||||||||||
|
TWO INDEPENDENCE SQUARE (c)
|
Washington, DC
|
100
|
%
|
105,800
|
|
52,711
|
|
202,702
|
|
255,413
|
|
5,820
|
|
52,711
|
|
208,522
|
|
261,233
|
|
50,074
|
|
1991
|
11/22/2002
|
0 to 40 years
|
|||||||||||||||||||||
|
ONE INDEPENDENCE SQUARE (c)
|
Washington, DC
|
100
|
%
|
57,800
|
|
29,765
|
|
104,814
|
|
134,579
|
|
2,770
|
|
30,562
|
|
106,787
|
|
137,349
|
|
25,791
|
|
1991
|
11/22/2002
|
0 to 40 years
|
|||||||||||||||||||||
|
2120 WEST END AVENUE (c)
|
Nashville, TN
|
100
|
%
|
26,800
|
|
4,908
|
|
59,011
|
|
63,919
|
|
6,671
|
|
5,100
|
|
65,490
|
|
70,590
|
|
15,965
|
|
2000
|
11/26/2002
|
0 to 40 years
|
|||||||||||||||||||||
|
800 NORTH BRAND BOULEVARD
|
Glendale, CA
|
100
|
%
|
None
|
|
23,605
|
|
136,284
|
|
159,889
|
|
7,545
|
|
23,607
|
|
143,827
|
|
167,434
|
|
34,789
|
|
1990
|
12/20/2002
|
0 to 40 years
|
|||||||||||||||||||||
|
EASTPOINT I
|
Mayfield
Heights, OH
|
100
|
%
|
None
|
|
1,485
|
|
11,064
|
|
12,549
|
|
156
|
|
1,485
|
|
11,220
|
|
12,705
|
|
2,677
|
|
2000
|
1/9/2003
|
0 to 40 years
|
|||||||||||||||||||||
|
EASTPOINT II
|
Mayfield Heights, OH
|
100
|
%
|
None
|
|
1,235
|
|
9,199
|
|
10,434
|
|
1,836
|
|
1,235
|
|
11,035
|
|
12,270
|
|
3,102
|
|
2000
|
1/9/2003
|
0 to 40 years
|
|||||||||||||||||||||
|
150 WEST JEFFERSON
|
Detroit, MI
|
100
|
%
|
None
|
|
9,759
|
|
88,364
|
|
98,123
|
|
3,956
|
|
9,759
|
|
92,320
|
|
102,079
|
|
22,885
|
|
1989
|
3/31/2003
|
0 to 40 years
|
|||||||||||||||||||||
|
US BANCORP CENTER
|
Minneapolis, MN
|
100
|
%
|
105,000
|
|
11,138
|
|
175,629
|
|
186,767
|
|
5,885
|
|
11,138
|
|
181,514
|
|
192,652
|
|
41,441
|
|
2000
|
5/1/2003
|
0 to 40 years
|
|||||||||||||||||||||
|
AON CENTER
|
Chicago, IL
|
100
|
%
|
225,000
|
|
23,267
|
|
472,488
|
|
495,755
|
|
93,857
|
|
23,966
|
|
565,646
|
|
589,612
|
|
126,462
|
|
1972
|
5/9/2003
|
0 to 40 years
|
|||||||||||||||||||||
|
AUBURN HILLS CORPORATE CENTER
|
Auburn Hills, MI
|
100
|
%
|
None
|
|
1,978
|
|
16,570
|
|
18,548
|
|
(8,159
|
)
|
1,591
|
|
8,798
|
|
10,389
|
|
3,379
|
|
2001
|
5/9/2003
|
0 to 40 years
|
|||||||||||||||||||||
|
11107 SUNSET HILLS ROAD
|
Reston, VA
|
100
|
%
|
None
|
|
2,711
|
|
17,890
|
|
20,601
|
|
3,665
|
|
2,711
|
|
21,555
|
|
24,266
|
|
7,228
|
|
1985
|
6/27/2003
|
0 to 40 years
|
|||||||||||||||||||||
|
11109 SUNSET HILLS ROAD
|
Reston, VA
|
100
|
%
|
None
|
|
1,218
|
|
8,038
|
|
9,256
|
|
(2,338
|
)
|
1,218
|
|
5,700
|
|
6,918
|
|
1,334
|
|
1984
|
6/27/2003
|
0 to 40 years
|
|||||||||||||||||||||
|
9211 CORPORATE BOULEVARD
|
Rockville, MD
|
100
|
%
|
None
|
|
3,019
|
|
21,984
|
|
25,003
|
|
(4,844
|
)
|
2,960
|
|
17,199
|
|
20,159
|
|
3,741
|
|
1989
|
7/30/2003
|
0 to 40 years
|
|||||||||||||||||||||
|
9221 CORPORATE BOULEVARD
|
Rockville, MD
|
100
|
%
|
None
|
|
3,019
|
|
21,984
|
|
25,003
|
|
(4,822
|
)
|
2,960
|
|
17,221
|
|
20,181
|
|
3,749
|
|
1989
|
7/30/2003
|
0 to 40 years
|
|||||||||||||||||||||
|
GLENRIDGE HIGHLANDS TWO
|
Atlanta, GA
|
100
|
%
|
None
|
|
6,662
|
|
69,031
|
|
75,693
|
|
(22,727
|
)
|
6,662
|
|
46,304
|
|
52,966
|
|
9,790
|
|
2000
|
8/1/2003
|
0 to 40 years
|
|||||||||||||||||||||
|
200 BRIDGEWATER CROSSING (c)
|
Bridgewater, NJ
|
100
|
%
|
40,200
|
|
8,182
|
|
84,160
|
|
92,342
|
|
(4,565
|
)
|
8,328
|
|
79,449
|
|
87,777
|
|
31,348
|
|
2002
|
8/14/2003
|
0 to 40 years
|
|||||||||||||||||||||
|
1055 EAST COLORADO BOULEVARD
|
Pasadena, CA
|
100
|
%
|
29,200
|
|
6,495
|
|
30,265
|
|
36,760
|
|
(8,360
|
)
|
6,495
|
|
21,905
|
|
28,400
|
|
4,857
|
|
2001
|
8/22/2003
|
0 to 40 years
|
|||||||||||||||||||||
|
FAIRWAY CENTER II (c)
|
Brea, CA
|
100
|
%
|
10,700
|
|
7,110
|
|
15,600
|
|
22,710
|
|
(2,988
|
)
|
7,110
|
|
12,612
|
|
19,722
|
|
2,425
|
|
2002
|
8/29/2003
|
0 to 40 years
|
|||||||||||||||||||||
|
COPPER RIDGE CENTER
|
Lyndhurst, NJ
|
100
|
%
|
None
|
|
6,974
|
|
38,714
|
|
45,688
|
|
(6,388
|
)
|
6,974
|
|
32,326
|
|
39,300
|
|
7,298
|
|
1989
|
9/5/2003
|
0 to 40 years
|
|||||||||||||||||||||
|
1901 MAIN STREET
|
Irvine, CA
|
100
|
%
|
None
|
|
6,246
|
|
36,455
|
|
42,701
|
|
(2,715
|
)
|
6,246
|
|
33,740
|
|
39,986
|
|
10,003
|
|
2001
|
9/17/2003
|
0 to 40 years
|
|||||||||||||||||||||
|
RHEIN
|
Beaverton, OR
|
100
|
%
|
None
|
|
1,015
|
|
6,425
|
|
7,440
|
|
(580
|
)
|
1,015
|
|
5,845
|
|
6,860
|
|
1,742
|
|
1988
|
10/9/2003
|
0 to 40 years
|
|||||||||||||||||||||
|
DESCHUTES
|
Beaverton, OR
|
100
|
%
|
None
|
|
1,072
|
|
6,361
|
|
7,433
|
|
(2,082
|
)
|
1,072
|
|
4,279
|
|
5,351
|
|
902
|
|
1989
|
10/9/2003
|
0 to 40 years
|
|||||||||||||||||||||
|
WILLAMETTE
|
Beaverton, OR
|
100
|
%
|
None
|
|
1,085
|
|
6,211
|
|
7,296
|
|
(1,933
|
)
|
1,085
|
|
4,278
|
|
5,363
|
|
895
|
|
1990
|
10/9/2003
|
0 to 40 years
|
|||||||||||||||||||||
|
ROGUE
|
Beaverton, OR
|
100
|
%
|
None
|
|
1,546
|
|
7,630
|
|
9,176
|
|
—
|
|
1,546
|
|
7,630
|
|
9,176
|
|
1,597
|
|
1998
|
10/9/2003
|
0 to 40 years
|
|||||||||||||||||||||
|
400 VIRGINIA AVE
|
Washington, DC
|
100
|
%
|
None
|
|
22,146
|
|
49,740
|
|
71,886
|
|
(2,135
|
)
|
22,146
|
|
47,605
|
|
69,751
|
|
9,904
|
|
1985
|
11/19/2003
|
0 to 40 years
|
|||||||||||||||||||||
|
4250 NORTH FAIRFAX DRIVE
|
Arlington, VA
|
100
|
%
|
45,000
|
|
13,636
|
|
70,918
|
|
84,554
|
|
5,082
|
|
13,636
|
|
76,000
|
|
89,636
|
|
19,458
|
|
1998
|
11/19/2003
|
0 to 40 years
|
|||||||||||||||||||||
|
1225 EYE STREET (d)
|
Washington, DC
|
50
|
%
|
57,600
|
|
21,959
|
|
47,602
|
|
69,561
|
|
3,150
|
|
21,959
|
|
50,752
|
|
72,711
|
|
16,202
|
|
1986
|
11/19/2003
|
0 to 40 years
|
|||||||||||||||||||||
|
1201 EYE STREET (e)
|
Washington, DC
|
50
|
%
|
82,400
|
|
31,985
|
|
63,139
|
|
95,124
|
|
2,790
|
|
31,985
|
|
65,929
|
|
97,914
|
|
17,895
|
|
2001
|
11/19/2003
|
0 to 40 years
|
|||||||||||||||||||||
S- 2
|
1901 MARKET STREET
|
Philadelphia, PA
|
100
|
%
|
None
|
|
13,584
|
|
166,683
|
|
180,267
|
|
137
|
|
20,829
|
|
159,575
|
|
180,404
|
|
39,218
|
|
1987
|
12/18/2003
|
0 to 40 years
|
|||||||||||||||||||||
|
60 BROAD STREET
|
New York, NY
|
100
|
%
|
None
|
|
32,522
|
|
168,986
|
|
201,508
|
|
(5,694
|
)
|
60,708
|
|
135,106
|
|
195,814
|
|
29,919
|
|
1962
|
12/31/2003
|
0 to 40 years
|
|||||||||||||||||||||
|
1414 MASSACHUSETTS AVENUE
|
Cambridge, MA
|
100
|
%
|
None
|
|
4,210
|
|
35,821
|
|
40,031
|
|
1,988
|
|
4,365
|
|
37,654
|
|
42,019
|
|
11,642
|
|
1873
|
1/8/2004
|
0 to 40 years
|
|||||||||||||||||||||
|
ONE BRATTLE SQUARE
|
Cambridge, MA
|
100
|
%
|
None
|
|
6,974
|
|
64,940
|
|
71,914
|
|
(3,924
|
)
|
7,113
|
|
60,877
|
|
67,990
|
|
20,414
|
|
1991
|
2/26/2004
|
0 to 40 years
|
|||||||||||||||||||||
|
600 CORPORATE DRIVE
|
Lebanon, NJ
|
100
|
%
|
None
|
|
3,934
|
|
—
|
|
3,934
|
|
16,281
|
|
3,934
|
|
16,281
|
|
20,215
|
|
3,959
|
|
2005
|
3/16/2004
|
0 to 40 years
|
|||||||||||||||||||||
|
1075 WEST ENTRANCE DRIVE
|
Auburn Hills,
MI
|
100
|
%
|
None
|
|
5,200
|
|
22,957
|
|
28,157
|
|
(313
|
)
|
5,207
|
|
22,637
|
|
27,844
|
|
3,835
|
|
2001
|
7/7/2004
|
0 to 40 years
|
|||||||||||||||||||||
|
3100 CLARENDON BOULEVARD
|
Arlington, VA
|
100
|
%
|
None
|
|
11,700
|
|
69,705
|
|
81,405
|
|
(5,341
|
)
|
11,791
|
|
64,273
|
|
76,064
|
|
11,084
|
|
1987
|
12/9/2004
|
0 to 40 years
|
|||||||||||||||||||||
|
9200 CORPORATE BOULEVARD
|
Rockville, MD
|
100
|
%
|
None
|
|
3,730
|
|
16,608
|
|
20,338
|
|
(1,624
|
)
|
3,882
|
|
14,832
|
|
18,714
|
|
2,596
|
|
1982
|
12/29/2004
|
0 to 40 years
|
|||||||||||||||||||||
|
400 BRIDGEWATER CROSSING (c)
|
Bridgewater, NJ
|
100
|
%
|
29,300
|
|
10,400
|
|
71,052
|
|
81,452
|
|
3,237
|
|
10,400
|
|
74,289
|
|
84,689
|
|
23,825
|
|
2002
|
2/17/2006
|
0 to 40 years
|
|||||||||||||||||||||
|
LAS COLINAS CORPORATE CENTER I (b)
|
Irving, TX
|
100
|
%
|
17,500
|
|
3,912
|
|
18,830
|
|
22,742
|
|
(1,663
|
)
|
2,543
|
|
18,536
|
|
21,079
|
|
6,112
|
|
1998
|
8/31/2006
|
0 to 40 years
|
|||||||||||||||||||||
|
LAS COLINAS CORPORATE CENTER II (b)
|
Irving, TX
|
100
|
%
|
25,025
|
|
4,496
|
|
29,881
|
|
34,377
|
|
(6,073
|
)
|
2,543
|
|
25,761
|
|
28,304
|
|
4,833
|
|
1998
|
8/31/2006
|
0 to 40 years
|
|||||||||||||||||||||
|
TWO PIERCE PLACE
|
Itasca, IL
|
100
|
%
|
None
|
|
4,370
|
|
70,632
|
|
75,002
|
|
611
|
|
4,370
|
|
71,243
|
|
75,613
|
|
13,390
|
|
1991
|
12/7/2006
|
0 to 40 years
|
|||||||||||||||||||||
|
2300 CABOT DRIVE
|
Lisle, IL
|
100
|
%
|
None
|
|
4,390
|
|
19,549
|
|
23,939
|
|
(2,849
|
)
|
4,390
|
|
16,700
|
|
21,090
|
|
3,737
|
|
1998
|
5/10/2007
|
0 to 40 years
|
|||||||||||||||||||||
|
PIEDMONT POINTE I
|
Bethesda, MD
|
100
|
%
|
None
|
|
11,200
|
|
58,606
|
|
69,806
|
|
5,527
|
|
11,200
|
|
64,133
|
|
75,333
|
|
6,268
|
|
2007
|
11/13/2007
|
0 to 40 years
|
|||||||||||||||||||||
|
PIEDMONT POINTE II
|
Bethesda, MD
|
100
|
%
|
None
|
|
13,300
|
|
70,618
|
|
83,918
|
|
2,310
|
|
13,300
|
|
72,928
|
|
86,228
|
|
6,433
|
|
2008
|
6/25/2008
|
0 to 40 years
|
|||||||||||||||||||||
|
SUWANEE GATEWAY ONE
|
Suwanee, GA
|
100
|
%
|
None
|
|
1,000
|
|
6,875
|
|
7,875
|
|
78
|
|
1,000
|
|
6,953
|
|
7,953
|
|
230
|
|
2008
|
9/28/2010
|
0 to 40 years
|
|||||||||||||||||||||
|
ONE MERIDIAN CROSSINGS
|
Richfield, MN
|
100
|
%
|
None
|
|
2,919
|
|
24,398
|
|
27,317
|
|
(1
|
)
|
2,919
|
|
24,397
|
|
27,316
|
|
861
|
|
1997
|
10/1/2010
|
0 to 40 years
|
|||||||||||||||||||||
|
TWO MERIDIAN CROSSINGS
|
Richfield, MN
|
100
|
%
|
None
|
|
2,661
|
|
25,742
|
|
28,403
|
|
14
|
|
2,661
|
|
25,756
|
|
28,417
|
|
1,012
|
|
1998
|
10/1/2010
|
0 to 40 years
|
|||||||||||||||||||||
|
1200 ENCLAVE PARKWAY
|
Houston, TX
|
100
|
%
|
None
|
|
3,460
|
|
15,047
|
|
18,507
|
|
66
|
|
3,460
|
|
15,113
|
|
18,573
|
|
397
|
|
1999
|
3/30/2011
|
0 to 40 years
|
|||||||||||||||||||||
|
500 W. MONROE
|
Chicago, IL
|
100
|
%
|
140,000
|
|
36,990
|
|
185,113
|
|
222,103
|
|
50
|
|
36,990
|
|
185,163
|
|
222,153
|
|
17,400
|
|
1991
|
3/31/2011
|
0 to 40 years
|
|||||||||||||||||||||
|
THE DUPREE
|
Atlanta, GA
|
100
|
%
|
None
|
|
4,080
|
|
14,310
|
|
18,390
|
|
71
|
|
4,080
|
|
14,381
|
|
18,461
|
|
471
|
|
1997
|
4/29/2011
|
0 to 40 years
|
|||||||||||||||||||||
|
THE MEDICI
|
Atlanta, GA
|
100
|
%
|
None
|
|
1,780
|
|
11,510
|
|
13,290
|
|
194
|
|
1,780
|
|
11,704
|
|
13,484
|
|
449
|
|
2008
|
6/7/2011
|
0 to 40 years
|
|||||||||||||||||||||
|
225 PRESIDENTIAL WAY
|
Boston, MA
|
100
|
%
|
None
|
|
3,626
|
|
36,916
|
|
40,542
|
|
(764
|
)
|
3,612
|
|
36,166
|
|
39,778
|
|
533
|
|
2000
|
9/13/2011
|
0 to 40 years
|
|||||||||||||||||||||
|
235 PRESIDENTIAL WAY
|
Boston, MA
|
100
|
%
|
None
|
|
4,154
|
|
44,048
|
|
48,202
|
|
(911
|
)
|
4,138
|
|
43,153
|
|
47,291
|
|
634
|
|
2001
|
9/13/2011
|
0 to 40 years
|
|||||||||||||||||||||
|
400 TOWNPARK
|
Lake Mary, FL
|
100
|
%
|
None
|
|
2,570
|
|
20,555
|
|
23,125
|
|
—
|
|
2,570
|
|
20,555
|
|
23,125
|
|
130
|
|
2008
|
11/10/2011
|
0 to 40 years
|
|||||||||||||||||||||
|
110 HIDDEN LAKE CIRCLE (g)
|
Duncan, SC
|
100
|
%
|
None
|
|
1,002
|
|
15,709
|
|
16,711
|
|
1,276
|
|
1,002
|
|
16,985
|
|
17,987
|
|
4,062
|
|
1987
|
7/31/2002
|
0 to 40 years
|
|||||||||||||||||||||
|
112 HIDDEN LAKE CIRCLE (g)
|
Duncan, SC
|
100
|
%
|
None
|
|
663
|
|
10,914
|
|
11,577
|
|
840
|
|
663
|
|
11,754
|
|
12,417
|
|
2,815
|
|
1987
|
7/31/2002
|
0 to 40 years
|
|||||||||||||||||||||
|
PIEDMONT POWER, LLC (h)
|
Bridgewater, NJ
|
100
|
%
|
None
|
|
—
|
|
79
|
|
79
|
|
818
|
|
—
|
|
897
|
|
897
|
|
—
|
|
N/A
|
12/20/2011
|
0 to 40 years
|
|||||||||||||||||||||
|
UNDEVELOPED LAND PARCELS (b)
|
Various
|
100
|
%
|
None
|
|
6,021
|
|
427
|
|
6,448
|
|
2,523
|
|
8,944
|
|
27
|
|
8,971
|
|
7
|
|
N/A
|
Various
|
N/A
|
|||||||||||||||||||||
|
Total—Consolidated REIT Properties
|
$
|
610,637
|
|
$
|
3,888,197
|
|
$
|
4,498,834
|
|
$
|
116,978
|
|
$
|
640,196
|
|
$
|
3,975,616
|
|
$
|
4,615,812
|
|
$
|
911,761
|
|
|||||||||||||||||||||
S- 3
|
|
|
|
|
Initial Cost
|
|
Gross Amount at Which Carried at
December 31, 2011
|
|
|
|
|
||||||||||||||||||||||||||||||||||
|
Description
|
Location
|
Ownership
Percentage
|
Encumbrances
|
Land
|
Buildings and
Improvements
|
Total
|
Costs
Capitalized
Subsequent
to
Acquisition
|
Land
|
Buildings and
Improvements
|
Total
|
Accumulated
Depreciation
and
Amortization
|
Date of
Construction
|
Date
Acquired
|
Life on
which
Depreciation
and
Amortization
is Computed
(f)
|
||||||||||||||||||||||||||||||
|
20/20
|
Leawood, KS
|
57
|
%
|
None
|
1,696
|
|
7,851
|
|
9,547
|
|
(1,364
|
)
|
1,767
|
|
6,416
|
|
8,183
|
|
3,599
|
|
1992
|
7/2/1999
|
0 to 40 years
|
|||||||||||||||||||||
|
4685 INVESTMENT DRIVE
|
Troy, MI
|
55
|
%
|
None
|
2,144
|
|
9,984
|
|
12,128
|
|
2,902
|
|
2,233
|
|
12,797
|
|
15,030
|
|
5,748
|
|
2000
|
5/10/2000
|
0 to 40 years
|
|||||||||||||||||||||
|
5301 MARYLAND WAY
|
Brentwood, TN
|
55
|
%
|
None
|
4,300
|
|
20,702
|
|
25,002
|
|
1,355
|
|
4,479
|
|
21,878
|
|
26,357
|
|
6,708
|
|
1989
|
5/15/2001
|
0 to 40 years
|
|||||||||||||||||||||
|
8560 UPLAND DRIVE
|
Parker, CO
|
72
|
%
|
None
|
1,954
|
|
11,216
|
|
13,170
|
|
542
|
|
2,048
|
|
11,664
|
|
13,712
|
|
3,301
|
|
2001
|
12/21/2001
|
0 to 40 years
|
|||||||||||||||||||||
|
TWO PARK CENTER
|
Hoffman Estates, IL
|
72
|
%
|
None
|
600
|
|
22,682
|
|
23,282
|
|
(3,065
|
)
|
624
|
|
19,593
|
|
20,217
|
|
4,599
|
|
1999
|
9/19/2003
|
0 to 40 years
|
|||||||||||||||||||||
|
Total – Unconsolidated JV Properties
|
$
|
10,694
|
|
$
|
72,435
|
|
$
|
83,129
|
|
$
|
370
|
|
$
|
11,151
|
|
$
|
72,348
|
|
$
|
83,499
|
|
$
|
23,955
|
|
||||||||||||||||||||
|
Total – All Properties
|
$
|
621,331
|
|
$
|
3,960,632
|
|
$
|
4,581,963
|
|
$
|
117,348
|
|
$
|
651,347
|
|
$
|
4,047,964
|
|
$
|
4,699,311
|
|
$
|
935,716
|
|
||||||||||||||||||||
|
(a)
|
Property is owned subject to a long-term ground lease.
|
|
(b)
|
The acquisition of the property included excess, developable land, which has subsequently been reclassed into the asset class “Undeveloped Land Parcels”. Further, such Undeveloped Land Parcels are not included in Piedmont’s total building count.
|
|
(c)
|
These properties collateralize the
$350 Million
Secured Pooled Facility with Morgan Stanley that accrues interest at
4.84%
and matures in June 2014.
|
|
(d)
|
Piedmont purchased all of the membership interest in 1225 Equity, LLC, which own a
49.5%
membership interest in 1225 Eye Street, N.W. Associates, which owns the 1225 Eye Street building. As a result of its ownership of 1225 Equity, LLC, Piedmont owns an approximate
49.5%
in the 1225 Eye Street building. As the controlling member, Piedmont is deemed to have control of the entities and, as such, consolidates the joint ventures.
|
|
(e)
|
Piedmont purchased all of the membership interest in 1201 Equity, LLC, which own a
49.5%
membership interest in 1201 Eye Street, N.W. Associates, which owns the 1201 Eye Street building. As a result of its ownership of 1201 Equity, LLC, Piedmont owns an approximate
49.5%
in the 1201 Eye Street building. As the controlling member, Piedmont is deemed to have control of the entities and, as such, consolidates the joint ventures.
|
|
(f)
|
Piedmont’s assets are depreciated or amortized using the straight-lined method over the useful lives of the assets by class. Generally, Tenant Improvements are amortized over the shorter of economic life or lease term, and Lease Intangibles are amortized over the lease term. Generally, Building Improvements are depreciated over
5
-
25
years, Land Improvements are depreciated over
20
-
25
years, and Buildings are depreciated over
40
years.
|
|
(g)
|
Property is designated as an industrial property, and is not included in Piedmont’s total building count, which refers only to office properties.
|
|
(h)
|
During 2011, Piedmont Office Holdings, Inc. through a wholly-owned subsidiary (Piedmont Power, LLC), commenced a project to install solar panels at the 400 Bridgewater Crossing building. Piedmont Power, LLC is not included in Piedmont’s total building count.
|
S- 4
|
2011
|
2010
|
2009
|
||||||||||
|
Real Estate:
|
||||||||||||
|
Balance at the beginning of the year
|
$
|
4,666,188
|
|
|
$
|
4,681,313
|
|
|
$
|
4,739,791
|
|
|
|
Additions to/improvements of real estate
|
440,141
|
|
|
105,282
|
|
|
30,610
|
|
|
|||
|
Assets disposed
|
(361,397
|
)
|
(72,586
|
)
|
|
—
|
|
|
||||
|
Assets impaired
|
—
|
|
(8,489
|
)
|
(2)
|
(38,379
|
)
|
(3)
|
||||
|
Write-offs of intangible assets
(1)
|
(35,916
|
)
|
|
—
|
|
(2,340
|
)
|
|||||
|
Write-offs of fully depreciated/amortized assets
|
(9,705
|
)
|
(39,332
|
)
|
(48,369
|
)
|
||||||
|
Balance at the end of the year
|
$
|
4,699,311
|
|
|
$
|
4,666,188
|
|
|
$
|
4,681,313
|
|
|
|
Accumulated Depreciation and Amortization:
|
||||||||||||
|
Balance at the beginning of the year
|
$
|
918,578
|
|
|
$
|
840,545
|
|
|
$
|
748,778
|
|
|
|
Depreciation and amortization expense
|
147,440
|
|
|
131,000
|
|
|
140,136
|
|
|
|||
|
Assets disposed
|
(84,681
|
)
|
(13,519
|
)
|
|
—
|
|
|
||||
|
Write-offs of intangible assets
(1)
|
(35,916
|
)
|
|
—
|
|
|
—
|
|
||||
|
Write-offs of fully depreciated/amortized assets
|
(9,705
|
)
|
(39,448
|
)
|
(48,369
|
)
|
||||||
|
Balance at the end of the year
|
$
|
935,716
|
|
|
$
|
918,578
|
|
|
$
|
840,545
|
|
|
|
(1)
|
Consists of write-offs of intangible lease assets related to lease restructurings, amendments and terminations.
|
|
(2)
|
Piedmont recorded an impairment charge against real estate assets of approximately
$7.0 million
related to the 111 Sylvan Avenue building at the time it was classified as held-for-sale in May 2010. This wholly-owned asset was subsequently sold in December 2010. In addition, the Fund IX, Fund XI, and REIT Joint Venture recorded an impairment loss on real estate assets of approximately
$1.4 million
during 2010 related to the 360 Interlocken building; however, Piedmont recorded its proporationate share of the charge (approximately
$53,000
) in the accompanying consolidated statements of income with other such net property operations as equity in income of unconsolidated joint ventures.
|
|
(3)
|
Piedmont recorded impairment charges of approximately
$35.1 million
related to the following wholly-owned assets: 1) the Auburn Hills Corporate Center building, 2) the 1111 Durham Avenue building, and 3) the 1441 W. Long Lake Road building. In addition, the Wells/Fremont Joint Venture recorded an impairment loss on real estate assets of approximately
$3.3 million
during 2009 related to the 47300 Kato Road building (f/k/a 47320 Kato Road building); however, Piedmont recorded its proporationate share of the charge (approximately
$2.6 million
) in the accompanying consolidated statements of income with other such net property operations as equity in income of unconsolidated joint ventures.
|
S- 5
TABLE OF CONTENTS
Part IItem 1. BusinessItem 1B. Unresolved Staff CommentsItem 2. PropertiesItem 3. Legal ProceedingsItem 4. Mine Safety DisclosuresPart IIItem 5. Market For Registrant S Common Equity, Related Stockholder Matters and Issuer Purchases Of Equity SecuritiesItem 6. Selected Financial DataItem 7. Management S Discussion and Analysis Of Financial Condition and Results Of OperationsItem 7A. Quantitative and Qualitative Disclosures About Market RisksItem 8. Financial Statements and Supplementary DataItem 9. Changes in and Disagreements with Accountants on Accounting and Financial DisclosureItem 9A. Controls and ProceduresItem 9B. Other InformationPart IIIItem 10. Directors, Executive Officers and Corporate GovernanceItem 11. Executive CompensationItem 12. Security Ownership Of Certain Beneficial Owners and Management and Related Stockholder MattersItem 13. Certain Relationships and Related Transactions and Director IndependenceItem 14. Principal Accounting Fees and ServicesPart IVItem 15. Exhibits, Financial Statement Schedules