PEDEVCO CORP
10-Ks and 10-Qs
|
|
|
|
|
|
|
|
|
|
|
|
|
|
|
|
|
|
|
|
|
|
|
|
|
|
|
|
|
|
|
|
|
|
|
|
|
|
|
|
|
|
|
|
|
|
|
|
|
|
|
|
|
UNITED STATES
SECURITIES AND EXCHANGE COMMISSION
Washington, D.C. 20549
FORM 10-K
|
þ
|
ANNUAL REPORT PURSUANT TO SECTION 13 OR 15(D) OF THE SECURITIES EXCHANGE ACT OF 1934
|
For the fiscal year ended December 31, 2013
|
o
|
TRANSITION REPORT PURSUANT TO SECTION 13 OR 15(d) OF THE SECURITIES EXCHANGE ACT OF 1934
|
For the transition period from
to
Commission file number: 001-35922
PEDEVCO Corp.
(Exact Name of Registrant as Specified in Its Charter)
|
Texas
|
22-3755993
|
|
|
(State or other jurisdiction of incorporation
or organization)
|
(IRS Employer Identification No.)
|
|
4125 Blackhawk Plaza Circle, Suite 201
Danville, California 94506
(Address of Principal Executive Offices)
(855) 733 2685
(Registrant’s Telephone Number,
Including Area Code)
Securities registered pursuant to Section 12(b) of the Act:
Common Stock, $0.001 par value per share NYSE MKT
Securities registered pursuant to Section 12(g) of the Act:
None.
Indicate by check mark if the registrant is a well-known seasoned issuer, as defined in Rule 405 of the Securities Act.
Yes
o
No
þ
Indicate by check mark if the registrant is not required to file reports pursuant to Section 13 or Section 15(d) of the Act.
Yes
o
No
þ
Indicate by check mark whether the registrant (1) has filed all reports required to be filed by Section 13 or 15(d) of the Securities Exchange Act of 1934 during the preceding 12 months (or for such shorter period that the registrant was required to file such reports), and (2) has been subject to such filing requirements for the past 90 days. Yes
þ
No
o
Indicate by check mark whether the registrant has submitted electronically and posted on its corporate Web site, if any, every Interactive Data File required to be submitted and posted pursuant to Rule 405 of Regulation S-T (§232.405 of this chapter) during the preceding 12 months (or for such shorter period that the registrant was required to submit and post such files). Yes
þ
No
o
Indicate by check mark if disclosure of delinquent filers pursuant to Item 405 of Regulation S-K is not contained herein, and will not be contained, to the best of the Registrant’s knowledge, in definitive proxy or information statements incorporated by reference in Part III of this Form 10-K or any amendment to this Form 10-K.
o
Indicate by check mark whether the registrant is a large accelerated filer, an accelerated filer, a non-accelerated filer, or a smaller reporting company. See the definitions of “large accelerated filer,” “accelerated filer” and “smaller reporting company” in Rule 12b-2 of the Exchange Act.
|
Large accelerated filer
|
o
|
Accelerated filer
|
o
|
|
Non-accelerated filer
|
o
|
Smaller reporting company
|
þ
|
Indicate by check mark whether the registrant is a shell company (as defined in Rule 12b-2 of the Exchange Act).
Yes
o
No
þ
The aggregate market value of the voting and non-voting common equity held by non-affiliates of the registrant as of June 28, 2013 based upon the closing price reported on such date was approximately $44,437,679. Shares of voting stock held by each officer and director and by each person who, as of June 28, 2013, may be deemed to have beneficially owned more than 10% of the outstanding voting stock have been excluded. This determination of affiliate status is not necessarily a conclusive determination of affiliate status for any other purpose.
As of March 28, 2014, 26,539,013
shares of the registrant’s common stock, $0.001 par value per share, were outstanding
Table of Contents
|
Page
|
|||||
|
PART I
|
|||||
|
Item 1
|
Risk Factors
|
34
|
|||
|
Unresolved Staff Comments
|
59
|
||||
|
Properties
|
59
|
||||
|
Legal Proceedings
|
65
|
||||
|
Mine Safety Disclosures
|
65 | ||||
|
PART II
|
|||||
|
Market For Registrant’s Common Equity, Related Stockholder Matters and Issuer Purchases of Equity Securities
|
66
|
||||
|
Selected Financial Data
|
71
|
||||
|
Management’s Discussion and Analysis of Financial Condition and Results of Operations
|
72
|
||||
|
Quantitative and Qualitative Disclosure About Market Risk
|
83
|
||||
|
Financial Statements and Supplementary Data
|
83
|
||||
|
Changes in and Disagreements with Accountants on Accounting and Financial Disclosure
|
83
|
||||
|
Controls and Procedures
|
83
|
||||
|
|
Other Information
|
84
|
|||
|
PART III
|
|||||
|
Directors, Executive Officers and Corporate Governance
|
85
|
||||
|
Executive Compensation
|
91
|
||||
|
|
Security Ownership of Certain Beneficial Owners and Management and Related Stockholder Matters
|
101
|
|||
|
Certain Relationships and Related Transactions, and Director Independence
|
103
|
||||
|
|
Principal Accounting Fees and Services
|
106
|
|||
|
PART IV
|
|||||
|
Exhibits and Financial Statement Schedules
|
F-1
|
||||
2
Forward Looking Statements
ALL STATEMENTS IN THIS DISCUSSION THAT ARE NOT HISTORICAL ARE FORWARD-LOOKING STATEMENTS. STATEMENTS PRECEDED BY, FOLLOWED BY OR THAT OTHERWISE INCLUDE THE WORDS "BELIEVES," "EXPECTS," "ANTICIPATES," "INTENDS,” "PROJECTS," "ESTIMATES,” "PLANS," "MAY INCREASE," "MAY FLUCTUATE" AND SIMILAR EXPRESSIONS OR FUTURE OR CONDITIONAL VERBS SUCH AS "SHOULD", "WOULD", "MAY" AND "COULD" ARE GENERALLY FORWARD-LOOKING IN NATURE AND NOT HISTORICAL FACTS. THESE FORWARD-LOOKING STATEMENTS WERE BASED ON VARIOUS FACTORS AND WERE DERIVED UTILIZING NUMEROUS IMPORTANT ASSUMPTIONS AND OTHER IMPORTANT FACTORS THAT COULD CAUSE ACTUAL RESULTS TO DIFFER MATERIALLY FROM THOSE IN THE FORWARD-LOOKING STATEMENTS. FORWARD-LOOKING STATEMENTS INCLUDE THE INFORMATION CONCERNING OUR FUTURE FINANCIAL PERFORMANCE, BUSINESS STRATEGY, PROJECTED PLANS AND OBJECTIVES. THESE FACTORS INCLUDE, AMONG OTHERS, THE FACTORS SET FORTH BELOW UNDER THE HEADING "RISK FACTORS." ALTHOUGH WE BELIEVE THAT THE EXPECTATIONS REFLECTED IN THE FORWARD-LOOKING STATEMENTS ARE REASONABLE, WE CANNOT GUARANTEE FUTURE RESULTS, LEVELS OF ACTIVITY, PERFORMANCE OR ACHIEVEMENTS. MOST OF THESE FACTORS ARE DIFFICULT TO PREDICT ACCURATELY AND ARE GENERALLY BEYOND OUR CONTROL. WE ARE UNDER NO OBLIGATION TO PUBLICLY UPDATE ANY OF THE FORWARD-LOOKING STATEMENTS TO REFLECT EVENTS OR CIRCUMSTANCES AFTER THE DATE HEREOF OR TO REFLECT THE OCCURRENCE OF UNANTICIPATED EVENTS. READERS ARE CAUTIONED NOT TO PLACE UNDUE RELIANCE ON THESE FORWARD-LOOKING STATEMENTS. REFERENCES IN THIS FORM 10-K, UNLESS ANOTHER DATE IS STATED, ARE TO DECEMBER 31, 2013. AS USED HEREIN, THE “COMPANY,” “WE,” “US,” “OUR” AND WORDS OF SIMILAR MEANING REFER TO PEDEVCO CORP. (D/B/A PACIFIC ENERGY DEVELOPMENT), WHICH WAS KNOWN AS BLAST ENERGY SERVICES, INC. UNTIL JULY 30, 2012, AND ITS WHOLLY-OWNED AND PARTIALLY-OWNED SUBSIDIARIES, BLAST AFJ, INC. PACIFIC ENERGY DEVELOPMENT CORP., CONDOR ENERGY TECHNOLOGY LLC, WHITE HAWK PETROLEUM, LLC, PACIFIC ENERGY TECHNOLOGY SERVICES, LLC, PACIFIC ENERGY & RARE EARTH LIMITED, BLACKHAWK ENERGY LIMITED, RED HAWK PETROLEUM, LLC, AND PACIFIC ENERGY DEVELOPMENT MSL LLC, UNLESS OTHERWISE STATED.
This Annual Report on Form 10-K (this “Annual Report”) may contain forward-looking statements which are subject to a number of risks and uncertainties, many of which are beyond our control. All statements, other than statements of historical fact included in this Annual Report, regarding our strategy, future operations, financial position, estimated revenues and losses, projected costs and cash flows, prospects, plans and objectives of management are forward-looking statements. When used in this Annual Report, the words “could,” “believe,” “anticipate,” “intend,” “estimate,” “expect,” “may,” “should,” “continue,” “predict,” “potential,” “project” and similar expressions are intended to identify forward-looking statements, although not all forward-looking statements contain such identifying words.
Forward-looking statements may include statements about our:
|
●
|
business strategy;
|
|
●
|
reserves;
|
|
●
|
technology;
|
|
●
|
cash flows and liquidity;
|
|
●
|
financial strategy, budget, projections and operating results;
|
|
●
|
oil and natural gas realized prices;
|
|
●
|
timing and amount of future production of oil and natural gas;
|
|
●
|
availability of oil field labor;
|
|
●
|
the amount, nature and timing of capital expenditures, including future exploration and development costs;
|
|
●
|
availability and terms of capital;
|
|
●
|
drilling of wells;
|
|
●
|
government regulation and taxation of the oil and natural gas industry;
|
|
●
|
marketing of oil and natural gas;
|
|
●
|
exploitation projects or property acquisitions;
|
|
●
|
costs of exploiting and developing our properties and conducting other operations;
|
|
●
|
general economic conditions;
|
|
●
|
competition in the oil and natural gas industry;
|
|
●
|
effectiveness of our risk management and hedging activities;
|
|
●
|
environmental liabilities;
|
|
●
|
counterparty credit risk;
|
|
●
|
developments in oil-producing and natural gas-producing countries;
|
|
●
|
future operating results;
|
|
●
|
estimated future reserves and the present value of such reserves; and
|
|
●
|
plans, objectives, expectations and intentions contained in this Annual Report that are not historical.
|
3
All forward-looking statements speak only at the date of the filing of this Annual Report. The reader should not place undue reliance on these forward-looking statements. Although we believe that our plans, intentions and expectations reflected in or suggested by the forward-looking statements we make in this Annual Report are reasonable, we can give no assurance that these plans, intentions or expectations will be achieved. We disclose important factors that could cause our actual results to differ materially from our expectations under “Risk Factors” and “Management’s Discussion and Analysis of Financial Condition and Results of Operations” and elsewhere in this Annual Report. These cautionary statements qualify all forward-looking statements attributable to us or persons acting on our behalf. We do not undertake any obligation to update or revise publicly any forward-looking statements except as required by law, including the securities laws of the United States and the rules and regulations of the SEC.
Certain abbreviations and oil and gas industry terms used throughout this Annual Report are described and defined in greater detail under “Glossary of Oil And Natural Gas
Terms”
on page 31, and
readers
are encouraged to review that section.
Available Information
We are subject to the information and reporting requirements of the Securities Exchange Act of 1934, or the Exchange Act, under which we file periodic reports, proxy and information statements and other information with the United States Securities and Exchange Commission, or SEC. Copies of the reports, proxy statements and other information may be examined without charge at the Public Reference Room of the SEC, 100 F Street, N.E., Room 1580, Washington, D.C. 20549, or on the Internet at
http://www.sec.gov
. Copies of all or a portion of such materials can be obtained from the Public Reference Room of the SEC upon payment of prescribed fees. Please call the SEC at 1-800-SEC-0330 for further information about the Public Reference Room.
Financial and other information about PEDEVCO Corp. is available on our website (
www.pedevco.com
). Information on our website is not incorporated by reference into this report. We make available on our website, free of charge, copies of our annual report on Form 10-K, quarterly reports on Form 10-Q, current reports on Form 8-K, and amendments to those reports filed or furnished pursuant to Section 13(a) or 15(d) of the Exchange Act as soon as reasonably practicable after filing such material electronically or otherwise furnishing it to the SEC.
4
PART I
History
We were originally incorporated in September 2000 as Rocker & Spike Entertainment, Inc. In January 2001 we changed our name to Reconstruction Data Group, Inc., and in April 2003 we changed our name to Verdisys, Inc. and were engaged in the business of providing satellite services to agribusiness. In June 2005, we changed our name to Blast Energy Services, Inc. (“Blast”) to reflect our new focus on the energy services business.
During 2010, Blast's management chose to change the direction of the Company to attempt to generate operating capital from investing in oil producing properties. As a part of this shift in strategy, in September 2010, with an effective date of October 1, 2010, we closed on the acquisition of oil and gas interests in the North Sugar Valley Field located in Matagorda County, Texas, and we decided to divest our satellite services business unit, which we sold in December 2010.
On July 27, 2012, we acquired through a reverse acquisition, Pacific Energy Development Corp., a privately held Nevada corporation, which we refer to as Pacific Energy Development. As described below, pursuant to the acquisition, the shareholders of Pacific Energy Development gained control of approximately 95% of the voting securities of our company. Since the transaction resulted in a change of control, Pacific Energy Development is the acquirer for accounting purposes. In connection with the merger, which we refer to as the Pacific Energy Development merger, Pacific Energy Development became our wholly-owned subsidiary and we changed our name from Blast Energy Services, Inc. to PEDEVCO Corp. Following the merger, we refocused our business plan on the acquisition, exploration, development and production of oil and natural gas resources in the United States, with a primary focus on oil and natural gas shale plays and a secondary focus on conventional oil and natural gas plays.
Business Operations
Overview
We are an energy company engaged primarily in the acquisition, exploration, development and production of oil and natural gas shale plays in the United States, and a secondary focus on conventional oil and natural gas plays. Our current operations are located primarily in the Niobrara Shale play in the Denver-Julesburg Basin (the “DJ Basin”) in Weld and Morgan Counties, Colorado, and the Mississippian Lime play in Comanche, Harper, Barber and Kiowa Counties, Kansas. In March 2014, we expanded our DJ Basin position into the Wattenberg and Wattenberg Extension through the acquisition of additional oil and gas working interests from Continental Resources, Inc. (“Continental”), which includes approximately 14,000 net operated acres and interests in 40 wells located in Weld and Morgan Counties, Colorado, which we refer to as the “Wattenberg Asset.” We also hold an interest in the North Sugar Valley Field in Matagorda County, Texas, though we consider this a non-core asset. We have entered into agreements to acquire an approximately 34% indirect interest (of which we are required to assign 50% of such interest, or 17%, to RJ Resources, as discussed below) in a company holding an exploration agreement covering an approximately 380,000 acre oil and gas producing asset located in the Pre-Caspian Basin in Kazakhstan, which we plan to close upon receipt of required approvals from the Kazakhstan government, anticipated to be received no later than the third quarter of 2014, as described in greater detail below in “Recent Developments” – “Kazakhstan Acquisition”.
We have approximately 16,379 net acres of oil and gas properties in the DJ Basin, including 13,995 net acres in our recently acquired Wattenberg Asset, and 2,384 net acres of oil and gas properties in our Niobrara Asset. Red Hawk holds our Wattenberg Asset with interests in 40 wells, 11 of which are operated by Red Hawk, 14 are non-operated, and Red Hawk has an after-payout interest in 15, with a two week average production from the 11 operated wells since their acquisition on March 7, 2014 of approximately 434 gross BOE per day, which does not include production from two of the wells which are currently undergoing repair. We estimate that once we bring these two wells back on production, the production from the 11 operated wells will be 504 gross BOE per day. We have not yet received enough information in regards to the 14 non-operated wells to estimate their current production. Condor Energy Technology LLC (“Condor”), in which we own a 20% interest and manage with an affiliate of MIE Holdings Corporation (described in greater detail below under “Strategic Alliances” – “MIE Holdings”), operates our Niobrara Asset, including five wells in the Niobrara Asset with daily production in the month of February 2014 of approximately 240 BOE (63 BOE net). We believe our current Wattenberg Asset could contain approximately a gross total of 1,256 gross (175 net) drilling locations, and our Niobrara Asset could contain a gross total of 212 gross (81 net) drilling locations, for a combined total of 1,468 gross (256 net) possible drilling locations in the DJ Basin, based on 40 and 80 acre spacing.
5
We have approximately 7,006 gross (3,443 net acres) of oil and gas properties in the Mississippian Lime play, which we own an average of 49% working interest in and operate (the “Mississippian Asset”). We believe the Mississippian Asset could contain a total of 42 gross (21 net) drilling locations, based on 160 acre spacing.
We have also announced the entry into Kazakhstan through an agreement whereby we plan to acquire an approximate 34% indirect interest in Aral Petroleum Capital Limited Partnership (“Aral”), a Kazakhstan entity which holds a 100% operated working interest in a production license covering the contract area issued by the Republic of Kazakhstan that expires in 2034 in western Kazakhstan (the “Contract Area”), from Asia Sixth Energy Resources Limited (“Asia Sixth”), which Contract Area covers 380,000 acres within the North Block located in the Pre-Caspian Basin. Under the agreement, we plan to acquire an interest in Aral through the acquisition of a 51% interest in Asia Sixth, by way of subscription of shares of Asia Sixth, which in turn currently holds a 60% controlling interest in Aral. Asia Sixth’s interest in Aral is scheduled to increase to 66.5% following the completion of certain transactions to occur between Asia Sixth and Asia Sixth’s partner in Aral that currently holds the remaining 40% interest in Aral (the “Aral Transactions”). Upon closing and completion of the Aral Transactions, Aral will be owned 66.5% by Asia Sixth. We have also entered into an agreement with our strategic partner, RJ Resources Corp. (“RJ Resources”), pursuant to which we have agreed, at the option of RJ Resources, to either (a) provide for the issuance of the share certificate representing the shares of capital stock due from Asia Sixth representing 51% of the total issued and outstanding share capital of Asia Sixth which we have the right to purchase from Asia Sixth, to a Delaware limited liability company to be formed by us (such company, the “Nominee”) and to convey to RJ Resources fifty percent (50%) of the limited liability company interests issued by the Nominee or (b) provide for fifty percent (50%) of such Asia Sixth shares to be issued directly to RJ Resources or its designee. Upon the closing and completion of these contemplated transactions, the Company, through its ownership in Asia Sixth, will own an approximate 17% beneficial interest in Aral.
Business Strategy
Our goal is to increase shareholder value by building reserves, production and cash flows at an attractive return on invested capital. We intend to primarily engage in the acquisition, exploration, development and production of oil and natural gas resources in the United States, primarily shale oil and natural gas and secondarily conventional oil and natural gas opportunities. We intend to achieve our objectives as follows:
Aggressively drill and develop our existing acreage positions
. We plan to aggressively drill our core assets, drilling approximately 11 gross (4 net) wells on the Wattenberg Asset, two gross (0.4 net) wells on the Niobrara Asset, and three gross (1.5 net) wells in the Mississippian Lime for a total of approximately 16 gross (6 net) wells through the end of 2014, funding permitting. We believe our planned drilling schedules will allow us to begin converting our undeveloped acreage to developed acreage with production, cash flow and proved reserves.
Acquire additional oil and natural gas opportunities
. We plan to leverage our relationships and experienced acquisition team to pursue additional leasehold assets in our core areas as well as continue to pursue additional oil and natural gas interests. As described above, in March 2014 we expanded our DJ Basin position into the Wattenberg and Wattenberg Extension through the acquisition of additional oil and gas working interests from Continental, which includes approximately 14,000 net operated acres and interests in 40 wells located in Weld and Morgan Counties, Colorado. We also have an agreement in place (subject to customary closing conditions including required government approvals) for the acquisition of an approximately 34% indirect interest (including 50% (or 17% of the interest) that we are obligated to assign to RJ Resources, as discussed above) in Aral (as described below under “Recent Developments” – “Kazakhstan Acquisition”), a Kazakhstan entity which holds a 100% operated interest in a company holding an exploration agreement covering a contract area issued by the Republic of Kazakhstan in western Kazakhstan from Asia Sixth, which Contract Area covers approximately 380,000 acres within the North Block located in the Pre-Caspian Basin. This basin is one of the largest currently producing basins in Kazakhstan. We plan to close this acquisition upon receipt of required approvals from the government of Kazakhstan, anticipated to be received no later than the third quarter of 2014. We are also exploring additional oil and natural gas opportunities in our core areas, and in other areas of the United States and Asia.
Leverage expertise of management and external resources
. We plan to focus on profitable investments that provide a platform for our management expertise. We have also engaged South Texas Reservoir Alliance LLC, or STXRA, and other industry veterans as key advisors, and in September 2012 we jointly formed Pacific Energy Technology Services, LLC with STXRA, for the purpose of providing acquisition, engineering and oil drilling and completion technology services to third parties in the United States and Pacific Rim countries. As necessary, we intend to enlist external resources and talent to operate and manage our properties during peak operations.
Engage and leverage strategic alliances in Asia
. We have already entered into a strategic alliance with MIE Holdings, and we intend to partner with additional Chinese energy companies to (a) acquire producing oil field assets that could provide cash flow to help fund our U.S. development program, (b) provide technical horizontal drilling expertise for a fee, thus acquiring valuable experience and data in regards to the China shale formations and successful engineering techniques, and (c) acquire interests in Asian producing assets.
6
Limit exposure and increase diversification through engaging in joint ventures
. We own various oil and natural gas interests through joint ventures with MIE Holdings, and may in the future enter into similar joint ventures with respect to other oil and gas interests either with MIE Holdings or other partners. We believe that conducting many of our activities through partially owned joint ventures will enable us to lower our risk exposure while increasing our ability to invest in multiple ventures.
Leverage partnerships and our drilling facility for financial strength and flexibility
. Our joint venture partner, MIE Holdings, has been a strong financial partner. They have loaned us $432,433 toward the acquisition of the Mississippian Asset, which we repaid in March 2014, and $6.17 million through a short-term note to fund operations and development of the Niobrara Asset. We also recently obtained a $15.5 million drilling facility from RJ Resources for the development of our Wattenberg Asset, the drawdown of which is subject to certain requirements, and which is described in greater detail below under “Recent Developments” – “Note Purchase Agreement and Sale of Secured Promissory Notes”. We expect that proceeds from future equity offerings, internally generated cash flow, our new drilling facility, and future debt financings will provide us with the financial resources to pay off these amounts due MIE Holdings and RJ Resources and pursue our leasing and drilling and development programs through 2014. We have also met with financial institutions introduced to us by MIE Holdings and Casimir Capital L.P., our financial advisor, seeking to secure a line of credit or reserve-based lending facilities that could be used for both acquisition and development costs where needed. We cannot assure you, however, that we will be able to secure any such financing on terms acceptable to us, on a timely basis, or at all.
Competition
The oil and natural gas industry is highly competitive. We compete and will continue to compete with major and independent oil and natural gas companies for exploration opportunities, acreage and property acquisitions. We also compete for drilling rig contracts and other equipment and labor required to drill, operate and develop our properties. Most of our competitors have substantially greater financial resources, staffs, facilities and other resources than we have. In addition, larger competitors may be able to absorb the burden of any changes in federal, state and local laws and regulations more easily than we can, which would adversely affect our competitive position. These competitors may be able to pay more for drilling rigs or exploratory prospects and productive oil and natural gas properties and may be able to define, evaluate, bid for and purchase a greater number of properties and prospects than we can. Our competitors may also be able to afford to purchase and operate their own drilling rigs.
Our ability to drill and explore for oil and natural gas and to acquire properties will depend upon our ability to conduct operations, to evaluate and select suitable properties and to consummate transactions in this highly competitive environment. Many of our competitors have a longer history of operations than we have, and most of them have also demonstrated the ability to operate through industry cycles.
Competitive Strengths
We believe we are well positioned to successfully execute our business strategies and achieve our business objectives because of the following competitive strengths:
Management
. We have assembled management teams at our Company and joint venture partnerships with extensive experience in the fields of international business development, petroleum engineering, geology, petroleum field development and production, petroleum operations and finance. Several members of the team developed and ran what we believe were successful energy ventures that were commercialized at Texaco, CAMAC Energy Inc., and Rosetta Resources, while members of our team at Condor have drilled and presently manage over 2,000 oil wells in the Pacific Rim and Kazakhstan. We believe that our management team is highly qualified to identify, acquire and exploit energy resources both in the U.S. and Pacific Rim countries, particularly China.
Our management team is headed by our President and Chief Executive Officer, Frank C. Ingriselli, an international oil and gas industry veteran with over 34 years of experience in the energy industry, including as the President of Texaco International Operations Inc., President and Chief Executive Officer of Timan Pechora Company, President of Texaco Technology Ventures, and President, Chief Executive Officer and founder of CAMAC Energy Inc. Our management team also includes Chief Financial Officer and Executive Vice President Michael L. Peterson, who brings extensive experience in the energy, corporate finance and securities sectors, including as a Vice President of Goldman Sachs & Co., Chairman and Chief Executive Officer of Nevo Energy, Inc. (formerly Solargen Energy, Inc.), and a former director of Aemetis, Inc. (formerly AE Biofuels Inc.). In addition, our Senior Vice President and Managing Director, Jamie Tseng, has over 25 years of financial management and operations experience and was a co-founder of CAMAC Energy Inc., and our Executive Vice President and General Counsel, Clark R. Moore, has nearly 10 years of energy industry experience, and formerly served as acting general counsel of CAMAC Energy Inc.
7
Key Advisors
. Our key advisors include STXRA and other industry veterans. According to STXRA, the STXRA team has experience in drilling and completing horizontal wells, including over 100 horizontal wells with lengths exceeding 4,000 feet from 2010 to 2013, as well as experience in both slick water and hybrid multi-stage hydraulic fracturing technologies and in the operation of shale wells and fields. We believe that our relationship with STXRA, both directly and through our jointly-owned services company, Pacific Energy Technology Services, LLC, will supplement the core competencies of our management team and provide us with petroleum and reservoir engineering, petrophysical, and operational competencies that will help us to evaluate, acquire, develop, and operate petroleum resources into the future.
Significant acreage positions and drilling potential
. Without giving effect to the Kazakhstan acquisition opportunity, we have accumulated interests in a total of (19,784 net) acres in our existing core Wattenberg Asset, Niobrara Asset, and Mississippian Asset operating areas, each of which we believe represents a significant unconventional resource play. The majority of our interests are in or near areas of considerable activity by both major and independent operators, although such activity may not be indicative of our future operations. Based on our current acreage position, and without giving effect to the Kazakhstan acquisition opportunity, we estimate there could be up to 1,489 potential gross drilling locations on our acreage, and we anticipate drilling approximately 16 gross (6 net) wells through the end of 2014, leaving us a substantial drilling inventory for future years.
Marketing
The prices we receive for our oil and natural gas production fluctuate widely. Factors that cause price fluctuation include the level of demand for oil and natural gas, weather conditions, hurricanes in the Gulf Coast region, natural gas storage levels, domestic and foreign governmental regulations, the actions of OPEC (Organization of the Petroleum Exporting Countries), price and availability of alternative fuels, political conditions in oil and natural gas producing regions, the domestic and foreign supply of oil and natural gas, the price of foreign imports and overall economic conditions. Decreases in these commodity prices adversely affect the carrying value of our proved reserves and our revenues, profitability and cash flows. Short-term disruptions of our oil and natural gas production occur from time to time due to downstream pipeline system failure, capacity issues and scheduled maintenance, as well as maintenance and repairs involving our own well operations. These situations can curtail our production capabilities and ability to maintain a steady source of revenue for our company. In addition, demand for natural gas has historically been seasonal in nature, with peak demand and typically higher prices during the colder winter months. See “Risk Factors.”
Oil
. Our crude oil is generally sold under short-term, extendable and cancellable agreements with unaffiliated purchasers based on published price bulletins reflecting an established field posting price. As a consequence, the prices we receive for crude oil move up and down in direct correlation with the oil market as it reacts to supply and demand factors. Transportation costs related to moving crude oil are also deducted from the price received for crude oil.
We have entered into month-to-month crude oil purchase contract with two third party buyers, pursuant to which one of the buyers purchases the crude oil produced from our initial five wells in the Niobrara Asset, periodically at a price per barrel equal to the average monthly “Light Sweet Crude Oil” contract price as reported by NYMEX from the first day of the delivery month through the last day of the delivery month, less $12.90 currently per barrel for transportation costs, and the other buyer purchases the crude oil produced from our 11 wells operated on our Wattenberg Asset, periodically at a price per barrel equal to the average monthly “Light Sweet Crude Oil” contract price as reported by NYMEX from the first day of the delivery month through the last day of the delivery month, less $11.50 currently per barrel for transportation costs.
Natural Gas
.
Our natural gas is sold under both long-term and short-term natural gas purchase agreements. Natural gas produced by us is sold at various delivery points at or near producing wells to both unaffiliated independent marketing companies and unaffiliated mid-stream companies. We receive proceeds from prices that are based on various pipeline indices less any associated fees for processing, location or transportation differentials.
We have entered into a Gas Purchase Contract, dated June 1, 2012, with DCP Midstream, LP, which we refer to as DCP, pursuant to which we have agreed to sell, and DCP has agreed to purchase, all gas produced from our Niobrara Asset wells located in Weld County, Colorado, at a purchase price equal to 83% of the net weighted average value for gas attributable to us that is received by DCP at its facilities sold during the month, less a $0.06/gallon local fractionation fee, for a period of ten years, terminating June 1, 2022.
In connection with our acquisition of the Wattenberg Asset from Continental in March 2014, we became a party to a Gas Purchase Contract, dated December 1, 2011, with DCP, pursuant to which we have agreed to sell, and DCP has agreed to purchase, all gas produced from six (6) of our Wattenberg Asset wells and surrounding lands located in Weld County, Colorado, at a purchase price equal to 83% of the net weighted average value for gas attributable to us that is received by DCP at its facilities sold during the month, less a $0.06/gallon local fractionation fee, for a period of ten years, terminating December 1, 2021.
8
In connection with our acquisition of the Wattenberg Asset from Continental in March 2014, we also became a party to a Gas Purchase Agreement, dated April 1, 2012, as amended, with Sterling Energy Investments LLC (“Sterling”), pursuant to which we have agreed to sell, and Sterling has agreed to purchase, all gas produced from five (5) of our Wattenberg Asset wells and surrounding lands located in Weld County, Colorado, at a purchase price equal to 85% of the revenue received by Sterling from the sale of gas after processing at Sterling’s plant that is attributable to us during the month, less a $0.50/Mcf gathering fee, subject to escalation, for a period of twenty years, terminating April 1, 2032.
We endeavor to assure that title to our properties is in accordance with standards generally accepted in the oil and natural gas industry. Some of our acreage will be obtained through farmout agreements, term assignments and other contractual arrangements with third parties, the terms of which often will require the drilling of wells or the undertaking of other exploratory or development activities in order to retain our interests in the acreage. Our title to these contractual interests will be contingent upon our satisfactory fulfillment of these obligations. Our properties are also subject to customary royalty interests, liens incident to financing arrangements, operating agreements, taxes and other burdens that we believe will not materially interfere with the use and operation of or affect the value of these properties. We intend to maintain our leasehold interests by making lease rental payments or by producing wells in paying quantities prior to expiration of various time periods to avoid lease termination.
Merger with Pacific Energy Development
On July 27, 2012, in order to carry out our business plan, we acquired through a reverse acquisition, Pacific Energy Development Corp., a privately held Nevada corporation, which we refer to as Pacific Energy Development. As described below, pursuant to the acquisition, the shareholders of Pacific Energy Development gained control of approximately 95% of the voting securities of our company. Since the transaction resulted in a change of control, Pacific Energy Development is the acquirer for accounting purposes. In connection with the merger, which we refer to as the Pacific Energy Development merger, Pacific Energy Development became our wholly-owned subsidiary and we changed our name from Blast Energy Services, Inc. to PEDEVCO CORP.
As part of the Pacific Energy Development merger, we issued to the shareholders of Pacific Energy Development (a) 5,972,420 shares of our common stock, (b) 6,538,892 shares of our newly created Series A preferred stock, (c) warrants to purchase an aggregate of 373,334 shares of our common stock and 230,861 shares of our Series A preferred stock at various exercise prices, and (d) options to purchase an aggregate of 1,411,667 shares of our common stock at various exercise prices. Pursuant to the Pacific Energy Development merger, all of our shares of preferred stock that were outstanding prior to the Pacific Energy Development merger were converted into shares of common stock on a one-for-one basis and we effected a reverse stock split of our common stock on a 1 for 112 shares basis effective on July 30, 2012. All share and per share amounts used in this Annual Report have been restated to reflect this reverse stock split and a further reverse split in the ratio of 1 for 3 affected on April 23, 2013.
At the effective time of the Pacific Energy Development merger, (a) Pacific Energy Development owned the Niobrara and Eagle Ford assets and had begun discussions regarding the Mississippian acquisition opportunity, and (b) our primary business was developing the North Sugar Valley Field asset. As a result of our acquisition of Pacific Energy Development in the Pacific Energy Development merger, we acquired these assets and opportunities of Pacific Energy Development.
9
The following chart reflects our current core subsidiaries and joint ventures:
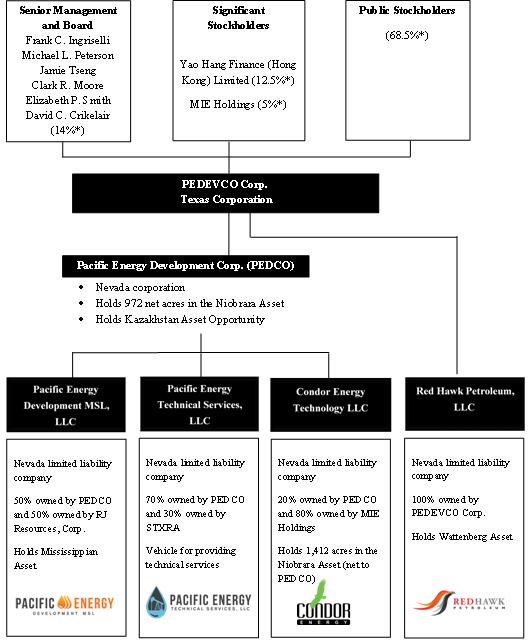
*Represents percentage of voting power based on 26,539,013 shares of common stock outstanding as of March 28, 2014, and excludes voting power to be acquired upon exercise of outstanding options or warrants.
Oil and Gas Properties
We believe that the Wattenberg, Niobrara and Mississippian Shale plays represent among the most promising unconventional oil and natural gas plays in the U.S. We plan to continue to seek additional acreage proximate to our currently held core acreage. Our strategy is to be the operator, directly or through our subsidiaries and joint ventures, in the majority of our acreage so we can dictate the pace of development in order to execute our business plan. The majority of our capital expenditure budget for the period from January 2014 to December 2014 will be focused on the acquisition, development and expansion of these formations.
10

December 31, 2013 and our drilling capital budget with respect to this acreage from January 1, 2014 to December 31, 2014, subject to availability of capital.
|
Drilling & Land Acquisition Capital Budget
January 1, 2014 - December 31, 2014
|
||||||||||||||||||||||||||||||||||||||
|
Current Core Assets:
|
Total
Gross
Acreage
|
Approximate
Ownership
Interest
|
Net Acres
|
Acre Spacing
|
Potential Gross -Drilling
Locations (3)
|
Gross Wells
|
Net Wells
|
Gross Costs per Well (4)
|
Capital Cost to
the Company
(4)
|
|||||||||||||||||||||||||||||
|
Wattenberg (1)
|
27,914
|
50.0
|
%
|
13,957
|
40/80(5)
|
1,256
|
11
|
4.00
|
$
|
3,800,000
|
$
|
15,200,000
|
||||||||||||||||||||||||||
|
Niobrara (2)
|
9,067
|
26.3
|
%
|
2,384
|
80
|
212
|
2
|
0.40
|
$
|
3,800,000
|
$
|
1,520,000
|
||||||||||||||||||||||||||
|
Mississippian (3)
|
7,006
|
49.1
|
%
|
3,443
|
160
|
21
|
3
|
1.47
|
$
|
3,500,000
|
$
|
5,145,000
|
||||||||||||||||||||||||||
|
Current Assets
|
43,987
|
19,784
|
1,489
|
16
|
5.87
|
$
|
21,865,000
|
|||||||||||||||||||||||||||||||
|
(1)
|
We acquired the Wattenberg Asset on March 7, 2014, with an effective date of December 1, 2013. The leased acreage in the Wattenberg Asset covers 178 sections (640 acres per section). Our gross acreage is the acreage purchased from Continental and currently held 50% by the Company and 50% by RJ Resources.
|
|
(2)
|
As discussed below, we have an average 26.3% net ownership interest in the leased acreage in the Niobrara Asset given our average 10.72% interest in certain leases held directly by us plus our 20% interest in Condor.
|
|
(3)
|
Potential gross drilling locations are calculated using the acre spacings specified for each area in the table and adjusted assuming forced pooling in the Niobrara. Colorado, where the Niobrara Asset is located, allows for forced pooling, which may create more potential gross drilling locations than acre spacing alone would otherwise indicate. 40 acre spacing assumed for Wattenberg acreage and 80 acre spacing is assumed for Wattenberg Extension acreage.
|
|
(4)
|
Costs per well are gross costs while capital costs presented are net to the Company’s working interests.
|
|
(5)
|
40 acre spacing is assumed for Wattenberg acreage and 80 acre spacing is assumed for Wattenberg Extension acreage. |
11
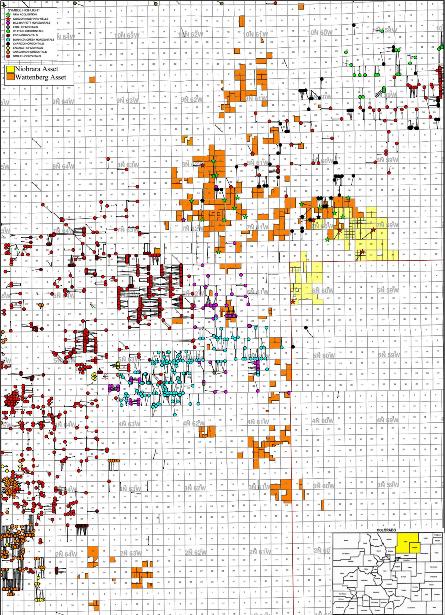
Wattenberg Asset
We directly hold all of our interests in the Wattenberg Asset through our wholly-owned subsidiary, Red Hawk Petroleum, LLC (“Red Hawk”). These interests are located in Weld and Morgan Counties, Colorado. Red Hawk is the operator of our Wattenberg Asset.
Niobrara Asset
Our interests in the Niobrara Asset consist of the following:
|
●
|
We directly hold a portion of our interest in the Niobrara Asset through our wholly-owned subsidiary, Pacific Energy Development Corp. These interests are all located within Weld County, Colorado.
|
|
●
|
We indirectly hold a portion of our interest in the Niobrara Asset by virtue of our 20% ownership in Condor Energy Technology LLC (“Condor”), which is 80% owned by a subsidiary of our partner, MIE Holdings Corporation. These interests are all located within Weld and Morgan Counties, Colorado. Condor is the operator of our Niobrara Asset (both directly and indirectly owned).
|
Mississippian Asset
We hold all of our interests in the Mississippian Asset through Pacific Energy Development MSL, LLC, which is 50% owned by us, and 50% owned by our strategic partner, RJ Resources. These interests are all located within Comanche, Harper, Barber and Kiowa Counties, Kansas.
North Sugar Valley Asset (non-core asset)
We directly hold all of our interests in the North Sugar Valley asset. These interests are all located within Matagorada County, Texas.
Strategic Alliances
MIE Holdings
Through the relationships developed by our founder and Chief Executive Officer, Frank Ingriselli, we formed a strategic relationship with MIE Holdings Corporation (Hong Kong Stock Exchange code: 1555.HK), one of the largest independent upstream onshore oil companies in China, which we refer to as MIE Holdings, to assist us with our plans to develop unconventional shale properties. According to information provided by MIE Holdings, MIE Holdings has drilled and currently operates over 2,000 oil wells in China and brings extensive drilling and completion experience and expertise, as well as a strong geological team. MIE Holdings has also been a significant investor in our operations, and our current Niobrara Asset is held in part by Condor, which is a Nevada limited liability company owned 20% by us and 80% by an affiliate of MIE Holdings.
Although our initial focus is on oil and natural gas opportunities in the United States, we plan to use our strategic relationship with MIE Holdings and our experience in operating U.S.-based shale oil and natural gas interests to acquire, explore, develop and produce oil and natural gas resources in Pacific Rim countries, with a particular focus on China. We intend to use our existing or future joint ventures with MIE Holdings to acquire additional shale properties in the United States and in China, where MIE Holdings and other partners have extensive experience working in the energy sector.
STXRA
On October 4, 2012, we established a technical services subsidiary, Pacific Energy Technology Services, LLC, which is 70% owned by us and 30% owned by STXRA, through which we plan to provide acquisition, engineering, and oil drilling and completion technology services in joint cooperation with STXRA in the United States and Pacific Rim countries, particularly in China. While Pacific Energy Technology Services, LLC currently has no operations, only nominal assets and liabilities and limited capitalization, we anticipate actively developing this venture throughout 2014.
STXRA is a consulting firm specializing in the delivery of petroleum resource acquisition services and practical engineering solutions to clients engaged in the acquisition, exploration and development of petroleum resources. It was founded by its principals in conjunction with the forming of our company in order to provide technical and operating services to us. In April 2011, we entered into an agreement of joint cooperation with STXRA in an effort to identify suitable energy ventures for acquisition by us, with a focus on plays in shale oil and natural gas bearing regions in the United States. According to information provided by STXRA, the STXRA team has experience in their collective careers of drilling and completing horizontal wells, including over 100 horizontal wells with lengths exceeding 4,000 feet from 2010 to 2013, as well as experience in both slick water and hybrid multi-stage hydraulic fracturing technologies and in the operation of shale wells and fields. We believe that our relationship with STXRA, both directly and through our jointly-owned Pacific Energy Technology Services LLC services company, will supplement the core competencies of our management team and provide us with petroleum and reservoir engineering, petrophysical, and operational competencies that will help us to evaluate, acquire, develop and operate petroleum resources in the future.
12
RJ Resources
On March 7, 2014, in connection with our acquisition of the Wattenberg Asset, we entered into a $50 million 3-year term debt facility with RJ Resources, a subsidiary of a New York-based investment management group with more than $1.3 billion in assets under management specializing in resource investments. As part of the transaction, RJ Resources acquired (i) an equal 13,995 net acre position in the assets acquired from Continental, (ii) 50% of our pending interest in the Kazakhstan asset, and (iii) 50% of our ownership interest in (a) Pacific Energy Development MSL, LLC, which holds our Mississippian Asset, thereby making RJ Resources a 50% working interest partner with us in the development of our Wattenberg Asset, (b) the Kazakhstan Asset which we are in the process of acquiring, and (c) our Mississippian Asset, allowing us to undertake a more aggressive drilling and development program in 2014 and beyond.
13
Our Core Areas
The majority of our capital expenditure budget for the period from January to December 2014 will be focused on the acquisition and development of our core oil and natural gas properties located in the Wattenberg Asset, Niobrara Asset and Mississippian Asset. The following paragraphs summarize each of these core areas. For additional information, see “Management’s Discussion and Analysis of Financial Condition and Results of Operations-Liquidity and Capital Resources” and “Business.”
14
Wattenberg Asset
On March 7, 2014, through our wholly-owned subsidiary Red Hawk, we completed the acquisition of 13,995 net acres of oil and gas properties covering approximately 178 sections, and interests in 40 wells located in the DJ Basin, Colorado, from Continental for approximately $28.5 million in cash, and the assumption of approximately $845,000 of suspense accounts payable to royalty owners, mineral owners and other persons with an interest in production associated with the assets acquired, pertaining to oil and gas produced, which Continental had not paid as of closing. This acreage, which we refer to as the Wattenberg Asset, is located in the Wattenberg and Wattenberg Extension Areas of the DJ Basin in Weld and Morgan Counties, Colorado. Of these 40 wells, 11 are operated by Red Hawk, 14 are non-operated, and we will have an after-payout interest in 15. All of Continental’s leases and related rights, oil and gas and other wells, equipment, easements, contract rights, and production effective as of the December 1, 2013 effective date of the agreement were included in the purchase.
In order to finance the acquisition of the Wattenberg Asset, and provide us with sufficient capital to immediately commence a meaningful development program covering this new acreage, we entered into a 3-year term debt facility with RJ Resources as described above under “RJ Resources”.
We plan to drill approximately 11 gross (4 net) horizontal wells on our Wattenberg Asset in 2014, utilizing the $15.5 million drilling facility provided by RJ Resources, cash on hand, proceeds from future equity offerings, internally generated cash flow, and future debt financings to aggressively develop this new asset.
Niobrara Asset
As of December 31, 2013, we held 2,384 net acres in oil and natural gas properties covering approximately 9,067 gross acres that are located in Morgan and Weld Counties, Colorado that include the Niobrara formation, which we refer to as the Niobrara Asset. We hold 972 of our Niobrara leased acreage directly, and hold the remaining 1,412 acres through our ownership in Condor, which holds 7,058 acres in the leased acreage in the Niobrara Asset.
Condor is designated as the operator of the Niobrara Asset. The day-to-day operations of Condor are managed by our management, and Condor’s Board of Managers is comprised of our President and Chief Executive Officer, Mr. Frank Ingriselli, and two designees of MIE Holdings. In addition, MIE Holdings has loaned us approximately $6.17 million to fund operations and development of the Niobrara Asset.
Based on approximately 250 square miles of 3D seismic data covering the Niobrara asset, we estimate that there are up to 212 potential gross drilling locations in the Niobrara Asset, with 2 gross well locations identified for our 2014 Niobrara development plan. We believe that the Niobrara Asset affords us the opportunity to participate in this emerging play at an early stage, with a position in the Denver-Julesburg Basin adjacent to significant drilling activity.
During 2012, Condor completed drilling the initial horizontal well on the Niobrara asset, the FFT2H, in April 2012, reaching a total combined vertical and horizontal depth of 11,307 feet. Halliburton performed a 20-stage frac of the well in mid-June 2012, with the well completed in July 2012 with an initial production rate of 437 BOE per day from the Niobrara formation. Condor completed drilling its second horizontal well on the Niobrara asset, the Waves 1H, in November 2012, drilling to 11,114 feet measured depth (6,200 true vertical foot depth) in eight days. The 4,339 foot lateral section was completed in 18 stages by Halliburton in February 2013, and the well tested at an initial production rate of 528 barrels of oil per day and 360 Mcf per day (588 BOE per day) from the Niobrara “B” Bench target zone. Condor also completed drilling its third horizontal well on the Niobrara asset, the Logan 2H, in December 2012 to 12,911 feet measured depth (6,112 true vertical depth) in nine days. The 6,350 foot lateral section was completed in 25 stages by Halliburton in January 2013, and tested at an initial production rate of 522 barrels of oil per day and 360 Mcf per day (585 BOE per day) from the Niobrara “B” Bench target zone.
During 2013, Condor completed drilling its fourth horizontal well on the Niobrara asset, the State 16-7-60 1H well, in July 2013, reaching a total vertical depth of approximately 6,260 feet and total measured depth of approximately 10,630 feet. The well tested at an initial production rate of 480 barrels of oil per day (bopd) and 360 thousand cubic feet of gas per day (mcfgpd) (540 barrels of oil equivalent per day (boepd)), during a 4-hour test of the Niobrara “B” Bench target zone. Following removal of a down hole sand screen which was restricting flow, the well reached a peak production rate of 972 bopd and 800 mcfgd (1,105 boepd), during a 4-hour test from the Niobrara “B” Bench target zone. Condor also completed drilling its fifth horizontal well, the Wickstrom 18-2H well, located in Morgan County, Colorado, in August reaching a total vertical depth of approximately 6,125 feet and total measured depth of approximately 14,706 feet. The well tested an initial production rate of 414 bopd and 408 mcfgd (482 boepd), during a 4-hour test from the Niobrara “B” Bench target zone. The well was tested using a limited rate flowback technique to reduce frac sand entry into the well bore and test the concept of EUR increases through lower drawdown similar to the practice employed in the Eagle Ford Shale, resulting in an initial production rate at 80% of its anticipated full production potential.
15
Based on publicly available information, we believe that average drilling and completion costs for wells in the Niobrara core area which, for purposes of industry comparisons, we define as Morgan and Weld Counties, Colorado, have ranged between $3.6 million and $6.0 million per well with average estimated ultimate recoveries, or EURs, of 100,000 to 300,000 BOE per well and initial 30-day average production of 300 to 600 BOE per day per well. The costs incurred, EURs and initial production rates achieved by others may not be indicative of the well costs we will incur or the results we will achieve from our wells.
Recently, there has been significant industry activity in the Niobrara Shale play. The most active operators offsetting our acreage position include Carrizo Oil and Gas, Inc. (NASDAQ: CRZO), Continental Resources, Inc. (NYSE: CLR), EOG Resources (NYSE: EOG), Synergy Resources (NYSE: SYRG), Anadarko Petroleum (NYSE: APC), SM Energy (NYSE: SM), Noble Energy (NYSE: NBL), Chesapeake Energy (NYSE: CHK), Whiting Petroleum (NYSE: WLL), Quicksilver Resources (NYSE: KWK), MDU Resources (NYSE: MDU), and Bill Barrett Corp. (NYSE: BBG).
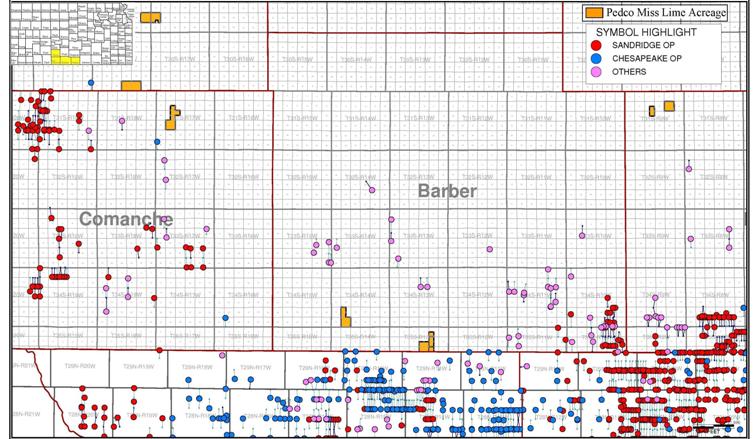
Mississippian Asset
Effective March 15, 2013, we acquired an average 97% working interest in the Mississippian Lime covering approximately 7,006 gross (6,763 net) acres located in Comanche, Harper, Barber and Kiowa Counties, Kansas, which we refer to as the Mississippian Asset, and approximately 10.5 square miles of related 3-D seismic data. Also effective March 15, 2013, we acquired certain additional working interests in the same acreage located in Comanche, Harper, and Kiowa Counties, Kansas, bringing our average working interest to 98% in the Mississippian asset covering an aggregate of approximately 7,006 gross (6,885 net) acres.
Effective March 7, 2014, pursuant to a Membership Interest Purchase Agreement (the “Membership Purchase Agreement”) entered into by and between Pacific Energy Development Corp. (“PEDCO”) and RJ Resources, PEDCO agreed to sell 50% of PEDCO MSL Merger Sub LLC, LLC, a Nevada limited liability company (“MSL Merger Sub”), which was wholly-owned by PEDCO immediately prior to the transactions contemplated by the Membership Purchase Agreement, to RJ Resources.
The Membership Purchase Agreement contained customary representations, warranties, covenants and requirements for PEDCO to indemnify RJ Resources, subject to the terms and conditions of the Membership Purchase Agreement. Immediately subsequent to the closing of the transactions contemplated by the Membership Purchase Agreement, PEDCO’s wholly-owned subsidiary, Pacific Energy Development MSL, LLC (“PEDCO MSL”) and MSL Merger Sub, entered into an Agreement and Plan of Merger (the “Plan of Merger”), pursuant to which PEDCO MSL merged with and into MSL Merger Sub, with MSL Merger Sub being the surviving entity in the merger, and concurrently therewith effecting a name change to Pacific Energy Development MSL, LLC, which was effected pursuant to the filing of Articles of Merger with the Secretary of State of Nevada and effective March 10, 2014. The effective result of the Membership Purchase Agreement and Plan of Merger is that RJ Resources now owns 50% of PEDCO MSL. As a result of the transactions effected by the Membership Purchase Agreement and Plan of Merger, RJ Resources acquired effective ownership of 50% of the Mississippian Asset, with the Company now owning an average 49% working interest in the Mississippian Asset covering an aggregate of approximately 7,006 gross (3,443 net) acres.
16
The Mississippian acquisition is structured as a primary term assignment to us by Berexco of the leasehold interests which expires on December 29, 2014. If we drill at least three (3) horizontal wells on these leasehold interests during this primary term, then we have the option, in our sole discretion, to extend the primary term with respect to some or all of the leases subject to the assignment for an additional one (1) year period upon payment to Berexco of an additional $200 per net acre covered by the leases upon which the option is exercised. If we complete a commercially producing well during the primary or extended terms, then Berexco shall assign such leases to us for as long as the wells produce in paying quantities, with each horizontal well of at least 4,000 feet in length holding 320 acres covered by the leases, each short horizontal well with a length of between less than 4,000 feet and at least 2,000 feet in length holding 160 acres, and each vertical well holding 10 acres. Berexco shall retain an overriding royalty interest equal to the positive difference, if any, obtained by subtracting existing leasehold burdens from 22.5% before payout and 25% after payout (reduced to the extent Berexco assigns less than a 100% working interest to us). For purposes of the Mississippian agreement, “payout” is defined as such time, on a well by well basis, when a well has sold the following specified barrels of oil equivalent (“BOE”), (utilizing a conversion factor for gas sales of 8 Mcf per 1 barrel of oil): for a vertical well, ten thousand (10,000) BOE; for a short horizontal well: twenty-five thousand (25,000) BOE; and for a horizontal well: fifty thousand (50,000) BOE.
We serve as the operator of the Mississippian Asset, which includes both undeveloped and held-by-production (HBP) positions. We anticipate drilling the first three wells on the Mississippian Asset in 2014. The Mississippian oil play is one of the latest oil plays that have recently captured attention in the industry, and we believe that there is an opportunity to acquire additional interests in this emerging play on attractive terms.
Our Non-Core Area
North Sugar Valley Field Asset
We acquired the North Sugar Valley asset in Matagorda County, Texas in connection with our merger with Blast, representing an approximately 65% working interest (net revenue interest of approximately 50%) in three wells, the Millberger #1, Millberger #2 and Oxbow #1 wells. Our 2013 year-end reserve report estimates contain approximately 9,762 barrels of proved oil reserves net to the interest we acquired.
Sun Resources Texas, Inc. (“Sun”), a privately-held company based in Longview, Texas, is the operator of the properties. Sun retains a 1% working interest in the wells.
During late 2011 and early 2012, the down-hole equipment on the Oxbow #1 well began to fail which eventually caused the well to be deemed uneconomic. In late 2013, the Millberger #2 well began to have problems and work was performed in December 2013 to repair the well. After the work was completed the well failed again and in January, 2014 it was determined that there was a casing failure and Sun presented an AFE to seek to work over the well. We went non-consent on that AFE and Sun is researching and plans to present another plan and AFE to the working interest parties. The Millberger #1 continues to produce and we will continue to review our options with respect to the Millberger #2 and all three wells, including reviewing divestiture options as this is a non-core asset.
Recent Developments
Kazakhstan Acquisition
On September 16, 2013, we entered into a Share Subscription Agreement to acquire an approximate 51% ownership in Asia Sixth, which holds an approximate 60% ownership interest in Aral. Aral holds a 100% operated working interest in a production license issued by the Republic of Kazakhstan that expires in 2034 in western Kazakhstan (the “Contract Area”). The Contract Area covers 380,000 acres within the North Block located in the Pre-Caspian Basin. This basin is the largest currently producing basin in Kazakhstan.
17
Under the agreement, we plan to acquire an interest in Aral through the acquisition of a 51% interest in Asia Sixth, by way of subscription of shares of Asia Sixth, which in turn currently holds a 60% controlling interest in Aral. Asia Sixth’s interest in Aral is scheduled to increase to 66.5% following the completion of certain transactions to occur between Asia Sixth and Asia Sixth’s partner in Aral that currently holds the remaining 40% interest in Aral (the “Aral Transactions”). Upon closing and completion of the Aral Transactions, Aral will be owned 66.5% by Asia Sixth.
On March 7, 2014, the Company and RJ Resources entered into the Asia Sixth Purchase Agreement (the “Asia Sixth Agreement”), pursuant to which we agreed, at the option of RJ Resources, to either (a) provide for the issuance of the share certificate representing the shares of capital stock due from Asia Sixth representing 51% of the total issued and outstanding share capital of Asia Sixth (the “Subscription Shares”), which we have the right to purchase pursuant to the Shares Subscription Agreement, to a Delaware limited liability company to be formed by us (such company, the “Nominee”) and to convey to RJ Resources fifty percent (50%) of the limited liability company interests issued by the Nominee or (b) provide for fifty percent (50%) of such Subscription Shares to be issued directly to RJ Resources or its designee.
Upon closing and completion of the transactions contemplated by the Share Subscription Agreement and Asia Sixth Agreement, we, through our approximate 26% ownership in Asia Sixth, will own an approximate 17% beneficial interest in Aral. The closing of the transaction contemplated by the Share Subscription Agreement is anticipated to occur in September 2014, subject to the satisfaction of certain customary closing conditions including the approval of the Agency of the Republic of Kazakhstan for the Protection of Competition and the Ministry of Oil and Gas of the Republic of Kazakhstan (“MOG”), and the MOG’s waiver of its pre-emptive purchase right with respect to the transaction, and the closing of the transaction contemplated by the Asia Sixth Agreement is anticipated to occur within approximately one (1) year thereafter, similarly subject to the satisfaction of certain customary closing conditions including the approval of the Agency of the Republic of Kazakhstan for the Protection of Competition and the MOG, and the MOG’s waiver of its pre-emptive purchase right with respect to the transaction. In addition, our ability to pay the final closing payment (if and to the extent due) is contingent upon our securing sufficient financing, of which there can be no assurances.
We have paid an initial deposit of $8 million in September 2013 and a subsequent deposit of $2 million on October 1, 2013 to Asia Sixth, and we were required to increase our deposit by up to $10 million to a total of $20 million contingent upon receipt of payment in full from an investor under a promissory note maturing in December 2013. The investor failed to pay the $10 million balance due under the Note by December 1, 2013, On December 1, 2013, the Company granted a verbal extension to the investor pending further discussions regarding the investment. Following discussions with the investor, the investor elected to forego making further investment. Accordingly, on March 7, 2014, the Company notified the investor that, effective immediately, the Escrowed Shares and Escrowed Warrants were rescinded as permitted pursuant to the terms of the Note, and the Note was cancelled and forgiven, with no further action required by the investor (the “Cancellation”). The stock subscription receivable related to 3,333,333 shares of common stock and 999,999 warrants for shares of common stock in the amount of $10 million was extinguished as of March 7, 2014. The rescission of the note has no net effect on us or our obligations under the Share Subscription Agreement because (a) if such note was paid in full we would have been required to pay such funds directly to Asia Sixth; and (b) the result of such funds not being paid only results in a decrease in the required deposit due to Asia Sixth.
The $10 million deposit is subject to full refund to us in the event the transaction does not close, other than as a result of our material uncured breach, provided, however, that pursuant to the Asia Sixth Agreement, if any part of the $10 million deposit previously paid by us is returned to us, 50% of any such returned funds must be paid to RJ Resources. These funds will also be used, in part, to recomplete and rework currently producing wells with the goal of significantly increasing their production rates. Based on how these wells perform, at closing, we shall owe to Asia Sixth a final closing payment equal to an additional: (i) $20 million if the daily average volume of oil produced by Aral over a specified 30 day period (the “Target Volume”) equals or exceeds 1,500 barrels of oil per day (“BOPD”); (ii) $15 million if the Target Volume equals or exceeds 1,000 BOPD but is less than 1,500 BOPD; or (iii) $0 due if the Target Volume comes in less than 1,000 BOPD. Pursuant to the Asia Sixth Agreement, RJ Resources is obligated to pay 50% of any final closing payment due to Asia Sixth.
Upon closing, we and the other shareholders of Asia Sixth will enter into a shareholders agreement, pursuant to which the shareholders will agree to certain restrictions on the transfer of their interests in Asia Sixth, certain pre-emption rights in the event a shareholder desires to transfer its interests in Asia Sixth, certain information rights, and certain other rights, including, but not limited to, certain management and control provisions, including: (i) our right to nominate two (2) of the five (5) directors of Asia Sixth, subject to our maintaining at least a 25% ownership of Asia Sixth; (ii) our right to nominate one (1) additional of the five (5) directors of Asia Sixth, subject to our maintaining at least a 51% ownership of Asia Sixth; (iii) our right to designate the Chairman of Asia Sixth from among its directors appointed to the Asia Sixth Board; and (iv) the appointment of two (2) of the Asia Sixth directors designated by us to the five (5) member Supervisory Council of Aral.
18
In February 2014, we were informed by Aral that in December 2013 the Central Development Committee of the Republic of Kazakhstan approved the development plan proposed by Aral for the development of its 2,199 acre contract area located in the East Zhagabulak Block oilfield, thereby officially moving the oilfield into the development stage under Aral's existing production license issued by the Republic of Kazakhstan. Under Kazakh law, a government-approved development plan is necessary to commence formal oil production under a production license. With receipt of this approval, Aral now formally enters into the production stage, which expires in 2034.
Following the previously announced completion of two target zones in wells #306 and #315, the asset has recently been producing approximately 1,522 barrels of oil equivalent per day (259 boepd to our 17% net interest) at approximately 50% choke from these two wells. Production was recently voluntarily halted by Aral pending receipt of a required gas-flaring permit or finalization of a gas off-take agreement for the sale of gas produced from the asset, following which Aral plans to commence commercial production within the coming months.
Wattenberg Asset Acquisition
On January 21, 2014, Red Hawk entered into a Purchase and Sale Agreement (“Purchase Agreement”) with Continental, pursuant to which we agreed to acquire Continental’s right, title and interest in the Wattenberg Asset, representing approximately 28,727 net acres of oil and gas properties and interests in 40 wells located in the DJ Basin, Colorado, including approximately 2,200 net acres in the prolific Wattenberg Area, for $30 million in cash (subject to adjustment as provided in the Purchase Agreement)(the “Purchase Price” and the “Continental Acquisition”). The acreage, located in the Wattenberg and Wattenberg Extension Areas in the DJ Basin, includes approximately 28,241 net acres located in Weld County, Colorado and approximately 486 net acres located in Morgan County, Colorado. Of these 40 wells, 11 are operated, 14 are non-operated, and we will have an after-payout interest in 15. All of Continental’s leases and related rights, oil and gas and other wells, equipment, easements, contract rights, and production effective as of the December 1, 2013 effective date of the agreement were included in the purchase.
We paid $1.5 million of the Purchase Price as a deposit upon entering into the Purchase Agreement (the “Deposit”). The final Purchase Price after adjustments as described in the Purchase Agreement was $28,521,822, leaving $27,031,822 due to Continental after the payment of the Deposit (the “Final Purchase Price”), provided that we also assumed an obligation in connection with approximately $845,000 of suspense accounts payable to royalty owners, mineral owners and other persons with an interest in production associated with the assets acquired, pertaining to oil and gas produced, which Continental had not paid as of closing.
On March 7, 2014, we paid the Final Purchase Price, closed the Purchase Agreement and acquired the Wattenberg Asset (representing an adjusted total of 27,990 net acres at closing). Immediately upon closing, we transferred 50% of the Wattenberg Asset to RJ Resources as additional consideration for agreeing to provide the debt financing required to acquire the Wattenberg Asset, and to provide the $15.5 million drilling facility for development of the Wattenberg Asset in 2014 and going forward, as described in greater detail below under “Recent Developments” – “Note Purchase Agreement and Sale of Secured Promissory Notes”.
Eagle Ford Asset Sale
On March 29, 2012, we acquired Excellong E&P-2, Inc., a Texas corporation for a total purchase price of $3.75 million. Excellong E&P-2’s sole asset was an approximately 8% working interest in certain oil and gas leases covering approximately 1,650 net acres in the Leighton Field located in McMullen County, Texas, which is currently producing oil and natural gas from the Eagle Ford shale formation. This area is currently producing oil and natural gas from three wells, but the remainder of the acreage is under development. We subsequently transferred these assets to White Hawk Petroleum, LLC (“White Hawk”), which was 50% owned by us and 50% owned by MIE Jurassic Energy Corporation, a subsidiary of MIE Holdings, or MIEJ.
On December 20, 2013, White Hawk entered into a series of transactions pursuant to which MIEJ divested its 50% share of interests in the assets held through White Hawk to a third party, and withdrew from White Hawk as a member thereof effective December 31, 2013, with our effective interests in the Eagle Ford shale assets remaining unchanged and unaffected by the transactions. As a result of the transactions, described in greater detail below under “Recent Developments” – “Eagle Ford Sale”, White Hawk divested 50% of its assets and we became the 100% owner of White Hawk.
On February 19, 2014, White Hawk entered into and closed a Purchase and Sales Agreement (the “Sale Agreement”) with Millennial PDP Fund IV, LP (“Millennial”), pursuant to which White Hawk sold its remaining interests in the Eagle Ford shale play to Millennial for net proceeds of $2,718,158 in cash. Pursuant to the sale agreement (which included customary indemnification requirements and representations and warranties of the parties), the sale had an effective date of November 1, 2013, and Millennial delivered to White Hawk the sale consideration on February 27, 2014.
19
Issuance and Sale of 3,250,000 Shares in December 2013 Underwritten Public Offering
On December 9, 2013, we announced the pricing of our underwritten public offering of an aggregate of 3,250,000 shares of common stock at price of $2.25 per share to the public (the "December 2013 Offering"). The underwriters in the offering were granted a 45-day option to purchase up to 487,500 shares of common stock to cover over-allotments, of which there were none. On December 13, 2013, we closed this underwritten offering of an aggregate of 3,250,000 shares of common stock. We received gross proceeds of $7,312,500 before deducting underwriting discounts and offering expenses as a result of the offering and net proceeds of approximately $6,281,767. We expect to use the net proceeds from the December 2013 Offering to fund drilling operations, for working capital and other general corporate purposes.
Issuance and Sale of 3,438,500 Shares in March 2014 Underwritten Public Offering
On March 4, 2014, we announced the pricing of our underwritten public offering of an aggregate of 2,990,000 shares of common stock at price of $2.15 per share to the public (the "March 2014 Offering"). The underwriters in the offering were granted a 30-day option to purchase up to 448,500 shares of common stock to cover over-allotments. On March 7, 2014, we closed this underwritten offering of an aggregate of 3,438,500 shares of common stock, which included the full exercise of the overallotment by the underwriters and net proceeds of
$6,581,280.
We received gross proceeds of $7,392,775 before deducting underwriting discounts and offering expenses as a result of the offering. We expect to use the net proceeds from the March 2014 Offering to fund drilling operations, for working capital and other general corporate purposes.
Pursuant to the Underwriting Agreement entered into on March 4, 2014, in connection with the March 2014 Offering, (a) directors and executive officers of the Company entered into agreements providing for a 90-day “lock-up” period with respect to sales of specified securities, subject to certain exceptions; and (b) the Company agreed, without the prior written consent of the underwriters, to not offer or sell any shares of the Company’s common stock for 90 days, subject to certain exceptions including (i) pursuant to Options (defined below) or restricted stock grants issued to employees or directors of, or consultants or advisors to, the Company or any of its subsidiaries pursuant to a plan, agreement or arrangement approved by the Board of Directors; (ii) upon exercise or conversion of (x) any Options or Convertible Securities (defined below) which are outstanding on the day immediately preceding the date of the Underwriting Agreement was entered into, provided that such Options or Convertible Securities have not been amended since the date of such Underwriting Agreement to increase the number of such securities or to decrease the exercise price, exchange price or conversion price of such securities (except as a result of anti-dilution provisions therein); or (y) any outstanding debt obligations of the Company which are amended subsequent to the date of the Underwriting Agreement to provide such holders the right to convert the outstanding principal and interest due thereunder into shares of the Company’s common stock, provided that the conversion price of such security totals no more than a 20% discount to the closing sales price of the common stock (except as a result of anti-dilution provisions therein); (iii) directly to a counterparty, its affiliates or their respective stockholders in connection with any bona fide acquisitions, mergers, asset acquisitions and similar transactions approved by the Board of Directors the primary purpose of which is not to raise equity capital; (iv) in connection with transactions with lenders, customers, vendors or other commercial or strategic partners, the terms of which are approved by the Board of Directors, in each case, the primary purpose of which is not to raise equity capital; (v) pursuant to the Underwriting Agreement; (vi) up to 2,250,000 Options issued to a lender and placement agent in connection with a credit facility or debt arrangement entered into to finance the purchase price under that certain Purchase and Sale Agreement, dated January 21, 2014, entered into with Continental; and (vii) shares of common stock, preferred stock (including convertible preferred stock stock), and Options issued in a private placement transaction. “Options” means any rights, warrants or options to subscribe for or purchase shares of common stock or Convertible Securities. “Convertible Securities” means any stock or securities (other than Options) convertible into or exercisable or exchangeable for shares of common stock.
Note Purchase Agreement and Sale of Secured Promissory Notes
In connection with our acquisition of the Wattenberg Asset, on March 7, 2014, we entered into and effected the transactions contemplated by a Note Purchase Agreement (the “Note Purchase”), between the Company, BRe BCLIC Primary, BRe BCLIC Sub, BRe WNIC 2013 LTC Primary, BRe WNIC 2013 LTC Sub, and RJ Credit LLC (“RJC”), as investors (collectively, the “Investors”), and BAM Administrative Services LLC, as agent for the Investors (the “Agent”). Pursuant to the Note Purchase, we sold the Investors Secured Promissory Notes in the aggregate amount of $34.5 million (the “Initial Notes”).
We received $29,325,000 before expenses in connection with the sale of the Initial Notes after paying the Investors an original issue discount in connection with the sale of the Notes of $1,725,000 (5% of the balance of the Initial Notes); and an underwriting fee of $3,450,000 (10% of the balance of the Initial Notes). In connection with the Note Purchase, we also reimbursed approximately $135,000 of the legal fees and expenses of the Investors’ counsel, and paid the Casimir Note Closing Fee of $
1,716,905, to Casimir Capital LP (“Casimir”), our investment banker in the transaction, as described and defined below, leaving a net of approximately $27,473,095 which was received by us on March 7, 2014.
20
From time to time, subject to the terms and conditions of the Note Purchase (including the requirement that we have deposited funds in an aggregate amount of any additional requested loan into a segregated bank account (the “Company Deposits”)), and prior to the Maturity Date (defined below), we have the right to request additional loans (to be evidenced by notes with substantially similar terms as the Initial Notes, the “Subsequent Notes”, and together with the Initial Notes, the “Notes”) from RJC, up to an additional $15.5 million in total or an aggregate of $50 million together with the Initial Notes. We are required to pay original issue discounts in the amount of 5% of the funds borrowed, underwriting fees in the amount of 10% of the amount of the funds borrowed, reimburse certain of the legal fees of RJC’s counsel, and pay applicable fees to Casimir representing 5% of any funds borrowed, in connection with funds borrowed under any Subsequent Notes. Funds borrowed under any Subsequent Notes are only eligible to be used by us, together with Company Deposits, for approved authorization for expenditures (“AFEs”) issued for a well or wells to be drilled and completed on any properties acquired in connection with the Continental Acquisition or owed by us in connection with the Mississippian Asset (the “Permitted Expenditures”). The total aggregate amount of any Subsequent Notes cannot exceed $15.5 million and in the event we drill a dry hole, we are prohibited from using the proceeds from the sale of any Subsequent Notes, without the consent of RJC. Additionally, pursuant to the Note Purchase, no proceeds we receive from the transfer, sale, assignment or farm-out of the Mississippian Asset may be used to fund the Company Deposits.
The Notes are due and payable on March 6, 2017 (the “Maturity Date”), and may be repaid in full without premium or penalty at any time.
As additional consideration for RJC providing the loan evidenced by its Initial Note and agreeing, subject to the terms of the Note Purchase, to provide the funding contemplated by the Subsequent Notes, we entered into and affected the following transactions in favor of RJC and its affiliate RJ Resources, on March 7, 2014 concurrent with the closing of the transactions contemplated by the Note Purchase:
|
●
|
A Purchase and Sale Agreement, by and between PEDCO, Red Hawk and RJ Resources (the “Red Hawk Purchase”), described in greater detail above under “Wattenberg Asset Acquisition”;
|
|
●
|
The Asia Sixth Purchase Agreement, by and between PEDCO and RJ Resources described in greater detail above under “Kazakhstan Acquisition”; and
|
|
●
|
A Membership Interest Purchase Agreement, by and between PEDCO and RJ Resources, described in greater detail above under “Mississippian Asset”
|
As a result of the transactions affected by the Red Hawk Purchase, Asia Sixth Purchase, Membership Purchase and Plan of Merger, RJ Resources acquired ownership of 50% of all of our oil and gas assets and properties acquired in connection with the Continental Acquisition, rights to 50% of the oil and gas assets and properties which we have the right to acquire in Kazakhstan pursuant to the Shares Subscription Agreement, and effective ownership of 50% of the Mississippian Asset (the “Disposition Transactions”).
Pursuant to the Asia Sixth Purchase, PEDCO agreed, at the option of RJ Resources, to either (a) provide for the issuance of the share certificate representing the shares of capital stock due from Asia Sixth Energy Resources Limited (“Asia Sixth”), representing 51% of the total issued and outstanding share capital of Asia Sixth (the “Subscription Shares”), which we have the right to purchase pursuant to the Shares Subscription Agreement dated September 11, 2013 (the “Shares Subscription Agreement”), to a Delaware limited liability company to be formed by PEDCO (such company, the “Nominee”) and to convey to RJ Resources fifty percent (50%) of the limited liability company interests issued by the Nominee or (b) provide for fifty percent (50%) of such Subscription Shares to be issued directly to RJ Resources or its designee. Additionally, the Asia Sixth Purchase provides that if any part of the $10 million deposit previously paid by us in connection with the Shares Subscription Agreement is returned to us, 50% of any such returned funds will be paid to RJ Resources.
The Asia Sixth Purchase contains customary representations, warranties, covenants and requirements for PEDCO to indemnify RJ Resources, subject to the terms and conditions of the Asia Sixth Purchase.
The Notes bear interest at the rate of 15% per annum, payable monthly in arrears, on the first business day of each month beginning April 1, 2014 (in connection with the Initial Notes), provided that upon the occurrence of an event of default, the Notes bear interest at the lesser of 30% per annum and the maximum legal rate of interest allowable by law. We can prepay all or any portion of the principal amount of Notes, without premium or penalty. The Notes include standard and customary events of default.
Additionally, we are required on the third business day of each month, commencing on April 1, 2014, to prepay the Notes in an amount equal to the lesser of (a) the outstanding principal amount of the Notes or (b) twenty-five percent (25%) of the aggregate of all net revenues actually received by us and are subsidiaries (other than net revenues received by Asia Sixth, unless and to the extent received by us in the United States) or for the immediately preceding calendar month (or such pro rata portion of the first month the payment is required). The Notes also provide that RJC is to be repaid (i) accrued interest, only after all of the other Investors are repaid any accrued interest due and (ii) principal, only after all of the other Investors are repaid the full amount of principal due under their Notes, and (iii) that any funding in connection with Subsequent Notes will be made solely by RJC.
21
The amount outstanding under the Notes is secured by a first priority security interest in all of our and our subsidiaries, assets, property, real property, intellectual property, securities and proceeds therefrom, granted in favor of the Agent for the benefit of the Investors, pursuant to a Security Agreement and Patent Security Agreement, and described in greater detail therein. Additionally, the Agent, for the benefit of the Investors, was granted a mortgage and security interest in all of our and our subsidiaries real property as located in the state of Colorado (including those assets acquired pursuant to the Continental Acquisition) and the state of Texas pursuant to (i) Leasehold Deed of Trust, Fixture Filing, Assignment of Rents and Leases, and Security Agreements filed in Weld County and Morgan County, Colorado; and (ii) a Mortgage, Deed of Trust, Security Agreement, Financing Statement and Assignment of Production filed in Matagorda County, Texas (collectively, the “Mortgages”). Additionally, our obligations under the Notes, Note Purchase Agreement and related agreements were guaranteed by our direct and indirect subsidiaries, PEDCO, White Hawk, Pacific Energy & Rare Earth Limited, Blackhawk Energy Limited, PEDCO MSL and Red Hawk pursuant to a Guaranty Agreement.
The net proceeds from the Initial Funding were used by us (along with funds raised through the February 2014 sale of assets which were formerly owned by White Hawk), to purchase assets located in Weld and Morgan Counties, Colorado, from Continental Resources, Inc. as part of the Continental Acquisition, which transaction closed on March 7, 2014, and (ii) to pay fees and expenses incurred in connection with the transactions contemplated by the Note Purchase and Continental Acquisition.
We previously engaged Casimir as our investment banker and non-exclusive placement agent in connection with among other things, the transactions contemplated by the Note Purchase, and in connection with the closing of the Note Purchase, we paid Casimir a fee of $1,716,905 (5% of the funding amount we received before expenses of $29,325,000) of the proceeds received in connection therewith (the “Casimir Note Closing Fee”). Upon the closing of the Note Purchase, we were also obligated to grant to Casimir warrants to purchase up to 1,000,000 shares of our common stock at an exercise price of $2.50 per share (the closing sales price of our common stock on the date immediately prior to the closing date of the Note Purchase), which warrants were issued on March 24, 2014, and which warrants have cashless exercise rights and a term of five years (the “Casimir Warrants”).
Rescission of Shares and Warrants and Cancellation of Note
On August 12, 2013, we sold (a) 6,666,667 shares of common stock at a price of $3.00 per share (the “Purchased Shares”), which included rights to the following warrants (b) three-year warrants exercisable on a cash basis only for (i) an aggregate of 666,667 shares of common stock at $3.75 per share, (ii) an aggregate of 666,667 shares of common stock at $4.50 per share, and (iii) an aggregate of 666,667 shares of common stock at $5.25 per share (collectively (i), (ii) and (iii), the “Purchased Warrants”), to Yao Hang Finance (Hong Kong) Limited (the “Lead Investor”) in consideration for $20 million.
The Lead Investor paid $10 million in cash at the closing, and entered into a common stock and Warrant Subscription Agreement (the “Subscription Agreement”), First Amendment to common stock and Warrant Subscription Agreement (the “Amendment”), and full-recourse promissory note (the “Note”), which Amendment and Note required that it pay the balance of $10 million in cash no later than December 1, 2013, with 3,333,333 of the shares of common stock issued to the Lead Investor in the Private Placement (the “Escrowed Shares”), as well as warrants exercisable for (i) an aggregate of 333,333 shares of common stock at $3.75 per share, (ii) an aggregate of 333,333 shares of common stock at $4.50 per share, and (iii) an aggregate of 333,333 shares of common stock at $5.25 per share (collectively (i), (ii) and (iii), the “Escrowed Warrants”), being held in escrow by the Company pending the Lead Investor’s payment in full of the $10 million due under the Note.
The Lead Investor failed to pay the $10 million balance due under the Note by December 1, 2013. On March 7, 2014, we notified the Lead Investor that, effective immediately, the Escrowed Shares and Escrowed Warrants were rescinded as permitted pursuant to the terms of the Note, and the Note was cancelled and forgiven, with no further action required by the Lead Investor (the “Cancellation”).
Pursuant to the terms of our September 16, 2013, Share Subscription Agreement which provides us rights to acquire an approximately 51% ownership in Asia Sixth, which holds an approximately 60% ownership interest in Aral, a Kazakhstan entity, which holds a 100% operated working interest in a production license issued by the Republic of Kazakhstan that expires in 2034 in western Kazakhstan, we were required to pay the Note proceeds to Asia Sixth in the event we received such proceeds, provided that if such proceeds were not received, the required amount of the Share Subscription Agreement was to automatically be reduced from $20 million to $10 million (which $10 million deposit has previously been paid by us). Consequently, the rescission of the Note has no net effect on us or our obligations under the Share Subscription Agreement because (a) if such Note was paid in full we would have been required to pay such funds directly to Asia Sixth; and (b) the result of such funds not being paid only results in a decrease in the required deposit due to Asia Sixth.
22
Letter Amending Cash Compensation Payable to South Texas Reservoir Alliance LLC
On March 7, 2014, PEDCO MSL and South Texas Reservoir Alliance LLC (“STXRA”) entered into a letter agreement providing for $405,777 of cash consideration owed to STXRA for consulting services provided by STXRA to PEDCO MSL in connection with our acquisition of the Mississippian Asset in March 2013, which was satisfied in full through the issuance by the Company to STXRA on March 24, 2014 of an aggregate total of 190,000 shares of our restricted common stock.
Amendment to Bridge Notes and Subordination and Intercreditor Agreements
On December 16, 2013, we entered into an Amendment to Secured Promissory Notes, with each of the holders, or bridge investors, of those certain Secured Promissory Notes, which we refer to as the bridge notes. The bridge notes were originally issued by us on March 22, 2013, in a private placement transaction in which we sold and issued to the bridge investors a total of $4.0 million of bridge notes and warrants exercisable for a total of up to 76,198 shares of our common stock, which we refer to as the bridge warrants, for gross proceeds of $4.0 million, which we refer to as the bridge financing.
The bridge notes were amended effective December 16, 2013, or the effective date, to provide for (i) the extension of the maturity date of such bridge notes, which were originally due as of December 31, 2013, to July 31, 2014, which we refer to as the extension term and new maturity date, respectively, (ii) the subordination of the bridge notes to certain of our future qualified senior indebtedness with a principal amount of at least $5.0 million, (iii) the payment in full of all accrued interest through the effective date on January 8, 2014, or the payment date, equal to an aggregate of $294,795 due and payable to the bridge investors on the payment date, (iv) the payment in full of the payment-in-kind amount, or PIK, equal to 10% of the original principal amount of such bridge notes on the payment date, equal to an aggregate of $400,000 due and payable to the bridge investors on the payment date, (v) the repayment of either none or 50% of the outstanding principal amount due under such bridge notes, as elected by the holders thereof, on the payment date, which aggregate principal repayment of $1,625,000 shall be due and payable to the bridge investors on the payment date as elected by the holders, (vi) the amendment of the interest rate of such bridge notes for the extension term from 10% per annum to 12% per annum with respect to the remaining unpaid principal amount of such bridge notes, or the deferred principal, and (vii) an additional payment-in-kind cash amount equal to 10% of the deferred principal due on the new maturity date, or the additional PIK. In total, eleven (11) bridge investors holding bridge notes with an aggregate principal amount outstanding of $3,250,000 elected to defer 50% of their principal, agreeing to defer an aggregate of $1,625,000 in principal amount of the bridge notes, and five (5) bridge investors holding bridge notes with an aggregate principal amount outstanding of $750,000 elected to defer 100% of their principal, for a total deferred principal of $2,375,000, and an aggregate additional PIK due and paid upon the new maturity date of $237,500.
As additional consideration for the amendment of the bridge notes, we granted a new warrant, which we refer to as the new warrant, exercisable on a cashless basis at an exercise price of $2.34 per share for a number of shares of our common stock equal to (x) two times the number of shares issuable under the bridge warrant originally issued to each holder who agreed to defer 50% of the outstanding principal of its bridge note, and (y) three times the number of shares issuable under the bridge warrant originally issued to each holder who agreed to defer 100% of the outstanding principal of his, her, or its bridge note, for a total of new warrants exercisable for an aggregate of 166,684 shares of our common stock. The new warrants have a 4-year life and have substantially the same terms as the bridge warrants originally issued to the bridge investors.
Frank C. Ingriselli, our President, Chief Executive Officer, and member of our Board of Directors, agreed to defer $500,000 of the original $1.0 million principal amount outstanding under his bridge note, and on the payment date we paid him $73,699 in accrued interest and $100,000 in PIK amounts due, and repaid 50% of his outstanding principal amount of $500,000, and Mr. Ingriselli received a new warrant exercisable for 38,096 shares of our common stock. Clark R. Moore, our Executive Vice President and General Counsel, agreed to defer $25,000 of the original $50,000 principal amount outstanding under his bridge note, and on the payment date we paid him $3,685 in accrued interest and $5,000 in PIK amounts due, and repaid 50% of his outstanding principal amount of $25,000, and Mr. Moore received a new warrant exercisable for 1,906 shares of our common stock.
We amended the bridge notes in order to extend their maturity dates with respect to the deferred principal to conserve our available cash, and to subordinate the bridge notes to better position us to seek additional senior debt financing opportunities.
23
On March 7, 2014, we entered into Second Amendment to Secured Promissory Notes (each, an “Amended Note,” and collectively, the “Amended Notes”) with all but one of the bridge investors.
The Amended Notes amended the bridge notes to allow the holders thereof the right to convert up to 100% of the outstanding and unpaid principal amount (but in increments of not less than 25% of the principal amount of each bridge note outstanding as of the entry into the Amended Notes and only up to four (4) total conversions of not less than 25% each); the additional payment-in-kind cash amount equal to 10% of the principal amount of each holder’s bridge note which was deferred pursuant to the First Amendment; and all accrued and unpaid interest under each bridge note (collectively, the “Conversion Amount”) into our common stock, subject to an additional listing application regarding such common stock being approved by the NYSE MKT. Upon a conversion, the applicable holder shall receive that number of shares of common stock as is determined by dividing the Conversion Amount by a conversion price (the “Conversion Price”) as follows:
(A) prior to June 1, 2014, the Conversion Price shall be $2.15 per share; and
(B) following June 1, 2014, the denominator used in the calculation described above shall be the greater of (i) 80% of the average of the closing price per share of our publicly traded common stock for the five (5) trading days immediately preceding the date of the conversion notice provide by the holder; and (ii) $0.50 per share.
Additionally, each bridge investor entered into a Subordination and Intercreditor Agreement in favor of the Agent, subordinating and deferring the repayment of the bridge notes, and actions in connection with the security interests provided under the bridge notes, until full repayment of the Notes sold pursuant to the Note Purchase. The Subordination and Intercreditor Agreements also prohibit us from repaying the bridge notes until the Notes have been paid in full, except that we are allowed to repay the bridge notes from net proceeds received from the sale of common or preferred stock (i) in calendar year 2014 if such net proceeds received in such calendar year exceeds $35,000,000, (ii) in calendar year 2015 if such net proceeds received in such calendar year exceeds $50,000,000, and (iii) in calendar year 2016 if such net proceeds actually received in such calendar year exceeds $50,000,000.
Frank C. Ingriselli, our President, Chief Executive Officer, and member of our Board of Directors, originally provided us $1.0 million in bridge notes (which was reduced to $500,000 in connection with payments made pursuant to the First Amendment) and Clark R. Moore, our Executive Vice President and General Counsel, originally provided us $50,000 in bridge notes (which was reduced to $25,000 in connection with payments made pursuant to the First Amendment), provided that prior to the bridge note Investors’ entry into the Amended Notes, Mr. Ingriselli and Mr. Moore transferred their bridge notes to non-affiliates of the Company and as such, as of the date of the Amended Notes, such officers no longer held any bridge notes or rights thereunder.
Shale Oil and Natural Gas Overview
The relatively recent surge of oil and natural gas production from underground shale rock formations has had a dramatic impact on the oil and natural gas market in the U.S., where the practice was first developed, and globally. Shale oil production is facilitated by the combination of a set of technologies that had been applied separately to other hydrocarbon reservoir types for many decades. In combination these technologies and techniques have enabled large volumes of oil to be produced from deposits with characteristics that would not otherwise permit oil to flow at rates sufficient to justify its exploitation. The application of horizontal drilling, hydraulic fracturing and advanced reservoir assessment tools to these reservoirs is unlocking a global resource of shale and other unconventional oil and natural gas that the International Energy Agency estimates could eventually double recoverable global oil reserves.
In 2008, U.S. natural gas production was in a decline, and the U.S. was on its way to becoming a significant importer of liquefied natural gas (LNG). By 2009, U.S.-marketed natural gas production was 14% higher than in 2005, and in 2010 it surpassed the previous annual production record set in 1973. This turnaround is mainly attributable to shale oil and natural gas output that has more than tripled since 2007. Knowledge is expanding rapidly concerning the shale oil reservoirs that are already being exploited and others that appear suitable for development with current technology. In its preliminary 2011 Annual Energy Outlook, the U.S. Department of Energy (DOE) increased its estimate of recoverable U.S. shale natural gas resources by 238% compared to its previous estimate, bringing U.S. potential natural gas resources to 2,552 trillion cubic feet (TCF), equivalent to more than a century’s supply at current consumption rates.
Along with the reduction in economic activity resulting from the recession, the increase in production from shale natural gas has had a significant impact on U.S. average natural gas wellhead prices, which have fallen by more than 30% since 2007. As a result, the value of natural gas has diverged significantly from that of petroleum on an energy-equivalent basis. That has provided substantial economic benefits to natural gas-consuming industries. It has also led to both economic and environmental benefits for the electricity sector, as fired power plants displace power from higher-cost and higher-emitting sources. Shale natural gas has been cited by U.S. Secretary of Energy, Stephen Chu, as helping the world shift to cleaner fuels. A report by the National Petroleum Council (NPC) to Stephen Chu in September 2011 stated that shale oil fields in the U.S. could produce 2 to 3 million barrels of oil per day by 2025, given the right regulatory environment and technology breakthroughs.
24
Oil and natural gas produced from shale is considered an unconventional resource. Commercial oil and natural gas production from unconventional sources requires special techniques in order to achieve attractive oil and natural gas flow rates. Unlike conventional oil and natural gas, which is typically generated in deeper source rock and subsequently migrates into a sandstone structure with an overlying impermeable layer forming a “trap,” shale oil and natural gas is generated from organic material contained within the shale and retained by the rock’s inherent low permeability. Permeability is a measure of the ease with which natural gas, oil or other fluids can flow through the material. The same low permeability that secures large volumes of natural gas and liquids in place within the shale strata makes it much more difficult to extract them, even with a large pressure difference between the reservoir and the surface. The location and potential of many of today’s productive shale reservoirs were known for many years, but until the development of current shale oil and natural gas techniques these deposits were considered noncommercial or inaccessible.
The main challenge of shale oil and natural gas drilling is to overcome the low permeability of the shale reservoirs. A conventional vertical oil or natural gas well drilled into one of these reservoirs might achieve production, though at reduced rates and for a limited duration before the oil or natural gas volume in proximity to the wellbore is exhausted. That often renders such an approach impractical and uneconomic for exploiting shale oil and natural gas. The two main technologies associated with U.S. shale oil and natural gas production are horizontal drilling and hydraulic fracturing, or “hydrofracking.” They are employed to overcome these constraints by greatly increasing the exposure of each well to the shale stratum and enabling oil and natural gas located farther from the well to flow through the rock and replace the nearby oil and natural gas that has been extracted to the surface.
Instead of drilling a simple vertical well through the shale and then perforating the well within the zone where it is in contact with the shale, the drilling company drills a directional well vertically to within proximity of the shale and then executes a 90-degree turn in order to intersect the shale and then travel for a significant horizontal distance through it. A typical North American shale well has a horizontal extent of 1,000 feet to 5,000 feet or more.
Once the lateral portion of the well has reached the desired extent, the other main technique of shale oil and natural gas drilling is deployed. After the well has been completed, the farthest section of the lateral is perforated, opening up holes through which fluid can flow. This portion of the reservoir is then hydrofracked by injecting fluid into the well under high pressure to fracture the exposed shale rock and open up pathways through which oil and natural gas can flow. The “fracking fluid” consists mainly of water with a variety of chemical additives intended to reduce friction and dissolve minerals, among other purposes, along with sand or sand-like material to prop open the new pathways created by hydrofracking. This process is then repeated at intervals along the well’s horizontal extent, successively perforating and hydrofracking each section in turn. This process creates a producing well that emulates the effect of a vertical well drilled into a conventional oil and natural gas reservoir by substituting multiple horizontal “pay zones” in the shale stratum for the thinner but more prolific vertical pay zone in a more permeable reservoir. Compared to conventional oil and natural gas drilling, the production of oil and natural gas from shale reservoirs thus entails more drilling, on average, and requires a substantial supply of water.
Shale oil and natural gas are currently being produced from a number of reservoirs in the U.S. Among these are the Bakken Shale in Montana and North Dakota, the Niobrara Shale in northeastern Colorado and parts of adjacent Wyoming, Nebraska, and Kansas, the Eagle Ford Shale in southern Texas, the Mississippian Lime in Kansas and Oklahoma, and the Marcellus Shale spanning several states in the northeastern U.S. According to a January 2014 U.S. Energy Information Administration’s report, the total technically recoverable world resources of shale oil and gas are estimated at 345 billion barrels (oil) and 7,299 trillion cubic feet (gas), with an estimated 58 billion barrels (oil) and 665 trillion cubic feet (gas) being concentrated in the U.S.
Regulation
Oil and Natural Gas Regulation
Our oil and natural gas exploration, development, production and related operations are subject to extensive federal, state and local laws, rules and regulations. Failure to comply with these laws, rules and regulations can result in substantial penalties. The regulatory burden on the oil and natural gas industry increases our cost of doing business and affects our profitability. Because these rules and regulations are frequently amended or reinterpreted and new rules and regulations are promulgated, we are unable to predict the future cost or impact of complying with the laws, rules and regulations to which we are, or will become, subject. Our competitors in the oil and natural gas industry are generally subject to the same regulatory requirements and restrictions that affect our operations. We cannot predict the impact of future government regulation on our properties or operations.
25
Texas, Colorado, Kansas, and many other states require permits for drilling operations, drilling bonds and reports concerning operations and impose other requirements relating to the exploration, development and production of oil and natural gas. Many states also have statutes or regulations addressing conservation of oil and natural gas matters, including provisions for the unitization or pooling of oil and natural gas properties, the establishment of maximum rates of production from wells, the regulation of well spacing, the surface use and restoration of properties upon which wells are drilled, the sourcing and disposal of water used in the drilling and completion process and the plugging and abandonment of these wells. Many states restrict production to the market demand for oil and natural gas. Some states have enacted statutes prescribing ceiling prices for natural gas sold within their boundaries. Additionally, some regulatory agencies have, from time to time, imposed price controls and limitations on production by restricting the rate of flow of oil and natural gas wells below natural production capacity in order to conserve supplies of oil and natural gas. Moreover, each state generally imposes a production or severance tax with respect to the production and sale of oil, natural gas and natural gas liquids within its jurisdiction.
Some of our oil and natural gas leases are issued by agencies of the federal government, as well as agencies of the states in which we operate. These leases contain various restrictions on access and development and other requirements that may impede our ability to conduct operations on the acreage represented by these leases.
Our sales of natural gas, as well as the revenues we receive from our sales, are affected by the availability, terms and costs of transportation. The rates, terms and conditions applicable to the interstate transportation of natural gas by pipelines are regulated by the Federal Energy Regulatory Commission (FERC) under the Natural Gas Act, as well as under Section 311 of the Natural Gas Policy Act. Since 1985, FERC has implemented regulations intended to increase competition within the natural gas industry by making natural gas transportation more accessible to natural gas buyers and sellers on an open-access, non-discriminatory basis. The natural gas industry has historically, however, been heavily regulated and we can give no assurance that the current less stringent regulatory approach of FERC will continue.
In 2005, Congress enacted the Energy Policy Act of 2005. The Energy Policy Act, among other things, amended the Natural Gas Act to prohibit market manipulation by any entity, to direct FERC to facilitate market transparency in the market for sale or transportation of physical natural gas in interstate commerce, and to significantly increase the penalties for violations of the Natural Gas Act, the Natural Gas Policy Act of 1978, or FERC rules, regulations or orders thereunder. FERC has promulgated regulations to implement the Energy Policy Act. Should we violate the anti-market manipulation laws and related regulations, in addition to FERC-imposed penalties, we may also be subject to third-party damage claims.
Intrastate natural gas transportation is subject to regulation by state regulatory agencies. The basis for intrastate regulation of natural gas transportation and the degree of regulatory oversight and scrutiny given to intrastate natural gas pipeline rates and services varies from state to state. Because these regulations will apply to all intrastate natural gas shippers within the same state on a comparable basis, we believe that the regulation in any states in which we operate will not affect our operations in any way that is materially different from our competitors that are similarly situated.
The price we receive from the sale of oil and natural gas liquids will be affected by the availability, terms and cost of transportation of the products to market. Under rules adopted by FERC, interstate oil pipelines can change rates based on an inflation index, though other rate mechanisms may be used in specific circumstances. Intrastate oil pipeline transportation rates are subject to regulation by state regulatory commissions, which varies from state to state. We are not able to predict with certainty the effects, if any, of these regulations on our operations.
In 2007, the Energy Independence & Security Act of 2007 (the “EISA”), went into effect. The EISA, among other things, prohibits market manipulation by any person in connection with the purchase or sale of crude oil, gasoline or petroleum distillates at wholesale in contravention of such rules and regulations that the Federal Trade Commission may prescribe, directs the Federal Trade Commission to enforce the regulations and establishes penalties for violations thereunder. We cannot predict any future regulations or their impact.
U.S. Federal and State Taxation
The federal, state and local governments in the areas in which we operate impose taxes on the oil and natural gas products we sell and, for many of our wells, sales and use taxes on significant portions of our drilling and operating costs. In the past, there has been a significant amount of discussion by legislators and presidential administrations concerning a variety of energy tax proposals. President Obama has recently proposed sweeping changes in federal laws on the income taxation of small oil and natural gas exploration and production companies such as us. President Obama has proposed to eliminate allowing small U.S. oil and natural gas companies to deduct intangible U.S. drilling costs as incurred and percentage depletion. Many states have raised state taxes on energy sources, and additional increases may occur. Changes to tax laws could adversely affect our business and our financial results.
26
Environmental Regulation
The exploration, development and production of oil and natural gas, including the operation of saltwater injection and disposal wells, are subject to various federal, state and local environmental laws and regulations. These laws and regulations can increase the costs of planning, designing, installing and operating oil and natural gas wells. Our activities are subject to a variety of environmental laws and regulations, including but not limited to the Oil Pollution Act of 1990 (OPA 90), the Clean Water Act (CWA), the Comprehensive Environmental Response, Compensation and Liability Act (CERCLA), the Resource Conservation and Recovery Act (RCRA), the Clean Air Act (CAA), the Safe Drinking Water Act (the SDWA) and the Occupational Safety and Health Act (OSHA), as well as comparable state statutes and regulations. We are also subject to regulations governing the handling, transportation, storage and disposal of wastes generated by our activities and naturally occurring radioactive materials (NORM) that may result from our oil and natural gas operations. Civil and criminal fines and penalties may be imposed for noncompliance with these environmental laws and regulations. Additionally, these laws and regulations require the acquisition of permits or other governmental authorizations before undertaking some activities, limit or prohibit other activities because of protected wetlands, areas or species and require investigation and cleanup of pollution. We intend to remain in compliance in all material respects with currently applicable environmental laws and regulations.
OPA 90 and its regulations impose requirements on “responsible parties” related to the prevention of crude oil spills and liability for damages resulting from oil spills into or upon navigable waters, adjoining shorelines or in the exclusive economic zone of the U.S. A “responsible party” under OPA 90 may include the owner or operator of an onshore facility. OPA 90 subjects responsible parties to strict joint and several financial liability for removal costs and other damages, including natural resource damages, caused by an oil spill that is covered by the statute. It also imposes other requirements on responsible parties, such as the preparation of an oil spill contingency plan. Failure to comply with OPA 90 may subject a responsible party to civil or criminal enforcement action. We may conduct operations on acreage located near, or that affects navigable waters subject to OPA 90.
The CWA imposes restrictions and strict controls regarding the discharge of produced waters and other wastes into navigable waters. These controls have become more stringent over the years, and it is possible that additional restrictions will be imposed in the future. Permits are required to discharge pollutants into state and federal waters and to conduct construction activities in waters and wetlands. Certain state regulations and the general permits issued under the federal National Pollutant Discharge Elimination System program prohibit the discharge of produced water, produced sand, drilling fluids, drill cuttings and certain other substances related to the oil and natural gas industry into certain coastal and offshore waters. Furthermore, the EPA has adopted regulations requiring certain oil and natural gas exploration and production facilities to obtain permits for storm water discharges. Costs may be associated with the treatment of wastewater or developing and implementing storm water pollution prevention plans. The CWA and comparable state statutes provide for civil, criminal and administrative penalties for any unauthorized discharges of oil and other pollutants and impose liability for the costs of removal or remediation of contamination resulting from such discharges. In furtherance of the CWA, the EPA promulgated the Spill Prevention, Control, and Countermeasure (SPCC) regulations, which require certain oil-storing facilities to prepare plans and meet construction and operating standards.
CERCLA, also known as the “Superfund” law, and comparable state statutes impose liability, without regard to fault or the legality of the original conduct, on various classes of persons that are considered to have contributed to the release of a “hazardous substance” into the environment. These persons include the owner or operator of the disposal site where the release occurred and companies that disposed of, or arranged for the disposal of, the hazardous substances found at the site. Persons who are responsible for releases of hazardous substances under CERCLA may be subject to joint and several liability for the costs of cleaning up the hazardous substances and for damages to natural resources. In addition, it is not uncommon for neighboring landowners and other third parties to file claims for personal injury and property damage allegedly caused by hazardous substances released into the environment. Our operations may, and in all likelihood will, involve the use or handling of materials that may be classified as hazardous substances under CERCLA. Furthermore, we may acquire or operate properties that unknown to us have been subjected to, or have caused or contributed to, prior releases of hazardous wastes.
RCRA and comparable state and local statutes govern the management, including treatment, storage and disposal, of both hazardous and nonhazardous solid wastes. We generate hazardous and nonhazardous solid waste in connection with our routine operations. At present, RCRA includes a statutory exemption that allows many wastes associated with crude oil and natural gas exploration and production to be classified as nonhazardous waste. A similar exemption is contained in many of the state counterparts to RCRA. At various times in the past, proposals have been made to amend RCRA to eliminate the exemption applicable to crude oil and natural gas exploration and production wastes. Repeal or modifications of this exemption by administrative, legislative or judicial process, or through changes in applicable state statutes, would increase the volume of hazardous waste we are required to manage and dispose of and would cause us, as well as our competitors, to incur increased operating expenses. Hazardous wastes are subject to more stringent and costly disposal requirements than are nonhazardous wastes.
27
The CAA and comparable state laws restrict the emission of air pollutants from many sources, including oil and natural gas production. These laws and any implementing regulations impose stringent air permit requirements and require us to obtain pre-approval for the construction or modification of certain projects or facilities expected to produce air emissions, or to use specific equipment or technologies to control emissions. On July 28, 2011, the EPA proposed new regulations targeting air emissions from the oil and natural gas industry. The proposed rules, if adopted, would impose new requirements on production and processing and transmission and storage facilities.
Changes in environmental laws and regulations occur frequently, and any changes that result in more stringent and costly waste handling, storage, transport, disposal or cleanup requirements or operating requirements could materially adversely affect our operations and financial position, as well as those of the oil and natural gas industry in general. For instance, recent scientific studies have suggested that emissions of certain gases, commonly referred to as “greenhouse gases,” and including carbon dioxide and methane, may be contributing to the warming of the Earth’s atmosphere. As a result, there have been attempts to pass comprehensive greenhouse gas legislation. To date, such legislation has not been enacted. Any future federal laws or implementing regulations that may be adopted to address greenhouse gas emissions could, and in all likelihood would, require us to incur increased operating costs adversely affecting our profits and could adversely affect demand for the oil and natural gas we produce depressing the prices we receive for oil and natural gas.
On December 15, 2009, the EPA published its finding that emissions of greenhouse gases presented an endangerment to human health and the environment. These findings by the EPA allow the agency to proceed with the adoption and implementation of regulations that would restrict emissions of greenhouse gases under existing provisions of the CAA. Subsequently, the EPA proposed and adopted two sets of regulations, one of which requires a reduction in emissions of greenhouse gases from motor vehicles and the other of which regulated emissions of greenhouse gases from certain large stationary sources. In addition, on October 30, 2009, the EPA published a rule requiring the reporting of greenhouse gas emissions from specified sources in the U.S. beginning in 2011 for emissions occurring in 2010. On November 30, 2010, the EPA released a rule that expands its final rule on greenhouse gas emissions reporting to include owners and operators of onshore and offshore oil and natural gas production, onshore natural gas processing, natural gas storage, natural gas transmission and natural gas distribution facilities. Reporting of greenhouse gas emissions from such onshore production became required on an annual basis beginning in 2012 for emissions occurring in 2011. The adoption and implementation of any regulations imposing reporting obligations on, or limiting emissions of greenhouse gases from, our equipment and operations could, and in all likelihood will, require us to incur costs to reduce emissions of greenhouse gases associated with our operations adversely affecting our profits or could adversely affect demand for the oil and natural gas we produce depressing the prices we receive for oil and natural gas.
Some states have begun taking actions to control and/or reduce emissions of greenhouse gases, primarily through the planned development of greenhouse gas emission inventories and/or regional greenhouse gas cap and trade programs. Although most of the state-level initiatives have to date focused on significant sources of greenhouse gas emissions, such as coal-fired electric plants, it is possible that less significant sources of emissions could become subject to greenhouse gas emission limitations or emissions allowance purchase requirements in the future. Any one of these climate change regulatory and legislative initiatives could have a material adverse effect on our business, financial condition and results of operations.
Underground injection is the subsurface placement of fluid through a well, such as the reinjection of brine produced and separated from oil and natural gas production. In our industry, underground injection not only allows us to economically dispose of produced water, but if injected into an oil bearing zone, it can increase the oil production from such zone. The SDWA establishes a regulatory framework for underground injection, the primary objective of which is to ensure the mechanical integrity of the injection apparatus and to prevent migration of fluids from the injection zone into underground sources of drinking water. The disposal of hazardous waste by underground injection is subject to stricter requirements than the disposal of produced water. We currently do not own or operate any underground injection wells, but may do so in the future. Failure to obtain, or abide by the requirements for the issuance of necessary permits could subject us to civil and/or criminal enforcement actions and penalties.
Oil and natural gas exploration and production, operations and other activities have been conducted at some of our properties by previous owners and operators. Materials from these operations remain on some of the properties, and, in some instances, may require remediation. In addition, we occasionally must agree to indemnify sellers of producing properties from whom we acquire reserves against some of the liability for environmental claims associated with these properties. We cannot assure you that the costs we incur for compliance with environmental regulations and remediating previously or currently owned or operated properties will not result in material expenditures that adversely affect our profitability.
28
Additionally, in the course of our routine oil and natural gas operations, surface spills and leaks, including casing leaks, of oil or other materials will occur, and we will incur costs for waste handling and environmental compliance. It is also possible that our oil and natural gas operations may require us to manage NORM. NORM is present in varying concentrations in sub-surface formations, including hydrocarbon reservoirs, and may become concentrated in scale, film and sludge in equipment that comes in contact with crude oil and natural gas production and processing streams. Some states, including Texas, have enacted regulations governing the handling, treatment, storage and disposal of NORM. Moreover, we will be able to control directly the operations of only those wells for which we act as the operator. Despite our lack of control over wells owned by us but operated by others, the failure of the operator to comply with the applicable environmental regulations may, in certain circumstances, be attributable to us.
We are subject to the requirements of OSHA and comparable state statutes. The OSHA Hazard Communication Standard, the “community right-to-know” regulations under Title III of the federal Superfund Amendments and Reauthorization Act and similar state statutes require us to organize information about hazardous materials used, released or produced in our operations. Certain of this information must be provided to employees, state and local governmental authorities and local citizens. We are also subject to the requirements and reporting set forth in OSHA workplace standards.
We cannot assure you that more stringent laws and regulations protecting the environment will not be adopted or that we will not otherwise incur material expenses in connection with environmental laws and regulations in the future. The clear trend in environmental regulation is to place more restrictions and limitations on activities that may affect the environment and, thus, any changes in environmental laws and regulations or re-interpretation of enforcement policies that result in more stringent and costly waste handling, storage, transport, disposal or remediation requirements could have a material adverse effect on our operations and financial position. We may be unable to pass on such increased compliance costs to our customers. Moreover, accidental releases or spills may occur in the course of our operations, and we cannot assure you that we will not incur significant costs and liabilities as a result of such releases or spills, including any third party claims for damage to property, natural resources or persons.
We maintain insurance against some, but not all, potential risks and losses associated with our industry and operations. We do not currently carry business interruption insurance. For some risks, we may not obtain insurance if we believe the cost of available insurance is excessive relative to the risks presented. In addition, pollution and environmental risks generally are not fully insurable. If a significant accident or other event occurs and is not fully covered by insurance, it could materially adversely affect our financial condition and results of operations.
Hydraulic Fracturing Regulation
We use hydraulic fracturing as a means to maximize the productivity of our oil and natural gas wells in most wells that we drill and complete. Although average drilling and completion costs for each area will vary, as will the cost of each well within a given area, on average approximately 60% of the drilling and completion costs for our horizontal wells are associated with hydraulic fracturing activities. These costs are treated in the same way that all other costs of drilling and completion of our wells are treated and are built into and funded through our normal capital expenditures budget.
Hydraulic fracturing technology, which has been used by the oil and natural gas industry for more than 60 years and is constantly being enhanced, enables companies to produce crude oil and natural gas that would otherwise not be recovered. Specifically, hydraulic fracturing is a process in which pressurized fluid is pumped into underground formations to create tiny fractures or spaces that allow crude oil and natural gas to flow from the reservoir into the well so that it can be brought to the surface. The makeup of the fluid used in the hydraulic fracturing process is typically more than 99% water and sand, and less than 1% highly diluted chemical additives. While the majority of the sand remains underground to hold open the fractures, a significant percentage of the water and chemical additives flow back and are then either recycled or safely disposed of at sites that are approved and permitted by the appropriate regulatory authorities. Hydraulic fracturing generally takes place thousands of feet underground, a considerable distance below any drinking water aquifers, and there are impermeable layers of rock between the area fractured and the water aquifers.
Recently, there has been increasing regulatory scrutiny of hydraulic fracturing, which is generally exempted from regulation as underground injection on the federal level pursuant to the SDWA. However, the U.S. Senate and House of Representatives have considered legislation to repeal this exemption. If enacted, these proposals would amend the definition of “underground injection” in the SDWA to encompass hydraulic fracturing activities. If enacted, such a provision could require hydraulic fracturing operations to meet permitting and financial assurance requirements, adhere to certain construction specifications, fulfill monitoring, reporting and recordkeeping obligations, and meet plugging and abandonment requirements. These legislative proposals have also contained language to require the reporting and public disclosure of chemicals used in the fracturing process. If the exemption for hydraulic fracturing is removed from the SDWA, or if other legislation is enacted at the federal, state or local level, any restrictions on the use of hydraulic fracturing contained in any such legislation could have a significant impact on our business, financial condition and results of operations.
29
In addition, at the federal level and in some states, there has been a push to place additional regulatory burdens upon hydraulic fracturing activities. Certain bills have been introduced in the Senate and the House of Representatives that, if adopted, could increase the possibility of litigation and establish an additional level of regulation at the federal level that could lead to operational delays or increased operating costs and could, and in all likelihood would, result in additional regulatory burdens, making it more difficult to perform hydraulic fracturing operations and increasing our costs of compliance. At the state level, Wyoming and Texas, for example, have enacted requirements for the disclosure of the composition of the fluids used in hydraulic fracturing. On June 17, 2011, Texas signed into law a mandate for public disclosure of the chemicals that operators use during hydraulic fracturing in Texas. The law went into effect September 1, 2011. In addition, several local governments in Texas have imposed temporary moratoria on drilling permits within city limits so that local ordinances may be reviewed to assess their adequacy to address hydraulic fracturing activities. Additional burdens upon hydraulic fracturing, such as reporting requirements or permitting requirements for the hydraulic fracturing activity, will result in additional expense and delay in our operations.
We are not able to predict the timing, scope and effect of any currently proposed or future laws or regulations regarding hydraulic fracturing, but the direct and indirect costs of such laws and regulations (if enacted) could materially and adversely affect our business, financial conditions and results of operations. See “Risk Factors,” including “Our operations are subject to operational hazards and unforeseen interruptions for which we may not be adequately insured” and "Federal and state legislation and regulatory initiatives relating to hydraulic fracturing and water disposal could result increased costs and additional operating restrictions or delays."
International Regulation
Our anticipated future exploration and production operations outside the U.S. will be subject to various types of regulations imposed by the respective governments of the countries in which our operations may be conducted and that may affect our operations and costs. We currently have no operations outside of the U.S., however we will have such operations upon completion of the proposed Kazakhstan Acquisition. We have not yet assessed the scope and effect of any currently proposed or future foreign laws, regulations or treaties, including those regarding climate change and hydraulic fracturing, but the direct and indirect costs of such laws, regulations and treaties (if enacted) could materially and adversely affect our business, results of operations, financial condition and competitive position.
Insurance
Our oil and gas properties are subject to hazards inherent in the oil and gas industry, such as accidents, blowouts, explosions, implosions, fires and oil spills. These conditions can cause:
|
●
|
damage to or destruction of property, equipment and the environment; and
|
|
●
|
personal injury or loss of life; and,
|
|
●
|
suspension of operations.
|
We maintain insurance coverage that we believe to be customary in the industry against these types of hazards. However, we may not be able to maintain adequate insurance in the future at rates we consider reasonable. In addition, our insurance is subject to coverage limits and some policies exclude coverage for damages resulting from environmental contamination. The occurrence of a significant event or adverse claim in excess of the insurance coverage that we maintain or that is not covered by insurance could have a material adverse effect on our financial condition and results of operations.
Patents and Licenses
In February 2009, we filed a provisional patent (application number 61/152,885) relating to the process and unique equipment related to our applied fluid jetting process ("AFJ"). In February 2010, the final patent application was submitted. This patent was approved by the U.S. Patent Office in September 2012. We are currently in the process of working with the inventor to assign the rights to the patent to us.
During 2009, we tested the AFJ process on wells in the Austin Chalk play in Central Texas operated by Reliance Oil & Gas, Inc., which we refer to as Reliance, and had some initial production success. We subsequently attempted to apply the process to third-party wells in West Texas and in Kentucky. Due to mechanical failures of the surface equipment, we were unable to achieve any lateral jetting in the down-hole environment. Currently, the AFJ rig and other support vehicles have been moved to a storage yard in Spring, Texas. The AFJ asset is a secondary, non-core business focus for our company and may not ever be commercialized.
30
Although we believe the applied fluid technology and related trade secrets may provide us with a competitive edge in the oil and gas service industry, we do not believe this technology to be core to our current business and we are currently not actively pursuing its development and commercialization. However, we are highly committed to protecting the technology. We cannot assure our investors that the scope of any protection we are able to secure for our technology will be adequate to protect such technology, or that we will have the financial resources to engage in litigation against parties who may infringe upon us or seek to rescind their agreements with us. We also cannot provide our investors with any degree of assurance regarding the possible independent development by others of technology similar to that which we have acquired, thereby possibly diminishing our competitive edge.
Employees
At December 31, 2013, we had 9 full-time employees. We believe that our relationships with our employees are satisfactory. No employee is covered by a collective bargaining agreement. In order to expand our operations in accordance with our business plan, we intend to hire additional employees with expertise in the areas of corporate development, petroleum engineering, geological and geophysical sciences and accounting, as well as hiring additional technical, operations and administrative staff. We are not currently able to estimate the number of employees that we will hire during the next twelve months since that number will depend upon the rate at which our operations expand and upon the extent to which we engage third parties to perform required services.
From time to time, we use the services of independent consultants and contractors to perform various professional services, particularly in the areas of geology and geophysics, construction, design, well site surveillance and supervision, permitting and environmental assessment and legal and income tax preparation and accounting services. Independent contractors, at our request, drill our wells and perform field and on-site production operation services for us, including pumping, maintenance, dispatching, inspection and testing.
GLOSSARY OF OIL AND NATURAL GAS TERMS
The following is a description of the meanings of some of the oil and natural gas terms used in this Annual Report.
Bbl
. One stock tank barrel, or 42 U.S. gallons liquid volume, used in this Annual Report in reference to crude oil or other liquid hydrocarbons.
Bcf.
An abbreviation for billion cubic feet. Unit used to measure large quantities of gas, approximately equal to 1 trillion Btu.
BOE
. Barrels of oil equivalent, determined using the ratio of one Bbl of crude oil, condensate or natural gas liquids, to six Mcf of natural gas.
Boepd
. Barrels of oil equivalent per day.
Bopd
. Barrels of oil per day.
Btu or British thermal unit
. The quantity of heat required to raise the temperature of one pound of water by one degree Fahrenheit.
Completion
. The operations required to establish production of oil or natural gas from a wellbore, usually involving perforations, stimulation and/or installation of permanent equipment in the well or, in the case of a dry hole, the reporting of abandonment to the appropriate agency.
Condensate
. Liquid hydrocarbons associated with the production of a primarily natural gas reserve.
Conventional resources
. Natural gas or oil that is produced by a well drilled into a geologic formation in which the reservoir and fluid characteristics permit the natural gas or oil to readily flow to the wellbore.
Developed acreage
. The number of acres that are allocated or assignable to productive wells.
Development well
. A well drilled into a proved oil or natural gas reservoir to the depth of a stratigraphic horizon known to be productive.
Estimated ultimate recovery or EUR
. Estimated ultimate recovery is the sum of reserves remaining as of a given date and cumulative production as of that date.
31
Exploratory well
. A well drilled to find and produce oil or natural gas reserves not classified as proved, to find a new reservoir in a field previously found to be productive of oil or natural gas in another reservoir or to extend a known reservoir.
Farmin or farmout
. An agreement under which the owner of a working interest in an oil or natural gas lease assigns the working interest or a portion of the working interest to another party who desires to drill on the leased acreage. Generally, the assignee is required to drill one or more wells in order to earn its interest in the acreage. The assignor usually retains a royalty or reversionary interest in the lease. The interest received by an assignee is a “farmin” while the interest transferred by the assignor is a “farmout.”
FERC
. Federal Energy Regulatory Commission.
Field
. An area consisting of a single reservoir or multiple reservoirs all grouped on or related to the same individual geological structural feature and/or stratigraphic condition.
Gross acres or gross wells
. The total acres or wells in which a working interest is owned.
Held by production
. An oil and natural gas property under lease in which the lease continues to be in force after the primary term of the lease in accordance with its terms as a result of production from the property.
Horizontal drilling or well
. A drilling operation in which a portion of the well is drilled horizontally within a productive or potentially productive formation. This operation typically yields a horizontal well that has the ability to produce higher volumes than a vertical well drilled in the same formation. A horizontal well is designed to replace multiple vertical wells, resulting in lower capital expenditures for draining like acreage and limiting surface disruption.
Liquids
. Liquids, or natural gas liquids, are marketable liquid products including ethane, propane, butane and pentane resulting from the further processing of liquefiable hydrocarbons separated from raw natural gas by a natural gas processing facility.
MBbl
. One thousand barrels of crude oil or other liquid hydrocarbons.
Mcf
. One thousand cubic feet of natural gas.
Mcfgpd
. Thousands of cubic feet of natural gas per day.
MMcf
. One million cubic feet of natural gas.
MMBtu
. One million British thermal units.
Net acres or net wells
. The sum of the fractional working interest owned in gross acres or wells.
Net revenue interest
. The interest that defines the percentage of revenue that an owner of a well receives from the sale of oil, natural gas and/or natural gas liquids that are produced from the well.
NYMEX
. New York Mercantile Exchange.
Permeability
. A reference to the ability of oil and/or natural gas to flow through a reservoir.
Petrophysical analysis
. The interpretation of well log measurements, obtained from a string of electronic tools inserted into the borehole, and from core measurements, in which rock samples are retrieved from the subsurface, then combining these measurements with other relevant geological and geophysical information to describe the reservoir rock properties.
Play
. A set of known or postulated oil and/or natural gas accumulations sharing similar geologic, geographic and temporal properties, such as source rock, migration pathways, timing, trapping mechanism and hydrocarbon type.
Possible reserves
. Additional reserves that are less certain to be recognized than probable reserves.
Probable reserves
. Additional reserves that are less certain to be recognized than proved reserves but which, in sum with proved reserves, are as likely as not to be recovered.
Producing well, production well or productive well
. A well that is found to be capable of producing hydrocarbons in sufficient quantities such that proceeds from the sale of the well’s production exceed production-related expenses and taxes.
32
Properties
. Natural gas and oil wells, production and related equipment and facilities and natural gas, oil or other mineral fee, leasehold and related interests.
Prospect
. A specific geographic area which, based on supporting geological, geophysical or other data and also preliminary economic analysis using reasonably anticipated prices and costs, is considered to have potential for the discovery of commercial hydrocarbons.
Proved developed reserves
. Proved reserves that can be expected to be recovered through existing wells and facilities and by existing operating methods.
Proved reserves
. Reserves of oil and natural gas that have been proved to a high degree of certainty by analysis of the producing history of a reservoir and/or by volumetric analysis of adequate geological and engineering data.
Proved undeveloped reserves
. Proved reserves that are expected to be recovered from new wells on undrilled acreage or from existing wells where a relatively major expenditure is required for recompletion.
Repeatability
. The potential ability to drill multiple wells within a prospect or trend.
Reservoir
. A porous and permeable underground formation containing a natural accumulation of producible oil and/or natural gas that is confined by impermeable rock or water barriers and is individual and separate from other reservoirs.
Royalty interest
. An interest in an oil and natural gas lease that gives the owner of the interest the right to receive a portion of the production from the leased acreage (or of the proceeds of the sale thereof), but generally does not require the owner to pay any portion of the costs of drilling or operating the wells on the leased acreage. Royalties may be either landowner’s royalties, which are reserved by the owner of the leased acreage at the time the lease is granted, or overriding royalties, which are usually reserved by an owner of the leasehold in connection with a transfer to a subsequent owner.
2-D seismic
. The method by which a cross-section of the earth’s subsurface is created through the interpretation of reflecting seismic data collected along a single source profile.
3-D seismic
. The method by which a three-dimensional image of the earth’s subsurface is created through the interpretation of reflection seismic data collected over a surface grid. 3-D seismic surveys allow for a more detailed understanding of the subsurface than do 2-D seismic surveys and contribute significantly to field appraisal, exploitation and production.
Trend
. A region of oil and/or natural gas production, the geographic limits of which have not been fully defined, having geological characteristics that have been ascertained through supporting geological, geophysical or other data to contain the potential for oil and/or natural gas reserves in a particular formation or series of formations.
Unconventional resource play
. A set of known or postulated oil and or natural gas resources or reserves warranting further exploration which are extracted from (a) low-permeability sandstone and shale formations and (b) coalbed methane. These plays require the application of advanced technology to extract the oil and natural gas resources.
Undeveloped acreage
. Lease acreage on which wells have not been drilled or completed to a point that would permit the production of commercial quantities of oil and natural gas, regardless of whether such acreage contains proved reserves. Undeveloped acreage is usually considered to be all acreage that is not allocated or assignable to productive wells.
Unproved and unevaluated properties
. Refers to properties where no drilling or other actions have been undertaken that permit such property to be classified as proved.
Vertical well
. A hole drilled vertically into the earth from which oil, natural gas or water flows is pumped.
Volumetric reserve analysis
. A technique used to estimate the amount of recoverable oil and natural gas. It involves calculating the volume of reservoir rock and adjusting that volume for the rock porosity, hydrocarbon saturation, formation volume factor and recovery factor.
Wellbore
. The hole made by a well.
Working interest
. The operating interest that gives the owner the right to drill, produce and conduct operating activities on the property and receive a share of production.
33
ITEM 1A. RISK FACTORS.
An investment in our common stock involves a high degree of risk. You should carefully consider the risks described below as well as the other information in this filing before deciding to invest in our company. Any of the risk factors described below could significantly and adversely affect our business, prospects, financial condition and results of operations. Additional risks and uncertainties not currently known or that are currently considered to be immaterial may also materially and adversely affect our business, prospects, financial condition and results of operations. As a result, the trading price or value of our common stock could be materially adversely affected and you may lose all or part of your investment.
Risks Related to the Oil and Natural Gas Industry and Our Business
We have a limited operating history and expect to continue to incur losses for an indeterminable period of time.
We have a limited operating history and are engaged in the initial stages of exploration, development and exploitation of our leasehold acreage and will continue to be so until commencement of substantial production from our oil and natural gas properties, which will depend upon successful drilling results, additional and timely capital funding, and access to suitable infrastructure. Companies in their initial stages of development face substantial business risks and may suffer significant losses. We have generated substantial net losses and negative cash flows from operating activities in the past and expect to continue to incur substantial net losses as we continue our drilling program. In considering an investment in our common stock, you should consider that there is only limited historical and financial operating information available upon which to base your evaluation of our performance. We have incurred losses from operations of $30,922,151 from the date of inception (February 9, 2011) through December 31, 2013. Additionally, we are dependent on obtaining additional debt and/or equity financing to roll-out and scale our planned principal business operations. Management’s plans in regard to these matters consist principally of seeking additional debt and/or equity financing combined with expected cash flows from current oil and gas assets held and additional oil and gas assets that we may acquire. Our efforts may not be successful and funds may not be available on favorable terms, if at all.
We face challenges and uncertainties in financial planning as a result of the unavailability of historical data and uncertainties regarding the nature, scope and results of our future activities. New companies must develop successful business relationships, establish operating procedures, hire staff, install management information and other systems, establish facilities and obtain licenses, as well as take other measures necessary to conduct their intended business activities. We may not be successful in implementing our business strategies or in completing the development of the infrastructure necessary to conduct our business as planned. In the event that one or more of our drilling programs is not completed or is delayed or terminated, our operating results will be adversely affected and our operations will differ materially from the activities described in this Annual Report. As a result of industry factors or factors relating specifically to us, we may have to change our methods of conducting business, which may cause a material adverse effect on our results of operations and financial condition. The uncertainty and risks described in this Annual Report may impede our ability to economically find, develop, exploit and acquire oil and natural gas reserves. As a result, we may not be able to achieve or sustain profitability or positive cash flows provided by our operating activities in the future.
We will need additional capital to complete future acquisitions, conduct our operations and fund our business and our ability to obtain the necessary funding is uncertain.
We will need to raise additional funding to complete future potential acquisitions and may need to raise additional funds through public or private debt or equity financing or other various means to fund our operations, acquire assets and complete exploration and drilling operations. In such a case, adequate funds may not be available when needed or may not be available on favorable terms. If we need to raise additional funds in the future, by issuing equity securities, dilution to existing stockholders will result, and such securities may have rights, preferences and privileges senior to those of our common stock. If funding is insufficient at any time in the future and we are unable to generate sufficient revenue from new business arrangements, to complete planned acquisitions or operations, our results of operations and the value of our securities could be adversely affected.
34
Our $34.5 million Wattenberg Asset acquisition debt facility and $15.5 million drilling facility, includes various covenants, reduces our financial flexibility, increases our interest expense and may adversely impact our operations and our costs.
In connection with our acquisition of the Wattenberg Asset on March 7, 2014, we entered into a senior debt facility pursuant to which we borrowed $34.5 million, and have an additional $15.5 million available for future drilling operations, subject to the terms and conditions of such facility (as described in greater detail below in the risk factor entitled “Our ability to borrow additional funds under the debt facility is subject to certain requirements and limitations set forth in our debt facility”), which amounts represent a significant amount of additional indebtedness. The debt facility includes various covenants (positive and negative) binding us, including:
|
●
|
requiring that we maintain the registration of our common stock under Section 12 of the Securities Exchange Act of 1934, as amended;
|
|
●
|
requiring that we maintain the listing of our common stock on the NYSE MKT;
|
|
●
|
requiring that we timely file periodic reports under the Exchange Act;
|
|
●
|
requiring that we provide the lenders yearly and quarterly budgets and certain reserve reports;
|
|
●
|
requiring that we provide capital expenditure plans to the lenders prior to making certain expenditures;
|
|
●
|
prohibiting us and our subsidiaries from creating or becoming subject to any indebtedness, except pursuant to certain limited exceptions; and
|
|
●
|
prohibiting us or our subsidiaries from merging, selling their assets (except in the usual course of business), altering our organizational structure, winding up or liquidating, except in certain limited circumstances.
|
This new debt facility affects our operations in several ways, including the following:
|
●
|
a significant portion of our cash flows must be used to service the debt facility, including the obligation to pay monthly in arrears interest accruing at 15% per annum, and the monthly obligation to prepay the debt in an amount equal to the lesser of (a) the outstanding principal amount of the debt and (b) twenty-five percent (25%) of the aggregate of all net revenues actually received by us and our subsidiaries;
|
|
●
|
the high level of debt could increase our vulnerability to general adverse economic and industry conditions;
|
|
●
|
limiting our ability to borrow additional funds, dispose of assets, pay dividends and make certain investments; and
|
|
●
|
the debt covenants may affect our flexibility in planning for, and reacting to, changes in the economy and in our industry.
|
The high level of indebtedness under this new debt facility increases the risk that we may default on our debt obligations. We may not be able to generate sufficient cash flows to pay the principal or interest on our debt, 25% of any revenues we do generate will be required to be used to repay the debt, and future working capital, borrowings or equity financing may not be available to pay or refinance such debt. If we do not have sufficient funds and are otherwise unable to arrange financing to pay the interest or principal due on the debt, fund our business plan and satisfy our other obligations and liabilities, we may have to sell significant assets or have a portion of our assets foreclosed upon which could have a material adverse effect on our business, financial condition and results of operations.
We do not currently have any commitments of additional capital except pursuant to the terms of the debt facility. We can provide no assurance that additional financing will be available on favorable terms, if at all. If we choose to raise additional capital through the sale of other debt or equity securities, such sales may cause substantial dilution to our existing shareholders.
The repayment of our debt facility is secured by a security interest in all of our assets.
The repayment of our debt facility (which currently has an outstanding principal balance of $34.5 million and provides us the option, pursuant to the terms of the debt facility, to borrow an additional $15.5 million) is secured by a first priority security interest in all of our assets, property, real property and the securities of our subsidiaries and the repayment of such debt is further guaranteed by certain of our subsidiaries. If we default in the repayment of the debt facility and/or any of the terms and conditions thereof, the lenders may enforce their security interest over our assets which secure the repayment of such debt, and we could be forced to curtail or abandon our current business plans and operations. If that were to happen, any investment in the Company could become worthless.
35
Our ability to borrow additional funds under the debt facility is subject to certain requirements and limitations set forth in our debt facility.
From time to time, subject to the terms and conditions of the debt facility (including the requirement that we deposited funds in an aggregate amount of any additional requested loan into a segregated bank account (the “Company Deposits”)), we have the right to request additional loans under our debt facility up to an additional $15.5 million in total or an aggregate of $50 million under such debt facility. We are required to pay original issue discounts in the amount of 5% of the funds borrowed, underwriting fees in the amount of 10% of the amount of the funds borrowed, reimburse certain of the legal fees of the lender’s counsel, and pay applicable investment banking fees representing 5% of any funds borrowed, in connection with funds borrowed. Funds borrowed are only eligible to be used by us, together with Company Deposits, for approved authorization for expenditures (“AFEs”) issued for a well or wells to be drilled and completed on any properties acquired in connection with the Wattenberg Asset, or the Mississippian Asset (the “Permitted Expenditures”). In the event we drill a dry hole, we are prohibited from using any additional proceeds borrowed under the debt facility without the consent of the lender. Additionally, no proceeds we receive from the transfer, sale, assignment or farm-out of the Mississippian Asset may be used to fund the Company Deposits. The requirement that we put up funds equal to any further borrowing under the facility, fees required to be paid in connection with such further loans and the restrictions on our ability to borrow funds under such debt facility and our use of such funds may limit our ability to borrow funds under such facility, complete our planned business operations with funds from such debt facility, and increase our cost of borrowing, which individually or in the aggregate could have a material adverse effect on our results of operations.
The occurrence of an event of default under the notes sold in connection with our debt facility could have a material adverse effect on us and our financial condition.
The notes issued in connection with our debt facility include standard and customary events of default, including, among other things, our or any subsidiary’s default in the payment of any indebtedness under any agreement, or failure to comply with the terms and conditions of any other agreement related to indebtedness or otherwise, if the effect of such failure or default, is to cause, or permit the holder or holders thereof, or any counterparty to an agreement relating to indebtedness, to cause indebtedness, or amounts due thereunder, in an aggregate amount of $250,000 or more to become due prior to its stated date of maturity or the date such amount would otherwise have been due notwithstanding such default, subject to certain exclusions; the loss, suspension or revocation of, or failure to renew, any license or permit, if such license or permit is not obtained or reinstated within thirty (30) days, unless such loss, suspension, revocation or failure to renew could not reasonably be expected to have a material adverse effect on us; or there is filed against us or any of our subsidiaries or any of our officers, members or managers any civil or criminal action, suit or proceeding under any federal or state racketeering statute (including, without limitation, the Racketeer Influenced and Corrupt Organization Act of 1970), or any civil or criminal action, suit or proceeding under any other applicable law is filed by any governmental entity, that could result in the confiscation or forfeiture of any material portion of any collateral subject to any security interest held by the investors or their agent or other assets of such entity or person, and such action, suit or proceeding is not dismissed within one hundred twenty (120) days.
Upon an event of default under the notes, the holder of such note may declare the entire unpaid balance (as well as any interest, fees and expenses) immediately due and payable. Funding to repay such notes may not be available timely, on favorable terms, if at all, and any default by us of the terms and conditions of the notes would likely have a material adverse effect on our results of operations, financial condition and the value of our common stock.
Drilling for and producing oil and natural gas are highly speculative and involve a high degree of risk, with many uncertainties that could adversely affect our business. We have not recorded significant proved reserves, and areas that we decide to drill may not yield oil or natural gas in commercial quantities or at all.
Exploring for and developing hydrocarbon reserves involves a high degree of operational and financial risk, which precludes us from definitively predicting the costs involved and time required to reach certain objectives. Our potential drilling locations are in various stages of evaluation, ranging from locations that are ready to drill to locations that will require substantial additional interpretation before they can be drilled. The budgeted costs of planning, drilling, completing and operating wells are often exceeded and such costs can increase significantly due to various complications that may arise during the drilling and operating processes. Before a well is spud, we may incur significant geological and geophysical (seismic) costs, which are incurred whether a well eventually produces commercial quantities of hydrocarbons or is drilled at all. Exploration wells bear a much greater risk of loss than development wells. The analogies we draw from available data from other wells, more fully explored locations or producing fields may not be applicable to our drilling locations. If our actual drilling and development costs are significantly more than our estimated costs, we may not be able to continue our operations as proposed and could be forced to modify our drilling plans accordingly.
36
If we decide to drill a certain location, there is a risk that no commercially productive oil or natural gas reservoirs will be found or produced. We may drill or participate in new wells that are not productive. We may drill wells that are productive, but that do not produce sufficient net revenues to return a profit after drilling, operating and other costs. There is no way to predict in advance of drilling and testing whether any particular location will yield oil or natural gas in sufficient quantities to recover exploration, drilling or completion costs or to be economically viable. Even if sufficient amounts of oil or natural gas exist, we may damage the potentially productive hydrocarbon-bearing formation or experience mechanical difficulties while drilling or completing the well, resulting in a reduction in production and reserves from the well or abandonment of the well. Whether a well is ultimately productive and profitable depends on a number of additional factors, including the following:
|
●
|
general economic and industry conditions, including the prices received for oil and natural gas;
|
|
●
|
shortages of, or delays in, obtaining equipment, including hydraulic fracturing equipment, and qualified personnel;
|
|
●
|
potential drainage by operators on adjacent properties;
|
|
●
|
loss of or damage to oilfield development and service tools;
|
|
●
|
problems with title to the underlying properties;
|
|
●
|
increases in severance taxes;
|
|
●
|
adverse weather conditions that delay drilling activities or cause producing wells to be shut down;
|
|
●
|
domestic and foreign governmental regulations; and
|
|
●
|
proximity to and capacity of transportation facilities.
|
If we do not drill productive and profitable wells in the future, our business, financial condition and results of operations could be materially and adversely affected.
Our success is dependent on the prices of oil and natural gas. Low oil or natural gas prices and the substantial volatility in these prices may adversely affect our business, financial condition and results of operations and our ability to meet our capital expenditure requirements and financial obligations.
The prices we receive for our oil and natural gas heavily influence our revenue, profitability, cash flow available for capital expenditures, access to capital and future rate of growth. Oil and natural gas are commodities and, therefore, their prices are subject to wide fluctuations in response to relatively minor changes in supply and demand. Historically, the prices for oil and natural gas have been volatile. For example, for the four years ended December 31, 2013, the NYMEX - WTI oil price ranged from a high of $113.93 per Bbl to a low of $68.01 per Bbl, while the NYMEX - Henry Hub natural gas price ranged from a high of $7.51 per MMBtu to a low of $1.82 per MMBtu. These markets will likely continue to be volatile in the future. The prices we receive for our production, and the levels of our production, depend on numerous factors. These factors include the following:
|
●
|
the domestic and foreign supply of oil and natural gas;
|
|
●
|
the domestic and foreign demand for oil and natural gas;
|
|
●
|
the prices and availability of competitors’ supplies of oil and natural gas;
|
|
●
|
the actions of the Organization of Petroleum Exporting Countries, or OPEC, and state-controlled oil companies relating to oil price and production controls;
|
|
●
|
the price and quantity of foreign imports of oil and natural gas;
|
|
●
|
the impact of U.S. dollar exchange rates on oil and natural gas prices;
|
|
●
|
domestic and foreign governmental regulations and taxes;
|
|
●
|
speculative trading of oil and natural gas futures contracts;
|
|
●
|
localized supply and demand fundamentals, including the availability, proximity and capacity of gathering and transportation systems for natural gas;
|
37
|
●
|
the availability of refining capacity;
|
|
●
|
the prices and availability of alternative fuel sources;
|
|
●
|
weather conditions and natural disasters;
|
|
●
|
political conditions in or affecting oil and natural gas producing regions, including the Middle East and South America;
|
|
●
|
the continued threat of terrorism and the impact of military action and civil unrest;
|
|
●
|
public pressure on, and legislative and regulatory interest within, federal, state and local governments to stop, significantly limit or regulate hydraulic fracturing activities;
|
|
●
|
the level of global oil and natural gas inventories and exploration and production activity;
|
|
●
|
authorization of exports from the Unites States of liquefied natural gas;
|
|
●
|
the impact of energy conservation efforts;
|
|
●
|
technological advances affecting energy consumption; and
|
|
●
|
overall worldwide economic conditions.
|
Declines in oil or natural gas prices would not only reduce our revenue, but could reduce the amount of oil and natural gas that we can produce economically. Should natural gas or oil prices decrease from current levels and remain there for an extended period of time, we may elect in the future to delay some of our exploration and development plans for our prospects, or to cease exploration or development activities on certain prospects due to the anticipated unfavorable economics from such activities, and, as a result, we may have to make substantial downward adjustments to our estimated proved reserves, each of which would have a material adverse effect on our business, financial condition and results of operations.
Our exploration, development and exploitation projects require substantial capital expenditures that may exceed cash on hand, cash flows from operations and potential borrowings, and we may be unable to obtain needed capital on satisfactory terms, which could adversely affect our future growth.
Our exploration and development activities are capital intensive. We make and expect to continue to make substantial capital expenditures in our business for the development, exploitation, production and acquisition of oil and natural gas reserves. Our cash on hand, our operating cash flows and future potential borrowings may not be adequate to fund our future acquisitions or future capital expenditure requirements. The rate of our future growth may be dependent, at least in part, on our ability to access capital at rates and on terms we determine to be acceptable.
Our cash flows from operations and access to capital are subject to a number of variables, including:
|
●
|
our estimated proved oil and natural gas reserves;
|
|
●
|
the amount of oil and natural gas we produce from existing wells;
|
|
●
|
the prices at which we sell our production;
|
|
●
|
the costs of developing and producing our oil and natural gas reserves;
|
|
●
|
our ability to acquire, locate and produce new reserves;
|
|
●
|
the ability and willingness of banks to lend to us; and
|
|
●
|
our ability to access the equity and debt capital markets.
|
38
In addition, future events, such as terrorist attacks, wars or combat peace-keeping missions, financial market disruptions, general economic recessions, oil and natural gas industry recessions, large company bankruptcies, accounting scandals, overstated reserves estimates by major public oil companies and disruptions in the financial and capital markets have caused financial institutions, credit rating agencies and the public to more closely review the financial statements, capital structures and earnings of public companies, including energy companies. Such events have constrained the capital available to the energy industry in the past, and such events or similar events could adversely affect our access to funding for our operations in the future.
If our revenues decrease as a result of lower oil and natural gas prices, operating difficulties, declines in reserves or for any other reason, we may have limited ability to obtain the capital necessary to sustain our operations at current levels, further develop and exploit our current properties or invest in additional exploration opportunities. Alternatively, a significant improvement in oil and natural gas prices or other factors could result in an increase in our capital expenditures and we may be required to alter or increase our capitalization substantially through the issuance of debt or equity securities, the sale of production payments, the sale or farm out of interests in our assets, the borrowing of funds or otherwise to meet any increase in capital needs. If we are unable to raise additional capital from available sources at acceptable terms, our business, financial condition and results of operations could be adversely affected. Further, future debt financings may require that a portion of our cash flows provided by operating activities be used for the payment of principal and interest on our debt, thereby reducing our ability to use cash flows to fund working capital, capital expenditures and acquisitions. Debt financing may involve covenants that restrict our business activities. If we succeed in selling additional equity securities to raise funds, at such time the ownership percentage of our existing stockholders would be diluted, and new investors may demand rights, preferences or privileges senior to those of existing stockholders. If we choose to farm-out interests in our prospects, we may lose operating control over such prospects.
Our oil and natural gas reserves are estimated and may not reflect the actual volumes of oil and natural gas we will receive, and significant inaccuracies in these reserve estimates or underlying assumptions will materially affect the quantities and present value of our reserves.
The process of estimating accumulations of oil and natural gas is complex and is not exact, due to numerous inherent uncertainties. The process relies on interpretations of available geological, geophysical, engineering and production data. The extent, quality and reliability of this technical data can vary. The process also requires certain economic assumptions related to, among other things, oil and natural gas prices, drilling and operating expenses, capital expenditures, taxes and availability of funds. The accuracy of a reserves estimate is a function of:
|
●
|
the quality and quantity of available data;
|
|
●
|
the interpretation of that data;
|
|
●
|
the judgment of the persons preparing the estimate; and
|
|
●
|
the accuracy of the assumptions.
|
The accuracy of any estimates of proved reserves generally increases with the length of the production history. Due to the limited production history of our properties, the estimates of future production associated with these properties may be subject to greater variance to actual production than would be the case with properties having a longer production history. As our wells produce over time and more data is available, the estimated proved reserves will be re-determined on at least an annual basis and may be adjusted to reflect new information based upon our actual production history, results of exploration and development, prevailing oil and natural gas prices and other factors.
Actual future production, oil and natural gas prices, revenues, taxes, development expenditures, operating expenses and quantities of recoverable oil and natural gas most likely will vary from our estimates. It is possible that future production declines in our wells may be greater than we have estimated. Any significant variance to our estimates could materially affect the quantities and present value of our reserves.
We may have accidents, equipment failures or mechanical problems while drilling or completing wells or in production activities, which could adversely affect our business.
While we are drilling and completing wells or involved in production activities, we may have accidents or experience equipment failures or mechanical problems in a well that cause us to be unable to drill and complete the well or to continue to produce the well according to our plans. We may also damage a potentially hydrocarbon-bearing formation during drilling and completion operations. Such incidents may result in a reduction of our production and reserves from the well or in abandonment of the well.
39
Our operations are subject to operational hazards and unforeseen interruptions for which we may not be adequately insured.
There are numerous operational hazards inherent in oil and natural gas exploration, development, production and gathering, including:
|
●
|
unusual or unexpected geologic formations;
|
|
●
|
natural disasters;
|
|
●
|
adverse weather conditions;
|
|
●
|
unanticipated pressures;
|
|
●
|
loss of drilling fluid circulation;
|
|
●
|
blowouts where oil or natural gas flows uncontrolled at a wellhead;
|
|
●
|
cratering or collapse of the formation;
|
|
●
|
pipe or cement leaks, failures or casing collapses;
|
|
●
|
fires or explosions;
|
|
●
|
releases of hazardous substances or other waste materials that cause environmental damage;
|
|
●
|
pressures or irregularities in formations; and
|
|
●
|
equipment failures or accidents.
|
In addition, there is an inherent risk of incurring significant environmental costs and liabilities in the performance of our operations, some of which may be material, due to our handling of petroleum hydrocarbons and wastes, our emissions to air and water, the underground injection or other disposal of our wastes, the use of hydraulic fracturing fluids and historical industry operations and waste disposal practices.
Any of these or other similar occurrences could result in the disruption or impairment of our operations, substantial repair costs, personal injury or loss of human life, significant damage to property, environmental pollution and substantial revenue losses. The location of our wells, gathering systems, pipelines and other facilities near populated areas, including residential areas, commercial business centers and industrial sites, could significantly increase the level of damages resulting from these risks. Insurance against all operational risks is not available to us. We are not fully insured against all risks, including development and completion risks that are generally not recoverable from third parties or insurance. In addition, pollution and environmental risks generally are not fully insurable. We maintain $2 million general liability coverage and $10 million umbrella coverage that covers our and our subsidiaries’ business and operations. Our wholly-owned subsidiary, Red Hawk, which operates our Wattenberg Asset, also maintains a $10 million control of well insurance policy that covers its operations in Colorado, and our partially-owned subsidiary, Condor, which operates our current Niobrara Asset, maintains a $10 million control of well insurance policy, a $2 million commercial general liability insurance policy, and a $10 million umbrella insurance policy that covers its operations in Colorado. With respect to our other non-operated assets, we may elect not to obtain insurance if we believe that the cost of available insurance is excessive relative to the perceived risks presented. Losses could, therefore, occur for uninsurable or uninsured risks or in amounts in excess of existing insurance coverage. Moreover, insurance may not be available in the future at commercially reasonable prices or on commercially reasonable terms. Changes in the insurance markets due to various factors may make it more difficult for us to obtain certain types of coverage in the future. As a result, we may not be able to obtain the levels or types of insurance we would otherwise have obtained prior to these market changes, and the insurance coverage we do obtain may not cover certain hazards or all potential losses that are currently covered, and may be subject to large deductibles. Losses and liabilities from uninsured and underinsured events and delay in the payment of insurance proceeds could have a material adverse effect on our business, financial condition and results of operations.
40
Our strategy as an onshore unconventional resource player may result in operations concentrated in certain geographic areas and may increase our exposure to many of the risks described in this Annual Report.
Our initial operations are concentrated in the States of Colorado, Texas, and Kansas. This concentration may increase the potential impact of many of the risks described in this Annual Report. For example, we may have greater exposure to regulatory actions impacting these four states, natural disasters in these states, competition for equipment, services and materials available in the areas and access to infrastructure and markets in those areas.
Unless we replace our oil and natural gas reserves, our reserves and production will decline, which would adversely affect our business, financial condition and results of operations.
The rate of production from our oil and natural gas properties will decline as our reserves are depleted. Our future oil and natural gas reserves and production and, therefore, our income and cash flow, are highly dependent on our success in (a) efficiently developing and exploiting our current reserves on properties owned by us or by other persons or entities and (b) economically finding or acquiring additional oil and natural gas producing properties. In the future, we may have difficulty acquiring new properties. During periods of low oil and/or natural gas prices, it will become more difficult to raise the capital necessary to finance expansion activities. If we are unable to replace our production, our reserves will decrease, and our business, financial condition and results of operations would be adversely affected.
Our strategy includes acquisitions of oil and natural gas properties, and our failure to identify or complete future acquisitions successfully could reduce our earnings and hamper our growth.
We may be unable to identify properties for acquisition or to make acquisitions on terms that we consider economically acceptable. There is intense competition for acquisition opportunities in our industry. Competition for acquisitions may increase the cost of, or cause us to refrain from, completing acquisitions. The completion and pursuit of acquisitions may be dependent upon, among other things, our ability to obtain debt and equity financing and, in some cases, regulatory approvals. Our ability to grow through acquisitions will require us to continue to invest in operations, financial and management information systems and to attract, retain, motivate and effectively manage our employees. The inability to manage the integration of acquisitions effectively could reduce our focus on subsequent acquisitions and current operations, and could negatively impact our results of operations and growth potential. Our financial position and results of operations may fluctuate significantly from period to period as a result of the completion of significant acquisitions during particular periods. If we are not successful in identifying or acquiring any material property interests, our earnings could be reduced and our growth could be restricted.
We may engage in bidding and negotiating to complete successful acquisitions. We may be required to alter or increase substantially our capitalization to finance these acquisitions through the use of cash on hand, the issuance of debt or equity securities, the sale of production payments, the sale of non-strategic assets, the borrowing of funds or otherwise. If we were to proceed with one or more acquisitions involving the issuance of our common stock, our shareholders would suffer dilution of their interests. Furthermore, our decision to acquire properties that are substantially different in operating or geologic characteristics or geographic locations from areas with which our staff is familiar may impact our productivity in such areas.
We may purchase oil and natural gas properties with liabilities or risks that we did not know about or that we did not assess correctly, and, as a result, we could be subject to liabilities that could adversely affect our results of operations.
Before acquiring oil and natural gas properties, we estimate the reserves, future oil and natural gas prices, operating costs, potential environmental liabilities and other factors relating to the properties. However, our review involves many assumptions and estimates, and their accuracy is inherently uncertain. As a result, we may not discover all existing or potential problems associated with the properties we buy. We may not become sufficiently familiar with the properties to assess fully their deficiencies and capabilities. We do not generally perform inspections on every well or property, and we may not be able to observe mechanical and environmental problems even when we conduct an inspection. The seller may not be willing or financially able to give us contractual protection against any identified problems, and we may decide to assume environmental and other liabilities in connection with properties we acquire. If we acquire properties with risks or liabilities we did not know about or that we did not assess correctly, our business, financial condition and results of operations could be adversely affected as we settle claims and incur cleanup costs related to these liabilities.
We may incur losses or costs as a result of title deficiencies in the properties in which we invest.
If an examination of the title history of a property that we have purchased reveals an oil and natural gas lease has been purchased in error from a person who is not the owner of the property, our interest would be worthless. In such an instance, the amount paid for such oil and natural gas lease as well as any royalties paid pursuant to the terms of the lease prior to the discovery of the title defect would be lost.
41
Prior to the drilling of an oil and natural gas well, it is the normal practice in the oil and natural gas industry for the person or company acting as the operator of the well to obtain a preliminary title review of the spacing unit within which the proposed oil and natural gas well is to be drilled to ensure there are no obvious deficiencies in title to the well. Frequently, as a result of such examinations, certain curative work must be done to correct deficiencies in the marketability of the title, and such curative work entails expense. Our failure to cure any title defects may adversely impact our ability in the future to increase production and reserves. In the future, we may suffer a monetary loss from title defects or title failure. Additionally, unproved and unevaluated acreage has greater risk of title defects than developed acreage. If there are any title defects or defects in assignment of leasehold rights in properties in which we hold an interest, we will suffer a financial loss which could adversely affect our business, financial condition and results of operations.
Our identified drilling locations are scheduled over several years, making them susceptible to uncertainties that could materially alter the occurrence or timing of their drilling.
Our management team has identified and scheduled drilling locations in our operating areas over a multi-year period. Our ability to drill and develop these locations depends on a number of factors, including the availability of equipment and capital, approval by regulators, seasonal conditions, oil and natural gas prices, assessment of risks, costs and drilling results. The final determination on whether to drill any of these locations will be dependent upon the factors described elsewhere in this filing and the documents incorporated by reference herein, as well as, to some degree, the results of our drilling activities with respect to our established drilling locations. Because of these uncertainties, we do not know if the drilling locations we have identified will be drilled within our expected timeframe or at all or if we will be able to economically produce hydrocarbons from these or any other potential drilling locations. Our actual drilling activities may be materially different from our current expectations, which could adversely affect our business, financial condition and results of operations.
We currently license only a limited amount of seismic and other geological data and may have difficulty obtaining additional data at a reasonable cost, which could adversely affect our future results of operations.
We currently license only a limited amount of seismic and other geological data to assist us in exploration and development activities. We intend to obtain access to additional data in our areas of interest through licensing arrangements with companies that own or have access to that data or by paying to obtain that data directly. Seismic and geological data can be expensive to license or obtain. We may not be able to license or obtain such data at an acceptable cost. In addition, even when properly interpreted, seismic data and visualization techniques are not conclusive in determining if hydrocarbons are present in economically producible amounts and seismic indications of hydrocarbon saturation are generally not reliable indicators of productive reservoir rock.
The unavailability or high cost of drilling rigs, completion equipment and services, supplies and personnel, including hydraulic fracturing equipment and personnel, could adversely affect our ability to establish and execute exploration and development plans within budget and on a timely basis, which could have a material adverse effect on our business, financial condition and results of operations.
Shortages or the high cost of drilling rigs, completion equipment and services, supplies or personnel could delay or adversely affect our operations. When drilling activity in the United States increases, associated costs typically also increase, including those costs related to drilling rigs, equipment, supplies and personnel and the services and products of other vendors to the industry. These costs may increase, and necessary equipment and services may become unavailable to us at economical prices. Should this increase in costs occur, we may delay drilling activities, which may limit our ability to establish and replace reserves, or we may incur these higher costs, which may negatively affect our business, financial condition and results of operations.
In addition, the demand for hydraulic fracturing services currently exceeds the availability of fracturing equipment and crews across the industry and in our operating areas in particular. The accelerated wear and tear of hydraulic fracturing equipment due to its deployment in unconventional oil and natural gas fields characterized by longer lateral lengths and larger numbers of fracturing stages has further amplified this equipment and crew shortage. If demand for fracturing services continues to increase or the supply of fracturing equipment and crews decreases, then higher costs could result and could adversely affect our business, financial condition and results of operations.
42
We have limited control over activities on properties we do not operate.
We are not the operator on some of our properties and, as a result, our ability to exercise influence over the operations of these properties or their associated costs is limited. Our dependence on the operators and other working interest owners of these projects and our limited ability to influence operations and associated costs or control the risks could materially and adversely affect the realization of our targeted returns on capital in drilling or acquisition activities. The success and timing of our drilling and development activities on properties operated by others therefore depends upon a number of factors, including:
|
●
|
timing and amount of capital expenditures;
|
|
●
|
the operator’s expertise and financial resources;
|
|
●
|
the rate of production of reserves, if any;
|
|
●
|
approval of other participants in drilling wells; and
|
|
●
|
selection of technology.
|
The marketability of our production is dependent upon oil and natural gas gathering and transportation facilities owned and operated by third parties, and the unavailability of satisfactory oil and natural gas transportation arrangements would have a material adverse effect on our revenue.
The unavailability of satisfactory oil and natural gas transportation arrangements may hinder our access to oil and natural gas markets or delay production from our wells. The availability of a ready market for our oil and natural gas production depends on a number of factors, including the demand for, and supply of, oil and natural gas and the proximity of reserves to pipelines and terminal facilities. Our ability to market our production depends in substantial part on the availability and capacity of gathering systems, pipelines and processing facilities owned and operated by third parties. Our failure to obtain these services on acceptable terms could materially harm our business. We may be required to shut-in wells for lack of a market or because of inadequacy or unavailability of pipeline or gathering system capacity. If that were to occur, we would be unable to realize revenue from those wells until production arrangements were made to deliver our production to market. Furthermore, if we were required to shut-in wells we might also be obligated to pay shut-in royalties to certain mineral interest owners in order to maintain our leases. We do not expect to purchase firm transportation capacity on third-party facilities. Therefore, we expect the transportation of our production to be generally interruptible in nature and lower in priority to those having firm transportation arrangements.
The disruption of third-party facilities due to maintenance and/or weather could negatively impact our ability to market and deliver our products. The third parties control when or if such facilities are restored and what prices will be charged. Federal and state regulation of oil and natural gas production and transportation, tax and energy policies, changes in supply and demand, pipeline pressures, damage to or destruction of pipelines and general economic conditions could adversely affect our ability to produce, gather and transport oil and natural gas.
Strategic relationships, including with MIE Holdings, STXRA, and RJ Resources, upon which we may rely, are subject to risks and uncertainties which may adversely affect our business, financial conditions and results of operations.
Our ability to explore, develop and produce oil and natural gas resources successfully and acquire oil and natural gas interests and acreage depends on our developing and maintaining close working relationships with industry participants and on our ability to select and evaluate suitable acquisition opportunities in a highly competitive environment. These realities are subject to risks and uncertainties that may adversely affect our business, financial condition and results of operations.
To develop our business, we will endeavor to use the business relationships of our management and board to enter into strategic relationships, which may take the form of contractual arrangements with other oil and natural gas companies, including those that supply equipment and other resources that we expect to use in our business. For example, we have entered into a strategic relationship with MIE Holdings with respect to several of our oil and natural gas interests, and have both retained STXRA as a key advisor for our exploration and drilling efforts, and formed Pacific Energy Technology Services, LLC as a jointly-owned technical services venture with STXRA to provide acquisition, engineering, and oil drilling and completion technology services in the United States and abroad. We have also entered into a strategic relationship with RJ Resources, a subsidiary of a New York-based investment management group with more than $1.3 billion in assets under management specializing in resource investment, whereby RJ Resources has become our equal working interest partner in our Wattenberg Asset, our Mississippian Asset, and our Kazakhstan asset, and has agreed to provided us with a $15.5 million drilling facility, subject to various conditions and requirements (as described in greater detail above in the risk factor entitled “Our ability to borrow additional funds under the debt facility is subject to certain requirements and limitations set forth in our debt facility”). We may not be able to establish these strategic relationships, or if established, we may not be able to maintain them. In addition, the dynamics of our relationships with strategic partners may require us to incur expenses or undertake activities we would not otherwise be inclined to incur in order to fulfill our obligations to these partners or maintain our relationships. If our strategic relationships are not established or maintained, our business, financial condition and results of operations may be adversely affected.
43
An increase in the differential between the NYMEX or other benchmark prices of oil and natural gas and the wellhead price we receive for our production could adversely affect our business, financial condition and results of operations.
The prices that we will receive for our oil and natural gas production sometimes may reflect a discount to the relevant benchmark prices, such as NYMEX, that are used for calculating hedge positions. The difference between the benchmark price and the prices we receive is called a differential. Increases in the differential between the benchmark prices for oil and natural gas and the wellhead price we receive could adversely affect our business, financial condition and results of operations. We do not have, and may not have in the future, any derivative contracts covering the amount of the basis differentials we experience in respect of our production. As such, we will be exposed to any increase in such differentials.
Our success depends, to a large extent, on our ability to retain our key personnel, including our Chairman of the Board, Chief Executive Officer and President, and our Chief Financial Officer and Executive Vice President, and the loss of any of our key personnel could disrupt our business operations.
Investors in our common stock must rely upon the ability, expertise, judgment and discretion of our management and the success of our technical team in identifying, evaluating and developing prospects and reserves. Our performance and success are dependent to a large extent on the efforts and continued employment of our management and technical personnel, including our Chairman, President and Chief Executive Officer, Frank C. Ingriselli, and our Chief Financial Officer and Executive Vice President, Michael L. Peterson. We do not believe that they could be quickly replaced with personnel of equal experience and capabilities, and their successors may not be as effective. If Mr. Ingriselli, Mr. Peterson, or any of our other key personnel resign or become unable to continue in their present roles and if they are not adequately replaced, our business operations could be adversely affected. Except for a $3 million insurance policy on the life of Mr. Ingriselli, we do not currently maintain any insurance against the loss of any of these individuals. Further, pursuant to the promissory notes issued pursuant to that certain Note Purchase Agreement, dated March 7, 2014, entered into by and between us and certain investors in connection with our acquisition of the Wattenberg Asset and creation of our $15.5 million drilling facility with RJ Resources, the investors have the right to require us to prepay the entire amount due under the notes if either Mr. Ingriselli or Mr. Peterson cease to be involved in the management of the Company or any subsidiary (except due to death, disability, removal by the Board of Directors, or resignation in order to serve his church, and if a replacement acceptable to the holders is appointed to replace such individual), subject to certain exceptions. Accordingly, the failure of either Mr. Ingriselli or Mr. Peterson to be involved with our management could result in us being required to prepay such debt prior to maturity, which could materially adversely affect us and disrupt our business operations.
We have an active board of directors that meets several times throughout the year and is intimately involved in our business and the determination of our operational strategies. Our board of directors work closely with management to identify potential prospects, funding sources, acquisitions and areas for further development. One of our directors has been involved with us since our inception and all of our directors have a deep understanding of our operations and culture. If any of our directors resign or become unable to continue in their present role, it may be difficult to find replacements with the same knowledge and experience and as a result, our operations may be adversely affected.
We may have difficulty managing growth in our business, which could have a material adverse effect on our business, financial condition and results of operations and our ability to execute our business plan in a timely fashion.
Because of our small size, growth in accordance with our business plans, if achieved, will place a significant strain on our financial, technical, operational and management resources. As we expand our activities, including our planned increase in oil exploration, development and production, and increase the number of projects we are evaluating or in which we participate, there will be additional demands on our financial, technical and management resources. The failure to continue to upgrade our technical, administrative, operating and financial control systems or the occurrence of unexpected expansion difficulties, including the inability to recruit and retain experienced managers, geoscientists, petroleum engineers and landmen could have a material adverse effect on our business, financial condition and results of operations and our ability to execute our business plan in a timely fashion.
44
We have identified material weaknesses in our internal control over financial reporting, and our business and stock price may be adversely affected if we do not adequately address those weaknesses or if we have other material weaknesses or significant deficiencies in our internal control over financial reporting.
As a public reporting company, we are required to establish and maintain appropriate internal controls over financial reporting. Rules adopted by the SEC pursuant to Section 404 of the Sarbanes-Oxley Act of 2002 require annual assessment of our internal control over financial reporting. The standards that must be met for management to assess the internal control over financial reporting as effective are complex, and require significant documentation, testing and possible remediation to meet the detailed standards. We may encounter problems or delays in completing activities necessary to make an assessment of our internal control over financial reporting. If we cannot assess our internal control over financial reporting as effective, investor confidence and share value may be negatively impacted. In addition, management’s assessment of internal controls over financial reporting may identify weaknesses and conditions that need to be addressed in our internal controls over financial reporting or other matters that may raise concerns for investors.
As described in this Annual Report, we conducted an evaluation of the effectiveness of our internal controls over financial reporting as of December 31, 2013. Based on that evaluation, we concluded that, as of such date, our internal controls over financial reporting were not effective due to deficiencies that existed in the design of our internal controls over financial reporting that adversely affected our internal controls, and that may be considered to be a material weakness. As a result of the early stage of our development, we have not fully implemented the necessary internal controls. The matters involving internal controls and procedures that our management considered to be material weaknesses were: (1) insufficient written policies and procedures for accounting and financial reporting with respect to the requirements and application of accounting principles generally accepted in the United States of America and SEC disclosure requirements; and (2) ineffective controls over period end financial disclosure and reporting processes.
Although we are in the process of taking steps to remediate these weaknesses, including hiring additional accounting staff to provide more resources and expand our technical accounting knowledge, we may continue to have material weaknesses or significant deficiencies in our internal controls. The existence of these or one or more other material weaknesses or significant deficiencies could result in errors in our financial statements, and substantial costs and resources may be required to rectify any internal control deficiencies. If we cannot produce reliable financial reports, investors could lose confidence in our reported financial information, the market price of our stock could decline significantly, we may be unable to obtain additional financing to operate and expand our business, and our business and financial condition could be harmed.
Financial difficulties encountered by our oil and natural gas purchasers, third-party operators or other third parties could decrease our cash flow from operations and adversely affect the exploration and development of our prospects and assets.
We will derive substantially all of our revenues from the sale of our oil and natural gas to unaffiliated third-party purchasers, independent marketing companies and mid-stream companies. Any delays in payments from our purchasers caused by financial problems encountered by them will have an immediate negative effect on our results of operations.
Liquidity and cash flow problems encountered by our working interest co-owners or the third-party operators of our non-operated properties may prevent or delay the drilling of a well or the development of a project. Our working interest co-owners may be unwilling or unable to pay their share of the costs of projects as they become due. In the case of a farmout party, we would have to find a new farmout party or obtain alternative funding in order to complete the exploration and development of the prospects subject to a farmout agreement. In the case of a working interest owner, we could be required to pay the working interest owner’s share of the project costs. We cannot assure you that we would be able to obtain the capital necessary to fund either of these contingencies or that we would be able to find a new farmout party.
The calculated present value of future net revenues from our proved reserves will not necessarily be the same as the current market value of our estimated oil and natural gas reserves.
You should not assume that the present value of future net cash flows as included in our public filings is the current market value of our estimated proved oil and natural gas reserves. We generally base the estimated discounted future net cash flows from proved reserves on current costs held constant over time without escalation and on commodity prices using an unweighted arithmetic average of first-day-of-the-month index prices, appropriately adjusted, for the 12-month period immediately preceding the date of the estimate. Actual future prices and costs may be materially higher or lower than the prices and costs used for these estimates and will be affected by factors such as:
|
●
|
actual prices we receive for oil and natural gas;
|
|
●
|
actual cost and timing of development and production expenditures;
|
45
|
●
|
the amount and timing of actual production; and
|
|
●
|
changes in governmental regulations or taxation.
|
In addition, the 10% discount factor that is required to be used to calculate discounted future net revenues for reporting purposes under GAAP is not necessarily the most appropriate discount factor based on the cost of capital in effect from time to time and risks associated with our business and the oil and natural gas industry in general.
We may incur additional indebtedness which could reduce our financial flexibility, increase interest expense and adversely impact our operations and our unit costs.
In the future, we may incur significant amounts of additional indebtedness in order to make acquisitions or to develop our properties. Our level of indebtedness could affect our operations in several ways, including the following:
|
●
|
a significant portion of our cash flows could be used to service our indebtedness;
|
|
●
|
a high level of debt would increase our vulnerability to general adverse economic and industry conditions;
|
|
●
|
any covenants contained in the agreements governing our outstanding indebtedness could limit our ability to borrow additional funds, dispose of assets, pay dividends and make certain investments;
|
|
●
|
a high level of debt may place us at a competitive disadvantage compared to our competitors that are less leveraged and, therefore, may be able to take advantage of opportunities that our indebtedness may prevent us from pursuing; and
|
|
●
|
debt covenants to which we may agree may affect our flexibility in planning for, and reacting to, changes in the economy and in our industry.
|
A high level of indebtedness increases the risk that we may default on our debt obligations. We may not be able to generate sufficient cash flows to pay the principal or interest on our debt, and future working capital, borrowings or equity financing may not be available to pay or refinance such debt. If we do not have sufficient funds and are otherwise unable to arrange financing, we may have to sell significant assets or have a portion of our assets foreclosed upon which could have a material adverse effect on our business, financial condition and results of operations.
Competition in the oil and natural gas industry is intense, making it difficult for us to acquire properties, market oil and natural gas and secure trained personnel.
Our ability to acquire additional prospects and to find and develop reserves in the future will depend on our ability to evaluate and select suitable properties and to consummate transactions in a highly competitive environment for acquiring properties, marketing oil and natural gas and securing trained personnel. Also, there is substantial competition for capital available for investment in the oil and natural gas industry. Many of our competitors possess and employ financial, technical and personnel resources substantially greater than ours, and many of our competitors have more established presences in the United States and the Pacific Rim than we have. Those companies may be able to pay more for productive oil and natural gas properties and exploratory prospects and to evaluate, bid for and purchase a greater number of properties and prospects than our financial or personnel resources permit. In addition, other companies may be able to offer better compensation packages to attract and retain qualified personnel than we are able to offer. The cost to attract and retain qualified personnel has increased in recent years due to competition and may increase substantially in the future. We may not be able to compete successfully in the future in acquiring prospective reserves, developing reserves, marketing hydrocarbons, attracting and retaining quality personnel and raising additional capital, which could have a material adverse effect on our business, financial condition and results of operations.
Our competitors may use superior technology and data resources that we may be unable to afford or that would require a costly investment by us in order to compete with them more effectively.
Our industry is subject to rapid and significant advancements in technology, including the introduction of new products and services using new technologies and databases. As our competitors use or develop new technologies, we may be placed at a competitive disadvantage, and competitive pressures may force us to implement new technologies at a substantial cost. In addition, many of our competitors will have greater financial, technical and personnel resources that allow them to enjoy technological advantages and may in the future allow them to implement new technologies before we can. We cannot be certain that we will be able to implement technologies on a timely basis or at a cost that is acceptable to us. One or more of the technologies that we will use or that we may implement in the future may become obsolete, and we may be adversely affected.
46
If we do not hedge our exposure to reductions in oil and natural gas prices, we may be subject to significant reductions in prices. Alternatively, we may use oil and natural gas price hedging contracts, which involve credit risk and may limit future revenues from price increases and result in significant fluctuations in our profitability.
In the event that we choose not to hedge our exposure to reductions in oil and natural gas prices by purchasing futures and by using other hedging strategies, we may be subject to significant reduction in prices which could have a material negative impact on our profitability. Alternatively, we may elect to use hedging transactions with respect to a portion of our oil and natural gas production to achieve more predictable cash flow and to reduce our exposure to price fluctuations. While the use of hedging transactions limits the downside risk of price declines, their use also may limit future revenues from price increases. Hedging transactions also involve the risk that the counterparty may be unable to satisfy its obligations.
Environmental and overall public scrutiny focused on the oil and gas industry is increasing. The current trend is to increase regulations of our operations in the industry. We are subject to federal, state, and local government regulation and liability, including complex environmental laws, which could require significant expenditures and/or adversely affect the cost, manner or feasibility of doing business.
Our exploration, development, production and marketing operations are regulated extensively at the federal, state, and local levels. Environmental and other governmental laws and regulations have increased our costs to plan, design, drill, install, operate and abandon natural gas and crude oil wells. Similar to other companies in our industry, we incur substantial operating and capital costs to comply with such laws and regulations. These compliance costs may put us at a competitive disadvantage compared to larger companies in the industry which can spread such additional costs over a greater number of wells and larger operating staff. Failure to comply with these laws and regulations may result in the suspension or termination of our operations and subject us to administrative, civil and criminal penalties. Moreover, public interest in environmental protection has increased in recent years—particularly with respect to hydraulic fracturing—and environmental organizations have opposed, with some success, certain drilling projects.
Matters subject to regulation include discharge permits, drilling bonds, reports concerning operations, the spacing of wells, unitization and pooling of properties, taxation or environmental matters and health and safety criteria addressing worker protection. Under these laws and regulations, we may be required to make large expenditures that could materially adversely affect our business, financial condition and results of operations. These expenditures could include payments for:
|
●
|
personal injuries;
|
|
●
|
property damage;
|
|
●
|
containment and cleanup of oil and other spills;
|
|
●
|
the management and disposal of hazardous materials;
|
|
●
|
remediation and clean-up costs; and
|
|
●
|
other environmental damages.
|
We do not believe that full insurance coverage for all potential damages is available at a reasonable cost. Failure to comply with these laws and regulations also may result in the suspension or termination of our operations and subject us to administrative, civil and criminal penalties, injunctive relief and/or the imposition of investigatory or other remedial obligations. Laws, rules and regulations protecting the environment have changed frequently and the changes often include increasingly stringent requirements. These laws, rules and regulations may impose liability on us for environmental damage and disposal of hazardous materials even if we were not negligent or at fault. We may also be found to be liable for the conduct of others or for acts that complied with applicable laws, rules or regulations at the time we performed those acts. These laws, rules and regulations are interpreted and enforced by numerous federal and state agencies. In addition, private parties, including the owners of properties upon which our wells are drilled or the owners of properties adjacent to or in close proximity to those properties, may also pursue legal actions against us based on alleged non-compliance with certain of these laws, rules and regulations.
47
Additionally, the natural gas and crude oil regulatory environment could change in ways that might substantially increase our financial and managerial costs to comply with the requirements of these laws and regulations and, consequently, adversely affect our profitability. At the state level, for instance, the Colorado Oil and Gas Conservation Commission (“COGCC”) issued a new rule governing mandatory minimum spacing, or setbacks, between oil and gas wells and occupied buildings and other areas. Similarly, it is expected that the COGCC may undertake a rulemaking focused on wellbore integrity in 2014 that would increase requirements in this area. The COGCC has also recently concluded a rulemaking that will require baseline sampling of certain ground and surface water in most areas of Colorado. These new sampling requirements could increase the costs of developing wells in certain locations. In addition to increasing costs of operation, these rules could prevent us from drilling wells on certain locations we plan to develop, thereby reducing our reserves as well as our future revenues. In addition, the Colorado Department of Public Health & Environment is expected to undertake a potentially expansive new rule regulating methane and other air emissions at oil and gas facilities in the State. This rulemaking is expected to begin and be finalized in 2014.
Some local governmental bodies, for instance Longmont, Colorado, have adopted or are considering regulations regarding, among other things, land use, requirements for the posting of bonds to secure restoration obligations and limitations on hydraulic fracturing and other drilling activities, and these regulations may limit, delay or prohibit exploration and development activities or make those activities more expensive. Additionally, state and local governments are undertaking air quality studies to assess potential public health impacts from oil and gas operations. These studies may result in the imposition of additional regulatory requirements on oil and gas operations.
The BP crude oil spill in the Gulf of Mexico and generally heightened industry scrutiny has resulted and may result in new state and federal safety and environmental laws, regulations, guidelines and enforcement interpretations. The EPA has recently focused on citizen concerns about the risk of water contamination and public health problems from drilling and hydraulic fracturing activities, and conducted public meetings around the country on this issue which have been well publicized and well attended. This renewed focus could lead to additional federal, state and local laws and regulations affecting our drilling, fracturing and other operations.
Other potential laws and regulations affecting us include new or increased severance taxes proposed in several states. This could adversely affect the existing operations in these states and the economic viability of future drilling. Additional laws, regulations or other changes could significantly reduce our future growth, increase our costs of operations and reduce our cash flows, in addition to undermining the demand for the natural gas and crude oil we produce.
Part of our strategy involves drilling in existing or emerging shale plays using some of the latest available horizontal drilling and completion techniques. The results of our planned exploratory drilling in these plays are subject to drilling and completion technique risks, and drilling results may not meet our expectations for reserves or production. As a result, we may incur material write-downs and the value of our undeveloped acreage could decline if drilling results are unsuccessful.
Our operations in the DJ Basin in Weld and Morgan Counties, Colorado, and anticipated operations in the Mississippian, involve utilizing the latest drilling and completion techniques in order to maximize cumulative recoveries and therefore generate the highest possible returns. Risks that we may face while drilling include, but are not limited to, landing our well bore in the desired drilling zone, staying in the desired drilling zone while drilling horizontally through the formation, running our casing the entire length of the well bore and being able to run tools and other equipment consistently through the horizontal well bore. Risks that we may face while completing our wells include, but are not limited to, being able to fracture stimulate the planned number of stages, being able to run tools the entire length of the well bore during completion operations and successfully cleaning out the well bore after completion of the final fracture stimulation stage.
The results of our drilling in new or emerging formations will be more uncertain initially than drilling results in areas that are more developed and have a longer history of established production. Newer or emerging formations and areas have limited or no production history and consequently we are less able to predict future drilling results in these areas.
Ultimately, the success of these drilling and completion techniques can only be evaluated over time as more wells are drilled and production profiles are established over a sufficiently long time period. If our drilling results are less than anticipated or we are unable to execute our drilling program because of capital constraints, lease expirations, access to gathering systems and limited takeaway capacity or otherwise, and/or natural gas and oil prices decline, the return on our investment in these areas may not be as attractive as we anticipate. Further, as a result of any of these developments we could incur material write-downs of our oil and natural gas properties and the value of our undeveloped acreage could decline in the future.
48
Our acreage must be drilled before lease expiration, generally within three to five years, in order to hold the acreage by production. In the highly competitive market for acreage, failure to drill sufficient wells in order to hold acreage will result in a substantial lease renewal cost, or if renewal is not feasible, loss of our lease and prospective drilling opportunities.
Our leases on oil and natural gas properties typically have a primary term of three to five years, after which they expire unless, prior to expiration, production is established within the spacing units covering the undeveloped acres. During the twelve month period ended December 31, 2013, 279 net acres did expire, in our Niobrara Asset. 181 net acres expire in 2014, 21 net acres expire in 2015, 169 net acres expire in 2016 and 588 net acres expire thereafter (net to our direct ownership interest only). As of our March 7, 2014 acquisition of the Wattenberg Asset, 867 net acres were due to expire in 2014, 5,789 net acres expire in 2015, and 2,272 net acres expire thereafter in the Wattenberg Asset. In addition, all of our net acres in the Mississippian asset will expire in 2014 if we do not drill at least three (3) long horizontal wells in the asset by December 29, 2014. If our extension options expire and we have to renew such leases on new terms, we could incur significant cost increases, and we may not be able to renew such leases on commercially reasonable terms or at all, which could have a material adverse effect on our leased acreage. In addition, on certain portions of our acreage, third-party leases become immediately effective if our leases expire. As such, our actual drilling activities may materially differ from our current expectations, which could adversely affect our business.
Competition and regulation of hydraulic fracturing services and water disposal could impede our ability to develop our shale plays.
The unavailability or high cost of high pressure pumping services (or hydraulic fracturing services), chemicals, proppant, water and water disposal and related services and equipment could limit our ability to execute our exploration and development plans on a timely basis and within our budget. The oil and natural gas industry is experiencing a growing emphasis on the exploitation and development of shale natural gas and shale oil resource plays, which are dependent on hydraulic fracturing for economically successful development. Hydraulic fracturing in shale plays requires high pressure pumping service crews. A shortage of service crews or proppant, chemical, water or water disposal options, especially if this shortage occurred in southern Texas, southern Kansas, northern Oklahoma or eastern Colorado, could materially and adversely affect our operations and the timeliness of executing our development plans within our budget. There is significant regulatory uncertainty as some states have begun to regulate hydraulic fracturing and the U.S. Environmental Protection Agency, or the EPA, has released a progress report on its study of the impact of hydraulic fracturing on drinking water sources on December 21, 2012 describing 18 research projects underway. The result of this study could affect the current regulatory jurisdiction of the states and increase the cycle times and costs to receive permits, delay or possibly preclude receipt of permits in certain areas, impact water usage and waste water disposal and require chemical additives disclosures.
We are subject to federal, state and local taxes, and may become subject to new taxes or have eliminated or reduced certain federal income tax deductions currently available with respect to oil and natural gas exploration and production activities as a result of future legislation, which could adversely affect our business, financial condition and results of operations.
The federal, state and local governments in the areas in which we operate impose taxes on the oil and natural gas products we sell and, for many of our wells, sales and use taxes on significant portions of our drilling and operating costs. In the past, there has been a significant amount of discussion by legislators and presidential administrations concerning a variety of energy tax proposals. Many states have raised state taxes on energy sources, and additional increases may occur. Changes to tax laws that are applicable to us could adversely affect our business and our financial results.
Periodically, legislation is introduced to eliminate certain key U.S. federal income tax preferences currently available to oil and natural gas exploration and production companies. Such possible changes include, but are not limited to, (a) the repeal of the percentage depletion allowance for oil and natural gas properties, (b) the elimination of current deductions for intangible drilling and development costs, (c) the elimination of the deduction for certain United States production activities, and (d) the increase in the amortization period for geological and geophysical costs paid or incurred in connection with the exploration for, or development of, oil or natural gas within the United States. It is unclear whether any such changes will actually be enacted or, if enacted, how soon any such changes could become effective. The passage of any legislation as a result of the budget proposals or any other similar change in U.S. federal income tax law could affect certain tax deductions that are currently available with respect to oil and natural gas exploration and production activities and could negatively impact our business, financial condition and results of operations.
The derivatives legislation adopted by Congress, and implementation of that legislation by federal agencies, could have an adverse impact on our ability to hedge risks associated with our business.
On July 21, 2010, President Obama signed into law the Dodd-Frank Wall Street Reform and Consumer Protection Act, the Dodd-Frank Act, which, among other things, sets forth the new framework for regulating certain derivative products including the commodity hedges of the type that we may elect to use, but many aspects of this law are subject to further rulemaking and will take effect over several years. As a result, it is difficult to anticipate the overall impact of the Dodd-Frank Act on our ability or willingness to enter into and maintain such commodity hedges and the terms of such hedges. There is a possibility that the Dodd-Frank Act could have a substantial and adverse impact on our ability to enter into and maintain these commodity hedges. In particular, the Dodd-Frank Act could result in the implementation of position limits and additional regulatory requirements on derivative arrangements, which could include new margin, reporting and clearing requirements. In addition, this legislation could have a substantial impact on our counterparties and may increase the cost of our derivative arrangements in the future.
49
If these types of commodity hedges become unavailable or uneconomic, our commodity price risk could increase, which would increase the volatility of revenues and may decrease the amount of credit available to us. Any limitations or changes in our use of derivative arrangements could also materially affect our future ability to conduct acquisitions.
Federal and state legislation and regulatory initiatives relating to hydraulic fracturing and water disposal could result in increased costs and additional operating restrictions or delays.
Congress has considered, but has not yet passed, legislation to amend the federal Safe Drinking Water Act to remove the exemption from restrictions on underground injection of fluids near drinking water sources granted to hydraulic fracturing operations and require reporting and disclosure of chemicals used by oil and natural gas companies in the hydraulic fracturing process. Hydraulic fracturing involves the injection of water, sand or other propping agents and chemicals under pressure into rock formations to stimulate natural gas production. We routinely use hydraulic fracturing to produce commercial quantities of oil, liquids and natural gas from shale formations. Sponsors of bills, which have been subject to various proceedings in the legislative process, including the House Energy and Commerce Committee and the Senate Environmental and Public Works Committee, have asserted that chemicals used in the fracturing process could adversely affect drinking water supplies and otherwise cause adverse environmental impacts. Such legislation, if adopted, could increase the possibility of litigation and establish an additional level of regulation at the federal level that could lead to operational delays or increased operating costs and could, and in all likelihood would, result in additional regulatory burdens, making it more difficult to perform hydraulic fracturing operations and increasing our costs of compliance.
In addition, certain members of Congress have called upon the U.S. Government Accountability Office to investigate how hydraulic fracturing might adversely affect water resources, the U.S. Securities and Exchange Commission to investigate the natural-gas industry and any possible misleading of investors or the public regarding the economic feasibility of pursuing natural-gas deposits in shales by means of hydraulic fracturing, and the U.S. Energy Information Administration to provide a better understanding of that agency’s estimates regarding natural-gas reserves, including reserves from shale formations, as well as uncertainties associated with those estimates. The U.S. Government Accountability Office released its report on hydraulic fracturing in September 2012. Depending on the outcome of these studies, federal and state legislatures and agencies may seek to further regulate hydraulic fracturing activities.
The EPA is also involved in regulating hydraulic fracturing. On April 17, 2012, the EPA approved final rules under the Clean Air Act that would subject all oil and gas operations (production, processing, transmission, storage and distribution) to regulation under the New Source Performance Standards (NSPS) and National Emission Standards for Hazardous Air Pollutants (NESHAPS) programs. These rules also include NSPS standards for completions of hydraulically fractured gas wells. These standards include the reduced emission completion (REC) techniques developed in EPA’s Natural Gas STAR program along with pit flaring of gas not sent to the gathering line. The standards would be applicable to newly drilled and fractured wells as well as existing wells that are refractured. Further, the proposed regulations under NESHAPS include maximum achievable control technology (MACT) standards for those glycol dehydrators and storage vessels at major sources of hazardous air pollutants not currently subject to MACT standards. While these rules have been finalized, many of the rule’s provisions will be phased-in over time, with the more stringent requirements like REC not becoming effective until 2015. The new rules are substantial and may increase future costs of our operations and are likely to require us to make modifications to our operations and install new equipment.
Moreover, the EPA is conducting a comprehensive research study on the potential adverse impacts that hydraulic fracturing may have on drinking water and groundwater. In addition, in December 2011, the EPA published an unrelated draft report concluding that hydraulic fracturing caused groundwater pollution of a natural gas field in Wyoming, although this study remains subject to review and public comments. Consequently, even if federal legislation is not adopted soon or at all, the performance of the hydraulic fracturing study by the EPA could spur further action at a later date towards federal legislation and regulation of hydraulic fracturing or similar production operations.
In addition, a number of states are considering or have implemented more stringent regulatory requirements applicable to fracturing, which could include, among other requirements, stringent permitting on air emission control requirements, disclosure, wastewater disposal, baseline sampling, well construction and well location requirements on hydraulic fracturing operations or otherwise seek to ban injection of fracturing wastewater, and effectively prohibit further production of natural gas through the use of hydraulic fracturing or similar operations. For example, Texas has adopted legislation that requires the disclosure of information regarding the substances used in the hydraulic fracturing process to the Railroad Commission of Texas and the public. Some municipalities and local governments, including most recently the city of Fort Collins, Colorado, have adopted or are considering similar actions. This legislation and any implementing regulation could increase our costs of compliance and doing business.
50
The adoption of new laws or regulations imposing reporting obligations on, or otherwise limiting, the hydraulic fracturing and related water disposal processes could make it more difficult to complete oil and natural gas wells in shale formations. In addition, if hydraulic fracturing becomes regulated at the federal level as a result of federal legislation or regulatory initiatives by the EPA, fracturing activities could become subject to additional permitting requirements, and also to attendant permitting delays and potential increases in cost, which could adversely affect our business, financial condition and results of operations.
Legislation or regulations restricting emissions of “greenhouse gases” could result in increased operating costs and reduced demand for the natural gas, natural gas liquids and oil we produce while the physical effects of climate change could disrupt our production and cause us to incur significant costs in preparing for or responding to those effects.
On December 15, 2009, the EPA published its final findings that emissions of carbon dioxide, methane and other “greenhouse gases” present an endangerment to public health and welfare because emissions of such gases are, according to the EPA, contributing to the warming of the earth’s atmosphere and other climatic changes. These findings allow the EPA to adopt and implement regulations that would restrict emissions of greenhouse gases under existing provisions of the federal Clean Air Act. Accordingly, the EPA has adopted regulations that would require a reduction in emissions of greenhouse gases from motor vehicles and permitting and presumably requiring a reduction in greenhouse gas emissions from certain stationary sources. In addition, on October 30, 2009, the EPA published a final rule requiring the reporting of greenhouse gas emissions from specified large greenhouse gas emission sources in the United States beginning in 2011 for emissions occurring in 2010. On November 30, 2010, the EPA released a final rule that expands its rule on reporting of greenhouse gas emissions to include owners and operators of petroleum and natural gas systems. The adoption and implementation of any regulations imposing reporting obligations on, or limiting emissions of greenhouse gases from, our equipment and operations could require us to incur costs to reduce emissions of greenhouse gases associated with our operations. Further, various states have adopted legislation that seeks to control or reduce emissions of greenhouse gases from a wide range of sources. Any such legislation could adversely affect demand for the natural gas, oil and liquids that we produce.
Some scientists have concluded that increasing concentrations of greenhouse gases in the Earth’s atmosphere may produce climate changes that have significant physical effects, such as increased frequency and severity of storms, floods and other climatic events. If any such effects were to occur, they could have an adverse effect on our exploration and production operations. Significant physical effects of climate change could also have an indirect effect on our financing and operations by disrupting the transportation or process-related services provided by midstream companies, service companies or suppliers with whom we have a business relationship. We may not be able to recover through insurance some or any of the damages, losses, or costs that may result from potential physical effects of climate change.
Our operations are substantially dependent on the availability of water. Restrictions on our ability to obtain water may have an adverse effect on our financial condition, results of operations and cash flows.
Water is an essential component of deep shale oil and natural gas production during both the drilling and hydraulic fracturing, or fracking processes. Our operations could be adversely impacted if we are unable to locate sufficient amounts of water, or dispose of or recycle water used in our exploration and production operations. Currently, the quantity of water required in certain completion operations, such as hydraulic fracturing, and changing regulations governing usage may lead to water constraints and supply concerns (particularly in some parts of the country). According to the Lower Colorado River Authority, during 2011, Texas experienced the lowest inflows of water of any year in recorded history. In addition, Colorado and other western states have recently experienced a drought. As a result, future availability of water from certain sources used in the past may be limited. Moreover, the imposition of new environmental initiatives and conditions could include restrictions on our ability to conduct certain operations such as hydraulic fracturing or disposal of waste, including, but not limited to, produced water, drilling fluids and other wastes associated with the exploration, development or production of oil and natural gas. The federal Clean Water Act, or CWA and analogous state laws impose restrictions and strict controls regarding the discharge of pollutants, including produced waters and other oil and natural gas waste, into navigable waters or other regulated federal and state waters. Permits or other approvals must be obtained to discharge pollutants to regulated waters and to conduct construction activities in such waters and wetlands. Uncertainty regarding regulatory jurisdiction over wetlands and other regulated waters has, and will continue to, complicate and increase the cost of obtaining such permits or other approvals. The CWA and analogous state laws provide for civil, criminal and administrative penalties for any unauthorized discharges of pollutants and unauthorized discharges of reportable quantities of oil and other hazardous substances. Many state discharge regulations, and the Federal National Pollutant Discharge Elimination System General permits issued by the EPA, prohibit the discharge of produced water and sand, drilling fluids, drill cuttings and certain other substances related to the oil and natural gas industry into coastal waters. While generally exempt under federal programs, many state agencies have also adopted regulations requiring certain oil and natural gas exploration and production facilities to obtain permits for storm water discharges. In October 2011, the EPA announced its intention to develop federal pretreatment standards for wastewater discharges associated with hydraulic fracturing activities. If adopted, the pretreatment rules will require coalbed methane and shale gas operations to pretreat wastewater before transferring it to treatment facilities Some states have banned the treatment of fracturing wastewater at publicly owned treatment facilities. There has been recent nationwide concern over earthquakes associated with Class II underground injection control wells, a predominant storage method for crude oil and gas wastewater. It is likely that new rules and regulations will be developed to address these concerns, possibly eliminating access to Class II wells in certain locations, and increasing the cost of disposal in others. Finally, the EPA study noted above has focused and will continue to focus on various stages of water use in hydraulic fracturing operations. It is possible that, following the conclusion of the EPA’s study, the agency will move to more strictly regulate the use of water in hydraulic fracturing operations. While we cannot predict the impact that these changes may have on our business at this time, they may be material to our business, financial condition, and operations. Compliance with environmental regulations and permit requirements governing the withdrawal, storage and use of surface water or groundwater necessary for hydraulic fracturing of wells or the disposal or recycling of water will increase our operating costs and may cause delays, interruptions or termination of our operations, the extent of which cannot be predicted. In addition, our inability to meet our water supply needs to conduct our completion operations may impact our business, and any such future laws and regulations could negatively affect our financial condition, results of operations and cash flows.
51
Restrictions on drilling activities intended to protect certain species of wildlife may adversely affect our ability to conduct drilling activities in some of the areas where we operate.
Oil and natural gas operations in our operating areas can be adversely affected by seasonal or permanent restrictions on drilling activities designed to protect various wildlife. Seasonal restrictions may limit our ability to operate in protected areas and can intensify competition for drilling rigs, oilfield equipment, services, supplies and qualified personnel, which may lead to periodic shortages when drilling is allowed. These constraints and the resulting shortages or high costs could delay our operations and materially increase our operating and capital costs. Permanent restrictions imposed to protect endangered species could prohibit drilling in certain areas or require the implementation of expensive mitigation measures.
As a result of a settlement approved by the U.S. District Court for the District of Columbia on September 9, 2011, the U.S. Fish and Wildlife Service is required to consider listing more than 250 species as endangered under the Endangered Species Act. The law prohibits the harming of endangered or threatened species, provides for habitat protection, and imposes stringent penalties for noncompliance. The final designation of previously unprotected species in areas where we operate as threatened or endangered could cause us to incur increased costs arising from species protection measures or could result in limitations, delays, or prohibitions on our exploration and production activities that could have an adverse impact on our ability to develop and produce our reserves.
Potential conflicts of interest could arise for certain members of our management team that hold management positions with other entities.
Frank C. Ingriselli, our Chairman of the Board and Chief Executive Officer, is also president and Chief Executive Officer of Global Venture Investments LLC and Michael L. Peterson, our Chief Financial Officer, is a managing partner of Pascal Management. We believe these positions require only an immaterial amount of Messrs. Ingriselli’s and Peterson’s time and will not conflict with each of their respective roles or responsibilities with our company. If either of these entities enters into one or more transactions with our company, or if either of these positions require significantly more time than currently anticipated, potential conflicts of interests could arise from Messrs. Ingriselli and Peterson performing services for us and these other entities.
Our planned acquisition of assets in Kazakhstan may not be completed, or if completed, could force us to pay certain additional consideration to the seller, either of which could adversely affect our business and results of operations.
We have
entered into an agreement to acquire an approximate 51% ownership in Asia Sixth Energy Resources Limited, a British Virgin Islands entity (“Asia Sixth”), which holds an approximate 60% ownership interest in Aral Petroleum Capital Limited Partnership, a Kazakhstan entity (“Aral”), and we have entered into a subsequent agreement to transfer 50% of the interest we will acquire in Asia Sixth to RJ Resources, thereby netting us a 25.5% ownership in Asia Sixth following the closing of these transactions. Aral holds a production license covering a 380,000 acre oil and gas producing asset located in the Pre-Caspian Basin in Kazakhstan, which we plan to close upon receipt of required approvals from the government of Kazakhstan, anticipated to be received no later than the third quarter of 2014.
52
We have paid an initial deposit of $10 million to Asia Sixth, and were required to increase our deposit by up to $10 million to a total of $20 million contingent upon receipt of payment in full of $10 million by us from an investor under a promissory note maturing in December 2013. The investor failed to pay the $10 million balance due under the Note by December 1, 2013. On December 1, 2013, the Company granted a verbal extension to the investor pending further discussions regarding the investment. Following discussions with the investor, the investor elected to forego making further investment. Accordingly, on March 7, 2014, the Company notified the investor that, effective immediately, the Escrowed Shares and Escrowed Warrants were rescinded as permitted pursuant to the terms of the Note, and the Note was cancelled and forgiven, with no further action required by the investor (the “Cancellation”). The stock subscription receivable related to 3,333,333 shares of common stock and 999,999 warrants for shares of common stock in the amount of $10 million was extinguished as of March 7, 2014. The rescission of the note has no net effect on us or our obligations because (a) if such note was paid in full we would have been required to pay such funds directly to Asia Sixth; and (b) the result of such funds not being paid only results in a decrease in the required deposit due to Asia Sixth.
The $10 million deposit is subject to full refund to us in the event the transaction does not close, other than as a result of our material uncured breach, provided, however, that if any part of the $10 million deposit previously paid by us is returned to us, 50% of any such returned funds must be paid to RJ Resources. These funds will also be used, in part, to recomplete and rework currently producing wells with the goal of significantly increasing their production rates. Based on how these wells perform, at closing, we shall owe to Asia Sixth a final closing payment equal to an additional: (i) $20 million if the daily average volume of oil produced by Aral over a specified 30 day period (the “Target Volume”) equals or exceeds 1,500 barrels of oil per day (“BOPD”); (ii) $15 million if the Target Volume equals or exceeds 1,000 BOPD but is less than 1,500 BOPD; or (iii) $0 due if the Target Volume comes in less than 1,000 BOPD. In the event we are required to pay any final closing payment to Asia Sixth, RJ Resources is obligated to pay 50% of any such amount due.
The closing of the transaction is scheduled to occur no earlier than September 15, 2014, subject to certain conditions precedent, including the approval of the Agency of the Republic of Kazakhstan for the Protection of Competition and the Ministry of Oil and Gas of the Republic of Kazakhstan, or the MOG, and the MOG’s waiver of its pre-emptive purchase right with respect to the transaction. In the event the MOG does not approve the transaction or waive its pre-emptive purchase right, the transaction will be terminated, our anticipated business and results of operations could be adversely affected and there is no guarantee that we could subsequently acquire an equally attractive oil play. Additionally, in the event the transaction closes and we are required to make a final closing payment to Asia Sixth based on well performance, we will need to raise the funds required through debt and/or equity financings, which funds may not be available on favorable terms, if at all.
We face risks associated with our planned operations in Kazakhstan.
In the event we complete the pending acquisition of our Kazakhstan assets we will be subject to various risks associated with doing business in Kazakhstan and relating to Kazakhstan’s economic and political environment. As is typical of an emerging market, Kazakhstan does not possess a well-developed business, legal and regulatory infrastructure that would generally exist in a more mature free market economy and, in recent years, Kazakhstan has undergone substantial political, economic and social change. We could also face currency risks associated with operations in Kazakhstan. Additionally, our successful operation of particular facilities or projects may be disrupted by civil unrest, acts of sabotage or terrorism, and other local security concerns. Such concerns may require us to incur greater costs for security or to shut down operations for a period of time. Our planned operations in Kazakhstan will also be subject to Kazakhstan specific laws and regulations relating to areas of labor, tax, import and export requirements, anti-corruption, foreign exchange controls and cash repatriation restrictions, environmental, health, and safety, which will be different than U.S. laws and may force us to expend additional resources complying with such laws and regulations. Our failure to manage the risks associated with doing business in Kazakhstan could have a material adverse effect upon our results of operations.
Our technology services company has no operating history and there is a risk that such company will not be successful or face liabilities.
On October 4, 2012, we established a technical services subsidiary, Pacific Energy Technology Services, LLC, which is 70% owned by us and 30% owned by STXRA, through which we plan to provide acquisition, engineering, and oil drilling and completion technology services in joint cooperation with STXRA in the United States and Pacific Rim countries, particularly in China. While Pacific Energy Technology Services, LLC currently has no operations, only nominal assets and liabilities and limited capitalization, we anticipate actively developing this venture in 2014. Due to the fact that this entity does not have an operating history and the fact that we have not previously provided technology services as part of its operations, there is a risk that we will not be successful in marketing this venture, that revenues will not develop and that Pacific Energy Technology Services, LLC will not be successful. We may be subject to liability claims from clients of our planned services. Our product liability insurance and contractual limitations may not cover all potential claims. Our failure to provide services at a level requested by clients could cause us to lose revenue, as well as to experience delay in or loss of market acceptance and sales, or injury to our reputation.
53
Risks Related to Our Common Stock
We currently have an illiquid and volatile market for our common stock, and the market for our common stock is and may remain illiquid and volatile in the future.
We currently have a highly sporadic, illiquid and volatile market for our common stock, which market is anticipated to remain sporadic, illiquid and volatile in the future.
Factors that could affect our stock price or result in fluctuations in the market price or trading volume of our common stock include:
|
●
|
our actual or anticipated operating and financial performance and drilling locations, including reserves estimates;
|
|
●
|
quarterly variations in the rate of growth of our financial indicators, such as net income per share, net income and cash flows, or those of companies that are perceived to be similar to us;
|
|
●
|
changes in revenue, cash flows or earnings estimates or publication of reports by equity research analysts;
|
|
●
|
speculation in the press or investment community;
|
|
●
|
public reaction to our press releases, announcements and filings with the SEC;
|
|
●
|
sales of our common stock by us or other shareholders, or the perception that such sales may occur;
|
|
●
|
the limited amount of our freely tradable common stock available in the public marketplace;
|
|
●
|
general financial market conditions and oil and natural gas industry market conditions, including fluctuations in commodity prices;
|
|
●
|
the realization of any of the risk factors presented in this Annual Report;
|
|
●
|
the recruitment or departure of key personnel;
|
|
●
|
commencement of, or involvement in, litigation;
|
|
●
|
the prices of oil and natural gas;
|
|
●
|
the success of our exploration and development operations, and the marketing of any oil and natural gas we produce;
|
|
●
|
changes in market valuations of companies similar to ours; and
|
|
●
|
domestic and international economic, legal and regulatory factors unrelated to our performance.
|
Our common stock is listed on the NYSE MKT under the symbol “
PED.
” Our stock price may be impacted by factors that are unrelated or disproportionate to our operating performance.
The stock markets in general have experienced extreme volatility that has often been unrelated to the operating performance of particular companies. These broad market fluctuations may adversely affect the trading price of our common stock. Additionally,
general economic, political and market conditions, such as recessions, interest rates or international currency fluctuations may adversely affect the market price of our common stock. Due to the limited volume of our shares which trade, we believe that our stock prices (bid, ask and closing prices) may not be related to our actual value, and not reflect the actual value of our common stock. Shareholders and potential investors in our common stock should exercise caution before making an investment in us.
Additionally, as a result of the illiquidity of our common stock, investors may not be interested in owning our common stock because of the inability to acquire or sell a substantial block of our common stock at one time. Such illiquidity could have an adverse effect on the market price of our common stock. In addition, a shareholder may not be able to borrow funds using our common stock as collateral because lenders may be unwilling to accept the pledge of securities having such a limited market. We cannot assure you that an active trading market for our common stock will develop or, if one develops, be sustained.
54
An active liquid trading market for our common stock may not develop in the future.
Our common stock currently trades on the NYSE MKT, although our common stock’s trading volume is very low. Liquid and active trading markets usually result in less price volatility and more efficiency in carrying out investors’ purchase and sale orders. However, our common stock may continue to have limited trading volume, and many investors may not be interested in owning our common stock because of the inability to acquire or sell a substantial block of our common stock at one time. Such illiquidity could have an adverse effect on the market price of our common stock. In addition, a shareholder may not be able to borrow funds using our common stock as collateral because lenders may be unwilling to accept the pledge of securities having such a limited market. We cannot assure you that an active trading market for our common stock will develop or, if one develops, be sustained.
We do not presently intend to pay any cash dividends on or repurchase any shares of our common stock.
We do not presently intend to pay any cash dividends on our common stock or to repurchase any shares of our common stock. Any payment of future dividends will be at the discretion of the Board of Directors and will depend on, among other things, our earnings, financial condition, capital requirements, level of indebtedness, statutory and contractual restrictions applying to the payment of dividends and other considerations that our Board of Directors deems relevant. Cash dividend payments in the future may only be made out of legally available funds and, if we experience substantial losses, such funds may not be available. Accordingly, you may have to sell some or all of your common stock in order to generate cash flow from your investment, and there is no guarantee that the price of our common stock that will prevail in the market will ever exceed the price paid by you.
The issuance of common stock upon conversion of our convertible notes will cause immediate and substantial dilution.
The issuance of common stock upon conversion of our outstanding convertible notes in the aggregate amount of $2,125,000 in principal and $212,500 of payment in kind, along with interest on the principal amount of such notes, which allow the holders thereof the right to convert such amounts from time to time, subject to certain limitations, into common stock of the Company, as is determined by dividing the amount converted by a conversion price as follows (A) prior to June 1, 2014, the conversion price is $2.15 per share; and (B) following June 1, 2014, the denominator used in the calculation described above shall be the greater of (i) 80% of the average of the closing price per share of our publicly traded common stock for the five (5) trading days immediately preceding the date of the conversion notice provide by the holder; and (ii) $0.50 per share, will result in immediate and substantial dilution to the interests of other stockholders.
The continuously adjustable conversion price feature of our convertible notes could require us to issue a substantially greater number of shares, which may adversely affect the market price of our common stock and cause dilution to our existing stockholders.
Our existing stockholders may experience substantial dilution of their investment upon conversion of the convertible notes. The convertible notes are convertible into shares of common stock as described in the risk factor above entitled “The issuance of common stock upon conversion of our convertible notes will cause immediate and substantial dilution”, after June 1, 2014, at a discount to the trading price of our common stock, subject to a floor of $0.50 per share. As a result, the number of shares issuable could prove to be significantly greater in the event of a decrease in the trading price of our common stock, which decrease could cause substantial dilution to our existing stockholders. As sequential conversions and sales take place, the price of our common stock may decline, and if so, the holders of the convertible notes would be entitled to receive an increasing number of shares, which could then be sold, triggering further price declines and conversions for even larger numbers of shares, which would cause additional dilution to our existing stockholders and could cause the value of our common stock to decline.
55
Because we are a small company, the requirements of being a public company, including compliance with the reporting requirements of the Securities Exchange Act of 1934, as amended (the “Exchange Act”) and the requirements of the Sarbanes-Oxley Act and the Dodd-Frank Act, may strain our resources, increase our costs and distract management, and we may be unable to comply with these requirements in a timely or cost-effective manner.
As a public company with listed equity securities, we must comply with the federal securities laws, rules and regulations, including certain corporate governance provisions of the Sarbanes-Oxley Act of 2002 (the “Sarbanes-Oxley Act”) and the Dodd-Frank Act, related rules and regulations of the SEC and the NYSE MKT, with which a private company is not required to comply. Complying with these laws, rules and regulations will occupy a significant amount of time of our Board of Directors and management and will significantly increase our costs and expenses, which we cannot estimate accurately at this time. Among other things, we must:
|
●
|
establish and maintain a system of internal control over financial reporting in compliance with the requirements of Section 404 of the Sarbanes-Oxley Act and the related rules and regulations of the SEC and the Public Company Accounting Oversight Board;
|
|
●
|
comply with rules and regulations promulgated by the NYSE MKT;
|
|
●
|
prepare and distribute periodic public reports in compliance with our obligations under the federal securities laws;
|
|
●
|
maintain various internal compliance and disclosures policies, such as those relating to disclosure controls and procedures and insider trading in our common stock;
|
|
●
|
involve and retain to a greater degree outside counsel and accountants in the above activities;
|
|
●
|
maintain a comprehensive internal audit function; and
|
|
●
|
maintain an investor relations function.
|
In addition, being a public company subject to these rules and regulations may require us to accept less director and officer liability insurance coverage than we desire or to incur substantial costs to obtain coverage. These factors could also make it more difficult for us to attract and retain qualified members of our Board of Directors, particularly to serve on our audit committee, and qualified executive officers.
Future sales of our common stock could cause our stock price to decline.
If our shareholders sell substantial amounts of our common stock in the public market, the market price of our common stock could decrease significantly. The perception in the public market that our shareholders might sell shares of our common stock could also depress the market price of our common stock. Up to $100,000,000 in total aggregate value of securities have been registered by us on a “shelf” registration statement on Form S-3 (File No. 333-191869) that we filed with the Securities and Exchange Commission on October 23, 2013, and which was declared effective on November 5, 2013. To date, an aggregate of $14,705,275 in securities have been sold by us under the Form S-3, leaving $85,294,725 in securities which will be eligible for sale in the public markets from time to time, when sold and issued by us, subject to the requirements of Form S-3, which limits us, until such time, if ever, as our public float exceeds $75 million, from selling securities in a public primary offering under Form S-3 with a value exceeding more than one-third of the aggregate market value of the common stock held by non-affiliates of the Company every twelve months. Additionally, if our existing shareholders sell, or indicate an intent to sell, substantial amounts of our common stock in the public market, the trading price of our common stock could decline significantly. The market price for shares of our common stock may drop significantly when such securities are sold in the public markets. A decline in the price of shares of our common stock might impede our ability to raise capital through the issuance of additional shares of our common stock or other equity securities.
Our outstanding options, warrants and convertible securities may adversely affect the trading price of our common stock.
As of December 31, 2013, there were outstanding stock options to purchase approximately 1,438,062 shares of our common stock and outstanding warrants to purchase approximately 3,020,046 shares of common stock. For the life of the options and warrants, the holders have the opportunity to profit from a rise in the market price of our common stock without assuming the risk of ownership. The issuance of shares upon the exercise of outstanding securities will also dilute the ownership interests of our existing stockholders.
The availability of these shares for public resale, as well as any actual resales of these shares, could adversely affect the trading price of our common stock. We previously filed a registration statement with the SEC on Form S-8 providing for the registration of approximately 2,118,386 shares of our common stock issuable or reserved for issuance under our equity incentive plans. Subject to the satisfaction of vesting conditions, the expiration of lockup agreements, any management 10b5-1 plans and certain restrictions on sales by affiliates, shares registered under registration statements on Form S-8 will be available for resale immediately in the public market without restriction.
56
We cannot predict the size of future issuances of our common stock pursuant to the exercise of outstanding options or warrants or conversion of other securities, or the effect, if any, that future issuances and sales of shares of our common stock may have on the market price of our common stock. Sales or distributions of substantial amounts of our common stock (including shares issued in connection with an acquisition), or the perception that such sales could occur, may cause the market price of our common stock to decline.
Six of our directors and executive officers own approximately 13.9% of our common stock, and two of our major shareholders own approximately 21.5% of our common stock, which may give them influence over important corporate matters in which their interests are different from your interests.
Six of our directors and executive officers beneficially own approximately 13.9% of our outstanding shares of common stock, and our largest two non-director or officer shareholders own approximately 21.5% of our outstanding shares of common stock (assuming exercise of warrants held thereby) based on a total of 26,539,013 shares of common stock outstanding as of March 28, 2014. These directors, executive officers and major shareholders will be positioned to influence or control to some degree the outcome of matters requiring a shareholder vote, including the election of directors, the adoption of amendments to our certificate of formation or bylaws and the approval of mergers and other significant corporate transactions. These directors, executive officers and major shareholders, subject to any fiduciary duties owed to the shareholders generally, may have interests different than the rest of our shareholders. Their influence or control of our company may have the effect of delaying or preventing a change of control of our company and may adversely affect the voting and other rights of other shareholders. In addition, due to the ownership interest of these directors and officers in our common stock, they may be able to remain entrenched in their positions.
Furthermore, one of our major shareholders, MIE Holdings, is an independent oil company in China with its own oil and natural gas operations separate from its relationship with us. Potential conflicts of interest could arise as a result, either in the terms of our relationship with MIE Holdings or in MIE Holdings competing with us in its operations outside of its relationship with us.
Provisions of Texas law may have anti-takeover effects that could prevent a change in control even if it might be beneficial to our shareholders.
Provisions of Texas law may discourage, delay or prevent someone from acquiring or merging with us, which may cause the market price of our common stock to decline. Under Texas law, a shareholder who beneficially owns more than 20% of our voting stock, or any “affiliated shareholder,” cannot acquire us for a period of three years from the date this person became an affiliated shareholder, unless various conditions are met, such as approval of the transaction by our Board of Directors before this person became an affiliated shareholder or approval of the holders of at least two-thirds of our outstanding voting shares not beneficially owned by the affiliated shareholder.
Our Board of Directors can authorize the issuance of preferred stock, which could diminish the rights of holders of our common stock and make a change of control of our company more difficult even if it might benefit our shareholders.
Our Board of Directors is authorized to issue shares of preferred stock in one or more series and to fix the voting powers, preferences and other rights and limitations of the preferred stock. Shares of preferred stock may be issued by our Board of Directors without shareholder approval, with voting powers and such preferences and relative, participating, optional or other special rights and powers as determined by our Board of Directors, which may be greater than the shares of common stock currently outstanding. As a result, shares of preferred stock may be issued by our Board of Directors which cause the holders to have majority voting power over our shares, provide the holders of the preferred stock the right to convert the shares of preferred stock they hold into shares of our common stock, which may cause substantial dilution to our then common stock shareholders and/or have other rights and preferences greater than those of our common stock shareholders including having a preference over our common stock with respect to dividends or distributions on liquidation or dissolution.
Investors should keep in mind that the Board of Directors has the authority to issue additional shares of common stock and preferred stock, which could cause substantial dilution to our existing shareholders. Additionally, the dilutive effect of any preferred stock which we may issue may be exacerbated given the fact that such preferred stock may have voting rights and/or other rights or preferences which could provide the preferred shareholders with substantial voting control over us subsequent to the date of this filing and/or give those holders the power to prevent or cause a change in control, even if that change in control might benefit our shareholders. As a result, the issuance of shares of common stock and/or preferred stock may cause the value of our securities to decrease.
57
Securities analysts may not cover, or continue to cover, our common stock and this may have a negative impact on our common stock’s market price.
The trading market for our common stock will depend, in part, on the research and reports that securities or industry analysts publish about us or our business. We do not have any control over independent analysts (provided that we have engaged various non-independent analysts). We currently only have a few independent analysts that cover our common stock, and these analysts may discontinue coverage of our common stock at any time. Further, we may not be able to obtain additional research coverage by independent securities and industry analysts. If no independent securities or industry analysts continue coverage of us, the trading price for our common stock could be negatively impacted. If one or more of the analysts who covers us downgrades our common stock, changes their opinion of our shares or publishes inaccurate or unfavorable research about our business, our stock price could decline. If one or more of these analysts ceases coverage of us or fails to publish reports on us regularly, demand for our common stock could decrease and we could lose visibility in the financial markets, which could cause our stock price and trading volume to decline.
Shareholders may be diluted significantly through our efforts to obtain financing and satisfy obligations through the issuance of securities.
Wherever possible, our Board of Directors will attempt to use non-cash consideration to satisfy obligations. In many instances, we believe that the non-cash consideration will consist of shares of our common stock, preferred stock or warrants to purchase shares of our common stock. Our Board of Directors has authority, without action or vote of the shareholders,
subject to the requirements of the NYSE MKT (which generally require shareholder approval for any transactions which would result in the issuance of more than 20% of our then outstanding shares of common stock or voting rights representing over 20% of our then outstanding shares of stock),
to issue all or part of the authorized but unissued shares of common stock, preferred stock or warrants to purchase such shares of common stock. In addition, we may attempt to raise capital by selling shares of our common stock, possibly at a discount to market in the future. These actions will result in dilution of the ownership interests of existing shareholders and may further dilute common stock book value, and that dilution may be material. Such issuances may also serve to enhance existing management’s ability to maintain control of us, because the shares may be issued to parties or entities committed to supporting existing management.
If we are delisted from the NYSE MKT, your ability to sell your shares of our common stock may be limited by the penny stock restrictions, which could further limit the marketability of your shares.
If our common stock is delisted, it could come within the definition of “
penny stock
” as defined in the Exchange Act and could be covered by Rule 15g-9 of the Exchange Act. That Rule imposes additional sales practice requirements on broker-dealers who sell securities to persons other than established customers and accredited investors. For transactions covered by Rule 15g-9, the broker-dealer must make a special suitability determination for the purchaser and receive the purchaser’s written agreement to the transaction prior to the sale. Consequently, Rule 15g-9, if it were to become applicable, would affect the ability or willingness of broker-dealers to sell our securities, and accordingly would affect the ability of stockholders to sell their securities in the public market. These additional procedures could also limit our ability to raise additional capital in the future.
Due to the fact that our common stock is listed on the NYSE MKT, we are subject to financial and other reporting and corporate governance requirements which increase our costs and expenses.
We are currently required to file annual and quarterly information and other reports with the Securities and Exchange Commission that are specified in Sections 13 and 15(d) of the Securities Exchange Act of 1934, as amended. Additionally, due to the fact that our common stock is listed on the NYSE MKT, we are also subject to the requirements to maintain independent directors, comply with other corporate governance requirements and are required to pay annual listing and stock issuance fees. These obligations require a commitment of additional resources including, but not limited, to additional expenses, and may result in the diversion of our senior management’s time and attention from our day-to-day operations. These obligations increase our expenses and may make it more complicated or time consuming for us to undertake certain corporate actions due to the fact that we may require NYSE approval for such transactions and/or NYSE rules may require us to obtain shareholder approval for such transactions.
58
ITEM 1B. UNRESOLVED STAFF COMMENTS.
None.
Oil and Gas Properties
All oil and gas properties are currently in the United States.
Productive Wells
The following table presents our total gross and net productive wells by core operating area and by oil or natural gas completion as of December 31, 2013, including wells acquired in our Wattenberg Asset, which we acquired on March 7, 2014, with an effective date of December 1, 2013, and excluding wells on our Eagle Ford Asset, which we divested on February 19, 2014, effective November 1, 2013:
|
Gross Productive Wells
|
Net Productive Wells
|
|||||||||||||||||||||||||||
|
Oil
|
Natural Gas
|
Total
|
Oil
|
Natural Gas
|
Total
|
% Operated
|
||||||||||||||||||||||
|
December 31, 2013
|
||||||||||||||||||||||||||||
|
Wattenberg Asset (1)
|
25.0
|
-
|
25.0
|
12.38
|
-
|
12.38
|
42
|
%
|
||||||||||||||||||||
|
Niobrara (2)
|
5.0
|
-
|
5.0
|
1.26
|
-
|
1.26
|
100
|
%
|
||||||||||||||||||||
|
Eagle Ford (3)
|
5.0
|
-
|
5.0
|
0.20
|
-
|
0.20
|
0
|
%
|
||||||||||||||||||||
|
Sugar Valley
|
1.0
|
-
|
1.0
|
0.50
|
-
|
0.50
|
0
|
%
|
||||||||||||||||||||
|
Total
|
36.0
|
-
|
36.0
|
14.34
|
-
|
14.34
|
||||||||||||||||||||||
|
(1)
|
11 wells are operated by Red Hawk, our 100% owned subsidiary.
|
|
(2)
|
Operated by Condor, which our company jointly owns and manages with MIE Holdings.
|
|
(3)
|
We divested our Eagle Ford asset in full on February 19, 2014, effective November 1, 2013.
|
“Gross wells” represents the number of wells in which a working interest is owned, and “net wells” represents the total of our fractional working interests owned in gross wells.
Acreage
The following table sets forth certain information regarding the developed and undeveloped acreage in which we own a working interest as of December 31, 2013 for each of our core operating areas, and includes our Wattenberg Asset which was acquired March 7, 2014, with an effective date of December 1, 2013. Acreage related to royalty, overriding royalty and other similar interests is excluded from this summary.
|
Undeveloped Acres
|
Developed Acres
|
Total
|
% of
Acreage
Held-by-
|
|||||||||||||||||||||||||
|
As of December 31, 2013
|
Gross
|
Net
|
Gross
|
Net
|
Gross
|
Net
|
Production
|
|||||||||||||||||||||
|
Current Assets:
|
||||||||||||||||||||||||||||
|
Wattenberg (1)
|
18,365
|
9,18
2
|
9,549
|
4,775
|
27,914
|
13,957
|
34.2
|
%
|
||||||||||||||||||||
|
Niobrara
|
5,905
|
1,529
|
3,162
|
855
|
9,067
|
2,384
|
34.9
|
%
|
||||||||||||||||||||
|
Mississippian
|
7,006
|
3,443
|
-
|
-
|
7,006
|
3,443
|
-
|
%
|
||||||||||||||||||||
|
Eagle Ford (2)
|
1,133
|
45
|
198
|
8
|
1,331
|
53
|
52.7
|
%
|
||||||||||||||||||||
|
Sugar Valley
|
-
|
-
|
251
|
164
|
251
|
164
|
100
|
%
|
||||||||||||||||||||
|
Total
|
32,409
|
14,
199
|
13,160
|
5,802
|
45,569
|
20,001
|
||||||||||||||||||||||
|
(1)
|
We purchased the Wattenberg asset March 7, 2014 effective December 1, 2013.
|
|
(2)
|
We divested our Eagle Ford asset in full on February 19, 2014, effective November 1, 2013.
|
59
Undeveloped Acreage Expirations
The following table sets forth the number of gross and net undeveloped acres on our Niobrara, Eagle Ford, Mississippian and North Sugar Valley assets as of December 31, 2013, and with respect to our newly acquired Wattenberg Asset, as of its acquisition date of March 7, 2014, that will expire over the next three years unless production is established within the spacing units covering the acreage prior to the expiration dates:
|
As of December 31, 2013
|
||||||||||||||||||||||||||||||||
|
2014
|
2015
|
2016
|
Thereafter
|
|||||||||||||||||||||||||||||
|
Assets
|
Gross
|
Net
|
Gross
|
Net
|
Gross
|
Net
|
Gross
|
Net
|
||||||||||||||||||||||||
|
Niobrara (1)
|
679
|
181
|
93
|
21
|
486
|
169
|
811
|
588
|
||||||||||||||||||||||||
|
Eagle Ford (2)
|
-
|
-
|
-
|
-
|
-
|
-
|
-
|
-
|
||||||||||||||||||||||||
|
North Sugar Valley (3)
|
-
|
-
|
-
|
-
|
-
|
-
|
-
|
-
|
||||||||||||||||||||||||
|
Wattenberg (4)
|
1,734
|
867
|
11,578
|
5,789
|
4,544
|
2,272
|
450
|
225
|
||||||||||||||||||||||||
|
Total
|
2,413
|
1,048
|
11,671
|
5,810
|
5,030
|
2,441
|
1,261
|
813
|
||||||||||||||||||||||||
|
(1)
|
We plan to continue to hold, and not allow to expire, significantly all of this acreage through an active program of completing producing wells thereon to hold such acreage by production, and seeking to extend leases where drilling is not planned prior to expiration. All “net” acreage reflects our acreage held directly and our 20% proportionate share of acreage held by Condor by virtue of our 20% ownership interest in Condor.
|
|
(2)
|
We divested our Eagle Ford asset in full on February 19, 2014 effective November 1, 2013
|
|
(3)
|
All of our North Sugar Valley acreage is currently held by production.
|
|
(4)
|
We plan to seek to hold and not allow to expire that acreage highest in resistivity and most likely to be developed
|
Many of the leases comprising the acreage set forth in the table above will expire at the end of their respective primary terms unless production from the leasehold acreage has been established prior to such date, in which event the lease will remain in effect until the cessation of production in commercial quantities. While we may attempt to secure a new lease upon the expiration of certain of our acreage, there are some third-party leases that may become effective immediately if our leases expire at the end of their respective terms and production has not been established prior to such date. We have options to extend some of our leases through payment of additional lease bonus payments prior the expiration of the primary term of the leases. Our leases are mainly fee leases with three to five years of primary term. We believe that our leases are similar to our competitors’ fee lease terms as they relate to primary term and reserved royalty interests.
Drilling Activity
The following table summarizes our operated and non-operated drilling activity for exploratory and development wells drilled from 2012 through 2013 on our Niobrara, Eagle Ford, and North Sugar Valley assets.
|
Net Exploratory
|
Net Development
|
||||||||||||||||||
|
2012
|
2013
|
2012
|
2013
|
||||||||||||||||
|
Wells Drilled
|
|||||||||||||||||||
|
Productive
|
0.31
|
1.07
|
0.04
|
.08
|
|||||||||||||||
|
Dry
|
-
|
-
|
-
|
-
|
|||||||||||||||
|
Total
|
0.31
|
1.07
|
0.04
|
.08
|
|||||||||||||||
60
Natural Gas and Oil Reserves
Reserves Estimates
The following table sets forth, by property and as of December 31, 2013, our estimated net proved oil and natural gas reserves, and the estimated present value (discounted at an annual rate of ten percent (10%)) of estimated future net revenues before future income taxes (PV-10) and after future income taxes (Standardized Measure) of our proved reserves, each prepared in accordance with assumptions described by the Securities and Exchange Commission (“SEC”).
The PV-10 value is a widely used measure of value of oil and natural gas assets and represents a pre-tax present value of estimated cash flows discounted at ten percent (10%). PV-10 is considered a non-GAAP financial measure as defined by the SEC. We believe that our PV-10 presentation is relevant and useful to our investors because it presents the discounted future net cash flows attributable to our proved reserves before taking into account the related future income taxes, as such taxes may differ among various companies because of differences in the amounts and timing of deductible basis, net operating loss carry forwards and other factors. We believe investors and creditors use our PV-10 as a basis for comparison of the relative size and value of our proved reserves to the reserve estimates of other companies. PV-10 is not a measure of financial or operating performance under GAAP and is not intended to represent the current market value of our estimated oil and natural gas reserves. PV-10 should not be considered in isolation or as a substitute for the standardized measure of discounted future net cash flows as defined under GAAP.
These calculations were prepared using standard geological and engineering methods generally accepted by the petroleum industry and in accordance with SEC financial accounting and reporting standards.
|
Reserves at December 31, 2013
|
||||||||||||
|
Reserve Category
|
Oil
(Bbls)
|
Natural Gas
(MMcf)
|
Total (4)
(BOE)
|
|||||||||
|
Owned Directly by PEDEVCO (1)
|
||||||||||||
|
Proved Developed
|
||||||||||||
|
-Niobrara Held Directly
|
16,665
|
34
|
22,332
|
|||||||||
|
-Eagle Ford Held in White Hawk
|
27,419
|
44
|
34,752
|
|||||||||
|
-North Sugar Valley
|
9,762
|
-
|
9,762
|
|||||||||
|
Total Proved Developed (Direct)
|
53,846
|
78
|
66,846
|
|||||||||
|
Proved Undeveloped
|
||||||||||||
|
-Niobrara Held Directly
|
84,925
|
176
|
114,258
|
|||||||||
|
- Eagle Ford Held in White Hawk
|
-
|
-
|
-
|
|||||||||
|
-North Sugar Valley
|
-
|
-
|
-
|
|||||||||
|
Total Proved Undeveloped (Direct)
|
84,925
|
176
|
114,258
|
|||||||||
|
Total Proved Reserves (Owned Directly by PEDEVCO)
|
138,771
|
254
|
181,104
|
|||||||||
|
Owned Indirectly Through Equity Investees (2)
|
||||||||||||
|
Proved Developed
|
||||||||||||
|
- Niobrara Held in Condor
|
35,465
|
73
|
47,704
|
|||||||||
|
Total Proved Developed (Indirect)
|
35,465
|
73
|
47,704
|
|||||||||
|
Proved Undeveloped
|
||||||||||||
|
- Niobrara Held in Condor
|
218,807
|
454
|
294,477
|
|||||||||
|
Total Proved Undeveloped (Indirect)
|
218,807
|
454
|
294,477
|
|||||||||
|
Total Proved Reserves (Owned Indirectly through Investees)
|
254,272
|
527
|
342,181
|
|||||||||
|
Combined Directly and Indirectly Owned (3)
|
||||||||||||
|
Combined Total Proved Developed Reserves
|
89,311
|
151
|
114,550
|
|||||||||
|
Combined Total Proved Undeveloped Reserves
|
303,732
|
630
|
408,735
|
|||||||||
|
Combined Total Proved Reserves (Direct & Indirect)
|
393,043
|
781
|
523,285
|
|||||||||
|
(1)
|
Includes reserves attributable to our 9.08% average directly held interest in the Niobrara asset, Eagle Ford asset and our North Sugar Valley asset.
|
|
(2)
|
Includes reserves net to the Company’s equity interest held in unconsolidated investments in Condor.
|
|
(3)
|
Includes combined reserves as described in both (1) and (2) above.
|
|
(4)
|
Natural gas is converted on the basis of six (6) Mcf per one (1) barrel of oil equivalent.
|
61
|
Reserves at December 31, 2012
|
||||||||||||
|
Reserve Category
|
Oil
(Bbls)
|
Natural Gas
(MMcf)
|
Total (4)
(BOE)
|
|||||||||
|
Owned Directly by PEDEVCO (1)
|
||||||||||||
|
Proved Developed
|
||||||||||||
|
-Niobrara Held Directly
|
44,512
|
74
|
56,845
|
|||||||||
|
-North Sugar Valley
|
36,988
|
-
|
36,988
|
|||||||||
|
Total Proved Developed (Direct)
|
81,500
|
74
|
93,833
|
|||||||||
|
Proved Undeveloped
|
||||||||||||
|
-Niobrara Held Directly
|
195,008
|
324
|
249,008
|
|||||||||
|
-North Sugar Valley
|
-
|
-
|
-
|
|||||||||
|
Total Proved Undeveloped (Direct)
|
195,008
|
324
|
249,008
|
|||||||||
|
Total Proved Reserves (Owned Directly by PEDEVCO)
|
276,508
|
398
|
342,841
|
|||||||||
|
Owned Indirectly Through Equity Investees (2)
|
||||||||||||
|
Proved Developed
|
||||||||||||
|
- Niobrara Held in Condor
|
29,082
|
48
|
37,082
|
|||||||||
|
- Eagle Ford Held in White Hawk
|
11,147
|
21
|
14,647
|
|||||||||
|
Total Proved Developed (Indirect)
|
40,229
|
69
|
51,729
|
|||||||||
|
Proved Undeveloped
|
||||||||||||
|
- Niobrara Held in Condor
|
323,239
|
537
|
412,739
|
|||||||||
|
- Eagle Ford Held in White Hawk
|
127,480
|
181
|
157,647
|
|||||||||
|
Total Proved Undeveloped (Indirect)
|
450,719
|
718
|
570,386
|
|||||||||
|
Total Proved Reserves (Owned Indirectly through Investees)
|
490,948
|
787
|
622,115
|
|||||||||
|
Combined Directly and Indirectly Owned (3)
|
||||||||||||
|
Combined Total Proved Developed Reserves
|
121,729
|
143
|
145,562
|
|||||||||
|
Combined Total Proved Undeveloped Reserves
|
645,727
|
1,042
|
819,394
|
|||||||||
|
Combined Total Proved Reserves (Direct & Indirect)
|
767,456
|
1,185
|
964,956
|
|||||||||
|
(1)
|
Includes reserves attributable to our 18.75% average directly held interest in the Niobrara asset and our North Sugar Valley asset.
|
|
(2)
|
Includes reserves net to the Company’s equity interest held in unconsolidated investments in Condor and White Hawk.
|
|
(3)
|
Includes combined reserves as described in both (1) and (2) above.
|
|
(4)
|
Natural gas is converted on the basis of six (6) Mcf per one (1) barrel of oil equivalent.
|
62
The following table is a summary of Proved Reserves at December 31, 2013 and 2012 for interests owned directly by PEDEVCO and indirectly through an unconsolidated investment in Condor.
|
December 31, 2013
|
||||||||||||
|
PV-10 (1) (‘000s)
|
Proved Developed
|
Proved Undeveloped
|
Total Proved
|
|||||||||
|
Directly Owned Proved Reserves
|
$
|
2,142
|
$
|
(628)
|
$
|
1,514
|
||||||
|
Indirectly Owned Proved Reserves
|
$
|
1,055
|
$
|
(945)
|
$
|
110
|
||||||
|
Combined Proved Reserves
|
$
|
3,197
|
$
|
(1,573)
|
$
|
1,624
|
||||||
|
December 31, 2012
|
||||||||||||
|
PV-10 (1) (‘000s)
|
Proved Developed
|
Proved Undeveloped
|
Total Proved
|
|||||||||
|
Directly Owned Proved Reserves
|
$
|
2,426
|
$
|
689
|
$
|
3,115
|
||||||
|
Indirectly Owned Proved Reserves
|
$
|
1,219
|
$
|
2,855
|
$
|
4,074
|
||||||
|
Combined Proved Reserves
|
$
|
3,645
|
$
|
3,544
|
$
|
7,189
|
||||||
|
(1)
|
In accordance with applicable financial accounting and reporting standards of the SEC, the estimates of our proved reserves and the PV-10 set forth herein reflect estimated future gross revenue to be generated from the production of proved reserves, net of estimated production and future development costs, using prices and costs under existing economic conditions at December 31, 2013 and 2012. For purposes of determining prices, we used the unweighted arithmetical average of the prices on the first day of each month within the 12-month period ended December 31, 2013 and 2012. The average prices utilized for purposes of estimating our proved reserves as of December 31, 2013 and 2012 were $90.37 and $87.35 per barrel of oil, respectively, and $5.71 and $4.73 per Mcf of natural gas, respectively, for our properties, adjusted by property for energy content, quality, transportation fees and regional price differentials. The prices should not be interpreted as a prediction of future prices. The amounts shown do not give effect to non-property related expenses, such as corporate general administrative expenses and debt service, future income taxes or to depreciation, depletion and amortization.
|
Due to the inherent uncertainties and the limited nature of reservoir data, proved reserves are subject to change as additional information becomes available. The estimates of reserves, future cash flows and present value are based on various assumptions, including those prescribed by the SEC, and are inherently imprecise. Although we believe these estimates are reasonable, actual future production, cash flows, taxes, development expenditures, operating expenses and quantities of recoverable oil and natural gas reserves may vary substantially from these estimates.
Reserve Estimation Process, Controls and Technologies
The reserve estimates, including PV-10, set forth above were prepared by Ryder Scott Company, L.P. (“Ryder Scott”). The reports from Ryder Scott were prepared on March 6, 2014 and March 14, 2014.
These calculations were prepared using standard geological and engineering methods generally accepted by the petroleum industry and in accordance with SEC financial accounting and reporting standards. Our year-end reserve reports are prepared by Ryder Scott based upon a review of property interests being appraised, production from such properties, current costs of operation and development, current prices for production, agreements relating to current and future operations and sale of production, geosciences and engineering data, and other information provided to them by our management team. Ryder Scott also prepares reserve estimates for Condor and White Hawk. This information is reviewed by knowledgeable members of our Company to ensure accuracy and completeness of the data, as it pertains to our Company, prior to submission to Ryder Scott Company, L.P. Upon analysis and evaluation of data provided, Ryder Scott issues preliminary appraisal reports of our directly held and indirectly held reserves. The preliminary appraisal reports and changes in our reserves are reviewed by our independent petroleum consultant, South Texas Reservoir Alliance LLC (“STXRA”), a Certified Professional Petroleum Engineering Company, State of Texas Registration Number F-13460, Frank Ingriselli, President, our President and Chief Executive Officer, and Michael Peterson, our Executive Vice President and Chief Financial Officer, for completeness of the data presented and reasonableness of the results obtained. Messrs. Ingriselli and Peterson have a combined total of over 40 years’ experience in the oil and gas industry. Once any questions have been addressed, Ryder Scott issues the final appraisal reports, reflecting their conclusions.
Ryder Scott is an independent professional engineering firm specializing in the technical and financial evaluation of oil and gas assets. Ryder Scott Company, L.P.’s report was conducted under the direction of Michael F. Stell of Ryder Scott. Ryder Scott, and its employees, have no interest in our Company and were objective in determining our reserves.
Ryder Scott estimated the proved reserves for our properties by performance methods and analogy. All of the proved producing reserves attributable to producing wells and/or reservoirs were estimated by performance methods. These performance methods, such as decline curve analysis, utilized extrapolations of historical production and pressure data available through December 2013 in those cases where such data were considered to be definitive. The data utilized were furnished to Ryder Scott by PEDEVCO or obtained from public data sources. All of the proved developed non-producing and undeveloped reserves were estimated by analogy.
63
Proved Undeveloped Reserves
As of December 31, 2013, our proved undeveloped reserves both owned directly and through equity interests in Condor totaled 393,043 Bbls of oil and 781 MMcf of natural gas, for a total of 523,285 BOE. As of December 31, 2012, our proved undeveloped reserves both owned directly and through equity interests in Condor and White Hawk totaled 645,727 Bbls of oil and 1,041 MMcf of natural gas, for a total of 819,395 BOE. The reduction in proven reserves in the year ended December 31, 2013 was due primarily to a change in our reserve engineer’s interpretation of applicable SEC disclosure guidelines, such that PUDs could only be booked when in between two sections with horizontal Niobrara producers. We believe that this is a very conservative approach and is not consistent with the approach used in our prior year’s reserve report. However, as we continue to develop our assets we believe those previously identified and additional PUDs should be re-realized. The impairment was also the result of a decrease in the production decline curve assumptions that the Company believes were due to lower than expected production from the wells primarily from inclement weather conditions in the third and fourth quarter of 2013 that resulted in flooding and freezing that caused unique and unforeseen mechanical problems at our well sites.
Our proved undeveloped reserves at December 31, 2013 were associated with our properties in our Niobrara asset operated by Condor and our Eagle Ford asset operated by Sundance Energy. In 2012, our first wells were drilled in the Niobrara acreage and a new well was drilled and completed in the Eagle Ford acreage which caused previously nonproducing and unproven acreage to be reclassified as proved developed, proved producing or proved undeveloped acreage. During the fiscal year 2013, we had capital expenditures of approximately $3.4 million in drilling and/or completing costs for these four wells (directly and through our equity interests). We intend to further increase our proved reserves during fiscal year 2014 by drilling additional wells in the Niobrara.
As this is the second year we have booked proved undeveloped reserves and thus none have been booked for longer than five years.
Oil & Gas Production, Production Prices and Production Costs
|
Oil
|
2012
|
2013
|
||||||||||||||||||||||
|
Geography/Field
|
Bbl Sold
|
Average Sales Price
|
Average Production
Cost
|
Bbl Sold
|
Average Sales Price
|
Average Production
Cost
|
||||||||||||||||||
|
-Niobrara
|
2,235
|
$
|
88.79
|
$
|
53.52
|
5,970
|
$
|
90.40
|
$
|
43.36
|
||||||||||||||
|
-North Sugar Valley
|
1,475
|
$
|
99.26
|
$
|
66.11
|
1,627
|
$
|
103.45
|
$
|
199.99
|
||||||||||||||
|
Gas
|
2012
|
2013
|
||||||||||||||||||||||
|
Geography/Field
|
Mcf Sold
|
Average Sales Price
|
Average Production
Cost
|
Mcf Sold
|
Average Sales Price
|
Average Production
Cost
|
||||||||||||||||||
|
-Niobrara
|
-
|
-
|
-
|
5,927
|
$
|
6.02
|
-
|
|||||||||||||||||
|
-North Sugar Valley
|
-
|
-
|
-
|
-
|
-
|
-
|
||||||||||||||||||
Kazakhstan Opportunity Summary (Pending Acquisition)
Acreage
The following table sets forth certain information regarding the developed and undeveloped acreage as of December 31, 2013, with respect to the acreage associated with the proposed Kazakhstan opportunity, if such acquisition is completed. Acreage related to royalty, overriding royalty and other similar interests is excluded from this summary.
|
Undeveloped Acres
|
Developed Acres
|
Total
|
% of
Acreage
Held-by-
|
|||||||||||||||||||||||||
|
Gross
|
Net
|
Gross
|
Net
|
Gross
|
Net
|
Production
|
||||||||||||||||||||||
|
Kazakhstan
|
377,801
|
64,226
|
2,199
|
3,738
|
380,000
|
64,600
|
0.6%
|
|||||||||||||||||||||
64
Undeveloped Acreage Expirations
With respect to the acreage we intend to acquire in connection with the proposed Kazakhstan opportunity, we expect that the gross and net undeveloped acres will expire as follows, unless production is established within the spacing units covering the acreage prior to the expiration dates:
|
2014
|
2015
|
Thereafter
|
|||||||||||||||||||||
|
Gross
|
Net
|
Gross
|
Net
|
Gross
|
Net
|
||||||||||||||||||
|
377,801
|
64,226
|
-
|
-
|
2,199
|
374
|
||||||||||||||||||
Many of the leases comprising the acreage set forth in the table above will expire at the end of their respective primary terms unless production from the leasehold acreage has been established prior to such date, in which event the lease will remain in effect until the cessation of production in commercial quantities. While we may attempt to secure a new lease upon the expiration of certain of our acreage, there are some third-party leases that may become effective immediately if our leases expire at the end of their respective terms and production has not been established prior to such date. We have options to extend some of our leases through payment of additional lease bonus payments prior the expiration of the primary term of the leases. Our leases are mainly fee leases with three to five years of primary term. We believe that our leases are similar to our competitors’ fee lease terms as they relate to primary term and reserved royalty interests.
Office Lease
Our corporate headquarters are located in approximately 2,000 square feet of office space at 4125 Blackhawk Plaza Circle, Suite 201, Danville, California 94506. We lease that space pursuant to a lease that expires on July 31, 2014 and that has a base monthly rent of approximately $4,100.
Although we may, from time to time, be involved in litigation and claims arising out of our operations in the normal course of business, we are not currently a party to any material legal proceeding. In addition, we are not aware of any material legal or governmental proceedings against us, or contemplated to be brought against us.
None
65
PART II
ITEM 5. MARKET FOR REGISTRANT’S COMMON EQUITY, RELATED STOCKHOLDER MATTERS AND ISSUER PURCHASES OF EQUITY SECURITIES.
Market Information
Our common stock traded on the OTC Bulletin Board over-the-counter market from January 13, 2003 to September 9, 2013. On September 10, 2013, the Company's shares of common stock commenced trading on the NYSE MKT under the ticker symbol "PED."
The following high and low closing prices of our common stock, except as otherwise noted, (a) has been adjusted to reflect the 1-for-112 reverse stock split of our common stock that was effected on July 30, 2012; (b) has been adjusted to reflect the 1-for-3 reverse stock split of our common stock that was effected on April 23, 2013; and (c) prior to July 30, 2012, does not reflect any value attributable to our merger with Pacific Energy Development, which occurred on that date. The following price information reflects inter-dealer prices, without retail mark-up, mark-down or commission and may not represent actual transactions.
|
Quarter Ended
|
High
|
Low
|
||||||
|
March 31, 2013
|
$
|
7.44
|
$
|
5.01
|
||||
|
June 30, 2013
|
5.40
|
2.10
|
||||||
|
September 30, 2013
|
4.67
|
2.80
|
||||||
|
December 31, 2013
|
4.20
|
2.00
|
||||||
|
March 31, 2012
|
$
|
6.06
|
$
|
1.02
|
||||
|
June 30, 2012
|
3.36
|
1.02
|
||||||
|
September 30, 2012
|
15.00
|
2.70
|
||||||
|
December 31, 2012
|
10.50
|
6.00
|
||||||
Shareholders
As of March 28, 2014, there were approximately 873 holders of record of our common stock, not including any persons who hold their stock in “street name.”
Common Stock
The Company is authorized to issue 200,000,000 shares of common stock with $0.001 par value per share. Holders of shares of common stock are entitled to one vote per share on each matter submitted to a vote of shareholders. In the event of liquidation, holders of common stock are entitled to share pro rata in the distribution of assets remaining after payment of liabilities, if any. Holders of common stock have no cumulative voting rights, and, accordingly, the holders of a majority of the outstanding shares have the ability to elect all of the directors of the Company. Holders of common stock have no preemptive or other rights to subscribe for shares. Holders of common stock are entitled to such dividends as may be declared by the Board out of funds legally available therefore. The outstanding shares of common stock are validly issued, fully paid and non-assessable.
66
Preferred Stock
The Company is authorized to issue 100,000,000 shares of preferred stock, $0.001 par value per share, of which 25,000,000 shares have been designated “Series A Convertible Preferred Stock”. On January 27, 2013, each outstanding share of Series A Convertible Preferred Stock converted into one share of common stock. Accordingly, the Company has no preferred shares outstanding at December 31, 2013 or as of the date of this filing.
Dividend Policy
We have never declared or paid any dividends on our common stock and do not anticipate that we will pay dividends in the foreseeable future. Any payment of cash dividends on our common stock in the future will be dependent upon the amount of funds legally available, our earnings, if any, our financial condition, our anticipated capital requirements and other factors that the board of directors may think are relevant. However, we currently intend for the foreseeable future to follow a policy of retaining all of our earnings, if any, to finance the development and expansion of our business and, therefore, do not expect to pay any dividends on our common stock in the foreseeable future.
Securities Authorized for Issuance Under Equity Compensation Plans
The following table sets forth information, as of December 31, 2013, with respect to our compensation plans under which common stock is authorized for issuance.
EQUITY COMPENSATION PLAN INFORMATION
|
Plan Category
|
Number of securities to be issued upon exercise of outstanding options, warrants and rights
(A)
|
Weighted-average exercise price of outstanding options, warrants and rights
(B)
|
Number of securities remaining available for future issuance under equity compensation plans (excluding securities reflected in Column A)
(C)
|
|||||||||
|
Equity compensation plans approved by stockholders (1)
|
484,727
|
$
|
1.41
|
664,748
|
(2)
|
|||||||
|
Equity compensation plans not approved by stockholders (3)
|
1,103,826
|
$
|
0.68
|
-
|
||||||||
|
Total
|
1,588,553
|
$
|
0.90
|
664,748
|
||||||||
|
(1)
|
Consists of (i) options to purchase 376,803 shares of common stock issued and outstanding under the Pacific Energy Development Corp. 2012 Equity Incentive Plan, (ii) options to purchase 3,424 shares of common stock issued and outstanding under the Blast Energy Services, Inc. 2009 Incentive Plan, and (iii) options to purchase 104,500 shares of common stock issued and outstanding under the PEDEVCO Corp. 2012 Equity Incentive Plan.
|
|
(2)
|
Consists of 664,748 shares of common stock reserved and available for issuance under the PEDEVCO Corp. 2012 Equity Incentive Plan.
|
|
(3)
|
Consists of (i) options to purchase 953,335 shares of common stock granted by Pacific Energy Development Corp. to employees and consultants of the company in October 2011 and June 2012, and (ii) warrants to purchase 150,491 shares of common stock granted by Pacific Energy Development Corp. and PEDEVCO Corp. to placement agents and consultants between October 2011 and March 2013.
|
67
Stock Transfer Agent
Our Stock Transfer Agent is First American Stock Transfer, located at 4747 N. 7
th
Street, Suite 170, Phoenix, AZ 85014.
Recent Sales of Unregistered Securities
During the past year, we issued and sold the following securities without registration under the Securities Act of 1933, as amended (the “Securities Act”). On April 23, 2013, the Company effected a 1 for 3 reverse stock split of its common and Series A preferred stock. All share and per share amounts used throughout this section have been retroactively restated for the impact of the reverse split.
In January 2013, the Company issued 47,059 shares of its Series A preferred stock in connection with a cashless warrant exercise effected on December 12, 2012.
In January 2013, the Company issued 13,334 shares of restricted common stock with a grant date fair value of $80,000 to an independent contractor for services provided to the Company. The 13,334 shares issued were for services performed in December of 2012 and recorded as a stock payable in 2012.
On January 11, 2013, the Company issued 177,778 shares of restricted common stock upon conversion of 177,778 shares of its Series A preferred stock held by a shareholder.
On January 27, 2013 the Company issued 6,659,682 shares of common stock on a 1-for-1 conversion of all its 6,659,682 outstanding Series A preferred stock, pursuant to the automatic conversion provisions the Company’s Series A Convertible Preferred Stock Amended and Restated Certificate of Designations.
On March 22, 2013, the Company sold $4.0 million in bridge notes and issued warrants exercisable for up to an aggregate of 76,198 shares of common stock in connection with the closing of the Company’s secured promissory note and warrant bridge financing to investors participating therein, and an additional warrant exercisable for up to an aggregate of 9,524 shares of common stock to a placement agent solely in connection with a non-U.S. Person participating in the bridge financing.
On March 29, 2013, the Company rescinded the prior cashless exercise of certain options to purchase an aggregate of 127,800 shares of common stock of the Company by four Company employees, effective December 19, 2012. As a result of the rescission, an aggregate of 120,710 shares of common stock of the Company which were originally issued upon the cashless exercise of the options were surrendered by the holders and cancelled in exchange for the original options at the original terms.
On April 23, 2013, the Company effected a reverse stock split of its common stock on a 1-for-3 basis.
On July 1, 2013, the Company issued an aggregate of 27,804 shares of restricted common stock to Esenjay Oil & Gas, Ltd., Winn Exploration Co., Inc., Lacy Properties, Ltd., and Crain Energy, Ltd. (collectively, “Esenjay”), as additional consideration due to Esenjay upon the spudding by Condor of the State 16-7-60 1H well on June 13, 2013.
On July 11, 2013, the Company issued to South Texas Reservoir Alliance LLC an aggregate of 33,815 restricted shares of common stock as equity compensation in connection with the Company’s acquisition of certain interests in the Mississippian formation in southern Kansas from Berexco LLC that closed in March 2013.
On July 15, 2013, the Company issued a five-year warrant exercisable for 240,000 shares of the Company’s common stock on a cashless basis to an investor relations consultant as partial consideration for certain investor relations services to be provided to the Company (the “IR Warrant”). The IR Warrant has an exercise price per share of $5.00, and vests with respect to 50% of the shares issuable thereunder upon the IR Warrant issuance date, and 50% on February 1, 2014, subject to continued engagement by the Company of the investor relations consultant on such date. On October 9, 2013, the investor relations consultant notified the Company that it was immediately winding-down its operations and was terminating all investor relations engagements, including with the Company. Accordingly, the Company cancelled the IR Warrant in full on October 25, 2013 due to non-performance by the consultant.
68
On August 9, 2013, options to purchase an aggregate of 104,500 shares of common stock were granted to four consultants and employees at an exercise price of $3.75 per share, pursuant to the Company’s 2012 Equity Incentive Plan (described in greater detail below under “Part II - “Item 11. Executive Compensation” – “Equity Incentive Plans”) and in connection with the Company’s year 2012 annual equity incentive compensation review process. The options have terms of five years and fully vest in August 2016. 40% of the shares subject to the options vest six months from the date of grant, 15% vest eighteen months from the date of grant, 15% vest two years from the date of grant, 15% vest two and one-half years from the date of grant and the final 15% vest three years from the date of grant, all contingent upon the recipient’s continued service with the Company. The aggregate fair value of the options on the date of grant, using the Black-Scholes model, is $228,670.
On August 9, 2013, the Company granted an aggregate of 1,165,000 shares of its restricted common stock with an aggregate fair value of $4,368,750 to certain officers and employees of the Company pursuant to the Company’s 2012 Equity Incentive Plan and in connection with the Company’s year 2012 annual equity incentive compensation review process. 40% of the shares vest six months from the date of grant, 15% vest eighteen months from the date of grant, 15% vest two years from the date of grant, 15% vest two and one-half years from the date of grant and the final 15% vest three years from the date of grant, all contingent upon the recipient’s continued service with the Company.
On August 9, 2013, the Company granted an aggregate of 25,750 shares of its restricted common stock with an aggregate fair value of $96,563 to certain employees of, and consultants to, the Company pursuant to the Company’s 2012 Equity Incentive Plan and in connection with the Company’s year 2012 annual equity incentive compensation review process. The shares fully vest on the six month anniversary of the grant date, all contingent upon the recipient’s continued service with the Company.
On August 12, 2013, the Company completed the closing of a private placement (the “Private Placement”) pursuant to which it sold (a) 7,333,334 shares of its restricted common stock at a price of $3.00 per share, which included rights to the following warrants (b) three-year warrants exercisable on a cash basis only for (i) an aggregate of 733,334 shares of common stock at $3.75 per share, (ii) an aggregate of 733,334 shares of common stock at $4.50 per share, and (iii) an aggregate of 733,334 shares of common stock at $5.25 per share, to two investors for aggregate proceeds to the Company in connection with such subscription of $22 million, $20 million of which securities were acquired by Yao Hang Finance (Hong Kong) Limited (the “Lead Investor”), the lead investor in the Private Placement, and $2 million of which securities were acquired by an outside investor (the “Outside Investor”). The Lead Investor paid $10 million in cash at the closing, and entered into a Common Stock and Warrant Subscription Agreement (the “Subscription Agreement”), First Amendment to Common Stock and Warrant Subscription Agreement (the “Amendment”), and full-recourse promissory note (the “Note”), which Amendment and Note require that it pay the balance of $10 million in cash due no later than December 1, 2013, with 3,333,333 of the shares of common stock issued to the Lead Investor in the Private Placement (the “Escrowed Shares”), as well as warrants exercisable for (i) an aggregate of 333,333 shares of common stock at $3.75 per share, (ii) an aggregate of 333,333 shares of common stock at $4.50 per share, and (iii) an aggregate of 333,333 shares of common stock at $5.25 per share (collectively, the “Escrowed Warrants”), being held in escrow by the Company pending the Lead Investor’s payment in full of the $10 million due under the Note. The Outside Investor also entered into a Subscription Agreement, Amendment and Note, which Amendment and Note require that it pay the $2 million purchase price for the common stock and warrants no later than September 11, 2013, with all shares and warrants issued to the Outside Investor in the Private Placement being held in escrow by the Company pending the Outside Investor’s payment in full of the $2 million due under the Note. The Company paid $10 million of the cash proceeds received in the Private Placement to Asia Sixth as an initial deposit in connection with the pending Kazakhstan Acquisition described above under
“Part I” – “Item 1. Business” - “Recent Developments” - “Rescission of Shares and Warrants and Cancellation of Note”.
On September 30, 2013, the Company received cash payment in full from the Outside Investor that was due under the $2 million promissory note, and the Outside Investor’s shares and warrants were released from escrow. Upon receipt of the final $10 million due under the outstanding $10 million promissory note, the Company was obligated to remit such funds to Asia Sixth in connection with the Kazakhstan Acquisition, thereby increasing the Company’s deposit from $10 million to a total of $20 million. However, in the event the final $10 million due under the outstanding $10 million promissory note was not received by the Company, the Company was not obligated to increase its deposit amount to Asia Sixth, and the Company was allowed to rescind the corresponding number of shares of common stock and warrants originally issued to the investor to the extent acquired in exchange for the cancellation of the $10 million promissory note, and/or pursue other legal remedies. The investor failed to pay the $10 million balance due under the Note by December 1, 2013. On December 1, 2013, the Company granted a verbal extension to the investor pending further discussions regarding the investment. Following discussions with the investor, the investor elected to forego making further investment. Accordingly, on March 7, 2014, the Company notified the investor that, effective immediately, the Escrowed Shares and Escrowed Warrants were rescinded as permitted pursuant to the terms of the Note, and the Note was cancelled and forgiven, with no further action required by the investor (the “Cancellation”). The stock subscription receivable related to 3,333,333 shares of common stock and 999,999 warrants for shares of common stock in the amount of $10 million was extinguished as of March 7, 2014. The Note was cancelled and Escrowed Shares and Escrowed Warrants held by the Company in escrow were cancelled and rescinded by the Company.
On August 20, 2013, the Company issued 4,900 shares of restricted common stock to a former director of Blast Energy Services, Inc. in connection with the exercise of 4,900 warrants.
69
On September 10, 2013, the Company granted an aggregate of 26,668 shares of its restricted common stock with an aggregate fair value of $120,006 to the two new independent directors of the Company pursuant to the Company’s 2012 Equity Incentive Plan. 100% of the shares vest on the one year anniversary date of grant, contingent upon the recipient’s continued service with the Company.
On October 16, 2013, the Company entered into a research services agreement with a consultant in connection with which the Company was obligated to issue 15,000 shares of restricted common stock of the Company, vesting on January 6, 2014, subject to approval of the Board of Directors of the Company. The Company’s Board of Directors approved the grant of stock to the consultant, and the restricted stock was issued to the consultant on November 6, 2014 upon receipt of additional listing approval from the NYSE MKT, which was received on such date.
On October 31, 2013, the Company issued 12,768 shares of common stock to an employee in connection with the cashless net exercise of 12,768 options.
On November 6, 2013, the Company granted an aggregate of 305,000 shares of its restricted common stock with an aggregate fair value of $924,150, for placement agent services rendered to the Company. 100% of the shares vested on January 28, 2014.
On January 6, 2014, the Company issued 28,683 shares of common stock to a consultant in connection with the exercise of 33,334 options.
On February 6, 2014, the Company issued 29,647 shares of common stock to a former consultant in connection with the cashless net exercise of 33,334 options.
On February 11, 2014, the Company issued 20,000 shares of common stock to a consultant in connection with the exercise of 20,000 options.
On March 24, 2014, the Company issued 190,000 restricted shares of common stock to a consultant in full satisfaction of an outstanding obligation to pay $405,777 due for previous services provided.
In December 2013, we issued amended bridge notes and bridge warrants in December 2013, as described in greater detail above under “Part I” – “Item 1. Business” - “Recent Developments” - “Amendment to Bridge Notes and Subordination and Intercreditor Agreements” to the holders of bridge notes originally sold in March 2013.
In March 2014, we entered into Amended Notes with the bridge note holders as described in greater detail above under “Part I” – “Item 1. Business” - “Recent Developments” - “Amendment to Bridge Notes and Subordination and Intercreditor Agreements”.
In March 2014, we sold the Initial Notes to the Investors in the initial principal amount of $34.5 million, as described in greater detail above under “Part I” – “Item 1. Business” - “Recent Developments” - “
Note Purchase Agreement and Sale of Secured Promissory Notes”.
On March 24, 2014, the Company issued a five-year cashless warrant exercisable for 1,000,000 shares of common stock at an exercise price of $2.50 per share to a financial advisor as partial compensation due, described in greater detail above under
“Part I” – “Item 1. Business” - “Recent Developments” - “
Note Purchase Agreement and Sale of Secured Promissory Notes”.
The issuances and grants described above were exempt from registration pursuant to Section 4(2), Rule 506 of Regulation D and/or Regulation S of the Securities Act since the foregoing issuances and grants did not involve a public offering, the recipients took the securities for investment and not resale, we took take appropriate measures to restrict transfer, and the recipients were (a) “accredited investors”; (b)
had
access to similar documentation and information as would be required in a Registration Statement under the Act; (c) were non-U.S. persons; and/or (d) were officers or directors of the Company.
With respect to any exchanges or conversions of our outstanding securities discussed above, we claim an exemption from registration afforded by Section 3(a)(9) of the Act for the above conversions, as the securities were exchanged by our company with its existing security holders exclusively in transactions where no commission or other remuneration was paid or given directly or indirectly for soliciting such exchange.
70
Use of Proceeds From Sale of Registered Securities
Our Registration Statement on Form S-3 (Reg. No. 333-191869) in connection with the sale by us of up to $100 million in securities (common stock, preferred stock, warrants and units) was declared effective by the Securities and Exchange Commission on November 5, 2013.
On December 2, 2013, we filed a preliminary Rule 424(b)(5) prospectus supplement and on December 10, 2013, we filed a final Rule 424(b)(5) prospectus supplement relating to the primary offering by us in a fully-underwritten offering of 3,250,000 shares of common stock at a public offering price per share of $2.25. The offering closed on December 13, 2013. The net proceeds to us from our sale of the common stock were $6,281,767 (after deducting the underwriting discount and offering expenses payable by us, and payment by us of an advisory fee equal to 2% of the public offering price per share due and payable to Casimir Capital L.P., the Company’s financial advisor). The underwriter of the offering (National Securities Corporation) was also provided an option to purchase an additional 487,500 shares from us, at the public offering price less the underwriting discount, within 45 days of the offering to cover over-allotments, if any, which overallotment option was not exercised by the underwriter. No further shares will be sold under the prospectus supplement.
On February 28, 2014, we filed a preliminary Rule 424(b)(5) prospectus supplement and on March 4, 2014, we filed a final Rule 424(b)(5) prospectus supplement relating to the primary offering by us in a fully-underwritten offering of 2,990,000 shares of common stock at a public offering price per share of $2.15. The underwriters of the offering
(
Roth Capital Partners as Sole Book-Running Manager and National Securities Corporation as Co-Manager) were also provided an option to purchase an additional 448,500 shares from us, at the public offering price less the underwriting discount, within 30 days of the offering to cover over-allotments, if any, which overallotment option was exercised in full by the underwriters. The offering (including the sale of the underwriters’ overallotment shares) closed on March 7, 2014. The net proceeds to us from our sale of the common stock (including the shares sold in connection with the exercise of the underwriters’ overallotment) were $6,581,000 (after deducting the underwriting discount and commissions and offering expenses payable by us). No further shares will be sold under the prospectus supplement.
No payments for our expenses were made in either offering described above directly or indirectly to (i) any of our directors, officers or their associates, (ii) any person(s) owning 10% or more of any class of our equity securities or (iii) any of our affiliates. We used the net proceeds from the offerings as described in our final prospectuses filed with the SEC pursuant to Rule 424(b).
There has been no material change in the planned use of proceeds from our offerings as described in our final prospectuses filed with the SEC pursuant to Rule 424(b).
Issuer Purchases of Equity Securities
None.
ITEM 6. SELECTED FINANCIAL DATA
Not required under Regulation S-K for “smaller reporting companies.”
71
ITEM 7. MANAGEMENT’S DISCUSSION AND ANALYSIS OF FINANCIAL CONDITION AND RESULTS OF OPERATIONS
The following discussion and analysis of our financial condition and results of operations should be read in conjunction with the consolidated financial statements and related notes appearing elsewhere in this Annual Report. The following discussion contains “forward-looking statements” that reflect our future plans, estimates, beliefs and expected performance. We caution you that assumptions, expectations, projections, intentions or beliefs about future events may, and often do, vary from actual results and the differences can be material. See “Risk Factors” and “Forward Looking Statements.”
On July 27, 2012, we completed our acquisition of Pacific Energy Development Corp., which we refer to as Pacific Energy Development. The acquisition was accounted for as a “reverse acquisition,” and Pacific Energy Development was deemed to be the accounting acquirer in the acquisition. Because Pacific Energy Development Corp. was deemed the acquirer for accounting purposes, the financial statements of Pacific Energy Development are presented as the continuing accounting entity and the below discussion solely relates to the financial information of Pacific Energy Development as the continuing accounting entity.
Overview
We are an energy company engaged primarily in the acquisition, exploration, development and production of oil and natural gas shale plays in the United States, and a secondary focus on conventional oil and natural gas plays. Our current operations are located primarily in the Niobrara Shale play in the DJ Basin in Weld and Morgan Counties, Colorado, and the Mississippian Lime play in Comanche, Harper, Barber and Kiowa Counties, Kansas. In March 2014, we expanded our DJ Basin position into the Wattenberg and Wattenberg Extension through the acquisition of additional oil and gas working interests from Continental, which includes approximately 14,000 net operated acres and interests in 40 wells located in Weld and Morgan Counties, Colorado. We also hold an interest in the North Sugar Valley Field in Matagorda County, Texas, though we consider this a non-core asset. We have entered into agreements to acquire an approximate 34% indirect interest (of which we are required to assign 50% of such interest, or 17%, to RJ Resources, as discussed below) in a company holding an exploration agreement covering an approximately 380,000 acre oil and gas producing asset located in the Pre-Caspian Basin in Kazakhstan, which we plan to close upon receipt of required approvals from the Kazakhstan government, anticipated to be received no later than the third quarter of 2014, as described in greater detail below.
We have approximately 16,379 net acres of oil and gas properties in the DJ Basin, including 13,995 net acres in our recently acquired Wattenberg Asset, and 2,384 net acres of oil and gas properties in our Niobrara Asset. Red Hawk holds our Wattenberg Asset with interests in 40 wells, 11 of which are operated by Red Hawk, 14 are non-operated, and Red Hawk has an after-payout interest in 15, with a two week average production from the 11 operated wells since their acquisition on March 7, 2014 of approximately 434 gross BOE per day, which does not include production from two of the wells which are currently undergoing repair. We estimate that once we bring these two wells back on production, the production from the 11 operated wells will be 504 gross BOE per day. We have not yet received enough information in regards to the 14 non-operated wells to estimate their current production. Condor, in which we own a 20% interest and manage with an affiliate of MIE Holdings Corporation, operates our Niobrara Asset, including five wells in the Niobrara Asset with daily production in the month of February 2014 of approximately 180 BOE (47 BOE net). We believe our current Wattenberg Asset could contain approximately a total of 1,256 gross (175 net) drilling locations, and our Niobrara Asset could contain a total of 212 gross (81 net) drilling locations, for a combined total of 1,468 gross (256 net) possible drilling locations in the DJ Basin, based on 40 and 80 acre spacing.
We have approximately 7,006 gross (3,443 net acres) of oil and gas properties in the Mississippian Asset, which we own an average of 49% working interest in and operate. We believe the Mississippian Asset could contain a total of 42 gross (21 net) drilling locations, based on 160 acre spacing.
We have also announced the entry into Kazakhstan through an agreement whereby we plan to acquire an approximate 34% indirect interest in Aral, a Kazakhstan entity which holds a 100% operated working interest in a production license covering the contract area issued by the Republic of Kazakhstan that expires in 2034 in western Kazakhstan, from Asia Sixth, which Contract Area covers 380,000 acres within the North Block located in the Pre-Caspian Basin. Under the agreement, we plan to acquire an interest in Aral through the acquisition of a 51% interest in Asia Sixth, by way of subscription of shares of Asia Sixth, which in turn currently holds a 60% controlling interest in Aral. Asia Sixth’s interest in Aral is scheduled to increase to 66.5% following the completion of certain transactions to occur between Asia Sixth and Asia Sixth’s partner in Aral that currently holds the remaining 40% interest in Aral. Upon closing and completion of the Aral Transactions, Aral will be owned 66.5% by Asia Sixth. We have also entered into an agreement with our strategic partner, RJ Resources, pursuant to which we have agreed, at the option of RJ Resources, to either (a) provide for the issuance of the share certificate representing the shares of capital stock due from Asia Sixth representing 51% of the total issued and outstanding share capital of Asia Sixth which we have the right to purchase from Asia Sixth, to a Delaware limited liability company to be formed by us and to convey to RJ Resources fifty percent (50%) of the limited liability company interests issued by such Nominee or (b) provide for fifty percent (50%) of such Asia Sixth shares to be issued directly to RJ Resources or its designee. Upon the closing and completion of these contemplated transactions, the Company, through its ownership in Asia Sixth, will own an approximate 17% beneficial interest in Aral.
We believe that the Wattenberg, Niobrara, and Mississippian Shale plays represent among the most promising unconventional oil and natural gas plays in the United States. We will continue to seek additional acreage proximate to our currently held core acreage. Our strategy is to be the operator, directly or through our subsidiaries and joint ventures, in the majority of our acreage so we can dictate the pace of development in order to execute our business plan. The majority of our capital expenditure budget for 2014 will be focused on the acquisition, development and expansion of these formations.
Detailed information about our business plans and operations, including our core Niobrara, Eagle Ford and Mississippian assets, is contained under “Part 1” - “Item 1. Business” beginning on
page
5
of this Annual Report.
72
How We Conduct Our Business and Evaluate Our Operations
Our use of capital for acquisitions and development allows us to direct our capital resources to what we believe to be the most attractive opportunities as market conditions evolve. We have historically acquired properties that we believe had significant appreciation potential. We intend to continue to acquire both operated and non-operated properties to the extent we believe they meet our return objectives.
We will use a variety of financial and operational metrics to assess the performance of our oil and natural gas operations, including:
|
●
|
production volumes;
|
|
●
|
realized prices on the sale of oil and natural gas, including the effects of our commodity derivative contracts;
|
|
●
|
oil and natural gas production and operating expenses;
|
|
●
|
capital expenditures;
|
|
●
|
general and administrative expenses;
|
|
●
|
net cash provided by operating activities; and
|
|
●
|
net income.
|
Production Volumes
Production volumes will directly impact our results of operations. We currently have production from 11 gross operated wells and 14 gross non-operated wells in our recently acquired Wattenberg Asset, five gross wells in our Niobrara Asset, and two gross wells in our North Sugar Valley field, and we expect to increase production assuming drilling success in the future as we expand operations in our Wattenberg, Niobrara and Mississippian Assets.
Factors Affecting the Sales Price of Oil and Natural Gas
We expect to market our crude oil and natural gas production to a variety of purchasers based on regional pricing. The relative prices of crude oil and natural gas are determined by the factors impacting global and regional supply and demand dynamics, such as economic conditions, production levels, weather cycles and other events. In addition, relative prices are heavily influenced by product quality and location relative to consuming and refining markets.
Oil.
The New York Mercantile Exchange-West Texas Intermediate (NYMEX-WTI) futures price is a widely used benchmark in the pricing of domestic crude oil in the U.S. The actual prices realized from the sale of crude oil differ from the quoted NYMEX-WTI price as a result of quality and location differentials. Quality differentials to NYMEX-WTI prices result from the fact that crude oils differ from one another in their molecular makeup, which plays an important part in their refining and subsequent sale as petroleum products. Among other things, there are two characteristics that commonly drive quality differentials: (a) the crude oil’s American Petroleum Institute, or API, gravity and (b) the crude oil’s percentage of sulfur content by weight. In general, lighter crude oil (with higher API gravity) produces a larger number of lighter products, such as gasoline, which have higher resale value and, therefore, normally sell at a higher price than heavier oil. Crude oil with low sulfur content (“sweet” crude oil) is less expensive to refine and, as a result, normally sells at a higher price than high sulfur-content crude oil (“sour” crude oil).
Location differentials to NYMEX-WTI prices result from variances in transportation costs based on the produced crude oil’s proximity to the major consuming and refining markets to which it is ultimately delivered. Crude oil that is produced close to major consuming and refining markets, such as near Cushing, Oklahoma, is in higher demand as compared to crude oil that is produced farther from such markets. Consequently, crude oil that is produced close to major consuming and refining markets normally realizes a higher price (i.e., a lower location differential to NYMEX-WTI).
In the past, crude oil prices have been extremely volatile, and we expect this volatility to continue. For example, for the four years ended December 31, 2013, the NYMEX - WTI oil price ranged from a high of $113.93 per Bbl to a low of $68.01 per Bbl. These markets will likely continue to be volatile in the future.
73
Natural Gas.
The NYMEX-Henry Hub price of natural gas is a widely used benchmark for the pricing of natural gas in the U.S. Similar to crude oil, the actual prices realized from the sale of natural gas differ from the quoted NYMEX-Henry Hub price as a result of quality and location differentials. Quality differentials to NYMEX-Henry Hub prices result from: (a) the British thermal unit (Btu) content of natural gas, which measures its heating value, and (b) the percentage of sulfur, CO2 and other inert content by volume. Wet natural gas with a high Btu content sells at a premium to low Btu content dry natural gas because it yields a greater quantity of natural gas liquids (NGLs). Natural gas with low sulfur and CO2 content sells at a premium to natural gas with high sulfur and CO2 content because of the added cost to separate the sulfur and CO2 from the natural gas to render it marketable. Wet natural gas is processed in third-party natural gas plants and residue natural gas as well as NGLs are recovered and sold. Dry natural gas residue from our properties is generally sold based on index prices in the region from which it is produced.
Location differentials to NYMEX-Henry Hub prices result from variances in transportation costs based on the natural gas’ proximity to the major consuming markets to which it is ultimately delivered. Also affecting the differential is the processing fee deduction retained by the natural gas processing plant generally in the form of percentage of proceeds. Generally, these index prices have historically been at a discount to NYMEX-Henry Hub natural gas prices.
In the past, natural gas prices have been extremely volatile, and we expect this volatility to continue. For example, for the four years ended December 31, 2013, the NYMEX - Henry Hub natural gas price ranged from a high of $7.51 per MMBtu to a low of $1.82 per MMBtu. These markets will likely continue to be volatile in the future.
Commodity Derivative Contracts
. We expect to adopt a commodity derivative policy designed to minimize volatility in our cash flows from changes in commodity prices. We have not determined the portion of our estimated production, if any, for which we will mitigate our risk through the use of commodity derivative instruments, but in no event will we maintain a commodity derivative position in an amount in excess of our estimated production. Should we reduce our estimates of future production to amounts which are lower than our commodity derivative volumes, we will reduce our positions as soon as practical. If forward crude oil or natural gas prices increase to prices higher than the prices at which we have entered into commodity derivative positions, we may be required to make margin calls out of our working capital in the amounts those prices exceed the prices we have entered into commodity derivative positions.
Oil and Natural Gas Production Expenses
.
We will strive to increase our production levels to maximize our revenue. Oil and natural gas production expenses are the costs incurred in the operation of producing properties and workover costs. We expect expenses for utilities, direct labor, water injection and disposal, and materials and supplies to comprise the most significant portion of our oil and natural gas production expenses. Oil and natural gas production expenses do not include general and administrative costs or production and other taxes. Certain items, such as direct labor and materials and supplies, generally remain relatively fixed across broad production volume ranges, but can fluctuate depending on activities performed during a specific period. For instance, repairs to our pumping equipment or surface facilities may result in increased oil and natural gas production expenses in periods during which they are performed.
A majority of our operating cost components will be variable and increase or decrease as the level of produced hydrocarbons and water increases or decreases. For example, we will incur power costs in connection with various production related activities such as pumping to recover oil and natural gas and separation and treatment of water produced in connection with our oil and natural gas production. Over the life of hydrocarbon fields, the amount of water produced may increase for a given volume of oil or natural gas production, and, as pressure declines in natural gas wells that also produce water, more power will be needed to provide energy to artificial lift systems that help to remove produced water from the wells. Thus, production of a given volume of hydrocarbons may become more expensive each year as the cumulative oil and natural gas produced from a field increases until, at some point, additional production becomes uneconomic.
Production
and Ad Valorem Taxes
. Texas regulates the development, production, gathering and sale of oil and natural gas, including imposing production taxes and requirements for obtaining drilling permits. For oil production, Texas currently imposes a production tax at 4.6% of the market value of the oil produced and an additional regulatory fee of 3/16 of one cent per barrel of crude petroleum produced plus an oil cleanup fee of 5/16 of a cent per barrel of crude petroleum produced, and for natural gas, Texas currently imposes a production tax at 7.5% of the market value of the natural gas produced. Colorado imposes production taxes ranging from 2% to 5% based on gross income and a conservation tax ranging from 0.07% to 1.5% based on the market value of oil and natural gas production. Ad valorem taxes are generally tied to the valuation of the oil and natural gas properties; however, these valuations are reasonably correlated to revenues, excluding the effects of any commodity derivative contracts.
General and Administrative Expenses
. General and administrative expenses related to being a publicly traded company include: Exchange Act reporting expenses; expenses associated with Sarbanes-Oxley compliance; expenses associated with our efforts to have our shares listed on the NYSE MKT; independent auditor fees; legal fees; investor relations expenses; registrar and transfer agent fees; director and officer liability insurance costs; and director compensation. As a publicly-traded company, we expect that general and administrative expenses will continue to be significant.
Income Tax Expense
. We are a C-corporation for federal income tax purposes, and accordingly, we are directly subject to federal income taxes which may affect future operating results and cash flows. We are also subject to taxation through our membership interests in our joint ventures, which are limited liability companies taxed as pass-through entities.
74
Liquidity and Capital Resources
Liquidity Outlook
We expect to incur substantial expenses and generate significant operating losses as we continue to explore for and develop our oil and natural gas prospects, and as we opportunistically invest in additional oil and natural gas properties, develop our discoveries which we determine to be commercially viable and incur expenses related to operating as a public company and compliance with regulatory requirements.
Our future financial condition and liquidity will be impacted by, among other factors, the success of our exploration and appraisal drilling program, the number of commercially viable oil and natural gas discoveries made and the quantities of oil and natural gas discovered, the speed with which we can bring such discoveries to production, and the actual cost of exploration, appraisal and development of our prospects. Assuming that we complete one or more public or private debt or equity financings to fund our planned 2014 capital expenditures and repay our outstanding debt as it becomes due, we plan to make capital expenditures, excluding capitalized interest and general and administrative expense, of up to $22 million during the period from January 1, 2014 to December 31, 2014 in order to achieve our plans.
We expect our projected cash flow from operations combined with our existing cash on hand and the $15.5 million gross ($12.5 million net, after origination-related fees and expenses) available under our current debt facility will be sufficient to fund our operations for the next twelve months. The debt due to the holders of secured promissory notes dated March 22, 2013, as amended, in the principal amount of $2.375 million maturing on July 31, 2014, and the repayment of debt due to MIEJ under a secured subordinated promissory note dated February 14, 2013, as amended March 25, 2013 and July 9, 2013, in the principal amount of $6.17 million maturing on August 31, 2014, have been subordinated and are not eligible to be repaid until the maturity of our senior credit facility, described in greater detail below under “Secured Debt Funding”, but may be paid if and when our senior creditor allows during the three year term of our senior credit facility. We may seek additional funding through asset sales, farm-out arrangements, lines of credit, or public or private debt or equity financings to fund additional 2014 capital expenditures and/or repay or refinance a portion or all of our outstanding debt if allowed to do so by our senior creditor.
Our capital budget may be adjusted as business conditions warrant. The amount, timing and allocation of capital expenditures is largely discretionary and within our control. If oil and natural gas prices decline or costs increase significantly, we could defer a significant portion of our budgeted capital expenditures until later periods to prioritize capital projects that we believe have the highest expected returns and potential to generate near-term cash flows. We routinely monitor and adjust our capital expenditures in response to changes in prices, availability of financing, drilling and acquisition costs, industry conditions, timing of regulatory approvals, availability of rigs, success or lack of success in drilling activities, contractual obligations, internally generated cash flows and other factors both within and outside our control.
Historical Liquidity and Capital Resources
Amendment to PEDCO-MIEJ Note
On March 25, 2013, we and MIE Jurassic Energy Corporation (“MIEJ”), amended and restated that certain Secured Subordinated Promissory Note, dated February 14, 2013 provided to MIEJ by our wholly-owned subsidiary PEDCO (the “MIEJ Note”), to increase from $5 million the maximum amount available for us to borrow thereunder to $6.5 million, and to permit amounts borrowed under the MIEJ Note to be used by us to fund fees and expenses allocable to us with respect to our operations in the Niobrara Asset, Niobrara Asset-related acquisition expenses, and repayment of $432,433 due to Condor as a refund of the performance deposit paid by MIEJ with respect to the Mississippian Asset acquisition and applied toward our purchase price of the Mississippian Asset. The MIEJ Note converted amounts previously advanced by MIEJ to us in the amount of $2.17 million to fund operations in the Niobrara Asset through November 1, 2012, as well as an additional $2 million loaned by MIEJ to us under the MIEJ Note on February 14, 2013 and $2 million loaned by MIEJ to us under the MIEJ Note on March 25, 2013.
75
On July 9, 2013, we and MIEJ agreed to amend the MIEJ Note to extend the maturity date from December 31, 2013 to August 31, 2014, and to remove the maturity trigger upon the closing of a debt or equity financing transaction with gross proceeds of $10 million to the Company. The Amended and Restated Secured Subordinated Promissory Note (the “Amended Note”), dated July 9, 2013, amends and restates the MIEJ Note. Under the Amended Note, PEDCO may draw down multiple advances up to a maximum of $6.5 million outstanding principal under the Note, with repaid amounts not being permitted to be re-borrowed. Amounts borrowed under the Amended Note may be used by PEDCO to fund fees and expenses allocable to PEDCO with respect to its operations in the Niobrara Asset. When drawn, principal borrowed under the Amended Note carries an interest rate of 10.0% per annum. Principal and accrued interest under the Amended Note are due and payable within ten (10) business days of August 31, 2014. The Amended Note may be prepaid in full by the Company without penalty, and is secured by all of PEDCO’s ownership and working interest in the FFT2H, Waves 1H, Logan 2H, State 16-7-60 1H and Wickstrom 18-2H wells located in the Niobrara Asset, and all corresponding leasehold rights pooled with respect to such well, and PEDCO’s ownership and working interest in each future well drilled and completed in the Niobrara Asset. The total principal amount outstanding under the note is $6.17 million as of December 31, 2013. There is currently approximately $330,000 available for future borrowing by PEDCO under the note. Further, the Company owes $585,777 in accrued interest at December 31, 2013 under the Note.
Amendments to Condor-MIEJ Note
On July 9, 2013, Condor, the Company’s 20% owned subsidiary, and MIEJ agreed to amend the Promissory Note (the “Original Condor-MIEJ Note”) previously entered into on February 14, 2013 by Condor and MIEJ, to increase the amount available for borrowing from $14 million to $25 million for the purposes of funding drilling and development of Condor’s assets. The Amended and Restated Promissory Note, executed July 9, 2013 by Condor and effective June 28, 2013 (the “Amended Condor-MIEJ Note”), amends and restates the Original Condor-MIEJ Note. Under the Amended Condor-MIEJ Note, Condor may draw down multiple advances up to a maximum of $25 million outstanding principal under the Amended Condor-MIEJ Note (previously $14 million), with repaid amounts not being permitted to be re-borrowed. When drawn, principal borrowed under the Amended Condor-MIEJ Note carries an interest rate per annum equal to the one (1) month LIBOR rate, plus four percent (4%). Principal and accrued interest due under the Amended Condor-MIEJ Note is due and payable on the date that is 36 months from the date each advance is made under the Amended Condor-MIEJ Note. The note may be prepaid in full by Condor without penalty. The total principal amount outstanding as of December 31, 2013 under the Amended Condor-MIEJ Note is $26,472,535.
Bridge Notes
On March 22, 2013, to finance the acquisition of the Mississippian Asset, we closed a private placement of $4.0 million aggregate principal amount of secured promissory notes (the “Bridge Notes”). The Company incurred debt offering costs and deferred financing costs of $40,000 in connection with the debt placement.
The bridge notes were amended effective December 16, 2013, or the effective date, to provide for (i) the extension of the maturity date of such bridge notes, which were originally due as of December 31, 2013, to July 31, 2014, which we refer to as the extension term and new maturity date, respectively, (ii) the subordination of the bridge notes to certain of our future qualified senior indebtedness with a principal amount of at least $5.0 million, (iii) the payment in full of all accrued interest through the effective date on January 8, 2014, or the payment date, equal to an aggregate of $294,795 due and payable to the bridge investors on the payment date, (iv) the payment in full of the payment-in-kind amount, or PIK, equal to 10% of the original principal amount of such bridge notes on the payment date, equal to an aggregate of $400,000 due and payable to the bridge investors on the payment date, (v) the repayment of either none or 50% of the outstanding principal amount due under such bridge notes, as elected by the holders thereof, on the payment date, which aggregate principal repayment of $1,625,000 shall be due and payable to the bridge investors on the payment date as elected by the holders, (vi) the amendment of the interest rate of such bridge notes for the extension term from 10% per annum to 12% per annum with respect to the remaining unpaid principal amount of such bridge notes, or the deferred principal, and (vii) an additional payment-in-kind cash amount equal to 10% of the deferred principal due on the new maturity date, or the additional PIK. In total, eleven (11) bridge investors holding bridge notes with an aggregate principal amount outstanding of $3,250,000 elected to defer 50% of their principal, agreeing to defer an aggregate of $1,625,000 in principal amount of the bridge notes, and five (5) bridge investors holding bridge notes with an aggregate principal amount outstanding of $750,000 elected to defer 100% of their principal, for a total deferred principal of $2,375,000, and an aggregate additional PIK due and paid upon the new maturity date of $237,500.
As additional consideration for the amendment of the bridge notes, we granted a new warrant, which we refer to as the new warrant, exercisable on a cashless basis at an exercise price of $2.34 per share for a number of shares of our common stock equal to (x) two times the number of shares issuable under the bridge warrant originally issued to each holder who agreed to defer 50% of the outstanding principal of its bridge note, and (y) three times the number of shares issuable under the bridge warrant originally issued to each holder who agreed to defer 100% of the outstanding principal of his, her, or its bridge note, for a total of new warrants exercisable for an aggregate of 166,684 shares of our common stock issuable. The new warrants have a 4-year life and have substantially the same terms as the bridge warrants originally issued to the bridge investors.
76
On March 7, 2014, we entered into the Second Amendment to Secured Promissory Notes (each, an “Amended Note,” and collectively, the “Amended Notes”) with all but one of the bridge investors.
The Amended Notes amended the bridge notes to allow the holders thereof the right to convert up to 100% of the outstanding and unpaid principal amount (but in increments of not less than 25% of the principal amount of each bridge note outstanding as of the entry into the Amended Notes and only up to four (4) total conversions of not less than 25% each); the additional payment-in-kind cash amount equal to 10% of the principal amount of each holder’s bridge note which was deferred pursuant to the First Amendment; and all accrued and unpaid interest under each bridge note (collectively, the “Conversion Amount”) into our common stock, subject to an additional listing application regarding such common stock being approved by the NYSE MKT. Upon a conversion, the applicable holder shall receive that number of shares of common stock as is determined by dividing the Conversion Amount by a conversion price (the “Conversion Price”) as follows:
(A) prior to June 1, 2014, the Conversion Price shall be $2.15 per share; and
(B) following June 1, 2014, the denominator used in the calculation described above shall be the greater of (i) 80% of the average of the closing price per share of our publicly traded common stock for the five (5) trading days immediately preceding the date of the conversion notice provide by the holder; and (ii) $0.50 per share.
Additionally, each bridge investor entered into a Subordination and Intercreditor Agreement in favor of the Agent, subordinating and deferring the repayment of the bridge notes, and actions in connection with the security interests provided under the bridge notes, until full repayment of the Notes sold pursuant to the Note Purchase in March 2014, as described in greater detail below. The Subordination and Intercreditor Agreements also prohibit us from repaying the bridge notes until the Notes have been paid in full, except that we are allowed to repay the bridge notes from net proceeds received from the sale of common or preferred stock (i) in calendar year 2014 if such net proceeds received in such calendar year exceeds $35,000,000, (ii) in calendar year 2015 if such net proceeds received in such calendar year exceeds $50,000,000, and (iii) in calendar year 2016 if such net proceeds actually received in such calendar year exceeds $50,000,000.
Private Placement
On August 12, 2013, we completed the closing of a $22 million private placement offering to two investors for aggregate initial proceeds to the Company of $10 million. The private placement was comprised of $20 million of common stock and warrants from one investor and $2 million of common stock and warrants from another investor. The Company received $10 million in cash on August 12, 2013, and received promissory notes for $2 million which was due by September 11, 2013 and $10 million which was due by December 1, 2013. The Company paid $10 million of the cash proceeds received in the private placement to Asia Sixth as an initial deposit for the Kazakhstan Acquisition. On September 30, 2013, the Company received cash payment in full that was due under the $2 million promissory note. As of December 31, 2013, the $10 million promissory note (due by December 1, 2013) had not been received and is recorded as a $10 million stock subscription receivable on the balance sheet. The investor failed to pay the $10 million balance due under the Note by December 1, 2013. On December 1, 2013, the Company granted a verbal extension to the investor pending further discussions regarding the investment. Following discussions with the investor, the investor elected to forego making further investment. Accordingly, on March 7, 2014, the Company notified the investor that, effective immediately, the Escrowed Shares and Escrowed Warrants were rescinded as permitted pursuant to the terms of the Note, and the Note was cancelled and forgiven, with no further action required by the investor (the “Cancellation”). The stock subscription receivable related to 3,333,333 shares of common stock and 999,999 warrants for shares of common stock in the amount of $10 million was extinguished as of March 7, 2014. The rescission of the note has no net effect on us or our obligations to increase our initial deposit due to Asia Sixth because (a) if such note was paid in full we would have been required to pay such funds directly to Asia Sixth; and (b) the result of such funds not being paid only results in a decrease in the required deposit due to Asia Sixth.
The $10 million deposit is subject to full refund to the Company in the event the transaction does not close, other than as a result of the Company’s material uncured breach, provided, however, that pursuant to our agreement with RJ Resources, if any part of the $10 million deposit previously paid by the Company is returned to the Company, 50% of any such returned funds must be paid to RJ Resources. These funds will also be used, in part, to recomplete and rework currently producing wells with the goal of significantly increasing their production rates. Based on how these wells perform, at closing, the Company shall owe to Asia Sixth a final closing payment equal to an additional: (i) $20 million if the daily average volume of oil produced by Aral over a specified 30 day period (the “Target Volume”) equals or exceeds 1,500 barrels of oil per day (“BOPD”); (ii) $15 million if the Target Volume equals or exceeds 1,000 BOPD but is less than 1,500 BOPD; or (iii) $0 due if the Target Volume comes in less than 1,000 BOPD. Pursuant to our agreement with RJ Resources, RJ Resources is obligated to pay 50% of any final closing payment due to Asia Sixth.
77
Eagle Ford Sale
On February 19, 2014, White Hawk entered into and closed a Purchase and Sales Agreement with Millennial PDP Fund IV, LP (“Millennial”), pursuant to which White Hawk sold its remaining interest in the Eagle Ford shale play to Millennial for $2,718,158 in cash (subject to adjustment as provided in the sale agreement). Pursuant to the sale agreement (which included customary indemnification requirements and representations and warranties of the parties), the sale had an effective date of November 1, 2013, and Millennial delivered to White Hawk the sale consideration on February 27, 2014.
Registered Public Offerings
On December 13, 2013, we closed an underwritten public offering of an aggregate of 3,250,000 shares of common stock at price of $2.25 per share to the public. We received net proceeds of $6,281,767. We expect to use the net proceeds from the offering to fund drilling operations, for working capital and other general corporate purposes.
On March 7, 2014, we closed an underwritten public offering of an aggregate of 3,438,500 shares of common stock, which included the full exercise of an overallotment option by the underwriters, at price of $2.15 per share to the public. The Company expects to use the net proceeds of approximately $6,581,000 from the March 2014 Offering to fund drilling operations, for working capital and other general corporate purposes.
Secured Debt Funding
In connection with our acquisition of the Wattenberg Asset, on March 7, 2014, we entered into and effected the transactions contemplated by the Note Purchase (described in greater detail above under “Part I” – “Item 1. Business” - “Recent Developments “ - “Wattenberg Asset Acquisition”), pursuant to which we sold the Investors Secured Promissory Notes in the aggregate amount of $34.5 million (the “Initial Notes”).
We received $29,325,000 before expenses in connection with the sale of the Initial Notes after paying the Investors an original issue discount in connection with the sale of the Notes of $1,725,000 (5% of the balance of the Initial Notes); and an underwriting fee of $3,450,000 (10% of the balance of the Initial Notes). In connection with the Note Purchase, we also reimbursed approximately $135,000 of the legal fees and expenses of the Investors’ counsel, and paid the Casimir Note Closing Fee of $1,716,905, to Casimir, our investment banker in the transaction, as described and defined below, leaving a net of approximately $27,473,095 which was received by us on March 7, 2014.
From time to time, subject to the terms and conditions of the Note Purchase (including the requirement that we have deposited funds in an aggregate amount of any additional requested loan into a segregated bank account (the “Company Deposits”)), and prior to the Maturity Date (defined below), we have the right to request additional loans (to be evidenced by notes with substantially similar terms as the Initial Notes, the “Subsequent Notes”, and together with the Initial Notes, the “Notes”) from RJC, up to an additional $15.5 million in total or an aggregate of $50 million together with the Initial Notes. We are required to pay original issue discounts in the amount of 5% of the funds borrowed, underwriting fees in the amount of 10% of the amount of the funds borrowed, reimburse certain of the legal fees of RJC’s counsel, and pay applicable fees to Casimir representing 5% of any funds borrowed, in connection with funds borrowed under any Subsequent Notes. Funds borrowed under any Subsequent Notes are only eligible to be used by us, together with Company Deposits, for approved AFEs issued for a well or wells to be drilled and completed on any properties acquired in connection with the Continental Acquisition or owed by us in connection with the Mississippian Asset. The total aggregate amount of any Subsequent Notes cannot exceed $15.5 million and in the event we drill a dry hole, we are prohibited from using the proceeds from the sale of any Subsequent Notes, without the consent of RJC. Additionally, pursuant to the Note Purchase, no proceeds we receive from the transfer, sale, assignment or farm-out of the Mississippian Asset may be used to fund the Company Deposits.
The Notes are due and payable on March 6, 2017 (the “Maturity Date”), and may be repaid in full without premium or penalty at any time.
As additional consideration for the Note Purchase transaction and for RJ Resources agreeing to purchase the Subsequent Notes, RJ Resources acquired ownership of 50% of all of our oil and gas assets and properties acquired in connection with the Continental Acquisition, rights to 50% of the oil and gas assets and properties which we have the right to acquire in Kazakhstan pursuant to the Shares Subscription Agreement, and effective ownership of 50% of the Mississippian Asset.
The Notes bear interest at the rate of 15% per annum, payable monthly in arrears, on the first business day of each month beginning April 1, 2014 (in connection with the Initial Notes), provided that upon the occurrence of an event of default, the Notes bear interest at the lesser of 30% per annum and the maximum legal rate of interest allowable by law. We can prepay all or any portion of the principal amount of Notes, without premium or penalty. The Notes include standard and customary events of default.
78
Additionally, we are required on the third business day of each month, commencing on April 1, 2014, to prepay the Notes in an amount equal to the lesser of (a) the outstanding principal amount of the Notes or (b) twenty-five percent (25%) of the aggregate of all net revenues actually received by us and our subsidiaries (other than net revenues received by Asia Sixth, unless and to the extent received by us in the United States) or for the immediately preceding calendar month (or such pro rata portion of the first month the payment is required). The Notes also provide that RJC is to be repaid (i) accrued interest, only after all of the other Investors are repaid any accrued interest due and (ii) principal, only after all of the other Investors are repaid the full amount of principal due under their Notes, and (iii) that any funding in connection with Subsequent Notes will be made solely by RJC.
The amount outstanding under the Notes is secured by a first priority security interest in all of our and our subsidiaries, assets, property, real property, intellectual property, securities and proceeds therefrom, granted in favor of the Agent for the benefit of the Investors. Additionally, the Agent, for the benefit of the Investors, was granted a mortgage and security interest in all of our and our subsidiaries real property as located in the state of Colorado (including those assets acquired pursuant to the Continental Acquisition) and the state of Texas. Additionally, our obligations under the Notes, Note Purchase Agreement and related agreements were guaranteed by our wholly-owned and majority owned direct and indirect subsidiaries.
The net proceeds from the Initial Funding were used by us (along with funds raised through the February 2014 sale of assets which were formerly owned by White Hawk), to purchase assets located in Weld and Morgan Counties, Colorado, from Continental Resources, Inc. as part of the Continental Acquisition, which transaction closed on March 7, 2014, and (ii) to pay fees and expenses incurred in connection with the transactions contemplated by the Note Purchase and Continental Acquisition.
We previously engaged Casimir as our investment banker and non-exclusive placement agent in connection with among other things, the transactions contemplated by the Note Purchase, and in connection with the closing of the Note Purchase, we paid Casimir a fee of $1,716,905 in connection therewith (the “Casimir Note Closing Fee”). Upon the closing of the Note Purchase, we were also obligated to grant to Casimir warrants to purchase up to 1,000,000 shares of our common stock at an exercise price of $2.50 per share (the closing sales price of our common stock on the date immediately prior to the closing date of the Note Purchase), which were issued on March 24, 2014, and which warrants have cashless exercise rights and a term of five years (the “Casimir Warrants”).
We had total current assets of $7.0 million as of December 31, 2013, including cash of $6.6 million, compared to total current assets of $2.8 million as of December 31, 2012, including a cash balance of $2.5 million.
We had total assets of $25.8 million as of December 31, 2013 and $11.1 million as of December 31, 2012. Included in total assets as of December 31, 2013 and December 31, 2012 were $2.2 million and $2.4, respectively, of proved oil and gas properties subject to amortization and $6.6 million and $0.9 million, respectively, in unproved oil and gas properties not subject to amortization,
We had total liabilities of $14.9 million as of December 31, 2013, including current liabilities of $14.8 million, compared to total liabilities of $4.8 million as of December 31, 2012, including current liabilities of $4.7 million.
We had negative working capital of $7.8 million, total stockholders’ equity of $10.9 million and a total accumulated deficit of $30.9 million as of December 31, 2013, compared to negative working capital of $1.9 million, total stockholders’ equity of $5.1 million and a total accumulated deficit of $12.8 million as of December 31, 2012.
79
Results of Operations
As a result of the reverse acquisition, the financial statements of Pacific Energy Development prior to the merger are presented as the financial statements of the Company. The financial statements prior to the date of the merger represent the operations of pre-merger Pacific Energy Development only. After the date of the merger, the financial statements include the operations of the combined companies.
Comparison of the Year Ended December 31, 2013 with the Year Ended December 31, 2012
Oil and Gas Revenue.
We had total revenue of approximately $744,000 for the year ended December 31, 2013, compared to approximately $503,000 in revenue for the year ended December 31, 2012. Revenue in 2012 was generated after February 2012 from Pacific Energy Development’s one producing well in the Niobrara Asset and approximately $146,000 in revenue generated after the merger on July 27, 2012 from the former Blast business (“Blast”) operations. Prior to February 2012, Pacific Energy Development was focused on acquiring oil and natural gas properties, and did not yet generate any revenue. Revenue in 2013 was generated from Pacific Energy Development’s three producing wells in the Niobrara Asset and approximately $168,000 in revenue generated from “Blast” operations.
Lease Operating Expense.
Operating expenses associated with the oil and gas properties were approximately $648,000 for the year ended December 31, 2013 compared to approximately $281,000 for the year ended December 31, 2012. Operating expenses for 2012 were comprised of approximately $176,000 for Pacific Energy Development and approximately $105,000 attributable to Blast after the merger on July 27, 2012. Operating expenses for 2013 were comprised of approximately $259,000 for Pacific Energy Development and approximately $389,000 attributable to Blast.
Selling, General and Administrative
. Selling, general and administrative (“SG&A”) expenses increased by approximately $3,419,000 to approximately $7,149,000 for the year ended December 31, 2013 compared to approximately $3,730,000 for the year ended December 31, 2012. The increase was primarily due to increased stock compensation expense, professional service fees, and legal fees
.
|
For the Years Ended
|
||||||||||||
|
December 31,
|
Increase
|
|||||||||||
|
(in thousands)
|
2013
|
2012
|
(Decrease)
|
|||||||||
|
Payroll and related costs
|
$
|
1,685
|
$
|
1,682
|
$
|
3
|
||||||
|
Option and warrant expense
|
3,198
|
621
|
2,577
|
|||||||||
|
Legal fees and settlements
|
441
|
162
|
279
|
|||||||||
|
Professional services
|
1,380
|
910
|
470
|
|||||||||
|
Insurance
|
178
|
109
|
69
|
|||||||||
|
Travel & entertainment
|
152
|
111
|
41
|
|||||||||
|
Office rent, communications and other
|
115
|
135
|
(20)
|
|||||||||
|
$
|
7,149
|
$
|
3,730
|
$
|
3,419
|
|||||||
Impairment of Goodwill.
There were no impairment of goodwill in the year ended December 31, 2013 compared to approximately $6,820,000 in the year ended December 31, 2012.
Management evaluated the amount of goodwill associated with the merger with Blast in 2102 following the allocation of fair value to the assets and liabilities acquired and determined that the goodwill should be fully impaired and has reflected the impairment on the statement of operations as of the date of the merger for the year ending December 31, 2012.
Impairment of Oil and Gas Properties.
Impairment costs for proved properties in the year ended December 31, 2013 were approximately $3,303,000 compared to approximately $180,000 in the year ended December 31, 2012.
The Company assessed the recoverability of the carrying value of the proved properties by estimating the future net undiscounted cash flows expected to result from the asset based on the reserve report prepared by the Company's independent reserve engineers, including eventual disposition. As the future net undiscounted cash flows were less than the carrying value of the asset, an impairment loss was recorded equal to the difference between the asset’s carrying value and estimated fair value of the future net discounted cash flows associated with the properties. The impairment in 2013 was primarily due to a reduction in proven reserves in the year ended December 31, 2013. This decrease in proven reserves was due primarily to a change in our reserve engineer’s interpretation of applicable SEC disclosure guidelines, such that PUDs could only be booked when in between two sections with horizontal Niobrara producers. We believe that this is a very conservative approach and is not consistent with the approach used in our prior year’s reserve report. However, as we continue to develop our assets we believe those previously identified and additional PUDs should be re-realized. The impairment was also the result of a decrease in the production decline curve assumptions that the Company believes were due to lower than expected production from the wells primarily from inclement weather conditions in the third and fourth quarter of 2013 that resulted in flooding and freezing that caused unique and unforeseen mechanical problems at our well sites.
Depreciation, Depletion and Amortization (“DD&A”)
. DD&A costs were approximately $437,000 for the year ended December 31, 2013, compared to approximately $131,000 for the year ended December 31, 2012. Recording of depletion commenced in 2012 when the wells began producing revenue.
Gain on Sale of Equity Method Investments.
In connection with the White Hawk Sale in May 2012, the Company recorded a gain of $64,000 representing the difference between the Company’s carrying value of the 50% investment sold ($1,875,000) and the fair value of the net sale proceeds received from MIE Holdings ($1,939,000). There was no such sale in 2013.
80
Loss from Equity Method Investment.
Loss from equity method investments was $5,778,000 in 2013, compared with $358,000 in 2012. The Company has two investments accounted for using the equity method, Condor and White Hawk. The higher loss was due primarily to impairment costs associated with proven properties within Condor, the loss on sale of the White Hawk properties that was finalized in February 2014, but recognized in 2013, and offset in part by net income generated by White Hawk in both years. The Condor impairment to oil and gas properties was $26.0 million (of which 20% was attributed to Pedevco). Management assessed the recoverability of the carrying value of the proved properties using estimated future net undiscounted cash flows based on the reserve report prepared by the Company's independent reserve engineers, which were less than the carrying value. The $26.0 million impairment loss equals the difference of the carrying value and estimated fair value. There is minimal risk of additional significant impairment losses in Condor proved properties affecting PEDEVCO as most of the carrying value has already been impaired.
Interest Expense.
Interest expense was $1,591,000 for the year ended December 31, 2013 compared to $986,000 for the year ended December 31, 2012, an increase of $605,000. This increase is primarily due to the increased interest expense due to borrowings of $4,000,000 under Bridge Notes issued in March, 2013 along with the related warrants and PIK. In addition the borrowings from MIE increased from $2,170,000 in the beginning of 2013 to $6,170,065 as of December 31, 2013. These increases were offset in part by the 2012 satisfaction of the Centurion note acquired from Blast in the merger (including the amortization of $507,000 for debt discount and $63,000 of interest expense) and $380,000 of interest in 2012 incurred on the extension of the due date for a deferred payment related to the acquisition of the Eagle Ford property held in Excellong E&P-2, Inc. (now White Hawk Petroleum, LLC).
Gain on Debt Extinguishment.
In 2012, the Company recorded a loss of $160,000 for debt extinguishment in connection with modifications made to amounts borrowed from Centurion Credit Funding, LLC under the Note Purchase Amendment dated January 13, 2012 as a significant conversion feature was added to the terms of the note and the Company’s Merger with Blast triggered the contingent conversion feature. The Company recorded a gain on debt extinguishment of $169,000 in connection with amounts forgiven by Centurion Credit Funding, LLC for the complete extinguishment of the outstanding debt during the year. The net gain on debt extinguishment for the year ended December 31, 2012 was approximately $9,000.There was no such debt extinguishment applicable to 2013.
Loss on Settlement of Payable
. During the year ended December 31, 2013, the Company recorded a loss on a settlement of payable in the amount of approximately $8,000 compared to approximately $140,000 for the year ended December 31, 2012, with 2012 related to the issuance of 279,749 shares of Series A preferred Stock in full satisfaction and release of our obligation to Esenjay.
Net Loss.
Net loss increased by $6,132,000 to a net loss of $18,145,000 for the year ended December 31, 2013 compared to a net loss of $12,013,000 for the year ended December 31, 2012. This increase was primarily due to an increase in impairment costs of $3,123,000, an increased loss from Equity Method Investment of $5,420,000 due to Condor impairment costs, offset somewhat by $6,820,000 for goodwill impairment recorded in 2012. Additionally there was an increase in SG&A of $3,419,000 in 2013 as described above, increased interest expense of about $605,000, and an increase in lease operating expenses of about $367,000,
Cash Flows from Operating Activities.
Pacific Energy Development had net cash used in operating activities of $2,263,000 for the year ended December 31, 2013, which was primarily due to a $18,145,000 loss from continuing operations offset by $3,198,000 of stock compensation expense;$2,946,000 for impairment of oil and gas properties, and $5,778,000 of loss from equity method investments
.
Cash Flows from Investing Activities.
Pacific Energy Development had net cash used in investing activities of $20,198,000 for the year ended December 31, 2013. Cash was used for oil and gas property additions in the amount of $5,341,000, $1,050,000 for drilling costs, $10,000,000 for a deposit on the Company’s Kazakhstan investment, and $4,020,000 cash funded to White Hawk and Condor as notes receivable.
Cash Flows from Financing Activities.
Pacific Energy Development had net cash provided from financing activities of $26,596,000 for the year ended December 31, 2013, which was due primarily to stock issued for cash in the amount of $18,282,000 and proceeds from the issuance of notes payable of $8,000,000.
Recently Issued Accounting Pronouncements
There were various accounting standards and interpretations issued during 2013 and 2012, none of which are expected to have a material impact on the Company’s financial position, operations or cash flows.
In July 2012 the FASB issued ASU 2012-02
Testing Indefinite-Lived Intangible Assets for Impairment
, which amends Topic 350 and gives companies the option first to assess qualitative factors to determine whether the existence of events and circumstances indicates that it is more likely than not that the indefinite-lived intangible asset is impaired. If, after assessing the totality of events and circumstances, an entity concludes that it is not more likely than not that the indefinite-lived intangible asset is impaired, then the entity is not required to take further action. However, if an entity concludes otherwise, then it is required to determine the fair value of the indefinite-lived intangible asset and perform the quantitative impairment test by comparing the fair value with the carrying amount in accordance with Topic 350-30. This ASU shall be applied prospectively for annual and interim impairment tests performed for fiscal years beginning after September 15, 2012 and early adoption is permitted. Implementation of the ASU is not expected to have a significant impact on the Company’s consolidated financial statements.
Critical Accounting Policies
Our discussion and analysis of our financial condition and results of operations is based on our financial statements, which have been prepared in accordance with accounting principles generally accepted in the United States. The preparation of these financial statements requires us to make estimates and judgments that affect the reported amounts of assets, liabilities, revenues and expenses. We base our estimates on historical experience and on various other assumptions that we believe to be reasonable under the circumstances, the results of which form the basis for making judgments about the carrying values of assets and liabilities that are not readily apparent from other sources. Actual results may differ from these estimates under different assumptions or conditions. We believe the following critical accounting policies affect our most significant judgments and estimates used in preparation of our financial statements.
81
Revenue Recognition.
All revenue is recognized when persuasive evidence of an arrangement exists, the service or sale is complete, the price is fixed or determinable and collectability is reasonably assured. Revenue is derived from the sale of crude oil. Revenue from crude oil sales is recognized when the crude oil is delivered to the purchaser and collectability is reasonably assured. We follow the “sales method” of accounting for oil and natural gas revenue, which means we recognize revenue on all natural gas or crude oil sold to purchasers, regardless of whether the sales are proportionate to our ownership in the property. A receivable or liability is recognized only to the extent that we have an imbalance on a specific property greater than our share of the expected remaining proved reserves. If collection is uncertain, revenue is recognized when cash is collected. We recognize reimbursements received from third parties for out-of-pocket expenses incurred as service revenues and account for out-of-pocket expenses as direct costs.
Equity Method Accounting for Joint Ventures
. The majority of our oil and gas interests are held all or in part by the following joint ventures which we jointly own with affiliates of MIE Holdings:
- Condor Energy Technology LLC, which we refer to as Condor, which is a Nevada limited liability company owned 20% by us and 80% by an affiliate of MIE Holdings. We account for our 20% ownership in Condor using the equity method; and
- White Hawk Petroleum, LLC, which we refer to as White Hawk, which is a Nevada limited liability company owned 50% by us and 50% by an affiliate of MIE Holdings. We also account for our 50% interest in this entity using the equity method.
We evaluated our relationship with Condor and White Hawk to determine if either qualified as a variable interest entity ("VIE"), as defined in ASC 810-10, and whether we were the primary beneficiary, in which case consolidation with us would be required. We determined that both Condor and White Hawk qualified as a VIE, but since we were not the primary beneficiary of either Condor or White Hawk that consolidation was not required for either entity.
Effective December 31, 2013, MIEJ withdrew from White Hawk and we became the sole member. Accordingly, White Hawk will no longer be deemed an equity method investee following such date, and White Hawk’s results will be consolidated.
Oil and Natural Gas Properties, Successful Efforts Method.
We use the successful efforts method of accounting for oil and gas producing activities. Under the successful efforts method, costs to acquire mineral interests in oil and gas properties, to drill and equip exploratory wells that find proved reserves, and to drill and equip development wells are capitalized. Costs to drill exploratory wells that do not find proved reserves, geological and geophysical costs, and costs of carrying and retaining unproved properties are expensed as incurred. We evaluate our proved oil and gas properties for impairment on a field-by-field basis whenever events or changes in circumstances indicate that an asset’s carrying value may not be recoverable. We follow Accounting Standards Codification ASC 360 - Property, Plant, and Equipment, for these evaluations. Unamortized capital costs are reduced to fair value if the undiscounted future net cash flows from our interest in the property’s estimated proved reserves are less than the asset’s net book value.
Accounting for Asset Retirement Obligations.
If a reasonable estimate of the fair value of an obligation to perform site reclamation, dismantle facilities or plug and abandon wells can be made, we will record a liability (an asset retirement obligation or “ARO”) on our consolidated balance sheet and capitalize the present value of the asset retirement cost in oil and natural gas properties in the period in which the retirement obligation is incurred. In general, the amount of an ARO and the costs capitalized will be equal to the estimated future cost to satisfy the abandonment obligation assuming the normal operation of the asset, using current prices that are escalated by an assumed inflation factor up to the estimated settlement date, which is then discounted back to the date that the abandonment obligation was incurred using an assumed cost of funds for our company. After recording these amounts, the ARO will be accreted to its future estimated value using the same assumed cost of funds and the capitalized costs are depreciated on a unit-of-production basis over the estimated proved developed reserves. Both the accretion and the depreciation will be included in depreciation, depletion and amortization expense on our consolidated statement of income.
Stock-Based Compensation.
Pursuant to the provisions of FASB ASC 718, Compensation – Stock Compensation, which establishes accounting for equity instruments exchanged for employee service, we utilize the Black-Scholes option pricing model to estimate the fair value of employee stock option awards at the date of grant, which requires the input of highly subjective assumptions, including expected volatility and expected life. Changes in these inputs and assumptions can materially affect the measure of estimated fair value of our share-based compensation. These assumptions are subjective and generally require significant analysis and judgment to develop. When estimating fair value, some of the assumptions will be based on, or determined from, external data and other assumptions may be derived from our historical experience with stock-based payment arrangements. The appropriate weight to place on historical experience is a matter of judgment, based on relevant facts and circumstances. We estimate volatility by considering historical stock volatility. We have opted to use the simplified method for estimating expected term, which is equal to the midpoint between the vesting period and the contractual term.
82
Not required under Regulation S-K for “smaller reporting companies.”
ITEM 8. FINANCIAL STATEMENTS AND SUPPLEMENTARY DATA.
The audited consolidated financial statements and supplementary data required by this Item are presented beginning on page F-1 of this Annual Report on Form 10-K.
None.
Disclosure Controls and Procedures
Disclosure controls and procedures are designed to ensure that information required to be disclosed in our reports filed or submitted under the Securities Exchange Act of 1934, as amended (the “Exchange Act”) is recorded, processed, summarized and reported, within the time period specified in the SEC’s rules and forms and is accumulated and communicated to the Company’s management, as appropriate, in order to allow timely decisions in connection with required disclosure.
Evaluation of Disclosure Controls and Procedures
Under the supervision and with the participation of our management, including our Chief Executive Officer and Chief Financial Officer, we conducted an evaluation of the effectiveness of the design and operation of our disclosure controls and procedures, as defined in Rules 13a-15(e) and 15d-15(e) under the Exchange Act as of the end of the period covered by this Annual Report. Based on this evaluation, our Chief Executive Officer and Chief Financial Officer concluded that as of December 31, 2013, that our disclosure controls and procedures were not effective.
As a result of the formative stage of our development, the Company has not fully implemented the necessary internal controls. The matters involving internal controls and procedures that the Company's management considered to be material weaknesses under the standards of the Committee of Sponsoring Organizations of the Treadway Commission (COSO) were: (1) insufficient written policies and procedures for accounting and financial reporting with respect to the requirements and application of accounting principles generally accepted in the United States of America (“GAAP”) and SEC disclosure requirements; and (2) ineffective controls over period end financial disclosure and reporting processes.
Management believes that the material weaknesses set forth above did not have an effect on the Company's financial results reported herein. We are committed to improving our financial organization. As part of this commitment, we have recently increased our personnel resources and technical accounting expertise as we develop the internal and financial resources of the Company. In addition, the Company will prepare and implement sufficient written policies and checklists which will set forth procedures for accounting and financial reporting with respect to the requirements and application of GAAP and SEC disclosure requirements.
Management believes that preparing and implementing sufficient written policies and checklists will remedy the following material weaknesses (i) insufficient written policies and procedures for accounting and financial reporting with respect to the requirements and application of GAAP and SEC disclosure requirements; and (ii) ineffective controls over period end financial close and reporting processes.
We have improved our financial organization as we have increased our personnel resources and technical accounting expertise.
83
We will continue to monitor and evaluate the effectiveness of our internal controls and procedures and our internal controls over financial reporting on an ongoing basis.
Management’s Report on Internal Control Over Financial Reporting
Management of the Company is responsible for establishing and maintaining adequate internal control over financial reporting as defined in Rules 13a-15(f) and 15d-15(f) under the Exchange Act. The Company’s internal control over financial reporting is designed to provide reasonable assurance regarding the reliability of financial reporting and the preparation of financial statements for external purposes in accordance with GAAP, but because of its inherent limitations, internal control over financial reporting may not prevent or detect misstatements. The Company’s internal control over financial reporting includes those policies and procedures that are designed to:
|
●
|
pertain to the maintenance of records that, in reasonable detail, accurately and fairly reflect the transactions and dispositions of the assets of the Company;
|
|
|
●
|
provide reasonable assurance that transactions are recorded as necessary to permit preparation of financial statements in accordance with GAAP, and that receipts and expenditures of the Company are being made only in accordance with authorizations of management and directors of the Company; and
|
|
|
●
|
provide reasonable assurance regarding prevention or timely detection of unauthorized acquisition, use or disposition of the Company’s assets that could have a material effect on the financial statements.
|
Management assessed the effectiveness of the Company’s internal control over financial reporting as of December 31, 2013. In making this assessment, management used the criteria set forth by the Committee of Sponsoring Organizations of the Treadway Commission in Internal Control — Integrated Framework. Based on our assessment, management believes that the Company’s internal controls over financial reporting were not effective as of December 31, 2013.
During the year December 31, 2013, we reevaluated our most recent assessment of internal controls and concluded that that our internal controls were still not effective. The Company has recently hired additional accounting staff to provide more resources and expand the technical accounting knowledge.
Changes in Internal Control Over Financial Reporting
As an early stage company, we continue to develop our internal control systems. We continue to seek additional financial reporting and accounting experience and expertise. The Company has implemented certain internal controls with respect to: (1) its financial closing process to ensure that all transactions are properly identified, evaluated for accounting and disclosure treatment and recorded in the proper period; and (2) its controls over reporting between the Company and its related party operations (Condor and White Hawk). The Company is in the process of implementing standardized, written internal controls and procedures. These controls and procedures have not yet been fully developed or documented. The Company expects to complete the initial phase of its internal controls development over the next six months.
Except as otherwise discussed above, there were no changes in our internal controls over financial reporting during the fourth quarter of the year ended December 31, 2013 that have materially affected or are reasonably likely to materially affect, our internal controls over financial reporting, including any corrective actions with regard to significant deficiencies and material weaknesses.
Limitations on the Effectiveness of Controls
The Company’s disclosure controls and procedures are designed to provide the Company’s Chief Executive Officer and Chief Financial Officer with reasonable assurances that the Company’s disclosure controls and procedures will achieve their objectives. However, the Company’s management does not expect that the Company’s disclosure controls and procedures or the Company’s internal control over financial reporting can or will prevent all human error. A control system, no matter how well designed and implemented, can provide only reasonable, not absolute, assurance that the objectives of the control system are met. Furthermore, the design of a control system must reflect the fact that there are internal resource constraints, and the benefit of controls must be weighed relative to their corresponding costs. Because of the limitations in all control systems, no evaluation of controls can provide complete assurance that all control issues and instances of error, if any, within the Company’s company are detected. These inherent limitations include the realities that judgments in decision-making can be faulty, and that breakdowns can occur due to human error or mistake. Additionally, controls, no matter how well designed, could be circumvented by the individual acts of specific persons within the organization. The design of any system of controls is also based in part upon certain assumptions about the likelihood of future events, and there can be no assurance that any design will succeed in achieving its stated objectives under all potential future conditions.
Attestation Report of the Registered Public Accounting Firm
This report does not include an attestation report of our registered public accounting firm regarding our internal controls over financial reporting. Under SEC rules, such attestation is not required for smaller reporting companies such as ourselves.
None.
84
Executive Officers, Directors and Director Nominees
The following table sets forth the name, age and position held by each of our executive officers and directors. Directors are elected for a period of one year and thereafter serve until the next annual meeting at which their successors are duly elected by the shareholders.
|
Name
|
Age
|
Position
|
||
|
Frank C. Ingriselli
|
59
|
Executive Chairman of the Board, Chief Executive Officer and President
|
||
|
Michael L. Peterson
|
52
|
Chief Financial Officer and Executive Vice President
|
||
|
Jamie Tseng
|
60
|
Senior Vice President and Managing Director
|
||
|
Clark Moore
|
41
|
Executive Vice President, General Counsel and Secretary
|
||
|
Elizabeth P. Smith
|
64
|
Director
|
||
|
David C. Crikelair
|
66
|
Director
|
There is no arrangement or understanding between our directors and executive officers and any other person pursuant to which any director or officer was or is to be selected as a director or officer, and there is no arrangement, plan or understanding as to whether non-management shareholders will exercise their voting rights to continue to elect the current Board of Directors (the “Board”). There are also no arrangements, agreements or understandings to our knowledge between non-management shareholders that may directly or indirectly participate in or influence the management of our affairs.
Business Experience
The following is a brief description of the business experience and background of our current directors and executive officers. There are no family relationships among any of the directors or executive officers.
Frank C. Ingriselli, Executive Chairman of the Board, President and Chief Executive Officer
Mr. Ingriselli has served as our Executive Chairman of the Board, Chief Executive Officer and President since our acquisition of Pacific Energy Development in July 2012. Mr. Ingriselli has served as the President, Chief Executive Officer, and Director of Pacific Energy Development since its inception in February 2011. Mr. Ingriselli began his career at Texaco, Inc. in 1979 and held management positions in Texaco’s Producing-Eastern Hemisphere Department, Middle East/Far East Division, and Texaco’s International Exploration Company. While at Texaco, Mr. Ingriselli negotiated a successful foreign oil development investment contract in China in 1983. In 1992, Mr. Ingriselli was named President of Texaco International Operations Inc. and over the next several years directed Texaco’s global initiatives in exploration and development. In 1996, he was appointed President and CEO of the Timan Pechora Company, a Houston, Texas headquartered company owned by affiliates of Texaco, Exxon, Amoco and Norsk Hydro, which was developing an investment in Russia. In 1998, Mr. Ingriselli returned to Texaco’s Executive Department with responsibilities for Texaco’s power and natural gas operations, merger and acquisition activities, pipeline operations and corporate development. In August 2000, Mr. Ingriselli was appointed President of Texaco Technology Ventures, which was responsible for all of Texaco’s global technology initiatives and investments. In 2001, Mr. Ingriselli retired from Texaco after its merger with Chevron, and founded Global Venture Investments LLC, which we refer to as GVEST, an energy consulting firm, for which Mr. Ingriselli continues to serve as the President and Chief Executive Officer. We believe Mr. Ingriselli’s positions with GVEST require only an immaterial amount of Mr. Ingriselli’s time and do not conflict with his roles or responsibilities with our company. In 2005, Mr. Ingriselli co-founded CAMAC Energy Inc. (NYSE: CAK) (formerly Pacific Asia Petroleum, Inc.) an independent energy company headquartered in Houston, Texas, and served as its President, Chief Executive Officer and a member of its Board of Directors from 2005 to July 2010.
From 2000 to 2006, Mr. Ingriselli sat on the Board of the Electric Drive Transportation Association (where he was also Treasurer) and the Angelino Group, and was an officer of several subsidiaries of Energy Conversion Devices Inc., a U.S. public corporation engaged in the development and commercialization of environmental energy technologies. From 2001 to 2006, he was a Director and Officer of General Energy Technologies Inc., a “technology facilitator” to Chinese industry serving the need for advanced energy technology and the demand for low-cost high quality components, and Eletra Ltd, a Brazilian hybrid electric bus developer. Mr. Ingriselli currently sits on the Advisory Board of the Eurasia Foundation, a Washington D.C.-based non-profit that funds programs that build democratic and free market institutions in the new independent states of the former Soviet Union.
85
Mr. Ingriselli graduated from Boston University in 1975 with a Bachelor of Science degree in Business Administration. He also earned a Master of Business Administration degree from New York University in both Finance and International Finance in 1977 and a Juris Doctor degree from Fordham University School of Law in 1979.
Mr. Ingriselli brings to the board over 34 years’ experience in the energy industry. The board of directors believes that Mr. Ingriselli’s experience with our company’s acquired subsidiary Pacific Energy Development and the insights he has gained from these experiences will benefit our company’s future plans to evaluate and acquire additional oil producing properties and that they qualify him to serve as a director for our company.
Michael L. Peterson, Chief Financial Officer and Executive Vice President
Mr. Peterson has served as our Chief Financial Officer and Executive Vice President since our acquisition of Pacific Energy Development in July 2012. Mr. Peterson joined Pacific Energy Development as its Executive Vice President in September 2011, assumed the additional office of Chief Financial Officer in June 2012, and served as a member of our Board of Directors from July 2012 to September 2013. Mr. Peterson formerly served as Interim President and CEO (from June 2009 to December 2011) and as director (from May 2008 to December 2011) of Blast, as a director (from May 2006 to July 2012) of Aemetis, Inc. (formerly AE Biofuels Inc.), a Cupertino, California-based global advanced biofuels and renewable commodity chemicals company (AMTX), and as Chairman and Chief Executive Officer of Nevo Energy, Inc. (NEVE) (formerly Solargen Energy, Inc.), a Cupertino, California-based developer of utility-scale solar farms which he helped form in December 2008 (from December 2008 to July 2012). In addition, since February 2006, Mr. Peterson has served as founder and managing partner of California-based Pascal Management, a manager of hedge and private equity investments, which we believe requires only an immaterial amount of Mr. Peterson’s time and does not conflict with his roles or responsibilities with our company. From 2005 to 2006, Mr. Peterson co-founded and became a managing partner of American Institutional Partners, a venture investment fund based in Salt Lake City. From 2000 to 2004, he served as a First Vice President at Merrill Lynch, where he helped establish a new private client services division to work exclusively with high net worth investors. From September 1989 to January 2000, Mr. Peterson was employed by Goldman Sachs & Co. in a variety of positions and roles, including as a Vice President with the responsibility for a team of professionals that advised and managed over $7 billion in assets. Mr. Peterson speaks Mandarin Chinese.
Mr. Peterson received his MBA at the Marriott School of Management and a BS in statistics/computer science from Brigham Young University.
Jamie Tseng, Senior Vice President and Managing Director
Mr. Tseng has served as our Senior Vice President and Managing Director since our acquisition of Pacific Energy Development in July 2012. Mr. Tseng has served as Pacific Energy Development’s Senior Vice President, Managing Director and director, since its inception in February 2011, and as Chief Financial Officer from inception until June 2012, and served as a member of our Board of Directors from July 2012 to September 2013. In 2005, Mr. Tseng co-founded CAMAC Energy Inc. (NYSE: CAK) (formerly Pacific Asia Petroleum, Inc.), an independent energy company headquartered in Houston, Texas, and served as its Executive Vice President from 2005 through his retirement from that company in January 2010. From February 2000 to August 2005, Mr. Tseng served as Chief Financial Officer of General Energy Technologies Inc., a “technology facilitator” to Chinese industry serving the need for advanced energy technology and the demand for low cost high quality components. From 1998 to February 2000, Mr. Tseng served as Chief Financial Officer of Multa Communications Corporation, a California-based Internet service provider focusing on China. From 1980 until 1998, he held management positions with Collins Company, Hilton International, China Airlines and Tatung Company of America. Mr. Tseng is fluent in Chinese Mandarin. He has a BD degree in Accounting from Soochow University in Taiwan.
Clark R. Moore, Executive Vice President, General Counsel and Secretary
Mr. Moore has served as our Executive Vice President, General Counsel, and Secretary since our acquisition of Pacific Energy Development in July 2012 and has served as the Executive Vice President, General Counsel, and Secretary of Pacific Energy Development since its inception in February 2011. Mr. Moore began his career in 2000 as a corporate attorney at the law firm of Venture Law Group located in Menlo Park, California, which later merged into Heller Ehrman LLP in 2003. In 2004, Mr. Moore left Heller Ehrman LLP and launched a legal consulting practice focused on representation of private and public company clients in the energy and high-tech industries. In September 2006, Mr. Moore joined CAMAC Energy Inc. (NYSE: CAK) (formerly Pacific Asia Petroleum, Inc.), an independent energy company headquartered in Houston, Texas, as its acting General Counsel and continued to serve in that role through June 2011.
Mr. Moore received his J.D. with Distinction from Stanford Law School and his B.A. with Honors from the University of Washington.
86
Elizabeth P. Smith, Director
Ms. Smith joined our Board of Directors on September 10, 2013, immediately prior to the listing of our common stock on the NYSE MKT. Ms. Smith retired from Texaco Inc. as Vice President-Investor Relations and Shareholder Services in late 2001 following its merger with Chevron Corp. Ms. Smith was also the Corporate Compliance Officer for Texaco and was a member of the Board of The Texaco Foundation. Ms. Smith joined Texaco’s Legal Department in 1976. As an attorney in the Legal Department, Ms. Smith handled administrative law matters and litigation. She served as Chairman of the American Petroleum Institute’s Subcommittee on Department of Energy Law for the 1983-1985 term. Ms. Smith was appointed Director of Investor Relations for Texaco, Inc. in 1984, and was named Vice President of the Corporate Communications division in 1989. In 1992, Ms. Smith was elected a Vice President of Texaco Inc. and assumed additional responsibilities as head of that company’s Shareholder Services Group. In 1999, Ms. Smith was named Corporate Compliance Officer for Texaco. Ms. Smith served as a Director of Pacific Asia Petroleum, Inc. until its merger with CAMAC Energy, Inc. in April of 2010.
Ms. Smith was elected to the Board of Finance of Darien, Connecticut, in November 2007, and since November 2010, has been serving as the Chairman. In June of 2012, Ms. Smith was elected a Trustee of St. Luke’s School in New Canaan, Connecticut. From 2007 through 2010, Ms. Smith has also served as a Board Member of the Community Fund of Darien, Connecticut, and from 1996 through 2006, Ms. Smith served on the board of directors of INROADS/Fairfield Westchester Counties, Inc. From 2002 through 2005, Ms. Smith served as a member of the Board of Families With Children From China-Greater New York, and from 2004 through 2005 she served as a member of the Board of The Chinese Language School of Connecticut. While at Texaco, Ms. Smith was an active member in NIRI (National Investor Relations Institute) and the NIRI Senior Roundtable. She has been a member and past President of both the Investor Relations Association and the Petroleum Investor Relations Institute. Ms. Smith was a member of the Board of Trustees of Marymount College Tarrytown from 1993 until 2001. She was also a member of the Board of The Education and Learning Foundation of Westchester and Putnam Counties from 1993 to 2002.
Ms. Smith graduated from Bucknell University in 1971 with a Bachelor of Arts degree, cum laude, and received a Doctor of Jurisprudence degree from Georgetown University Law Center in 1976.
The Board of Directors believes that Ms. Smith’s over 30 years’ experience in corporate compliance, investor relations, and law in the energy industry working at a major U.S. oil and gas company, and the insights she has gained from these experiences, will provide crucial guidance for our company’s future operations and compliance efforts.
David C. Crikelair, Director
Mr. Crikelair joined our Board of Directors on September 10, 2013, immediately prior to the listing of our common stock on the NYSE MKT. Mr. Crikelair has more than 40 years of experience in the oil and gas industry, and has broad experience in the areas of corporate finance, banking, capital markets and financial reporting. Since 2001, Mr. Crikelair has been as co-owner and serves as a Managing Partner of FrontStreet Partners, LLC, a privately-held energy and real estate investment firm. Previously, Mr. Crikelair spent most of his career with Texaco Inc. and Affiliates, serving in various financial and operating positions, including: Vice President of Texaco Inc. (1991 - 1999), corporate Treasurer (1986 - 1991), and Head of the Alternate Energy Department (1991 - 1996), responsible for worldwide co-generation and power businesses, technology licensing, gasification business, ethanol manufacturing, intellectual property, and non-oil and gas natural resources. Mr. Crikelair also served as Chief Financial Officer of Equilon Enterprises, LLC (1998 - 1999), the major Houston based joint venture of the Shell Oil Company and Texaco Inc. focused on the refining, marketing, trading, transportation and lubricant businesses. Mr. Crikelair also served as a Director of Caltex Petroleum Corporation, the principal international refining and marketing joint venture company owned by Texaco Inc. and Chevron. He also served as Chief Financial Officer for a privately-held software company focused on collaborative supply chain activities.
Mr. Crikelair has served as a member of various not for profit community and governmental organizations and boards. He continues to be involved in a number of charitable organizations. Mr. Crikelair graduated from Franklin and Marshall College in 1969 with a Bachelor of Arts degree in Mathematics and received a Masters of Business Administration in Corporate Finance from the New York University Graduate School of Business Administration in 1971.
The Board of Directors believes that Mr. Crikelair’s over 40 years’ experience in corporate finance, banking, capital markets and financial reporting in the energy industry, and the insights he has gained from these experiences, will provide crucial guidance for our company’s future operations, capital raising efforts, and oversight of our financial reporting and internal controls.
Director Qualifications
The Board believes that each of our directors is highly qualified to serve as a member of the Board. Each of the directors has contributed to the mix of skills, core competencies and qualifications of the Board. When evaluating candidates for election to the Board, the Board seeks candidates with certain qualities that it believes are important, including integrity, an objective perspective, good judgment, and leadership skills. Our directors are highly educated and have diverse backgrounds and talents and extensive track records of success in what we believe are highly relevant positions.
87
Involvement in Certain Legal Proceedings
To the best of our knowledge, during the past ten years, none of our directors or executive officers were involved in any of the following:
(1) any bankruptcy petition filed by or against any business of which such person was a general partner or executive officer either at the time of the bankruptcy or within two years prior to that time; (2) any conviction in a criminal proceeding or being a named subject to a pending criminal proceeding (excluding traffic violations and other minor offenses); (3) being subject to any order, judgment, or decree, not subsequently reversed, suspended or vacated, of any court of competent jurisdiction, permanently or temporarily enjoining, barring, suspending or otherwise limiting his involvement in any type of business, securities or banking activities; (4) being found by a court of competent jurisdiction (in a civil action), the SEC or the Commodities Futures Trading Commission to have violated a federal or state securities or commodities law, (5) being the subject of, or a party to, any Federal or State judicial or administrative order, judgment, decree, or finding, not subsequently reversed, suspended or vacated, relating to an alleged violation of (i) any Federal or State securities or commodities law or regulation; (ii) any law or regulation respecting financial institutions or insurance companies including, but not limited to, a temporary or permanent injunction, order of disgorgement or restitution, civil money penalty or temporary or permanent cease-and-desist order, or removal or prohibition order; or (iii) any law or regulation prohibiting mail or wire fraud or fraud in connection with any business entity; or (6) being the subject of, or a party to, any sanction or order, not subsequently reversed, suspended or vacated, of any self-regulatory organization (as defined in Section 3(a)(26) of the Exchange Act), any registered entity (as defined in Section 1(a)(29) of the Commodity Exchange Act), or any equivalent exchange, association, entity or organization that has disciplinary authority over its members or persons associated with a member.
Board Leadership Structure
Our Board of Directors has the responsibility for selecting the appropriate leadership structure for the Company. In making leadership structure determinations, the Board of Directors considers many factors, including the specific needs of the business and what is in the best interests of the Company’s stockholders. Our current leadership structure is comprised of a combined Chairman of the Board and Chief Executive Officer (“CEO”), Mr. Ingriselli. The Board of Directors believes that this leadership structure is the most effective and efficient for the Company at this time. Mr. Ingriselli possesses detailed and in-depth knowledge of the issues, opportunities, and challenges facing the Company, and is thus best positioned to develop agendas that ensure that the Board of Directors’ time and attention are focused on the most critical matters. Combining the Chairman of the Board and CEO roles promotes decisive leadership, fosters clear accountability and enhances the Company’s ability to communicate its message and strategy clearly and consistently to our stockholders, particularly during periods of turbulent economic and industry conditions.
Risk Oversight
The Board exercises direct oversight of strategic risks to the Company. The Audit Committee reviews and assesses the Company’s processes to manage business and financial risk and financial reporting risk. It also reviews the Company’s policies for risk assessment and assesses steps management has taken to control significant risks. The Compensation Committee oversees risks relating to compensation programs and policies. In each case management periodically reports to our Board or relevant committee, which provides the relevant oversight on risk assessment and mitigation.
Director Independence
Our Board of Directors has determined that each of Ms. Smith and Mr. Crikelair is an independent director as defined in the NYSE MKT rules governing members of boards of directors or as defined under Rule 10A-3 of the Exchange Act. Accordingly, a majority of the members of our Board of Directors are independent as defined in the NYSE MKT rules governing members of boards of directors and as defined under Rule 10A-3 of the Exchange Act.
88
Committees of our Board of Directors
On September 5, 2013, and effective September 10, 2013, the Board of Directors adopted charters for the Nominating and Corporate Governance Committee, Compensation Committee and Audit Committee and appointed the following directors to such newly formed committees, all of which members are independent directors:
|
Director
|
Audit Committee
|
Compensation Committee
|
Nominating and Corporate Governance Committee
|
Independent
|
|
Frank C. Ingriselli
|
||||
|
David C. Crikelair
|
C
|
M
|
M
|
X
|
|
Elizabeth P. Smith
|
M
|
C
|
C
|
X
|
C - Chairman of Committee.
M – Member.
Each of these committees has the duties described below and operates under a charter that has been approved by our Board of Directors and is posted on our website. Our website address is http://www.pacificenergydevelopment.com.
Audit Committee
The audit committee selects, on behalf of our Board of Directors, an independent public accounting firm to audit our financial statements, discusses with the independent auditors their independence, reviews and discusses the audited financial statements with the independent auditors and management, and recommends to the Board of Directors whether the audited financials should be included in our Annual Reports to be filed with the SEC. Mr. Crikelair serves as Chair of the Audit Committee and our Board has determined that Mr. Crikelair is an “audit committee financial expert” as defined under Item 407(d)(5) of Regulation S-K of the Exchange Act.
During the year ended December 31, 2013, the audit committee, which was formed effective September 10, 2013, held one meeting.
Compensation Committee
The compensation committee reviews and approves (a) the annual salaries and other compensation of our executive officers, and (b) individual stock and stock option grants. The compensation committee also provides assistance and recommendations with respect to our compensation policies and practices and assists with the administration of our compensation plans. Ms. Smith serves as Chair of the compensation committee.
During the year ended December 31, 2013, the compensation committee, which was formed effective September 10, 2013, held one meeting.
Nominating and Corporate Governance Committee
The nominating and corporate governance committee assists our Board of Directors in fulfilling its responsibilities by: identifying and approving individuals qualified to serve as members of our Board of Directors, selecting director nominees for our annual meetings of shareholders, evaluating the performance of our Board of Directors, and developing and recommending to our Board of Directors corporate governance guidelines and oversight procedures with respect to corporate governance and ethical conduct. Ms. Smith serves as Chair of the nominating and corporate governance committee.
The nominating and governance committee of the Board considers nominees for director based upon a number of qualifications, including their personal and professional integrity, ability, judgment, and effectiveness in serving the long-term interests of the Company’s shareholders. There are no specific, minimum or absolute criteria for Board membership. The committee makes every effort to ensure that the Board and its committees include at least the required number of independent directors, as that term is defined by applicable standards promulgated by the NYSE MKT and/or the SEC.
The nominating and governance committee may use its network of contacts to compile a list of potential candidates. The nominating and governance committee has not in the past relied upon professional search firms to identify director nominees, but may engage such firms if so desired. The nominating and governance committee may meet to discuss and consider candidates’ qualifications and then choose a candidate by majority vote.
89
The nominating and governance committee will consider qualified director candidates recommended in good faith by shareholders, provided those nominees meet the requirements of NYSE MKT and applicable federal securities law. The nominating and governance committee’s evaluation of candidates recommended by shareholders does not differ materially from its evaluation of candidates recommended from other sources. Any shareholder wishing to recommend a nominee should submit the candidate’s name, credentials, contact information and his or her written consent to be considered as a candidate. These recommendations should be submitted in writing to the Company, Attn: Corporate Secretary, to the address appearing on the cover page of this Annual Report. The proposing shareholder should also include his or her contact information and a statement of his or her share ownership. The Committee may request further information about shareholder recommended nominees in order to comply with any applicable laws, rules or regulations or to the extent such information is required to be provided by such shareholder pursuant to any applicable laws, rules or regulations.
During the year ended December 31, 2013, the nominating and corporate governance committee, which was formed effective September 10, 2013, held no meetings.
Meetings of the Board of Directors and Annual Meeting
During the fiscal year that ended on December 31, 2013, the Board held one meeting and took various other actions via the unanimous written consent of the Board of Directors and the various committees described below. All directors attended all of the Board of Directors meetings and committee meetings relating to the committees on which each director served during fiscal year 2013. The Company did not hold an annual shareholders meeting in 2012 or 2013. Each director of the Company is expected to be present at annual meetings of shareholders, absent exigent circumstances that prevent their attendance. Where a director is unable to attend an annual meeting in person but is able to do so by electronic conferencing, the Company will arrange for the director’s participation by means where the director can hear, and be heard, by those present at the meeting.
Code of Ethics
In 2012, in accordance with SEC rules, our Board of Directors adopted a Code of Business Conduct and Ethics for our directors, officers and employees. Our Board of Directors believes that these individuals must set an exemplary standard of conduct. This code sets forth ethical standards to which these persons must adhere and other aspects of accounting, auditing and financial compliance, as applicable. The Code of Business Conduct and Ethics is available on our website at www.pacificenergydevelopment.com. Please note that the information contained on our website is not incorporated by reference in, or considered to be a part of, this Annual Report.
Shareholder Communications
Currently, we do not have a policy with regard to the consideration of any director candidates recommended by security holders. To date, no security holders have made any such recommendations. The Board of Directors will assess all candidates, whether submitted by management or shareholders, and make recommendations for election or appointment.
A shareholder who wishes to communicate with our Board of Directors may do so by directing a written request addressed to our President, at the address appearing on the first page of this Annual Report.
Section 16(a) Beneficial Ownership Reporting Compliance
Section 16(a) of the Exchange Act requires our executive officers and directors and persons who own more than 10% of a registered class of our equity securities to file with the SEC initial statements of beneficial ownership, reports of changes in ownership and annual reports concerning their ownership in our common stock and other equity securities, on Form 3, 4 and 5 respectively. Executive officers, directors and greater than 10% shareholders are required by the SEC regulations to furnish our company with copies of all Section 16(a) reports they file.
Based solely on our review of the copies of such reports received by us and on written representation by our officers and directors regarding their compliance with the applicable reporting requirements under Section 16(a) of the Exchange Act, we believe that with respect to the fiscal year ended December 31, 2013, our directors, executive officers and 10% stockholders complied with all Section 16(a) filing requirements, with the exception of Yao Hang Finance (Hong Kong) Limited, which acquired beneficial ownership of more than 10% of the Company’s issued and outstanding common stock effective August 12, 2013, and has not, to the Company’s knowledge, filed a Form 3 as required under Section 16 or a Schedule 13D or Schedule 13G with the U.S. Securities and Exchange Commission.
90
ITEM 11. EXECUTIVE COMPENSATION.
Current Executive Employment Agreements
Frank Ingriselli.
Pacific Energy Development, our wholly-owned subsidiary, has entered into an employment agreement, dated June 10, 2011, as amended January 11, 2013, with Frank Ingriselli, its Chairman, President and Chief Executive Officer, pursuant to which, effective June 15, 2011, Mr. Ingriselli has been employed by Pacific Energy Development, and since the Pacific Energy Development merger, our company, with a base annual salary of $200,000 ($370,000 commencing January 1, 2014), and a target annual cash bonus of between 20% and 40% of his base salary, awardable by the board of directors in its discretion. In addition, Mr. Ingriselli’s employment agreement includes, among other things, severance payment provisions that would require our company to make lump sum payments equal to 36 months’ salary and target bonus to Mr. Ingriselli in the event his employment is terminated due to his death or disability, terminated without “Cause” or if he voluntarily resigns for “Good Reason” (48 months in connection with a “Change of Control”), and continuation of benefits for up to 48 months, as such terms are defined in the employment agreement. The employment agreement also prohibits Mr. Ingriselli from engaging in competitive activities during and following termination of his employment that would result in disclosure of Company’s confidential information, but does not contain a general restriction on engaging in competitive activities.
For purposes of Mr. Ingriselli’s employment agreement, the term “Cause” shall mean his (1) conviction of, or plea of nolo contendere to, a felony or any other crime involving moral turpitude; (2) fraud on or misappropriation of any funds or property of our company or any of its affiliates, customers or vendors; (3) act of material dishonesty, willful misconduct, willful violation of any law, rule or regulation, or breach of fiduciary duty involving personal profit, in each case made in connection with his responsibilities as an employee, officer or director of our company and which has, or could reasonably be deemed to result in, a Material Adverse Effect upon our company; (4) illegal use or distribution of drugs; (5) material violation of any policy or code of conduct of our company; or (6) material breach of any provision of the employment agreement or any other employment, non-disclosure, non-competition, non-solicitation or other similar agreement executed by him for the benefit of our company or any of its affiliates, all as reasonably determined in good faith by the board of directors of our company. However, an event that is or would constitute “Cause” shall cease to be “Cause” if he reverses the action or cures the default that constitutes “Cause” within 10 days after our company notifies his in writing that Cause exists. No act or failure to act on Mr. Ingriselli’s part will be considered “willful” unless it is done, or omitted to be done, by him in bad faith or without reasonable belief that such action or omission was in the best interests of our company. Any act or failure to act that is based on authority given pursuant to a resolution duly passed by the board of directors, or the advice of counsel to our company, shall be conclusively presumed to be done, or omitted to be done, in good faith and in the best interests of our company.
For purposes of the employment agreement, “Material Adverse Effect” means any event, change or effect that is materially adverse to the condition (financial or otherwise), properties, assets, liabilities, business, operations or results of operations of our company or its subsidiaries, taken as a whole.
For purposes of Mr. Ingriselli’s employment agreement, “Good Reason” means the occurrence of any of the following without his written consent: (a) the assignment to him of duties substantially inconsistent with this employment agreement or a material adverse change in his titles or authority; (b) any failure by our company to comply with the compensation provisions of the agreement in any material way; (c) any material breach of the employment agreement by our company; or (d) the relocation of him by more than fifty (50) miles from the location of our company’s principal office located in Danville, California. However, an event that is or would constitute “Good Reason” shall cease to be “Good Reason” if: (i) he does not terminate employment within 45 days after the event occurs; (ii) before he terminates employment, our company reverses the action or cures the default that constitutes “Good Reason” within 10 days after he notifies us in writing that Good Reason exists; or (iii) he was a primary instigator of the “Good Reason” event and the circumstances make it inappropriate for him to receive “Good Reason” termination benefits under the employment agreement (e.g., he agrees temporarily to relinquish his position on the occurrence of a merger transaction he assists in negotiating).
For purposes of Mr. Ingriselli’s employment agreement, “Change of Control” means: (i) a merger, consolidation or sale of capital stock by existing holders of capital stock of our company that results in more than 50% of the combined voting power of the then outstanding capital stock of our company or its successor changing ownership; (ii) the sale, or exclusive license, of all or substantially all of our company’s assets; or (iii) the individuals constituting our company’s board of directors as of the date of the employment agreement (the “Incumbent Board”) cease for any reason to constitute at least 1/2 of the members of the board of directors; provided, however, that if the election, or nomination for election by our stockholders, of any new director was approved by a vote of the Incumbent Board, such new director shall be considered a member of the Incumbent Board. Notwithstanding the foregoing and for purposes of clarity, a transaction shall not constitute a Change in Control if: (w) its sole purpose is to change the state of our company’s incorporation; (x) its sole purpose is to create a holding company that will be owned in substantially the same proportions by the persons who held our company’s securities immediately before such transaction; or (y) it is a transaction effected primarily for the purpose of financing our company with cash (as determined by the board of directors in its discretion and without regard to whether such transaction is effectuated by a merger, equity financing or otherwise).
91
Michael L. Peterson.
On September 1, 2011, Pacific Energy Development, our wholly-owned subsidiary, entered into a Consulting Agreement engaging Michael L. Peterson to serve as Executive Vice President of Pacific Energy Development. This Consulting Agreement was superseded by an employment offer letter dated February 1, 2012, which employment offer letter was later amended and restated in full on June 16, 2012. Pursuant to Mr. Peterson’s current employment offer letter, Mr. Peterson serves as our company’s Chief Financial Officer and Executive Vice President at an annual base salary of $275,000 ($295,000 commencing January 1, 2014), and a target annual cash bonus of between 20% and 40% of his base salary, awardable by the board of directors in its discretion. Mr. Peterson previously served as a member of the board of directors and as the Interim President and Chief Executive Officer of Blast.
In addition, on January 11, 2013, Mr. Peterson’s employment offer letter was amended to revise the termination and severance provisions to parallel those of Mr. Clark Moore, our Executive Vice President, Secretary and General Counsel, as described below. Mr. Peterson’s employment offer letter amendment provides for, among other things, severance payment provisions that would require our company to make lump sum payments equal to 18 months’ salary and target bonus to Mr. Peterson in the event his employment is terminated due to his death or disability, terminated without “Cause” or if he voluntarily resigns for “Good Reason” (36 months in connection with a “Change of Control”), and continuation of benefits for up to 36 months (48 months in connection with a “Change of Control”), as such terms are defined in the employment offer letter amendment.
For purposes of Mr. Peterson’s employment offer letter amendment, the term “Cause” shall mean his (1) conviction of, or plea of nolo contendere to, a felony or any other crime involving moral turpitude; (2) fraud on or misappropriation of any funds or property of our company or any of its affiliates, customers or vendors; (3) act of material dishonesty, willful misconduct, willful violation of any law, rule or regulation, or breach of fiduciary duty involving personal profit, in each case made in connection with his responsibilities as an employee, officer or director of our company and which has, or could reasonably be deemed to result in, a Material Adverse Effect upon our company; (4) illegal use or distribution of drugs; (5) material violation of any policy or code of conduct of our company; or (6) material breach of any provision of the employment agreement or any other employment, non-disclosure, non-competition, non-solicitation or other similar agreement executed by him for the benefit of our company or any of its affiliates, all as reasonably determined in good faith by our board of directors. However, an event that is or would constitute “Cause” shall cease to be “Cause” if he reverses the action or cures the default that constitutes “Cause” within 10 days after our company notifies him in writing that Cause exists. No act or failure to act on Mr. Peterson’s part will be considered “willful” unless it is done, or omitted to be done, by him in bad faith or without reasonable belief that such action or omission was in the best interests of our company. Any act or failure to act that is based on authority given pursuant to a resolution duly passed by the board of directors, or the advice of counsel to our company, shall be conclusively presumed to be done, or omitted to be done, in good faith and in the best interests of our company.
For purposes of the employment offer letter amendment, “Material Adverse Effect” means any event, change or effect that is materially adverse to the condition (financial or otherwise), properties, assets, liabilities, business, operations or results of operations of our company or its subsidiaries, taken as a whole.
For purposes of Mr. Peterson’s employment offer letter amendment, “Good Reason” means the occurrence of any of the following without his written consent: (a) the assignment to him of duties substantially inconsistent with this employment agreement or a material adverse change in his titles or authority; (b) any failure by our company to comply with the compensation provisions of the agreement in any material way; (c) any material breach of the employment agreement by our company; or (d) the relocation of him by more than fifty (50) miles from the location of our company’s principal office located in Danville, California. However, an event that is or would constitute “Good Reason” shall cease to be “Good Reason” if: (i) he does not terminate employment within 45 days after the event occurs; (ii) before he terminates employment, our company reverses the action or cures the default that constitutes “Good Reason” within 10 days after he notifies our company in writing that Good Reason exists; or (iii) he was a primary instigator of the “Good Reason” event and the circumstances make it inappropriate for him to receive “Good Reason” termination benefits under the employment agreement (e.g., he agrees temporarily to relinquish his position on the occurrence of a merger transaction he assists in negotiating).
92
For purposes of Mr. Peterson’s employment offer letter amendment, “Change of Control” means: (i) a merger, consolidation or sale of capital stock by existing holders of our capital stock that results in more than 50% of the combined voting power of the then outstanding capital stock of our company or its successor changing ownership; (ii) the sale, or exclusive license, of all or substantially all of our company’s assets; or (iii) the individuals constituting our company’s board of directors as of the date of the employment agreement (the “Incumbent Board”) cease for any reason to constitute at least 1/2 of the members of the board of directors; provided, however, that if the election, or nomination for election by our company’s stockholders, of any new director was approved by a vote of the Incumbent Board, such new director shall be considered a member of the Incumbent Board. Notwithstanding the foregoing and for purposes of clarity, a transaction shall not constitute a Change in Control if: (w) its sole purpose is to change the state of our company’s incorporation; (x) its sole purpose is to create a holding company that will be owned in substantially the same proportions by the persons who held our company’s securities immediately before such transaction; or (y) it is a transaction effected primarily for the purpose of financing our company with cash (as determined by the board of directors in its discretion and without regard to whether such transaction is effectuated by a merger, equity financing or otherwise).
Jamie Tseng.
On January 6, 2012, Pacific Energy Development, our wholly-owned subsidiary, entered into an employment offer letter with Jamie Tseng, Senior Vice President, Director and Managing Director of our company, pursuant to which Mr. Tseng is paid an annual base salary of $120,000.
Clark Moore.
Pacific Energy Development, our wholly-owned subsidiary, has entered into an employment agreement, dated June 10, 2011, as amended January 11, 2013, with Clark Moore, its Executive Vice President, Secretary and General Counsel, pursuant to which, effective June 1, 2011, Mr. Moore has been employed by Pacific Energy Development, and since the Pacific Energy Development merger, our company, with a base annual salary of $150,000 ($270,000 commencing January 1, 2014), and a target annual cash bonus of between 20% and 40% of his base salary, awardable by the board of directors in its discretion. In addition, Mr. Moore’s employment agreement includes, among other things, severance payment provisions that would require our company to make lump sum payments equal to 18 months’ salary and target bonus to Mr. Moore in the event his employment is terminated due to his death or disability, terminated without “Cause” or if he voluntarily resigns for “Good Reason” (36 months in connection with a “Change of Control”), and continuation of benefits for up to 36 months (48 months in connection with a “Change of Control”), as such terms are defined in the employment agreement. The employment agreement also prohibits Mr. Moore from engaging in competitive activities during and following termination of his employment that would result in disclosure of our company’s confidential information, but does not contain a general restriction on engaging in competitive activities.
For purposes of Mr. Moore’s employment agreement, the term “Cause” shall mean his (1) conviction of, or plea of nolo contendere to, a felony or any other crime involving moral turpitude; (2) fraud on or misappropriation of any funds or property of our company or any of its affiliates, customers or vendors; (3) act of material dishonesty, willful misconduct, willful violation of any law, rule or regulation, or breach of fiduciary duty involving personal profit, in each case made in connection with his responsibilities as an employee, officer or director of our company and which has, or could reasonably be deemed to result in, a Material Adverse Effect upon our company; (4) illegal use or distribution of drugs; (5) material violation of any policy or code of conduct of our company; or (6) material breach of any provision of the employment agreement or any other employment, non-disclosure, non-competition, non-solicitation or other similar agreement executed by him for the benefit of our company or any of its affiliates, all as reasonably determined in good faith by our board of directors. However, an event that is or would constitute “Cause” shall cease to be “Cause” if he reverses the action or cures the default that constitutes “Cause” within 10 days after our company notifies his in writing that Cause exists. No act or failure to act on Mr. Moore’s part will be considered “willful” unless it is done, or omitted to be done, by him in bad faith or without reasonable belief that such action or omission was in the best interests of our company. Any act or failure to act that is based on authority given pursuant to a resolution duly passed by the board of directors, or the advice of counsel to our company, shall be conclusively presumed to be done, or omitted to be done, in good faith and in the best interests of our company.
For purposes of the employment agreement, “Material Adverse Effect” means any event, change or effect that is materially adverse to the condition (financial or otherwise), properties, assets, liabilities, business, operations or results of operations of our company or its subsidiaries, taken as a whole.
For purposes of Mr. Moore’s employment agreement, “Good Reason” means the occurrence of any of the following without his written consent: (a) the assignment to him of duties substantially inconsistent with this employment agreement or a material adverse change in his titles or authority; (b) any failure by our company to comply with the compensation provisions of the agreement in any material way; (c) any material breach of the employment agreement by our company; or (d) the relocation of him by more than fifty (50) miles from the location of our company’s principal office located in Danville, California. However, an event that is or would constitute “Good Reason” shall cease to be “Good Reason” if: (i) he does not terminate employment within 45 days after the event occurs; (ii) before he terminates employment, our company reverses the action or cures the default that constitutes “Good Reason” within 10 days after he notifies our company in writing that Good Reason exists; or (iii) he was a primary instigator of the “Good Reason” event and the circumstances make it inappropriate for him to receive “Good Reason” termination benefits under the employment agreement (e.g., he agrees temporarily to relinquish his position on the occurrence of a merger transaction he assists in negotiating).
93
For purposes of Mr. Moore’s employment agreement, “Change of Control” means: (i) a merger, consolidation or sale of capital stock by existing holders of our capital stock that results in more than 50% of the combined voting power of the then outstanding capital stock of our company or its successor changing ownership; (ii) the sale, or exclusive license, of all or substantially all of our company’s assets; or (iii) the individuals constituting our company’s board of directors as of the date of the employment agreement (the “Incumbent Board”) cease for any reason to constitute at least 1/2 of the members of the board of directors; provided, however, that if the election, or nomination for election by our company’s stockholders, of any new director was approved by a vote of the Incumbent Board, such new director shall be considered a member of the Incumbent Board. Notwithstanding the foregoing and for purposes of clarity, a transaction shall not constitute a Change in Control if: (w) its sole purpose is to change the state of our company’s incorporation; (x) its sole purpose is to create a holding company that will be owned in substantially the same proportions by the persons who held our company’s securities immediately before such transaction; or (y) it is a transaction effected primarily for the purpose of financing our company with cash (as determined by the board of directors in its discretion and without regard to whether such transaction is effectuated by a merger, equity financing or otherwise).
Equity Incentive Plans
2012 Plan
General.
On June 26, 2012, our board adopted the Blast Energy Services, Inc. 2012 Equity Incentive Plan, which we refer to as the 2012 Plan, which was approved by our shareholders on July 30, 2012. The 2012 Plan provides for awards of incentive stock options, non-statutory stock options, rights to acquire restricted stock, stock appreciation rights, or SARs, and performance units and performance shares. Subject to the provisions of the 2012 Plan relating to adjustments upon changes in our common stock, an aggregate of 2,000,000 shares of common stock have been reserved for issuance under the 2012 Plan.
Purpose.
Our board adopted the 2012 Plan to provide a means by which our employees, directors and consultants may be given an opportunity to benefit from increases in the value of our common stock, to assist in attracting and retaining the services of such persons, to bind the interests of eligible recipients more closely to our company’s interests by offering them opportunities to acquire shares of our common stock and to afford such persons stock-based compensation opportunities that are competitive with those afforded by similar businesses.
Administration.
Unless it delegates administration to a committee, our board administers the 2012 Plan. Subject to the provisions of the 2012 Plan, our board has the power to construe and interpret the 2012 Plan, and to determine: (a) the fair value of common stock subject to awards issued under the 2012 Plan; (b) the persons to whom and the dates on which awards will be granted; (c) what types or combinations of types of awards will be granted; (d) the number of shares of common stock to be subject to each award; (e) the time or times during the term of each award within which all or a portion of such award may be exercised; (f) the exercise price or purchase price of each award; and (g) the types of consideration permitted to exercise or purchase each award and other terms of the awards.
Eligibility.
Incentive stock options may be granted under the 2012 Plan only to employees of our company and its affiliates. Employees, directors and consultants of our company and its affiliates are eligible to receive all other types of awards under the 2012 Plan.
Terms of Options and SARs.
The exercise price of incentive stock options may not be less than the fair market value of the common stock subject to the option on the date of the grant and, in some cases, may not be less than 110% of such fair market value. The exercise price of nonstatutory options also may not be less than the fair market value of the common stock on the date of grant.
Options granted under the 2012 Plan may be exercisable in cumulative increments, or “vest,” as determined by our board. Our board has the power to accelerate the time as of which an option may vest or be exercised. The maximum term of options, SARs and performance shares and units under the 2012 Plan is ten years, except that in certain cases, the maximum term is five years. Options, SARs and performance shares and units awarded under the 2012 Plan generally will terminate three months after termination of the participant’s service, subject to certain exceptions.
A recipient may not transfer an incentive stock option otherwise than by will or by the laws of descent and distribution. During the lifetime of the recipient, only the recipient may exercise an option, SAR or performance share or unit. Our board may grant nonstatutory stock options, SARs and performance shares and units that are transferable to the extent provided in the applicable written agreement.
94
Terms of Restricted Stock Awards.
Our board may issue shares of restricted stock under the 2012 Plan as a grant or for such consideration, including services, and, subject to the Sarbanes-Oxley Act of 2002, promissory notes, as determined in its sole discretion.
Shares of restricted stock acquired under a restricted stock purchase or grant agreement may, but need not, be subject to forfeiture to us or other restrictions that will lapse in accordance with a vesting schedule to be determined by our board. In the event a recipient’s employment or service with our company terminates, any or all of the shares of common stock held by such recipient that have not vested as of the date of termination under the terms of the restricted stock agreement may be forfeited to our company in accordance with such restricted stock agreement.
Rights to acquire shares of common stock under the restricted stock purchase or grant agreement shall be transferable by the recipient only upon such terms and conditions as are set forth in the restricted stock agreement, as our board shall determine in its discretion, so long as shares of common stock awarded under the restricted stock agreement remain subject to the terms of such agreement.
Adjustment Provisions.
If any change is made to our outstanding shares of common stock without our receipt of consideration (whether through reorganization, stock dividend or stock split, or other specified change in the capital structure of our company, other than in connection with the reverse stock split discussed above in connection with the Pacific Energy Development merger), appropriate adjustments may be made in the class and maximum number of shares of common stock subject to the 2012 Plan and outstanding awards. In that event, the 2012 Plan will be appropriately adjusted in the class and maximum number of shares of common stock subject to the 2012 Plan, and outstanding awards may be adjusted in the class, number of shares and price per share of common stock subject to such awards.
Effect of Certain Corporate Events.
In the event of (a) a liquidation or dissolution of our company; (b) a merger or consolidation of our company with or into another corporation or entity (other than a merger with a wholly-owned subsidiary); (c) a sale of all or substantially all of the assets of our company; or (d) a purchase or other acquisition of more than 50% of the outstanding stock of our company by one person or by more than one person acting in concert, any surviving or acquiring corporation may assume awards outstanding under the 2012 Plan or may substitute similar awards. Unless the stock award agreement otherwise provides, in the event any surviving or acquiring corporation does not assume such awards or substitute similar awards, then the awards will terminate if not exercised at or prior to such event.
Duration, Amendment and Termination.
Our board may suspend or terminate the 2012 Plan without stockholder approval or ratification at any time or from time to time. Unless sooner terminated, the 2012 Plan will terminate ten years from the date of its adoption by our board, i.e., in March 2022.
Our board may also amend the 2012 Plan at any time, and from time to time. However, except as relates to adjustments upon changes in common stock, no amendment will be effective unless approved by our stockholders to the extent stockholder approval is necessary to preserve incentive stock option treatment for federal income tax purposes. Our board may submit any other amendment to the 2012 Plan for stockholder approval if it concludes that stockholder approval is otherwise advisable.
As of the date of this Annual Report, options to purchase 184,500 shares of restricted stock and 1,270,752 shares of restricted stock have been issued under the 2012 Plan, with 544,748 shares of common stock remaining available for issuance under the 2012 Plan.
2012 Pacific Energy Development (Pre-Merger) Plan
On February 9, 2012, prior to the Pacific Energy Development merger, Pacific Energy Development adopted the Pacific Energy Development 2012 Equity Incentive Plan, which we refer to as the 2012 Pre-Merger Plan. We assumed the obligations of the 2012 Pre-Merger Plan pursuant to the Pacific Energy Development merger, though the 2012 Pre-Merger Plan has been superseded by the 2012 Plan.
The 2012 Pre-Merger Plan provides for awards of incentive stock options, non-statutory stock options, rights to acquire restricted stock, stock appreciation rights, or SARs, and performance units and performance shares. Subject to the provisions of the 2012 Pre-Merger Plan relating to adjustments upon changes in our common stock, an aggregate of 1,000,000 shares of common stock have been reserved for issuance under the 2012 Pre-Merger Plan.
The board of Pacific Energy Development adopted the 2012 Pre-Merger Plan to provide a means by which its employees, directors and consultants may be given an opportunity to benefit from increases in the value of its common stock, to assist in attracting and retaining the services of such persons, to bind the interests of eligible recipients more closely to our company’s interests by offering them opportunities to acquire shares of our common stock and to afford such persons stock-based compensation opportunities that are competitive with those afforded by similar businesses.
95
The exercise price of incentive stock options may not be less than the fair market value of the common stock subject to the option on the date of the grant and, in some cases, may not be less than 110% of such fair market value. The exercise price of nonstatutory options also may not be less than the fair market value of the common stock on the date of grant. Options granted under the 2012 Pre-Merger Plan may be exercisable in cumulative increments, or “vest,” as determined by the board of Pacific Energy Development at the time of grant.
Shares of restricted stock could be issued under the 2012 Pre-Merger Plan as a grant or for such consideration, including services, and, subject to the Sarbanes-Oxley Act of 2002, promissory notes, as determined in the sole discretion of the Pacific Energy Development board. Shares of restricted stock acquired under a restricted stock purchase or grant agreement could, but need not, be subject to forfeiture or other restrictions that will lapse in accordance with a vesting schedule determined by the board of Pacific Energy Development at the time of grant. In the event a recipient’s employment or service with our company terminates, any or all of the shares of common stock held by such recipient that have not vested as of the date of termination under the terms of the restricted stock agreement may be forfeited to our company in accordance with such restricted stock agreement.
Appropriate adjustments may be made to outstanding awards in the event of changes in our outstanding shares of common stock, whether through reorganization, stock dividend or stock split, or other specified change in capital structure of our company. In the event of liquidation, merger or consolidation, sale of all or substantially all of the assets of our company, or other change in control, any surviving or acquiring corporation may assume awards outstanding under the 2012 Pre-Merger Plan or may substitute similar awards. Unless the stock award agreement otherwise provides, in the event any surviving or acquiring corporation does not assume such awards or substitute similar awards, then the awards will terminate if not exercised at or prior to such event.
As of the date of this Annual Report, 343,471 options and
551,670 shares of restricted stock remain outstanding under the 2012 Pre-Merger Plan. These options have a weighted average exercise price of $0.47 per share, and have expiration dates ranging from February 8, 2022 to June 18, 2022.
2009 Stock Incentive Plan
Effective July 30, 2012, our 2009 Stock Incentive Plan, which we refer to as the 2009 Plan was replaced by the 2012 Plan. The 2009 Plan was intended to secure for us the benefits arising from ownership of our common stock by the employees, officers, directors and consultants of our company. The 2009 Plan was designed to help attract and retain for our company and its affiliates personnel of superior ability for positions of exceptional responsibility, to reward employees, officers, directors and consultants for their services and to motivate such individuals through added incentives to further contribute to the success of our company and its affiliates.
Pursuant to the 2009 Plan, our board of directors (or a committee thereof) had the ability to award grants of incentive or non-qualified options, restricted stock awards, performance shares and other securities as described in greater detail in the 2009 Plan to our employees, officers, directors and consultants. The number of securities issuable pursuant to the 2009 Plan was initially 14,881, provided that the number of shares available for issuance under the 2009 Plan would be increased on the first day of each fiscal year beginning with our 2011 fiscal year, in an amount equal to the greater of (a) 5,953 shares; or (b) three percent (3%) of the number of issued and outstanding shares of our company on the first day of such fiscal year. The 2009 Plan was to expire in April 2019. As of the date of this prospectus 4,762 options remain outstanding under the 2009 Plan. These options have a weighted average exercise price of $47.69 per share, and have an expiration date of February 2, 2021.
As of the date of this Annual Report, 3,424 options remain outstanding under the 2009 Plan. These options have a weighted average exercise price of $35.07 per share, and have an expiration date ranging from May 28, 2018 to February 2, 2021.
2003 Stock Option Plan
Effective April 1, 2009, our 2003 Stock Option Plan was replaced by the 2009 Plan. The number of securities originally grantable pursuant to the 2003 Stock Option Plan were 23,810. Any options granted pursuant to the 2003 Stock Option Plan remain in effect until they otherwise expire or are terminated according to their terms. As of the date of this Annual Report, no options remain outstanding under the 2003 Plan.
96
Compensation of Executive Officers
The following table sets forth the compensation for services paid in all capacities for the two fiscal years ended December 31, 2013 and 2012 to (a) Frank C. Ingriselli, who was appointed President and Chief Executive Officer effective July 2012 upon the closing of the Pacific Energy Development merger, and who was serving in these positions at fiscal year-end 2012 and 2013, (b) Roger P. (Pat) Herbert, who was serving as Interim President and Chief Executive Officer until the July 2012 effectiveness of the Pacific Energy Development merger, (c) Michael L. Peterson and Clark R. Moore, who were the two most highly compensated executive officers at fiscal year-end 2012 and 2013, and (d) Jamie Tseng, who was appointed Senior Vice President and Managing Director effective July 2012 upon the closing of the Pacific Energy Development merger, and who was serving in these positions at fiscal year-ended 2012 and 2013, and received compensation in excess of $100,000 in 2013. There were no other executive officers who received compensation in excess of $100,000 in either 2012 or 2013.
Summary Compensation Table
|
Name and Principal Position
|
Fiscal Year Ended December 31
|
Salary
($)
|
Bonus
($)
|
Option Awards ($)
(1)
|
Stock
Awards
($)
|
All Other
Compensation
($)
|
Total
($)
|
|||||||
|
Frank C. Ingriselli
|
2013
|
350,000
|
140,000
|
-
|
1,687,500
|
(2)
|
-
|
2,177,500
|
||||||
|
Chief Executive Officer, President and Chairman of the Board
|
2012
|
145,833
|
140,000
|
(3)
|
-
|
-
|
-
|
285,833
|
||||||
|
Michael L. Peterson
|
||||||||||||||
|
Chief Financial Officer and Executive Vice President
|
2013
|
275,000
|
140,000
|
-
|
1,218,750
|
(4)
|
-
|
1,633,750
|
||||||
|
Former Interim CEO and President, former Director
|
2012
|
112,500
|
110,000
|
(5)
|
-
|
|
-
|
-
|
222,500
|
|||||
|
Clark R. Moore
|
2013
|
250,000
|
140,000
|
-
|
1,087,500
|
(6)
|
-
|
1,477,500
|
||||||
|
Executive Vice President, General Counsel and Secretary
|
2012
|
104,167
|
100,000
|
(7)
|
-
|
|
-
|
-
|
204,167
|
|||||
|
Jamie Tseng
|
2013
|
120,000
|
-
|
-
|
112,500
|
(9)
|
-
|
232,500
|
||||||
|
Senior Vice President and Managing Director
|
2012
|
50,000
|
12,000
|
(8)
|
-
|
-
|
-
|
|
62,000
|
|||||
|
Roger P. (Pat) Herbert
(10)
|
2013
|
-
|
-
|
-
|
-
|
-
|
-
|
|||||||
|
Former Interim President and CEO
|
2012
|
-
|
-
|
-
|
-
|
30,000
|
(11)
|
30,000
|
Does not include perquisites and other personal benefits or property, unless the aggregate amount of such compensation is more than $10,000.
No executive officer earned any non-equity incentive plan compensation or nonqualified deferred compensation during the periods reported above.
|
(1)
|
Amounts in this column represent the aggregate grant date fair value of awards computed in accordance with Financial Accounting Standards Board Accounting Standard Codification Topic 718. For additional information on the valuation assumptions with respect to the option grants, refer to Note 15 of our financial statements for the year ended December 31, 2013. These amounts do not correspond to the actual value that will be recognized by the named individuals from these awards.
|
|
(2)
|
Consists of the value of 450,000 shares of restricted common stock granted in August 2013 at $3.75 per share.
|
97
|
(3)
|
Reflects a bonus of $140,000 granted for services rendered post-merger from August, 2012 through December 31, 2012.
|
|
(4)
|
Consists of the value of 325,000 shares of restricted common stock granted in August 2013 at $3.75 per share.
|
|
(5)
|
Reflects a bonus of $110,000 granted for services rendered post-merger from August, 2012 through December 31, 2012.
|
|
(6)
|
Consists of the value of 290,000 shares of restricted common stock granted in August 2013 at $3.75 per share.
|
|
(7)
|
Reflects a bonus of $100,000 granted for services rendered post-merger from August, 2012 through December 31, 2012.
|
|
(8)
|
Reflects a bonus of $12,000 granted for services rendered post-merger from August, 2012 through December 31, 2012.
|
|
(9)
|
Consists of 30,000 shares of restricted common stock granted in August 2013 at $3.75 per share.
|
|
(10)
|
Mr. Herbert was appointed as Interim President and Chief Executive Officer of Blast Energy Services on December 22, 2011 and resigned on July 27, 2012.
|
|
(11)
|
Reflects board fees incurred from January through July 2012, pre-merger, and paid in common stock of the Company in 2012.
|
98
Outstanding Equity Awards at Year Ended December 31, 2013
The following table sets forth information as of December 31, 2013 concerning outstanding equity awards for the executive officers named in the Summary Compensation Table. All outstanding option and stock awards were proportionally adjusted in light of the April 2013 reverse stock split.
|
Outstanding Equity Awards at Fiscal Year-End
|
||||||||||||||||||
|
Option Awards
|
Stock Awards
|
|||||||||||||||||
|
Name
|
Number of
securities
underlying
unexercised
options (#)
exercisable
|
Number
of securities
underlying
unexercised
options (#)
unexercisable
|
Option Exercise
price
($)
|
Option expiration
date
|
Number of shares or units of stock that have not vested (#)
|
Market value of shares or units of stock that have not vested ($)
|
||||||||||||
|
Frank C. Ingriselli
|
313,440
|
34,827 (1)
|
$ |
0.51
|
6/18/2022
|
16,667 (2)
|
$ |
35,834
|
||||||||||
|
38,280
|
4,253 (1)
|
$ |
0.51
|
6/18/2022
|
450,000 (3)
|
$ |
967,500
|
|||||||||||
|
Michael L. Peterson
|
446
|
-
|
$ |
67.20
|
5/28/2018
|
25,000 (2)
|
$ |
53,750
|
||||||||||
|
2,976
|
-
|
$ |
30.24
|
2/2/2021
|
325,000 (3)
|
$ |
698,750
|
|||||||||||
|
100,000
|
-
|
$ |
0.24
|
10/7/2021
|
||||||||||||||
|
242,580
|
26,953 (1)
|
$ |
0.51
|
6/18/2022
|
||||||||||||||
|
57,420
|
6,380 (1)
|
$ |
0.51
|
6/18/2022
|
||||||||||||||
|
Clark Moore
|
169,980
|
18,887 (1)
|
$ |
0.51
|
6/18/2022
|
8,334 (2)
|
$ |
17,918
|
||||||||||
|
40,020
|
4,447 (1)
|
$ |
0.51
|
6/18/2022
|
290,000 (3)
|
$ |
623,500
|
|||||||||||
|
Jamie Tseng
|
30,000
|
3,333 (2)
|
$ |
0.30
|
2/8/2022
|
30,000 (3)
|
$ |
64,500
|
||||||||||
|
(1)
|
Vesting with respect to 100% of these options on June 18, 2014, subject to the holder remaining an employee of or consultant to the Company on such vesting date.
|
|
(2)
|
Fully vested on February 9, 2014.
|
|
(3)
|
Vesting with respect to 40% of these options on February 9, 2014, 15% on February 9, 2015, 15% on August 9, 2015, 15% on February 9, 2016 and 15% on August 9, 2016, subject to the holder remaining an employee of or consultant to the Company on such vesting date.
|
99
Compensation of Directors
The following table sets forth compensation information with respect to our non-executive directors during our fiscal year ended December 31, 2013.
|
Name (1)
|
Fees Earned or
Paid in Cash
($)*
|
Stock
Awards ($) (3)
|
All Other
Compensation
($)
|
Total ($)
|
||||||||||||
|
David C. Crikelair (2)
|
$ | 5,000 | $ | 60,003 | $ | - | $ | 65,003 | ||||||||
|
Elizabeth P. Smith (2)
|
$ | 5,000 | $ | 60,003 | $ | - | $ | 65,003 | ||||||||
* The table above does not include the amount of any expense reimbursements paid to the above directors. No directors received any Non-Equity Incentive Plan Compensation or Nonqualified Deferred Compensation Earnings during the period presented. Includes quarterly cash compensation earned, but not yet paid, in the amount of $5,000. Does not include perquisites and other personal benefits, or property, unless the aggregate amount of such compensation is more than $10,000.
(1) Neither Mr. Frank C. Ingriselli, who served as director throughout the year ended December 31, 2013, nor Michael L. Peterson or Mr. Jamie Tseng, who each served as directors of the Company from July 2012 to September 10, 2013, received any separate consideration for their services on the Board of Directors other than the consideration they were paid as executive officers of the Company as described in the Summary Compensation Table above.
(2) Appointed as a director on September 10, 2013.
(3) Amounts in this column represent the aggregate grant date fair value of awards computed in accordance with Financial Accounting Standards Board Accounting Standard Codification Topic 718. For additional information on the valuation assumptions with respect to the restricted stock grants, refer to Note 15 of our financial statements for the year ended December 31, 2013. These amounts do not correspond to the actual value that will be recognized by the named individuals from these awards. The director received a grant of 13,334 shares of restricted stock on September 10, 2013, which vests in full on September 10, 2014.
Our board has adopted a compensation program that, effective for periods after 2012, provides each of our “independent” directors as defined in NYSE MKT rules or under Rule 10A-3 of the Exchange Act with compensation consisting of (a) a quarterly cash payment of $5,000, and (b) an annual equity award consisting of shares of restricted stock valued at $60,000, vesting on the date that is one year following the date of grant.
100
ITEM 12. SECURITY OWNERSHIP OF CERTAIN BENEFICIAL OWNERS AND MANAGEMENT AND RELATED STOCKHOLDER MATTERS.
The following table sets forth, as of the date of this Annual Report, the number and percentage of outstanding shares of our common stock beneficially owned by: (a) each person who is known by us to be the beneficial owner of more than 5% of our outstanding shares of common stock; (b) each of our directors; (c) the Named Executive Officers; and (d) all current directors and executive officers, as a group. As of March 28, 2014 there were 26,539,013 shares of common stock issued and outstanding.
Beneficial ownership has been determined in accordance with Rule 13d-3 under the Exchange Act. Under this rule, certain shares may be deemed to be beneficially owned by more than one person (if, for example, persons share the power to vote or the power to dispose of the shares). In addition, shares are deemed to be beneficially owned by a person if the person has the right to acquire shares (for example, upon exercise of an option or warrant) within 60 days of the date as of which the information is provided. In computing the percentage ownership of any person, the amount of shares is deemed to include the amount of shares beneficially owned by such person by reason of such acquisition rights. As a result, the percentage of outstanding shares of any person as shown in the following table does not necessarily reflect the person’s actual voting power at any particular date.
To our knowledge, except as indicated in the footnotes to this table and pursuant to applicable community property laws, the persons named in the table have sole voting and investment power with respect to all shares of common stock shown as beneficially owned by them.
|
Common Stock
|
||||||||
|
Name and Address of Beneficial Owner
|
Number of
Shares Beneficially
Owned
|
Percentage of
Shares Beneficially Owned(1)
|
||||||
|
Current Executive Officers and Directors
|
||||||||
|
Frank C. Ingriselli
|
1,914,637
|
(2)
|
7.1
|
%
|
||||
|
Michael L. Peterson
|
1,037,900
|
(3)
|
3.9
|
%
|
||||
|
Clark R. Moore
|
1,035,928
|
(4)
|
3.9
|
%
|
||||
|
Jamie Tseng
|
730,001
|
(5)
|
2.7
|
%
|
||||
|
Elizabeth P. Smith
|
80,001
|
(6)
|
*
|
|||||
|
David C. Crikelair
|
13,334
|
(7)
|
*
|
|||||
|
All Executive Officers and Directors as a Group (six persons)
|
4,811,801
|
17.4
|
%
|
|||||
|
Greater than 5% Stockholders
|
||||||||
|
Yao Hang Finance (Hong Kong) Limited (8)
|
4,333,336
|
(9)
|
15.7
|
%
|
||||
|
MIE Holdings Corporation (10)
|
1,666,668
|
(11)
|
6.2
|
%
|
||||
* Less than 1%.
_____________________________
Unless otherwise stated, the address of each shareholder is c/o PEDEVCO Corp., 4125 Blackhawk Plaza Circle, Suite 201, Danville, CA 94506
|
(1)
|
Ownership voting percentages are based on 26,539,013 total shares of common stock which were outstanding as of March 28, 2014. Beneficial ownership is determined in accordance with the rules of the SEC and includes voting and/or investing power with respect to securities. We believe that, except as otherwise noted and subject to applicable community property laws, each person named in the following table has sole investment and voting power with respect to the securities shown as beneficially owned by such person. Additionally, shares of common stock subject to options, warrants or other convertible securities that are currently exercisable or convertible, or exercisable or convertible within 60 days of the applicable date below, are deemed to be outstanding and to be beneficially owned by the person or group holding such options, warrants or other convertible securities for the purpose of computing the percentage ownership of such person or group, but are not treated as outstanding for the purpose of computing the percentage ownership of any other person or group.
|
101
|
(2)
|
Includes: (a) 1,059,691 fully-vested shares of common stock held by Mr. Ingriselli; (b) 450,000 shares of common stock held by Mr. Ingriselli which vest with respect to 40% of the shares of February 9, 2014, 15% of the shares on February 9, 2015, 15% of the shares on August 9, 2015, 15% of the shares on February 9, 2016 and 15% of the shares on August 9, 2016; (c) options to purchase 347,468 shares of common stock exercisable by Mr. Ingriselli as of December 18, 2013 at an exercise price of $0.51 per share; (d) warrants exercisable for 334 shares of common stock at $2.25 per share (originally issued as warrants exercisable for 334 shares of Series A preferred stock, now exercisable for 334 shares of common stock as a result of the January 27, 2013 automatic conversion of the Company’s Series A preferred stock), which expire October 31, 2014; (e) warrants exercisable for 38,096 shares of common stock at $2.34 per share held by Global Venture Investments LLC, a limited liability company owned and controlled by Mr. Ingriselli (“GVEST”), which expire December 16, 2017; and (f) warrants exercisable for 19,048 shares of common stock at $5.25 per share held by GVEST which expire March 22, 2017. Mr. Ingriselli has voting control over his unvested shares of common stock.
|
|
(3)
|
Consisting of the following: (a) 26,668 fully-vested shares of common stock held by Mr. Peterson’s minor children; (b) 347,807 fully-vested shares of common stock (including shares held by a family trust which Mr. Peterson is deemed to beneficially own); (c) 260,000 shares of common stock held by Mr. Peterson which vest with respect to 40% of the shares of February 9, 2014, 15% of the shares on February 9, 2015, 15% of the shares on August 9, 2015, 15% of the shares on February 9, 2016 and 15% of the shares on August 9, 2016; (d) options to purchase 100,000 shares of common stock exercisable by Mr. Peterson as of January 1, 2013 at an exercise price of $0.24 per share; (e) options to purchase 300,001 shares of common stock exercisable by Mr. Peterson as of December 18, 2013 at an exercise price of $0.51 per share; and (f) 3,424 shares of common stock underlying currently exercisable options, of which options to purchase 2,977 shares are exercisable at $30.24 per share and options to purchase 447 shares are exercisable at $67.20 per share. Mr. Peterson has voting control over his unvested shares of common stock.
|
|
(4)
|
Includes: (a) 557,734 fully-vested shares of common stock; (b) 16,667 fully-vested shares of common stock held by each of Mr. Moore’s two minor children, which he is deemed to beneficially own; (c) 232,000 shares of common stock held by Mr. Moore which vest with respect to 40% of the shares of February 9, 2014, 15% of the shares on February 9, 2015, 15% of the shares on August 9, 2015, 15% of the shares on February 9, 2016 and 15% of the shares on August 9, 2016; (d) options to purchase 210,001 shares of common stock exercisable by Mr. Moore as of December 18, 2013 at an exercise price of $0.51 per share; (e) warrants exercisable for 1,906 shares of common stock at $2.34 per share held by Mr. Moore which expire December 16, 2017; and (f) warrants exercisable for 953 shares of common stock at $5.25 per share held by Mr. Moore which expire March 22, 2017. Mr. Ingriselli has voting control over his unvested shares of common stock.
|
|
(5)
|
Includes: (a) 666,667 fully-vested shares of common stock held by Mr. Tseng; (b) 30,000 shares of common stock held by Mr. Tseng which vest with respect to 40% of the shares of February 9, 2014, 15% of the shares on February 9, 2015, 15% of the shares on August 9, 2015, 15% of the shares on February 9, 2016 and 15% of the shares on August 9, 2016; and (c) fully-vested options to purchase 33,334 shares of common stock at an exercise price of $0.30 per share.
|
|
(6)
|
Includes (i) 66,667 shares of common stock held by Ms. Smith (issued upon the January 27, 2013 automatic conversion of 66,667 shares of Series A preferred stock held by Ms. Smith), and (ii) 13,334 shares of restricted stock held by Ms. Smith which vest in full on September 10, 2014.
|
|
(7)
|
Represents 13,334 shares of restricted stock held by Mr. Crikelair which vest in full on September 10, 2014.
|
|
(8)
|
Address: Room 5, 27/F, Richmond Comm. Bldg., 109 Argyle Street, Mongkok, Kowloon Hong Kong.
|
|
(9)
|
Representing (i) 3,333,334 shares of common stock, (ii) warrants to purchase 333,334 shares of common stock with an exercise price of $3.75 per share which expire August 12, 2016, (iii) warrants to purchase 333,334 shares of common stock with an exercise price of $4.50 per share which expire August 12, 2016, and (iv) warrants to purchase 333,334 shares of common stock with an exercise price of $5.25 per share which expire August 12, 2016.
|
102
|
(10)
|
Address: c/o MIE Holdings Corporation, Suite 1501, Block C, Grand Palace, 5 Huizhong Road, Chaoyong District, Beijing, China 100101. To the best of our knowledge, the beneficial owners of MIE Holdings Corporation are Zhang Ruilin, its Executive Director, Chairman and Chief Executive Officer, and Zhao Jiangwei, its Executive Director, Vice Chairman and Senior Vice President.
|
|
(11)
|
Representing 1,333,334 shares of common stock (issued upon the January 27, 2013 automatic conversion of 1,333,334 shares of Series A preferred stock held by MIE Holdings Corporation), warrants to purchase 166,667 shares of common stock with an exercise price of $3.75 per share which expire May 23, 2014, and warrants to purchase 166,667 shares of common stock with an exercise price of $4.50 per share which expire May 23, 2014.
|
ITEM 13. CERTAIN RELATIONSHIPS AND RELATED TRANSACTIONS, AND DIRECTOR INDEPENDENCE.
The following transactions include transactions that were engaged in by Pacific Energy Development and persons that may be deemed “related persons” to Pacific Energy Development pursuant to applicable rules under the Exchange Act, prior to our acquisition of Pacific Energy Development in July 2012, and by PEDEVCO Corp. and persons that may be deemed “related persons” to PEDEVCO Corp. pursuant to applicable rules under the Exchange Act following the acquisition of Pacific Energy Development in July 2012.
Transactions with Directors and Officers
From its inception, Frank Ingriselli has been the Chief Executive Officer, President, and a Director of Pacific Energy Development. Starting in September 2011, Mr. Peterson has been the Chief Financial Officer and Executive Vice President of Pacific Energy Development. From its inception, Jamie Tseng has been the Senior Vice President, a Director and Managing Director, of Pacific Energy Development, and its Chief Financial Officer from inception until September 2011. Since its inception, Clark Moore has been the Executive Vice President, General Counsel and Secretary of Pacific Energy Development. Each of the foregoing individuals also was beneficial owner of more than 5% of the shares of common stock of Pacific Energy Development.
Upon our acquisition of Pacific Energy Development, the foregoing individuals became officers and directors of our company, with the same positions set forth above, and in each case became beneficial owners of more than 5% of our shares of common stock. Prior to our acquisition of Pacific Energy Development, Mr. Peterson formerly served as Interim President and Chief Executive Officer (from June 2009 to December 2011) and as director (from May 2008 to December 2011) of Blast, as discussed in greater details above.
Founders
Since the founding of Pacific Energy Development, an aggregate of 4,840,000 fully-vested shares of common stock have been directly and indirectly purchased by various parties as founder’s shares for nominal value, including to members of our management team, as follows: 2,533,334 shares to Frank C. Ingriselli (including the shares issued to GVEST, as described below); 666,667 shares to Jamie Tseng; and 633,334 shares to Clark R. Moore.
Global Venture Investments LLC, which we refer to as GVEST, an entity wholly-owned and controlled by Mr. Ingriselli, and Pacific Energy Development entered into a Subscription Agreement, dated April 30, 2011, pursuant to which GVEST contributed a 6% joint venture interest in Rare Earth Ovonic Metal Hydride JV Co. Ltd. Joint Venture, a Chinese rare earth metal manufacturing and production company, to Pacific Energy Development in exchange for 1,366,668 fully-vested shares of common stock. GVEST has subsequently transferred all of these shares into the name of Frank C. Ingriselli, our President and Chief Executive Officer.
Share Grants to Management
The majority of the shares of Pacific Energy Development held by Messrs. Ingriselli, Tseng and Moore were acquired through the direct purchase of such shares from Pacific Energy Development at a price of approximately $0.003 per share, and are fully-vested. A total of 116,667 of the shares of Pacific Energy Development held by Mr. Peterson were subject to forfeiture in the event Mr. Peterson was no longer an employee, officer, director or consultant to Pacific Energy Development, which risk of forfeiture lapsed with respect to 50% of the shares on December 1, 2012, and 50% of the shares on June 1, 2013. An additional 116,667 of the shares of Pacific Energy Development held by Mr. Peterson were similarly subject to restrictions that lapsed on June 1, 2012. In addition, 250,000, 166,667, and 83,334 of the shares of Pacific Energy Development held by Messrs. Peterson, Ingriselli and Moore, respectively, were acquired through a grant of such shares as restricted stock by Pacific Energy Development, and are or were subject to forfeiture in the event the holder is or was no longer an employee, officer, director or consultant to Pacific Energy Development, which risk of forfeiture lapsed with respect to 50% of the shares on August 9, 2012, and the risk of forfeiture lapsed with respect to 20% of the shares on February 9, 2013, 20% of the shares on August 9, 2013, and the balance of 10% of the shares lapsed on February 9, 2014.
103
Loans from Directors and Officers
On March 22, 2013, we closed a private placement of secured promissory notes (the “Bridge Notes”) for an aggregate principal amount of $4.0 million, together with warrants exercisable for a total of up to 76,198 shares of our common stock at an exercise price of $5.25 per share (the “Bridge Warrants,” and, together with the Bridge Notes, the “Bridge Securities”). Frank C. Ingriselli, our President, Chief Executive Officer, and member of our Board of Directors, participated in the Bridge Financing, purchasing Bridge Notes of $1 million and receiving Bridge Warrants exercisable for 19,048 shares of our common stock, and Clark R. Moore, our Executive Vice President and General Counsel, purchased Bridge Notes of $50,000 and received Bridge Warrants exercisable for 953 shares of our common stock, respectively.
On December 16, 2013, we amended all of the Bridge Notes in order to extend the maturity date to July 31, 2014, subordinate the Bridge Notes to certain future qualified senior indebtedness, repay all accrued interest and payment-in-kind cash due, repay either none or 50% of the outstanding principal amounts due under such Bridge Notes, as elected by the holders, increase the interest rate from 10% per annum to 12% per annum on all deferred principal, and provided for an additional 10% payment-in-kind cash (“PIK”) amount equal to 10% of the deferred principal due. As additional consideration for the amendment of the Bridge Notes, we granted a new warrant (“New Warrant”) exercisable on a cashless basis at an exercise price of $2.34 per share for a number of shares of our common stock equal to (x) double (2x) the number of shares issuable under the Bridge Warrant originally issued to each holder who agreed to defer 50% of the outstanding principal of its Bridge Note, and (y) triple (3x) the number of shares issuable under the Bridge Warrant originally issued to each holder who agreed to defer 100% of the outstanding principal of its Bridge Note. Frank C. Ingriselli, our President, Chief Executive Officer, and member of our Board of Directors, agreed to defer $500,000 of the original $1.0 million principal amount outstanding under his Bridge Note, and we paid to him $73,699 in accrued interest and $100,000 in PIK amounts due, and repaid 50% of his outstanding principal amount of $500,000, and Mr. Ingriselli received a New Warrant exercisable for 38,096 shares of our common stock. Clark R. Moore, our Executive Vice President and General Counsel, agreed to defer $25,000 of the original $50,000 principal amount outstanding under his Bridge Note, and we paid to him $3,685 in accrued interest and $5,000 in PIK amounts due, and repaid 50% of his outstanding principal amount of $25,000, and Mr. Moore received a New Warrant exercisable for 1,906 shares of our common stock.
In February 2014, each of Mr. Ingriselli and Mr. Moore transferred their Bridge Notes to non-affiliates of the Company, and as such, such officers no longer hold any Bridge Notes or rights thereunder.
In March 2014, the Bridge Notes were further amended as described above under “Part II” – “ITEM 7. MANAGEMENT’S DISCUSSION AND ANALYSIS OF FINANCIAL CONDITION AND RESULTS OF OPERATIONS” – “Liquidity and Capital Resources” – “Historical Liquidity and Capital Resources.”
Agreements with Affiliates
MIE Holdings Corporation
MIE Holdings Corporation, which we refer to as MIE Holdings, an independent upstream onshore oil company operating in China and abroad, may be deemed to be an affiliate of our company due to its beneficial ownership of 1,333,334 shares of our common stock, representing beneficial ownership of greater than 5% of our outstanding common stock. MIE Holdings acquired 1,333,334 shares of preferred stock from Pacific Energy Development and an 80% interest in Condor for $3,000,000 on October 31, 2011; the shares were converted into 1,333,334 shares of our Series A preferred stock in the Pacific Energy Development merger and subsequently converted into 1,333,334 shares of our common stock in January 2013. MIE Holdings continues to hold these shares.
Pacific Energy Development and an affiliate of MIE Holdings collectively own and operate Condor, which holds part of our interests in the Niobrara Asset, and formerly held a 50% interest in White Hawk, which previously held our interests in the Eagle Ford asset until we divested those interests effective November 1, 2013.
On February 14, 2013, the Company, through its wholly-owned Nevada subsidiary, Pacific Energy Development Corp. (“PEDCO”), entered into a Secured Subordinated Promissory Note (the “MIEJ Note”) with MIEJ, with an effective date of November 1, 2012. Under the Note, PEDCO may draw down multiple advances up to a maximum of $5 million outstanding principal under the MIEJ Note, with repaid amounts not being permitted to be re-borrowed. Amounts borrowed under the MIEJ Note may be used by PEDCO to fund fees and expenses allocable to PEDCO with respect to its operations in the Niobrara Asset. When drawn, principal borrowed under the MIEJ Note carries an interest rate of 10.0% per annum. Principal and accrued interest under the MIEJ Note were required to be paid within ten (10) business days of the earlier to occur of (i) December 31, 2013 or (ii) the closing of a debt or equity financing transaction with gross proceeds to the Company of at least $10 million. The MIEJ Note can be prepaid in full by the Company without penalty, and is secured by all of PEDCO’s ownership and working interest in the FFT2H well located in the Niobrara Asset, and all corresponding leasehold rights pooled with respect to such well, and PEDCO’s ownership and working interest in each future well drilled and completed in the Niobrara Asset..
104
On March 25, 2013, we and MIEJ amended and restated the MIEJ Note, to increase from $5 million the maximum amount available for us to borrow thereunder to $6.5 million, and to permit amounts borrowed under the MIEJ Note to be used by us to fund fees and expenses allocable to us with respect to our operations in the Niobrara Asset, Niobrara Asset-related acquisition expenses, and repayment of $432,433 due to Condor as a refund of the performance deposit paid by MIEJ with respect to the Mississippian Asset acquisition and applied toward our purchase price of the Mississippian Asset. The MIEJ Note converted amounts previously advanced by MIEJ to us in the amount of $2.17 million to fund operations in the Niobrara Asset through November 1, 2012, as well as an additional $2 million loaned by MIEJ to us under the MIEJ Note on February 14, 2013 and $2 million loaned by MIEJ to us under the MIEJ Note on March 25, 2013.
On July 9, 2013, we and MIEJ agreed to amend the MIEJ Note to extend the maturity date from December 31, 2013 to August 31, 2014, and to remove the maturity trigger upon the closing of a debt or equity financing transaction with gross proceeds of $10 million to the Company. The Amended and Restated Secured Subordinated Promissory Note (the “Amended Note”), dated July 9, 2013, amends and restates the MIEJ Note. Under the Amended Note, PEDCO may draw down multiple advances up to a maximum of $6.5 million outstanding principal under the Note, with repaid amounts not being permitted to be re-borrowed. Amounts borrowed under the Amended Note may be used by PEDCO to fund fees and expenses allocable to PEDCO with respect to its operations in the Niobrara Asset. When drawn, principal borrowed under the Amended Note carries an interest rate of 10.0% per annum. Principal and accrued interest under the Amended Note are due and payable within ten (10) business days of August 31, 2014. The total principal amount outstanding under the note is $6.17 million as of December 31, 2013. There is currently approximately $330,000 available for future borrowing by PEDCO under the note. Further, the Company owes $585,777 in accrued interest at December 31, 2013 under the Note.
On July 9, 2013, Condor, the Company’s 20% owned subsidiary, and MIEJ agreed to amend the Promissory Note (the “Original Condor-MIEJ Note”) previously entered into on February 14, 2013 by Condor and MIEJ, to increase the amount available for borrowing from $14 million to $25 million for the purposes of funding drilling and development of Condor’s assets. The Amended and Restated Promissory Note, executed July 9, 2013 by Condor and effective June 28, 2013 (the “Amended Condor-MIEJ Note”), amends and restates the Original Condor-MIEJ Note. Under the Amended Condor-MIEJ Note, Condor may draw down multiple advances up to a maximum of $25 million outstanding principal under the Amended Condor-MIEJ Note (previously $14 million), with repaid amounts not being permitted to be re-borrowed. When drawn, principal borrowed under the Amended Condor-MIEJ Note carries an interest rate per annum equal to the one (1) month LIBOR rate, plus four percent (4%). Principal and accrued interest due under the Amended Condor-MIEJ Note is due and payable on the date that is 36 months from the date each advance is made under the Amended Condor-MIEJ Note. The note may be prepaid in full by Condor without penalty. The total principal amount outstanding as of December 31, 2013 under the Amended Condor-MIEJ Note is $26,472,535.
On November 26, 2012, we entered into an agreement with MIEJ providing for the allocation of 50% of the purchase price, payment of the aggregate $864,866 performance deposit due, ownership interest, development and operational expenses with respect to the Mississippian Asset to each of our company and MIEJ, provided that if MIEJ elected to not participate in the acquisition of the Mississippian asset, that we would refund MIEJ’s $432,433 paid as its 50% portion of the performance deposit paid and allow MIEJ to exit the transaction. In February 2013, MIEJ elected not to participate in the Mississippian asset acquisition transaction, the seller and the Company agreed to restructure the Mississippian asset acquisition transaction to provide for the Company to be the sole buyer and apply the performance deposit previously paid toward the purchase price due from the Company in the restructured transaction. In March 2014, the Company fully satisfied its obligation to refund to MIEJ the amount of $432,433.
On December 20, 2013, White Hawk entered into a series of transactions pursuant to which MIEJ divested its 50% share of interests in the assets held through White Hawk to a third party, and withdrew from White Hawk as a member thereof effective December 31, 2013, with our effective interests in the Eagle Ford shale assets remaining unchanged and unaffected by the transactions. As a result of the transactions, White Hawk divested 50% of its assets and we became the 100% owner of White Hawk. Thereafter, we sold our Eagle Ford assets to a third party, effective November 1, 2013, and exited the Eagle Ford play.
Yao Hang Finance (Hong Kong) Limited
Yao Hang Finance (Hong Kong) Limited, which we refer to as Yao Hang, may be deemed to be an affiliate of our company due to its beneficial ownership of 3,333,334 shares of our common stock, representing beneficial ownership of greater than 5% of our outstanding common stock. On August 12, 2013, we sold (a) 6,666,667 shares of common stock at a price of $3.00 per share (the “Purchased Shares”), which included rights to the following warrants (b) three-year warrants exercisable on a cash basis only for (i) an aggregate of 666,667 shares of common stock at $3.75 per share, (ii) an aggregate of 666,667 shares of common stock at $4.50 per share, and (iii) an aggregate of 666,667 shares of common stock at $5.25 per share (collectively (i), (ii) and (iii), the “Purchased Warrants”), to Yao Hang in consideration for $20 million.
105
Yao Hang paid $10 million in cash at the closing, and entered into a common stock and Warrant Subscription Agreement (the “Subscription Agreement”), First Amendment to common stock and Warrant Subscription Agreement (the “Amendment”), and full-recourse promissory note (the “Note”), which Amendment and Note required that it pay the balance of $10 million in cash no later than December 1, 2013, with 3,333,333 of the shares of common stock issued to Yao Hang in the private placement (the “Escrowed Shares”), as well as warrants exercisable for (i) an aggregate of 333,333 shares of common stock at $3.75 per share, (ii) an aggregate of 333,333 shares of common stock at $4.50 per share, and (iii) an aggregate of 333,333 shares of common stock at $5.25 per share (collectively (i), (ii) and (iii), the “Escrowed Warrants”), being held in escrow by the Company pending Yao Hang’s payment in full of the $10 million due under the Note.
Yao Hang failed to pay the $10 million balance due under the Note by December 1, 2013, and has not paid any funds in connection with such remaining Note balance to date. On March 7, 2014, we notified Yao Hang that, effective immediately, the Escrowed Shares and Escrowed Warrants were rescinded as permitted pursuant to the terms of the Note, and the Note was cancelled and forgiven, with no further action required by Yao Hang.
The following table presents fees for professional audit services performed by GBH CPAs, PC for the audit of our annual financial statements for the fiscal years ended December 31, 2013 and 2012.
|
2013
|
2012
|
|||||||
|
GBH CPAs, PC:
|
||||||||
|
Audit Fees(1)
|
$
|
190,855
|
$
|
65,680
|
||||
|
Audit-Related Fees(2)
|
100,720
|
69,220
|
||||||
|
Tax Fees(3)
|
-
|
2,800
|
||||||
|
All Other Fees(4)
|
212,145
|
-
|
||||||
|
Total
|
$
|
503,720
|
$
|
137,700
|
||||
|
(1)
|
Audit fees include professional services rendered for (1) the audit of our annual financial statements for the fiscal years ended December 31, 2013 and 2012 and (ii) the reviews of the financial statements included in our quarterly reports on Form 10-Q for such years.
|
|
(2)
|
Audit-related fees consist of fees billed for professional services that are reasonably related to the performance of the audit or review of our consolidated financial statements, but are not reported under “Audit fees.”
|
|
(3)
|
Tax fees include professional services relating to preparation of the annual tax return.
|
|
(4)
|
Other fees include professional services for review of various filings and issuance of consents.
|
106
Pre-Approval Policies
It is the policy of our Board of Directors that all services to be provided by our independent registered public accounting firm, including audit services and permitted audit-related and non-audit services, must be pre-approved by our Board of Directors. Our Board of Directors pre-approved all services, audit and non-audit, provided to us by GBH CPAs, PC for 2013 and 2012.
|
(b)
|
List of Exhibits
|
|
Exhibit
No.
|
Description
|
Filed With
This Annual Report on Form 10-K
|
Form
|
Exhibit
|
Filing Date/Period End Date
|
File Number
|
|
1.1
|
Underwriting Agreement, dated December 9, 2013, by and among the Company and National Securities Corporation
|
8-K
|
1.1
|
12/10/2013
|
001-35922
|
|
|
1.2
|
Underwriting Agreement, dated March 4, 2014, by and among the Company and Roth Capital Partners, LLC as representative of the several underwriters set forth in such agreement
|
8-K
|
1.1
|
3/6/2014
|
001-35922
|
|
|
2.1
|
Agreement and Plan of Reorganization, dated January 13, 2012, by and among Blast Services, Inc., Blast Acquisition Corp., and Pacific Energy Development Corp.
|
8-K
|
2.1
|
1/20/2012
|
000-53725
|
|
|
2.2
|
First Amendment to the Agreement and Plan of Merger, dated May 29, 2012, by and among Blast Services, Inc., Blast Acquisition Corp., and Pacific Energy Development Corp.
|
8-K
|
2.2
|
5/31/2012
|
000-53725
|
|
|
2.3
|
Articles of Merger (Nevada) by Blast Acquisition Corp. and Pacific Energy Development Corp.
|
8-K
|
3.3
|
8/2/2012
|
000-53725
|
|
|
2.4
|
Agreement and Plan of Merger of Pacific Energy Development MSL LLC and PEDCO MSL Merger Sub LLC (March 7, 2014)
|
8-K
|
2.1
|
3/10/2014
|
001-35922
|
|
|
2.5
|
Purchase and Sale Agreement, dated January 21, 2014, by and between Continental Resources, Inc. and Red Hawk Petroleum, LLC
|
8-K
|
2.1
|
1/22/2014
|
001-35922
|
|
|
2.6
|
Purchase and Sale Agreement, dated February 19, 2014, by and between White Hawk Petroleum, LLC and Millennial PDP Fund IV, LP
|
8-K
|
2.1
|
2/20/2014
|
001-35922
|
|
|
3.1
|
Amended and Restated Certificate of Formation and Designation by Blast Acquisition Corp. and Pacific Energy Development Corp.
|
8-K
|
3.1
|
8/2/2012
|
000-53725
|
|
|
3.2
|
Amended and Restated Certificate of Designation of Series A Preferred Stock
|
8-K
|
3.2
|
8/2/2012
|
000-53725
|
|
|
3.3
|
Certificate of Amendment of Amended and Restated Certificate of Formation
|
8-K
|
3.1
|
4/23/2013
|
000-53725
|
|
|
3.4
|
Bylaws of Blast Energy Services, Inc.
|
8-K
|
3.3
|
3/6/2008
|
333-64122
|
|
|
3.5
|
Amendment to the Bylaws
|
8-K
|
3.1
|
12/6/2012
|
000-53725
|
|
|
3.6
|
Articles of Merger (Nevada) of Pacific Energy Development MSL LLC and PEDCO MSL Merger Sub LLC (March 7, 2014)
|
8-K
|
3.1
|
3/10/2014
|
001-35922
|
107
|
4.1
|
Form of Common Stock Certificate for PEDEVCO CORP.
|
S-3
|
4.1
|
10/23/2013
|
333-191869
|
|
|
4.2
|
Form of PEDEVCO Corp. Series A Preferred Stock Certificate
|
X
|
||||
|
4.3
|
Form of PEDEVCO Corp. Warrant Agreement
|
8-K
|
3/10/2014
|
001-35922
|
||
|
4.4
|
CCG Investor Relations Partners LLC Warrant (July 15, 2013)
|
10-Q
|
4.1
|
8/14/2013
|
001-35922
|
|
|
4.5
|
Form of Warrant for the Purchase of Common Stock (Private Placement Investor) August 12, 2013
|
8-K
|
4.1
|
8/12/2013
|
001-35922
|
|
|
4.6
|
Consultant Stock Option Agreement, dated October 7, 2011, entered into by and between Michael L. Peterson and the Registrant
|
S-8
|
4.9
|
10/31/13
|
333-192002
|
|
|
4.7
|
Employee Stock Option Agreement, dated October 7, 2011, entered into by and between Valentina Babichev and the Registrant
|
S-8
|
4.10
|
10/31/13
|
333-192002
|
|
|
4.8
|
Consultant Stock Option Agreement, dated October 7, 2011, entered into by and between Y.M. Shum and the Registrant
|
S-8
|
4.11
|
10/31/13
|
333-192002
|
|
|
4.9
|
Consultant Stock Option Agreement, dated October 7, 2011, entered into by and between Kathleen Cole and the Registrant
|
S-8
|
4.12
|
10/31/13
|
333-192002
|
|
|
4.10
|
Employee Stock Option Agreement, dated June 18, 2012, entered into by and between Frank C. Ingriselli and the Registrant
|
S-8
|
4.13
|
10/31/13
|
333-192002
|
|
|
4.11
|
Employee Stock Option Agreement, dated June 18, 2012, entered into by and between Michael L. Peterson and the Registrant
|
S-8
|
4.14
|
10/31/13
|
333-192002
|
|
|
4.12
|
Employee Stock Option Agreement, dated June 18, 2012, entered into by and between Clark R. Moore and the Registrant
|
S-8
|
4.15
|
10/31/13
|
333-192002
|
|
|
10.1
|
2003 Stock Option Plan
|
10-QSB/A
|
10.12
|
11/20/2003
|
333-64122
|
|
|
10.2
|
Blast Energy Services, Inc. 2009 Stock Incentive Plan
|
10-Q
|
4.1
|
8/14/2009
|
000-53725
|
|
|
10.3
|
PEDEVCO Corp. 2012 Equity Incentive Plan
|
S-8
|
4.1
|
8/2/2012
|
000-53725
|
|
|
10.4
|
PEDEVCO Corp. 2012 Equity Incentive Plan - Form of Restricted Shares Grant Agreement
|
S-8
|
4.2
|
10/31/13
|
333-192002
|
|
|
10.5
|
PEDEVCO Corp. 2012 Equity Incentive Plan - Form of Stock Option Agreement
|
S-8
|
4.3
|
10/31/13
|
333-192002
|
|
|
10.6
|
Pacific Energy Development Corp. 2012 Equity Incentive Plan
|
S-8
|
4.4
|
10/31/13
|
333-192002
|
|
|
10.7
|
Pacific Energy Development Corp. 2012 Plan - Form of Restricted Shares Grant Agreement
|
S-8
|
4.5
|
10/31/13
|
333-192002
|
|
|
10.8
|
Pacific Energy Development Corp. 2012 Plan - Form of Stock Option Agreement
|
S-8
|
4.6
|
10/31/13
|
333-192002
|
|
|
10.9
|
Pacific Energy Development Corp. - Form of Restricted Shares Grant Agreement
|
S-8
|
4.7
|
10/31/13
|
333-192002
|
108
|
10.10
|
Pacific Energy Development Corp. - Form of Stock Option Agreement
|
S-8
|
4.8
|
10/31/13
|
333-192002
|
|
|
10.11
|
Pedevco Corp. - Form of Indemnification Agreement
|
X
|
||||
|
10.12
|
Agreement to Purchase Sugar Valley Interest, dated September 9, 2010, by and between Blast Energy Services, Inc. and Sun Resources Texas, Inc.
|
8-K
|
10.1
|
9/23/2010
|
000-53725
|
|
|
10.13
|
Promissory Note, dated September 9, 2010, by Blast Energy Services, Inc. in favor of Sun Resources Texas, Inc.
|
8-K
|
10.2
|
9/23/2010
|
000-53725
|
|
|
10.14
|
Letter of Intent to Farm in to Guijarral Hills Extension Exploitation Project, dated October 25, 2010, by Blast Energy Services, Inc. and Solimar Energy Limited
|
8-K
|
10.1
|
11/2/2010
|
000-53725
|
|
|
10.15
|
Asset Purchase Agreement, dated December 30, 2010, by and between Blast Energy Services, Inc. and GlobaLogix, Inc.
|
8-K
|
10.1
|
1/5/2011
|
000-53725
|
|
|
10.16
|
Modification Agreement with Solimar Energy LLC, dated December 22, 2011, by and between Solimar Energy LLC and Blast Energy Services, Inc.
|
8-K
|
2.1
|
12/27/2011
|
000-53725
|
|
|
10.17
|
Secured Promissory Note of Pacific Energy Development Company LLC, dated February 14, 2011, issued by Frank Ingriselli
|
X
|
||||
|
10.18
|
Agreement on Joint Cooperation, dated April 27, 2011, by Pacific Energy Development Company LLC and South Texas Reservoir Alliance LLC
|
X
|
||||
|
10.19
|
Executive Employment Agreement, dated June 10, 2011, by Pacific Energy Development Corp and Frank Ingriselli
|
X
|
||||
|
10.20
|
Executive Employment Agreement, dated June 10, 2011, by Pacific Energy Development Corp and Clark Moore
|
X
|
||||
|
10.21
|
Secured Convertible Promissory Note, dated July 6, 2011, issued to Pacific Energy Development Corp by Global Venture Investments LLC
|
X
|
||||
|
10.22
|
Purchase and Sale Agreement, dated August 23, 2011, by Pacific Energy Development Corp, Esenjay Oil & Gas, Ltd., Winn Exploration Co., Inc., Lacy Properties, Ltd. and Crain Energy, Ltd.
|
X
|
||||
|
10.23
|
Amendatory Letter Agreement No. 1 to Purchase and Sale Agreement, dated September 30, 2011, by and among Esenjay Oil & Gas, Ltd., Winn Exploration Co., Inc., Lacy Properties, Ltd. and Crain Energy, Ltd., and Pacific Energy Development Corp.
|
X
|
||||
|
10.24
|
Amendatory Letter Agreement No. 2 to Purchase and Sale Agreement, dated October 27, 2011, by and among Esenjay Oil & Gas, Ltd., Winn Exploration Co., Inc., Lacy Properties, Ltd., Crain Energy, Ltd., and Pacific Energy Development Corp.
|
X
|
||||
|
10.25
|
Amendatory Letter Agreement No. 3 to Purchase and Sale Agreement, dated October 31, 2011, by and among Esenjay Oil & Gas, Ltd., Winn Exploration Co., Inc., Lacy Properties, Ltd., Crain Energy, Ltd., and Pacific Energy Development Corp.
|
X
|
109
|
10.26
|
Consulting Agreement, dated September 19, 2011, by Pacific Energy Development Corp and South Texas Reservoir Alliance LLC
|
X
|
||||
|
10.27
|
Operating Agreement, dated October 31, 2011, by and between Condor Energy Technology LLC as Operator and the parties named therein
|
X
|
||||
|
10.28
|
Series A Convertible Preferred Stock Warrant, dated October 31, 2011, issued to Global Venture Investments LLC by Pacific Energy Development Corp
|
X
|
||||
|
10.29
|
Condor Energy Technology LLC Operating Agreement, dated October 31, 2011, by MIE Jurassic Energy Corporation and Pacific Energy Development Corp
|
X
|
||||
|
10.30
|
Consulting Agreement, dated November 26, 2011, by and between Condor Energy Technology LLC and South Texas Reservoir Alliance LLC
|
X
|
||||
|
10.31
|
Stock Purchase Agreement, dated December 16, 2011, by Pacific Energy Development Corp, the Shareholders of Excellong E&P-2, Inc., and Excellong, Inc.
|
X
|
||||
|
10.32
|
Executive Employment Agreement, dated January 6, 2012, by Pacific Energy Development Corp and Jamie Tseng
|
X
|
||||
|
10.33
|
Amendatory Letter Agreement to Stock Purchase Agreement, dated February 9, 2012, between Pacific Energy Development Corp., the Shareholders of Excellong E&P-2, Inc. and Excellong, Inc.
|
X
|
||||
|
10.34
|
Contract Operating Services Agreement, dated February 15, 2012, by and between South Texas Reservoir Alliance and Condor Energy Technology LLC
|
X
|
||||
|
10.35
|
Amendatory Letter Agreement No. 2 to Stock Purchase Agreement, dated February 29, 2012, between Pacific Energy Development Corp., the Shareholders of Excellong E&P-2, Inc. and Excellong, Inc.
|
X
|
||||
|
10.36
|
Amendatory Letter Agreement No. 3 to Stock Purchase Agreement, dated March 28, 2012, between Pacific Energy Development Corp., the Shareholders of Excellong E&P-2, Inc. and Excellong, Inc.
|
X
|
||||
|
10.37
|
Promissory Note, dated March 7, 2012, by Condor Energy Technology LLC in favor of MIE Jurassic Energy Corporation
|
X
|
||||
|
10.38
|
Form of Common Stock Warrant dated May 24, 2012, issued to MIE Jurassic Energy Corporation, May 24, 2012
|
X
|
110
|
10.39
|
White Hawk Petroleum, LLC Amended and Restated Operating Agreement, dated May 23, 2012, by MIE Jurassic Energy Corporation and Pacific Energy Development Corp.
|
X
|
||||
|
10.40
|
White Hawk Petroleum, LLC Membership Unit Purchase Agreement, dated May 23, 2012, by MIE Jurassic Energy Corporation, Pacific Energy Development and White Hawk Petroleum, LLC
|
X
|
||||
|
10.41
|
Consulting Services Agreement, effective June 1, 2012, by and between South Texas Reservoir Alliance and Condor Energy Technology LLC
|
X
|
||||
|
10.42
|
Gas Purchase Contract, effective as of June 1, 2012, between Condor Energy Technology, LLC and DCP Midstream, LP
|
X
|
||||
|
10.43
|
Gas Purchase Contract, dated December 1, 2011, by and between DCP Midstream, LP and Continental Resources, Inc., assigned to Red Hawk Petroleum, LLC by Continental Resources, Inc. effective March 7, 2014
|
X
|
||||
|
10.44
|
Gas Purchase Contract, dated April 1, 2012, as amended, by and between Sterling Energy Investments LLC and Continental Resources, Inc., assigned to Red Hawk Petroleum, LLC by Continental Resources, Inc. effective March 7, 2014
|
X
|
||||
|
10.45
|
Executive Employment Agreement, dated June 16, 2012, by Pacific Energy Development Corp. and Michael Peterson
|
X
|
||||
|
10.46
|
Form of Common Stock Warrant, dated July 27, 2012
|
X
|
||||
|
10.47
|
Form of Placement Agent Series A Preferred Stock Warrant, dated July 27, 2012
|
X
|
||||
|
10.48
|
Purchase and Sale Agreement, dated July 26, 2012, by and among Esenjay Oil & Gas, Ltd., Winn Exploration Co., Inc., Lacy Properties, Ltd., Crain Energy, Ltd., Ravco, Inc., Arentee Investments, Schibi Oil & Gas, Ltd., and Condor Energy Technology LLC
|
X
|
||||
|
10.49
|
Amendatory Letter Agreement No. 1 to Purchase and Sale Agreement, dated September 21, 2012, by and among Esenjay Oil & Gas, Ltd., Winn Exploration Co., Inc., Lacy Properties, Ltd., Crain Energy, Ltd., Ravco, Inc., Arentee Investments, Schibi Oil & Gas, Ltd., and Condor Energy Technology LLC
|
X
|
||||
|
10.50
|
Form of Pacific Energy Development Corp Series A Preferred Stock Subscription Agreement
|
X
|
||||
|
10.51
|
Binding Strategic Cooperation Agreement, dated September 24, 2012, by PEDEVCO Corp and Guofa Zhonghai Energy Investment Co., Ltd.
|
8-K
|
10.1
|
10/1/2012
|
000-53725
|
|
|
10.52
|
Promissory Note, dated September 24, 2012, by Condor Energy Technology LLC in favor of Pacific Energy Development Corp.
|
X
|
111
|
10.53
|
Pacific Energy Technology Service, LLC Operating Agreement, dated October 4, 2012, by and between Pacific Energy Development Corp. and South Texas Reservoir Alliance LLC
|
X
|
||||
|
10.54
|
Closing Payment Extension Amendatory Letter Agreement, dated November 20, 2012, by and among PEDEVCO Corp, Esenjay Oil & Gas, Ltd., Winn Exploration Co., Inc., Lacy Properties, Ltd., and Crain Energy, Ltd.
|
X
|
||||
|
10.55
|
Term Assignment Evaluation Agreement, dated November 26, 2012, by and between Pacific Energy Development Corp. and MIE Jurassic Energy Corporation.
|
X
|
||||
|
10.56
|
Amendment No. 1 to Employment Agreement, dated January 11, 2013, by and between PEDEVCO Corp. and Michael L. Peterson
|
X
|
||||
|
10.57
|
Amendment No. 1 to Employment Agreement, dated January 11, 2013, by and between PEDEVCO Corp. and Frank C. Ingriselli
|
X
|
||||
|
10.58
|
Amendment No. 1 to Employment Agreement, dated January 11, 2013, by and between PEDEVCO Corp. and Clark R. Moore
|
X
|
||||
|
10.59
|
Agreement for Purchase of Term Assignment, dated February 22, 2013, by Berexco LLC and Pacific Energy Development MSL LLC
|
X
|
||||
|
10.60
|
Mandate, dated February 25, 2013, entered into by and between PEDEVCO Corp. and Somerley Limited
|
X
|
||||
|
10.61
|
Form of Bridge Financing Note and Warrant Purchase Agreement
|
X
|
||||
|
10.62
|
Form of Bridge Financing Secured Promissory Note
|
X
|
||||
|
10.63
|
Form of Bridge Financing Warrant
|
X
|
||||
|
10.64
|
Amended and Restated Secured Subordinated Promissory Note, dated March 25, 2013, by and between Pacific Energy Development Corp. and MIE Jurassic Energy Corporation
|
X
|
||||
|
10.65
|
Letter Agreement, dated March 25, 2013, by and between PEDEVCO Corp. and South Texas Reservoir Alliance LLC
|
X
|
||||
|
10.66
|
Letter Agreement, dated May 15, 2013, by and between PEDEVCO Corp. and South Texas Reservoir Alliance LLC
|
10-Q
|
10.11
|
5/20/2013
|
001-35922
|
|
|
10.67
|
First Amendment to Amended and Restated Secured Subordinated Promissory Note, dated July 9, 2013, by and between Pacific Energy Development Corp. and MIE Jurassic Energy Corporation
|
8-K
|
10.1
|
7/15/2013
|
001-35922
|
|
|
10.68
|
Amended and Restated Promissory Note, dated July 9, 2013, by Condor Energy Technology LLC in favor of MIE Jurassic Energy Corporation
|
8-K
|
10.2
|
7/15/2013
|
001-35922
|
|
|
10.69
|
Form of Common Stock and Warrant Subscription Agreement (August 12, 2013 - Private Placement Offering)
|
8-K
|
10.1
|
8/13/2013
|
001-35922
|
112
|
10.70
|
Form of First Amendment to Common Stock and Warrant Subscription Agreement (August 12, 2013 - Private Placement Offering)
|
8-K
|
10.2
|
8/13/2013
|
001-35922
|
|
|
10.71
|
Form of Promissory Note (August 12, 2013 - Private Placement Offering)
|
8-K
|
10.3
|
8/13/2013
|
001-35922
|
|
|
10.72
|
Shares Subscription Agreement, dated September 11, 2013, by and among The Sixth Energy Limited, Asia Sixth Energy Resources Limited, and Pacific Energy Development Corp.
|
8-K
|
10.1
|
9/16/2013
|
001-35922
|
|
|
10.73
|
Form of Amendment to Secured Promissory Note - Bridge Lenders (December 2013)
|
8-K
|
10.1
|
12/18/2013
|
001-35922
|
|
|
10.74
|
Form of Warrant for the Purchase of Common Stock - Bridge Lenders (December 2013 New Warrants)
|
8-K
|
10.2
|
12/18/2013
|
001-35922
|
|
|
10.75
|
Purchase and Sale Agreement, dated December 20, 2013, by and between White Hawk Petroleum, LLC and Millennial PDP Fund IV, LP
|
8-K
|
10.1
|
12/24/2013
|
001-35922
|
|
|
10.76
|
Member Withdrawal Agreement, dated December 20, 2013, by and among White Hawk Petroleum, LLC, MIE Jurassic Energy Corporation, and Pacific Energy Development Corp.
|
8-K
|
10.2
|
12/24/2013
|
001-35922
|
|
|
10.77
|
Amendatory Letter Agreement No. 1 dated February 25, 2014, between Red Hawk Petroleum, LLC and Continental Resources, Inc.
|
8-K
|
10.1
|
2/28/2014
|
001-35922
|
|
|
10.78
|
Note Purchase Agreement, dated as of March 7, 2014, by and between the Company; BRe BCLIC Primary, BRe BCLIC Sub, BRe WNIC 2013 LTC Primary, BRe WNIC 2013 LTC Sub, and RJ Credit LLC, as investors, and BAM Administrative Services LLC, as agent for the investors
|
8-K
|
10.1
|
3/10/2014
|
001-35922
|
|
|
10.79
|
Senior Secured Promissory Note (BRe BCLIC Primary) ($11,800,000)(March 7, 2014)
|
8-K
|
10.2
|
3/10/2014
|
001-35922
|
|
|
10.80
|
Senior Secured Promissory Note (BRe BCLIC Sub) ($423,530)(March 7, 2014)
|
8-K
|
10.3
|
3/10/2014
|
001-35922
|
|
|
10.81
|
Senior Secured Promissory Note (BRe WNIC 2013 LTC Primary) ($17,522,941)(March 7, 2014)
|
8-K
|
10.4
|
3/10/2014
|
001-35922
|
|
|
10.82
|
Senior Secured Promissory Note (BRe WNIC 2013 LTC Sub) ($803,529)(March 7, 2014)
|
8-K
|
10.5
|
3/10/2014
|
001-35922
|
|
|
10.83
|
Senior Secured Promissory Note (RJ Credit LLC) ($19,450,000)(March 7, 2014)#
|
8-K
|
10.6
|
3/10/2014
|
001-35922
|
|
|
10.84
|
Guaranty dated March 7, 2014, by Pacific Energy Development Corp., White Hawk Petroleum, LLC, Pacific Energy & Rare Earth Limited, Blackhawk Energy Limited, Pacific Energy Development MSL, LLC, and Red Hawk Petroleum, LLC, in favor of BAM Administrative Services LLC, as agent
|
8-K
|
10.7
|
3/10/2014
|
001-35922
|
|
|
10.85
|
Security Agreement dated March 7, 2014, by Pacific Energy Development Corp., White Hawk Petroleum, LLC, Pacific Energy & Rare Earth Limited, Blackhawk Energy Limited, Pacific Energy Development MSL, LLC, and Red Hawk Petroleum, LLC, in favor of BAM Administrative Services LLC, as secured party
|
8-K
|
10.8
|
3/10/2014
|
001-35922
|
113
|
10.86
|
Patent Security Agreement dated March 7, 2014, by the Company in favor of BAM Administrative Services LLC, as secured party
|
8-K
|
10.9
|
3/10/2014
|
001-35922
|
|
|
10.87
|
Mortgage, Deed of Trust, Security Agreement, Financing Statement and Assignment of Production (Matagorda County, Texas) (March 7, 2014)
|
8-K
|
10.10
|
3/10/2014
|
001-35922
|
|
|
10.88
|
Leasehold Deed of Trust, Fixture Filing, Assignment of Rents and Leases, and Security Agreement (Morgan County, Colorado) – Pacific Energy Development Corp. (March 7, 2014
|
8-K
|
10.11
|
3/10/2014
|
001-35922
|
|
|
10.89
|
Leasehold Deed of Trust, Fixture Filing, Assignment of Rents and Leases, and Security Agreement (Morgan County, Colorado) – Red Hawk Petroleum, LLC (March 7, 2014)
|
8-K
|
10.12
|
3/10/2014
|
001-35922
|
|
|
10.90
|
Leasehold Deed of Trust, Fixture Filing, Assignment of Rents and Leases, and Security Agreement (Weld County, Colorado) – Pacific Energy Development Corp. (March 7, 2014)
|
8-K
|
10.13
|
3/10/2014
|
001-35922
|
|
|
10.91
|
Leasehold Deed of Trust, Fixture Filing, Assignment of Rents and Leases, and Security Agreement (Weld County, Colorado) – Red Hawk Petroleum, LLC (March 7, 2014)
|
8-K
|
10.14
|
3/10/2014
|
001-35922
|
|
|
10.92
|
Purchase and Sale Agreement, dated March 7, 2014, by and between Red Hawk Petroleum, LLC and RJ Resources Corp.
|
8-K
|
10.15
|
3/10/2014
|
001-35922
|
|
|
10.93
|
Asia Sixth Purchase Agreement, dated March 7, 2014, by and between Pacific Energy Development Corp. and RJ Resources Corp.
|
8-K
|
10.16
|
3/10/2014
|
001-35922
|
|
|
10.94
|
Membership Interest Purchase Agreement, dated March 7, 2014, by and between Pacific Energy Development Corp. and RJ Resources Corp.
|
8-K
|
10.17
|
3/10/2014
|
001-35922
|
|
|
10.95
|
Warrant for the Purchase of 1,000,000 shares of Common Stock granted to Casimir Capital, LP (March 7, 2014)
|
8-K
|
10.18
|
3/10/2014
|
001-35922
|
|
|
10.96
|
Form of Second Amendment to Secured Promissory Note (March 7, 2014)
|
8-K
|
10.19
|
3/10/2014
|
001-35922
|
|
|
10.97
|
Form of Subordination and Intercreditor Agreement with Secured Promissory Note Holders (March 7, 2014)
|
8-K
|
10.20
|
3/10/2014
|
001-35922
|
|
|
10.98
|
Letter Amending Cash Compensation Payable to South Texas Reservoir Alliance LLC (March 7, 2014)
|
8-K
|
10.22
|
3/10/2014
|
001-35922
|
|
|
10.99
|
Amendatory Letter Agreement No. 2 to Purchase and Sale Agreement, dated January 21, 2014, between Continental Resources, Inc. and Red Hawk Petroleum, LLC
|
8-K
|
10.22
|
3/10/2014
|
001-35922
|
|
|
14.1
|
Code of Ethics and Business Conduct
|
8-K/A
|
14.1
|
8/8/2012
|
000-53725
|
|
|
21.1
|
List of Subsidiaries of PEDEVCO CORP.
|
X
|
114
|
23.1
|
Consent of GBH CPAs, PC
|
X | ||||
|
23.2
|
Consent of Ryder Scott Company, L.P.
|
X
|
||||
|
31.1
|
Certification of Chief Executive Officer Pursuant to Section 302 of the Sarbanes-Oxley Act of 2002
|
X
|
||||
|
31.2
|
Certification of Chief Financial Officer Pursuant to Section 302 of the Sarbanes-Oxley Act of 2002
|
X
|
||||
|
32.1
|
Certification of Chief Executive Officer Pursuant to 18 U.S.C. Section 1350, as Adopted Pursuant to Section 906 of the Sarbanes-Oxley Act of 2002**
|
**
|
||||
|
32.2
|
Certification of Chief Financial Officer Pursuant to 18 U.S.C. Section 1350, as Adopted Pursuant to Section 906 of the Sarbanes-Oxley Act of 2002**
|
**
|
||||
|
99.1
|
Reserves Report of Ryder Scott Company, L.P. for reserves of PEDEVCO Corp. (Direct Interests Only) at December 31, 2013
|
X
|
||||
|
99.2
|
Reserves Report of Ryder Scott Company, L.P. for reserves of PEDEVCO Corp. (Direct and Indirect Interests) at December 31, 2013
|
X
|
||||
|
99.3
|
Charter of the Nominating and Corporate Governance Committee
|
8-K
|
99.1
|
9/5/2013
|
001-35922
|
|
|
99.4
|
Charter of the Compensation Committee
|
8-K
|
99.2
|
9/5/2013
|
001-35922
|
|
|
99.5
|
Charter of the Audit Committee
|
8-K
|
99.3
|
9/5/2013
|
001-35922
|
|
|
101.INS
|
XBRL Instance Document*
|
|||||
|
101.SCH
|
XBRL Taxonomy Extension Schema Document*
|
|||||
|
101.CAL
|
XBRL Taxonomy Extension Calculation Linkbase Document*
|
|||||
|
101.DEF
|
XBRL Taxonomy Extension Definition Linkbase Document*
|
|||||
|
101.LAB
|
XBRL Taxonomy Extension Label Linkbase Document*
|
|||||
|
101.PRE
|
XBRL Taxonomy Extension Presentation Linkbase Document*
|
|
* XBRL (Extensible Business Reporting Language) information is furnished and not filed or a part of a registration statement or prospectus for purposes of Sections 11 or 12 of the Securities Act of 1933, as amended, is deemed not filed for purposes of Section 18 of the Securities Exchange Act of 1934, as amended, and otherwise is not subject to liability under these sections.
|
|
#Although the RJ Credit LLC note has a total face value of $19,450,000, the Company is not obligated to pay any amount more than is borrowed over the $3,950,000 initially funded by RJ Credit LLC.
|
|
**Furnished herein.
|
115
SIGNATURES
Pursuant to the requirements of Section 13 or 15(d) of the Securities Exchange Act of 1934, the registrant has duly caused this report to be signed on its behalf by the undersigned, thereunto duly authorized.
|
PEDEVCO Corp.
|
|||
|
March 31, 2014
|
By:
|
/s/ Frank C. Ingriselli | |
| Frank C. Ingriselli | |||
|
President and Chief Executive Officer
|
|||
|
(Principal Executive Officer)
|
|||
|
March 31, 2014
|
By:
|
/s/ Michael L. Peterson | |
| Michael L. Peterson | |||
|
Executive Vice President and Chief Financial Officer (Principal Financial and Accounting Officer)
|
|||
Pursuant to the requirements of the Securities Exchange Act of 1934, this report has been signed below by the following persons on behalf of the registrant and in the capacities and on the dates indicated.
|
Signature
|
Title
|
Date
|
||
|
/s/ Frank C. Ingriselli
|
President, Chief Executive Officer and Chairman of the Board of Directors
(Principal Executive Officer)
|
March 31, 2014
|
||
|
Frank C. Ingriselli
|
||||
|
/s/ Michael L. Peterson
|
Chief Financial Officer, Executive Vice President
(Principal Financial and Accounting Officer)
|
March 31, 2014
|
||
|
Michael L. Peterson
|
||||
|
/s/ Elizabeth P. Smith
|
Director
|
March 31, 2014
|
||
|
Elizabeth P. Smith
|
||||
|
/s/ David C. Crikelair
|
Director
|
March 31, 2014
|
||
|
David C. Crikelair
|
116
PART IV
(a) Financial Statements
|
Audited Financial Statements for Years Ended December 31, 2013 and 2012
|
||||
|
Pedevco Corp.:
|
||||
|
Report of Independent Registered Public Accounting Firm
|
F-2
|
|||
|
Consolidated Balance Sheets as of December 31, 2013 and 2012
|
F-3
|
|||
|
Consolidated Statements of Operations for the Years Ended December 31, 2013 and 2012
|
F-4
|
|||
|
Consolidated Statement of Shareholders’ Equity For the Years Ended December 31, 2013 and 2012
|
F-5
|
|||
|
Consolidated Statements of Cash Flows for the Years Ended December 31, 2013 and 2012
|
F-6
|
|||
|
Notes to Consolidated Financial Statements
|
F-8
|
|||
|
(2)
|
Financial Statement Schedules
|
All financial statement schedules have been omitted, since the required information is not applicable or is not present in amounts sufficient to require submission of the schedule, or because the information required is included in the consolidated financial statements and notes thereto included in this Form 10-K.
|
(3)
|
Exhibits required by Item 601 of Regulation S-K
|
The information required by this Section (a) (3) of Item 15 is set forth on the exhibit index that follows the Signatures page of this Form 10-K.
F-1
REPORT OF INDEPENDENT REGISTERED PUBLIC ACCOUNTING FIRM
To the Board of Directors
PEDEVCO Corp. (formerly Blast Energy Services, Inc.)
Danville, California
We have audited the accompanying consolidated balance sheets of PEDEVCO Corp. (formerly Blast Energy Services, Inc.) as of December 31, 2013 and 2012 and the related consolidated statements of operations, changes in shareholders’ equity and cash flows for the years then ended. These consolidated financial statements are the responsibility of PEDEVCO Corp.’s management. Our responsibility is to express an opinion on these consolidated financial statements based on our audits.
We conducted our audits in accordance with standards of the Public Company Accounting Oversight Board (United States). Those standards require that we plan and perform the audits to obtain reasonable assurance about whether the consolidated financial statements are free of material misstatement. The Company is not required to have, nor were we engaged to perform, an audit of its internal control over financial reporting. Our audit included consideration of internal control over financial reporting as a basis for designing audit procedures that are appropriate in the circumstances, but not for the purpose of expressing an opinion on the effectiveness of the Company’s internal control over financial reporting. Accordingly, we express no such opinion. An audit includes examining, on a test basis, evidence supporting the amounts and disclosures in the consolidated financial statements. An audit also includes assessing the accounting principles used and significant estimates made by management, as well as evaluating the overall financial statement presentation. We believe that our audits provide a reasonable basis for our opinion.
In our opinion, the consolidated financial statements referred to above present fairly, in all material respects, the financial position of PEDEVCO Corp. as of December 31, 2013 and 2012 and the results of their operations and their cash flows for the years then ended in conformity with accounting principles generally accepted in the United States of America.
/s/ GBH CPAs, PC
GBH CPAs, PC
www.gbhcpas.com
Houston, Texas
March 31, 2014
F-2
PEDEVCO CORP.
(FORMERLY BLAST ENERGY SERVICES, INC.)
CONSOLIDATED BALANCE SHEETS
|
December 31,
|
December 31,
|
||||||
|
2013
|
2012
|
||||||
| (Restated) | |||||||
|
Assets
|
|||||||
|
Current assets:
|
|||||||
|
Cash
|
$
|
6,613,470
|
$
|
2,478,250
|
|||
|
Accounts receivable – oil and gas
|
110,547
|
16,571
|
|||||
|
Accounts receivable – oil and gas - related party
|
47,076
|
112,488
|
|||||
|
Accounts receivable – related party
|
78,830
|
83,064
|
|||||
|
Deferred financing costs
|
50,000
|
-
|
|||||
|
Prepaid expenses and other current assets
|
74,310
|
133,900
|
|||||
|
Total current assets
|
6,974,233
|
2,824,273
|
|||||
|
Oil and gas properties:
|
|||||||
|
Oil and gas properties, subject to amortization, net
|
2,173,245
|
2,420,688
|
|||||
|
Oil and gas properties, not subject to amortization, net
|
6,629,394
|
925,382
|
|||||
|
Total oil and gas properties, net
|
8,802,639
|
3,346,070
|
|||||
|
Equipment, net of accumulated depreciation
|
-
|
87,883
|
|||||
|
Notes receivable – related parties
|
-
|
2,786,064
|
|||||
|
Deposit for business acquisitions
|
10,019,633
|
-
|
|||||
|
Investments – equity method
|
-
|
2,098,334
|
|||||
|
Investments – cost method
|
4,100
|
4,100
|
|||||
|
Total assets
|
$
|
25,800,605
|
$
|
11,146,724
|
|||
|
Liabilities and Shareholders’ Equity
|
|||||||
|
Current liabilities:
|
|||||||
|
Accounts payable
|
$
|
173,475
|
$
|
132,243
|
|||
|
Accounts payable – related party
|
2,346,818
|
922,112
|
|||||
|
Accrued expenses
|
1,501,221
|
1,449,014
|
|||||
|
Accrued expenses – related party
|
1,057,265
|
36,168
|
|||||
|
Notes payable, net of discounts of $93,957 and $0, respectively
|
2,633,430
|
-
|
|||||
|
Notes payable - related party, net of discounts of $316,570 and $0, respectively
|
7,126,109
|
2,170,065
|
|||||
|
Total current liabilities
|
14,838,318
|
4,709,602
|
|||||
|
Long-term liabilities:
|
|||||||
|
Asset retirement obligations
|
75,447
|
59,298
|
|||||
|
Total liabilities
|
14,913,765
|
4,768,900
|
|||||
|
Commitments and contingencies
|
|||||||
|
Redeemable Series A convertible preferred stock: -0- and 555,556 shares issued and outstanding at December 31, 2013 and 2012, respectively
|
-
|
1,250,000
|
|||||
|
Shareholders’ equity:
|
|||||||
|
Series A convertible preferred stock, $0.001 par value, 100,000,000 shares authorized, -0- and 6,234,845 shares issued and outstanding at December 31, 2013 and 2012, respectively
|
-
|
6,235
|
|||||
|
Common stock, $0.001 par value, 200,000,000 shares authorized; 26,121,062 and 7,183,501 shares issued and outstanding at December 31, 2013 and 2012, respectively
|
26,121
|
7,184
|
|||||
|
Stock subscriptions receivable
|
(10,000,000
|
)
|
(276,326
|
)
|
|||
|
Additional paid-in capital
|
51,782,870
|
18,167,419
|
|||||
|
Accumulated deficit
|
(30,922,151
|
)
|
(12,776,688
|
)
|
|||
|
Total shareholders’ equity
|
10,886,840
|
5,127,824
|
|||||
|
Total liabilities and shareholders’ equity
|
$
|
25,800,605
|
$
|
11,146,724
|
|||
See accompanying notes to consolidated financial statements
F-3
PEDEVCO CORP.
(FORMERLY BLAST ENERGY SERVICES, INC.)
CONSOLIDATED STATEMENTS OF OPERATIONS
For the Years Ended December 31, 2013 and 2012
|
December 31,
|
||||||||
|
2013
|
2012
|
|||||||
|
(Restated)
|
||||||||
|
Revenue:
|
||||||||
|
Oil and gas sales
|
$
|
743,656
|
$
|
503,153
|
||||
|
Operating expenses:
|
||||||||
|
Lease operating costs
|
648,462
|
281,103
|
||||||
|
Selling, general and administrative expense
|
7,149,103
|
3,729,525
|
||||||
|
Impairment of goodwill
|
-
|
6,820,003
|
||||||
|
Impairment of oil and gas properties
|
3,302,803
|
180,262
|
||||||
|
Loss on oil and gas property acquisition deposit
|
200,000
|
-
|
||||||
|
Depreciation, depletion, amortization and accretion
|
437,040
|
131,332
|
||||||
|
Loss on settlement of payables
|
8,455
|
139,874
|
||||||
|
Total operating expenses
|
11,745,863
|
11,282,099
|
||||||
|
Gain on sale of equity method investments
|
-
|
64,168
|
||||||
|
Loss from equity method investments
|
(5,778,021
|
)
|
(357,612
|
)
|
||||
|
Operating loss
|
(16,780,228
|
)
|
(11,072,390
|
)
|
||||
|
Other income (expense):
|
||||||||
|
Interest expense
|
(1,591,405
|
)
|
(986,248
|
)
|
||||
|
Interest income
|
196,871
|
36,359
|
||||||
|
Gain on debt extinguishment
|
-
|
9,268
|
||||||
|
Gain on change in derivative fair value
|
14,005
|
-
|
||||||
|
Other income
|
15,294
|
-
|
||||||
|
Total other expense
|
(1,365,235
|
)
|
(940,621
|
)
|
||||
|
Net loss
|
$
|
(18,145,463
|
)
|
$
|
(12,013,011
|
)
|
||
|
Net loss per common share:
|
||||||||
|
Basic and diluted
|
$
|
(1.07
|
)
|
$
|
(1.94
|
)
|
||
|
Weighted average number of common shares outstanding:
|
||||||||
|
Basic and diluted
|
16,996,470
|
6,205,024
|
||||||
See accompanying notes to consolidated financial statements
F-4
PEDEVCO CORP.
(FORMERLY BLAST ENERGY SERVICES, INC.)
CONSOLIDATED STATEMENTS OF SHAREHOLDERS' EQUITY
For the Years Ended December 31, 2013 and 2012
|
Series A Convertible
Preferred Stock
|
Common Stock | |||||||||||||||||||||||||||||||
| Shares | Amount | Shares | Amount |
Additional
Paid-in Capital
|
Stock Subscriptions Receivable | Accumlated Deficit | Totals | |||||||||||||||||||||||||
|
Balances at December 31, 2011 (Restated)
|
2,222,224 | $ | 2,222 | 5,167,423 | $ | 5,167 | $ | 1,644,841 | - | $ | (763,677 | ) | $ | 888,553 | ||||||||||||||||||
|
Issuance of Series A preferred stock net of placement costs
|
3,684,448 | 3,684 | - | - | 8,011,387 | - | - | 8,015,071 | ||||||||||||||||||||||||
|
Issuance of Series A preferred stock to related party for services
|
76,667 | 77 | - | - | 172,423 | - | - | 172,500 | ||||||||||||||||||||||||
|
Issuance of Series A preferred stock for acquisition of oil and gas properties
|
122,812 | 123 | - | - | 276,203 | (276,326 | ) | - | - | |||||||||||||||||||||||
|
Issuance of Series A preferred stock for settlement of payables
|
93,250 | 93 | - | - | 559,405 | - | - | 559,498 | ||||||||||||||||||||||||
|
Issuance of Series A preferred stock for debt extension
|
44,445 | 45 | - | - | 279,956 | - | - | 280,001 | ||||||||||||||||||||||||
|
Issuance of restricted common stock for compensation
|
- | - | 785,000 | 785 | 234,715 | - | - | 235,500 | ||||||||||||||||||||||||
|
Exercise of common stock options
|
- | - | 20,000 | 20 | 4,780 | - | - | 4,800 | ||||||||||||||||||||||||
|
Issuance of common stock in connection with Blast merger
|
- | - | 474,291 | 475 | 4,491,750 | - | - | 4,492,225 | ||||||||||||||||||||||||
|
Issuance of common stock for debt conversions
|
- | - | 529,172 | 529 | 1,516,234 | - | - | 1,516,763 | ||||||||||||||||||||||||
|
Beneficial conversion feature
|
- | - | - | - | 667,418 | - | - | 667,418 | ||||||||||||||||||||||||
|
Cashless exercise of options - common stock
|
- | - | 161,086 | 161 | (161 | ) | - | - | - | |||||||||||||||||||||||
|
Cashless exercise of warrants- common stock
|
- | - | 37,529 | 38 | (38 | ) | - | - | - | |||||||||||||||||||||||
|
Warrants issued to MIE for sale of equity interests in White Hawk
|
- | - | - | - | 2,586 | - | - | 2,586 | ||||||||||||||||||||||||
|
Conversion of preferred stock to common stock
|
(9,000 | ) | (9 | ) | 9,000 | 9 | - | - | - | - | ||||||||||||||||||||||
|
Stock compensation
|
- | - | - | - | 305,920 | - | - | 305,920 | ||||||||||||||||||||||||
|
Net loss
|
- | - | - | - | - | - | (12,013,011 | ) | (12,013,011 | ) | ||||||||||||||||||||||
|
Balances at December 31, 2012 (Restated)
|
6,234,846 | $ | 6,235 | 7,183,501 | $ | 7,184 | $ | 18,167,419 | $ | (276,326 | ) | $ | (12,776,688 | ) | $ | 5,127,824 | ||||||||||||||||
|
Conversion of redeemable preferred stock to preferred stock - Esenjay
|
555,556 | 556 | - | - | 1,249,444 | - | 1,250,000 |
|
Cashless exercise of warrants - preferred stock
|
47,059 | 47 | - | - | (47 | ) | - | - | - |
|
Conversion of preferred stock to common stock
|
(6,837,461 | ) | (6,838 | ) | 6,837,461 | 6,838 | - | - | - | - |
|
Issuance of common stock for cash
|
- | - | 3,250,000 | 3,250 | 6,278,517 | - | - | 6,281,767 |
|
Issuance of common stock in private placement for cash
|
- | - | 7,333,334 | 7,333 | 21,992,667 | (10,000,000 | ) | - | 12,000,000 |
|
Issuance of common stock for compensation
|
- | - | 1,522,418 | 1,522 | (1,522 | ) | - | - | - |
|
Issuance of common stock for services
|
- | - | 13,334 | 13 | 79,987 | - | 80,000 |
|
Issuance of common stock for oil and gas properties
|
- | - | 27,804 | 28 | 116,471 | (116,499 | ) | - | - |
|
Issuance of common stock to STXRA for payables settlement
|
- | - | 33,815 | 34 | 109,865 | - | - | 109,899 |
|
Rescission of exercise of common stock options
|
- | - | (120,710 | ) | (121 | ) | 121 | - | - | - |
|
Exercise of warrants for cash
|
- | - | 4,900 | 5 | 11,020 | - | - | 11,025 |
|
Fractional share issuance for reverse common stock split
|
- | - | 289 | - | - | - | - | - |
|
Warrants issued with bridge notes
|
- | - | 274,947 | - | - | 274,947 |
|
Warrants issued for extension of bridge notes
|
181,475 | - | - | 181,475 |
|
Cashless exercise of options
|
- | - | 34,916 | 35 | (35 | ) | - | - | - |
|
Stock subscription received from Condor
|
- | - | - | - | - | 392,825 | - | 392,825 |
|
Forfeiture of MIE's capital account in White Hawk
|
- | - | - | - | 124,301 | - | - | 124,301 |
|
Stock compensation
|
- | - | - | - | 3,198,240 | - | - | 3,198,240 |
|
Net loss
|
- | - | - | - | - | - | (18,145,463 | ) | (18,145,463 | ) | ||||||||||||||||||||||
|
Balances at December 31, 2013
|
- | $ | - | 26,121,062 | $ | 26,121 | $ | 51,782,870 | $ | (10,000,000 | ) | $ | (30,922,151 | ) | $ | 10,886,840 |
See accompanying notes to consolidated financial statements
F-5
PEDEVCO CORP.
(FORMERLY BLAST ENERGY SERVICES, INC.)
CONSOLIDATED STATEMENTS OF CASH FLOWS
For the Years Ended December 31, 2013 and 2012
|
December 31,
|
||||||||
|
2013
|
2012
|
|||||||
|
(Restated)
|
||||||||
|
Cash Flows From Operating Activities:
|
||||||||
|
Net loss
|
$
|
(18,145,463
|
)
|
$
|
(12,013,011
|
)
|
||
|
Adjustments to reconcile net loss to net cash used in operating activities:
|
||||||||
|
Stock based compensation expense
|
3,198,240
|
621,420
|
||||||
|
Impairment of goodwill
|
-
|
6,820,003
|
||||||
|
Impairment of oil and gas properties
|
2,945,903
|
180,262
|
||||||
| Impairment of expired leases | 356,900 | - | ||||||
|
Loss on oil and gas property acquisition deposit
|
200,000
|
-
|
||||||
|
Depreciation, depletion, amortization and accretion
|
437,040
|
131,692
|
||||||
|
Loss on settlement of payables
|
8,455
|
139,874
|
||||||
|
Gain on sale of equity method investments
|
-
|
(64,168
|
)
|
|||||
|
Loss from equity method investments
|
5,778,021
|
357,612
|
||||||
|
Amortization of debt discount
|
665,306
|
507,505
|
||||||
| Amortization of deferred financiang and costs | 72,095 | - | ||||||
|
Series A preferred stock issued for debt extension
|
-
|
280,001
|
||||||
|
Gain on debt extinguishment
|
-
|
(9,268
|
)
|
|||||
|
Gain on change in fair value of derivative
|
(14,005)
|
-
|
||||||
|
Changes in operating assets and liabilities:
|
|
|||||||
|
Accounts receivable – oil and gas
|
15,233
|
90,192
|
||||||
|
Accounts receivable – oil and gas – related party
|
65,412
|
-
|
||||||
|
Accounts receivable – related party
|
5,978
|
-
|
||||||
|
Prepaid expenses and other current assets
|
59,590
|
(94,532
|
)
|
|||||
|
Accounts payable
|
19,801
|
289,041
|
||||||
|
Accounts payable – related party
|
1,857,138
|
-
|
||||||
|
Accrued expenses
|
(652,120
|
) |
(40,966)
|
|||||
|
Accrued expenses – related party
|
863,592
|
-
|
||||||
|
Net cash used in operating activities
|
(2,262,884
|
)
|
(2,804,343
|
)
|
||||
|
Cash Flows From Investing Activities:
|
||||||||
|
Cash paid for oil and gas properties
|
(5,340,610
|
) |
(1,500,000
|
)
|
||||
|
Cash paid for drilling costs
|
(1,050,286
|
)
|
-
|
|||||
|
Cash paid for equipment
|
-
|
(1,358
|
)
|
|||||
|
Cash paid for acquisition of Blast Energy Services, Inc.
|
-
|
(454,614
|
)
|
|||||
|
Proceeds from sale of equity method investment
|
-
|
1,000,000
|
||||||
|
Cash paid for deposits on oil and gas properties
|
(200,000
|
)
|
-
|
|||||
|
Cash paid for deposit on acquisitions
|
(10,019,633
|
)
|
-
|
|||||
| Proceeds from acquisition of White Hawk | 91,114 | - | ||||||
| Proceeds from notes receivable | 342,181 | - | ||||||
|
Issuance of notes receivable – related parties
|
(4,020,279
|
)
|
(2,786,064
|
)
|
||||
|
Net cash used in investing activities
|
(20,197,513
|
)
|
(3,742,036
|
)
|
||||
|
Cash Flows From Financing Activities:
|
||||||||
|
Repayment of notes payable to related party
|
-
|
(200,000
|
)
|
|||||
|
Proceeds from stock subscription receivable
|
392,825
|
-
|
||||||
|
Proceeds from notes payable
|
2,950,000
|
-
|
||||||
|
Proceeds from issuance of notes payable to related party
|
5,050,000
|
1,028,287
|
||||||
|
Cash paid for deferred financing costs
|
(90,000)
|
-
|
||||||
|
Proceeds from issuance of common stock, net of offering costs
|
18,281,767
|
-
|
||||||
|
Proceeds from sales of Series A preferred stock
|
-
|
8,015,071
|
||||||
|
Proceeds from exercise of options for common stock
|
-
|
4,800
|
||||||
|
Proceeds from exercise of warrants for common stock
|
11,025
|
-
|
||||||
|
Net cash provided by financing activities
|
26,595,617
|
8,848,158
|
||||||
|
Net increase in cash
|
4,135,220
|
2,301,779
|
||||||
|
Cash at beginning of the year
|
2,478,250
|
176,471
|
||||||
|
Cash at end of the year
|
$
|
6,613,470
|
$
|
2,478,250
|
F-6
PEDEVCO CORP.
(FORMERLY BLAST ENERGY SERVICES, INC.)
CONSOLIDATED STATEMENTS OF CASH FLOWS
For the Years Ended December 31, 2013 and 2012 (Cont'd)
|
Supplemental disclosure of cash flow information
|
||||||||
|
Cash paid for:
|
||||||||
|
Interest
|
$ | - | $ | - | ||||
|
Income taxes
|
$ | - | $ | - | ||||
|
Noncash investing and financing activities:
|
||||||||
|
Accrual of drilling costs
|
$ | - | $ | 1,733,859 | ||||
| Accrual of unproved property acquisition costs | $ | 405,777 | $ | - | ||||
|
Transfer of unproved properties to proved properties
|
$ | - | $ | 697,016 | ||||
|
Asset retirement costs capitalized
|
$ | 1,446 | $ | 16,552 | ||||
|
Issuance of 555,556 shares of Series A preferred stock in exchange for acquisition of Excellong E&P-2, Inc.
|
$ | - | $ | 1,250,030 | ||||
|
Contribution of Excellong E&P-2, Inc. to White Hawk as equity investment
|
$ | - | $ | 3,734,986 | ||||
|
Cash paid on behalf of PEDEVCO to Excellong E&P-2, Inc. by MIE to acquire interest in White Hawk
|
$ | - | $ | 1,000,000 | ||||
|
Cash paid on behalf of PEDEVCO to Condor by MIE for drilling operations
|
$ | - | $ | 1,141,778 | ||||
|
Accrual of purchase adjustment for sale of White Hawk interest
|
$ | - | $ | 58,332 | ||||
|
Warrants issued to MIE for sale of White Hawk equity interests
|
$ | - | $ | 2,586 | ||||
|
Issuance of 76,667 shares of Series A preferred stock to settle payables
|
$ | - | $ | 172,500 | ||||
|
Conversion of Series A preferred stock to common stock
|
$ | 6,282 | $ | - | ||||
|
Conversion of redeemable preferred stock to common stock
|
$ | 556 | $ | - | ||||
|
Expiration of redemption feature in 555,556 shares of Series A preferred stock issued in acquisition of Excellong E&P-2, Inc.
|
$ | 1,250,000 | $ | - | ||||
|
Issuance of Series A convertible preferred stock in settlement of carried interest payable
|
$ | - | $ | 419,624 | ||||
|
Issuance of Series A convertible preferred stock to third party on behalf of Condor for oil and gas properties acquired
|
$ | - | $ | 276,326 | ||||
|
Issuance of preferred stock for cashless exercise of warrants
|
$ | 47 | $ | - | ||||
|
Issuance of common stock to settle payables
|
$ | 181,444 | $ | - | ||||
|
Conversion of Series A preferred stock to common stock
|
$ | - | $ | 27 | ||||
|
Issuance of common stock for convertible notes payable
|
$ | - | $ | 1,029,545 | ||||
|
Beneficial conversion feature associated with convertible debt
|
$ | - | $ | 667,418 | ||||
|
Cashless exercise of common stock options and warrants
|
$ | 35 | $ | 595 | ||||
|
Issuance of common stock to Esenjay in exchange for acquisition of Excellong E&P-2, Inc. on behalf of Condor
|
$ | 116,499 | $ | - | ||||
|
Rescission of common stock issued for exercise of stock options in 2012
|
$ | 121 | $ | - | ||||
|
Debt discount related to warrants issued in conjunction with notes payable
|
$ | 327,357 | $ | - | ||||
|
Debt discount related to warrants issued for extension of bridge notes
|
$ | 110,975 | $ | - | ||||
|
Deferred financing costs related to warrants issued in conjunction with notes payable
|
$ | 18,090 | $ | - | ||||
|
Fair value of derivative warrant instruments issued with notes payable
|
$ | 14,005 | $ | - | ||||
|
Reduction in notes receivable for the equity investment losses in excess of the Company's investment account
|
$ | 5,193,577 | $ | - | ||||
|
Consolidation of net assets and liabilities of equity investment in White Hawk:
|
$ | 1,638,191 | $ | - | ||||
| Forfeiture of White Hawk member’s capital account upon withdrawal | $ | 124,301 | $ | - | ||||
| Reduction in note receivable from Condor for MSL deposit owed to Condor | $ | 432,433 | $ | - | ||||
| Payment in kind liability recorded as debt discount on bridge notes | $ | 480,000 | $ | - | ||||
| Payment in kind liability recorded as debt discount - related party on bridge notes | $ | 157,500 | $ | - |
See accompanying notes to consolidated financial statements
F-7
PEDEVCO CORP.
(FORMERLY BLAST ENERGY SERVICES, INC.)
NOTES TO CONSOLIDATED FINANCIAL STATEMENTS
The accompanying consolidated financial statements of PEDEVCO CORP., formerly Blast Energy Services, Inc. (“PEDEVCO” or the “Company”), have been prepared in accordance with accounting principles generally accepted in the United States of America (“GAAP”) and the rules of the Securities and Exchange Commission (“SEC”).
PEDEVCO’s primary business plan is: (i) engaging in the acquisition, exploration, development and production of oil and natural gas resources in the United States, primarily shale oil and natural gas and secondarily conventional oil and natural gas opportunities in the United States (U.S.), and (ii) utilizing the Company’s strategic relationships for acquisition, exploration, development and production in Asia, with a particular focus on China and Kazakhstan.
The Company’s principal operating properties are located in the Niobrara formation in the Denver-Julesburg Basin (the “DJ Basin”) in Morgan and Weld Counties, Colorado.
The Company owns a 20% interest in Condor Energy Technology, LLC (“Condor”). Condor’s operations consist primarily of working interests in oil and gas leases in the Niobrara shale formation located in the DJ Basin in Morgan and Weld Counties, Colorado. The remaining interest in Condor is owned by an affiliate of MIE Holdings Corporation (Hong Kong Stock Exchange code: 1555.HK), one of the largest independent upstream onshore oil companies in China (“MIE Holdings”). In addition, the Company has made a direct investment into the drilling of the first three wells that Condor has drilled.
As of December 31, 2013, the Company also owned an average 98% working interest in leases covering the Mississippian Lime located in Comanche, Harper, Barber and Kiowa Counties, Kansas. The Company serves as the operator of this asset and anticipates drilling its first well in the first half of 2014.
As of January 1, 2013, the Company owned a 50% interest in White Hawk Petroleum, LLC (“White Hawk”). White Hawk’s operations consist primarily of working interests in oil and gas leases in the Eagle Ford shale formation in McMullen County, Texas. The remaining interest in White Hawk was owned by an affiliate of MIE Holdings, MIE Jurassic Energy Corporation (“
MIEJ
”). On December 20, 2013, White Hawk entered into a series of transactions pursuant to which White Hawk divested approximately 50% of its assets and used the funds from the divestiture to acquire MIEJ’s interest in White Hawk. MIEJ then withdrew from White Hawk as a member on December 31, 2013, with the Company’s effective interests in the Eagle Ford shale assets remaining unchanged and unaffected by the transactions. As a result of the transactions, the Company became the 100% owner of White Hawk. See Note 5. Accordingly, as of December 31, 2013, the Company has accounted for White Hawk as a consolidated subsidiary of the Company and will no longer account for the entity as an equity investment. In addition, on February 19, 2014, White Hawk sold its remaining interests in the Eagle Ford Shale play for net proceeds of $2,718,158. See Note 19.
The Company plans to focus initially on developing shale oil and gas assets held by the Company in the U.S., including its first oil and gas working interests known as the “Niobrara Asset,” its oil and gas working interests known as the “Mississippian Asset,” and its recently acquired oil and gas working interests known as the “Wattenberg Asset,” which it acquired in March 2014 from Continental Resources, Inc. (“Continental). In addition, the Company has also entered into an agreement to acquire an approximate 51% ownership in Asia Sixth Energy Resources Limited (“Asia Sixth”), a British Virgin Islands entity, which holds an approximate 60% ownership interest in Aral Petroleum Capital Limited Partnership (“Aral”), a Kazakhstan entity. Aral holds a production license covering a 380,000 acre oil and gas producing asset located in the Pre-Caspian Basin in Kazakhstan, which the Company plans to close upon receipt of required approvals from the government of Kazakhstan, anticipated to be received no later than the third quarter of 2014. See Note 19. The Company plans to seek additional shale oil and gas and conventional oil and gas asset acquisition opportunities in the U.S. and Asia utilizing its strategic relationships and technologies that may provide the Company a competitive advantage in accessing and exploring such assets. Some or all of these assets may be acquired by subsidiaries, and equity investees such as Condor and White Hawk, or others that may be formed at a future date.
To further develop the business plan, in the first quarter of 2014, the Company entered into a financing transaction with investors to acquire the Wattenberg Asset and provide funding for the Company’s 2014 drilling plan. In connection with the transaction, the Company sold a portion of its interests to the parties to the transaction in its Mississippian Asset, its Wattenberg Asset and its interest in Asia Sixth. See Note 19.
F-8
Basis of Presentation and Principles of Consolidation.
The consolidated financial statements herein have been prepared in accordance with GAAP and include the accounts of the Company and those of its wholly-owned subsidiaries as follows: (i) Eagle Domestic Drilling Operations LLC, a Texas limited liability company (which was voluntarily dissolved effective July 10, 2013); (ii) Blast AFJ, Inc., a Delaware corporation; (iii) Pacific Energy Development Corp., a Nevada corporation; (iv) Pacific Energy Technology Services, LLC, a Nevada limited liability company; (v) Pacific Energy & Rare Earth Limited, a Hong Kong company; (vi) Blackhawk Energy Limited, a British Virgin Islands company; (vii) Pacific Energy Development MSL, LLC, a Nevada limited liability company, and (viii) as of December 31, 2013, White Hawk Petroleum, LLC, a Nevada limited liability company. All significant intercompany accounts and transactions have been eliminated. We also own 100% of Red Hawk Petroleum, LLC, a Nevada limited liability company, which was formed on January 16, 2014. As of March 7, 2014, we only held 50% of Pacific Energy Development MSL, LLC. All significant intercompany accounts and transactions have been eliminated.
Equity Method Accounting for Joint Ventures
. The majority of the Company’s oil and gas interests are held all or in part by the following joint ventures which are collectively owned with affiliates of MIE Holdings:
- Condor Energy Technology LLC, a Nevada limited liability company owned 20% by the Company and 80% by an affiliate of MIE Holdings. The Company accounts for its 20% ownership in Condor using the equity method; and
- White Hawk Petroleum, LLC, a Nevada limited liability company owned 50% by the Company and 50% by an affiliate of MIE Holdings through December 30, 2013. Through December 30, 2013, the Company accounted for its 50% interest in White Hawk using the equity method. As a result of a series of transactions pursuant to which MIEJ divested its 50% interest in White Hawk as of December 31, 2013, described in greater detail in Note 5, White Hawk became a consolidated subsidiary effective on December 31, 2013.
The Company evaluated its relationship with Condor and White Hawk to determine if either qualified as a variable interest entity ("VIE"), as defined in ASC 810-10, and whether the Company is the primary beneficiary, in which case consolidation would be required. The Company determined that both Condor and White Hawk qualified as VIE’s, but since the Company is not the primary beneficiary of either Condor or White Hawk, the Company concluded that consolidation was not required during 2013 for either entity (though White Hawk was consolidated as of December 31, 2013 following MIEJ’s withdrawal).
Use of Estimates in Financial Statement Preparation.
The preparation of financial statements in conformity with GAAP requires management to make estimates and assumptions that affect the reported amounts of assets, liabilities, revenues and expenses, as well as certain financial statement disclosures. While management believes that the estimates and assumptions used in the preparation of the financial statements are appropriate, actual results could differ from these estimates. Significant estimates generally include those with respect to the amount of recoverable oil and gas reserves, the fair value of financial instruments, oil and gas depletion, asset retirement obligations, and stock-based compensation.
Cash and Cash Equivalents.
The Company considers all highly liquid investments with original maturities of three months or less to be cash equivalents. As of December 31, 2013 and 2012, cash equivalents consisted of money market funds and cash on deposit.
Concentrations of Credit Risk.
Financial instruments which potentially subject the Company to concentrations of credit risk include cash deposits placed with financial institutions. The Company maintains its cash in bank accounts which, at times, may exceed federally insured limits as guaranteed by the Federal Deposit Insurance Corporation (FDIC). At December 31, 2013, approximately $6,272,356 of the Company’s cash balances were uninsured. The Company has not experienced any losses on such accounts.
Sales to three customers comprised 53%, 23% and 19% of the Company’s total oil and gas revenues for the year ended December 31, 2013. Sales to two customers comprised 71% and 29% of the Company’s total oil and gas revenues for the year ended December 31, 2012. The Company believes that, in the event that its primary customers are unable or unwilling to continue to purchase the Company’s production, there are a substantial number of alternative buyers for its production at comparable prices.
Accounts Receivable.
Accounts receivable typically consist of oil and gas receivables. The Company has classified these as short-term assets in the balance sheet because the Company expects repayment or recovery within the next 12 months. The Company evaluates these accounts receivable for collectability considering the results of operations of these related entities and when necessary records allowances for expected unrecoverable amounts. To date, no allowances have been recorded.
Revenue Recognition.
All revenue is recognized when persuasive evidence of an arrangement exists, the service or sale is complete, the price is fixed or determinable and collectability is reasonably assured. Revenue is derived from the sale of crude oil and natural gas. Revenue from crude oil and natural gas sales is recognized when the product is delivered to the purchaser and collectability is reasonably assured. The Company follows the “sales method” of accounting for oil and natural gas revenue, so it recognizes revenue on all natural gas or crude oil sold to purchasers, regardless of whether the sales are proportionate to its ownership in the property. A receivable or liability is recognized only to the extent that the Company has an imbalance on a specific property greater than its share of the expected remaining proved reserves. If collection is uncertain, revenue is recognized when cash is collected.
F-9
Equipment.
Equipment is stated at cost less accumulated depreciation and amortization. Maintenance and repairs are charged to expense as incurred. Renewals and betterments which extend the life or improve existing equipment are capitalized. Upon disposition or retirement of equipment, the cost and related accumulated depreciation are removed and any resulting gain or loss is reflected in operations. Depreciation is provided using the straight-line method over the estimated useful lives of the assets, which are 3 to 10 years.
Deferred Property Acquisition Costs.
The Company defers the costs, such as title and legal fees, related to oil and gas property acquisitions. At the time the acquisition is completed, these costs are reclassified and included as part of the purchase price of the property acquired. To the extent a property acquisition is not consummated these costs are expensed.
Oil and Gas Properties, Successful Efforts Method.
The successful efforts method of accounting is used for oil and gas exploration and production activities. Under this method, all costs for development wells, support equipment and facilities, and proved mineral interests in oil and gas properties are capitalized. Geological and geophysical costs are expensed when incurred. Costs of exploratory wells are capitalized as exploration and evaluation assets pending determination of whether the wells find proved oil and gas reserves. Proved oil and gas reserves are the estimated quantities of crude oil and natural gas which geological and engineering data demonstrate with reasonable certainty to be recoverable in future years from known reservoirs under existing economic and operating conditions, (i.e., prices and costs as of the date the estimate is made). Prices include consideration of changes in existing prices provided only by contractual arrangements, but not on escalations based upon future conditions.
Exploratory wells in areas not requiring major capital expenditures are evaluated for economic viability within one year of completion of drilling. The related well costs are expensed as dry holes if it is determined that such economic viability is not attained. Otherwise, the related well costs are reclassified to oil and gas properties and subject to impairment review. For exploratory wells that are found to have economically viable reserves in areas where major capital expenditure will be required before production can commence, the related well costs remain capitalized only if additional drilling is under way or firmly planned. Otherwise the related well costs are expensed as dry holes.
Exploration and evaluation expenditures incurred subsequent to the acquisition of an exploration asset in a business combination are accounted for in accordance with the policy outlined above.
Depreciation, depletion and amortization of capitalized oil and gas properties is calculated on a field by field basis using the unit of production method. Lease acquisition costs are amortized over the total estimated proved developed and undeveloped reserves and all other capitalized costs are amortized over proved developed reserves.
Impairment of Long-Lived Assets.
The Company reviews the carrying value of its long-lived assets annually or whenever events or changes in circumstances indicate that the historical cost-carrying value of an asset may no longer be appropriate. The Company assesses recoverability of the carrying value of the asset by estimating the future net undiscounted cash flows expected to result from the asset, including eventual disposition. If the future net undiscounted cash flows are less than the carrying value of the asset, an impairment loss is recorded equal to the difference between the asset’s carrying value and estimated fair value.
Asset Retirement Obligations.
If a reasonable estimate of the fair value of an obligation to perform site reclamation, dismantle facilities or plug and abandon wells can be made, the Company will record a liability (an asset retirement obligation or “ARO”) on its consolidated balance sheet and capitalize the present value of the asset retirement cost in oil and gas properties in the period in which the retirement obligation is incurred. In general, the amount of an ARO and the costs capitalized will be equal to the estimated future cost to satisfy the abandonment obligation assuming the normal operation of the asset, using current prices that are escalated by an assumed inflation factor up to the estimated settlement date, which is then discounted back to the date that the abandonment obligation was incurred using an assumed cost of funds for the Company. After recording these amounts, the ARO will be accreted to its future estimated value using the same assumed cost of funds and the capitalized costs are depreciated on a unit-of-production basis over the estimated proved developed reserves. Both the accretion and the depreciation will be included in depreciation, depletion and amortization expense on our consolidated statements of operations.
Income Taxes.
The Company utilizes the asset and liability method in accounting for income taxes. Under this method, deferred tax assets and liabilities are recognized for operating loss and tax credit carry-forwards and for the future tax consequences attributable to differences between the financial statement carrying amounts of existing assets and liabilities and their respective tax bases. Deferred tax assets and liabilities are measured using enacted tax rates expected to apply to taxable income in the year in which those temporary differences are expected to be recovered or settled. The effect on deferred tax assets and liabilities of a change in tax rates is recognized in the results of operations in the period that includes the enactment date. A valuation allowance is recorded to reduce the carrying amounts of deferred tax assets unless it is more likely than not that the value of such assets will be realized.
F-10
Stock-Based Compensation.
We utilize the Black-Scholes option pricing model to estimate the fair value of employee stock option awards at the date of grant, which requires the input of highly subjective assumptions, including expected volatility and expected life. Changes in these inputs and assumptions can materially affect the measure of estimated fair value of our share-based compensation. These assumptions are subjective and generally require significant analysis and judgment to develop. When estimating fair value, some of the assumptions will be based on, or determined from, external data and other assumptions may be derived from our historical experience with stock-based payment arrangements. The appropriate weight to place on historical experience is a matter of judgment, based on relevant facts and circumstances.
The Company estimates volatility by considering the historical stock volatility. The Company has opted to use the simplified method for estimating expected term, which is generally equal to the midpoint between the vesting period and the contractual term.
E
arnings or Loss per Common Share.
Basic earnings per common share equal net earnings or loss divided by weighted average common shares outstanding during the period. Diluted earnings per share include the impact on dilution from all contingently issuable shares, including options, warrants and convertible securities. The common stock equivalents from contingent shares are determined by the treasury stock method. The Company incurred net losses for the years ended December 31, 2013 and 2012, and therefore, basic and diluted earnings per share for those periods are the same as all potential common equivalent shares would be anti-dilutive. The Company excluded 1,404,724 and 1,218,206 potentially issuable shares of common stock related to options and 3,053,370 and 633,631 potentially issuable shares of common stock related to warrants due to their anti-dilutive effect for the years ended December 31, 2013 and 2012, respectively.
Derivative Liability.
The Company follows Financial Accounting Standards Board (“FASB”),
Derivatives and Hedging
(“ASC 815-40”), which limits the extent to which the conversion or exercise price (the “strike price”) of an instrument can be adjusted for subsequent transactions. The Company utilizes a two-step process to determine whether an instrument is indexed to its stock: (a) evaluate the instrument’s contingent exercise provisions, if any and (b) evaluate the instrument’s settlement provisions. If it is determined the instrument is not indexed to the Company’s stock, the instrument is recognized as a derivative instrument at issuance and is measured at fair value at each reporting period and the change is recorded in earnings.
Fair Value of Financial Instruments.
The Company follows FASB ASC 820,
Fair Value Measurement
(“ASC 820”), which clarifies fair value as an exit price, establishes a hierarchal disclosure framework for measuring fair value, and requires extended disclosures about fair value measurements. The provisions of ASC 820 apply to all financial assets and liabilities measured at fair value.
As defined in ASC 820, fair value, clarified as an exit price, represents the amount that would be received to sell an asset or paid to transfer a liability in an orderly transaction between market participants. As a result, fair value is a market-based approach that should be determined based on assumptions that market participants would use in pricing an asset or a liability.
As a basis for considering these assumptions, ASC 820 defines a three-tier value hierarchy that prioritizes the inputs used in the valuation methodologies in measuring fair value.
|
Level 1 – Quoted prices in active markets for identical assets or liabilities.
|
|
|
Level 2 – Inputs other than Level 1 that are observable, either directly or indirectly, such as quoted prices for similar assets or liabilities, quoted prices in markets that are not active, or other inputs that are observable or can be corroborated by observable market data for substantially the full term of the assets or liabilities.
|
|
|
Level 3 – Unobservable inputs that are supported by little or no market activity and that are significant to the fair value of the assets or liabilities.
|
The fair value hierarchy also requires an entity to maximize the use of observable inputs and minimize the use of unobservable inputs when measuring fair value.
Recently Issued Accounting Pronouncements.
There were various accounting standards and interpretations issued during 2013 and 2011, none of which are expected to have a material impact on the Company’s financial position, operations or cash flows.
In July 2012 the FASB issued ASU 2012-02
Testing Indefinite-Lived Intangible Assets for Impairment
, which amends Topic 350 and gives companies the option first to assess qualitative factors to determine whether the existence of events and circumstances indicates that it is more likely than not that the indefinite-lived intangible asset is impaired. If, after assessing the totality of events and circumstances, an entity concludes that it is not more likely than not that the indefinite-lived intangible asset is impaired, then the entity is not required to take further action. However, if an entity concludes otherwise, then it is required to determine the fair value of the indefinite-lived intangible asset and perform the quantitative impairment test by comparing the fair value with the carrying amount in accordance with Topic 350-30. This ASU shall be applied prospectively for annual and interim impairment tests performed for fiscal years beginning after September 15, 2012 and early adoption is permitted. Implementation of the ASU is not expected to have a significant impact on the Company’s consolidated financial statements.
Subsequent Events.
The Company has evaluated all transactions through the date the consolidated financial statements were issued for subsequent event disclosure consideration.
F-11
On July 27, 2012, the Company completed the transactions contemplated by the January 13, 2012, Agreement and Plan of Reorganization (as amended, the “Merger Agreement”), between the Company, Blast Acquisition Corp., a wholly-owned Nevada subsidiary of the Company (“MergerCo”), and Pacific Energy Development Corp., a privately-held Nevada corporation (“PEDCO” or “Pacific Energy Development Corp.”).
Pursuant to the Merger Agreement on July 27, 2012, MergerCo was merged with and into PEDCO, with PEDCO continuing as the surviving entity and becoming a wholly-owned subsidiary of the Company, in a transaction structured to qualify as a tax-free reorganization (the “Merger”). In connection with the Merger, the Company issued former security holders of PEDCO 5,972,421 shares of common stock, 6,538,892 shares of new Series A Preferred Stock, warrants to purchase an aggregate of 373,334 shares of our common stock, warrants to purchase 230,862 shares of our new Series A Preferred Stock, and options to purchase 1,411,667 shares of the Company’s common stock. As the merger was accounted for as a reverse acquisition, these shares have been reflected as the historical equity of the Company as the accounting acquirer in the recapitalization.
Additionally, immediately prior to the Merger becoming effective, the shareholders of the Company approved an Amended and Restated Certificate of Formation and an Amended and Restated Series A Convertible Preferred Stock Designation which upon effectiveness: (i) converted all 2,000,000 outstanding shares of the Company’s Series A Convertible Preferred Stock and the single outstanding share of Series B Preferred Stock into 2,000,001 shares of common stock of the Company on a one to one basis, and immediately thereafter, (ii) effected a one for one hundred and twelve (1:112) reverse stock split rounding up for all fractional shares of the Company’s then outstanding common stock, resulting in the conversion of approximately 159,238,556 shares of preferred and common stock into 474,291 shares of common stock (the “Reverse Split” and the “Amended and Restated Certificate of Formation”). All share and per share amounts in the consolidated financial statements and footnotes have been retroactively restated for the impact of the reverse split and the 1-for-3 reverse stock split of our common and preferred stock that was effected on April 23, 2013.
Furthermore, in connection with the Reverse Split and the Amended and Restated Certificate of Formation, the Company changed its name to “PEDEVCO Corp.”, and amended its Certificate of Formation, to effect various changes to its Certificate of Formation, including, but not limited to increasing the Company’s authorized capitalization to 300,000,000 shares of capital stock post-Reverse Split, which includes 200,000,000 shares of common stock, $0.001 par value per share (“Common Stock”); and 100,000,000 authorized shares of Preferred Stock, including 25,000,000 authorized shares of Series A Convertible Preferred Stock, $0.001 par value per share ("New Series A Preferred Stock"), which shares were designated in connection with approval of and filing of the Amended and Restated Certificate of Designations of the Company’s Series A Convertible Preferred Stock, which amended and replaced the prior designation of the Company’s Series A Convertible Preferred Stock (which shares were automatically converted into shares of common stock pursuant to the Amended and Restated Certificate of Formation).
The acquisition was accounted for as a “reverse acquisition,” and Pacific Energy Development Corp. was deemed to be the accounting acquirer in the acquisition. The Company’s assets and liabilities are recorded at their fair value. Pacific Energy Development Corp.'s assets and liabilities are carried forward at their historical costs. The financial statements of Pacific Energy Development Corp. are presented as the continuing accounting entity since it is the acquirer for the purpose of applying purchase accounting. The equity section of the balance sheet and earnings per share of Pacific Energy Development Corp. are retroactively restated to reflect the effect of the exchange ratio established in the Merger Agreement. Goodwill is recorded for the excess of fair value of consideration transferred and fair value of net assets. As a result of the issuance of the shares of common stock pursuant to the Merger Agreement, a change in control of the Company occurred.
The purchase price on the date of acquisition was:
|
Value of stock issued in acquisition
|
$
|
4,492,225
|
||
|
Cash advanced from PEDCO prior to merger
|
507,757
|
|||
|
Merger expenses
|
36,841
|
|||
|
Total Purchase Price
|
$
|
5,036,823
|
||
|
Current assets
|
978
|
|||
|
Fixed assets
|
112,089
|
|||
|
Oil and gas properties
|
127,088
|
|||
|
Current liabilities
|
(646,787
|
)
|
||
|
Asset retirement obligations assumed
|
(41,712
|
)
|
||
|
Long-term liabilities
|
(1,334,836
|
)
|
||
|
(1,783,180
|
)
|
|||
|
Goodwill
|
$
|
6,820,003
|
F-12
Management evaluated the amount of goodwill associated with the transaction following the allocation of fair value to the assets and liabilities acquired and determined that the goodwill should be fully impaired and has reflected the impairment on the statement of operations as of the date of the merger.
Centurion Debt Modifications
In connection with the anticipated Merger, on January 13, 2012, Blast entered into an amendment to note purchase agreement (the “Note Purchase Amendment”), with Centurion Credit Funding LLC (“Centurion”), a secured creditor of Blast, and on May 29, 2012, Blast entered into the Second Amendment to First Tranche Promissory Note and the Second Amendment to the Second Tranche Promissory Note (collectively, the “Second Amendments to the Promissory Notes”) with Centurion. The Note Purchase Amendment and the Second Amendments to the Promissory Notes amended the Note Purchase Agreement, dated February 24, 2011 (the “Note Purchase Agreement”), entered into with Centurion primarily in order (i) to grant consent to the Merger, (ii) to waive, solely with respect to the Company post-Merger, certain loan covenants and restrictions as they relate to the assets of PEDCO and the operations of the Company post-Merger, (iii) to waive Centurion’s right of first refusal to provide additional funding to Blast, and (iv) to provide for the conversion of up to 50% of the loan amounts outstanding to Centurion in the original principal amount of $2,522,111, of which approximately $1,306,078 was owed as of the date of the parties’ entry into the Note Purchase Amendment, into shares of the Company’s common stock at $2.25 per share at the option of Centurion at any time after June 9, 2012, provided that the Company in its sole discretion may waive the 50% conversion limitation. The conversion rights described above are subject to Centurion being prohibited from converting any portion of the outstanding notes which would cause it to beneficially own more than 4.99% of the Company’s then outstanding shares of common stock, subject to Centurion’s right to increase such limit to up to 9.99% of the Company’s outstanding shares with 61 days prior written notice to the Company.
The Promissory Notes issued in connection with the Note Purchase Amendment were amended to provide an extension of the maturity date of such Promissory Notes, which were due February 2, 2012 under the terms of the original notes, to the earlier of (i) thirty (30) days after the termination of the Merger Agreement, if the Merger Agreement s terminated before June 1, 2012, (ii) August 1, 2012, or (iii) the date all obligations and indebtedness under such Promissory Notes are accelerated in accordance with the terms and conditions of such Promissory Notes. Furthermore, commencing February 2, 2012, the interest amount on the Promissory Notes was increased from 10% to 18% per annum, and the new interest rate included both the principal amount and the Exit Fee payable described below. Lastly, the Exit Fee, which is 12% of the repayment amount, was increased by an aggregate of $15,000 for the Promissory Notes and was expensed by Blast at the date of modification.
On August 30, 2012, following the Merger, the Company entered into the Third Amendment to Senior Secured Promissory Notes (First and Second Tranche) with Centurion (the “Third Amendment to the Promissory Notes”), which amended certain provisions of the Senior Secured Promissory Note (First Tranche) and Senior Secured Promissory Note (Second Tranche), each originally dated February 24, 2011 and amended on January 13, 2012 and May 29, 2012 (together, as amended, the “Promissory Notes”). The Promissory Notes were amended to provide an extension of the maturity date which were due as of August 1, 2012, to the earlier of (i) November 30, 2012, or (ii) the date all obligations and indebtedness under such Promissory Notes are accelerated in accordance with the terms and conditions of such Promissory Notes. The Company further agreed to deposit an additional $700,000 as a “repayment deposit” into the Company’s bank account that was subject to a deposit account control agreement (the “DACA”) between the Company and Centurion in order to provide additional security to Centurion with the DACA being revised to provide that Centurion may not have access to such funds until the maturity date of such Promissory Notes, unless a default or event of default has occurred. Additionally, the Third Amendment to the Promissory Notes removed the prior prohibition which limited Centurion to converting the Promissory Notes only once every thirty days.
The Company applied ASC 470-50-40/55 “Debtor’s Accounting for a Modification or Exchange of Debt Instrument” and concluded that the Note Purchase Amendment dated January 13, 2012 constituted a debt extinguishment rather than a debt modification because a significant conversion feature was added to the terms of the note. The conversion feature was contingent on the completion of the Merger. As such, the Company’s Merger with Blast triggered the contingent conversion feature. As a result, the Company recorded a loss on debt extinguishment of $159,913 during the year ended December 31, 2012, as summarized below.
|
Loss on Extinguishment:
|
||||
|
Estimated fair value of debt after modification
|
$
|
1,494,749
|
||
|
Less: Carrying value of pre-modification debt
|
(1,334,836
|
)
|
||
|
Loss on debt extinguishment
|
$
|
159,913
|
||
F-13
In connection with the Note Purchase Amendment, the convertible debenture was also analyzed for a beneficial conversion feature after the debt modification at which time it was concluded that a beneficial conversion feature existed. Accordingly, a debt discount was recorded at the date of the modification. See detail summary below for carrying value of debt on the date of the merger.
|
Post-Modification Debt:
|
||||
|
Estimated fair value of debt after modification
|
$
|
1,494,749
|
||
|
Less: beneficial conversion feature recorded as debt discount
|
(667,418
|
)
|
||
|
Carrying value at date of Merger
|
$
|
827,331
|
||
On August 31, 2012, Centurion converted $101,250 of principal and accrued interest, into 45,000 shares of the Company’s common stock. In October 2012, Centurion converted $536,250 of principal into 238,334 shares of the Company’s common stock. In November 2012, Centurion converted $392,045 of principal into 174,242 shares of the Company’s common stock. Centurion forgave the principal and interest balance of $169,181 and the balance owed Centurion at December 31, 2012 was paid in full. See detail summary below of loan activity and balance as of December 31, 2012.
|
Carrying value at merger
|
$
|
827,331
|
||
|
Accrued interest
|
75,699
|
|||
|
Accretion of beneficial conversion feature recorded as debt discount
|
667,418
|
|||
|
Less: amortization of debt premium
|
(159,913
|
)
|
||
|
Less: Principal and accrued interest of convertible note converted to common stock
|
(1,029,545
|
)
|
||
|
Less: Cash payments on principal
|
(211,809
|
)
|
||
|
Balance of note forgiven by Centurion
|
(169,181
|
)
|
||
|
Balance at December 31, 2012
|
$
|
-0-
|
The Company recorded a gain on debt extinguishment in the amount of $169,181 which was netted against loss on extinguishment in the amount of $159,913 resulting in a net gain of $9,268.
Prior to the Merger, as additional security for the repayment of the First Note and Second Note, and pursuant to a Stock Purchase Agreement, the Company sold Centurion one (1) share of its newly designated Series B Preferred Stock, in consideration for $100, which entitled Centurion to consent to and approve the Company’s or any of its subsidiaries’ entry into any bankruptcy proceeding, consent to the appointment of a receiver, liquidator or trustee or the assignment by the Company or any of its subsidiaries for the benefit of any creditors. The Company assigned no value to this Series B Preferred Share. The one share of the Company’s Series B Preferred Stock was converted on a one-for-one basis into one (1) share of the Company’s pre-Reverse Split common stock in connection with the Merger.
Other Debt Conversions
In connection with the Merger, the Company approved the conversion of certain other outstanding debt obligations of the Company at $6.72 per share. At the time of the Mergers these debt obligations included: $335,500 of accrued compensation due to the members of Board of Directors, $6,150 of short term loans from members of the Board of Directors, $225,958 of accrued salaries and vacation pay owed to the Company’s employees for a total amount of $567,608. These amounts were converted at $6.72 per share under debt conversion agreements (“Debt Conversion Agreements”) into approximately 84,465 shares of the Company’s common stock in August and September 2012. Additionally, in May 2012, pursuant to a settlement agreed upon among the Company, Trident Partners Ltd. (“Trident”), and certain principals for Trident, the placement fee owed by the Company to Trident was reduced from $119,990 to $47,960 and Trident agreed to convert the remaining amount due at $6.72 per share into approximately 7,143 shares of the Company’s common stock upon completion of the Merger.
F-14
The following tables summarize the Company’s oil and gas activities by classification for the years ended December 31, 2013 and 2012:
|
January 1,
2013
|
Additions
|
Disposals
|
Transfers
|
December 31,
2013
|
||||||||||||||||
|
Oil and gas properties subject to amortization
|
$ |
2,479,535
|
$ |
3,834,509
|
$ |
-
|
$ |
-
|
$ |
6,314,044
|
||||||||||
|
Oil and gas properties not subject to amortization
|
1,105,645
|
6,060,912
|
-
|
-
|
7,166,557
|
|||||||||||||||
|
Asset retirement costs
|
16,552
|
11,529
|
-
|
-
|
28,081
|
|||||||||||||||
|
Accumulated depreciation, depletion and impairment
|
(255,662
|
)
|
(4,450,381
|
)
|
-
|
-
|
(4,706,043
|
)
|
||||||||||||
|
Total oil and gas properties, net
|
$ |
3,346,070
|
$ |
5,456,569
|
$ |
-
|
$ |
-
|
$ |
8,802,639
|
||||||||||
|
January 1,
2012
|
Additions
|
Disposals
|
Transfers
|
December 31,
2012
|
||||||||||||||||
|
Oil and gas properties subject to amortization
|
$ |
-
|
$ |
5,532,519
|
$ |
(3,750,000
|
)
|
$ |
697,016
|
$ |
2,479,535
|
|||||||||
|
Oil and gas properties not subject to amortization
|
1,724,234
|
78,427
|
-
|
(697,016
|
)
|
1,105,645
|
||||||||||||||
|
Asset retirement costs
|
-
|
16,552
|
-
|
-
|
16,552
|
|||||||||||||||
|
Accumulated depreciation, depletion and impairment
|
-
|
(270,676
|
)
|
15,014
|
-
|
(255,662
|
)
|
|||||||||||||
|
Total oil and gas properties, net
|
$ |
1,724,234
|
$ |
5,356,822
|
$ |
(3,734,986
|
)
|
$ |
-
|
$ |
3,346,070
|
|||||||||
The depletion recorded for production on properties subject to amortization for the years ended December 31, 2013 and 2012 amounted to $346,020 and $90,414, respectively. The Company recorded impairment of leases for the years ended December 31, 2013 and 2012 of $356,902 and $180,262, respectively, for lease acreage that expired during the year due to non-renewals or non-utilization of leases. The Company recorded impairment of properties subject to amortization for the years ended December 31, 2013 and 2012 of $2,945,903 and $0, respectively. The consolidation of White Hawk also added $801,556 of accumulated depletion and impairment for the year ended December 31, 2013.
During the year ended December 31, 2013, additions to oil and gas properties subject to amortization consisted of drilling and completion costs of $589,455 and $460,832 for the Logan 2H and Waves 1H wells and the addition of $2,784,222 related to the consolidation of White Hawk. During the year ended December 31, 2013, additions to oil and gas properties not subject to amortization consisted of the acquisition of the Mississippian asset of $5,287,367 described below, the addition of $734,370 related to the consolidation of White Hawk and $39,175 related to legal and title work performed on leases in our Niobrara assets.
During the year ended December 31, 2012, the Company began drilling operations on its Ford Family Trust 2H (“FFT2H”), Logan 2H and Waves 1H wells. The Company completed the FFT2H well in July 2012 and incurred $1,143,100 in drilling and completion costs. As of December 31, 2012, the Company has incurred $246,365 and $263,382 in drilling costs related to the Logan 2H and Waves 1H wells, respectively, which were completed subsequent to December 31, 2012. As a result of this drilling the Company reclassified $697,016 of the carrying value of the properties from properties not subject to amortization to properties subject to amortization. The Company acquired the Eagle Ford property for $3,750,000 in additions, and subsequently contributed the property to White Hawk (as a disposal for $3,750,000), for the year ended December 31, 2012.
Mississippian Asset
On February 22, 2013, Pacific Energy Development MSL, LLC (“PEDCO MSL”), a wholly-owned subsidiary of the Company, entered into an Agreement for Purchase of Term Assignment (the “Purchase Agreement”) with Berexco LLC (“Berexco”) for the acquisition of unproved oil and gas interests in the Mississippian Lime formation covering approximately 6,763 net acres located in Comanche, Harper, Barber and Kiowa Counties, Kansas (the “Mississippian Asset”) and approximately 10.5 square miles of related 3-D seismic data, for an aggregate purchase price of $4,207,117. Pursuant to the Purchase Agreement, Berexco applied $864,866 as the initial escrow deposit due from PEDCO MSL to Berexco in connection with a previously contemplated transaction between Condor and Berexco. The Company was obligated to Condor to refund the amount of $432,433 for the portion of the initial deposit previously paid by MIE Jurassic Holding Corporation (“MIEJ”) in connection with the previously contemplated transaction between Condor and Berexco. The $432,433 was subsequently paid in March 2014. The remaining $3,774,684 was paid in cash by the Company to Berexco in March 2013. The Company also capitalized $245,695 for legal fees and title work, $72,726 for additional costs (including $67,341 for acquiring an additional 122 acres) and $507,221 payable to South Texas Reservoir Alliance LLC (“STXRA”) for acquisition costs for total initial capitalized costs of approximately $5,032,760. The Company has subsequently capitalized an additional $254,607 of legal and other costs for the Mississippian property for a total cost of $5,287,367.
F-15
On March 25, 2013, PEDCO MSL completed the acquisition of the Mississippian asset, acquiring an average 98% working interest in the Mississippian Lime properties. PEDCO MSL serves as the operator of the asset.
The Mississippian acquisition is structured as a primary term assignment by the seller to PEDCO MSL of the leasehold interests which expire on December 29, 2014. If PEDCO MSL drills at least three (3) horizontal wells on these leasehold interests during this primary term, then PEDCO MSL has the option, in its sole discretion, to extend the primary term with respect to some or all of the leases subject to the assignment for an additional one (1) year period upon payment to the seller of an additional $200 per net acre covered by the leases upon which the option is exercised. If PEDCO MSL completes a commercially producing well during the primary or extended terms, then the seller shall assign such leases to PEDCO MSL for as long as the wells produce in paying quantities, with each horizontal well of at least 4,000 feet in length holding 320 acres covered by the leases, each short horizontal well with a length of between less than 4,000 feet and at least 2,000 feet in length holding 160 acres, and each vertical well holding 10 acres. The seller shall retain an overriding royalty interest equal to the positive difference, if any, obtained by subtracting existing leasehold burdens from 22.5% before payout and 25% after payout (reduced to the extent the seller assigns less than a 100% working interest to PEDCO MSL). For purposes of the Mississippian agreement, “payout” is defined as such time, on a well by well basis, when a well has sold the following specified barrels of oil equivalent (“BOE”), (utilizing a conversion factor for gas sales of 8 thousand cubic feet (Mcf) per 1 barrel of oil (bbl)): for a vertical well, ten thousand (10,000) BOE; for a short horizontal well, twenty-five thousand (25,000) BOE; and for a horizontal well, fifty thousand (50,000) BOE.
In connection with the closing of the Company’s acquisition of the Mississippian Asset, pursuant to a letter agreement with STXRA dated March 25, 2013, as amended, the Company is obligated to pay STXRA a completion fee of $507,221 (equal to $75.00 per net acre acquired in the Mississippian Asset (the “Completion Fee”)), based on the 6,763 net acres acquired, which is payable 80% in cash and 20% in the Company’s common stock, or $405,777 in cash and $101,444 in common stock (the “Equity Consideration”). The Company recorded an account payable and a corresponding asset to oil and gas properties, not subject to amortization on March 25, 2013 in the accompanying balance sheet for $507,221. STXRA originally identified the Mississippian Asset acquisition opportunity for the Company, and provided acquisition and due-diligence related consulting services to the Company, with their sole compensation being the Completion Fee.
The Company issued to STXRA 33,815 shares of common stock on July 11, 2013 valued at $109,899 on the grant date for the Equity Consideration. The Company recorded a loss on settlement payable of $8,455. On March 7, 2014, the remaining payable to STXRA was satisfied in full through the issuance to STXRA of 190,000 shares of common stock valued at $444,600 on the grant date and recognized a loss on settlement of payable of $38,823.
On March 7, 2014, the Company entered into a series of transactions and agreements with RJ Resources Corp. (“RJ Corp.”). The effective result of these transactions and agreements included the sale of 50% of the Company’s interests in the Mississippian Asset to RJ Corp. See Note 19.
Guijarral Hills Exploitation Project
In October 2010, Blast entered into Farmout Agreement with Solimar Energy LLC (“Solimar”), to participate in an exploration project in the Guijarral Hills Field located in the San Joaquin basin of central California. In 2011, an initial exploratory well (the “Solimar Well”) was drilled on the project, but the zones tested did not result in an oil-producing well. On August 6, 2012, Solimar notified its desire to assign the Solimar Well to Vintage Production California LLC (“Vintage”), the lessor of the well in return for payment of the salvage value of the equipment in the Solimar Well. The Company elected to give up its right to take over the well and all related plugging and abandonment obligations, and agreed to assign its interest in the well to Vintage. On October 1, 2013, the Company quitclaimed all of its right, title and interest in the Solimar Well to Vintage. In connection with the allocation of the purchase price in the Merger, no value was attributed to the Guijarral Project.
Acquisition of Eagle Ford Assets
On March 29, 2012, the Company acquired Excellong E&P-2, Inc., a Texas corporation for a total purchase price of $3.75 million. Excellong E&P-2’s sole asset was an approximately 8% working interest in certain oil and gas leases covering approximately 1,650 net acres in the Leighton Field located in McMullen County, Texas, which is currently producing oil and natural gas from the Eagle Ford shale formation (the “Eagle Ford Asset”). The purchase was accounted for as a business combination; however, the Company acquired no other assets or liabilities other than the working interests and tangible equipment associated with producing wells.
F-16
Upon acquisition in March 2012, this area was producing oil and natural gas from two wells, with the remainder of the acreage under development. The purchase price terms were:
|
Cash paid at closing
|
$
|
1,500,000
|
||
|
Loan payable
|
1,000,000
|
(1)
|
||
|
Series A Preferred Stock issued
|
1,250,000
|
(2)
|
||
|
Total purchase price
|
$
|
3,750,000
|
|
(1)
|
Payable in 60 days following the closing. The amount was paid in May 2012 by an affiliate of MIE Holdings as consideration for the White Hawk sale described below.
|
|
(2)
|
The Company issued 555,556 shares of Series A Preferred Stock at a grant date fair value of $1,250,000. In accordance with the purchase agreement, the Company has a contingent obligation to repurchase up to the full 555,556 shares of Series A Preferred Stock at a price per share of $2.25 in the event that, on March 29, 2013 (the date that is twelve months from the closing date), the market value of the stock is less than $1,250,000, and the sellers demand repurchase. Accordingly, the Company has determined that the shares are redeemable at the option of the holder and has classified the Preferred Stock outside of shareholders’ equity on the accompanying balance sheet.
|
The following table summarizes the allocation of the aggregate contribution as follows:
|
Asset:
|
Valuation
|
|||
|
Tangible equipment
|
$
|
147,000
|
||
|
Proved oil and gas reserves
|
2,958,936
|
|||
|
Unproved oil and gas leaseholds
|
629,050
|
|||
|
Total
|
$
|
3,734,986
|
||
On May 11, 2012, the Company merged its wholly-owned subsidiary, Excellong E&P-2, Inc. (“E&P-2”), into White Hawk Petroleum, LLC (“White Hawk”), a newly-formed Nevada limited liability company also wholly-owned by the Company (the “E&P-2 Merger”). The separate corporate existence of E&P-2 ceased as a result of the E&P-2 Merger. White Hawk then held all of the Eagle Ford Assets of the Company. The transaction among entities under common control was recorded at historical cost and no gain or loss was recognized. The assets transferred from E&P-2 to White Hawk amounted to $147,000 for tangible equipment and $2,958,936 for proved oil and gas reserves and $629,050 for unproved oil and gas leaseholds (total Eagle Ford E&P-2 property value of $3,734,986). The amount of production, depletion and depreciation between the acquisition date and the merger date was not material over this period.
On May 23, 2012, the Company completed the sale of 50% of the common stock of White Hawk (the “White Hawk Sale”) to an affiliate of MIE Holdings, which is also the Company’s 80% partner in Condor and a significant investor in the Company. As a result of the White Hawk Sale, an affiliate of MIE Holdings and the Company each had an equal 50% ownership interest in White Hawk and each agreed to proportionately share all expenses and revenues with respect to the Eagle Ford Asset. The sale price consideration for the White Hawk Sale by the affiliate of MIE Holdings was $1,939,082 as follows:
|
Cash received at closing
|
$
|
500,000
|
||
|
Cash received on June 29, 2012
|
500,000
|
|||
|
Payment to Excellong E&P-2
|
1,000,000
|
(1)
|
||
|
Total cash consideration
|
2,000,000
|
|||
|
Less: fair value of warrants issued at $3.75 per share
|
(1,586)
|
(2)
|
||
|
Less: fair value of warrants issued at $4.50 per share
|
(1,000)
|
(2)
|
||
|
Less: purchase price adjustment for net field income activity for March 2012 through sale date
|
(58,332)
|
(3)
|
||
|
Total sale price
|
$
|
1,939,082
|
|
(1)
|
$1.0 million in cash paid directly to the original sellers of E&P-2 on behalf of the Company on May 23, 2012, which was the amount due to such sellers 60 days following the acquisition;
|
|
(2)
|
On May 23, 2012, the Company issued 166,667 warrants valued at $1,586 to purchase common stock at $3.75 per share exercisable in cash for a period of two years and an additional 166,667 warrants valued at $1,000 to purchase common stock at $4.50 per share exercisable in cash for a period of two years; and
|
|
(3)
|
The effective date of the sale was March 1, 2012. Accordingly, production activity from the effective date until the closing date is reflected as a purchase price adjustment.
|
F-17
The following table summarizes the allocation of the aggregate sale price as follows:
|
Asset:
|
Valuation
|
|||
|
Tangible equipment
|
$
|
76,015
|
||
|
Proved oil and gas reserves
|
1,863,067
|
|||
|
Total
|
$
|
1,939,082
|
||
In connection with the White Hawk Sale, the Company recorded a gain of $64,168 representing the difference between the Company’s carrying value of the 50% interest sold ($1,875,000) and the fair value of the net sale proceeds received from MIE Holdings ($1,939,168).
The pro forma results of the White Hawk sale as if the transaction had occurred at January 1, 2012 is:
|
For the Year Ended
December 31, 2012
|
||||||||||||
|
PEDEVCO
|
E&P-2
|
Combined
|
||||||||||
|
Revenue
|
$
|
503,153
|
$
|
266,867
|
$
|
770,020
|
||||||
|
Lease operating costs
|
$
|
(281,103
|
)
|
$
|
(44,099
|
)
|
$
|
(325,202
|
)
|
|||
|
Net loss
|
$
|
(12,013,011
|
)
|
$
|
222,768
|
$
|
(11,790,243
|
)
|
||||
|
Net loss per common share
|
$
|
(0.65
|
)
|
$
|
0.02
|
$
|
(0.63
|
)
|
||||
White Hawk Acquisition
On December 20, 2013, White Hawk effected a two-step transaction to divest 50% of the assets held by White Hawk and acquire MIEJ’s interests in White Hawk from the proceeds of the sale.
On December 20, 2013, White Hawk sold 50% of its oil and gas properties to Millennial PDP Fund IV, LP (“Millennial”), a third party, pursuant to a Purchase and Sale Agreement (the “Sale Agreement”) for net proceeds of $2,654,602. The transaction was recorded as a sale of properties and White Hawk recorded a loss on sale of $161,712.
White Hawk used the proceeds of the sale plus 50% of White Hawk’s cash balance to pay MIEJ for its share of ownership in White Hawk and in settlement of the outstanding balance of its Promissory Note dated June 4, 2012 to MIEJ. MIEJ then withdrew from White Hawk as a member on December 31, 2013. As a result of the transactions, the Company became the 100% owner of White Hawk, and the Company recorded $124,301 of contributed capital from MIEJ.
Upon the completion of the redemption and withdrawal of MIEJ’s 50% interest in White Hawk on December 31, 2013, the Company became the sole member of White Hawk and the Company’s net ownership in the Eagle Ford shale assets held through White Hawk prior to the transactions remained unchanged and unaffected as a result of the transactions. Accordingly, as of December 31, 2013, the Company began accounting for White Hawk as a consolidated subsidiary of the Company and no longer accounts for the entity as an equity investment.
The following table summarizes the estimated fair values of the net assets recorded upon consolidation of White Hawk on December 31, 2013.
|
Fair value at December 31, 2013
|
||||
|
Current assets
|
$
|
202,068
|
||
|
Oil and gas properties, subject to amortization
|
1,995,640
|
|||
|
Oil and gas properties, not subject to amortization
|
734,370
|
|||
|
Total assets
|
2,932,078
|
|||
|
Current liabilities
|
21,430
|
|||
|
Note payable - PEDEVCO
|
1,257,996
|
|||
|
Asset retirement obligations
|
14,460
|
|||
|
Total liabilities
|
1,293,886
|
|||
|
Total fair value of net assets
|
$
|
1,638,192
|
As the Company gained control over White Hawk on December 31, 2013, the carrying value of the Company’s membership interest in White Hawk was remeasured to fair value in accordance with ASC 805,
Business Combinations.
The following table summarizes the carrying value and estimated fair value of the Company’s membership interest in White Hawk as of December 31, 2013 and the resulting loss on remeasurement of $515,314, which has been recognized in the loss from equity investment in the accompanying consolidated statements of operations:
|
Fair value at December 31, 2013
|
$
|
1,638,192
|
||
|
Carrying value of White Hawk membership interest
|
2,153,506
|
|||
|
Loss on remeasurement of equity method investment
|
$
|
(515,314
|
)
|
The fair value of the Company’s existing membership interest in White Hawk has been determined based on the subsequent sale of the oil and gas properties of White Hawk on February 19, 2014.
The Company did not record any revenues or expenses of White Hawk in its consolidated statements of operations as the transaction occurred on December 31, 2013. The following table presents the Company’s supplemental consolidated pro forma total revenues, lease operating costs, net income (loss) and net loss per common share as if the acquisition of White Hawk had occurred on January 1, 2013.
|
For the Year Ended
December 31, 2013
|
||||||||||||||||||||
|
PEDEVCO
|
White Hawk
|
(1) |
Combined
|
|||||||||||||||||
|
Revenue
|
$ | 743,656 | $ | 471,153 | $ | 1,214,809 | ||||||||||||||
|
Lease operating costs
|
$ | (648,462 | ) | $ | (86,128 | ) | $ | (734,590 | ) | |||||||||||
|
Net income (loss)
|
$ | (18,213,883 | )(2) | $ | (412,691 | )(3) | $ | (18,626,574 | ) | |||||||||||
|
Net loss per common share
|
$ | (1.07 | ) | $ | - | $ | (1.10 | ) | ||||||||||||
|
(1)
|
The revenues, lease operating expenses and net income presented for White Hawk represents the amounts attributable to the net assets acquired as of December 31, 2013 subsequent to the sale of 50% of the assets to Millennial.
|
|
(2)
|
Net loss of PEDEVCO was adjusted by $22,799 in interest income related to the note receivable held by PEDEVCO from White Hawk and loss from equity investment of $424,091 in White Hawk, that would have been eliminated upon consolidation of White Hawk.
|
|
(3)
|
Net loss of White Hawk was adjusted by $22,799 in interest expense related to the note receivable held by PEDEVCO from White Hawk, that would have been eliminated upon consolidation of White Hawk.
|
F-18
On February 19, 2014, White Hawk closed an agreement with Millennial PDP Fund IV, LP to sell its remaining interests in the Eagle Ford Shale assets to Millennial PDP Fund IV, LP for net proceeds of $2,718,158. See Note 19. The Company recognized no gain or loss on the disposition of oil and gas properties.
On September 16, 2013, the Company entered into a Share Subscription Agreement (“SSA”) to acquire an approximate 51% ownership in Asia Sixth, which holds an approximate 60% ownership interest in Aral. Aral holds a 100% operated working interest in a production license issued by the Republic of Kazakhstan that expires in 2034 in western Kazakhstan (the “Contract Area”). The Contract Area covers 380,000 acres within the North Block located in the Pre-Caspian Basin.
Under the SSA, the Company plans to acquire an interest in Aral through the acquisition of a 51% interest in Asia Sixth, by way of subscription of shares of Asia Sixth, which in turn currently holds a 60% controlling interest in Aral. Asia Sixth’s interest in Aral is scheduled to increase to 66.5% following the completion of certain transactions to occur between Asia Sixth and Asia Sixth’s partner in Aral that currently holds the remaining 40% interest in Aral (the “Aral Transactions”). Upon closing and completion of the Aral Transactions, Aral will be owned 66.5% by Asia Sixth.
The Company paid an initial deposit of $8 million in September 2013 and a subsequent deposit of $2 million in October 2013 to Asia Sixth, and was required to increase its deposit by up to $10 million to a total of $20 million contingent upon receipt of payment in full to the Company from an investor under a promissory note maturing in December 2013. The investor failed to pay the $10 million balance due under the Note by December 1, 2013, On December 1, 2013, the Company granted a verbal extension to the investor pending further discussions regarding the investment. Following discussions with the investor, the investor elected to forego making further investment. Accordingly, on March 7, 2014, the Company notified the investor that, effective immediately, the Escrowed Shares and Escrowed Warrants were rescinded as permitted pursuant to the terms of the Note, and the Note was cancelled and forgiven, with no further action required by the investor (the “Cancellation”). The stock subscription receivable related to 3,333,333 shares of common stock and 999,999 warrants for shares of common stock in the amount of $10 million was extinguished as of March 7, 2014. The rescission of the note has no net effect on us or our obligations under the Share Subscription Agreement because (a) if such note was paid in full we would have been required to pay such funds directly to Asia Sixth; and (b) the result of such funds not being paid only results in a decrease in the required deposit due to Asia Sixth.
The $10 million deposit is subject to full refund to the Company in the event the transaction does not close, other than as a result of the Company’s material uncured breach. These funds have been or will be used, in part, to recomplete and rework currently producing wells with the goal of significantly increasing their production rates. Based on how these wells perform, at closing, the Company shall owe to Asia Sixth a final closing payment equal to an additional: (i) $20 million if the daily average volume of oil produced by Aral over a specified 30 day period (the “Target Volume”) equals or exceeds 1,500 barrels of oil per day (“BOPD”); (ii) $15 million if the Target Volume equals or exceeds 1,000 BOPD but is less than 1,500 BOPD; or (iii) $0 due if the Target Volume comes in less than 1,000 BOPD.
Upon closing, the Company and the other shareholders of Asia Sixth will enter into a shareholders agreement, pursuant to which the shareholders will agree to certain restrictions on the transfer of their interests in Asia Sixth, certain pre-emption rights in the event a shareholder desires to transfer its interests in Asia Sixth, certain information rights, and certain other rights, including, but not limited to, certain management and control provisions, including: (i) the Company’s right to nominate two (2) of the five (5) directors of Asia Sixth, subject to the Company maintaining at least a 25% ownership of Asia Sixth; (ii) the Company’s right to nominate one (1) additional of the five (5) directors of Asia Sixth, subject to the Company maintaining at least a 51% ownership of Asia Sixth; (iii) the Company’s right to designate the Chairman of Asia Sixth from among its directors appointed to the Asia Sixth Board; and (iv) the appointment of two (2) of the Asia Sixth directors designated by the Company to the five (5) member Supervisory Council of Aral.
On March 7, 2014, the Company entered into a series of transactions and agreements with RJ Corp. The effective result of these transactions and agreements included the sale of 50% of the Company’s interest in the Aral Transactions. Pursuant to the Asia Sixth Purchase Agreement in March 2014 between RJ Corp. and the Company, RJ Corp. is obligated to pay 50% of any final closing payment due to Asia Sixth. See Note 19.
F-19
Property and equipment as of December 31, 2013 and, 2012 consisted of the following:
|
December 31,
|
December 31,
|
|||||||
|
2013
|
2012
|
|||||||
|
Computer equipment
|
$
|
6,714
|
$
|
6,714
|
||||
|
Tractor
|
-
|
-
|
||||||
|
Service trailer
|
-
|
-
|
||||||
|
AFJ Rig
|
112,089
|
112,089
|
||||||
|
Subtotal
|
118,803
|
118,803
|
||||||
|
Less:
|
||||||||
|
Accumulated depreciation
|
(118,803
|
)
|
(30,920
|
)
|
||||
|
Equipment, net
|
$
|
-
|
$
|
87,883
|
||||
The AFJ rig, tractor and service trailer were acquired in the Merger transaction. In connection with the Merger, the Company evaluated the carrying value of the AFJ rig and, based upon the independent third party analysis, recorded the estimated fair value of the AFJ rig at $112,089 at the date of the merger, reflecting a reduction in the carrying value at $254,000.
Depreciation expense for the year ended December 31, 2013 and the period from inception to December 31, 2012 was $87,884 and $30,258, respectively, and are included in operating expenses in the accompanying statement of operations.
Condor Energy Technology, LLC
The Company loaned Condor funds for operations pursuant to a promissory note entered into on February 14, 2013, with an effective date of November 1, 2012, which note permits multiple loans to be made thereunder up to $8,000,000 as separate “advances”. The note receivable bears interest at a rate per annum equal to the one (1) month LIBOR rate for U.S. dollar deposits plus four (4.0) percentage points. Principal and interest are due thirty-six (36) months from the date each advance is made under the note, with the first repayment being due September 24, 2015. As of December 31, 2013, the balance of the note receivable is $5,005,108 plus accrued interest of $188,469 due from Condor. As of December 31, 2013, there was $2,994,892 available to Condor to borrow under this agreement. Note receivable activity:
|
Date of Advance
|
Maturity Date
|
2013
|
2012
|
||||||
|
Balance as of beginning of year
|
$ | 1,419,253 | $ | - | |||||
|
September 24, 2012
|
September 24, 2015
|
- | 276,326 | ||||||
|
November 1, 2012
|
November 1, 2015
|
- | 1,142,927 | ||||||
|
January 4, 2013
|
January 4, 2016
|
1,297,038 | - | ||||||
|
January 11, 2013
|
January 11, 2016
|
1,011,250 | - | ||||||
|
June 30, 2013
|
June 30, 2016
|
134,479 | - | ||||||
|
July 31, 2013
|
July 31, 2016
|
203,088 | - | ||||||
|
December 31, 2013
|
December 31, 2016
|
940,000 | - | ||||||
|
Balance at end of year
|
$ | 5,005,108 | $ | 1,419,253 | |||||
The Company's share of Condor’s losses from operations in 2013 were greater than the residual value of the Company’s investment in Condor of $160,353. Accordingly, the carrying amount of the note receivable and accrued interest presented on the accompanying financial statements was reduced by $5,193,577 as a valuation allowance for the Company’s share of losses from Condor for the year ended December 31, 2013.
White Hawk Petroleum, LLC
The Company loaned White Hawk funds for operating expenses and drilling and completion costs for four additional Eagle Ford wells, pursuant to a promissory note entered into on June 4, 2012, which note permits multiple loans to be made thereunder as separate “advances”, with no stated maximum limit of loan principal. The note receivable bears interest at a rate per annum equal to the one (1) month LIBOR rate for U.S. dollar deposits plus four (4.0) percentage points. Principal and interest of each loan is due thirty-six (36) months from the date each advance is made under the note, with the first repayment being due June 4, 2015. As of December 31, 2013, the balance of the note receivable is $1,252,393. As of December 31, 2013, White Hawk became a wholly-owned subsidiary of the Company and this amount was eliminated in consolidation.
F-20
Condor Energy Technology, LLC
In October 2011, the Company formed a new subsidiary, Condor Energy Technology LLC (“Condor”), a limited liability company organized under the laws of the State of Nevada. The Company owns 20% of Condor and a subsidiary of MIE Holdings Corporation (“MIE Holdings”) owns 80%.
The Company accounts for its 20% ownership in Condor using the equity method. The Company evaluated its relationship with Condor to determine if Condor was a variable interest entity (“VIE”) as defined in ASC 810-10, and whether the Company was the primary beneficiary of Condor, in which case consolidation with the Company would be required. The Company determined that Condor qualified as a VIE, however, the Company concluded that MIE Holdings was the primary beneficiary as a result of being in control of the Board and its ability to control the funding commitments to Condor. The following table reflects the activity related to the equity investment:
|
December 31,
|
December 31,
|
|||||||
|
2013
|
2012
|
|||||||
|
Beginning balance
|
$
|
160,353
|
$
|
588,453
|
||||
|
Contributions
|
-
|
-
|
||||||
|
Equity in net loss at 20%
|
(5,353,930
|
)
|
(428,100
|
)
|
||||
|
Notes receivable from Condor
|
5,193,577
|
-
|
||||||
|
Ending balance
|
$
|
-
|
$
|
160,353
|
||||
As of December 31, 2013, the Company has a note receivable of $5,005,108 plus accrued interest of $188,469 due from Condor.
As of December 31, 2013, the Company has unrecognized losses of $272,637 in excess of its basis in Condor.
The Company is subject to recording its 20% proportionate share of Condor’s income or losses. The Company is obligated to maintain, under the membership agreement of Condor, its proportionate share of capital contributions. Below is summarized financial information for Condor.
Summarized balance sheets:
|
December 31,
|
December 31,
|
||||||
|
2013
|
2012
|
||||||
|
Current assets
|
$
|
4,224,369
|
$
|
5,182,717
|
|||
|
Oil and gas properties, net
|
3,533,915
|
9,742,120
|
|||||
|
Other long –term assets
|
108,000
|
1,078,220
|
|||||
|
Total assets
|
$
|
7,866,284
|
$
|
16,003,057 | |||
|
Current liabilities
|
$
|
3,708,123
|
$
|
2,952,710
|
|||
|
Notes payable to affiliates
|
31,477,643
|
12,240,161
|
|||||
|
Other long term liabilities
|
11,587
|
8,420
|
|||||
|
Total liabilities
|
35,197,353
|
15,201,291
|
|||||
|
Members’ equity (deficit)
|
(27,331,069
|
) |
801,766
|
||||
|
Total liabilities and members’ equity (deficit)
|
$
|
7,866,284
|
$
|
16,003,057
|
|||
F-21
Summarized statements of operations:
|
For the Year Ended December 31,
|
For the Year Ended December 31,
|
|||||||
|
2013
|
2012
|
|||||||
|
Revenue
|
$
|
4,779,966
|
$
|
653,802
|
||||
|
Lease operating expenses
|
(1,850,818
|
) |
(424,872
|
)
|
||||
|
Exploration costs
|
(365,938
|
) |
(759,857)
|
|||||
|
Selling, general and administrative expenses
|
(1,111,912
|
) |
(806,285)
|
|||||
|
Depletion
|
(2,679,676
|
) | (220,412 | ) | ||||
|
Impairment of oil and gas properties
|
(25,982,745
|
) |
(369,037
|
) | ||||
|
Interest expense
|
(921,712
|
) |
(213,839)
|
|||||
|
Net loss
|
$ |
(28,132,835
|
) | $ |
(2,140,500)
|
|||
The Company has an agreement to provide management services to Condor for which Condor owes $75,131 and $81,124 at December 31, 2013 and 2012, respectively. Total fees billed to Condor were $667,054 and $363,102 in 2013 and 2012, respectively.
Condor owes the Company $47,076 and $112,488 at December 31, 2013 and 2012, respectively, from production sales related to the Company’s working interests in the Niobrara Asset.
The Company owes Condor $59,448 and $112,069 from production related expenses and $2,278,266 and $802,614 related to capital expenditures incurred by Condor for the drilling of wells during the year ended December 31, 2013 and 2012, respectively.
The Company's 20% equity share of Condor's losses for the year ended December 31, 2013 were $5,626,567. These losses exceeded the Company's investment at risk of $160,353. In accordance with ASC 323-10-35, the Company recorded $5,193,577 of the excess losses against the Company's note receivable and accrued interest. The remaining excess of $272,637 attributable to the Company has not been recorded. Accordingly, any future investment in Condor by the Company or equity share of future net income in Condor's operations will be offset by the unrecorded excess losses.
White Hawk Petroleum, LLC
For all periods up to December 31, 2013, the Company accounted for its 50% ownership in White Hawk using the equity method. As a result of White Hawk’s series of transactions described in Note 5, on December 31, 2013, the Company began accounting for White Hawk as a consolidated subsidiary of the Company and no longer accounts for the entity as an equity investment.
The Company evaluated its relationship with White Hawk prior to the withdrawal of MIEJ to determine if White Hawk was a variable interest entity (“VIE”) as defined in ASC 810-10, and whether the Company was the primary beneficiary of White Hawk, in which case consolidation with the Company would have been required prior to December 31, 2013. The Company determined that White Hawk qualified as a VIE, however the Company concluded that MIE Holdings was the primary beneficiary as a result of its ability to control the funding commitments to White Hawk. The Company’s entire investment in White Hawk is at risk of loss. The following table reflects the activity related to the equity investment:
|
December 31, 2013
|
December 31,
2012
|
|||||
|
Beginning balance
|
$
|
1,937,981
|
$
|
3,734,986
|
||
|
Sale of equity investment
|
-
|
(1,867,493
|
)
|
|||
|
Equity in net earnings at 50%
|
91,223
|
70,488
|
||||
|
Forfeiture of MIE’s capital account recorded in additional paid-in capital
|
124,301
|
-
|
||||
| Remeasurement of equity method invesment upon consolidation | (515,314 | ) | - | |||
|
Consolidation of equity investment
|
(1,638,191)
|
-
|
||||
|
Ending balance
|
$
|
-
|
$
|
1,937,981
|
||
As of December 31, 2012, the Company had a note receivable of $332,974 plus accrued interest of $460 due from White Hawk. As of December 31, 2013, the Company had a note receivable of $1,252,393 plus accrued interest of $5,603 due from White Hawk, though this receivable was eliminated in consolidation following the withdrawal of MIEJ from White Hawk.
Bridge Note Financing
On March 22, 2013, the Company closed a private placement of secured promissory notes (the “Bridge Notes”) for an aggregate principal amount of $4.0 million, together with warrants exercisable for a total of up to 76,198 shares of its common stock at an exercise price of $5.25 per share (the “Bridge Warrants,” and, together with the Bridge Notes, the “Bridge Securities”). At the closing of the bridge financing (the “Bridge Financing”), the Company entered into separate Note and Warrant Purchase Agreements with a total of 16 individual and institutional investors (collectively, the “Bridge Investors”), including ten (10) current Company shareholders, in which the Company sold and issued to the Bridge Investors a total of $4.0 million of Bridge Notes and Bridge Warrants to purchase 76,198 shares of the Company’s common stock (the "Note and Warrant Purchase Agreements") for gross proceeds of $4.0 million. The fair value of the warrants was $256,857 which was recorded as a debt discount.
F-22
Frank C. Ingriselli, the Company’s President, Chief Executive Officer, and member of the Company’s Board of Directors, participated in the Bridge Financing, purchasing Bridge Notes of $1 million and receiving Bridge Warrants exercisable for 19,048 shares of the Company’s common stock, and Clark R. Moore, the Company’s Executive Vice President and General Counsel, purchased Bridge Notes of $50,000 and received Bridge Warrants exercisable for 953 shares of the Company’s common stock, respectively.
Somerley Limited (“Somerley”) acted as the Company’s placement agent with respect to a portion of the Bridge Financing sold to non-U.S. investors. As compensation, Somerley received total cash fees of $40,000 and Bridge Warrants to purchase a total of up to 9,524 shares of the Company’s common stock at an exercise price of $5.25 per share valued at $32,095 using a Monte Carlo simulation model. The Company capitalized these amounts as deferred financing costs and will be amortized over the expected life of the Bridge Financing as modified to July 31, 2014. Interest expense for the year ended December 31, 2013 was $69,984.
Terms of the Bridge Notes
The proceeds of the Bridge Financing were used by the Company for (i) the acquisition of the Mississippian asset; (ii) up to $300,000 to acquire an exclusive option to acquire leases and 3D seismic data in the Mississippian formation covering up to an additional 7,880 gross (7,043 net) acres located in Harper, Kiowa, Barber and Comanche Counties, Kansas, and Woods County, Oklahoma; (iii) the payment of placement agent fees; and (iv) general working capital expenses.
The Bridge Notes have an annual interest rate of 10% and are due and payable on the earlier to occur of (i) the date that is thirty (30) days following the closing of the Company’s next underwritten public offering of the Company’s common stock, or (ii) December 31, 2013 (the “Maturity Date”). The Company may, in its sole discretion, repay the Bridge Notes in whole or in part at any time prior to the Maturity Date. The Bridge Notes are secured by a lien and security interest in all of the Company’s assets, subject to a senior lien on the Company’s Niobrara assets held by MIEJ, an affiliate of MIE Holdings, which secures MIEJ’s loans to date under the Note with MIEJ described below.
Upon maturity, the Company is obligated to pay to the holders an additional payment-in-kind (“PIK”) cash amount equal to 10% of the original principal amount of the Bridge Notes, or $400,000. If an event of default on the Bridge Notes occurs, the principal amount of the Bridge Notes, plus accrued and unpaid interest and the PIK, if any, may be declared immediately due and payable, subject to certain conditions such as bankruptcy or insolvency.
Terms of the Bridge Warrants
The Bridge Warrants are exercisable for shares of the Company’s common stock for a period of four (4) years from their issuance date, at an exercise price of $5.25 per share; provided, however, that the exercise price shall be adjusted to the price per share at which the Company issues common stock in the Company’s next underwritten public offering of common stock, if such price per share is lower than $5.25 per share and such offering occurs within six months of the grant date. The Bridge Warrants may be exercised on a cashless basis. The Company determined that these warrants contain provisions that protect holders from future issuances of the Company’s common stock at prices below such warrants’ respective exercise prices and these provisions could have resulted in modification of the warrants’ exercise price based on a variable that is not an input to the fair value of a “fixed-for-fixed” option. Such warrants were recognized as derivative warrant instruments at issuance and are measured at fair value at each reporting period. The Company determined the fair value of these warrants was $14,005 using a Monte Carlo
simulation
valuation model in the period ended March 31, 2013. The Company subsequently determined, as a public offering was not closed prior to the six month expiration of any possible exercise price adjustment on September 22, 2013, that the exercise price of the warrants would not be reset and the derivative feature of the warrants has no value as of the year ended December 31, 2013.
Modification of Bridge Notes
On December 16, 2013, the Company entered into an amendment to the secured promissory notes (the “Amended Notes”) with each of the Bridge Investors of the Bridge Notes. The Amended Notes provide for (i) the extension of the maturity date of such Bridge Notes, which were originally due on December 31, 2013, to July 31, 2014 (the “New Maturity Date”), (ii) the subordination of the Bridge Notes to certain future qualified senior indebtedness of the Company with a principal amount of at least $5.0 million, (iii) the payment in full of all accrued interest through January 8, 2014 (the “Payment Date”), equal to an aggregate of $294,795 due and payable to the Bridge Investors on the Payment Date, (iv) the payment in full of the $400,000 PIK on the original principal amount of such Bridge Notes on the Payment Date (v) the repayment of either none or 50% of the outstanding principal amount due under such Bridge Notes, as elected by the holders on the Payment Date, of which principal repayment of $1,625,000 shall be due and payable to the Bridge Investors on the Payment Date as elected by the holders, (vi) the amendment of the interest rate of such Bridge Notes for the Amended Notes from 10% per annum to 12% per annum with respect to the remaining unpaid principal amount of the Bridge Notes (the “Deferred Principal”), and (vii) an additional payment-in-kind cash amount equal to 10% of the Deferred Principal due on the New Maturity Date (the “Additional PIK”). In total, eleven (11) Bridge Investors holding Bridge Notes with an aggregate principal amount outstanding of $3,250,000 elected to defer 50% of their principal, agreeing to defer an aggregate of $1,625,000 in principal amount of the Bridge Notes, and five (5) Bridge Investors holding Bridge Notes with an aggregate principal amount outstanding of $750,000 elected to defer 100% of their principal, for total deferred principal of $2,375,000, and an aggregate Additional PIK due upon the New Maturity Date of $237,500. The Company recorded the Additional PIK as a debt discount to the Amended Notes.
F-23
As additional consideration for the Amended Notes, the Company granted a new warrant (“New Warrant”) exercisable on a cashless basis at an exercise price of $2.34 per share for a number of shares of common stock of the Company equal to (i) double (2x) the number of shares issuable under the Bridge Warrant originally issued to each holder who agreed to defer 50% of the outstanding principal of its Bridge Note, and (ii) triple (3x) the number of shares issuable under the Bridge Warrant originally issued to each holder who agreed to defer 100% of the outstanding principal of its Bridge Note, for a total of New Warrants exercisable for an aggregate of 166,684 shares of Company common stock issued by the Company to the Bridge Investors. The New Warrants have a 4-year life and have substantially the same terms as the Bridge Warrants originally issued to the Bridge Investors. The New Warrants have a fair value of $181,475, calculated using the Black Scholes model.
Frank C. Ingriselli, the Company’s President, Chief Executive Officer, and member of the Company’s Board of Directors, agreed to defer $500,000 of the original $1.0 million principal amount outstanding under his Bridge Note, and on the Payment Date, the Company paid $73,699 in accrued interest and $100,000 in PIK amounts due, and repaid 50% of his outstanding principal amount of $500,000. Mr. Ingriselli received a New Warrant exercisable for 38,096 shares of the Company’s common stock valued at $41,064 on the grant date. Clark R. Moore, the Company’s Executive Vice President and General Counsel, agreed to defer $25,000 of the original $50,000 principal amount outstanding under his Bridge Note, and on the Payment Date, the Company paid $3,685 in accrued interest and $5,000 in PIK amounts due, and repaid 50% of his outstanding principal amount of $25,000. Mr. Moore received a New Warrant exercisable for 1,906 shares of the Company’s common stock valued at $2,055 on the grant date.
The Company accounted for the amendment to the notes with the Bridge Investors as a modification of debt under ASC 405-20, and, accordingly, the unamortized debt discount related to the PIK of $12,544 and debt discount of $8,055 related to the Bridge Warrants prior to the amendment of the notes with the Bridge Investors was amortized over the new expected term of the Amended Notes, which is July 2014. In addition, the amounts related to the New Warrants and Additional PIK will also be amortized as interest expense over the new expected term of the Amended Notes.
The unamortized debt discount related to the Bridge Warrants and New Warrants as of December 31, 2013, was $177,035. Interest expense related to the debt discount for the Bridge Warrants and New Warrants for the year ended December 31, 2013 was $261,296. The unamortized debt discount related to the PIK and Additional PIK reflected on the balance sheet as of December 31, 2013 was $233,521 and the interest expense related to the PIK and Additional PIK was $403, 979 for the year ended December 31, 2013.
Second Amendment to Bridge Notes and Subordination and Intercreditor Agreements
On March 7, 2014, the Company entered into a Second Amendment to Secured Promissory Notes (each, a “Second Amended Note,” and collectively, the “Second Amended Notes”) with all but one of the holders (each holder who agreed to such Second Amendment Notes, the “Amended Bridge Investors”).
The Second Amended Notes amended the Bridge Notes to allow the holders the right to convert up to 100% of the outstanding and unpaid principal amount (but in increments of not less than 25% of the principal amount of each Bridge Note outstanding as of the entry into the Second Amended Notes and only up to four (4) total conversions of not less than 25% each); the Additional PIK; and all accrued and unpaid interest under each Bridge Note (collectively, the “Conversion Amount”) into common stock of the Company, subject to an additional listing application regarding such common stock being approved by the NYSE MKT. Upon a conversion, the applicable holder shall receive that number of shares of common stock as is determined by dividing the Conversion Amount by a conversion price (the “Conversion Price”) as follows:
(A) prior to June 1, 2014, the Conversion Price shall be $2.15 per share; and
(B) following June 1, 2014, the denominator used in the calculation described above shall be the greater of (i) 80% of the average of the closing price per share of the Company’s publicly traded common stock for the five (5) trading days immediately preceding the date of the conversion notice provided by the holder; and (ii) $0.50 per share.
F-24
Additionally, each Bridge Investor entered into a Subordination and Intercreditor Agreement in favor of BAM Administrative Services LLC (the “Agent”), subordinating and deferring the repayment of the Bridge Notes until full repayment of certain senior notes. The Subordination and Intercreditor Agreements also prohibit us from repaying the Bridge Notes until certain senior notes have been paid in full, except that we are allowed to repay the Bridge Notes from net proceeds received from the sale of common or preferred stock (i) in calendar year 2014 if such net proceeds received in such calendar year exceeds $35,000,000, (ii) in calendar year 2015 if such net proceeds received in such calendar year exceeds $50,000,000, and (iii) in calendar year 2016 if such net proceeds actually received in such calendar year exceeds $50,000,000.
Frank C. Ingriselli, the Company’s President, Chief Executive Officer, and member of the Company’s Board of Directors, originally provided us $1.0 million in Bridge Notes (which was reduced to $500,000 in connection with payments made pursuant to the First Amendment) and Clark R. Moore, the Company’s Executive Vice President and General Counsel, originally provided us $50,000 in Bridge Notes (which was reduced to $25,000 in connection with payments made pursuant to the First Amendment), provided that prior to the Bridge Note Investors’ entry into the Amended Notes, Mr. Ingriselli and Mr. Moore transferred their Bridge Notes to non-affiliates of the Company and as such, as of the date of the Amended Notes, such officers no longer held any Bridge Notes or rights thereunder. See Note 19.
Centurion Note Conversions
On August 31, 2012, Centurion converted $101,250 of principal and accrued interest into 45,000 shares of the Company’s common stock. In October 2012, Centurion converted $536,250 of principal into 238,334 shares of the Company’s common stock. In November 2012, Centurion converted $392,045 of principal into 174,242 shares of the Company’s common stock. Centurion forgave the principal and interest balance of $169,181 and the balance owed Centurion at December 31, 2012 was paid in full.
Related Party Transactions
MIE Jurassic Energy Corporation
On February 14, 2013, the Company’s subsidiary, Pacific Energy Development Corp. (“PEDCO”) entered into a Secured Subordinated Promissory Note, as amended on March 25, 2013 and July 9, 2013 (the “Note”) with MIEJ, with an effective date of November 1, 2012. Under the Note, PEDCO may draw down multiple advances up to a maximum of $6.5 million under the Note, with repaid amounts not being permitted to be re-borrowed. Amounts borrowed under the Note were used by PEDCO to fund fees and expenses allocable to PEDCO with respect to its operations in the Niobrara Asset, Niobrara Asset-related acquisition expenses, and repayment of $432,433 due to Condor as a refund of the performance deposit paid by MIEJ to Condor with respect to the Mississippian Asset acquisition and applied toward the Company’s purchase price of the Mississippian Asset. When drawn, principal borrowed under the Note carries an interest rate of 10.0% per annum. Principal and accrued interest under the Note is due and payable within ten (10) business days of August 31, 2014. The Note may be prepaid in full by PEDCO without penalty, and is secured by all of PEDCO’s ownership and working interests in the FFT2H, Logan 2H, Waves 1H, State 16-7-60 1H and Wickstrom 18-2H wells located in the Niobrara Asset, and all corresponding leasehold rights pooled with respect to such wells, and PEDCO’s ownership and working interests in each future well drilled and completed in the Niobrara Asset. The Note converted amounts previously advanced by MIEJ to PEDCO in the amount of $2.17 million to fund operations in the Niobrara Asset through November 1, 2012, as well as an additional $2 million loaned by MIEJ to PEDCO under the Note on February 14, 2013 and $2 million loaned by MIEJ to PEDCO under the Note on March 25, 2013, for a total current principal amount outstanding under the Note of $6.17 million as of December 31, 2013. There is currently approximately $330,000 available for future borrowing by PEDCO under the Note. Further, the Company owes $585,777 in accrued interest at December 31, 2013 under the Note.
On March 7, 2014, the Company paid an aggregate of $516,192 as repayment in full of amounts due to Condor as a refund of the performance deposit paid by MIEJ to Condor with respect to the Mississippian Asset acquisition and applied toward our purchase price of the Mississippian Asset, and other Mississippian Asset acquisition related expenses. See Note 19.
F-25
The Company determined that certain warrants the Company had issued in connection with the Bridge Financing (as discussed in Note 10 – Bridge Financing) contained provisions that protected holders from future issuances of the Company’s common stock at prices below such warrants’ respective exercise prices and these provisions could have resulted in modification of the warrants’ exercise price based on a variable that was not an input to the fair value of a “fixed-for-fixed” option. The warrants issued in connection with the Bridge Financing contained anti-dilution provisions that provided for a reduction in the exercise price of such warrants in the event that the Company issued common stock in an underwritten public offering occurring within six (6) months following March 22, 2013, if the price per share of Company common stock issued in the underwritten public offering was less than the Exercise Price of the warrant (as adjusted prior to, or in connection with, such underwritten public offering pursuant to stock splits, stock dividends, reorganizations, mergers, consolidation or sales of assets), then the Exercise Price of the warrant would have been automatically adjusted to equal the offering price per share issued by the Company in the underwritten public offering, provided, however, that this was a one-time adjustment to occur only in connection with the Company’s first underwritten public offering consummated within six (6) months following March 22, 2013. Such warrants were recognized as derivative warrant instruments at issuance and are measured at fair value at each reporting period. The Company determined the fair values of these warrants using a Monte Carlo
simulation
valuation model in the period ended March 31, 2013. As a public offering was not closed prior to the six months expiration of any possible exercise price adjustment on September 22, 2013, the exercise price of the warrants was not reset and the derivative feature of the warrants had no value as of the period ending September 30, 2013. Activity for derivative warrant instruments during the year ended December 31, 2013, was as follows:
|
Description
|
Balance at
December 31,
2012
|
Initial valuation of derivative liabilities upon issuance
of warrants
|
Decrease in fair
value of derivative liability
|
Exercise of
warrants
|
Balance at
December 31,
2013
|
|||||||||||||||
|
Bridge Warrants
|
$
|
-
|
$
|
14,005
|
$
|
(14,005
|
)
|
$
|
-
|
$
|
-
|
|||||||||
|
Total
|
$
|
-
|
$
|
14,005
|
$
|
(14,005
|
)
|
$
|
-
|
$
|
-
|
|||||||||
The following is a summary of the assumptions used in the Monte Carlo simulation valuation model as of the initial valuation of the derivative warrant instruments issued on March 22, 2013:
|
Description
|
||||
|
Common stock issuable upon exercise of warrants
|
85,722
|
|||
|
Market value of common stock on date of measurement (1)
|
$
|
5.25
|
||
|
Adjusted exercise price
|
$
|
5.25
|
||
|
Risk free interest rate (2)
|
0.6
|
%
|
||
|
Warrant lives in years
|
4
|
|||
|
Expected volatility (3)
|
85.0
|
%
|
||
|
Expected dividend yield (4)
|
0.0
|
%
|
||
|
(1)
|
The market value of common stock is the stock price at the close of trading on the date of issuance or at period-end, as applicable.
|
|
(2)
|
The risk-free interest rate was determined by management using the 3 or 5 - year Treasury Bill as of the respective offering or measurement date.
|
|
(3)
|
Because the Company does not have adequate trading history to determine its historical trading volatility, the volatility factor was estimated by management using the historical volatilities of comparable companies in the same industry and region.
|
|
(4)
|
Management determined the dividend yield to be 0% based upon its expectation that it will not pay dividends for the foreseeable future.
|
F-26
Office Lease
In July 2012, the Company entered into a non-cancelable lease agreement with a term of two years ending in July 2014 for its corporate office space located in Danville, California. The obligation under this lease as of December 31, 2013 is $28,987.
Niobrara Asset - $1 Million Guarantee
Under the Niobrara Asset purchase agreement in 2012, the Company agreed to issue 444,445 shares of Series A Preferred Stock on November 13, 2012, subject to a guaranteed minimum value of $1 million of the preferred stock, to the parties that sold the asset to the Company (the “Sellers”). On November 13, 2012, the Sellers had the option to elect to receive the fixed number of 444,445 shares or $1 million in cash, due and payable within five days of their written election to receive cash in lieu of the shares. The agreement does not provide the Sellers the option for a variable number of shares based on the per share value. The obligation of $1 million was recorded in accrued expenses on the date of the transaction. The Company received elections from the Sellers requesting payment of the obligation in cash due on or about November 20, 2012. On November 26, 2012, the Agreement was amended to provide for the payment of $100,000 to the Sellers, and 44,445 shares of the preferred stock valued at $100,000 to extend the $1 million payment until February 18, 2013. The fair value of $280,001 of the 44,445 preferred shares issued and the $100,000 payment were recorded as interest expense in 2012. The Company subsequently paid the $1 million due on February 18, 2013.
Drilling Commitments
Our oil and gas leasehold acreage is subject to expiration of leases if we do not drill and hold such acreage by production. In the Niobrara asset 181 net acres expire in 2014, 21 net acres expire in 2015, 169 net acres expire in 2016 and 588 net acres expire thereafter. We plan to hold significantly all of this acreage through an active program of drilling and completing producing wells. Where we are not able to drill a well before lease expiration we will seek to extend leases where able. All “net” acreage reflects our acreage held directly and our 20% proportionate share of acreage held by Condor by virtue of our 20% ownership interest in Condor. In addition, all of our net acres in the Mississippian asset will expire in 2014 if we do not drill at least three (3) long horizontal wells in the asset by December 29, 2014. As of March 2014, we no longer hold any assets in the Eagle Ford formation. If our extension options expire and we have to renew such leases on new terms, we could incur significant cost increases, and we may not be able to renew such leases on commercially reasonable terms or at all. In addition, on certain portions of our acreage, third-party leases become immediately effective if our leases expire.
Pursuant to the Condor operating agreement, PEDCO is required to fund its 20% pro rata share of all Condor operations, commitments and expenses. Condor plans to drill 2 gross wells in the Niobrara Asset at an estimated cost of $7.6 million in 2014, of which PEDCO will be required to fund its 20% interest in Condor, or $1.52 million.
Legal Matters
The Company is not aware of any pending or threatened legal proceedings. The foregoing is also true with respect to each officer, director and control shareholder as well as any entity owned by any officer, director and control shareholder, over the last five years.
As part of its regular operations, the Company may become party to various pending or threatened claims, lawsuits and administrative proceedings seeking damages or other remedies concerning its’ commercial operations, products, employees and other matters. Although the Company can give no assurance about the outcome of these or any other pending legal and administrative proceedings and the effect such outcomes may have on the Company, except as described above, the Company believes that any ultimate liability resulting from the outcome of such proceedings, to the extent not otherwise provided for or covered by insurance, will not have a material adverse effect on the Company’s financial condition or results of operations.
Asia Sixth Acquisition
As discussed in Note 19, in September 2013 the Company entered into a series of transactions and agreements with Asia Sixth to acquire certain oil and gas production rights in Kazakhstan. The SSA provides for, among other things, based on how producing wells perform, at closing, the Company shall owe to Asia Sixth a final closing payment equal to an additional: (i) $20 million if the daily average volume of oil produced by Aral over a specified 30 day period (the “Target Volume”) equals or exceeds 1,500 barrels of oil per day (“BOPD”); (ii) $15 million if the Target Volume equals or exceeds 1,000 BOPD but is less than 1,500 BOPD; or (iii) $0 due if the Target Volume comes in less than 1,000 BOPD. Pursuant to the Asia Sixth Agreement, RJ Corp. is obligated to pay 50% of any final closing payment due to Asia Sixth.
Series A Convertible Preferred Stock Designations
At December 31, 2013, the Company was authorized to issue 100,000,000 shares of its Series A Preferred Stock with a par value of $0.001 per share.
F-27
On April 23, 2013, the Company’s board of directors approved a 1-for-3 reverse stock split of its common and preferred stock, effective as of the close of business on April 23, 2013. All preferred stock had previously been converted to common stock on a one for one basis on January 27, 2013 prior to the reverse stock split. As a result of the reverse stock split, every three shares of the Company’s issued common stock were converted into one share of the Company’s new common stock. Fractional shares resulting from the reverse stock split were rounded up to the nearest whole share. The stock split affected all issued and outstanding shares of the Company's common and preferred stock (of which there was no preferred stock issued at the date of the split), as well as common or preferred stock underlying stock options, stock appreciation rights, restricted stock units, warrants and convertible debentures outstanding immediately prior to its effectiveness on April 23, 2013. All share and per share amounts have been retroactively adjusted to reflect the reverse stock split.
Preferred Stock Issuances
During the year ended December 31, 2012, activity in the Company’s preferred stock was as follows:
|
●
|
In 2012, the Company issued 3,684,448 shares of New Series A Preferred Stock to investors for gross cash proceeds of $8,015,071. Offering costs were $246,423.
|
|
●
|
In February 2012, the Company issued 76,667 shares of New Series A Preferred Stock at a value of $172,500 to South Texas Reservoir Alliance LLC. (“STXRA”). A liability was accrued as of December 31, 2011 for this issuance, which issuance was made in full satisfaction of certain obligations to STXRA associated with the Niobrara Asset purchase.
|
|
●
|
In March 2012, the Company had issued 555,556 shares of Series A preferred stock valued at $2.25 per share in connection with the Excellong purchase agreement. The Company had a contingent obligation to repurchase up to the full 555,556 shares of Series A preferred stock at a price per share of $2.25 in the event that, on March 29, 2013, the market value of the stock was less than $1,250,000, and the sellers demand repurchase. Accordingly, the shares were redeemable at the option of the holder as of December 31, 2012 and were classified outside of shareholders’ equity as of that date. On January 27, 2013, the shares redeemable at the option of the holders were converted to redeemable common stock. On March 29, 2013, the market value of the redeemable common stock exceeded $1,250,000, so the sellers were not able to demand redemption and the shares were reclassified to equity as of March 31, 2013.
|
|
●
|
In July 2012, the Company issued 122,812 shares of its New Series A Preferred Stock valued at $276,326 in exchange for a subscription receivable from Condor in connection with the acquisition of additional interests by Condor in the Niobrara formation of Weld and Morgan Counties, Colorado.
|
|
●
|
In September 2012, the Company issued 93,250 shares of its New Series A Preferred Stock valued at $559,498 for settlement of a payable due to Esenjay.
|
|
●
|
In November 2012, the Company issued 44,445 shares of its New Series A Preferred Stock to Esenjay pursuant to terms of a Modification Agreement wherein the Company extended the due date of a $1 million payment until February 18, 2013. These shares were recorded as additional interest expense of $280,001 based on the grant date fair value.
|
|
●
|
In October 2012, 9,000 shares of the Company’s New Series A Preferred Stock were converted by an investor into shares of the Company’s common stock.
|
During the year ended December 31, 2013, activity in the Company’s preferred stock was as follows:
|
●
|
In January 2013, the Company issued 47,059 shares of its Series A preferred stock in connection with a cashless warrant exercise.
|
|
●
|
In January 2013, 6,281,904 shares of the Company’s Series A preferred stock were converted by investors into 6,281,904 shares of the Company’s common stock pursuant to the automatic conversion provisions of the Company’s Series A Convertible Preferred Stock Amended and Restated Certificate of Designations.
|
At December 31, 2013, there were -0- shares of the Company’s Series A preferred stock outstanding.
At December 31, 2013, the Company was authorized to issue 200,000,000 shares of its common stock with a par value of $0.001 per share.
In October 2011, the Company granted 233,334 shares of its restricted Common Stock valued at $0.30 per share to an executive of the Company. These shares were valued at $70,000. The Company recorded stock-based compensation expense of $65,589 in 2012. The shares were subject to forfeiture in the event the recipient was no longer an officer to the Company, which risk of forfeiture lapsed with respect to 50% of the shares on June 1, 2012, 25% on December 31, 2012 and the final 25% on June 1, 2013, all contingent upon the recipient's continued service with the Company. These awards were authorized and issued under the Company's equity incentive plan adopted in February 2012. At December 31, 2013, none of these 233,334 shares were subject to forfeiture.
F-28
During the year ended December 31, 2012, the Company issued shares of common stock as follows:
|
●
|
In February 2012, the Company granted to five of its consultants and employees a total of 551,667 shares of its restricted Common Stock valued at $0.30 per share. The Company recorded stock-based compensation expense of $165,500 on the date of grant. The shares were subject to forfeiture in the event the recipient was no longer an employee, officer, director or consultant to the Company, which risk of forfeiture lapsed with respect to 50% of the shares six months from the date of grant, 20% twelve months from the date of grant, 20% eighteen months from the date of grant, and the final 10% twenty-four months from the date of grant, all contingent upon the recipient’s continued service with the Company. These awards were authorized and issued under the Company’s equity incentive plan adopted in February 2012. At December 31, 2012, 50% of these 551,667 shares were subject to forfeiture, and at December 31, 2013, none of these shares were subject to forfeiture.
|
|
●
|
In September 2012, as a result of the 1:112 Reverse Split, 474,291 shares of common stock were issued to shareholders of Blast. (See Note 4).
|
|
●
|
In October 2012, 71,596 shares of common stock were issued in connection with the Blast merger in settlement of outstanding debt of the Company of $487,218. (See Note 4).
|
|
●
|
In December 2012, the Company granted 13,334 shares of its restricted common stock with a grant date fair value of $80,000 to an independent contractor for services proved pursuant to our 2012 Equity Incentive Plan which shares were issued in January 2013.
|
|
●
|
In 2012, 457,576 shares of common stock were issued to Centurion pursuant to conversion of debt in the amount of $1,029,545. (See Note 10).
|
|
●
|
In June 2012, non-qualified stock options previously granted to South Texas Reservoir Alliance LLC (“STXRA”), were exercised at the $0.24 exercise price per share and STXRA paid $4,800 for the issuance of 20,000 shares of common stock.
|
|
●
|
In 2012, 161,086 shares of common stock were issued to employees and consultants in connection with the cashless exercise of common stock options.
|
|
●
|
In 2012, 37,529 shares of common stock were issued to an investor in connection with the cashless exercise of common stock warrants.
|
|
●
|
In October 2012, 9,000 shares of the Company’s New Series A Preferred Stock were converted by an investor into 9,000 shares of the Company’s Common Stock.
|
During the year ended December 31, 2013, the Company issued shares of common stock as follows:
|
●
|
In January 2013, the Company issued 13,334 shares of common stock with a grant date fair value of $80,000 to an independent contractor for services provided to the Company. The 13,334 shares issued were for services performed in December of 2012 and recorded as a stock payable in 2012.
|
|
●
|
On January 27, 2013, the Company issued 6,281,905 shares of common stock on a 1-for-1 conversion of all the Company’s 6,281,905 outstanding Series A preferred stock, pursuant to the automatic conversion provisions of the Company’s Series A Convertible Preferred Stock Amended and Restated Certificate of Designations.
|
|
●
|
During 2012, the Company had issued 555,556 shares of Series A preferred stock valued at $2.25 per share in connection with the Excellong purchase agreement. The Company had a contingent obligation to repurchase up to the full 555,556 shares of Series A preferred stock at a price per share of $2.25 in the event that, on March 29, 2013 (the date that is twelve months from the closing date), the market value of the stock was less than $1,250,000, and the sellers demand repurchase. Accordingly, the shares were redeemable at the option of the holder as of December 31, 2012 and were classified outside of shareholders’ equity as of that date. On January 27, 2013, the shares redeemable at the option of the holders were converted to redeemable common stock. On March 29, 2013, the market value of the redeemable common stock exceeded $1,250,000, so the sellers were not able to demand redemption and the shares were reclassified to equity as of March 31, 2013.
|
F-29
|
●
|
On March 29, 2013, the Company rescinded the prior cashless exercise of certain options to purchase an aggregate of 127,800 shares of common stock of the Company by four Company employees, effective December 19, 2012. As a result of the rescission, an aggregate of 120,710 shares of common stock of the Company which were originally issued upon the cashless exercise of the options were surrendered by the holders and cancelled in exchange for the original options at the original terms.
|
|
●
|
On July 1, 2013, the Company issued an aggregate of 27,804 shares of common stock to Esenjay Oil & Gas, Ltd., Winn Exploration Co., Inc., Lacy Properties, Ltd., and Crain Energy, Ltd. (collectively, “Esenjay”), as additional consideration due to Esenjay upon the spudding by certain wells operated by Condor. These shares were valued at $116,499. The Company recorded $116,499 as a stock subscription receivable for the total of 27,804 shares at $4.19 per share on the date of grant to reflect the shares issued to Esenjay by the Company on Condor’s behalf. This amount was received during 2013.
|
|
●
|
On July 11, 2013, the Company issued to STXRA 33,815 shares of common stock at a fair value of $109,899 for services in connection with the acquisition of properties in the Mississippian formation.
|
|
●
|
On August 9, 2013, the Company granted an aggregate of 1,165,000 shares of its restricted common stock with an aggregate fair value of $4,368,750 to certain employees of the Company pursuant to the Company’s 2012 Equity Incentive Plan and in connection with the Company’s year 2012 annual equity incentive compensation review process. 40% of the shares vested nine months from the date of grant, 15% vest eighteen months from the date of grant, 15% vest two years from the date of grant, 15% vest two and one-half years from the date of grant and the final 15% vest three years from the date of grant, all contingent upon the recipient’s continued service with the Company. On this same date, the Company also granted an aggregate of 25,750 shares of its restricted common stock with an aggregate fair value of $96,563 to certain employees of, and consultants to, the Company pursuant to the Company’s 2012 Equity Incentive Plan and in connection with the Company’s year 2012 annual equity incentive compensation review process. The shares fully vested on the six month anniversary of the grant date, all contingent upon the recipient’s continued service with the Company.
|
|
●
|
On August 12, 2013, the Company completed the closing of a private placement (the “Private Placement”) pursuant to which it sold (a) 7,333,334 shares of its common stock at a price of $3.00 per share, which included rights to the following warrants (b) three-year warrants exercisable on a cash basis only for (i) an aggregate of 733,334 shares of common stock at $3.75 per share, (ii) an aggregate of 733,334 shares of common stock at $4.50 per share, and (iii) an aggregate of 733,334 shares of common stock at $5.25 per share, to two investors for aggregate proceeds to the Company in connection with such subscription of $22 million, $20 million of which securities were acquired by Yao Hang Finance (Hong Kong) Limited (the “Lead Investor”), the lead investor in the Private Placement, and $2 million of which securities were acquired by an outside investor (the “Outside Investor”). The Lead Investor paid $10 million in cash at the closing, and entered into a Common Stock and Warrant Subscription Agreement (the “Subscription Agreement”), First Amendment to Common Stock and Warrant Subscription Agreement (the “Amendment”), and full-recourse promissory note (the “Note”), which Amendment and Note require that it pay the balance of $10 million in cash due no later than December 1, 2013, with 3,333,333 of the shares of common stock issued to the Lead Investor in the Private Placement (the “Escrowed Shares”), as well as warrants exercisable for (i) an aggregate of 333,333 shares of Common Stock at $3.75 per share, (ii) an aggregate of 333,333 shares of common stock at $4.50 per share, and (iii) an aggregate of 333,333 shares of common stock at $5.25 per share (collectively, the “Escrowed Warrants”), being held in escrow by the Company pending the Lead Investor’s payment in full of the $10 million due under the Note. The Outside Investor also entered into a Subscription Agreement, Amendment and Note, which Amendment and Note require that it pay the $2 million purchase price for the common stock and warrants no later than September 11, 2013, with all shares and warrants issued to the Outside Investor in the Private Placement being held in escrow by the Company pending the Outside Investor’s payment in full of the $2 million due under the Note. On September 30, 2013, the Company received cash payment in full from the Outside Investor that was due under the $2 million promissory note, and the Outside Investor’s shares and warrants were released from escrow. The Lead Investor failed to pay the $10 million balance due under the Note by December 1, 2013, On December 1, 2013, the Company granted a verbal extension to the Lead Investor pending further discussions regarding the investment. Following discussions with the Lead Investor, the Lead Investor elected to forego making further investment. Accordingly, on March 7, 2014, the Company notified the Lead Investor that, effective immediately, the Escrowed Shares and Escrowed Warrants were rescinded as permitted pursuant to the terms of the Note, and the Note was cancelled and forgiven, with no further action required by the investor (the “Cancellation”). The stock subscription receivable related to 3,333,333 shares of common stock and 999,999 warrants for shares of common stock in the amount of $10 million was extinguished as of March 7, 2014. The rescission of the shares and warrants will be reflected in the Company’s financial statements in the first quarter of 2014.
|
|
●
|
On August 20, 2013, the Company issued 4,900 shares of common stock for cash proceeds of $11,025 to a former director of Blast Energy Services, Inc. in connection with the exercise of 4,900 warrants.
|
|
●
|
On September 10, 2013, the Company granted an aggregate of 26,668 shares of its restricted common stock with an aggregate fair value of $120,006 to the two new independent directors of the Company pursuant to the Company’s 2012 Equity Incentive Plan. 100% of the shares vest on the one year anniversary date of grant, contingent upon the recipient’s continued service with the Company.
|
F-30
|
●
|
On October 31, 2013, the Company issued 12,768 shares of common stock to an employee in connection with the exercise of 12,768 options on a cashless basis.
|
|
●
|
On November 6, 2013, the Company granted an aggregate of 305,000 shares of its restricted common stock with an aggregate fair value of $924,150, for placement agent services. 100% of the shares vested on January 28, 2014.
|
|
●
|
On December 16, 2013, the Company issued 3,250,000 shares of common stock in connection with its public offering and received $6,281,767 in net proceeds after deducting offering costs.
|
|
●
|
On December 17, 2013, the Company issued 22,148 shares of common stock to an employee in connection with the exercise of 22,148 options on a cashless basis.
|
During the year ended December 31, 2013, the Company received $276,326 from Condor in payment of the stock subscription receivable for 122,812 shares of the Company's New Series A Preferred Stock issued in July 2012.
Blast 2003 Stock Option Plan and 2009 Stock Incentive Plan
As of December 31, 2012, 10,205 shares of common stock granted under Blast’s 2003 Stock Option Plan and 2009 Stock Incentive Plan were outstanding and exercisable, and as of December 31, 2013 and 2012, 3,424 shares of common stock granted under these plans remain outstanding and exercisable. No options were issued under these plans in 2012 or 2013.
2012 Incentive Plan
On July 27, 2012, the shareholders of the Company approved the 2012 Equity Incentive Plan (the “2012 Incentive Plan”), which was previously approved by the Board of Directors on June 27, 2012, and authorizes the issuance of various forms of stock-based awards, including incentive or non-qualified options, restricted stock awards, performance shares and other securities as described in greater detail in the 2012 Incentive Plan, to the Company’s employees, officers, directors and consultants. A total of 2,000,000 shares of Common Stock are eligible to be issued under the 2012 Incentive Plan.
PEDCO 2012 Equity Incentive Plan
As a result of the Merger, the Company assumed the PEDCO 2012 Equity Incentive Plan (the “PEDCO Incentive Plan”), which was adopted by PEDCO on February 9, 2012. The PEDCO Incentive Plan authorized PEDCO to issue an aggregate of 1,000,000 shares of common stock in the form of restricted shares, incentive stock options, non-qualified stock options, share appreciation rights, performance share, and performance unit under the PEDCO Incentive Plan. As of December 31, 2013, options to purchase 1,221,667 shares of PEDCO common stock and 551,667 shares of PEDCO restricted common stock had been granted under this plan (all of which were granted by PEDCO prior to the closing of the Merger, with such grants being assumed by the Company and remaining subject to the PEDCO Incentive Plan following the consummation of the Merger). The Company does not plan to grant any additional awards under the PEDCO Incentive Plan post-Merger.
Options
In 2012, options to purchase an aggregate of 88,333 shares of common stock were granted to five consultants and employees at an exercise price of $0.30 per share. The options have terms of 10 years and fully vested in February 2014. 50% of the shares subject to the options vested six months from the date of grant, 20% vested one year from the date of grant, 20% vested eighteen months from the date of grant, and the final 10% vested two years from the date of grant, all contingent upon the recipient’s continued service with the Company. The fair value of the options on the date of grant using the Black-Scholes model was $20,670.
F-31
In 2012, options to purchase an aggregate of 1,133,334 shares of common stock were granted to members of Company management and employees at an exercise price of $0.51 per share. The options have terms of 10 years and fully vest in June 2014. 50% of the shares subject to the options vested six months from the date of grant, 20% vested one year from the date of grant, 20% vested eighteen months from the date of grant, and the final 10% vest two years from the date of grant, all contingent upon the recipient’s continued service with the Company. The fair value of the options on the date of grant using the Black-Scholes model was $272,000.
On August 9, 2013, the Company granted options to purchase an aggregate of 104,500 shares of common stock to four consultants and employees at an exercise price of $3.75 per share, pursuant to the Company’s 2012 Equity Incentive Plan and in connection with the Company’s 2012 annual equity incentive compensation review process. The options have terms of five years and fully vest in August 2016. With respect to options to purchase an aggregate of 64,500 shares, 40% of the shares subject to the options vested six months from the date of grant, 15% vest eighteen months from the date of grant, 15% vest two years from the date of grant, 15% vest two and one-half years from the date of grant and the final 15% vest three years from the date of grant, all contingent upon the recipient’s continued service with the Company. With respect to options to purchase an aggregate of 40,000 shares, 25% of the shares subject to the options vested six months from the date of grant, 15% vest twelve months from the date of grant, 15% vest eighteen months from the date of grant, 15% vest two years from the date of grant, 15% vest two and one-half years from the date of grant and the final 15% vest three years from the date of grant, all contingent upon the recipient’s continued service with the Company. The aggregate fair value of the options on the date of grant, using the Black-Scholes model, was $228,670. Variables used in the Black-Scholes option-pricing model for the options issued included: (1) a discount rate of 0.61%, (2) expected term of 3.5 years, (3) expected volatility of 85%, and (4) zero expected dividends.
During the year ended December 31, 2013, the Company recognized option stock-based compensation expense of $564,366. The remaining amount of unamortized stock options expense at December 31, 2013 was $145,960. The Black-Scholes option-pricing model was used to determine fair value. Variables used in the Black-Scholes option-pricing model for the options issued included: (1) a discount rate range of 0.27% to 1.36%, (2) expected term of 2 to 3.5 years, (3) expected volatility range of 85% to 173%, and (4) zero expected dividends.
The intrinsic value of outstanding and exercisable options at December 31, 2013 was $2,178,812 and $1,983,579, respectively.
Option activity during the year ended December 31, 2013 was:
|
Number of Shares
|
Weighted Average Exercise Price
|
Weighted Average Remaining Contract Term (years)
|
||||||||||
|
Outstanding at January 1, 2013
|
1,218,206
|
$
|
0.92
|
9.30
|
||||||||
|
Granted
|
104,500
|
3.75
|
||||||||||
|
Rescission of granted options
|
127,800
|
0.48
|
||||||||||
|
Exercised
|
(39,000
|
)
|
0.28
|
|||||||||
|
Forfeited and cancelled
|
(6,782
|
)
|
21.99
|
|||||||||
|
Outstanding at December 31, 2013
|
1,404,724
|
$
|
0.80
|
8.09
|
||||||||
|
Exercisable at December 31, 2013
|
1,182,309
|
$
|
0.57
|
8.36
|
||||||||
F-32
Option activity during the year ended December 31, 2012 was:
|
Number of Shares
|
Weighted Average Exercise Price
|
Weighted Average Remaining Contract Term (years)
|
||||||||||
|
Outstanding at January 1, 2012
|
176,667
|
$
|
0.24
|
9.75
|
||||||||
|
Granted under Blast merger
|
12,973
|
125.15
|
||||||||||
|
Granted
|
1,221,667
|
0.49
|
||||||||||
|
Exercised
|
(190,333
|
)
|
0.46
|
|||||||||
|
Forfeited and cancelled
|
(2,768
|
)
|
381.63
|
|||||||||
|
Outstanding at December 31, 2012
|
1,218,206
|
$
|
0.92
|
9.30
|
||||||||
|
Exercisable at December 31, 2012
|
561,372
|
$
|
1.44
|
9.20
|
||||||||
Summary of options outstanding and exercisable as of December 31, 2013:
|
Exercise Price
|
Weighted Average
Remaining Life (years)
|
Options Outstanding
|
Options Exercisable
|
|||||||||||
|
$
|
0.24
|
0.81
|
146,667
|
146,667
|
||||||||||
|
0.30
|
0.34
|
59,335
|
50,500
|
|||||||||||
|
0.51
|
6.58
|
1,090,800
|
981,720
|
|||||||||||
|
3.75
|
0.34
|
104,500
|
-
|
|||||||||||
|
30.24
|
0.02
|
2,976
|
2,976
|
|||||||||||
|
67.20
|
-
|
446
|
446
|
|||||||||||
|
$
|
0.24 to $67.20
|
8.09
|
1,404,724
|
1,182,309
|
||||||||||
Summary of options outstanding and exercisable as of December 31, 2012:
|
Exercise Price
|
Weighted Average
Remaining Life (years)
|
Options Outstanding
|
Options Exercisable
|
|||||||||||
|
$
|
0.24
|
1.08
|
149,667
|
103,667
|
||||||||||
|
0.30
|
0.60
|
80,000
|
35,833
|
|||||||||||
|
0.51
|
7.60
|
978,333
|
411,666
|
|||||||||||
|
30.24
|
0.02
|
5,953
|
5,953
|
|||||||||||
|
33.60
|
-
|
2,247
|
2,247
|
|||||||||||
|
67.20
|
-
|
893
|
893
|
|||||||||||
|
127.68
|
-
|
36
|
36
|
|||||||||||
|
134.40
|
-
|
298
|
298
|
|||||||||||
|
204.96
|
-
|
36
|
36
|
|||||||||||
|
268.80
|
-
|
743
|
743
|
|||||||||||
|
$
|
0.24 to $268.80
|
9.30
|
1,218,206
|
561,372
|
||||||||||
Warrants
In 2012, in connection with the Series A Preferred Stock issuances, the Company issued warrants to its placement agent and an employee to purchase a total of 20,000 shares of Series A Preferred Stock valued at $1.26 per share on the grant date. These warrants have an exercise price of $2.25 per share and expire in April 2015.
In 2012, warrants to purchase an aggregate of 33,334 shares of common stock were granted to an advisor at an exercise price of $0.30 per share. The warrants have a term of 10 years and were fully vested on the date of grant. The Company recorded $8,000 of stock compensation expense on the date of grant.
In 2012, the Company issued warrants to an advisor to purchase a total of 2,167 shares of its Series A Preferred Stock valued at $1.26 per share on the grant date. These warrants have an exercise price of $2.25 per share and expire in May 2015. The Company recorded $2,714 of stock compensation expense on the date of grant.
In 2012, as part of the sale of 50% of the ownership interests in White Hawk to an affiliate of MIE Holdings, the Company granted a two-year warrant to the affiliate of MIE Holdings exercisable for 166,667 shares of Company common stock at $3.75 per share valued at $1,586, exercisable solely on a cash basis, and granted a two-year warrant to the affiliate of MIE Holdings exercisable for 166,667 shares of Company common stock at $4.50 per share valued at $1,000, exercisable solely on a cash basis. The Company recorded $2,586 of stock-based compensation expense for the fair value of the warrants issued on the date of grant. These warrants expire in May 2014.
F-33
In 2012, the Company issued warrants to seven consultants who provided placement agent services to purchase a total of 47,806 shares of its Series A Preferred Stock valued at $1.26 on the grant date. These warrants have an exercise price of $2.25 per share and expire in July 2015.
In 2012, the Company issued warrants to three consultants who provided services for public relations, marketing, and Merger integration support to purchase a total of 41,667 shares of its Common Stock valued at $1.25 on the grant date. These warrants have an exercise price of $2.25 per share and expire in July 2015. The Company recorded $52,156 of stock-based compensation expense for the fair value of the warrants issued on the date of grant.
In 2012, the Company acquired 68,736 warrants as part of the merger with Blast.
In 2012, the principals of Trident Partners Ltd. (“Trident principals”) were issued an aggregate of 1,670 shares of the Company’s common stock upon the cashless net exercise of warrants exercisable for a total of 3,795 shares of the Company’s common stock that were originally issued to the Trident principals on June 3, 2011 and December 22, 2011 with an exercise price of $3.36 per share.
In March 2013, the Company issued warrants to purchase 76,198 shares of the Company’s common stock to investors in conjunction with its Bridge Financing. Fair value of $243,771 was calculated using the Black-Scholes option-pricing model. Variables used in the Black-Scholes option-pricing model for the warrants issued included: (1) discount rate of 0.60%; (2) expected term of 4 years; (3) expected volatility of 85%; and (4) zero expected dividends. Fair value of $256,857 was recorded as a debt discount which was calculated using Monte Carlo simulation.
Somerley Limited (“Somerley”) acted as the Company’s placement agent with respect to a portion of the Bridge Financing sold to non-U.S. investors. As compensation, in March 2013, Somerley received total cash fees of $40,000 and Bridge Warrants to purchase a total of up to 9,524 shares of the Company’s common stock at an exercise price of $5.25 per share valued at $31,176 using the Black-Scholes option pricing model.
On July 15, 2013, the Company issued a five-year warrant exercisable for 240,000 shares of the Company’s common stock on a cashless basis to an investor relations consultant as partial consideration for certain investor relations services to be provided to the Company (the “IR Warrant”). The fair value calculated using the Black-Scholes option-pricing model on the date of issuance was $284,886. The IR Warrant has an exercise price per share of $5.00, and vested with respect to 50% of the shares issuable thereunder upon the IR Warrant issuance date, and 50% on February 1, 2014, subject to continued engagement by the Company of the investor relations consultant on such date. Variables used in the Black-Scholes option-pricing model for the warrants issued included: (1) discount rate of 0.66%; (2) expected term of 2.5 years; (3) expected volatility of 85%; and (4) zero expected dividends. On October 9, 2013, the investor relations consultant notified the Company that it was immediately winding-down its operations and was terminating all investor relations engagements, including with the Company. Accordingly, the Company cancelled the IR Warrant in full on October 25, 2013 due to non-performance by the consultant. No expense was recorded for these warrants.
In connection with the August 2013 Private Placement, the Company issued (after consideration of the rescission discussed in Note 19) warrants exercisable for (i) an aggregate of 333,333 shares of Common Stock at $3.75 per share, (ii) an aggregate of 333,333 shares of Common Stock at $4.50 per share, and (iii) an aggregate of 333,333 shares of Common Stock at $5.25 per share issued to the Lead Investor in the Private Placement. The fair value of the warrants on the date of grant was $1,309,269.
On December 16, 2013, the Company issued 166,684 warrants in connection with the amendment and extension of repayment of certain bridge notes, with a fair value of $181,475. Variables used in the Black-Scholes option-pricing model for the warrants issued included: (1) discount rate of 1.55%; (2) expected term of 2 years; (3) expected volatility of 86%; and (4) zero expected dividends.
During the year ended December 31, 2013, the Company recognized warrant stock based compensation expense of $0.
The intrinsic value of outstanding as well as exercisable warrants at December 31, 2013 and 2012 was $125,335 and $1,883,479.
F-34
Warrant activity during the year ended December 31, 2013 was:
|
Number of Shares
|
Weighted Average Exercise Price
|
Weighted Average Remaining Contract Term (# years)
|
||||||||||
|
Outstanding at January 1, 2012
|
633,631
|
$
|
18.25
|
2.43
|
||||||||
|
Granted
|
2,452,408
|
4.38
|
||||||||||
|
Exercised
|
(4,900
|
)
|
2.25
|
|||||||||
|
Forfeited and cancelled
|
(27,769
|
)
|
||||||||||
|
Outstanding at December 31, 2013
|
3,053,370
|
$
|
4.12
|
2.49
|
||||||||
|
Exercisable at December 31, 2013
|
3,053,370
|
$
|
4.12
|
2.49
|
||||||||
Warrant activity during the year ended December 31, 2012 was:
|
Number of Shares
|
Weighted Average Exercise Price
|
Weighted Average Remaining Contract Term (# years)
|
||||||||||
|
Outstanding at January 1, 2012
|
193,334
|
$
|
1.89
|
4.04
|
||||||||
|
Granted under Blast merger
|
68,736
|
141.81
|
||||||||||
|
Granted
|
479,195
|
3.42
|
||||||||||
|
Exercised
|
(106,890
|
)
|
1.56
|
|||||||||
|
Forfeited and cancelled
|
(744
|
)
|
33.60
|
|||||||||
|
Outstanding at December 31, 2012
|
633,631
|
$
|
18.25
|
2.43
|
||||||||
|
Exercisable at December 31, 2012
|
633,631
|
$
|
18.25
|
2.43
|
||||||||
Summary of warrants outstanding and exercisable as of December 31, 2013 was as follows:
|
Exercise Price
|
Weighted Average Remaining Life (years)
|
Warrants Outstanding
|
Warrants Exercisable
|
|||||||||||
|
$
|
0.24
|
0.08
|
33,334
|
33,334
|
||||||||||
|
0.30
|
0.09
|
33,333
|
33,333
|
|||||||||||
|
2.25
|
0.08
|
200,961
|
200,961
|
|||||||||||
|
2.34
|
0.22
|
166,684
|
166,684
|
|||||||||||
|
3.75
|
0.65
|
900,001
|
900,001
|
|||||||||||
|
4.50
|
0.65
|
900,001
|
900,001
|
|||||||||||
|
5.25
|
0.72
|
819,056
|
819,056
|
|||||||||||
|
$
|
0.24 to $5.25
|
2.49
|
3,053,370
|
3,053,370
|
||||||||||
F-35
Summary of warrants outstanding and exercisable as of December 31, 2012 was as follows: done
|
Exercise Price
|
Weighted Average Remaining Life (years)
|
Warrants Outstanding
|
Warrants Exercisable
|
|||||||||||
|
$
|
0.08
|
0.46
|
33,334
|
33,334
|
||||||||||
|
0.10
|
0.49
|
33,334
|
33,334
|
|||||||||||
|
0.75
|
0.72
|
205,862
|
205,862
|
|||||||||||
|
1.12
|
0.00
|
4,882
|
4,882
|
|||||||||||
|
1.25
|
0.37
|
166,667
|
166,667
|
|||||||||||
|
1.50
|
0.37
|
166,667
|
166,667
|
|||||||||||
|
22.40
|
0.00
|
2,529
|
2,529
|
|||||||||||
|
112.00
|
0.00
|
2,232
|
2,232
|
|||||||||||
|
161.28
|
0.02
|
18,124
|
18,124
|
|||||||||||
|
$
|
0.08 to $161.28
|
2.43
|
633,631
|
633,631
|
||||||||||
On February 14, 2013, PEDCO entered into a Secured Subordinated Promissory Note, as amended on March 25, 2013 and July 9, 2013 (the “Note”) with MIEJ, with a maximum of $6.5 million available under the Note, with repaid amounts not being permitted to be re-borrowed. The Note converted $2.17 million previously advanced by MIEJ to PEDCO to fund operations in the Niobrara Asset, as well as an additional $2 million loaned by MIEJ to PEDCO under the Note on February 14, 2013 and $2 million loaned by MIEJ to PEDCO under the Note on March 25, 2013, for a total principal amount outstanding under the Note of $6.17 million as of December 31, 2013. There is currently approximately $330,000 available for future borrowing by PEDCO under the Note. Further, the Company owes $585,777 in accrued interest at December 31, 2013 under the Note.
In May 2012, the Company merged its wholly-owned subsidiary, Excellong E&P-2, Inc., into White Hawk and then sold 50% of its ownership interests in White Hawk to MIEJ and issued certain warrants. See Note 5.
The Company loaned White Hawk funds for operating expenses and drilling and completion costs for four Eagle Ford wells, pursuant to a promissory note on June 4, 2012, which note permits multiple loans to be made as separate “advances”, with no stated maximum limit of loan principal. The note receivable bears interest at a rate per annum equal to the one (1) month LIBOR rate for U.S. dollar deposits plus four (4.0) percentage points. Principal and interest of each loan is due thirty-six (36) months from the date each advance is made under the note, with the first repayment being due June 4, 2015. As of December 31, 2013, the balance of the note receivable is $1,252,393. As previously discussed, as of December 31, 2013, White Hawk became a wholly-owned subsidiary, and this amount was eliminated in consolidation.
The Company loaned Condor funds for operations pursuant to a promissory note entered into on February 14, 2013, with an effective date of November 1, 2012, which note permits multiple loans to be made thereunder up to $8,000,000 as separate “advances”. The note receivable bears interest at a rate per annum equal to the one (1) month LIBOR rate for U.S. dollar deposits plus four (4.0) percentage points. Principal and interest are due thirty-six (36) months from the date each advance is made under the note, with the first repayment being due September 24, 2015. As of December 31, 2013, the balance of the note receivable is $5,005,108 plus accrued interest of $188,469 due from Condor. The carrying balance of the note receivable and accrued interest was reduced by $5,193,577 as the Company’s share of losses from Condor for the year ended December 31, 2013 of $5,626,567 were more than the Company’s residual value in Condor of $160,353 in the investment account. In accordance with ASC 323-10-35, the excess loss from Condor was used to reduce the notes receivable balance.
On November 1, 2012, and pursuant to the terms of the Inter-Company Agreement, Condor and the Company amended and restated the PEDCO Note in full to capitalize interest accrued under the PEDCO Note to November 1, 2012. As a result $1,224 in accrued interest was capitalized as additional principal. During the year ended December 31, 2012, the Company advanced $2,434,442 in cash and 122,812 shares of PEDEVCO’s Series A Preferred Stock valued at $276,326. As of December 31, 2012, Condor had $2,711,992 and $16,963 in loans payable and accrued interest, respectively, to the Company.
During the year ended December 31, 2013, the Company advanced $3,001,875 in cash and 27,804 shares of PEDEVCO’s common stock valued at $116,499. Condor made repayments of $393,642 to the Company which were used to settle the stock subscription receivable of $392,825 and accrued interest of $871
.
Accruals for drilling costs due to Condor as a working interest owner and revenue receivable due from Condor as a working interest owner represent capital expenditures, lease operating expenses and revenues allocable to the Company for its working interests and net revenue interests in the Niobrara asset.
The Company has an agreement to provide management services to Condor for which Condor owes $75,131 and $81,124 at December 31, 2013 and 2012, respectively. Total fees billed to Condor were $667,054 and $363,102 in 2013 and 2012, respectively.
On March 22, 2013, the Company closed a private placement of Bridge Notes.
Frank C. Ingriselli, the Company’s President, Chief Executive Officer, and member of the Company’s Board of Directors, participated in the Bridge Financing, purchasing Bridge Notes of $1 million and receiving Bridge Warrants exercisable for 19,048 shares of the Company’s common stock, and Clark R. Moore, the Company’s Executive Vice President and General Counsel, purchased Bridge Notes of $50,000 and received Bridge Warrants exercisable for 953 shares of the Company’s common stock, respectively. See Note 10.
F-36
Frank C. Ingriselli, the Company’s President, Chief Executive Officer, and member of the Company’s Board of Directors, agreed to defer $500,000 of the original $1.0 million principal amount outstanding under his Bridge Note, and on the Payment Date, the Company paid $73,699 in accrued interest and $100,000 in PIK amounts due, and repaid 50% of his outstanding principal amount of $500,000. Mr. Ingriselli received a New Warrant exercisable for 38,096 shares of the Company’s common stock valued at $41,477 on the grant date. Clark R. Moore, the Company’s Executive Vice President and General Counsel, agreed to defer $25,000 of the original $50,000 principal amount outstanding under his Bridge Note, and on the Payment Date, the Company paid $3,685 in accrued interest and $5,000 in PIK amounts due, and repaid 50% of his outstanding principal amount of $25,000. Mr. Moore received a New Warrant exercisable for 1,906 shares of the Company’s common stock valued at $2,075 on the grant date.
Mr. Ingriselli and Mr. Moore transferred their Bridge Notes to non-affiliates of the Company prior to the further amendment of such Bridge Notes in March 2014, and as such, such officers no longer hold any Bridge Notes or rights. See Note 10.
Due to the Company’s net loss, there was no provision for income taxes for the years ended December 31, 2013 and 2012.
The difference between the income tax expense of zero shown in the statement of operations and pre-tax book net loss times the federal statutory rate of 34% is principally due to the change in the valuation allowance.
Deferred income taxes assets for years ended December 31, 2013 and 2012 are as follows:
|
Deferred Tax Assets (Liabilities)
|
Year ended
December 31,
2013
|
Year ended
December 31,
2012
|
||||||
|
Difference in depreciation, depletion, and capitalization methods – oil and natural gas properties
|
$ | 562,342 | $ | 18,845 | ||||
|
Net operating losses
|
4,131,374 | 1,761,066 | ||||||
|
Impairment – oil and natural gas properties
|
(1,122,953 | ) | (61,289 | ) | ||||
|
Other
|
(33,885 | ) | (43,809 | ) | ||||
|
Total noncurrent deferred tax asset
|
3,536,878 | 1,674,813 | ||||||
|
Less valuation allowance
|
(3,536,878 | ) | (1,674,813 | ) | ||||
|
Total deferred tax assets
|
$ | - | $ | - | ||||
In assessing the realization of deferred tax assets, management considers whether it is more likely than not that some portion or all of deferred assets will not be realized. The ultimate realization of the deferred tax assets is dependent upon the generation of future taxable income during the periods in which those temporary differences become deductible.
Based on the available objective evidence, management believes it is more likely than not that the net deferred tax assets will not be fully realizable. Accordingly, management has applied a full valuation allowance against its net deferred tax assets at December 31, 2013. The net change in the total valuation allowance from December 31, 2012 to December 31, 2013, was an increase of $1,862,065.
The Company’s policy is to recognize interest and penalties accrued on any unrecognized tax benefits as a component of income tax expense. As of December 31, 2013, the Company did not have any significant uncertain tax positions or unrecognized tax benefits. The Company did not have associated accrued interest or penalties, nor was any interest expense or penalties recognized for the years ended December 31, 2013 and 2012.
As of December 31, 2013 the Company has federal net operating loss carryforwards of approximately $8,229,866 for federal and state tax purposes, respectively. If not utilized, these losses will expire beginning in 2031 for both federal and state purposes.
Utilization of NOL and tax credit carryforwards may be subject to a substantial annual limitation due to ownership change limitations that may have occurred or that could occur in the future, as required by the Internal Revenue Code (the “Code”), as amended, as well as similar state provisions. In general, an "ownership change" as defined by the Code results from a transaction or series of transactions over a three-year period resulting in an ownership change of more than 50 percent of the outstanding stock of a company by certain shareholders or public groups.
The Company currently has tax returns open for examination by the Internal Revenue Service for all years since 2005.
F-37
2012 Restatements
On April 11, 2013, the consolidated financial statements, for the period from January 1, 2012 through December 31, 2012, have been restated to properly classify the Company’s issuance of 122,812 shares of Series A preferred stock to a related party as stock subscriptions receivable rather than a note receivable.
In addition, the consolidated financial statements have been restated to properly present on the balance sheet and the statement of shareholders’ equity the classification of Series A Preferred Shares issued and outstanding; the par value and additional paid in capital for the 555,556 shares of Series A preferred stock presented outside of shareholders’ equity as the redemption of such shares is outside the control of the issuer.
The impact on the previously reported balance sheet as of December 31, 2012 is as follows:
|
As Reported
|
As Restated
|
|||||||
|
Notes receivable – related parties
|
$
|
3,062,390
|
$
|
2,786,064
|
||||
|
Total assets
|
$
|
11,423,050
|
$
|
11,146,724
|
||||
|
Series A convertible preferred stock
|
$
|
6,790
|
$
|
6,235
|
||||
|
Additional paid in capital
|
$
|
18,166,864
|
$
|
18,167,419
|
||||
|
Stock subscriptions receivable
|
$
|
-
|
$
|
(276,326
|
)
|
|||
|
Total shareholder’s equity
|
$
|
(5,404,150
|
)
|
$
|
(5,127,824
|
)
|
||
|
Total liabilities and shareholders' equity
|
$
|
11,423,050
|
$
|
11,146,724
|
||||
Purchase and Sale Agreement for White Hawk Properties
On February 19, 2014, White Hawk entered into and closed a Purchase and Sales Agreement (the “Sale Agreement”) with Millennial PDP Fund IV, LP (“Millennial”), pursuant to which White Hawk sold its remaining interests in the Eagle Ford Shale formation to Millennial for net cash proceeds of $2,718,158 received on February 27, 2014. No gain or loss was recognized on the sale of oil and gas properties.
Sale of 3,438,500 Shares of Common Stock
On March 7, 2014, the Company closed an underwritten offering for an aggregate of 3,438,500 shares of common stock at $2.15 per share. The Company has received gross proceeds of $7,392,775 before deducting underwriting discounts and offering expenses as a result of the offering. The Company expects to use the net proceeds of approximately $6,581,000 from the March 2014 Offering to fund drilling operations, for working capital and other general corporate purposes.
Acquisition of Properties from Continental Resources, Inc.
On January 21, 2014, Red Hawk entered into a Purchase and Sale Agreement (“Purchase Agreement”) with Continental, pursuant to which the Company agreed to acquire Continental’s interests (the “Continental Acquisition”) in approximately 28,727 net acres of oil and gas properties and interests in 40 wells located in the Niobrara formation of the DJ Basin, Colorado, including approximately 2,200 net acres in the Wattenberg Area, for $30 million in cash (subject to customary post-closing adjustments).
The Company paid $1.5 million of the purchase price as a deposit upon entering into the Purchase Agreement (the “Deposit”). The final purchase price after adjustments was $28,521,822, resulting in $27,031,822 due to Continental after applying the Deposit (the “Final Purchase Price”). In connection with the purchase, the Company also assumed an obligation of approximately $845,000 of accounts payable to royalty owners, mineral owners and other persons with an interest in production associated with the assets acquired.
F-38
On March 7, 2014, the Company completed the Continental Acquisition and used a portion of funds from the initial closing of a $50 million financing facility with RJ Credit LLC etal. of which $34.5 million was borrowed initially to pay the Final Purchase Price to acquire Continental's properties (representing an adjusted total of 27,990 net acres at closing). As described below, the Note Purchase Agreement further provided that the Company convey 50% of the interests acquired from Continental to RJ Corp. as additional consideration for agreeing to make the initial loans and subsequent loans.
Note Purchase Agreement and Sale of Secured Promissory Notes
On March 7, 2014, the Company entered into a $50 million financing facility between the Company, BRe BCLIC Primary, BRe BCLIC Sub, BRe WNIC 2013 LTC Primary, BRe WNIC 2013 LTC Sub, and RJ Credit LLC (“RJC”), as investors (collectively, the “Investors”), and BAM Administrative Services LLC, as agent for the Investors (the “Agent”). Pursuant to the Note Purchase, the Company initially issued the Investors Secured Promissory Notes in the aggregate amount of $34.5 million (the “Initial Notes”) and provided for an additional $15.5 million available under the financing agreement to fund future drilling costs. The Initial Notes are due and payable on March 6, 2017 (the “Maturity Date”), and may be repaid in full without premium or penalty at any time.
The Company received net proceeds of $27,473,095 on March 7, 2014 from the initial Note Purchase Agreement (the “Note Purchase”) after offering costs including an original issue discount of $1,725,000 (5% of the balance of the Initial Notes); and an underwriting fee of $3,450,000 (10% of the balance of the Initial Notes). The Company also reimbursed approximately $135,000 of the legal fees and expenses of the Investors’ counsel, and paid the Casimir Note Closing Fee of $1,716,905 to Casimir, the Company’s investment banker. Upon the closing of the Note Purchase, we also granted Casimir warrants to purchase up to 1,000,000 shares of our common stock at an exercise price of $2.50 per share (the closing sales price of our common stock on the date immediately prior to the closing date of the Note Purchase), which warrants have cashless exercise rights and a term of five years (the “Casimir Warrants”). The fair value of these warrants was $1,047,974 and will be recorded as a debt discount and amortized over the term of the financing facility.
The financing agreement provides for additional loans (with substantially similar terms as the Initial Notes, the “Subsequent Notes”) from RJC, up to an additional $15.5 million in total or an aggregate of $50 million together with the Initial Notes. The Company is required to pay original issue discounts of 5% of the funds borrowed, underwriting fees of 10% of the funds borrowed, reimburse certain legal fees of RJC’s counsel, and pay applicable fees to Casimir representing 5% of any additional funds borrowed. Funds borrowed under any Subsequent Notes are only eligible to be used by the Company for approved authorization for expenditures (“AFEs”) issued for a well or wells to be drilled and completed on any properties acquired in connection with the Continental Acquisition or properties owned by the Company and located in Comanche, Harper, Barber and Kiowa Counties, Kansas (the “Mississippian Property”). The total aggregate amount of any Subsequent Notes cannot exceed $15.5 million and in the event the Company drills a dry hole, the Company is prohibited from using any proceeds from the issuance of any Subsequent Notes, without the consent of RJC. Additionally, pursuant to the Note Purchase, no proceeds the Company receives from the transfer, sale, assignment or farm-out of the Mississippian Property may be used to fulfill the Company’s obligations to fund its portion of drilling.
The Notes bear interest at the rate of 15% per annum, payable monthly in arrears, on the first business day of each month beginning April 1, 2014 (in connection with the Initial Notes), provided that upon the occurrence of an event of default, the Notes bear interest at the lesser of 30% per annum and the maximum legal rate of interest allowable by law. The Company can prepay all or any portion of the principal amount of Notes, without premium or penalty. The Notes include standard and customary events of default.
Additionally, the Company is required on the third business day of each month, commencing on April 1, 2014, to prepay the Notes in an amount equal to the lesser of (a) the outstanding principal amount of the Notes or (b) twenty-five percent (25%) of the aggregate of all net revenues actually received by the Company and its subsidiaries (other than net revenues received by Asia Sixth, unless and to the extent received by the Company in the United States) or for the immediately preceding calendar month (or such pro rata portion of the first month the payment is required). The Notes also provide that RJC is to be repaid (i) accrued interest, only after all of the other Investors are repaid any accrued interest due and (ii) principal, only after all of the other Investors are repaid the full amount of principal due under their Notes, and (iii) that any funding in connection with Subsequent Notes will be made solely by RJC.
F-39
The amount outstanding under the Notes is secured by a first priority security interest in all of the Company’s and its subsidiaries, assets, property, real property, intellectual property, securities and proceeds therefrom, granted in favor of the Agent for the benefit of the Investors, pursuant to a Security Agreement and Patent Security Agreement, and described in greater detail therein. Additionally, the Agent, for the benefit of the Investors, was granted a mortgage and security interest in all of the Company’s and its subsidiaries real property as located in the state of Colorado (including those assets acquired pursuant to the Continental Acquisition (defined and described below under Item 2.01)) and the state of Texas pursuant to (i) Leasehold Deed of Trust, Fixture Filing, Assignment of Rents and Leases, and Security Agreements filed in Weld County and Morgan County, Colorado; and (ii) a Mortgage, Deed of Trust, Security Agreement, Financing Statement and Assignment of Production filed in Matagorda County, Texas (collectively, the “Mortgages”). Additionally, the Company’s obligations under the Notes, Note Purchase Agreement and related agreements were guaranteed by the Company’s direct and indirect subsidiaries, PEDCO, White Hawk Petroleum, LLC (“White Hawk”), Pacific Energy & Rare Earth Limited, Blackhawk Energy Limited, PEDCO MSL and Red Hawk pursuant to a Guaranty Agreement.
As additional consideration for RJC providing the loan evidenced by its Initial Note and agreeing to provide the funding from the Subsequent Notes, on March 7, 2014, the Company entered into the following transactions in favor of RJC and its affiliate RJ Resources Corp. (“RJ Corp.”):
| ● |
Red Hawk Purchase - A Purchase and Sale Agreement between Pacific Energy Development Corp.’s (the Company’s wholly-owned subsidiary, “PEDCO”) wholly-owned subsidiary, Red Hawk Petroleum, LLC (“Red Hawk”) and RJ Corp. (the “Red Hawk Purchase”); the principal terms of which require the conveyance of 50% of the mineral interests and leases acquired in the Continental Acquisition to RJ Resources Corp. The agreement also provides that for three years from March 7, 2014, RJ Corp. does not have the right to propose or conduct any operations on the property acquired pursuant to the Red Hawk Purchase, unless (a) approved by Red Hawk, or (b) unless Red Hawk fails to execute the portion of the then current capital expenditure plan related to such applicable assets, provided that RJ Corp. may not (i) propose to drill more wells on such lands during the calendar year covered by such capital expenditure plan than are prescribed in the portion of such applicable capital expenditure plan and (ii) propose or conduct any operations on such lands during the following calendar year in excess of the operations budgeted for in the portion of such applicable capital expenditure plan.
|
| ● |
Asia Sixth Purchase - The Asia Sixth Purchase Agreement between PEDCO and RJ Corp. (the “Asia Sixth Purchase”); the principal terms of which require the conveyance of 50% of the Company’s 51% interest in Asia Sixth and if any part of the $10 million deposit previously paid by the Company in connection with the Shares Subscription Agreement is returned to the Company, 50% of any such returned funds will be paid to RJ Corp.
|
| ● |
Membership Purchase and Plan of Merger - A Membership Interest Purchase Agreement between PEDCO and RJ Corp. (the “Membership Purchase”), pursuant to which (i) PEDCO transferred 50% ownership of PEDCO MSL Merger Sub LLC, LLC, a Nevada limited liability company (“MSL Merger Sub”), which was wholly-owned by PEDCO to RJ Corp., (ii) PEDCO’s wholly-owned subsidiary, Pacific Energy Development MSL, LLC (“PEDCO MSL”) merged with and into MSL Merger Sub, with MSL Merger Sub being the surviving entity in the merger, and (iii) MSL Merger Sub changed its name to Pacific Energy Development MSL, LLC. The effective result of the Membership Purchase and Plan of Merger was that RJ Corp. now owns 50% of PEDCO MSL, which owns all of the interests in the Mississippian Asset.
|
As a result of the transactions effected by the Red Hawk Purchase, Asia Sixth Purchase, Membership Purchase and Plan of Merger, RJ Corp. acquired ownership of 50% of all of the Company’s oil and gas assets and properties acquired in connection with the Continental Acquisition, rights to 50% of the Company's right to acquire Asia Sixth which owns the oil and gas assets and properties in Kazakhstan pursuant to the Shares Subscription Agreement, and effective ownership of 50% of the Mississippian Property. In connection with the financing with RJ Corp, the Company will allocate a portion of the proceeds from the financing to the promissory notes and a portion to the sales of (i) 50% of the Continental asset, (ii) 50% of the Company's investment in Asia Sixth and (iii) 50% of the Mississippian asset. To the extent the proceeds of the financing exceed the portion allocated to the debt the Company will record a debt discount. To the extent the sales price attributable to the assets differs from the net book value, the Company will record a gain or loss on sale. The Company is currently assessing the fair value of the components of the transaction to determine the amounts attributable to debt and assets sold.
Rescission of Shares and Warrants and Cancellation of Note
As described in Note 14, the Company had issued into escrow to Yao Hang Finance (Hong Kong) Limited 6,666,667 shares of common stock and three-year warrants exercisable on a cash basis (i) an aggregate of 666,667 shares of common stock at $3.75 per share, (ii) an aggregate of 666,667 shares of common stock at $4.50 per share, and (iii) an aggregate of 666,667 shares of common stock at $5.25 per share in consideration for $20 million.
The Lead Investor paid $10 million in cash on August 12, 2013, and entered into a common stock and Warrant Subscription Agreement (the “Subscription Agreement”), First Amendment to common stock and Warrant Subscription Agreement (the “Amendment”), and full-recourse promissory note (the “Note”), which Amendment and Note required that it pay the balance of $10 million in cash no later than December 1, 2013, with 3,333,333 of the shares of common stock issued to the Lead Investor in the Private Placement (the “Escrowed Shares”), as well as warrants exercisable for (i) an aggregate of 333,333 shares of common stock at $3.75 per share, (ii) an aggregate of 333,333 shares of common stock at $4.50 per share, and (iii) an aggregate of 333,333 shares of common stock at $5.25 per share (collectively (i), (ii) and (iii), the “Escrowed Warrants”), being held in escrow by the Company pending the Lead Investor’s payment in full of the $10 million due under the Note.
F-40
The investor failed to pay the $10 million balance due under the Note by December 1, 2013. On December 1, 2013, the Company granted a verbal extension to the investor pending further discussions regarding the investment. Following discussions with the investor, the investor elected to forego making further investment. Accordingly, on March 7, 2014, the Company notified the investor that, effective immediately, the Escrowed Shares and Escrowed Warrants were rescinded as permitted pursuant to the terms of the Note, and the Note was cancelled and forgiven, with no further action required by the investor (the “Cancellation”). The stock subscription receivable related to 3,333,333 shares of common stock and 999,999 warrants for shares of common stock in the amount of $10 million was extinguished as of March 7, 2014. No gain or loss was recognized.
T
he SSA provides us rights to acquire an approximately 51% ownership in Asia Sixth, which holds an approximate 60% ownership interest in Aral Petroleum Capital Limited Partnership (“Aral”), a Kazakhstan entity, which holds a 100% operated working interest in a production license issued by the Republic of Kazakhstan that expires in 2034 in western Kazakhstan, we were required to pay the Note proceeds to Asia Sixth in the event we received such proceeds, provided that if such proceeds were not received, the required amount of the Share Subscription Agreement was to automatically be reduced from $20 million to $10 million (which $10 million deposit has previously been paid by the Company). Consequently, the rescission of the Note has no net effect on us or our obligations under the Share Subscription Agreement because (a) if such Note was paid in full we would have been required to pay such funds directly to Asia Sixth; and (b) the result of such funds not being paid only results in a decrease in the required deposit due to Asia Sixth.
Letter Amending Cash Compensation Payable to South Texas Reservoir Alliance LLC
On March 7, 2014, PEDCO MSL and South Texas Reservoir Alliance LLC (“STXRA”) entered into a letter agreement providing for $405,777 of cash consideration owed to STXRA for consulting services provided by STXRA to PEDCO MSL to be satisfied through the issuance to STXRA of 190,000 shares of restricted common stock of the Company, subject to the NYSE MKT’s approval of the additional listing of such shares. These shares were issued on March 24, 2014 at a market value of $444,600 at $2.34 per share, resulting in a loss on settlement of payables of $38,823.
Amendment to Bridge Notes and Subordination and Intercreditor Agreements
On March 7, 2014, the Company entered into a Second Amendment to Secured Promissory Notes (each, a “Second Amended Note,” and collectively, the “Second Amended Notes”) with all but one of the holders (each holder who agreed to such Second Amendment Notes, the “Amended Bridge Investors”).
The Second Amended Notes amended the Bridge Notes to allow the holders the right to convert up to 100% of the outstanding and unpaid principal amount (but in increments of not less than 25% of the principal amount of each Bridge Note outstanding as of the entry into the Second Amended Notes and only up to four (4) total conversions of not less than 25% each); the Additional PIK; and all accrued and unpaid interest under each Bridge Note (collectively, the “Conversion Amount”) into common stock of the Company, subject to an additional listing application regarding such common stock being approved by the NYSE MKT. Upon a conversion, the applicable holder shall receive that number of shares of common stock as is determined by dividing the Conversion Amount by a conversion price (the “Conversion Price”) as follows:
(A) prior to June 1, 2014, the Conversion Price shall be $2.15 per share; and
(B) following June 1, 2014, the denominator used in the calculation described above shall be the greater of (i) 80% of the average of the closing price per share of the Company’s publicly traded common stock for the five (5) trading days immediately preceding the date of the conversion notice provide by the holder; and (ii) $0.50 per share.
The Company concluded that the Note Purchase Amendment described above constituted a debt extinguishment rather than a debt modification because a significant conversion feature was added to the terms of the note. As a result, the Company will record a loss on debt extinguishment of $598,522 in the first quarter of 2014.
In connection with the Note Purchase Amendment, the convertible debenture was also analyzed for a beneficial conversion feature after the debt modification at which time it was concluded that a beneficial conversion feature existed. Accordingly, a debt discount of $211,571 will be recorded in the first quarter of 2014 at the date of the modification. The debt discount will be amortized over the term of the Second Amended Notes.
F-41
Additionally, each Bridge Investor entered into a Subordination and Intercreditor Agreement in favor of the Agent, subordinating and deferring the repayment of the Bridge Notes, and actions in connection with the security interests provided under the Bridge Notes, until full repayment of the Notes sold pursuant to the Note Purchase. The Subordination and Intercreditor Agreements also prohibit us from repaying the Bridge Notes until the Notes have been paid in full, except that we are allowed to repay the Bridge Notes from net proceeds received from the sale of common or preferred stock (i) in calendar year 2014 if such net proceeds received in such calendar year exceeds $35,000,000, (ii) in calendar year 2015 if such net proceeds received in such calendar year exceeds $50,000,000, and (iii) in calendar year 2016 if such net proceeds actually received in such calendar year exceeds $50,000,000.
Frank C. Ingriselli, the Company’s President, Chief Executive Officer, and member of the Company’s Board of Directors, originally provided us $1.0 million in Bridge Notes (which was reduced to $500,000 in connection with payments made pursuant to the First Amendment) and Clark R. Moore, the Company’s Executive Vice President and General Counsel, originally provided us $50,000 in Bridge Notes (which was reduced to $25,000 in connection with payments made pursuant to the First Amendment), provided that prior to the Bridge Note Investors’ entry into the Amended Notes, Mr. Ingriselli and Mr. Moore transferred their Bridge Notes to non-affiliates of the Company and as such, as of the date of the Amended Notes, such officers no longer held any Bridge Notes or rights thereunder.
Options and shares of restricted common stock issued
On March 5, 2014, the Company granted 80,000 options to purchase common stock to an employee with an exercise price of $2.50 per share and a five-year term with a fair value of $69,132.
On March 5, 2014, the Company granted 40,000 shares of its restricted common stock to an employee at a grant date fair value of $2.50 per share ,or $100,000, based on the market price on the date of grant. These shares vest 25% after the first year, 15% additional after 18 months, 15% additional after two years, 15% additional after 30 months, 15% additional after three years and the final 15% after 42 months.
F-42
SUPPLEMENTAL INFORMATION ON OIL AND GAS PRODUCING ACTIVITIES
(UNAUDITED)
The following supplemental unaudited information regarding PEDEVCO’s direct oil and gas activities is presented pursuant to the disclosure requirements of ASC 932, in addition to information about the investment in Condor that PEDEVCO accounts for under the equity method, as well as proved reserves attributable to PEDEVCO’s net equity interests in Condor. All oil and gas operations are located in the U.S.
(1) Capitalized costs relating to Oil and Gas Producing Activities:
|
2013
|
2012
|
|||||||
|
Unproved oil and gas properties
|
$ | 7,166,557 | 1,105,644 | |||||
|
Proved oil and gas properties
|
6,342,125 | 2,496,081 | ||||||
| 13,508,682 | 3,601,725 | |||||||
|
Accumulated depreciation, amortization and impairment
|
(4,706,043 | ) | (255,655 | ) | ||||
|
Net capitalized costs
|
$ | 8,802,639 | 3,346,070 | |||||
(2) Costs Incurred in Oil and Gas Property Acquisition and Development Costs:
|
2013
|
2012
|
|||||||
|
Acquisition of properties:
|
||||||||
|
Proved
|
$
|
2,797,197
|
$
|
95,906
|
||||
|
Unproved
|
6,060,907
|
78,426
|
||||||
|
Exploration costs
|
-
|
-
|
||||||
|
Development costs
|
1,048,853
|
1,703,159
|
||||||
|
$
|
9,906,957
|
$
|
1,877,491
|
|||||
(3) Results of Operations for Producing Activities:
|
2013
|
2012
|
|||||||
|
Sales
|
$
|
743,656
|
$
|
503,153
|
||||
|
Production costs
|
(648,462
|
)
|
(281,103
|
)
|
||||
|
Depletion, accretion and impairment
|
(4,450,381
|
)
|
(311,594
|
)
|
||||
|
Income tax benefit
|
-
|
-
|
||||||
|
Results of operations
|
$
|
(4,352,187
|
)
|
$
|
(89,544
|
)
|
||
(4) Reserve quantity information:
The supplemental unaudited presentation of proved reserve quantities and related standardized measure of discounted future net cash flows provides estimates only and does not purport to reflect realizable values or fair market values of the Company’s reserves. The Company emphasizes that reserve estimates are inherently imprecise and that estimates of new discoveries are more imprecise than those of producing oil and gas properties. Accordingly, significant changes to these estimates can be expected as future information becomes available. All of the Company’s reserves are located in the United States.
F-43
Proved reserves are those estimated reserves of crude oil (including condensate and natural gas liquids) and natural gas that geological and engineering data demonstrate with reasonable certainty to be recoverable in future years from known reservoirs under existing economic and operating conditions. Proved developed reserves are those expected to be recovered through existing wells, equipment, and operating methods.
The standardized measure of discounted future net cash flows is computed by applying the average first day of the month price of oil and gas during the 12 month period before the end of the year (with consideration of price changes only to the extent provided by contractual arrangements) to the estimated future production of proved oil and gas reserves, less the estimated future expenditures (based on year-end costs) to be incurred in developing and producing the proved reserves, less estimated future income tax expenses (based on year-end statutory tax rates, with consideration of future tax rates already legislated) to be incurred on pretax net cash flows less tax basis of the properties and available credits, and assuming continuation of existing economic conditions. The estimated future net cash flows are then discounted using a rate of 10 percent per year to reflect the estimated timing of the future cash flows.
The reserve estimates set forth below were prepared by Ryder Scott Company, L.P. (“Ryder Scott”), a professional engineering firm certified by the Texas Board of Professional Engineers (Registration number F-1580), under the direction of Michael F. Stell of Ryder Scott. Ryder Scott, and its employees, have no interest in our Company and were objective in determining our reserves.
The reserve estimates were prepared by Ryder Scott using reserve definitions and pricing requirements prescribed by the SEC.
Ryder Scott estimated the proved reserves for our properties by performance methods and analogy. All of the proved producing reserves attributable to producing wells and/or reservoirs were estimated by performance methods. These performance methods, such as decline curve analysis, utilized extrapolations of historical production and pressure data available through December 2013 in those cases where such data were considered to be definitive. The data utilized were furnished to Ryder Scott by the Company or obtained from public data sources. All of the proved developed non-producing and undeveloped reserves were estimated by analogy.
|
Estimated Quantities of Proved Oil and Gas Reserves
|
2013
|
|||||||
|
Oil
|
Gas
|
|||||||
|
(MBbls)
|
(Mmcf)
|
|||||||
|
Proved Developed Producing
|
53.9
|
78.0
|
||||||
|
Proved Developed Non-Producing
|
-
|
-
|
||||||
|
Total Proved Developed
|
53.9
|
78.0
|
||||||
|
Proved Undeveloped
|
84.9
|
176.0
|
||||||
|
Total Proved as of December 31, 2013
|
138.8
|
254.0
|
||||||
|
2013
|
||||||||
|
Oil
|
Gas
|
|||||||
|
(MBbls)
|
(Mmcf)
|
|||||||
|
Total Proved Reserves:
|
||||||||
|
Beginning of year
|
276.5
|
398.0
|
||||||
|
Extensions and discoveries
|
6.0
|
12.0
|
||||||
|
Revisions of previous estimates
|
(163.6
|
) |
(194.6)
|
|||||
|
Purchase of minerals in place
|
27.4
|
44.0
|
||||||
|
Production
|
(7.5
|
)
|
(5.4
|
) | ||||
|
End of year proved reserves
|
138.8
|
254.0
|
||||||
F-44
|
Estimated Quantities of Proved Oil and Gas Reserves
|
2012
|
|||||||
|
Oil
|
Gas
|
|||||||
|
(MBbls)
|
(Mmcf)
|
|||||||
|
Proved Developed Producing
|
49.7
|
21.0
|
||||||
|
Proved Developed Non-Producing
|
31.8
|
53.0
|
||||||
|
Total Proved Developed
|
81.5
|
74.0
|
||||||
|
Proved Undeveloped
|
195.0
|
324.0
|
||||||
|
Total Proved as of December 31, 2013
|
276.5
|
398.0
|
||||||
|
2012
|
||||||||
|
Oil
|
Gas
|
|||||||
|
(MBbls)
|
(Mmcf)
|
|||||||
|
Total Proved Reserves:
|
||||||||
|
Beginning of year
|
0.0
|
0.0
|
||||||
|
Extensions and discoveries
|
243.2
|
398.0
|
||||||
|
Revisions of previous estimates
|
0.0
|
0.0
|
||||||
|
Purchase of minerals in place
|
38.4
|
0.0
|
||||||
|
Production
|
(5.1
|
)
|
0.0
|
|||||
|
End of year proved reserves
|
276.5
|
398.0
|
||||||
The standardized measure of discounted future net cash flows, in management’s opinion, should be examined with caution. The basis for this table is the reserve studies prepared by independent petroleum engineering consultants, which contain imprecise estimates of quantities and rates of future production of reserves. Revisions of previous year estimates can have a significant impact on these results. Therefore, the standardized measure of discounted future net cash flow is not necessarily indicative of the fair value of the Company’s proved oil and natural gas properties.
Future income tax expense was computed by applying statutory rates, less the effects of tax credits for each period presented, to calculate the difference between pre-tax net cash flows relating to the Company’s proved reserves and the tax basis of proved properties, after consideration of available net operating loss and percentage depletion carryovers.
The following table sets forth the standardized measure of discounted future net cash flows (stated in thousands) relating to the proved reserves as of December 31, 2013:
|
($ 000's)
|
||||
|
For the year ended December 31, 2013
|
||||
|
Future Cash Inflows
|
$
|
13,991
|
||
|
Future production costs
|
(5,584
|
)
|
||
|
Future development costs
|
(5,117
|
)
|
||
|
Future income tax expense
|
-
|
|
||
|
Future net cash flows
|
3,290
|
|||
|
10% annual discount
|
(1,777
|
)
|
||
|
Standardized measure of discounted future net cash flows
|
$
|
1,513
|
||
F-45
|
Changes in Standardized Measure of Discounted Future Cash Flows
|
||||
|
($ 000's)
|
||||
|
Beginning of year
|
$
|
2,406
|
||
|
Sales and transfers of oil and gas produced, net of production costs
|
(95
|
) | ||
|
Net changes in prices and production costs
|
(1,475
|
)
|
||
|
Extensions, discoveries, additions and improved recovery, net of related costs
|
(28
|
) | ||
|
Development costs incurred
|
953
|
|||
|
Revisions of estimated development costs
|
3,212
|
|||
|
Revisions of previous quantity estimates
|
(2,719
|
) | ||
|
Accretion of discount
|
312
|
|||
|
Net change in income taxes
|
708
|
|
||
|
Purchases of reserves in place
|
1,067
|
|||
|
Sales of reserves in place
|
-
|
|||
|
Changes in timing and other
|
(2,828
|
) | ||
|
End of year
|
$
|
1,513
|
||
The following table sets forth the standardized measure of discounted future net cash flows (stated in thousands) relating to the proved reserves as of December 31, 2012:
|
($ 000's)
|
||||
|
For the year ended December 31, 2012
|
||||
|
Future Cash Inflows
|
$
|
26,036
|
||
|
Future production costs
|
(5,496
|
)
|
||
|
Future development costs
|
(9,914
|
)
|
||
|
Future income tax expense
|
(2,487
|
)
|
||
|
Future net cash flows
|
8,139
|
|||
|
10% annual discount
|
(5,733
|
)
|
||
|
Standardized measure of discounted future net cash flows
|
$
|
2,406
|
||
|
Changes in Standardized Measure of Discounted Future Cash Flows
|
||||
|
($ 000's)
|
||||
|
Beginning of year
|
$
|
-
|
||
|
Sales and transfers of oil and gas produced, net of production costs
|
(222)
|
|||
|
Net changes in prices and production costs
|
-
|
|||
|
Extensions, discoveries, additions and improved recovery, net of related costs
|
2,074
|
|||
|
Development costs incurred
|
-
|
|||
|
Revisions of estimated development costs
|
-
|
|||
|
Revisions of previous quantity estimates
|
-
|
|||
|
Accretion of discount
|
-
|
|||
|
Net change in income taxes
|
(708
|
)
|
||
|
Purchases of reserves in place
|
1,262
|
|||
|
Sales of reserves in place
|
-
|
|||
|
Changes in timing and other
|
-
|
|||
|
End of year
|
$
|
2,406
|
||
F-46
|
Capitalized costs relating to Oil and Gas producing activities of Equity Method Investees:
|
||||||||||||||||
|
Company's share of Equity Method Investees- Condor Energy Technology, LLC
|
Company's share of Equity Method Investees- White Hawk Petroleum LLC
|
|||||||||||||||
|
2013
|
2012
|
2013 (1)
|
2012
|
|||||||||||||
|
Unproved oil and gas properties
|
$
|
858,024
|
$
|
604,168
|
$
|
-
|
$
|
314,525
|
||||||||
|
Proved oil and gas properties
|
5,698,983
|
1,462,109
|
-
|
1,953,131
|
||||||||||||
|
Subtotal
|
6,557,007
|
2,066,277
|
-
|
2,267,656
|
||||||||||||
|
Accumulated depreciation, amortization and impairment
|
(5,850,191
|
)
|
(117,853
|
)
|
-
|
(107,236
|
)
|
|||||||||
|
Net capitalized costs
|
$
|
706,816
|
$
|
1,948,424
|
$
|
-
|
$
|
2,160,420
|
||||||||
|
(1)
|
As of December 31, 2013, White Hawk was 100% owned by the Company.
|
Capitalized costs relating to Oil and Gas producing activities of Equity Method Investees:
|
Company's share of Equity Method Investees- Total
|
||||||||
|
2013
|
2012
|
|||||||
|
Unproved oil and gas properties
|
$
|
858,024
|
$
|
918,693
|
||||
|
Proved oil and gas properties
|
5,698,983
|
3,415,240
|
||||||
|
Subtotal
|
6,557,007
|
4,333,933
|
||||||
|
Accumulated depreciation, amortization and impairment
|
(5,850,191)
|
(225,089
|
)
|
|||||
|
Net capitalized costs
|
$
|
706,816
|
4,108,844
|
|||||
Cost Incurred in Oil and Gas Property Acquisition and development costs of Equity Method Investees:
|
Company's share of Equity Method Investees- Condor Energy Technology, LLC
|
Company's share of Equity Method Investees- White Hawk Petroleum LLC
|
|||||||||||||||
|
2013
|
2012
|
2013 (1)
|
2012
|
|||||||||||||
|
Acquisition of properties
|
||||||||||||||||
|
Proved
|
$
|
4,236,874
|
$
|
6,790
|
$
|
-
|
$
|
1,490,034
|
||||||||
|
Unproved
|
236,856
|
338,496
|
-
|
314,525
|
||||||||||||
|
Exploration costs
|
-
|
-
|
-
|
-
|
||||||||||||
|
Development costs
|
-
|
1,082,913
|
-
|
463,097
|
||||||||||||
|
$
|
4,473,730
|
$
|
1,428,199
|
$
|
-
|
$
|
2,267,656
|
|||||||||
|
(1)
|
As of December 31, 2013, White Hawk was 100% owned by the Company.
|
F-47
Cost Incurred in Oil and Gas Property Acquisition and development costs of Equity Method Investees:
|
Company's share of Equity Method Investees-Total
|
||||||||
|
2013
|
2012
|
|||||||
|
Acquisition of properties
|
||||||||
|
Proved
|
$
|
4,236,874
|
$
|
1,496,824
|
||||
|
Unproved
|
236,856
|
653,021
|
||||||
|
Exploration costs
|
-
|
-
|
||||||
|
Development costs
|
-
|
1,546,010
|
||||||
|
$
|
4,473,730
|
$
|
3,695,855
|
|||||
Results of operations for producing activities for Equity Method Investees:
|
Company's share of Equity Method Investees- Condor Energy Technology, LLC
|
Company's share of Equity Method Investees- White Hawk Petroleum LLC
|
|||||||||||||||
|
2013
|
2012
|
2013 (1)
|
2012
|
|||||||||||||
|
Sales
|
$
|
955,993
|
$
|
130,760
|
$
|
-
|
$
|
273,171
|
||||||||
|
Production costs
|
(370,164
|
)
|
(84,974
|
)
|
-
|
(76,257
|
)
|
|||||||||
|
Depletion, accretion and impairment
|
(5,732,484
|
)
|
(117,890
|
)
|
-
|
(107,903
|
)
|
|||||||||
|
Income tax benefit
|
-
|
-
|
-
|
-
|
||||||||||||
|
Results of operations
|
$
|
(5,146,655
|
)
|
$
|
(72,104
|
)
|
$
|
-
|
$
|
89,011
|
||||||
|
(1)
|
As of December 31, 2013, White Hawk was 100% owned by the Company.
|
Results of operations for producing activities for Equity Method Investees:
|
Company's share of Equity Method Investees-Total
|
||||||||
|
2013
|
2012
|
|||||||
|
Sales
|
$
|
955,993
|
$
|
403,931
|
||||
|
Production costs
|
(370,164
|
)
|
(161,231
|
)
|
||||
|
Depletion, accretion and impairment
|
(5,732,484
|
)
|
(225,792
|
)
|
||||
|
Income tax benefit
|
-
|
-
|
||||||
|
Results of operations
|
$
|
(5,146,655
|
) |
$
|
16,908
|
|||
F-48
|
Estimated Quantities of Proved Oil and Gas Reserves of Equity Method Investees
|
Company's share of Equity Method Investees- Condor Energy Technology, LLC
|
|||||||
|
Oil
|
Gas
|
|||||||
|
As of December 31, 2013
|
(MBbls)
|
(Mmcf)
|
||||||
|
Proved Developed Producing
|
35.5
|
73.4
|
||||||
|
Proved Developed Non-Producing
|
-
|
-
|
||||||
|
Total Proved Developed
|
35.5
|
73.4
|
||||||
|
Proved Undeveloped
|
218.8
|
454.0
|
||||||
|
Total Proved as of December 31
|
254.3
|
527.4
|
||||||
|
Estimated Quantities of Proved Oil and Gas Reserves of Equity Method Investees
|
Company's share of Equity Method Investees-Total
|
|||||||
|
Oil
|
Gas
|
|||||||
|
As of December 31, 2013
|
(MBbls)
|
(Mmcf)
|
||||||
|
Proved Developed Producing
|
35.5
|
73.4
|
||||||
|
Proved Developed Non-Producing
|
-
|
-
|
||||||
|
Total Proved Developed
|
35.5
|
73.4
|
||||||
|
Proved Undeveloped
|
218.8
|
454.0
|
||||||
|
Total Proved as of December 31, 2013
|
254.3
|
527.4
|
||||||
|
Estimated Quantities of Proved Oil and Gas Reserves of Equity Method Investees
|
Company's share of Equity Method Investees- Condor Energy Technology, LLC
|
Company's share of Equity Method Investees- White Hawk Petroleum LLC
|
||||||||||||||
|
Oil
|
Gas
|
Oil
|
Gas
|
|||||||||||||
|
As of December 31, 2012
|
(MBbls)
|
(Mmcf)
|
(MBbls)
|
(Mmcf)
|
||||||||||||
|
Proved Developed Producing
|
8.3
|
13.8
|
11.2
|
20.5
|
||||||||||||
|
Proved Developed Non-Producing
|
20.8
|
34.4
|
0.0
|
0.0
|
||||||||||||
|
Total Proved Developed
|
29.1
|
48.2
|
11.2
|
20.5
|
||||||||||||
|
Proved Undeveloped
|
323.2
|
536.6
|
127.5
|
181.0
|
||||||||||||
|
Total Proved as of December 31, 2012
|
352.3
|
584.8
|
138.7
|
201.5
|
||||||||||||
|
Estimated Quantities of Proved Oil and Gas Reserves of Equity Method Investees
|
Company's share of Equity Method Investees-Total
|
|||||||
|
Oil
|
Gas
|
|||||||
|
As of December 31, 2012
|
(MBbls)
|
(Mmcf)
|
||||||
|
Proved Developed Producing
|
19.5
|
34.3
|
||||||
|
Proved Developed Non-Producing
|
20.8
|
34.4
|
||||||
|
Total Proved Developed
|
40.3
|
68.7
|
||||||
|
Proved Undeveloped
|
450.7
|
717.6
|
||||||
|
Total Proved as of December 31, 2012
|
491.0
|
786.3
|
||||||
F-49
|
Company's share of Equity Method Investees- Condor Energy Technology, LLC
|
||||||||
|
As of December 31, 2013
|
Oil
|
Gas
|
||||||
|
(MBbls)
|
(Mmcf)
|
|||||||
|
Total Proved Reserves:
|
||||||||
|
Beginning of year
|
352.3
|
584.8
|
||||||
|
Extensions and discoveries
|
87.9
|
179.3
|
||||||
|
Revisions of previous estimates
|
(211.9
|
) |
(300.8
|
) | ||||
|
Purchase of minerals in place
|
36.1
|
71.5
|
||||||
|
Production
|
(10.1
|
)
|
(7.4
|
) | ||||
|
End of year proved reserves
|
254.3
|
527.4
|
||||||
|
Company's share of Equity Method Investees-Total
|
||||||||
|
As of December 31, 2013
|
Oil
|
Gas
|
||||||
|
(MBbls)
|
(Mmcf)
|
|||||||
|
Total Proved Reserves:
|
||||||||
|
Beginning of year
|
352.3
|
584.8
|
||||||
|
Extensions and discoveries
|
87.9
|
179.3
|
||||||
|
Revisions of previous estimates
|
(211.9
|
) |
(300.8
|
) _ | ||||
|
Purchase of minerals in place
|
36.1
|
71.5
|
||||||
|
Production
|
(10.1
|
)
|
(7.4
|
)
|
||||
|
End of year proved reserves
|
254.3
|
527.4
|
||||||
|
Company's share of Equity Method Investees- Condor Energy Technology, LLC
|
Company's share of Equity Method Investees- White Hawk Petroleum LLC
|
|||||||||||||||
|
As of December 31, 2012
|
Oil
|
Gas
|
Oil
|
Gas
|
||||||||||||
|
(MBbls)
|
(Mmcf)
|
(MBbls)
|
(Mmcf
)
|
|||||||||||||
|
Total Proved Reserves:
|
||||||||||||||||
|
Beginning of year
|
0.0
|
0.0
|
0.0
|
0.0
|
||||||||||||
|
Extensions and discoveries
|
353.8
|
584.8
|
6.2
|
1.8
|
||||||||||||
|
Revisions of previous estimates
|
0.0
|
0.0
|
0.0
|
0.0
|
||||||||||||
|
Purchase of minerals in place
|
0.0
|
0.0
|
135.0
|
202.5
|
||||||||||||
|
Production
|
(1.5
|
)
|
0.0
|
(2.6
|
)
|
(2.8
|
)
|
|||||||||
|
End of year proved reserves
|
352.3
|
584.8
|
138.6
|
201.5
|
||||||||||||
F-50
|
Company's share of Equity Method Investees-Total
|
||||||||
|
As of December 31, 2012
|
Oil
|
Gas
|
||||||
|
(MBbls)
|
(Mmcf)
|
|||||||
|
Total Proved Reserves:
|
||||||||
|
Beginning of year
|
0.0
|
0.0
|
||||||
|
Extensions and discoveries
|
360.0
|
586.6
|
||||||
|
Revisions of previous estimates
|
0.0
|
0.0
|
||||||
|
Purchase of minerals in place
|
135.0
|
202.5
|
||||||
|
Production
|
(4.0
|
)
|
(2.8
|
)
|
||||
|
End of year proved reserves
|
491.0
|
786.3
|
||||||
The following table sets forth the Company’s share of the Equity Method Investees’ standardized measure of discounted future net cash flows (stated in thousands) relating to the proved reserves as of December 31, 2013:
|
Condor Energy Technology, LLC
|
Company's share of Equity Method Investees- Total
|
|||||||
|
For the year ended December 31, 2013 (000's)
|
||||||||
|
Future Cash Inflows
|
$
|
25,472
|
$
|
25,472
|
||||
|
Future production costs
|
(9,585
|
)
|
(9,585
|
)
|
||||
|
Future development costs
|
(12,845
|
)
|
(12,845
|
)
|
||||
|
Future income tax expense
|
(1,191
|
)
|
(1,191
|
)
|
||||
|
Future net cash flows
|
1,851
|
1,851
|
||||||
|
10% annual discount
|
(1,798
|
)
|
(1,798
|
)
|
||||
|
Standardized measure of discounted future net cash flows
|
$
|
53
|
$
|
53
|
||||
|
Condor Energy
Technology, LLC
|
Company's share of Equity Method Investees- Total
|
|||||||
|
Changes in Standardized Measure of Discounted Future Cash Flows (000s)
|
||||||||
|
December 31, 2012
|
$ | 497 | $ | 497 | ||||
|
Sales and transfers of oil and gas produced, net of production costs
|
(586 | ) | (587 | ) | ||||
|
Net changes in prices and production costs
|
(1,018 | ) | (1,018 | ) | ||||
|
Extensions, discoveries, additions and improved recovery, net of related costs
|
102 | 102 | ||||||
|
Development costs incurred
|
1,356 | 1,356 | ||||||
|
Revisions of estimated development costs
|
5,278 | 5,278 | ||||||
|
Revisions of previous quantity estimates
|
(2,164 | ) | (2,164 | ) | ||||
|
Accretion of discount
|
205 | 205 | ||||||
|
Net change in income taxes
|
978 | 978 | ||||||
|
Purchases of reserves in place
|
162 | 162 | ||||||
|
Sales of reserves in place
|
- | - | ||||||
|
Changes in timing and other
|
(4,757 | ) | (4,757 | ) | ||||
|
December 31, 2013
|
$ | 53 | $ | 53 | ||||
F-51
The following table sets forth the Company’s share of the Equity Method Investees’ standardized measure of discounted future net cash flows (stated in thousands) relating to the proved reserves as of December 31, 2012:
|
Condor Energy Technology, LLC
|
White Hawk Petroleum, LLC
|
Company's share of Equity Method Investees- Total
|
||||||||||
|
For the year ended December 31, 2012 (000's)
|
||||||||||||
|
Future Cash Inflows
|
$
|
33,228
|
$
|
14,594
|
$
|
47,822
|
||||||
|
Future production costs
|
(6,784
|
)
|
(6,147
|
)
|
(12,931
|
)
|
||||||
|
Future development costs
|
(15,044
|
)
|
(4,377
|
)
|
(19,421
|
)
|
||||||
|
Future income tax expense
|
(4,457
|
)
|
(1,589
|
)
|
(6,046
|
)
|
||||||
|
Future net cash flows
|
6,943
|
2,481
|
9,424
|
|||||||||
|
10% annual discount
|
(6,446
|
)
|
(1,364
|
)
|
(7,810
|
)
|
||||||
|
Standardized measure of discounted future net cash flows
|
$
|
497
|
$
|
1,117
|
$
|
1,614
|
||||||
|
Condor Energy Technology, LLC
|
White Hawk Petroleum, LLC
|
Company's share of Equity Method Investees- Total
|
||||||||||
|
Changes in Standardized Measure of Discounted Future Cash Flows (000s)
|
||||||||||||
|
December 31, 2011
|
|
$
|
-
|
$
|
-
|
$
|
-
|
|||||
|
Sales and transfers of oil and gas produced, net of production costs
|
(46
|
)
|
(197
|
)
|
(243
|
)
|
||||||
|
Net changes in prices and production costs
|
-
|
-
|
-
|
|||||||||
|
Extensions, discoveries, additions and improved recovery, net of related costs
|
2,099
|
328
|
2,427
|
|||||||||
|
Development costs incurred
|
-
|
-
|
-
|
|||||||||
|
Revisions of estimated development costs
|
-
|
-
|
-
|
|||||||||
|
Revisions of previous quantity estimates
|
-
|
-
|
-
|
|||||||||
|
Accretion of discount
|
-
|
-
|
-
|
|||||||||
|
Net change in income taxes
|
(1,556
|
)
|
(904
|
)
|
(2,460
|
)
|
||||||
|
Purchases of reserves in place
|
-
|
1,890
|
1,890
|
|||||||||
|
Sales of reserves in place
|
-
|
-
|
-
|
|||||||||
|
Changes in timing and other
|
-
|
-
|
-
|
|||||||||
|
December 31, 2012
|
$
|
497
|
$
|
1,117
|
$
|
1,614
|
||||||
F-52
TABLE OF CONTENTS
Part I Financial InformationItem 1. Financial StatementsNote 1 Basis Of PresentationNote 2 Description Of BusinessNote 3 Summary Of Significant Accounting PoliciesNote 4 - Merger Agreement Pacific Energy Development CorpNote 5 Oil and Gas PropertiesNote 6 Deposit For Business AcquisitionNote 7 EquipmentNote 8 Notes ReceivableNote 9 Equity Method InvestmentsNote 10 Notes PayableNote 11 Derivative LiabilitiesNote 12 CommitmentsNote 13 Preferred StockNote 14 Common StockNote 15 Stock Options and WarrantsNote 16 Related Party TransactionsNote 17 Income TaxesNote 18 Prior Year RestatementsNote 19 Subsequent Events