PENUMBRA INC
10-Ks and 10-Qs
|
|
|
|
|
|
|
|
|
|
|
|
|
|
|
|
|
|
|
|
|
|
|
|
|
|
|
|
|
|
|
|
|
|
|
|
|
|
UNITED STATES
SECURITIES AND EXCHANGE COMMISSION
Washington, D.C. 20549
FORM 10-K
(Mark One)
|
x
|
ANNUAL REPORT PURSUANT TO SECTION 13 OR 15(d) OF THE SECURITIES EXCHANGE ACT OF 1934
|
For the fiscal year ended
December 31, 2015
or
|
o
|
TRANSITION REPORT PURSUANT TO SECTION 13 OR 15(d) OF THE SECURITIES EXCHANGE ACT OF 1934
|
For the transition period from _____ to _____
Commission file number: 001-37557
Penumbra, Inc.
(Exact Name of Registrant as Specified in Its Charter)
|
Delaware
|
05-0605598
|
|
|
(State or Other Jurisdiction of
Incorporation or Organization)
|
(I.R.S. Employer
Identification No.)
|
|
|
One Penumbra Place
1351 Harbor Bay Parkway
Alameda, CA
|
94502
|
|
|
(Address of Principal Executive Offices)
|
(Zip Code)
|
|
(510) 748-3200
(Registrant’s telephone number, including area code)
Securities registered pursuant of Section 12(b) of the Act:
|
Title of each class
|
Name of Each Exchange on Which Registered
|
|
|
Common Stock, Par value $0.001 per share
|
The New York Stock Exchange
|
|
Securities registered pursuant of Section 12(g) of the Act:
None
Indicate by check mark if the registrant is a well-known seasoned issuer, as defined in Rule 405 of the Securities Act. Yes:
o
No:
x
Indicate by check mark if the registrant is not required to file reports pursuant to Section 13 or Section 15(d) of the Act. Yes:
o
No:
x
Indicate by check mark whether the registrant (1) has filed all reports required to be filed by Section 13 or 15(d) of the Securities Exchange Act of 1934 during the preceding 12 months (or for such shorter period that the registrant was required to file such reports), and (2) has been subject to such filing requirements for the past 90 days. Yes:
x
No:
o
Indicate by check mark whether the registrant has submitted electronically and posted on its corporate Web site, if any, every Interactive Data File required to be submitted and posted pursuant to Rule 405 of Regulation S-T (
§
232.405 of this chapter) during the preceding 12 months (or for such shorter period that the registrant was required to submit and post such files). Yes:
x
No:
o
Indicate by check mark if disclosure of delinquent filers pursuant to Item 405 of Regulation S-K (
§
229.405 of this chapter) is not contained herein, and will not be contained, to the best of registrant’s knowledge, in definitive proxy or information statements incorporated by reference in Part III of this Form 10-K or any amendment to this Form 10-K. Yes:
o
No:
o
Indicate by check mark whether the registrant is a large accelerated filer, an accelerated filer, a non-accelerated filer or a smaller reporting company. See the definitions of “large accelerated filer,” “accelerated filer” and “smaller reporting company” in Rule 12b-2 of the Exchange Act. (Check one):
|
Large accelerated filer
|
o
|
Accelerated filer
|
o
|
|
|
Non-accelerated filer
|
x
|
(Do not check if a smaller reporting Company)
|
Smaller reporting company
|
o
|
Indicate by check mark whether the registrant is a shell company (as defined in Rule 12b-2 of the Act). Yes:
o
No:
x
The registrant was not a public company as of the last business day of its most recently completed second fiscal quarter and therefore cannot calculate the aggregate market value of its voting and nonvoting common equity held by nonaffiliates as of such date.
As of
January 31, 2016
, the registrant had
29,978,983
shares of common stock, par value $0.001 per share, outstanding.
DOCUMENTS INCORPORATED BY REFERENCE
Portions of the registrant’s definitive proxy statement for its 2016 annual meeting of stockholders, which is to be filed not more than 120 days after the registrants fiscal year ended
December 31, 2015
, are incorporated by reference into Part III of this Annual Report on Form 10-K.
Penumbra, Inc.
FORM 10-K
TABLE OF CONTENTS
|
|
Page
|
|
|
Item 1.
|
||
|
Item 1A.
|
||
|
Item 1B.
|
||
|
Item 2.
|
||
|
Item 3.
|
||
|
Item 4.
|
||
|
Item 5.
|
||
|
Item 6.
|
||
|
Item 7.
|
||
|
Item 7A.
|
||
|
Item 8.
|
||
|
Item 9.
|
||
|
Item 9A.
|
||
|
Item 9B.
|
||
|
Item 10.
|
||
|
Item 11.
|
||
|
Item 12.
|
||
|
Item 13.
|
||
|
Item 14.
|
||
|
Item 15.
|
||
1
FORWARD-LOOKING STATEMENTS
This Annual Report on Form 10-K includes forward-looking statements in addition to historical information. These forward-looking statements are included throughout this Form 10-K, including in the sections entitled “Business,” “Risk Factors,” “Management’s Discussion and Analysis of Financial Condition and Results of Operations,” and in other sections of this Form 10-K. In some cases, you can identify these statements by forward-looking words such as “may,” “might,” “will,” “should,” “expects,” “plans,” “anticipates,” “believes,” “estimates,” “predicts,” “potential,” “opportunity” or “continue,” the negative of these terms and other comparable terminology. These forward-looking statements, which are subject to risks, uncertainties and assumptions about us, may include projections of our future financial performance, our anticipated growth strategies and anticipated trends in our business.
These statements are only predictions based on our current expectations and projections about future events. There are important factors that could cause our actual results, level of activity, performance or achievements to differ materially from the results, level of activity, performance or achievements expressed or implied by the forward-looking statements, including those factors discussed in the section titled “Risk Factors.” You should specifically consider the numerous risks outlined in the section titled “Risk Factors.” Although we believe the expectations reflected in the forward-looking statements are reasonable, we cannot guarantee future results, level of activity, performance or achievements. We undertake no obligation to update any forward-looking statements made in this Form 10-K to reflect events or circumstances after the date of this Form 10-K or to reflect new information or the occurrence of unanticipated events, except as required by law.
2
Overview
References herein to “we,” “us,” “our,” “Company,” and “Penumbra,” refer to Penumbra, Inc. and its consolidated subsidiaries unless the context specifically states otherwise.
Penumbra is a global interventional therapies company that designs, develops, manufactures and markets innovative medical devices. We have a broad portfolio of products that addresses challenging medical conditions and significant clinical needs across two major markets, neuro and peripheral vascular. The conditions that our products address include, among others, ischemic stroke, hemorrhagic stroke and various peripheral vascular conditions that can be treated through thrombectomy and embolization procedures.
We are an established company focused on the neuro market, and we recently expanded our business to include the peripheral vascular market. We focus on developing, manufacturing and marketing products for use by specialist physicians, including interventional neuroradiologists, neurosurgeons, interventional neurologists, interventional radiologists and vascular surgeons. We design our products to provide these specialist physicians with a means to drive improved clinical outcomes through faster and safer procedures.
We attribute our success to our culture built on cooperation, our highly efficient product innovation process, our disciplined approach to product and commercial development, our deep understanding of our target end markets and our relationships with specialist physicians. We believe these factors have enabled us to rapidly innovate in a highly capital-efficient manner.
Since our founding in 2004, we have had a strong track record of organic product development and commercial expansion that has established the foundation of our global organization. Some of our key accomplishments include:
|
•
|
launching our first product, for neurovascular access, in the U. S. in 2007;
|
|
•
|
establishing our direct neuro salesforce in the U. S. and Europe in 2008;
|
|
•
|
launching the first 510(k)-cleared, aspiration-based product for the treatment of ischemic stroke patients in 2008, and launching four subsequent generations of that product;
|
|
•
|
launching our first neurovascular coil for the treatment of brain aneurysms in 2011;
|
|
•
|
launching our first peripheral vascular product in 2013; and
|
|
•
|
establishing our direct peripheral vascular salesforce in the U. S. and Europe in 2014.
|
We sell our products to hospitals primarily through our direct sales organization in the U. S., most of Europe, Canada and Australia, as well as through distributors in select international markets. In 2015, we generated revenue of
$186.1 million
, which represents a
48.3%
increase over
2014
, and
$4.2 million
in operating income as compared to an operating income of
$3.0 million
in
2014
. For the year ended
December 31, 2014
, we generated revenue of
$125.5 million
, which represented a
41.3%
increase over
2013
, and
$3.0 million
in operating income as compared to an operating loss of $1.1 million in
2013
.
3
Our Products
Since our founding in 2004, we have invested in expanding our product development and marketing capabilities. These investments have included engineering and materials science capabilities, pre-clinical and bench-testing infrastructure and in-house clinical and regulatory infrastructure. Our fully-integrated organization has enabled us to launch 16 product brands for access, thrombectomy and embolization since 2007 to service our two target end markets. The following table summarizes our product offerings in each of our target end markets:

4
OUR NEURO PRODUCTS
Neurovascular Access
Accessing the brain through the tortuous neurovasculature has been a substantial challenge for physicians treating vascular disorders in the brain. Companies developing products for neurovascular applications have historically leveraged technologies developed for use in coronary or peripheral vascular interventions. This approach created challenges given the vastly different anatomy, structure and sizing of the neurovascular vessels.
Our portfolio of neurovascular access products includes our Neuron Access System catheters, BENCHMARK Intracranial Access System catheters and a variety of microcatheters.
Neuron Access System
We recognized the challenges posed by existing access technologies and focused our initial efforts on developing a guide catheter system designed specifically for neurointerventional procedures. Our Neuron delivery catheter is a variable stiffness guide catheter with increased support in the aortic arch, which enables trackability to access the intracranial vasculature. The design of Neuron enables physicians to position the catheter much higher in the anatomy than conventional guide catheters.
We believe the Neuron family of guide catheters and the Penumbra distal delivery catheters that we subsequently introduced have enabled many neuro-endovascular procedures that previously had not been possible in the tortuous anatomy of the neurovasculature. We have continued our development and currently offer a wide range of catheters that enable delivery of the different therapeutic catheters that are required for ischemic and hemorrhagic stroke interventions. Our Neuron products include the following:
|
•
|
The Neuron Intracranial Access System
is indicated for the introduction of interventional devices into the peripheral, coronary and neuro vasculature. The system is a two-catheter system comprised of the Neuron Delivery Catheter and the Select Catheter.
|
|
•
|
The Neuron Delivery Catheter
is a variable stiffness, large lumen catheter that combines proximal arch support with a microcatheter-like distal segment that is designed to access the intracranial anatomy. The Neuron can be used individually with a 0.038 inch guidewire, or together with the Neuron Select Catheter, to access the desired location.
|
|
•
|
The Select Catheter
is a single lumen, braid-reinforced, torquable catheter with a radiopaque distal end and a hub on the proximal end. The Select Catheter enables primary access with the Neuron Delivery Catheters, obviating the need for an extra guide catheter.
|
|
•
|
The Neuron MAX System
is an additional configuration to the currently available Neuron Intracranial Access System. The Neuron MAX System is a long sheath catheter with a flexible distal tip for neurovascular use and provides a larger lumen to enable a wide range of device compatibility in neurovascular procedures.
|
BENCHMARK Intracranial Access System
Advances in our catheter technology, driven largely by our advances in ischemic stroke therapy, have enabled us to further develop our intracranial access category of products. Our latest development in this category is the BENCHMARK catheter, which features additional improvements in ease-of-use, trackability, and aortic arch support that we believe will further enhance our position in the neurovascular access market.
The BENCHMARK catheter technology achieves these improvements by combining our advanced tracking technology with the original Neuron intracranial access concept. In addition to improved proximal support in the arch through multi-geometry metal reinforcement, the distal tip is softer and more trackable, while maintaining complete distal shaft radiopacity for improved visualization. The BENCHMARK also is available pre-packaged with a Select catheter to obviate the need for a neurovascular guide catheter exchange, which reduces the number of devices needed per procedure and shortens procedure times.
Ischemic Stroke
Penumbra System
We developed our aspiration-based Penumbra System family of products to enable specialist physicians to revascularize blood vessels that are blocked by clots in the intracranial vasculature. We launched our first Penumbra System product in 2008 in the U. S.. We believe ACE, launched in June 2013, and ACE 64, launched in May 2015, represent significant advancements over prior generations of the Penumbra System.
5
Overview of the Penumbra System
Our Penumbra System family of products is comprised of several principal components, which include:
|
•
|
Penumbra Reperfusion Catheters
are the cornerstone of the Penumbra System and are manufactured using a variety of proprietary processes and materials science innovations. We have launched five successive generations of Reperfusion Catheters since 2008.
|
|
•
|
The latest generation of our Reperfusion Catheters, the ACE family of catheters, represents our most powerful and trackable Reperfusion Catheters launched to date. Its design enables specialist physicians to track these large bore aspiration catheters to the distal locations of occluded vessels. Once at the site of the occlusion, ACE provides significantly greater aspiration power than our prior Reperfusion Catheters, which we believe contributes to improved clinical outcomes and reduced procedure times.
|
|
•
|
ACE 64, our latest generation of ACE catheter, is designed to offer enhanced aspiration power relative to prior generations of the product, while maintaining trackability. ACE 64 launched in the U. S. in late May 2015.
|
|
•
|
Penumbra Separators
are a component of the earlier generations of the Penumbra System and enable a physician to remove an aspirated clot that has aggregated in the Reperfusion Catheter during the procedure. The Separators were an important component of our earlier Penumbra System due to the smaller diameter of our original Reperfusion Catheters, which resulted in frequent obstruction of the catheter. With the launch of our larger diameter ACE, Separators are less frequently used by physicians.
|
|
•
|
3D
is a stent retriever component of the Penumbra System that allows a physician to combine direct aspiration with stent retriever technology. 3D is being evaluated in a clinical study pursuant to an Investigational Device Exemption (IDE) to obtain clearance under Section 510(k) of the Federal Food, Drug, and Cosmetic Act (FD&C Act). With 198 of the anticipated 230 patients enrolled, the Data Safety Monitoring Board for this study recently temporarily suspended further enrollment in order to assess the data. The Board indicated that the suspension was not due to safety issues.
|
|
•
|
Penumbra Aspiration Pumps
are attached to our Reperfusion Catheters and provide the aspirating suction force. Our second generation MAX Aspiration Pump features increased aspiration capabilities and an improved, easier to use design. We have standardized the MAX Aspiration Pump to work with all generations of our Reperfusion Catheters.
|
Evolution of Penumbra System’s Reperfusion Catheters
The Penumbra System Reperfusion Catheters are the foundation of the Penumbra System. The principal generations of our Reperfusion Catheters include the original Penumbra System, Penumbra System MAX, Penumbra System ACE and Penumbra System ACE 64. We have introduced five successive generations of these catheters since early 2008. Each subsequent generation of our Reperfusion Catheters has incorporated significant performance enhancements relative to prior generations with regard to trackability and aspiration power.
6
The Generations of the Penumbra System
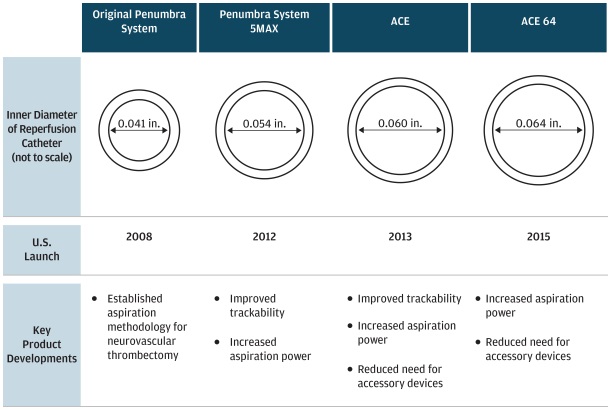
The Original Penumbra System
Our original Penumbra System was CE-marked in September 2006 and 510(k) cleared by the U.S. Food and Drug Administration (FDA) in December 2007. The Penumbra System is intended for use in the revascularization of patients with ischemic stroke within eight hours of symptom onset.
Our original Penumbra System was evaluated in the Penumbra Pivotal study, a 125 patient clinical study to assess the safety and effectiveness of the Penumbra System in the revascularization of patients presenting with ischemic stroke. This study was sponsored by Penumbra to support and obtain regulatory clearance for the original Penumbra System. The Penumbra Pivotal study demonstrated an 81.6% success rate in achieving successful revascularization. The study was completed in 2007 and the results were published in the journal
Stroke
in 2009.
We had commissioned and subsequently evaluated the Penumbra System in our THERAPY study, a clinical study comparing the clinical outcomes in the medical management of stroke patients with IV recombinant tPA (rtPA) to stroke patients treated with a combination of IV rtPA and the Penumbra System. The THERAPY study was commenced in March 2012, and was designed to enroll up to 692 patients, but was stopped early in October 2014, because the positive results of the MR CLEAN study made it unethical to continue to treat the control group in the THERAPY study with medical management rather than with endovascular treatment. The MR CLEAN study demonstrated the superiority of endovascular treatment of stroke over medical management. As a result, the steering committee for THERAPY recommended stopping enrollment for the trial. The THERAPY study results, after the randomization of 108 patients, were presented in April 2015 at the European Stroke Organization Conference and the manuscript is being prepared for submission to a peer-reviewed journal. Despite the early termination of the study, the pre-specified per protocol analysis demonstrated a significant benefit of combined treatment with IV rtPA and the Penumbra System over IV rtPA alone.
Penumbra System MAX
The Penumbra System MAX applies our advanced tracking technology and improved aspiration power to the Penumbra System’s aspiration platform. Launched in 2011, the 3MAX and 4MAX Systems feature MAX Tracking Technology that allows access over a solo guidewire for an even faster, easier procedure than with our original Penumbra System. The proximal shaft of these specialized catheters incorporates tapering, larger diameters, enabling increased aspiration power. In August 2012, we launched the 5MAX, which added our MAX Tracking Technology to an even larger dimension Reperfusion Catheter.
7
ACE
Almost a decade of research and product development culminated in the introduction of our first ACE Reperfusion Catheter in July 2013. ACE features a unique tapered design, large lumen diameter and other developments that result in significantly greater aspiration power and improved trackability compared to our earlier original Penumbra System and Penumbra MAX products.
Given its improved aspiration power and larger lumen size, our ACE Reperfusion Catheter can enable the extraction of a fibrous thrombus without fragmentation and often in one solid piece. This leaves the longitudinal fibrin strands in the clot intact, allowing the thrombus to retain its integrity. We believe this is evidenced in our post-launch clinical experience, in which clinicians have seen high rates of TICI 3 revascularization, representing complete recanalization of the affected area, using our ACE catheters.
Our ACE 64 Reperfusion Catheter was launched in the U. S. in May 2015. It is built on our ACE platform and offers an increased lumen diameter, which leads to further increased aspiration power and which we believe will aid in the removal of clot from the neurovasculature.
Neurovascular Embolization
Given the minimal product differentiation among the existing coils on the market, we concluded that to initially penetrate this market successfully we would have to develop a coil that was materially easier to deliver, and provided a procedural economic advantage. We also identified a segment of aneurysms that traditional neurovascular coils could not effectively treat on a cost effective basis. These included larger aneurysms and other larger, more complex lesions. We estimate that these aneurysms and lesions currently represent less than 10% of the addressable aneurysms.
The Penumbra Coil 400
We developed our Penumbra Coil 400 to offer an improved alternative for the treatment of larger aneurysms and other larger, more complex lesions. We implemented several proprietary design innovations to enable the coil to maintain shape while achieving biomechanically stable occlusion. Our coil system is composed of a platinum embolization coil complemented by a nitinol inner structure and stretch resistant nitinol wire. It is attached to a composite delivery pusher with a radiopaque positioning marker. The Penumbra Detachment Handle offers instant mechanical detachment of the coil and can be controlled by the physician in the sterile field.
We received 510(k) clearance for the Penumbra Coil 400 in 2011. The Penumbra Coil system is FDA cleared for endovascular embolization of intracranial aneurysms and other neurovascular abnormalities.
Review of Penumbra Coil 400 Clinical Performance
Given the size and handling of the Penumbra Coil 400, it is able to achieve higher packing density with fewer coils compared to competitive coiling systems. These findings have been confirmed in numerous physician sponsored post-marketing studies. Collectively, the clinical studies have shown that use of the Penumbra Coil 400 resulted in:
|
•
|
less retreatments or worsening occlusions;
|
|
•
|
larger aneurysm treatment capabilities;
|
|
•
|
higher packing density; and
|
|
•
|
fewer coils per aneurysm.
|
Penumbra SMART Coil
Leveraging our initial experience treating larger aneurysms and more complex lesions with the Penumbra Coil 400, we turned our efforts to developing a standard sized coil to compete in the traditional, smaller neurovascular coil market. While the market has seen significant growth over the last 15 years, there has been very little innovation in the last several years with regard to coil design, material science and performance. As a result, neurovascular coils built on the traditional, smaller-coil platform offer very little differentiation in terms of materials, ease-of-use and trackability.
In light of these dynamics, we focused our development efforts on a coil that would improve ease of delivery, or “feel” of the coil compared to the leading established coils. In order to accomplish this, our engineering team developed a highly sophisticated coil that dramatically changes its softness profile within the span of a single individual coil. This progressive softness feature enables physicians to pack the coil into a delicate lesion and mitigate catheter kick-back at the end of delivery, which can preclude the successful complete embolization of the lesion.
8
The Penumbra SMART Coil is designed to treat patients with a wide range of neurovascular lesions, including the small and medium sized aneurysms that comprise the majority of the neurovascular coiling market. Alternative products available to physicians in this market are offered in single levels of softness - standard, soft or extra soft.
The three principal levels of softness that competitors offer are derived from using smaller platinum filaments to increase the level of softness. However, this methodology does not allow for changes to the softness level within an individual coil. The design of the Penumbra SMART Coil allows the level of softness to be determined not only by the diameter of the platinum filament, but also by a structural component inside the coil itself. This development enables the Penumbra SMART Coil to become progressively softer within the span of an individual coil.
We introduced our SMART Coil in the fourth quarter of 2015. We believe that it will provide us with another important opportunity to offer specialist physicians a broader suite of products to address their neurovascular coiling needs.
Neurosurgical Tools
The Apollo System
We received 510(k) clearance from the FDA for our first neurosurgical product, the Apollo System, in 2014. The Apollo system leverages our expertise in thrombectomy and access to offer a minimally invasive approach to surgical removal of fluid and tissue from the ventricles in the brain.
The Apollo system is comprised of two primary components:
|
•
|
the Apollo wand that is inserted into the brain through an endoscope, which, in turn, is inserted through a small burr hole into the skull; and
|
|
•
|
a reusable hardware device that delivers vacuum, irrigation and vibrational energy along the disposable wand to the site of the hemorrhage.
|
OUR PERIPHERAL VASCULAR PRODUCTS
After initially focusing our business on our neuro products, we identified the peripheral vascular market as an ideal opportunity to leverage our neuro experience and our core expertise in thrombectomy, embolization and access technologies to develop new products that could address significant clinical needs cost effectively.
The peripheral vasculature suffers from disorders that are very similar to those experienced in the neurovasculature that our products already successfully address. For example, weakening of the vascular walls can result in aneurysms, and blockages can form as the result of embolism or advanced atherosclerosis. Just as the disruption of blood flow to the brain has high mortality and morbidity, disruptions in the peripheral vasculature can also have serious adverse consequences.
The peripheral vasculature also presents unique challenges that do not apply to interventional efforts in the brain. Many peripheral arteries and veins are significantly larger than those found in the brain and therefore have higher blood flow rates. More importantly, they must be able to accommodate larger pressure gradients and sustain structural integrity despite substantial movement and flexing of the organs and musculature that surround them. Imaging can also be more challenging as physicians have to view their equipment through many more layers of organs and tissue than in the brain.
In 2012, we began investing further in research and development to evaluate and identify potential solutions to address significant clinical needs in the peripheral vasculature. Our products for the treatment of peripheral vascular disease focus on:
|
•
|
peripheral vascular embolization;
|
|
•
|
vessel occlusion; and
|
|
•
|
peripheral vascular thrombectomy.
|
Peripheral Embolization
Ruby Coil System
After completing research and development focusing on the specific requirements of the peripheral embolization market, we launched our Ruby Coil System for use in the peripheral vascular market in 2013. The Ruby Coil System consists of detachable coils that are specifically designed for peripheral applications. The Ruby coils have a controlled mechanical detachment mechanism that permits the physician to deliver and reposition the coil until the final satisfactory position is reached before detachment. Compared to pushable coils, this minimizes costly complications like embolizing unintended vessels.
9
The Ruby Coil System is used in a variety of clinical applications, including:
|
•
|
active extravasations, or the escape of blood into surrounding tissue;
|
|
•
|
selective embolization in patients with visceral aneurysms;
|
|
•
|
exclusion of branches prior to chemoembolization and radioembolization;
|
|
•
|
embolization in patients with gastrointestinal bleeding;
|
|
•
|
embolization of branches prior to stent graft procedures;
|
|
•
|
procedures after stent grafting in patients with persistent type II endoleaks and sac enlargement;
|
|
•
|
treatment of patients with varicocele and pelvic congestion syndrome;
|
|
•
|
high flow arterial venous malformations;
|
|
•
|
post trans intrahepatic shunt placement;
|
|
•
|
balloon retrograde transvenous obliteration; and
|
|
•
|
exclusion of hepatic branches prior to liver resection.
|
We believe our Ruby Coil System offers specialist physicians a differentiated, cost-effective solution in the treatment of peripheral embolization patients.
Lantern
After entering the peripheral embolization market, we developed the Lantern Microcatheter to address unmet clinical needs. We received 510(k) clearance for the Lantern Microcatheter in December 2015. The Lantern Microcatheter is offered in a variety of lengths and tip shapes relevant to peripheral vascular procedures. The distal segment of Lantern is visual under fluoroscopy to aid in the navigation and visualization of the microcatheter during procedures.
POD (Penumbra Occlusion Device)
We developed POD, our peripheral vascular occlusion device, to address a specific need in the peripheral embolization market to rapidly and precisely occlude a target vessel. Current options for vessel occlusion in the periphery are limited, either requiring multiple devices or difficult to deliver vascular plugs. Microcatheter deliverable devices, such as coils, are not ideally suited for vessel embolization due to their tendency to migrate with antegrade flow and generally require the deployment of several devices to achieve occlusion. Vascular plug technology for larger peripheral vessels requires access with large diagnostic catheters or even larger bore sheaths. Additionally, these devices often require the placement of adjunctive devices, such as coils, to achieve complete occlusion. Our POD device utilizes technology that delivers both variable sizing and variable softness to provide a single device solution for rapid and precise embolization of the target vessel. We received 510(k) clearance for POD in July 2014.
Unlike conventional vascular plugs, our POD technology enables the occlusive device to be delivered through a microcatheter. Additionally, a single POD can occlude a range of vessel diameters, reducing the need for sophisticated measurement prior to embolization.
Our POD technology leverages the key features of a dedicated vessel embolization device to improve ease-of-use. These include:
|
•
|
microcatheter deliverability;
|
|
•
|
instant detachment;
|
|
•
|
immediate and precise anchoring;
|
|
•
|
a single device to treat a range of vessel diameters; and
|
|
•
|
dense occlusion in a short segment.
|
The technology achieves this range of features through the design of a distal anchoring segment, thereby immediately anchoring the device in a range of vessel diameters. The proximal segment of the POD achieves dense occlusion by packing a softer, smaller diameter segment tightly behind the anchored portion. Once POD is deployed, it can be detached instantly with the sterile detachment handle.
10
POD Packing Coil
We introduced the POD Packing Coil in January 2016 as a complementary device for use with our other peripheral embolization products. It is uniquely designed to pack densely behind RUBY Coils and POD to occlude arteries and veins throughout the peripheral vasculature including aneurysms.
Peripheral Thrombectomy
Indigo System
Our Indigo System, which we launched in 2014, was designed for continuous aspiration mechanical thrombectomy (CAT), leveraging the success of the Penumbra System in ischemic stroke. The Indigo System is designed to remove clots in the peripheral arteries and veins.
Our Indigo System family of products and accessories is an easy to use thrombectomy system that is powerful, highly trackable, and suited to a wide range of clot morphology. The principal components include:
|
•
|
Continuous Aspiration Mechanical Thrombectomy Catheters
are the foundation of the system and are ideally suited to reach anatomy below the knee. Much like our MAX and ACE catheters, the CAT catheters are robust, durable, trackable and suited for the peripheral anatomy. The initial launch of the Indigo System included our CAT5 catheter and the device made for more distal access, CAT3, which is able to reach the distal peripheral vessels of the upper and lower extremities. On May 26, 2015, we received FDA clearance for CAT6 and CAT8, two larger sizes of the Indigo System, as well as to market the Indigo System for use in both the peripheral arterial and venous systems.
|
|
•
|
Indigo Separator
enables the peripheral interventionalist to remove a difficult to aspirate clot from the CAT catheter. In the peripheral vessels, clots often form in long segments, and are more resistant to traditional aspiration techniques. The Indigo System with the Separator enables a wide range of clot morphology to be removed from the body. While conclusions should not be drawn from initial results and further results may prove to be worse or inconclusive, we have demonstrated in clinical settings that the Indigo System with the Separator can remove clots that were resistant to hours of revascularization attempts with other technologies and thrombolytic agents.
|
|
•
|
Penumbra Aspiration Pump
is the power source that provides the aspirating suction force to remove waste, such as blood and clots.
|
Research and Development
We direct our research efforts towards the development of clinical therapies that expand the therapeutic alternatives available to specialist physicians and improve upon our existing product offerings. Our research and development team has a track record of product innovation and significant product improvements. Since inception, we have introduced 16 products brands in either the U. S., international markets, or both. Our research and development expenses totaled
$18.0 million
,
$15.6 million
and
$14.1 million
for the years ended
December 31, 2015
,
2014
and
2013
, respectively.
We believe our ability to rapidly develop innovative products is in large part attributable to the fully integrated product innovation process that we have implemented, and the management philosophy behind that process. In addition, we have recruited and retained engineers with both significant experience in the development of medical devices as well as engineers directly from undergraduate and graduate programs that have become immediately productive within our development process. We have a pipeline of products in various stages of development that are expected to provide additional commercial opportunities. All of our research and development efforts are based at our campus in Alameda, California.
Manufacturing
We currently maintain one manufacturing facility at our campus in Alameda, California, which, together with our research and development space, totals 180,000 square feet. The manufacturing facilities run two eight-hour shifts per weekday. In addition, in December 2015, we signed a lease for an additional 99,568 square feet of space at our campus in Alameda, giving us capacity to increase production, and allowing us to expand adjacent to our current facilities. We currently produce substantially all of our products in-house.
Our rigorous quality control management programs have earned us a number of quality-related manufacturing designations. Our manufacturing facilities are EN ISO 13485 compliant with ISO 13485-2003 certification achieved in 2005. In 2007, we achieved compliance with MDD standards, allowing our products to be CE marked. We use annual internal audits, combined with external audits by regulatory agencies to help ensure strong quality control practices. An internal, on-going staff training and education program contributes to our quality assurance program; training is documented and considered part of the employee evaluation process.
11
Sales and Marketing
We have dedicated substantial resources to establish a direct sales capability in the U. S., most of Europe, Canada and Australia, which we have complemented with distributors in Japan and certain other international markets. We have regulatory clearance to sell our neurovascular access, ischemic stroke, neurovascular embolization, peripheral embolization and peripheral thrombectomy products in two of our three major markets, the U. S. and Europe, except that 3D has been cleared in Europe but not the U. S. In our third major market, Japan, we have regulatory clearance to sell our ischemic stroke, neurovascular embolization and peripheral embolization products. The only access product that has received regulatory clearance in Japan is PXSLIM. 3D, Ruby Coil, ACE 64 and Indigo System have not received regulatory clearance in Japan. Our Penumbra Coil 400 products are also used for peripheral embolization in Japan, and have received regulatory clearance for that use in that market. Liberty Stent has not yet received regulatory clearance anywhere. We believe our global presence enables us to capitalize on the markets for neuro and peripheral vascular devices that exist outside of the U. S.
We currently sell our products to hospitals in the U. S. through our dedicated salesforce in two target end markets, neuro and peripheral vascular. Our sales representatives and sales managers generally have substantial medical device experience and market our products directly to a variety of specialist physicians engaged in the treatment of neurovascular and peripheral vascular disorders, who are the end users of our products and significantly influence hospital buying decisions relating to medical devices. We are focused on developing strong relationships with specialist physicians and devote significant resources to training and educating physicians in the use and benefits of our products. The principal specialist physicians in our two target end markets include:
|
•
|
Neuro:
Interventional neuroradiologists, neurosurgeons and interventional neurologists.
|
|
•
|
Peripheral vascular:
Interventional radiologists and vascular surgeons.
|
In addition to our direct sales organizations, we work with distributors in certain geographic areas where we have determined that selling through distributors is likely to be more effective. The largest market where we sell our products through a distributor is Japan, with Medico’s Hirata Inc.
Our direct sales have been, and we anticipate will continue to represent, a majority of our revenues. In 2015, direct sales accounted for approximately 83.7% of our revenue, with the balance generated by independent distributors that sell our products outside of the U. S.
Backlog
We typically accept and ship orders on the day purchase orders are received or the next business day. Furthermore, if requested, we generally permit customers to cancel or reschedule without penalty. As a result, we do not believe that our backlog at any particular time is material, nor is it a reliable indication of future revenue.
Reimbursement
In the U. S., hospitals are the purchasers of our products. Hospitals in turn bill various third-party payors, such as Medicare, Medicaid and private health insurance plans, for the total healthcare services required to treat the patient. Government agencies, private insurers and other payors determine whether to provide coverage for a particular procedure and to reimburse hospitals for inpatient treatment at a fixed rate based on the diagnosis-related group (DRG) as determined by the U.S. Centers for Medicare and Medicaid Services (CMS). The fixed rate of reimbursement is based on the procedure performed, and is unrelated to the specific medical device used in that procedure. Medicare rates for the same or similar procedures vary due to geographic location, nature of facility in which the procedure is performed (i.e., teaching or community hospital) and other factors. While private payors vary in their coverage and payment policies, most look to coverage and payment by Medicare as a benchmark by which to make their own decisions.
Some payors may deny reimbursement if they determine that the device used in a treatment was unnecessary, not cost-effective, or used for a non-approved indication. We cannot assure you that government or private third-party payors will cover and reimburse the procedures using our products in whole or in part in the future or that payment rates will be adequate.
Outside the U. S., market acceptance of medical devices depends partly upon the availability of reimbursement within the prevailing healthcare payment system. Reimbursement levels vary significantly by country, and by region within some countries. Reimbursement is obtained from a variety of sources, including government-sponsored and private health insurance plans, and combinations of both. A small number of countries may require us to gather additional clinical data before recognizing coverage and reimbursement for our products. It is our intent to complete the requisite clinical studies and obtain coverage and reimbursement approval in countries where it makes economic sense to do so.
12
The increased emphasis on managed healthcare in the U. S. and on country and regional pricing and reimbursement controls in international markets will put additional pressure on product pricing, reimbursement and usage, which may adversely affect our product sales and results of operations. These pressures can arise from rules and practices of insurers and managed care organizations, judicial decisions and governmental laws and regulations related to Medicare, Medicaid and healthcare reform, medical device reimbursement policies and pricing in general. Our ability to achieve market acceptance or significant sales volume will depend in large part on the availability of coverage and the level of reimbursement for procedures performed using our products under healthcare payment systems in such markets.
All third-party reimbursement programs, whether government funded or insured commercially, whether in the U. S. or internationally, are developing increasingly sophisticated methods of controlling health care costs through prospective reimbursement and capitation programs, group purchasing, redesign of benefits, second opinions required prior to major surgery, careful review of bills, encouragement of healthier lifestyles and exploration of more cost-effective methods of delivering health care. These types of programs and legislative or regulatory changes to reimbursement policies could potentially limit the amount which healthcare providers may be willing to pay for medical devices.
Competition
The medical device industry is intensely competitive, subject to rapid change and significantly affected by new product introductions and other market activities of industry participants. We compete with a number of manufacturers and distributors of neurovascular and peripheral vascular medical devices. Our most notable competitors are Boston Scientific, Johnson & Johnson, Medtronic, Stryker and Terumo. All of these competitors are large, well-capitalized companies with significantly more market share and resources than we have. As a consequence, they are able to spend more on product development, marketing, sales and other product initiatives than we can. We also compete with a number of smaller medical device companies that have single products or a limited range of products. Some of our competitors have:
|
•
|
significantly greater name recognition;
|
|
•
|
broader or deeper relations with healthcare professionals, customers and third-party payors;
|
|
•
|
more established distribution networks;
|
|
•
|
additional lines of products and the ability to offer rebates or bundle products to offer greater discounts or other incentives to gain a competitive advantage;
|
|
•
|
greater experience in conducting research and development, manufacturing, clinical trials, marketing and obtaining regulatory clearance or approval for products; and
|
|
•
|
greater financial and human resources for product development, sales and marketing and patent litigation.
|
We compete primarily on the basis that our products are able to treat patients with neurovascular and peripheral vascular diseases and disorders safely and effectively. Our continued success depends on our ability to:
|
•
|
develop innovative, proprietary products that can cost-effectively address significant clinical needs;
|
|
•
|
continue to innovate and develop scientifically advanced technology;
|
|
•
|
obtain and maintain regulatory clearances or approvals;
|
|
•
|
demonstrate efficacy in Penumbra-sponsored and third-party clinical trials and studies;
|
|
•
|
apply technology across product lines and markets;
|
|
•
|
attract and retain skilled research and development and sales personnel; and
|
|
•
|
cost-effectively manufacture and successfully market and sell products.
|
Intellectual Property
Our success depends in part on our ability to protect our proprietary technology and intellectual property and operate without infringing the patents and other proprietary rights of third parties. We rely on a combination of patent, trademark, trade secret, copyright and other intellectual property rights and measures to protect our intellectual property rights that we consider important to our business. We also rely on know-how and continuing technological innovation to develop and maintain our competitive position. We do not have any material licenses to any technology or intellectual property rights.
As of
December 31, 2015
, we owned 20 issued patents globally, of which nine were U.S. patents. As of
December 31, 2015
, we owned 38 pending patent applications, of which 15 were patent applications pending in the U. S. Subject to payment of required maintenance fees, annuities and other charges, nine of our issued patents are currently expected to expire between
13
2024 and 2025; five of these patents relate to components of the Penumbra System and the Indigo System and one of these patents relates to methods performed by the Apollo System. An additional five of our issued patents, which relate to components of devices that have not been commercialized, are expected to expire between 2026 and 2027. The remaining seven of our issued patents, which relate to the components of the Penumbra Coil 400 and Ruby Coil, are currently expected to expire after 2027. Our issued patents relate to the following main areas: mechanical thrombectomy, coil embolization, treatment of aneurysm and treatment of intracranial hemorrhage. Our pending patent applications relate primarily to the following five main areas: mechanical thrombectomy, coil embolization, coronary atherectomy, blood filtration and treatment of patients with intracranial hemorrhage. Some of our pending patent applications pertain to components and methods of use associated with currently commercialized products. Our pending patent applications may not result in issued patents and we can give no assurance that any patents that have issued or might issue in the future will protect our current or future products or provide us with any competitive advantage. See the section titled “Risk Factors-Risks Related to Our Intellectual Property” for additional information.
Additionally, we own or have rights to trademarks or trade names that are used in our business and in conjunction with the sale of our products, including nine U.S. trademark registrations and six foreign trademark registrations as of
December 31, 2015
. Included in the registered trademarks is a mark with our company name and logo.
We also seek to protect our proprietary rights through a variety of methods, including confidentiality agreements and proprietary information agreements with suppliers, employees, consultants and others who may have access to our proprietary information.
Government Regulation
United States
Our products are medical devices subject to extensive and ongoing regulation by the FDA under the FD&C Act and its implementing regulations, as well as other federal and state regulatory bodies in the U. S. and comparable authorities in other countries under other statutes and regulations. The laws and regulations govern, among other things, product design and development, pre-clinical and clinical testing, manufacturing, packaging, labeling, storage, record keeping and reporting, clearance or approval, marketing, distribution, promotion, import and export, and post-marketing surveillance. Failure to comply with applicable requirements may subject a device and/or its manufacturer to a variety of administrative sanctions, such as issuance of Warning letters, import detentions, civil monetary penalties, and/or judicial sanctions, such as product seizures, injunctions and criminal prosecution.
FDA’s Premarket Clearance and Approval Requirements
Each medical device we seek to commercially distribute in the U. S. will require either a prior 510(k) clearance, unless it is exempt, or a premarket approval from the FDA. Medical devices are classified into one of three classes-Class I, Class II or Class III-depending on the degree of risk associated with each medical device and the extent of control needed to provide reasonable assurance of safety and effectiveness. Class I devices are deemed to be low risk and are subject to the general controls of the FD&C Act, such as provisions that relate to adulteration; misbranding; registration and listing; notification, including repair, replacement, or refund; records and reports; and good manufacturing practices. Most Class I devices are classified as exempt from premarket notification under Section 510(k) of the FD&C Act, and therefore may be commercially distributed without obtaining 510(k) clearance from the FDA., Class II devices are subject to both general controls and special controls to provide reasonable assurance of safety and effectiveness. Special controls include performance standards, postmarket surveillance, patient registries, and guidance documents. A manufacturer may be required to submit to the FDA a premarket notification requesting permission to commercially distribute some Class II devices. Devices deemed by the FDA to pose the greatest risk, such as life-sustaining, life-supporting or implantable devices, or devices deemed not substantially equivalent to a previously cleared 510(k) device, are placed in Class III. A Class III device cannot be marketed in the U. S. unless the FDA approves the device after submission of a premarket approval application (
PMA
). However, there are some Class III devices for which the FDA has not yet called for a PMA. For these devices, the manufacturer must submit a premarket notification and obtain 510(k) clearance in order to commercially distribute these devices. The FDA can also impose sales, marketing or other restrictions on devices in order to assure that they are used in a safe and effective manner.
510(k) Clearance Pathway
When a 510(k) clearance is required, we must submit a premarket notification to the FDA demonstrating that our proposed device is substantially equivalent to a predicate device, which is a previously cleared and legally marketed 510(k) device or a device that was in commercial distribution before May 28, 1976. By regulation, a premarket notification must be submitted to the FDA at least 90 days before we intend to distribute a device. As a practical matter, clearance often takes significantly longer. To demonstrate substantial equivalence, the manufacturer must show that the proposed device has the same
14
intended use as the predicate device, and it either has the same technological characteristics, or different technological characteristics and the information in the premarket notification demonstrates that the device is equally safe and effective and does not raise different questions of safety and effectiveness. The FDA may require further information, including clinical data, to make a determination regarding substantial equivalence. If the FDA determines that the device, or its intended use, is not substantially equivalent to a previously cleared device or use, the FDA will place the device into Class III.
There are three types of 510(k)s: traditional, special and abbreviated. Special 510(k)s are for devices that are modified and the modification needs a new 510(k) but does not affect the intended use or alter the fundamental scientific technology of the device. Abbreviated 510(k)s are for devices that conform to a recognized standard. The special and abbreviated 510(k)s are intended to streamline review, and the FDA intends to process special 510(k)s within 30 days of receipt.
Premarket Approval Pathway
A premarket approval application must be submitted to the FDA for Class III devices for which the FDA has required a PMA. The premarket approval application process is much more demanding than the 510(k) premarket notification process. A premarket approval application must be supported by extensive data, including but not limited to technical, preclinical, clinical trials, manufacturing and labeling to demonstrate to the FDA’s satisfaction reasonable evidence of safety and effectiveness of the device.
After a premarket approval application is submitted, the FDA has 45 days to determine whether the application is sufficiently complete to permit a substantive review and thus whether the FDA will file the application for review. The FDA has 180 days to review a filed premarket approval application, although the review of an application generally occurs over a significantly longer period of time and can take up to several years. During this review period, the FDA may request additional information or clarification of the information already provided. Also, an advisory panel of experts from outside the FDA may be convened to review and evaluate the application and provide recommendations to the FDA as to the approvability of the device. Although the FDA is not bound by the advisory panel decision, the panel’s recommendations are important to the FDA’s overall decision making process. In addition, the FDA may conduct a preapproval inspection of the manufacturing facility to ensure compliance with the Quality System Regulation (
QSR)
. The agency also may inspect one or more clinical sites to assure compliance with FDA’s regulations.
Upon completion of the PMA review, the FDA may: (i) approve the PMA which authorizes commercial marketing with specific prescribing information for one or more indications, which can be more limited than those originally sought; (ii) issue an approvable letter which indicates the FDA’s belief that the PMA is approvable and states what additional information the FDA requires, or the post-approval commitments that must be agreed to prior to approval; (iii) issue a not approvable letter which outlines steps required for approval, but which are typically more onerous than those in an approvable letter, and may require additional clinical trials that are often expensive and time consuming and can delay approval for months or even years; or (iv) deny the application. If the FDA issues an approvable or not approvable letter, the applicant has 180 days to respond, after which the FDA’s review clock is reset.
Clinical Trials
Clinical trials are almost always required to support premarket approval and are sometimes required for 510(k) clearance. In the U. S., for significant risk devices, these trials require submission of an application for an Investigational Device Exemption(
IDE)
to the FDA. The IDE application must be supported by appropriate data, such as animal and laboratory testing results, showing it is safe to test the device in humans and that the testing protocol is scientifically sound. The IDE must be approved in advance by the FDA for a specific number of patients at specified study sites. During the trial, the sponsor must comply with the FDA’s IDE requirements for investigator selection, trial monitoring, reporting, and recordkeeping. The investigators must obtain patient informed consent, rigorously follow the investigational plan and study protocol, control the disposition of investigational devices, and comply with all reporting and recordkeeping requirements. Clinical trials for significant risk devices may not begin until the IDE application is approved by the FDA and the appropriate institutional review boards, or IRBs, at the clinical trial sites. An IRB is an appropriately constituted group that has been formally designated to review and monitor medical research involving subjects and which has the authority to approve, require modifications in, or disapprove research to protect the rights, safety and welfare of human research subjects. A nonsignificant risk device does not require FDA approval of an IDE; however, the clinical trial must still be conducted in compliance with various requirements of FDA’s IDE regulations and be approved by an IRB at the clinical trials sites. We, the FDA or the IRB at each site at which a clinical trial is being performed may withdraw approval of a clinical trial at any time for various reasons, including a belief that the risks to study subjects outweigh the benefits or a failure to comply with FDA or IRB requirements. Even if a trial is completed, the results of clinical testing may not demonstrate the safety and effectiveness of the device, may be equivocal or may otherwise not be sufficient to obtain approval or clearance of the product.
15
Sponsors of clinical trials of devices are required to register with clinicaltrials.gov, a public database of clinical trial information. Information related to the device, patient population, phase of investigation, study sites and investigators, and other aspects of the clinical trial is made public as part of the registration.
Ongoing Regulation by the FDA
Even after a device receives clearance or approval and is placed on the market, numerous regulatory requirements apply. These include:
|
•
|
establishment registration and device listing;
|
|
•
|
the QSR, which requires manufacturers, including third-party manufacturers, to follow stringent design, testing, control, documentation, and other quality assurance procedures during all aspects of the manufacturing process;
|
|
•
|
labeling regulations and the FDA prohibitions against the promotion of products for un-cleared, unapproved or “off-label” uses, and other requirements related to promotional activities;
|
|
•
|
medical device reporting regulations, which require that manufactures report to the FDA if their device may have caused or contributed to a death or serious injury or if their device malfunctioned and the device or a similar device marketed by the manufacturer would be likely to cause or contribute to a death or serious injury if the malfunction were to recur;
|
|
•
|
corrections and removal reporting regulations, which require that manufactures report to the FDA field corrections or removals if undertaken to reduce a risk to health posed by a device or to remedy a violation of the FD&C Act that may present a risk to health; and
|
|
•
|
post market surveillance regulations, which apply to certain class II or III devices when necessary to protect the public health or to provide additional safety and effectiveness data for the device.
|
After a device receives 510(k) clearance, any modification that could significantly affect its safety or effectiveness, or that would constitute a major change in its intended use, will require a new clearance or possibly a premarket approval. The FDA requires each manufacturer to make this determination initially, but the FDA can review any such decision and can disagree with a manufacturer’s determination. If the FDA disagrees with our determination not to seek a new 510(k) clearance, the FDA may retroactively require us to seek 510(k) clearance or possibly a premarket approval. The FDA could also require us to cease marketing and distribution and/or recall the modified device until 510(k) clearance or premarket approval is obtained. Also, in these circumstances, we may be subject to significant regulatory fines and penalties.
Some changes to an approved PMA device, including changes in indications, labeling, or manufacturing processes or facilities, require submission and FDA approval of a new PMA or PMA supplement, as appropriate, before the change can be implemented. Supplements to a PMA often require the submission of the same type of information required for an original PMA, except that the supplement is generally limited to that information needed to support the proposed change from the device covered by the original PMA. The FDA uses the same procedures and actions in reviewing PMA supplements as it does in reviewing original PMAs.
FDA regulations require us to register as a medical device manufacturer with the FDA. Additionally, the California Department of Health Services (
CDHS)
requires us to register as a medical device manufacturer within the state. Because of this, the FDA and the CDHS inspect us on a routine basis for compliance with the QSR. These regulations require that we manufacture our products and maintain related documentation in a prescribed manner with respect to manufacturing, testing and control activities. We have undergone and expect to continue to undergo regular QSR inspections in connection with the manufacture of our products at our facilities. Further, the FDA requires us to comply with various FDA regulations regarding labeling. Failure by us or by our suppliers to comply with applicable regulatory requirements can result in enforcement action by the FDA or state authorities, which may include any of the following sanctions:
|
•
|
warning or untitled letters, fines, injunctions, consent decrees and civil penalties;
|
|
•
|
customer notifications, voluntary or mandatory recall or seizure of our products;
|
|
•
|
operating restrictions, partial suspension or total shutdown of production;
|
|
•
|
delay in processing submissions or applications for new products or modifications to existing products;
|
|
•
|
withdrawing approvals that have already been granted; and
|
|
•
|
criminal prosecution.
|
The Medical Device Reporting laws and regulations require us to provide information to the FDA when we receive or otherwise become aware of information that reasonably suggests our device may have caused or contributed to a death or
16
serious injury as well as a device malfunction that likely would cause or contribute to death or serious injury if the malfunction were to recur. In addition, the FDA prohibits an approved device from being marketed for off-label use. The FDA and other agencies actively enforce the laws and regulations prohibiting the promotion of off-label uses, and a company that is found to have improperly promoted off-label uses may be subject to significant liability, including substantial monetary penalties and criminal prosecution.
Newly discovered or developed safety or effectiveness data may require changes to a product’s labeling, including the addition of new warnings and contraindications, and also may require the implementation of other risk management measures. Also, new government requirements, including those resulting from new legislation, may be established, or the FDA’s policies may change, which could delay or prevent regulatory clearance or approval of our products under development.
We are also subject to other federal, state and local laws, and regulations relating to safe working conditions, laboratory, and manufacturing practices.
Regulatory Inspections
We are subject to periodic inspections by the FDA and other regulatory bodies related to the regulatory requirements that apply to medical devices designed and manufactured, and clinical trials sponsored, by us. When the FDA conducts an inspection, the inspectors will identify any deficiencies they believe exist in the form of a notice of inspectional observations, or Form FDA 483. If we receive a notice of inspectional observations or deficiencies from the FDA following an inspection, we likely will be required to respond in writing, and may be required to undertake corrective and preventive actions or other actions in order to address the FDA’s concerns. Failure to address the FDA’s concerns may result in the issuance of a warning letter or other enforcement or administrative actions.
From June 24, 2015 to July 15, 2015, the FDA conducted an inspection of our records relating to certain investigational sites for two different clinical trials, and from July 30, 2015 to August 4, 2015, the FDA conducted an inspection of our Quality System. At the conclusion of the first inspection, a Form FDA 483 was issued with one observation related to the failure to ensure proper monitoring at five of the investigational sites reviewed. At the conclusion of the second inspection, a Form FDA 483 was also issued with one observation relating to our procedures for completing and documenting effectiveness checks for Corrective and Preventative Action (CAPA). We provided timely responses to both Form FDA 483s, implemented changes to our clinical trial monitoring and CAPA procedures, and updated the FDA on the steps taken. On November 6, 2015, we received a letter from the FDA regarding the CAPA-related Form 483, noting that they had received our responses and would review the adequacy of the actions taken at our next inspection. On December 21, 2015, we received a letter from the FDA regarding the monitoring-related Form 483 indicating that our responses and actions appeared adequate to address the observation and noting that they may verify the actions taken during a future inspection. However, the FDA may conclude in subsequent inspections that we have not adequately responded to its observations or carried out all necessary corrective actions, and could take action against us without further notice. Action by the FDA against us could result in monetary fines or require us to take further corrective actions, which could be expensive and time-consuming to complete and could impose additional burdens and expenses, and could even require us to discontinue our investigational studies.
European Union
Our products are regulated in the European Union as medical devices per the European Union Directive (93/42/EEC), also known as the Medical Device Directive. An authorized third party, also called a Notified Body, must approve products for CE marking. The CE mark is contingent upon continued compliance to the applicable regulations and the quality system requirements of the ISO 13485 standard.
Other Regions
Most major markets have different levels of regulatory requirements for medical devices. Modifications to the cleared or approved products may require a new regulatory submission in all major markets. The regulatory requirements, and the review time, vary significantly from country to country. Products can also be marketed in other countries that have minimal requirements for medical devices.
Fraud and Abuse and Other Healthcare Regulation
Anti-Kickback Statute
We are subject to various federal and state healthcare laws, including, but not limited to, anti-kickback laws. In particular, the federal Anti-Kickback Statute prohibits persons or entities from knowingly and willfully soliciting, offering, receiving or paying any remuneration, directly or indirectly, overtly or covertly, in cash or in kind, in exchange for or to induce either the referral of an individual for the furnishing or arranging for a good or service, or for the purchasing, leasing, ordering, or arranging for or recommending any good, facility, service or item for which payment may be made in whole or in part under
17
federal healthcare programs, such as the Medicare and Medicaid programs. The federal Anti-Kickback Statute is broad and prohibits many arrangements and practices that are lawful in businesses outside of the healthcare industry. The term “remuneration” expressly includes kickbacks, bribes, or rebates and also has been broadly interpreted to include anything of value, including, for example, gifts, discounts, the furnishing of supplies or equipment, credit arrangements, payments of cash, waivers of payments, ownership interests and providing anything at less than its fair market value.
There are a number of statutory exceptions and regulatory safe harbors protecting certain business arrangements from prosecution under the federal Anti-Kickback Statute. These statutory exceptions and safe harbors set forth provisions that, if all their applicable requirements are met, will assure healthcare providers and other parties that they may not be prosecuted under the federal Anti-Kickback Statute. The failure of a transaction or arrangement to fit precisely within one or more applicable statutory exceptions or safe harbors does not necessarily mean that it is illegal or that prosecution will be pursued. However, conduct and business arrangements that do not fully satisfy all requirements of an applicable safe harbor may result in increased scrutiny by government enforcement authorities and will be evaluated on a case-by-case basis based on a cumulative review of all of its facts and circumstances. Additionally, the intent standard under the federal Anti-Kickback Statute was amended under the Patient Protection and Affordable Care Act, as amended by the Health Care and Education Reconciliation Act of 2010 (Affordable Care Act), to a stricter standard such that a person or entity no longer needs to have actual knowledge of the statute or specific intent to violate it in order to have committed a violation. The Affordable Care Act provides that the government may assert that a claim including items or services resulting from a violation of the federal Anti-Kickback Statute constitutes a false or fraudulent claim for purposes of the federal civil False Claims Act which is discussed below. Penalties for violations of the anti-kickback statute include, but are not limited to, criminal, civil and/or administrative penalties, damages, fines, disgorgement, individual imprisonment, possible exclusion from Medicare, Medicaid and other federal healthcare programs, and the curtailment or restructuring of operations. Various states have adopted laws similar to the federal Anti-Kickback Statute, and some of these state laws may be broader in scope in that some of these state laws extend to all payors and may not contain safe harbors.
Federal Civil False Claims Act.
The federal civil False Claims Act prohibits, among other things, persons or entities from knowingly presenting or causing to be presented a false or fraudulent claim to, or the knowing use of false statements to obtain payment from or approval by, the federal government. Suits filed under the federal civil False Claims Act, known as “
qui tam
” actions, can be brought by any individual on behalf of the government. These individuals, sometimes known as “relators” or, more commonly, as “whistleblowers,” may share in any amounts paid by the entity to the government in fines or settlement. The number of filings of
qui tam
actions has increased significantly in recent years, causing more healthcare companies to have to defend a case brought under the federal civil False Claim Act. If an entity is determined to have violated the federal civil False Claims Act, it may be required to pay up to three times the actual damages sustained by the government, plus civil penalties for each separate false claim. Various states have adopted laws similar to the federal civil False Claims Act, and many of these state laws are broader in scope and apply to all payors, and therefore, are not limited to only those claims submitted to the federal government.
Federal Civil Monetary Penalties Statute.
The federal Civil Monetary Penalties Statute, among other things, imposes fines against any person who is determined to have presented, or caused to be presented, claims to a federal healthcare program that the person knows, or should know, is for an item or service that was not provided as claimed or is false or fraudulent.
Sunshine Act.
The Affordable Care Act also included a provision, commonly referred to as the Sunshine Act. This provision requires that any manufacturer of a covered device that provides payment or other transfer of value to a physician or teaching hospital, or to a third party at the request of a physician or teaching hospital, must submit to CMS information about the payment or other transfer of value annually, with the reported information to be made public on a searchable website.
Health Insurance Portability and Accountability Act of 1996.
The federal Health Insurance Portability and Accountability Act (HIPAA) created several new federal crimes, including healthcare fraud and false statements relating to healthcare matters. The healthcare fraud statute prohibits knowingly and willfully executing a scheme to defraud any healthcare benefit program, including private third-party payors. The false statements statute prohibits knowingly and willfully falsifying, concealing or covering up a material fact or making any materially false, fictitious or fraudulent statement in connection with the delivery of or payment for healthcare benefits, items or services. In addition, HIPAA and its implementing regulations established uniform standards for certain covered entities, which are healthcare providers, health plans and healthcare clearinghouses, as well as their business associates, governing the conduct of specified electronic healthcare transactions and protecting the security and privacy of protected health information.
The American Recovery and Reinvestment Act of 2009, commonly referred to as the economic stimulus package, included an expansion of HIPAA’s privacy and security standards called the Health Information Technology for Economic and Clinical Health Act (HITECH). Among other things, HITECH created four new tiers of civil monetary penalties and gave state
18
attorneys general new authority to file civil actions for damages or injunctions in federal courts to enforce the federal HIPAA laws and seek attorneys’ fees and costs associated with pursuing federal civil actions.
Employees
As of
December 31, 2015
, we had approximately 1,100 employees worldwide. None of our employees are represented by a collective bargaining agreement and we have never experienced a work stoppage. We believe our employee relations are good.
Facilities
We maintain a 180,000 square feet research and development and manufacturing facility in three buildings at our campus in Alameda, California. The leases for these three buildings expire in 2029, subject to our option to renew any or all three leases for an additional ten years. In December 2015, we signed a lease for an additional 99,568 square feet of space (plus an additional space of 15,882 square feet that may be delivered to us at the landlord’s option prior to May 1, 2016) in three adjacent buildings located in our campus in Alameda, California. From time to time during the ten year period following the initial commencement date of the new lease, if any space in any of the buildings or in a fourth building located in the same business park as our campus becomes vacant, that space will be added to the lease at the then current base monthly rental rate. The maximum additional space that could be added under this provision of the lease is 117,325 square feet. We have a right of first offer to lease any space that becomes available in the buildings or in the fourth building after the expiration of the ten year period following the initial commencement date, subject to the terms described in the new lease. The term of the new lease expires after fifteen years from the initial lease commencement date, subject to our option to renew the lease for up to three additional five-year periods.
We also lease office space in Berlin, Germany; Sydney, Australia; and Sao Paulo, Brazil. The offices in Berlin and Sydney support our direct sales operations in Europe and Australia, respectively, and the office in Sao Paulo supports our Latin America marketing efforts through our distribution partners.
Legal Proceedings
We were contacted in 2015 by the attorney for a potential product liability claimant who allegedly suffered injuries as a result of an aneurysm procedure in which the Penumbra Coil 400 was used. On February 19, 2016, a complaint for damages was filed on behalf of this claimant against Penumbra and the hospital involved in the procedure
(
Montgomery v. Penumbra, Inc., et al.,
Case No. 16-2-04050-1 SEA, Superior Court of the State of Washington, King County)
. The suit alleges liability primarily under the Washington Product Liability Act and seeks both compensatory and punitive damages without a specific damages claim. Counsel for the claimant previously indicated that he expects that a jury could award $35 million in damages were this matter to go to trial. This amount is substantially in excess of our insurance coverage. The hospital defendant has requested indemnification from Penumbra. As the litigation has been filed recently and the parties have not engaged in formal discovery, we are unable to assess the merits of the plaintiff’s case. We intend to vigorously defend the litigation, as we believe there will be substantial questions regarding causation, liability and damages.
Additionally, from time to time, we are subject to claims and assessments in the ordinary course of business. We are not currently a party to any litigation matter that, individually or in the aggregate, is expected to have a material adverse effect on our business, financial condition, results of operations or cash flows.
Available Information
We make our Annual Reports on Form 10-K, Quarterly Reports on Form 10-Q, Current Reports on Form 8-K, and amendments to those reports, available free of charge at our website as soon as reasonably practicable after they have been filed with the SEC. Our website address is www.penumbrainc.com. Information on our website is not part of this report.
The public may read and copy any materials we file with the SEC at the SEC’s Public Reference Room at 100 F Street, NE, Washington, DC 20549. The public may obtain information of the Public Reference Room by calling the SEC at 1-800-SEC-0330. The SEC maintains a website that contains the materials we file with the SEC at www.sec.gov.
19
This Annual Report on Form 10-K contains forward-looking information based on our current expectations. Because our business is subject to many risks and our actual results may differ materially from any forward-looking statements made by or on behalf of us, this section includes a discussion of important factors that could affect our business, operating results, financial condition and the trading price of our common stock. You should carefully consider these risk factors, together with all of the other information included in this Annual Report on Form 10-K as well as our other publicly available filings with the SEC.
Business Risks
We have a limited operating history and may not be able to sustain or grow our profitability or generate positive cash flows from operations.
We were founded in 2004 and did not generate any revenue until 2007. Moreover, while we have successfully developed, obtained regulatory clearance or approval for, and introduced a number of products in the neuro market since 2007, we first introduced products in the peripheral vascular and neurosurgical markets in 2013 and 2014, respectively. Accordingly, we only have a limited operating history upon which investors can evaluate our business and prospects, and this limited operating history may not be indicative of our future results. Since 2009, we have been generally profitable on an annual basis; however, we incurred operating losses in 2013. We can give no assurance that we will be profitable or cash flow positive in the future.
Our general and administrative and sales and marketing expenses have increased, and we expect that they will continue to increase, to support our anticipated growth as well as the additional operational and reporting costs associated with being a public company. We have also expended significant amounts on research and development to develop and fund clinical testing of our products, and we expect to continue to do so. We also expend significant amounts on maintaining inventory levels of raw materials, components and finished products to meet anticipated customer demand. In addition, our coil products are sold on a consignment basis, which requires us to expend significant amounts on inventory that is placed at many customer locations. Our ability to sustain our growth and profitability and operate cash flow positive may be influenced by many factors, including:
•
our ability to achieve and maintain market acceptance of our products;
•
unanticipated problems and additional costs relating to the development and testing of new products;
•
our ability to introduce, manufacture at scale, build new inventory and commercialize new products;
•
our ability to produce sufficient quantities of our products to meet demand and to smoothly transition to new products;
•
the impact of competition;
•
the timing and impact of market and regulatory developments;
•
our ability to expand into new markets;
•
pricing pressure from competitors;
•
the availability and adequacy of third-party reimbursement for procedures in which our products are used; and
•
our ability to obtain and maintain adequate intellectual property protection for our products and technologies.
If we encounter difficulties with any of the foregoing or unexpected expenses, it could materially adversely affect our business, results of operations, financial condition or cash flows.
Our existing products may be rendered obsolete and we may be unable to effectively introduce and market new products or may fail to keep pace with advances in technology.
The medical device market is characterized by rapidly advancing technology. Our success depends, in part, on our ability to anticipate technological advancements and competitive innovations and introduce new products to adapt to these advancements and innovations. To compete in the marketplace, we have made, and we must continue to make, substantial investments in new product development, whether internally through research and development or externally through licensing or acquisitions. We can give no assurance that we will be successful in identifying, developing or acquiring, and marketing new products or enhancing our existing products. In addition, we can give no assurance that new products or alternative treatment techniques developed by competitors will not render our current or future products obsolete or inferior, technologically or economically.
The success of any new products that we develop or acquire depends on achieving and maintaining market acceptance. Market acceptance for our current and new products could be affected by a number of factors, including:
|
•
|
our ability to market and distribute our products effectively;
|
|
•
|
the availability, perceived efficacy and pricing of alternative products from our competitors;
|
20
|
•
|
the development of new products or alternative treatments by others that render our products and technologies obsolete;
|
|
•
|
the price, quality, effectiveness and reliability of our products;
|
|
•
|
our customer service and reputation;
|
|
•
|
our ability to convince specialist physicians to use our products on their patients; and
|
|
•
|
the timing of market entry of new products or alternative treatments.
|
Our competition may respond more quickly to new or emerging technologies or a changing clinical landscape, undertake more extensive marketing campaigns, have greater financial, marketing and other resources than us or be more successful in attracting potential customers and strategic partners. Given these factors, we cannot assure you that we will be able to continue or increase our level of success. Our failure to introduce new and innovative products in a timely manner, and our inability to maintain or grow the market acceptance of our existing products, could result in permanent write-downs or write-offs of our inventory and otherwise have a material and adverse effect on our business, results of operations, financial condition or cash flows.
Delays in product introductions could adversely affect our business, results of operations, financial condition or cash flows.
The medical device market is highly competitive and designs change often to adjust to shifting market preferences and other factors. Therefore, product life cycles are relatively short. As a result, any delays in our product launches may significantly impede our ability to enter or compete in a given market and may reduce the sales that we are able to generate from these products. We may experience delays in any phase of a product launch, including during research and development, clinical trials, regulatory review, manufacturing and marketing. Delays in product introductions could materially adversely affect our business, results of operations, financial condition or cash flows.
We face significant competition, and if we are unable to compete effectively, we may not be able to achieve or maintain significant market penetration or improve our results of operations.
The medical device industry is intensely competitive, subject to rapid change and significantly affected by new product introductions and other market activities of industry participants. We compete with a number of manufacturers and distributors of neuro and peripheral vascular devices. Our most notable competitors are Boston Scientific, Johnson & Johnson, Medtronic, Stryker and Terumo. All of these competitors are large, well-capitalized companies with longer operating histories and significantly greater resources than us. We also compete with a number of smaller medical device companies that have a single product or a limited range of products. Our competitors may be able to spend more on product development, marketing, sales and other product initiatives, or be more focused in their spending and activities, than we can. Some of our competitors have:
|
•
|
significantly greater name recognition;
|
|
•
|
broader or deeper relations with healthcare professionals, customers and third-party payors;
|
|
•
|
more established distribution networks;
|
|
•
|
additional lines of products and the ability to offer rebates or bundle products to offer greater discounts or other incentives to gain a competitive advantage;
|
|
•
|
greater experience in conducting research and development, manufacturing, clinical trials, marketing and obtaining regulatory clearance or approval for products; and
|
|
•
|
greater financial and human resources for product development, sales and marketing and patent litigation.
|
We compete primarily on the basis that our products are able to treat patients with neurovascular and peripheral vascular diseases and disorders safely and effectively, with improved outcomes and procedural cost savings. Our continued success depends on our ability to:
|
•
|
develop innovative, proprietary products that can cost-effectively address significant clinical needs;
|
|
•
|
continue to innovate and develop scientifically advanced technology;
|
|
•
|
obtain and maintain regulatory clearances or approvals;
|
|
•
|
demonstrate efficacy in Penumbra-sponsored and third-party clinical trials and studies;
|
|
•
|
apply technology across product lines and markets;
|
|
•
|
attract and retain skilled research and development and sales personnel; and
|
21
|
•
|
cost-effectively manufacture and successfully market and sell products.
|
We cannot assure you that we will be able to compete effectively on the basis of these factors. Additionally, our competitors with greater financial resources could acquire or develop new technologies or products that effectively compete with our existing or future products. If we are unable to effectively compete, it would materially adversely affect our business, results of operations, financial condition and cash flows.
Our future growth depends, in part, on our ability to further penetrate our current customer base and increase the frequency of use of our products by our customers.
We will need to continue to make specialist physicians and other hospital staff aware of the benefits of our products to generate increased demand and frequency of use, and thus increase sales to our hospital customers. Although we are attempting to increase the number of patients treated with procedures that use our products through our established relationships and focused sales efforts, we cannot provide assurance that our efforts will increase the use of our products. If we are unable to increase the frequency of use of our products by specialist physicians, this could materially adversely affect our business, results of operations, financial condition or cash flows.
Our future growth depends, in part, on significantly expanding our user base to include additional specialist physicians in both our existing and future target end markets.
Currently, the primary users of our neuro products are neuro interventionalists who perform endovascular neuro interventions. We also began selling in the peripheral vascular market in 2013 with the introduction of our Ruby Coil and the neurosurgery market in 2014 with the introduction of our Apollo System, and we may enter new target end markets in the future. Our revenue growth will depend in part on our ability to convince specialist physicians in our existing and future target end markets of our products’ efficacy, to educate them in the proper use of our products and to sell our products to their affiliated hospitals. Convincing specialist physicians to use new products and to dedicate the time and energy necessary for adequate education in the use of our products is challenging, especially in new markets where treatments using our products are not established. Expanding our customer base in existing or new target end markets may require, among other things, additional clinical evidence supporting patient benefits, training in a manner to which we are not accustomed, or other resources that we do not readily have available or are not cost effective for us to provide. If we are unable to convert specialist physicians in existing or new target end markets to the use of our products, our sales growth will be limited, which could materially adversely affect our business, results of operations, financial condition or cash flows.
The marketing and sales of our products require a significant amount of time and expense and we may not have the resources to successfully market and sell our products, which would adversely affect our business and results of operations.
The marketing and sales of our products requires us to invest in training and education and employ a salesforce that is large enough to interact with the specialist physicians who use our products. Entering new markets also requires a significant amount of time and expense in order to identify and establish relationships with key opinion leaders among the specialist physicians who may use our products in those markets. We may not have adequate resources to market and sell our products successfully against larger competitors. For example, when we began selling in the peripheral vascular market in 2013, we did not have a dedicated direct peripheral vascular sales team and our neuro sales team was required to dedicate a portion of its efforts to the sales of our peripheral vascular products. We subsequently expended significant sums to develop a direct salesforce focused on peripheral vascular product sales. If we do not have adequate resources to market and sell our products effectively, or cannot otherwise market and sell our products successfully, it could materially adversely affect our business, results of operations, financial condition or cash flows.
Third-party reimbursement may not be available or adequate for the procedures in which our products are used.
Our ability to commercialize new products successfully in both the U. S. and international markets depends in part on the availability of, and hospitals’ ability to obtain, adequate levels of third-party reimbursement for the procedures in which our products are used. In the U. S., the cost of medical care is funded, in substantial part, by government insurance programs, such as Medicare and Medicaid, and private and corporate health insurance plans. Third-party payors may deny reimbursement if they determine that a device used in a procedure has not received appropriate FDA or other governmental regulatory clearances or approvals, is not used in accordance with cost-effective treatment methods as determined by the payor, or is experimental, unnecessary or inappropriate. Our ability to commercialize our products successfully will depend, in large part, on the extent to which adequate reimbursement levels for the cost of their use are obtained from government authorities, private health insurers and other organizations, such as health maintenance organizations. Further, healthcare in the U. S. and international markets is also being affected by economic pressure to contain reimbursement levels and costs. Changing reimbursement models could materially adversely affect our business, results of operations, financial condition or cash flows.
22
We have generated a significant portion of our revenue from products that are used in connection with the treatment of neurovascular diseases, and our revenue and business prospects would be adversely affected if our neuro product sales were to decline.
We have generated most of our revenue from our neurovascular products, including our Penumbra System, Penumbra Coil 400 and Neuron products. If any one or more of these products, or any successor products, were no longer available for sale in any key market because of regulatory, third-party reimbursement or intellectual property issues or any other reason, or if one of our competitors introduced one or more products that specialist physicians believe are superior to our products, our revenue from these products would decline. A significant decline in our sales of neurovascular products could also negatively impact our financial condition and our ability to conduct product development activities, and therefore negatively impact our business prospects.
We must maintain and further develop relationships with specialist physicians. If specialist physicians do not recommend and endorse, or use, our products or if our relationships with specialist physicians deteriorate, our products may not be accepted or maintain acceptance in the marketplace, which would adversely affect our business and results of operations.
Our products are sold to hospitals for use by specialist physicians practicing at their facilities. In order for us to sell our products, specialist physicians must recommend and endorse them for the hospital to purchase them, and must use them in treating their patients to generate follow-on sales. We may not obtain the necessary recommendations or endorsements for new products from specialist physicians, nor may we be able to maintain the current or future level of acceptance and usage of our products. Acceptance of our products depends on educating the medical community as to the distinctive characteristics, perceived benefits, safety, clinical efficacy and cost-effectiveness of our products compared to products of our competitors or treatments that do not use our products, and on training specialist physicians in the proper application and use of our products. We invest in significant training and education of our sales representatives and specialist physicians to achieve market acceptance of our products, with no assurance of success. If we are not successful in obtaining and maintaining the recommendations or endorsements of specialist physicians for our products, if specialist physicians prefer our competitors’ products or other alternative treatments that do not use our products, or if our products otherwise do not gain or maintain market acceptance, our business could be adversely affected.
In addition, the research, development, marketing and sales of our products are dependent, in part, upon our working relationships with specialist physicians. We rely on them to provide us with knowledge and feedback regarding our products and the marketing of our products. If we are unable to develop or maintain strong relationships with specialist physicians and receive their advice and input, the development and marketing of our products could suffer, which could materially adversely affect our business, results of operations, financial condition or cash flows.
We may not be able to achieve or maintain satisfactory pricing and margins for our products.
Manufacturers of medical devices have a history of price competition, and we can give no assurance that we will be able to achieve satisfactory prices for our products or maintain prices at the levels we have historically achieved. If we are unable to achieve or maintain our prices, or if our costs increase and we are unable to offset such increase with an increase in our prices, our margins could erode and we may be unable to maintain profitable operations.
We cannot be certain that we will be able to manufacture our products in high volumes at commercially reasonable costs.
We currently maintain our manufacturing operations in buildings located at our campus in Alameda, California. We currently produce substantially all of our products at this facility, and we do not have redundant facilities. We may need to expend significant capital resources and increase the size of our manufacturing capabilities as we grow our business. We could, however, encounter problems related to:
|
•
|
capacity constraints;
|
|
•
|
production yields;
|
|
•
|
quality control;
|
|
•
|
equipment availability; and
|
|
•
|
shortages of qualified personnel.
|
Our continuous product innovation limits our ability to identify and implement manufacturing efficiencies. Failure to do so may reduce our ability to manufacture our products at commercially reasonable costs. If we are unable to manufacture our products in high volumes at commercially reasonable costs, it could materially affect our ability to adequately increase production of our products and fulfill customer orders on a timely basis, which could have a material adverse effect on our business, results of operations, financial condition or cash flows.
23
We are required to maintain high levels of inventory, which consume a significant amount of our working capital and could lead to permanent write-downs or write-offs of our inventory.
We maintain a significant inventory of raw materials, components and finished goods, which subjects us to a number of risks and challenges. Our hospital customers typically maintain only small quantities of our products at their facilities, so as products are used, they order replacements that typically require prompt delivery. As a result, we must maintain sufficient levels of finished goods to permit rapid shipment of products following receipt of a customer order. In turn, we must also maintain a sufficient supply of raw materials and components inventory to permit rapid manufacturing and re-stocking of finished goods. Furthermore, our coil inventory is supplied to hospital customers on a consignment basis, which means that it is classified as part of our inventory for financial reporting purposes but is maintained at the hospital location until it is used. We have built, and will continue to build, a significant inventory of coils in order to support the introduction of and to provide adequate consignment stock for our new and existing coil products.
Maintaining a significant inventory of raw materials, components and finished goods, including coils, consumes a significant amount of our working capital. This working capital could be used for other purposes, such as research and development or sales and marketing activities. As we grow our business, we may need substantial additional capital to fund higher levels of inventory, which may materially adversely affect our liquidity or result in dilution to our stockholders if we sell additional equity securities or leverage if we raise debt capital to finance our working capital requirements.
Maintaining a significant inventory of raw materials, components and finished goods, including coils, also subjects us to the risk of inventory excess and obsolescence, which may lead to a permanent write-down or write-off of our inventory. While in inventory, our components and finished goods may become obsolete, and we may over-estimate the amount of inventory needed, which may lead to excessive inventory. In these circumstances, we would write-down or write-off our inventory, and we may be required to expend additional resources or be constrained in the amount of end product that we can produce. Furthermore, our products have a limited shelf life due to sterilization requirements, and part or all of a given product or component may expire, resulting in a decrease in value and potentially a permanent write-down of our inventory. For example, we recorded write downs of
$1.2 million
,
$1.9 million
and
$0.9 million
for excess and obsolete inventory in
2015
,
2014
and
2013
, respectively. In the event that a substantial portion of our inventory becomes excess or obsolete, it could materially adversely affect our results of operations.
Defects or failures or alleged defects or failures associated with our products could lead to recalls, safety alerts or litigation, as well as significant costs and negative publicity.
Manufacturing flaws, component failures, design defects, off-label uses or inadequate disclosure of product-related information could result in an unsafe condition or the injury or death of a patient. These problems could lead to a recall of, or issuance of a safety alert relating to, our products and result in significant costs, negative publicity and adverse competitive pressure. While we have had product recalls, they have all been voluntary, based on our own internal safety and quality monitoring and testing data, and none of our past product recalls has been material. The circumstances giving rise to recalls are, however, unpredictable, and any future recalls of existing or future products could materially adversely affect our business, results of operations, financial condition or cash flows.
The medical device industry has historically been subject to extensive litigation over product liability claims. There are high rates of mortality and other complications associated with some of the medical conditions suffered by the patients whom specialist physicians use our devices to treat, and we may be subject to product liability claims if our products cause, or merely appear to have caused, an injury or death. In addition, an injury or death that is caused by the activities of our suppliers, such as those that provide us with components and raw materials, or by an aspect of a treatment used in combination with our products, such as a complementary drug or anesthesia, may be the basis for a claim against us by patients, hospitals, health-care providers or others purchasing or using our products, even if our products were not the actual cause of such injury or death. For example, a product liability lawsuit was recently filed against Penumbra by a claimant who allegedly suffered injuries as a result of an aneurysm procedure in which the Penumbra Coil 400 was used, see Legal Proceedings in Part I, Item 3 of this Form 10-K. An adverse outcome involving one of our products could result in reduced market acceptance and demand for all of our products, and could harm our reputation and our ability to market our products in the future. In some circumstances, adverse events arising from or associated with the design, manufacture or marketing of our products could result in the suspension or delay of regulatory reviews of our premarket notifications or applications for marketing. Any of the foregoing problems could disrupt our business and have a material adverse effect on our business, results of operation, financial condition or cash flows.
Although we carry product liability insurance in the U. S. and in other countries in which we conduct business, including for clinical trials and product marketing, we can give no assurance that such coverage will be available or adequate to satisfy any claims. Product liability insurance is expensive, subject to significant deductibles and exclusions, and may not be available on acceptable terms, if at all. If we are unable to obtain or maintain insurance at an acceptable cost or on acceptable terms with adequate coverage or otherwise protect against potential product liability claims, we could be exposed to significant liabilities. A product liability claim, recall or other claim with respect to uninsured liabilities or for amounts in excess of insured liabilities
24
could materially adversely affect our business, financial condition and results of operations. Defending a suit, regardless of its merit or eventual outcome, could be costly, could divert management’s attention from our business and might result in adverse publicity, which could result in reduced acceptance of our products in the market, product recalls or market withdrawals.
Our products are continually the subject of clinical trials conducted by us, our competitors, or other third parties, the results of which may be unfavorable, or perceived as unfavorable, and which could materially adversely affect our business, financial condition and results of operations.
As a part of the regulatory process of obtaining marketing clearance or approval for new products and new indications for existing products, as well as to provide specialist physicians with ongoing information regarding the efficacy of our products, we conduct and participate in numerous clinical trials with a variety of study designs, patient populations and trial endpoints. Our competitors and third parties also conduct clinical trials of our products without our participation. Unfavorable or inconsistent clinical data from existing or future clinical trials conducted by us, our competitors or third parties, or the market’s or regulators’ perception of clinical data, could materially adversely affect our business, results of operations, financial condition or cash flows.
Our future success depends in part upon establishing an interventional stroke care pathway in the U. S. that integrates the use of endovascular thrombectomy into the treatment of ischemic stroke.
The stroke care pathway in the U. S. generally begins with emergency responders who are responsible for transporting the patient to a hospital facility. With a small number of exceptions (such as for trauma), emergency responders in the U. S. generally operate under a protocol that transports patients to the nearest hospital, which decreases the likelihood that the patient will be transported to a stroke center that has a developed stroke team and an interventional approach to the treatment of stroke. Further, there is no agreed upon standard of care among physicians or hospitals regarding the treatment of ischemic stroke patients, and treatment protocols vary according to the particular hospital, often resulting in significant delays and gaps in patients being assessed for and receiving interventional treatment. The absence of a uniform protocol among hospitals and among physicians within the same hospital means that we have to educate each hospital and stroke center about protocols that integrate our products for the treatment of stroke.
We believe that the stroke care system in the U. S. has not been historically geared towards interventional treatment of stroke due to the absence of clinical evidence that interventional techniques were effective. Our and our competitors’ ability to alter the existing stroke care pathway may depend on whether we and our competitors are successful in using recent positive clinical studies to convince specialist physicians that intervention yields superior clinical results relative to cases where intervention is not used.
Establishing an interventional stroke pathway that integrates the use of interventional treatments, including our products, will depend upon many factors, including:
|
•
|
continuing to educate hospitals and specialist physicians about the clinical evidence supporting intervention, as well as the use, benefits and cost-effectiveness of our products;
|
|
•
|
improving the speed with which patients are assessed for and receive interventional treatments; and
|
|
•
|
increasing the likelihood that patients are transported to a hospital or stroke center where interventional treatments are available.
|
Even if these efforts are successful, it may be years before existing systems and care pathways are changed. These factors may make it difficult to grow our business.
Any data that is gathered in the course of clinical trials may be significantly more favorable than the typical results achieved by practicing specialist physicians, which could negatively impact rates of adoption of our products.
Even if the data collected from clinical trials indicates positive results, each specialist physician’s actual experience with our products will vary. Clinical trials often involve procedures performed by specialist physicians who are technically proficient and high volume users. Consequently, the results reported in clinical trials may be significantly more favorable than typical results of other users. If specialist physicians’ experiences indicate, or they otherwise believe, that our products are not as safe or effective as other treatment options with which they are more familiar, or clinical trial data indicates the same, adoption of our products may suffer, which could materially adversely affect our business, results of operations, financial condition or cash flows.
Negative publicity regarding our products or marketing tactics by competitors could reduce demand for our products, which would adversely affect sales and our financial performance.
We may experience, from time to time, negative exposure in clinical publications or in marketing campaigns of our competitors. Such publications or campaigns may present negative individual physician experience regarding the safety or
25
effectiveness of our products or may suggest our competitors’ products are superior to ours, based on studies or clinical trials conducted or funded by competitors or that involved competitive products.
Our reputation and competitive position may also be harmed by other publicly available information suggesting that our products are not safe. For example, we file adverse event reports under Medical Device Reporting (
MDR)
obligations with the FDA that are publicly available on the FDA’s website. We are required to file MDRs if our products may have caused or contributed to a serious injury or death or malfunctioned in a way that could likely cause or contribute to a serious injury or death if it were to recur. Any such MDR that reports a significant adverse event could result in negative publicity and could harm our reputation and future sales.
Our dependence on key suppliers puts us at risk of interruptions in the availability of our products, which could reduce our revenue and adversely affect our results of operations. In addition, increases in prices for raw materials and components used in our products could adversely affect our results of operations.
We require the timely delivery of sufficient amounts of components and materials to manufacture our products. For reasons of quality assurance, cost effectiveness or availability, we procure certain raw materials and components from a single or limited number of suppliers. We generally acquire such raw materials and components through purchase orders placed in the ordinary course of business, and as a result we may not have a significant inventory of these materials and components and generally do not have any guaranteed or contractual supply arrangements with many of these suppliers. Our reliance on these suppliers subjects us to risks that could harm our business, including, but not limited to, difficulty locating and qualifying alternative suppliers.
Our dependence on third-party suppliers involves several other risks, including limited control over pricing, availability, quality and delivery schedules. Suppliers of raw materials and components may decide, or be required, for reasons beyond our control, to cease supplying raw materials and components to us or to raise their prices. Shortages of raw materials, quality control problems, production capacity constraints or delays by our suppliers could negatively affect our ability to meet our production requirements and result in increased prices for affected materials or components. We may also face delays, yield issues and quality control problems if we are required to locate and secure new sources of supply. While we have not experienced any to date, any material shortage, constraint or delay may result in delays in shipments of our products, which could materially adversely affect our results of operations. Increases in prices for raw materials and components used in our products could also materially adversely affect our results of operations.
In addition, the FDA and regulators outside of the U. S. may require additional testing of any raw materials or components from new suppliers prior to our use of these materials or components. In the case of a device with clearance under Section 510(k) of the FD&C Act, referred to as a 510(k), we may be required to submit a new 510(k) if a change in a raw material or component supplier results in a change in a material or component supplied that is not within the 510(k) cleared device specifications. If we need to establish additional or replacement suppliers for some of these materials or components, our access to the materials or components might be delayed while we qualify such suppliers and obtain any necessary FDA approvals or clearances. Our suppliers may also be subject to regulatory inspection and scrutiny. Any adverse regulatory finding or action against those suppliers could impact their ability to supply us with raw materials and components for our products.
Our corporate culture has contributed to our success, and if we cannot maintain this culture as we grow, we could lose the innovative approach, creativity, and teamwork fostered by our culture, and our business may be harmed.
We believe that a critical contributor to our success has been our corporate culture, which we believe fosters innovation, teamwork, and a focus on execution, as well as facilitating critical knowledge transfer and knowledge sharing. As we grow, we may find it difficult to maintain these important aspects of our corporate culture, which could limit our ability to innovate and operate effectively. Any failure to preserve our culture could also negatively affect our ability to retain and recruit personnel or execute on our business strategy.
If our facilities were to become inoperable, we would be unable to continue to develop and manufacture our products until we were able to restore full research, manufacturing and administrative capabilities at our facilities or secure a new facility, and as a result, our business would be harmed.
We currently maintain our research and development, manufacturing and administrative operations in buildings located at our campus in Alameda, California, and we do not have redundant facilities. Alameda is situated on or near earthquake fault lines, and our facilities are built on filled land, which could be prone to liquefaction in a major earthquake. Should one or more of our buildings be significantly damaged or destroyed by natural or man-made disasters, such as earthquakes, fires or other events, it could take months to relocate or rebuild, during which time our employees may seek other positions, our research, development and manufacturing would cease or be delayed and our products may be unavailable. Moreover, because of the time required to approve and license a manufacturing facility under FDA and non-U.S. regulatory requirements, we may not be able to resume production on a timely basis even if we are able to replace production capacity in the event we lose manufacturing capacity. While we maintain property and business interruption insurance, such insurance has limits and would
26
only cover the cost of rebuilding and relocating and lost profits, but not losses we may suffer due to our products being replaced by competitors’ products. The inability to perform our research, development and manufacturing activities, combined with our limited inventory of raw materials and components and manufactured products, may cause specialist physicians to discontinue using our products or harm our reputation, and we may be unable to reestablish relationships with those specialist physicians in the future. Consequently, a catastrophic event at our facility could materially adversely affect our business, results of operations, financial condition or cash flows.
To successfully market and sell our products internationally, we must address a number of unique challenges applicable to international markets.
For the years ended
December 31, 2015
,
2014
and
2013
, we derived 31.6%, 33.9% and 34.4%, respectively, of our revenue from international sales. International sales are subject to a number of risks and challenges, including:
|
•
|
reliance on distributors;
|
|
•
|
varying coverage and reimbursement policies, processes and procedures;
|
|
•
|
difficulties in staffing and managing international operations from which sales are conducted;
|
|
•
|
difficulties in penetrating markets in which our competitors’ products or alternative procedures that do not use our products are more established;
|
|
•
|
reduced protection for intellectual property rights in some countries;
|
|
•
|
export licensing requirements or restrictions, trade regulations and foreign tax laws;
|
|
•
|
fluctuating foreign currency exchange rates;
|
|
•
|
foreign certification, regulatory requirements and legal requirements;
|
|
•
|
lengthy payment cycles and difficulty in collecting accounts receivable;
|
|
•
|
customs clearance and shipping delays;
|
|
•
|
pricing pressure in international markets;
|
|
•
|
political and economic instability; and
|
|
•
|
preference for locally produced products.
|
If we are unable to successfully address these challenges, we may not be able to grow our international sales and our results of operations may suffer as a result.
Over the long term, we intend to grow our business internationally and to do so, we will need to either spend substantial sums to expand or develop direct sales capabilities in existing and new geographic areas or generate additional sales through existing distributors or attract additional distributors.
As a result of our international operations, we are required to comply with tax requirements in multiple jurisdictions, the scope and impact of which may be unclear. Moreover, tax authorities in jurisdictions in which we do business could disagree with tax positions that we take, including, for example, our inter-company pricing policies, or could assert that we owe more taxes than we currently pay due to the level and nature of our activities in such jurisdictions.
We rely on our distributors to market and sell our products in certain international markets.
We have established a direct sales capability in the U. S., most of Europe, Canada and Australia, which we have complemented with distributors in Japan and certain other international markets. Sales to distributors represented 16.3% and 17.7% of our revenue in
2015
and
2014
respectively. In addition, sales to our Japanese distributor, Medico’s Hirata Inc., represented approximately 10.2% of our revenue in
2015
. Our success outside of the U. S., most of Europe, Canada and Australia depends largely upon marketing arrangements with distributors, in particular their sales expertise and their relationships with specialist physicians and affiliated hospitals in their geographic areas. Distributors may terminate their relationship with us, sell competitive products or devote insufficient sales efforts or other resources to our products. We do not control our distributors, and they may not be successful in implementing our marketing plans. In addition, many of our distributors initially obtain and maintain foreign regulatory approval for the sale of our products in their respective countries, and their efforts in obtaining and maintaining regulatory approval may not be as robust as we desire or expect. Our failure to maintain our existing relationships with our distributors, or our failure to recruit and retain additional skilled distributors in existing or new international markets, could have an adverse effect on our operations. If current or future distributors do not perform adequately, or if we lose a significant distributor, such as our Japanese distributor, we may not be able to maintain
27
existing levels of international revenue or realize expected long term international revenue growth. We have also experienced turnover with some of our distributors in the past that has adversely affected sales in the countries in which those distributors operate. Similar occurrences could happen in the future.
Most of our customer relationships outside of the U. S. are with governmental entities, and we could be materially adversely affected by violations of the U.S. Foreign Corrupt Practices Act and similar anti-bribery laws in non-U.S. jurisdictions.
The U.S. Foreign Corrupt Practices Act (
FCPA)
and similar anti-bribery laws in non-U.S. jurisdictions generally prohibit companies and their intermediaries from making improper payments to non-U.S. officials for the purpose of obtaining or retaining business. Because of the predominance of government-sponsored healthcare systems around the world, most of our customer relationships outside of the U. S. are with governmental entities, and physicians practicing in those systems are considered “government officials.” Therefore, our sales to these entities are therefore subject to such anti-bribery laws. Our policies mandate compliance with these anti-bribery laws. We operate in many parts of the world that have experienced governmental corruption, and in certain circumstances strict compliance with anti-bribery laws may be at variance with local customs and practices. Despite our training and compliance programs, our internal control policies and procedures may not always protect us from reckless or criminal acts committed by our employees, distributors or agents. Violations of the FCPA or other anti-bribery laws, or allegations of such violations, could disrupt our business and materially adversely affect our business, results of operations, financial condition or cash flows.
Foreign currency exchange rates may adversely affect our results.
We are exposed to the effects of changes in foreign currency exchange rates, and we have not historically hedged our foreign currency exposure. Approximately 31.6%, 33.9% and 34.4% of our revenue for the years ended
December 31, 2015
,
2014
and
2013
, respectively, were derived from sales in non-U.S. markets, and we expect sales from non-U.S. markets to continue to represent a significant portion of our revenue. For direct sales in our international markets, we are paid by our customers in their local currency, which is primarily euros. For sales to distributors in our international markets, we are paid in either U.S. dollars, euros or Japanese yen. Therefore, when the U.S. dollar strengthens relative to the euro, yen or other local currency, as it has in recent periods, our U.S. dollar reported revenue from non-U.S. dollar denominated sales will decrease, or we will need to increase our non-U.S. dollar denominated prices, which may not be commercially practical. Conversely, when the U.S. dollar weakens relative to the euro, yen or other local currency, our U.S. dollar reported expenses from non-U.S. dollar denominated operating costs will increase. Changes in the relative values of currencies occur regularly and, in some instances, could materially adversely affect our business, results of operations, financial condition or cash flows.
We have experienced rapid growth in recent periods, and if we fail to manage our growth effectively, our business and results of operations may suffer.
We have significantly expanded our overall business, research and development, customer base, product portfolio, employee headcount and operations in recent periods. We have also established new operations in other countries. We have increased our total number of full-time employees from 468 as of
December 31, 2013
, to approximately 1,100 as of
December 31, 2015
. Our expansion has placed, and our expected future growth will continue to place, a significant strain on our managerial, operational, product development, sales and marketing, administrative, financial and other resources. More systems, facilities, processes and management employees are needed to allow us to continue to grow successfully. We also plan to continue to increase our salesforce. Our experience has been that it takes at least six months, and often longer, before new sales personnel generate enough sales to cover their costs, resulting in increased costs without offsetting revenue during periods in which we are increasing the size of our salesforce. To meet anticipated demand for our products, we will also have to obtain additional space, buy additional equipment and hire additional research and development and manufacturing employees, including quality control personnel and other personnel involved in the production process. If we are unable to manage our growth successfully, it could have a material and adverse effect on our business, results of operations, financial condition or cash flows.
We have experienced rapid initial growth in the endovascular treatment of stroke and we believe this market may not continue to grow sustainably at these rates.
Our revenue increased from $88.8 million to $125.5 million to $186.1 million in the years ended December 31, 2013, 2014 and 2015, respectively. Revenue increased in 2014 and 2015 partially as a result of the presentation and publication of the MR. CLEAN trial results in the fourth quarter of 2014, and the presentation and publication of additional trial results in the first quarter of 2015, each of which supported endovascular treatment of stroke and opened up additional opportunities for our products as the standard of care in treatment of stroke, resulting in increased procedures for us and our competitors. We do not expect that the rate of market growth will continue at this pace in the future.
28
We have experienced rapid growth in the market for our peripheral vascular products and we expect this growth to be more gradual in the future.
Revenue from our peripheral vascular products increased $25.4 million, or 131.9%, to $44.7 million in 2015, from $19.3 million in 2014. Our peripheral embolization and peripheral thrombectomy products have experienced strong volume growth, primarily due to the focused efforts of our dedicated peripheral vascular salesforce, which was established in the second half of 2014, and further market penetration of our products. As we continue to grow and scale our peripheral vascular business, we expect that our growth rates will be more gradual.
We depend on key personnel to operate our business and develop our products, and if we are unable to retain, attract and integrate qualified personnel, our ability to develop and successfully grow our business could be harmed.
We believe that our future success is highly dependent on the contributions of our executive officers, particularly our chief executive officer, as well as our ability to attract and retain highly skilled and experienced sales and marketing, technical and other personnel in the U. S. and in international markets. Each of these persons’ efforts will be critical to us as we continue to develop our products and business. If we were to lose one or more of our key employees, including to competitors, we may experience difficulties in competing effectively, developing our products and implementing our business strategies.
Our research and development and sales and marketing programs depend on our ability to attract and retain highly skilled technicians, engineers and salespeople. We may not be able to attract or retain qualified employees in the future due to the intense competition for qualified personnel among life science businesses, particularly in the San Francisco Bay Area, where our corporate headquarters, research and development and manufacturing facilities are located. If we are not able to identify, recruit and retain highly qualified personnel, we may experience constraints that will adversely affect our ability to support our research, development, manufacturing and sales programs, and ultimately our ability to compete. If we are unable to identify, recruit and retain qualified salespeople, there could be a delay or decline in the adoption of our products. If key personnel were to leave Penumbra, either to join our competitors or otherwise, we may not be able to attract and retain equally qualified personnel to replace them.
We depend on information technology systems to operate our business, and issues with maintaining, upgrading or implementing these systems, or a cyber-attack or other breach of these systems could have a material adverse effect on our business.
We rely on the efficient and uninterrupted operation of information technology systems to process, transmit and store electronic information in our day-to-day operations. All information technology systems are vulnerable to damage or interruption from a variety of sources. As our business has grown in size and complexity, the growth has placed, and will continue to place, significant demands on our information technology systems. To effectively manage this growth, our information systems and applications require an ongoing commitment of significant resources to maintain, protect, enhance and upgrade existing systems and develop and implement new systems to keep pace with changing technology and our business needs. For example, we are in the process of evaluating an upgrade to our existing enterprise resource planning (ERP) software system to perform various functions, and we may implement other upgrades or new systems in the near future. These upgrades or system changes entail certain risks, including difficulties with changes in business processes that could disrupt our operations, such as our ability to track orders and timely ship products, manage our supply chain and aggregate financial and operational data. During transitions we may continue to rely on legacy information systems, which may be costly or inefficient, while the implementation of new initiatives may not achieve the anticipated benefits and may divert management's attention from other operational activities, negatively affect employee morale, or have other unintended consequences. Delays in integration or disruptions to our business from implementation of new or upgraded systems could have a material adverse impact on our financial condition and operating results. Additionally, if we are not able to accurately forecast expenses and capitalized costs related to system upgrades and changes, this may have an adverse impact on our financial condition and operating results.
In addition, our information technology systems are vulnerable to a cyber-attack, malicious intrusion, breakdown, destruction, loss of data privacy or other significant disruption. Any such successful attacks could result in the theft of intellectual property or other misappropriation of assets, or otherwise compromise our confidential or proprietary information and disrupt our operations. Cyber-attacks are becoming more sophisticated and frequent, and our systems could be the target of malware and other cyber-attacks. We have invested in our systems and the protection of our data to reduce the risk of an intrusion or interruption, and we monitor our systems on an ongoing basis for any current or potential threats. We can give no assurances that these measures and efforts will prevent interruptions or breakdowns.
If the information we rely upon to run our businesses were to be found to be inaccurate or unreliable, if we fail to maintain or protect our information technology systems and data integrity effectively, if we fail to develop and implement new or upgraded systems to meet our business needs in a timely manner, or if we fail to anticipate, plan for or manage significant disruptions to these systems, our competitive position could be harmed, we could have operational disruptions, we could lose
29
existing customers, have difficulty preventing, detecting, and controlling fraud, have disputes with customers, specialist physicians and other health care professionals, have regulatory sanctions or penalties imposed or other legal problems incur increased operating and administrative expenses, lose revenues as a result of a data privacy breach or theft of intellectual property or suffer other adverse consequences, any of which could have a material adverse effect on our business, results of operations, financial condition or cash flows.
Cost-containment efforts of our customers, purchasing groups and governmental organizations could have a material adverse effect on our sales and profitability.
In an effort to reduce costs, many hospitals within the U. S. have become members of Group Purchasing Organizations (GPOs) and Integrated Delivery Networks (IDNs). GPOs and IDNs negotiate pricing arrangements with medical device companies and distributors and offer the negotiated prices to affiliated hospitals and other members. GPOs and IDNs typically award contracts on a category-by-category basis through a competitive bidding process. Bids are generally solicited from multiple providers with the intention of driving down pricing or reducing the number of vendors. Due to the highly competitive nature of the GPO and IDN contracting processes, we may not be able to obtain or maintain contract positions with major GPOs and IDNs. Furthermore, the increasing leverage of organized buying groups may reduce market prices for our products, thereby reducing our profitability.
While having a contract with a GPO or IDN for a given product category can facilitate sales to members of that GPO or IDN, such contract positions can offer no assurance that any level of sales will be achieved, as sales are typically made pursuant to purchase orders. Even when a provider is the sole contracted supplier of a GPO or IDN for a certain product category, members of the GPO or IDN generally are free to purchase from other suppliers. Furthermore, GPO and IDN contracts typically are terminable without cause by the GPO or IDN upon 60 to 90 days’ notice. Accordingly, although we have multiple contracts with many major GPOs and IDNs, the members of such groups may choose to purchase from our competitors due to the price or quality offered by such competitors, which could result in a decline in our sales and profitability.
The successful use of our products depends, in part, on our ability to educate specialist physicians in the proper use of our products, which may be more complex than competitive products or alternative treatments that do not use our products. If we are unable to educate specialist physicians in the proper use of our products, we may experience a high risk of product liability.
The successful use of our products depends, in part, on our ability to educate specialist physicians in the proper use of our products, which may be more complex than competitive products or alternative treatments that do not use our products. We educate specialist physicians on the proper techniques in using our products to achieve the intended outcome. However, our products may be more complicated to operate than competitive products or alternative treatments that do not use our products. In the event that specialist physicians perceive that our products are complex relative to alternative products or established treatments that do not use our products, we may have difficulty gaining or increasing adoption of our products. Further, we may be unable to provide adequate education on the use of our products to specialist physicians, and some specialist physicians may not be willing to invest the time required to become properly educated on the use of our products. If we are unable to educate specialist physicians to properly use our products, this may lead to inadequate demand for our products and materially adversely affect our business, results of operations, financial condition or cash flows.
If we do not adequately educate specialist physicians on the use of our products, and our products are used incorrectly during procedures, we may also be subject to claims against us by such specialist physicians, their hospitals or their patients. Our business, including our reputation, may consequently be adversely affected by any litigation that may occur based on error in the use of our products, and such litigation could also materially adversely affect our results of operations, financial condition or cash flows.
Regulatory Risks
We are subject to stringent domestic and foreign medical device regulation, which may impede the approval or clearance process for our products, hinder our development activities and manufacturing processes and, in some cases, result in the recall or seizure of previously approved or cleared products.
Our products, development activities and manufacturing processes are subject to extensive and rigorous regulation by the FDA and by comparable agencies in foreign countries and by other regulatory agencies and governing bodies. Manufacturers of medical devices such as us must comply with certain regulations that cover the composition, labeling, testing, clinical study, manufacturing, packaging and distribution of medical devices. In addition, medical devices must receive FDA clearance or approval before they can be commercially marketed in the U. S.. The FDA may require testing and surveillance programs to monitor the effects of cleared or approved products that have been commercialized and can prevent or limit further marketing of a product based on the results of these post-marketing programs. Furthermore, most major markets for medical devices outside the U. S. require clearance, approval or compliance with certain standards and requirements before a product can be
30
commercially marketed. The process of obtaining marketing approval or clearance from the FDA and foreign regulatory agencies for new products could take a significant period of time, require the expenditure of substantial resources, involve rigorous pre-clinical and clinical testing, require changes to our products and result in limitations on the indicated uses of our products. We cannot provide assurance that we will receive the required approval or clearance from the FDA and foreign regulatory agencies for future products on a timely basis. Results from pre-clinical studies and early clinical trials may not allow us to predict results in later-stage testing. We cannot be certain that our future clinical trials will demonstrate the safety and effectiveness of any of our future products or will result in clearance or approval to market any of these products. The failure to receive approval or clearance for significant new products on a timely basis could have a material adverse effect on our business, results of operation, financial condition or cash flows.
The FDA also conducts periodic inspections of our facilities to determine compliance with both the FDA’s QSR requirements and/or MDR regulations. Product approvals or clearances by the FDA can be withdrawn, and new product approvals or clearances by the FDA and foreign regulatory bodies can be delayed, due to failure to comply with regulatory requirements or the occurrence of unforeseen problems following initial approval or clearance of a product. The failure to comply with regulatory requirements or the discovery of previously unknown problems with a product or manufacturer could result in fines, delays or suspensions of regulatory approvals or clearances, seizures or recalls of products (with the attendant expenses and adverse competitive impact), the banning of a particular device, an order to replace or refund the cost of any device previously manufactured or distributed, operating restrictions and criminal prosecution, as well as decreased sales as a result of negative publicity and product liability claims, all of which could have a material adverse effect on our business, results of operation, financial condition or cash flows.
The implementation of healthcare reform in the U. S. could have a material adverse effect on our business.
In March 2010, the Affordable Care Act was enacted into law in the U. S.. The Affordable Care Act includes provisions that, among other things, reduce and/or limit Medicare reimbursement, require all individuals to have health insurance (with limited exceptions) and impose new and/or increased taxes. Specifically, the law imposed a 2.3% excise tax on the sale in the U. S. of certain medical devices by a manufacturer, producer or importer of such devices starting after December 31, 2012. While this tax has been suspended for a two-year period commencing January 1, 2016, it could be reinstated. The Affordable Care Act also reduces Medicare and Medicaid payments to hospitals and clinical laboratories, which could reduce medical procedure volumes and impact the demand for our products or the prices at which we sell them. While this legislation is intended to expand health insurance coverage to uninsured persons in the U. S., the impact of any overall increase in access to healthcare on sales of our products remains uncertain. Various healthcare reform proposals have also emerged at the state level. The impact of the Affordable Care Act and these proposals could have a material adverse effect on our business, results of operation, financial condition or cash flows.
If we modify our FDA cleared products, we may need to seek and obtain new clearances, which, if not granted, would prevent us from selling our modified products or require us to redesign our products.
A component of our strategy is to continue to modify and upgrade our products that have been cleared by the FDA. The FDA requires device manufacturers to make a determination of whether or not a modification requires a clearance; however, the FDA can review a manufacturer’s decision not to submit for additional clearances. Any modifications to an FDA cleared device that would significantly affect its safety or effectiveness or that would constitute a major change in its intended use would require a new 510(k) clearance or possibly a premarket approval. We may not be able to obtain additional 510(k) clearances or premarket approvals for new products or for modifications to, or additional indications for, our existing products in a timely fashion, or at all. We also cannot provide any assurance that the FDA will agree with our decisions not to seek clearances for particular device modifications. Delays in obtaining future clearances would adversely affect our ability to introduce new or enhanced products in a timely manner, which in turn would harm our revenue and future profitability. We have made modifications to our products in the past and may make additional modifications in the future that we believe do not or will not require additional clearances. If the FDA disagrees, and requires new clearances or approvals for any modifications, and we fail to obtain such approvals or clearances or fail to secure approvals or clearances in a timely manner, we may be required to recall and to stop the manufacturing and marketing of the modified device until we obtain FDA approval or clearance, and we may be subject to significant regulatory fines or penalties, all of which could harm our results of operations and require us to redesign our products.
We may not receive necessary foreign regulatory approvals or clearances or otherwise comply with foreign regulations.
For the years ended
December 31, 2015
,
2014
and
2013
, sales outside the U. S. accounted for approximately 31.6%, 33.9% and 34.4%, respectively, of our total sales, and we expect this percentage to increase in future years. Foreign regulatory bodies have established varying regulations. Specifically, the European Union has promulgated rules that require that medical device products receive the right to affix the CE mark, an international symbol of adherence to quality assurance standards and compliance with applicable European medical device directives. Although we have received CE markings for all of the products we currently sell in the European Union, we can give no assurance that we will be able to obtain European Union
31
approval for any of our future products. Our inability or failure, or the inability or failure of our international distributors, to comply with varying foreign regulations or the imposition of new regulations could restrict or, in certain countries, result in the prohibition of the sale of our products, and thereby adversely affect our business, financial condition and results of operations. In addition, our profitability from our international operations may be limited by risks and uncertainties related to economic conditions in these regions, foreign currency fluctuations, regulatory and reimbursement approvals, competitive offerings, infrastructure development, rights to intellectual property and our ability to implement our overall business strategy. Any significant changes in the competitive, political, legal, regulatory, reimbursement or economic environment where we conduct international operations may have a material adverse effect on our business, results of operation, financial condition or cash flows.
We may not be able to meet regulatory quality requirements applicable to our manufacturing process.
We are required to register with the FDA as a device manufacturer and as a result, we are subject to periodic inspection by the FDA for compliance with the FDA’s QSR requirements, which require manufacturers of medical devices to adhere to certain regulations, including testing, quality control and documentation procedures. In addition, the federal MDR regulations require us to provide information to the FDA whenever there is evidence that reasonably suggests that a device may have caused or contributed to a death or serious injury, or has malfunctioned, and if the malfunction were to recur, it would be likely to cause or contribute to a death or serious injury. Compliance with applicable regulatory requirements is subject to continual review and is rigorously monitored through periodic inspections by the FDA. In the European Community, we are required to maintain certain International Organization for Standardization (ISO) certifications in order to sell products and we undergo periodic inspections by notified bodies to obtain and maintain these certifications. Some foreign countries, most notably Japan and Brazil, have similar requirements or may require inspections of our manufacturing facilities before approving a product for sale in their country. Some of our suppliers are subject to the same or similar scrutiny. If we or our suppliers fail to adhere to QSR, ISO or similar requirements, this could delay production of our products and lead to fines, difficulties in obtaining regulatory clearances or approvals, recalls or other consequences, which could in turn have a material adverse effect on our business, results of operation, financial condition or cash flows.
We are subject to periodic inspections by the FDA and other regulatory bodies related to regulatory requirements that apply to medical devices designed and manufactured, and clinical trials sponsored, by us. We recently received notices of inspectional observations or deficiencies from the FDA, which require us to undertake corrective and preventive actions or other actions in order to address the FDA’s concerns, which could be expensive and time-consuming to complete and could impose additional burdens and expenses.
We are subject to periodic inspections by the FDA and other regulatory bodies. If we receive a notice of inspectional observations or deficiencies from the FDA following an inspection, we may be required to undertake corrective and preventive actions or other actions in order to address the FDA’s concerns, which could be expensive and time-consuming to complete and could impose additional burdens and expenses. Failure to adequately address the FDA’s concerns could expose us to enforcement and administrative actions.
From June 24, 2015 to July 15, 2015, the FDA conducted an inspection of our records relating to certain investigational sites for two different clinical trials, and from July 30, 2015 to August 4, 2015, the FDA conducted an inspection of our Quality System. At the conclusion of the first inspection, a Form FDA 483 was issued with one observation related to the failure to ensure proper monitoring at five of the investigational sites reviewed. At the conclusion of the second inspection, a Form FDA 483 was also issued with one observation relating to our procedures for completing and documenting effectiveness checks for Corrective and Preventative Action (CAPA). We provided timely responses to both Form FDA 483s, implemented changes to our clinical trial monitoring and CAPA procedures, and updated the FDA on the steps taken. On November 6, 2015, we received a letter from the FDA regarding the CAPA-related Form 483, noting that they had received our responses and would review the adequacy of the actions taken at our next inspection. On December 21, 2015, we received a letter from the FDA regarding the monitoring-related Form 483 indicating that our responses and actions appeared adequate to address the observation and noting that they may verify the actions taken during a future inspection. However, the FDA may conclude in subsequent inspections that we have not adequately responded to its observations or carried out all necessary corrective actions, and could take action against us without further notice. Action by the FDA against us could result in monetary fines or require us to take further corrective actions, which could be expensive and time-consuming to complete and could impose additional burdens and expenses, and could even require us to discontinue our investigational studies.
We are subject to healthcare fraud and abuse regulations that could result in significant liability, require us to change our business practices and restrict our operations in the future.
We are subject to various federal, state and local laws targeting fraud and abuse in the healthcare industry, including anti-kickback and false claims laws. Violations of these laws are punishable by criminal or civil sanctions, including substantial fines, imprisonment and exclusion from participation in healthcare programs such as Medicare and Medicaid. These laws and regulations are wide ranging and subject to changing interpretation and application, which could restrict our sales or marketing
32
practices. Furthermore, since many of our customers rely on reimbursement from Medicare, Medicaid and other governmental programs to cover a substantial portion of their expenditures, our exclusion from such programs as a result of a violation of these laws could have a material adverse effect on our business, results of operation, financial condition or cash flows.
The FDA and other regulatory agencies strictly regulate the promotional claims that may be made about medical devices. If we are found to have improperly promoted our products for off-label uses, we may become subject to significant fines and other liability.
The FDA and other regulatory agencies strictly regulate the promotional claims that may be made about medical devices. For example, devices cleared under section 510(k) cannot be marketed for any intended use that is outside of the FDA’s substantial equivalence determination for such devices. Physicians nevertheless may use our products on their patients in a manner that is inconsistent with the intended use cleared by the FDA. If we are found to have promoted such “off-label” uses, we may become subject to significant government fines and other related liability. The federal government has levied large civil and criminal fines against companies for alleged improper promotion and has enjoined several companies from engaging in off-label promotion. The FDA has also requested that companies enter into consent decrees or permanent injunctions under which specified promotional conduct is changed or curtailed.
Our operations are subject to environmental, health and safety laws and regulations, with which compliance may be costly.
Our business is subject to federal, state, and local laws and regulations relating to the protection of the environment, worker health and safety and the use, management, storage, and disposal of hazardous substances and wastes. Failure to comply with these laws and regulations may result in substantial fines, penalties or other sanctions. In addition, environmental laws and regulations could require us to pay for environmental remediation and response costs, or subject us to third party claims for personal injury, natural resource or property damage, relating to environmental contamination. Liability may be imposed whether or not we knew of, or were responsible for, such environmental contamination. The cost of defending against environmental claims, of compliance with environmental, health and safety regulatory requirements or of remediating contamination could materially adversely affect our business, assets or results of operations and, consequently, amounts available for distribution to our stockholders.
Risks Related to Our Intellectual Property
We rely on a variety of intellectual property rights, and if we are unable to maintain or protect our intellectual property, our business and results of operations will be harmed.
Our commercial success will depend, in part, on our ability to obtain and maintain intellectual property protection for our products and related technologies both in the U. S. and elsewhere, successfully defend our intellectual property rights against third-party challenges and successfully enforce our intellectual property rights to prevent third-party infringement. While we rely primarily upon a combination of patents, trademarks and trade secret protection, as well as nondisclosure, confidentiality and other contractual agreements to protect the intellectual property related to our brands, products and other proprietary technologies, protection derived from patents is relatively limited.
The process of obtaining patent protection is expensive and time-consuming, and we may not be able to prosecute all necessary or desirable patent applications at a reasonable cost or in a timely manner. We may choose not to seek patent protection for certain innovations or products and may choose not to pursue patent protection in certain jurisdictions, and under the laws of certain jurisdictions, patents or other intellectual property rights may be unavailable or limited in scope and, in any event, any patent protection we obtain may be limited. As a result, some of our products are not, and in the future may not be, protected by patents. We generally apply for patents in those countries where we intend to make, have made, use or sell products and where we assess the risk of infringement to justify the cost of seeking patent protection. However, we do not seek protection in all countries where we sell products and we may not accurately predict all the countries where patent protection would ultimately be desirable. If we fail to timely file a patent application in any such country or major market, we may be precluded from doing so at a later date. Competitors may use our technologies in jurisdictions where we have not obtained patent protection to develop their own products and, further, may export otherwise infringing products to territories in which we have patent protection that may not be sufficient to terminate infringing activities.
Furthermore, we cannot guarantee that any patents will be issued from any pending or future owned or licensed patent applications, or if any current or future patents will provide us with any meaningful protection or competitive advantage. Even if issued, existing or future patents may be challenged, including with respect to ownership, narrowed, invalidated, held unenforceable or circumvented, any of which could limit our ability to prevent competitors and other third parties from developing and marketing similar products or limit the length of terms of patent protection we may have for our products and technologies. Other companies may also design around technologies we have patented, licensed or developed. In addition, the issuance of a patent does not give us the right to practice the patented invention. Third parties may have blocking patents that could prevent us from marketing our products or practicing our own patented technology.
33
The patent positions of medical device companies can be highly uncertain and involve complex legal, scientific and factual questions for which important legal principles remain unresolved. The standards that the U. S. Patent and Trademark Office (USPTO) and its foreign counterparts use to grant patents are not always applied predictably or uniformly. Changes in either the patent laws, implementing regulations or the interpretation of patent laws may diminish the value of our rights. The legal systems of certain countries do not protect intellectual property rights to the same extent as the laws of the U. S., and many companies have encountered significant problems in protecting and defending such rights in foreign jurisdictions.
Because patent applications in the U. S., Europe and many other jurisdictions are typically not published until 18 months after filing, or in some cases not at all, and because publications of discoveries in scientific literature lag behind actual discoveries, we cannot be certain that we were the first to make the inventions claimed in our issued patents or pending patent applications, or that we were the first to file for protection of the inventions set forth in our patents or applications. We can give no assurance that all of the potentially relevant art relating to our patents and patent applications has been found; overlooked prior art could be used by a third party to challenge the validity, enforceability and scope of our patents or prevent a patent from issuing from a pending patent application. As a result, we may not be able to obtain or maintain protection for certain inventions. Therefore, the validity, enforceability and scope of our patents in the U. S., Europe and in other countries cannot be predicted with certainty and, as a result, any patents that we own or license may not provide sufficient protection against our competitors.
Third parties may challenge any existing patent or future patent we own or license through adversarial proceedings in the issuing offices or in court proceedings, including as a response to any assertion of our patents against them. In any of these proceedings, a court or agency with jurisdiction may find our patents invalid and/or unenforceable, or even if valid and enforceable, insufficient to provide protection against competing products and services sufficient to achieve our business objectives. We may be subject to a third party pre-issuance submission of prior art to the USPTO, or reexamination by the USPTO if a third party asserts a substantial question of patentability against any claim of a U.S. patent we own or license. The adoption of the Leahy-Smith America Invents Act (Leahy-Smith Act) in September 2011 established additional opportunities for third parties to invalidate U.S. patent claims, including inter parties review and post-grant review proceedings. Outside of the U. S., patents we own or license may become subject to patent opposition or similar proceedings, which may result in loss of scope of some claims or the entire patent. In addition, such proceedings are very complex and expensive, and may divert our management’s attention from our core business. If any of our patents are challenged, invalidated, circumvented by third parties or otherwise limited or expire prior to the commercialization of our product candidates, and if we do not own or have exclusive rights to other enforceable patents protecting our products or other technologies, competitors and other third parties could market products and use processes that are substantially similar to, or superior to, ours and our business would suffer.
The degree of future protection for our proprietary rights is uncertain because legal means afford only limited protection and may not adequately protect our rights or permit us to gain or keep a competitive advantage. For example:
|
•
|
others may be able to develop products that are similar to, or better than, ours in a way that is not covered by the claims of our patents;
|
|
•
|
we might not have been the first to make the inventions covered by our patents or pending patent applications;
|
|
•
|
we might not have been the first to file patent applications for these inventions;
|
|
•
|
any patents that we obtain may not provide us with any competitive advantages or may ultimately be found invalid or unenforceable; or
|
|
•
|
we may not develop additional proprietary technologies that are patentable.
|
We may file lawsuits or initiate other proceedings to protect or enforce our patents or other intellectual property rights, which could be expensive, time consuming and unsuccessful.
Competitors may infringe our issued patents or other intellectual property. To counter infringement or unauthorized use, we may be required to file infringement claims, which can be expensive and time-consuming. Any claims we assert against perceived infringers could provoke these parties to assert counterclaims against us alleging that we infringe their intellectual property. In addition, in a patent infringement proceeding, a court may decide that a patent of ours is invalid or unenforceable, in whole or in part, construe the patent’s claims narrowly or refuse to stop the other party from using the technology at issue on the grounds that our patents do not cover the technology in question. An adverse result in any litigation proceeding could put one or more of our patents at risk of being invalidated or interpreted narrowly, which could adversely affect our competitive business position, business prospects and financial condition.
34
Our commercial success depends significantly on our ability to operate without infringing upon the intellectual property rights of third parties.
The medical device industry is subject to rapid technological change and substantial litigation regarding patent and other intellectual property rights. Our competitors in both the U. S. and abroad, many of which have substantially greater resources and have made substantial investments in patent portfolios and competing technologies, may have applied for or obtained or may in the future apply for and obtain, patents that will prevent, limit or otherwise interfere with our ability to make, use and sell our products. Numerous third party patents exist in the fields relating to our products, and it is difficult for industry participants, including us, to identify all third-party patent rights relevant to our products and technologies. Moreover, because some patent applications are maintained as confidential for a certain period of time, we cannot be certain that third parties have not filed patent applications that cover our products and technologies.
Patents could be issued to third parties that we may ultimately be found to infringe. Third parties may have or obtain valid and enforceable patents or proprietary rights that could block us from developing product candidates using our technology. Our failure to obtain or maintain a license to any technology that we require may materially harm our business, financial condition and results of operations. Furthermore, we would be exposed to a threat of litigation.
From time to time, we may be party to, or threatened with, litigation or other proceedings with third parties, including non-practicing entities, who allege that our products, components of our products and/or proprietary technologies infringe, misappropriate or otherwise violate their intellectual property rights. The types of situations in which we may become a party to such litigation or proceedings include:
|
•
|
we or our collaborators may initiate litigation or other proceedings against third parties seeking to invalidate the patents held by those third parties or to obtain a judgment that our products or processes do not infringe those third parties’ patents;
|
|
•
|
we or our collaborators may participate at substantial cost in International Trade Commission proceedings to abate importation of products that would compete unfairly with our products;
|
|
•
|
if our competitors file patent applications that claim technology also claimed by us or our licensors, we or our licensors may be required to participate in interference, derivation or opposition proceedings to determine the priority of invention, which could jeopardize our patent rights and potentially provide a third party with a dominant patent position;
|
|
•
|
if third parties initiate litigation claiming that our processes or products infringe their patent or other intellectual property rights, we and our collaborators will need to defend against such proceedings;
|
|
•
|
if third parties initiate litigation or other proceedings seeking to invalidate patents owned by or licensed to us or to obtain a declaratory judgment that their product or technology does not infringe our patents or patents licensed to us, we will need to defend against such proceedings;
|
|
•
|
we may be subject to ownership disputes relating to intellectual property, including disputes arising from conflicting obligations of consultants or others who are involved in developing our products; and
|
|
•
|
if a license to necessary technology is terminated, the licensor may initiate litigation claiming that our processes or products infringe or misappropriate their patent or other intellectual property rights and/or that we breached our obligations under the license agreement, and we and our collaborators would need to defend against such proceedings.
|
These lawsuits and proceedings, regardless of merit, are time-consuming and expensive to initiate, maintain, defend or settle, and could divert the time and attention of managerial and technical personnel, which could materially adversely affect our business. Any such claim could also force use to do one or more of the following:
|
•
|
incur substantial monetary liability for infringement or other violations of intellectual property rights, which we may have to pay if a court decides that the product or technology at issue infringes or violates the third party’s rights, and if the court finds that the infringement was willful, we could be ordered to pay treble damages and the third party’s attorneys’ fees;
|
|
•
|
pay substantial damages to our customers or end users to discontinue use or replace infringing technology with non-infringing technology;
|
|
•
|
stop manufacturing, selling, using, exporting or licensing the product or technology incorporating the allegedly infringing technology or stop incorporating the allegedly infringing technology into such product or technology;
|
|
•
|
obtain from the owner of the infringed intellectual property right a license, which may require us to pay substantial upfront fees or royalties to sell or use the relevant technology and which may not be available on commercially reasonable terms, or at all;
|
35
|
•
|
redesign our products and technology so they do not infringe or violate the third party’s intellectual property rights, which may not be possible or may require substantial monetary expenditures and time;
|
|
•
|
enter into cross-licenses with our competitors, which could weaken our overall intellectual property position;
|
|
•
|
lose the opportunity to license our technology to others or to collect royalty payments based upon successful protection and assertion of our intellectual property against others;
|
|
•
|
find alternative suppliers for non-infringing products and technologies, which could be costly and create significant delay; or
|
|
•
|
relinquish rights associated with one or more of our patent claims, if our claims are held invalid or otherwise unenforceable.
|
Some of our competitors may be able to sustain the costs of complex intellectual property litigation more effectively than we can because they have substantially greater resources. In addition, intellectual property litigation, regardless of its outcome, may cause negative publicity, adversely impact prospective customers, cause product shipment delays, or prohibit us from manufacturing, marketing or otherwise commercializing our products and technology. Any uncertainties resulting from the initiation and continuation of any litigation could have a material adverse effect on our ability to raise additional funds or otherwise have a material adverse effect on our business, results of operation, financial condition or cash flows.
In addition, we may indemnify our customers and distributors against claims relating to the infringement of intellectual property rights of third parties related to our products. Third parties may assert infringement claims against our customers or distributors. These claims may require us to initiate or defend protracted and costly litigation on behalf of our customers or distributors, regardless of the merits of these claims. If any of these claims succeed, we may be forced to pay damages on behalf of our customers, suppliers or distributors, or may be required to obtain licenses for the products they use. If we cannot obtain all necessary licenses on commercially reasonable terms, our customers may be forced to stop using our products.
Furthermore, because of the substantial amount of discovery required in connection with intellectual property litigation, there is a risk that some of our confidential information could be compromised by disclosure during this type of litigation. There could also be public announcements of the results of hearings, motions or other interim proceedings or developments. If securities analysts or investors perceive these results to be negative, it could have a material adverse effect on the price of our common stock. The occurrence of any of these events may have a material adverse effect on our business, results of operation, financial condition or cash flows.
Changes in patent law could diminish the value of patents in general, thereby impairing our ability to protect our existing and future products.
Recent patent reform legislation could increase the uncertainties and costs surrounding the prosecution of our patent applications and the enforcement or defense of our issued patents. The Leahy-Smith Act includes a number of significant changes to U.S. patent law. These include provisions that affect the way patent applications are prosecuted, redefine prior art, and may also affect patent litigation. The USPTO developed new regulations and procedures to govern administration of the Leahy-Smith Act, including switching the U. S. patent system from a “first-to-invent” system to a “first-to-file” system. Under a “first-to-file” system, assuming the other requirements for patentability are met, the first inventor to file a patent application generally will be entitled to the patent on an invention regardless of whether another inventor had made the invention earlier. Many of the substantive changes to patent law associated with the Leahy-Smith Act, in particular, the first-to-file provisions, only became effective recently. Accordingly, it is not clear what, if any, impact the Leahy-Smith Act will have on the operation of our business. The Leahy-Smith Act and its implementation could increase the uncertainties and costs surrounding the prosecution of our patent applications and the enforcement or defense of our issued patents, all of which could have a material adverse effect on our business, results of operation, financial condition or cash flows.
In addition, patent reform legislation may pass in the future that could lead to additional uncertainties and increased costs surrounding the prosecution, enforcement and defense of our patents and applications. Furthermore, the U.S. Supreme Court and the U.S. Court of Appeals for the Federal Circuit have made, and will likely continue to make, changes in how the patent laws of the U. S. are interpreted. Similarly, foreign courts have made, and will likely continue to make, changes in how the patent laws in their respective jurisdictions are interpreted. We cannot predict future changes in the interpretation of patent laws or changes to patent laws that might be enacted into law by U. S. and foreign legislative bodies. Those changes may materially affect our patents or patent applications and our ability to obtain additional patent protection in the future.
36
Obtaining and maintaining patent protection depends on compliance with various procedural, document submission, fee payment and other requirements imposed by governmental patent agencies, and our patent protection could be reduced or eliminated for non-compliance with these requirements.
The USPTO and various foreign patent offices require compliance with a number of procedural, documentary, fee payment and other similar provisions. In addition, periodic maintenance fees on our owned and in-licensed patents are due to be paid to governmental patent agencies over the lifetime of the patents. Future maintenance fees will also need to be paid on other patents that may be issued to us. We have systems in place to remind us to pay these fees, and we employ outside firms to remind us or our licensor to pay annuity fees due to patent agencies on our patents and pending patent applications. In certain cases, an inadvertent lapse can be cured by payment of a late fee or by other means in accordance with the applicable rules. However, there are situations in which noncompliance can result in abandonment or lapse of the patent or patent application, resulting in partial or complete loss of patent rights in the relevant jurisdiction. In such an event, our competitors might be able to enter the market and this circumstance would have a material adverse effect on our business, results of operation, financial condition or cash flows.
If our trademarks and trade names are not adequately protected, then we may not be able to build name recognition in our markets of interest and our business may be adversely affected.
We currently own nine trademarks, related to our company name, logo, products and technology, that are registered with the USPTO as well as six trademarks registered in Europe and Japan. Our registered or unregistered trademarks or trade names may be challenged, infringed, circumvented, declared generic or determined to be infringing on other marks or names. We may not be able to protect our rights in these trademarks and trade names, which we need in order to build name recognition with potential customers in our markets of interest. There is no guarantee we will be able to secure registration for any of our pending trademark applications with the USPTO or comparable foreign authorities. In addition, third parties have registered trademarks similar and identical to our trademarks, and may in the future file for registration of such trademarks. If they succeed in registering or developing common law rights in such trademarks, and if we are not successful in challenging such third-party rights, we may not be able to use these trademarks to market our products in those countries where such third parties have registered such trademarks or obtained such common law rights. In any case, if we are unable to establish name recognition based on our trademarks and trade names, then we may not be able to compete effectively and our business may be adversely affected.
In addition, we may be involved in litigation or other proceedings to protect our trademark rights associated with our company name or the names used with our products. For example, the U. S. application for registration of our Apollo trademark is currently subject to an opposition proceeding before the Trademark Trial and Appeal Board. An adverse decision in such proceeding could require us to establish an alternative name for our Apollo product line. Any objections we receive from the USPTO, foreign trademark authorities or third parties relating to our pending applications could require us to incur significant expense in defending the objections or establishing alternative names. Names used with our products may be claimed to infringe names held by others or to be ineligible for proprietary protection. If we have to change the name of our company or any product, we may experience a loss in goodwill associated with our brand name, customer confusion or a loss of sales.
If we are unable to protect the confidentiality of our trade secrets and other proprietary information, our business and competitive position may be harmed.
In addition to patent protection, we also rely on confidential proprietary information, including trade secrets and know-how, to develop and maintain our competitive position. We seek to protect our confidential proprietary information, in part, by entering into confidentiality agreements with our employees, consultants, collaborators and others upon the commencement of their relationships with us. These agreements require that all confidential information developed by the individual or made known to the individual by us during the course of the individual’s relationship with us be kept confidential. Our agreements with employees and our personnel policies also provide that any inventions conceived by the individual in the course of rendering services to us shall be our exclusive property. However, we may not obtain these agreements in all circumstances, and individuals with whom we have these agreements may not comply with their terms. Thus, despite such agreements, such inventions may become assigned to third parties. Monitoring unauthorized uses and disclosures of our intellectual property is difficult, and we do not know whether the steps we have taken to protect our intellectual property will be effective. In the event of unauthorized use or disclosure of our trade secrets or proprietary information, these agreements, even if obtained, may not provide meaningful protection, particularly for our trade secrets or other confidential information. To the extent that our employees, consultants or contractors use technology or know-how owned by third parties in their work for us, disputes may arise between us and those third parties as to the rights in related inventions. To the extent that an individual who is not obligated to assign rights in intellectual property to us is rightfully an inventor of intellectual property, we may need to obtain an assignment or a license to that intellectual property from that individual, or a third party or from that individual’s assignee. Such assignment or license may not be available on commercially reasonable terms or at all.
37
Adequate remedies may not exist in the event of unauthorized use or disclosure of our proprietary information. The disclosure of our trade secrets would impair our competitive position and may materially harm our business, financial condition and results of operations. Costly and time consuming litigation could be necessary to enforce and determine the scope of our proprietary rights, and failure to maintain trade secret protection could adversely affect our competitive business position. In addition, others may independently discover or develop our trade secrets and proprietary information, and the existence of our own trade secrets affords no protection against such independent discovery.
We may also employ individuals who were previously or concurrently employed at research institutions and/or other medical device companies, including our competitors or potential competitors. We may be subject to claims that these employees, or we, have inadvertently or otherwise used or disclosed trade secrets or other proprietary information of their former employers, or that patents and applications we have filed to protect inventions of these employees, even those related to one or more of our products, are rightfully owned by their former or concurrent employer. Litigation may be necessary to defend against these claims. Even if we are successful in defending against these claims, litigation could result in substantial costs and be a distraction to management.
Risks Related to Our Finances and Capital Requirements
It is difficult to forecast future performance, which may cause our financial results to fluctuate unpredictably.
A number of factors over which we have limited or no control may contribute to fluctuations in our financial results, such as:
|
•
|
variations in revenue due to the unavailability of specialist physicians who use our products during certain times of the year, such as those periods when there are major conferences on conditions they treat or those periods when high volume users of our products take time off of work;
|
|
•
|
positive or negative media coverage of our products or the procedures or products of our competitors or our industry;
|
|
•
|
publication of clinical trial results or studies by us or our competitors;
|
|
•
|
changes in our sales process due to industry changes, such as changes in the stroke care pathway;
|
|
•
|
delays in receipt of anticipated purchase orders;
|
|
•
|
delays in customers receiving products;
|
|
•
|
performance of our independent distributors;
|
|
•
|
our ability to obtain further regulatory clearances or approvals;
|
|
•
|
the timing of product development and clinical trial activities, including the pace of enrollment;
|
|
•
|
delays in, or failure of, product and component deliveries by our suppliers;
|
|
•
|
changes in reimbursement policies or levels;
|
|
•
|
the number of procedures performed in any given period using our products, which can sometimes vary significantly between periods;
|
|
•
|
customer response to the introduction of new products or alternative treatments, and the degree to we which we are effective in transitioning customers to our products; and
|
|
•
|
fluctuations in foreign currency.
|
In the event our actual revenue and results of operations do not meet our or others’ forecasts for a particular period, the market price of our common stock may decline substantially.
We may require additional financing in the future and may not be able to obtain such financing on favorable terms, if at all, which could force us to delay, reduce or eliminate our research and development activities or otherwise harm our business.
To date, we have financed our operations primarily through our operations, sales of our equity securities, including in our IPO and borrowings under a line of credit with a financial institution. We are unable to predict the extent of any future operating cash flows or whether we will be able to maintain or grow our profitability. If we require additional financing to continue or expand our operations, for research and development, for acquisitions or for other purposes, we may determine to engage in equity or debt financings or incur other indebtedness. We may not be able to timely secure additional debt or equity financing on favorable terms, or at all. If we raise additional funds through the issuance of equity or convertible debt or other equity-linked securities, our existing stockholders could suffer significant dilution. Any debt financing obtained by us in the future could involve restrictive covenants relating to our capital raising activities and other financial and operational matters, which may make it more difficult for us to obtain additional capital and to pursue business opportunities, including potential
38
acquisitions. If needed funds are not available in adequate amounts or on acceptable terms from additional financing sources, our business will be materially adversely affected.
If we engage in any acquisitions, we will incur a variety of costs and may potentially face numerous risks that could adversely affect our business and operations.
If appropriate opportunities become available, we may seek to acquire additional businesses, assets, technologies or products to enhance our business. In connection with any acquisitions, we could issue additional equity securities or convertible debt or equity-linked securities, which would dilute our stockholders, cause us to incur substantial debt to fund the acquisitions, or assume significant liabilities.
Acquisitions involve numerous risks, including problems integrating the purchased operations, technologies or products, unanticipated costs and other liabilities, diversion of management’s attention from our core businesses, adverse effects on existing business relationships with current and/or prospective customers and/or suppliers, risks associated with entering markets in which we have no or limited prior experience and potential loss of key employees. Acquisitions may also require us to record goodwill and non-amortizable intangible assets that will be subject to impairment testing on a regular basis and potential periodic impairment charges, incur amortization expenses related to certain intangible assets, and incur write offs and restructuring and other related expenses, any of which could harm our results of operations and financial condition. If we fail in our integration efforts with respect to any of our acquisitions and are unable to efficiently operate as a combined organization, our business and financial condition may be adversely affected.
Risks Relating to Securities Markets and Investment in Our Common Stock
The price of our common stock may be volatile, and you could lose all or part of your investment.
The trading price of our common stock has been and is likely to continue to be volatile. Our closing stock price as reported on The New York Stock Exchange (
NYSE)
has ranged from $35.31 to $59.36 since our IPO on September 18, 2015 through December 31, 2015. Stock markets have experienced extreme volatility that has often been unrelated to the operating performance of particular companies. These broad market fluctuations may adversely affect the trading price of our common stock. In addition, limited trading volume of our stock may contribute to its future volatility. Price declines in our common stock could result from general market and economic conditions, some of which are beyond our control, and a variety of other factors, including any of the risk factors described in this Annual Report on Form 10-K or those that we have not anticipated. These broad market and industry factors may harm the market price of our common stock, regardless of our operating performance, and could cause you to lose all or part of your investment in our common stock since you might be unable to sell your shares at or above the price you paid for such shares. Factors that could cause fluctuations in the market price of our common stock include the following:
|
•
|
price and volume fluctuations in the overall stock market from time to time;
|
|
•
|
volatility in the market prices and trading volumes of medical device company stocks;
|
|
•
|
changes in operating performance and stock market valuations of other medical device companies generally, or those in our industry in particular;
|
|
•
|
sales of shares of our common stock by us or our stockholders;
|
|
•
|
failure of securities analysts to maintain coverage of us, changes in financial estimates by securities analysts who follow our company, or our failure to meet these estimates or the expectations of investors;
|
|
•
|
the financial projections we may provide to the public, any changes in those projections or our failure to meet those projections;
|
|
•
|
announcements by us or our competitors of new products or services;
|
|
•
|
the public’s reaction to our press releases, other public announcements and filings with the SEC;
|
|
•
|
rumors and market speculation involving us or other companies in our industry;
|
|
•
|
actual or anticipated changes in our results of operations or fluctuations in our results of operations;
|
|
•
|
actual or anticipated developments in our business, our competitors’ businesses or the competitive landscape generally;
|
|
•
|
litigation involving us, our industry or both, or investigations by regulators into our operations or those of our competitors;
|
|
•
|
developments or disputes concerning our intellectual property or other proprietary rights;
|
|
•
|
announced or completed acquisitions of businesses or technologies by us or our competitors;
|
39
|
•
|
new laws or regulations or new interpretations of existing laws or regulations applicable to our business;
|
|
•
|
changes in accounting standards, policies, guidelines, interpretations or principles;
|
|
•
|
any significant change in our management; and
|
|
•
|
general economic conditions and slow or negative growth of our markets.
|
In addition, in the past, following periods of volatility in the overall market and the market price of a particular company’s securities, securities class action litigation has often been instituted against these companies. This litigation, if instituted against us, could result in substantial costs and a diversion of our management’s attention and resources.
If our executive officers, directors and largest stockholders choose to act together, they may be able to significantly influence our management and operations, acting in their own best interests and not necessarily those of other stockholders.
As of
December 31, 2015
, our executive officers, directors and holders of 5% or more of our outstanding stock and their affiliates beneficially owned approximately 33.4% of our voting stock in the aggregate. These stockholders, acting together, would be able to significantly influence all matters requiring approval by our stockholders, including the election of directors and the approval of mergers or other business combination transactions. The interests of this group of stockholders may not always coincide with the interests of other stockholders, and they may act in a manner that advances their best interests and not necessarily those of other stockholders. This concentration of ownership may have the effect of delaying, preventing or deterring a change in control of our company, could deprive our stockholders of an opportunity to receive a premium for their common stock as part of a sale of our company and might ultimately affect the market price of our common stock.
A significant portion of our outstanding shares of common stock is restricted from immediate resale but may be sold into the market in the near future. This could cause the market price of our common stock to drop significantly, even if our business is doing well.
Sales of a substantial number of shares of our common stock could occur at any time. In particular, the 4,600,000 shares we sold in our IPO may be resold without restriction. In addition, approximately, 26 million shares of our common stock were subject to lock-up, as part of the underwriting condition by the underwriters of our IPO, that expires on March 16, 2016 and a substantial portion of these shares may be freely sold after that date. These sales, or the perception in the market that the holders of a large number of shares of common stock intend to sell shares, could reduce the market price of our common stock. As of
December 31, 2015
, our directors, executive officers and holders of 5% or more of our outstanding stock beneficially owned approximately 33.4% of our outstanding stock in the aggregate. If one or more of them were to sell a substantial portion of the shares they hold, it could cause our stock price to decline. Furthermore, the lock-up mentioned above may be waived by the underwriters at any time which could lead to these shares being sold in the market prior to March 16, 2016.
In addition, as of
December 31, 2015
, there were 3,755,345 shares subject to outstanding options that will become eligible for sale in the public market upon exercise of such options to the extent permitted by any applicable vesting requirements, the lock-up agreements, market standoff provisions and Rules 144 and 701 under the Securities Act of 1933, as amended (Securities Act).
Holders of an aggregate of 21,617,845 shares of our common stock have rights, subject to some conditions, to require us to file registration statements covering their shares or to include their shares in registration statements that we may file for ourselves or other stockholders.
We have registered 3,600,000 shares of common stock that were initially reserved for issuance under our Amended and Restated 2014 Equity Incentive Plan and our 2015 Employee Stock Purchase Plan. These shares can be freely sold in the public market upon issuance.
Sales of our common stock as restrictions end or pursuant to registration rights may make it more difficult for us to sell equity securities in the future at a time and at a price that we deem appropriate. These sales also could cause the price of our common stock to fall and make it more difficult for you to sell shares of our common stock.
Our restated certificate of incorporation, our amended and restated bylaws and Delaware law contain provisions that could discourage another company from acquiring us and may prevent attempts by our stockholders to replace or remove our current management.
Provisions of Delaware law (where we are incorporated), our amended and restated certificate of incorporation and amended and restated bylaws may discourage, delay or prevent a merger or acquisition that stockholders may consider favorable, including transactions in which you might otherwise receive a premium for your shares. In addition, these provisions may frustrate or prevent any attempts by our stockholders to replace or remove our current management by making it more difficult for stockholders to replace or remove our board of directors. These provisions include:
|
•
|
authorizing the issuance of “blank check” preferred stock without any need for action by stockholders;
|
40
|
•
|
requiring supermajority stockholder voting to effect certain amendments to our restated certificate of incorporation and amended and restated bylaws;
|
|
•
|
eliminating the ability of stockholders to call and bring business before special meetings of stockholders;
|
|
•
|
prohibiting stockholder action by written consent;
|
|
•
|
establishing advance notice requirements for nominations for election to the board of directors or for proposing matters that can be acted on by stockholders at stockholder meetings;
|
|
•
|
dividing our board of directors into three classes so that only one third of our directors will be up for election in any given year; and
|
|
•
|
providing that our directors may be removed by our stockholders only for cause.
|
I
n addition, we are subject to Section 203 of the Delaware General Corporation Law, which may have an anti-takeover effect with respect to transactions not approved in advance by our board of directors, including discouraging takeover attempts that could have resulted in a premium over the market price for shares of our common stock.
These provisions apply even if a takeover offer may be considered beneficial by some stockholders and could delay or prevent an acquisition that our board of directors determines is not in our and our stockholders’ best interests and could also affect the price that some investors are willing to pay for our common stock. See the section titled “Description of Capital Stock.”
Our restated certificate of incorporation provides that the Court of Chancery of the State of Delaware is the exclusive forum for substantially all disputes between us and our stockholders, which could limit our stockholders’ ability to obtain a favorable judicial forum for disputes with us or our directors, officers or employees.
Our restated certificate of incorporation provides that the Court of Chancery of the State of Delaware is the exclusive forum for any derivative action or proceeding brought on our behalf; any action asserting a breach of fiduciary duty; any action asserting a claim against us arising pursuant to the General Corporation Law of the State of Delaware, our restated certificate of incorporation or our amended and restated bylaws; or any action asserting a claim against us that is governed by the internal affairs doctrine. The choice of forum provision may limit a stockholder’s ability to bring a claim in a judicial forum that it finds favorable for disputes with us or our directors, officers or other employees, which may discourage such lawsuits against us and our directors, officers and other employees. If a court were to find the choice of forum provision contained in our restated certificate of incorporation to be inapplicable or unenforceable in an action, we may incur additional costs associated with resolving such action in other jurisdictions, which could harm our business and financial condition.
We incur significantly increased costs and devote substantial management time as a result of operating as a public company.
As a public company, we incur significant legal, accounting and other expenses. In addition, our administrative staff is required to perform additional tasks. We are subject to the reporting requirements of the Securities Exchange Act of 1934, as amended (the Exchange Act), and are required to comply with the applicable requirements of the Sarbanes-Oxley Act of 2002 (the Sarbanes-Oxley Act), and the Dodd-Frank Wall Street Reform and Consumer Protection Act, as well as rules and regulations subsequently implemented by the SEC and the NYSE, including the establishment and maintenance of effective disclosure and financial controls and changes in corporate governance practices. We expect that compliance with these requirements will increase our legal and financial compliance costs and will make some activities more time consuming and costly.
We are investing resources to comply with the evolving laws, regulations and standards applicable to public companies, and this investment may result in increased general and administrative expenses and a diversion of management’s time and attention from revenue-generating activities to compliance activities. Operating as a public company and being subject to these rules and regulations makes it more expensive for us to obtain director and officer liability insurance, and we may be required to accept reduced coverage or incur substantially higher costs to obtain coverage. As a result, it may be difficult for us to attract and retain qualified members of our board of directors or executive officers.
The costs associated with operating as a public company may decrease our net income or increase any future net loss and may cause us to reduce costs in other areas of our business or increase the prices of our products to offset the effect of such costs. Additionally, if these requirements divert our management’s attention from other business concerns, they could have a material adverse effect on our business, results of operation, financial condition or cash flows.
We are an “emerging growth company,” and we cannot be certain if the reduced reporting requirements applicable to emerging growth companies will make our common stock less attractive to investors.
We are an “emerging growth company,” as defined in the Jumpstart our Business Startups Act of 2012 (JOBS Act). For as long as we continue to be an emerging growth company, we may take advantage of exemptions from various reporting
41
requirements that are applicable to other public companies but not to “emerging growth companies,” including, but not limited to:
|
•
|
not being required to comply with the auditor attestation requirements in the assessment of our internal control over financial reporting under Section 404 of the Sarbanes-Oxley Act;
|
|
•
|
not being required to comply with any requirement that may be adopted by the Public Company Accounting Oversight Board regarding mandatory audit firm rotation or a supplement to the auditor’s report providing additional information about the audit and the financial statements;
|
|
•
|
reduced disclosure obligations regarding executive compensation in our periodic reports and proxy statements; and
|
|
•
|
exemptions from the requirements of holding a nonbinding advisory vote on executive compensation and shareholder approval of any golden parachute payments not previously approved.
|
We will remain an emerging growth company until the earlier of (1) the last day of the fiscal year (a) following the fifth anniversary of the completion of our IPO, (b) in which we have total annual gross revenue of at least $1 billion, or (c) in which we are deemed to be a large accelerated filer, which means the market value of our common stock that is held by non-affiliates exceeds $700 million as of the prior June 30th, and (2) the date on which we have issued more than $1 billion in non-convertible debt during the prior three-year period. We cannot predict if investors will find our common stock less attractive if we choose to rely on these exemptions. If some investors find our common stock less attractive as a result of any choices to reduce future disclosure, there may be a less active trading market for our common stock and the price of our common stock may be more volatile.
Under the JOBS Act, emerging growth companies can also delay adopting new or revised accounting standards until such time as those standards apply to private companies. We have irrevocably elected not to avail ourselves of this exemption from new or revised accounting standards and, therefore, will be subject to the same new or revised accounting standards as other public companies that are not emerging growth companies.
If we fail to maintain an effective system of disclosure controls and internal control over financial reporting, our ability to produce timely and accurate financial statements or comply with applicable regulations could be impaired.
As a public company, we are subject to the reporting requirements of the Exchange Act, Sarbanes-Oxley Act, and the listing standards of the NYSE. We expect that the requirements of these rules and regulations will continue to increase our legal, accounting and financial compliance costs, make some activities more difficult, time consuming and costly, and place significant strain on our personnel, systems and resources.
The Sarbanes-Oxley Act requires, among other things, that we maintain effective disclosure controls and procedures and internal control over financial reporting. We are continuing to develop and refine our disclosure controls and other procedures that are designed to ensure that information required to be disclosed by us in the reports that we will file with the SEC is recorded, processed, summarized and reported within the time periods specified in SEC rules and forms, and that information required to be disclosed in reports under the Exchange Act is accumulated and communicated to our principal executive and financial officers. We are also continuing to improve our internal control over financial reporting. In order to maintain and improve the effectiveness of our disclosure controls and procedures and internal control over financial reporting, we have expended, and anticipate that we will continue to expend, significant resources, including accounting-related costs and significant management oversight.
Our current controls and any new controls that we develop may become inadequate because of changes in our business. Further, weaknesses in our disclosure controls or our internal control over financial reporting may be discovered in the future. Any failure to develop or maintain effective controls, or any difficulties encountered in their implementation or improvement, could harm our operating results or cause us to fail to meet our reporting obligations and may result in errors in our financial statements or a restatement of our financial statements for prior periods. Any failure to implement and maintain effective internal control over financial reporting also could adversely affect the results of management evaluations and independent registered public accounting firm audits of our internal control over financial reporting that we will eventually be required to include in our periodic reports that will be filed with the SEC. Ineffective disclosure controls and procedures and internal control over financial reporting could also cause investors to lose confidence in our reported financial and other information, which would likely have a negative effect on the trading price of our common stock. In addition, if we are unable to continue to meet these requirements, we may not be able to remain listed on the NYSE.
We are not currently required to comply with the SEC rules that implement Section 404 of the Sarbanes-Oxley Act, and are therefore not required to make a formal assessment of the effectiveness of our internal control over financial reporting for that purpose. As a public company, we will be required to provide an annual management report on the effectiveness of our internal control over financial reporting commencing with our second Annual Report on Form 10-K. Our independent registered public accounting firm is not required to audit the effectiveness of our internal control over financial reporting until
42
after we are no longer an “emerging growth company,” as defined in the JOBS Act. At such time, our independent registered public accounting firm may issue a report that is adverse in the event it is not satisfied with the level at which our internal control over financial reporting is documented, designed or operating. If we have a material weakness in our internal control over financial reporting, we may not detect errors on a timely basis and our financial statements may be materially misstated. We are in the process of designing and implementing the internal control over financial reporting required to comply with this obligation, which process will be time consuming, costly and complicated. If we identify material weaknesses in our internal control over financial reporting, if we are unable to comply with the requirements of Section 404 in a timely manner, if we are unable to assert that our internal control over financial reporting are effective, or, when required in the future, if our independent registered public accounting firm is unable to express an opinion as to the effectiveness of our internal control over financial reporting, investors may lose confidence in the accuracy and completeness of our financial reports and the market price of our common stock could be adversely affected, and we could become subject to investigations by the stock exchange on which our securities are listed, the SEC, or other regulatory authorities, which could require additional financial and management resources.
Any failure to maintain effective disclosure controls and internal control over financial reporting could have a material and adverse effect on our business and results of operations, and cause a decline in the price of our common stock.
If securities or industry analysts publish inaccurate or unfavorable research about our business or cease publishing research, our stock price and trading volume could decline.
The trading market for our common stock depends in part on the research and reports that securities or industry analysts publish about us or our business. If one or more of the analysts who cover us downgrade our stock or publish inaccurate or unfavorable research about our business, our stock price would likely decline. If one or more of these analysts cease coverage of our company or fail to publish reports on us regularly, demand for our stock could decrease, which might cause our stock price and trading volume to decline.
We do not anticipate paying cash dividends, and accordingly, stockholders must rely on stock appreciation for any return on their investment.
We do not anticipate paying cash dividends in the future. As a result, only appreciation of the price of our common stock, which may never occur, would provide a return to stockholders. Investors seeking cash dividends should not invest in our common stock.
Impairment of our deferred tax assets could require a charge to earnings, which could result in a negative impact on our results of operations.
Primarily as a result of net operating losses, stock based compensation, various accruals and reserves, and tax credits, we maintain a deferred tax asset (an asset recognized to reflect an expected benefit to be realized in the future) that may be used to reduce the amount of tax that we would otherwise be required to pay in future periods. Deferred tax assets are reduced by a valuation allowance when it is more likely than not that the future realization of all or some of the deferred tax assets will not be achieved. Valuation allowances related to deferred tax assets can be affected by changes to tax laws, statutory tax rates, future taxable income levels and input from our tax advisors or regulatory authorities. At
December 31, 2015
, our net deferred tax asset was $10.1 million, after reduction of a valuation allowance of $2.7 million. If our management was to determine that we would not be able to realize all or a portion of our net deferred tax assets in the future, a valuation allowance and a related charge to earnings would be reflected in that period, which could have a material adverse impact on our financial condition and results of operations.
43
None.
We maintain a 180,000 square feet research and development and manufacturing facility in three buildings at our campus in Alameda, California. The leases for these three buildings expire in 2029, subject to our option to renew any or all three leases for an additional ten years. In December 2015, we signed a lease for an additional 99,568 square feet of space (plus an additional space of 15,882 square feet that may be delivered to us at the landlord’s option prior to May 1, 2016) in three adjacent buildings located in our campus in Alameda, California. From time to time during the ten year period following the initial commencement date of the new lease, if any space in any of the buildings or in a fourth building located in the same business park as our campus becomes vacant, that space will be added to the lease at the then current base monthly rental rate. The maximum additional space that could be added under this provision of the lease is 117,325 square feet. We have a right of first offer to lease any space that becomes available in the buildings or in the fourth building after the expiration of the ten year period following the initial commencement date, subject to the terms described in the new lease. The term of the new lease expires after fifteen years from the initial lease commencement date, subject to our option to renew the lease for up to three additional five-year periods.
We also lease office space in Berlin, Germany; Sydney, Australia; and Sao Paulo, Brazil. The offices in Berlin and Sydney support our direct sales operations in Europe and Australia, respectively, and the office in Sao Paulo supports our Latin America marketing efforts through our distribution partners.
F
or information with respect to Legal Proceedings, see Note 8 “Commitment and Contingencies” to our consolidated financial statements in Part II, Item 8 of this Form 10-K.
Not applicable.
44
Market Information
Our common stock has been listed on the NYSE under the symbol “PEN” since September 18, 2015. Prior to that date, there was no established public trading market for our common stock. The following table sets forth the range of high and low sale prices for our common stock as reported on the NYSE from September 18, 2015 through
December 31, 2015
. Such quotations represent inter dealer prices without retail markup, markdown, or commission and may not necessarily represent actual transactions.
|
High
|
Low
|
|||||||
|
Year ended December 31, 2015
|
||||||||
|
Third Quarter
|
$
|
43.06
|
|
$
|
38.00
|
|
||
|
Fourth Quarter
|
59.36
|
|
35.31
|
|
||||
On
December 31, 2015
, the last day that the NYSE was open for public trading during
2015
, the last reported sale price of our common stock on the NYSE was
$53.81
. As of January 31, 2016, there were
365
holders of record of our common stock. The actual number of stockholders is greater than this number of record holders, and includes stockholders who are beneficial owners, but whose shares are held in street name by brokers and other nominees. This number of holders of record also does not include stockholders whose shares may be held in trust by other entities.
Performance Graph
This performance graph shall not be deemed “soliciting material,” or to be “filed” with the SEC for purposes of Section 18 of the Exchange Act, or otherwise subject to the liabilities under that Section and shall not be deemed to be incorporated by reference into any other filing of Penumbra, Inc. under the Securities Act or the Exchange Act, except to the extent that the company specifically incorporates it by reference into such filing.
The following graph compares our total common stock return with the total return for (i) the S&P Healthcare Equipment and (ii) the Russell 2000 Index (Russell 2000) for the period from September 18, 2015 (the date our common stock commenced trading on the NYSE) through December 31, 2015. Although our common stock was initially listed at $30.00 per share on the date our common stock was first listed on the NYSE, September18, 2015, the $30.00 price is not reflected in the graph. Instead, the figures represented below assume an investment of $100 in our common stock at the closing price of $41.30 on September 18, 2015 and in the NYSE Composite and the Russell 2000 on September 18, 2015 and the reinvestment of dividends into shares of common stock. The comparisons in the table are required by the SEC and are not intended to forecast or be indicative of possible future performance of our common stock.

|
$100 Investment in stock or index
|
Ticker
|
September 18, 2015
|
September 30, 2015
|
October 30, 2015
|
November 30, 2015
|
December 31, 2015
|
||||||||||||||||
|
Penumbra
|
PEN
|
$
|
100.00
|
|
$
|
97.09
|
|
$
|
89.66
|
|
$
|
121.84
|
|
$
|
130.29
|
|
||||||
|
S&P 500 Health Care Equipment Index
|
XHE
|
100.00
|
|
90.66
|
|
94.65
|
|
99.91
|
|
93.50
|
|
|||||||||||
|
NYSE Composite
|
NYA
|
100.00
|
|
97.69
|
|
104.28
|
|
103.77
|
|
101.11
|
|
|||||||||||
45
Dividend Policy
We have never declared or paid cash dividends on our capital stock. We currently intend to retain all available funds for use in the operation and expansion of our business, and do not anticipate paying any cash dividends in the foreseeable future. Any future determination related to dividend policy will be made at the discretion of our board of directors, subject to applicable laws, and will depend on a number of factors, including our financial condition, results of operations, capital requirements, contractual restrictions, general business conditions and other factors that our board of directors may deem relevant.
Recent Sales of Unregistered Securities
Between July 1, 2015 and September 18, 2015 (the date of the filing of our Registration Statement on Form S-8, No. 333-207007):
|
•
|
We granted to our directors, officers, employees and consultants options to purchase an aggregate of 1,321,250 shares of common stock under our equity compensation plans, at exercise prices ranging from $22.04 to $30.00 per share.
|
|
•
|
We issued and sold to our directors, officers, employees and consultants an aggregate of 6,500 shares of common stock upon the exercise of options under our equity compensation plans at exercise prices ranging from $1.26 to $3.98 per share, for an aggregate amount of $16,613.
|
|
•
|
We granted to our directors, officers and employees an aggregate of 5,000 shares of restricted stock under our equity compensation plans at a fair market value of $22.04 per share, for an aggregate amount of $110,200.
|
None of the foregoing transactions involved any underwriters, underwriting discounts or commissions, or any public offering. Unless otherwise stated, the sales of the above securities were deemed to be exempt from registration under the Securities Act in reliance upon Section 4(a)(2) of the Securities Act (or Regulation D promulgated thereunder) or Rule 701 promulgated under Section 3(b) of the Securities Act as transactions by an issuer not involving any public offering or pursuant to benefit plans and contracts relating to compensation as provided under Rule 701. The recipients of the securities in each of these transactions represented their intentions to acquire the securities for investment only and not with a view to or for sale in connection with any distribution thereof, and appropriate legends were placed upon the stock certificates issued in these transactions.
Use of Proceeds from Public Offering of Common Stock
The Registration Statement on Form S-1 (File No. 333-206412) and the Registration Statement on Form S-1 (File No. 333-207000) filed pursuant to Rule 462(b) relating thereto, each relating to the IPO of shares of our common stock, became effective on September 17, 2015. There has been no material change in the planned use of proceeds from our IPO from that described in the prospectus dated September 17, 2015 filed with the SEC pursuant to Rule 424(b)(4) under the Securities Act. Pending the planned use of proceeds, we have invested the funds received from our IPO in marketable investments.
46
The following selected consolidated financial data of Penumbra, Inc. should be read in conjunction with, and are qualified by reference to, the section titled “Management’s Discussion and Analysis of Financial Condition and Results of Operations” and the consolidated financial statements and notes thereto included in this report. The consolidated statement of operations data for the years ended
December 31, 2015
,
2014
and
2013
, and the consolidated balance sheet data as of
December 31, 2015
and
2014
, are derived from, and qualified by reference to, our audited consolidated financial statements included elsewhere in this Annual Report on Form 10-K. The selected consolidated balance sheet data as of
December 31, 2013
are derived from our audited consolidated financial statements not included in this Annual Report on Form 10-K. Our historical results are not necessarily indicative of the results that may be expected in the future.
|
Year Ended December 31,
|
||||||||||||||||
|
2015
|
2014
|
2013
|
2012
|
|||||||||||||
|
(In thousands, except share and per share amounts)
|
||||||||||||||||
|
Consolidated Statement of Operations Data:
|
||||||||||||||||
|
Revenue
|
$
|
186,095
|
|
$
|
125,510
|
|
$
|
88,848
|
|
$
|
73,141
|
|
||||
|
Cost of revenue
|
62,037
|
|
42,668
|
|
30,972
|
|
24,178
|
|
||||||||
|
Gross profit
|
124,058
|
|
82,842
|
|
57,876
|
|
48,963
|
|
||||||||
|
Operating expenses:
|
||||||||||||||||
|
Research and development
|
18,027
|
|
15,575
|
|
14,084
|
|
12,548
|
|
||||||||
|
Sales, general and administrative
|
101,852
|
|
64,258
|
|
44,918
|
|
32,987
|
|
||||||||
|
Total operating expenses
|
119,879
|
|
79,833
|
|
59,002
|
|
45,535
|
|
||||||||
|
Income (loss) from operations
|
4,179
|
|
3,009
|
|
(1,126
|
)
|
3,428
|
|
||||||||
|
Interest income (expense), net
|
541
|
|
439
|
|
345
|
|
244
|
|
||||||||
|
Other income (expense), net
|
(696
|
)
|
(309
|
)
|
(474
|
)
|
220
|
|
||||||||
|
Income (loss) before provision for (benefit from) income taxes
|
4,024
|
|
3,139
|
|
(1,255
|
)
|
3,892
|
|
||||||||
|
Provision for (benefit from) income taxes
|
1,659
|
|
894
|
|
(5,354
|
)
|
1,934
|
|
||||||||
|
Net income
|
$
|
2,365
|
|
$
|
2,245
|
|
$
|
4,099
|
|
$
|
1,958
|
|
||||
|
Net income (loss) attributable to common stockholders
|
$
|
719
|
|
$
|
(833
|
)
|
$
|
887
|
|
$
|
412
|
|
||||
|
Net income (loss) per share attributable to common
stockholders —Basic |
$
|
0.09
|
|
$
|
(0.18
|
)
|
$
|
0.21
|
|
$
|
0.10
|
|
||||
|
—Diluted
|
$
|
0.08
|
|
$
|
(0.18
|
)
|
$
|
0.14
|
|
$
|
0.07
|
|
||||
|
Weighted average shares used to compute net income (loss) per share attributable to common stockholders
—Basic |
11,993,429
|
|
4,609,375
|
|
4,304,396
|
|
4,153,121
|
|
||||||||
|
—Diluted
|
14,219,650
|
|
4,609,375
|
|
6,500,835
|
|
5,886,126
|
|
||||||||
|
Year Ended December 31,
|
||||||||||||||||
|
2015
|
2014
|
2013
|
2012
|
|||||||||||||
|
(in thousands)
|
||||||||||||||||
|
Balance Sheet Data:
|
||||||||||||||||
|
Cash and cash equivalents
|
$
|
19,547
|
|
$
|
3,290
|
|
$
|
4,131
|
|
$
|
7,435
|
|
||||
|
Marketable investments
|
$
|
129,257
|
|
$
|
48,253
|
|
$
|
9,545
|
|
$
|
11,341
|
|
||||
|
Total assets
|
$
|
263,848
|
|
$
|
121,381
|
|
$
|
71,147
|
|
$
|
63,209
|
|
||||
|
Long-term debt
|
$
|
—
|
|
$
|
—
|
|
$
|
—
|
|
$
|
4,000
|
|
||||
|
Working capital
|
$
|
216,213
|
|
$
|
94,478
|
|
$
|
46,401
|
|
$
|
41,607
|
|
||||
|
Convertible Preferred stock
|
$
|
—
|
|
$
|
111,467
|
|
$
|
56,222
|
|
$
|
56,222
|
|
||||
|
Total stockholders’ equity (deficit)
|
$
|
232,522
|
|
$
|
(12,370
|
)
|
$
|
(8,062
|
)
|
$
|
(12,751
|
)
|
||||
47
You should read the following discussion and analysis of our financial condition and results of operations together with the section of this report entitled “Selected Consolidated Financial Data” and our consolidated financial statements and related notes included elsewhere in this Annual Report on Form 10-K. This discussion and other parts of this report contain forward-looking statements that involve risk and uncertainties, such as statements of our plans, objectives, expectations, and intentions. As a result of many factors, including those factors set forth in the “Risk Factors” section of this Annual Report on Form 10-K, our actual results could differ materially from the results described in or implied by these forward-looking statements.
Overview
Penumbra is a global interventional therapies company that designs, develops, manufactures and markets innovative medical devices. We have a broad portfolio of products that addresses challenging medical conditions and significant clinical needs across two major markets, neuro and peripheral vascular. The conditions that our products address include, among others, ischemic stroke, hemorrhagic stroke and various peripheral vascular conditions that can be treated through thrombectomy and embolization procedures.
We are an established company focused on the neuro market, and we recently expanded our business to include the peripheral vascular market. We sell our products to hospitals, primarily through our salesforce, as well as through distributors in select international markets. We focus on developing, manufacturing and marketing products for use by specialist physicians, including interventional neuroradiologists, neurosurgeons, interventional neurologists, interventional radiologists and vascular surgeons. We design our products to provide these specialist physicians with a means to drive improved clinical outcomes through faster and safer procedures.
Since our founding in 2004, we have invested heavily in our product development capabilities in our two key markets: neuro and peripheral vascular. We launched our first neurovascular product in 2007, our first peripheral vascular product in 2013 and our first neurosurgical product in 2014. To date, we have launched 16 product brands, and we expect to continue to develop and build our portfolio of products based on our thrombectomy, embolization and access technologies. Generally, when we introduce a next generation product or a new product designed to replace a current product, sales of the earlier generation product or the product replaced decline. Our research and development activities are centered around the development of new products and clinical activities designed to support our regulatory submissions and demonstrate the effectiveness of our products.
We manufacture substantially all of our products at our campus in Alameda, California, and stock inventory of raw materials, components and finished goods at that location. We rely on a single or limited number of suppliers for certain raw materials and components, and we generally have no long-term supply arrangements with our suppliers, as we order on a purchase order basis. We ship all of our products from Alameda to our hospital customers and distributors worldwide pursuant to purchase orders
, and we are preparing to open a distribution facility in the Eastern United States
. We typically recognize revenue when products are delivered to our hospital customers or distributors, other than our coils, which we ship to our hospital customers on a consignment basis, and for which we recognize revenue when the hospital customers utilize products in a procedure.
Hospitals purchase our products for use in procedures performed by their specialist physicians, generally seeking reimbursement from third party payors for procedures performed. We believe that the cost-effectiveness of our products is attractive to our hospital customers.
In
2015
, 31.6% of our revenue was generated from customers located outside of the U. S. Our sales outside of the U. S. are denominated principally in the euro and Japanese yen. As a result, we have foreign exchange exposure, but do not currently engage in hedging. In
2015
, no single hospital and only one distributor accounted for more than 10% of our sales.
We sell our products to hospitals primarily through our direct sales organization in the U. S., most of Europe, Canada and Australia, as well as through distributors in select international markets. In
2015
, we generated revenue of
$186.1 million
, which represents a
48.3%
increase over same period in
2014
, and
$4.2 million
in operating income as compared to an operating income of
$3.0 million
in
2014
. In
2014
, we generated revenue of
$125.5 million
, which represents a
41.3%
increase over same period in
2013
, and
$3.0 million
in operating income as compared to an operating loss of
$1.1 million
in
2013
.
Factors Affecting Our Performance
There are a number of factors that have impacted, and we believe will continue to impact, our results of operations and growth. These factors include:
48
|
•
|
The rate at which we grow our salesforce and the speed at which newly hired salespeople become fully effective can impact our revenue growth or our costs incurred in anticipation of such growth.
|
|
•
|
Our industry is intensely competitive and, in particular, we compete with a number of large, well-capitalized companies. We must continue to successfully compete in light of our competitors’ existing and future products and their resources to successfully market to the specialist physicians who use our products.
|
|
•
|
We must continue to successfully introduce new products that gain acceptance with specialist physicians and successfully transition from existing products to new products, ensuring adequate supply while avoiding excess inventory of older products and resulting inventory write-downs or write-offs. In addition, as we introduce new products, we generally build our inventory of components and finished goods in advance of sales, which may cause quarterly fluctuations in our financial condition.
|
|
•
|
Publications of clinical results by us, our competitors and other third parties can have a significant influence on whether, and the degree to which, our products are used by specialist physicians and the procedures and treatments those physicians choose to administer for a given condition.
|
|
•
|
The specialist physicians who use our products may not perform procedures during certain times of the year, such as those periods when they are at major medical conferences or are away from their practices for other reasons, the timing of which occurs irregularly during the year and from year to year.
|
In addition, we have experienced and expect to continue to experience meaningful variability in our annual revenue and gross profit as a result of a number of factors, including, but not limited to: the number of available selling days, which can be impacted by holidays; the mix of products sold; the geographic mix of where products are sold; the demand for our products and the products of our competitors; the timing of or failure to obtain regulatory approvals or clearances for products; increased competition; the timing of customer orders; inventory write-offs and write-downs; costs, benefits and timing of new product introductions; the availability and cost of components and raw materials; and fluctuations in foreign currency exchange rates. We experience quarters in which we have significant revenue growth sequentially followed by quarters of moderate or no revenue growth. Additionally, we experience quarters in which operating expenses, in particular research and development expenses, fluctuate depending on the stage and timing of product development.
Critical Accounting Policies and Use of Estimates
Our consolidated financial statements have been prepared in accordance with accounting principles generally accepted in the United States. The preparation of our consolidated financial statements requires management to make estimates, assumptions and judgments that affect the reported amounts of assets and liabilities and disclosure of contingent assets and liabilities at the date of the consolidated financial statements and the reported amounts of revenues and expenses during the applicable periods. Management bases its estimates, assumptions and judgments on historical experience and on various other factors that it believes to be reasonable under the circumstances. Different assumptions and judgments would change the estimates used in the preparation of our consolidated financial statements, which, in turn, could materially change our results from those reported. Management evaluates its estimates, assumptions and judgments on an ongoing basis. Historically, our critical accounting estimates have not differed materially from actual results. However, if our assumptions change, we may need to revise our estimates, or take other corrective actions, either of which may also have a material adverse effect on our consolidated statements of operations, liquidity and financial condition.
We believe the following critical accounting policies involve significant areas where management applies judgments and estimates in the preparation of our consolidated financial statements.
Revenue Recognition
Revenue is comprised of product revenue net of returns, discounts and administration fees. We recognize revenue when persuasive evidence of an arrangement exists, delivery has occurred, the sales price is fixed or determinable and collectability is reasonably assured. Evidence of an arrangement consists of customer orders, and we typically consider delivery to have occurred once title and risk of loss has been transferred and the product has been delivered to our customers. We typically recognize revenue when products are delivered to our hospital customers or distributors. However, with respect to products that we consign to hospitals, which primarily consist of coils, we recognize revenue at the time hospitals utilize our products used in a procedure.
We defer revenue for amounts that we have already invoiced our customers for and are ultimately expected to be recognized as revenue, but for which not all revenue recognition criteria have been met.
Our terms and conditions permit product returns and exchanges, and we record returns reserves in the period when revenue is recognized. Estimates are based on actual historical returns over the prior three years and are recorded as reductions
49
in revenue at the time of sale. Upon recognition, we reduce revenue and cost of revenue for the estimated return. Return rates can fluctuate over time, but are sufficiently predictable to allow us to estimate expected future product returns.
Inventories
Inventories are stated at the lower of cost (determined under the first-in first-out method) or market. Write-downs are provided for finished goods expected to become nonsaleable and provisions are specifically made for excessive, slow-moving or obsolete items. Market value is determined as the lower of replacement cost or net realizable value. We regularly review inventory quantities in consideration of actual loss experiences, projected future demand, and remaining shelf life to record a provision for excess and obsolete inventory when appropriate.
The estimate of excess quantities is subjective and primarily dependent on our estimate of future demand for a particular product. If the estimate of future demand is inaccurate based on actual sales, we may increase the write down for excess inventory for that component and record a charge to inventory impairment in the accompanying consolidated statements of operations and comprehensive income. We periodically evaluate the carrying value of inventory on hand for potential excess amount over demand using the same lower of cost or market approach as that has been used to value the inventory. We also periodically evaluate inventory quantities in consideration of actual loss experience.
Cost of Revenue
Cost of revenue includes direct and indirect costs associated with the manufacture of our products. Direct costs include material and labor, while indirect costs include, but are not limited to, inbound freight charges, receiving costs, inspection and testing costs, warehousing costs, royalty expense and other labor and overhead costs incurred in the manufacturing of products. Cost of revenue also includes stock-based compensation, warranty replacement costs, cost of revenue related to product return reserves, and excess and obsolete inventory write-downs.
Stock-Based Compensation
Stock-based compensation costs related to stock options granted to employees are measured at the date of grant based on the estimated fair value of the award, net of estimated forfeitures. We estimate the grant date fair value, and the resulting stock-based compensation expense, using the Black-Scholes option-pricing model on a straight-line basis over the requisite service period of the award, which is generally the vesting term of four years.
The Black-Scholes option-pricing model requires the use of highly subjective assumptions which determine the fair value of stock-based awards. The assumptions used in our option-pricing model represent management’s best estimates. These estimates are complex, involve a number of variables, uncertainties and assumptions and the application of management’s judgment, so that they are inherently subjective. If factors change and different assumptions are used, our stock-based compensation expense could be materially different in the future. These assumptions are estimated as follows:
Risk-Free Interest Rate.
We base the risk-free interest rate used in the Black-Scholes valuation model on the implied yield available on U.S. Treasury zero-coupon issues with an equivalent remaining term of the options for each option group.
Expected Term.
The expected term represents the period that our stock-based awards are expected to be outstanding. Because of the limitations on the sale or transfer or our common stock as a privately held company before the IPO, we did not believe our historical exercise pattern was indicative of the pattern we would experience as a publicly traded company post IPO. We have consequently used the Staff Accounting Bulletin, or SAB 110, simplified method to calculate the expected term, which is the average of the contractual term and vesting period. We plan to continue to use the SAB 110 simplified method until we have sufficient trading history as a publicly traded company.
Volatility.
We determine the price volatility factor based on the historical volatilities of our peer group as prior to the IPO we did not have a trading history for our common stock. Industry peers consist of several public companies in the medical device technology industry with comparable characteristics including enterprise value, risk profiles and position within the industry. We intend to continue to consistently apply this process using the same or similar public companies until a sufficient amount of historical information regarding the volatility of our own common stock share price becomes available, or unless circumstances change such that the identified companies are no longer similar to us, in which case, more suitable companies whose share prices are publicly available would be utilized in the calculation.
Dividend Yield.
The expected dividend assumption is based on our current expectations about our anticipated dividend policy. We currently do not expect to issue any dividends.
In addition to assumptions used in the Black-Scholes option-pricing model, we must also estimate a forfeiture rate to calculate the stock-based compensation for our awards. We will continue to use judgment in evaluating the assumptions related
50
to our stock-based compensation on a prospective basis. As we continue to accumulate additional data, we may have refinements to our estimates, which could materially impact our future stock-based compensation expense.
Income Taxes
We account for income taxes using the asset and liability method, whereby deferred tax asset and liability account balances are determined based on differences between the financial reporting and tax bases of assets and liabilities, and are measured using the enacted tax rates and laws that will be in effect when the differences are expected to reverse. We provide a valuation allowance to reduce the net deferred tax assets to their estimated realizable value.
At
December 31, 2015
, we had approximately $16.3 million and $1.8 million of state and foreign net operating loss carryforwards, respectively, available to offset future taxable income. The state net operating loss carryforwards will begin to expire in 2017. At
December 31, 2015
, we had research credits available to offset state tax liabilities in the amount of $3.6 million, respectively. California state tax credits have no expiration.
The calculation of our current provision for income taxes involves the use of estimates, assumptions and judgments while taking into account current tax laws, interpretation of current tax laws and possible outcomes of future tax audits. We have established reserves to address potential exposures related to tax positions that could be challenged by tax authorities. Although we believe our estimates, assumptions and judgments to be reasonable, any changes in tax law or its interpretation of tax laws and the resolutions of potential tax audits could significantly impact the amounts provided for income taxes in our consolidated financial statements.
For the year ended
December 31, 2015
, our net deferred tax asset was $10.1 million, after reduction of a valuation allowance of $2.7 million. The calculation of our deferred tax asset balance involves the use of estimates, assumptions and judgments while taking into account estimates of the amounts and type of future taxable income. Deferred tax assets are reduced by a valuation allowance when it is more likely than not that the future realization of all or some of the deferred tax assets will not be achieved. Valuation allowances related to deferred tax assets can be affected by changes to tax laws, statutory tax rates, future taxable income levels and input from our tax advisors or regulatory authorities. If our management was to determine that we would not be able to realize all or a portion of our net deferred tax assets in the future, a valuation allowance related charge to earnings would be reflected in that period, which could have a material adverse impact on our financial condition and results of operations.
We have adopted FASB ASC 740-10 “Accounting for Uncertainty in Income Taxes” that prescribes a recognition threshold and measurement attribute for the financial statement recognition and measurement of uncertain tax positions taken or expected to be taken in our income tax return, and also provides guidance on derecognition, classification, interest and penalties, accounting in interim periods and disclosure.
We include interest and penalties related to unrecognized tax benefits within income tax expense in the accompanying consolidated statements of operations.
Components of Results of Operations
Revenue.
We sell our products directly to hospitals and through distributors for use in procedures performed by specialist physicians to treat patients in two key markets: neuro and peripheral vascular disease. We sell our products through purchase orders, and we do not have long term purchase commitments from our customers. We typically recognize revenue when products are delivered to our hospital customers or distributors. However, with respect to products that we consign to hospitals, which primarily consist of coils, we recognize revenue at the time hospitals utilize products in a procedure. Revenue also includes shipping and handling costs that we charge to customers.
Cost of Revenue.
Cost of revenue consists primarily of the cost of raw materials and components, personnel costs, including stock-based compensation, inbound freight charges, receiving costs, inspection and testing costs, warehousing costs, royalty expense, shipping and handling costs and other labor and overhead costs incurred in the manufacturing of products. We manufacture substantially all of our products in our manufacturing facility at our campus in Alameda, California.
Operating Expenses
Research and Development (R&D).
R&D expenses include product development, clinical and regulatory expenses, materials, depreciation and other costs associated with the development of our products. R&D expenses also include salaries, benefits and other related costs, including stock-based compensation, for personnel and consultants. We expense R&D costs as they are incurred.
We expect to incur additional costs as we continue to innovate and develop new products and engage in ongoing clinical research. These costs will generally increase in absolute terms as we continue to expand our product pipeline and add personnel.
51
Sales, General and Administrative (SG&A).
SG&A expenses primarily consist of salaries, benefits and other related costs, including stock-based compensation, for personnel and consultants engaged in sales, marketing, finance, legal, compliance, administrative, information technology, medical education and training and human resource activities. Our sales, general and administrative expenses also include commissions, generally based on a percentage of sales, to direct sales representatives and the medical device excise tax, which is approximately 2.3% of U.S. sales. The medical device excise tax has been suspended for a two-year period commencing January 1, 2016, it could be reinstated.
We expect our SG&A expenses to continue to increase in absolute terms as we expand our salesforce and operations. Additionally, we expect to incur increased expenses related to headcount, professional service fees, systems and other infrastructure related to operating as a public company.
Income Tax Expense.
We are taxed at the rates applicable within each jurisdiction in which we operate. The composite income tax rate, tax provisions, deferred tax assets and deferred tax liabilities will vary according to the jurisdiction in which profits arise. Tax laws are complex and subject to different interpretations by management and the respective governmental taxing authorities, and require us to exercise judgment in determining our income tax provision, our deferred tax assets and liabilities and the potential valuation allowance recorded against our net deferred tax assets. Deferred tax assets and liabilities are determined using the enacted tax rates in effect for the years in which those tax assets are expected to be realized. A valuation allowance is established when it is more likely than not that the future realization of all or some of the deferred tax assets will not be achieved.
Results of Operations
The following table sets forth the components of our consolidated statements of operations in dollars and as a percentage of revenue for the periods presented:
|
|
Year Ended December 31,
|
|||||||||||||||||||
|
|
2015
|
2014
|
2013
|
|||||||||||||||||
|
|
||||||||||||||||||||
|
Revenue
|
$
|
186,095
|
|
100.0
|
%
|
$
|
125,510
|
|
100.0
|
%
|
$
|
88,848
|
|
100.0
|
%
|
|||||
|
Cost of revenue
|
62,037
|
|
33.3
|
%
|
42,668
|
|
34.0
|
%
|
30,972
|
|
34.9
|
%
|
||||||||
|
Gross profit
|
124,058
|
|
66.7
|
%
|
82,842
|
|
66.0
|
%
|
57,876
|
|
65.1
|
%
|
||||||||
|
Operating expenses:
|
||||||||||||||||||||
|
Research and development
|
18,027
|
|
9.7
|
%
|
15,575
|
|
12.4
|
%
|
14,084
|
|
15.9
|
%
|
||||||||
|
Sales, general and administrative
|
101,852
|
|
54.7
|
%
|
64,258
|
|
51.2
|
%
|
44,918
|
|
50.6
|
%
|
||||||||
|
Total operating expenses
|
119,879
|
|
64.4
|
%
|
79,833
|
|
63.6
|
%
|
59,002
|
|
66.4
|
%
|
||||||||
|
Income (loss) from operations
|
4,179
|
|
2.2
|
%
|
3,009
|
|
2.4
|
%
|
(1,126
|
)
|
(1.3
|
)%
|
||||||||
|
Interest income (expense), net
|
541
|
|
0.3
|
%
|
439
|
|
0.3
|
%
|
345
|
|
0.4
|
%
|
||||||||
|
Other income (expense), net
|
(696
|
)
|
(0.4
|
)%
|
(309
|
)
|
(0.2
|
)%
|
(474
|
)
|
(0.5
|
)%
|
||||||||
|
Income (loss) before provision for (benefit from) income taxes
|
4,024
|
|
2.2
|
%
|
3,139
|
|
2.5
|
%
|
(1,255
|
)
|
(1.4
|
)%
|
||||||||
|
Provision for (benefit from) income taxes
|
1,659
|
|
0.9
|
%
|
894
|
|
0.7
|
%
|
(5,354
|
)
|
(6.0
|
)%
|
||||||||
|
Net income
|
$
|
2,365
|
|
1.3
|
%
|
$
|
2,245
|
|
1.8
|
%
|
$
|
4,099
|
|
4.6
|
%
|
|||||
Year Ended
December 31, 2015
Compared to Year Ended
December 31, 2014
Revenue
|
|
Year Ended December 31,
|
Change
|
||||||||||||
|
|
2015
|
2014
|
$
|
%
|
||||||||||
|
|
(in thousands, except for percentages)
|
|||||||||||||
|
Neuro
|
$
|
141,410
|
|
$
|
106,242
|
|
$
|
35,168
|
|
33.1
|
%
|
|||
|
Peripheral Vascular
|
44,685
|
|
19,268
|
|
25,417
|
|
131.9
|
%
|
||||||
|
Total
|
$
|
186,095
|
|
$
|
125,510
|
|
$
|
60,585
|
|
48.3
|
%
|
|||
Revenue increased
$60.6 million
, or
48.3%
, to
$186.1 million
in
2015
, from
$125.5 million
in
2014
. Our revenue growth resulted from increased sales due to expansion of our salesforce headcount by 53.3%, further market penetration of our existing products and sales of new products or products with new indications. Increased sales of Penumbra System products accounted
52
for approximately half of the revenue increase in
2015
. Additionally, approximately one quarter of the increase in revenue for the year ended
December 31, 2015
was from increased sales of our Indigo System, primarily due to a new venous indication and the introduction of our larger sizes within our Indigo System, resulting in an increase in new procedure volumes.
Revenue from sales in the U. S. increased
$44.3 million
, or
53.5%
, to
$127.3 million
in
2015
, from
$83.0 million
in
2014
. Revenue from sales in international markets increased
$16.2 million
, or
38.2%
, to
$58.8 million
in
2015
, from
$42.5 million
in
2014
. Revenue from international sales represented
31.6%
and
33.9%
of our total revenue in
2015
and
2014
, respectively.
Revenue from our neuro products increased
$35.2 million
, or
33.1%
, to
$141.4 million
in
2015
, from
$106.2 million
in
2014
. Our neuro product sales experienced strong momentum due to further market penetration and growth in the market following the presentation and publication of MR. CLEAN trial results in the fourth quarter of 2014, and the presentation and publication of additional trial results in the first quarter of 2015, each of which support endovascular treatment of stroke. We believe that these published trial results led to increases in the number of procedures performed by specialist physicians using our products in the year ended December 31, 2015. Increased sales of Penumbra System products accounted for most of the revenue increase in
2015
. Further, while our introduction of Benchmark in the fourth quarter of 2014 was designed as a potential replacement for our Neuron access products, sales of our Neuron access products have increased slightly since Benchmark was introduced. The increase in revenue from our neuro products was partially offset by a 12.5%, or $3.8 million, period over period decrease in sales of our neuro embolization products. This decrease was due to: (i) reduced demand for our Penumbra Coil 400 product, which demand can fluctuate from period to period due to the number of procedures performed in a given period using our products, as well as (ii) a shift in our focus due to the introduction of our SMART Coil in the fourth quarter of 2015. Prices for our neuro products remained substantially flat during the year.
Revenue from our peripheral vascular products increased
$25.4 million
, or
131.9%
, to
$44.7 million
in
2015
, from
$19.3 million
in
2014
. Our peripheral embolization and peripheral thrombectomy products experienced strong volume growth in the year, primarily due to the focused efforts of our dedicated peripheral vascular salesforce, which was established in the second half of 2014, and further market penetration of our products. Increased sales of Indigo System products accounted more than half of the revenue increase in the year ended December 31, 2015. Prices for our peripheral vascular products remained substantially flat during the year.
Gross Profit and Gross Margin
|
|
Year Ended December 31,
|
Change
|
||||||||||||
|
|
2015
|
2014
|
$
|
%
|
||||||||||
|
|
(in thousands, except for percentages)
|
|||||||||||||
|
Cost of revenue
|
$
|
62,037
|
|
$
|
42,668
|
|
$
|
19,369
|
|
45.4
|
%
|
|||
|
Gross profit
|
$
|
124,058
|
|
$
|
82,842
|
|
$
|
41,216
|
|
49.8
|
%
|
|||
|
Gross margin %
|
66.7
|
%
|
66.0
|
%
|
||||||||||
Gross profit increased
$41.2 million
, or
49.8%
, to
$124.1 million
in
2015
, from
$82.8 million
in
2014
. The increase in gross profit was primarily due to an increase in revenue from sales of our neuro and peripheral vascular products.
Gross margin increased
0.7
percentage points to
66.7%
in
2015
, from
66.0%
in
2014
. The increase in gross margin was primarily due to geographic and product mix.
Research and Development (R&D)
|
|
Year Ended December 31,
|
Change
|
||||||||||||
|
|
2015
|
2014
|
$
|
%
|
||||||||||
|
|
(in thousands, except for percentages)
|
|||||||||||||
|
R&D
|
$
|
18,027
|
|
$
|
15,575
|
|
$
|
2,452
|
|
15.7
|
%
|
|||
|
R&D as a percentage of revenue
|
9.7
|
%
|
12.4
|
%
|
||||||||||
R&D expenses increased by
$2.5 million
, or
15.7%
, to
$18.0 million
in
2015
, from
$15.6 million
in
2014
. The
$2.5 million
increase in R&D expenses was primarily due to a $2.0 million increase in compensation expense resulting from increased headcount to support continued investment in our products, a $0.6 million increase in R&D IT infrastructure and support related expenses and a $0.3 million increase in travel related expenses, partially offset by $1.1 million reduced R&D spend due to the stage and timing of development activities on our projects.
53
Sales, General and Administrative (SG&A)
|
|
Year Ended December 31,
|
Change
|
||||||||||||
|
|
2015
|
2014
|
$
|
%
|
||||||||||
|
|
(in thousands, except for percentages)
|
|||||||||||||
|
SG&A
|
$
|
101,852
|
|
$
|
64,258
|
|
$
|
37,594
|
|
58.5
|
%
|
|||
|
SG&A
as a percentage of revenue
|
54.7
|
%
|
51.2
|
%
|
||||||||||
SG&A expenses increased by
$37.6 million
, or
58.5%
, to
$101.9 million
in
2015
, from
$64.3 million
in
2014
. Our sales and administrative headcount in 2015 increased by 55.4%, which led to a $24.1 million increase in compensation expense. Additionally, SG&A expenses were impacted by a $4.4 million increase due to expanded marketing programs, a $3.0 million increase in legal, professional and consulting expenses due to our operating as a publicly traded company, and a $2.8 million increase in travel-related expenses of our salesforce to support our sales activities.
Provision for Income Taxes
|
|
Year Ended December 31,
|
Change
|
||||||||||
|
|
2015
|
2014
|
$
|
%
|
||||||||
|
|
(in thousands, except for percentages)
|
|||||||||||
|
Provision for income taxes
|
1,659
|
|
894
|
|
$
|
765
|
|
85.6
|
%
|
|||
|
Effective tax rate
|
41.2
|
%
|
28.5
|
%
|
||||||||
Our provision for income taxes increased
$0.8 million
, to
$1.7 million
in
2015
, from
$0.9 million
in
2014
. Our effective tax rate increased to
41.2%
in
2015
, compared to
28.5%
in
2014
. The higher effective tax rate for 2015 was primarily due to higher permanent tax differences relating to nondeductible stock-based compensation expense, change in mix of jurisdictional profits and a change in valuation allowance.
Year Ended
December 31, 2014
Compared to Year Ended
December 31, 2013
Revenue
|
|
Year Ended December 31,
|
Change
|
||||||||||||
|
|
2014
|
2013
|
$
|
%
|
||||||||||
|
|
(in thousands, except for percentages)
|
|||||||||||||
|
Neuro
|
$
|
106,242
|
|
$
|
81,343
|
|
$
|
24,899
|
|
30.6
|
%
|
|||
|
Peripheral Vascular
|
19,268
|
|
7,505
|
|
11,763
|
|
156.7
|
%
|
||||||
|
Total
|
$
|
125,510
|
|
$
|
88,848
|
|
$
|
36,662
|
|
41.3
|
%
|
|||
Revenue increased
$36.7 million
, or
41.3%
, to
$125.5 million
in
2014
, from
$88.8 million
in
2013
. Our revenue growth was primarily due to expansion of our salesforce headcount by 55.8%, further market penetration of our existing products and sales of new products. Increased sales of Penumbra System products accounted for approximately half of the revenue increase in 2014. With respect to the impact of the introduction of new products, 12.1% of the increase in 2014 revenues came from the sale of new products, including our Indigo peripheral thrombectomy product, our Apollo System and our Benchmark neuro access product.
Revenue from sales in the U. S. increased
$24.7 million
, or
42.3%
, to
$83.0 million
in
2014
, from
$58.3 million
in
2013
. Revenue from sales in international markets increased
$12.0 million
, or
39.3%
, to
$42.5 million
in
2014
, from
$30.5 million
in
2013
. Revenue from international sales represented 34% and 34% of our total revenue in
2014
and
2013
, respectively.
Revenue from our neuro products increased
$24.9 million
, or
30.6%
, to
$106.2 million
in
2014
, from
$81.3 million
in
2013
. Our neuro product sales experienced strong momentum due to further market penetration and growth in the market following presentation of trial results in October 2014, which support endovascular treatment of stroke. Additionally, our neuro product sales benefited from the launch of our ACE Reperfusion Catheter in July 2013. Prices for our neuro products remained substantially flat during the period.
Revenue from our peripheral vascular products increased
$11.8 million
, or
156.7%
, to
$19.3 million
in
2014
, from
$7.5 million
in
2013
. Peripheral vascular product sales volume growth benefited from the focused efforts of our dedicated peripheral vascular salesforce, which was established in the second half of 2014, further market penetration and sales from our recently launched Indigo product. Prices for our peripheral vascular products remained substantially flat during the period.
54
Gross Profit and Gross Margin
|
|
Year Ended December 31,
|
Change
|
||||||||||||
|
|
2014
|
2013
|
$
|
%
|
||||||||||
|
|
(in thousands, except for percentages)
|
|||||||||||||
|
Cost of revenue
|
$
|
42,668
|
|
$
|
30,972
|
|
$
|
11,696
|
|
37.8
|
%
|
|||
|
Gross profit
|
$
|
82,842
|
|
$
|
57,876
|
|
$
|
24,966
|
|
43.1
|
%
|
|||
|
Gross margin %
|
66.0
|
%
|
65.1
|
%
|
||||||||||
Gross profit increased
$25.0 million
, or
43.1%
, to
$82.8 million
in
2014
, from
$57.9 million
in
2013
. The increase in gross profit was primarily driven by an increase in revenue from sales of our neuro and peripheral vascular products.
Gross margin increased
0.9
percentage points to
66.0%
in
2014
, from
65.1%
in
2013
. The increase in gross margin is attributable to geographic and product mix and improved manufacturing efficiency.
Research and Development (R&D) Expenses
|
|
Year Ended December 31,
|
Change
|
||||||||||||
|
|
2014
|
2013
|
$
|
%
|
||||||||||
|
|
(in thousands, except for percentages)
|
|||||||||||||
|
R&D
|
$
|
15,575
|
|
$
|
14,084
|
|
$
|
1,491
|
|
10.6
|
%
|
|||
|
R&D as a percentage of revenue
|
12.4
|
%
|
15.9
|
%
|
||||||||||
R&D expenses increased by
$1.5 million
, or
10.6%
, to
$15.6 million
in
2014
, from
$14.1 million
in
2013
. The
$1.5 million
increase was primarily due to a $1.2 million increase in compensation expense resulting from increased headcount to support continued research and development in our products and a $0.3 million increase in consulting costs.
Sales, General and Administrative (SG&A) Expenses
|
|
Year Ended December 31,
|
Change
|
||||||||||||
|
|
2014
|
2013
|
$
|
%
|
||||||||||
|
|
(in thousands, except for percentages)
|
|||||||||||||
|
SG&A
|
$
|
64,258
|
|
$
|
44,918
|
|
$
|
19,340
|
|
43.1
|
%
|
|||
|
SG&A as a percentage of revenue
|
51.2
|
%
|
50.6
|
%
|
||||||||||
SG&A expenses increased by
$19.3 million
, or
43.1%
, to
$64.3 million
in
2014
, from
$44.9 million
in
2013
. The
$19.3 million
increase was primarily due to a $10.9 million increase in compensation expense resulting from increased headcount, a $2.1 million increase in legal, professional and consulting fees, a $2.1 million increase in marketing expenses due to expanded marketing programs and a $1.5 million increase in travel-related expenses for our salesforce to support our sales activities.
Provision for (Benefit from) Income Taxes
|
|
Year Ended December 31,
|
Change
|
|||||||||||
|
|
2014
|
2013
|
$
|
%
|
|||||||||
|
|
(in thousands, except for percentages)
|
||||||||||||
|
Provision for (benefit from) income taxes
|
$
|
894
|
|
$
|
(5,354
|
)
|
$
|
6,248
|
|
nm
|
|||
|
Effective tax rate
|
28.5
|
%
|
nm
|
|
|||||||||
Our provision for income taxes was
$0.9 million
in
2014
compared to a tax benefit of
$5.4 million
in
2013
. The higher tax provision in
2014
was due to the release of a valuation allowance of $5.0 million against net deferred tax assets in
2013
and the reduced availability of net operating loss carryforwards in
2014
. Our effective tax rate increased to
28.5%
in
2014
. The effective tax rate in
2014
was lower than the U.S. federal statutory rate due to the impact of federal income tax credits.
Prior to
2013
, we recorded a valuation allowance in the full amount of our net deferred tax assets, as we had assessed our cumulative loss position and determined that the future benefits were not more likely than not to be realized. As of
December 31, 2013
, we determined that it is more likely than not that a portion of the net deferred tax assets will be realized for federal and state income tax purposes in the U.S., except in California, and released $5.0 million of the valuation allowance. We continue to record a valuation allowance in the full amount of the net deferred tax assets attributable to California and certain foreign jurisdictions.
55
Liquidity and Capital Resources
As of
December 31, 2015
, we had
$216.2 million
in working capital, which included
$19.5 million
in cash and
$129.3 million
in marketable investments. Prior to our initial public offering (IPO), we financed our operations primarily through private placements of convertible preferred stock and borrowings under a line of credit. We closed our IPO on September 23, 2015 and raised $124.7 million in net proceeds.
In addition to our existing cash and cash equivalents and marketable investment balances, our principal source of liquidity is our accounts receivable. We believe these sources will be sufficient to meet our liquidity requirements for at least the next 12 months. Our principal liquidity requirements are to fund our operations, including our research and development, and capital expenditures. To facilitate our expansion, we may also lease or purchase additional facilities. We expect to continue to make investments as we launch new products, expand our manufacturing operations and further expand into international markets. We may, however, require or elect to secure additional financing as we continue to execute our business strategy. If we require or elect to raise additional funds, we may do so through equity or debt financing, which may not be available on acceptable terms, could result in dilution to our stockholders and could require us to agree to covenants that limit our operating flexibility.
|
|
December 31,
2015 |
December 31,
2014 |
|||||
|
|
(in thousands)
|
||||||
|
Cash and cash equivalents
|
$
|
19,547
|
|
$
|
3,290
|
|
|
|
Marketable investments
|
129,257
|
|
48,253
|
|
|||
|
Accounts receivable, net
|
29,444
|
|
18,912
|
|
|||
|
Accounts payable
|
2,567
|
|
2,348
|
|
|||
|
Accrued liabilities
|
25,581
|
|
18,475
|
|
|||
|
Working capital
(1)
|
216,213
|
|
94,478
|
|
|||
____________________
|
(1)
|
Working capital consists of total current assets less total current liabilities.
|
The following table sets forth, for the periods indicated, our beginning balance of cash and cash equivalents, net cash flows provided by (used in) operating, investing and financing activities and our ending balance of cash and cash equivalents:
|
|
Year Ended December 31,
|
||||||||||
|
|
2015
|
2014
|
2013
|
||||||||
|
|
(in thousands)
|
||||||||||
|
Cash and cash equivalents at beginning of year
|
$
|
3,290
|
|
$
|
4,131
|
|
$
|
7,435
|
|
||
|
Net cash used in operating activities
|
(22,279
|
)
|
(6,389
|
)
|
(3,396
|
)
|
|||||
|
Net cash used in investing activities
|
(85,816
|
)
|
(37,001
|
)
|
(1,251
|
)
|
|||||
|
Net cash provided by financing activities
|
124,424
|
|
42,897
|
|
2,178
|
|
|||||
|
Cash and cash equivalents at end of year
|
19,547
|
|
3,290
|
|
4,131
|
|
|||||
Net Cash Used in Operating Activities
Net cash used in operating activities consists primarily of net income adjusted for certain non-cash items (including depreciation and amortization, inventory write downs, stock-based compensation expense, provision for doubtful accounts, provision for sales returns, loss on minority investment, loss on disposal of property and equipment, and provision for product warranty), and the effect of changes in working capital and other activities.
Net cash used in operating activities was
$22.3 million
in 2015 and consisted of net income of
$2.4 million
and non-cash items of
$7.6 million
offset by net changes in operating assets and liabilities of
$32.3 million
. The change in operating assets and liabilities includes the increase in inventories of
$25.1 million
to support our revenue growth, an increase in accounts receivable of
$11.1 million
, an increase in prepaid expenses and other current and non-current assets of
$4.0 million
, partially offset by an increase in accrued expenses and other non-current liabilities of
$7.8 million
and accounts payable of
$0.1 million
, as a result of the growth in our business activities.
Net cash used by operating activities was $6.4 million in 2014 and consisted of net income of $2.2 million and non-cash items of $3.5 million, offset by net changes in operating assets and liabilities of $12.1 million. The change in operating assets and liabilities includes an increase in inventories of $9.4 million to support our revenue growth and a corresponding increase in accounts receivable of $7.4 million and an increase in prepaid expenses and other current and non-current assets of $1.9 million
56
partially offset by an increase in accrued expenses and other non-current liabilities of $5.4 million and accounts payable of $1.3 million as a result of the growth in our business activities.
Net cash used by operating activities was $3.4 million in 2013 and consisted of net income of $4.1 million, and a change in non-cash items of $2.5 million, which includes a release of a valuation allowance of $5.0 million and a change in deferred tax benefits of $0.3 million, partially offset by net changes in operating assets and liabilities of $5.0 million. The significant items in the change in operating assets and liabilities include increases in inventories and accounts receivable of $3.8 million and $1.6 million, respectively, partially offset by an increase in accrued expenses and other non-current liabilities of $1.7 million.
Net Cash Used in Investing Activities
Net cash used in investing activities relates primarily to divestures or purchases of marketable investments and capital expenditures.
Net cash used in investing activities was
$85.8 million
in 2015 and consisted of net purchases of marketable investments of
$80.3 million
and capital expenditures of
$5.5 million
.
Net cash used in investing activities was $37.0 million in 2014 and consisted of net purchases of marketable investments of $33.1 million and capital expenditures of $3.9 million.
Net cash used in investing activities was $1.3 million during in 2013 and consisted of capital expenditures of $0.8 million and net purchases of marketable investments of $0.5 million.
Net Cash Provided by Financing Activities
Net cash from financing activities primarily relates to capital raising activities through equity or debt financing.
Financing activities in 2015 provided cash of
$124.4 million
and consisted of net proceeds from our IPO of
$124.7 million
, net of issuance costs, excess tax benefit from stock-based compensation of
$1.6 million
and proceeds from exercises of stock options of
$0.6 million
, partially offset by payment of employee taxes related to vested common and restricted stock of
$2.5 million
.
Financing activities in 2014 provided $42.9 million and consisted of proceeds from issuance of Series F Preferred Stock of $57.2 million, net of issuance costs, and proceeds from exercises of stock options of $1.0 million. These proceeds were partially offset by repurchases of preferred stock, common stock and stock options of $9.4 million and the repayment of amounts outstanding under our credit facility of $6.0 million upon its termination in May 2014.
Financing activities in 2013 provided $2.2 million and consisted of proceeds from our credit facility of $2.0 million and proceeds from exercises of stock options of $0.2 million.
In May 2012, we entered into a $15.0 million revolving credit facility with Wells Fargo Bank, National Association. The credit facility was collateralized by our investment balances. The interest on the credit facility was based on the daily one-month London Inter-Bank Offered Rate, plus 1.75% and was payable monthly. The credit facility contained customary covenants for credit facilities of this type, including limitations on disposition of assets and changes in control. In May 2014, in conjunction with our Series F Preferred Stock financing, we paid the then outstanding balance and terminated the credit facility.
Contractual Obligations and Commitments
The following table summarizes our contractual obligations as of
December 31, 2015
:
|
|
Payments Due by Period
|
||||||||||||||||||
|
|
Total
|
Less Than
One Year
|
1-3 Years
|
3-5 Years
|
More than
Five Years
|
||||||||||||||
|
|
(in thousands)
|
||||||||||||||||||
|
Rent obligations
(1)
|
$
|
75,535
|
|
$
|
3,803
|
|
$
|
9,351
|
|
$
|
9,826
|
|
$
|
52,555
|
|
||||
|
Equipment lease obligations
(2)
|
953
|
|
252
|
|
387
|
|
314
|
|
—
|
|
|||||||||
|
Purchase commitments
(3)
|
11,820
|
|
10,960
|
|
860
|
|
—
|
|
—
|
|
|||||||||
|
Total
|
$
|
88,308
|
|
$
|
15,015
|
|
$
|
10,598
|
|
$
|
10,140
|
|
$
|
52,555
|
|
||||
____________________
|
(1)
|
We lease our corporate headquarters and a manufacturing facility at our campus in Alameda, California, pursuant to lease agreements that expire on various dates from 2029 to 2031. Additionally, we lease offices in Germany, Australia and Brazil. Included in rent obligations
|
57
is a lease for an additional 99,568 square feet of space pursuant to a lease agreement that we signed in December 2015. Under this lease agreement, we may be delivered with an additional space of 15,882 square feet at the landlord
’
s option prior to May 1, 2016. Additionally, from time to time during the ten year period following the initial commencement date of the lease, if any space located in the same business park as our campus becomes vacant, that space will be added to the lease at the then current base monthly rental rate. The maximum additional space that could be added under this provision of the lease is 117,325 square feet. The table above does not include our potential obligation for the additional space(s) that may be added to the lease by the landlord.
|
(2)
|
We lease equipment and automobiles under operating leases. These leases expire at various dates through 2018.
|
|
(3)
|
Purchase commitments consist of contracts with suppliers to purchase raw materials to be used to manufacture products.
|
The amounts in the table above exclude $1.7 million of income tax liabilities included in other non-current liabilities as we are unable to reasonably estimate the timing of settlement. In addition, the table above does not reflect royalty obligations under a license agreement as amounts due thereunder fluctuate depending on sales levels.
Off-Balance Sheet Arrangements
We do not have any off-balance sheet arrangements or any holdings in variable interest entities.
Recently Issued Accounting Standards
For information with respect to recently issued accounting standards and the impact of these standards on our consolidated financial statements, see Note 2 “Summary of Significant Accounting Policies” to our consolidated financial statements in Part II, Item 8 of this Annual Report on Form 10-K.
58
We are exposed to various market risks, which may result in potential losses arising from adverse changes in market rates, such as interest rates and foreign exchange rates. We do not enter into derivatives or other financial instruments for trading or speculative purposes and do not believe we are exposed to material market risk with respect to our cash and cash equivalents and/or our marketable investments.
Interest Rate Risk.
We had cash and cash equivalents of
$19.5 million
as of
December 31, 2015
, which consisted of funds held in general checking and savings accounts. In addition, we had marketable investments of $129.3 million, which consisted primarily of corporate bonds, commercial paper, U.S. agency securities and U.S. Treasury. Our investment policy is focused on the preservation of capital and supporting our liquidity needs. Under the policy, we invest in highly rated securities,
while limiting the amount of credit exposure to any one issuer other than the U.S. government. We do not invest in financial instruments for trading or speculative purposes, nor do we use leveraged financial instruments. We utilize external investment managers who adhere to the guidelines of our investment polic
y. A hypothetical 100 basis point change in interest rates would not have a material impact on the value of our cash and cash equivalents or marketable investments.
Foreign Exchange Risk Management.
We operate in countries other than the U. S., and, therefore, we are exposed to foreign currency risks. We bill most sales outside of the U. S. in local currencies, primarily the euro and Japanese yen. We expect that the percentage of our sales denominated in foreign currencies may increase in the foreseeable future as we continue to expand into international markets. When sales or expenses are not denominated in U.S. dollars, a fluctuation in exchange rates could affect our net income. We do not believe an immediate 10% adverse change in foreign exchange rates would have a material effect on our results of operations. We do not currently hedge our exposure to foreign currency exchange rate fluctuations; however, we may choose to hedge our exposure in the future.
We do not believe that inflation and change in prices had a significant impact on our results of operations for any periods presented on our consolidated financial statements.
59
PENUMBRA, INC.
INDEX TO THE CONSOLIDATED FINANCIAL STATEMENTS
60
REPORT OF INDEPENDENT REGISTERED PUBLIC ACCOUNTING FIRM
To the Board of Directors and Stockholders of
Penumbra, Inc.
Alameda, California
We have audited the accompanying consolidated balance sheets of Penumbra, Inc. and subsidiaries (the “Company”) as of December 31, 2015 and 2014, and the related consolidated statements of operations and comprehensive income, convertible preferred stock and stockholders’ equity (deficit), and cash flows for each of the three years in the period ended December 31, 2015. These financial statements are the responsibility of the Company’s management. Our responsibility is to express an opinion on the financial statements based on our audits.
We conducted our audits in accordance with the standards of the Public Company Accounting Oversight Board (United States). Those standards require that we plan and perform the audit to obtain reasonable assurance about whether the financial statements are free of material misstatement. The Company is not required to have, nor were we engaged to perform, an audit of its internal control over financial reporting. Our audits included consideration of internal control over financial reporting as a basis for designing audit procedures that are appropriate in the circumstances, but not for the purpose of expressing an opinion on the effectiveness of the Company’s internal control over financial reporting. Accordingly, we express no such opinion. An audit also includes examining, on a test basis, evidence supporting the amounts and disclosures in the financial statements, assessing the accounting principles used and significant estimates made by management, as well as evaluating the overall financial statement presentation. We believe that our audits provide a reasonable basis for our opinion.
In our opinion, such consolidated financial statements present fairly, in all material respects, the financial position of Penumbra, Inc. and subsidiaries as of December 31, 2015 and 2014, and the results of their operations and their cash flows for each of the three years in the period ended December 31, 2015, in conformity with accounting principles generally accepted in the United States of America.
As discussed in Note 2 to the financial statements, the Company early adopted the Financial Accounting Standards Board Accounting Standards Update No. 2015-17, Balance Sheet Classification of Deferred Taxes, as of December 31, 2015 on a prospective basis.
/s/ DELOITTE & TOUCHE LLP
San Francisco, California
March 8, 2016
61
Penumbra, Inc.
(in thousands, except share and per share amounts)
|
December 31,
|
||||||||
|
2015
|
2014
|
|||||||
|
Assets
|
||||||||
|
Current assets:
|
||||||||
|
Cash and cash equivalents
|
$
|
19,547
|
|
$
|
3,290
|
|
||
|
Marketable investments
|
129,257
|
|
48,253
|
|
||||
|
Accounts receivable, net of doubtful accounts of $589 and $602 at December 31, 2015 and 2014, respectively
|
29,444
|
|
18,912
|
|
||||
|
Inventories
|
56,761
|
|
33,451
|
|
||||
|
Deferred taxes
|
—
|
|
6,280
|
|
||||
|
Prepaid expenses and other current assets
|
9,352
|
|
5,115
|
|
||||
|
Total current assets
|
244,361
|
|
115,301
|
|
||||
|
Property and equipment, net
|
8,951
|
|
5,181
|
|
||||
|
Deferred taxes
|
10,143
|
|
571
|
|
||||
|
Other non-current assets
|
393
|
|
328
|
|
||||
|
Total assets
|
$
|
263,848
|
|
$
|
121,381
|
|
||
|
Liabilities, Convertible Preferred Stock and Stockholders’ Equity (Deficit)
|
||||||||
|
Current Liabilities:
|
||||||||
|
Accounts payable
|
$
|
2,567
|
|
$
|
2,348
|
|
||
|
Accrued liabilities
|
25,581
|
|
18,475
|
|
||||
|
Total current liabilities
|
28,148
|
|
20,823
|
|
||||
|
Other non-current liabilities
|
3,178
|
|
1,461
|
|
||||
|
Total liabilities
|
31,326
|
|
22,284
|
|
||||
|
Commitments and contingencies (Note 8)
|
|
|
|
|
||||
|
Convertible preferred stock, $0.001 par value per share—none authorized, issued and outstanding at December 31, 2015; 25,000,000 shares authorized, 19,510,410 shares issued and outstanding at December 31, 2014; aggregate liquidation value $149,361 at December 31, 2014
|
—
|
|
111,467
|
|
||||
|
Stockholders’ Equity (Deficit):
|
||||||||
|
Preferred stock, $0.001 par value per share—5,000,000 shares authorized, none issued and outstanding at December 31, 2015; None authorized, issued and outstanding at December 31, 2014
|
—
|
|
—
|
|
||||
|
Common stock, $0.001 par value per share—300,000,000 shares authorized, 29,897,860 issued and outstanding at December 31, 2015; 40,000,000 shares authorized, 4,736,689 issued and outstanding at December 31, 2014
|
30
|
|
5
|
|
||||
|
Additional paid-in capital
|
252,087
|
|
8,446
|
|
||||
|
Notes receivable from stockholders
|
(5
|
)
|
(117
|
)
|
||||
|
Accumulated other comprehensive loss
|
(2,115
|
)
|
(864
|
)
|
||||
|
Accumulated deficit
|
(17,475
|
)
|
(19,840
|
)
|
||||
|
Total stockholders’ equity (deficit)
|
232,522
|
|
(12,370
|
)
|
||||
|
Total liabilities, convertible preferred stock and stockholders’ equity (deficit)
|
$
|
263,848
|
|
$
|
121,381
|
|
||
The accompanying notes are an integral part of these consolidated financial statements.
62
Penumbra, Inc.
(in thousands, except share and per share amounts)
|
Year Ended December 31,
|
|||||||||||
|
2015
|
2014
|
2013
|
|||||||||
|
Revenue
|
$
|
186,095
|
|
$
|
125,510
|
|
$
|
88,848
|
|
||
|
Cost of revenue
|
62,037
|
|
42,668
|
|
30,972
|
|
|||||
|
Gross profit
|
124,058
|
|
82,842
|
|
57,876
|
|
|||||
|
Operating expenses:
|
|||||||||||
|
Research and development
|
18,027
|
|
15,575
|
|
14,084
|
|
|||||
|
Sales, general and administrative
|
101,852
|
|
64,258
|
|
44,918
|
|
|||||
|
Total operating expenses
|
119,879
|
|
79,833
|
|
59,002
|
|
|||||
|
Income (loss) from operations
|
4,179
|
|
3,009
|
|
(1,126
|
)
|
|||||
|
Interest income (expense), net
|
541
|
|
439
|
|
345
|
|
|||||
|
Other income (expense), net
|
(696
|
)
|
(309
|
)
|
(474
|
)
|
|||||
|
Income (loss) before provision for (benefit from) income taxes
|
4,024
|
|
3,139
|
|
(1,255
|
)
|
|||||
|
Provision for (benefit from) income taxes
|
1,659
|
|
894
|
|
(5,354
|
)
|
|||||
|
Net income
|
2,365
|
|
2,245
|
|
4,099
|
|
|||||
|
Foreign currency translation adjustments, net of tax
|
(1,308
|
)
|
(1,423
|
)
|
(522
|
)
|
|||||
|
Unrealized gains (losses) on available-for-sale securities, net of tax
|
57
|
|
(237
|
)
|
(84
|
)
|
|||||
|
Comprehensive income
|
$
|
1,114
|
|
$
|
585
|
|
$
|
3,493
|
|
||
|
Net income (loss) attributable to common stockholders (Note 16)
|
$
|
1,084
|
|
$
|
(833
|
)
|
$
|
887
|
|
||
|
Net income (loss) per share attributable to common stockholders
—Basic |
$
|
0.09
|
|
$
|
(0.18
|
)
|
$
|
0.21
|
|
||
|
—Diluted
|
$
|
0.08
|
|
$
|
(0.18
|
)
|
$
|
0.14
|
|
||
|
Weighted average shares used to compute net income (loss) per share attributable to common stockholders
—Basic |
11,993,429
|
|
4,609,375
|
|
4,304,396
|
|
|||||
|
—Diluted
|
14,219,650
|
|
4,609,375
|
|
6,500,835
|
|
|||||
The accompanying notes are an integral part of these consolidated financial statements.
63
Penumbra, Inc.
Consolidated Statements of Convertible Preferred Stock and Stockholders’ Equity (Deficit)
(in thousands, except share amounts)
|
Convertible Preferred Stock
|
Common Stock
|
Additional
Paid-in
Capital
|
Notes
Receivable
from
Stockholders
|
Accumulated
Other
Comprehensive
Income (Loss)
|
Accumulated
Deficit
|
Total
Stockholders’
Equity (Deficit)
|
|||||||||||||||||||||||||||||
|
|
Shares
|
Amount
|
Shares
|
Amount
|
|||||||||||||||||||||||||||||||
|
Balance at December 31, 2012
|
15,594,618
|
|
$
|
56,222
|
|
4,192,745
|
|
$
|
4
|
|
$
|
5,073
|
|
$
|
(138
|
)
|
$
|
1,402
|
|
$
|
(19,092
|
)
|
$
|
(12,751
|
)
|
||||||||||
|
Issuance of common stock
|
—
|
|
—
|
|
198,843
|
|
—
|
|
310
|
|
—
|
|
—
|
|
—
|
|
310
|
|
|||||||||||||||||
|
Stock-based compensation
|
—
|
|
—
|
|
—
|
|
—
|
|
886
|
|
—
|
|
—
|
|
—
|
|
886
|
|
|||||||||||||||||
|
Foreign currency translation adjustment, net of tax of $213
|
—
|
|
—
|
|
—
|
|
—
|
|
—
|
|
—
|
|
(522
|
)
|
—
|
|
(522
|
)
|
|||||||||||||||||
|
Unrealized loss on investments, net of tax of $10
|
—
|
|
—
|
|
—
|
|
—
|
|
—
|
|
—
|
|
(84
|
)
|
—
|
|
(84
|
)
|
|||||||||||||||||
|
Net income
|
—
|
|
—
|
|
—
|
|
—
|
|
—
|
|
—
|
|
—
|
|
4,099
|
|
4,099
|
|
|||||||||||||||||
|
Balance at December 31, 2013
|
15,594,618
|
|
56,222
|
|
4,391,588
|
|
4
|
|
6,269
|
|
(138
|
)
|
796
|
|
(14,993
|
)
|
(8,062
|
)
|
|||||||||||||||||
|
Issuance of Series F preferred stock, net of issuance cost of $2,788
|
4,545,455
|
|
57,212
|
|
—
|
|
—
|
|
—
|
|
—
|
|
—
|
|
—
|
|
—
|
|
|||||||||||||||||
|
Repurchase of preferred stock
|
(629,663
|
)
|
(1,967
|
)
|
—
|
|
—
|
|
—
|
|
—
|
|
—
|
|
(6,344
|
)
|
(6,344
|
)
|
|||||||||||||||||
|
Repurchase of common stock
|
—
|
|
—
|
|
(115,612
|
)
|
—
|
|
(292
|
)
|
—
|
|
—
|
|
(748
|
)
|
(1,040
|
)
|
|||||||||||||||||
|
Issuance of common stock
|
—
|
|
—
|
|
460,713
|
|
1
|
|
1,036
|
|
—
|
|
—
|
|
—
|
|
1,037
|
|
|||||||||||||||||
|
Stock-based compensation
|
—
|
|
—
|
|
—
|
|
—
|
|
1,433
|
|
—
|
|
—
|
|
—
|
|
1,433
|
|
|||||||||||||||||
|
Forgiven notes receivable from stockholders
|
—
|
|
—
|
|
—
|
|
—
|
|
—
|
|
21
|
|
—
|
|
—
|
|
21
|
|
|||||||||||||||||
|
Foreign currency translation adjustment, net of tax of $245
|
—
|
|
—
|
|
—
|
|
—
|
|
—
|
|
—
|
|
(1,423
|
)
|
—
|
|
(1,423
|
)
|
|||||||||||||||||
|
Unrealized loss on investments, net of tax of $168
|
—
|
|
—
|
|
—
|
|
—
|
|
—
|
|
—
|
|
(237
|
)
|
—
|
|
(237
|
)
|
|||||||||||||||||
|
Net income
|
—
|
|
—
|
|
—
|
|
—
|
|
—
|
|
—
|
|
—
|
|
2,245
|
|
2,245
|
|
|||||||||||||||||
|
Balance at December 31, 2014
|
19,510,410
|
|
111,467
|
|
4,736,689
|
|
$
|
5
|
|
8,446
|
|
(117
|
)
|
(864
|
)
|
(19,840
|
)
|
(12,370
|
)
|
||||||||||||||||
|
Conversion of convertible preferred stock into common stock upon closing of IPO
|
(19,510,410
|
)
|
(111,467
|
)
|
19,510,410
|
|
19
|
|
111,448
|
|
—
|
|
—
|
|
—
|
|
111,467
|
|
|||||||||||||||||
|
Shares issued upon closing of IPO
|
—
|
|
—
|
|
4,600,000
|
|
5
|
|
124,737
|
|
—
|
|
—
|
|
—
|
|
124,742
|
|
|||||||||||||||||
|
Issuance of common stock
|
—
|
|
—
|
|
1,074,411
|
|
1
|
|
1,125
|
|
—
|
|
—
|
|
—
|
|
1,126
|
|
|||||||||||||||||
|
Shares held for tax withholdings
|
—
|
|
—
|
|
—
|
|
—
|
|
(2,525
|
)
|
—
|
|
—
|
|
—
|
|
(2,525
|
)
|
|||||||||||||||||
|
Repurchase of common stock
|
—
|
|
—
|
|
(23,650
|
)
|
—
|
|
(342
|
)
|
—
|
|
—
|
|
—
|
|
(342
|
)
|
|||||||||||||||||
|
Stock-based compensation
|
—
|
|
—
|
|
—
|
|
—
|
|
7,608
|
|
—
|
|
—
|
|
—
|
|
7,608
|
|
|||||||||||||||||
|
Excess tax benefit from stock-based compensation
|
—
|
|
—
|
|
—
|
|
—
|
|
1,590
|
|
—
|
|
—
|
|
—
|
|
1,590
|
|
|||||||||||||||||
|
Forgiven notes receivable from stockholders
|
—
|
|
—
|
|
—
|
|
—
|
|
—
|
|
91
|
|
—
|
|
—
|
|
91
|
|
|||||||||||||||||
|
Note received from a stockholder
|
—
|
|
—
|
|
—
|
|
—
|
|
—
|
|
21
|
|
—
|
|
—
|
|
21
|
|
|||||||||||||||||
|
Foreign currency translation adjustment, net of tax of $117
|
—
|
|
—
|
|
—
|
|
—
|
|
—
|
|
—
|
|
(1,308
|
)
|
—
|
|
(1,308
|
)
|
|||||||||||||||||
|
Unrealized gain on investments, net of tax of $66
|
—
|
|
—
|
|
—
|
|
—
|
|
—
|
|
—
|
|
57
|
|
—
|
|
57
|
|
|||||||||||||||||
|
Net income
|
—
|
|
—
|
|
—
|
|
—
|
|
—
|
|
—
|
|
—
|
|
2,365
|
|
2,365
|
|
|||||||||||||||||
|
Balance at December 31, 2015
|
—
|
|
$
|
—
|
|
29,897,860
|
|
$
|
30
|
|
$
|
252,087
|
|
$
|
(5
|
)
|
$
|
(2,115
|
)
|
$
|
(17,475
|
)
|
$
|
232,522
|
|
||||||||||
The accompanying notes are an integral part of these consolidated financial statements.
64
|
|
Year Ended December 31,
|
||||||||||
|
|
2015
|
2014
|
2013
|
||||||||
|
CASH FLOWS FROM OPERATING ACTIVITIES:
|
|||||||||||
|
Net income
|
$
|
2,365
|
|
$
|
2,245
|
|
$
|
4,099
|
|
||
|
Adjustments to reconcile net income to net cash used in operating activities:
|
|||||||||||
|
Depreciation and amortization
|
1,752
|
|
751
|
|
677
|
|
|||||
|
Amortization of premium on marketable investments
|
83
|
|
—
|
|
—
|
|
|||||
|
Stock-based compensation
|
7,271
|
|
1,433
|
|
886
|
|
|||||
|
Excess tax benefit from stock-based compensation
|
(1,590
|
)
|
—
|
|
—
|
|
|||||
|
Provision for doubtful accounts
|
(13
|
)
|
150
|
|
259
|
|
|||||
|
Inventory write downs
|
1,163
|
|
1,852
|
|
892
|
|
|||||
|
Write off of note receivable
|
91
|
|
21
|
|
—
|
|
|||||
|
Provision for sales returns
|
1,083
|
|
(3
|
)
|
(212
|
)
|
|||||
|
Loss on minority investment
|
—
|
|
150
|
|
—
|
|
|||||
|
Loss on disposal of property and equipment
|
43
|
|
21
|
|
3
|
|
|||||
|
Realized loss on marketable investments
|
541
|
|
—
|
|
160
|
|
|||||
|
Provision for product warranty
|
399
|
|
(8
|
)
|
—
|
|
|||||
|
Release of valuation allowance
|
(243
|
)
|
(321
|
)
|
(4,962
|
)
|
|||||
|
Deferred taxes
|
(2,961
|
)
|
(571
|
)
|
(335
|
)
|
|||||
|
Issuance of common stock to third parties
|
—
|
|
—
|
|
132
|
|
|||||
|
Changes in operating assets and liabilities:
|
|||||||||||
|
Accounts receivable
|
(11,063
|
)
|
(7,426
|
)
|
(1,550
|
)
|
|||||
|
Inventories
|
(25,126
|
)
|
(9,444
|
)
|
(3,779
|
)
|
|||||
|
Prepaid expenses and other current and non-current assets
|
(4,013
|
)
|
(1,906
|
)
|
(961
|
)
|
|||||
|
Accounts payable
|
132
|
|
1,299
|
|
(451
|
)
|
|||||
|
Accrued expenses and other non-current liabilities
|
7,807
|
|
5,368
|
|
1,746
|
|
|||||
|
Net cash used in operating activities
|
(22,279
|
)
|
(6,389
|
)
|
(3,396
|
)
|
|||||
|
CASH FLOWS FROM INVESTING ACTIVITIES:
|
|||||||||||
|
Purchases of marketable investments
|
(135,340
|
)
|
(51,342
|
)
|
(6,858
|
)
|
|||||
|
Proceeds from sales of marketable investments
|
54,998
|
|
18,229
|
|
6,405
|
|
|||||
|
Purchases of property and equipment
|
(5,474
|
)
|
(3,888
|
)
|
(798
|
)
|
|||||
|
Net cash used in investing activities
|
(85,816
|
)
|
(37,001
|
)
|
(1,251
|
)
|
|||||
|
CASH FLOWS FROM FINANCING ACTIVITIES:
|
|||||||||||
|
Proceeds from issuance of preferred stock, net of issuance costs
|
—
|
|
57,212
|
|
—
|
|
|||||
|
Proceeds from issuance of common stock issued in initial public offering, net of issuance costs
|
124,742
|
|
—
|
|
—
|
|
|||||
|
Proceeds from exercises of stock options
|
617
|
|
1,036
|
|
178
|
|
|||||
|
Excess tax benefit from stock-based compensation
|
1,590
|
|
—
|
|
—
|
|
|||||
|
Repurchase of preferred stock
|
—
|
|
(8,311
|
)
|
—
|
|
|||||
|
Proceeds from credit facility
|
—
|
|
—
|
|
2,000
|
|
|||||
|
Repayment of credit facility
|
—
|
|
(6,000
|
)
|
—
|
|
|||||
|
Repurchase of common stock and stock options
|
—
|
|
(1,040
|
)
|
—
|
|
|||||
|
Payment of employee taxes related to vested common and restricted stock
|
(2,525
|
)
|
—
|
|
—
|
|
|||||
|
Net cash provided by financing activities
|
124,424
|
|
42,897
|
|
2,178
|
|
|||||
|
Effect of foreign exchange rate changes on cash and cash equivalents
|
(72
|
)
|
(348
|
)
|
(835
|
)
|
|||||
|
NET INCREASE IN CASH AND CASH EQUIVALENTS
|
16,257
|
|
(841
|
)
|
(3,304
|
)
|
|||||
|
CASH AND CASH EQUIVALENTS—Beginning of period
|
3,290
|
|
4,131
|
|
7,435
|
|
|||||
|
CASH AND CASH EQUIVALENTS—End of period
|
$
|
19,547
|
|
$
|
3,290
|
|
$
|
4,131
|
|
||
|
SUPPLEMENTAL DISCLOSURES OF CASH FLOW INFORMATION:
|
|||||||||||
|
Cash paid for interest
|
$
|
1
|
|
$
|
160
|
|
$
|
100
|
|
||
|
Cash paid for income taxes
|
$
|
1,220
|
|
$
|
3,086
|
|
$
|
37
|
|
||
|
NONCASH INVESTING AND FINANCING ACTIVITIES:
|
|||||||||||
|
Conversion of convertible preferred stock into common stock
|
$
|
111,467
|
|
$
|
—
|
|
$
|
—
|
|
||
|
Purchase of property and equipment funded through accounts payable
|
$
|
143
|
|
$
|
44
|
|
$
|
5
|
|
||
The accompanying notes are an integral part of these consolidated financial statements.
65
1. Organization and Description of Business
Penumbra, Inc. (the Company) is a global interventional therapies company that designs, develops, manufactures and markets innovative medical devices. The Company has a broad portfolio of products that addresses challenging medical conditions and significant clinical needs across
two
major markets, neuro and peripheral vascular. The conditions that the Company’s products address include, among others, ischemic stroke, hemorrhagic stroke and various peripheral vascular conditions that can be treated through thrombectomy and embolization procedures.
2. Summary of Significant Accounting Policies
Basis of Presentation and Consolidation
The accompanying consolidated financial statements have been prepared in accordance with accounting principles generally accepted in the United States (U.S. GAAP). The consolidated financial statements include the accounts of the Company and its wholly-owned subsidiaries. All intercompany accounts and transactions have been eliminated in consolidation.
Use of Estimates
The preparation of financial statements in conformity with U.S. GAAP requires management to make estimates and assumptions that affect the reported amounts of assets, liabilities and equity accounts; disclosure of contingent assets and liabilities at the date of the financial statements; and the reported amounts of revenues and expenses during the reporting period. On an ongoing basis, the Company evaluates its estimates, including those related to provisions for doubtful accounts, sales return reserve, warranty reserves, valuation of inventories, useful lives of property and equipment, income taxes, the valuation of equity instruments and contingencies, among others. The Company bases its estimates on historical experience and on various other assumptions that are believed to be reasonable under the circumstances, the results of which form the basis for making judgments about the carrying values of assets and liabilities that are not readily apparent from other data. Actual results could differ from those estimates.
Segments
The Company determined its operating segment on the same basis that it uses to evaluate its performance internally. The Company has
one
business activity: the design, development, manufacturing and marketing of innovative medical devices, and operates as
one
operating segment. The Company’s chief operating decision-maker, its Chief Executive Officer, reviews its operating results for the purpose of allocating resources and evaluating financial performance. The Company determines revenue by geographic area, based on the destination to which it ships its products.
Foreign Currency Translation
The Company’s consolidated financial statements are prepared in United States Dollars (USD). Its foreign subsidiaries use their local currency as their functional currency and maintain their records in the local currency. Accordingly, the assets and liabilities of these subsidiaries are translated into USD using the current exchange rates in effect at the balance sheet date and equity accounts are translated into USD using historical rates. Revenues and expenses are translated using the average exchange rates in effect for the year involved. The resulting foreign currency translation adjustments are recorded in accumulated other comprehensive income in the consolidated balance sheets. Transactions denominated in foreign currency are translated at exchange rates at the date of transaction with foreign currency gains (losses) recorded in other income (expense), net in the consolidated statements of operations and comprehensive income. The Company recognized net foreign currency transaction losses of
$0.1 million
,
$0.3 million
and
$0.3 million
during the years ended
December 31, 2015
,
2014
and
2013
, respectively.
As the Company’s international operations grow, its risks associated with fluctuation in currency rates will become greater, and the Company will continue to reassess its approach to managing this risk. In addition, currency fluctuations or a weakening USD can increase the costs of the Company’s international expansion. To date, the Company has not entered into any foreign currency hedging contracts, since exchange rate fluctuations have not had a material impact on its operating results and cash flows.
Concentration of Credit Risk
Financial instruments that potentially subject the Company to a concentration of credit risk consist of cash and cash equivalents, marketable investments and accounts receivable. The majority of the Company’s cash is held by
one
financial
66
institution in the
U. S.
in excess of federally insured limits. The Company maintained investments in money market funds that were not federally insured during the year ended
December 31, 2015
and held cash in foreign banks of approximately
$1.9 million
and
$0.8 million
at
December 31, 2015
and
2014
, respectively, that was not federally insured.
All of the Company’s revenue has been derived from sales of its products in the
U. S.
and international markets. The Company uses both its own salesforce and independent distributors to sell its products. Concentrations of credit risk with respect to accounts receivable are limited due to the large number of entities comprising the Company’s customer base. The Company performs ongoing credit evaluations of its customers, including its distributors, does not require collateral, and maintains allowances for potential credit losses on customer accounts when deemed necessary.
During the years ended
December 31, 2015
,
2014
and
2013
,
one
customer (a distributor) accounted for
10%
,
12%
and
14%
, respectively, of the Company’s revenue.
No
customer accounted for greater than
10%
of the Company’s accounts receivable balance as of
December 31, 2015
or
2014
.
Significant Risks and Uncertainties
The Company is subject to risks common to medical device companies including, but not limited to, new technological innovations, dependence on key personnel, protection of proprietary technology, compliance with government regulations, product liability, uncertainty of market acceptance of products and the potential need to obtain additional financing. The Company is dependent on third party suppliers, in some cases single-source suppliers.
There can be no assurance that the Company’s products will continue to be accepted in the marketplace, nor can there be any assurance that any future products can be developed or manufactured at an acceptable cost and with appropriate performance characteristics, or that such products will be successfully marketed, if at all.
The Company’s products require approval or clearance from the U.S. Food and Drug Administration prior to commencing commercial sales in the
U. S.
. There can be no assurance that the Company’s products will receive all of the required approvals or clearances. Approvals or clearances are also required in foreign jurisdictions in which the Company sells its products. If the Company is denied such approvals or clearances or such approvals or clearances are delayed, it may have a material adverse impact on the Company’s results of operations, financial position and liquidity.
Fair Value of Financial Instruments
Carrying amounts of certain of the Company’s financial instruments, including cash equivalents, accounts receivable, prepaid expenses and other current assets, accounts payable and accrued liabilities, approximate fair value due to their relatively short maturities.
Cash, Cash Equivalents and Marketable Investments
The Company invests its cash primarily in money market funds and in highly liquid debt instruments of U.S. federal and municipal governments, and their agencies, and corporate debt securities. All highly liquid investments with stated maturities of three months or less from the date of purchase are classified as cash equivalents; all highly liquid investments with stated maturities of greater than three months are classified as marketable investments. The majority of the Company’s cash and investments are held in U.S. banks.
The Company determines the appropriate classification of its investments in marketable investments at the time of purchase and re-evaluates such designation at each balance sheet date. The Company’s marketable investments have been classified and accounted for as available-for-sale. Investments with remaining maturities of more than one year are viewed by the Company as available to support current operations and are classified as current assets under the caption marketable investments in the accompanying consolidated balance sheets. Investments in marketable investments are carried at fair value, with the unrealized gains and losses reported as a component of accumulated other comprehensive loss. Any realized gains or losses on the sale of marketable investments are determined on a specific identification method, and such gains and losses are reflected as a component of other income (expense), net.
67
Impairment of Marketable Investments
After determining the fair value of available-for-sale debt instruments, unrealized gains or losses on these securities are recorded to accumulated other comprehensive income (loss) until either the security is sold or the Company determines that the decline in value is other-than-temporary. The primary differentiating factors that the Company considers in classifying impairments as either temporary or other-than-temporary impairments is the intent and ability to retain the investment in the issuer for a period of time sufficient to allow for any anticipated recovery in market value, the length of the time and the extent to which the market value of the investment has been less than cost, the financial condition and near-term prospects of the issuer. There were
no
other-than-temporary impairments for the years ended
December 31, 2015
,
2014
or
2013
.
Accounts Receivable
Accounts receivable are stated at invoice value less estimated allowances for doubtful accounts. The Company continually monitors customer payments and maintains a reserve for estimated losses resulting from its customers’ inability to make required payments. The Company considers factors such as historical experience, credit quality, age of the accounts receivable balances, geographic related risks and economic conditions that may affect a customer’s ability to pay. In cases where there are circumstances that may impair a specific customer’s ability to meet its financial obligations, a specific allowance is recorded against amounts due, and thereby reduces the net recognized receivable to the amount reasonably believed to be collectible.
Inventories
Inventories are stated at the lower of cost (determined under the first-in first-out method) or market. Write downs are provided for raw materials, components or finished goods that are determined to be excessive or obsolete. Market value is determined as the lower of replacement cost or net realizable value. The Company regularly reviews inventory quantities in consideration of actual loss experience, projected future demand and remaining shelf life to record a provision for excess and obsolete inventory when appropriate.
The estimate of excess quantities is subjective and primarily dependent on the Company’s estimates of future demand for a particular product or components or raw materials used in the manufacturing of such product. If the estimate of future demand is inaccurate based on actual sales, the Company may increase the write down for excess inventory and record a charge to inventory impairment in the accompanying consolidated statements of operations and comprehensive income. The Company periodically evaluates the carrying value of inventory on hand for potential excess amounts over demand using the same lower of cost or market approach that has been used to value the inventory. The Company also periodically evaluates inventory quantities in consideration of actual loss experience. As a result of these evaluations, the Company recognized total write downs of
$1.2 million
,
$1.9 million
and
$0.9 million
for the years ended
December 31, 2015
,
2014
and
2013
, respectively.
Property and Equipment, net
Property and equipment are stated at cost less accumulated depreciation. Depreciation is computed using the straight-line method over
five
years, which is the estimated useful lives of the assets. Leasehold improvements are amortized using the straight-line method over the shorter of the lease term or estimated useful life. Upon retirement or sale, the cost and the related accumulated depreciation are removed from the consolidated balance sheet and the resulting gain or loss is reflected in operations. Maintenance and repairs are charged to operations as incurred.
Impairment of Long-Lived Assets
The Company reviews long-lived assets for impairment whenever events or changes in circumstances indicate that the carrying amount of an asset may not be recoverable. When such an event occurs, management determines whether there has been impairment by comparing the anticipated undiscounted future net cash flows to the related asset group’s carrying value. If an asset is considered impaired, the asset is written down to fair value, which is determined based either on discounted cash flows or appraised value, depending on the nature of the asset. There was
no
impairment of long-lived assets during the years ended
December 31, 2015
,
2014
or
2013
.
Convertible Preferred Stock
The Company, prior to the closing of its initial public offering (IPO) on September 23, 2015, classified its outstanding convertible preferred stock as temporary equity in the consolidated balance sheet due to the existence of certain change in control events that were not solely within the Company’s control, including liquidation, sale or transfer of the Company, that could trigger the ability of the holders of the convertible preferred stock to call for redemption of shares. Upon the closing of
68
the IPO, all outstanding shares of convertible preferred stock automatically converted into shares of common stock on a
one
-for-one basis.
Revenue Recognition
Revenue is comprised of product revenue net of returns, discounts, administration fees and sales rebates. The Company recognizes revenue when persuasive evidence of an arrangement exists, delivery has occurred, the sales price is fixed or determinable and collectability is reasonably assured. Evidence of an arrangement consists of customer orders and the Company typically considers delivery to have occurred once title and risk of loss has been transferred and the product has been delivered to the customer. The Company typically recognizes revenue when products are delivered to hospital customers or distributors. However, with respect to products that the Company consigns to hospitals, which primarily consist of coils, the Company recognizes revenue at the time hospitals utilize products in a procedure.
Deferred revenue represents amounts that the Company has already invoiced its customers and that are ultimately expected to be recognized as revenue, but for which not all revenue recognition criteria have been met. The Company had a deferred revenue balance of
$0.6 million
and
$1.6 million
, as of
December 31, 2015
and
2014
, respectively.
The Company’s terms and conditions permit product returns and exchanges, and it records returns reserves in the period when revenue is recognized. Estimates are based on actual historical returns over the prior three years and are recorded as reductions in revenue at the time of sale. Upon recognition, the Company reduces revenue and cost of revenue for the estimated return. Return rates can fluctuate over time, but are sufficiently predictable to allow the Company to estimate expected future product returns.
Cost of Revenue
Cost of revenue includes direct and indirect costs associated with the manufacture of the Company’s products. Direct costs include material and labor, while indirect costs include inbound freight charges, receiving costs, inspection and testing costs, warehousing costs, royalty expense and other labor and overhead costs incurred in the manufacturing of products. Cost of revenue also includes stock-based compensation, warranty replacement costs, cost of revenue related to product return reserves and excess and obsolete inventory write-downs.
Shipping Costs
Shipping and handling costs charged to customers are recorded as revenue. Shipping and handling costs are included in cost of revenue.
Research and Development (R&D) Costs
R&D costs primarily consist of product development, clinical and regulatory expenses, materials, depreciation and other costs associated with the development of the Company’s products. R&D costs also include related personnel and consultants’ salaries, benefits and related costs, including stock-based compensation. The Company expenses R&D costs as they are incurred.
The Company’s clinical trial accruals are based on estimates of patient enrollment and related costs at clinical investigator sites. The Company estimates preclinical and clinical trial expenses based on the services performed pursuant to contracts with research institutions and clinical research organizations that conduct and manage preclinical studies and clinical trials on its behalf. In accruing service fees, the Company estimates the time period over which services will be performed and the level of patient enrollment and activity expended in each period. If the actual timing of the performance of services or the level of effort varies from the estimate, the Company will adjust the accrual accordingly. Payments made to third parties under these arrangements in advance of the receipt of the related services are recorded as prepaid expenses until the services are rendered.
Advertising Costs
Advertising costs are included in sales, general and administrative expenses and are expensed as incurred. Advertising costs consist primarily of trade show and booth costs, product demonstration, and marketing materials. Advertising costs were
$0.5 million
,
$0.3 million
and
$0.1 million
for the years ended
December 31, 2015
,
2014
and
2013
, respectively.
Stock-Based Compensation
The Company recognizes the cost of stock-based compensation in the financial statements based upon fair value. The fair value of restricted stock and restricted stock unit (RSU) awards is determined based on the number of units granted and the
69
closing price of the Company’s common stock as of the grant date. The fair value of stock options is determined as of the grant date using the Black-Scholes option pricing model. The Company’s determination of the fair value of stock options is impacted by the price of the Company's common stock as well as changes in assumptions regarding a number of highly complex and subjective variables. These variables include, but are not limited to, the expected term that options will remain outstanding, expected common stock price volatility over the term of the option awards, risk-free interest rates and expected dividends.
The fair value of an option award is recognized over the period during which an optionee is required to provide services in exchange for the option award, known as the requisite service period (usually the vesting period) on a straight-line basis. Stock-based compensation expense recognized at fair value includes the impact of estimated forfeitures. The Company estimates future forfeitures at the date of grant and revises the estimates, if necessary, in subsequent periods if actual forfeitures differ from those estimates. To the extent actual forfeiture results differ from the estimates, the difference is recorded as a cumulative adjustment in the period forfeiture estimates are revised. No compensation cost is recorded for options that do not vest.
Equity instruments issued to non-employees are recorded at their fair value on the measurement date and are subject to periodic adjustments as the underlying equity instruments vest. The fair value of these equity instruments are expensed over the service period.
Estimates of the fair value of equity-settled awards as of the grant date using valuation models, such as the Black-Scholes option pricing model, are affected by assumptions regarding a number of complex variables. Changes in the assumptions can materially affect the fair value of the award and ultimately how much stock-based compensation expense is recognized. These inputs are subjective and generally require significant analysis and judgment to develop. For all stock options granted to date, the Company estimated the volatility data based on a study of publicly traded industry peer companies. For purposes of identifying these peer companies, the Company considered the industry, stage of development, size and financial leverage of potential comparable companies. The risk-free interest rate is based on the yield available on U.S. Treasury zero-coupon issues similar in duration to the expected term of the equity-settled award.
The Company uses the Staff Accounting Bulletin, No. 110 ( SAB 110) simplified method to calculate the expected term, which is the average of the contractual term and vesting period.
Income Taxes
The Company accounts for income taxes using the asset and liability method, whereby deferred tax asset and liability account balances are determined based on differences between the financial reporting and tax bases of assets and liabilities, and are measured using the enacted tax rates and laws that will be in effect when the differences are expected to reverse. The Company provides a valuation allowance to reduce the net deferred tax assets to their estimated realizable value.
The calculation of the Company’s current provision for income taxes involves the use of estimates, assumptions and judgments while taking into account current tax laws, interpretation of current tax laws and possible outcomes of future tax audits. The Company has established reserves to address potential exposures related to tax positions that could be challenged by tax authorities. Although the Company believes its estimates, assumptions and judgments to be reasonable, any changes in tax law or its interpretation of tax laws and the resolutions of potential tax audits could significantly impact the amounts provided for income taxes in the Company’s consolidated financial statements.
The calculation of the Company’s deferred tax asset balance involves the use of estimates, assumptions and judgments while taking into account estimates of the amounts and type of future taxable income. Actual future operating results and the underlying amount and type of income could differ materially from the Company’s estimates, assumptions and judgments thereby impacting the Company’s financial position and results of operations.
The Company follows the guidance relating to accounting for uncertainty in income taxes, which prescribes a recognition threshold and measurement attribute for the financial statement recognition and measurement of uncertain tax positions taken or expected to be taken in the Company’s income tax return, and also provides guidance on derecognition, classification, interest and penalties, accounting in interim periods and disclosure.
The Company includes interest and penalties related to unrecognized tax benefits within income tax expense in the accompanying consolidated statements of operations.
Comprehensive Income
The Company is required to display comprehensive income and its components as part of the Company’s consolidated financial statements. Comprehensive income consists of net income, unrealized gains or losses on available-for-sale investments and the effects of foreign currency translation.
70
Net Income (Loss) Per Share of Common Stock
The Company, for the periods prior to the closing of the IPO, calculated its basic and diluted net income (loss) per share attributable to common stockholders in conformity with the two-class method required for companies with participating securities. Under the two-class method, the Company determined whether it had net income (loss) attributable to common stockholders, which included the results of operations less current period preferred stock non-cumulative dividends. If it was determined that the Company did have net income (loss) attributable to common stockholders during a period, the related undistributed earnings were then allocated between common stock and the preferred stock based on the weighted average number of shares outstanding during the period to determine the numerator for the basic net income (loss) per share attributable to common stockholders. In computing diluted net income attributable to common stockholders, undistributed earnings were re-allocated to reflect the potential impact of dilutive securities to determine the numerator for the diluted net income per share attributable to common stockholders.
The Company’s basic net income (loss) per share attributable to common stockholders is calculated by dividing the net income (loss) by the weighted average number of shares of common stock outstanding for the period. The diluted net income per share attributable to common stockholders is computed by giving effect to all potential dilutive common stock equivalents outstanding for the period. For purposes of this calculation, options to purchase common stock, restricted stock, RSUs and common stock warrants are considered common stock equivalents.
Recently Issued Accounting Standards
In May 2014, the Financial Accounting Standards Board (FASB) issued ASU No. 2014-09,
Revenue from Contracts with Customers
, which outlines a comprehensive new revenue recognition model designed to depict the transfer of promised goods or services to customers in an amount that reflects the consideration to which the entity expects to be entitled in exchange for those goods or services. In August 2015, the FASB issued ASU No. 2015-14,
Revenue from Contracts with Customers
—
Deferral of the Effective Date
to defer the effective date by one year for annual reporting periods beginning after December 15, 2017, including interim reporting periods within that reporting period. Earlier adoption is permitted only as of annual reporting periods beginning after December 15, 2016, including interim reporting periods within that reporting period. The Company is currently evaluating the impact of this accounting standard.
In July 2015, the FASB issued ASU No. 2015-11,
Simplifying the Measurement of Inventory
, which requires an entity to measure most inventory at the lower of cost and net realizable value, thereby simplifying the current guidance under which an entity must measure inventory at the lower of cost or market. The accounting standard is effective prospectively for annual periods beginning after December 15, 2016, and interim periods therein. Early adoption is permitted as of the beginning of an interim or annual reporting period. The Company is currently evaluating the impact of this accounting standard.
In November 2015, the FASB issued ASU No. 2015-17,
Balance Sheet Classification of Deferred Taxes
, which requires that deferred tax assets and liabilities be classified as non-current in a classified statement of financial position. The accounting standard is effective, either prospectively to all deferred tax assets and liabilities or retrospectively to all periods presented, for annual periods beginning after December 15, 2016, and interim periods therein. Early adoption is permitted as of the beginning of an interim or annual reporting period. The Company early adopted this standard as of December 31, 2015 on a prospective basis.
In January 2016, the FASB issued ASU 2016-01,
Recognition and Measurement of Financial Assets and Financial Liabilities
, which
addresses certain aspects of recognition, measurement, presentation and disclosure of financial instruments
. The new standard is effective for annual periods and interim periods beginning after December 15, 2017, and upon adoption, an entity should apply the amendments by means of a cumulative-effect adjustment to the balance sheet at the beginning of the first reporting period in which the guidance is effective. Early adoption is not permitted except for the provision to record fair value changes for financial liabilities under the fair value option resulting from instrument-specific credit risk in other comprehensive income. The Company is currently evaluating the impact of adopting this guidance.
In February 2016, the FASB issued ASU 2016-02,
Leases
, which requires to recognize and measure leases at the beginning of the earliest period presented using a modified retrospective approach. The accounting standard is effective for fiscal years beginning after December 15, 2018, including interim periods within those fiscal years. Early adoption is permitted. The Company is currently evaluating the impact of adopting this guidance.
71
3. Initial Public Offering (IPO)
The Company closed its IPO on September 23, 2015, in which it sold
4.6 million
shares of common stock at an offering price of
$30.00
per share and raised
$124.7 million
in net proceeds after deducting underwriting discounts and commissions of
$9.7 million
and other offering expenses of
$3.6 million
.
Upon the closing of the IPO, all outstanding shares of convertible preferred stock of the Company were automatically converted into
19,510,410
shares of common stock on a
one
-for-one basis.
4. Fair Value of Financial Instruments
Fair value is defined as the price that would be received to sell an asset or paid to transfer a liability (an exit price) in an orderly transaction between market participants at the reporting date. The accounting guidance establishes a three-tiered hierarchy, which prioritizes the inputs used in the valuation methodologies in measuring fair value:
Level 1 - Quoted prices in active markets for identical assets or liabilities.
Level 2 - Inputs other than Level 1 that are observable, either directly or indirectly, such as quoted prices in markets that are not active; or other inputs that are observable or can be corroborated by observable market data for substantially the full term of the assets or liabilities.
Level 3 - Unobservable inputs that are supported by little or no market activity and that are significant to the fair value of the assets or liabilities.
The categorization of a financial instrument within the valuation hierarchy is based on the lowest level of input that is significant to the fair value measurement.
The Company classifies its cash equivalents and marketable investments within Level 1 and Level 2, as it uses quoted market prices or alternative pricing sources and models utilizing market observable inputs.
The Company determined the fair value of its Level 1 financial instruments, which are traded in active markets, using quoted market prices for identical instruments.
Marketable investments classified within Level 2 of the fair value hierarchy are valued based on other observable inputs, including broker or dealer quotations or alternative pricing sources. When quoted prices in active markets for identical assets or liabilities are not available, the Company relies on non-binding quotes from its investment managers, which are based on proprietary valuation models of independent pricing services. These models generally use inputs such as observable market data, quoted market prices for similar instruments, historical pricing trends of a security as relative to its peers and internal assumptions of the independent pricing services. To validate the fair value determination provided by its investment managers, the Company reviews the pricing movement in the context of overall market trends and trading information from its investment managers. In addition, the Company assesses the inputs and methods used in determining the fair value in order to determine the classification of securities in the fair value hierarchy.
The Company did not own any Level 3 financial assets or liabilities as of
December 31, 2015
or
2014
.
The Company did not have any financial assets and liabilities measured at fair value on a non-recurring basis as of
December 31, 2015
and
2014
.
During the years ended
December 31, 2015
,
2014
and
2013
, the Company did not record any impairment charges related to its marketable investments, and the Company did not have any transfers between Level 1, Level 2 and Level 3 of the fair value hierarchy.
72
The following tables set forth the Company’s financial assets and liabilities measured at fair value by level within the fair value hierarchy (in thousands):
|
|
As of December 31, 2015
|
|||||||||||||||
|
|
Level 1
|
Level 2
|
Level 3
|
Fair Value
|
||||||||||||
|
Financial Assets
|
||||||||||||||||
|
Cash equivalents:
|
||||||||||||||||
|
Commercial paper
|
$
|
—
|
|
$
|
9,850
|
|
$
|
—
|
|
$
|
9,850
|
|
||||
|
Money market funds
|
252
|
|
—
|
|
—
|
|
252
|
|
||||||||
|
Marketable investments:
|
||||||||||||||||
|
Commercial paper
|
—
|
|
22,332
|
|
—
|
|
22,332
|
|
||||||||
|
U.S. Treasury
|
15,436
|
|
—
|
|
—
|
|
15,436
|
|
||||||||
|
U.S. Agency securities
|
—
|
|
21,464
|
|
—
|
|
21,464
|
|
||||||||
|
U.S. States and Municipalities
|
—
|
|
2,084
|
|
—
|
|
2,084
|
|
||||||||
|
Corporate bonds
|
—
|
|
61,002
|
|
—
|
|
61,002
|
|
||||||||
|
Non-U.S. Government debt securities
|
—
|
|
6,939
|
|
—
|
|
6,939
|
|
||||||||
|
Total
|
$
|
15,688
|
|
$
|
123,671
|
|
$
|
—
|
|
$
|
139,359
|
|
||||
|
|
As of December 31, 2014
|
|||||||||||||||
|
|
Level 1
|
Level 2
|
Level 3
|
Fair Value
|
||||||||||||
|
Financial Assets
|
||||||||||||||||
|
Cash equivalents:
|
||||||||||||||||
|
Money market funds
|
$
|
155
|
|
$
|
—
|
|
$
|
—
|
|
$
|
155
|
|
||||
|
Marketable investments:
|
||||||||||||||||
|
Mutual funds
|
8,619
|
|
—
|
|
—
|
|
8,619
|
|
||||||||
|
U.S. Treasury
|
4,009
|
|
—
|
|
—
|
|
4,009
|
|
||||||||
|
U.S. Agency securities
|
—
|
|
6,006
|
|
—
|
|
6,006
|
|
||||||||
|
Corporate bonds
|
—
|
|
29,619
|
|
—
|
|
29,619
|
|
||||||||
|
Total
|
$
|
12,783
|
|
$
|
35,625
|
|
$
|
—
|
|
$
|
48,408
|
|
||||
5. Balance Sheet Components
Accounts Receivable, Net
The Company’s allowance for doubtful accounts comprised of the following (in thousands):
|
Balance At
Beginning Of Year |
Charged To
Costs And Expenses |
Deductions
|
Balance At
End Of Year |
|||||||||||||
|
For the year ended:
|
||||||||||||||||
|
December 31, 2013
|
$
|
212
|
|
$
|
259
|
|
$
|
—
|
|
$
|
471
|
|
||||
|
December 31, 2014
|
471
|
|
150
|
|
(19
|
)
|
602
|
|
||||||||
|
December 31, 2015
|
602
|
|
(13
|
)
|
—
|
|
589
|
|
||||||||
73
Prepaid Expenses and Other Current Assets
The Company’s prepaid expenses and other current assets comprised of the following (in thousands):
|
|
December 31,
|
|||||||
|
2015
|
2014
|
|||||||
|
Prepaid expenses
|
$
|
7,442
|
|
$
|
3,130
|
|
||
|
Income tax receivable
|
606
|
|
1,654
|
|
||||
|
Other current assets
|
1,304
|
|
331
|
|
||||
|
Prepaid expenses and other current assets
|
$
|
9,352
|
|
$
|
5,115
|
|
||
Marketable Investments
The Company’s marketable investments as of
December 31, 2015
and
2014
were as follows (in thousands):
|
December 31, 2015
|
||||||||||||||||
|
Cost
|
Gross
Unrealized
Gains
|
Gross
Unrealized
Losses
|
Fair Value
|
|||||||||||||
|
Commercial paper
|
$
|
22,328
|
|
$
|
5
|
|
$
|
(1
|
)
|
$
|
22,332
|
|
||||
|
U.S. Treasury
|
15,459
|
|
4
|
|
(27
|
)
|
15,436
|
|
||||||||
|
U.S. Agency securities
|
21,497
|
|
1
|
|
(34
|
)
|
21,464
|
|
||||||||
|
U.S. States and Municipalities
|
2,086
|
|
—
|
|
(2
|
)
|
2,084
|
|
||||||||
|
Corporate bonds
|
61,188
|
|
3
|
|
(189
|
)
|
61,002
|
|
||||||||
|
Non-U.S. Government debt securities
|
6,954
|
|
1
|
|
(16
|
)
|
6,939
|
|
||||||||
|
Total
|
$
|
129,512
|
|
$
|
14
|
|
$
|
(269
|
)
|
$
|
129,257
|
|
||||
|
December 31, 2014
|
||||||||||||||||
|
Cost
|
Gross
Unrealized
Gains
|
Gross
Unrealized
Losses
|
Fair Value
|
|||||||||||||
|
U.S. Agency securities
|
$
|
6,012
|
|
$
|
3
|
|
$
|
(9
|
)
|
$
|
6,006
|
|
||||
|
U.S. Treasury
|
4,011
|
|
—
|
|
(2
|
)
|
4,009
|
|
||||||||
|
Corporate bonds
|
29,834
|
|
4
|
|
(219
|
)
|
29,619
|
|
||||||||
|
Mutual funds
|
8,768
|
|
—
|
|
(149
|
)
|
8,619
|
|
||||||||
|
Total
|
$
|
48,625
|
|
$
|
7
|
|
$
|
(379
|
)
|
$
|
48,253
|
|
||||
74
The following tables present the gross unrealized losses and the fair value for those marketable investments that were in an unrealized loss position for less than twelve months as of
December 31, 2015
and
2014
(in thousands):
|
December 31, 2015
|
||||||||
|
Fair Value
|
Gross Unrealized Losses
|
|||||||
|
Commercial paper
|
$
|
4,746
|
|
$
|
(1
|
)
|
||
|
US Treasury
|
12,453
|
|
(27
|
)
|
||||
|
US Agency securities
|
13,475
|
|
(34
|
)
|
||||
|
US States and Municipalities
|
2,084
|
|
(2
|
)
|
||||
|
Corporate bonds
|
59,163
|
|
(189
|
)
|
||||
|
Non-U.S. government debt securities
|
5,881
|
|
(16
|
)
|
||||
|
Total
|
$
|
97,802
|
|
$
|
(269
|
)
|
||
|
December 31, 2014
|
||||||||
|
Fair Value
|
Gross Unrealized Losses
|
|||||||
|
Mutual Funds
|
$
|
8,619
|
|
$
|
(149
|
)
|
||
|
US Treasury
|
3,008
|
|
(2
|
)
|
||||
|
US Agency Securities
|
5,255
|
|
(9
|
)
|
||||
|
Corporate Bonds
|
26,633
|
|
(219
|
)
|
||||
|
Total
|
$
|
43,515
|
|
$
|
(379
|
)
|
||
As of
December 31, 2015
and
2014
, there were
no
securities that had been in a loss position for more than twelve months.
The contractual maturities of the Company’s marketable investments as of
December 31, 2015
and
2014
were as follows (in thousands):
|
|
December 31,
|
|||||||
|
2015
|
2014
|
|||||||
|
Marketable Investments
|
Fair Value
|
Fair Value
|
||||||
|
Due in one year
|
$
|
62,983
|
|
$
|
16,442
|
|
||
|
Due in one to five years
|
66,274
|
|
31,811
|
|
||||
|
Total
|
$
|
129,257
|
|
$
|
48,253
|
|
||
Inventories
The components of inventories consisted of the following (in thousands):
|
December 31,
|
||||||||
|
2015
|
2014
|
|||||||
|
Raw materials
|
$
|
9,176
|
|
$
|
5,105
|
|
||
|
Work in process
|
2,746
|
|
543
|
|
||||
|
Finished goods
|
44,839
|
|
27,803
|
|
||||
|
Inventories
|
$
|
56,761
|
|
$
|
33,451
|
|
||
75
Property and Equipment, Net
Property and equipment, net consisted of the following (in thousands):
|
December 31,
|
||||||||
|
2015
|
2014
|
|||||||
|
Machinery and equipment
|
$
|
8,559
|
|
$
|
5,089
|
|
||
|
Furniture and fixtures
|
2,091
|
|
519
|
|
||||
|
Leasehold improvements
|
1,564
|
|
379
|
|
||||
|
Software
|
666
|
|
599
|
|
||||
|
Computers
|
565
|
|
153
|
|
||||
|
Construction in progress
|
577
|
|
1,931
|
|
||||
|
Total property and equipment
|
14,022
|
|
8,670
|
|
||||
|
Less: Accumulated depreciation and amortization
|
(5,071
|
)
|
(3,489
|
)
|
||||
|
Property and equipment, net
|
$
|
8,951
|
|
$
|
5,181
|
|
||
Depreciation and amortization expense was
$1.8 million
,
$0.8 million
and
$0.7 million
for the years ended
December 31, 2015
,
2014
and
2013
, respectively.
Accrued Liabilities
The following table shows the components of accrued liabilities (in thousands):
|
December 31,
|
||||||||
|
2015
|
2014
|
|||||||
|
Payroll and employee-related expenses
|
$
|
13,653
|
|
$
|
8,221
|
|
||
|
Sales return reserve
|
3,247
|
|
2,164
|
|
||||
|
Preclinical and clinical trial cost
|
1,330
|
|
2,319
|
|
||||
|
Deferred revenue
|
526
|
|
1,591
|
|
||||
|
Product warranty
|
713
|
|
314
|
|
||||
|
Sales tax payable
|
531
|
|
306
|
|
||||
|
Income tax payable
|
308
|
|
332
|
|
||||
|
Other accrued liabilities
|
5,273
|
|
3,228
|
|
||||
|
Total accrued liabilities
|
$
|
25,581
|
|
$
|
18,475
|
|
||
The estimated product warranty accrual was as follows (in thousands):
|
December 31,
|
||||||||||||
|
2015
|
2014
|
2013
|
||||||||||
|
Balance at the beginning of the year
|
$
|
314
|
|
$
|
323
|
|
$
|
323
|
|
|||
|
Accruals of warranties issued
|
752
|
|
149
|
|
100
|
|
||||||
|
Settlements of warranty claims
|
(353
|
)
|
(158
|
)
|
(100
|
)
|
||||||
|
Balance at the end of the year
|
$
|
713
|
|
$
|
314
|
|
$
|
323
|
|
|||
6. Credit Facility
In May 2012, the Company entered into a revolving credit facility of
$15.0 million
with Wells Fargo Bank, National Association. The credit facility was collateralized by the Company’s investment balances. The interest on the credit facility was based on the daily one-month London Inter-Bank Offered Rate, plus
1.75%
and was payable monthly. The credit facility contained customary covenants for credit facilities of this type, including limitations on disposition of assets and changes in control. In May 2014, in conjunction with its Series F preferred stock financing, the Company paid the then outstanding balance on the credit facility and terminated the credit facility.
76
7. Related Party Transactions
Notes Receivable from Stockholders
In March 2005, options to purchase
250,000
shares of common stock, subject to repurchase by the Company, were exercised in exchange for a full recourse promissory note totaling
$21,250
. The note bore interest at
2.92%
per year, compounded annually. The Company received the amount due including interest under the promissory note in the fourth quarter of
2015
.
In July 2011, options to purchase
5,000
shares of common stock were exercised in exchange for a full recourse promissory note totaling
$4,600
. The note is noninterest bearing and is due in full on December 31, 2016.
As of
December 31, 2015
and
2014
, the amounts due under outstanding promissory notes were
$4,600
and
$0.1 million
, respectively.
8. Commitments and Contingencies
Lease Commitments
The Company leases its offices and other equipment under non-cancelable operating leases that expire at various dates from 2029 to
2031
. In December 2015, the Company entered into a lease agreement (the Lease) relating to the lease of additional office, research and development and manufacturing space at the campus where the Company’s headquarters is located in Alameda, California. Pursuant to the Lease, the Company agreed to lease
99,968
square feet of space (plus an additional space of
15,882
square feet
that may be delivered to the Company at the landlord’s option prior to May 1, 2016
).
From time to time during the
ten
year period following the initial commencement date of the new lease, if any space in any of the buildings located in the same business park as our campus becomes vacant, that space will be added to the lease at the then current base monthly rental rate. The maximum additional space that could be added under this provision of the lease is
117,325
square feet. The Company has a right of first offer to lease any space that becomes available after the expiration of the
ten
year period following the initial commencement date, subject to the terms described in the new lease.
The term of the lease expires after
15
years from the initial lease commencement date, subject to the Company’s option to renew the lease for up to
three
additional
five
-year periods.
The table below does not include the Company
’s
potential obligation for the additional space(s) that may be added to the lease by the landlord.
Rent expense for the years ended
December 31, 2015
,
2014
, and
2013
was
$3.2 million
,
$1.8 million
and
$1.7 million
, respectively.
Future minimum lease payments under the non-cancelable operating leases as of
December 31, 2015
are as follows (in thousands):
|
Lease Payments
|
|||
|
Year Ending December 31:
|
|||
|
2016
|
$
|
4,055
|
|
|
2017
|
4,861
|
|
|
|
2018
|
4,877
|
|
|
|
2019
|
5,007
|
|
|
|
2020
|
5,133
|
|
|
|
Thereafter
|
52,555
|
|
|
|
Total future minimum lease payments
|
$
|
76,488
|
|
Purchase Commitments
The Company had non-cancellable purchase obligations to suppliers at
December 31, 2015
of
$11.8 million
.
Royalty Obligations
In March 2005, the Company entered into a license agreement that requires the Company to make minimum royalty payments to the licensor, on a quarterly basis. As of
December 31, 2015
and
2014
, the license agreement requires minimum annual royalty payments of
$0.1 million
and
$0.1 million
in equal quarterly installments, respectively. On each January 1, the
77
quarterly calendar year minimum royalty shall be adjusted to equal the prior year’s minimum royalty adjusted by a percentage equal to the percentage change in the “consumer price index for all urban consumers” for the prior calendar year as reported by the U.S. Department of Labor. Unless terminated earlier, the term of the license agreement shall continue until the expiration of the last to expire patent that covers that licensed product or for the period of
15
years following the first commercial sale of such licensed product, whichever is longer. The first commercial sale of covered products occurred in June 2007.
In April 2012, the Company entered into an agreement that requires the Company to pay a
5%
royalty on sales of products covered under applicable patents, on a quarterly basis. The first commercial sale of covered products occurred in April 2014. Unless terminated earlier, the royalty term for each applicable product shall continue for
15
years following the first commercial sale of such patented product, or when the applicable patent covering such product has expired, whichever is sooner.
In April 2015, the Company entered into a royalty agreement that requires the Company to pay a
2%
royalty on sales of certain products covered by the agreement, on a quarterly basis. The Company began the first commercial sale of the covered products in July 2015. Unless terminated earlier, the royalty term for each covered product shall continue for
20
years following the first commercial sale of the covered products.
Royalty expense included in cost of sales for the years ended
December 31, 2015
,
2014
and
2013
was
$2.0 million
,
$1.1 million
and
$0.7 million
, respectively.
Contingencies
From time to time, the Company may have certain contingent liabilities that arise in the ordinary course of business. The Company accrues a liability for such matters when it is probable that future expenditures will be made and such expenditures can be reasonably estimated.
Indemnification
The Company enters into standard indemnification arrangements in the ordinary course of business. Pursuant to these arrangements, the Company indemnifies, holds harmless, and agrees to reimburse the indemnified parties for losses suffered or incurred by the indemnified party, in connection with any trade secret, copyright, patent or other intellectual property infringement claim by any third-party with respect to the Company’s technology. The term of these indemnification agreements is generally perpetual. The maximum potential amount of future payments the Company could be required to make under these agreements is not determinable because it involves claims that may be made against the Company in the future, but have not yet been made.
The Company has entered into indemnification agreements with its directors and officers that may require the Company to indemnify its directors and officers against liabilities that may arise by reason of their status or service as directors or officers, other than liabilities arising from willful misconduct of the individual.
The Company has not incurred costs to defend lawsuits or settle claims related to these indemnification agreements. No liability associated with such indemnifications has been recorded to date.
Litigation
The Company was contacted in 2015 by the attorney for a potential product liability claimant who allegedly suffered injuries as a result of aneurysm procedure in which the Penumbra Coil 400 was used. On February 19, 2016, a complaint for damages was filed on behalf of this claimant against Penumbra and the hospital involved in the procedure
(
Montgomery v. Penumbra, Inc., et al.,
Case No. 16-2-04050-1 SEA, Superior Court of the State of Washington, King County)
. The suit alleges liability primarily under the Washington Product Liability Act and seeks both compensatory and punitive damages without a specific damages claim. Counsel for the claimant previously indicated that he expects that a jury could award
$35 million
in damages were this matter to go to trial. This amount is substantially in excess of the Company’s insurance coverage.
The hospital defendant has requested indemnification from Penumbra.
As the litigation has been filed recently and the parties have not engaged in formal discovery, the Company is unable to assess the merits of the plaintiff’s case. The Company intends to vigorously defend the litigation, as the Company believes there will be substantial questions regarding causation, liability and damages.
From time to time, the Company is subject to claims and assessments in the ordinary course of business. The Company is not currently a party to any litigation matter that, individually or in the aggregate, is expected to have a material adverse effect on the Company’s business, financial condition, results of operations or cash flows.
78
9. Convertible Preferred Stock
The convertible preferred stock at
December 31, 2014
consisted of the following (in thousands, except shares):
|
Series
|
Shares
Authorized
|
Shares Issued
and
Outstanding
|
Proceeds,
Net of Issuance
Costs
|
Aggregate
Liquidation
Amount
|
||||||||||
|
Series A Preferred Stock
|
1,000,000
|
|
1,000,000
|
|
$
|
299
|
|
$
|
554
|
|
||||
|
Series B Preferred Stock
|
4,287,486
|
|
4,005,338
|
|
6,536
|
|
11,725
|
|
||||||
|
Series C Preferred Stock
|
4,388,715
|
|
4,168,218
|
|
13,266
|
|
22,238
|
|
||||||
|
Series D Preferred Stock
|
3,944,733
|
|
3,881,459
|
|
19,647
|
|
30,976
|
|
||||||
|
Series E Preferred Stock
|
1,973,684
|
|
1,909,940
|
|
14,507
|
|
21,609
|
|
||||||
|
Series F Preferred Stock
|
5,303,031
|
|
4,545,455
|
|
57,212
|
|
62,259
|
|
||||||
|
Undesignated
|
4,102,351
|
|
—
|
|
—
|
|
—
|
|
||||||
|
Total convertible preferred stock
|
25,000,000
|
|
19,510,410
|
|
$
|
111,467
|
|
$
|
149,361
|
|
||||
Upon the closing of the IPO on September 23, 2015, all outstanding shares of convertible preferred stock were automatically converted into
19,510,410
shares of common stock on a
one
-for-one basis and the related balance was reclassified from temporary equity to common stock and additional paid-in capital.
10. Common Stock
Each share of common stock is entitled to
one
vote. The holders of common stock are also entitled to receive dividends whenever funds are legally available and when declared by the board of directors, subject to the prior rights of holders of all classes of stock outstanding.
11. Warrants
In connection with the sale of Series B preferred stock in 2004, the Company issued warrants to purchase
211,138
shares of common stock at a purchase price of
$0.01
per share. The warrants were exercisable upon grant and had a term of
10
years from the date of grant, which expired on
December 31, 2014
. The value of the warrants was calculated using Black-Scholes option pricing model and was deemed to be immaterial.
No
warrants were outstanding as of
December 31, 2015
or
2014
.
12. Stock Option Plans
2005 Stock Plan
The Company adopted the Penumbra, Inc. 2005 Stock Plan (the 2005 Plan) in January 2005. The 2005 Plan was subsequently amended and restated in 2006, 2007, 2008 and 2010. As of
December 31, 2015
and
2014
, the Company had granted options to purchase
5,431,017
and
5,431,017
shares of common stock, respectively, under the 2005 Plan, of which options to purchase
1,757,282
and
2,707,176
shares of common stock were outstanding, and options to purchase
12,339
and
33,081
shares of common stock had been early exercised and were unvested and subject to repurchase, as of
December 31, 2015
and
2014
, respectively. Under the 2005 Plan, the board of directors could grant incentive stock options (ISO
s
), nonqualified stock options (NSOs), and/or stock awards to eligible persons, including employees, nonemployees, directors, consultants and other independent advisors who provide services to the Company. Stock purchase rights could also be granted under the 2005 Plan. The board of directors had the authority to determine to whom options would be granted, the number of options, the term and the exercise price. ISOs could only be granted to Company employees, which include officers and directors of the Company. NSOs and stock purchase rights could be granted to employees and consultants. For individuals holding more than
10%
of the voting rights of all classes of stock, the exercise price for an ISO could not be less than
110%
of fair market value. Options granted under the 2005 Plan permitted an optionee to exercise options immediately upon grant irrespective of the vesting term. Options generally vest annually at a rate of 1/4 after the first year and 1/48 per month thereafter. The term of the options is no longer than
five
years for ISOs, for which the grantee owns greater than
10%
of the voting power of all classes of stock and no longer than
10
years for all other options.
79
2011 Equity Incentive Plan
The Company adopted the Penumbra, Inc. 2011 Equity Incentive Plan (the 2011 Plan) in October 2011. As of
December 31, 2015
and
2014
, the Company had granted options to purchase
145,000
and
145,000
shares of common stock, respectively, under the 2011 Plan, of which options to purchase
145,000
and
145,000
shares of common stock were outstanding at
December 31, 2015
and
2014
, respectively. As of
December 31, 2015
and
2014
, the Company had granted
505,000
and
505,000
shares of restricted stock under the 2011 Plan, of which
249,125
and
367,126
shares were unvested and subject to forfeiture and
4,667
and
1,667
shares had been forfeited as of
December 31, 2015
and
2014
, respectively. Under the 2011 Plan, the board of directors could grant ISOs, NSOs, restricted stock, and/or RSUs to eligible persons, including employees, directors and consultants who provide services to the Company. Stock Appreciation Rights (SAR) could also be granted under the 2011 Plan. The board of directors had the authority to determine to whom options would be granted, the number of options, the term and the exercise price. ISOs could only be granted to Company employees, which include officers and directors of the Company. NSOs, SARs, restricted stock and RSUs could be granted to employees and consultants. For individuals holding more than
10%
of the voting rights of all classes of stock, the exercise price for an ISO could not be less than
110%
of fair market value. Stock options granted under the 2011 Plan generally have a contractual life of
ten
years, and generally vest over a period of
four
years.
Amended and Restated 2014 Equity Incentive Plan
The Company adopted the Penumbra, Inc. 2014 Equity Incentive Plan in May 2014.
The plan was amended and restated as of September 17, 2015 (as amended and restated, the 2014 Plan).
The 2014 Plan replaced the 2011 Plan and the 2005 Plan and no further equity awards may be granted under the 2011 Plan or the 2005 Plan. Under the 2014 Plan,
3,000,000
shares of common stock were reserved for issuance, of which as of
December 31, 2015
,
597,730
shares of common stock were available for grant. As of
December 31, 2015
and
2014
, the Company had granted options to purchase
1,857,900
and
48,500
shares of common stock under the 2014 Plan,
1,853,063
and
48,500
of which were outstanding and
4,421
and
1,000
of which had been forfeited as of
December 31, 2015
and
2014
, respectively. The Company had granted
673,361
and
0
shares of restricted stock under the 2014 Plan, as of
December 31, 2015
and
2014
, respectively, of which
508,646
and
0
shares were unvested and subject to forfeiture as of such dates. The Company had granted
91,800
and
0
shares of RSU under the 2014 Plan, as of
December 31, 2015
and
2014
, respectively, of which
91,800
and
0
shares were unvested and subject to forfeiture as of such dates.
Employee Stock Purchase Plan
The Penumbra, Inc. Employee Stock Purchase Plan (the ESPP
)
, became effective on September 17, 2015. The ESPP initially reserved
600,000
shares of common stock for purchase under the ESPP,
with the number of shares reserved for purchase automatically increasing each year pursuant to an “evergreen” provision set forth in the ESPP.
All qualifying employees of the Company and its designated subsidiaries are eligible to participate in the ESPP. Each offering to the Company’s employees to purchase stock under the ESPP will begin on each May 20 and November 20 and will end on the following November 19 and May 19, respectively, each referred to as offering periods, except that the first offering period under the ESPP began on September 17, 2015 and will end on May 19, 2016. Under the ESPP, each employee may purchase shares by authorizing payroll deductions at a minimum of
1%
and up to
15%
of his or her eligible compensation for each pay period during the offering period. Unless the participating employee withdraws from the offering, his or her accumulated payroll deductions will be used to purchase the Company’s common stock on the last business day of the offering period at a price equal to
85%
of the fair market value of the common stock on either the first or the last day of the offering period, whichever is lower, provided that no more than
2,000
shares of the Company’s common stock or such other lesser maximum number established by the ESPP administrator may be purchased by any one employee during each offering period. Under applicable tax rules, an employee may purchase no more than
$25,000
worth of common stock, valued at the start of the purchase period (corresponding to an offering period), under the ESPP in any calendar year.
80
Early Exercises
Stock options granted under the 2005 Plan, 2011 Plan and 2014 Plan allow the board of directors to grant awards to provide employee option holders the right to elect to exercise unvested options in exchange for restricted common stock. Unvested shares, which amounted to
12,339
and
33,081
as of
December 31, 2015
and
2014
, respectively, were subject to a repurchase right held by the Company at the original issue price in the event the optionees’ employment was terminated either voluntarily or involuntarily. For exercises of employee options, this right lapses according to the vesting schedule designated on the associated option grant. The repurchase terms are considered to be a forfeiture provision. The shares purchased by the employees pursuant to the early exercise of stock options are not deemed to be issued or outstanding for accounting purposes until those shares vest, though they are legally issued and outstanding. In addition, cash received from employees for exercise of unvested options is treated as a refundable deposit shown as a liability on the consolidated balance sheets. As of
December 31, 2015
and
2014
, cash received related to unvested shares totaled
$0.1 million
and
$0.2 million
, respectively. Amounts recorded are transferred into common stock and additional paid-in-capital as the shares vest.
Activity of stock options under 2005 Plan, 2011 Plan and 2014 Plan is set forth below:
|
Number
of Shares
|
Weighted
Average
Exercise
Price
|
Weighted Average Remaining Contractual Life (in Years)
|
Aggregate Intrinsic Value (in thousands)
|
||||||||||
|
Balance, December 31, 2014
|
2,900,676
|
|
$
|
2.66
|
|
||||||||
|
Granted
|
1,809,400
|
|
21.47
|
|
|||||||||
|
Exercised
|
(948,872
|
)
|
0.99
|
|
|||||||||
|
Canceled/Forfeited
|
(5,859
|
)
|
11.15
|
|
|||||||||
|
Balance, December 31, 2015
|
3,755,345
|
|
$
|
12.13
|
|
||||||||
|
Vested and expected to vest—December 31, 2015
|
3,621,919
|
|
$
|
11.79
|
|
6.70
|
$
|
152,187
|
|
||||
|
Exercisable—December 31, 2015
|
1,941,150
|
|
$
|
3.47
|
|
4.20
|
$
|
97,717
|
|
||||
The Company uses the Black-Scholes option pricing model to determine the fair value of stock options. The valuation model for stock compensation expense requires the Company to make assumptions and judgments about the variables used in the calculation including the expected term (weighted average period of time that the options granted are expected to be outstanding); volatility of the Company’s common stock and an assumed-risk-free interest rate.
The Company used the following assumptions in its Black-Scholes option pricing model to determine the fair value of stock options:
|
Year Ended December 31,
|
||||||
|
2015
|
2014
|
2013
|
||||
|
Expected term (in years)
|
6.08—6.25
|
6.25
|
6.25
|
|||
|
Expected volatility
|
45%
|
45%
|
45%
|
|||
|
Risk-free interest rate
|
1.56%—1.78%
|
1.76%—2.02%
|
0.63%—0.90%
|
|||
|
Expected dividend rate
|
0%
|
0%
|
0%
|
|||
Fair Value of Common Stock.
Prior to the IPO, the fair value of the shares of common stock underlying the Company's stock options was determined by the Company’s board of directors. Because there was no public market for the Company’s common stock and in the absence of recent arm’s-length cash sales transactions of the Company’s common stock with independent third parties, the Company’s board of directors determined the fair value of the Company’s common stock by considering at the time of grant a number of objective and subjective factors. The intent of the Company’s board of directors was for all options granted to be exercisable at a price per share not less than the per share fair value of the Company’s common stock underlying those options on the date of grant. The estimated fair value of the Company’s common stock was determined at each valuation date in accordance with the guidelines outlined in the American Institute of Certified Public Accountants Practice Aid, Valuation of Privately-Held-Company Equity Securities Issued as Compensation. The Company’s board of directors, with the assistance of management, developed these valuations using significant judgement and taking into account numerous factors, including the following:
|
•
|
independent third-party valuations;
|
81
|
•
|
progress of research and development activities;
|
|
•
|
the
Company’s
operating and financial performance, including its levels of available capital resources;
|
|
•
|
rights and preferences of the
Company’s
common stock compared to the rights and preferences of the
Company’s
other outstanding equity securities;
|
|
•
|
equity market conditions affecting comparable public companies, as reflected in comparable companies’ market multiples, IPO valuations and other metrics;
|
|
•
|
the achievement of enterprise milestones, including the
Company’s
progress in clinical trials;
|
|
•
|
the likelihood of achieving a liquidity event for the shares of common stock, such as an IPO given prevailing market and medical device sector conditions;
|
|
•
|
sales of the
Company’s
preferred stock in arms-length transactions;
|
|
•
|
the illiquidity of the
Company’s
securities by virtue of being a private company;
|
|
•
|
business risks; and
|
|
•
|
management and board experience.
|
The Company considered the following approaches in the preparation of its valuations:
|
•
|
Market Approach.
The market approach values a business by reference to guideline companies, for which enterprise values are known. This approach has two principal methodologies. The guideline public company methodology derives valuation multiples from the operating data and share prices of similar publicly traded companies. The guideline acquisition methodology focuses on comparisons between the subject company and guideline acquired public or private companies.
|
|
•
|
Option-Pricing Method Backsolve (OPM backsolve).
The OPM backsolve method derives the implied equity value for a company from a recent transaction involving the
Company’s
own securities issued on an arms-length basis.
|
|
•
|
Probability Weighted Expected Return Method (PWERM)
. Using the PWERM method, the value of a company’s common stock is estimated based upon the analysis of future values for the company assuming various possible future liquidity events like an initial public offering, sale or merger. Share value is based upon the probability-weighted present value of expected future net cash flows, considering each of the possible future events, as well as the rights and preferences of each share class.
|
In addition, the Company also considered an enterprise value allocation method:
|
•
|
Option-Pricing Method (OPM)
. Under the OPM method, each class of stock is modeled as a call option with a distinct claim on the enterprise value of the company. The option’s exercise prices would be based on a comparison with the enterprise value. The method assumes that a formula, such as the Black-Scholes model, would calculate the fair value when provided with certain values, including share price, expiration date, volatility and the risk free interest rate.
|
The per share common stock value was estimated by allocating the Company’s enterprise value using the OPM method on October 1, 2013, May 16, 2014, and September 30, 2014, which determined the common value to be $
7.75
, $
9.06
and $
10.92
, respectively. The per share common stock value was estimated in December 31, 2014, March 31, 2015, June 30, 2015 and July 31, 2015, which utilized the PWERM method, which determined the common stock value to be $
12.36
, $
14.46
, $
20.51
and $
22.04
, respectively.
In determining the estimated fair value of the common stock, the Company’s board of directors also considered the fact that the Company’s stockholders could not freely trade the Company’s common stock in the public markets. Accordingly, the Company applied discounts to reflect the lack of marketability of its common stock based on the expected time to liquidity. The estimated fair value of the Company’s common stock at each grant date reflected a non-marketability discount partially based on the anticipated likelihood and timing of a future liquidity event.
The key subjective factors and assumptions used in the Company’s valuations primarily consisted of: (i) the selection of the appropriate market comparable transactions, (ii) the selection of the appropriate comparable publicly traded companies, (iii) the financial forecasts utilized to determine future cash balances and necessary capital requirements, (iv) the probability and timing of the various possible liquidity events, (v) the estimated weighted-average cost of capital and (vi) the discount for lack of marketability of the Company’s common stock.
82
At each grant date the board of directors reviewed any recent events and their potential impact on the estimated fair value per share of the common stock.
Weighted Average Expected Term.
The Company derived the expected term using the “simplified” method (the expected term is determined as the average of the time-to-vesting and the contractual life of the options), as the Company had limited historical information to develop expectations about future exercise patterns and post vesting employment termination behavior.
Volatility.
Since there has been no public market for the Company’s common stock and lack of company-specific historical volatility, it has determined the share price volatility for options granted based on an analysis of the volatility used by a peer group of publicly traded medical device companies. In evaluating similarity, the Company considers factors such as industry, stage of life cycle and size.
Risk-Free Interest Rate.
The risk-free interest rate is based upon U.S. Treasury zero-coupon issues with remaining terms similar to the expected term of the options.
Dividend Yield.
The Company has never paid any dividends and does not plan to pay dividends in the foreseeable future, and therefore, used an expected dividend yield of zero in the valuation model.
Forfeitures.
The Company is required to estimate forfeitures at the time of grant, and revise those estimates in subsequent periods if actual forfeitures differ from those estimates. The Company uses historical data to estimate pre-vesting option forfeitures and record stock based compensation expense only for those awards that are expected to vest. To the extent actual forfeitures differ from the estimates, the difference will be recorded as a cumulative adjustment in the period that the estimates are revised.
The total intrinsic value of stock options exercised during the year ended
December 31, 2015
,
2014
and
2013
was
$13.1 million
,
$3.8 million
and
$0.3 million
, respectively. The intrinsic value is calculated as the difference between the estimated fair value of the Company’s common stock at the exercise date and the exercise price of the stock option.
The weighted average grant date fair value of the employee stock options was
$9.69
,
$3.69
and
$2.63
per share during the years ended
December 31, 2015
,
2014
and
2013
, respectively.
The following table summarizes the activity of unvested restricted stock and RSUs:
|
Number
of Shares
|
Weighted Average
Grant Date
Fair Value
|
||||||
|
Unvested at December 31, 2014
|
367,126
|
|
$
|
7.26
|
|
||
|
Granted
|
765,161
|
|
17.70
|
|
|||
|
Vested
|
(279,716
|
)
|
11.93
|
|
|||
|
Canceled/Forfeited
|
(3,000
|
)
|
7.75
|
|
|||
|
Unvested at December 31, 2015
|
849,571
|
|
15.12
|
|
|||
As of
December 31, 2015
, total unrecognized compensation cost was
$27.2 million
related to unvested share-based compensation arrangements which is expected to be recognized over a weighted average period of
2.1
years.
The total stock-based compensation cost capitalized in inventory was
$0.3 million
as of
December 31, 2015
. The total stock-based compensation cost capitalized in inventory was insignificant as of
December 31, 2014
and
2013
.
The following table sets forth the stock-based compensation expense included in the consolidated statements of operations (in thousands):
|
|
Year Ended December 31,
|
|||||||||||
|
|
2015
|
2014
|
2013
|
|||||||||
|
Cost of sales
|
$
|
316
|
|
$
|
267
|
|
$
|
98
|
|
|||
|
Research and development
|
444
|
|
96
|
|
84
|
|
||||||
|
Sales, general and administrative
|
6,511
|
|
1,070
|
|
704
|
|
||||||
|
$
|
7,271
|
|
$
|
1,433
|
|
$
|
886
|
|
||||
83
13. Common and Preferred Stock Repurchase
The Company’s board of directors approved the repurchase of
70,612
shares of common stock,
45,000
stock options and
45,611
of preferred stock from shareholders in May 2014 for
$13.20
per share for a total purchase price of
$2.0 million
. For the repurchased shares of common stock and stock options, the Company charged the difference between the purchase and market prices of
$0.5 million
to expense. For the repurchased preferred shares, the excess between the purchase and the issuance price of
$0.5 million
was treated as a deemed dividend. In addition, the Company closed a tender offer in July 2014 to repurchase shares of preferred stock from existing shareholders at a purchase price of
$13.20
per share. The Company repurchased
584,052
shares of preferred stock for a total purchase price of
$7.7 million
. The excess between the purchase and the issuance price of
$5.8 million
was treated as a deemed dividend. The repurchased shares of common and preferred stock were retired and remained as authorized but unissued.
14. Accumulated Other Comprehensive Income
Other comprehensive income consists of two components: unrealized gains or losses on the Company's available-for-sale marketable investments, and gains or losses from foreign currency translation adjustments. Until realized and reported as a component of net income, these comprehensive income items accumulate and are included within accumulated other comprehensive income. Unrealized gains and losses on our marketable investments are reclassified from accumulated other comprehensive income into earnings when realized upon sale, and are determined based on specific identification of securities sold. Gains and losses from the translation of assets and liabilities denominated in non-U.S. dollar functional currencies are included in accumulated other comprehensive income.
The following table summarizes the changes in the accumulated balances during the period, and includes information regarding the manner in which the reclassifications out of accumulated other comprehensive income into earnings affect our consolidated statements of operations (in thousands):
|
Year Ended December 31, 2015
|
Year Ended December 31, 2014
|
|||||||||||||||||||||||
|
Marketable
Investments |
Currency Translation
Adjustments |
Total
|
Marketable
Investments |
Currency Translation
Adjustments |
Total
|
|||||||||||||||||||
|
Balance, beginning of the year
|
$
|
(220
|
)
|
$
|
(644
|
)
|
$
|
(864
|
)
|
$
|
17
|
|
$
|
779
|
|
$
|
796
|
|
||||||
|
Other comprehensive income before reclassifications:
|
||||||||||||||||||||||||
|
Unrealized gains (losses)—marketable investments
|
(417
|
)
|
—
|
|
(417
|
)
|
(388
|
)
|
—
|
|
(388
|
)
|
||||||||||||
|
Foreign currency translation gains (losses)
|
—
|
|
(1,425
|
)
|
(1,425
|
)
|
—
|
|
(1,668
|
)
|
(1,668
|
)
|
||||||||||||
|
Income tax effect—benefit (expense)
|
128
|
|
117
|
|
245
|
|
161
|
|
245
|
|
406
|
|
||||||||||||
|
Net of tax
|
(289
|
)
|
(1,308
|
)
|
(1,597
|
)
|
(227
|
)
|
(1,423
|
)
|
(1,650
|
)
|
||||||||||||
|
Amounts reclassified from accumulated other comprehensive income to earnings:
|
||||||||||||||||||||||||
|
Realized losses—marketable investments
|
540
|
|
—
|
|
540
|
|
(17
|
)
|
—
|
|
(17
|
)
|
||||||||||||
|
Income tax effect—benefit
|
(194
|
)
|
—
|
|
(194
|
)
|
7
|
|
—
|
|
7
|
|
||||||||||||
|
Net of tax
|
346
|
|
—
|
|
346
|
|
(10
|
)
|
—
|
|
(10
|
)
|
||||||||||||
|
Net current-year other comprehensive income (loss)
|
57
|
|
(1,308
|
)
|
(1,251
|
)
|
(237
|
)
|
(1,423
|
)
|
(1,660
|
)
|
||||||||||||
|
Balance, end of the year
|
$
|
(163
|
)
|
$
|
(1,952
|
)
|
$
|
(2,115
|
)
|
$
|
(220
|
)
|
$
|
(644
|
)
|
$
|
(864
|
)
|
||||||
15. Employee Benefit Plans
The Company offers a retirement savings plan under Section 401(k) of the Internal Revenue Code (IRC) to its eligible U.S. employees whereby they may contribute up to the maximum amount permitted by the IRC. In the third quarter of 2015, the Company began 401(k) matching of eligible compensation under the plan, subject to a maximum dollar threshold. Contribution expense was
$0.3 million
for the
year ended
December 31, 2015
.
16. Income Taxes
The Company’s income tax expense (benefit), deferred tax assets and liabilities, and reserves for unrecognized tax benefits reflect management's best assessment of estimated current and future taxes to be paid. The Company is subject to income taxes in both the
U. S.
and foreign jurisdictions. Significant judgments and estimates are required in determining the consolidated income tax expense (benefit).
84
The Company is incorporated in the
U. S.
and operates in various countries with differing tax laws and rates. A portion of the Company’s income or (loss) before taxes and the provision for (benefit from) income taxes are generated from international operations.
Income
or (loss) before income taxes for the years ended
December 31, 2015
,
2014
and
2013
is summarized as follows:
|
Year Ended December 31,
|
||||||||||||
|
2015
|
2014
|
2013
|
||||||||||
|
United States
|
$
|
2,955
|
|
$
|
2,230
|
|
$
|
(1,142
|
)
|
|||
|
Foreign
|
1,069
|
|
909
|
|
(113
|
)
|
||||||
|
Total income (loss) before provision for (benefit from) income taxes
|
$
|
4,024
|
|
$
|
3,139
|
|
$
|
(1,255
|
)
|
|||
Income tax provision in
2015
,
2014
and
2013
is comprised of federal, state, and foreign taxes.
The components of the provision for (benefit from) income taxes are summarized as follows:
|
Year Ended December 31,
|
||||||||||||
|
2015
|
2014
|
2013
|
||||||||||
|
Current:
|
||||||||||||
|
Federal
|
$
|
3,815
|
|
$
|
1,155
|
|
$
|
(155
|
)
|
|||
|
State
|
603
|
|
274
|
|
87
|
|
||||||
|
Foreign
|
492
|
|
323
|
|
—
|
|
||||||
|
Total current
|
4,910
|
|
1,752
|
|
(68
|
)
|
||||||
|
Deferred:
|
||||||||||||
|
Federal
|
(3,025
|
)
|
(625
|
)
|
(5,087
|
)
|
||||||
|
State
|
(251
|
)
|
(116
|
)
|
(199
|
)
|
||||||
|
Foreign
|
25
|
|
(117
|
)
|
—
|
|
||||||
|
Total deferred
|
(3,251
|
)
|
(858
|
)
|
(5,286
|
)
|
||||||
|
Provision for (benefit from) income taxes
|
$
|
1,659
|
|
$
|
894
|
|
$
|
(5,354
|
)
|
|||
The Company’s actual provision for tax differed from the amounts computed by applying the U.S. federal income tax rate of
34%
to pretax income as a result of the following:
|
Year Ended December 31,
|
|||||||||
|
2015
|
2014
|
2013
|
|||||||
|
Income tax at federal statutory rate
|
34.0
|
%
|
34.0
|
%
|
34.0
|
%
|
|||
|
State income taxes, net of federal benefit
|
1.9
|
|
3.2
|
|
(5.6
|
)
|
|||
|
Foreign taxes differential
|
(9.0
|
)
|
5.2
|
|
5.8
|
|
|||
|
Prepaid tax ASC 810-10
|
2.1
|
|
(8.9
|
)
|
(2.7
|
)
|
|||
|
Foreign exchange gains and losses
|
—
|
|
—
|
|
11.7
|
|
|||
|
IRC 199 deduction
|
(7.4
|
)
|
(7.0
|
)
|
—
|
|
|||
|
Stock-based compensation
|
14.8
|
|
6.0
|
|
(14.1
|
)
|
|||
|
Meals and entertainment
|
5.6
|
|
5.8
|
|
(10.7
|
)
|
|||
|
Imputed interest
|
4.7
|
|
6.6
|
|
(12.1
|
)
|
|||
|
Tax credits
|
(11.6
|
)
|
(12.1
|
)
|
41.8
|
|
|||
|
Other
|
3.6
|
|
2.8
|
|
0.3
|
|
|||
|
Change in valuation allowance
|
2.5
|
|
(7.1
|
)
|
378.2
|
|
|||
|
Effective tax rate
|
41.2
|
%
|
28.5
|
%
|
426.6
|
%
|
|||
85
Deferred income tax assets and liabilities consist of the following:
|
December 31,
|
||||||||
|
2015
|
2014
|
|||||||
|
Deferred tax assets
|
||||||||
|
Net operating loss carryforwards
|
$
|
1,000
|
|
$
|
1,626
|
|
||
|
Tax credits
|
1,355
|
|
1,779
|
|
||||
|
Accruals and reserves
|
5,048
|
|
3,759
|
|
||||
|
Stock-based compensation
|
1,352
|
|
416
|
|
||||
|
Translation adjustment
|
715
|
|
674
|
|
||||
|
UNICAP adjustments
|
3,840
|
|
2,227
|
|
||||
|
Other
|
870
|
|
—
|
|
||||
|
Gross deferred tax assets
|
14,180
|
|
10,481
|
|
||||
|
Valuation allowance
|
(2,702
|
)
|
(2,945
|
)
|
||||
|
Total deferred tax assets
|
11,478
|
|
7,536
|
|
||||
|
Deferred tax liabilities
|
||||||||
|
Depreciation and amortization
|
(1,335
|
)
|
(685
|
)
|
||||
|
Total deferred tax liabilities
|
(1,335
|
)
|
(685
|
)
|
||||
|
Net deferred tax assets
|
$
|
10,143
|
|
$
|
6,851
|
|
||
|
Deferred income taxes, net - Balance Sheet Classification
|
||||||||
|
Current deferred income tax assets
|
$
|
—
|
|
$
|
6,280
|
|
||
|
Long-term deferred income tax assets
|
10,143
|
|
571
|
|
||||
|
Net deferred tax assets
|
$
|
10,143
|
|
$
|
6,851
|
|
||
The Company assesses the realizability of its net deferred tax assets by evaluating all available evidence, both positive and negative, including (1) cumulative results of operations in recent years, (2) sources of recent losses, (3) estimates of future taxable income and (4) the length of net operating loss carryforward periods. As of
December 31, 2013
, the Company determined that it is more likely than not that a portion of the net deferred tax assets will be realized for federal and US states except California and released the valuation allowance of
$5.0 million
. As a result, the Company has maintained a full valuation allowance against the net deferred tax assets of California through
December 31, 2015
. As of
December 31, 2014
, the Company determined that it is more likely than not that German net deferred tax assets will be realized and released the German valuation allowance of
$0.3 million
.
The net deferred tax assets was
$10.1 million
as of December 31, 2015 and was included in non-current deferred tax assets due to the adoption of FASB guidance discussed in Note 2
“
Summary of Significant Accounting Policies
”
to the consolidated financial statements included in this Form 10-K.
The valuation allowance against net deferred tax assets changed as follows:
|
December 31,
|
||||||||||||
|
2015
|
2014
|
2013
|
||||||||||
|
Balance at the beginning of the year
|
$
|
2,945
|
|
$
|
3,860
|
|
$
|
8,742
|
|
|||
|
Release of valuation allowance
|
(243
|
)
|
(321
|
)
|
(4,962
|
)
|
||||||
|
Other reserves and deferrals
|
—
|
|
(594
|
)
|
80
|
|
||||||
|
Balance at the end of the year
|
$
|
2,702
|
|
$
|
2,945
|
|
$
|
3,860
|
|
|||
At
December 31, 2015
, the Company had approximately
$16.3 million
and
$1.8 million
of state and foreign net operating loss carryforwards, respectively, available to offset future taxable income. The state net operating loss carryforwards will begin to expire in 2017. At
December 31, 2015
, the Company had research credits available to offset state tax liabilities in the amount of
$3.6 million
. California state tax credits have no expiration. The state net operating loss carryforwards of
$16.3 million
included $
0.6 million
relating to stock-based compensation deductions. These amounts are not included in the Company’s gross or net deferred tax assets pursuant to applicable accounting guidance and, if and when realized, through a reduction in income tax payable, will be accounted for as a credit to additional paid-in capital.
86
IRC Sections 382 and 383 limit the use of net operating losses and business credits if there is a change in ownership. In 2009, the Company determined there were changes in ownership in 2004 and 2008, which did not cause any impairment of tax attributes.
Included in the
$3.6 million
balance of unrecognized tax benefits as of
December 31, 2015
is
$1.3 million
of tax benefits that, if recognized, would affect the effective tax rate.
A reconciliation of the change in the gross unrecognized tax benefits from January 1, 2013 to
December 31, 2015
, is as follows:
|
December 31,
|
||||||||||||
|
2015
|
2014
|
2013
|
||||||||||
|
Beginning Balance
|
$
|
1,726
|
|
$
|
1,325
|
|
$
|
838
|
|
|||
|
Gross increase for tax positions of current year
|
1,023
|
|
401
|
|
324
|
|
||||||
|
Gross increase for tax positions of prior years
|
1,062
|
|
—
|
|
163
|
|
||||||
|
Settlements
|
—
|
|
—
|
|
—
|
|
||||||
|
Lapse of statute of limitations
|
(192
|
)
|
—
|
|
—
|
|
||||||
|
Ending Balance
|
$
|
3,619
|
|
$
|
1,726
|
|
$
|
1,325
|
|
|||
The Company recognizes interest and penalties related to uncertain tax positions in income tax expense. As of
December 31, 2015
, the Company had
$0.1 million
accrued interest and penalties related to uncertain tax positions.
The Company files U.S., state and foreign income tax returns in jurisdictions with varying statutes of limitations. Due to net operating loss and credit carryovers, the tax years ending December 31, 2004 through
December 31, 2015
remain subject to examination by federal and state tax authorities. In Australia and Canada, tax years ending December 31, 2008 through
December 31, 2015
generally remain subject to examination by tax authorities. In Germany, tax years ending December 31, 2013 through
December 31, 2015
remain subject to examination by tax authorities.
The Company does not anticipate any significant changes in the balance of gross unrecognized tax benefits over the next 12 months.
17. Net Income (Loss) per Share of Common Stock attributable to Common Stockholders
A reconciliation of the numerator and denominator used in the calculation of the basic and diluted net income (loss) per share attributable to common stockholders is as follows (in thousands, except share and per share amounts):
|
|
Year Ended December 31,
|
|||||||||||
|
|
2015
|
2014
|
2013
|
|||||||||
|
Net income (loss) per share:
|
||||||||||||
|
Numerator
|
||||||||||||
|
Net income
|
$
|
2,365
|
|
$
|
2,245
|
|
$
|
4,099
|
|
|||
|
Less: Deemed dividend paid to convertible preferred stockholders upon repurchase
|
—
|
|
(6,344
|
)
|
—
|
|
||||||
|
Less: Undistributed income attributable to convertible preferred stockholders
|
(1,281
|
)
|
—
|
|
(3,212
|
)
|
||||||
|
Add: Undistributed loss attributable to convertible preferred stockholders
|
—
|
|
3,266
|
|
—
|
|
||||||
|
Net income (loss) attributable to common stockholders—basic and diluted
|
$
|
1,084
|
|
$
|
(833
|
)
|
$
|
887
|
|
|||
|
Denominator
|
||||||||||||
|
Weighted average shares used to compute net income (loss) attributable to common stockholders—Basic
|
11,993,429
|
|
4,609,375
|
|
4,304,396
|
|
||||||
|
Potential dilutive options, as calculated using treasury stock method
|
1,959,226
|
|
—
|
|
2,021,394
|
|
||||||
|
Potential dilutive common stock warrants, as calculated using treasury stock method
|
—
|
|
—
|
|
86,985
|
|
||||||
|
Potential dilutive restricted stock, as calculated using treasury stock method
|
266,995
|
|
—
|
|
88,060
|
|
||||||
|
Weighted average shares used to compute net income (loss) attributable to common stockholders—Diluted
|
14,219,650
|
|
4,609,375
|
|
6,500,835
|
|
||||||
|
Net income (loss) per share attributable to common stockholders
—Basic
|
$
|
0.09
|
|
$
|
(0.18
|
)
|
$
|
0.21
|
|
|||
|
—Diluted
|
$
|
0.08
|
|
$
|
(0.18
|
)
|
$
|
0.14
|
|
|||
87
The following outstanding shares of potentially dilutive securities were excluded from the computation of diluted net income (loss) per share of common stock for the periods presented, because the effect of including them would have been anti-dilutive:
|
|
Year Ended December 31,
|
||||||||
|
|
2015
|
2014
|
2013
|
||||||
|
Options to purchase common stock
|
1,321,250
|
|
2,933,757
|
|
63,750
|
|
|||
|
Restricted stock and restricted stock units
|
96,800
|
|
367,126
|
|
—
|
|
|||
|
Total
|
1,418,050
|
|
3,300,883
|
|
63,750
|
|
|||
18. Geographic Areas and Product Sales
The Company’s revenue by geographic area, based on the destination to which the Company ships its products, was as follows (in thousands):
|
|
Year Ended December 31,
|
|||||||||||
|
|
2015
|
2014
|
2013
|
|||||||||
|
United States
|
$
|
127,311
|
|
$
|
82,965
|
|
$
|
58,305
|
|
|||
|
Japan
|
19,016
|
|
14,699
|
|
12,668
|
|
||||||
|
Other International
|
39,768
|
|
27,846
|
|
17,875
|
|
||||||
|
Total
|
$
|
186,095
|
|
$
|
125,510
|
|
$
|
88,848
|
|
|||
The following table sets forth revenue by product category (in thousands):
|
|
Year Ended December 31,
|
|||||||||||
|
|
2015
|
2014
|
2013
|
|||||||||
|
Neuro
|
$
|
141,410
|
|
$
|
106,242
|
|
$
|
81,343
|
|
|||
|
Peripheral Vascular
|
44,685
|
|
19,268
|
|
7,505
|
|
||||||
|
Total
|
$
|
186,095
|
|
$
|
125,510
|
|
$
|
88,848
|
|
|||
The Company does not have significant long-lived assets outside the U.S.
88
19. Selected Quarterly Financial Data (Unaudited)
The following table provides the selected quarterly financial data for
2015
and
2014
(in thousands, except share and per share amounts):
|
Quarter Ended
|
||||||||||||||||||||||||||||||||
|
2015
|
2014
|
|||||||||||||||||||||||||||||||
|
December 31
|
September 30
|
June 30
|
March 31
|
December 31
|
September 30
|
June 30
|
March 31
|
|||||||||||||||||||||||||
|
Revenue
|
$
|
54,416
|
|
$
|
50,416
|
|
$
|
42,311
|
|
$
|
38,952
|
|
$
|
35,403
|
|
$
|
32,464
|
|
$
|
31,480
|
|
$
|
26,163
|
|
||||||||
|
Cost of revenue
|
17,958
|
|
16,919
|
|
14,936
|
|
12,224
|
|
11,512
|
|
11,667
|
|
10,780
|
|
8,709
|
|
||||||||||||||||
|
Gross profit
|
$
|
36,458
|
|
$
|
33,497
|
|
$
|
27,375
|
|
$
|
26,728
|
|
$
|
23,891
|
|
$
|
20,797
|
|
$
|
20,700
|
|
$
|
17,454
|
|
||||||||
|
Income (loss) before provision for (benefit from) income taxes
|
$
|
1,876
|
|
$
|
2,084
|
|
$
|
(4,178
|
)
|
$
|
4,242
|
|
$
|
417
|
|
$
|
399
|
|
$
|
526
|
|
$
|
1,797
|
|
||||||||
|
Net income (loss)
|
$
|
1,633
|
|
$
|
901
|
|
$
|
(2,671
|
)
|
$
|
2,502
|
|
$
|
416
|
|
$
|
172
|
|
$
|
391
|
|
$
|
1,266
|
|
||||||||
|
Net income (loss) attributable to common stockholders
|
$
|
1,633
|
|
$
|
276
|
|
$
|
(553
|
)
|
$
|
503
|
|
$
|
81
|
|
$
|
(1,192
|
)
|
$
|
81
|
|
$
|
280
|
|
||||||||
|
Net income (loss) per share attributable to common stockholders—Basic
|
$
|
0.05
|
|
$
|
0.04
|
|
$
|
(0.11
|
)
|
$
|
0.10
|
|
$
|
0.02
|
|
$
|
(0.25
|
)
|
$
|
0.02
|
|
$
|
0.06
|
|
||||||||
|
Net income (loss) per share attributable to common stockholders—Diluted
|
$
|
0.05
|
|
$
|
0.03
|
|
$
|
(0.11
|
)
|
$
|
0.07
|
|
$
|
0.01
|
|
$
|
(0.25
|
)
|
$
|
0.01
|
|
$
|
0.04
|
|
||||||||
|
Weighted average shares used to compute net income (loss) per share attributable to common stockholders—Basic
|
29,890,944
|
|
7,853,730
|
|
5,096,151
|
|
4,903,535
|
|
4,701,999
|
|
4,688,045
|
|
4,608,510
|
|
4,430,824
|
|
||||||||||||||||
|
Weighted average shares used to compute net income (loss) per share attributable to common stockholders—Diluted
|
32,321,410
|
|
10,189,248
|
|
5,096,151
|
|
7,193,452
|
|
7,102,885
|
|
4,688,045
|
|
6,868,889
|
|
6,705,066
|
|
||||||||||||||||
89
None.
Evaluation of Disclosure Controls and Procedures
We have established disclosure controls and procedures that are designed to ensure that the information required to be disclosed by the Company in the reports that it files or submits under the Exchange Act is recorded, processed, summarized and reported within the time periods specified in SEC rules and forms and that such information is accumulated and communicated to management, including our principal executive officer and principal financial officer, as appropriate to allow timely decisions regarding required disclosure.
Our management, including our principal executive officer and principal financial officer, evaluated the effectiveness of our disclosure controls and procedures. Based on this review, the principal executive officer and principal financial officer of the Company have concluded that the Company’s disclosure controls and procedures (as defined in Rules 13a-15(e) and 15d-15(e) under the Exchange Act) were effective as of
December 31, 2015
.
Management’s Report on Internal Control Over Financial Reporting
This annual report does not include a report of management’s assessment regarding internal control over financial reporting or an attestation report of our registered public accounting firm due to a transition period established by rules of the SEC for newly public companies.
Changes in Internal Control Over Financial Reporting
There was no change in our internal control over financial reporting (as defined in Rules 13a-15(f) and 15d-15(f) under the Exchange Act) that occurred during the quarterly period ended
December 31, 2015
that has materially affected, or is reasonably likely to materially affect, our internal control over financial reporting.
None.
90
The information required by this item is incorporated by reference to the information set forth in our Definitive Proxy Statement to be filed with the SEC in connection with our Annual Meeting of Stockholders to be held in June 2016 (the 2016 Proxy Statement).
We have adopted a Code of Ethics that applies to all of our directors, officers and employees, including our principal executive, financial and accounting officers, or persons performing similar functions. Our Code of Ethics is posted under Corporate Governance on the Investor Relations page of our corporate website, www.penumbrainc.com. We intend to make any required disclosures regarding any amendments of our Code of Ethics or waivers granted to any of our directors or executive officers under our Code of Ethics on our website.
The information required by this item is incorporated by reference to the information in the 2016 Proxy Statement.
The information required by this item is incorporated by reference to the information in the 2016 Proxy Statement.
The information required by this item is incorporated by reference to the information in the 2016 Proxy Statement.
The information required by this item is incorporated by reference to the information in the 2016 Proxy Statement.
91
|
1.
|
Financial Statements: The financial statements included in “Index to Consolidated Financial Statements” in Part II, Item 8 are filed as part of this Annual Report on Form 10-K
|
|
2.
|
Exhibits: The exhibits listed in the accompanying index to exhibits are filed or incorporated by reference as part of this Annual Report on Form 10-K.
|
92
SIGNATURES
Pursuant to the requirements of Section 13 or 15(d) of the Securities Exchange Act of 1934, the registrant has duly caused this report to be signed on its behalf by the undersigned, thereunto duly authorized.
|
|
PENUMBRA, INC.
|
|
|
Date: March 8, 2016
|
|
|
|
|
By:
|
/s/ Sri Kosaraju
|
|
|
Sri Kosaraju
|
|
|
|
Chief Financial Officer and Head of Strategy
|
|
|
(Principal Financial and Accounting Officer)
|
||
POWER OF ATTORNEY
KNOW ALL PERSONS BY THESE PRESENTS, that each person whose signature appears below constitutes and appoints Adam Elsesser and Sri Kosaraju, his attorney-in-fact, each with the power of substitution, for him in any and all capacities, to sign any amendments in this Annual Report on Form 10-K, and to file the same, with exhibits thereto and other documents in connections therewith, with the Securities and Exchange Commission, hereby ratifying and conforming all that each of said attorneys-in-fact, or his substitutes, may do or cause to be done by virtue of hereof.
Pursuant to the requirements of the Securities Exchange Act of 1934, this report has been signed below by the following persons on behalf of the registrant and in the capacities and on the dates indicated.
|
Signature
|
Title
|
Date
|
||
|
/s/ Adam Elsesser
|
Chairman, Chief Executive Officer and President
|
March 8, 2016
|
||
|
Adam Elsesser
|
(principal executive officer)
|
|||
|
/s/ Sri Kosaraju
|
Chief Financial Officer and Head of Strategy
|
March 8, 2016
|
||
|
Sri Kosaraju
|
(principal financial officer and principal accounting officer)
|
|||
|
/s/ Arani Bose
|
Chief Innovator and Director
|
March 8, 2016
|
||
|
Arani Bose
|
||||
|
/s/ Don Kassing
|
Director
|
March 8, 2016
|
||
|
Don Kassing
|
||||
|
/s/ Walter C. Wang
|
Director
|
March 8, 2016
|
||
|
Walter Charles Wang
|
||||
|
/s/ Harpreet Grewal
|
Director
|
March 8, 2016
|
||
|
Harpreet Grewal
|
||||
|
/s/ Kevin J. Sullivan
|
Director
|
March 8, 2016
|
||
|
Kevin James Sullivan
|
||||
93
EXHIBIT INDEX
|
Incorporation by Reference
|
||||||||||
|
Exhibit Number
|
Description
|
Form
|
File No.
|
Exhibit(s)
|
Filing Date
|
|||||
|
3.1
|
Restated Certificate of Incorporation of Penumbra, Inc.
|
8-K
|
001-37557
|
3.3
|
September 29, 2015
|
|||||
|
3.2
|
Amended and Restated Bylaws of Penumbra, Inc.
|
8-K
|
001-37557
|
3.4
|
September 29, 2015
|
|||||
|
4.1
|
Specimen Common Stock Certificate
|
S-1/A
|
333-206412
|
4.1
|
September 8, 2015
|
|||||
|
4.2
|
Fourth Amended and Restated Investors’ Rights Agreement, by and among Penumbra, Inc., Adam Elsesser and Arani Bose and the investors listed on Exhibit A thereto, dated May 16, 2014
|
S-1
|
333-206412
|
4.2
|
August 14, 2015
|
|||||
|
10.1
|
Lease for facilities at 1351 Harbor Bay Parkway, Alameda, California, dated November 28, 2007 and amended on May 7, 2008 and June 23, 2011
|
S-1
|
333-206412
|
10.1
|
August 14, 2015
|
|||||
|
10.2
|
Lease for facilities at 1411 Harbor Bay Parkway, Alameda, California, dated September 11, 2014
|
S-1
|
333-206412
|
10.2
|
August 14, 2015
|
|||||
|
10.3
|
Lease for facilities at 1321 Harbor Bay Parkway, Alameda, California, dated September 11, 2014
|
S-1
|
333-206412
|
10.3
|
August 14, 2015
|
|||||
|
10.4*
|
Lease for facilities at 1301, 1311, 1401 and 1431 Harbor Bay Parkway, Alameda, California, dated December 19, 2015
|
|||||||||
|
10.5#
|
Distribution Agreement between Penumbra, Inc. and Medico’s Hirata, dated August 2, 2009, as amended
|
S-1
|
333-206412
|
10.4
|
August 14, 2015
|
|||||
|
10.6†
|
Amended and Restated 2014 Equity Incentive Plan, and forms of Restricted Stock Agreement, Stock Option Agreement and Early Exercise Stock Option Agreement
|
S-1
|
333-206412
|
10.19
|
August 14, 2015
|
|||||
|
10.7†
|
Amended and Restated 2014 Equity Incentive Plan - Restricted Stock Agreement of Penumbra, Inc.
|
10-Q
|
001-37557
|
10.1
|
November 12, 2015
|
|||||
|
10.8†
|
Amended and Restated 2014 Equity Incentive Plan - Stock Option Agreement of Penumbra, Inc.
|
10-Q
|
001-37557
|
10.2
|
November 12, 2015
|
|||||
|
10.9†*
|
Amended and Restated 2014 Equity Incentive Plan - Restricted Stock Unit Agreement of Penumbra, Inc.
|
|||||||||
|
10.10†
|
2014 Equity Incentive Plan, and forms of Restricted Stock Agreement, Stock Option Agreement and Early Exercise Stock Option Agreement
|
S-1
|
333-206412
|
10.5
|
August 14, 2015
|
|||||
|
10.11†
|
2011 Equity Incentive Plan, and forms of Restricted Stock Agreement, Stock Grant Agreement, Stock Option Agreement and Early Exercise Stock Option Agreement
|
S-1
|
333-206412
|
10.6
|
August 14, 2015
|
|||||
|
10.12†
|
2005 Stock Plan, and forms of Notice of Grant and Early Exercise Stock Option Agreement
|
S-1
|
333-206412
|
10.7
|
August 14, 2015
|
|||||
|
10.13†
|
Form of Indemnification Agreement by and between Penumbra, Inc. and each of its directors and executive officers
|
S-1
|
333-206412
|
10.9
|
August 14, 2015
|
|||||
|
10.14†
|
Offer Letter with Adam Elsesser
|
S-1
|
333-206412
|
10.10
|
August 14, 2015
|
|||||
|
10.15†
|
Offer Letter with Arani Bose
|
S-1
|
333-206412
|
10.11
|
August 14, 2015
|
|||||
|
10.16†
|
Offer Letter with Sri Kosaraju
|
S-1
|
333-206412
|
10.12
|
August 14, 2015
|
|||||
|
10.17†
|
Offer Letter with Daniel Davis
|
S-1
|
333-206412
|
10.13
|
August 14, 2015
|
|||||
|
10.18†
|
Offer Letter with James Pray
|
S-1
|
333-206412
|
10.14
|
August 14, 2015
|
|||||
|
10.19†
|
Offer Letter with Lynn Rothman
|
S-1
|
333-206412
|
10.15
|
August 14, 2015
|
|||||
|
10.20†
|
Offer Letter with Robert Evans
|
S-1
|
333-206412
|
10.16
|
August 14, 2015
|
|||||
|
10.21†
|
Form of Employee Nondisclosure and Assignment Agreement
|
S-1
|
333-206412
|
10.17
|
August 14, 2015
|
|||||
|
10.22†
|
Employee Stock Purchase Plan
|
S-1/A
|
333-206412
|
10.18
|
August 31, 2015
|
|||||
|
10.24
|
Engagement Letter between the Penumbra, Inc. and Perella Weinberg Partners LP
|
S-1/A
|
333-206412
|
10.20
|
August 31, 2015
|
|||||
94
|
21.1
|
Subsidiaries of the Registrant
|
S-1
|
333-206412
|
21.1
|
August 14, 2015
|
|||||
|
23.1*
|
Consent of Deloitte & Touche LLP
|
|||||||||
|
24.1*
|
Power of Attorney (included on signature page)
|
|||||||||
|
31.1*
|
Certification of Principal Executive Officer required under Rule 13a-14(a) and 15d-14(a) of the Securities Exchange Act of 1934, as amended.
|
|||||||||
|
31.2*
|
Certification of Principal Financial Officer required under Rule 13a-14(a) and 15d-14(a) of the Securities Exchange Act of 1934, as amended.
|
|||||||||
|
32.1*
|
Certification of Principal Executive Officer and Principal Financial Officer required under Rule 13a-14(b) of the Securities Exchange Act of 1934, as amended, and 18 U.S.C. §1350.
|
|||||||||
|
101*
|
The following materials from the Company’s Annual Report on Form 10-K for the year ended December 31, 2015 formatted in Extensible Business Reporting Language (XBRL) includes: (i) Consolidated Balance Sheets as of December 31, 2015 and 2014, (ii) Consolidated Statements of Operations and Comprehensive Income for the years ended December 31, 2015, 2014 and 2013, (iii) Consolidated Statements of Convertible Preferred Stock and Stockholders’ Equity (Deficit) for the years ended December 31, 2015, 2014 and 2013, (iv) Consolidated Statements of Cash Flows for the years ended December 31, 2015, 2014 and 2013, and (v) Notes to Consolidated Financial Statements.
|
|||||||||
* Filed herewith
†
Indicates a management contract or compensatory plan or arrangement.
# Portions of this exhibit (indicated by asterisks) have been omitted pursuant to a grant of confidential treatment.
95
TABLE OF CONTENTS
Part IItem 1. BusinessItem 1A. Risk FactorsItem 1B. Unresolved Staff CommentsItem 2. PropertiesItem 3. Legal ProceedingsItem 4. Mine Safety DisclosuresPart IIItem 5. Market For Registrant's Common Equity, Related Stockholder Matters and Issuer Purchases Of Equity SecuritiesItem 6. Selected Consolidated Financial DataItem 7. Management S Discussion and Analysis Of Financial Condition and Results Of OperationsItem 7A. Quantitative and Qualitative Disclosures About Market RiskItem 8. Financial Statements and Supplementary DataItem 9. Changes in and Disagreements with Accountants on Accounting and Financial DisclosureItem 9A. Controls and ProceduresItem 9B. Other InformationPart IIIItem 10. Directors, Executive Officers and Corporate GovernanceItem 11. Executive CompensationItem 12. Security Ownership Of Certain Benefical Owners and Management and Related Stockholder MattersItem 13. Certain Relationships and Related Transactions and Director IndependenceItem 14. Principal Accounting Fees and ServicesPart IVItem 15. Exhibits and Financial Statement Schedules