PFIZER INC
10-Ks and 10-Qs
|
|
|
|
|
|
|
|
|
|
|
|
|
|
|
|
|
|
|
|
|
|
|
|
|
|
|
|
|
|
|
|
|
|
|
|
|
|
|
|
|
|
|
|
|
|
|
|
|
|
|
|
|
|
|
|
UNITED STATES
SECURITIES AND EXCHANGE COMMISSION
WASHINGTON, D.C. 20549
FORM
10-Q
X
QUARTERLY REPORT PURSUANT TO SECTION 13 OR 15(d)
OF THE SECURITIES EXCHANGE ACT OF 1934
For the quarterly period ended
March 31, 2019
OR
TRANSITION REPORT PURSUANT TO SECTION 13
OR 15(d) OF THE SECURITIES EXCHANGE ACT OF 1934
For the transition period from _______ to _______
COMMISSION FILE NUMBER 1-3619
----
PFIZER INC
.
(Exact name of registrant as specified in its charter)
|
DELAWARE
(State of Incorporation)
|
13-5315170
(I.R.S. Employer Identification No.)
|
235 East 42
nd
Street, New York, New York 10017
(Address of principal executive offices) (zip code)
(212) 733-2323
(Registrant’s telephone number)
Indicate by check mark whether the registrant (1) has filed all reports required to be filed by Section 13 or 15(d) of the Securities Exchange Act of 1934 during the preceding 12 months (or for such shorter period that the registrant was required to file such reports), and (2) has been subject to such filing requirements for the past 90 days.
|
YES
X
|
NO ___
|
Indicate by check mark whether the registrant has submitted electronically every Interactive Data File required to be submitted pursuant to Rule 405 of Regulation S-T (§232.405 of this chapter) during the preceding 12 months (or for such shorter period that the registrant was required to submit such files).
|
YES
X
|
NO ___
|
Indicate by check mark whether the registrant is a large accelerated filer, an accelerated filer, a non-accelerated filer, smaller reporting company, or an emerging growth company. See the definitions of “large accelerated filer,” “accelerated filer,” “smaller reporting company,” and “emerging growth company” in Rule 12b-2 of the Exchange Act:
Large Accelerated filer
X
Accelerated filer ___ Non-accelerated filer ___ Smaller reporting company ___ Emerging growth company ___
If an emerging growth company, indicate by check mark if the registrant has elected not to use the extended transition period for complying with any new or revised financial accounting standards provided pursuant to Section 13(a) of the Exchange Act. ___
Indicate by check mark whether the registrant is a shell company (as defined in Rule 12b-2 of the Exchange Act).
|
YES ____
|
NO
X
|
|
Securities registered pursuant to Section 12(b) of the Act:
|
||||
|
Title of each class
|
Trading Symbol(s)
|
Name of each exchange on which registered
|
||
|
Common Stock, $.05 par value
|
PFE
|
New York Stock Exchange
|
||
|
0.000% Notes due 2020
|
PFE20A
|
New York Stock Exchange
|
||
|
0.250% Notes due 2022
|
PFE22
|
New York Stock Exchange
|
||
|
1.000% Notes due 2027
|
PFE27
|
New York Stock Exchange
|
||
At
May 6, 2019
,
5,559,929,190
shares of the issuer’s voting common stock were outstanding.
Table of Contents
|
Page
|
|
|
|
|
|
|
|
|
Condensed Consolidated Statements of Income for the three months ended March 31, 2019 and April 1, 2018
|
|
|
Condensed Consolidated Statements of Comprehensive Income for the three months ended March 31, 2019 and April 1, 2018
|
|
|
Condensed Consolidated Balance Sheets as of March 31, 2019 and December 31, 2018
|
|
|
Condensed Consolidated Statements of Equity for the three months ended March 31, 2019 and April 1, 2018
|
|
|
Condensed Consolidated Statements of Cash Flows for the three months ended March 31, 2019 and April 1, 2018
|
|
|
|
|
|
|
|
|
|
|
|
|
|
|
|
|
|
|
|
|
|
|
|
|
|
|
|
|
|
|
|
|
|
|
2
GLOSSARY OF DEFINED TERMS
Unless the context requires otherwise, references to “Pfizer,” “the Company,” “we,” “us” or “our” in this Quarterly Report on Form 10-Q (defined below) refer to Pfizer Inc. and its subsidiaries. We also have used several other terms in this Quarterly Report on Form 10-Q, most of which are explained or defined below:
|
2018 Financial Report
|
Financial Report for the fiscal year ended December 31, 2018, which was filed as Exhibit 13 to the Annual Report on Form 10-K for the fiscal year ended December 31, 2018
|
|
2018 Form 10-K
|
Annual Report on Form 10-K for the fiscal year ended December 31, 2018
|
|
ACA (Also referred to as U.S. Healthcare Legislation)
|
U.S. Patient Protection and Affordable Care Act, as amended by the Health Care and Education Reconciliation Act
|
|
ACIP
|
Advisory Committee on Immunization Practices
|
|
ALK
|
anaplastic lymphoma kinase
|
|
Alliance revenues
|
Revenues from alliance agreements under which we co-promote products discovered or developed by other companies or us
|
|
Allogene
|
Allogene Therapeutics, Inc.
|
|
Anacor
|
Anacor Pharmaceuticals, Inc.
|
|
AOCI
|
Accumulated Other Comprehensive Income
|
|
Astellas
|
Astellas Pharma Inc., Astellas US LLC and Astellas Pharma US, Inc.
|
|
Bamboo
|
Bamboo Therapeutics, Inc.
|
|
Biopharma
|
Pfizer Biopharmaceuticals Group
|
|
BMS
|
Bristol-Myers Squibb Company
|
|
BRCA
|
BReast CAncer susceptibility gene
|
|
CAR T
|
chimeric antigen receptor T cell
|
|
CDC
|
U.S. Centers for Disease Control and Prevention
|
|
cGMP
|
current Good Manufacturing Practices
|
|
Citibank
|
Citibank, N.A.
|
|
Developed Markets
|
U.S., Western Europe, Japan, Canada, South Korea, Australia, Scandinavian countries, Finland and
New Zealand |
|
EEA
|
European Economic Area
|
|
EGFR
|
epidermal growth factor receptor
|
|
EH
|
Essential Health
|
|
EMA
|
European Medicines Agency
|
|
Emerging Markets
|
Includes, but is not limited to, the following markets: Asia (excluding Japan and South Korea),
Latin America, Eastern Europe, the Middle East, Africa, Central Europe and Turkey |
|
EPS
|
earnings per share
|
|
EU
|
European Union
|
|
Exchange Act
|
Securities Exchange Act of 1934, as amended
|
|
FASB
|
Financial Accounting Standards Board
|
|
FDA
|
U.S. Food and Drug Administration
|
|
GAAP
|
Generally Accepted Accounting Principles
|
|
GIST
|
gastrointestinal stromal tumors
|
|
GPD
|
Global Product Development organization
|
|
GSK
|
GlaxoSmithKline plc
|
|
GS&Co.
|
Goldman, Sachs & Co. LLC
|
|
HER2-
|
human epidermal growth factor receptor 2-negative
|
|
hGH-CTP
|
human growth hormone
|
|
HIS
|
Hospira Infusion Systems
|
|
Hisun Pfizer
|
Hisun Pfizer Pharmaceuticals Company Limited
|
|
Hospira
|
Hospira, Inc.
|
|
HR+
|
hormone receptor-positive
|
|
ICU Medical
|
ICU Medical, Inc.
|
|
IH
|
Innovative Health
|
|
IPR&D
|
in-process research and development
|
|
IRS
|
U.S. Internal Revenue Service
|
|
IV
|
intravenous
|
|
Janssen
|
Janssen Biotech Inc.
|
|
J&J
|
Johnson & Johnson
|
|
King
|
King Pharmaceuticals LLC (formerly King Pharmaceuticals, Inc.)
|
3
|
LDL
|
low density lipoprotein
|
|
LEP
|
Legacy Established Products
|
|
LIBOR
|
London Interbank Offered Rate
|
|
Lilly
|
Eli Lilly & Company
|
|
LOE
|
loss of exclusivity
|
|
MCC
|
Merkel cell carcinoma
|
|
MCO
|
managed care organization
|
|
MD&A
|
Management’s Discussion and Analysis of Financial Condition and Results of Operations
|
|
Medivation
|
Medivation LLC (formerly Medivation, Inc.)
|
|
Merck
|
Merck & Co., Inc.
|
|
Meridian
|
Meridian Medical Technologies, Inc.
|
|
Moody’s
|
Moody’s Investors Service
|
|
NDA
|
new drug application
|
|
NSCLC
|
non-small cell lung cancer
|
|
NYSE
|
New York Stock Exchange
|
|
OPKO
|
OPKO Health, Inc.
|
|
OTC
|
over-the-counter
|
|
PARP
|
poly ADP ribose polymerase
|
|
PBM
|
pharmacy benefit manager
|
|
Pharmacia
|
Pharmacia Corporation
|
|
PP&E
|
property, plant & equipment
|
|
PsA
|
psoriatic arthritis
|
|
Quarterly Report on Form 10-Q
|
Quarterly Report on Form 10-Q for the quarterly period ended March 31, 2019
|
|
RA
|
rheumatoid arthritis
|
|
RCC
|
renal cell carcinoma
|
|
R&D
|
research and development
|
|
ROU
|
right of use
|
|
Sandoz
|
Sandoz, Inc., a division of Novartis AG
|
|
SBS
|
short bowel syndrome
|
|
SEC
|
U.S. Securities and Exchange Commission
|
|
SFJ
|
SFJ Pharmaceuticals Group
|
|
Shire
|
Shire International GmbH
|
|
SI&A
|
selling, informational and administrative
|
|
SIP
|
sterile injectable pharmaceuticals
|
|
S&P
|
Standard and Poor’s
|
|
Tax Cuts and Jobs Act or TCJA
|
legislation commonly referred to as the U.S. Tax Cuts and Jobs Act of 2017
|
|
Therachon
|
Therachon Holding AG
|
|
UC
|
ulcerative colitis
|
|
U.K.
|
United Kingdom
|
|
U.S.
|
United States
|
|
ViiV
|
ViiV Healthcare Limited
|
|
WRDM
|
Worldwide Research, Development and Medical
|
4
PART I - FINANCIAL INFORMATION
Item 1. Financial Statements
PFIZER INC. AND SUBSIDIARY COMPANIES
CONDENSED CONSOLIDATED STATEMENTS OF INCOME
(UNAUDITED)
|
|
Three Months Ended
|
|||||||
|
(MILLIONS, EXCEPT PER COMMON SHARE DATA)
|
March 31,
2019 |
|
April 1,
2018 |
|
||||
|
Revenues
|
$
|
13,118
|
|
$
|
12,906
|
|
||
|
Costs and expenses:
|
||||||||
|
Cost of sales
(a)
|
2,433
|
|
2,563
|
|
||||
|
Selling, informational and administrative expenses
(a)
|
3,339
|
|
3,412
|
|
||||
|
Research and development expenses
(a)
|
1,703
|
|
1,743
|
|
||||
|
Amortization of intangible assets
|
1,183
|
|
1,196
|
|
||||
|
Restructuring charges and certain acquisition-related costs
|
46
|
|
43
|
|
||||
|
Other (income)/deductions––net
|
92
|
|
(178
|
)
|
||||
|
Income from continuing operations before provision for taxes on income
|
4,323
|
|
4,127
|
|
||||
|
Provision for taxes on income
|
433
|
|
556
|
|
||||
|
Income from continuing operations
|
3,889
|
|
3,571
|
|
||||
|
Discontinued operations––net of tax
|
—
|
|
(1
|
)
|
||||
|
Net income before allocation to noncontrolling interests
|
3,889
|
|
3,570
|
|
||||
|
Less: Net income attributable to noncontrolling interests
|
6
|
|
9
|
|
||||
|
Net income attributable to Pfizer Inc.
|
$
|
3,884
|
|
$
|
3,561
|
|
||
|
Earnings per common share––basic
:
|
|
|
|
|
||||
|
Income from continuing operations attributable to Pfizer Inc. common shareholders
|
$
|
0.69
|
|
$
|
0.60
|
|
||
|
Discontinued operations––net of tax
|
—
|
|
—
|
|
||||
|
Net income attributable to Pfizer Inc. common shareholders
|
$
|
0.69
|
|
$
|
0.60
|
|
||
|
Earnings per common share––diluted
:
|
|
|
|
|
||||
|
Income from continuing operations attributable to Pfizer Inc. common shareholders
|
$
|
0.68
|
|
$
|
0.59
|
|
||
|
Discontinued operations––net of tax
|
—
|
|
—
|
|
||||
|
Net income attributable to Pfizer Inc. common shareholders
|
$
|
0.68
|
|
$
|
0.59
|
|
||
|
Weighted-average shares––basic
|
5,635
|
|
5,957
|
|
||||
|
Weighted-average shares––diluted
|
5,750
|
|
6,057
|
|
||||
|
(a)
|
Excludes amortization of intangible assets, except as disclosed in
Note 9A. Identifiable Intangible Assets and Goodwill: Identifiable Intangible Assets.
|
Amounts may not add due to rounding.
See Notes to Condensed Consolidated Financial Statements.
5
PFIZER INC. AND SUBSIDIARY COMPANIES
CONDENSED CONSOLIDATED STATEMENTS OF COMPREHENSIVE INCOME
(UNAUDITED)
|
|
Three Months Ended
|
|||||||
|
(MILLIONS OF DOLLARS)
|
March 31,
2019 |
|
April 1,
2018 |
|
||||
|
Net income before allocation to noncontrolling interests
|
$
|
3,889
|
|
$
|
3,570
|
|
||
|
Foreign currency translation adjustments, net
|
324
|
|
758
|
|
||||
|
Reclassification adjustments
|
2
|
|
15
|
|
||||
|
|
326
|
|
773
|
|
||||
|
Unrealized holding gains/(losses) on derivative financial instruments, net
|
267
|
|
(114
|
)
|
||||
|
Reclassification adjustments for (gains)/losses included in net income
(a)
|
(263
|
)
|
44
|
|
||||
|
|
4
|
|
(69
|
)
|
||||
|
Unrealized holding gains on available-for-sale securities, net
|
40
|
|
160
|
|
||||
|
Reclassification adjustments for (gains)/losses included in net income
(a)
|
11
|
|
(174
|
)
|
||||
|
Reclassification adjustments for unrealized gains included in
Retained earnings
(b)
|
—
|
|
(462
|
)
|
||||
|
|
51
|
|
(476
|
)
|
||||
|
Benefit plans: actuarial gains, net
|
—
|
|
163
|
|
||||
|
Reclassification adjustments related to amortization
|
60
|
|
62
|
|
||||
|
Reclassification adjustments related to settlements, net
|
—
|
|
37
|
|
||||
|
Other
|
(23
|
)
|
(86
|
)
|
||||
|
|
37
|
|
175
|
|
||||
|
Reclassification adjustments related to amortization of prior service costs and other, net
|
(46
|
)
|
(46
|
)
|
||||
|
Reclassification adjustments related to curtailments of prior service costs and other, net
|
—
|
|
(7
|
)
|
||||
|
Other
|
—
|
|
2
|
|
||||
|
|
(46
|
)
|
(51
|
)
|
||||
|
Other comprehensive income, before tax
|
372
|
|
352
|
|
||||
|
Tax provision on other comprehensive income
|
25
|
|
432
|
|
||||
|
Other comprehensive income/(loss) before allocation to noncontrolling interests
|
$
|
348
|
|
$
|
(80
|
)
|
||
|
Comprehensive income before allocation to noncontrolling interests
|
$
|
4,237
|
|
$
|
3,490
|
|
||
|
Less: Comprehensive income attributable to noncontrolling interests
|
1
|
|
10
|
|
||||
|
Comprehensive income attributable to Pfizer Inc.
|
$
|
4,236
|
|
$
|
3,480
|
|
||
|
(a)
|
Reclassified into
Other (income)/deductions—net
and
Cost of sales
in the condensed consolidated statements of income. For additional information on amounts reclassified into
Cost of sales,
see
Note 7E. Financial Instruments: Derivative Financial Instruments and Hedging Activities.
|
|
(b)
|
For additional information, see
Note 1B
.
Basis of Presentation and Significant Accounting Policies: Adoption of New Accounting Standards in 2018
in our 2018 Financial Report.
|
Amounts may not add due to rounding.
See Notes to Condensed Consolidated Financial Statements.
6
PFIZER INC. AND SUBSIDIARY COMPANIES
CONDENSED CONSOLIDATED BALANCE SHEETS
|
(MILLIONS OF DOLLARS)
|
March 31,
2019 |
|
December 31,
2018 |
|
||||
|
(Unaudited)
|
||||||||
|
Assets
|
||||||||
|
Cash and cash equivalents
|
$
|
1,937
|
|
$
|
1,139
|
|
||
|
Short-term investments
|
9,682
|
|
17,694
|
|
||||
|
Trade accounts receivable, less allowance for doubtful accounts: 2019—$538; 2018—$541
|
9,599
|
|
8,025
|
|
||||
|
Inventories
|
8,029
|
|
7,508
|
|
||||
|
Current tax assets
|
3,598
|
|
3,374
|
|
||||
|
Other current assets
|
2,567
|
|
2,461
|
|
||||
|
Assets held for sale
|
9,877
|
|
9,725
|
|
||||
|
Total current assets
|
45,290
|
|
49,926
|
|
||||
|
Long-term investments
|
2,859
|
|
2,767
|
|
||||
|
Property, plant and equipment, less accumulated depreciation: 2019—$16,158; 2018—$16,591
|
13,467
|
|
13,385
|
|
||||
|
Identifiable intangible assets, less accumulated amortization
|
34,039
|
|
35,211
|
|
||||
|
Goodwill
|
53,487
|
|
53,411
|
|
||||
|
Noncurrent deferred tax assets and other noncurrent tax assets
|
1,946
|
|
1,924
|
|
||||
|
Other noncurrent assets
|
4,333
|
|
2,799
|
|
||||
|
Total assets
|
$
|
155,421
|
|
$
|
159,422
|
|
||
|
Liabilities and Equity
|
|
|
|
|
||||
|
Short-term borrowings, including current portion of long-term debt: 2019—$4,471; 2018—$4,776
|
$
|
9,410
|
|
$
|
8,831
|
|
||
|
Trade accounts payable
|
4,156
|
|
4,674
|
|
||||
|
Dividends payable
|
—
|
|
2,047
|
|
||||
|
Income taxes payable
|
1,849
|
|
1,265
|
|
||||
|
Accrued compensation and related items
|
1,797
|
|
2,397
|
|
||||
|
Other current liabilities
|
10,276
|
|
10,753
|
|
||||
|
Liabilities held for sale
|
1,935
|
|
1,890
|
|
||||
|
Total current liabilities
|
29,423
|
|
31,858
|
|
||||
|
Long-term debt
|
35,733
|
|
32,909
|
|
||||
|
Pension benefit obligations, net
|
5,125
|
|
5,272
|
|
||||
|
Postretirement benefit obligations, net
|
1,332
|
|
1,338
|
|
||||
|
Noncurrent deferred tax liabilities
|
3,591
|
|
3,700
|
|
||||
|
Other taxes payable
|
14,712
|
|
14,737
|
|
||||
|
Other noncurrent liabilities
|
6,346
|
|
5,850
|
|
||||
|
Total liabilities
|
96,263
|
|
95,664
|
|
||||
|
Commitments and Contingencies
|
|
|
|
|
||||
|
Preferred stock
|
19
|
|
19
|
|
||||
|
Common stock
|
468
|
|
467
|
|
||||
|
Additional paid-in capital
|
86,635
|
|
86,253
|
|
||||
|
Treasury stock
|
(110,781
|
)
|
(101,610
|
)
|
||||
|
Retained earnings
|
93,388
|
|
89,554
|
|
||||
|
Accumulated other comprehensive loss
|
(10,923
|
)
|
(11,275
|
)
|
||||
|
Total Pfizer Inc. shareholders’ equity
|
58,806
|
|
63,407
|
|
||||
|
Equity attributable to noncontrolling interests
|
352
|
|
351
|
|
||||
|
Total equity
|
59,158
|
|
63,758
|
|
||||
|
Total liabilities and equity
|
$
|
155,421
|
|
$
|
159,422
|
|
||
Amounts may not add due to rounding.
See Notes to Condensed Consolidated Financial Statements.
7
PFIZER INC. AND SUBSIDIARY COMPANIES
CONDENSED CONSOLIDATED STATEMENTS OF EQUITY
|
PFIZER INC. SHAREHOLDERS
|
|||||||||||||||||||||||||||||||||||||||||||||
|
Preferred Stock
|
Common Stock
|
Treasury Stock
|
|||||||||||||||||||||||||||||||||||||||||||
|
(MILLIONS, EXCEPT PREFERRED SHARES)
|
Shares
|
|
Stated Value
|
|
Shares
|
|
Par Value
|
|
Add’l
Paid-In Capital
|
|
Shares
|
|
Cost
|
|
Retained Earnings
|
|
Accum. Other Comp.
Loss
|
|
Share-
holders’ Equity
|
|
Non-controlling interests
|
|
Total Equity
|
|
|||||||||||||||||||||
|
Balance, January 1, 2019
|
478
|
|
$
|
19
|
|
9,332
|
|
$
|
467
|
|
$
|
86,253
|
|
(3,615
|
)
|
$
|
(101,610
|
)
|
$
|
89,554
|
|
$
|
(11,275
|
)
|
$
|
63,407
|
|
$
|
351
|
|
$
|
63,758
|
|
||||||||||||
|
Net income
|
3,884
|
|
3,884
|
|
6
|
|
3,889
|
|
|||||||||||||||||||||||||||||||||||||
|
Other comprehensive income/(loss), net of tax
|
353
|
|
353
|
|
(4
|
)
|
348
|
|
|||||||||||||||||||||||||||||||||||||
|
Cash dividends declared:
|
|
|
|||||||||||||||||||||||||||||||||||||||||||
|
Common stock
|
(68
|
)
|
(68
|
)
|
(68
|
)
|
|||||||||||||||||||||||||||||||||||||||
|
Preferred stock
|
—
|
|
—
|
|
—
|
|
|||||||||||||||||||||||||||||||||||||||
|
Noncontrolling interests
|
—
|
|
—
|
|
—
|
|
|||||||||||||||||||||||||||||||||||||||
|
Share-based payment transactions
|
26
|
|
1
|
|
383
|
|
(7
|
)
|
(306
|
)
|
78
|
|
78
|
|
|||||||||||||||||||||||||||||||
|
Purchases of common stock
|
(180
|
)
|
(8,865
|
)
|
(8,865
|
)
|
(8,865
|
)
|
|||||||||||||||||||||||||||||||||||||
|
Preferred stock conversions and redemptions
|
(12
|
)
|
—
|
|
(1
|
)
|
—
|
|
—
|
|
(1
|
)
|
(1
|
)
|
|||||||||||||||||||||||||||||||
|
Other
(a)
|
—
|
|
—
|
|
—
|
|
—
|
|
—
|
|
19
|
|
—
|
|
19
|
|
—
|
|
19
|
|
|||||||||||||||||||||||||
|
Balance, March 31, 2019
|
466
|
|
$
|
19
|
|
9,358
|
|
$
|
468
|
|
$
|
86,635
|
|
(3,801
|
)
|
$
|
(110,781
|
)
|
$
|
93,388
|
|
$
|
(10,923
|
)
|
$
|
58,806
|
|
$
|
352
|
|
$
|
59,158
|
|
||||||||||||
|
PFIZER INC. SHAREHOLDERS
|
|||||||||||||||||||||||||||||||||||||||||||||
|
Preferred Stock
|
Common Stock
|
Treasury Stock
|
|||||||||||||||||||||||||||||||||||||||||||
|
(MILLIONS, EXCEPT PREFERRED SHARES)
|
Shares
|
|
Stated Value
|
|
Shares
|
|
Par Value
|
|
Add’l
Paid-In Capital
|
|
Shares
|
|
Cost
|
|
Retained Earnings
|
|
Accum. Other Comp.
Loss
|
|
Share-
holders’ Equity
|
|
Non-controlling interests
|
|
Total Equity
|
|
|||||||||||||||||||||
|
Balance, January 1, 2018
|
524
|
|
$
|
21
|
|
9,275
|
|
$
|
464
|
|
$
|
84,278
|
|
(3,296
|
)
|
$
|
(89,425
|
)
|
$
|
85,291
|
|
$
|
(9,321
|
)
|
$
|
71,308
|
|
$
|
348
|
|
$
|
71,656
|
|
||||||||||||
|
Net income
|
|
|
3,561
|
|
|
|
3,561
|
|
9
|
|
3,570
|
|
|||||||||||||||||||||||||||||||||
|
Other comprehensive income/(loss), net of tax
|
|
|
|
|
(81
|
)
|
(81
|
)
|
1
|
|
(80
|
)
|
|||||||||||||||||||||||||||||||||
|
Cash dividends declared:
|
|
|
|
|
|
|
|
|
|
|
|
|
|||||||||||||||||||||||||||||||||
|
Common stock
|
|
|
(65
|
)
|
|
|
(65
|
)
|
|
|
(65
|
)
|
|||||||||||||||||||||||||||||||||
|
Preferred stock
|
|
|
—
|
|
|
|
—
|
|
|
|
—
|
|
|||||||||||||||||||||||||||||||||
|
Noncontrolling interests
|
|
|
|
|
|
|
—
|
|
—
|
|
—
|
|
|||||||||||||||||||||||||||||||||
|
Share-based payment transactions
|
24
|
|
1
|
|
321
|
|
3
|
|
29
|
|
|
|
|
|
351
|
|
|
|
351
|
|
|||||||||||||||||||||||||
|
Purchases of common stock
|
(145
|
)
|
(6,063
|
)
|
|
|
|
|
(6,063
|
)
|
|
|
(6,063
|
)
|
|||||||||||||||||||||||||||||||
|
Preferred stock conversions and redemptions
|
(11
|
)
|
—
|
|
(1
|
)
|
—
|
|
—
|
|
|
|
|
|
(1
|
)
|
|
|
(1
|
)
|
|||||||||||||||||||||||||
|
Other
(b)
|
—
|
|
—
|
|
—
|
|
—
|
|
—
|
|
1,175
|
|
—
|
|
1,175
|
|
—
|
|
1,175
|
|
|||||||||||||||||||||||||
|
Balance, April 1, 2018
|
513
|
|
$
|
21
|
|
9,299
|
|
$
|
465
|
|
$
|
84,599
|
|
(3,437
|
)
|
$
|
(95,460
|
)
|
$
|
89,961
|
|
$
|
(9,402
|
)
|
$
|
70,184
|
|
$
|
358
|
|
$
|
70,541
|
|
||||||||||||
|
(a)
|
Represents the cumulative effect of the adoption of a new accounting standard in the first quarter of 2019 for leases. For additional information, see
Note 1B. Basis of Presentation and Significant Accounting Policies: Adoption of New Accounting Standards
.
|
|
(b)
|
Represents the cumulative effect of the adoption of new accounting standards in the first quarter of 2018 for revenues, financial assets and liabilities, income tax accounting, and the reclassification of certain tax effects from
Accumulated other comprehensive income
. For additional information, see Notes to Consolidated Financial Statements––
Note 1B. Basis of Presentation and Significant Accounting Policies: Adoption of New Accounting Standards in 2018
in Pfizer’s 2018 Financial Report.
|
Amounts may not add due to rounding.
See Notes to Condensed Consolidated Financial Statements.
8
PFIZER INC. AND SUBSIDIARY COMPANIES
CONDENSED CONSOLIDATED STATEMENTS OF CASH FLOWS (UNAUDITED)
|
|
Three Months Ended
|
|||||||
|
(MILLIONS OF DOLLARS)
|
March 31,
2019 |
|
April 1,
2018 |
|
||||
|
Operating Activities
|
|
|
||||||
|
Net income before allocation to noncontrolling interests
|
$
|
3,889
|
|
$
|
3,570
|
|
||
|
Adjustments to reconcile net income before allocation to noncontrolling interests to net cash provided by operating activities:
|
|
|
|
|
||||
|
Depreciation and amortization
|
1,545
|
|
1,567
|
|
||||
|
Asset write-offs and impairments
|
155
|
|
7
|
|
||||
|
TCJA impact
(a)
|
(131
|
)
|
(68
|
)
|
||||
|
Deferred taxes from continuing operations
|
(60
|
)
|
294
|
|
||||
|
Share-based compensation expense
|
185
|
|
182
|
|
||||
|
Benefit plan contributions in excess of expense
|
(151
|
)
|
(692
|
)
|
||||
|
Other adjustments, net
|
(236
|
)
|
(161
|
)
|
||||
|
Other changes in assets and liabilities, net of acquisitions and divestitures
|
(3,498
|
)
|
(2,715
|
)
|
||||
|
Net cash provided by operating activities
|
1,698
|
|
1,983
|
|
||||
|
Investing Activities
|
|
|
|
|
||||
|
Purchases of property, plant and equipment
|
(460
|
)
|
(386
|
)
|
||||
|
Purchases of short-term investments
|
(1,402
|
)
|
(913
|
)
|
||||
|
Proceeds from redemptions/sales of short-term investments
|
3,601
|
|
6,463
|
|
||||
|
Net proceeds from redemptions/sales of short-term investments with original maturities of three months or less
|
5,941
|
|
4,507
|
|
||||
|
Purchases of long-term investments
|
(84
|
)
|
(605
|
)
|
||||
|
Proceeds from redemptions/sales of long-term investments
|
44
|
|
576
|
|
||||
|
Acquisitions of intangible assets
|
(158
|
)
|
(32
|
)
|
||||
|
Other investing activities, net
|
67
|
|
57
|
|
||||
|
Net cash provided by investing activities
|
7,550
|
|
9,667
|
|
||||
|
Financing Activities
|
|
|
|
|
||||
|
Proceeds from short-term borrowings
|
609
|
|
428
|
|
||||
|
Principal payments on short-term borrowings
|
(1,766
|
)
|
(2,493
|
)
|
||||
|
Net proceeds from/(payments on) short-term borrowings with original maturities of three months or less
|
2,032
|
|
(83
|
)
|
||||
|
Proceeds from issuance of long-term debt
|
4,942
|
|
—
|
|
||||
|
Principal payments on long-term debt
|
(3,004
|
)
|
(355
|
)
|
||||
|
Purchases of common stock
|
(8,865
|
)
|
(6,063
|
)
|
||||
|
Cash dividends paid
|
(2,045
|
)
|
(2,032
|
)
|
||||
|
Proceeds from exercise of stock options
|
126
|
|
372
|
|
||||
|
Other financing activities, net
|
(495
|
)
|
(495
|
)
|
||||
|
Net cash used in financing activities
|
(8,467
|
)
|
(10,720
|
)
|
||||
|
Effect of exchange-rate changes on cash and cash equivalents and restricted cash and cash equivalents
|
12
|
|
55
|
|
||||
|
Net increase in cash and cash equivalents and restricted cash and cash equivalents
|
792
|
|
985
|
|
||||
|
Cash and cash equivalents and restricted cash and cash equivalents, beginning
|
1,225
|
|
1,431
|
|
||||
|
Cash and cash equivalents and restricted cash and cash equivalents, end
|
$
|
2,018
|
|
$
|
2,416
|
|
||
|
|
|
|
|
|||||
|
Supplemental Cash Flow Information
|
||||||||
|
Cash paid (received) during the period for:
|
|
|
|
|
||||
|
Income taxes
|
$
|
235
|
|
$
|
257
|
|
||
|
Interest paid
|
385
|
|
259
|
|
||||
|
Interest rate hedges
|
(33
|
)
|
20
|
|
||||
|
(a)
|
As a result of the enactment of the TCJA in December 2017, Pfizer’s
Provision for taxes on income
for (i) the
three months ended March 31, 2019
was favorably impacted by approximately
$131 million
, primarily as a result of additional guidance issued by the U.S. Department of Treasury and (ii) the
three months ended April 1, 2018
was favorably impacted by approximately
$68 million
, primarily related to certain tax initiatives associated with the lower U.S. tax rate as a result of the TCJA.
|
Amounts may not add due to rounding.
See Notes to Condensed Consolidated Financial Statements.
9
PFIZER INC. AND SUBSIDIARY COMPANIES
NOTES TO CONDENSED CONSOLIDATED FINANCIAL STATEMENTS
(UNAUDITED)
Note 1.
Basis of Presentation and Significant Accounting Policies
A. Basis of Presentation
See the Glossary of Defined Terms at the beginning of this Quarterly Report on Form 10-Q for terms used throughout the condensed consolidated financial statements and related notes in this Quarterly Report on Form 10-Q.
We prepared the condensed consolidated financial statements following the requirements of the SEC for interim reporting. As permitted under those rules, certain footnotes or other financial information that are normally required by U.S. GAAP can be condensed or omitted.
The financial information included in our condensed consolidated financial statements for subsidiaries operating outside the U.S. is as of and for the
three months
ended
February 24, 2019
and
February 25, 2018
. The financial information included in our condensed consolidated financial statements for U.S. subsidiaries is as of and for the
three months
ended
March 31, 2019
and
April 1, 2018
.
Revenues, expenses, assets and liabilities can vary during each quarter of the year. Therefore, the results and trends in these interim financial statements may not be representative of those for the full year.
We are responsible for the unaudited financial statements included in this Quarterly Report on Form 10-Q. The interim financial statements include all normal and recurring adjustments that are considered necessary for the fair statement of results for the interim periods presented. The information included in this Quarterly Report on Form 10-Q should be read in conjunction with the consolidated financial statements and accompanying notes included in our
2018
Financial Report.
At the beginning of our 2019 fiscal year, we began to manage our commercial operations through a new global structure consisting of
three
business segments––Pfizer Biopharmaceuticals Group (Biopharma), Upjohn and Consumer Healthcare. Biopharma and Upjohn are the only reportable segments. We have revised prior-period segment information to reflect the reorganization. For additional information, see
Note 13
.
Certain amounts in the condensed consolidated financial statements and associated notes may not add due to rounding. All percentages have been calculated using unrounded amounts.
In the first quarter of
2019
, as of January 1,
2019
, we adopted
four
new accounting standards. See
Note 1B
for further information.
Our recent significant business development activities include:
|
•
|
On December 19, 2018, we announced that we entered into a definitive agreement with GSK under which we and GSK have agreed to combine our respective consumer healthcare businesses into a new consumer healthcare joint venture, which will operate globally under the GSK Consumer Healthcare name. Assets and liabilities associated with our Consumer Healthcare business were reclassified as held for sale in the consolidated balance sheets as of March 31, 2019 and December 31, 2018. We expect to complete the transaction during the second half of 2019, subject to customary closing conditions, including GSK shareholder approval, which occurred on May 8, 2019, and required regulatory approvals.
|
For additional information, see
Note 2
and Notes to Consolidated Financial Statements––
Note 2. Acquisitions, Divestitures, Assets and Liabilities Held for Sale, Licensing Arrangements, Research and Development and Collaborative Arrangements, Equity-Method Investments and Privately Held Investment
in
Pfizer’s
2018
Financial Report.
B. Adoption of New Accounting Standards
On January 1, 2019, we adopted
four
new accounting standards.
Leases
––On January 1, 2019, we adopted a new accounting standard for leases and changed our lease policies accordingly. Under the new standard, the most significant change is the requirement of balance sheet recognition of ROU assets and lease liabilities by lessees for those leases classified as operating leases. We adopted the new accounting standard utilizing the modified retrospective method using a simplified transition approach, and, therefore, no adjustments were made to our prior period financial statements. We have elected the package of practical expedients for transition which are permitted in the new standard. Accordingly, we did not reassess whether (i) any expired or existing contracts are or contain leases under the new standard, (ii) classification of leases as operating leases or capital leases would be different under the new standard, or (iii) any initial direct costs would have met the definition of initial direct costs under the new standard. Additionally, we did not elect to
10
PFIZER INC. AND SUBSIDIARY COMPANIES
NOTES TO CONDENSED CONSOLIDATED FINANCIAL STATEMENTS
(UNAUDITED)
use hindsight in determining the lease term for existing leases as of January 1, 2019. We recorded noncurrent ROU assets of
$1.4 billion
and current and noncurrent operating lease liabilities of
$1.4 billion
as of January 1, 2019. We also recorded the cumulative effect of adopting the standard as an adjustment to increase the opening balance of
Retained earnings
by
$30 million
on a pre-tax basis (
$20 million
after-tax), relating to previously deferred sale-leaseback gains that can be recognized under the new rules.
|
Adopting the standard related to leases impacted our prior period condensed consolidated balance sheet as follows:
|
||||||||||||
|
(MILLIONS OF DOLLARS)
|
As Previously Reported Balance at
December 31, 2018
|
|
Effect of Change
Higher/(Lower)
|
|
Balance at
January 1, 2019
|
|
||||||
|
Other current assets
|
$
|
2,461
|
|
$
|
(1
|
)
|
$
|
2,460
|
|
|||
|
Noncurrent deferred tax assets and other noncurrent tax assets
|
1,924
|
|
(11
|
)
|
1,913
|
|
||||||
|
Other noncurrent assets
|
2,799
|
|
1,351
|
|
4,149
|
|
||||||
|
Other current liabilities
|
10,753
|
|
258
|
|
11,011
|
|
||||||
|
Other noncurrent liabilities
|
5,850
|
|
1,060
|
|
6,910
|
|
||||||
|
Retained earnings
|
89,554
|
|
20
|
|
89,574
|
|
||||||
Adoption of the standard related to leases did not have a material impact on our condensed consolidated statements of income or condensed consolidated statements of cash flows for the quarter ended
March 31, 2019
. For additional information, see
Note 1D
.
Amortization Period for Certain Callable Debt Securities Held at a Premium
––We prospectively adopted the standard, which shortens the amortization period for certain callable debt securities held at a premium. The new guidance requires the premium to be amortized to the earliest call date. We do not have any investments with features subject to this standard and, therefore, there was no impact to our condensed consolidated financial statements from the adoption of this new standard.
Accounting for Certain Financial Instruments with Characteristics of Liabilities and Equity and Accounting for Certain Financial Instruments with Down Round Features
––We prospectively adopted the standard, which changes the accounting for warrants or convertible instruments that include a down round feature. We do not have any financial instruments with features subject to this standard and, therefore, there was no impact to our condensed consolidated financial statements from the adoption of this new standard.
Accounting for Share-Based Payments to Nonemployees
––We prospectively adopted the standard, which simplifies the accounting for share-based payments to nonemployees by aligning it with the accounting for share-based payments to employees, with certain exceptions. Under the guidance, the measurement of equity-classified nonemployee awards will be fixed at the grant date. We do not have any share-based awards issued to nonemployees and, therefore, there was no impact to our condensed consolidated financial statements from the adoption of this new standard.
On January 1, 2018, we adopted
eleven
new accounting standards. For additional information, see Notes to Consolidated Financial Statements––
Note 1B. Basis of Presentation and Significant Accounting Policies: Adoption of New Accounting Standards in 2018
included in our 2018 Financial Report.
C. Revenues and Trade Accounts Receivable
Our accruals for Medicare rebates, Medicaid and related state program rebates, performance-based contract rebates, chargebacks, sales allowances and sales returns and cash discounts totaled
$5.5 billion
as of
March 31, 2019
and
$5.4 billion
as of
December 31, 2018
.
|
The following table provides information about the balance sheet classification of these accruals:
|
||||||||
|
(MILLIONS OF DOLLARS)
|
March 31, 2019
|
|
December 31, 2018
|
|
||||
|
Reserve against
Trade accounts receivable, less allowance for doubtful accounts
|
$
|
1,232
|
|
$
|
1,288
|
|
||
|
Other current liabilities
:
|
||||||||
|
Accrued rebates
|
3,344
|
|
3,208
|
|
||||
|
Other accruals
|
559
|
|
531
|
|
||||
|
Other noncurrent liabilities
|
410
|
|
399
|
|
||||
|
Total accrued rebates and other accruals
|
$
|
5,544
|
|
$
|
5,426
|
|
||
11
PFIZER INC. AND SUBSIDIARY COMPANIES
NOTES TO CONDENSED CONSOLIDATED FINANCIAL STATEMENTS
(UNAUDITED)
D. Leases
On January 1, 2019, we adopted a new accounting standard for leases. For further information, see
Note 1B
.
We lease real estate, fleet, and equipment for use in our operations. Our leases generally have lease terms of
1
to
30
years, some of which include options to terminate or extend leases for up to
5
to
10
years or on a month-to-month basis. We include options that are reasonably certain to be exercised as part of the determination of lease terms. We may negotiate termination clauses in anticipation of any changes in market conditions, but generally these termination options are not exercised. Residual value guarantees are generally not included within our operating leases with the exception of some fleet leases. In addition to base rent payments, the leases may require us to pay directly for taxes and other non-lease components, such as insurance, maintenance and other operating expenses, which may be dependent on usage or vary month-to-month. Variable lease payments amounted to
$59 million
for the three months ended
March 31, 2019
. We have elected the practical expedient in the new standard to not separate non-lease components from lease components in calculating the amounts of ROU assets and lease liabilities for all underlying asset classes.
We determine if an arrangement is a lease at inception of the contract in accordance with guidance detailed in the new standard and we perform the lease classification test as of the lease commencement date. ROU assets represent our right to use an underlying asset for the lease term and lease liabilities represent our obligation to make lease payments arising from the lease. Operating lease ROU assets and liabilities are recognized at commencement date based on the present value of lease payments over the lease term. As most of our leases do not provide an implicit rate, we use our estimated incremental borrowing rate based on the information available at commencement date in determining the present value of future payments.
|
For operating leases, the ROU assets and liabilities are presented in our condensed consolidated balance sheet as follows:
|
||||||
|
(MILLIONS OF DOLLARS)
|
Balance Sheet
Classification
|
Balance at
March 31, 2019
|
|
|||
|
ROU assets
|
Other noncurrent assets
|
$
|
1,280
|
|
||
|
Lease liabilities (short-term)
|
Other current liabilities
|
253
|
|
|||
|
Lease liabilities (long-term)
|
Other noncurrent liabilities
|
1,043
|
|
|||
|
Our total lease costs are as follows:
|
||||
|
Three Months Ended
|
|
|||
|
(MILLIONS OF DOLLARS)
|
March 31, 2019
|
|
||
|
Operating lease cost
|
$
|
100
|
|
|
|
Variable lease cost
|
59
|
|
||
|
Sublease income
|
(10
|
)
|
||
|
Total lease cost
|
$
|
149
|
|
|
|
Other supplemental information includes the following:
|
|||||
|
(MILLIONS OF DOLLARS)
|
Weighted-Average Remaining Contractual Lease Term (Years)
|
Three Months Ended
|
|
||
|
March 31, 2019
|
|
||||
|
Operating leases
|
7.5
|
||||
|
Weighted-average discount rate:
|
|||||
|
Operating leases
|
3.7
|
%
|
|||
|
Cash paid for amounts included in the measurement of lease liabilities:
|
|||||
|
Operating cash flows from operating leases
|
78
|
|
|||
|
ROU assets obtained in exchange for new operating lease liabilities
|
46
|
|
|||
12
PFIZER INC. AND SUBSIDIARY COMPANIES
NOTES TO CONDENSED CONSOLIDATED FINANCIAL STATEMENTS
(UNAUDITED)
|
The table below reconciles the undiscounted cash flows for the first five years and total of the remaining years to the operating lease liabilities recorded in the condensed consolidated balance sheet as of March 31, 2019:
|
||||
|
(MILLIONS OF DOLLARS)
|
||||
|
Period
|
Operating Lease Liabilities
|
|||
|
Next one year
(a)
|
$
|
287
|
|
|
|
1-2 years
|
241
|
|
||
|
2-3 years
|
207
|
|
||
|
3-4 years
|
175
|
|
||
|
4-5 years
|
144
|
|
||
|
Thereafter
|
435
|
|
||
|
Total undiscounted lease payments
|
1,489
|
|
||
|
Less: Imputed interest
|
193
|
|
||
|
Present Value of Minimum Lease Payments
|
1,296
|
|
||
|
Less: Current portion
|
253
|
|
||
|
Noncurrent portion
|
$
|
1,043
|
|
|
|
(a)
|
Reflects lease payments due within 12 months subsequent to the balance sheet date.
|
In April 2018, we entered an agreement to lease space in an office building in New York City. We will relocate our global headquarters to this property with commencement expected in 2022. Our future minimum rental commitment under this
20
-year lease is approximately
$1.7 billion
.
Prior to our adoption of the new lease standard, rental expense, net of sublease income, was
$301 million
in 2018,
$314 million
in 2017 and
$292 million
in 2016.
|
As of December 31, 2018, the future minimum rental commitments under non-cancelable operating leases follow:
|
||||||||||||||||||||||||
|
(MILLIONS OF DOLLARS)
|
2019
|
|
2020
|
|
2021
|
|
2022
|
|
2023
|
|
After 2023
|
|
||||||||||||
|
Lease commitments
|
$
|
300
|
|
$
|
252
|
|
$
|
210
|
|
$
|
267
|
|
$
|
248
|
|
$
|
2,040
|
|
||||||
Note 2.
Assets and Liabilities Held for Sale
On December 19, 2018, we announced that we entered into a definitive agreement with GSK under which we and GSK have agreed to combine our respective consumer healthcare businesses into a new consumer healthcare joint venture that will operate globally under the GSK Consumer Healthcare name. In exchange for contributing our Consumer Healthcare business, we will receive a
32%
equity stake in the new company and GSK will own the remaining
68%
. The transaction is expected to close in the second half of 2019, subject to customary closing conditions, including GSK shareholder approval, which occurred on May 8, 2019, and required regulatory approvals. Upon the closing of the transaction, we will deconsolidate our Consumer Healthcare business and recognize a gain for the difference in the fair value of our
32%
equity stake in the new company and the carrying value of our Consumer Healthcare business. We will account for our
32%
equity stake in the new company after closing of the transaction as an equity-method investment. Assets and liabilities associated with our Consumer Healthcare business were reclassified as held for sale in the consolidated balance sheets as of March 31, 2019 and December 31, 2018. The Consumer Healthcare business assets held for sale are reported in
Assets held for sale
and Consumer Healthcare business liabilities held for sale are reported in
Liabilities held for sale
. This includes the Consumer Healthcare business tax assets and liabilities related to fully dedicated consumer healthcare subsidiaries. The amounts associated with the Consumer Healthcare business, as well as other assets classified as held for sale consisted of the following:
13
PFIZER INC. AND SUBSIDIARY COMPANIES
NOTES TO CONDENSED CONSOLIDATED FINANCIAL STATEMENTS
(UNAUDITED)
|
(MILLIONS OF DOLLARS)
|
March 31, 2019
|
December 31, 2018
|
||||||
|
Assets Held for Sale
|
||||||||
|
Cash and cash equivalents
|
$
|
61
|
|
$
|
32
|
|
||
|
Trade accounts receivable, less allowance for doubtful accounts
|
550
|
|
532
|
|
||||
|
Inventories
|
563
|
|
538
|
|
||||
|
Other current assets
|
57
|
|
56
|
|
||||
|
PP&E
|
687
|
|
675
|
|
||||
|
Identifiable intangible assets, less accumulated amortization
|
5,776
|
|
5,763
|
|
||||
|
Goodwill
|
1,972
|
|
1,972
|
|
||||
|
Noncurrent deferred tax assets and other noncurrent tax assets
|
59
|
|
54
|
|
||||
|
Other noncurrent assets
|
105
|
|
57
|
|
||||
|
Total Consumer Healthcare assets held for sale
|
9,830
|
|
9,678
|
|
||||
|
Other assets held for sale
(a)
|
47
|
|
46
|
|
||||
|
Assets held for sale
|
$
|
9,877
|
|
$
|
9,725
|
|
||
|
Liabilities Held for Sale
|
||||||||
|
Trade accounts payable
|
$
|
335
|
|
$
|
406
|
|
||
|
Income taxes payable
|
55
|
|
39
|
|
||||
|
Accrued compensation and related items
|
140
|
|
93
|
|
||||
|
Other current liabilities
|
371
|
|
353
|
|
||||
|
Pension benefit obligations, net
|
39
|
|
39
|
|
||||
|
Postretirement benefit obligations, net
|
33
|
|
33
|
|
||||
|
Noncurrent deferred tax liabilities
|
884
|
|
870
|
|
||||
|
Other noncurrent liabilities
|
78
|
|
56
|
|
||||
|
Total Consumer Healthcare liabilities held for sale
|
$
|
1,935
|
|
$
|
1,890
|
|
||
|
(a)
|
Other assets held for sale consist of PP&E.
|
As a part of Pfizer, pre-tax income on a management business unit basis for the Consumer Healthcare business was
$281 million
for the
three months
ended
March 31, 2019
and
$265 million
for the
three months
ended 2018.
Note 3.
Restructuring Charges and Other Costs Associated with Acquisitions and Cost-Reduction/Productivity Initiatives
We incur significant costs in connection with acquiring, integrating and restructuring businesses and in connection with our global cost-reduction/productivity initiatives. For example:
|
•
|
In connection with acquisition activity, we typically incur costs associated with executing the transactions, integrating the acquired operations (which may include expenditures for consulting and the integration of systems and processes), and restructuring the combined company (which may include charges related to employees, assets and activities that will not continue in the combined company); and
|
|
•
|
In connection with our cost-reduction/productivity initiatives, we typically incur costs and charges associated with site closings and other facility rationalization actions, workforce reductions and the expansion of shared services, including the development of global systems.
|
All of our businesses and functions may be impacted by these actions, including sales and marketing, manufacturing and R&D, as well as groups such as information technology, shared services and corporate operations.
2017-2019 Initiatives and Organizing for Growth
During 2018, as we reviewed our business opportunities and challenges and the way in which we think about our business operations, we determined that at the start of our 2019 fiscal year, we would begin operating under our new commercial structure, which reorganizes our operations into
three
businesses
––
Biopharma,
a science-based innovative medicines business; Upjohn, a global, primarily off-patent branded and generic established medicines business; and a Consumer Healthcare business (see
Note 13
). To operate effectively in this structure and position ourselves for future growth, we are focused on creating a simpler, more efficient operating structure within each business as well as the functions that support them. Beginning in the fourth quarter of 2018, we reviewed previously planned initiatives and new initiatives to ensure that there was alignment around our new structure and combined the 2017-2019 initiatives with our current Organizing for Growth initiatives to form one cohesive plan. Initiatives for the combined program include activities related to the optimization of our manufacturing plant network, the centralization of our corporate and platform functions, and the simplification and optimization of our operating
14
PFIZER INC. AND SUBSIDIARY COMPANIES
NOTES TO CONDENSED CONSOLIDATED FINANCIAL STATEMENTS
(UNAUDITED)
business structure and functions that support them. Through
March 31, 2019
, we incurred approximately
$735 million
associated with manufacturing optimization, and approximately
$793 million
associated with other activities.
In 2019, we expect restructuring, implementation and additional depreciation charges of about
$800 million
and, of that amount, we expect approximately
20%
of the total charges will be non-cash.
Current-Period Key Activities
For the first
three months
of
2019
, we incurred costs of
$92 million
composed of
$64 million
associated with the 2017-2019 and Organizing for Growth initiatives,
$25 million
associated with the integration of Hospira and
$3 million
associated with all other acquisition-related initiatives.
|
The following table provides the components of costs associated with acquisitions and cost-reduction/productivity initiatives:
|
||||||||
|
|
Three Months Ended
|
|||||||
|
(MILLIONS OF DOLLARS)
|
March 31,
2019 |
|
April 1,
2018 |
|
||||
|
Restructuring charges/(credits):
|
|
|
|
|
||||
|
Employee terminations
|
$
|
(2
|
)
|
$
|
(8
|
)
|
||
|
Asset impairments
|
9
|
|
2
|
|
||||
|
Exit costs
|
3
|
|
(3
|
)
|
||||
|
Restructuring charges/(credits)
(a)
|
10
|
|
(9
|
)
|
||||
|
Integration costs
(b)
|
36
|
|
52
|
|
||||
|
Restructuring charges and certain acquisition-related costs
|
46
|
|
43
|
|
||||
|
Net periodic benefit costs recorded in
Other (income)/deductions––net
|
6
|
|
32
|
|
||||
|
Additional depreciation––asset restructuring
recorded in our condensed consolidated statements of income as follows
(c)
:
|
|
|
|
|
||||
|
Cost of sales
|
9
|
|
17
|
|
||||
|
Selling, informational and administrative expenses
|
1
|
|
—
|
|
||||
|
Research and development expenses
|
3
|
|
—
|
|
||||
|
Total additional depreciation––asset restructuring
|
13
|
|
17
|
|
||||
|
Implementation costs recorded in our condensed consolidated statements of income as follows
(d)
:
|
|
|
|
|
||||
|
Cost of sales
|
13
|
|
16
|
|
||||
|
Selling, informational and administrative expenses
|
9
|
|
17
|
|
||||
|
Research and development expenses
|
4
|
|
6
|
|
||||
|
Total implementation costs
|
26
|
|
39
|
|
||||
|
Total costs associated with acquisitions and cost-reduction/productivity initiatives
|
$
|
92
|
|
$
|
131
|
|
||
|
(a)
|
In the
first quarter
of
2019
, restructuring charges are primarily associated with cost reduction initiatives and mainly represent asset write downs, partially offset by the reversal of previously recorded accruals for employee termination costs and asset impairments related to our acquisition of Hospira. In the
three months ended April 1, 2018
, restructuring credits were primarily due to the reversal of previously recorded accruals for exit costs related to our acquisition of Hospira, as well as cost-reduction and productivity initiatives not associated with acquisitions.
|
The restructuring activities for the
three months ended March 31, 2019
are associated with the following:
|
•
|
Biopharma (
$13 million
charge
); Upjohn (
$13 million
credit
); and Other (
$10 million
charge).
|
The restructuring activities for the
three months ended April 1, 2018
are associated with the following:
|
•
|
Total reportable segments (
$14 million
credit); and Other (
$4 million
charge). At the beginning of fiscal 2019, we revised our operating segments and are unable to directly associate these prior-period restructuring charges with the new individual segments.
|
|
(b)
|
Integration costs represent external, incremental costs directly related to integrating acquired businesses, and primarily include expenditures for consulting and the integration of systems and processes. In the
first quarter
of
2019
and 2018, integration costs were primarily related to our acquisition of Hospira.
|
|
(c)
|
Additional depreciation––asset restructuring represents the impact of changes in the estimated useful lives of assets involved in restructuring actions.
|
|
(d)
|
Implementation costs represent external, incremental costs directly related to implementing our non-acquisition-related cost-reduction/productivity initiatives.
|
15
PFIZER INC. AND SUBSIDIARY COMPANIES
NOTES TO CONDENSED CONSOLIDATED FINANCIAL STATEMENTS
(UNAUDITED)
|
The following table provides the components of and changes in our restructuring accruals:
|
||||||||||||||||
|
(MILLIONS OF DOLLARS)
|
Employee
Termination Costs
|
|
Asset
Impairment Charges
|
|
Exit Costs
|
|
Accrual
|
|
||||||||
|
Balance, December 31, 2018
(a)
|
$
|
1,203
|
|
$
|
—
|
|
$
|
49
|
|
$
|
1,252
|
|
||||
|
Provision/(Credit)
|
(2
|
)
|
9
|
|
3
|
|
10
|
|
||||||||
|
Utilization and other
(b)
|
(145
|
)
|
(9
|
)
|
(15
|
)
|
(169
|
)
|
||||||||
|
Balance, March 31, 2019
(c)
|
$
|
1,057
|
|
$
|
—
|
|
$
|
37
|
|
$
|
1,093
|
|
||||
|
(a)
|
Included in
Other current liabilities
(
$823 million
) and
Other noncurrent liabilities
(
$428 million
).
|
|
(b)
|
Includes adjustments for foreign currency translation.
|
|
(c)
|
Included in
Other current liabilities
(
$669 million
) and
Other noncurrent liabilities
(
$424 million
).
|
Note 4.
Other (Income)/Deductions—Net
|
The following table provides components of
Other (income)/deductions––net
:
|
||||||||
|
|
Three Months Ended
|
|||||||
|
(MILLIONS OF DOLLARS)
|
March 31,
2019 |
|
|
April 1,
2018 |
|
|||
|
Interest income
(a)
|
$
|
(66
|
)
|
$
|
(77
|
)
|
||
|
Interest expense
(a)
|
361
|
|
310
|
|
||||
|
Net interest expense
|
295
|
|
233
|
|
||||
|
Royalty-related income
|
(89
|
)
|
(96
|
)
|
||||
|
Net gains on asset disposals
|
(1
|
)
|
(7
|
)
|
||||
|
Net gains recognized during the period on investments in equity securities
(b)
|
(111
|
)
|
|
(118
|
)
|
|||
|
Net realized losses on sales of investments in debt securities
|
—
|
|
|
3
|
|
|||
|
Income from collaborations, out-licensing arrangements and sales of compound/product rights
(c)
|
(82
|
)
|
(142
|
)
|
||||
|
Net periodic benefit credits other than service costs
(d)
|
(40
|
)
|
(82
|
)
|
||||
|
Certain legal matters, net
|
4
|
|
(19
|
)
|
||||
|
Certain asset impairments
(e)
|
150
|
|
—
|
|
||||
|
Business and legal entity alignment costs
(f)
|
119
|
|
3
|
|
||||
|
Net losses on early retirement of debt
(g)
|
138
|
|
3
|
|
||||
|
Other, net
(h)
|
(291
|
)
|
|
42
|
|
|||
|
Other (income)/deductions––net
|
$
|
92
|
|
$
|
(178
|
)
|
||
|
(a)
|
Interest income decreased in the
first quarter
of
2019
, primarily driven by a lower investment balance. Interest expense increased in the
first quarter
of
2019
, primarily as a result of higher interest rates.
|
|
(b)
|
The net gains on investments in equity securities for the
first quarter
of
2019
include gains of
$43 million
related to our investment in Allogene. The
first quarter
of
2018
included gains of
$61 million
related to our investment in ICU Medical stock.
For additional information, see
Note 7B
.
|
|
(c)
|
Includes income from upfront and milestone payments from our collaboration partners and income from out-licensing arrangements and sales of compound/product rights. In the
first
quarter of
2019
, primarily includes
$60 million
in milestone income from Mylan Pharmaceuticals Inc. related to the FDA’s approval and launch of Wixela Inhub
®
, a generic of Advair Diskus
®
(fluticasone propionate and salmeterol inhalation powder). In the
first
quarter of
2018
, primarily includes, among other things, a
$75 million
milestone payment received from Shire related to their first dosing of a patient in a Phase III clinical trial of a compound out-licensed by Pfizer to Shire for the treatment of ulcerative colitis, and a
$40 million
milestone payment from Merck in conjunction with the approval of ertugliflozin in the EU.
|
|
(d)
|
For additional information, see
Note 10
.
|
|
(e)
|
In the
first quarter
of
2019
, primarily includes intangible asset impairment charges of
$130 million
composed of: (i)
$90 million
related to WRDM IPR&D, which relates to a pre-clinical stage asset from our acquisition of Bamboo Therapeutics, Inc. (Bamboo) for gene therapies for the potential treatment of patients with certain rare diseases; and (ii)
$40 million
related to a Biopharma developed technology right, acquired in connection with our acquisition of King, for government defense products. The WRDM IPR&D intangible asset impairment charge was the result of a determination to not use certain Bamboo IPR&D acquired in future rare disease development. The intangible asset impairment charge related to the Biopharma developed technology right reflects, among other things, updated commercial forecasts including manufacturing cost assumptions. In addition, the
first quarter
of
2019
includes other asset impairments of
$20 million
.
|
|
(f)
|
In the first quarter of 2019, represents incremental costs associated with the design, planning and implementation of our new organizational structure, effective in the beginning of 2019, and primarily includes consulting, legal, tax and advisory services. In the first quarter of 2018, represents expenses for changes to our infrastructure to align our commercial operations that existed through December 31, 2018, including costs to internally separate our businesses into distinct legal entities, as well as to streamline our intercompany supply operations to better support each business.
|
|
(g)
|
In
first quarter
of
2019
, represents net losses due to the early retirement of debt, inclusive of the related termination of cross-currency swaps.
|
|
(h)
|
In the
first quarter
of
2019
, includes among other things, credits of
$72 million
, reflecting the change in the fair value of contingent consideration, and dividend income of
$64 million
from our investment in ViiV. In the
first quarter
of
2018
, primarily includes, among other things, charges of
$102 million
, reflecting the change in the fair value of contingent consideration, partially offset by dividend income of
$59 million
from our investment in ViiV.
|
16
PFIZER INC. AND SUBSIDIARY COMPANIES
NOTES TO CONDENSED CONSOLIDATED FINANCIAL STATEMENTS
(UNAUDITED)
|
The following table provides additional information about the intangible assets that were impaired in the first quarter of 2019 in
Other (income)/deductions:
|
||||||||||||||||||||
|
Fair Value
(a)
|
Three Months Ended March 31, 2019
|
|||||||||||||||||||
|
(MILLIONS OF DOLLARS)
|
Amount
|
Level 1
|
Level 2
|
Level 3
|
Impairment
|
|||||||||||||||
|
Intangible assets
––
IPR&D
(b)
|
$
|
—
|
|
$
|
—
|
|
$
|
—
|
|
$
|
—
|
|
$
|
90
|
|
|||||
|
Intangible assets––Developed technology right
(b)
|
—
|
|
—
|
|
—
|
|
—
|
|
40
|
|
||||||||||
|
Total
|
$
|
—
|
|
$
|
—
|
|
$
|
—
|
|
$
|
—
|
|
$
|
130
|
|
|||||
|
(a)
|
The fair value amount is presented as of the date of impairment, as these assets are not measured at fair value on a recurring basis.
|
|
(b)
|
Reflects intangible assets written down to fair value in the first
three months
of
2019
. Fair value was determined using the income approach, specifically the multi-period excess earnings method, also known as the discounted cash flow method. We started with a forecast of all the expected net cash flows associated with the asset and then applied an asset-specific discount rate to arrive at a net present value amount. Some of the more significant estimates and assumptions inherent in this approach include: the amount and timing of the projected net cash flows, which includes the expected impact of competitive, legal and/or regulatory forces on the product; the discount rate, which seeks to reflect the various risks inherent in the projected cash flows; and the tax rate, which seeks to incorporate the geographic diversity of the projected cash flows.
|
Note 5.
Tax Matters
A. Taxes on Income from Continuing Operations
Our effective tax rate for continuing operations was
10.0%
for the
first
quarter of
2019
, compared to
13.5%
for the
first
quarter of
2018
.
The
lower
effective tax rate for the
first
quarter of 2019 in comparison with the same period in
2018
was primarily due to:
|
•
|
the tax benefit recorded as a result of additional guidance issued by the U.S. Department of Treasury related to the enactment of the TCJA;
|
|
•
|
the favorable change in the jurisdictional mix of earnings as a result of operating fluctuations in the normal course of business, as well as
|
|
•
|
an increase in tax benefits associated with the resolution of certain tax positions pertaining to prior years, and the expiration of certain statutes of limitations.
|
Our estimated
$15 billion
repatriation tax liability on accumulated post-1986 foreign earnings for which we plan to elect, with the filing of our 2018 U.S. Federal Consolidated Income Tax Return, payment over eight years through 2026 is reported in
Income
taxes payable
(
$750 million
) and the remaining liability is reported in
Other taxes payable
in our consolidated balance sheet as of March 31, 2019. The first installment of
$750 million
was paid in April 2019.
B. Tax Contingencies
We are subject to income tax in many jurisdictions, and a certain degree of estimation is required in recording the assets and liabilities related to income taxes. All of our tax positions are subject to audit by the local taxing authorities in each tax jurisdiction. These tax audits can involve complex issues, interpretations and judgments and the resolution of matters may span multiple years, particularly if subject to negotiation or litigation. Our assessments are based on estimates and assumptions that have been deemed reasonable by management, but our estimates of unrecognized tax benefits and potential tax benefits may not be representative of actual outcomes, and variation from such estimates could materially affect our financial statements in the period of settlement or when the statutes of limitations expire, as we treat these events as discrete items in the period of resolution.
The U.S. is one of our major tax jurisdictions, and we are regularly audited by the IRS. With respect to Pfizer, the IRS has issued a Revenue Agent’s Report (RAR) for tax years 2009-2010. We are not in agreement with the RAR and are currently appealing certain disputed issues. Tax years 2011-2015 are currently under audit. Tax years 2016-2019 are open, but not under audit. All other tax years are closed.
In addition to the open audit years in the U.S., we have open audit years in other major tax jurisdictions, such as Canada (2013-2019), Japan (2017-2019), Europe (2011-2019, primarily reflecting Ireland, the United Kingdom, France, Italy, Spain and Germany), Latin America (1998-2019, primarily reflecting Brazil) and Puerto Rico (2011-2019).
17
PFIZER INC. AND SUBSIDIARY COMPANIES
NOTES TO CONDENSED CONSOLIDATED FINANCIAL STATEMENTS
(UNAUDITED)
C.
Tax Provision on Other Comprehensive Income
|
The following table provides the components of
Tax provision on
other comprehensive income
:
|
||||||||
|
Three Months Ended
|
||||||||
|
(MILLIONS OF DOLLARS)
|
March 31,
2019 |
|
April 1,
2018 |
|
||||
|
Foreign currency translation adjustments, net
(a)
|
$
|
27
|
|
$
|
(34
|
)
|
||
|
Unrealized holding gains/(losses) on derivative financial instruments, net
|
59
|
|
(4
|
)
|
||||
|
Reclassification adjustments for (gains)/losses included in net income
|
(55
|
)
|
(7
|
)
|
||||
|
Reclassification adjustments of certain tax effects from AOCI to
Retained earnings
(b)
|
—
|
|
1
|
|
||||
|
4
|
|
(9
|
)
|
|||||
|
Unrealized holding gains on available-for-sale securities, net
|
5
|
|
20
|
|
||||
|
Reclassification adjustments for (gains)/losses included in net income
|
1
|
|
(22
|
)
|
||||
|
Reclassification adjustments for tax on unrealized gains from AOCI to
Retained earnings
(c)
|
—
|
|
(45
|
)
|
||||
|
7
|
|
(47
|
)
|
|||||
|
Benefit plans: actuarial gains, net
|
—
|
|
38
|
|
||||
|
Reclassification adjustments related to amortization
|
3
|
|
14
|
|
||||
|
Reclassification adjustments related to settlements, net
|
—
|
|
9
|
|
||||
|
Reclassification adjustments of certain tax effects from AOCI to
Retained earnings
(b)
|
—
|
|
637
|
|
||||
|
Other
|
(5
|
)
|
(20
|
)
|
||||
|
(2
|
)
|
677
|
|
|||||
|
Reclassification adjustments related to amortization of prior service costs and other, net
|
(11
|
)
|
(11
|
)
|
||||
|
Reclassification adjustments related to curtailments of prior service costs and other, net
|
—
|
|
(7
|
)
|
||||
|
Reclassification adjustments of certain tax effects from AOCI to
Retained earnings
(b)
|
—
|
|
(144
|
)
|
||||
|
Other
|
—
|
|
6
|
|
||||
|
(11
|
)
|
(155
|
)
|
|||||
|
Tax provision on other comprehensive income
|
$
|
25
|
|
$
|
432
|
|
||
|
(a)
|
Taxes are not provided for foreign currency translation adjustments relating to investments in international subsidiaries that will be held indefinitely.
|
|
(b)
|
For additional information on the adoption of a new accounting standard related to reclassification of certain tax effects from AOCI, see
Note 1B. Basis of Presentation and Significant Accounting Policies: Adoption of New Accounting Standards in 2018
in our 2018 Financial Report.
|
|
(c)
|
For additional information on the adoption of a new accounting standard related to financial assets and liabilities, see
Note 1B
.
Basis of Presentation and Significant Accounting Policies: Adoption of New Accounting Standards in 2018
in our 2018 Financial Report.
|
Note 6.
Accumulated Other Comprehensive Loss, Excluding Noncontrolling Interests
|
The following table provides the changes, net of tax, in
Accumulated other comprehensive loss
:
|
||||||||||||||||||||||||
|
|
Net Unrealized Gains/(Losses)
|
Benefit Plans
|
|
|||||||||||||||||||||
|
(MILLIONS OF DOLLARS)
|
Foreign Currency Translation Adjustments
|
|
Derivative Financial Instruments
|
|
Available-For-Sale Securities
|
|
Actuarial Gains/(Losses)
|
|
Prior Service (Costs)/Credits and Other
|
|
Accumulated Other Comprehensive Income/(Loss)
|
|
||||||||||||
|
Balance, December 31, 2018
|
$
|
(6,075
|
)
|
$
|
167
|
|
$
|
(68
|
)
|
$
|
(6,027
|
)
|
$
|
728
|
|
$
|
(11,275
|
)
|
||||||
|
Other comprehensive income/(loss)
(a)
|
304
|
|
—
|
|
44
|
|
40
|
|
(35
|
)
|
353
|
|
||||||||||||
|
Balance, March 31, 2019
|
$
|
(5,772
|
)
|
$
|
167
|
|
$
|
(24
|
)
|
$
|
(5,986
|
)
|
$
|
693
|
|
$
|
(10,923
|
)
|
||||||
|
(a)
|
Amounts do not include foreign currency translation adjustments attributable to noncontrolling interests of
$4 million
loss for
the first three months of
2019
.
|
As of
March 31, 2019
,
with respect to derivative financial instruments, the amount of unrealized pre-tax net
gains
on derivative financial instruments estimated to be reclassified into income within the next 12 months is approximately
$345 million
. The net gains are expected to be offset primarily by net
losses
from reclassification adjustments related to foreign currency exchange-denominated forecasted intercompany inventory sales and available-for-sale debt securities.
18
PFIZER INC. AND SUBSIDIARY COMPANIES
NOTES TO CONDENSED CONSOLIDATED FINANCIAL STATEMENTS
(UNAUDITED)
Note 7.
Financial Instruments
A. Fair Value Measurements
Financial Assets and Liabilities Measured at Fair Value on a Recurring Basis
|
The following table presents the financial assets and liabilities measured at fair value using a market approach on a recurring basis by balance sheet categories and fair value hierarchy level as defined in Notes to Consolidated Financial Statements––
Note 1E. Basis of Presentation and Significant Accounting Policies: Fair Value
in Pfizer’s 2018 Financial Report:
|
||||||||||||||||||||||||
|
March 31, 2019
|
December 31, 2018
|
|||||||||||||||||||||||
|
(MILLIONS OF DOLLARS)
|
Total
|
Level 1
|
Level 2
|
Total
|
Level 1
|
Level 2
|
||||||||||||||||||
|
Financial assets measured at fair value on a recurring basis:
|
||||||||||||||||||||||||
|
Short-term investments
|
||||||||||||||||||||||||
|
Classified as equity securities:
|
||||||||||||||||||||||||
|
Money market funds
|
$
|
1,570
|
|
|
$
|
—
|
|
|
$
|
1,570
|
|
|
$
|
1,571
|
|
|
$
|
—
|
|
|
$
|
1,571
|
|
|
|
Equity
(a)
|
26
|
|
16
|
|
11
|
|
29
|
|
17
|
|
11
|
|
||||||||||||
|
1,597
|
|
16
|
|
1,581
|
|
1,600
|
|
17
|
|
1,583
|
|
|||||||||||||
|
Classified as available-for-sale debt securities:
|
||||||||||||||||||||||||
|
Government and agency—non-U.S.
|
5,406
|
|
—
|
|
5,406
|
|
9,609
|
|
—
|
|
9,609
|
|
||||||||||||
|
Corporate and other
|
1,773
|
|
—
|
|
1,773
|
|
5,482
|
|
—
|
|
5,482
|
|
||||||||||||
|
7,180
|
|
—
|
|
7,180
|
|
15,091
|
|
—
|
|
15,091
|
|
|||||||||||||
|
Total short-term investments
|
8,776
|
|
16
|
|
8,760
|
|
16,691
|
|
17
|
|
16,674
|
|
||||||||||||
|
Other current assets
|
||||||||||||||||||||||||
|
Derivative assets:
|
||||||||||||||||||||||||
|
Interest rate contracts
|
81
|
|
—
|
|
81
|
|
97
|
|
—
|
|
97
|
|
||||||||||||
|
Foreign exchange contracts
|
482
|
|
—
|
|
482
|
|
477
|
|
—
|
|
477
|
|
||||||||||||
|
Total other current assets
|
563
|
|
—
|
|
563
|
|
574
|
|
—
|
|
574
|
|
||||||||||||
|
Long-term investments
|
||||||||||||||||||||||||
|
Classified as equity securities:
|
||||||||||||||||||||||||
|
Equity
(a)
|
1,290
|
|
|
1,265
|
|
|
24
|
|
|
1,223
|
|
|
1,193
|
|
|
30
|
|
|||||||
|
Classified as trading securities:
|
||||||||||||||||||||||||
|
Equity funds
|
52
|
|
|
51
|
|
|
—
|
|
|
50
|
|
|
50
|
|
|
—
|
|
|||||||
|
1,341
|
|
|
1,317
|
|
|
24
|
|
|
1,273
|
|
|
1,243
|
|
|
30
|
|
||||||||
|
Classified as available-for-sale debt securities:
|
||||||||||||||||||||||||
|
Government and agency—non-U.S.
|
44
|
|
—
|
|
44
|
|
94
|
|
—
|
|
94
|
|
||||||||||||
|
Corporate and other
|
389
|
|
—
|
|
389
|
|
397
|
|
—
|
|
397
|
|
||||||||||||
|
434
|
|
—
|
|
434
|
|
491
|
|
—
|
|
491
|
|
|||||||||||||
|
Total long-term investments
|
1,775
|
|
1,317
|
|
458
|
|
1,764
|
|
1,243
|
|
521
|
|
||||||||||||
|
Other noncurrent assets
|
||||||||||||||||||||||||
|
Derivative assets:
|
||||||||||||||||||||||||
|
Interest rate contracts
|
461
|
|
—
|
|
461
|
|
335
|
|
—
|
|
335
|
|
||||||||||||
|
Foreign exchange contracts
|
269
|
|
—
|
|
269
|
|
232
|
|
—
|
|
232
|
|
||||||||||||
|
Total other noncurrent assets
|
731
|
|
—
|
|
731
|
|
566
|
|
—
|
|
566
|
|
||||||||||||
|
Total assets
|
$
|
11,845
|
|
$
|
1,333
|
|
$
|
10,512
|
|
$
|
19,595
|
|
$
|
1,260
|
|
$
|
18,335
|
|
||||||
|
Financial liabilities measured at fair value on a recurring basis:
|
||||||||||||||||||||||||
|
Other current liabilities
|
||||||||||||||||||||||||
|
Derivative liabilities:
|
||||||||||||||||||||||||
|
Interest rate contracts
|
$
|
2
|
|
$
|
—
|
|
$
|
2
|
|
$
|
5
|
|
$
|
—
|
|
$
|
5
|
|
||||||
|
Foreign exchange contracts
|
89
|
|
—
|
|
89
|
|
78
|
|
—
|
|
78
|
|
||||||||||||
|
Total other current liabilities
|
91
|
|
—
|
|
91
|
|
82
|
|
—
|
|
82
|
|
||||||||||||
|
Other noncurrent liabilities
|
||||||||||||||||||||||||
|
Derivative liabilities:
|
||||||||||||||||||||||||
|
Interest rate contracts
|
178
|
|
—
|
|
178
|
|
378
|
|
—
|
|
378
|
|
||||||||||||
|
Foreign exchange contracts
|
232
|
|
—
|
|
232
|
|
564
|
|
—
|
|
564
|
|
||||||||||||
|
Total other noncurrent liabilities
|
410
|
|
—
|
|
410
|
|
942
|
|
—
|
|
942
|
|
||||||||||||
|
Total liabilities
|
$
|
501
|
|
$
|
—
|
|
$
|
501
|
|
$
|
1,024
|
|
$
|
—
|
|
$
|
1,024
|
|
||||||
|
(a)
|
As of
March 31, 2019
, short-term equity securities of
$10 million
and long-term equity securities of
$23 million
are held in trust for benefits attributable to the former Pharmacia Savings Plus Plan.
As of
December 31, 2018
, short-term equity securities of
$11 million
and long-term equity securities of
$29 million
are held in trust for benefits attributable to the former Pharmacia Savings Plus Plan.
|
19
PFIZER INC. AND SUBSIDIARY COMPANIES
NOTES TO CONDENSED CONSOLIDATED FINANCIAL STATEMENTS
(UNAUDITED)
Financial Assets and Liabilities Not Measured at Fair Value on a Recurring Basis
|
The following table presents the financial liabilities not measured at fair value on a recurring basis, including the carrying values and estimated fair values using a market approach:
|
||||||||||||||||||||||||
|
March 31, 2019
|
December 31, 2018
|
|||||||||||||||||||||||
|
Carrying Value
|
Estimated Fair Value
|
Carrying Value
|
Estimated Fair Value
|
|||||||||||||||||||||
|
(MILLIONS OF DOLLARS)
|
Total
|
Level 2
|
Total
|
Level 2
|
||||||||||||||||||||
|
Financial Liabilities
|
||||||||||||||||||||||||
|
Long-term debt, excluding the current portion
|
$
|
35,733
|
|
$
|
39,016
|
|
$
|
39,016
|
|
$
|
32,909
|
|
$
|
35,260
|
|
$
|
35,260
|
|
||||||
The differences between the estimated fair values and carrying values of held-to-maturity debt securities, restricted stock and private equity securities, and short-term borrowings not measured at fair value on a recurring basis were not significant as of
March 31, 2019
or
December 31, 2018
. The fair value measurements of our held-to-maturity debt securities and our short-term borrowings are based on Level 2 inputs. The fair value measurements of our private equity securities, which represent investments in the life sciences sector, are based on Level 3 inputs using a market approach.
In addition, as of
March 31, 2019
and
December 31, 2018
, we had long-term receivables whose fair value is based on Level 3 inputs. As of
March 31, 2019
and
December 31, 2018
, the differences between the estimated fair values and carrying values of these receivables were not significant.
Total Short-Term and Long-Term Investments
|
The following table represents our investments by classification type:
|
||||||||
|
(MILLIONS OF DOLLARS)
|
March 31, 2019
|
|
December 31, 2018
|
|
||||
|
Short-term investments
|
||||||||
|
Equity securities
|
$
|
1,597
|
|
$
|
1,600
|
|
||
|
Available-for-sale debt securities
|
7,180
|
|
15,091
|
|
||||
|
Held-to-maturity debt securities
|
906
|
|
1,003
|
|
||||
|
Total Short-term investments
|
$
|
9,682
|
|
$
|
17,694
|
|
||
|
Long-term investments
|
||||||||
|
Equity securities
|
$
|
1,290
|
|
$
|
1,223
|
|
||
|
Trading equity funds securities
|
|
52
|
|
|
50
|
|
||
|
Available-for-sale debt securities
|
434
|
|
491
|
|
||||
|
Held-to-maturity debt securities
|
55
|
|
59
|
|
||||
|
Private equity investments at cost, as adjusted, or equity method
|
1,029
|
|
944
|
|
||||
|
Total Long-term investments
|
$
|
2,859
|
|
$
|
2,767
|
|
||
|
Held-to-maturity cash equivalents
|
$
|
213
|
|
$
|
199
|
|
||
B. Investments
|
At March 31, 2019, the investment securities portfolio consisted of debt securities that were virtually all investment-grade. Information on investments in debt and equity securities at March 31, 2019 and December 31, 2018 is as follows, including, as of March 31, 2019, the contractual maturities, or as necessary, the estimated maturities, of the available-for-sale and held-to-maturity debt securities:
|
||||||||||||||||||||||||||||||||||||||||||||||||
|
March 31, 2019
|
December 31, 2018
|
|||||||||||||||||||||||||||||||||||||||||||||||
|
Gross Unrealized
|
Maturities (in Years)
|
Gross Unrealized
|
||||||||||||||||||||||||||||||||||||||||||||||
|
(MILLIONS OF DOLLARS)
|
Amortized Cost
|
|
Gains
|
|
Losses
|
|
Fair Value
|
|
Within 1
|
|
Over 1
to 5 |
|
Over 5
|
|
Total
|
|
Amortized Cost
|
|
Gains
|
|
Losses
|
|
Fair Value
|
|
||||||||||||||||||||||||
|
Available-for-sale debt securities
|
||||||||||||||||||||||||||||||||||||||||||||||||
|
Government and agency
––
non-U.S.
|
$
|
5,462
|
|
$
|
6
|
|
$
|
(17
|
)
|
$
|
5,451
|
|
$
|
5,406
|
|
$
|
44
|
|
$
|
—
|
|
$
|
5,451
|
|
$
|
9,754
|
|
$
|
7
|
|
$
|
(58
|
)
|
$
|
9,703
|
|
||||||||||||
|
Corporate and other
(a)
|
2,178
|
|
1
|
|
(17
|
)
|
2,162
|
|
1,773
|
|
386
|
|
3
|
|
2,162
|
|
5,905
|
|
—
|
|
(27
|
)
|
5,878
|
|
||||||||||||||||||||||||
|
Held-to-maturity debt securities
|
||||||||||||||||||||||||||||||||||||||||||||||||
|
Time deposits and other
|
617
|
|
—
|
|
—
|
|
617
|
|
562
|
|
16
|
|
39
|
|
617
|
|
668
|
|
—
|
|
—
|
|
668
|
|
||||||||||||||||||||||||
|
Government and agency
––
non-U.S.
|
557
|
|
—
|
|
—
|
|
557
|
|
557
|
|
—
|
|
—
|
|
557
|
|
592
|
|
—
|
|
—
|
|
592
|
|
||||||||||||||||||||||||
|
Total debt securities
|
$
|
8,815
|
|
$
|
7
|
|
$
|
(34
|
)
|
$
|
8,787
|
|
$
|
8,299
|
|
$
|
446
|
|
$
|
43
|
|
$
|
8,787
|
|
$
|
16,920
|
|
$
|
8
|
|
$
|
(85
|
)
|
$
|
16,842
|
|
||||||||||||
|
(a)
|
Primarily issued by a diverse group of corporations.
|
20
PFIZER INC. AND SUBSIDIARY COMPANIES
NOTES TO CONDENSED CONSOLIDATED FINANCIAL STATEMENTS
(UNAUDITED)
|
The following table presents the net unrealized (gains) and losses for the period that relate to equity securities still held at the reporting date, calculated as follows:
|
||||||||
|
Three Months Ended
|
||||||||
|
(MILLIONS OF DOLLARS)
|
March 31, 2019
|
|
April 1, 2018
|
|
||||
|
Net gains recognized during the period on investments in equity securities
(a)
|
$
|
(111
|
)
|
$
|
(118
|
)
|
||
|
Less: Net gains recognized during the period on equity securities sold during the period
|
(5
|
)
|
(19
|
)
|
||||
|
Net unrealized gains during the reporting period on equity securities still held at the reporting date
|
$
|
(106
|
)
|
$
|
(98
|
)
|
||
|
(a)
|
The net gains on investments in equity securities are reported in
Other (income)/deductions
––
net.
For additional information, see
Note 4
.
|
C. Short-Term Borrowings
|
Short-term borrowings include:
|
||||||||
|
(MILLIONS OF DOLLARS)
|
March 31,
2019 |
|
December 31,
2018 |
|
||||
|
Commercial paper
|
$
|
3,947
|
|
$
|
3,100
|
|
||
|
Current portion of long-term debt, principal amount
|
4,473
|
|
4,781
|
|
||||
|
Other short-term borrowings, principal amount
(a)
|
1,000
|
|
966
|
|
||||
|
Total short-term borrowings, principal amount
|
9,420
|
|
8,847
|
|
||||
|
Net fair value adjustments related to hedging and purchase accounting
|
(1
|
)
|
(5
|
)
|
||||
|
Net unamortized discounts, premiums and debt issuance costs
|
(9
|
)
|
(11
|
)
|
||||
|
Total
Short-term borrowings, including current portion of long-term debt
, carried at historical proceeds, as adjusted
|
$
|
9,410
|
|
$
|
8,831
|
|
||
|
(a)
|
Other short-term borrowings primarily include cash collateral. For additional information, see
Note 7E
.
|
D.
Long-Term Debt
New Issuances
|
In the first quarter of 2019, we issued the following senior unsecured notes:
|
||||||
|
Principal
|
||||||
|
(MILLIONS OF DOLLARS)
|
Maturity Date
|
As of March 31, 2019
|
||||
|
2.800% notes
(a)
|
March 11, 2022
|
$
|
500
|
|
||
|
2.950% notes
(a)
|
March 15, 2024
|
750
|
|
|||
|
3.450% notes
(a)
|
March 15, 2029
|
1,750
|
|
|||
|
3.900% notes
(a)
|
March 15, 2039
|
750
|
|
|||
|
4.000% notes
(a)
|
March 15, 2049
|
1,250
|
|
|||
|
Total long-term debt issued in the first quarter of 2019
(b)
|
$
|
5,000
|
|
|||
|
(a)
|
Fixed rate notes may be redeemed by us at any time, in whole, or in part, at varying redemption prices plus accrued and unpaid interest.
|
|
(b)
|
The weighted-average effective interest rate for the notes at issuance was
3.57%
.
|
Retirements
In January 2019, we repurchased all
€1.1 billion
(
$1.3 billion
, at exchange rates on settlement) principal amount outstanding of the
5.75%
euro-denominated debt that was due June 2021 before the maturity date at a redemption value of
€1.3 billion
(
$1.5 billion
, at exchange rates on settlement). As a result, in the first quarter of 2019, we recorded a net loss of approximately
$138 million
, which included the related termination of cross-currency swaps, and that was recorded in
Other (income)/deductions––net
in the condensed consolidated statement of income in the first quarter of 2019. For additional information, see
Note 4
.
21
PFIZER INC. AND SUBSIDIARY COMPANIES
NOTES TO CONDENSED CONSOLIDATED FINANCIAL STATEMENTS
(UNAUDITED)
|
The following table provides the aggregate principal amount of our senior unsecured long-term debt, and adjustments to report our aggregate long-term debt:
|
||||||||
|
(MILLIONS OF DOLLARS)
|
March 31,
2019 |
|
December 31,
2018 |
|
||||
|
Total long-term debt, principal amount
|
$
|
35,122
|
|
$
|
32,558
|
|
||
|
Net fair value adjustments related to hedging and purchase accounting
|
793
|
|
479
|
|
||||
|
Net unamortized discounts, premiums and debt issuance costs
|
(189
|
)
|
(136
|
)
|
||||
|
Other long-term debt
|
7
|
|
7
|
|
||||
|
Total long-term debt, carried at historical proceeds, as adjusted
|
$
|
35,733
|
|
$
|
32,909
|
|
||
|
Current portion of long-term debt, carried at historical proceeds, as adjusted
|
$
|
4,471
|
|
$
|
4,776
|
|
||
E.
Derivative Financial Instruments and Hedging Activities
Foreign Exchange Risk
A significant portion of our revenues, earnings and net investments in foreign affiliates is exposed to changes in foreign exchange rates. We manage our foreign exchange risk, in part, through operational means, including managing same-currency revenues in relation to same-currency costs and same-currency assets in relation to same-currency liabilities. We also manage our foreign exchange risk, depending on market conditions, through fair value, cash flow, and net investment hedging programs through the use of derivative financial instruments and foreign currency debt. These financial instruments serve to protect net income against the impact of remeasurement into another currency, or against the impact of translation into U.S. dollars of certain foreign exchange-denominated transactions.
The derivative financial instruments primarily hedge or offset exposures in the
euro, Japanese yen, U.K. pound, Chinese renminbi and Swedish krona
.
As a part of our cash flow hedging program, we designate foreign exchange contracts to hedge a portion of our forecasted
euro, Japanese yen, Chinese renminbi, Canadian dollar, U.K. pound and Australian dollar
-denominated intercompany inventory sales expected to occur no more than two years from the date of each hedge.
Interest Rate Risk
Our interest-bearing investments and borrowings are subject to interest rate risk. With respect to our investments, we strive to maintain a predominantly floating-rate basis position, but our strategy may change based on prevailing market conditions. We currently borrow primarily on a long-term, fixed rate basis. From time to time, depending on market conditions, we will change the profile of our outstanding debt by entering into derivative financial instruments like interest rate swaps. We entered into derivative financial instruments to hedge or offset the fixed interest rates on the hedged item, matching the amount and timing of the hedged item. The derivative financial instruments primarily hedge U.S. dollar fixed-rate debt.
|
The following table provides the fair value of the derivative financial instruments and the related notional amounts presented between those derivatives that are designated as hedging instruments and those that are not designated as hedging instruments:
|
||||||||||||||||||||||||
|
(MILLIONS OF DOLLARS)
|
March 31, 2019
|
December 31, 2018
|
||||||||||||||||||||||
|
Fair Value
|
Fair Value
|
|||||||||||||||||||||||
|
Notional
|
Asset
|
Liability
|
Notional
|
Asset
|
Liability
|
|||||||||||||||||||
|
Derivatives designated as hedging instruments:
|
||||||||||||||||||||||||
|
Foreign exchange contracts
(a)
|
$
|
18,353
|
|
$
|
713
|
|
$
|
248
|
|
$
|
22,984
|
|
$
|
654
|
|
$
|
586
|
|
||||||
|
Interest rate contracts
|
11,145
|
|
543
|
|
180
|
|
11,145
|
|
432
|
|
383
|
|
||||||||||||
|
1,255
|
|
429
|
|
1,085
|
|
968
|
|
|||||||||||||||||
|
Derivatives not designated as hedging instruments:
|
||||||||||||||||||||||||
|
Foreign exchange contracts
|
$
|
15,111
|
|
38
|
|
72
|
|
$
|
15,154
|
|
55
|
|
55
|
|
||||||||||
|
Total
|
$
|
1,294
|
|
$
|
501
|
|
$
|
1,140
|
|
$
|
1,024
|
|
||||||||||||
|
(a)
|
As of
March 31, 2019
, the notional amount of outstanding foreign currency forward-exchange contracts hedging our intercompany forecasted inventory sales was
$6.5 billion
.
|
22
PFIZER INC. AND SUBSIDIARY COMPANIES
NOTES TO CONDENSED CONSOLIDATED FINANCIAL STATEMENTS
(UNAUDITED)
|
The following table provides information about the gains/(losses) incurred to hedge or offset operational foreign exchange or interest rate risk:
|
||||||||||||||||||||||||
|
|
|
Amount of
Gains/(Losses) Recognized in OID (a) |
|
Amount of Gains/(Losses)
Recognized in OCI (a), (b) |
|
Amount of Gains/(Losses)
Reclassified from OCI into OID and COS (a), (b) |
||||||||||||||||||
|
(MILLIONS OF DOLLARS)
|
Mar 31,
2019 |
|
Apr 1,
2018 |
|
Mar 31,
2019 |
|
Apr 1,
2018 |
|
Mar 31,
2019 |
|
Apr 1,
2018 |
|
||||||||||||
|
Three Months Ended
|
|
|
|
|
|
|
||||||||||||||||||
|
Derivative Financial Instruments in Cash Flow Hedge Relationships:
|
||||||||||||||||||||||||
|
Foreign exchange contracts
(c)
|
$
|
—
|
|
$
|
—
|
|
$
|
210
|
|
$
|
(143
|
)
|
$
|
209
|
|
$
|
(72
|
)
|
||||||
|
Amount excluded from effectiveness testing recognized in earnings based on an amortization approach
|
—
|
|
—
|
|
56
|
|
28
|
|
54
|
|
27
|
|
||||||||||||
|
Derivative Financial Instruments in Fair Value Hedge Relationships:
|
||||||||||||||||||||||||
|
Interest rate contracts
|
329
|
|
(399
|
)
|
—
|
|
—
|
|
—
|
|
—
|
|
||||||||||||
|
Hedged item
|
(329
|
)
|
399
|
|
—
|
|
—
|
|
—
|
|
—
|
|
||||||||||||
|
Foreign exchange contracts
|
—
|
|
(7
|
)
|
—
|
|
—
|
|
—
|
|
—
|
|
||||||||||||
|
Hedged item
|
—
|
|
8
|
|
—
|
|
—
|
|
—
|
|
—
|
|
||||||||||||
|
Derivative Financial Instruments in Net Investment Hedge Relationships:
|
|
|
|
|
|
|
|
|
|
|
|
|
||||||||||||
|
Foreign exchange contracts
|
—
|
|
—
|
|
23
|
|
(5
|
)
|
—
|
|
—
|
|
||||||||||||
|
The portion on foreign exchange contracts excluded from the assessment of hedge effectiveness
|
—
|
|
—
|
|
41
|
|
2
|
|
24
|
|
6
|
|
||||||||||||
|
Non-Derivative Financial Instruments in Net Investment Hedge Relationships:
|
|
|
|
|
|
|
|
|
|
|
|
|
||||||||||||
|
Foreign currency short-term borrowings
(d)
|
—
|
|
—
|
|
35
|
|
(42
|
)
|
—
|
|
—
|
|
||||||||||||
|
Foreign currency long-term debt
(d)
|
—
|
|
—
|
|
38
|
|
(92
|
)
|
—
|
|
—
|
|
||||||||||||
|
Derivative Financial Instruments Not Designated as Hedges:
|
||||||||||||||||||||||||
|
Foreign exchange contracts
|
(120
|
)
|
(55
|
)
|
—
|
|
—
|
|
—
|
|
—
|
|
||||||||||||
|
All other net
|
—
|
|
—
|
|
1
|
|
—
|
|
—
|
|
—
|
|
||||||||||||
|
|
$
|
(120
|
)
|
$
|
(55
|
)
|
$
|
404
|
|
$
|
(251
|
)
|
$
|
286
|
|
$
|
(39
|
)
|
||||||
|
(a)
|
OID = Other (income)/deductions—net, included in
Other (income)/deductions—net
in the condensed consolidated statements of income
.
COS = Cost of Sales, included in
Cost of sales
in the condensed consolidated statements of income. OCI = Other comprehensive income/(loss), included in the condensed consolidated statements of comprehensive income
.
|
|
(b)
|
For derivative financial instruments in cash flow hedge relationships, the gains and losses are included in
Other comprehensive income––
Unrealized holding gains/(losses) on derivative financial instruments, net
. For derivative financial instruments in net investment hedge relationships and for foreign currency debt designated as hedging instruments, the effective portion is included in
Other comprehensive income––Foreign currency translation adjustments, net.
|
|
(c)
|
Based on quarter-end foreign exchange rates that are subject to change, we expect to reclassify a pre-tax
gain
of
$202 million
within the next 12 months into
Cost of sales.
The maximum length of time over which we are hedging future foreign exchange cash flow relates to our
$1.8 billion
U.K. pound debt maturing in 2043.
|
|
(d)
|
Short-term borrowings include foreign currency short-term borrowings with carrying values of
$1.1 billion
as of
March 31, 2019
, which are used as hedging instruments in net investment hedges. Long-term debt includes foreign currency long-term borrowings with carrying values of
$2.0 billion
as of
March 31, 2019
, which are used as hedging instruments in net investment hedges.
|
|
The following table provides the total amount of each income and expense line in which the results of fair value or cash flow hedges are recorded:
|
||||||||
|
|
|
Three Months Ended
|
||||||
|
(MILLIONS OF DOLLARS)
|
|
March 31, 2019
|
|
April 1, 2018
|
|
|||
|
Cost of sales
|
|
$
|
2,433
|
|
$
|
2,563
|
|
|
|
Other (income)/deductions—net
|
|
92
|
|
(178
|
)
|
|||
23
PFIZER INC. AND SUBSIDIARY COMPANIES
NOTES TO CONDENSED CONSOLIDATED FINANCIAL STATEMENTS
(UNAUDITED)
|
The following table provides the amounts recorded in our condensed consolidated balance sheet related to cumulative basis adjustments for fair value hedges:
|
||||||||||||||||
|
March 31, 2019
|
April 1, 2018
|
|||||||||||||||
|
(MILLIONS OF DOLLARS)
|
|
Carrying Amount of Hedged Assets/Liabilities
|
|
|
Cumulative Amount of Fair Value Hedging Adjustment Gains/(Losses) Included in the Carrying Amount of the Hedged Assets/Liabilities
|
|
Carrying Amount of Hedged Assets/Liabilities
|
|
Cumulative Amount of Fair Value Hedging Adjustment Gains/(Losses) Included in the Carrying Amount of the Hedged Assets/Liabilities
|
|
||||||
|
Short-term investments
|
|
$
|
—
|
|
|
$
|
—
|
|
$
|
286
|
|
$
|
(1
|
)
|
||
|
Long-term investments
|
|
45
|
|
|
(1
|
)
|
45
|
|
(1
|
)
|
||||||
|
Short-term borrowings, including current portion of long-term debt
|
|
1,500
|
|
|
1
|
|
999
|
|
1
|
|
||||||
|
Long-term debt
|
|
9,945
|
|
|
(282)
|
|
11,372
|
|
100
|
|
||||||
Certain of our derivative instruments are covered by associated credit-support agreements that have credit-risk-related contingent features designed to reduce both counterparties’ exposure to risk of defaulting on amounts owed by the other party. As of
March 31, 2019
, the aggregate fair value of these derivative instruments that are in a net liability position was
$209 million
, for which we have posted collateral of
$214 million
in the normal course of business. If there had been a downgrade to below an A rating by S&P or the equivalent rating by Moody’s, we would not have been required to post any additional collateral to our counterparties.
As of
March 31, 2019
, we received cash collateral of
$948 million
from various counterparties. The collateral primarily supports the approximate fair value of our derivative contracts that are in a net asset position. With respect to the collateral received, the obligations are reported in
Short-term borrowings, including current portion of long-term debt.
F. Credit Risk
On an ongoing basis, we review the creditworthiness of counterparties to our foreign exchange and interest rate agreements and do not expect to incur a significant loss from failure of any counterparties to perform under the agreements. There are no significant concentrations of credit risk related to our financial instruments with any individual counterparty, except for certain significant customers. For additional information on significant customers, see Notes to Consolidated Financial Statements––
Note 18C. Segment, Geographic and Other Revenue Information: Other Revenue Information
in Pfizer’s
2018
Financial Report. As of
March 31, 2019
, we had amounts due from a well-diversified, high quality group of banks (
$1.7 billion
) from around the world. For details about our investments, see
Note 7B
above
.
In general, there is no requirement for collateral from customers. However, derivative financial instruments are executed under credit-support agreements that provide for the ability to request to receive cash collateral, depending on levels of exposure, our credit rating and the credit rating of the counterparty, see
Note 7E
above.
Note 8.
Inventories
|
The following table provides the components of
Inventories
:
|
||||||||
|
(MILLIONS OF DOLLARS)
|
March 31,
2019 |
|
December 31,
2018 |
|
||||
|
Finished goods
|
$
|
2,287
|
|
$
|
2,262
|
|
||
|
Work-in-process
|
5,182
|
|
4,701
|
|
||||
|
Raw materials and supplies
|
560
|
|
546
|
|
||||
|
Inventories
(a)
|
$
|
8,029
|
|
$
|
7,508
|
|
||
|
Noncurrent inventories not included above
(b)
|
$
|
637
|
|
$
|
618
|
|
||
|
(a)
|
The change from
December 31, 2018
reflects increases for certain products to meet targeted levels in the normal course of business, including inventory build for supply recovery and market demand.
|
|
(b)
|
Included in
Other noncurrent assets
. There are no recoverability issues associated with these amounts.
|
24
PFIZER INC. AND SUBSIDIARY COMPANIES
NOTES TO CONDENSED CONSOLIDATED FINANCIAL STATEMENTS
(UNAUDITED)
Note 9.
Identifiable Intangible Assets and Goodwill
A. Identifiable Intangible Assets
Balance Sheet Information
|
The following table provides the components of
Identifiable intangible assets
:
|
||||||||||||||||||||||||
|
|
March 31, 2019
|
December 31, 2018
|
||||||||||||||||||||||
|
(MILLIONS OF DOLLARS)
|
Gross
Carrying
Amount
|
|
Accumulated
Amortization
|
|
Identifiable
Intangible
Assets, less
Accumulated
Amortization
|
|
Gross
Carrying
Amount
|
|
Accumulated
Amortization
|
|
Identifiable
Intangible
Assets, less
Accumulated
Amortization
|
|
||||||||||||
|
Finite-lived intangible assets
|
||||||||||||||||||||||||
|
Developed technology rights
|
$
|
89,379
|
|
$
|
(59,913
|
)
|
$
|
29,465
|
|
$
|
89,430
|
|
$
|
(58,895
|
)
|
$
|
30,535
|
|
||||||
|
Brands
|
923
|
|
(717
|
)
|
206
|
|
923
|
|
(708
|
)
|
215
|
|
||||||||||||
|
Licensing agreements and other
|
1,442
|
|
(1,150
|
)
|
292
|
|
1,436
|
|
(1,140
|
)
|
296
|
|
||||||||||||
|
91,743
|
|
(61,780
|
)
|
29,963
|
|
91,788
|
|
(60,743
|
)
|
31,045
|
|
|||||||||||||
|
Indefinite-lived intangible assets
|
||||||||||||||||||||||||
|
Brands and other
|
1,994
|
|
|
|
1,994
|
|
1,994
|
|
|
|
1,994
|
|
||||||||||||
|
IPR&D
|
2,082
|
|
|
|
2,082
|
|
2,171
|
|
|
|
2,171
|
|
||||||||||||
|
4,076
|
|
|
|
4,076
|
|
4,165
|
|
|
|
4,165
|
|
|||||||||||||
|
Identifiable intangible assets
(a)
|
$
|
95,819
|
|
$
|
(61,780
|
)
|
$
|
34,039
|
|
$
|
95,954
|
|
$
|
(60,743
|
)
|
$
|
35,211
|
|
||||||
|
(a)
|
The decrease in
I
dentifiable intangible assets, less accumulated amortization
,
is primarily due to amortization and intangible asset impairment charges, partially offset by additions for the period. See
Note 4
for additional information on intangible asset impairments.
|
|
Our identifiable intangible assets are associated with the following, as a percentage of total identifiable intangible assets, less accumulated amortization:
|
|||||||||
|
March 31, 2019
|
|||||||||
|
Biopharma
|
Upjohn
|
WRDM
|
|||||||
|
Developed technology rights
|
99
|
%
|
1
|
%
|
—
|
|
|||
|
Brands, finite-lived
|
100
|
%
|
—
|
|
—
|
|
|||
|
Brands, indefinite-lived
|
42
|
%
|
58
|
%
|
—
|
|
|||
|
IPR&D
|
87
|
%
|
—
|
|
13
|
%
|
|||
Amortization
Total amortization expense for finite-lived intangible assets was
$1.2 billion
for the
first
quarter of
2019
and
$1.2 billion
for the
first
quarter of
2018
.
B. Goodwill
Prior to 2019, we managed our commercial operations through
two
distinct business segments: Pfizer Innovative Health (IH) and Pfizer Essential Health (EH). At the beginning of our 2019 fiscal year, we reorganized our commercial operations and our businesses are now managed through
three
different operating segments––Biopharma, Upjohn and Pfizer’s Consumer Healthcare business (see
Note 13
for further information). Our Consumer Healthcare business is classified as held for sale as of December 31, 2018 and March 31, 2019 and, therefore the goodwill attributable to the Pfizer Consumer Healthcare business is included in
Assets held for sale
in the accompanying condensed consolidated balance sheets and not included in the table below (see
Note 2
for further information). As a result of the reorganization of our commercial operations, our remaining goodwill is required to be reallocated amongst the new Biopharma and Upjohn operating segments. The allocation of goodwill is a complex process that requires, among other things, that we determine the fair value of each reporting unit under our old and new management structure and the portions being transferred. Therefore, we have not yet completed the allocation, but it will be completed in the current year.
25
PFIZER INC. AND SUBSIDIARY COMPANIES
NOTES TO CONDENSED CONSOLIDATED FINANCIAL STATEMENTS
(UNAUDITED)
|
The following table provides the components of and changes in the carrying amount of
Goodwill
:
|
||||||||||||||||
|
(MILLIONS OF DOLLARS)
|
Biopharma
|
Upjohn
|
To be Allocated
(a)
|
Total
|
||||||||||||
|
Balance, December 31, 2018
|
$
|
—
|
|
$
|
—
|
|
$
|
53,411
|
|
$
|
53,411
|
|
||||
|
Other
(b)
|
—
|
|
—
|
|
76
|
|
76
|
|
||||||||
|
Balance, March 31, 2019
|
$
|
—
|
|
$
|
—
|
|
$
|
53,487
|
|
$
|
53,487
|
|
||||
|
(a)
|
The amount to be allocated includes the goodwill associated with our former operating segments (see above), for which the allocation to our new reporting units, and, as a result, to the new operating segments, is pending.
|
|
(b)
|
Primarily reflects the impact of foreign exchange.
|
Note 10.
Pension and Postretirement Benefit Plans
|
The following table provides the components of net periodic benefit cost/(credit):
|
||||||||||||||||||||||||||||||||
|
Three Months Ended
|
||||||||||||||||||||||||||||||||
|
|
Pension Plans
|
|||||||||||||||||||||||||||||||
|
|
U.S.
Qualified
|
U.S.
Supplemental
(Non-Qualified)
|
International
|
Postretirement
Plans
|
||||||||||||||||||||||||||||
|
(MILLIONS OF DOLLARS)
|
March 31, 2019
|
|
April 1, 2018
|
|
March 31, 2019
|
|
April 1, 2018
|
|
March 31, 2019
|
|
April 1, 2018
|
|
March 31, 2019
|
|
April 1, 2018
|
|
||||||||||||||||
|
Net periodic benefit cost/(credit):
|
|
|
||||||||||||||||||||||||||||||
|
Service cost
|
$
|
—
|
|
$
|
—
|
|
$
|
—
|
|
$
|
—
|
|
$
|
32
|
|
$
|
37
|
|
$
|
9
|
|
$
|
10
|
|
||||||||
|
Interest cost
|
157
|
|
151
|
|
12
|
|
13
|
|
54
|
|
54
|
|
19
|
|
18
|
|
||||||||||||||||
|
Expected return on plan assets
|
(223
|
)
|
(263
|
)
|
—
|
|
—
|
|
(80
|
)
|
(92
|
)
|
(8
|
)
|
(9
|
)
|
||||||||||||||||
|
Amortization of:
|
|
|
|
|
|
|
|
|
|
|
|
|
|
|
||||||||||||||||||
|
Actuarial losses
|
37
|
|
30
|
|
2
|
|
4
|
|
20
|
|
26
|
|
1
|
|
2
|
|
||||||||||||||||
|
Prior service credits
|
(1
|
)
|
—
|
|
—
|
|
—
|
|
(1
|
)
|
(1
|
)
|
(45
|
)
|
(45
|
)
|
||||||||||||||||
|
Curtailments
|
—
|
|
2
|
|
—
|
|
—
|
|
—
|
|
—
|
|
—
|
|
(7
|
)
|
||||||||||||||||
|
Settlements
|
1
|
|
20
|
|
—
|
|
17
|
|
—
|
|
—
|
|
—
|
|
—
|
|
||||||||||||||||
|
Special termination benefits
|
—
|
|
—
|
|
6
|
|
—
|
|
—
|
|
—
|
|
—
|
|
—
|
|
||||||||||||||||
|
$
|
(28
|
)
|
$
|
(58
|
)
|
$
|
20
|
|
$
|
33
|
|
$
|
25
|
|
$
|
24
|
|
$
|
(23
|
)
|
$
|
(31
|
)
|
|||||||||
|
The following table provides the amounts we contributed, and the amounts we expect to contribute during 2019, to our pension and postretirement plans from our general assets for the periods indicated:
|
||||||||||||||||
|
Pension Plans
|
||||||||||||||||
|
(MILLIONS OF DOLLARS)
|
U.S. Qualified
|
U.S. Supplemental (Non-Qualified)
|
International
|
Postretirement Plans
|
||||||||||||
|
Contributions from our general assets for the three months ended March 31, 2019
|
$
|
1
|
|
$
|
71
|
|
$
|
44
|
|
$
|
29
|
|
||||
|
Expected contributions from our general assets during 2019
(a)
|
10
|
|
167
|
|
191
|
|
149
|
|
||||||||
|
(a)
|
Contributions expected to be made for 2019 are inclusive of amounts contributed during the three months ended March 31, 2019. The U.S. supplemental (non-qualified) pension plan, international pension plan and the postretirement plan contributions from our general assets include direct employer benefit payments.
|
26
PFIZER INC. AND SUBSIDIARY COMPANIES
NOTES TO CONDENSED CONSOLIDATED FINANCIAL STATEMENTS
(UNAUDITED)
Note 11.
Earnings Per Common Share Attributable to Common Shareholders
|
The following table provides the detailed calculation of
EPS
:
|
||||||||
|
|
Three Months Ended
|
|||||||
|
(IN MILLIONS)
|
March 31,
2019 |
|
April 1,
2018 |
|
||||
|
EPS Numerator––Basic
|
||||||||
|
Income from continuing operations
|
$
|
3,889
|
|
$
|
3,571
|
|
||
|
Less: Net income attributable to noncontrolling interests
|
6
|
|
9
|
|
||||
|
Income from continuing operations attributable to Pfizer Inc.
|
3,884
|
|
3,562
|
|
||||
|
Less: Preferred stock dividends––net of tax
|
—
|
|
—
|
|
||||
|
Income from continuing operations attributable to Pfizer Inc. common shareholders
|
3,883
|
|
3,562
|
|
||||
|
Discontinued operations––net of tax
|
—
|
|
(1
|
)
|
||||
|
Net income attributable to Pfizer Inc. common shareholders
|
$
|
3,883
|
|
$
|
3,560
|
|
||
|
EPS Numerator––Diluted
|
|
|
|
|
||||
|
Income from continuing operations attributable to Pfizer Inc. common shareholders and assumed conversions
|
$
|
3,884
|
|
$
|
3,562
|
|
||
|
Discontinued operations––net of tax, attributable to Pfizer Inc. common shareholders and assumed conversions
|
—
|
|
(1
|
)
|
||||
|
Net income attributable to Pfizer Inc. common shareholders and assumed conversions
|
$
|
3,884
|
|
$
|
3,561
|
|
||
|
EPS Denominator
|
|
|
|
|
||||
|
Weighted-average number of common shares outstanding––Basic
|
5,635
|
|
5,957
|
|
||||
|
Common-share equivalents: stock options, stock issuable under employee compensation plans, convertible preferred stock and accelerated share repurchase agreements
|
115
|
|
100
|
|
||||
|
Weighted-average number of common shares outstanding––Diluted
|
5,750
|
|
6,057
|
|
||||
|
Stock options that had exercise prices greater than the average market price of our common stock issuable under employee compensation plans
(a)
|
2
|
|
2
|
|
||||
|
Cash dividends declared per share
|
$
|
0.36
|
|
$
|
0.34
|
|
||
|
(a)
|
These common stock equivalents were outstanding for the periods presented, but were not included in the computation of diluted EPS for those periods because their inclusion would have had an anti-dilutive effect.
|
Note 12.
Contingencies and Certain Commitments
We and certain of our subsidiaries are subject to numerous contingencies arising in the ordinary course of business, including tax and legal contingencies. For a discussion of our tax contingencies, see
Note 5B.
For a discussion of our legal contingencies, see below.
A. Legal Proceedings
Our legal contingencies include, but are not limited to, the following:
|
•
|
Patent litigation, which typically involves challenges to the coverage and/or validity of patents on various products, processes or dosage forms. We are the plaintiff in the majority of these actions. An adverse outcome in actions in which we are the plaintiff could result in loss of patent protection for a drug, a significant loss of revenues from that drug or impairment of the value of associated assets.
|
|
•
|
Product liability and other product-related litigation, which can include personal injury, consumer, off-label promotion, securities, antitrust and breach of contract claims, among others, often involves highly complex issues relating to medical causation, label warnings and reliance on those warnings, scientific evidence and findings, actual, provable injury and other matters.
|
|
•
|
Commercial and other matters, which can include merger-related and product-pricing claims and environmental claims and proceedings, can involve complexities that will vary from matter to matter.
|
|
•
|
Government investigations, which often are related to the extensive regulation of pharmaceutical companies by national, state and local government agencies in the U.S. and in other jurisdictions.
|
Certain of these contingencies could result in losses, including damages, fines and/or civil penalties, which could be substantial, and/or criminal charges.
27
PFIZER INC. AND SUBSIDIARY COMPANIES
NOTES TO CONDENSED CONSOLIDATED FINANCIAL STATEMENTS
(UNAUDITED)
We believe that our claims and defenses in matters in which we are a defendant are substantial, but litigation is inherently unpredictable and excessive verdicts do occur. We do not believe that any of these matters will have a material adverse effect on our financial position. However, we could incur judgments, enter into settlements or revise our expectations regarding the outcome of certain matters, and such developments could have a material adverse effect on our results of operations in the period in which the amounts are accrued and/or our cash flows in the period in which the amounts are paid.
We have accrued for losses that are both probable and reasonably estimable. Substantially all of our contingencies are subject to significant uncertainties and, therefore, determining the likelihood of a loss and/or the measurement of any loss can be complex. Consequently, we are unable to estimate the range of reasonably possible loss in excess of amounts accrued. Our assessments are based on estimates and assumptions that have been deemed reasonable by management, but the assessment process relies heavily on estimates and assumptions that may prove to be incomplete or inaccurate, and unanticipated events and circumstances may occur that might cause us to change those estimates and assumptions.
Amounts recorded for legal and environmental contingencies can result from a complex series of judgments about future events and uncertainties and can rely heavily on estimates and assumptions.
The principal pending matters to which we are a party are discussed below. In determining whether a pending matter is a principal matter, we consider both quantitative and qualitative factors in order to assess materiality, such as, among other things, the amount of damages and the nature of any other relief sought in the proceeding, if such damages and other relief are specified; our view of the merits of the claims and of the strength of our defenses; whether the action purports to be, or is, a class action and, if not certified, our view of the likelihood that a class will be certified by the court; the jurisdiction in which the proceeding is pending; whether related actions have been transferred to multidistrict litigation; any experience that we or, to our knowledge, other companies have had in similar proceedings; whether disclosure of the action would be important to a reader of our financial statements, including whether disclosure might change a reader’s judgment about our financial statements in light of all of the information that is available to the reader; the potential impact of the proceeding on our reputation; and the extent of public interest in the matter. In addition, with respect to patent matters in which we are the plaintiff, we consider, among other things, the financial significance of the product protected by the patent(s) at issue. As a result of considering qualitative factors in our determination of principal matters, there are some matters discussed below with respect to which management believes that the likelihood of possible loss in excess of amounts accrued is remote.
A1.
Legal Proceedings––Patent Litigation
Like other pharmaceutical companies, we are involved in numerous suits relating to our patents, including but not limited to, those discussed below. Most of the suits involve claims by generic drug manufacturers that patents covering our products, processes or dosage forms are invalid and/or do not cover the product of the generic drug manufacturer. Also, counterclaims, as well as various independent actions, have been filed alleging that our assertions of, or attempts to enforce, patent rights with respect to certain products constitute unfair competition and/or violations of antitrust laws. In addition to the challenges to the U.S. patents on a number of our products that are discussed below, patent rights to certain of our products are being challenged in various other jurisdictions. We are also party to patent damages suits in various jurisdictions pursuant to which generic drug manufacturers, payers, governments or other parties are seeking damages from us for allegedly causing delay of generic entry. Additionally, our licensing and collaboration partners face challenges by generic drug manufacturers to patents covering products for which we have licenses or co-promotion rights.
We also are often involved in other proceedings, such as inter partes review, post-grant review, re-examination or opposition proceedings, before the U.S. Patent and Trademark Office, the European Patent Office, or other foreign counterparts relating to our intellectual property or the intellectual property rights of others.
Also, if one of our patents is found to be invalid by such proceedings, generic or competitive products could be introduced into the market resulting in the erosion of sales of our existing products. For example, several of the patents in our pneumococcal vaccine portfolio were challenged in inter partes review and post-grant review proceedings in the United States. In June 2018, the Patent Trial and Appeal Board ruled on one patent, holding that
one
claim was valid and that all other claims were invalid. The party challenging that patent has appealed the decision. Challenges to other patents remain pending in jurisdictions outside the U.S.
The invalidation of all of the patents in our pneumococcal portfolio could potentially allow a competitor pneumococcal vaccine into the marketplace. We are also subject to patent litigation pursuant to which one or more third parties seeks damages and/or injunctive relief to compensate for alleged infringement of its patents by our commercial or other activities. For example, our Hospira subsidiaries are involved in patent and patent-related disputes over their attempts to bring generic pharmaceutical and biosimilar products to market.
If one of our marketed products is found to infringe valid patent rights of a third party, such third party may be awarded significant damages, or we may be prevented from further sales of that product. Such damages may be enhanced as much as three-fold in the event that we or one of our subsidiaries, like Hospira, is found to have willfully infringed valid patent rights of a third party.
28
PFIZER INC. AND SUBSIDIARY COMPANIES
NOTES TO CONDENSED CONSOLIDATED FINANCIAL STATEMENTS
(UNAUDITED)
Actions In Which We Are The Plaintiff
Bosulif (bosutinib)
In December 2016, Wyeth LLC, Wyeth Pharmaceuticals Inc., and PF Prism C.V. (collectively, Wyeth) brought a patent-infringement action against Alembic Pharmaceuticals, Ltd, Alembic Pharmaceuticals, Inc. (collectively, Alembic), Sun Pharmaceutical Industries, Inc., and Sun Pharmaceutical Industries Limited (collectively, Sun), in the U.S. District Court for the District of Delaware in connection with abbreviated new drug applications respectively filed with the FDA by Alembic and Sun, each seeking approval to market generic versions of bosutinib. Alembic is challenging a patent covering polymorphic forms of bosutinib, which expires in 2026, and a patent covering methods of treating chronic myelogenous leukemia, which expires in 2025. Sun is also challenging the same patent covering polymorphic forms of bosutinib that expires in 2026. In March 2017, Wyeth brought a patent-infringement action against MSN Laboratories Private Limited and MSN Pharmaceuticals, Inc. (collectively, MSN), in the U.S. District Court for the District of Delaware in connection with an abbreviated new drug application filed with the FDA by MSN, seeking approval to market a generic version of bosutinib, and challenging a patent expiring in 2026 covering polymorphic forms of bosutinib. In September 2017, the case against MSN was dismissed. Also, in September 2017, Wyeth brought an additional patent-infringement action against Sun in the U.S. District Court for the District of Delaware asserting the infringement and validity of
two
other patents challenged by Sun, covering compositions of bosutinib and methods of treating chronic myelogenous leukemia, each of which expire in 2025.
EpiPen
In July 2010, King, which we acquired in 2011 and is a wholly-owned subsidiary, brought a patent-infringement action against Sandoz in the U.S. District Court for the District of New Jersey in connection with Sandoz’s abbreviated new drug application filed with the FDA seeking approval to market an epinephrine injectable product. Sandoz is challenging patents, which expire in 2025, covering the next-generation autoinjector for use with epinephrine that is sold under the EpiPen brand name.
Precedex Premix
In June 2014,
Ben Venue Laboratories, Inc. (Ben Venue)
notified our subsidiary, Hospira, that it had filed an abbreviated new drug application with the FDA seeking approval to market a generic version of Hospira’s premix version of Precedex and containing allegations that a patent relating to the use of Precedex in an intensive care unit setting, which expires in March 2019, was invalid or not infringed. In August 2014, Hospira and Orion Corporation (co-owner of the patent that is the subject of the lawsuit) filed suit against Ben Venue, Hikma Pharmaceuticals PLC (Hikma), and West-Ward Pharmaceutical Corp. in the U.S. District Court for the District of Delaware asserting the validity and infringement of the patent. In October 2014, Eurohealth International Sarl was substituted for Ben Venue and Hikma. In June 2016, this case was settled on terms not material to Pfizer.
In June 2015, Amneal Pharmaceuticals LLC (Amneal) notified Hospira that it had filed an abbreviated new drug application with the FDA seeking approval to market a generic version of Hospira’s premix version of Precedex and containing allegations that
four
patents relating to the Precedex premix formulations and their use, all of which expire in 2032, were invalid or not infringed. In August 2015, Hospira filed suit against Amneal in the U.S. District Court for the District of Delaware asserting the validity and infringement of the patents that are the subject of the lawsuit. In January 2018, the District Court ruled that
one
of the
four
patents was valid and infringed, and that the other
three
patents were invalid. In February and March 2018, respectively, each of Amneal and Hospira appealed the District Court decision to the U.S. Court of Appeals for the Federal Circuit.
In December 2015, Fresenius Kabi USA LLC (Fresenius) notified Hospira that it had filed an abbreviated new drug application with the FDA seeking approval to market a generic version of Hospira’s premix version of Precedex and containing allegations that certain patents relating to the Precedex premix formulations and their use, all of which expire in 2032, were invalid or not infringed. In January 2016, Hospira filed suit against Fresenius in the U.S. District Court for the Northern District of Illinois, asserting the validity and infringement of those patents. In December 2018, the District Court ruled that the asserted patents were invalid. Hospira has appealed the District Court’s decision to the U.S. Court of Appeals for the Federal Circuit.
In August 2016, Par Sterile Products, LLC (Par) notified Hospira that it had filed an abbreviated new drug application with the FDA seeking approval to market a generic version of Hospira’s premix version of Precedex and containing allegations that
four
patents relating to the Precedex premix formulations and their use, all of which expire in 2032, were invalid or not infringed. In September 2016, Hospira filed suit against Par in the U.S. District Court for the District of Delaware asserting the validity and infringement of the patents that are the subject of the lawsuit. In December 2016, the case was stayed pending the outcome of Hospira’s suit against Amneal (including all appeals).
In December 2017, Gland Pharma Limited (Gland) notified Hospira that it had filed an abbreviated new drug application with the FDA seeking approval to market a generic version of Hospira’s premix version of Precedex and containing allegations that
six
patents relating to the Precedex premix formulations and their use, all of which expire in 2032, were invalid or not
29
PFIZER INC. AND SUBSIDIARY COMPANIES
NOTES TO CONDENSED CONSOLIDATED FINANCIAL STATEMENTS
(UNAUDITED)
infringed. In February 2018, Hospira filed suit against Gland in the U.S. District Court for the District of Delaware asserting the validity and infringement of
four
patents that are the subject of the lawsuit.
In December 2017, Jiangsu Hengrui Medicine Co., Ltd. (Hengrui) notified Hospira that it had filed an abbreviated new drug application with the FDA seeking approval to market a generic version of Hospira’s premix version of Precedex and containing allegations that
six
patents relating to the Precedex premix formulations and their use, all of which expire in 2032, were invalid or not infringed. In February 2018, Hospira filed suit against Hengrui in the U.S. District Court for the District of Delaware asserting the validity and infringement of
four
patents that are the subject of the lawsuit.
In February 2018, Baxter Healthcare Corporation (Baxter) filed a declaratory judgment action against Hospira in the U.S. District Court for the District of Delaware seeking a declaration of non-infringement of
four
patents relating to the Precedex premix formulations and their use.
One
of the patents included in the action expires in 2019 and the other
three
patents expire in 2032. In March 2018, Hospira filed a counterclaim for infringement of the patent expiring in 2019. In November 2018, the case was dismissed by mutual agreement of the parties.
Xeljanz (tofacitinib)
In February 2017, we brought a patent-infringement action against MicroLabs USA Inc. and MicroLabs Ltd. (collectively, MicroLabs) in the U.S. District Court for the District of Delaware asserting the infringement and validity of
three
patents challenged by MicroLabs in its abbreviated new drug application seeking approval to market a generic version of tofacitinib 5 mg tablets. In November 2018, we settled all of our claims against MicroLabs on terms not material to Pfizer.
Separately, also in February 2017, we brought a patent-infringement action against Sun Pharmaceutical Industries Ltd. in the U.S. District Court for the District of Delaware asserting the infringement and validity of our patent covering a polymorphic form of tofacitinib, expiring in 2023, that was challenged by Sun Pharmaceutical Industries Ltd. in its abbreviated new drug application seeking approval to market a generic version of tofacitinib 11 mg extended release tablets. In November 2017, we brought an additional patent-infringement action against Sun Pharmaceutical Industries Ltd. in the U.S. District Court for the District of Delaware asserting the infringement and validity of another patent challenged by Sun Pharmaceutical Industries Ltd, which covers the active ingredient and expires in December 2025. In October 2018, we brought a third patent infringement action against Sun Pharmaceutical Industries Ltd. in the U.S. District Court for the District of Delaware asserting the infringement and validity of our patent covering the extended release formulation of tofacitinib, which expires in 2034. In March and April 2019, the actions against Sun Pharmaceutical Industries Ltd. were dismissed by mutual agreement of the parties.
In March 2017, we brought a patent-infringement action against Zydus Pharmaceuticals (USA) Inc. and Cadila Healthcare Ltd. (collectively, Zydus) in the U.S. District Court for the District of Delaware asserting the infringement and validity of
three
patents: the patent covering the active ingredient expiring in December 2025, the patent covering an enantiomer of tofacitinib expiring in 2022, and the patent covering a polymorphic form of tofacitinib expiring in 2023, which Zydus challenged in its abbreviated new drug application seeking approval to market a generic version of tofacitinib 5 mg tablets.
Also, in March 2017, we brought separate actions in the U.S. District Court for the District of Delaware against Prinston Pharmaceutical Inc., Zhejiang Huahai Pharmaceutical Co., Ltd., Huahai US Inc. and Solco Healthcare US, LLC (collectively, Prinston) and against Breckenridge Pharmaceutical Inc., Pensa Pharma S.A. and Laboratorios Del Dr. Esteve, S.A. (collectively, Breckenridge) on the
two
patents expiring in 2022 and 2023, respectively, that were challenged by Prinston and Breckenridge in their respective abbreviated new drug applications seeking approval to market generic versions of tofacitinib 5 mg tablets. In October 2017, we brought an additional patent-infringement action against Breckenridge in the U.S. District Court for the District of Delaware asserting the infringement and validity of
four
additional patents challenged by Breckenridge,
three
of which expire in December 2020 and
one
of which expires in December 2025. In March 2018, we brought another patent infringement action against Prinston in the U.S. District Court for the District of Delaware asserting the infringement and validity of an additional patent, which had been subsequently challenged by Prinston and which expires in December 2025. In May 2018, we settled all of our claims against Breckenridge on terms not material to Pfizer. In January 2019, we settled all of our claims against Prinston on terms not material to Pfizer.
In December 2018, we brought a separate patent infringement action against Teva Pharmaceuticals USA, Inc. (Teva) in the U.S. District Court for the District of Delaware asserting the infringement and validity of our patent covering extended release formulations of tofacitinib that was challenged by Teva in its abbreviated new drug application seeking approval to market a generic version of tofacitinib 11 mg extended release tablets.
In March 2019, we brought a separate patent infringement action against Ajanta Pharma Ltd. and Ajanta Pharma USA Inc. (collectively, Ajanta) in the U.S. District Court for the District of Delaware asserting the infringement and validity of
two
patents: the patent covering the active ingredient that expires in December 2025 and the patent covering a polymorphic form of
30
PFIZER INC. AND SUBSIDIARY COMPANIES
NOTES TO CONDENSED CONSOLIDATED FINANCIAL STATEMENTS
(UNAUDITED)
tofacitinib that expires in 2023, each of which Ajanta challenged in its abbreviated new drug application seeking approval to market a generic version of tofacitinib 5 mg tablets.
Inlyta (axitinib)
In April 2018, Apotex Inc. notified us that it had filed an abbreviated new drug application with the FDA seeking approval to market a generic version of Inlyta. Apotex Inc. asserts the invalidity and non-infringement of the crystalline form patent for Inlyta that expires in 2030. In May 2018, we filed suit against Apotex Inc. in the U.S. District Court for the District of Delaware, asserting the validity and infringement of the crystalline form patent for Inlyta.
Kerydin (tavaborole)
In September 2018, several generic companies notified us that they had filed abbreviated new drug applications with the FDA seeking approval to market generic versions of Kerydin. The generic companies
assert the invalidity and non-infringement of methods of use and formulation patents for tavaborole that expire in 2026 and 2027, including pediatric exclusivity. In October 2018, Anacor, our wholly-owned subsidiary
,
filed infringement lawsuits against each of the generic filers in the U.S. District Court for the District of Delaware and the U.S. District Court for the District of West Virginia.
Ibrance (palbociclib)
In March 2019, several generic companies notified us that they had filed abbreviated new drug applications with the FDA seeking approval to market generic versions of Ibrance. The generic companies assert the invalidity and non-infringement of two composition of matter patents and a method of use patent covering palbociclib, each of which expire in 2023. In April 2019, we brought patent infringement actions against each of the generic filers in various federal courts, asserting the validity and infringement of the patents challenged by the generic companies.
Matters Involving Our Collaboration/Licensing Partners
Xtandi (enzalutamide)
In December 2016, Medivation and Medivation Prostate Therapeutics, Inc. (collectively, the Medivation Group); Astellas Pharma Inc., Astellas US LLC and Astellas Pharma US, Inc. (collectively, Astellas); and The Regents of the University of California filed patent-infringement suits in the U.S. District Court for the District of Delaware against Actavis Laboratories FL, Inc. and Actavis LLC (collectively, Actavis); Zydus; and Apotex Inc. and Apotex Corp. (collectively, Apotex) in connection with those companies’ respective abbreviated new drug applications filed with the FDA for approval to market generic versions of enzalutamide. The generic manufacturers are challenging patents, which expire as early as 2026, covering enzalutamide and treatments for prostate cancer. In May 2017, the Medivation Group filed a patent-infringement suit against Roxane Laboratories Inc. (Roxane) in the same court in connection with Roxane’s abbreviated new drug application with the FDA for approval to market a generic version of enzalutamide. In June and July 2018, we settled all of our claims against Actavis and Apotex, respectively, on terms not material to Pfizer.
Eliquis
In February, March, and April 2017,
twenty-five
generic companies sent BMS Paragraph-IV certification letters informing BMS that they had filed abbreviated new drug applications seeking approval of generic versions of Eliquis, challenging the validity and infringement of one or more of the
three
patents listed in the Orange Book for Eliquis. The patents currently are set to expire in 2019, 2026, and 2031. Eliquis has been jointly developed and is being commercialized by BMS and Pfizer. In April 2017, BMS and Pfizer filed patent-infringement actions against all generic filers in the U.S. District Court for the District of Delaware and the U.S. District Court for the District of West Virginia, asserting that each of the generic companies’ proposed products would infringe each of the patent(s) that each generic filer challenged. Some generic filers challenged only the 2031 patent, some challenged both the 2031 and 2026 patent, and one generic company challenged all
three
patents. We and BMS have settled with certain of the generic companies on terms not material to Pfizer, and we and BMS may settle with other generic companies in the future.
Actions In Which We Are The Defendant
Inflectra (infliximab-dyyb)
In March 2015, Janssen and New York University, together, brought a patent-infringement action in the U.S. District Court for the District of Massachusetts against Hospira, Celltrion Healthcare Co. Ltd. and Celltrion Inc. alleging that infliximab-dyyb, to be marketed by Hospira in the U.S. under the brand name Inflectra, would infringe
six
patents relating to infliximab, its manufacture and use. Claims with respect to
four
of the patents were dismissed by the plaintiffs, leaving
two
patents at issue: the infliximab antibody patent and a patent relating to cell culture media. In January 2018, the antibody patent was declared invalid by the Court of Appeals for the Federal Circuit. In July 2018, the U.S. District Court for the District of Massachusetts granted defendants’ motion for summary judgment and ruled that the patent relating to cell culture media was not infringed. Janssen appealed the District Court’s decision to the U.S. Court of Appeals for the Federal Circuit.
31
PFIZER INC. AND SUBSIDIARY COMPANIES
NOTES TO CONDENSED CONSOLIDATED FINANCIAL STATEMENTS
(UNAUDITED)
A2. Legal Proceedings––Product Litigation
Like other pharmaceutical companies, we are defendants in numerous cases, including but not limited to those discussed below, related to our pharmaceutical and other products. Plaintiffs in these cases seek damages and other relief on various grounds for alleged personal injury and economic loss.
Asbestos
Between 1967 and 1982, Warner-Lambert owned American Optical Corporation (American Optical), which manufactured and sold respiratory protective devices and asbestos safety clothing. In connection with the sale of American Optical in 1982, Warner-Lambert agreed to indemnify the purchaser for certain liabilities, including certain asbestos-related and other claims. As of
March 31, 2019
, approximately
46,400
claims naming American Optical and numerous other defendants were pending in various federal and state courts seeking damages for alleged personal injury from exposure to asbestos and other allegedly hazardous materials. Warner-Lambert was acquired by Pfizer in 2000 and is a wholly-owned subsidiary of Pfizer. Warner-Lambert is actively engaged in the defense of, and will continue to explore various means of resolving, these claims.
Numerous lawsuits are pending against Pfizer in various federal and state courts seeking damages for alleged personal injury from exposure to products allegedly containing asbestos and other allegedly hazardous materials sold by Pfizer and certain of its previously owned subsidiaries.
There also are a small number of lawsuits pending in various federal and state courts seeking damages for alleged exposure to asbestos in facilities owned or formerly owned by Pfizer or its subsidiaries.
Effexor
Beginning in May 2011, actions, including purported class actions, were filed in various federal courts against Wyeth and, in certain of the actions, affiliates of Wyeth and certain other defendants relating to Effexor XR, which is the extended-release formulation of Effexor. The plaintiffs in each of the class actions seek to represent a class consisting of all persons in the U.S. and its territories who directly purchased, indirectly purchased or reimbursed patients for the purchase of Effexor XR or generic Effexor XR from any of the defendants from June 14, 2008 until the time the defendants’ allegedly unlawful conduct ceased. The plaintiffs in all of the actions allege delay in the launch of generic Effexor XR in the U.S. and its territories, in violation of federal antitrust laws and, in certain of the actions, the antitrust, consumer protection and various other laws of certain states, as the result of Wyeth fraudulently obtaining and improperly listing certain patents for Effexor XR in the Orange Book, enforcing certain patents for Effexor XR and entering into a litigation settlement agreement with a generic drug manufacturer with respect to Effexor XR. Each of the plaintiffs seeks treble damages (for itself in the individual actions or on behalf of the putative class in the purported class actions) for alleged price overcharges for Effexor XR or generic Effexor XR in the U.S. and its territories since June 14, 2008. All of these actions have been consolidated in the U.S. District Court for the District of New Jersey.
In October 2014, the District Court dismissed the direct purchaser plaintiffs’ claims based on the litigation settlement agreement, but declined to dismiss the other direct purchaser plaintiff claims. In January 2015, the District Court entered partial final judgments as to all settlement agreement claims, including those asserted by direct purchasers and end-payer plaintiffs, which plaintiffs appealed to the U.S. Court of Appeals for the Third Circuit. In August 2017, the U.S. Court of Appeals for the Third Circuit reversed the District Court’s decisions and remanded the claims to the District Court.
Lipitor
|
•
|
Antitrust Actions
|
Beginning in November 2011, purported class actions relating to Lipitor were filed in various federal courts against, among others, Pfizer, certain affiliates of Pfizer, and, in most of the actions, Ranbaxy, Inc. (Ranbaxy) and certain affiliates of Ranbaxy. The plaintiffs in these various actions seek to represent nationwide, multi-state or statewide classes consisting of persons or entities who directly purchased, indirectly purchased or reimbursed patients for the purchase of Lipitor (or, in certain of the actions, generic Lipitor) from any of the defendants from March 2010 until the cessation of the defendants’ allegedly unlawful conduct (the Class Period). The plaintiffs allege delay in the launch of generic Lipitor, in violation of federal antitrust laws and/or state antitrust, consumer protection and various other laws, resulting from (i) the 2008 agreement pursuant to which Pfizer and Ranbaxy settled certain patent litigation involving Lipitor, and Pfizer granted Ranbaxy a license to sell a generic version of Lipitor in various markets beginning on varying dates, and (ii) in certain of the actions, the procurement and/or enforcement of certain patents for Lipitor. Each of the actions seeks, among other things, treble damages on behalf of the putative class for alleged price overcharges for Lipitor (or, in certain of the actions, generic Lipitor) during the Class Period. In addition, individual actions have been filed against Pfizer, Ranbaxy and certain of their affiliates, among others, that assert claims and seek relief for the plaintiffs that are substantially similar to the claims asserted and the relief sought in the purported class actions described above. These various actions have been consolidated for pre-trial proceedings in a Multi-District Litigation (
In re Lipitor Antitrust Litigation MDL-2332
) in the U.S. District
Court for the District of New Jersey.
32
PFIZER INC. AND SUBSIDIARY COMPANIES
NOTES TO CONDENSED CONSOLIDATED FINANCIAL STATEMENTS
(UNAUDITED)
In September 2013 and 2014, the District Court dismissed with prejudice the claims by direct purchasers. In October and November 2014, the District Court dismissed with prejudice the claims of all other Multi-District Litigation plaintiffs. All plaintiffs have appealed the District Court’s orders dismissing their claims with prejudice to the U.S. Court of Appeals for the Third Circuit. In addition, the direct purchaser class plaintiffs appealed the order denying their motion to amend the judgment and for leave to amend their complaint to the U.S. Court of Appeals for the Third Circuit. In August 2017, the U.S. Court of Appeals for the Third Circuit reversed the District Court’s decisions and remanded the claims to the District Court.
Also, in January 2013, the State of West Virginia filed an action in West Virginia state court against Pfizer and Ranbaxy, among others, that asserts claims and seeks relief on behalf of the State of West Virginia and residents of that state that are substantially similar to the claims asserted and the relief sought in the purported class actions described above.
|
•
|
Personal Injury Actions
|
A number of individual and multi-plaintiff lawsuits have been filed against us in various federal and state courts alleging that the plaintiffs developed type 2 diabetes purportedly as a result of the ingestion of Lipitor. Plaintiffs seek compensatory and punitive damages.
In February 2014, the federal actions were transferred for consolidated pre-trial proceedings to a Multi-District Litigation (
In re Lipitor (Atorvastatin Calcium) Marketing, Sales Practices and Products Liability Litigation (No. II) MDL-2502
) in the U.S. District Court for the District of South Carolina. Since 2016, certain cases in the Multi-District Litigation were remanded to certain state courts. In January 2017, the District Court granted our motion for summary judgment, dismissing substantially all of the remaining cases pending in the Multi-District Litigation. In January 2017, the plaintiffs appealed the District Court’s decision to the U.S. Court of Appeals for the Fourth Circuit. In June 2018, the U.S. Court of Appeals for the Fourth Circuit affirmed the District Court’s decision.
Viagra
A number of individual and multi-plaintiff lawsuits have been filed against us in various federal and state courts alleging that the plaintiffs developed melanoma and/or the exacerbation of melanoma purportedly as a result of the ingestion of Viagra. Plaintiffs seek compensatory and punitive damages.
In April 2016, the federal actions were transferred for coordinated pre-trial proceedings to a Multi-District Litigation (
In Re: Viagra (Sildenafil Citrate) Products Liability Litigation, MDL-2691
) in the U.S. District Court for the Northern District of California. In December 2016, federal actions filed against Lilly and filed against both us and Lilly, were transferred for coordinated pre-trial proceedings to the Multi-District Litigation (
In re: Viagra (Sildenafil Citrate) and Cialis (Tadalafil) Products Liability Litigation, MDL-2691
).
Intravenous Solutions
Beginning in November 2016, purported class actions were filed in the U.S. District Court for the Northern District of Illinois against Hospira, Hospira Worldwide, Inc. and certain other defendants relating to intravenous saline solution. Plaintiffs seek to represent a class consisting of all persons and entities in the U.S. who directly purchased intravenous saline solution sold by any of the defendants from January 1, 2013 until the time the defendants’ allegedly unlawful conduct ceases. Plaintiffs allege that the defendants’ conduct restricts output and artificially fixes, raises, maintains and/or stabilizes the prices of intravenous saline solution sold throughout the U.S. in violation of federal antitrust laws. Plaintiffs seek treble damages (for themselves and on behalf of the putative classes) and an injunction against defendants for alleged price overcharges for intravenous saline solution in the U.S. since January 1, 2013. All of these actions have been consolidated in the U.S. District Court for the Northern District of Illinois. In July 2018, the District Court granted defendants’ motions to dismiss the consolidated amended complaint without prejudice. Plaintiffs filed a second amended complaint in September 2018. On February 3, 2017, we completed the sale of our global infusion systems net assets, HIS, which includes intravenous saline solution, to ICU Medical. The litigation is the subject of cross-claims for indemnification by both Pfizer and ICU Medical under the purchase agreement.
Hormone Therapy Consumer Class Action
A certified consumer class action is pending against Wyeth in the U.S. District Court for the Southern District of California based on the alleged off-label marketing of its hormone therapy products. The case was originally filed in December 2003. The class consists of California consumers who purchased Wyeth’s hormone-replacement products between January 1995 and January 2003 and who do not seek personal injury damages therefrom. The class seeks compensatory and punitive damages, including a full refund of the purchase price.
Eliquis
A number of individual and multi-plaintiff lawsuits have been filed against us and BMS in various federal and state courts pursuant to which plaintiffs seek to recover for personal injuries, including wrongful death, due to bleeding allegedly as a result of the ingestion of Eliquis. Plaintiffs seek compensatory and punitive damages.
33
PFIZER INC. AND SUBSIDIARY COMPANIES
NOTES TO CONDENSED CONSOLIDATED FINANCIAL STATEMENTS
(UNAUDITED)
In February 2017, the federal actions were transferred for coordinated pre-trial proceedings to a Multi-District Litigation (
In Re: Eliquis (Apixaban) Products Liability Litigation MDL-2754
) in the U.S. District Court for the Southern District of New York. In July 2017, the District Court dismissed substantially all of the actions that were pending in the Multi-District Litigation. In August 2017, certain plaintiffs appealed the District Court’s dismissal to the U.S. Court of Appeals for the Second Circuit. In March 2019, the U.S. Court of Appeals for the Second Circuit affirmed the District Court’s decision.
EpiPen
Beginning in February 2017, purported class actions were filed in various federal courts by indirect purchasers of EpiPen against Pfizer, and/or its affiliates King and Meridian, and/or various entities affiliated with Mylan N.V., and Mylan N.V. Chief Executive Officer, Heather Bresch. The plaintiffs in these actions seek to represent U.S. nationwide classes comprising persons or entities who paid for any portion of the end-user purchase price of an EpiPen between 2009 until the cessation of the defendants’ allegedly unlawful conduct. In August 2017, a similar lawsuit brought in the U.S. District Court for the District of New Jersey on behalf of a purported class of direct purchaser plaintiffs against Pfizer, King, Meridian and Mylan was voluntarily dismissed without prejudice. Against Pfizer and/or its affiliates, plaintiffs generally allege that Pfizer’s and/or its affiliates’ settlement of patent litigation regarding EpiPen delayed market entry of generic EpiPen in violation of federal antitrust laws and various state antitrust or consumer protection laws. At least one lawsuit also alleges that Pfizer and/or Mylan N.V. violated the federal Racketeer Influenced and Corrupt Organizations Act. Plaintiffs also filed various consumer protection and unjust enrichment claims against, and relating to conduct attributable solely to, Mylan Pharmaceuticals regarding EpiPen. Plaintiffs seek treble damages for alleged overcharges for EpiPen since 2009. In August 2017, the actions were consolidated for coordinated pre-trial proceedings in a Multi-District Litigation (
In re: EpiPen (Epinephrine Injection, USP) Marketing, Sales Practices and Antitrust Litigation
, MDL-2785) in the U.S. District Court for the District of Kansas with other EpiPen-related actions against Mylan N.V. and/or its affiliates to which Pfizer, King and Meridian are not parties.
Nexium 24HR and Protonix
A number of individual and multi-plaintiff lawsuits have been filed against Pfizer, certain of its subsidiaries and/or other pharmaceutical manufacturers in various federal and state courts alleging that the plaintiffs developed kidney-related injuries purportedly as a result of the ingestion of certain proton pump inhibitors. The cases against us involve Nexium 24HR and/or Protonix and seek compensatory and punitive damages and, in some cases, treble damages, restitution or disgorgement. In August 2017, the federal actions were ordered transferred for coordinated pre-trial proceedings to a Multi-District Litigation (
In re: Proton-Pump Inhibitor Products Liability Litigation
(No. II)) in the U.S. District Court for the District of New Jersey.
Docetaxel
|
•
|
Personal Injury Actions
|
A number of lawsuits have been filed against Hospira and Pfizer in various federal and state courts alleging that plaintiffs who were treated with Docetaxel developed permanent hair loss. The significant majority of the cases also name other defendants, including the manufacturer of the branded product, Taxotere. Plaintiffs seek compensatory and punitive damages.
In October 2016, the federal cases were transferred for coordinated pre-trial proceedings to a Multi-District Litigation (
In re Taxotere (Docetaxel) Products Liability Litigation
, MDL-2740) in the U.S. District Court for the Eastern District of Louisiana.
|
•
|
Mississippi Attorney General Government Investigation
|
In October 2018, the Attorney General of Mississippi filed a complaint in Mississippi state court against the manufacturer of the branded product and
eight
other manufacturers including Pfizer and Hospira, alleging, with respect to Pfizer and Hospira, a failure to warn about a risk of permanent hair loss in violation of the Mississippi Consumer Protection Act. The action seeks civil penalties and injunctive relief.
Adalimumab Biosimilars
Beginning in March 2019, purported class actions relating to Humira and adalimumab biosimilars were filed in the United States District Court for the Northern District of Illinois against AbbVie Inc. (AbbVie), certain affiliates of AbbVie, and other pharmaceutical manufacturers. Pfizer is a named defendant in three of the actions. The plaintiffs seek to represent nationwide and multi-state classes consisting of persons and/or entities who are indirect purchasers of Humira from January 1, 2017 until the allegedly unlawful antitrust effects cease. Against Pfizer, the plaintiffs generally allege that Pfizer’s and AbbVie’s 2018 licensing agreements, resolving all global intellectual property matters for Pfizer’s proposed adalimumab biosimilar, delayed market entry of Pfizer’s biosimilar product in the U.S. in violation of federal antitrust laws, various state antitrust or consumer protection laws, and unjust enrichment laws. Plaintiffs seek injunctive relief and treble damages for alleged overcharges for Humira since 2017.
34
PFIZER INC. AND SUBSIDIARY COMPANIES
NOTES TO CONDENSED CONSOLIDATED FINANCIAL STATEMENTS
(UNAUDITED)
A3. Legal Proceedings––Commercial and Other Matters
Average Wholesale Price Litigation
Pfizer, certain of its subsidiaries and other pharmaceutical manufacturers were sued in various state courts by a number of states alleging that the defendants provided average wholesale price (AWP) information for certain of their products that was higher than the actual average prices at which those products were sold. The AWP is used to determine reimbursement levels under Medicare Part B and Medicaid and in many private-sector insurance policies and medical plans. All but
one
of those actions have been resolved through settlement, dismissal or final judgment. The plaintiff state, Illinois,
in the
one
remaining action, claims that the alleged spread between the AWPs at which purchasers were reimbursed and the actual sale prices was promoted by the defendants as an incentive to purchase certain of their products. The action
alleges, among other things, fraud
and violation of the state’s unfair trade practices and
consumer protection statutes and seeks monetary and other relief, including civil penalties and treble damages.
Monsanto-Related Matters
In 1997, Monsanto Company (Former Monsanto) contributed certain chemical manufacturing operations and facilities to a newly formed corporation, Solutia Inc. (Solutia), and spun off the shares of Solutia. In 2000, Former Monsanto merged with Pharmacia & Upjohn Company to form Pharmacia. Pharmacia then transferred its agricultural operations to a newly created subsidiary, named Monsanto Company (New Monsanto), which it spun off in a two-stage process that was completed in 2002. Pharmacia was acquired by Pfizer in 2003 and is a wholly-owned subsidiary of Pfizer.
In connection with its spin-off that was completed in 2002, New Monsanto assumed, and agreed to indemnify Pharmacia for, any liabilities related to Pharmacia’s former agricultural business. New Monsanto has defended and/or is defending Pharmacia in connection with various claims and litigation arising out of, or related to, the agricultural business, and has been indemnifying Pharmacia when liability has been imposed or settlement has been reached regarding such claims and litigation.
In connection with its spin-off in 1997, Solutia assumed, and agreed to indemnify Pharmacia for, liabilities related to Former Monsanto’s chemical businesses. As the result of its reorganization under Chapter 11 of the U.S. Bankruptcy Code, Solutia’s indemnification obligations relating to Former Monsanto’s chemical businesses are primarily limited to sites that Solutia has owned or operated. In addition, in connection with its spinoff that was completed in 2002, New Monsanto assumed, and agreed to indemnify Pharmacia for, any liabilities primarily related to Former Monsanto’s chemical businesses, including, but not limited to, any such liabilities that Solutia assumed. Solutia’s and New Monsanto’s assumption of, and agreement to indemnify Pharmacia for, these liabilities apply to pending actions and any future actions related to Former Monsanto’s chemical businesses in which Pharmacia is named as a defendant, including, without limitation, actions asserting environmental claims, including alleged exposure to polychlorinated biphenyls. Solutia and/or New Monsanto are defending Pharmacia in connection with various claims and litigation arising out of, or related to, Former Monsanto’s chemical businesses, and have been indemnifying Pharmacia when liability has been imposed or settlement has been reached regarding such claims and litigation.
Environmental Matters
In 2009, we submitted to the U.S. Environmental Protection Agency (EPA) a corrective measures study report with regard to Pharmacia’s discontinued industrial chemical facility in North Haven, Connecticut. In September 2010, our corrective measures study report was approved by the EPA, and we commenced construction of the site remedy in late 2011 under an Updated Administrative Order on Consent with the EPA.
Also, in 2009, we submitted a revised site-wide feasibility study with regard to Wyeth Holdings Corporation’s (formerly, American Cyanamid Company) discontinued industrial chemical facility in Bound Brook, New Jersey. In July 2011, Wyeth Holdings Corporation finalized an Administrative Settlement Agreement with the EPA and Order on Consent for Removal Action (the 2011 Administrative Settlement Agreement) with the EPA with regard to the Bound Brook facility. In May 2012, we completed construction of an interim remedy to address the discharge of impacted groundwater from that facility to the Raritan River. In September 2012, the EPA issued a final remediation plan for the Bound Brook facility’s main plant area, which is generally in accordance with one of the remedies evaluated in our revised site-wide feasibility study. In March 2013, Wyeth Holdings Corporation (now Wyeth Holdings LLC) entered into an Administrative Settlement Agreement and Order on Consent with the EPA to allow us to undertake detailed engineering design of the remedy for the main plant area and to perform a focused feasibility study for
two
adjacent lagoons. In September 2015, the U.S., on behalf of the EPA, filed a complaint and consent decree with the federal District Court for the District of New Jersey that allows Wyeth Holdings LLC to complete the design and to implement the remedy for the main plant area. In December 2015, the consent decree (which supersedes the 2011 Administrative Settlement Agreement) was entered by the District Court. In September 2018, the EPA issued a final remediation plan for the
two
adjacent lagoons, which is generally in accordance with one of the remedies evaluated in our focused feasibility study. We have accrued for the estimated costs of the site remedies for the North Haven and Bound Brook facilities.
35
PFIZER INC. AND SUBSIDIARY COMPANIES
NOTES TO CONDENSED CONSOLIDATED FINANCIAL STATEMENTS
(UNAUDITED)
We are a party to a number of other proceedings brought under the Comprehensive Environmental Response, Compensation, and Liability Act of 1980, as amended, and other state, local or foreign laws in which the primary relief sought is the cost of past and/or future remediation.
Contracts with Iraqi Ministry of Health
In October 2017, a number of United States service members, civilians, and their families brought a complaint in the Federal District Court for the District of Columbia against a number of pharmaceutical and medical devices companies, including Pfizer and certain of its subsidiaries, alleging that the defendants violated the United States Anti-Terrorism Act. The complaint alleges that the defendants provided funding for terrorist organizations through their sales practices pursuant to pharmaceutical and medical device contracts with the Iraqi Ministry of Health, and seeks monetary relief. In July 2018, the U.S. Department of Justice requested documents related to this matter, which are being provided.
Allergan Complaint for Indemnity
In August 2018, Pfizer was named as a defendant in a third-party complaint for indemnity, along with King, a Pfizer subsidiary, filed by Allergan Finance LLC (Allergan) in a Multi-District Litigation (
In re National Prescription Opiate Litigation MDL 2804
) in the U.S. District Court for the Northern District of Ohio. The lawsuit asserted claims for indemnity related to Kadian, which was owned for a short period by King in 2008, prior to Pfizer's acquisition of King in 2010. In December 2018, the District Court dismissed the lawsuit. In February 2019, Allergan filed a similar complaint in the Supreme Court of the State of New York, asserting claims for indemnity related to Kadian.
A4. Legal Proceedings––Government Investigations
Like other pharmaceutical companies, we are subject to extensive regulation by government agencies in the U.S., other developed markets and multiple emerging markets in which we operate. As a result, we have interactions with government agencies on an ongoing basis. Criminal charges, substantial fines and/or civil penalties, limitations on our ability to conduct business in applicable jurisdictions, corporate integrity or deferred prosecution agreements, as well as reputational harm and increased public interest in the matter could result from government investigations.
In addition, in a qui tam lawsuit in which the government declines to intervene, the relator may still pursue a suit for the recovery of civil damages and penalties on behalf of the government. Among the investigations by government agencies are the matters discussed below.
Phenytoin Sodium Capsules
In 2012, Pfizer sold the U.K. Marketing Authorisation for phenytoin sodium capsules to a third party, but retained the right to supply the finished product to that third party. In May 2013, the U.K. Competition & Markets Authority (CMA) informed us that it had launched an investigation into the supply of phenytoin sodium capsules in the U.K. market. In August 2015, the CMA issued a Statement of Objections alleging that Pfizer and Pfizer Limited, a U.K. subsidiary, engaged in conduct that violates U.K. and EU antitrust laws. In December 2016, the CMA imposed a
£84.2 million
fine on Pfizer and Pfizer Limited. Pfizer appealed the CMA decision to The Competition Appeal Tribunal in February 2017
.
On June 7, 2018, the Competition Appeal Tribunal overturned the CMA decision as well as the associated fine. The CMA appealed the judgment to the Court of Appeal.
Greenstone Investigations
Since July 2017, the U.S. Department of Justice’s Antitrust Division has been investigating our Greenstone generics business. We believe this is related to an ongoing antitrust investigation of the generic pharmaceutical industry. The government has been obtaining information from Greenstone. In April 2018, Greenstone received requests for information from the Antitrust Department of the Connecticut Office of the Attorney General. We have been providing information pursuant to these requests.
Subpoena relating to Manufacturing of Quillivant XR
In October 2018, we received a subpoena from the U.S. Attorney’s Office for the Southern District of New York (SDNY) seeking records relating to our relationship with another drug manufacturer and its production and manufacturing of drugs including, but not limited to, Quillivant XR. We are producing records pursuant to the subpoena.
Civil Investigative Demand relating to Meridian Medical Technologies
In February 2019, we received a civil investigative demand from the U.S. Attorney’s Office for the SDNY. The civil investigative demand seeks records and information related to alleged quality issues involving the manufacture of auto-injectors at our Meridian site. We are producing records in response to this civil investigative demand.
Contracts with Iraqi Ministry of Health
See
Note 12A3.
Contingencies and Certain Commitments
: Legal Proceedings––Commercial and Other Matters––Contracts with Iraqi Ministry of Health
above for information regarding U.S. government investigations related to contracts with the Iraqi Ministry of Health.
36
PFIZER INC. AND SUBSIDIARY COMPANIES
NOTES TO CONDENSED CONSOLIDATED FINANCIAL STATEMENTS
(UNAUDITED)
Docetaxel
––
Mississippi Attorney General Government Investigation
See
Note 12A2.
Contingencies and Certain Commitments
: Legal Proceedings
––
Product Litigation
––
Docetaxel
––
Mississippi Attorney General Government Investigation
above for information regarding a government investigation related to Docetaxel marketing practices.
B. Guarantees and Indemnifications
In the ordinary course of business and in connection with the sale of assets and businesses and other transactions, we often indemnify our counterparties against certain liabilities that may arise in connection with the transaction or that are related to events and activities prior to or following a transaction. If the indemnified party were to make a successful claim pursuant to the terms of the indemnification, we may be required to reimburse the loss. These indemnifications are generally subject to various restrictions and limitations. Historically, we have not paid significant amounts under these provisions and, as of
March 31, 2019
, the estimated fair value of these indemnification obligations was not significant.
In addition, in connection with our entry into certain agreements, our counterparties agree to indemnify us. For example, our collaboration agreement with EMD Serono, Inc. to co-promote Rebif in the U.S. expired at the end of 2015 and included certain indemnity provisions. Patent litigation brought by Biogen Idec MA Inc. against EMD Serono Inc. and Pfizer is pending in the U.S. District Court for the District of New Jersey and the United States Court of Appeals for the Federal Circuit. EMD Serono Inc. has acknowledged that it is obligated to satisfy any award of damages.
Pfizer Inc. has also guaranteed the long-term debt of certain companies that it acquired and that now are subsidiaries of Pfizer.
C. Certain Commitments
On
February 7, 2019
, we entered into an accelerated share repurchase agreement with
GS&Co.
to repurchase approximately
$6.8 billion
of our common stock. Pursuant to the terms of the agreement, on
February 12, 2019
, we paid approximately
$6.8 billion
to
GS&Co.
and received an initial delivery of approximately
130 million
shares of our common stock from
GS&Co.
, which represented, based on the closing price of our common stock on the NYSE on
February 7, 2019
, approximately
80%
of the notional amount of the accelerated share repurchase agreement. As of March 31, 2019, the common stock received is included in
Treasury Stock
. At settlement of the agreement, which is expected to occur during or prior to the third quarter of 2019,
GS&Co.
may be required to deliver additional shares of common stock to us, or, under certain circumstances, we may be required to deliver shares of our common stock or may elect to make a cash payment to
GS&Co.
, with the number of shares to be delivered or the amount of such payment, as well as the final price per share, based on the volume-weighted average price, less a discount, of Pfizer’s common stock during the term of the transaction. This agreement was entered into pursuant to our previously announced share repurchase authorization. After giving effect to the accelerated share repurchase agreement and other share repurchases through March 31, 2019, our remaining share-purchase authorization was approximately
$5.3 billion
on March 31, 2019.
Note 13.
Segment, Geographic and Other Revenue Information
A. Segment Information
At the beginning of our 2019 fiscal year, we began to manage our commercial operations through a new global structure consisting of
three
distinct business segments: Pfizer Biopharmaceuticals Group (Biopharma), Upjohn and Pfizer’s Consumer Healthcare business (Consumer Healthcare). The Biopharma, Upjohn and Consumer Healthcare segments are each led by a single manager. Each operating segment has responsibility for its commercial activities. Upjohn and Consumer Healthcare are responsible for their own R&D activities while Biopharma receives its R&D services from GPD and WRDM. These services include IPR&D projects for new investigational products and additional indications for in-line products. Each business has a geographic footprint across developed and emerging markets. Our chief operating decision maker uses the revenues and earnings of the
three
operating segments, among other factors, for performance evaluation and resource allocation. Biopharma and Upjohn are the only reportable segments. We have revised prior-period information (Revenues and Earnings, as defined by management) to conform to the current management structure. As our operations were not managed under the new structure until the beginning of fiscal 2019, certain costs and expenses could not be directly attributed to one of the new operating segments. As a result, our operating segment results for the first quarter of 2018 include allocations, which management believes are reasonable.
37
PFIZER INC. AND SUBSIDIARY COMPANIES
NOTES TO CONDENSED CONSOLIDATED FINANCIAL STATEMENTS
(UNAUDITED)
Operating Segments
|
Some additional information about our Biopharma and Upjohn business segments follows:
|
||

|
|
|
|
Biopharma is a science-based innovative medicines business that includes six business units – Oncology, Inflammation & Immunology, Rare Disease, Hospital, Vaccines and Internal Medicine. The new Hospital unit commercializes our global portfolio of sterile injectable and anti-infective medicines and includes Pfizer’s contract manufacturing operation, Pfizer CentreOne. We also incorporated our biosimilar portfolio into our Oncology and Inflammation & Immunology business units and certain legacy established products into the Internal Medicine business unit. Each business unit is committed to improving health with our innovative products from prevention to treatment to wellness – at every stage of life in communities across the globe.
|
Upjohn is a global, primarily off-patent branded and generic established medicines business, which includes 20 primarily off-patent solid oral dose legacy brands, as well as certain generic medicines.
|
|
|
Select products include:
- Prevnar 13/Prevenar 13 - Ibrance
-
Eliquis
- Enbrel (outside the U.S. and Canada) - Xeljanz - Chantix/Champix
-
Sutent
|
Select products include:
- Lyrica - Lipitor - Norvasc
- Celebrex
- Viagra
-
Certain generic medicines
|
|
Pfizer’s Consumer Healthcare segment is an over-the-counter medicines business, which we announced on December 19, 2018 will be contributed to, and combined with, GSK’s consumer healthcare business to form a new consumer healthcare joint venture. See
Note 2
for additional information.
Other Costs and Business Activities
Certain pre-tax costs are not allocated to our operating segment results, such as costs associated with the following:
|
•
|
WRDM––the R&D and Medical expenses managed by our WRDM organization, which is generally responsible for research projects for our Biopharma portfolio until proof-of-concept is achieved and then for transitioning those projects to the GPD organization for possible clinical and commercial development. R&D spending may include upfront and milestone payments for intellectual property rights. The WRDM organization also has responsibility for certain science-based and other platform-services organizations, which provide end-to-end technical expertise and other services to the various R&D projects, as well as the Worldwide Medical and Safety group, which ensures that Pfizer provides all stakeholders––including patients, healthcare providers, pharmacists, payers and health authorities––with complete and up-to-date information on the risks and benefits associated with Pfizer products so that they can make appropriate decisions on how and when to use Pfizer’s medicines.
|
|
•
|
GPD––the costs associated with our GPD organization, which is generally responsible for clinical trials from WRDM in the Biopharma portfolio, including late stage portfolio spend. GPD also provides technical support and other services to Pfizer R&D projects. GPD is responsible for facilitating all regulatory submissions and interactions with regulatory agencies.
|
|
•
|
Other––the operating results of our Consumer Healthcare business, and costs associated with other commercial activities not managed as part of Biopharma or Upjohn, including all strategy, business development, portfolio management and valuation capabilities, which previously had been reported in various parts of the organization.
|
|
•
|
Corporate and Other Unallocated––the costs associated with platform functions (such as worldwide technology, global real estate operations, legal, finance, human resources, worldwide public affairs, compliance, and worldwide procurement), patient advocacy activities and certain compensation and other corporate costs, such as interest income and expense, and gains and losses on investments, as well as overhead expenses associated with our manufacturing (which include
|
38
PFIZER INC. AND SUBSIDIARY COMPANIES
NOTES TO CONDENSED CONSOLIDATED FINANCIAL STATEMENTS
(UNAUDITED)
manufacturing variances associated with production) and commercial operations that are not directly assessed to an operating segment, as business unit (segment) management does not manage these costs.
|
•
|
Certain transactions and events such as (i) purchase accounting adjustments, where we incur expenses associated with the amortization of fair value adjustments to inventory, intangible assets and PP&E; (ii) acquisition-related costs, where we incur costs for executing the transaction, integrating the acquired operations and restructuring the combined company; and (iii) certain significant items, representing substantive and/or unusual, and in some cases recurring, items (such as restructuring charges, legal charges or net gains and losses on investments in equity securities) that are evaluated on an individual basis by management and that, either as a result of their nature or size, would not be expected to occur as part of our normal business on a regular basis. Such items can include, but are not limited to, non-acquisition-related restructuring costs, as well as costs incurred for legal settlements, asset impairments and disposals of assets or businesses, including, as applicable, any associated transition activities.
|
Segment Assets
We manage our assets on a total company basis, not by operating segment, as many of our operating assets are shared or commingled (such as accounts receivable, as many of our customers are served by multiple operating segments). Therefore, our chief operating decision maker does not regularly review any asset information by operating segment and, accordingly, we do not report asset information by operating segment. Total assets were approximately
$155 billion
as of
March 31, 2019
and
$159 billion
as of
December 31, 2018
.
Selected Income Statement Information
|
The following table provides selected income statement information by reportable segment:
|
||||||||||||||||
|
Three Months Ended
|
||||||||||||||||
|
|
Revenues
|
Earnings
(a)
|
||||||||||||||
|
(MILLIONS OF DOLLARS)
|
March 31,
2019 |
|
April 1,
2018 |
|
March 31,
2019 |
|
April 1,
2018 |
|
||||||||
|
Reportable Segments:
|
||||||||||||||||
|
Biopharma
|
$
|
9,185
|
|
$
|
8,881
|
|
$
|
5,888
|
|
$
|
5,823
|
|
||||
|
Upjohn
|
3,075
|
|
3,120
|
|
2,274
|
|
2,168
|
|
||||||||
|
Total reportable segments
|
12,259
|
|
12,001
|
|
8,162
|
|
7,991
|
|
||||||||
|
Other business activities
|
—
|
|
—
|
|
(1,113
|
)
|
(1,187
|
)
|
||||||||
|
Reconciling Items:
|
|
|
|
|
||||||||||||
|
Corporate and other unallocated
|
858
|
|
905
|
|
(1,278
|
)
|
(1,325
|
)
|
||||||||
|
Purchase accounting adjustments
|
—
|
|
—
|
|
(1,038
|
)
|
(1,221
|
)
|
||||||||
|
Acquisition-related costs
|
—
|
|
—
|
|
(28
|
)
|
(48
|
)
|
||||||||
|
Certain significant items
(b)
|
—
|
|
—
|
|
(382
|
)
|
(83
|
)
|
||||||||
|
$
|
13,118
|
|
$
|
12,906
|
|
$
|
4,323
|
|
$
|
4,127
|
|
|||||
|
(a)
|
Income from continuing operations before provision for taxes on income
. Biopharma’s earnings
include d
ividend income of
$64 million
in the
first quarter
of
2019
and
$59 million
in the
first quarter
of
2018
from our investment in ViiV. For additional information, see
Note 4.
|
|
(b)
|
Certain significant items are substantive and/or unusual, and in some cases recurring, items (such as restructuring or legal charges) that, either as a result of their nature or size, would not be expected to occur as part of our normal business on a regular basis.
|
For Earnings in the
first quarter
of
2019
, certain significant items includes: (i) restructuring charges and implementation costs associated with our cost-reduction ini
tiatives that are not associated with an acquisition of
$57 million
, (ii) income for certain legal matters of
$6 million
, (iii) certain asset impairment charges of
$139 million
,
(iv) charges for business and legal entity alignment of
$119 million
, (v) net gains recognized during the period on investments in equity securities of
$111 million
, (vi) net losses on early retirement of debt of
$138 million
and (vii) other charges of
$46 million
. For additional information, see
Note 3
and
Note 4.
For Earnings in the
first quarter
of
2018
, certain significant items includes: (i) restructuring charges and implementation costs associated with our cost-reduction initiatives that are not associated with an acquisition of
$51 million
, (ii) income for certain legal matters of
$19 million
, (iii) charges for business and legal entity alignment of
$3 million
, (iv) net gains recognized during the period on investments in equity securities of
$118 million
, (v) net losses on early retirement of debt of
$3 million
and (vi) other charges of
$162 million
, which includes, among other things, a
$108 million
charge, in the aggregate, in
Selling, informational and administrative expenses
for a special, one-time bonus paid to virtually all Pfizer colleagues, excluding executives, which was one of several actions taken by us after evaluating the expected positive net impact of the December 2017 enactment of the TCJA. For additional information, see
Note 3
and
Note 4
.
Equity in the net income of investees accounted for by the equity method is not significant for any of our operating segments.
The operating segment information does not purport to represent the revenues, costs and income from continuing operations before provision for taxes on income that each of our operating segments would have recorded had each segment operated as a standalone company during the periods presented.
39
PFIZER INC. AND SUBSIDIARY COMPANIES
NOTES TO CONDENSED CONSOLIDATED FINANCIAL STATEMENTS
(UNAUDITED)
B. Geographic Information
|
The following table provides revenues by geographic area:
|
|||||||||||
|
|
Three Months Ended
|
||||||||||
|
(MILLIONS OF DOLLARS)
|
March 31,
2019 |
|
April 1,
2018 |
|
%
Change
|
|
|||||
|
U.S.
|
$
|
6,175
|
|
$
|
6,275
|
|
(2
|
)
|
|||
|
Developed Europe
(a)
|
2,086
|
|
2,092
|
|
—
|
|
|||||
|
Developed Rest of World
(b)
|
1,535
|
|
1,461
|
|
5
|
|
|||||
|
Emerging Markets
(c)
|
3,322
|
|
3,078
|
|
8
|
|
|||||
|
Revenues
|
$
|
13,118
|
|
$
|
12,906
|
|
2
|
|
|||
|
(a)
|
Developed Europe region includes the following markets: Western Europe, Scandinavian countries and Finland.
Revenues denominated in euros were
$1.7 billion
in both the
first quarter
of
2019
and
2018
.
|
|
(b)
|
Developed Rest of World region includes the following markets: Japan, Canada, South Korea, Australia and New Zealand.
|
|
(c)
|
Emerging Markets region includes, but is not limited to, the following markets: Asia (excluding Japan and South Korea), Latin America, Eastern Europe, the Middle East, Africa, Central Europe and Turkey.
|
40
PFIZER INC. AND SUBSIDIARY COMPANIES
NOTES TO CONDENSED CONSOLIDATED FINANCIAL STATEMENTS
(UNAUDITED)
C.
Other Revenue Information
Significant Product Revenues
|
The following table provides detailed revenue information:
|
||||||||||
|
(MILLIONS OF DOLLARS)
|
Three Months Ended
|
|||||||||
|
PRODUCT
|
PRIMARY INDICATIONS OR CLASS
|
March 31,
2019 |
|
April 1,
2018 |
|
|||||
|
TOTAL REVENUES
|
$
|
13,118
|
|
$
|
12,906
|
|
||||
|
PFIZER BIOPHARMACEUTICALS GROUP (BIOPHARMA)
(a)
|
$
|
9,185
|
|
$
|
8,881
|
|
||||
|
Internal Medicine
(b)
|
$
|
2,217
|
|
$
|
2,071
|
|
||||
|
Eliquis alliance revenues and direct sales
|
Atrial fibrillation, deep vein thrombosis, pulmonary embolism
|
1,011
|
|
765
|
|
|||||
|
Chantix/Champix
|
An aid to smoking cessation treatment in adults 18 years of age or older
|
273
|
|
251
|
|
|||||
|
Premarin family
|
Symptoms of menopause
|
168
|
|
191
|
|
|||||
|
BMP2
|
Development of bone and cartilage
|
67
|
|
73
|
|
|||||
|
Toviaz
|
Overactive bladder
|
60
|
|
60
|
|
|||||
|
All other Internal Medicine
|
Various
|
639
|
|
730
|
|
|||||
|
Oncology
(c)
|
$
|
1,961
|
|
$
|
1,760
|
|
||||
|
Ibrance
|
Advanced breast cancer
|
1,133
|
|
933
|
|
|||||
|
Sutent
|
Advanced and/or metastatic RCC, adjuvant RCC, refractory GIST (after disease progression on, or intolerance to, imatinib mesylate) and advanced pancreatic neuroendocrine tumor
|
232
|
|
262
|
|
|||||
|
Xtandi alliance revenues
|
Castration-resistant prostate cancer
|
168
|
|
159
|
|
|||||
|
Xalkori
|
ALK-positive and ROS1-positive advanced NSCLC
|
123
|
|
153
|
|
|||||
|
Bosulif
|
Philadelphia chromosome–positive chronic myelogenous leukemia
|
80
|
|
60
|
|
|||||
|
Inlyta
|
Advanced RCC
|
73
|
|
74
|
|
|||||
|
All other Oncology
|
Various
|
153
|
|
119
|
|
|||||
|
Hospital
(d)
|
$
|
1,887
|
|
$
|
2,026
|
|
||||
|
Sulperazon
|
Treatment of infections
|
177
|
|
168
|
|
|||||
|
Medrol
(e)
|
Steroid anti-inflammatory
|
120
|
|
136
|
|
|||||
|
Zithromax
(e)
|
Bacterial infections
|
104
|
|
101
|
|
|||||
|
Vfend
(e)
|
Fungal infections
|
85
|
|
98
|
|
|||||
|
EpiPen
|
Epinephrine injection used in treatment of life-threatening allergic reactions
|
66
|
|
52
|
|
|||||
|
Zyvox
(e)
|
Bacterial infections
|
64
|
|
68
|
|
|||||
|
Fragmin
|
Slows blood clotting
|
60
|
|
70
|
|
|||||
|
Zosyn/Tazocin
|
Antibiotic
|
51
|
|
61
|
|
|||||
|
Pfizer CentreOne
(f)
|
Various
|
176
|
|
171
|
|
|||||
|
All other Anti-infectives
|
Various
|
354
|
|
392
|
|
|||||
|
All other Hospital
(d)
|
Various
|
631
|
|
708
|
|
|||||
|
Vaccines
|
$
|
1,612
|
|
$
|
1,463
|
|
||||
|
Prevnar 13/Prevenar 13
|
Vaccines for prevention of pneumococcal disease
|
1,486
|
|
1,380
|
|
|||||
|
All other Vaccines
|
Various
|
126
|
|
83
|
|
|||||
|
Inflammation & Immunology (I&I)
(g)
|
$
|
1,037
|
|
$
|
1,013
|
|
||||
|
Enbrel (Outside the U.S. and Canada)
|
RA, juvenile idiopathic arthritis, PsA, plaque psoriasis, pediatric plaque psoriasis, ankylosing spondylitis and nonradiographic axial spondyloarthritis
|
451
|
|
506
|
|
|||||
|
Xeljanz
|
RA, PsA, UC
|
423
|
|
326
|
|
|||||
|
Inflectra/Remsima
|
Inflammatory diseases
|
138
|
|
145
|
|
|||||
|
Eucrisa
|
Mild-to-moderate atopic dermatitis (eczema)
|
22
|
|
26
|
|
|||||
|
All other I&I
|
Various
|
3
|
|
11
|
|
|||||
|
Rare Disease
|
$
|
470
|
|
$
|
549
|
|
||||
|
BeneFIX
|
Hemophilia
|
125
|
|
147
|
|
|||||
|
Genotropin
|
Replacement of human growth hormone
|
107
|
|
132
|
|
|||||
|
Refacto AF/Xyntha
|
Hemophilia
|
106
|
|
130
|
|
|||||
|
Somavert
|
Acromegaly
|
59
|
|
63
|
|
|||||
|
All other Rare Disease
|
Various
|
72
|
|
76
|
|
|||||
41
PFIZER INC. AND SUBSIDIARY COMPANIES
NOTES TO CONDENSED CONSOLIDATED FINANCIAL STATEMENTS
(UNAUDITED)
|
(MILLIONS OF DOLLARS)
|
Three Months Ended
|
|||||||||
|
PRODUCT
|
PRIMARY INDICATIONS OR CLASS
|
March 31,
2019 |
|
April 1,
2018 |
|
|||||
|
UPJOHN
(b)
,
(h)
|
$
|
3,075
|
|
$
|
3,120
|
|
||||
|
Lyrica
|
Epilepsy, post-herpetic neuralgia and diabetic peripheral neuropathy, fibromyalgia, neuropathic pain due to spinal cord injury
|
1,186
|
|
1,213
|
|
|||||
|
Lipitor
|
Reduction of LDL cholesterol
|
622
|
|
511
|
|
|||||
|
Norvasc
|
Hypertension
|
300
|
|
256
|
|
|||||
|
Celebrex
|
Arthritis pain and inflammation, acute pain
|
174
|
|
145
|
|
|||||
|
Viagra
|
Erectile dysfunction
|
145
|
|
187
|
|
|||||
|
Effexor
|
Depression and certain anxiety disorders
|
77
|
|
71
|
|
|||||
|
Zoloft
|
Depression and certain anxiety disorders
|
69
|
|
74
|
|
|||||
|
Xalatan/Xalacom
|
Glaucoma and ocular hypertension
|
62
|
|
72
|
|
|||||
|
All other Upjohn
|
Various
|
440
|
|
591
|
|
|||||
|
CONSUMER HEALTHCARE BUSINESS
(i)
|
$
|
858
|
|
$
|
905
|
|
||||
|
Total Alliance revenues
|
Various
|
$
|
1,090
|
|
$
|
855
|
|
|||
|
(a)
|
The Pfizer Biopharmaceuticals Group encompasses Internal Medicine, Vaccines, Oncology, Inflammation & Immunology, Rare Disease and Hospital. The new Hospital business unit commercializes our global portfolio of sterile injectable and anti-infective medicines, and also includes Pfizer CentreOne
(f)
.
|
|
(b)
|
We reclassified certain products from the Legacy Established Products (LEP) category, including Premarin family products, and certain other products from the legacy Peri-LOE category, including Pristiq, to the Internal Medicine category and reclassified Lyrica from the Internal Medicine category to the Upjohn business to conform 2018 product revenues to the current presentation.
|
|
(c)
|
We performed certain reclassifications in the All other Oncology category to conform 2018 product revenues to the current presentation.
|
|
(d)
|
Hospital is a new business unit that commercializes our global portfolio of sterile injectable and anti-infective medicines. We performed certain reclassifications, primarily from the legacy Sterile Injectables Pharmaceuticals (SIP) category (Sulperazon, Medrol, Fragmin, Tygacil, Zosyn/Tazocin and Precedex, among other products), the LEP category (Epipen and Zithromax), and the legacy Peri-LOE category (Vfend and Zyvox) to the Hospital category to conform 2018 product revenues to the current presentation. Hospital also includes Pfizer CentreOne
(f)
. All other Hospital primarily includes revenues from legacy SIP products (that are not anti-infective products) and, to a much lesser extent, solid oral dose products (that are not anti-infective products). SIP anti-infective products that are not individually listed above are recorded in “All other Anti-infectives”.
|
|
(e)
|
2018 revenues for Medrol, Zithromax, Vfend and Zyvox may not agree to previously disclosed revenues because revenues for those products were previously split between LEP and the legacy SIP categories. All revenues for these products are currently reported in the Hospital category.
|
|
(f)
|
Pfizer CentreOne includes revenues from our contract manufacturing and active pharmaceutical ingredient sales operation, including sterile injectables contract manufacturing, and revenues related to our manufacturing and supply agreements, including with Zoetis Inc. In the fourth quarter of 2017, we sold our equity share in Hisun Pfizer. As a result, effective in the first quarter of 2018, Hisun Pfizer-related revenues, previously reported in emerging markets within legacy All Other LEP and legacy All Other SIP, are reported in emerging markets within Pfizer CentreOne.
|
|
(g)
|
We reclassified Inflectra/Remsima from the legacy Biosimilars category to the Inflammation & Immunology category to conform 2018 product revenues to the current presentation.
|
|
(h)
|
Pfizer’s Upjohn business encompasses primarily off-patent branded and generic established medicines that includes
20
of our primarily off-patent solid oral dose legacy brands including Lyrica, Lipitor, Norvasc, Celebrex and Viagra, as well as certain generic medicines.
|
|
(i)
|
Pfizer’s Consumer Healthcare business is an over-the-counter medicines business, which we announced in December 2018 will be contributed to, and combined with, GSK’s consumer healthcare business to form a new consumer healthcare joint venture, of which we will own
32%
, subject to customary closing conditions, including GSK shareholder approval, which occurred on May 8, 2019, and required regulatory approvals.
|
42
REVIEW REPORT OF INDEPENDENT REGISTERED PUBLIC ACCOUNTING FIRM
To the Board of Directors and Shareholders of Pfizer Inc.:
Results of Review of Interim Financial Information
We have reviewed the condensed consolidated balance sheet of Pfizer Inc. and Subsidiary companies (the Company) as of
March 31, 2019
, the related condensed consolidated statements of income, comprehensive income, equity, and cash flows for the
three-month
periods ended
March 31, 2019
and
April 1, 2018
, and the related notes (collectively, the consolidated interim financial information). Based on our reviews, we are not aware of any material modifications that should be made to the consolidated interim financial information for it to be in conformity with U.S. generally accepted accounting principles.
We have previously audited, in accordance with the standards of the Public Company Accounting Oversight Board (United States) (PCAOB), the consolidated balance sheet of the Company as of
December 31, 2018
, and the related consolidated statements of income, comprehensive income, equity, and cash flows for the year then ended (not presented herein); and in our report dated
February 28, 2019
, we expressed an unqualified opinion on those consolidated financial statements. In our opinion, the information set forth in the accompanying condensed consolidated balance sheet as of
December 31, 2018
is fairly stated, in all material respects, in relation to the consolidated balance sheet from which it has been derived.
Basis for Review Results
This consolidated interim financial information is the responsibility of the Company’s management. We are a public accounting firm registered with the PCAOB and are required to be independent with respect to the Company in accordance with the U.S. federal securities laws and the applicable rules and regulations of the Securities and Exchange Commission and the PCAOB.
We conducted our reviews in accordance with the standards of the PCAOB. A review of consolidated interim financial information consists principally of applying analytical procedures and making inquiries of persons responsible for financial and accounting matters. It is substantially less in scope than an audit conducted in accordance with the standards of the PCAOB, the objective of which is the expression of an opinion regarding the financial statements taken as a whole. Accordingly, we do not express such an opinion.
/s/ KPMG LLP
New York, New York
May 9, 2019
43
Item 2. Management’s Discussion and Analysis of Financial Condition and Results of Operations
Introduction
See the Glossary of Defined Terms at the beginning of this Quarterly Report on Form 10-Q for terms used throughout this MD&A. Our MD&A is provided in addition to the accompanying condensed consolidated financial statements and footnotes to assist readers in understanding Pfizer’s results of operations, financial condition and cash flows. The MD&A is organized as follows:
|
●
|
Beginning on page
45
|
||||
|
This section provides information about the following: Our Business; our performance during the first quarter of 2019 and 2018; Our Operating Environment; The Global Economic Environment; Our Strategy; Our Business Development Initiatives, such as acquisitions, dispositions, licensing and collaborations; and Our Financial Guidance for 2019.
|
|||||
|
●
|
Beginning on page
59
|
||||
|
This section discusses updates to our 2019 Financial Report disclosures for those accounting policies and estimates that we consider important in understanding our consolidated financial statements. For additional discussion of our accounting policies, see Notes to Consolidated Financial Statements—
Note 1. Basis of Presentation and Significant Accounting Policies
.
|
|||||
|
●
|
Beginning on page
60
|
||||
|
This section includes the following sub-sections:
|
|||||
|
Beginning on page
60
|
|||||
|
This sub-section provides an overview of revenues by operating segment and geography as well as revenue deductions
|
|||||
|
Beginning on page
62
|
|||||
|
This sub-section provides an overview of several of our biopharmaceutical products.
|
|||||
|
Beginning on page
67
|
|||||
|
This sub-section provides an overview of important biopharmaceutical product developments.
|
|||||
|
Beginning on page
71
|
|||||
|
This sub-section provides a discussion about our costs and expenses.
|
|||||
|
Beginning on page
73
|
|||||
|
This sub-section provides a discussion of items impacting our tax provisions.
|
|||||
|
Beginning on page
73
|
|||||
|
This sub-section provides a discussion of an alternative view of performance used by management.
|
|||||
|
●
|
Beginning on page
78
|
||||
|
This section provides a discussion of the performance of each of our operating segments.
|
|||||
|
●
|
Beginning on page
82
|
||||
|
This section provides a discussion of changes in certain components of other comprehensive income.
|
|||||
|
●
|
Beginning on page
83
|
||||
|
This section provides a discussion of changes in certain balance sheet accounts.
|
|||||
|
●
|
Beginning on page
84
|
||||
|
This section provides an analysis of our cash flows for the first three months of 2019 and 2018.
|
|||||
|
●
|
Beginning on page
85
|
||||
|
This section provides an analysis of selected measures of our liquidity and of our capital resources as of March 31, 2019 and December 31, 2018, as well as a discussion of our outstanding debt and other commitments that existed as of March 31, 2019 and December 31, 2018. Included in the discussion of outstanding debt is a discussion of the amount of financial capacity available to help fund Pfizer’s future activities.
|
|||||
|
●
|
Beginning on page
88
|
||||
|
This section discusses accounting standards that we have recently adopted, as well as those that recently have been issued, but not yet adopted.
|
|||||
|
●
|
Beginning on page
89
|
||||
|
This section provides a description of the risks and uncertainties that could cause actual results to differ materially from those discussed in forward-looking statements presented in this MD&A. Also included in this section is a discussion of legal proceedings and contingencies.
|
|||||
Certain amounts in our MD&A may not add due to rounding. All percentages have been calculated using unrounded amounts.
44
OVERVIEW OF OUR PERFORMANCE, OPERATING ENVIRONMENT, STRATEGY AND OUTLOOK
Our Business
We apply science and our global resources to bring therapies to people that extend and significantly improve their lives through the discovery, development and manufacture of healthcare products. Our global portfolio includes medicines and vaccines, as well as many of the world’s best-known consumer healthcare products. We work across developed and emerging markets to advance wellness, prevention, treatments and cures that challenge the most feared diseases of our time. We collaborate with healthcare providers, governments and local communities to support and expand access to reliable, affordable healthcare around the world. Our revenues are derived from the sale of our products and, to a much lesser extent, from alliance agreements, under which we co-promote products discovered or developed by other companies or us (Alliance revenues).
At the beginning of our 2019 fiscal year, we began to manage our commercial operations through a new global structure consisting of three business segments––Pfizer Biopharmaceuticals Group (Biopharma), Upjohn and Consumer Healthcare. Biopharma and Upjohn are the only reportable segments. For additional information, see Notes to Condensed Consolidated Financial Statements––
Note 13A.
Segment, Geographic and Other Revenue Information
: Segment Information
and the “Our Strategy
––
Commercial Operations” section of this MD&A below.
The majority of our revenues come from the manufacture and sale of biopharmaceutical products. As explained more fully in our
2018
Form 10-K, the biopharmaceutical industry is highly competitive and highly regulated. As a result, we face a number of industry-specific factors and challenges, which can significantly impact our results. These factors include, among others: the loss or expiration of intellectual property rights and the expiration of co-promotion and licensing rights, the ability to replenish innovative biopharmaceutical products, healthcare legislation, pipeline productivity, the regulatory environment, pricing and access pressures and competition. We also face challenges as a result of the global economic environment. For additional information about these factors and challenges, see the “Our Operating Environment” and “The Global Economic Environment” sections of this MD&A and of our
2018
Financial Report and Part I, Item 1A, “Risk Factors” of our
2018
Form 10-K.
The financial information included in our condensed consolidated financial statements for our subsidiaries operating outside the U.S. is as of and for the
three months
ended
February 24, 2019
and
February 25, 2018
. The financial information included in our condensed consolidated financial statements for U.S. subsidiaries is as of and for the
three months
ended
March 31, 2019
and
April 1, 2018
.
References to operational variances in this MD&A pertain to period-over-period growth rates that exclude the impact of foreign exchange. The operational variances are determined by multiplying or dividing, as appropriate, our current period U.S. dollar results by the current period average foreign exchange rates and then multiplying or dividing, as appropriate, those amounts by the prior-year period average foreign exchange rates. Although exchange rate changes are part of our business, they are not within our control. Exchange rate changes, however, can mask positive or negative trends in the business; therefore, we believe presenting operational variances provides useful information in evaluating the results of our business.
On May 8, 2019, we entered into a definitive agreement to acquire all the remaining shares of Therachon, a privately-held clinical-stage biotechnology company focused on rare diseases, with assets in development for the treatment of achondroplasia and SBS. For additional information, see the “Our Business Development Initiatives” section of this MD&A below.
On December 19, 2018, we announced that we entered into a definitive agreement with GSK under which we and GSK have agreed to combine our respective consumer healthcare businesses into a new consumer healthcare joint venture that will operate globally under the GSK Consumer Healthcare name. The joint venture is expected to be a category leader in pain relief, respiratory, vitamin and mineral supplements, digestive health, skin health and therapeutic oral health and will be the largest global OTC consumer healthcare business. In exchange for contributing our Consumer Healthcare business, we will receive a 32% equity stake in the new company
and GSK will own the remaining 68%. The transaction is expected to close in the second half of 2019, subject to customary closing conditions, including GSK shareholder approval, which occurred on May 8, 2019, and required regulatory approvals. For additional information, see Notes to Condensed Consolidated Financial Statements––
Note 2.
Assets and Liabilities Held for Sale
and the “Our Strategy” and “Our Business Development Initiatives” sections of this MD&A below.
Product Manufacturing
We periodically encounter difficulties or delays in manufacturing, including due to suspension of manufacturing or voluntary recall of a product, or legal or regulatory actions such as warning letters. For example, Hospira’s manufacturing facility in McPherson, Kansas is currently under the FDA inspection status of Official Action Indicated (OAI). As a result of this status, the FDA may refuse to grant premarket approval of applications and/or the FDA may refuse to grant export certificates related
45
to products manufactured at our McPherson site until the site status is upgraded, which upgrade would be based on a re-inspection by the FDA. Future FDA inspections and regulatory activities will further assess the adequacy and sustainability of corrections implemented at the site. Communication with the FDA on the status of the McPherson site is ongoing. For additional information regarding the FDA inspection of the McPherson site, see Part I, Item 1A, “Risk Factors––Product Manufacturing, Sales and Marketing Risks” of our 2018 Form 10-K. Also, in March 2019, we received a warning letter from the FDA communicating the FDA’s view that certain violations of cGMP regulations exist at Pfizer’s Irungattukottai (IKKT) manufacturing facility in Chennai, India. The warning letter is related to the FDA’s March-April 2018 inspection of the IKKT facility. Following this inspection, Pfizer paused production at the IKKT facility and initiated implementation of a comprehensive corrective and preventive action plan to address the issues noted by the FDA. Due to long-term loss of product demand, Pfizer announced in January 2019 its intention to exit the IKKT facility as soon as possible in 2019.
The product shortages we have been experiencing within our portfolio are primarily for products from the legacy Hospira portfolio and are largely driven by capacity constraints, technical issues and supplier quality concerns. We continue to remediate issues at legacy Hospira facilities manufacturing sterile injectables. Any continuing product shortage interruption at these manufacturing facilities could negatively impact our financial results, specifically in our Hospital portfolio. We continue to make progress on our comprehensive remediation plan to upgrade and modernize these facilities, and we expect our supply issues to be substantially improved by the end of 2019.
Our First Quarter
2019
Performance
Revenues
Revenues
in the
first
quarter of
2019
increase
d
$211 million
, or
2%
, compared to the same period in
2018
, which reflects an operational
increase
of
$664 million
, or
5%
, partially offset by
the unfavorable
impact of foreign exchange of
$453 million
, or
4%
.
The following provides an analysis of the changes in revenues for the
first quarter
of
2019
:
|
(MILLIONS OF DOLLARS)
|
||||
|
Revenues,
for the three months ended April 1, 2018
|
$
|
12,906
|
|
|
|
|
|
|||
|
Operational growth/(decline):
|
||||
|
Continued growth from certain key brands
(a)
|
763
|
|
||
|
Growth from Lipitor, Norvasc and Celebrex, primarily in emerging markets, driven by strong, volume-driven operational growth in China
|
237
|
|
||
|
Declines from Viagra and Pfizer’s authorized generic for Viagra in the U.S.; the Hospital business; certain rare disease products
(b)
; Greenstone, Upjohn’s solid oral dose generics subsidiary; and Lyrica
|
(267
|
)
|
||
|
Lower revenues for Consumer Healthcare
|
(19
|
)
|
||
|
Other operational factors, net
|
(50
|
)
|
||
|
Operational growth, net
|
664
|
|
||
|
Operational revenues
|
13,571
|
|
||
|
Unfavorable impact of foreign exchange
|
(453
|
)
|
||
|
Revenues,
for the three months ended March 31, 2019
|
$
|
13,118
|
|
|
|
(a)
|
K
ey brands
represent Eliquis, Ibrance, Prevnar 13/Prevenar 13 and Xeljanz.
|
|
(b)
|
Certain rare disease products include the hemophilia franchises (BeneFIX and Refacto AF/Xyntha) and Genotropin.
|
For worldwide revenues, by geography, for selected products, see the discussion in the “Analysis of the Condensed Consolidated Statements of Income––Revenues––Selected Product Discussion” section of this MD&A. For additional information regarding the primary indications or class of certain products, see Notes to Condensed Consolidated Financial Statements––
Note 13C.
Segment, Geographic and Other Revenue Information
:
Other Revenue Information
.
See the “Analysis of the Condensed Consolidated Statements of Income––Revenues by Segment and Geography” section below for more information, including a discussion of key drivers of our revenue performance.
46
Income from Continuing Operations Before Provision for Taxes on Income
The following provides an analysis of the
increase
in
Income from continuing operations before provision for taxes on income
for the
first
quarter of
2019
:
|
(MILLIONS OF DOLLARS)
|
||||
|
Income from continuing operations before provision for taxes on income,
for the three months ended April 1, 2018
|
$
|
4,127
|
|
|
|
Favorable change in revenues
|
211
|
|
||
|
Favorable/(unfavorable) changes:
|
||||
|
Favorable change in the fair value of contingent consideration
(a)
|
175
|
|
||
|
Lower
Cost of sales
(b)
|
130
|
|
||
|
Lower
Selling, information and administrative expenses
(c)
|
73
|
|
||
|
Lower
Research and development expenses
(d)
|
41
|
|
||
|
Lower
Amortization of intangible assets
(e)
|
13
|
|
||
|
Higher asset impairment charges
(a)
|
(150
|
)
|
||
|
Higher net losses on early retirement of debt
(a)
|
(134
|
)
|
||
|
Higher business and legal entity alignment costs
(a)
|
(115
|
)
|
||
|
Higher net interest expense
(a)
|
(62
|
)
|
||
|
Lower income from collaborations, out-licensing arrangements and sales of compound/product rights
(a)
|
(60
|
)
|
||
|
Impact of net periodic benefit costs/(credits) other than service costs
(a)
|
(42
|
)
|
||
|
Impact of certain legal matters, net
(a)
|
(23
|
)
|
||
|
All other items, net
|
139
|
|
||
|
Income from continuing operations before provision for taxes on income,
for the three months ended March 31, 2019
|
$
|
4,323
|
|
|
|
(a)
|
See the Notes to Condensed Consolidated Financial Statements––
Note 4.
Other (Income)/Deductions—Net
.
|
|
(b)
|
See the “Costs and Expenses––Cost of Sales” section of this MD&A.
|
|
(c)
|
See the “Costs and Expenses––Selling, Informational and Administrative (SI&A) Expenses” section of this MD&A.
|
|
(d)
|
See the “Costs and Expenses––Research and Development (R&D) Expenses” section of this MD&A.
|
|
(e)
|
See the “Costs and Expenses––Amortization of Intangible Assets” section of this MD&A.
|
For information on our tax provision and effective tax rate see the “Provision for Taxes on Income” section of this MD&A and Notes to Condensed Consolidated Financial Statements––
Note 5
.
Tax Matters
.
Our Operating Environment
Industry-Specific Challenges
Intellectual Property Rights and Collaboration/Licensing Rights
The loss, expiration or invalidation of intellectual property rights, patent litigation settlements with manufacturers and the expiration of co-promotion and licensing rights can have a significant adverse effect on our revenues. Many of our branded products have multiple patents that expire at varying dates, thereby strengthening our overall patent protection. However, once patent protection has expired or has been lost prior to the expiration date as a result of a legal challenge, we typically lose exclusivity on these products, and generic and biosimilar pharmaceutical manufacturers generally produce similar products and sell them for a lower price. The date at which generic competition commences may be different from the date that the patent or regulatory exclusivity expires. However, when generic competition does commence, the resulting price competition can substantially decrease our revenues for the impacted products, often in a very short period of time. Also, if one of our patents is found to be invalid by judicial, court or administrative proceedings, such as inter partes
review, post-grant review, re-examination or opposition proceedings, before the U.S. Patent and Trademark Office, the European Patent Office, or other foreign counterparts, generic or competitive products could be introduced into the market resulting in the erosion of sales of our existing products. For example, several of the patents in our pneumococcal vaccine portfolio were challenged in inter partes review and post-grant review proceedings in the U.S. In June 2018, the Patent Trial and Appeal Board ruled on one patent, holding that one claim was valid and that all other claims were invalid. The party challenging that patent has appealed the decision. Challenges to other patents remain pending in jurisdictions outside the U.S. The invalidation of all the patents in our pneumococcal portfolio could potentially allow a competitor pneumococcal vaccine into the marketplace.
A number of our current products have experienced patent-based expirations or loss of regulatory exclusivity in certain markets in the last few years.
For example, as a result of a patent litigation settlement, Teva Pharmaceuticals USA, Inc. launched a generic version of Viagra in the U.S. in December 2017. In addition, the basic product patent for Lyrica in the U.S. will expire
47
in June 2019, which includes the FDA’s grant of pediatric exclusivity that extended the period of market exclusivity in the U.S. for Lyrica for an additional six months from December 2018.
Our biologic products, including BeneFIX, ReFacto, Xyntha, Bavencio, Prevnar 13/Prevenar 13 and Enbrel (we market Enbrel outside the U.S. and Canada), may face in the future, or already face, competition from biosimilars (also referred to as follow-on biologics).
If competitors are able to obtain marketing approval for biosimilars referencing our biologic products, our biologic products may become subject to competition from these biosimilars, with attendant competitive pressure, and price reductions could follow. For example, Enbrel faces ongoing biosimilar competition in most developed Europe markets. The expiration or successful challenge of applicable patent rights could trigger this competition, assuming any relevant regulatory exclusivity period has expired.
We have lost exclusivity for a number of our products in certain markets and we have lost collaboration rights with respect to a number of our alliance products in certain markets, and we expect certain products to face significantly increased generic competition over the next few years.
See the “Intellectual Property Rights and Collaboration/Licensing Rights” section of our
2018
Financial Report for additional information about recent losses and expected losses of product exclusivity in the U.S., Europe and/or Japan impacting product revenues.
For additional information, including the patent rights we consider most significant in relation to our business as a whole, together with the year in which the basic product patent expires, see the “Patents and Other Intellectual Property Rights” section in Part I, Item 1, “Business” of our
2018
Form 10-K.
We will continue to aggressively defend our patent rights whenever we deem appropriate. For a discussion of certain recent developments with respect to patent litigation, see Notes to Condensed Consolidated Financial Statements––
Note 12A1.
Contingencies and Certain Commitments
: Legal Proceedings
––
Patent Litigation
.
Regulatory Environment/Pricing and Access––U.S. Healthcare Legislation
In March 2010, the ACA was enacted in the U.S. For additional information, see the “Government Regulation and Price Constraints” section in Part I, Item 1, “Business” of our
2018
Form 10-K.
|
We recorded the following amounts as a result of the U.S. Healthcare Legislation:
|
||||||||
|
Three Months Ended
|
||||||||
|
(MILLIONS OF DOLLARS)
|
March 31,
2019 |
|
April 1,
2018 |
|
||||
|
Reduction to
Revenues
, related to the Medicare “coverage gap” discount provision
|
$
|
135
|
|
$
|
101
|
|
||
|
Selling, informational and administrative expenses
, related to the fee payable to the federal government (which is not deductible for U.S. income tax purposes), based on our prior-calendar-year share relative to other companies of branded prescription drug sales to specified government programs. The amount in 2018 also reflected a favorable true-up associated with the updated 2017 invoice received from the federal government, which reflected a lower expense than what was previously estimated for invoiced periods.
|
50
|
|
3
|
|
||||
Regulatory Environment/Pricing and Access––Government and Other Payer Group Pressures
The pricing of medicines by pharmaceutical manufacturers and the cost of healthcare, which includes medicines, medical services and hospital services, continues to be important to payers, governments, patients, and other stakeholders. We believe that medicines are amongst the most powerful tools for patients in curing, treating and preventing illness and disability, and that all patients should have appropriate access to the medicines their doctors prescribe. We may consider a number of factors when determining a medicine’s price, including, for example, its impact on patients and their disease, other available treatments, the medicine’s potential to reduce other healthcare costs (such as hospital stays), and affordability. Within the U.S., in particular, we may also engage with patients, doctors and healthcare plans regarding their views. We also negotiate with insurers, including PBMs and MCOs, often providing significant discounts to them from the list price. The price that patients pay in the U.S. for the medicines their physicians prescribe is ultimately set by healthcare providers and insurers. On average, in the U.S., insurers impose a higher out-of-pocket burden on patients for prescription medicines than for comparably-priced medical services. We will continue to work with insurance providers, governments and others to improve access to today’s innovative treatments.
Governments, MCOs and other payer groups continue to seek increasing discounts on our products through a variety of means, such as leveraging their purchasing power, implementing price controls, and demanding price cuts (directly or by rebate actions). In Europe, Japan, China, Canada, South Korea and some other international markets, governments provide healthcare at low-to-zero direct cost to consumers at the point of care and have significant power as large single payers to regulate
48
pharmaceutical prices or patient reimbursement levels to control costs for the government-sponsored healthcare system, particularly under recent global economic pressures.
In the U.S., government action to reduce federal spending on entitlement programs including Medicare and Medicaid may affect payment for our products or services provided using our products. Any significant spending reductions or cost controls affecting Medicare, Medicaid or other publicly funded or subsidized health programs that may be implemented could have an adverse impact on our results of operations. Significant Medicare reductions could also result if, for example, Congress proceeds with certain proposals to convert the Medicare fee-for-service program into a premium support program, or Congress chooses to implement the recommendations made annually by the Medicare Payment Advisory Commission, which are primarily intended to extend the fiscal solvency of the Medicare program.
Consolidation among MCOs has increased the negotiating power of MCOs and other third-party payers. Private third-party payers, as well as governments, increasingly employ formularies to control costs by taking into account discounts in connection with decisions about formulary inclusion or favorable formulary placement. Failure to obtain or maintain timely or adequate pricing or favorable formulary placement for our products, or failure to obtain such formulary placement at favorable pricing, could adversely impact revenue.
Efforts by government officials or legislators to implement measures to regulate prices or payment for pharmaceutical products, including legislation on drug importation, could adversely affect our business if implemented. Recently, there has been considerable public and government scrutiny of pharmaceutical pricing and proposals to address the perceived high cost of pharmaceuticals. For example:
|
•
|
At the federal level, in May 2018, President Trump released his
Blueprint to Lower Drug Prices and Reduce Out-of-Pocket Costs
(Blueprint). Pfizer communicated a formal response to the request for information that accompanied the Blueprint, and is participating in the subsequent rule-making process to advance the proposals that are most likely to bring meaningful out-of-pocket cost relief to patients. Certain proposals in the Blueprint, and related drug pricing measures proposed since the Blueprint, could cause significant operational and reimbursement changes for the pharmaceutical industry.
|
|
•
|
In October 2018, the Centers for Medicare and Medicaid Services solicited public comments on potential changes to payment for certain Medicare Part B drugs, including reducing the Medicare payment amount for selected Medicare Part B drugs to more closely align with international drug prices.
|
|
•
|
In January 2019, the White House Office of Management and Budget released the long awaited proposed rule submitted by the Office of Inspector General of the Department of Health and Human Services to remove safe harbor protections for drug rebates paid to insurance plans and PBMs for Medicare Part D and Managed Medicaid and to create new safe harbors. Among other changes, the proposed rule would explicitly exclude the reductions in price offered by drug manufacturers to PBMs in Medicare Part D and Managed Medicaid plans from protection under the “discount” safe harbor. It would also create a new safe harbor designed specifically for price reductions in pharmaceutical products, but only those that are fully reflected in the price to the patient at the pharmacy counter. Additionally, a new safe harbor was proposed to protect administrative fees paid to PBMs, which must be at fair market value, a fixed fee and not based upon a percentage of volume or list price. Manufacturers could continue to negotiate price reductions with PBMs and Medicare Part D and Managed Medicaid plans if their reductions meet that criterion. The proposed rule represents a large step toward significantly altering the current rebate model in place with MCOs. Many stakeholders, including Pfizer, submitted comments to the proposed rule. In the interim, we are in the process of evaluating the implications of the proposed rule on our operations and processes, as well as the infrastructure that will be required in order to implement the rule once it is finalized.
|
|
•
|
We continue to see an increase in state legislative efforts to address drug costs, which generally have focused on increasing transparency around drug costs or limiting drug prices. Legal challenges of state legislation are pending. In 2019, we are seeing new proposed legislation regulating drug pricing at the federal level. Collectively, these efforts could further affect demand for, or pricing of, our products.
|
We believe medicines are the most efficient and effective use of healthcare dollars based on the value they deliver to the overall healthcare system. We will continue to work with law makers and advocate for solutions that effectively improve patient health outcomes, lower costs to the healthcare system, and ensure access to medicines within an efficient and affordable healthcare system.
There have been significant efforts at the federal and state levels to reform the healthcare system by enhancing access to healthcare, improving the delivery of healthcare and further rationalizing payment for healthcare. For example, we face uncertainties due to federal legislative and administrative efforts to repeal, substantially modify or invalidate some or all of the provisions of the ACA. For example, tax reform legislation enacted at the end of 2017 eliminates the tax penalty for individuals who do not maintain sufficient health insurance coverage beginning in 2019 (the so-called “individual mandate”). We anticipate continued Congressional interest in modifying provisions of the ACA, particularly given the December 2018 ruling in
Texas v. Azar
to invalidate the law as unconstitutional, and the subsequent decision by the U.S. Department of Justice not to defend the
49
law. At this time, the law remains in effect pending appeals of the decision. Given the outcomes of the 2018 U.S. midterm elections with Democrats taking over the U.S. House of Representatives and Republicans growing their majority in the U.S. Senate, we believe it is unlikely Congress will find bipartisan consensus to advance any significant changes to the ACA until the legal process unfolds. Further, both Senate leadership and the administration have indicated their preference for introducing replacement bills only after the 2020 election. The revenues generated for Pfizer by the health insurance exchanges and Medicaid expansion under the ACA are not material, so the impact of the change in law and similar recent administration actions is expected to be limited. Any future replacement, modification or repeal of the ACA may adversely affect our business and financial results, particularly if the legislation reduces incentives for employer-sponsored insurance coverage. As another example, the Bipartisan Budget Act of 2018, which increased the discount we pay in the Medicare Part D “coverage gap” from 50% to 70%, will modestly increase our future Medicare Part D rebates. Any future healthcare reform efforts may adversely affect our business and financial results.
The potential for additional pricing and access pressures in the commercial sector continues to be significant. Some employers, seeking to avoid the tax on high-cost health insurance in the ACA to be imposed in 2022, are already scaling back healthcare benefits and an increasing number are implementing high deductible benefit designs. This is a trend that is likely to continue. Private third-party payers, such as health plans, increasingly challenge pharmaceutical product pricing, which could result in lower prices, lower reimbursement rates and a reduction in demand for our products. Pricing pressures for our products may occur as a result of highly competitive insurance markets. Healthcare provider purchasers, directly or through group purchasing organizations, are seeking enhanced discounts or implementing more rigorous bidding or purchasing review processes.
Overall, there is increasing pressure on U.S. providers to deliver healthcare at a lower cost and to ensure that those expenditures deliver demonstrated value in terms of health outcomes. Longer term, we are seeing a shift in focus away from fee-for-service payments towards outcomes-based payments and risk-sharing arrangements that reward providers for cost reductions and improved patient outcomes. These new payment models can, at times, lead to lower prices for, and restricted access to, new medicines. At the same time, these models can also promote utilization of drugs by encouraging physicians to screen and diagnose and consider drugs as a means of forestalling more costly medical interventions.
Outside the U.S., certain governments, including the different EU Member States, China, Japan, Canada and South Korea, have significant power as large single payers to regulate prices and may use a variety of cost-containment measures for our pharmaceutical products, including price cuts, mandatory rebates, public or private health technology assessments, forced localization as a condition of market access and international reference pricing (i.e., the practice of a country linking its regulated medicine prices to those of other countries). As a result, we expect that such pressures on the pricing component of operating results will continue. In addition, the international patchwork of price regulation and differing economic conditions and incomplete value assessments across countries has led to varying health outcomes and some third-party trade in our products between countries.
In particular, international reference pricing adds to the regional impact of price cuts in individual countries and hinders patient access and innovation. Price variations, exacerbated by international reference pricing systems, also have resulted from exchange rate fluctuations. The downward pricing pressure resulting from this dynamic can be expected to continue as a result of reforms to international reference pricing policies and measures targeting pharmaceuticals in some European countries.
In addition, several important multilateral organizations, such as the United Nations (UN), including the World Health Organization (WHO), and the Organization for Economic Cooperation and Development (OECD), are increasing scrutiny of international pharmaceutical pricing through issuing reports and policy recommendations (e.g.,
2016 UN High Level Panel Report on Access to Medicines
). Late in 2018, two new reports critical of the pharmaceutical industry’s pricing practices were published: OECD’s
Pharmaceutical Innovation and Access to Medicines
and WHO’s
Pricing of Cancer Medicines and its Impacts
. These reports and upcoming public forums focused on their recommendations will continue to exert additional pricing pressures.
In China, pricing pressures have increased in recent years, and Chinese government officials have consistently emphasized that decreased drug prices will serve as a key indicator of progress towards ambitious healthcare reform goals. While the government provides basic health insurance for the vast majority of Chinese citizens, the insurance is not adequate to cover many innovative medicines and alternative funding sources for innovative medicines remain suboptimal.
In 2017 and 2018, China’s government negotiated with companies to add approximately 60 innovative drugs (mainly oncology medicines) to the National Reimbursement Drug List. Prices for drugs were reduced dramatically through this government-led process. While these negotiations included a path to access for companies, market access is not strictly assured. In addition, significant questions about the processes and negotiations for provincial tendering remain, as well as the need for multi-layered negotiations across provincial, municipal and hospital levels. In the off-patent space, in 2013, China began to implement a quality consistency (QCE) process in order to improve the quality of domestically-manufactured generic drugs, primarily by
50
requiring such drugs to pass a test to assess their bioequivalence to a qualified reference drug (typically the originator drug). In 2018, numerous local generics were officially deemed bioequivalent under the QCE. A pilot project for centralized procurement of 31 categories of drugs covering 11 major Chinese cities now drives patients to generics that have passed the QCE, which has resulted in dramatic price cuts for off-patent drugs.
We anticipate these pricing and access reforms will begin to impact our Upjohn operations in China in the second quarter of 2019.
In response to the evolving U.S. and global healthcare spending landscape, we are continuing to work with health authorities, health technology assessment and quality measurement bodies and major U.S. payers throughout the product-development process to better understand how these entities value our compounds and products. Further, we are seeking to develop stronger internal capabilities focused on demonstrating the value of the medicines that we discover or develop, register and manufacture, by recognizing patterns of usage of our medicines and competitor medicines along with patterns of healthcare costs.
For additional information, see the “Regulatory Environment––Pipeline Productivity” and “Competition” sections of our
2018
Financial Report.
The Global Economic Environment
In addition to the industry-specific factors discussed above, we, like other businesses of our size, are exposed to the economic cycle, which impacts our biopharmaceutical operations globally.
|
•
|
Governments, corporations, and insurance companies, which provide insurance benefits to patients, have implemented increases in cost-sharing and restrictions on access to medicines, potentially causing patients to switch to generic or biosimilar products, delay treatments, skip doses or use less effective treatments. As discussed above, government financing pressures can lead to negative pricing pressure in various markets where governments take an active role in setting prices, access criteria (e.g., through public or private health technology assessments), or other means of cost control. Examples include the different EU Member States, Japan, China, Canada, South Korea and a number of other international markets. The U.S. continues to maintain competitive insurance markets, but has also seen significant increases in patient cost-sharing and growing government influence as government programs continue to grow as a source of coverage.
|
|
•
|
Significant portions of our revenues, costs and expenses, as well as our substantial international net assets, are exposed to changes in foreign exchange rates. We seek to manage our foreign exchange risk in part through operational means, including managing same-currency revenues in relation to same-currency costs and same-currency assets in relation to same-currency liabilities. Depending on market conditions, foreign exchange risk also is managed through the use of derivative financial instruments and foreign currency debt. As we operate in multiple foreign currencies, including the euro, the Japanese yen, the Chinese renminbi, the U.K. pound, the Canadian dollar and approximately 100 other currencies, changes in those currencies relative to the U.S. dollar will impact our revenues and expenses. If the U.S. dollar were to weaken against another currency, assuming all other variables remained constant, our revenues would increase, having a positive impact on earnings, and our overall expenses would increase, having a negative impact on earnings. Conversely, if the U.S. dollar were to strengthen against another currency, assuming all other variables remained constant, our revenues would decrease, having a negative impact on earnings, and our overall expenses would decrease, having a positive impact on earnings. Therefore, significant changes in foreign exchange rates can impact our results and our financial guidance.
|
The impact of possible currency devaluations in countries experiencing high inflation rates or significant exchange fluctuations, including Venezuela and Argentina, can impact our results and financial guidance. For further information about our exposure to foreign currency risk, see the “Analysis of Financial Condition, Liquidity and Capital Resources” and the “Our Financial Guidance for
2019
” sections of this MD&A.
|
•
|
In June 2016, the U.K. electorate voted in a referendum to leave the EU, which is commonly referred to as “Brexit”. In March 2017, the U.K. government formally notified the European Council of its intention to leave the EU after it triggered Article 50 of the Lisbon Treaty to begin the two-year negotiation process establishing the terms of the exit and outlining the future relationship between the U.K. and the EU. Formal negotiations officially started in June 2017. After multiple votes in the British Parliament in January and March 2019 failing to approve the draft Brexit withdrawal agreement with the EU, the U.K. government negotiated a delay to the U.K.’s withdrawal until October 31, 2019, with the option of an earlier date if agreement can be reached sooner, so the new date of Brexit is still uncertain. The outcome after Brexit also continues to be uncertain, which may pose certain implications to our research, commercial and general business operations in the U.K. and the EU, including the approval and supply of our products. At present, it is still unclear whether and to what extent the U.K. will remain within or aligned to the EU system of medicines regulation, depending on the ultimate outcome of the negotiations. However, both the U.K. and the EU have issued detailed guidance for the industry on how medicines, medical devices and clinical trials will be separately regulated in their respective territories in the event of a ‘hard Brexit’, meaning an outcome where no negotiated settlement is reached.
|
We generated approximately
2%
of our worldwide revenues from the U.K. in 2018 and in the first
three months
of
2019
, including the foreign currency exchange impact from the weakening U.K. pound relative to the U.S. dollar to date.
51
Pfizer’s preparations for Brexit, including for a potential ‘hard Brexit’, are well advanced to make the changes necessary to meet all relevant requirements in the EU and the U.K. after Brexit, especially in the regulatory, research, manufacturing and supply chain areas. The principal aim is to ensure the continuity of supply to patients in Europe (EU and the U.K.) and other global markets impacted by these changes. The one-time costs of making these adaptations are currently estimated at approximately $100 million and are expected to be incurred between 2018 and 2021.
Pfizer maintains a strong financial position while operating in a complex global environment. Due to our significant operating cash flows, financial assets, access to capital markets and available lines of credit and revolving credit agreements, we continue to believe that we have, and will maintain, the ability to meet our liquidity needs for the foreseeable future. Our long-term debt is rated high quality by both S&P and Moody’s. As market conditions change, we continue to monitor our liquidity position. We have taken and will continue to take a conservative approach to our financial investments. Both short-term and long-term investments consist primarily of high-quality, highly liquid, well-diversified, available-for-sale debt securities. For further discussion of our financial condition and credit ratings, see the “Analysis of Financial Condition, Liquidity and Capital Resources” section of this MD&A.
These and other industry-wide factors that may affect our businesses should be considered along with information presented in the “Forward-Looking Information and Factors That May Affect Future Results” section of this MD&A and in Part I, Item 1A, “Risk Factors” of our
2018
Form 10-K.
Our Strategy
We believe that our medicines provide significant value for both healthcare providers and patients, not only from the improved treatment of diseases but also from a reduction in other healthcare costs, such as emergency room or hospitalization costs, as well as improvements in health, wellness and productivity. We continue to actively engage in dialogues about the value of our medicines and how we can best work with patients, physicians and payers to prevent and treat disease and improve outcomes. We continue to work within the current legal and pricing structures, as well as continue to review our pricing arrangements and contracting methods with payers, to maximize patient access and minimize any adverse impact on our revenues. We remain firmly committed to fulfilling our company’s purpose:
Breakthroughs that change patients’ lives
. By doing so, we expect to create value for the patients we serve and for our colleagues and shareholders.
Organizing for Growth
We believe our current pipeline is the best pipeline in our history coupled with several new industry-leading medicines that position us well for future growth. Following the impact of the expected patent expiration of Lyrica in the U.S. in June 2019, we expect to enter a period of significantly reduced revenue impact from patent expiries. This confluence of events has given us an opportunity to look at and refine how we organize our business to best achieve sustainable growth and to deliver our medicines and vaccines to the maximum number of people who need them.
At the beginning of our fiscal year 2019, we began to manage our commercial operations through a new global structure consisting of three businesses, each of which is led by a single manager—Pfizer Biopharmaceuticals Group (Biopharma), Upjohn and Pfizer’s Consumer Healthcare business. We designed this new global structure to take advantage of new growth opportunities driven by the evolving and unique dynamics of relevant markets.
See the “Commercial Operations” section below for additional information about each business.
We also reorganized our R&D operations as part of our Organizing for Growth reorganization:
|
•
|
The former Worldwide, Research and Development organization is renamed Worldwide Research, Development and Medical (WRDM) as we have created a new Worldwide Medical & Safety organization in WRDM that incorporates the former Chief Medical Office as well as the Worldwide Safety function;
|
|
•
|
The R&D organization within our former Essential Health business has been integrated into the WRDM, GPD and Upjohn organizations, including moving biosimilars into WRDM and GPD and realigning them with the relevant therapeutic areas (e.g., Oncology and Inflammation & Immunology);
|
|
•
|
The Regulatory function has been moved from the WRDM organization into the GPD organization; and
|
|
•
|
Late-stage portfolio spend has been moved from our former Innovative Health business to GPD and from our former Essential Health business to GPD and Upjohn.
|
We re-aligned our commercial operations in 2019 for a number of reasons, including:
|
•
|
Bringing biosimilars into our Oncology and Inflammation & Immunology therapeutic categories gives us the potential to leverage our R&D, regulatory and commercial infrastructure within the Biopharma business to more efficiently bring those assets to market;
|
52
|
•
|
Creating a business unit that is solely focused on medicines that are used in hospitals can potentially bring greater focus and attention to serving those customers and developing those relationships;
|
|
•
|
Giving Upjohn more autonomy with a focus on maximizing the value of its products, particularly in emerging markets, provides it the opportunity to operate as a standalone business within Pfizer with the potential for sustainable modest growth; and
|
|
•
|
We believe this new structure better positions each business to achieve its growth potential as we transition to a period post-2020 where we expect higher and more sustained revenue growth due to declining LOEs and the potential of our late-stage pipeline.
|
Biopharma seeks to leverage a strong pipeline, organize around operational growth drivers, and capitalize on trends creating long-term growth opportunities, including:
|
•
|
an aging global population that is generating increased demand for innovative medicines that address patients’ unmet needs;
|
|
•
|
advances in both biological science and digital technology that are enhancing the delivery of breakthrough new medicines; and
|
|
•
|
the increasingly significant role of hospitals in healthcare systems.
|
Urbanization and the rise of the middle class in emerging markets, particularly in Asia, provide growth opportunities for the Upjohn business. Our ability to work collaboratively within local markets and to be fast, focused and flexible is intended to position this business to seize these opportunities. Upjohn has distinct and dedicated manufacturing, marketing, regulatory and, subject to limited exceptions, enabling functions that report directly into the business providing autonomy and positioning Upjohn to operate as a true stand-alone division. We created this new structure to, among other things, position Upjohn to optimize its distinct growth potential and provide us with the flexibility to access further opportunities to enhance value, which we continue to consider.
As we prepare for expected growth, we are focused on creating a simpler, more efficient organization by streamlining structures, process and governance within each business and the functions that support them. As our innovative pipeline matures based on anticipated progression of current trials and the initiation of new pivotal trials, including new trials for medicines we may acquire or in-license, we will need to increase our R&D investments. In addition, as our pipeline potentially delivers new commercialization opportunities, we will need to increase our investments in new-market-creation activities. We are also initiating an enterprise-wide digital effort to accelerate drug development, enhance experiences (patient and physician), and leverage technology and robotics to simplify and automate our processes.
In the fourth quarter of 2018, we took steps to simplify the organization, increase spans of control and reduce organizational layers, which impacted some managerial roles and responsibilities. We also offered enhancements to certain employee benefits for a short period of time. The expenses related to these enhancements for certain employee benefits did not have a material impact on our 2018 results of operations and any expected future impact of these enhancements are reflected in the totality of our annual guidance for 2019. To partially offset the incremental cost increases of increased R&D investments and marketing activities in future periods, we expect to generate cost reduction opportunities, particularly in indirect SI&A.
Commercial Operations
As discussed under “Organizing for Growth”, at the beginning of our 2019 fiscal year, we began to manage our commercial operations through a new global structure consisting of three business segments––Biopharma, Upjohn and Consumer Healthcare, each led by a single manager. Each operating segment has responsibility for its commercial activities. Upjohn and Consumer Healthcare are responsible for their own R&D activities while Biopharma receives its R&D services from GPD and WRDM. These services include IPR&D projects for new investigational products and additional indications for in-line products. Each business has a geographic footprint across developed and emerging markets.
53
|
Some additional information about our Biopharma and Upjohn business segments follows:
|
||
|
|
|
|
|
Biopharma is a science-based innovative medicines business that includes six business units – Oncology, Inflammation & Immunology, Rare Disease, Hospital, Vaccines and Internal Medicine. The new Hospital unit commercializes our global portfolio of sterile injectable and anti-infective medicines and includes Pfizer’s contract manufacturing operation, Pfizer CentreOne. We also incorporated our biosimilar portfolio into our Oncology and Inflammation & Immunology business units and certain legacy established products into the Internal Medicine business unit. Each business unit is committed to improving health with our innovative products from prevention to treatment to wellness – at every stage of life in communities across the globe.
|
Upjohn is a global, primarily off-patent branded and generic established medicines business, which includes 20 primarily off-patent solid oral dose legacy brands, as well as certain generic medicines.
|
|
|
Select products include:
- Prevnar 13/Prevenar 13 - Ibrance
-
Eliquis
- Enbrel (outside the U.S. and Canada) - Xeljanz - Chantix/Champix
-
Sutent
|
Select products include:
- Lyrica - Lipitor - Norvasc
- Celebrex
- Viagra
-
Certain generic medicines
|
|
Pfizer’s Consumer Healthcare segment is an over-the-counter medicines business, which we announced on December 19, 2018 will be contributed to, and combined with, GSK’s consumer healthcare business to form a new consumer healthcare joint venture, of which we will own 32%. For additional information, see Notes to Condensed Consolidated Financial Statements—
Note 2.
Assets and Liabilities Held for Sale
.
For additional information about our operating structure, see Notes to Condensed Consolidated Financial Statements—
Note 13A.
Segment, Geographic and Other Revenue Information
: Segment Information.
For additional information about the first-quarter
2019
performance for each of our operating segments, see the “Analysis of Operating Segment Information” section of this MD&A.
Description of Research and Development Operations
Innovation is critical to the success of our company, and drug discovery and development are time-consuming, expensive and unpredictable.
Our goal is to discover, develop and bring to market innovative products that address major unmet medical needs.
Our R&D priorities include:
|
•
|
delivering a pipeline of differentiated therapies and vaccines with the greatest medical and commercial potential;
|
|
•
|
advancing our capabilities that can position Pfizer for long-term leadership; and
|
|
•
|
creating new models for biomedical collaboration that will expedite the pace of innovation and productivity.
|
To that end, our R&D primarily focuses on:
|
•
|
Inflammation and Immunology
;
|
|
•
|
Internal Medicine
;
|
|
•
|
Oncology
;
|
|
•
|
Rare Diseases
;
|
|
•
|
Vaccines
; and
|
|
•
|
Hospital.
|
In January 2018, we announced our decision to end internal neuroscience discovery and early development efforts and re-allocate funding to other areas where we have stronger scientific leadership. The development of tanezumab and potential
54
treatments for rare neuromuscular disorders is not impacted by this decision. In June 2018, we announced our plan to invest up to $600 million in biotechnology and other emerging growth companies through Pfizer Ventures, our venture investment vehicle. For additional information see the Notes to Consolidated Financial Statements––
Note 2B. Acquisitions, Divestitures, Assets and Liabilities Held for Sale, Licensing Arrangements, Research and Development and Collaborative Arrangements, Equity-Method Investments and Privately Held Investment: Divestitures
in Pfizer’s 2018 Financial Report
.
In 2019, we continue to strengthen our global R&D organization and pursue strategies intended to improve innovation and overall productivity in R&D to achieve a sustainable pipeline that is positioned to deliver value in the near term and over time.
Our R&D spending is conducted through a number of matrix organizations:
|
•
|
Research Units within our WRDM organization are generally responsible for research and early-stage development assets for our Biopharma business (assets that have not yet achieved proof-of-concept).
Our Research Units are organized by therapeutic area to enhance flexibility, cohesiveness and focus. Because of our structure, we are able to rapidly redeploy resources within a Research Unit between various projects as necessary because in many instances the workforce shares similar skills, expertise and/or focus.
|
|
•
|
Our science-based and other platform-services organizations, where a significant portion of our R&D spending occurs, provide technical expertise and other services to the various R&D projects, and are organized into science-based functions (which are part of our WRDM organization), such as Pharmaceutical Sciences, Medicine Design, Worldwide Medical and Safety and non-science-based functions, such as Facilities, Business Technology and Finance. As a result, within each of these functions, we are able to migrate resources among projects, candidates and/or targets in any therapeutic area and in most phases of development, allowing us to react quickly in response to evolving needs.
|
|
•
|
Our R&D organization within the Upjohn business supports the off-patent branded and generic established medicines and helps develop product enhancements, new indications and new market registrations based on these medicines.
|
|
•
|
Our GPD organization
is a unified center for clinical development and regulatory activities that is generally responsible for the clinical development strategy and operational execution of clinical trials for both early-stage assets in the WRDM portfolio as well as late-stage assets in the Biopharma portfolio. For WRDM assets, GPD works in close collaboration with the Early Clinical Development group, which has expertise in various disciplines such as Biostatistics, Clinical Pharmacology and Digital Medicine. GPD enables more efficient and effective development and enhances our ability to accelerate and progress assets through our pipeline. GPD also provides operational support to Upjohn for select clinical development and regulatory activities.
|
We manage R&D operations on a total-company basis through our matrix organizations described above. Specifically, a portfolio governance committee, comprised of senior executives, is accountable for aligning resources among all of our WRDM, GPD and Biopharma R&D projects and for seeking to ensure optimal capital allocation across the innovative R&D portfolio. We believe that this approach also serves to maximize accountability and flexibility. Our Upjohn R&D organization manages its resources separately from the WRDM and GPD organizations.
Generally, we do not disaggregate total R&D expense by development phase or by therapeutic area since, as described above, we do not manage a significant portion of our R&D operations by development phase or by therapeutic area. Further, as we are able to adjust a significant portion of our spending quickly, as conditions change, we believe that any prior-period information about R&D expense by development phase or by therapeutic area would not necessarily be representative of future spending.
While a significant portion of R&D is done internally, we continue to seek out promising chemical and biological lead molecules and innovative technologies developed by third parties to incorporate into our discovery and development processes or projects, as well as our product lines, by entering into collaboration, alliance and license agreements with other companies, as well as leveraging acquisitions and equity- or debt-based investments. These agreements enable us to co-develop, license or acquire promising compounds, technologies or capabilities. We also enter into agreements pursuant to which a third party agrees to fund a portion of the development costs of one or more of our pipeline products in exchange for rights to receive potential milestone payments, revenue sharing payments, profit sharing payments and/or royalties. Collaboration, alliance, license and funding agreements and equity- or debt-based investments allow us to share risk and cost and to access external scientific and technological expertise, and provide us the opportunity to advance our own products as well as the in-licensed or acquired products.
For additional information about R&D by operating segment, see the “Analysis of Operating Segment Information” section of this MD&A. For additional information about our pending new drug applications and supplemental filings, see the “Analysis of the Consolidated Statements of Income––Product Developments––Biopharmaceutical” section of this MD&A. For additional information about recent transactions and strategic investments that we believe have the potential to advance our pipeline, see the “Our Business Development Initiatives” section of this MD&A.
55
Intellectual Property Rights
We continue to aggressively defend our patent rights against increasingly aggressive infringement, and we will continue to support efforts that strengthen worldwide recognition of patent rights while taking necessary steps to ensure appropriate patient access. In addition, we will continue to employ innovative approaches designed to prevent counterfeit pharmaceuticals from entering the supply chain and to achieve greater control over the distribution of our products, and we will continue to participate in the generics market for our products, whenever appropriate, once they lose exclusivity. Also, the pursuit of valid business opportunities may require us to challenge intellectual property rights held by other companies that we believe were improperly granted. Such challenges may include negotiation and litigation, which may not always be successful. For additional information about our current efforts to enforce our intellectual property rights and certain other patent proceedings, see Notes to Condensed Consolidated Financial Statements
––
Note 12A1.
Contingencies and Certain Commitments
: Legal Proceedings
––
Patent Litigation.
For information on risks related to patent protection and intellectual property claims by third parties, see Part I, Item 1A, “Risk Factors––Risks Related to Intellectual Property” in our
2018
Form 10-K.
Capital Allocation and Expense Management
We seek to maintain a strong balance sheet and robust liquidity so that we continue to have the financial resources necessary to take advantage of prudent commercial, research and business development opportunities and to directly enhance shareholder value through share repurchases and dividends. For additional information about our financial condition, liquidity, capital resources, share repurchases (including accelerated share repurchases) and dividends, see the “Analysis of Financial Condition, Liquidity and Capital Resources” section of this MD&A. For additional information about our recent business development activities, see the “Our Strategy––Our Business Development Initiatives” section of this MD&A.
We remain focused on achieving an appropriate cost structure for our company. For additional information about our cost-reduction and productivity initiatives, see the “Costs and Expenses––Restructuring Charges and Other Costs Associated with Acquisitions and Cost-Reduction/Productivity Initiatives” section of this MD&A and Notes to Condensed Consolidated Financial Statements––
Note 3
.
Restructuring Charges and Other Costs Associated with Acquisitions and Cost-Reduction/Productivity Initiatives
.
Increasing Investment in the U.S.
––
After evaluating the expected positive net impact the TCJA will have on us, in early 2018, we decided to take several actions:
|
•
|
Over the five-year period from 2018 through 2022, we plan to invest approximately $5.0 billion in capital projects in the U.S., including the strengthening of our manufacturing presence in the U.S. As part of this plan, in July 2018, we announced that we will increase our commitment to U.S. manufacturing with a $465 million investment to build one of the most technically advanced sterile injectable pharmaceutical production facilities in the world in Portage, Michigan. This U.S. investment will strengthen our capability to produce and supply critical, life-saving injectable medicines for patients around the world. Known as Modular Aseptic Processing, the new, multi-story, 400,000-square-foot production facility will also support the area economy by creating an estimated 450 new jobs over the next several years.
|
|
•
|
We made a $500 million voluntary contribution to the U.S. Pfizer Consolidated Pension Plan in February 2018.
|
|
•
|
In the fourth quarter of 2017, we made a $200 million charitable contribution to the Pfizer Foundation, an organization that provides grant and investment funding to support organizations and social entrepreneurs in an effort to improve healthcare delivery.
|
|
•
|
In the first quarter of 2018, we paid a special, one-time bonus to virtually all Pfizer colleagues, excluding executives, of
$108 million
in the aggregate.
|
Our Business Development Initiatives
We are committed to capitalizing on growth opportunities by advancing our own pipeline and maximizing the value of our in-line products, as well as through various forms of business development, which can include alliances, licenses, joint ventures, collaborations, equity- or debt-based investments, dispositions, mergers and acquisitions. We view our business development activity as an enabler of our strategies, and we seek to generate earnings growth and enhance shareholder value by pursuing a disciplined, strategic and financial approach to evaluating business development opportunities. We continue to evaluate business development transactions that have the potential to strengthen our businesses and their capabilities, such as our acquisitions of Medivation, Anacor and AstraZeneca’s small molecule anti-infectives business, as well as collaborations, and alliance and license agreements with other companies. We assess our businesses, assets and scientific capabilities/portfolio as part of our regular, ongoing portfolio review process and also continue to consider business development activities that will advance our businesses. The more significant recent transactions and events are described below:
56
|
•
|
Acquisition of Therachon Holding AG (Biopharma)
––On May 8, 2019, we announced that we entered into a definitive agreement to acquire all the remaining shares of Therachon, a privately-held clinical-stage biotechnology company focused on rare diseases, with assets in development for the treatment of achondroplasia and SBS. Prior to the closing of the transaction with us, Therachon will spin-off its SBS development program into a separate, independent company. Under the terms of the agreement, we will acquire Therachon for $340 million upfront with an additional $470 million in payments contingent on the achievement of key milestones in the development and commercialization of TA-46 for the treatment of achondroplasia, a genetic condition and the most common form of short-limbed dwarfism. We previously purchased a minority stake in Therachon in the third quarter of 2018 for a payment of $5 million. Following the acquisition, Therachon will be our wholly-owned subsidiary. We do not expect this transaction to have any significant impact on our 2019 financial performance.
|
|
•
|
Agreement to Form a New Consumer Healthcare Joint Venture (Consumer Healthcare)
––On December 19, 2018, we announced that we entered into a definitive agreement with GSK under which we and GSK agreed to combine our respective consumer healthcare businesses into a new consumer healthcare joint venture that will operate globally under the GSK Consumer Healthcare name. The joint venture is expected to be a category leader in pain relief, respiratory, vitamin and mineral supplements, digestive health, skin health and therapeutic oral health and will be the largest global OTC consumer healthcare business. For additional information, see Notes to Condensed Consolidated Financial Statements––
Note 2. Assets and Liabilities Held for Sale
.
|
For a description of the more significant recent transactions through
February 28, 2019
, the filing date of our
2018
Form 10-K, see the “Our Business Development Initiatives” section of our
2018
Financial Report.
Our Financial Guidance for
2019
On
April 30, 2019
, we updated our 2019 financial guidance, which continues to reflect a full year of revenue and expense contributions from our Consumer Healthcare business.
|
•
|
Guidance for Adjusted Other (income)/deductions was increased by $100 million, primarily due to milestone income recorded in the first quarter of 2019; and
|
|
•
|
The midpoint of the guidance range for Adjusted diluted EPS was increased by $0.01 to an updated range of
$2.83 to $2.93
, reflecting a $0.03 operational improvement, primarily due to the aforementioned increase to the guidance for Adjusted Other (income)/deductions, partially offset by unfavorable changes in foreign exchange rates since mid-January 2019, which had an incremental negative impact of $0.02.
|
|
The following table provides our financial guidance for full-year 2019
(a), (b)
:
|
|
|
Revenues
|
$52.0 to $54.0 billion
|
|
Adjusted cost of sales as a percentage of revenues
|
20.8% to 21.8%
|
|
Adjusted selling, informational and administrative expenses
|
$13.5 to $14.5 billion
|
|
Adjusted research and development expenses
|
$7.8 to $8.3 billion
|
|
Adjusted other (income)/deductions
|
Approximately $200 million of income
|
|
(previously approximately $100 million of income)
|
|
|
Effective tax rate on adjusted income
|
Approximately 16.0%
|
|
Adjusted diluted EPS
|
$2.83 to $2.93
|
|
(previously $2.82 to $2.92)
|
|
|
(a)
|
T
he
2019
financial guidance reflects the following:
|
|
•
|
Does not assume the completion of any business development transactions not completed as of
March 31, 2019
, including any one-time upfront payments associated with such transactions.
|
|
•
|
Reflects an anticipated negative revenue impact of
$2.6 billion
due to recent and expected generic and biosimilar competition for certain products that have recently lost or are anticipated to soon lose patent protection.
|
|
•
|
Exchange rates assumed are a blend of the actual exchange rates in effect through first-quarter 2019 and mid-April 2019 rates for the remainder of the year. Reflects the anticipated unfavorable impact of approximately
$1.1 billion
on revenues and approximately
$0.08
on adjusted diluted EPS
as a result of changes in foreign exchange rates relative to the U.S. dollar compared to foreign exchange rates from 2018.
|
|
•
|
Guidance for adjusted diluted EPS assumes diluted weighted-average shares outstanding of approximately
5.7
billion shares, which reflects the weighted-average impact of share repurchases totaling $8.9 billion executed in the first quarter of 2019.
Dilution related to share-based employee compensation programs is currently expected to offset the reduction in shares associated with these share repurchases by approximately half.
|
|
(b)
|
For an understanding of Adjusted income and its components and Adjusted diluted EPS (all of which are non-GAAP financial measures), see the “Non-GAAP Financial Measure (Adjusted Income)” section of this MD&A.
|
Pfizer does not provide guidance for GAAP Reported financial measures (other than revenues) or a reconciliation of forward-looking non-GAAP financial measures to the most directly comparable GAAP Reported financial measures on a forward-looking basis because it is unable to predict with reasonable certainty the ultimate outcome of pending litigation, unusual gains and losses, acquisition-related expenses, net gains or losses on investments in equity securities and potential future asset impairments without unreasonable effort. These items are uncertain, depend on various factors, and could have a material impact on GAAP Reported results for the guidance period.
57
For information about our actual costs and anticipated costs and cost savings associated with our 2017-2019 initiatives and Organizing for Growth, see the “Costs and Expenses––Restructuring Charges and Other Costs Associated with Acquisitions and Cost-Reduction/Productivity Initiatives” section of this MD&A and Notes to Condensed Consolidated Financial Statements––
Note 3
.
Restructuring Charges and Other Costs Associated with Acquisitions and Cost-Reduction/Productivity Initiatives
.
Our
2019
financial guidance is subject to a number of factors and uncertainties as described in the “Our Operating Environment”, “The Global Economic Environment”, “Our Strategy” and “Forward-Looking Information and Factors That May Affect Future Results” sections of this MD&A; and Part I, Item 1A, “Risk Factors” of our
2018
Form 10-K.
58
SIGNIFICANT ACCOUNTING POLICIES AND APPLICATION OF CRITICAL ACCOUNTING ESTIMATES AND ASSUMPTIONS
For a description of our significant accounting policies, see Notes to Consolidated Financial Statements––
Note 1. Basis of Presentation and Significant Accounting Policies
in our
2018
Financial Report
.
Of these policies, the following are considered critical to an understanding of our consolidated financial statements as they require the application of the most subjective and the most complex judgments: (i) Acquisitions (Note 1D); (ii) Fair Value (Note 1E); (iii) Revenues (Note 1G ); (iv) Asset Impairments (Note 1L); (v) Tax Assets and Liabilities and Income Tax Contingencies (Note 1P); (vi) Pension and Postretirement Benefit Plans (Note 1Q); and Legal and Environmental Contingencies (Note 1R).
For a discussion about the critical accounting estimates and assumptions impacting our consolidated financial statements, see the “Significant Accounting Policies and Application of Critical Accounting Estimates and Assumptions” section of our
2018
Financial Report. See also Notes to Consolidated Financial Statements––
Note 1C. Basis of Presentation and Significant Accounting Policies: Estimates and Assumptions
in our
2018
Financial Report for a discussion about the risks associated with estimates and assumptions.
For a discussion of recently adopted accounting standards, see Notes to Condensed Consolidated Financial Statements––
Note 1B.
Basis of Presentation and Significant Accounting Policies
: Adoption of New Accounting Standards.
ANALYSIS OF THE CONDENSED CONSOLIDATED STATEMENTS OF INCOME
|
The following table provides the components of the condensed consolidated statements of income:
|
|||||||||||
|
|
Three Months Ended
|
||||||||||
|
(MILLIONS OF DOLLARS, EXCEPT PER COMMON SHARE DATA)
|
March 31,
2019 |
|
April 1,
2018 |
|
%
Change
|
|
|||||
|
Revenues
|
$
|
13,118
|
|
$
|
12,906
|
|
2
|
|
|||
|
Cost of sales
(a)
|
2,433
|
|
2,563
|
|
(5
|
)
|
|||||
|
% of revenues
|
18.5
|
%
|
19.9
|
%
|
|
|
|||||
|
Selling, informational and administrative expenses
(a)
|
3,339
|
|
3,412
|
|
(2
|
)
|
|||||
|
% of revenues
|
25.5
|
%
|
26.4
|
%
|
|
|
|||||
|
Research and development expenses
(a)
|
1,703
|
|
1,743
|
|
(2
|
)
|
|||||
|
% of revenues
|
13.0
|
%
|
13.5
|
%
|
|
|
|||||
|
Amortization of intangible assets
|
1,183
|
|
1,196
|
|
(1
|
)
|
|||||
|
% of revenues
|
9.0
|
%
|
9.3
|
%
|
|
|
|||||
|
Restructuring charges and certain acquisition-related costs
|
46
|
|
43
|
|
7
|
|
|||||
|
% of revenues
|
0.4
|
%
|
0.3
|
%
|
|
|
|||||
|
Other (income)/deductions––net
|
92
|
|
(178
|
)
|
*
|
|
|||||
|
Income from continuing operations before provision for taxes on income
|
4,323
|
|
4,127
|
|
5
|
|
|||||
|
% of revenues
|
33.0
|
%
|
32.0
|
%
|
|
|
|||||
|
Provision for taxes on income
|
433
|
|
556
|
|
(22
|
)
|
|||||
|
Effective tax rate
|
10.0
|
%
|
13.5
|
%
|
|
|
|||||
|
Income from continuing operations
|
3,889
|
|
3,571
|
|
9
|
|
|||||
|
% of revenues
|
29.6
|
%
|
27.7
|
%
|
|
|
|||||
|
Discontinued operations––net of tax
|
—
|
|
(1
|
)
|
*
|
|
|||||
|
Net income before allocation to noncontrolling interests
|
3,889
|
|
3,570
|
|
9
|
|
|||||
|
% of revenues
|
29.6
|
%
|
27.7
|
%
|
|
|
|||||
|
Less: Net income attributable to noncontrolling interests
|
6
|
|
9
|
|
(41
|
)
|
|||||
|
Net income attributable to Pfizer Inc.
|
$
|
3,884
|
|
$
|
3,561
|
|
9
|
|
|||
|
% of revenues
|
29.6
|
%
|
27.6
|
%
|
|
|
|||||
|
Earnings per common share––basic
:
|
|
|
|
|
|
|
|||||
|
Income from continuing operations attributable to Pfizer Inc. common shareholders
|
$
|
0.69
|
|
$
|
0.60
|
|
15
|
|
|||
|
Net income attributable to Pfizer Inc. common shareholders
|
$
|
0.69
|
|
$
|
0.60
|
|
15
|
|
|||
|
Earnings per common share––diluted
:
|
|
|
|||||||||
|
Income from continuing operations attributable to Pfizer Inc. common shareholders
|
$
|
0.68
|
|
$
|
0.59
|
|
15
|
|
|||
|
Net income attributable to Pfizer Inc. common shareholders
|
$
|
0.68
|
|
$
|
0.59
|
|
15
|
|
|||
* Calculation not meaningful or results are equal to or greater than 100%.
59
|
(a)
|
Excludes amortization of intangible assets, except as disclosed in Notes to Condensed Consolidated Financial Statements––
Note 9A. Identifiable Intangible Assets and Goodwill: Identifiable Intangible Assets.
|
Revenues by Operating Segment and Geography
The following graphs show revenues by operating segment and geography:
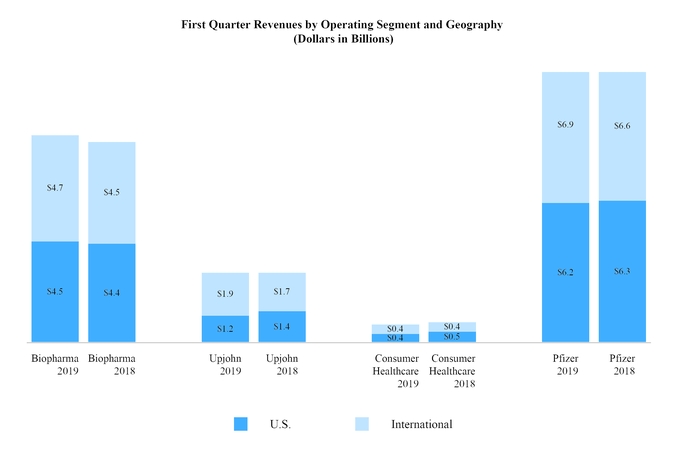
|
The following tables provide worldwide revenues by operating segment and geography:
|
|||||||||||||||||||||||||||||||||
|
Three Months Ended
|
|||||||||||||||||||||||||||||||||
|
|
Worldwide
|
U.S.
|
International
|
World-wide
|
U.S.
|
Inter-national
|
|||||||||||||||||||||||||||
|
(MILLIONS OF DOLLARS)
|
March 31,
2019 |
|
April 1,
2018 |
|
March 31,
2019 |
|
April 1,
2018 |
|
March 31,
2019 |
|
April 1,
2018 |
|
% Change in Revenues
|
||||||||||||||||||||
|
Operating Segments
(a)
:
|
|
|
|
|
|
|
|
|
|
||||||||||||||||||||||||
|
Biopharma
|
$
|
9,185
|
|
$
|
8,881
|
|
$
|
4,521
|
|
$
|
4,388
|
|
$
|
4,664
|
|
$
|
4,493
|
|
3
|
|
3
|
|
4
|
|
|||||||||
|
Upjohn
|
3,075
|
|
3,120
|
|
1,213
|
|
1,408
|
|
1,861
|
|
1,712
|
|
(1
|
)
|
(14
|
)
|
9
|
|
|||||||||||||||
|
Consumer Healthcare
|
858
|
|
905
|
|
440
|
|
479
|
|
418
|
|
427
|
|
(5
|
)
|
(8
|
)
|
(2
|
)
|
|||||||||||||||
|
Total revenues
|
$
|
13,118
|
|
$
|
12,906
|
|
$
|
6,175
|
|
$
|
6,275
|
|
$
|
6,943
|
|
$
|
6,631
|
|
2
|
|
(2
|
)
|
5
|
|
|||||||||
|
(a)
|
For additional information about each operating segment, see the “Our Strategy––Commercial Operations” and “Analysis of Operating Segment Information” sections of this MD&A and Notes to Condensed Consolidated Financial Statements––
Note 13A.
Segment, Geographic and Other Revenue Information
: Segment Information.
|
60
Revenues––
First Quarter
of
2019
vs.
First Quarter
of
2018
|
The following provides an analysis of the worldwide change in revenues by geographic areas in the first quarter of 2019:
|
||||||||||||
|
Three Months Ended March 31, 2019
|
||||||||||||
|
(MILLIONS OF DOLLARS)
|
Worldwide
|
U.S.
|
International
|
|||||||||
|
Operational growth/(decline):
|
||||||||||||
|
Continued growth from certain key brands
(a)
|
$
|
763
|
|
$
|
278
|
|
$
|
485
|
|
|||
|
Growth from Lipitor, Norvasc and Celebrex, primarily in emerging markets, driven by strong, volume-driven operational growth in China
|
237
|
|
(8
|
)
|
244
|
|
||||||
|
Lower revenues for Viagra and Upjohn's authorized generic for Viagra in the U.S. resulting from increased generic competition following Viagra's December 2017 patent expiration
|
(97
|
)
|
(111
|
)
|
13
|
|
||||||
|
Lower revenues for the Hospital business primarily in the U.S., mostly due to the continued expected negative impact from generic competition for products that have previously lost marketing exclusivity
|
(71
|
)
|
(68
|
)
|
(3
|
)
|
||||||
|
Lower revenues for certain rare disease products, including the hemophilia franchises (BeneFIX and Refacto AF/Xyntha) primarily due to competitive pressures, and Genotropin in the U.S., primarily due to unfavorable channel mix
|
(52
|
)
|
(25
|
)
|
(27
|
)
|
||||||
|
Lower revenues for Greenstone, Upjohn's authorized generic subsidiary, primarily due to continued industry-wide pricing challenges in the U.S., excluding revenues for Upjohn's authorized generic for Viagra in the U.S.
|
(28
|
)
|
(30
|
)
|
1
|
|
||||||
|
Lower revenues for Consumer Healthcare
|
(19
|
)
|
(38
|
)
|
19
|
|
||||||
|
Lower worldwide revenues for Lyrica, primarily in the U.S., reflecting wholesaler destocking in advance of anticipated generic competition beginning on June 30, 2019, and in developed Europe, reflecting continued generic competition
|
(18
|
)
|
(18
|
)
|
—
|
|
||||||
|
Other operational factors, net
|
(50
|
)
|
(82
|
)
|
32
|
|
||||||
|
Operational growth/(decline), net
|
664
|
|
(100
|
)
|
764
|
|
||||||
|
Unfavorable impact of foreign exchange
|
(453
|
)
|
—
|
|
(453
|
)
|
||||||
|
Revenues
increase/(decrease)
|
$
|
211
|
|
$
|
(100
|
)
|
$
|
311
|
|
|||
|
(a)
|
Certain k
ey brands
represent Eliquis, Ibrance, Prevnar 13/Prevenar 13 and Xeljanz. See the “Analysis of the Condensed Consolidated Statements of Income––Revenues––Selected Product Discussion" section of this MD&A for product analysis information.
|
Emerging markets revenues
increase
d
$243 million
, or
8%
, in the
first
quarter of
2019
to
$3.3 billion
from
$3.1 billion
, reflecting an operational
increase
of
$531 million
, or
17%
. Foreign exchange had
an unfavorable
impact of approximately
9%
on emerging markets revenues. The operational
increase
in emerging markets was driven by Lipitor, Norvasc and Celebrex in our Upjohn segment, as well as Prevenar 13, Ibrance and Enbrel in our Biopharma segment.
Revenue Deductions
Our gross product revenues are subject to a variety of deductions, which generally are estimated and recorded in the same period that the revenues are recognized. Such variable consideration represents chargebacks, rebates, sales allowances and sales returns. These deductions represent estimates of the related obligations and, as such, knowledge and judgment is required when estimating the impact of these revenue deductions on gross sales for a reporting period. Historically, our adjustments of estimates, to reflect actual results or updated expectations, have not been material to our overall business. On a quarterly basis, our adjustments of estimates to reflect actual results generally have been less than 1% of revenues, and have resulted in either a net increase or a net decrease in revenues. Product-specific rebates, however, can have a significant impact on year-over-year individual product growth trends.
61
|
The following table provides information about revenue deductions:
|
||||||||
|
|
Three Months Ended
|
|||||||
|
(MILLIONS OF DOLLARS)
|
March 31,
2019 |
|
April 1,
2018 |
|
||||
|
Medicare rebates
(a)
|
$
|
434
|
|
$
|
398
|
|
||
|
Medicaid and related state program rebates
(a)
|
568
|
|
495
|
|
||||
|
Performance-based contract rebates
(a), (b)
|
889
|
|
760
|
|
||||
|
Chargebacks
(c)
|
1,556
|
|
1,611
|
|
||||
|
Sales allowances
(d)
|
1,360
|
|
1,328
|
|
||||
|
Sales returns and cash discounts
|
327
|
|
346
|
|
||||
|
Total
(e)
|
$
|
5,134
|
|
$
|
4,939
|
|
||
|
(a)
|
Rebates are product-specific and, therefore, for any given year are impacted by the mix of products sold.
|
|
(b)
|
Performance-based contract rebates include contract rebates with MCOs within the U.S., including health maintenance organizations and PBMs, who receive rebates based on the achievement of contracted performance terms and claims under these contracts. Outside the U.S., performance-based contract rebates include rebates to wholesalers/distributors based on achievement of contracted performance for specific products or sales milestones.
|
|
(c)
|
Chargebacks primarily represent reimbursements to U.S. wholesalers for honoring contracted prices to third parties.
|
|
(d)
|
Sales allowances primarily represent price reductions that are contractual or legislatively mandated outside the U.S., discounts and distribution fees.
|
|
(e)
|
For the three months ended
March 31, 2019
, associated with the following segments: Biopharma (
$2.7 billion
), Upjohn (
$2.2 billion
) and Other (
$0.2 billion
). For the three months ended
April 1, 2018
, associated with the following segments: Biopharma (
$2.4 billion
), Upjohn (
$2.4 billion
) and Other (
$0.2 billion
).
|
Total revenue deductions for the
first quarter
of
2019
increase
d
4%
compared to the
first quarter
of
2018
, primarily as a result of:
|
•
|
an increase in performance-based contract rebates primarily in the U.S. due to increased sales of certain Biopharma products;
|
|
•
|
an increase in Medicaid and related state program rebates, primarily as a result of increased sales of Biopharma products through these programs; and
|
|
•
|
an increase in Medicare rebates driven by increased sales of Biopharma products through this channel.
|
For information on our accruals for Medicare rebates, Medicaid and related state program rebates, performance-based contract rebates, chargebacks, sales allowances and sales returns and cash discounts, including the balance sheet classification of these accruals, see Notes to Condensed Consolidated Financial Statements––
Note 1C. Basis of Presentation and Significant Accounting Policies: Revenues and Trade Accounts Receivable
.
Revenues––Selected Product Discussion
The tables below provide worldwide revenues, by geography, for selected products. References to total change pertain to period-over-period growth rates that include foreign exchange. The difference between the total change and operational change represents the impact of foreign exchange. Amounts may not add due to rounding. All percentages have been calculated using unrounded amounts. An asterisk (*) indicates the calculation is not meaningful or results are equal to or greater than 100%.
|
•
|
Prevnar 13/Prevenar 13
(Biopharma):
|
|
|
|
Three Months Ended
|
||||||||||
|
|
|
|
|
|
|
|
|
% Change
|
||||
|
(MILLIONS OF DOLLARS)
|
|
March 31,
2019 |
|
|
April 1,
2018 |
|
|
Total
|
|
Oper.
|
||
|
U.S.
|
|
$
|
878
|
|
|
$
|
826
|
|
|
6
|
|
|
|
International
|
|
608
|
|
|
555
|
|
|
10
|
|
16
|
||
|
Worldwide revenues
|
|
$
|
1,486
|
|
|
$
|
1,380
|
|
|
8
|
|
10
|
The
growth
in the U.S. was primarily due to higher government purchases for the pediatric indication, partially offset by the continued decline in revenues for the adult indication due to a high initial capture rate of the eligible population following its successful fourth-quarter 2014 launch, which resulted in a smaller remaining “catch up” opportunity (i.e., the opportunity to reach adults aged 65 years and older who have not been previously vaccinated with Prevnar 13), compared to the prior-year period.
62
The operational
growth
internationally was primarily due to the favorable impact of timing associated with government purchases for the pediatric indication in certain emerging markets, as well as higher volumes resulting from increased shipments associated with Gavi, the Vaccine Alliance and from the second quarter 2017 launch in China. This growth was partially offset by the non-recurrence of volumes associated with an adult national immunization program in first quarter 2018.
In 2014, the ACIP voted to recommend Prevnar 13 for routine use to help protect adults aged 65 years and older against pneumococcal disease, which for adults includes pneumonia caused by the 13 pneumococcal serotypes included in the vaccine. These ACIP recommendations were subsequently approved by the directors at the CDC and U.S. Department of Health and Human Services, and were published in the Morbidity and Mortality Weekly Report in September 2014 by the CDC. The CDC regularly monitors the impact of vaccination and reviews the recommendations. During the February 2019 ACIP meeting, the CDC presented a formal evaluation of evidence to the recommendation framework (grading) for ACIP’s input. The CDC also committed to gathering additional data in June 2019 to support a potential vote on the maintenance of the 65 years and older recommendation. A vote may occur at the June 2019 ACIP meeting or later. A potential adverse change in the ACIP recommendation would negatively impact future Prevnar 13 revenues. We continue to generate and publish data and communicate with the ACIP on the burden of pneumococcal disease and Prevnar 13 vaccine effectiveness and safety.
|
•
|
Lyrica
(Upjohn):
|
|
|
|
Three Months Ended
|
||||||||||||
|
|
|
|
|
|
|
|
|
% Change
|
||||||
|
(MILLIONS OF DOLLARS)
|
|
March 31,
2019 |
|
|
April 1,
2018 |
|
|
Total
|
|
|
Oper.
|
|
||
|
U.S.
|
|
$
|
889
|
|
|
$
|
907
|
|
|
(2
|
)
|
|
|
|
|
International
|
|
298
|
|
|
307
|
|
|
(3
|
)
|
|
—
|
|
||
|
Worldwide revenues
|
|
$
|
1,186
|
|
|
$
|
1,213
|
|
|
(2
|
)
|
|
(1
|
)
|
The decline in the U.S. was primarily due to lower volumes reflecting wholesaler destocking in advance of anticipated generic competition beginning on June 30, 2019, partially offset by favorable U.S. rebates and chargebacks.
The de minimis international operational increase was primarily due to increased volumes in Japan attributable to growth in the orally dissolving tablet formulation, offset by generic competition in developed Europe markets and pricing pressures across developed international markets.
|
•
|
Ibrance
(Biopharma):
|
|
|
|
Three Months Ended
|
||||||||||
|
|
|
|
|
|
|
|
|
% Change
|
||||
|
(MILLIONS OF DOLLARS)
|
|
March 31,
2019 |
|
|
April 1,
2018 |
|
|
Total
|
|
Oper.
|
||
|
U.S.
|
|
$
|
741
|
|
|
$
|
726
|
|
|
2
|
|
|
|
International
|
|
392
|
|
|
207
|
|
|
90
|
|
*
|
||
|
Worldwide revenues
|
|
$
|
1,133
|
|
|
$
|
933
|
|
|
21
|
|
25
|
The worldwide operational
growth
reflects continued strong uptake in international markets following launches in developed Europe, Japan and certain emerging markets, as well as growth in the U.S., reflecting continued moderating volumes in the approved metastatic breast cancer indications.
|
•
|
Eliquis alliance revenues and direct sales
(Biopharma): Eliquis has been jointly developed and is commercialized by Pfizer and BMS. Pfizer funds between 50% and 60% of all development costs depending on the study. Profits and losses are shared equally on a global basis, except in certain countries where Pfizer commercializes Eliquis and pays BMS compensation based on a percentage of net sales. We have full commercialization rights in certain smaller markets. BMS supplies the product to us at cost, plus a percentage of the net sales to end-customers in these markets. Eliquis is part of the Novel Oral Anticoagulant (NOAC) market; the agents in this class were developed as alternative treatment options to warfarin in appropriate patients.
|
|
|
|
Three Months Ended
|
||||||||||
|
|
|
|
|
|
|
|
|
% Change
|
||||
|
(MILLIONS OF DOLLARS)
|
|
March 31,
2019 |
|
|
April 1,
2018 |
|
|
Total
|
|
Oper.
|
||
|
U.S.
|
|
$
|
601
|
|
|
$
|
435
|
|
|
38
|
|
|
|
International
|
|
410
|
|
|
330
|
|
|
24
|
|
33
|
||
|
Worldwide revenues
|
|
$
|
1,011
|
|
|
$
|
765
|
|
|
32
|
|
36
|
63
The worldwide operational
growth
was primarily driven by continued increased adoption in non-valvular atrial fibrillation, as well as oral anti-coagulant market share gains.
|
•
|
Lipitor
(Upjohn):
|
|
|
|
Three Months Ended
|
|||||||||||
|
|
|
|
|
|
|
|
|
% Change
|
|||||
|
(MILLIONS OF DOLLARS)
|
|
March 31,
2019 |
|
|
April 1,
2018 |
|
|
Total
|
|
|
Oper.
|
||
|
U.S.
|
|
$
|
21
|
|
|
$
|
29
|
|
|
(26
|
)
|
|
|
|
International
|
|
601
|
|
|
483
|
|
|
25
|
|
|
31
|
||
|
Worldwide revenues
|
|
$
|
622
|
|
|
$
|
511
|
|
|
22
|
|
|
28
|
The worldwide operational
growth
was primarily due to increased demand in China driven by investments in geographic expansion and timing of shipments in Vietnam, partially offset by pricing pressures in China and developed markets.
|
•
|
Enbrel
(Biopharma, outside the U.S. and Canada):
|
|
|
|
Three Months Ended
|
||||||||||||
|
|
|
|
|
|
|
|
|
% Change
|
||||||
|
(MILLIONS OF DOLLARS)
|
|
March 31,
2019 |
|
|
April 1,
2018 |
|
|
Total
|
|
|
Oper.
|
|
||
|
U.S.
|
|
$
|
—
|
|
|
$
|
—
|
|
|
—
|
|
|
|
|
|
International
|
|
451
|
|
|
506
|
|
|
(11
|
)
|
|
(3
|
)
|
||
|
Worldwide revenues
|
|
$
|
451
|
|
|
$
|
506
|
|
|
(11
|
)
|
|
(3
|
)
|
The worldwide operational
decline
was primarily due to ongoing biosimilar competition in most developed Europe markets, which is expected to continue.
|
•
|
Xeljanz
(Biopharma):
|
|
|
|
Three Months Ended
|
||||||||||
|
|
|
|
|
|
|
|
|
% Change
|
||||
|
(MILLIONS OF DOLLARS)
|
|
March 31,
2019 |
|
|
April 1,
2018 |
|
|
Total
|
|
Oper.
|
||
|
U.S.
|
|
$
|
298
|
|
|
$
|
253
|
|
|
18
|
|
|
|
International
|
|
125
|
|
|
72
|
|
|
72
|
|
89
|
||
|
Worldwide revenues
|
|
$
|
423
|
|
|
$
|
326
|
|
|
30
|
|
34
|
The
growth
in the U.S. was primarily driven by increased adoption among rheumatologists, growing awareness among patients and improvements in payer access and from the launches of the PsA indication in the first quarter of 2018 and UC indication in the third quarter of 2018, partially offset by higher rebating and unfavorable channel mix in the first quarter of 2019.
The operational
growth
internationally was primarily driven by increased adoption among rheumatologists in Germany, Japan, Canada and emerging markets for the RA indication and from the recent launch of the UC indication in certain developed markets.
|
•
|
Norvasc
(Upjohn):
|
|
|
Three Months Ended
|
|||||||||||
|
% Change
|
||||||||||||
|
(MILLIONS OF DOLLARS)
|
March 31,
2019 |
|
April 1,
2018 |
|
Total
|
Oper.
|
||||||
|
U.S.
|
$
|
10
|
|
$
|
9
|
|
10
|
|||||
|
International
|
289
|
|
246
|
|
17
|
24
|
||||||
|
Worldwide revenues
|
$
|
300
|
|
$
|
256
|
|
17
|
24
|
||||
The worldwide operational
growth
was primarily due to increased demand in China driven by investments in geographic expansion, partially offset by pricing pressures in China and lower demand across certain other emerging markets.
64
|
•
|
Chantix/Champix
(Biopharma):
|
|
|
Three Months Ended
|
||||||||||||
|
% Change
|
|||||||||||||
|
(MILLIONS OF DOLLARS)
|
March 31,
2019 |
|
April 1,
2018 |
|
Total
|
|
Oper.
|
||||||
|
U.S.
|
$
|
212
|
|
$
|
188
|
|
13
|
|
|||||
|
International
|
61
|
|
64
|
|
(4
|
)
|
1
|
||||||
|
Worldwide revenues
|
$
|
273
|
|
$
|
251
|
|
8
|
|
10
|
||||
The
growth
in the U.S. was
primarily due to increased
volume, improved patient access and positive price impact. The operational growth internationally was primarily driven by growth in emerging markets, partially offset by generic entry in South Korea and Canada.
|
•
|
Sutent
(Biopharma):
|
|
|
|
Three Months Ended
|
||||||||||||
|
|
|
|
|
|
|
|
|
% Change
|
||||||
|
(MILLIONS OF DOLLARS)
|
|
March 31,
2019 |
|
|
April 1,
2018 |
|
|
Total
|
|
|
Oper.
|
|
||
|
U.S.
|
|
$
|
71
|
|
|
$
|
88
|
|
|
(19
|
)
|
|
|
|
|
International
|
|
161
|
|
|
174
|
|
|
(8
|
)
|
|
1
|
|
||
|
Worldwide revenues
|
|
$
|
232
|
|
|
$
|
262
|
|
|
(12
|
)
|
|
(6
|
)
|
The worldwide operational decline in revenues reflects continuous erosion as a result of increased competition in developed markets, primarily in the U.S.
|
•
|
Sulperazon
(Biopharma):
|
|
|
Three Months Ended
|
|||||||||||
|
% Change
|
||||||||||||
|
(MILLIONS OF DOLLARS)
|
March 31,
2019 |
|
April 1,
2018 |
|
Total
|
Oper.
|
||||||
|
U.S.
|
$
|
—
|
|
$
|
—
|
|
—
|
|||||
|
International
|
177
|
|
168
|
|
5
|
11
|
||||||
|
Worldwide revenues
|
$
|
177
|
|
$
|
168
|
|
5
|
11
|
||||
The international operational
growth
was primarily due to increased demand in China.
|
•
|
Celebrex
(Upjohn):
|
|
|
Three Months Ended
|
||||||||||||
|
% Change
|
|||||||||||||
|
(MILLIONS OF DOLLARS)
|
March 31,
2019 |
|
April 1,
2018 |
|
Total
|
|
Oper.
|
||||||
|
U.S.
|
$
|
15
|
|
$
|
16
|
|
(6
|
)
|
|||||
|
International
|
159
|
|
129
|
|
23
|
|
27
|
||||||
|
Worldwide revenues
|
$
|
174
|
|
$
|
145
|
|
20
|
|
23
|
||||
The worldwide operational
growth
was primarily due to increased volumes in China driven by investments in geographic expansion and increased demand in Japan as well as other Asian markets.
|
•
|
The
Premarin
family of products (Biopharma):
|
|
|
|
Three Months Ended
|
||||||||||||
|
|
|
|
|
|
|
|
|
% Change
|
||||||
|
(MILLIONS OF DOLLARS)
|
|
March 31,
2019 |
|
|
April 1,
2018 |
|
|
Total
|
|
|
Oper.
|
|
||
|
U.S.
|
|
$
|
158
|
|
|
$
|
180
|
|
|
(12
|
)
|
|
|
|
|
International
|
|
10
|
|
|
11
|
|
|
(6
|
)
|
|
1
|
|
||
|
Worldwide revenues
|
|
$
|
168
|
|
|
$
|
191
|
|
|
(12
|
)
|
|
(12
|
)
|
The worldwide operational
decline
was primarily driven by competitive pressures in the U.S.
65
|
•
|
Xtandi alliance revenues
(Biopharma): Xtandi is being developed and commercialized through a collaboration with Astellas. The two companies share equally in the gross profits (losses) related to U.S. net sales of Xtandi. Subject to certain exceptions, Pfizer and Astellas also share equally all Xtandi commercialization costs attributable to the U.S. market. Pfizer and Astellas also share certain development and other collaboration expenses, and Pfizer receives tiered royalties as a percentage of international Xtandi net sales (recorded in
Other (income)/deductions—net
).
|
|
|
|
Three Months Ended
|
||||||||||
|
|
|
|
|
|
|
% Change
|
||||||
|
(MILLIONS OF DOLLARS)
|
|
March 31,
2019 |
|
|
April 1,
2018 |
|
|
Total
|
|
Oper.
|
||
|
U.S.
|
|
$
|
168
|
|
|
$
|
159
|
|
|
6
|
|
|
|
International
|
|
—
|
|
|
—
|
|
|
—
|
|
—
|
||
|
Worldwide revenues
|
|
$
|
168
|
|
|
$
|
159
|
|
|
6
|
|
6
|
The
growth
in the U.S. was primarily driven by increased demand for Xtandi in metastatic (mCRPC) and non-metastatic (nmCRPC) castration-resistant prostate cancer, partially offset by higher patient assistance programs (PAP) utilization in the first quarter of 2019, compared to the same period in 2018.
|
•
|
Viagra
(Upjohn):
|
|
|
Three Months Ended
|
|||||||||||||
|
% Change
|
||||||||||||||
|
(MILLIONS OF DOLLARS)
|
March 31,
2019 |
|
April 1,
2018 |
|
Total
|
|
Oper.
|
|
||||||
|
U.S.
|
$
|
40
|
|
$
|
88
|
|
(55
|
)
|
||||||
|
International
|
105
|
|
99
|
|
7
|
|
14
|
|
||||||
|
Worldwide revenues
|
$
|
145
|
|
$
|
187
|
|
(22
|
)
|
(19
|
)
|
||||
The
decline
in the U.S. was primarily due to the loss of exclusivity in December 2017, contributing to lower volumes and pricing pressures.
The operational
growth
internationally was primarily due to increased demand in China driven by investments in geographic expansion, partially offset by pricing pressures in China.
|
•
|
Inflectra/Remsima
(Biopharma):
|
|
|
|
Three Months Ended
|
||||||||||||
|
|
|
|
|
|
|
% Change
|
||||||||
|
(MILLIONS OF DOLLARS)
|
|
March 31,
2019 |
|
|
April 1,
2018 |
|
|
Total
|
|
|
Oper.
|
|
||
|
U.S.
|
|
$
|
57
|
|
|
$
|
55
|
|
|
5
|
|
|
|
|
|
International
|
|
81
|
|
|
90
|
|
|
(10
|
)
|
|
(4
|
)
|
||
|
Worldwide revenues
|
|
$
|
138
|
|
|
$
|
145
|
|
|
(4
|
)
|
|
—
|
|
The worldwide operational decline was due to pricing pressures in certain markets, partially offset by continued uptake in certain channels in the U.S., as well as in certain developed markets in Europe, Canada and Australia.
Inflectra uptake in the U.S. is being driven by a number of factors, including purchases by closed systems (i.e., entities that act as both a purchaser and a payor), which value long-term savings over short-term rebating, and consistent reimbursement in Medicare. To date, reimbursement coverage has been mixed overall. While we achieved 100% Medicare coverage, in the face of exclusionary conduct by J&J, we have experienced access challenges among commercial payers where our lower priced product has not received access at parity to the innovator product. We will continue to work with commercial payers to enable greater access for Inflectra. Additionally, in September 2017, Pfizer filed suit in the U.S. District Court for the Eastern District of Pennsylvania against J&J alleging that J&J’s exclusionary contracts and other anticompetitive practices concerning Remicade® (infliximab) violate federal antitrust laws.
|
•
|
Xalkori
(Biopharma):
|
|
|
Three Months Ended
|
|||||||||||||
|
% Change
|
||||||||||||||
|
(MILLIONS OF DOLLARS)
|
March 31,
2019 |
|
April 1,
2018 |
|
Total
|
|
Oper.
|
|
||||||
|
U.S.
|
$
|
34
|
|
$
|
42
|
|
(19
|
)
|
||||||
|
International
|
88
|
|
110
|
|
(20
|
)
|
(14
|
)
|
||||||
|
Worldwide revenues
|
$
|
123
|
|
$
|
153
|
|
(20
|
)
|
(16
|
)
|
||||
66
The worldwide operational decline was primarily due to volume declines in the ALK indication across certain developed markets, primarily in the U.S. and certain markets in developed Europe, due to competitive pressures.
|
•
|
Inlyta
(Biopharma):
|
|
|
|
Three Months Ended
|
||||||||||||
|
|
|
|
|
|
|
% Change
|
||||||||
|
(MILLIONS OF DOLLARS)
|
|
March 31,
2019 |
|
|
April 1,
2018 |
|
|
Total
|
|
|
Oper.
|
|
||
|
U.S.
|
|
$
|
33
|
|
|
$
|
28
|
|
|
17
|
|
|
|
|
|
International
|
|
40
|
|
|
46
|
|
|
(12
|
)
|
|
(4
|
)
|
||
|
Worldwide revenues
|
|
$
|
73
|
|
|
$
|
74
|
|
|
(1
|
)
|
|
4
|
|
The worldwide operational growth was primarily due to increased demand in the U.S., as well as the impact of inclusion of Inlyta in the National Reimbursement Drug Listing in China at the end of 2018, partially offset by the decline in other developed markets outside the U.S., due to increased competition.
|
•
|
Eucrisa
(Biopharma):
|
|
|
|
Three Months Ended
|
||||||||||||
|
|
|
|
|
|
|
% Change
|
||||||||
|
(MILLIONS OF DOLLARS)
|
|
March 31,
2019 |
|
|
April 1,
2018 |
|
|
Total
|
|
|
Oper.
|
|
||
|
U.S.
|
|
$
|
22
|
|
|
$
|
26
|
|
|
(14
|
)
|
|
|
|
|
International
|
|
—
|
|
|
—
|
|
|
—
|
|
|
—
|
|
||
|
Worldwide revenues
|
|
$
|
22
|
|
|
$
|
26
|
|
|
(12
|
)
|
|
(12
|
)
|
The U.S.
decline
was primarily driven by unfavorable channel mix and a one time nonrecurring favorable rebate adjustment in the first quarter of 2018, partially offset by growth in prescription demand.
|
•
|
Alliance revenues
(Biopharma):
|
|
|
|
Three Months Ended
|
||||||||||
|
|
|
|
|
|
|
% Change
|
||||||
|
(MILLIONS OF DOLLARS)
|
|
March 31,
2019 |
|
|
April 1,
2018 |
|
|
Total
|
|
Oper.
|
||
|
U.S.
|
|
$
|
775
|
|
|
$
|
602
|
|
|
29
|
|
|
|
International
|
|
314
|
|
|
253
|
|
|
24
|
|
31
|
||
|
Worldwide revenues
|
|
$
|
1,090
|
|
|
$
|
855
|
|
|
27
|
|
29
|
The worldwide operational growth was mainly due to increases in Eliquis and Xtandi alliance revenues discussed above.
|
◦
|
Bavencio
(Biopharma) is being developed and commercialized in collaboration with Merck KGaA. Both companies jointly fund the majority of development and commercialization costs, and split equally any profits generated from selling any products containing avelumab from this collaboration. Bavencio is currently approved in metastatic MCC in the U.S., Europe and Japan and select other markets, as well as in second line treatment of locally advanced or metastatic urothelial carcinoma in the U.S.
|
See Notes to Condensed Consolidated Financial Statements––
Note 13C.
Segment, Geographic and Other Revenue Information
:
Other Revenue Information
for additional information regarding the primary indications or class of the selected products discussed above.
See Notes to Condensed Consolidated Financial Statements—
Note 12.
Contingencies and Certain Commitments
for a discussion of recent developments concerning patent and product litigation relating to certain of the products discussed above.
Product Developments—Biopharmaceutical
We continue to invest in R&D to provide potential future sources of revenues through the development of new products, as well as through additional uses for in-line and alliance products. Notwithstanding our efforts, there are no assurances as to when, or if, we will receive regulatory approval for additional indications for existing products or any of our other products in development.
We continue to strengthen our global R&D organization and pursue strategies intended to improve innovation and overall productivity in R&D to achieve a sustainable pipeline that will deliver value in the near term and over time.
For additional information about our R&D organization, see the “Overview of Our Performance, Operating Environment, Strategy and Outlook—Our Strategy—Organizing for Growth” and “—Description of Research and Development Operations” sections of this MD&A.
67
A comprehensive update of Pfizer’s development pipeline was published as of
April 30, 2019
and is available at www.pfizer.com/science/drug-product-pipeline. It includes an overview of our research and a list of compounds in development with targeted indication and phase of development, as well as mechanism of action for some candidates in Phase 1 and all candidates from Phase 2 through registration.
The following series of tables provides information about significant regulatory actions by, and filings pending with, the FDA and regulatory authorities in the EU and Japan, as well as additional indications and new drug candidates in late-stage development.
|
RECENT FDA APPROVALS
|
||
|
PRODUCT
|
INDICATION
|
DATE APPROVED
|
|
Vyndaqel (tafamidis meglumine)
|
Treatment of the cardiomyopathy of wild-type or hereditary transthyretin-mediated amyloidosis (ATTR-CM) in adults to reduce cardiovascular mortality and cardiovascular-related hospitalization
|
May 2019
|
|
Vyndamax (tafamidis)
|
Treatment of the cardiomyopathy of wild-type or hereditary ATTR-CM in adults to reduce cardiovascular mortality and cardiovascular-related hospitalization
|
May 2019
|
|
Trazimera (trastuzumab-qyyp)
(a)
|
A biosimilar to Herceptin
®
(trastuzumab) for all eligible indications of the reference product
|
March 2019
|
|
Daurismo (glasdegib)
|
Treatment of newly-diagnosed acute myeloid leukemia in adult patients who are 75 years or older or who have comorbidities that preclude use of intensive induction chemotherapy
|
November 2018
|
|
Lorbrena (lorlatinib)
|
Treatment of patients with ALK-positive metastatic NSCLC whose disease has progressed on crizotinib and at least one other ALK inhibitor for metastatic disease; or whose disease has progressed on alectinib or ceritinib as the first ALK inhibitor therapy for metastatic disease
|
November 2018
|
|
Talzenna (talazoparib)
|
Treatment of adult patients with deleterious or suspected deleterious germline BRCA-mutated (gBRCAm) human epidermal growth factor receptor 2 (HER2)-negative locally advanced or metastatic breast cancer
|
October 2018
|
|
Vizimpro (dacomitinib)
|
First-line treatment of patients with metastatic non-small cell lung cancer with epidermal growth factor receptor exon 19 deletion or exon 21 L858R substitution mutations as detected by an FDA-approved test, which is being developed in collaboration with SFJ
|
September 2018
|
|
Nivestym (filgrastim-aafi)
(b)
|
A biosimilar to Neupogen
®
(filgrastim) for all eligible indications of the reference product
|
July 2018
|
|
Xtandi (enzalutamide)
|
Treatment of men with non-metastatic castration-resistant prostate cancer, which is being developed through a collaboration with Astellas
|
July 2018
|
|
Xeljanz (tofacitinib)
|
Treatment of adult patients with moderately to severely active UC
|
May 2018
|
|
Retacrit (epoetin alfa-epbx)
(c)
|
A biosimilar to Epogen® and Procrit® (epoetin alfa) for all indications of the reference product
|
May 2018
|
|
(a)
|
Herceptin
®
is a registered trademark of Genentech, Inc.
|
|
(b)
|
Neupogen® is a registered trademark of Amgen Inc.
|
|
(c)
|
Epogen® is a registered U.S. trademark of Amgen Inc.; Procrit® is a registered U.S. trademark of J&J.
|
|
PENDING U.S. NDAs AND SUPPLEMENTAL FILINGS
|
||
|
PRODUCT
|
PROPOSED INDICATION
|
DATE FILED*
|
|
Bavencio (avelumab)
|
A monoclonal antibody that inhibits PD-L1, in combination with Inlyta (axitinib), a tyrosine kinase inhibitor, for the first-line treatment of advanced renal cell carcinoma, which is being developed in collaboration with Merck KGaA, Germany
|
February 2019
|
|
PF-06410293
(a)
|
A potential biosimilar to Humira® (adalimumab)
|
January 2019
|
|
PF-05280586
(b)
|
A potential biosimilar to Rituxan® (rituximab)
|
September 2018
|
|
PF-06439535
(c)
|
A potential biosimilar to Avastin® (bevacizumab)
|
August 2018
|
|
Vyndaqel (tafamidis meglumine)
(d)
|
Treatment of transthyretin familial amyloid polyneuropathy
|
February 2012
|
|
*
|
The dates set forth in this column are the dates on which the FDA accepted our submissions.
|
|
(a)
|
Humira
®
is a registered trademark of AbbVie Biotechnology Ltd.
|
|
(b)
|
Rituxan
®
is a registered trademark of Biogen MA Inc.
|
|
(c)
|
Avastin
®
is a registered trademark of Genentech, Inc.
|
|
(d)
|
In May 2012, the FDA’s Peripheral and Central Nervous System Drugs Advisory Committee voted that the tafamidis meglumine data provide substantial evidence of efficacy for a surrogate endpoint that is reasonably likely to predict a clinical benefit. In June 2012, the FDA issued a “complete response” letter with respect to this tafamidis NDA. The FDA has requested the completion of a second efficacy study, and also has asked for additional information on the data within the current tafamidis NDA. Pfizer has completed study B3461028, a global Phase 3 study to support the new indication of transthyretin amyloid cardiomyopathy, which includes patients with wild type and variant transthyretin. We are working with the FDA to identify next steps.
|
68
|
REGULATORY APPROVALS AND FILINGS IN THE EU AND JAPAN
|
|||
|
PRODUCT
|
DESCRIPTION OF EVENT
|
DATE APPROVED
|
DATE FILED*
|
|
Lorviqua (lorlatinib)
|
Application approved in the EU as monotherapy, for the treatment of adult patients with ALK- positive advanced non-small cell lung cancer whose disease has progressed after:
•
alectinib or ceritinib as the first ALK tyrosine kinase inhibitor (TKI) therapy; or
•
crizotinib and at least one other ALK TKI
|
May 2019
|
—
|
|
Vizimpro (dacomitinib)
|
Application approved in the EU as monotherapy for the first-line treatment of adult patients with locally advanced or metastatic non-small cell lung cancer with EGFR activating mutations, which is being developed in collaboration with SFJ
|
April 2019
|
—
|
|
Bavencio (avelumab)
|
Application filed in the EU for Bavencio (avelumab) in combination with Inlyta (axitinib) for the first-line treatment of advanced renal cell carcinoma, which is being developed in collaboration with Merck KGaA, Germany
|
—
|
March 2019
|
|
Vyndaqel (tafamidis meglumine)
|
Application approved in Japan for treatment of transthyretin amyloid cardiomyopathy
|
March 2019
|
—
|
|
Zirabev
(a)
|
Application approved in the EU for a biosimilar to Avastin® (bevacizumab) for the treatment of metastatic carcinoma of the colon or rectum, metastatic breast cancer, unresectable advanced, metastatic or recurrent NSCLC, advanced and/or metastatic renal cell cancer and persistent, recurrent, or metastatic carcinoma of the cervix
|
February 2019
|
—
|
|
Vyndaqel (tafamidis free acid)
|
Application filed in the EU for the treatment of adults with transthyretin amyloid cardiomyopathy
|
—
|
January 2019
|
|
Bavencio (avelumab)
|
Application filed in Japan for Bavencio (avelumab) in combination with Inlyta (axitinib) for the first-line treatment of advanced renal cell carcinoma, which is being developed in collaboration with Merck KGaA, Germany
|
—
|
January 2019
|
|
Vizimpro (dacomitinib)
|
Application approved in Japan for the treatment of patients with locally advanced or metastatic non-small cell lung cancer with EGFR mutations, which is being developed in collaboration with SFJ
|
January 2019
|
—
|
|
PF-06410293
(b)
|
Application filed in the EU for a potential biosimilar to Humira® (adalimumab)
|
—
|
November 2018
|
|
Xtandi (enzalutamide)
|
Application approved in the EU for treatment of adult men with high-risk non-metastatic castration-resistant prostate cancer, which is being developed through a collaboration with Astellas
|
October 2018
|
—
|
|
Trastuzumab BS for IV Infusion 60mg/150mg “Pfizer”
(c)
|
Application approved in Japan for a biosimilar to Herceptin® (trastuzumab)
|
September 2018
|
—
|
|
Lorbrena (lorlatinib)
|
Application approved in Japan for the treatment of patients with ALK-positive metastatic non-small cell lung cancer, previously treated with one or more ALK inhibitor
|
September 2018
|
—
|
|
PF-05280586
(d)
|
Application filed in the EU for a potential biosimilar to Rituxan® (rituximab)
|
—
|
August 2018
|
|
Xeljanz (tofacitinib)
|
Application approved in the EU for the treatment of adult patients with moderately to severely active UC who have had an inadequate response, lost response, or were intolerant to either conventional therapy or a biologic agent
|
July 2018
|
—
|
|
Trazimera
(c)
|
Application approved in the EU for a biosimilar to Herceptin® (trastuzumab) for the treatment of human epidermal growth factor (HER2) overexpressing breast cancer and HER2 overexpressing metastatic gastric or gastroesophageal junction adenocarcinoma
|
July 2018
|
—
|
|
Infliximab BS for IV Infusion 100mg “Pfizer”
(e)
|
Application approved in Japan for a biosimilar to Remicade® (infliximab)
|
July 2018
|
—
|
|
Xeljanz (tofacitinib)
|
Application approved in the EU for Xeljanz in combination with methotrexate for the treatment of active PsA in adult patients who have had an inadequate response or who have been intolerant to a prior disease-modifying antirheumatic drug therapy
|
June 2018
|
—
|
|
talazoparib
(f)
|
Application filed in the EU for the treatment of patients with germline BRCA-mutated advanced breast cancer
|
—
|
June 2018
|
|
Xeljanz (tofacitinib)
|
Application approved in Japan for the treatment of UC
|
May 2018
|
—
|
|
crisaborole
|
Application filed in the EU for the treatment of mild-to-moderate atopic dermatitis
|
—
|
May 2018
|
|
Xeljanz (tofacitinib)
|
Application filed in the EU for modified release 11mg tablet for RA
|
—
|
March 2018
|
|
*
|
For applications in the EU, the dates set forth in this column are the dates on which the EMA validated our submissions.
|
|
(a)
|
Avastin
®
is a registered trademark of Genentech, Inc.
|
|
(b)
|
Humira
®
is a registered trademark of AbbVie Biotechnology Ltd.
|
|
(c)
|
Herceptin
®
is a registered trademark of Genentech, Inc.
|
|
(d)
|
Rituxan
®
is a registered trademark of Biogen MA Inc.
|
|
(e)
|
Remicade
®
is a registered Japan trademark of Janssen. In February 2016, we divested the rights for development and commercialization of PF-06438179, a potential biosimilar to Remicade
®
(infliximab) in the 28 countries that form the EEA to Sandoz, which was a condition to the European Commission’s approval of the Hospira transaction. We retain commercialization rights to PF-06438179 in all countries outside of the EEA.
|
|
(f)
|
In April 2019, the EMA’s Committee for Medicinal Products for Human Use adopted a positive opinion recommending marketing authorization for talazoparib as monotherapy for the treatment of adult patients with germline breast cancer susceptibility gene (
gBRCA
) 1/2-mutations, who have human epidermal growth factor receptor 2-negative (HER2-) locally advanced (LA) or metastatic breast cancer (MBC).
|
69
|
LATE-STAGE CLINICAL PROGRAMS FOR ADDITIONAL USES AND DOSAGE FORMS
FOR IN-LINE AND IN-REGISTRATION PRODUCTS |
|
|
PRODUCT
|
PROPOSED INDICATION
|
|
Bavencio (avelumab)
|
A monoclonal antibody that inhibits PD-L1 for the first-line treatment of stage IIIb/IV non-small cell lung
cancer, which is being developed in collaboration with Merck KGaA, Germany |
|
Bavencio (avelumab)
|
A monoclonal antibody that inhibits PD-L1 for maintenance treatment, in the first-line setting, for patients
with urothelial cancer, which is being developed in collaboration with Merck KGaA, Germany |
|
Bavencio (avelumab)
|
A monoclonal antibody that inhibits PD-L1 for maintenance treatment of advanced or metastatic gastric/
gastro-esophageal junction cancers, which is being developed in collaboration with Merck KGaA, Germany |
|
Bavencio (avelumab)
|
A monoclonal antibody that inhibits PD-L1 for treatment of locally advanced squamous cell carcinoma of the
head and neck, which is being developed in collaboration with Merck KGaA, Germany |
|
Daurismo (glasdegib)
|
A smoothened inhibitor, in combination with azacitidine, for the treatment of acute myeloid leukemia
|
|
Ibrance (palbociclib)
|
Treatment of HER2+ advanced breast cancer, in collaboration with the Alliance Foundation Trials, LLC
|
|
Ibrance (palbociclib)
|
Treatment of high-risk early breast cancer, in collaboration with the German Breast Group
|
|
Ibrance (palbociclib)
|
Treatment of HR+ early breast cancer, in collaboration with the Alliance Foundation Trials, LLC, and the Austrian Breast Colorectal Cancer Study Group
|
|
Lorbrena (lorlatinib)
|
A next generation ALK/ROS1 tyrosine kinase inhibitor for the first-line treatment of patients with ALK-positive advanced non-small cell lung cancer
|
|
Xeljanz (tofacitinib)
|
Treatment of ankylosing spondylitis
|
|
Xtandi (enzalutamide)
|
Treatment of non-metastatic hormone-sensitive prostate cancer, which is being developed through a collaboration with Astellas
|
|
Xtandi (enzalutamide)
|
Treatment of metastatic hormone-sensitive prostate cancer, which is being developed through a collaboration with Astellas
|
|
Talzenna (talazoparib)
|
An oral PARP inhibitor, in combination with Xtandi (enzalutamide), for the treatment of metastatic castration-resistant prostate cancer
|
In March 2019, we and our partner Merck KGaA, Germany, announced the discontinuation of the Phase III JAVELIN Ovarian PARP 100 study evaluating the efficacy and safety of avelumab in combination with chemotherapy followed by maintenance therapy of avelumab in combination with talazoparib, versus an active comparator in treatment-naïve patients with locally advanced or metastatic ovarian cancer (Stage III or Stage IV). The alliance has notified health authorities and trial investigators of the decision to discontinue the trial. The decision was based on several emerging factors since the trial's initiation, including the previously announced interim results from JAVELIN Ovarian PARP 100. The alliance determined that the degree of benefit observed with avelumab in frontline ovarian cancer in that study does not support continuation of the JAVELIN Ovarian PARP 100 trial in an unselected patient population and emphasizes the need to better understand the role of immunotherapy in ovarian cancer. Additional factors include the rapidly changing treatment landscape and the approval of a PARP inhibitor in the frontline maintenance setting. The decision to discontinue the JAVELIN Ovarian PARP 100 trial was not made for safety reasons.
In February 2019, the company took steps to transition rheumatoid arthritis study patients who were on tofacitinib 10 mg twice daily to tofacitinib 5 mg twice daily in the FDA post-marketing requirement study A3921133, a study performed in patients considered to be at high risk for certain side effects. This action was taken as the result of notification from the tofacitinib Rheumatology Data Safety Monitoring Board of a safety signal regarding the tofacitinib 10 mg twice daily treatment arm in study A3921133. The 5 mg twice daily dose is the FDA approved dose in the U.S. for adult patients with moderate to severe rheumatoid arthritis. We continue to evaluate the information.
|
NEW DRUG CANDIDATES IN LATE-STAGE DEVELOPMENT
|
|
|
CANDIDATE
|
PROPOSED INDICATION
|
|
aztreonam-avibactam
(PF-06947387) |
A beta lactam/beta lactamase inhibitor for the treatment of patients with infections caused by Gram-negative bacteria, including those that produce metallo-beta-lactamases, for which there are limited or no treatment options
|
|
fidanacogene elaparvovec (PF-06838435)
|
An investigational gene therapy for the treatment of hemophilia B
|
|
PF-06482077
|
A 20-Valent pneumococcal conjugate vaccine for the prevention of invasive pneumococcal disease and pneumonia caused by Streptococcus pneumoniae serotypes covered by the vaccine in adults 18 years of age and older
|
|
PF-06651600
|
A Janus kinase 3 (JAK3) inhibitor for the treatment of patients with moderate to severe alopecia areata
|
|
PF-04965842
|
A Janus kinase 1 (JAK1) inhibitor for the treatment of moderate-to-severe atopic dermatitis
|
|
PF-06425090
|
A prophylactic vaccine for active immunization to prevent clostridium difficile disease
|
|
rivipansel (GMI-1070)
|
A pan-selectin inhibitor for the treatment of acute vaso-occlusive crises associated with sickle cell disease in patients aged 6 years and above, which was licensed from GlycoMimetics Inc.
|
|
somatrogon (PF-06836922)
|
A long-acting hGH-CTP for the treatment of growth hormone deficiency in children, which is being developed in collaboration with OPKO
|
|
somatrogon (PF-06836922)
|
A long-acting hGH-CTP for the treatment of growth hormone deficiency in adults, which is being developed in collaboration with OPKO
|
|
tanezumab
|
An anti-nerve growth factor monoclonal antibody for the treatment of pain, which is being developed in collaboration with Lilly
|
Additional product-related programs are in various stages of discovery and development.
70
Costs and Expenses
Cost of Sales
|
|
Three Months Ended
|
||||||||||
|
(MILLIONS OF DOLLARS)
|
March 31,
2019 |
|
April 1,
2018 |
|
%
Change
|
|
|||||
|
Cost of sales
|
$
|
2,433
|
|
$
|
2,563
|
|
(5
|
)
|
|||
|
As a percentage of
Revenues
|
18.5
|
%
|
19.9
|
%
|
|||||||
Cost of sales
decrease
d
$130 million
, or
5%
, in the
first
quarter of
2019
, compared to the same period in
2018
, primarily due to:
|
•
|
the favorable impact of foreign exchange of
$212 million
; and
|
|
•
|
the favorable impact of hedging activity on intercompany inventory of
$73 million
,
|
partially offset by:
|
•
|
net increased sales volumes, primarily in the U.S., China and Japan; and
|
|
•
|
an unfavorable change in product mix.
|
The
decrease
in
Cost of sales
as a percentage of revenues in the
first
quarter of
2019
, compared to the same period in
2018
, was primarily due to all of the factors discussed above, as well as an increase in alliance revenues, which have no associated cost of sales.
Selling, Informational and Administrative (SI&A) Expenses
|
|
Three Months Ended
|
||||||||||
|
(MILLIONS OF DOLLARS)
|
March 31,
2019 |
|
April 1,
2018 |
|
%
Change |
|
|||||
|
Selling, informational and administrative expenses
|
$
|
3,339
|
|
$
|
3,412
|
|
(2
|
)
|
|||
|
As a percentage of
Revenues
|
25.5
|
%
|
26.4
|
%
|
|||||||
SI&A expenses
decreased
$73 million
, or
2%
, in the first quarter of
2019
, compared to the same period in
2018
, primarily due to:
|
•
|
lower advertising, promotional and field force expenses in developed markets, primarily related to Lyrica in the U.S.;
|
|
•
|
the non-recurrence of a special, one-time bonus paid to virtually all Pfizer colleagues, excluding executives, of
$108 million
, in the aggregate, in the first quarter of 2018; and
|
|
•
|
the favorable impact of foreign exchange of $88 million,
|
partially offset by:
|
•
|
additional investment across several of our products, primarily Xeljanz, Eliquis and Vyndaqel;
|
|
•
|
the non-recurrence of a favorable true-up of healthcare reform expenses in the first quarter of 2018; and
|
|
•
|
additional investments in China.
|
Research and Development (R&D) Expenses
|
|
Three Months Ended
|
||||||||||
|
(MILLIONS OF DOLLARS)
|
March 31,
2019 |
|
April 1,
2018 |
|
%
Change |
|
|||||
|
Research and development expenses
|
$
|
1,703
|
|
$
|
1,743
|
|
(2
|
)
|
|||
|
As a percentage of
Revenues
|
13.0
|
%
|
13.5
|
%
|
|
|
|||||
R&D expenses
decrease
d
$41 million
, or
2%
, in the
first
quarter of
2019
, compared to the same period in
2018
, primarily due to:
|
•
|
decreased spending on our Oncology portfolio, as select programs have reached completion;
|
|
•
|
decreased costs due to timing of ongoing worldwide R&D projects and realized benefits of cost savings initiatives;
|
|
•
|
the discontinuation of the Staphylococcus aureus vaccine trial; and
|
|
•
|
the favorable impact of foreign exchange,
|
partially offset by:
|
•
|
increased investments towards building new capabilities and driving automation; and
|
|
•
|
the timing of milestone activity.
|
71
For additional information on Cost of sales, SI&A and R&D expenses by operating segment, see the “Analysis of Operating Segment Information” section of this MD&A.
Amortization of Intangible Assets
|
|
Three Months Ended
|
||||||||||
|
(MILLIONS OF DOLLARS)
|
March 31,
2019 |
|
April 1,
2018 |
|
%
Change |
|
|||||
|
Amortization of intangible assets
|
$
|
1,183
|
|
$
|
1,196
|
|
(1
|
)
|
|||
|
As a percentage of
Revenues
|
9.0
|
%
|
9.3
|
%
|
|||||||
See also Notes to Condensed Consolidated Financial Statements—
Note 9A. Identifiable Intangible Assets and Goodwill: Identifiable Intangible Assets.
Restructuring Charges and Other Costs Associated with Acquisitions and Cost-Reduction/Productivity Initiatives
|
|
Three Months Ended
|
||||||||||
|
(MILLIONS OF DOLLARS)
|
March 31,
2019 |
|
April 1,
2018 |
|
%
Change |
|
|||||
|
Restructuring credits—acquisition-related costs
(a)
|
$
|
(9
|
)
|
$
|
(8
|
)
|
14
|
|
|||
|
Restructuring charges/(credits)—cost reduction initiatives
(b)
|
19
|
|
(2
|
)
|
*
|
|
|||||
|
Restructuring charges/(credits)
|
10
|
|
(9
|
)
|
*
|
|
|||||
|
Integration costs
(c)
|
36
|
|
52
|
|
(32
|
)
|
|||||
|
Restructuring charges and certain acquisition-related costs
|
46
|
|
43
|
|
7
|
|
|||||
|
Net periodic benefit costs
|
6
|
|
32
|
|
(80
|
)
|
|||||
|
Additional depreciation—asset restructuring
|
13
|
|
17
|
|
(25
|
)
|
|||||
|
Total implementation costs
|
26
|
|
39
|
|
(32
|
)
|
|||||
|
Costs associated with acquisitions and cost-reduction/productivity initiatives
(d)
|
$
|
92
|
|
$
|
131
|
|
(30
|
)
|
|||
|
* Calculation not meaningful or results are equal to or greater than 100%.
|
|||||||||||
|
(a)
|
Restructuring credits––acquisition-related costs include employee termination costs, asset impairments and other exit costs associated with business combinations. Credits for the
first quarter
of
2019
were due to the reversal of previously recorded accruals for employee termination costs and asset impairments related to our acquisition of Hospira. Credits for the
first quarter
of
2018
were
primarily due to the reversal of previously recorded accruals for exit costs related to our ac
quisition of Hospira.
|
|
(b)
|
Restructuring charges/(credits)––cost reduction initiatives relate to employee termination costs, asset impairments and other exit costs not associated with acquisitions. For the
first quarter
of
2019
,
the charges were primarily related to asset write downs.
For the first quarter of 2018, the credits were mostly related to reserve releases for cost-reduction programs, partially offset by exit costs.
|
|
(c)
|
For additional information, see Notes to Condensed Consolidated Financial Statements—
Note 3.
Restructuring Charges and Other Costs Associated with Acquisitions and Cost-Reduction/Productivity Initiatives
.
|
|
(d)
|
Comprises
Restructuring charges and certain acquisition-related costs
as well as costs associated with our cost-reduction/productivity initiatives included in
Cost of sales
,
Research and development expenses,
Selling, informational and administrative expenses
and/or
Other (income)/deductions––net
as appropriate. For additional information, see Notes to Condensed Consolidated Financial Statements—
Note 3.
Restructuring Charges and Other Costs Associated with Acquisitions and Cost-Reduction/Productivity Initiatives
.
|
2017-2019 Initiatives and Organizing for Growth
During 2018, as we reviewed our business opportunities and challenges and the way in which we think about our business operations, we determined that at the start of our 2019 fiscal year, we would begin operating under our new commercial structure, which reorganizes our operations into three businesses
––
Biopharma,
a science-based innovative medicines business; Upjohn, a global, primarily off-patent branded and generic established medicines business; and a Consumer Healthcare business. To operate effectively in this structure and position ourselves for future growth, we are focused on creating a simpler, more efficient operating structure within each business as well as the functions that support them. Beginning in the fourth quarter of 2018, we reviewed previously planned initiatives and new initiatives to ensure that there was alignment around our new structure and have combined the 2017-2019 initiatives with our current Organizing for Growth initiatives to form one cohesive plan. For the combined programs, to achieve targeted savings of approximately
$1.9 billion
, we expect to incur approximately
$2.2 billion
in costs over the three-year period 2017-2019. Of this amount, we expect approximately
50%
to be related to manufacturing operations, and we expect approximately
20%
of the charges to be non-cash. Anticipated savings through 2020 associated with the Organizing for Growth initiatives of approximately
$500 million
will be reinvested in our R&D pipeline and in selling and marketing to support our current and recently launched products and indications. For additional information about these programs and expected and actual total costs, see Notes to Condensed Consolidated Financial Statements—
Note 3.
Restructuring Charges and Other Costs Associated with Acquisitions and Cost-Reduction/Productivity Initiatives
.
72
In addition to these major initiatives, we continuously monitor our operations for cost reduction and/or productivity opportunities, especially in light of the losses of exclusivity and the expiration of collaborative arrangements for various products.
Other (Income)/Deductions—Net
|
|
Three Months Ended
|
|||||||||
|
(MILLIONS OF DOLLARS)
|
March 31,
2019 |
|
April 1,
2018 |
|
%
Change |
|||||
|
Other (income)/deductions––net
|
$
|
92
|
|
$
|
(178
|
)
|
*
|
|||
|
* Calculation not meaningful or results are equal to or greater than 100%.
|
||||||||||
For information about the components of
Other (income)/deductions—net
, see Notes to Condensed Consolidated Financial Statements—
Note 4.
Other (Income)/Deductions—Net
.
See also the “Analysis of Operating Segment Information” section of this MD&A.
Provision for Taxes on Income
|
|
Three Months Ended
|
||||||||||
|
(MILLIONS OF DOLLARS)
|
March 31,
2019 |
|
April 1,
2018 |
|
%
Change |
|
|||||
|
Provision for taxes on income
|
$
|
433
|
|
$
|
556
|
|
(22
|
)
|
|||
|
Effective tax rate on continuing operations
|
10.0
|
%
|
13.5
|
%
|
|||||||
For information about our effective tax rate and the events and circumstances contributing to the changes between periods, see Notes to Condensed Consolidated Financial Statements—
Note 5.
Tax Matters
.
Non-GAAP Financial Measure (Adjusted Income)
General Description of Non-GAAP Financial Measure (Adjusted Income)
Adjusted income is an alternative view of performance used by management. We measure the performance of the overall Company on this basis in conjunction with other performance metrics. Because Adjusted income is an important internal measurement for Pfizer, we believe that investors’ understanding of our performance is enhanced by disclosing this performance measure. We report Adjusted income, certain components of Adjusted income, and Adjusted diluted earnings per share in order to portray the results of our major operations––the discovery, development, manufacture, marketing and sale of prescription medicines, vaccines and consumer healthcare (OTC) products––prior to considering certain income statement elements. We have defined Adjusted income as
Net income attributable to Pfizer Inc.
before the impact of purchase accounting for acquisitions, acquisition-related costs, discontinued operations and certain significant items, which are described below. Also, see the “Non-GAAP Financial Measure (Adjusted Income)––General Description of Non-GAAP Financial Measure (Adjusted Income)” section of our
2018
Financial Report for additional information.
Similarly, we have defined the Adjusted income components as
Cost of sales, Selling, informational and administrative expenses, Research and development expenses, Amortization of intangible assets
and
Other (income)/deductions––net
each before the impact of purchase accounting for acquisitions, acquisition-related costs and certain significant items. We have defined Adjusted diluted earnings per share as
Earnings per common share attributable to Pfizer Inc.––diluted
before the impact of purchase accounting for acquisitions, acquisition-related costs, discontinued operations and certain significant items. The Adjusted income measure, the Adjusted income component measures and the Adjusted diluted earnings per share measure are not, and should not be viewed as, substitutes for U.S. GAAP net income, U.S. GAAP net income components or U.S. GAAP diluted earnings per share.
The following are examples of how the Adjusted income and Adjusted diluted earnings per share measures are utilized:
|
•
|
senior management receives a monthly analysis of our operating results that is prepared on an Adjusted income and Adjusted diluted earnings per share basis;
|
|
•
|
our annual budgets are prepared on an Adjusted income and Adjusted diluted earnings per share basis; and
|
|
•
|
senior management’s annual compensation is derived, in part, using Adjusted income and Adjusted diluted earnings per share measures.
|
See the “Non-GAAP Financial Measure (Adjusted Income)––General Description of Non-GAAP Financial Measure (Adjusted Income)” section of our
2018
Financial Report for additional information.
Adjusted income and its components and Adjusted diluted earnings per share are non-GAAP financial measures that have no standardized meaning prescribed by U.S. GAAP and, therefore, are limited in their usefulness to investors. Because of their non-standardized definitions, Adjusted income and its components (unlike U.S. GAAP net income and its components) and
73
Adjusted diluted earnings per share (unlike U.S. GAAP diluted earnings per share) may not be comparable to the calculation of similar measures of other companies. Adjusted income and its components and Adjusted diluted earnings per share are presented solely to permit investors to more fully understand how management assesses performance.
We also recognize that, as internal measures of performance, the Adjusted income and its components and Adjusted diluted earnings per share measures have limitations, and we do not restrict our performance-management process solely to these metrics. A limitation of these measures is that they provide a view of our operations without including all events during a period, such as the effects of an acquisition or amortization of purchased intangibles, and do not provide a comparable view of our performance to other companies in the biopharmaceutical industry. We also use other specifically tailored tools designed to achieve the highest levels of performance. For example, our R&D organization has productivity targets, upon which its effectiveness is measured. In addition, total shareholder return, both on an absolute basis and relative to a publicly-traded pharmaceutical index, plays a significant role in determining payouts under certain of Pfizer’s long-term incentive compensation plans.
See the accompanying reconciliations of certain GAAP reported to non-GAAP adjusted information for the
first quarter
of
2019
and
2018
below.
Purchase Accounting Adjustments
Adjusted income is calculated prior to considering certain significant purchase accounting impacts resulting from business combinations and net asset acquisitions. These impacts, primarily associated with Wyeth (acquired in 2009), Hospira (acquired in 2015), Anacor (acquired in June 2016) and Medivation (acquired in September 2016), can include the incremental charge to cost of sales from the sale of acquired inventory that was written up to fair value, amortization related to the increase in fair value of the acquired finite-lived intangible assets, and to a much lesser extent, depreciation related to the increase/decrease in fair value of the acquired fixed assets (primarily manufacturing facilities), amortization related to the increase in fair value of acquired debt, and the fair value changes associated with contingent consideration. Therefore, the Adjusted income measure includes the revenues earned upon the sale of the acquired products without considering the acquisition cost of those products.
Acquisition-Related Costs
Adjusted income is calculated prior to considering transaction, integration, restructuring and additional depreciation costs associated with business combinations because these costs are unique to each transaction and represent costs that were incurred to restructure and integrate two businesses as a result of the acquisition decision. For additional clarity, only transaction costs, additional depreciation and restructuring and integration activities that are associated with a business combination or a net-asset acquisition are included in acquisition-related costs. We have made no adjustments for the resulting synergies.
Discontinued Operations
Adjusted income is calculated prior to considering the results of operations included in discontinued operations, as well as any related gains or losses on the disposal of such operations.
Certain Significant Items
Adjusted income is calculated prior to considering certain significant items. Certain significant items represent substantive and/or unusual items that are evaluated on an individual basis. Such evaluation considers both the quantitative and the qualitative aspects of their nature. Certain significant items may be highly variable and difficult to predict. Furthermore, in some cases it is reasonably possible that they could reoccur in future periods. For example, major non-acquisition-related cost-reduction programs stand on their own as they are specific to an event or goal with a defined term, but we may have subsequent programs based on reorganizations of the business, cost productivity or in response to loss of exclusivity or economic conditions. Legal charges to resolve litigation are also related to specific cases, which are facts and circumstances specific and, in some cases, may also be the result of litigation matters at acquired companies that were inestimable, not probable or unresolved at the date of acquisition. Unusual items may represent items that are not part of our ongoing business; items that, either as a result of their nature or size, we would not expect to occur as part of our normal business on a regular basis; items that would be non-recurring; or items that relate to products we no longer sell. While not all-inclusive, examples of items that could be included as certain significant items would be a major non-acquisition-related restructuring charge and associated implementation costs; amounts related to certain disposals of businesses, products or facilities that do not qualify as discontinued operations under U.S. GAAP; certain intangible asset impairments; adjustments related to the resolution of certain tax positions; the impact of adopting certain significant, event-driven tax legislation, such as the TCJA discussed in Notes to Condensed Consolidated Financial Statements—
Note 5A. Tax Matters: Taxes on Income from Continuing Operations
;
or charges related to certain legal matters, such as certain of those discussed in Notes to Condensed Consolidated Financial Statements—
Note 12A.
Contingencies
74
and Certain Commitments
: Legal Proceedings,
included in Part I, Item 1 of this Quarterly Report on Form 10-Q. Normal, ongoing defense costs of the Company or settlements of and accruals for legal matters made in the normal course of our business would not be considered certain significant items.
Beginning in 2019, we exclude the net gains and losses on investments in equity securities from our measure of Adjusted income because of their inherent volatility, which we do not control and cannot predict with any level of certainty and because we do not believe that including these gains and losses assists investors in understanding our business or is reflective of our core operations and business. We have revised Adjusted income and Adjusted diluted EPS for the first quarter of 2018 to conform with our 2019 presentation.
Reconciliations of GAAP Reported to Non-GAAP Adjusted Information––Certain Line Items
|
|
Three Months Ended March 31, 2019
|
|||||||||||||||||||||||
|
IN MILLIONS, EXCEPT PER COMMON SHARE DATA
|
GAAP Reported
|
|
Purchase Accounting Adjustments
(a)
|
|
Acquisition-Related Costs
(a)
|
|
Discontinued Operations
(a)
|
|
Certain Significant Items
(a)
|
|
Non-GAAP Adjusted
|
|
||||||||||||
|
Revenues
|
$
|
13,118
|
|
$
|
—
|
|
$
|
—
|
|
$
|
—
|
|
$
|
—
|
|
$
|
13,118
|
|
||||||
|
Cost of sales
|
2,433
|
|
4
|
|
—
|
|
—
|
|
(22
|
)
|
2,415
|
|
||||||||||||
|
Selling, informational and administrative expenses
|
3,339
|
|
1
|
|
(1
|
)
|
—
|
|
(27
|
)
|
3,311
|
|
||||||||||||
|
Research and development expenses
|
1,703
|
|
1
|
|
—
|
|
—
|
|
(11
|
)
|
1,693
|
|
||||||||||||
|
Amortization of intangible assets
|
1,183
|
|
(1,120
|
)
|
—
|
|
—
|
|
—
|
|
63
|
|
||||||||||||
|
Restructuring charges and certain acquisition-related costs
|
46
|
|
—
|
|
(27
|
)
|
—
|
|
(19
|
)
|
—
|
|
||||||||||||
|
Other (income)/deductions––net
|
92
|
|
76
|
|
—
|
|
—
|
|
(303
|
)
|
(135
|
)
|
||||||||||||
|
Income from continuing operations before provision for taxes on income
|
4,323
|
|
1,038
|
|
28
|
|
—
|
|
382
|
|
5,771
|
|
||||||||||||
|
Provision for taxes on income
(b)
|
433
|
|
224
|
|
5
|
|
—
|
|
212
|
|
875
|
|
||||||||||||
|
Income from continuing operations
|
3,889
|
|
814
|
|
23
|
|
—
|
|
171
|
|
4,896
|
|
||||||||||||
|
Discontinued operations––net of tax
|
—
|
|
—
|
|
—
|
|
—
|
|
—
|
|
—
|
|
||||||||||||
|
Net income attributable to noncontrolling interests
|
6
|
|
—
|
|
—
|
|
—
|
|
—
|
|
6
|
|
||||||||||||
|
Net income attributable to Pfizer Inc.
|
3,884
|
|
814
|
|
23
|
|
—
|
|
171
|
|
4,891
|
|
||||||||||||
|
Earnings per common share attributable to Pfizer Inc.––diluted
|
0.68
|
|
0.14
|
|
—
|
|
—
|
|
0.03
|
|
0.85
|
|
||||||||||||
See end of tables for notes
(a)
and
(b)
.
75
|
|
Three Months Ended April 1, 2018
|
|||||||||||||||||||||||
|
IN MILLIONS, EXCEPT PER COMMON SHARE DATA
|
GAAP Reported
|
|
Purchase Accounting Adjustments
(a)
|
|
Acquisition-Related Costs
(a)
|
|
Discontinued Operations
(a)
|
|
Certain Significant Items
(a)
|
|
Non-GAAP Adjusted
|
|
||||||||||||
|
Revenues
|
$
|
12,906
|
|
$
|
—
|
|
$
|
—
|
|
$
|
—
|
|
$
|
—
|
|
$
|
12,906
|
|
||||||
|
Cost of sales
|
2,563
|
|
(1
|
)
|
(3
|
)
|
—
|
|
(23
|
)
|
2,536
|
|
||||||||||||
|
Selling, informational and administrative expenses
|
3,412
|
|
—
|
|
—
|
|
—
|
|
(126
|
)
|
3,286
|
|
||||||||||||
|
Research and development expenses
|
1,743
|
|
1
|
|
—
|
|
—
|
|
(6
|
)
|
1,739
|
|
||||||||||||
|
Amortization of intangible assets
|
1,196
|
|
(1,126
|
)
|
—
|
|
—
|
|
—
|
|
71
|
|
||||||||||||
|
Restructuring charges and certain acquisition-related costs
|
43
|
|
—
|
|
(45
|
)
|
—
|
|
2
|
|
—
|
|
||||||||||||
|
Other (income)/deductions––net
|
(178
|
)
|
(96
|
)
|
—
|
|
—
|
|
70
|
|
(204
|
)
|
||||||||||||
|
Income from continuing operations before provision for taxes on income
|
4,127
|
|
1,221
|
|
48
|
|
—
|
|
83
|
|
5,479
|
|
||||||||||||
|
Provision for taxes on income
(b)
|
556
|
|
239
|
|
8
|
|
—
|
|
112
|
|
915
|
|
||||||||||||
|
Income from continuing operations
|
3,571
|
|
982
|
|
40
|
|
—
|
|
(29
|
)
|
4,564
|
|
||||||||||||
|
Discontinued operations––net of tax
|
(1
|
)
|
—
|
|
—
|
|
1
|
|
—
|
|
—
|
|
||||||||||||
|
Net income attributable to noncontrolling interests
|
9
|
|
—
|
|
—
|
|
—
|
|
—
|
|
9
|
|
||||||||||||
|
Net income attributable to Pfizer Inc.
|
3,561
|
|
982
|
|
40
|
|
1
|
|
(29
|
)
|
4,555
|
|
||||||||||||
|
Earnings per common share attributable to Pfizer Inc.––diluted
|
0.59
|
|
0.16
|
|
0.01
|
|
—
|
|
—
|
|
0.75
|
|
||||||||||||
|
(a)
|
For details of adjustments, see “Details of Income Statement Items Included in GAAP Reported but Excluded from Non-GAAP Adjusted Income” below.
|
|
(b)
|
The effective tax rate on Non-GAAP Adjusted income was
15.2%
in the
first quarter
of
2019
, compared to
16.7%
in the
first quarter
of
2018
. The decrease was primarily due to a favorable change in the jurisdictional mix of earnings as a result of operating fluctuations in the normal course of business, as well as an increase in tax benefits associated with the resolution of certain tax positions pertaining to prior years, and the expiration of certain statutes of limitations.
|
76
Details of Income Statement Items Included in GAAP Reported but Excluded from Non-GAAP Adjusted Income
|
Three Months Ended
|
||||||||
|
(MILLIONS OF DOLLARS)
|
March 31,
2019 |
|
April 1,
2018 |
|
||||
|
Purchase accounting adjustments
|
|
|
||||||
|
Amortization, depreciation and other
(a)
|
$
|
1,042
|
|
$
|
1,221
|
|
||
|
Cost of sales
|
(4
|
)
|
1
|
|
||||
|
Total purchase accounting adjustments––pre-tax
|
1,038
|
|
1,221
|
|
||||
|
Income taxes
(b)
|
(224
|
)
|
(239
|
)
|
||||
|
Total purchase accounting adjustments––net of tax
|
814
|
|
982
|
|
||||
|
Acquisition-related costs
|
|
|
|
|
||||
|
Restructuring credits
(c)
|
(9
|
)
|
(8
|
)
|
||||
|
Integration costs
(c)
|
36
|
|
52
|
|
||||
|
Additional depreciation––asset restructuring
(d)
|
1
|
|
3
|
|
||||
|
Total acquisition-related costs––pre-tax
|
28
|
|
48
|
|
||||
|
Income taxes
(e)
|
(5
|
)
|
(8
|
)
|
||||
|
Total acquisition-related costs––net of tax
|
23
|
|
40
|
|
||||
|
Discontinued operations
|
|
|
|
|
||||
|
Total discontinued operations––net of tax, attributable to Pfizer Inc.
(f)
|
—
|
|
1
|
|
||||
|
Certain significant items
|
|
|
|
|
||||
|
Restructuring charges/(credits)
––
cost reduction initiatives
(g)
|
19
|
|
(2
|
)
|
||||
|
Implementation costs and additional depreciation––asset restructuring
(h)
|
38
|
|
53
|
|
||||
|
Certain legal matters, net
(i)
|
(6
|
)
|
(19
|
)
|
||||
|
Certain asset impairments
(i)
|
139
|
|
—
|
|
||||
|
Business and legal entity alignment costs
(i)
|
119
|
|
3
|
|
||||
|
Net gains recognized during the period on investments in equity securities
(i)
|
(111
|
)
|
(118
|
)
|
||||
|
Net losses on early retirement of debt
(i)
|
138
|
|
3
|
|
||||
|
Other
(j)
|
46
|
|
162
|
|
||||
|
Total certain significant items––pre-tax
|
382
|
|
83
|
|
||||
|
Income taxes
(k)
|
(212
|
)
|
(112
|
)
|
||||
|
Total certain significant items––net of tax
|
171
|
|
(29
|
)
|
||||
|
Total purchase accounting adjustments, acquisition-related costs, discontinued operations and certain significant items––net of tax, attributable to Pfizer Inc.
|
$
|
1,007
|
|
$
|
994
|
|
||
|
(a)
|
Included primarily in
Amortization of intangible assets.
|
|
(b)
|
Included in
Provision for taxes on income.
Income taxes includes the tax effect of the associated pre-tax amounts, calculated by determining the jurisdictional location of the pre-tax amounts and applying that jurisdiction’s applicable tax rate.
|
|
(c)
|
Included in
Restructuring charges and certain acquisition-related costs
. Restructuring charges include employee termination costs, asset impairments and other exit costs associated with business combinations. Integration costs represent external, incremental costs directly related to integrating acquired businesses, and primarily include expenditures for consulting and the integration of systems and processes. For additional information, see Notes to Condensed Consolidated Financial Statements—
Note 3.
Restructuring Charges and Other Costs Associated with Acquisitions and Cost-Reduction/Productivity Initiatives
.
|
|
(d)
|
Included in
Selling, informational and administrative expenses
for the three months ended
March 31, 2019
and in
Cost of sales
for the three months ended
April 1, 2018
.
Represents the impact of changes in estimated useful lives of assets involved in restructuring actions related to acquisitions.
|
|
(e)
|
Included in
Provision for taxes on income
. Income taxes includes the tax effect of the associated pre-tax amounts, calculated by determining the jurisdictional location of the pre-tax amounts and applying that jurisdiction’s applicable tax rate.
|
|
(f)
|
Included in
Discontinued operations––net of tax.
|
|
(g)
|
Amounts relate to employee termination costs, asset impairments and other exit costs not associated with acquisitions, which are included in
Restructuring charges and certain acquisition-related cost
(see Notes to Condensed Consolidated Financial Statements—
Note 3.
Restructuring Charges and Other Costs Associated with Acquisitions and Cost-Reduction/Productivity Initiatives
). For the three months ended
March 31, 2019
,
the charges were primarily related to asset write downs.
For the three months ended
April 1, 2018
, the credits were mostly related to reserve releases for cost-reduction programs, partially offset by exit costs.
|
|
(h)
|
Amounts relate to our cost-reduction/productivity initiatives not related to acquisitions (see Notes to Condensed Consolidated Financial Statements—
Note 3.
Restructuring Charges and Other Costs Associated with Acquisitions and Cost-Reduction/Productivity Initiatives
). For the three months ended
March 31, 2019
, included in
Cost of sales
(
$22 million
),
Selling, informational and administrative expenses
(
$9 million
) and
Research and development expenses
(
$7 million
). For the three months ended
April 1, 2018
, included in
Cost of sales
(
$30 million
),
Selling, informational and administrative expenses
(
$17 million
) and
Research and development expenses
(
$6 million
).
|
|
(i)
|
Included in
Other (income)/deductions
—
net
(see Notes to Condensed Consolidated Financial Statements—
Note 4.
Other (Income)/Deductions—Net
)
.
|
|
(j)
|
For the three months ended
March 31, 2019
, included in
Selling, informational and administrative expenses
(
$18 million
),
Research and development expenses
(
$4 million
) and
Other (income)/deductions––net
(
$24 million
). For the three months ended
April 1, 2018
, included in
Cost of sales
(
$7 million
income),
Selling, informational and administrative expenses
(
$109 million
) and
Other (income)/deductions––net
(
$60 million
) and includes, among other things, a
$108 million
charge, in the aggregate, in
Selling, informational and administrative expenses
for a special, one-time bonus paid to virtually all Pfizer
|
77
colleagues, excluding executives, which was one of several actions taken by us after evaluating the expected positive net impact of the December 2017 enactment of the legislation commonly referred to as the TCJA.
|
(k)
|
Included in
Provision for taxes on income
. Income taxes includes the tax effect of the associated pre-tax amounts, calculated by determining the jurisdictional location of the pre-tax amounts and applying that jurisdiction’s applicable tax rate. The first quarter of 2019 was favorably impacted primarily by the tax benefit recorded as a result of additional guidance issued by the U.S. Department of Treasury related to the TCJA. The first quarter of 2018 was favorably impacted by the December 2017 enactment of the TCJA, primarily related to certain tax initiatives associated with the lower U.S. tax rate as a result of the TCJA.
|
Analysis of Operating Segment Information
The following tables and associated notes provide additional information about the performance of each of our two reportable operating segments—Biopharma and Upjohn. For additional information about each operating segment, see the “Overview of Our Performance, Operating Environment, Strategy and Outlook—Our Strategy—Organizing for Growth” and “—Commercial Operations” sections of this MD&A and Notes to Condensed Consolidated Financial Statements—
Note 13.
Segment, Geographic and Other Revenue Information
.
|
The following tables provide revenue and cost information by reportable operating segment and a reconciliation of that information to our condensed consolidated statements of income:
|
||||||||||||||||||||||||
|
Three Months Ended March 31, 2019
|
||||||||||||||||||||||||
|
(MILLIONS OF DOLLARS)
|
Biopharma
(a)
|
|
Upjohn
(a)
|
|
Other
(b)
|
|
Non-GAAP
Adjusted
(c)
|
|
Reconciling Items
(d)
|
|
GAAP Reported
|
|
||||||||||||
|
Revenues
|
$
|
9,185
|
|
$
|
3,075
|
|
$
|
858
|
|
$
|
13,118
|
|
$
|
—
|
|
$
|
13,118
|
|
||||||
|
Cost of sales
|
1,760
|
|
419
|
|
236
|
|
2,415
|
|
18
|
|
2,433
|
|
||||||||||||
|
% of revenue
|
19.2
|
%
|
|
13.6
|
%
|
|
*
|
|
|
18.4
|
%
|
|
*
|
|
|
18.5
|
%
|
|||||||
|
Selling, informational and administrative expenses
|
1,523
|
|
330
|
|
1,459
|
|
3,311
|
|
27
|
|
3,339
|
|
||||||||||||
|
Research and development expenses
|
165
|
|
54
|
|
1,474
|
|
1,693
|
|
10
|
|
1,703
|
|
||||||||||||
|
Amortization of intangible assets
|
63
|
|
—
|
|
—
|
|
63
|
|
1,120
|
|
1,183
|
|
||||||||||||
|
Restructuring charges and certain acquisition-related costs
|
—
|
|
—
|
|
—
|
|
—
|
|
46
|
|
46
|
|
||||||||||||
|
Other (income)/deductions––net
|
(213
|
)
|
(2
|
)
|
80
|
|
(135
|
)
|
227
|
|
92
|
|
||||||||||||
|
Income/(loss) from continuing operations before provision for taxes on income
|
$
|
5,888
|
|
$
|
2,274
|
|
$
|
(2,391
|
)
|
$
|
5,771
|
|
$
|
(1,449
|
)
|
$
|
4,323
|
|
||||||
|
Three Months Ended April 1, 2018
|
||||||||||||||||||||||||
|
(MILLIONS OF DOLLARS)
|
Biopharma
(a)
|
|
Upjohn
(a)
|
|
Other
(b)
|
|
Non-GAAP
Adjusted (c) |
|
Reconciling Items
(d)
|
|
GAAP Reported
|
|
||||||||||||
|
Revenues
|
$
|
8,881
|
|
$
|
3,120
|
|
$
|
905
|
|
$
|
12,906
|
|
$
|
—
|
|
$
|
12,906
|
|
||||||
|
Cost of sales
|
1,675
|
|
469
|
|
392
|
|
2,536
|
|
27
|
|
2,563
|
|
||||||||||||
|
% of revenue
|
18.9
|
%
|
|
15.0
|
%
|
|
*
|
|
|
19.7
|
%
|
|
*
|
|
|
19.9
|
%
|
|||||||
|
Selling, informational and administrative expenses
|
1,455
|
|
435
|
|
1,395
|
|
3,286
|
|
126
|
|
3,412
|
|
||||||||||||
|
Research and development expenses
|
162
|
|
52
|
|
1,524
|
|
1,739
|
|
4
|
|
1,743
|
|
||||||||||||
|
Amortization of intangible assets
|
59
|
|
—
|
|
11
|
|
71
|
|
1,126
|
|
1,196
|
|
||||||||||||
|
Restructuring charges and certain acquisition-related costs
|
—
|
|
—
|
|
—
|
|
—
|
|
43
|
|
43
|
|
||||||||||||
|
Other (income)/deductions––net
|
(294
|
)
|
(5
|
)
|
95
|
|
(204
|
)
|
26
|
|
(178
|
)
|
||||||||||||
|
Income/(loss) from continuing operations before provision for taxes on income
|
$
|
5,823
|
|
$
|
2,168
|
|
$
|
(2,512
|
)
|
$
|
5,479
|
|
$
|
(1,352
|
)
|
$
|
4,127
|
|
||||||
See end of tables for notes (a) through (d).
|
*
|
Indicates calculation not meaningful or result is equal to or greater than 100%.
|
|
(a)
|
Amounts represent the revenues and costs managed by each of the Biopharma and Upjohn reportable operating segments for the periods presented. The expenses generally include only those costs directly attributable to the operating segment.
|
78
|
(b)
|
Other comprises the revenues and costs included in our Adjusted income components (see footnote (c) below) that are managed outside Biopharma and Upjohn and includes the following:
|
|
Three Months Ended March 31, 2019
|
||||||||||||||||||||
|
Other Business Activities
|
||||||||||||||||||||
|
(MILLIONS OF DOLLARS)
|
WRDM
(i)
|
|
GPD
(ii)
|
|
Other
(iii)
|
|
Corporate and Other Unallocated
(iv)
|
|
Total
|
|
||||||||||
|
Revenues
|
$
|
—
|
|
$
|
—
|
|
$
|
858
|
|
$
|
—
|
|
$
|
858
|
|
|||||
|
Cost of sales
|
—
|
|
—
|
|
275
|
|
(38
|
)
|
236
|
|
||||||||||
|
Selling, informational and administrative expenses
|
21
|
|
—
|
|
388
|
|
1,050
|
|
1,459
|
|
||||||||||
|
Research and development expenses
|
532
|
|
726
|
|
30
|
|
185
|
|
1,474
|
|
||||||||||
|
Amortization of intangible assets
|
—
|
|
—
|
|
—
|
|
—
|
|
—
|
|
||||||||||
|
Restructuring charges and certain acquisition-related costs
|
—
|
|
—
|
|
—
|
|
—
|
|
—
|
|
||||||||||
|
Other (income)/deductions––net
|
(1
|
)
|
(1
|
)
|
1
|
|
80
|
|
80
|
|
||||||||||
|
Income/(loss) from continuing operations before provision for taxes on income
|
$
|
(552
|
)
|
$
|
(726
|
)
|
$
|
164
|
|
$
|
(1,278
|
)
|
$
|
(2,391
|
)
|
|||||
|
Three Months Ended April 1, 2018
|
||||||||||||||||||||
|
Other Business Activities
|
||||||||||||||||||||
|
(MILLIONS OF DOLLARS)
|
WRDM
(i)
|
|
GPD
(ii)
|
|
Other
(iii)
|
|
Corporate and Other Unallocated
(iv)
|
|
Total
|
|
||||||||||
|
Revenues
|
$
|
—
|
|
$
|
—
|
|
$
|
905
|
|
$
|
—
|
|
$
|
905
|
|
|||||
|
Cost of sales
|
—
|
|
—
|
|
298
|
|
94
|
|
392
|
|
||||||||||
|
Selling, informational and administrative expenses
|
28
|
|
—
|
|
407
|
|
960
|
|
1,395
|
|
||||||||||
|
Research and development expenses
|
548
|
|
762
|
|
42
|
|
172
|
|
1,524
|
|
||||||||||
|
Amortization of intangible assets
|
—
|
|
—
|
|
11
|
|
—
|
|
11
|
|
||||||||||
|
Restructuring charges and certain acquisition-related costs
|
—
|
|
—
|
|
—
|
|
—
|
|
—
|
|
||||||||||
|
Other (income)/deductions––net
|
(3
|
)
|
—
|
|
—
|
|
98
|
|
95
|
|
||||||||||
|
Income/(loss) from continuing operations before provision for taxes on income
|
$
|
(572
|
)
|
$
|
(762
|
)
|
$
|
147
|
|
$
|
(1,325
|
)
|
$
|
(2,512
|
)
|
|||||
|
(i)
|
WRDM—the R&D and Medical expenses managed by our WRDM organization, which is generally responsible for research projects for our Biopharma portfolio until proof-of-concept is achieved and then for transitioning those projects to the GPD organization for possible clinical and commercial development. R&D spending may include upfront and milestone payments for intellectual property rights. The WRDM organization also has responsibility for certain science-based and other platform-services organizations, which provide end-to-end technical expertise and other services to the various R&D projects, as well as the Worldwide Medical and Safety group, which ensures that Pfizer provides all stakeholders––including patients, healthcare providers, pharmacists, payers and health authorities––with complete and up-to-date information on the risks and benefits associated with Pfizer products so that they can make appropriate decisions on how and when to use Pfizer’s medicines.
|
|
(ii)
|
GPD
––
the costs associated with our GPD organization, which is generally responsible for clinical trials from WRDM in the Biopharma portfolio, including late stage portfolio spend. GPD also provides technical support and other services to Pfizer R&D projects. GPD is responsible for facilitating all regulatory submissions and interactions with regulatory agencies.
|
|
(iii)
|
Other—the operating results of our Consumer Healthcare business, and costs associated with other commercial activities not managed as part of Biopharma or Upjohn, including all strategy, business development, portfolio management and valuation capabilities, which previously had been reported in various parts of the organization.
|
|
(iv)
|
Corporate and Other Unallocated––the costs associated with platform functions (such as worldwide technology, global real estate operations, legal, finance, human resources, worldwide public affairs, compliance and worldwide procurement), patient advocacy activities and certain compensation and other corporate costs, such as interest income and expense, and gains and losses on investments, as well as overhead expenses associated with our manufacturing (which include manufacturing variances associated with production) and commercial operations that are not directly assessed to an operating segment, as business unit (segment) management does not manage these costs.
|
We recognized a
$44 million
gain
in the
first quarter
of
2019
as an offset to
Cost of sales
primarily related to euro-denominated forward-exchange contracts designated as cash flow hedges of a portion of our foreign exchange-denominated forecasted intercompany inventory sales. We recognized a
$29 million
loss in the
first quarter
of 2018 as an offset to
Cost of sales
primarily related to euro-denominated forward-exchange contracts designated as cash flow hedges of a portion of our foreign exchange-denominated forecasted intercompany inventory sales. For additional information, see Notes to Condensed Consolidated Financial Statements––
Note 7E.
Financial Instruments
:
Derivative Financial Instruments and Hedging Activities
.
For information purposes only, the following tables present reconciliations of the Biopharma segment operating results and Upjohn segment operating results to Biopharma and Upjohn operating results including estimated Other costs generally associated with the Biopharma and Upjohn operating segments. While we do not manage our segments or have performance goals under such an allocated manner, we believe that some investors may find this information useful in their analyses.
79
The estimated Other costs generally associated with our operating segments do not purport to reflect the additional amounts that each of our operating segments would have incurred had each segment operated as a standalone company during the period presented.
For information purposes only, for
the first three months of
2019
, we estimate that Other costs attributable to our Biopharma and Upjohn segments, as described above, for combined WRDM, GPD and other business activities costs are
$1.4 billion
, and combined Corporate and Other Unallocated costs are
$1.0 billion
, which excludes income and costs associated with our Consumer Healthcare business. The combined Corporate and Other Unallocated costs also exclude (i) net interest-related expense not attributable to an operating segment included in Corporate (approximately
$298 million
for
the first three months of
2019
in
Other (income)/deductions––net
); and (ii) net income from investments and other assets not attributable to an operating segment included in Corporate (approximately
$69 million
for
the first three months of
2019
in
Other
(income)/deductions––net
). The remaining costs have been attributed to our Biopharma and Upjohn operating segments, as follows:
|
|
|
Three Months Ended March 31, 2019
|
||||||||||||
|
|
|
|
|
Estimated Other Costs Associated with Biopharma
(ii)
|
|
|
||||||||
|
(MILLIONS OF DOLLARS)
|
|
Biopharma Non-GAAP Adjusted
(i), (iii)
|
|
|
Estimated WRDM/
GPD/Other Business Activities (ii) |
|
|
Estimated Corporate/Other Unallocated
(ii)
|
|
|
Biopharma with
Estimated Other Costs Associated with Biopharma Non-GAAP Adjusted (ii), (iii) |
|
||
|
Revenues
|
|
$
|
9,185
|
|
|
|
|
|
|
|
|
$
|
9,185
|
|
|
Cost of sales
|
|
1,760
|
|
|
—
|
|
|
(34
|
)
|
|
1,726
|
|
||
|
Selling, informational and administrative expenses
|
|
1,523
|
|
|
121
|
|
|
703
|
|
|
2,346
|
|
||
|
Research and development expenses
|
|
165
|
|
|
1,262
|
|
|
178
|
|
|
1,604
|
|
||
|
Amortization of intangible assets
|
|
63
|
|
|
—
|
|
|
—
|
|
|
63
|
|
||
|
Restructuring charges and certain acquisition-related costs
|
|
—
|
|
|
|
|
|
|
|
|
—
|
|
||
|
Other (income)/deductions––net
|
|
(213
|
)
|
|
1
|
|
|
(127
|
)
|
|
(339
|
)
|
||
|
Income/(loss) from continuing operations before provision for taxes on income
|
|
5,888
|
|
|
(1,384
|
)
|
|
(720
|
)
|
|
3,785
|
|
||
|
|
|
Three Months Ended March 31, 2019
|
||||||||||||
|
|
|
|
|
Estimated Other Costs Associated with Upjohn
(ii)
|
|
|
||||||||
|
(MILLIONS OF DOLLARS)
|
|
Upjohn
Non-GAAP Adjusted (i), (iii) |
|
|
Estimated WRDM/
GPD/Other Business Activities (ii) |
|
|
Estimated Corporate/Other Unallocated
(ii)
|
|
|
Upjohn with
Estimated Other Costs Associated with Upjohn Non-GAAP Adjusted (ii), (iii) |
|
||
|
Revenues
|
|
$
|
3,075
|
|
|
|
|
|
|
|
|
$
|
3,075
|
|
|
Cost of sales
|
|
419
|
|
|
—
|
|
|
(8
|
)
|
|
410
|
|
||
|
Selling, informational and administrative expenses
|
|
330
|
|
|
8
|
|
|
276
|
|
|
613
|
|
||
|
Research and development expenses
|
|
54
|
|
|
1
|
|
|
4
|
|
|
59
|
|
||
|
Amortization of intangible assets
|
|
—
|
|
|
—
|
|
|
—
|
|
|
—
|
|
||
|
Restructuring charges and certain acquisition-related costs
|
|
—
|
|
|
|
|
|
|
|
|
—
|
|
||
|
Other (income)/deductions––net
|
|
(2
|
)
|
|
—
|
|
|
(12
|
)
|
|
(14
|
)
|
||
|
Income/(loss) from continuing operations before provision for taxes on income
|
|
2,274
|
|
|
(9
|
)
|
|
(259
|
)
|
|
2,006
|
|
||
|
(i)
|
Amount represents the revenues and costs managed by the operating segments. The expenses generally include only those costs directly attributable to the operating segment. See note (a) above for more information.
|
|
(ii)
|
Represents costs not assessed to an operating segment, as business unit (segment) management does not manage these costs. For a description of these other costs and business activities, see note (b) above.
|
|
•
|
WRDM/GPD/Other Business Activities
––
The information provided for WRDM, GPD and Other Business Activities was substantially all derived from our estimates of the costs incurred in connection with the R&D projects associated with the Biopharma and Upjohn operating segments as well as specific identification and estimates of costs incurred in connection with activities associated with the Biopharma and Upjohn operating segments.
|
|
•
|
Corporate/Other Unallocated
––
The information provided for Corporate and Other Unallocated was derived mainly using proportional allocation methods based on global, regional or country revenues or global, regional or country headcount, as well as certain cost metrics, as appropriate, such as those derived from research and development and manufacturing costs, and, to a lesser extent, specific identification and estimates. Management believes that the allocations of Corporate and Other Unallocated costs are reasonable.
|
The estimated Other costs generally associated with our Biopharma and Upjohn operating segments do not purport to reflect the additional amounts that each of the operating segments would have incurred had each segment operated as a standalone company during the period presented.
80
|
(iii)
|
See note (c) below for an explanation of our Non-GAAP Adjusted financial measure.
|
|
(c)
|
See the “Non-GAAP Financial Measure (Adjusted Income)” section of this MD&A for a definition of these “Adjusted Income” components.
|
|
(d)
|
Includes costs associated with (i) purchase accounting adjustments; (ii) acquisition-related costs; and (iii) certain significant items, which are substantive and/or unusual, and in some cases recurring, items (such as restructuring charges, legal charges or net gains and losses on investment in equity securities), that are evaluated on an individual basis by management. For additional information about these reconciling items and/or our Non-GAAP adjusted measure of performance, see the “Non-GAAP Financial Measure (Adjusted Income)” section of this MD&A.
|
First Quarter
of
2019
vs.
First Quarter
of
2018
Biopharma Operating Segment
Revenues
Biopharma
Revenues
increase
d
$304 million
, or
3%
, to
$9.2 billion
, reflecting an operational
increase
of
$637 million
, or
7%
, partially offset by
the unfavorable
impact of foreign exchange of
$334 million
, or
4%
.
The following provides an analysis of the
increase
in Biopharma worldwide
Revenues
:
|
(MILLIONS OF DOLLARS)
|
||||
|
Biopharma
Revenues
, for the three months ended April 1, 2018
|
$
|
8,881
|
|
|
|
Operational growth/(decline):
|
||||
|
Continued worldwide growth from certain key brands
(a)
|
763
|
|
||
|
Lower revenues for the Hospital business primarily in the U.S., mostly due to the continued expected negative impact from generic competition for products that have previously lost marketing exclusivity
|
(71
|
)
|
||
|
Lower revenues for certain rare disease products, including the hemophilia franchises (BeneFIX and Refacto AF/Xyntha) primarily due to competitive pressures, and Genotropin in the U.S., primarily due to unfavorable channel mix
|
(52
|
)
|
||
|
Other operational factors, net
|
(3
|
)
|
||
|
Operational growth, net
|
637
|
|
||
|
Unfavorable impact of foreign exchange
|
(334
|
)
|
||
|
Biopharma
Revenues
increase
|
304
|
|
||
|
Biopharma
Revenues
, for the three months ended March 31, 2019
|
$
|
9,185
|
|
|
|
(a)
|
Certain k
ey brands
represent Eliquis, Ibrance, Prevnar 13/Prevenar 13 and Xeljanz. See the “Analysis of the Condensed Consolidated Statements of Income––Revenues––Selected Product Discussion” section of this MD&A for product analysis information
.
|
Total Biopharma revenues from emerging markets
increase
d
$83 million
, or
4%
, to
$1.9 billion
from
$1.9 billion
, reflecting
15%
operational growth. Foreign exchange had
an unfavorable
impact of
11%
on total Biopharma revenues from emerging markets. The operational increase in emerging markets was primarily driven by Prevenar 13, Ibrance and Enbrel.
Costs and Expenses
|
•
|
Cost of sales
as a percentage of
Revenues
was relatively flat
.
|
|
•
|
The
increase
in
Cost of sales
of
5%
was primarily driven by an increase in sales volumes for various products within the Biopharma product portfolio, an unfavorable change in product mix, an increase in inventory write-offs, primarily for legacy Hospira products in the U.S., as well as an increase in royalty expenses based on the mix of products sold, partially offset by the favorable impact of foreign exchange.
|
|
•
|
The
increase
in
Selling, informational and administrative
expenses
of
5%
was primarily driven by additional investment across several of our products, primarily Xeljanz, Eliquis and Vyndaqel, as well as the non-recurrence of a favorable true-up of healthcare reform expenses in the first quarter of 2018, partially offset by the favorable impact of foreign exchange.
|
|
•
|
Research and development
expenses
were relatively flat.
|
|
•
|
The
unfavorable
change in
Other (income)/deductions––net
primarily reflects a
$119 million
decrease in income from collaborations, out-licensing arrangements and sales of compound/product rights.
|
Upjohn Operating Segment
Revenues
Upjohn
Revenues
decrease
d
$45 million
, or
1%
, to
$3.1 billion
, reflecting an operational
increase
of
$46 million
, or
1%
, and
the unfavorable
impact of foreign exchange of
$92 million
, or
3%
.
81
The following provides an analysis of the
decrease
in Upjohn worldwide
Revenues
:
|
(MILLIONS OF DOLLARS)
|
|
|
|
|
|
Upjohn
Revenues
, for the three months ended April 1, 2018
|
|
$
|
3,120
|
|
|
|
|
|
|
|
|
Operational growth/(decline):
|
|
|
|
|
|
Growth from Lipitor, Norvasc and Celebrex, primarily in emerging markets, driven by strong, volume-driven operational growth in China
|
237
|
|
||
|
Lower revenues for Viagra and Upjohn's authorized generic for Viagra in the U.S. resulting from increased generic competition following Viagra's December 2017 patent expiration
|
|
(97
|
)
|
|
|
Lower revenues for Greenstone, Upjohn's authorized generic subsidiary, primarily due to continued industry-wide pricing challenges in the U.S., excluding revenues for Upjohn's authorized generic for Viagra in the U.S.
|
(28
|
)
|
||
|
Lower worldwide revenues for Lyrica, primarily in the U.S., reflecting wholesaler destocking in advance of anticipated generic competition beginning on June 30, 2019, and in developed Europe, reflecting continued generic competition
|
(18
|
)
|
||
|
Other operational factors, net
|
(47
|
)
|
||
|
Operational growth, net
|
|
46
|
|
|
|
|
|
|
||
|
Unfavorable impact of foreign exchange
|
|
(92
|
)
|
|
|
Upjohn
Revenues
decrease
|
|
(45
|
)
|
|
|
Upjohn
Revenues
, for the three months ended March 31, 2019
|
|
$
|
3,075
|
|
Total Upjohn revenues from emerging markets
increase
d
$171 million
, or
17%
, to
$1.2 billion
from
$1.0 billion
, reflecting
25%
operational growth. Foreign exchange had
an unfavorable
impact of
7%
on total Upjohn revenues from emerging markets. The operational increase in emerging markets was primarily driven by Lipitor, Norvasc and Celebrex.
Costs and Expenses
|
•
|
Cost of sales
as a percentage of
Revenues
decrease
d
1.4
percentage points, primarily due to the unfavorable impact of foreign exchange.
|
|
•
|
Cost of sales
decreased
11%
primarily due to the favorable impact of foreign exchange, partially offset by net volume increases primarily in China and Japan.
|
|
•
|
Selling, informational and administrative
expenses
decrease
d
24%
driven by a reduction in field force and advertising and promotional expenses in developed markets, primarily related to Lyrica in the U.S., and the favorable impact of foreign exchange,
partially offset by investments in China across key brands and the non-recurrence of a favorable true-up of healthcare reform expenses in the first quarter of 2018
.
|
•
Research and development
expenses
increase
d
3%
driven by investments in the Upjohn Research, Development and Medical organization
.
Consumer Healthcare Operating Segment
Consumer Healthcare
Revenues
decreased $47 million, or 5%, to $858 million, reflecting an operational decrease of $19 million, or 2%, and the unfavorable impact of foreign exchange of $28 million, or 3%.
ANALYSIS OF THE CONDENSED CONSOLIDATED STATEMENTS OF COMPREHENSIVE INCOME
Changes in the components of
Accumulated other comprehensive loss
for the
first quarter
of
2019
reflect the following:
|
•
|
For
Foreign currency translation adjustments, net
,
primarily reflects the results of our net investment hedging program and the weakening of the U.S. dollar against the Japanese yen and U.K. pound.
|
|
•
|
For
Unrealized holding gains/(losses) on derivative financial instruments, net
and
Unrealized holding gains on available-for-sale securities, net
,
reflects the impact of fair value re-measurements and the reclassification of amounts into income. For additional information, see Notes to Condensed Consolidated Financial Statements—
Note 7.
Financial Instruments
.
|
|
•
|
For
Benefit plans: actuarial gains, net
,
primarily reflects the amortization of changes in the pension benefit obligation previously recognized in
Other comprehensive income
and the favorable impact of foreign exchange. For additional information, see Notes to Condensed Consolidated Financial Statements—
Note 10.
Pension and Postretirement Benefit Plans
.
|
|
•
|
For
Benefit plans: prior service costs and other, net
, reflects the reclassification into income of amounts related to amortization of changes in prior service costs and credits previously recognized in
Other comprehensive income.
For additional information, see Notes to Condensed Consolidated Financial Statements—
Note 10. Pension and Postretirement Benefit Plans
.
|
82
ANALYSIS OF THE CONDENSED CONSOLIDATED BALANCE SHEETS
For information about certain of our financial assets and liabilities, including
Cash and cash equivalents, Short-term investments, Long-term investments, Short-term borrowings, including current portion of long-term debt
, and
Long-term debt
, see the “Analysis of the Condensed Consolidated Statements of Cash Flows” section of this MD&A, the “Analysis of Financial Condition, Liquidity and Capital Resources: Selected Measures of Liquidity and Capital Resources” section of this MD&A and Notes to Condensed Consolidated Financial Statements—
Note 7.
Financial Instruments
.
For information about events and circumstances impacting our tax-related accounts, see Notes to Condensed Consolidated Financial Statements—
Note 5.
Tax Matters
.
For information related to changes in
Accumulated other comprehensive loss
, see the “Analysis of the Condensed Consolidated Statements of Comprehensive Income” section of this MD&A and Notes to Condensed Consolidated Financial Statements—
Note 6.
Accumulated Other Comprehensive Loss, Excluding Noncontrolling Interests
.
The changes in our asset and liability accounts as of
March 31, 2019
, compared to
December 31, 2018
, generally reflect, among other things, fluctuations in foreign currency exchange rates, as well as the impact of the adoption of new accounting standards in the first quarter of 2019
.
The following explanations exclude the impact of foreign exchange, the impact of the adoption of the new accounting standards in the first quarter of 2019 and the pending consumer healthcare business joint venture with GSK (see Notes to Condensed Consolidated Financial Statements—
Note 1B.
Basis of Presentation and Significant Accounting Policies
: Adoption of New Accounting Standards
and
Note 2. Assets and Liabilities Held for Sale
for additional information).
|
•
|
For
Trade accounts receivable, less allowance for doubtful accounts,
the change reflects the timing of sales and collections in the normal course of business.
|
|
•
|
For
Inventories,
the change reflects the increases for certain products to meet targeted levels in the normal course of business, including inventory build for supply recovery and market demand.
|
|
•
|
For
PP&E
,
the change primarily reflects capital additions in the normal course of business, partially offset by depreciation during the period.
|
|
•
|
For
Identifiable intangible assets, less accumulated amortization
, the change primarily reflects amortization for the period and intangible asset impairment charges (see Notes to Condensed Consolidated Financial Statements—
Note 4. Other (Income)/Deductions
—
Net)
, partially offset by additions for the period.
|
|
•
|
For
Other noncurrent assets,
the change reflects an increase in receivables, associated with derivative instruments.
|
|
•
|
For
Trade accounts payable,
the change reflects the timing of purchases and payments in the normal course of business.
|
|
•
|
For
Accrued compensation and related items
, the decrease reflects normal bonus payments made to employees and the timing of payments in the normal course of business, partially offset by current year accruals.
|
|
•
|
For
Other current liabilities
, the change reflects a decrease in liabilities associated with:
|
|
◦
|
payments and accruals in the normal course of business,
|
|
◦
|
payments for contingent consideration obligations; and
|
|
◦
|
payments for restructuring activities.
|
|
•
|
For
Other noncurrent liabilities
, the change reflects a decrease in liabilities associated with:
|
|
◦
|
a decrease in payables, associated with derivative financial instruments; and
|
|
◦
|
a change in the fair value of contingent consideration (see Notes to Condensed Consolidated Financial Statements—
Note 4
.
Other (Income)/Deductions—Net
).
|
|
•
|
For
Treasury stock,
the change reflects
$6.8 billion
paid to
GS&Co.
in February 2019 pursuant to the terms of an accelerated share repurchase agreement as well as open market share repurchases. See Notes to Condensed Consolidated Financial Statements—
Note 12C.
Contingencies and Certain Commitments
: Certain Commitments
for additional information.
|
83
ANALYSIS OF THE CONDENSED CONSOLIDATED STATEMENTS OF CASH FLOWS
|
|
Three Months Ended
|
|
|||||||||
|
(MILLIONS OF DOLLARS)
|
|
March 31,
2019 |
|
April 1,
2018 |
|
%
Change |
|
||||
|
Cash provided by/(used in):
|
|
|
|
|
|||||||
|
Operating activities
|
|
$
|
1,698
|
|
$
|
1,983
|
|
(14
|
)
|
||
|
Investing activities
|
|
7,550
|
|
9,667
|
|
(22
|
)
|
||||
|
Financing activities
|
|
(8,467
|
)
|
(10,720
|
)
|
(21
|
)
|
||||
|
Effect of exchange-rate changes on cash and cash equivalents and restricted cash and cash equivalents
|
12
|
|
55
|
|
(78
|
)
|
|||||
|
Net increase in
Cash and cash equivalents
and restricted cash and cash equivalents
|
$
|
792
|
|
$
|
985
|
|
(20
|
)
|
|||
In the condensed consolidated statements of cash flows, the line item
Other changes in assets and liabilities, net of acquisitions and divestitures
is presented excluding the effects of changes in foreign currency exchange rates, as these changes do not reflect actual cash inflows or outflows, and excluding any other significant non-cash movements. Accordingly, the amounts shown will not necessarily agree with the changes in the assets and liabilities that are presented in our condensed consolidated balance sheets.
Operating Activities
Our net cash provided by operating activities was
$1.7 billion
in
the first three months of
2019
, compared to
$2.0 billion
in the same period in
2018
. The
decrease
in net cash provided by operating activities reflects the timing of receipts from customers and payments to vendors in the ordinary course of business, partially offset by a decrease in benefit plan contributions.
In
the first three months of
2019
, the change in the line item
Other adjustments, net
primarily reflects, among other items, net gains on foreign exchange contracts hedging a portion of our forecasted intercompany inventory sales (that fixes the cost of inventory sold later to customers).
In
the first three months of
2019
and
2018
, the line item
Other changes in assets and liabilities, net of acquisitions and divestitures,
primarily reflects changes, in the normal course of business, in trade accounts receivable, inventories, other current assets, other noncurrent assets, trade accounts payable, accrued compensation and other current and noncurrent liabilities.
For additional information about changes in other assets and liabilities account balances, see the “Analysis of the Condensed Consolidated Balance Sheets” in this MD&A.
Investing Activities
Our net cash provided by investing activities was
$7.5 billion
in
the first three months of
2019
, compared to net cash provided by investing activities of
$9.7 billion
in the same period in
2018
. The
decrease
in net cash provided by investing activities was primarily attributable to a decrease in net proceeds generated from the sale of investments of
$1.9 billion
in
2019
for cash needs.
Financing Activities
Our net cash used by financing activities was
$8.5 billion
in
the first three months of
2019
, compared to
$10.7 billion
in the same period in
2018
. The
decrease
in net cash used in financing activities was primarily attributable to:
|
•
|
the issuance of long-term debt of
$4.9 billion
in
2019
, with no corresponding issuance of debt in
the first three months of
2018
(see Notes to Condensed Consolidated Financial Statements––
Note 7D. Financial Instruments: Long-Term Debt
); and
|
|
•
|
$874 million
net proceeds raised from short-term borrowings in
the first three months of
2019
, compared to net repayments of
$2.1 billion
in
the first three months of
2018
.
|
partially offset by:
|
•
|
higher purchases of common stock of
$2.8 billion
;
|
|
•
|
higher repayments on long-term debt of
$2.6 billion
; and
|
|
•
|
lower proceeds from the exercise of stock options of
$246 million
.
|
84
ANALYSIS OF FINANCIAL CONDITION, LIQUIDITY AND CAPITAL RESOURCES
We rely largely on operating cash flows, short-term investments, short-term commercial paper borrowings and long-term debt to provide for our liquidity requirements. We continue our efforts to improve cash inflows through working capital efficiencies. We target specific areas of focus including accounts receivable, inventories, accounts payable, and other working capital, which allows us to optimize our operating cash flows. Due to our significant operating cash flows as well as our financial assets, access to capital markets and available lines of credit and revolving credit agreements, we believe that we have, and will maintain, the ability to meet our liquidity needs for the foreseeable future, which include:
|
•
|
the working capital requirements of our operations, including our R&D activities;
|
|
•
|
investments in our business;
|
|
•
|
dividend payments and potential increases in the dividend rate;
|
|
•
|
share repurchases;
|
|
•
|
the cash requirements associated with our cost-reduction/productivity initiatives;
|
|
•
|
paying down outstanding debt;
|
|
•
|
contributions to our pension and postretirement plans; and
|
|
•
|
business-development activities.
|
Our long-term debt is rated high-quality by both S&P and Moody’s. See the “Credit Ratings” section below. As market conditions change, we continue to monitor our liquidity position. We have taken and will continue to take a conservative approach to our financial investments. Both short-term and long-term investments consist primarily of high-quality, highly liquid, well-diversified available-for-sale debt securities.
Selected Measures of Liquidity and Capital Resources
|
The following table provides certain relevant measures of our liquidity and capital resources:
|
||||||||
|
(MILLIONS OF DOLLARS, EXCEPT RATIOS AND PER COMMON SHARE DATA)
|
March 31,
2019 |
|
December 31,
2018 |
|
||||
|
Selected financial assets
(a)
:
|
|
|
||||||
|
Cash and cash equivalents
|
$
|
1,937
|
|
$
|
1,139
|
|
||
|
Short-term investments
|
9,682
|
|
17,694
|
|
||||
|
Long-term investments
|
2,859
|
|
2,767
|
|
||||
|
|
14,478
|
|
21,600
|
|
||||
|
Debt:
|
|
|
|
|
||||
|
Short-term borrowings, including current portion of long-term debt
|
9,410
|
|
8,831
|
|
||||
|
Long-term debt
|
35,733
|
|
32,909
|
|
||||
|
|
45,143
|
|
41,740
|
|
||||
|
Selected net financial liabilities
(b)
|
$
|
(30,665
|
)
|
$
|
(20,140
|
)
|
||
|
Working capital
(c)
|
$
|
15,867
|
|
$
|
18,068
|
|
||
|
Ratio of current assets to current liabilities
|
1.54:1
|
|
1.57:1
|
|
||||
|
Total Pfizer Inc. shareholders’ equity per common share
(d)
|
$
|
10.58
|
|
$
|
11.09
|
|
||
|
(a)
|
See Notes to Condensed Consolidated Financial Statements––
Note 7.
Financial Instruments
for a description of certain assets held and for a description of credit risk related to our financial instruments held.
|
|
(b)
|
The
increase
in selected net financial liabilities was primarily driven by the decrease in short-term investments used for cash needs and the net increase in long-term debt. We retain a strong financial liquidity position as a result of our net cash provided by operating activities, our high-quality financial asset portfolio and access to capital markets. For additional information, see the “Credit Ratings” section of this MD&A.
|
|
(c)
|
The
decrease
in working capital was primarily due to:
|
|
•
|
a decrease in S
hort-term investments
mainly driven by the financing requirements for share repurchase activities, dividend payments, capital expenditures and debt repayment, partially offset by operating cash flow generation, cash from employee stock option exercises and the long-term debt issuance; and
|
|
•
|
an increase in short-term borrowings as a result of the issuance of commercial paper,
|
partially offset by:
|
•
|
the timing of accruals, cash receipts and payments in the ordinary course of business;
|
|
•
|
an increase in inventory related to increases for certain products to meet targeted levels in the normal course of business, including inventory build for supply recovery and market demand; and
|
|
•
|
the net impact of foreign currency exchange.
|
|
(d)
|
Represents total Pfizer Inc. shareholders’ equity divided by the actual number of common shares outstanding (which excludes treasury stock).
|
In March 2019, we completed a public offering of $5.0 billion aggregate principal amount of senior unsecured notes (see Notes to Condensed Consolidated Financial Statements
––Note 7D.
Financial Instruments
:
Long-Term Debt
).
85
For additional information about the sources and uses of our funds, see the “Analysis of the Condensed Consolidated Balance Sheets” and the “Analysis of the Condensed Consolidated Statements of Cash Flows” sections of this MD&A.
Domestic and International Selected Financial Assets
Many of our operations are conducted outside the U.S., and significant portions of our selected financial assets are held internationally. The amount of funds held in U.S. tax jurisdictions can fluctuate due to the timing of receipts and payments in the ordinary course of business and due to other reasons, such as business-development activities. As part of our ongoing liquidity assessments, we regularly monitor the mix of domestic and international cash flows (both inflows and outflows). The changes in tax law under the TCJA, which includes transitioning U.S. international taxation from a worldwide tax system to a territorial tax system, will also allow us to more easily access our selected financial assets globally. The majority of our cash we held internationally as of year-end 2017 was repatriated in 2018.
Credit Ratings
Two major corporate debt-rating organizations, Moody’s and S&P, assign ratings to our short-term and long-term debt. A security rating is not a recommendation to buy, sell or hold securities and the rating is subject to revision or withdrawal at any time by the rating organization. Each rating should be evaluated independently of any other rating.
|
The following table provides the current ratings assigned by these rating agencies to our commercial paper and senior unsecured long-term debt:
|
||||||||
|
NAME OF RATING AGENCY
|
Pfizer
Commercial Paper
|
Pfizer
Long-Term Debt
|
Outlook
|
Date of Last Rating Change
|
||||
|
Rating
|
Rating
|
|||||||
|
Moody’s
|
P-1
|
A1
|
Stable
|
October 2009
|
||||
|
S&P
|
A-1+
|
AA
|
Stable
|
October 2009
|
||||
Debt Capacity––Lines of Credit
We have available lines of credit and revolving credit agreements with a group of banks and other financial intermediaries. We typically maintain cash and cash equivalent balances and short-term investments in excess of our commercial paper and other short-term borrowings. As of
March 31, 2019
,
we had access to a
$7.0 billion
U.S. revolving credit facility expiring in 2023, which may be used to support our commercial paper borrowings. In addition to the U.S. revolving credit facility, our lenders have provided us an additional
$527 million
lines of credit, of which
$498 million
expire within one year. Of these total lines of credit,
$7.5 billion
were unused as of
March 31, 2019
.
LIBOR
From time to time, we issue variable rate debt based on LIBOR, or undertake interest rate swaps that contain a variable element based on LIBOR. Banks currently reporting information used to set LIBOR will stop doing so after 2021. Various parties, including government agencies, are seeking to identify an alternative rate to replace LIBOR. We are monitoring their efforts, and we will likely amend contracts to accommodate any replacement rate where it is not already provided.
Global Economic Conditions––General
The global economic environment has not had, nor do we anticipate it will have, a material impact on our liquidity or capital resources. Due to our significant operating cash flows, financial assets, access to capital markets and available lines of credit and revolving credit agreements, we continue to believe that we have, and will maintain, the ability to meet our liquidity needs for the foreseeable future. We monitor our liquidity position continuously in the face of evolving economic conditions. For additional information see the “Overview of Our Performance, Operating Environment, Strategy and Outlook––Our Operating Environment––The Global Economic Environment” section in this MD&A.
Global Economic Conditions––Venezuela Operations
Our Venezuela operations continue to operate with the U.S. dollar as the functional currency due to the hyperinflationary status of the Venezuelan economy.
We used the Venezuelan bolivar soberano rate of
3,298.64
as our best estimate to revalue our Venezuelan bolivar denominated net monetary assets. The current DICOM rate is about
5,203.21
. Future actions by the Venezuelan government in response to economic uncertainties could impact the recoverability of our investment in Venezuela, which could result in an impairment charge and, under extreme circumstances, could impact our ability to continue to operate in the country in the same manner as
86
we have historically. We have in Venezuela a few net monetary assets and
$58 million
of non-monetary assets, and
$11 million
of deferred foreign exchange losses reported in the balance sheet in
Accumulated other comprehensive loss––Foreign currency translation adjustments
at
February 24, 2019
, our international quarter-end.
Global Economic Conditions––Argentina Operations
Our Argentina operations function in a hyperinflationary economy. The impact to Pfizer is not considered material.
Off-Balance Sheet Arrangements
In the ordinary course of business and in connection with the sale of assets and businesses and other transactions, we often indemnify our counterparties against certain liabilities that may arise in connection with a transaction or that are related to events and activities prior to or following a transaction. If the indemnified party were to make a successful claim pursuant to the terms of the indemnification, we may be required to reimburse the loss. These indemnification obligations generally are subject to various restrictions and limitations. Historically, we have not paid significant amounts under these provisions and, as of
March 31, 2019
, the estimated fair value of our indemnity obligations was not significant.
Certain of our co-promotion or license agreements give our licensors or partners the rights to negotiate for, or in some cases to obtain under certain financial conditions, co-promotion or other rights in specified countries with respect to certain of our products.
Share-Purchase Plans and Accelerated Share Repurchase Agreements
Our December 2017 $10 billion share repurchase program was exhausted in the first quarter of 2019.
In December 2018, the Board of Directors authorized a new
$10.0 billion
share repurchase program to be utilized over time (the 2018 program) and share repurchases commenced thereunder in the first quarter of 2019.
On
February 7, 2019
, we entered into an accelerated share repurchase agreement with
GS&Co.
to repurchase approximately
$6.8 billion
of our common stock. For additional information, see Notes to Condensed Consolidated Financial Statements––
Note 12C
.
Contingencies and Certain Commitments
: Certain Commitments
and “Unregistered Sales of Equity Securities and Use of Proceeds––Issuer Purchases of Equity Securities” in Part II, Item 2 of this Quarterly Report on Form 10-Q.
|
The following table provides the number of shares of our common stock purchased and the cost of purchases under our publicly announced share purchase plans, including our accelerated share repurchase agreements:
|
||||||||
|
Three Months Ended
|
||||||||
|
(SHARES IN MILLIONS, DOLLARS IN BILLIONS)
|
March 31, 2019
(a)
|
|
April 1,
2018
(b)
|
|
||||
|
Shares of common stock purchased
|
180
|
|
145
|
|
||||
|
Cost of purchase
|
$
|
8.9
|
|
$
|
6.1
|
|
||
|
(a)
|
Represents shares purchased pursuant to an accelerated share repurchase agreement with
GS&Co.
entered into on February 7, 2019, as well as other share repurchases. For additional information, see Notes to Condensed Consolidated Financial Statements––
Note 12C
.
Contingencies and Certain Commitments
: Certain Commitments
and “Unregistered Sales of Equity Securities and Use of Proceeds––Issuer Purchases of Equity Securities” in Part II, Item 2 of this Quarterly Report on Form 10-Q.
|
|
(b)
|
Represents shares purchased pursuant to an accelerated share repurchase agreement with Citibank entered into on March 12, 2018, as well as other share repurchases. For additional information, see Notes to Consolidated Financial Statements––
Note 12
.
Equity
in our
2018
Financial Report.
|
After giving effect to the accelerated share repurchase agreement and other share repurchases through March 31, 2019, our remaining share-purchase authorization was approximately
$5.3 billion
on March 31, 2019.
Dividends on Common Stock
In April 2019, our Board of Directors declared a dividend of $0.36 per share, payable on June 7,
2019
, to shareholders of record at the close of business on May 10,
2019
.
87
NEW ACCOUNTING STANDARDS
Recently Adopted Accounting Standards
See Notes to Condensed Consolidated Financial Statements––
Note 1B. Basis of Presentation and Significant Accounting
Policies: Adoption of New Accounting Standards.
|
Recently Issued Accounting Standards, Not Adopted as of March 31, 2019
|
||||
|
Standard/Description
|
Effective Date
|
Effect on the Financial Statements or Other Significant Matters
|
||
|
In June 2016, the FASB issued new guidance on accounting for
credit losses of financial instruments
. The new guidance replaces the probable initial recognition threshold for incurred loss estimates in current GAAP with a methodology that reflects expected credit loss estimates.
|
January 1, 2020. Earlier application is permitted as of fiscal years beginning after December 15, 2018, including interim periods within that fiscal year.
|
We are assessing the impact of the provisions of this new guidance on our consolidated financial statements. This standard includes our financial instruments, such as accounts receivable, and investments that are generally of high credit quality.
Previously, when credit losses were measured under GAAP, an entity generally only considered past events and current conditions in measuring the incurred loss.
The new guidance requires us to identify, analyze, document and support new methodologies for quantifying expected credit loss estimates for our financial instruments, using information such as historical experience and current economic conditions, plus the use of reasonable supportable forecast information.
|
||
|
In January 2017, the FASB issued new guidance for
goodwill impairment testing
. The new guidance eliminates the requirement to perform a hypothetical purchase price allocation to measure goodwill impairment. Under the new guidance the goodwill impairment test is performed by comparing the fair value of a reporting unit with its carrying amount, and recognizing an impairment charge for the amount by which the carrying amount of the reporting unit exceeds its fair value, although it cannot exceed the total amount of goodwill allocated to that reporting unit.
|
January 1, 2020. Earlier application is permitted.
|
We do not expect this new guidance to have a material impact on our consolidated financial statements.
|
||
|
In August 2018, the FASB issued new guidance related to
customers’ accounting for implementation costs incurred in a cloud computing arrangement that is considered a service contract
. The new guidance aligns the requirements for capitalizing implementation costs in such arrangements with the requirements for capitalizing implementation costs incurred to develop or obtain internal-use software. The new guidance can be adopted either prospectively or retrospectively.
|
January 1, 2020. Earlier application is permitted.
|
We are assessing the impact of the provisions of this new guidance on our consolidated financial statements. We do not expect this new guidance to have a material impact on our consolidated financial statements.
|
||
|
In November 2018, the FASB issued new guidance clarifying the interaction between the accounting guidance for
collaboration agreements
and
revenue from contracts with customers
.
|
January 1, 2020. Earlier application is permitted
|
We have assessed the impact of the provisions of this new guidance and do not expect it will have a material impact on our consolidated financial statements.
|
||
88
FORWARD-LOOKING INFORMATION AND FACTORS THAT MAY AFFECT FUTURE RESULTS
This report and other written or oral statements that we make from time to time contain forward-looking statements. Such forward-looking statements involve substantial risks and uncertainties. We have tried, wherever possible, to identify such statements by using words such as “will,” “may,” “could,” “likely,” “ongoing,” “anticipate,” “estimate,” “expect,” “project,” “intend,” “plan,” “believe,” “assume,” “target,” “forecast,” “guidance,” “goal,” “objective,” “aim,” “seek” and other words and terms of similar meaning or by using future dates in connection with any discussion of, among other things, our anticipated operating and financial performance, business plans and prospects, expectations for in-line products and product candidates, including anticipated regulatory submissions, data read-outs, study starts, approvals, revenue contribution, growth, performance, timing of exclusivity and potential benefits, strategic reviews, capital allocation objectives, business-development plans, benefits anticipated from the reorganization of our commercial operations into three businesses, which became effective at the beginning of our 2019 fiscal year, our acquisitions and other business development activities, our ability to successfully capitalize on growth opportunities or prospects, manufacturing and product supply and plans relating to share repurchases and dividends. In particular, these include statements relating to future actions, business plans and prospects, our acquisitions and other business development activities, our proposed transaction with GSK to combine our respective consumer healthcare businesses into a new consumer healthcare joint venture, prospective products or product approvals, our product pipeline, future performance or results of current and anticipated products, sales efforts, expenses, interest rates, foreign exchange rates, the outcome of contingencies, such as legal proceedings, plans relating to share repurchases and dividends, government regulation and financial results, including, in particular, the anticipated progress in remediation efforts at certain of our Hospira manufacturing facilities and the expectations related to our supply issues set forth in the “Overview of Our Performance, Operating Environment, Strategy and Outlook––Our Business––Product Manufacturing” section of this MD&A, the benefits expected from the reorganization of our commercial operations into three businesses, which became effective at the beginning of our 2019 fiscal year and our expectations regarding growth set forth in the “Overview of Our Performance, Operating Environment, Strategy and Outlook––Our Strategy––Organizing for Growth” section of this MD&A, the expected timing of completion and benefits of our proposed transaction with GSK to combine our respective consumer healthcare businesses into a new consumer healthcare joint venture set forth in the “Overview of Our Performance, Operating Environment, Strategy and Outlook––Our Business,” “––Our Strategy––Our Business Development Initiatives” sections of this MD&A, the anticipated costs related to our preparations for Brexit set forth in the “Overview of Our Performance, Operating Environment, Strategy and Outlook––Our Operating Environment––The Global Economic Environment” section of this MD&A, our anticipated liquidity position set forth in the “Overview of Our Performance, Operating Environment, Strategy and Outlook––Our Operating Environment––The Global Economic Environment” and the “Analysis of Financial Condition, Liquidity and Capital Resources” sections of this MD&A, our plans for increasing investment in the U.S. set forth in the “Overview of Our Performance, Operating Environment, Strategy and Outlook––Our Strategy––Capital Allocation and Expense Management––Increasing Investment in the U.S.” section of this MD&A, the financial guidance set forth in the “Overview of Our Performance, Operating Environment, Strategy and Outlook––Our Financial Guidance for
2019
” section of this MD&A, the anticipated costs and savings from our 2017-2019 initiatives and our Organizing for Growth initiative, set forth in the “Costs and Expenses––Restructuring Charges and Other Costs Associated with Acquisitions and Cost-Reduction/Productivity Initiatives” section of this MD&A and in Notes to Condensed Consolidated Financial Statements––
Note 3.
Restructuring Charges and Other Costs Associated with Acquisitions and Cost-Reduction/Productivity Initiatives
,
the benefits expected from our business development transactions and the contributions that we expect to make from our general assets to the company’s pension and postretirement plans during
2019
set forth in Notes to Condensed Consolidated Financial Statements––
Note 10.
Pension and Postretirement Benefit Plans
. Among the factors that could cause actual results to differ materially from past results and future plans and projected future results are the following:
|
•
|
the outcome of R&D activities, including, without limitation, the ability to meet anticipated pre-clinical or clinical endpoints, commencement and/or completion dates for our pre-clinical or clinical trials, regulatory submission dates, regulatory approval dates and/or launch dates, as well as the possibility of unfavorable pre-clinical and clinical trial results, including the possibility of unfavorable new clinical data and further analyses of existing clinical data;
|
|
•
|
the risk we may not be able to successfully address all of the comments received from regulatory authorities such as the FDA or the EMA, or obtain approval from regulators, which will depend on myriad factors, including such regulator making a determination as to whether a product’s benefits outweigh its known risks and a determination of the product’s efficacy; regulatory decisions impacting labeling, manufacturing processes, safety and/or other matters; and recommendations by technical or advisory committees, such as ACIP, that may impact the use of our vaccines;
|
|
•
|
the speed with which regulatory authorizations, pricing approvals and product launches may be achieved;
|
|
•
|
the outcome of post-approval clinical trials, which could result in the loss of marketing approval, changes in product labeling, and/or new or increased concerns about the side effects or efficacy of, a product that could affect its availability or commercial potential;
|
89
|
•
|
the success of external business-development activities, including the ability to identify and execute on potential business development opportunities, the ability to satisfy the conditions to closing of announced transactions in the anticipated time frame or at all, the ability to realize the anticipated benefits of any such transactions, and the potential need to obtain additional equity or debt financing to pursue these opportunities, which could result in increased leverage and impact our credit ratings;
|
|
•
|
competitive developments, including the impact on our competitive position of new product entrants, in-line branded products, generic products, private label products, biosimilars and product candidates that treat diseases and conditions similar to those treated by our in-line drugs and drug candidates;
|
|
•
|
the implementation by the FDA and regulatory authorities in certain countries of an abbreviated legal pathway to approve biosimilar products, which could subject our biologic products to competition from biosimilar products, with attendant competitive pressures, after the expiration of any applicable exclusivity period and patent rights;
|
|
•
|
risks related to our ability to develop and launch biosimilars, including risks associated with “at risk” launches, defined as the marketing of a product by Pfizer before the final resolution of litigation (including any appeals) brought by a third party alleging that such marketing would infringe one or more patents owned or controlled by the third party, and access challenges for our biosimilar products where our product may not receive appropriate formulary access or remains in a disadvantaged position relative to the innovator product;
|
|
•
|
the ability to meet competition from generic, branded and biosimilar products after the loss or expiration of patent protection for our products or competitor products;
|
|
•
|
the ability to successfully market both new and existing products domestically and internationally;
|
|
•
|
difficulties or delays in manufacturing, including delays caused by natural events, such as hurricanes; supply shortages at our facilities; and legal or regulatory actions, such as warning letters, suspension of manufacturing, seizure of product, injunctions, debarment, voluntary recall of a product or failure to secure product approvals;
|
|
•
|
trade buying patterns;
|
|
•
|
the impact of existing and future legislation and regulatory provisions on product exclusivity;
|
|
•
|
trends toward managed care and healthcare cost containment, and our ability to obtain or maintain timely or adequate pricing or favorable formulary placement for our products;
|
|
•
|
the impact of any significant spending reductions or cost controls affecting Medicare, Medicaid or other publicly funded or subsidized health programs or changes in the tax treatment of employer-sponsored health insurance that may be implemented;
|
|
•
|
the impact of any U.S. healthcare reform or legislation, including any replacement, repeal, modification or invalidation of some or all of the provisions of the U.S. Patient Protection and Affordable Care Act, as amended by the Health Care and Education Reconciliation Act;
|
|
•
|
U.S. federal or state legislation or regulatory action and/or policy efforts affecting, among other things, pharmaceutical product pricing, intellectual property, reimbursement or access, including under Medicaid, Medicare and other publicly funded or subsidized health programs; patient out-of-pocket costs for medicines, manufacturer prices and/or price increases that could result in new mandatory rebates and discounts or other pricing restrictions; general budget control actions; the importation of prescription drugs from outside the U.S. at prices that are regulated by governments of various foreign countries; revisions to reimbursement of biopharmaceuticals under government programs; restrictions on U.S. direct-to-consumer advertising; limitations on interactions with healthcare professionals; or the use of comparative effectiveness methodologies that could be implemented in a manner that focuses primarily on the cost differences and minimizes the therapeutic differences among pharmaceutical products and restricts access to innovative medicines; as well as pricing pressures for our products as a result of highly competitive insurance markets;
|
|
•
|
legislation or regulatory action in markets outside the U.S., including China, affecting pharmaceutical product pricing, intellectual property, reimbursement or access, including, in particular, continued government-mandated reductions in prices and access restrictions for certain biopharmaceutical products to control costs in those markets;
|
|
•
|
the exposure of our operations outside the U.S. to possible capital and exchange controls, economic conditions, expropriation and other restrictive government actions, changes in intellectual property legal protections and remedies, as well as political unrest, unstable governments and legal systems and inter-governmental disputes;
|
|
•
|
contingencies related to actual or alleged environmental contamination;
|
|
•
|
claims and concerns that may arise regarding the safety or efficacy of in-line products and product candidates;
|
|
•
|
any significant breakdown, infiltration or interruption of our information technology systems and infrastructure;
|
|
•
|
legal defense costs, insurance expenses and settlement costs;
|
90
|
•
|
the risk of an adverse decision or settlement and the adequacy of reserves related to legal proceedings, including patent litigation, such as claims that our patents are invalid and/or do not cover the product of the generic drug manufacturer or where one or more third parties seeks damages and/or injunctive relief to compensate for alleged infringement of its patents by our commercial or other activities, product liability and other product-related litigation, including personal injury, consumer, off-label promotion, securities, antitrust and breach of contract claims, commercial, environmental, government investigations, employment and other legal proceedings, including various means for resolving asbestos litigation, as well as tax issues;
|
|
•
|
the risk that our currently pending or future patent applications may not result in issued patents, or be granted on a timely basis, or any patent-term extensions that we seek may not be granted on a timely basis, if at all;
|
|
•
|
our ability to protect our patents and other intellectual property, both domestically and internationally;
|
|
•
|
interest rate and foreign currency exchange rate fluctuations, including the impact of possible currency devaluations in countries experiencing high inflation rates;
|
|
•
|
governmental laws and regulations affecting domestic and foreign operations, including, without limitation, tax obligations and changes affecting the tax treatment by the U.S. of income earned outside the U.S. that may result from pending and possible future proposals, including further clarifications and/or interpretations of the TCJA enacted in 2017;
|
|
•
|
any significant issues involving our largest wholesale distributors, which account for a substantial portion of our revenues;
|
|
•
|
the possible impact of the increased presence of counterfeit medicines in the pharmaceutical supply chain on our revenues and on patient confidence in the integrity of our medicines;
|
|
•
|
the end result of any negotiations between the U.K. government and the EU regarding the terms of the U.K.’s exit from the EU, which could have implications on our research, commercial and general business operations in the U.K. and the EU, including the approval and supply of our products;
|
|
•
|
any significant issues that may arise related to the outsourcing of certain operational and staff functions to third parties, including with regard to quality, timeliness and compliance with applicable legal or regulatory requirements and industry standards;
|
|
•
|
any significant issues that may arise related to our joint ventures and other third-party business arrangements;
|
|
•
|
changes in U.S. generally accepted accounting principles;
|
|
•
|
further clarifications and/or changes in interpretations of existing laws and regulations, or changes in laws and regulations, in the U.S. and other countries;
|
|
•
|
uncertainties related to general economic, political, business, industry, regulatory and market conditions including, without limitation, uncertainties related to the impact on us, our customers, suppliers and lenders and counterparties to our foreign-exchange and interest-rate agreements of challenging global economic conditions and recent and possible future changes in global financial markets; the related risk that our allowance for doubtful accounts may not be adequate; and the risks related to volatility of our income due to changes in the market value of equity investments;
|
|
•
|
any changes in business, political and economic conditions due to actual or threatened terrorist activity in the U.S. and other parts of the world, and related U.S. military action overseas;
|
|
•
|
growth in costs and expenses;
|
|
•
|
changes in our product, segment and geographic mix;
|
|
•
|
the impact of purchase accounting adjustments, acquisition-related costs, discontinued operations and certain significant items;
|
|
•
|
the impact of acquisitions, divestitures, restructurings, internal reorganizations, including the reorganization of our commercial operations into three businesses, which became effective at the beginning of the company’s 2019 fiscal year, any other corporate strategic initiatives, and cost-reduction and productivity initiatives, each of which requires upfront costs but may fail to yield anticipated benefits and may result in unexpected costs or organizational disruption;
|
|
•
|
the impact of product recalls, withdrawals and other unusual items;
|
|
•
|
the risk of an impairment charge related to our intangible assets, goodwill or equity-method investments;
|
|
•
|
risks related to internal control over financial reporting;
|
91
|
•
|
risks and uncertainties related to acquisitions, including, among other things, the ability to realize the anticipated benefits of those acquisitions, including the possibility that the expected cost savings and/or accretion from certain of those acquisitions will not be realized or will not be realized within the expected time frame; the risk that the businesses will not be integrated successfully; disruption from the transactions making it more difficult to maintain business and operational relationships; risks related to our ability to grow revenues for certain acquired products; significant transaction costs; and unknown liabilities; and
|
|
•
|
risks and uncertainties related to our proposed transaction with GSK to combine our respective consumer healthcare businesses into a new consumer healthcare joint venture, including, among other things, risks related to the satisfaction of the conditions to closing the transaction (including the failure to obtain necessary regulatory approvals) in the anticipated timeframe or at all and the possibility that the transaction does not close, risks related to the ability to realize the anticipated benefits of the transaction, including the possibility that the expected benefits and cost synergies from the proposed transaction will not be realized or will not be realized within the expected time period, the risk that the businesses will not be integrated successfully, the possibility that a future separation of the joint venture may not occur, disruption from the transaction making it more difficult to maintain business and operational relationships, negative effects of the announcement or the consummation of the proposed transaction on the market price of Pfizer’s common stock and on Pfizer’s operating results, significant transaction costs, unknown liabilities, the risk of litigation and/or regulatory actions related to the proposed transaction, other business effects, including the effects of industry, market, economic, political or regulatory conditions, future exchange and interest rates, changes in tax and other laws, regulations, rates and policies, future business combinations or disposals and competitive developments.
|
We cannot guarantee that any forward-looking statement will be realized. Achievement of anticipated results is subject to substantial risks, uncertainties and inaccurate assumptions. Should known or unknown risks or uncertainties materialize or should underlying assumptions prove inaccurate, actual results could vary materially from past results and those anticipated, estimated or projected. Investors should bear this in mind as they consider forward-looking statements, and are cautioned not to put undue reliance on forward-looking statements.
We undertake no obligation to publicly update forward-looking statements, whether as a result of new information, future events or otherwise, except as required by law or by the rules and regulations of the SEC. You are advised, however, to consult any further disclosures we make on related subjects.
Additional discussion regarding certain risks, uncertainties and assumptions described above, as well as other material risks to our business, is included under the heading entitled “Risk Factors” in Part I, Item 1A. of our 2018 Form 10-K. These risks could cause actual results to differ materially from past and projected future results. We note these factors for investors as permitted by the Private Securities Litigation Reform Act of 1995. We incorporate that section of the 2018 Form 10-K in this filing and investors should refer to it. You should understand that it is not possible to predict or identify all such factors. Consequently, you should not consider any such list to be a complete set of all potential risks or uncertainties.
The operating segment information provided in this report does not purport to represent the revenues, costs and income from continuing operations before provision for taxes on income that each of our operating segments would have recorded had each segment operated as a standalone company during the periods presented.
This report includes discussion of certain clinical studies relating to various in-line products and/or product candidates. These studies typically are part of a larger body of clinical data relating to such products or product candidates, and the discussion herein should be considered in the context of the larger body of data. In addition, clinical trial data are subject to differing interpretations, and, even when we view data as sufficient to support the safety and/or effectiveness of a product candidate or a new indication for an in-line product, regulatory authorities may not share our views and may require additional data or may deny approval altogether.
Legal Proceedings and Contingencies
Information with respect to legal proceedings and contingencies required by this Item is incorporated herein by reference to Notes to Condensed Consolidated Financial Statements––
Note 12A.
Contingencies and Certain Commitments
: Legal Proceedings
in Part I, Item 1, of this Quarterly Report on Form 10-Q.
92
Item 3. Quantitative and Qualitative Disclosures About Market Risk
Information required by this item is incorporated by reference from the discussion under the heading
Financial Risk Management
in our
2018
Financial Report and Part II, Item 1A, “Risk Factors” of this Quarterly Report on Form 10-Q.
Item 4. Controls and Procedures
As of the end of the period covered by this report, we carried out an evaluation, under the supervision and with the participation of our principal executive officer and principal financial officer, of the effectiveness of the design and operation of our disclosure controls and procedures (as such term is defined in Rules 13a-15(e) and 15d-15(e) under the Exchange Act). Based on this evaluation, our principal executive officer and principal financial officer concluded that our disclosure controls and procedures are effective in alerting them in a timely manner to material information required to be disclosed in our periodic reports filed with the SEC.
During our most recent fiscal quarter, there has not been any change in our internal control over financial reporting (as such term is defined in Rules 13a-15(f) and 15d-15(f) under the Exchange Act) that has materially affected, or is reasonably likely to materially affect, our internal control over financial reporting.
93
PART II - OTHER INFORMATION
Item 1. Legal Proceedings
The information required by this Item is incorporated herein by reference to Notes to Condensed Consolidated Financial Statements––
Note 12A.
Contingencies and Certain Commitments
: Legal Proceedings
in Part I, Item 1, of this Quarterly Report on Form 10-Q.
Tax Matters
Additional information with respect to tax matters required by this Item is incorporated herein by reference to Notes to Condensed Consolidated Financial Statements––
Note 5B. Tax Matters: Tax Contingencies
in Part I, Item 1, of this Quarterly Report on Form 10-Q.
We account for income tax contingencies using a benefit recognition model. If our initial assessment fails to result in the recognition of a tax benefit, we regularly monitor our position and subsequently recognize the tax benefit: (i) if there are changes in tax law, analogous case law or there is new information that sufficiently raise the likelihood of prevailing on the technical merits of the position to “more likely than not”; (ii) if the statute of limitations expires; or (iii) if there is a completion of an audit resulting in a favorable settlement of that tax year with the appropriate agency. We regularly re-evaluate our tax positions based on the results of audits of federal, state and foreign income tax filings, statute of limitations expirations, changes in tax law or receipt of new information that would either increase or decrease the technical merits of a position relative to the “more-likely-than-not” standard.
Our assessments are based on estimates and assumptions that have been deemed reasonable by management, but our estimates of unrecognized tax benefits and potential tax benefits may not be representative of actual outcomes, and variation from such estimates could materially affect our financial statements in the period of settlement or when the statutes of limitations expire, as we treat these events as discrete items in the period of resolution. Finalizing audits with the relevant taxing authorities can include formal administrative and legal proceedings, and, as a result, it is difficult to estimate the timing and range of possible changes related to our uncertain tax positions, and such changes could be significant.
Item 1A. Risk Factors
The “Our Operating Environment” and “Forward-Looking Information and Factors That May Affect Future Results” sections of the MD&A of this Quarterly Report on Form 10-Q and Part I, Item 1A, “Risk Factors” of our
2018
Form 10-K are incorporated by reference herein. There have been no material changes from the risk factors discussed in Part I, Item 1A, “Risk Factors” of our
2018
Form 10-K.
94
Item 2. Unregistered Sales of Equity Securities and Use of Proceeds
The following table provides certain information with respect to our purchases of shares of the Company’s common stock during the
first
fiscal quarter of
2019
:
Issuer Purchases of Equity Securities
(a)
|
Period
|
Total Number of
Shares Purchased
(a), (b)
|
|
Average Price
Paid per Share
(a), (b)
|
|
Total Number of Shares Purchased as Part of Publicly Announced Plan
(a)
|
|
Approximate Dollar Value of Shares That May Yet Be Purchased Under the Plan
(a)
|
|
||||||
|
January 1, 2019 through January 27, 2019
|
30,571,524
|
|
$
|
42.74
|
|
30,534,439
|
|
$
|
12,852,881,452
|
|
||||
|
January 28, 2019 through February 24, 2019
|
149,288,448
|
|
$
|
41.68
|
|
148,967,228
|
|
$
|
5,292,881,709
|
|
||||
|
February 25, 2019 through March 31, 2019
|
6,675,405
|
|
$
|
43.28
|
|
—
|
|
$
|
5,292,881,709
|
|
||||
|
Total
|
186,535,377
|
|
$
|
41.91
|
|
179,501,667
|
|
|||||||
|
(a)
|
Our December 2017 $10 billion share repurchase program was exhausted in the first quarter of 2019. In December 2018, the Board of Directors authorized a new
$10.0 billion
share repurchase program to be utilized over time (the 2018 program) and share repurchases commenced thereunder in the first quarter of 2019. On
February 7, 2019
, we entered into an accelerated share repurchase agreement with
GS&Co.
to repurchase approximately
$6.8 billion
of our common stock. For additional information, see the Notes to Condensed Consolidated Financial Statements
––Note 12C.
Contingencies and Certain Commitments
: Certain Commitments
. At
March 31, 2019
, our remaining share-purchase authorization under the 2018 program was approximately
$5.3 billion
.
|
|
(b)
|
In addition to the amounts purchased under our share repurchase programs, including amounts purchased under the accelerated share repurchase agreement with
GS&Co.
, these columns represent (i)
7,028,724
shares of common stock surrendered to the Company to satisfy tax withholding obligations in connection with the vesting of awards under our long-term incentive programs and (ii) the open market purchase by the trustee of
4,986
shares of common stock in connection with the reinvestment of dividends paid on common stock held in trust for employees who were granted performance share awards and who deferred receipt of such awards.
|
Item 3. Defaults Upon Senior Securities
None.
Item 4. Mine Safety Disclosures
Not applicable.
Item 5. Other Information
None.
95
Item 6. Exhibits
|
-
|
Pfizer Inc. 2019 Stock Plan is incorporated by reference from our Proxy Statement for the 2019 Annual Meeting of Shareholders (File No. 001-03619).
|
||
|
-
|
The 2018 Form 10-K (File No. 001-03619), which, except for sections incorporated by reference, is furnished solely for the information of the SEC and is not to be deemed “filed.”
|
||
|
|
-
|
Accountants’ Acknowledgment.
|
|
|
|
-
|
Certification by the Chief Executive Officer Pursuant to Section 302 of the Sarbanes-Oxley Act of 2002.
|
|
|
|
-
|
Certification by the Chief Financial Officer Pursuant to Section 302 of the Sarbanes-Oxley Act of 2002.
|
|
|
|
-
|
Certification by the Chief Executive Officer Pursuant to 18 U.S.C. Section
1350, as Adopted Pursuant to Section 906 of the Sarbanes-Oxley Act of 2002.
|
|
|
|
-
|
Certification by the Chief Financial Officer Pursuant to 18 U.S.C. Section
1350, as Adopted Pursuant to Section 906 of the Sarbanes-Oxley Act of 2002.
|
|
|
|
Exhibit 101:
|
|
|
|
EX-101.INS
|
XBRL Instance Document
|
||
|
|
EX-101.SCH
EX-101.CAL
EX-101.LAB
EX-101.PRE
EX-101.DEF
|
|
XBRL Taxonomy Extension Schema
XBRL Taxonomy Extension Calculation Linkbase
XBRL Taxonomy Extension Label Linkbase
XBRL Taxonomy Extension Presentation Linkbase
XBRL Taxonomy Extension Definition Document
|
96
SIGNATURE
Pursuant to the requirements of the Securities Exchange Act of 1934, the registrant has duly caused this report to be signed on its behalf by the undersigned thereunto duly authorized.
|
|
Pfizer Inc.
|
|
|
|
(Registrant)
|
|
|
|
|
|
|
|
|
|
|
Dated:
|
May 9, 2019
|
/s/ Loretta V. Cangialosi
|
|
|
Loretta V. Cangialosi, Senior Vice President and
Controller
(Principal Accounting Officer and
Duly Authorized Officer)
|
|
97
TABLE OF CONTENTS
Part I - Financial InformationItem 1. Financial StatementsNote 9A. Identifiable Intangible Assets and Goodwill: Identifiable Intangible AssetsNote 7E. Financial Instruments: Derivative Financial Instruments and Hedging ActivitiesNote 1B. Basis Of Presentation and Significant Accounting Policies: Adoption Of New Accounting StandardsNote 1B. Basis Of Presentation and Significant Accounting Policies: Adoption Of New Accounting Standards in 2018Note 1. Basis Of Presentation and Significant Accounting PoliciesNote 2. Assets and Liabilities Held For SaleNote 3. Restructuring Charges and Other Costs Associated with Acquisitions and Cost-reduction/productivity InitiativesNote 4. Other (income)/deductions NetNote 5. Tax MattersNote 6. Accumulated Other Comprehensive Loss, Excluding Noncontrolling InterestsNote 7. Financial InstrumentsNote 1E. Basis Of Presentation and Significant Accounting Policies: Fair ValueNote 18C. Segment, Geographic and Other Revenue Information: Other Revenue InformationNote 8. InventoriesNote 9. Identifiable Intangible Assets and GoodwillNote 10. Pension and Postretirement Benefit PlansNote 11. Earnings Per Common Share Attributable To Common ShareholdersNote 12. Contingencies and Certain CommitmentsNote 12a3Note 12a2Note 13. Segment, Geographic and Other Revenue InformationItem 2. Management S Discussion and Analysis Of Financial Condition and Results Of OperationsNote 12a1Note 1C. Basis Of Presentation and Significant Accounting Policies: Estimates and AssumptionsNote 1C. Basis Of Presentation and Significant Accounting Policies: Revenues and Trade Accounts ReceivableNote 5A. Tax Matters: Taxes on Income From Continuing OperationsNote 4. Other (income)/deductionsNote 7D. Financial Instruments: Long-term DebtNote 1B. Basis Of Presentation and Significant AccountingItem 3. Quantitative and Qualitative Disclosures About Market RiskItem 4. Controls and ProceduresPart II - Other InformationItem 1. Legal ProceedingsNote 5B. Tax Matters: Tax ContingenciesItem 1A. Risk FactorsItem 2. Unregistered Sales Of Equity Securities and Use Of ProceedsItem 3. Defaults Upon Senior SecuritiesItem 4. Mine Safety DisclosuresItem 5. Other InformationItem 6. Exhibits