PEOPLES FINANCIAL SERVICES CORP.
10-Ks and 10-Qs
|
|
|
|
|
|
|
|
|
|
|
|
|
|
|
|
|
|
|
|
|
|
|
|
|
|
|
|
|
|
|
|
|
|
|
|
|
|
|
|
|
|
|
|
|
|
|
|
|
|
UNITED STATES
SECURITIES AND EXCHANGE COMMISSION
Washington, DC 20549
FORM 10-K
|
(X) ANNUAL REPORT PURSUANT TO SECTION 13 OR 15(d) OF THE SECURITIES EXCHANGE ACT OF 1934
|
||||
|
For the fiscal year ended December 31, 2011
|
||||
|
or
|
||||
|
( ) TRANSITION REPORT PURSUANT TO SECTION 13 or 15 (d) OF THE SECURITIES EXCHANGE ACT OF 1934
|
||||
|
For the transition period from ______ to ______
|
||||
|
Commission file number
0-23863
|
||||
|
PEOPLES FINANCIAL SERVICES CORP.
|
||||
|
(Exact name of registrant as specified in its charter)
|
||||
|
PENNSYLVANIA
|
23-2391852
|
|||
|
(State of incorporation)
|
(IRS Employer Identification No.)
|
|||
|
82 FRANKLIN AVENUE, HALLSTEAD, PA
|
18822
|
|||
|
(Address of principal executive offices)
|
(Zip code)
|
|||
|
(570) 879-2175
|
||||
|
(Registrant’s telephone number including area code)
|
||||
|
Securities registered pursuant to Section 12(b) of the Act:
|
||||
|
Title of each class
|
Name of each exchange on which registered
|
|||
|
None
|
None
|
|||
|
Securities registered pursuant to Section 12(g) of the Act:
|
||||
|
COMMON STOCK, par value, $2.00 per share
|
||||
|
(Title of Class)
|
||||
|
Indicate by check mark if the registrant is a well-known seasoned issuer, as defined in Rule 405 of the Securities Act. Yes __ No
X
|
||||
|
Indicate by check mark if the registrant is not required to file reports pursuant to Section 13 or Section 15(d) of the Act. Yes__ No
X
|
||||
|
Indicate by check mark whether the registrant (1) has filed all reports required to be filed by Section 13 or 15(d) of the Securities Exchange Act of 1934 during the preceding 12 months or for such shorter period that the registrant was required to file such reports, and (2) has been subject to such filing requirements for the past 90 days. Yes
X
No__
|
||||
|
Indicate by check mark whether the registrant has submitted electronically and posted on its corporate Web site, if any, every Interactive Data File required to be submitted and posted pursuant to Rule 405 of Regulation S-T during the preceding 12 months or for such shorter period that the registrant was required to submit and post such files. Yes
X
No__
|
||||
|
Indicate by check mark if disclosure of delinquent filers pursuant to Item 405 of Regulation S-K is not contained herein, and will not be contained, to the best of registrant’s knowledge, in definitive proxy or information statements incorporated by reference in Part III of this Form 10-K or any amendment to this Form 10-K.
X
|
||||
|
Indicate by check mark whether the registrant is a large accelerated filer, an accelerated filer, a non-accelerated filer or a smaller reporting company as defined in Rule 12b-2 of the Exchange Act.
|
||||
|
Large accelerated filer ____
|
Accelerated filer
X
|
Non-accelerated filer _____
|
Smaller reporting company _____
|
|
|
Indicate by check mark whether the registrant is a shell company as defined in Rule 12b-2 of the Exchange Act. Yes __ No
X
|
||||
|
State the aggregate market value of the voting common stock held by non-affiliates based on the closing sale price as of the last business day of the registrant’s most recently completed second fiscal quarter: $79,909,920 at June 30, 2011
|
||||
|
Indicate the number of shares outstanding of the registrant’s common stock, as of the latest practicable date: 3,117,606 at February 29, 2012.
|
||||
|
DOCUMENTS INCORPORATED BY REFERENCE
|
||||
|
Portions of the registrant’s 2012 Proxy Statement are incorporated by reference in Part III of this Annual Report.
|
||||
|
Page 1 of 102
Exhibit Index on Page 101
|
||||
|
PEOPLES FINANCIAL SERVICES CORP.
FORM 10-K
For the Year Ended December 31, 2011
TABLE OF CONTENTS
|
||
|
Page
|
||
|
Part I
|
Number
|
|
|
Item 1.
|
Business
|
3
|
|
Item 1A.
|
Risk Factors
|
12
|
|
Item 1B.
|
Unresolved Staff Comments
|
15
|
|
Item 2.
|
Properties
|
15
|
|
Item 3.
|
Legal Proceedings
|
15
|
|
Item 4.
|
Mine Safety Disclosures
|
15
|
|
Part II
|
||
|
Item 5.
|
Market for Registrant's Common Equity, Related Stockholder Matters and Issuer Purchases of Equity Securities
|
15
|
|
Item 6.
|
Selected Financial Data
|
18
|
|
Item 7.
|
Management's Discussion and Analysis of Financial Condition and
Results of Operations
|
19
|
|
Item 7A.
|
Quantitative and Qualitative Disclosures About Market Risk
|
52
|
|
Item 8.
|
Financial Statements and Supplementary Data
|
53
|
|
Item 9
.
|
Changes in and Disagreements with Accountants on Accounting and Financial Disclosure
|
97
|
|
Item 9A.
|
Controls and Procedures
|
97
|
|
Item 9B.
|
Other Information
|
100
|
|
Part III
|
||
|
Item 10.
|
Directors, Executive Officers and Corporate Governance
|
100
|
|
Item 11.
|
Executive Compensation
|
100
|
|
Item 12
.
|
Security Ownership of Certain Beneficial Owners and Management
and Related Stockholder Matters
|
100
|
|
Item 13.
|
Certain Relationships and Related Transactions, and Director Independence
|
100
|
|
Item 14.
|
Principal Accountant Fees and Services
|
100
|
|
Part IV
|
||
|
Item 15
.
|
Exhibits and Financial Statement Schedules
|
101
|
|
SIGNATURES
|
102
|
|
2
General
Peoples Financial Services Corp., a bank holding company incorporated in 1986 under the laws of Pennsylvania, provides a full range of financial services through its wholly-owned subsidiaries: Peoples Neighborhood Bank (“Peoples Bank”), including its subsidiaries, Peoples Advisors, LLC, Peoples Financial Leasing, LLC and Peoples Investment Holdings, LLC; and Peoples Financial Capital Corporation (collectively, the “Company”). The Company is headquartered in Hallstead, Pennsylvania and services its retail and commercial customers through eleven full-service community banking offices located within the Lackawanna, Susquehanna and Wyoming counties of Northern Pennsylvania and Broome county of Southern New York.
On December 13, 2010, Peoples Bank converted its charter to a state non-member bank under the jurisdiction of the Pennsylvania Department of Banking (“PADOB”) and the Federal Deposit Insurance Corporation (“FDIC”). Peoples Bank’s primary product is loans to small- and medium-sized businesses. Other lending products include one-to-four family residential mortgages and consumer loans. Peoples Bank primarily funds its loans by offering open time deposits to commercial enterprises and individuals. Other deposit product offerings include certificates of deposits and various demand deposit accounts.
Peoples Advisors, LLC, a member managed limited liability company, provides investment advisory services to individuals and small businesses. Peoples Financial Leasing, LLC, provides employee leasing services to Peoples Bank. Peoples Investment Holdings, LLC, incorporated under the laws of Delaware, maintains and manages the collection and distribution of income from certain investments of Peoples Bank.
Peoples Financial Capital Corporation, incorporated under the laws of Delaware, maintains and manages the collection and distribution of income from certain investments of the Company.
Peoples Advisors, LLC; Peoples Financial Leasing, LLC; Peoples Investment Holdings, LLC; and Peoples Financial Capital Corporation did not meet the quantitative thresholds for required segment disclosure in conformity with accounting principles generally accepted in the United States of America (“GAAP”). Peoples Bank’s eleven community banking offices, all similar with respect to economic characteristics, share a majority of the following aggregation criteria: (i) products and services; (ii) operating processes; (iii) customer bases; (iv) delivery systems; and (v) regulatory oversight. Accordingly, they were aggregated into a single operating segment.
As of December 31, 2011, the Company had 132 full-time equivalent employees. The Company and Peoples Bank are not parties to any collective bargaining agreement and employee relations are considered to be good.
Market Areas
Peoples Bank’s principal market area consists of Susquehanna, Wyoming and Lackawanna Counties of northeastern Pennsylvania and Broome County in the southern tier of New York. In addition, parts of Wayne and Bradford Counties in Pennsylvania that border Susquehanna and Wyoming Counties are also considered part of the market area.
Specifically, Peoples Bank’s market area is situated between:
|
·
|
the city of Binghamton, Broome County, New York, located to the north;
|
|
·
|
the city of Scranton, Lackawanna County, Pennsylvania, to the south; and
|
|
·
|
Wilkes-Barre, Luzerne County, Pennsylvania, to the southwest.
|
Susquehanna County could best be described as a bedroom county with a high percentage of its residents commuting to work in Broome County, New York, or Lackawanna County, Pennsylvania. The southern part of Susquehanna County tends to gravitate south for both employment and shopping, while the northern part of the county goes north to Broome County, New York. The western part of Susquehanna County gravitates south and west to and through Wyoming County. The majority of Peoples Bank’s offices are located in counties that would be considered sparsely populated, as they are made up of many small towns and villages.
3
Most recently, the production of natural gas from the Marcellus Shale formation located in the heart of Peoples Bank’s market area has begun to provide economic benefits to the communities served and as a result to Peoples Bank itself. Natural gas producers have already invested more than $4 billion in Pennsylvania in lease and land acquisition, new well drilling, infrastructure development and community partnerships, with an even greater investment expected in the future. The growth of Peoples Bank’s deposits, and to a lesser extent, loan portfolio, has been influenced by natural gas drilling activities.
Products and Services
Lending Activities
Peoples Bank provides a full range of retail and commercial lending products designed to meet the borrowing needs of consumers and small and medium sized businesses in its market areas. A significant amount of Peoples Bank’s loans are to customers located within the defined market area. Peoples Bank has no foreign loans or highly leveraged transaction loans, as defined by the FRB. Although Peoples Bank participates in loans originated by other banks, the majority of loans in the portfolio have been originated by itself.
Retail lending products include the following types of loans, among others: (i) residential real estate; (ii) automobiles; (iii) manufactured housing; (iv) personal; (v) student; (vi) home equity and (vii) credit card. Commercial lending products include the following types of loans, among others: (i) commercial real estate; (ii) working capital; (iii) equipment and other commercial needs; (iv) construction; (v) Small Business Administration and (vi) agricultural and mineral rights. The terms offered on a loan vary depending primarily on the type of loan and credit-worthiness of the borrower.
Payment risk is a function of the economic climate in which Peoples Bank’s lending activities are conducted. Economic downturns in the economy generally or in a particular sector could cause cash flow problems for customers and make loan payments more difficult. Peoples Bank attempts to minimize this risk by not being exposed to loan concentrations of a single customer or a group of customers, the loss of any one or more of whom would have a materially adverse effect on its financial condition. Interest rate risk (“IRR”) would occur if Peoples Bank were to make loans at fixed rates in an environment in which rates were subject to rise thereby preventing it from making loans at higher prevailing rates. Peoples Bank attempts to mitigate this risk by making adjustable rate commercial loans and by limiting repricing terms to five years or less for customers requiring fixed rate loans. Finally, collateral risk can occur if Peoples Bank’s position in collateral taken as security for loan repayment is not adequate. Peoples Bank minimizes collateral risk by avoiding loan concentrations to particular borrowers, by perfecting liens on collateral and by obtaining appraisals on property prior to extending loans. Peoples Bank attempt to mitigate its exposure to these and other types of risks by stratifying authorization requirements by loan size and complexity.
Deposit Activities
Peoples Bank’s primary source of funds is the cash flow provided by its financing activities, mainly deposit gathering. Other sources of funds are provided by investing activities, including principal and interest payments on loans and investment securities, and operating activities, primarily net income. Peoples Bank offers a variety of deposit accounts with a range of interest rates and terms, including, among others: (i) money market accounts; (ii) NOW accounts; (iii) savings accounts; (iv) certificates of deposit; (v) individual retirement accounts and (vi) demand deposit accounts. These deposits are primarily obtained from areas surrounding People Bank’s branch offices. Peoples Bank relies primarily on marketing, product innovation, technology, service and long-standing relationships with customers to attract and retain these deposits. Other deposit related services include: (i) remote deposit capture; (ii) automatic clearing house transactions; (iii) cash management services; (iv) automated teller machines; (v) point of sale transactions; (vi) safe deposit boxes; (vii) night depository services; (viii) direct deposit and (ix) official check services.
Wealth Management Services
Peoples Wealth Management, a division of Peoples Advisors, LLC, provides a comprehensive array of wealth management products and services to individuals, small businesses and nonprofit entities. These products and services include the following, among others: (i) investment portfolio management; (ii) estate planning; (iii) annuities; (iv) business succession planning; (v) insurances; (vi) education funding strategies and (vii) tax planning.
4
Competition
Peoples Bank competes primarily with commercial banks, thrift institutions and credit unions, many of which are substantially larger in terms of assets and available resources. Certain of these institutions have significantly higher lending limits than Peoples Bank and may provide various services for their customers that are not presently available at Peoples Bank. In addition, Peoples Bank experiences competition for deposits from mutual funds and security brokers, while consumer discount, mortgage and insurance companies compete for various types of loans. Credit unions, finance companies and mortgage companies enjoy certain competitive advantages over Peoples Bank as they are not subject to the same regulatory restrictions and taxations as commercial banks. Principal methods of competing for bank products, permitted nonbanking services and financial activities include price, nature of product, quality of service and convenience of location.
Peoples Bank’s most significant competitive advantage originates from its business philosophy which includes offering direct access to senior management and other officers and providing friendly, informed and courteous service, local and timely decision making, flexible and reasonable operating procedures and consistently applied credit policies. In addition, Peoples Bank’s success has been, and will continue to be, a result of its emphasis on community involvement and customer relationships. With consolidation continuing in the financial industry, and particularly in Peoples Bank’s market area, smaller community banks such as Peoples Bank are gaining opportunities and market share as larger institutions reduce their emphasis on or exit the markets.
Seasonality
Generally, the operations of Peoples Bank are not seasonal in nature. However, Peoples Bank’s business activities have been somewhat influenced by the recent increase in activities related to natural gas drilling in its market area,
Supervision and Regulation
The Company and its subsidiaries are extensively regulated under federal and state laws. Generally, these laws and regulations are intended to protect consumers, not shareholders. The following is a summary description of certain provisions of law that affect the regulation of bank holding companies and banks. This discussion is qualified in its entirety by reference to applicable laws and regulations. Changes in law and regulation may have a material effect on the business and prospects of the Company.
The Company is a bank holding company within the meaning of the Bank Holding Company Act of 1956, as amended, and is subject to regulation, supervision, and examination by the Federal Reserve Board (“FRB”). The Company is required to file annual and quarterly reports with the FRB and to provide the FRB with such additional information as the FRB may require. The FRB also conducts examinations of the Company.
With certain limited exceptions, the Company is required to obtain prior approval from the FRB before acquiring direct or indirect ownership or control of more than 5% of any voting securities or substantially all of the assets of a bank or bank holding company, or before merging or consolidating with another bank holding company. Additionally, with certain exceptions, any person or entity proposing to acquire control through direct or indirect ownership of 25% or more of any voting securities of the Company is required to give 60 days written notice of the acquisition to the FRB, which may prohibit the transaction, and to publish notice to the public.
The Company’s banking subsidiary is regulated by the PADOB and the FDIC. The PADOB may prohibit an institution over which it has supervisory authority from engaging in activities or investments that the agency believes constitute unsafe or unsound banking practices. Federal banking regulators have extensive enforcement authority over the institutions they regulate to prohibit or correct activities that violate law, regulation or a regulatory agreement or which are deemed to constitute unsafe or unsound practices.
5
Enforcement actions may include:
|
·
|
the appointment of a conservator or receiver;
|
|
·
|
the issuance of a cease and desist order;
|
|
·
|
the termination of deposit insurance, the imposition of civil money penalties on the institution, its directors, officers, employees and institution affiliated parties;
|
|
·
|
the issuance of directives to increase capital;
|
|
·
|
the issuance of formal and informal agreements;
|
|
·
|
the removal of or restrictions on directors, officers, employees and institution-affiliated parties; and
|
|
·
|
the enforcement of any such mechanisms through restraining orders or any other court actions.
|
Peoples Bank is subject to certain restrictions on extensions of credit to executive officers, directors, principal shareholders or any related interests of such persons which generally require that such credit extensions be made on substantially the same terms as are available to third persons dealing with Peoples Bank and not involving more than the normal risk of repayment. Other laws tie the maximum amount that may be loaned to any one customer and its related interests to capital levels of Peoples Bank.
The Company is subject to the jurisdiction of the United States Securities and Exchange Commission (“SEC”) for matters relating to the offering and sale of securities. The Company is also subject to the SEC’s rules and regulations relating to periodic reporting, insider trading and proxy solicitation materials.
Limitations on Dividends and Other Payments
The Company’s current ability to pay dividends is largely dependent upon the receipt of dividends from Peoples Bank. Both federal and state laws impose restrictions on the ability of the Company and Peoples Bank to pay dividends. Under such restrictions, Peoples Bank may not, without prior approval, declare dividends in excess of the sum of its net profit for that year combined with its retained net profits of the preceding two calendar years. In addition to these specific restrictions, bank regulatory agencies, in general, also have the ability to prohibit proposed dividends by a financial institution that would otherwise be permitted under applicable regulations if the regulatory body determines that such distribution would constitute an unsafe or unsound practice.
Permitted Non-Banking Activities
Generally, a bank holding company may not engage in any activities other than banking, managing, or controlling its bank and other authorized subsidiaries, and providing service to those subsidiaries. With prior approval of the FRB, the Company may acquire more than 5% of the assets or outstanding shares of a company engaging in non-bank activities determined by the FRB to be closely related to the business of banking or of managing or controlling banks. The FRB provides expedited procedures for expansion into approved categories of non-bank activities.
Subsidiary banks of a bank holding company are subject to certain quantitative and qualitative restrictions: (i) on extensions of credit to the bank holding company or its subsidiaries; and (ii) on the use of their securities as collateral for loans to any borrower. These regulations and restrictions may limit the Company’s ability to obtain funds from Peoples Bank for its cash needs, including funds for the payment of dividends, interest and operating expenses. Further, subject to certain exceptions, a bank holding company and its subsidiaries are prohibited from engaging in certain tie-in arrangements in connection with any extension of credit, lease or sale of property or furnishing of services.
Under FRB policy, a bank holding company is expected to act as a source of financial strength to its subsidiary banks and to make capital injections into a troubled subsidiary bank, and the FRB may charge the bank holding company with engaging in unsafe and unsound practices for failure to commit resources to a subsidiary bank when required. A required capital injection may be called for at a time when the holding company does not have the resources to provide it. In addition, depository institutions insured by the FDIC can be held liable for any losses incurred by, or reasonably anticipated to be incurred by, the FDIC in connection with the default of or assistance provided to, a commonly controlled FDIC-insured depository institution. Accordingly, in the event that any insured subsidiary of a bank holding company causes a loss to the FDIC, other insured subsidiaries of a bank holding company could be required to compensate the FDIC by reimbursing it for the estimated amount of such loss. Such cross guarantee liabilities generally are superior in priority to the obligation of the depository institutions to its stockholders due solely to their status as stockholders and obligations to other affiliates.
6
Pennsylvania Law
As a Pennsylvania bank holding company, the Company is subject to various restrictions on its activities as set forth in Pennsylvania law. This is in addition to those restrictions set forth in federal law. Under Pennsylvania law, a bank holding company that desires to acquire a bank or bank holding company that has its principal place of business in Pennsylvania must obtain permission from the PADOB.
Interstate Banking Legislation
The Riegle-Neal Interstate Banking and Branching Efficiency Act of 1994 provides that, among other things, substantially all state law barriers to the acquisition of banks by out-of-state bank holding companies were eliminated. The law also permits interstate branching by banks, subject to the ability of states to opt-out completely or to set an earlier effective date.
Financial Institution Reform, Recovery, and Enforcement Act (“FIRREA”)
FIRREA was enacted into law in order to address the financial condition of the Federal Savings and Loan Insurance Corporation, to restructure the regulation of the thrift industry, and to enhance the supervisory and enforcement powers of the federal bank and thrift regulatory agencies. As the primary federal regulator of Peoples Bank, the FDIC, in conjunction with the State is responsible its supervision. When dealing with capital requirements, those regulatory bodies have the flexibility to impose supervisory agreements on institutions that fail to comply with regulatory requirements. The imposition of a capital plan, termination of deposit insurance, and removal or temporary suspension of an officer, director or other institution-affiliated person may cause enforcement actions.
There are three levels of civil penalties under FIRREA.
|
·
|
The first tier provides for civil penalties of up to $5 thousand per day for any violation of law or regulation
|
|
·
|
The second tier provides for civil penalties of up to $25 thousand per day if more than a minimal loss or a pattern is involved.
|
|
·
|
Finally, civil penalties of up to $1 million per day may be assessed for knowingly or recklessly causing a substantial loss to an institution or taking action that results in a substantial pecuniary gain or other benefit.
|
Criminal penalties are increased to $1 million per violation and may be up to $5 million for continuing violations or for the actual amount of gain or loss. These penalties may be combined with prison sentences of up to five years.
Federal Deposit Insurance Corporation Improvement Act of 1991 (“FDICIA”)
FDICIA provides for, among other things:
|
·
|
publicly available annual financial condition and management reports for financial institutions, including audits by independent accountants;
|
|
·
|
the establishment of uniform accounting standards by federal banking agencies;
|
|
·
|
the establishment of a “prompt corrective action” system of regulatory supervision and intervention, based on capitalization levels, with more scrutiny and restrictions placed on depository institutions with lower levels of capital;
|
|
·
|
additional grounds for the appointment of a conservator or receiver; and
|
|
·
|
restrictions or prohibitions on accepting brokered deposits, except for institutions which significantly exceed minimum capital requirements.
|
FDICIA also provides for increased funding of the FDIC insurance funds and the implementation of risk-based premiums.
7
A central feature of FDICIA is the requirement that the federal banking agencies take “prompt corrective action” with respect to depository institutions that do not meet minimum capital requirements. Pursuant to FDICIA, the federal bank regulatory authorities have adopted regulations setting forth a five-tiered system for measuring the capital adequacy of the depository institutions that they supervise. Under these regulations, a depository institution is classified in one of the following capital categories:
|
·
|
"well capitalized";
|
|
·
|
"adequately capitalized";
|
|
·
|
"under capitalized";
|
|
·
|
"significantly undercapitalized"; and
|
|
·
|
"critically undercapitalized".
|
Peoples Bank was categorized as “well capitalized” under the regulatory framework for prompt corrective action at December 31, 2011, based on the most recent notification from the FDIC. An institution may be deemed by the regulators to be in a capitalization category that is lower than is indicated by its actual capital position if, among other things, it receives an unsatisfactory examination rating with respect to asset quality, management, earnings or liquidity.
FDICIA generally prohibits a depository institution from making any capital distribution including payment of a cash dividend or paying any management fees to its holding company, if the depository institution would thereafter be undercapitalized. Undercapitalized depository institutions are subject to growth limitations and are required to submit capital restoration plans. If a depository fails to submit an acceptable plan, it is treated as if it is “significantly undercapitalized”. Significantly undercapitalized depository institutions may be subject to a number of other requirements and restrictions, including orders to sell sufficient voting stock to become adequately capitalized, requirements to reduce total assets and stop accepting deposits from correspondent banks. Critically undercapitalized institutions are subject to the appointment of a receiver or conservator; generally within 90 days of the date such institution is determined to be critically undercapitalized.
FDICIA provides the federal banking agencies with significantly expanded powers to take enforcement action against institutions that fail to comply with capital or other standards. Such actions may include the termination of deposit insurance by the FDIC or the appointment of a receiver or conservator for the institution. FDICIA also limits the circumstances under which the FDIC is permitted to provide financial assistance to an insured institution before appointment of a conservator or receiver.
Under FDICIA, each federal banking agency is required to prescribe, by regulation, non-capital safety and soundness standards for institutions under its authority. The federal banking agencies, including the FDIC, have adopted standards covering:
|
·
|
internal controls;
|
|
·
|
information systems and internal audit systems;
|
|
·
|
loan documentation;
|
|
·
|
credit underwriting;
|
|
·
|
interest rate exposure;
|
|
·
|
asset growth; and
|
|
·
|
compensation fees and benefits.
|
Any institution that fails to meet these standards may be required to develop an acceptable plan, specifying the steps that the institutions will take to meet the standards. Failure to submit or implement such a plan may subject the institution to regulatory sanctions. The Company believes that it meets substantially all the standards that have been adopted. FDICIA also imposed new capital standards on insured depository institutions. Before establishing new branch offices, Peoples Bank must meet certain minimum capital stock and surplus requirements and must obtain State approval.
8
Risk-Based Capital Requirements
The federal banking regulators have adopted certain risk-based capital guidelines to assist in the assessing capital adequacy of a banking organization’s operations for both transactions reported on the balance sheet as assets and transactions, such as letters of credit, and recourse agreements, which are recorded as off-balance sheet items. Under these guidelines, nominal dollar amounts of assets and credit-equivalent amounts of off-balance sheet items are multiplied by one of several risk adjustment percentages, which range from 0% for assets with low credit risk, such as certain US Treasury securities, to 100% for assets with relatively high credit risk, such as business loans.
A banking organization’s risk-based capital ratios are obtained by dividing its qualifying capital by its total risk adjusted assets. The regulators measure risk-adjusted assets, which include off-balance-sheet items, against both total qualifying capital, the sum of Tier 1 capital and limited amounts of Tier 2 capital, and Tier 1 capital.
|
·
|
"Tier 1", or core capital, includes common equity, perpetual preferred stock and minority interest in equity accounts of consolidated subsidiaries, less goodwill and other intangibles, subject to certain exceptions.
|
|
·
|
"Tier 2", or supplementary capital, includes, among other things, limited life preferred stock, hybrid capital instruments, mandatory convertible securities, qualifying subordinated debt, and the allowance for loan and lease losses, subject to certain limitations and less restricted deductions. The inclusion of elements of Tier 2 capital is subject to certain other requirements and limitations of the federal banking agencies.
|
Banks and bank holding companies subject to the risk-based capital guidelines are required to maintain a ratio of Tier 1 capital to risk-weighted assets of at least 4% and a ratio of total capital to risk-weighted assets of at least 8%. The appropriate regulatory authority may set higher capital requirements when particular circumstances warrant. As of December 31, 2011, At December 31, 2011. The Company met both requirements with Tier 1 and Total capital ratios of 11.57% and 12.69%. In addition to risk-based capital, banks and bank holding companies are required to maintain a minimum amount of Tier 1 capital to total assets, referred to as the leverage capital ratio, of at least 4.00%. At December 31, 2011, the Company’s leverage ratio was 9.42%.
Failure to meet applicable capital guidelines could subject a banking organization to a variety of enforcement actions including:
|
·
|
limitations on its ability to pay dividends;
|
|
·
|
the issuance by the applicable regulatory authority of a capital directive to increase capital, and in the case of depository institutions, the termination of deposit insurance by the FDIC, as well as to the measures described under FDICIA as applicable to undercapitalized institutions.
|
In addition, future changes in regulations or practices could further reduce the amount of capital recognized for purposes of capital adequacy. Such a change could affect the ability of Peoples Bank to grow and could restrict the amount of profits, if any, available for the payment of dividends to the Company.
Interest Rate Risk
Regulatory agencies include, in their evaluations of a bank’s capital adequacy, an assessment of the bank’s IRR exposure. The standards for measuring the adequacy and effectiveness of a banking organization’s IRR management includes a measurement of Board of Directors and senior management oversight, and a determination of whether a banking organization’s procedures for comprehensive risk management are appropriate to the circumstances of the specific banking organization. Peoples Bank utilizes internal IRR models to measure and monitor IRR. In addition, Peoples Bank employs an independent consultant to provide a quarterly assessment of its IRR. Finally, regulatory agencies, as part of the scope of their periodic examinations, evaluate Peoples Bank’s IRR management. For these reasons, the Company does not expect the IRR evaluation in the agencies’ capital guidelines to result in significant changes in its capital requirements.
9
FDIC Insurance Assessments
As a FDIC member institution, Peoples Bank’s deposits are insured to a maximum of $250 thousand per depositor through the Bank Insurance Fund (“BIF”) that is administered by the FDIC and each institution is required to pay deposit insurance premium assessments to the FDIC. The Deposit Insurance Funds Act of 1996 recapitalized the Savings Association Insurance Fund (“SAIF”) and provided that BIF deposits would be subject to one-fifth of the assessment to which SAIF deposits are subject for FICO bond payments. Beginning in 2000, BIF deposits and SAIF deposits were subject to the same assessment for FICO bonds. The FICO assessment for Peoples Bank for 2011 was $0.0084 for each $100 of BIF deposits.
The FDIC adopted a risk-based deposit insurance assessment system that required all FDIC-insured institutions to pay quarterly premiums beginning in 2007. The Bank paid insurance premiums at levels stated for well-capitalized banks. The FDIC assessment for Peoples Bank for 2011 was $0.11 for each $100 of BIF deposits. Most recent assessment information from the FDIC indicate that annual premiums will range from 5 and 9 basis points of average total assets less average tangible equity for Risk Category 1 banks with the highest examination ratings to 35 basis points for Risk Category 4 banks with the lowest examination ratings. The Company anticipates being assessed deposit insurance premiums of between 5 and 9 basis points.
On November 12, 2009, the FDIC adopted a final rule that required all insured depository institutions to prepay their estimated quarterly risk-based assessments for the fourth quarter of 2009 and for all of 2010, 2011 and 2012. The FDIC also adopted a uniform increase in assessment rates of $0.03 per $100 of assessable deposits effective on January 1, 2011. The remaining prepaid assessment was $929 thousand at December 31, 2011.
Community Reinvestment Act
The Community Reinvestment Act of 1977, (“CRA”) is designed to create a system for bank regulatory agencies to evaluate a depository institution’s record in meeting the credit needs of its community. The CRA regulations were completely revised as of July 1, 1995, to establish performance-based standards for use in examining for compliance. The Bank had its last CRA compliance examination in 2008 and received a “satisfactory” rating.
USA Patriot Act of 2001
The Patriot Act contains anti-money laundering and financial transparency laws and imposes various regulations, including standards for verifying client identification at account opening, and rules to promote cooperation among financial institutions, regulators and law enforcement entities in identifying parties that may be involved in terrorism or money laundering.
Sarbanes-Oxley Act of 2002
The goals of the Sarbanes-Oxley Act (“SOX”) are to increase corporate responsibility, to provide for enhanced penalties for accounting and auditing improprieties at publicly traded companies and to protect investors by improving the accuracy and reliability of corporate disclosures pursuant to the securities laws.
Regulation W
Certain transactions, including loans and credit extensions, between the Company and its affiliates and subsidiaries are subject to quantitative and qualitative limitations, collateral requirements, and other restrictions imposed by statute and FRB regulation. Transactions subject to these restrictions are generally required to be made on an arms-length basis. These restrictions generally do not apply to transactions between the Company and its direct wholly-owned subsidiaries.
10
Recent Legislation
Overdraft Fee Regulation
On November 12, 2009, the FRB issued a final rule amending Regulation E, Electronic Funds Transfers. Effective July 1, 2010, banks may not charge fees for paying overdrafts on ATM and debit card transactions unless the customer gives consent, or opts in, to the payment of overdrafts for these transactions. Additional federal legislation has been introduced which would limit the number and amount of overdraft fees which banks can charge, prohibit ordering the posting transactions to cause customers to incur higher fees, prohibit insufficient funds fees on ATM or debit card transactions and require banks to provide a customer notice and opportunity to cancel transactions that would trigger an overdraft.
Dodd-Frank Act
On July 21, 2010, the Dodd-Frank Act became law. The Dodd-Frank Act has had a broad impact on the financial services industry, including significant regulatory and compliance changes.
The Dodd-Frank Act makes permanent the $250 thousand deposit insurance limit for insured deposits. Amendments to the FDICIA also revise the assessment base against which an insured depository institution’s deposit insurance premiums paid to the FDIC’s Deposit Insurance Fund (“DIF”) will be calculated. Under the amendments, the FDIC assessment base will no longer be the institution’s deposit base, but rather its average consolidated total assets less its average equity. The Dodd-Frank Act also changes the minimum designated reserve ratio of the DIF, increasing the minimum from 1.15% to 1.35% of the estimated amount of total insured deposits, and eliminating the requirement that the FDIC pay dividends to depository institutions to ensure that the DIF will reach 1.35% by September 30, 2020. Several of these provisions may increase the FDIC deposit insurance premiums Peoples Bank pays.
The Dodd-Frank Act also provided that, effective one year after the date of its enactment; depository institutions could begin to pay interest on commercial demand deposits. This change in regulations has had little impact on the Company.
The Dodd-Frank Act addresses many corporate governance and executive compensation matters that will affect most U.S. publicly traded companies, including the Company. The Dodd-Frank Act: grants shareholders of U.S. publicly traded companies an advisory vote on executive compensation and requires companies listed on national securities exchanges to adopt clawback policies for incentive-based compensation plans applicable to executive officers.
Many of the requirements the Dodd-Frank Act authorized will be implemented over time. The Company continues to assess the impact of the changes. Given the uncertainty associated with the timing and the manner in which the requirements will be implemented, the full extent of impact is unclear. These changes may require the Company to invest significant management attention and resources to make any necessary changes to comply with the requirements. While the Company cannot predict the final impact, its present assessment of the changes indicates that it will not have a material effect.
11
Changes in interest rates could reduce income, cash flows and asset values.
The Company’s income and cash flows and the value of assets depend to a great extent on the difference between the interest rates earned on interest-earning assets, such as loans and investment securities, and the interest rates paid on interest-bearing liabilities such as deposits and borrowings. These rates are highly sensitive to many factors which are beyond the Company’s control, including general economic conditions and policies of various governmental and regulatory agencies and, in particular, the FRB. Changes in monetary policy, including changes in interest rates, will influence not only the interest received on loans and investment securities and the amount of interest paid on deposits and borrowings, but will also affect the Company’s ability to originate loans and obtain deposits and the value of its investment portfolio. If the rate of interest paid on deposits and other borrowings increases more than the rate of interest earned on loans and other investments, net interest income, and therefore earnings, could be adversely affected. The Company’s earnings also could be adversely affected if the rates on its loans and other investments fall more quickly than those on its deposits and other borrowings.
Economic conditions either nationally or locally in areas in which the Company’s operations are concentrated may adversely affect its business.
Deterioration in local, regional, national or global economic conditions could cause the Company to experience a reduction in deposits and new loans, an increase in the number of borrowers who default on their loans and a reduction in the value of the collateral securing their loans, all of which could adversely affect performance and financial condition. Unlike larger banks that are more geographically diversified, the Company provides banking and financial services locally. Therefore, it is particularly vulnerable to adverse local economic conditions.
The financial condition and results of operations would be adversely affected if the allowance for loan losses is not sufficient to absorb actual losses or if the Company is required to increase its allowance.
Despite the Company’s underwriting criteria, it may experience loan delinquencies and losses. In order to absorb losses associated with nonperforming loans, the Company maintains an allowance for loan losses based on, among other things, historical experience, an evaluation of economic conditions, and regular reviews of delinquencies and loan portfolio quality. Determination of the allowance inherently involves a high degree of subjectivity and requires the Company to make significant estimates of current credit risks and future trends, all of which may undergo material changes. At any time, there are likely to be loans in the portfolio that will result in losses but that have not been identified as nonperforming or potential problem credits. The Company cannot be sure that it will be able to identify deteriorating credits before they become nonperforming assets or that it will be able to limit losses on those loans that are identified. The Company may be required to increase its allowance for loan losses for any of several reasons. Regulators, in reviewing the loan portfolio as part of a regulatory examination, may request that the Company increase its allowance for loan losses. Changes in economic conditions affects borrowers, new information regarding existing loans, identification of additional problem loans and other factors, both within and outside of the Company’s control, may require an increase in its allowance. In addition, if charge-offs in future periods exceed the allowance for loan losses; the Company will need additional increases in its allowance for loan losses. Any increase in the allowance for loan losses will result in a decrease in net income and capital and may materially affect the results of operations in the period in which the allowance is increased.
Competition may decrease growth or profits.
The Company faces substantial competition in all phases of its operations from a variety of different competitors, including commercial banks, credit unions, consumer finance companies, insurance companies and money market funds. There is very strong competition among financial services providers in the Company’s principal service area. Competitors may have greater resources, higher lending limits or larger branch systems than does the Company. Accordingly, they may be able to offer a broader range of products and services as well as better pricing for those products and services than the Company can. In addition, some of the financial services organizations with which the Company competes are not subject to the same degree of regulation as is imposed on federally insured financial institutions. As a result, those non-bank competitors may be able to access funding and provide various services more easily or at less cost than the Company, adversely affecting its ability to compete effectively.
12
The Company may be adversely affected by government regulation.
The banking industry is heavily regulated. Banking regulations are primarily intended to protect the federal deposit insurance funds and consumers, not shareholders. Changes in the laws, regulations, and regulatory practices affecting the banking industry may increase the Company’s cost of doing business or otherwise adversely affect it and create competitive advantages for others. Regulations affecting banks and financial services companies undergo continuous change, and the Company cannot predict the ultimate effect of these changes, which could have a material adverse effect on its profitability or financial condition.
The Company relies on its management and other key personnel, and the loss of any of them may adversely affect its operations.
The Company is, and will continue to be, dependent upon the services of its management team. The unexpected loss of services of any key management personnel could have an adverse effect on its business and financial condition because of their skills, knowledge of the Company’s market, years of industry experience and the difficulty of promptly finding qualified replacement personnel.
Environmental liability associated with lending activities could result in losses.
In the course of normal business, the Company may foreclose on and take title to properties securing its loans. If hazardous substances were discovered on any of these properties, it could be liable to governmental entities or third parties for the costs of remediation of the hazard, as well as for personal injury and property damage. Many environmental laws can impose liability regardless of whether the Company knew of, or were responsible for, the contamination. In addition, if the Company arranges for the disposal of hazardous or toxic substances at another site, it may be liable for the costs of cleaning up and removing those substances from the site even if it neither owns nor operates the disposal site. Environmental laws may require it to incur substantial expenses and may materially limit use of properties the Company acquires through foreclosure, reduce their value or limit its ability to sell them in the event of a default on the loans they secure. In addition, future laws or more stringent interpretations or enforcement policies with respect to existing laws may increase its exposure to environmental liability.
Failure to implement new technologies in operations may adversely affect growth or profits.
The market for financial services, including banking services and consumer finance services, is increasingly affected by advances in technology, including developments in telecommunications, data processing, computers, automation, internet-based banking and telebanking. The Company’s ability to compete successfully in its markets may depend on the extent to which it is able to exploit such technological changes. However, the Company can provide no assurance that it will be able to properly or timely anticipate or implement such technologies or properly train its staff to use such technologies. Any failure to adapt to new technologies could adversely affect its business, financial condition or operating results.
An investment in the Company’s common stock is not an insured deposit. The Company’s stock price is subject to market forces that could have an adverse affect to its stocks market value.
The Company’s common stock is not a bank deposit and, therefore, is not insured against loss by the FDIC, or any other deposit insurance fund or by any other public or private entity. Investment in the Company’s common stock is subject to the same market forces that affect the price of common stock in any company.
13
The Company’s legal lending limits are relatively low and this may restrict its ability to compete for larger customers.
At December 31, 2011, the Company’s lending limit per borrower was approximately $8.5 million or approximately 15% of its unimpaired capital. Accordingly, the size of loans that the Company can offer to potential borrowers, without participation by other lenders, is less than the size of loans that many of its competitors with larger capitalization are able to offer. The Company’s legal lending limit also impacts the efficiency of its lending operation because it tends to lower its average loan size, which means it has to generate a higher number of transactions to achieve the same portfolio volume. The Company may engage in loan participations with other banks for loans in excess of its legal lending limits. However, there can be no assurance that such participations will be available at all or on terms which are favorable to the Company and its customers.
The Company’s information systems may experience an interruption or breach in security
.
The Company relies heavily on communications and information systems to conduct its business. Any failure, interruption or breach in security of these systems could result in failures or disruptions in the Company’s customer relationship management, general ledger, deposit, loan and other systems. Although the Company has policies and procedures designed to prevent or limit the effect of the failure, interruption or security breach of these information systems, there can be no assurance that any such failures, interruptions or security breaches will not occur or, if they do occur, that they will be adequately addressed. The occurrence of any failures, interruptions or security breaches of the Company’s information systems could damage its reputation, result in a loss of customer business, subject it to additional regulatory scrutiny, or expose it to civil litigation and possible financial liability, any of which could have a material adverse effect on the Company’s financial condition and results of operations.
Rapid growth could require the Company to raise additional capital.
The Company is required by federal and state regulatory authorities to maintain adequate levels of capital to support its operations. As a financial holding company, the Company seeks to maintain capital sufficient to meet the “well-capitalized” standard set by regulators. The Company anticipates that its current capital resources will satisfy its capital requirements for the foreseeable future. The Company may at some point, however, need to raise additional capital to support continued growth, whether such growth occurs internally or through acquisitions. The Company’s ability to raise additional capital, if needed, will depend on conditions in the capital markets at that time, which are outside of the Company’s control, and on the Company’s financial performance. Accordingly, there can be no assurance of the Company’s ability to expand its operations through internal growth and acquisitions could be materially impaired. As such, the Company may be forced to delay raising capital, issue shorter term securities than desired or bear an unattractive cost of capital, which could decrease profitability and significantly reduce financial flexibility. In the event current sources of liquidity, including internal sources, do not satisfy the Company’s needs, the Company would be required to seek additional financing. The availability of additional financing will depend on a variety of factors such as market conditions, the general availability of credit, the overall availability of credit to the financial services industry, the Company’s credit ratings and credit capacity, as well as the possibility that lenders could develop a negative perception of the Company’s long- or short-term financial prospects if the Company incurs large credit losses or if the level of business activity decreases due to economic conditions.
Market conditions may adversely affect fee based investment business.
The Company receives fee based revenues from commissions on the sale of securities and investment advisory fees. In the event of decreased stock market activity, the volume of trading executed by its Wealth Management subsidiary will in all likelihood decrease resulting in decreased commission revenue on purchases and sales of securities. In addition, investment advisory fees, which are generally based on a percentage of the total value of an investment portfolio, will decrease in the event of decreases in the values of the investment portfolios as a result of overall market declines.
14
Available Information
The Company files reports, proxy and information statements and other information electronically with the SEC. You may read and copy any materials that the Company files with the SEC at the SEC’s Public Reference Room located at 100 F. Street, N.E., Washington, DC 20549 on official business days between the hours of 10:00am and 3:00pm EST. You can obtain information on the operation of the Public Reference Room by calling the SEC at 1-800-SEC-0330. The SEC maintains an Internet site that contains reports, proxy and information statements and other information regarding issuers that file electronically. The SEC’s website address is http://www.sec.gov. Copies of the Company’s Annual Report on Form 10-K, Quarterly Reports on Form 10-Q, Current Reports on Form 8-K and amendments to those reports filed with the SEC may be obtained without charge by writing to Peoples Financial Services Corp., 82 Franklin Avenue, Hallstead, PA 18822, Attn: Investor Relations or through the Company’s website at
http://www.peoplesnatbank.com
.
None.
The Company’s corporate headquarters is located at 82 Franklin Avenue, Hallstead, Susquehanna County, Pennsylvania. The Company owns the facility which has approximately 9,800 square feet.
In addition to the above location, at December 31, 2011, the Company owned 10 and leased one retail community banking offices. The Company also owns an office building located at 241 Main Street, Hallstead, Susquehanna County, Pennsylvania, which serves as its Bank Secrecy Act facility. The Company considers its properties to be suitable and adequate for its current and immediate future purposes.
The Company, Peoples Bank and their subsidiaries are not parties to any legal proceedings that could have a material effect on the financial condition or operating results of the Company. In addition, the Company, Peoples Bank and their subsidiaries are not parties to any legal proceedings under federal and state environmental laws.
Not Applicable
The Company had 1,077 stockholders of record, including individual participants in security position listings, and 3,117,606 shares of common stock, par value of $2.00 per share, the only authorized class of stock outstanding as of February 29, 2012. The Company’s common stock trades on the Over-the-Counter-Bulletin-Board under the symbol “PFIS.” The Company has paid cash dividends since its incorporation in 1986. The payment of future dividends must necessarily depend upon earnings, financial position, appropriate restrictions under applicable laws and other factors relevant at the time the Board of Directors considers any declaration of dividends. For information on dividend restrictions on the Company and Peoples Bank, refer to the consolidated financial statements and notes to these statements filed at Item 8 to this report and incorporated in their entirety by reference under this Item 5.
15
The high and low closing sale prices and dividends per share of the Company’s common stock for the four quarters of 2011 and 2010 are summarized in the following table:
|
2011
|
2010
|
|||||||||||||||||||||||
|
Low
|
High
|
Dividends Declared
|
Low
|
High
|
Dividends Declared
|
|||||||||||||||||||
|
First Quarter
|
$ | 26.31 | $ | 28.00 | $ | 0.20 | $ | 18.05 | $ | 22.75 | $ | 0.19 | ||||||||||||
|
Second Quarter
|
25.50 | 27.50 | 0.20 | 21.65 | 29.00 | 0.20 | ||||||||||||||||||
|
Third Quarter
|
26.90 | 28.25 | 0.20 | 26.00 | 28.00 | 0.20 | ||||||||||||||||||
|
Fourth Quarter
|
$ | 27.05 | $ | 28.25 | $ | 0.20 | $ | 26.60 | $ | 28.00 | $ | 0.20 | ||||||||||||
The following table discloses the number of outstanding options, warrants and rights granted by the Company to participants in equity compensation plans, as well as the number of securities remaining available for future issuance under these plans. Securities for future issuance are reserved and issued at the discretion of the Board of Directors on an annual basis. The table provides this information separately for equity compensation plans that have and have not been approved by security holders.
|
Number of securities to be issued upon exercise of outstanding options, warrants and rights
|
Weighted-average exercise price of outstanding options, warrants and rights
|
Number of securities remaining available for future issuance under equity compensation plans
|
||||||||||
|
Equity compensation plans approved
|
13,399 | $ | 26.59 | 35,451 | ||||||||
|
Equity compensation plans not approved
|
||||||||||||
|
Total
|
13,399 | $ | 26.59 | 35,451 | ||||||||
The following table presents information with respect to purchases made by or on behalf of the Company or any “affiliated purchaser,” as defined in the Exchange Act Rule 10b-18(a)(3), of the Company’s common stock during each of the three months ended December 31, 2011:
|
Month Ending
|
Total Number of Shares Purchased
|
Average Price Paid Per Share
|
Total Number of Shares Purchased as Part of Publicly Announced Programs(1)
|
Maximum Number of Shares that may yet be Purchased Under the Programs(1)
|
||||||||||||
|
October 31, 2011
|
8,000 | 27.35 | 8,000 | 37,651 | ||||||||||||
|
November 30, 2011
|
37,651 | |||||||||||||||
|
December 31, 2011
|
2,200 | 27.80 | 2,200 | 35,451 | ||||||||||||
|
Total
|
10,200 | 27.45 | 10,200 | |||||||||||||
(1) On July 2, 2001, the Board of Directors authorized the purchase of 158,931 shares of the Company’s common stock. As of December 31, 2011, there were 35,451 shares available for repurchase under this Program. The 2001 Stock Repurchases Program has no expiration date.
16
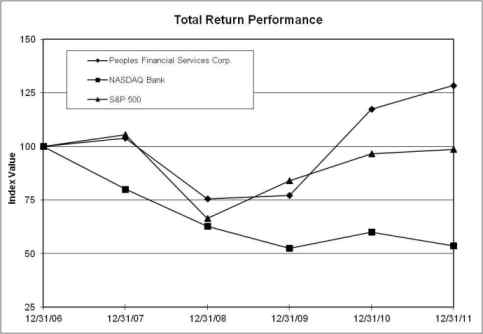
The following line graph compares the cumulative total stockholder return on the Company’s common stock, based on the market price change and assumes reinvestment of dividends, with the cumulative total return of the index for The NASDAQ Bank Stocks and the index for the Standards and Poor 500 Stocks during the five-year period ended December 31, 2011. The stockholder return shown on the graph and table below is not necessarily indicative of future performance.
Comparison of Five-Year Cumulative Total Returns
Performance Graph of
PEOPLES FINANCIAL SERVICES CORP.
|
Period Ending
|
||||||||||||||||||||||||
|
Index
|
12/31/06
|
12/31/07
|
12/31/08
|
12/31/09
|
12/31/10
|
12/31/11
|
||||||||||||||||||
|
Peoples Financial Services Corp.
|
$ | 100.00 | $ | 104.01 | $ | 75.66 | $ | 77.18 | $ | 117.50 | $ | 128.54 | ||||||||||||
|
NASDAQ Bank
|
100.00 | 80.09 | 62.84 | 52.60 | 60.04 | 53.74 | ||||||||||||||||||
|
S&P 500
|
$ | 100.00 | $ | 105.49 | $ | 66.46 | $ | 84.05 | $ | 96.71 | $ | 98.76 | ||||||||||||
17
(Dollars in thousands, except per share data)
|
Year Ended December 31
|
2011
|
2010
|
2009
|
2008
|
2007
|
|||||||||||||||
|
Condensed statements of financial performance:
|
||||||||||||||||||||
|
Interest income
|
$ | 27,350 | $ | 25,577 | $ | 24,273 | $ | 25,479 | $ | 24,611 | ||||||||||
|
Interest expense
|
5,639 | 6,498 | 7,258 | 9,154 | 11,105 | |||||||||||||||
|
Net interest income
|
21,711 | 19,079 | 17,015 | 16,325 | 13,506 | |||||||||||||||
|
Provision for loan losses
|
1,794 | 2,202 | 1,735 | 713 | 280 | |||||||||||||||
|
Net interest income after provision for loan losses
|
19,917 | 16,877 | 15,280 | 15,612 | 13,226 | |||||||||||||||
|
Noninterest income (loss)
|
5,567 | 4,290 | 3,082 | (1,809 | ) | 3,308 | ||||||||||||||
|
Noninterest expense
|
15,310 | 13,245 | 12,390 | 10,677 | 10,566 | |||||||||||||||
|
Income before income taxes
|
10,174 | 7,922 | 5,972 | 3,126 | 5,968 | |||||||||||||||
|
Provision for income tax expense
|
2,357 | 1,437 | 923 | 87 | 1,097 | |||||||||||||||
|
Net income
|
$ | 7,817 | $ | 6,485 | $ | 5,049 | $ | 3,039 | $ | 4,871 | ||||||||||
|
Condensed statements of financial position:
|
||||||||||||||||||||
|
Investment securities
|
$ | 139,899 | $ | 121,772 | $ | 130,506 | $ | 107,589 | $ | 109,471 | ||||||||||
|
Net loans
|
439,754 | 386,672 | 332,196 | 313,606 | 288,524 | |||||||||||||||
|
Other assets
|
41,751 | 50,143 | 53,781 | 51,181 | 36,439 | |||||||||||||||
|
Total assets
|
$ | 621,404 | $ | 558,587 | $ | 516,483 | $ | 472,376 | $ | 434,434 | ||||||||||
|
Deposits
|
$ | 494,283 | $ | 438,734 | $ | 410,038 | $ | 371,268 | $ | 327,430 | ||||||||||
|
Short-term borrowings
|
43,791 | 38,724 | 20,439 | 18,432 | 22,848 | |||||||||||||||
|
Long-term debt
|
18,927 | 27,336 | 38,750 | 39,691 | 38,534 | |||||||||||||||
|
Other liabilities
|
4,790 | 3,277 | 2,286 | 3,265 | 2,817 | |||||||||||||||
|
Stockholders’ equity
|
59,613 | 50,516 | 44,970 | 39,720 | 42,805 | |||||||||||||||
|
Total liabilities and stockholders’ equity
|
$ | 621,404 | $ | 558,587 | $ | 516,483 | $ | 472,376 | $ | 434,434 | ||||||||||
|
Per share data:
|
||||||||||||||||||||
|
Net income
|
$ | 2.49 | $ | 2.07 | $ | 1.61 | $ | 0.97 | $ | 1.55 | ||||||||||
|
Cash dividends declared
|
0.80 | 0.79 | 0.76 | 0.76 | 0.76 | |||||||||||||||
|
Stockholders’ equity
|
$ | 19.11 | $ | 16.07 | $ | 14.34 | $ | 12.69 | $ | 13.64 | ||||||||||
|
Cash dividends declared as a percentage of net income
|
32.28 | % | 38.24 | % | 47.15 | % | 79.53 | % | 48.92 | % | ||||||||||
|
Average common shares outstanding
|
3,136,663 | 3,139,606 | 3,133,518 | 3,128,170 | 3,135,889 | |||||||||||||||
|
Selected ratios (based on average balances):
|
||||||||||||||||||||
|
Net income as a percentage of total assets
|
1.33 | % | 1.18 | % | 1.07 | % | 0.68 | % | 1.17 | % | ||||||||||
|
Net income as a percentage of stockholders’ equity
|
14.80 | 13.87 | 12.62 | 7.53 | 11.85 | |||||||||||||||
|
Stockholders’ equity as a percentage of total assets
|
8.99 | 8.53 | 8.50 | 9.01 | 9.86 | |||||||||||||||
|
Tier I capital as a percentage of adjusted total assets
|
9.42 | 9.19 | 9.92 | 9.31 | 10.14 | |||||||||||||||
|
Net interest income as a percentage of earning assets
|
4.18 | 4.00 | 4.23 | 4.25 | 3.82 | |||||||||||||||
|
Loans, net, as a percentage of deposits
|
89.70 | % | 84.67 | % | 87.33 | % | 86.38 | % | 86.13 | % | ||||||||||
|
Selected ratios and data (based on period end balances):
|
||||||||||||||||||||
|
Tier I capital as a percentage of risk-weighted assets
|
11.57 | % | 11.72 | % | 12.30 | % | 12.26 | % | 13.64 | % | ||||||||||
|
Total capital as a percentage of risk-weighted assets
|
12.69 | 12.68 | 13.18 | 13.10 | 14.42 | |||||||||||||||
|
Allowance for loan losses as a percentage of loans, net
|
1.20 | 1.05 | 0.99 | 0.95 | 0.84 | |||||||||||||||
|
Nonperforming loans as a percentage of loans, net
|
2.30 | % | 1.77 | % | 0.99 | % | 1.63 | % | 0.17 | % | ||||||||||
Note: Average balances were calculated using average daily balances. Average balances for loans include nonaccrual loans. Tax-equivalent adjustments were calculated using the prevailing statutory rate of 34.0 percent.
18
Peoples Financial Services Corp.
(Dollars in thousands, except per share data)
Management’s Discussion and Analysis appearing on the following pages should be read in conjunction with the Consolidated Financial Statements contained in this Annual Report.
Forward-Looking Discussion:
This report on Form 10-K and the documents into which it may be incorporated by reference may contain and, from time to time, may make, certain statements that constitute forward-looking statements. Words such as “expects,” “anticipates,” “believes,” “estimates” and other similar expressions or future or conditional verbs such as “will,” “should,” “would” and “could” are intended to identify such forward-looking statements. These statements are not historical facts, but instead represent the current expectations, plans or forecasts of Peoples Financial Services Corp. and its subsidiaries regarding its future operating results, financial position, asset quality, credit reserves, credit losses, capital levels, dividends, liquidity, service charges, cost savings, effective tax rate, impact of changes in fair value of financial assets and liabilities, impact of new accounting and regulatory guidance, legal proceedings and other matters relating to us and the securities that we may offer from time to time. These statements are not guarantees of future results or performance and involve certain risks, uncertainties and assumptions that are difficult to predict, change over time and are often beyond our control. Actual outcomes and results may differ materially from those expressed in, or implied by, forward-looking statements.
You should not place undue reliance on any forward-looking statement and should consider the uncertainties and risks discussed in Part I Item 1A entitled “Risk Factors,” in this Annual Report, among others, and in any of our subsequent Securities and Exchange Commission (“SEC”) filings. Forward-looking statements speak only as of the date they are made, and we undertake no obligation to update any forward-looking statement to reflect the impact of circumstances or events that arise after the date the forward-looking statement was made. Notes to the Consolidated Financial Statements referred to in the Management’s Discussion and Analysis of Financial Condition and Results of Operations (“MD&A”) are incorporated by reference into the MD&A. Certain prior period amounts have been reclassified to conform with the current year’s presentation.
Critical Accounting Policies:
Our financial statements are prepared in accordance with accounting principles generally accepted in the United States of America (“GAAP”). The preparation of financial statements in conformity with GAAP requires us to establish critical accounting policies and make accounting estimates and assumptions that affect the reported amounts of assets and liabilities at the date of the financial statements, as well as the reported amounts of revenues and expenses during those reporting periods.
For a discussion of the recent Accounting Standards Updates (“ASU”) issued by the Financial Accounting Standards Board (“FASB”) refer to Note 1 entitled “Summary of significant accounting policies — Recent accounting standards,” in the Notes to Consolidated Financial Statements to this Annual Report.
An accounting estimate requires assumptions about uncertain matters that could have a material effect on the financial statements if a different amount within a range of estimates were used or if estimates changed from period to period. Readers of this report should understand that estimates are made considering facts and circumstances at a point in time, and changes in those facts and circumstances could produce results that differ from when those estimates were made. Significant estimates that are particularly susceptible to material change within the near term relate to the determination of allowance for loan losses, the determination of other-than-temporary impairment, the fair value of financial instruments, the valuations of real estate acquired in connection with foreclosures or satisfaction of loans and the valuation of loans deferred tax assets and liabilities. Actual amounts could differ from those estimates.
We maintain the allowance for loan losses at a level we believe adequate to absorb probable credit losses related to individually evaluated loans, as well as probable incurred losses inherent in the remainder of the loan portfolio as of the balance sheet date. The balance in the allowance for loan losses account is based on past events and current economic conditions.
19
Peoples Financial Services Corp.
Management’s Discussion and Analysis
(Dollars in thousands, except per share data)
The allowance for loan losses account consists of an allocated element and an unallocated element. The allocated element consists of a specific portion for the impairment of loans individually evaluated and a formula portion for loss contingencies on those loans collectively evaluated. The unallocated element, if any, is used to cover inherent losses that exist as of the evaluation date, but which have not been identified as part of the allocated allowance using our impairment evaluation methodology due to limitations in the process.
We monitor the adequacy of the allocated portion of the allowance quarterly and adjusts the allowance for any deficiencies through normal operations. This ongoing evaluation reduces potential differences between estimates and actual observed losses. The determination of the level of the allowance for loan losses is inherently subjective as it requires estimates that are susceptible to significant revision as more information becomes available. Accordingly, management cannot ensure that charge-offs in future periods will not exceed the allowance for loan losses or that additional increases in the allowance for loan losses will not be required, resulting in an adverse impact on operating results.
In determining the requirement to record an other-than-temporary impairment on securities owned by us, four main characteristics are considered including: (i) the length of time and the extent to which the fair value has been less than amortized cost; (ii) the financial condition and near-term prospects of the issuer; (iii) whether the market decline was affected by macroeconomic conditions and (iv) whether the entity has the intent to sell the debt security or more likely than not will be required to sell the debt security before its anticipated recovery. The assessment of whether an other-than-temporary impairment exists involves a high degree of subjectivity and judgment and is based on information available to us at a point in time.
Fair values of financial instruments, in cases where quoted market prices are not available, are based on estimates using present value or other valuation techniques which are subject to change.
Real estate acquired in connection with foreclosures or in satisfaction of loans is adjusted to fair value based upon current estimates derived through independent appraisals less cost to sell. However, proceeds realized from sales may ultimately be higher or lower than those estimates.
Deferred tax assets and liabilities are recognized for the estimated future tax effects of temporary differences by applying enacted statutory tax rates to differences between the financial statement carrying amounts and the tax bases of existing assets and liabilities. The amount of deferred tax assets is reduced, if necessary, to the amount that, based on available evidence, will more likely than not be realized. As changes in tax laws or rates are enacted, deferred tax assets and liabilities are adjusted through the provision for income taxes.
For a further discussion of our critical accounting policies, refer to Note 1 entitled, “Summary of significant accounting policies,” in the Notes to Consolidated Financial Statements to this Annual Report. This note lists the significant accounting policies used by us in the development and presentation of the financial statements. This MD&A, the Notes to Consolidated Financial Statements and other financial statement disclosures identify and address key variables and other qualitative and quantitative factors that are necessary for the understanding and evaluation of our financial position, results of operations and cash flows.
Operating Environment:
The United States economy continued to expand moderately in 2011, as the gross domestic product (“GDP”), the value of all goods and services produced in the Nation, increased at an annual rate of 2.8 percent in the fourth quarter of 2011, compared to 1.8 percent in the third quarter of 2011. The fourth quarter increase reflected positive contributions from private inventory investment, personal consumption expenditures (“PCE”), exports, and residential and nonresidential fixed investment which were partially offset by negative impacts from federal, state and local government spending, and an increase in imported goods.
20
Peoples Financial Services Corp.
Management’s Discussion and Analysis
(Dollars in thousands, except per share data)
As a result of the tepid economic growth in 2011, the Federal Open Market Committee (“FOMC”) maintained the federal funds target range of 0 to 25 basis points throughout the year and further signaled that they intend to keep short-term rates at extraordinarily low levels through at least late 2014. Despite the apparent recovery in 2011, many areas of the economy such as employment conditions and the housing market remained weak. Given these weaknesses, the FOMC decided that this extraordinary monetary policy stance was necessary to support the recovery. At their most recent meeting in January, 2012, the FOMC indicated that economic conditions will continue to warrant policy accommodation for an extended period. The committee directed that the program of quantitative easing, which began in September 2011, be continued. The Federal Reserve will purchase an additional $400 billion in Treasury securities with remaining maturities of approximately 6 to 30 years and in turn sell $400 billion in Treasuries with remaining maturities of 3 years or less by the end of June 2012. This action should contribute to a flatter yield curve and keep long-term rates low, with the intention of spurring business investment.
The PCE increased 2.0 percent in the fourth quarter up from 1.7 percent in the third quarter of 2011. The main contributor to the growth in PCE was durable goods which increased 14.8 percent and 5.7 percent, respectively. Nonresidential fixed investment increased 1.7 percent in the fourth quarter of 2011 and 15.7 percent in the third quarter of 2011. Exports of goods and services were up 4.7 percent in the third and fourth quarters of 2011. In contrast to these increases, federal government consumption expenditures decreased 7.3 percent in the fourth quarter of 2011 while the third quarter reflected an increase of 2.1 percent. State and local governments scaled back consumption expenditures by 2.6 percent and 1.6 percent in the fourth and third quarters of 2011.
Employment conditions improved moderately in 2011. The civilian labor force increased 274 thousand, while the number of people employed increased 1.6 million for the same period. As a result, the unemployment rate for the Nation fell to 8.5 percent in December 2011 from 9.4 percent in December 2010. All sectors of employment, with the exception of the government sector, reported employment gains from the end of 2010.
National, Pennsylvania, New York and our market area’s seasonally-adjusted unemployment rates at December 31, 2011 and 2010, are summarized as follows:
|
December 31
|
2011
|
2010
|
||||||
|
United States
|
8.5 | % | 9.4 | % | ||||
|
Pennsylvania
|
7.2 | % | 8.1 | % | ||||
|
New York
|
8.0 | % | 8.0 | % | ||||
|
Lackawanna County
|
8.1 | % | 8.8 | % | ||||
|
Susquehanna County
|
7.0 | % | 7.8 | % | ||||
|
Wyoming County
|
8.2 | % | 9.9 | % | ||||
|
Broome County
|
8.2 | % | 8.7 | % | ||||
Employment conditions improved for the Commonwealth of Pennsylvania, as the unemployment rate fell to 7.2 percent by year-end 2011 from 8.1 percent at the end of 2010. The unemployment rate for New York State remained at 8.0 percent at year-end 2011 and 2010. With respect to the markets we serve, the unemployment rate decreased for all four counties in northeastern Pennsylvania and Broome County in the southern tier of New York. Jobs related to natural gas drilling and exploration in Susquehanna and Wyoming counties in Pennsylvania have contributed to the turnaround in the employment situation in those counties, as well as to the improving employment situation in the neighboring counties of Lackawanna, Pennsylvania and Broome, New York.
21
Peoples Financial Services Corp.
Management’s Discussion and Analysis
(Dollars in thousands, except per share data)
It was a strong year for the commercial banking industry, characterized by operating income increases and balance sheet growth. Earnings for all Federal Deposit Insurance Corporation (“FDIC”)-insured commercial banks increased 48.3 percent in 2011. With respect to bank balance sheets, total assets for all FDIC-insured commercial banks grew 4.8 percent in 2011. The increase, for the most part, resulted from an improvement in loan demand, as total loans and leases increased 2.4 percent from December 31, 2010. Specifically, commercial and industrial loans increased 13.8 percent while residential mortgages decreased 1.6 percent and consumer loans decreased 1.2 percent from year-end 2010. FDIC-insured commercial banks also experienced strong demand for their deposit products. Total deposits for all FDIC-insured commercial banks grew 8.7 percent in 2011. Interest-bearing deposits rose 2.3 percent, while noninterest-bearing deposits increased 34.0 percent.
U.S. equity markets were mixed in 2011. The Dow Jones Industrial Average (“DJIA”) rose 4.7 percent in 2011 compared to a 28.1 percent increase in 2010. The Standard & Poor’s 500 and the NASDAQ Composite declined 1.1 percent and 3.2 percent in 2011. These indices rose 15.1 percent and 16.9 percent in 2010.
The United States economy is expected to continue a slow recovery in 2012. Moderate economic growth is expected with GDP advancing between 2.2 percent and 2.7 percent according to the latest FOMC minutes. Labor markets are expected to continue improving, with a slight decrease in the National unemployment rate of between 8.5 percent and 8.2 percent. Inflation is expected to remain subdued based on PCE estimates of 1.4 percent to 1.8 percent. Given the very slow pace of recovery and sustained weakness in certain areas, the FOMC has indicated that they will keep interest rates low for some time. Our 2012 earnings, along with those of all financial institutions, could be adversely impacted should the pace of the recovery be slower than anticipated.
Review of Financial Position:
We are headquartered in Northeastern Pennsylvania and offer traditional bank products and services, including loans, deposits and wealth management services, through our primary subsidiary, Peoples Neighborhood Bank. Our other subsidiary, Peoples Financial Capital Corporation maintains and manages the collection and distribution of income from certain investments of the consolidated companies. Peoples Neighborhood Bank operates eleven full-service community banking offices located within the contiguous four-county market area of Lackawanna, Wyoming and Susquehanna Counties in Pennsylvania and Broome County in New York. Each office, interdependent with the community, offers a comprehensive array of financial products and services to individuals, small- and medium-sized businesses and government entities. Peoples Neighborhood Bank has three subsidiaries, Peoples Advisors LLC, Peoples Financial Leasing LLC and Peoples Investment Holdings LLC. Peoples Wealth Management, a division of Peoples Advisors LLC, engages in selling insurance products and provides investment advisory services to the general public. Peoples Financial Leasing LLC provides employee leasing services to Peoples Neighborhood Bank. Peoples Investment Holdings LLC maintains and manages the collection and distribution of income from certain investments of the consolidated companies.
The continued weakness in economic conditions did not affect our operations in 2011. Demand for loans was robust in our market area, while deposit gathering strengthened. Contrary to many financial institutions, our asset quality improved as the ratio of problem assets declined.
Recent events surrounding certain of our competitors experiencing asset quality and regulatory issues favorably impacted our loan demand. These financial institutions were forced to focus their efforts on improving their asset quality which curtailed their emphasis on meeting the needs of their existing commercial customer base. In addition, at the close of 2010, a major competitor and the only other community bank located in our market area was acquired by a large regional bank. Small- and medium-sized commercial customers used to having direct access to senior management and other primary officers, being able to receive prompt locally made decisions and offered flexible and reasonable terms chose to abandon their relationships and transferred accounts to us. As a result of these events, our loan origination efforts prospered in 2011.
22
Peoples Financial Services Corp.
Management’s Discussion and Analysis
(Dollars in thousands, except per share data)
In addition to the favorable impact caused by the loss of a major competitor in our market area, one of the other major influences causing the strength of deposit gathering in 2011 was the effect of natural gas drilling. Many customers who own land in rural sections of Northeastern Pennsylvania were offered significant sums of money, including a flat land lease fee per acre and royalties for any gas extracted, by natural gas companies for drilling rights to their properties. In order to respond to the needs of these customers, we began offering investment products and services specifically tailored to meet these needs through our retail community offices and wealth management division. The favorable deposit growth was also a function of the increase in commercial deposits as we were successful in acquiring accounts of local school districts and municipalities.
Total assets increased $62.8 million or 11.3 percent to $621.4 million at December 31, 2011, from $558.6 million at December 31, 2010. Total assets averaged $587.6 million in 2011, an increase of $39.1 million or 7.1 percent from $548.5 million in 2010. Earning assets averaged $557.2 million and equaled 94.8 percent of total average assets in 2011, compared to $517.1 million or 94.3 percent of total average assets in 2010.
The balance sheet growth was driven by an increase in total deposits of $55.5 million or 12.7 percent to $494.3 million at the end of 2011, from $438.8 million at year-end 2010. Total interest-bearing deposits increased $36.2 million or 9.9 percent, while noninterest-bearing deposits rose $19.3 million or 26.2 percent. Now account growth of $12.9 million and time deposit increases of $16.2 million were primarily responsible for the change in interest-bearing deposits in 2011. As previously mentioned, short-term interest rates remained at historically low levels in 2011. As a result, we experienced a 28 basis point reduction in our cost of funds to 1.25 percent in 2011 from 1.53 percent in 2010.
Loans, net increased $54.3 million or 13.9 percent to $445.1 million at December 31, 2011, from $390.8 million at December 31, 2010. Loans averaged $420.6 million and represented 75.5 percent of average earning assets in 2011, compared to $364.3 million or 70.4 percent in 2010. Corresponding with the reductions in short-term interest rates, the prime rate remained at 3.25 percent over the course of 2011. The tax-equivalent yield on the loan portfolio decreased 15 basis points to 5.64 percent in 2011 from 5.79 percent in 2010. Excess deposits not used to fund loans were directed into the investment portfolio. Investment securities available-for-sale increased $18.1 million to $139.9 million at the end of 2011 from $121.8 million at December 31, 2010. Similar to loan yields, the tax-equivalent yield on the investment portfolio declined 32 basis points in 2011. Overall, we experienced a 7 basis point reduction in the tax-equivalent yield on earning assets to 5.19 percent in 2011 from 5.26 percent in 2010.
Stockholders’ equity equaled $59.6 million or $19.11 per share at December 31, 2011, and $50.5 million or $16.07 per share at December 31, 2010. Our Leverage ratio improved to 9.42 percent at the end of 2011, compared to 9.19 percent at December 31, 2010. The Leverage ratio, as well as all of our capital ratios, exceeded regulatory standards for well capitalized institutions. Accumulated other comprehensive income (loss) increased $4.5 million from year-end 2010, which resulted directly from an increase in the fair value of investment securities available-for-sale.
Investment Portfolio:
Primarily, our investment portfolio provides a source of liquidity needed to meet expected loan demand and generates a reasonable return in order to increase our profitability. Additionally, we utilize the investment portfolio to meet pledging requirements and reduce income taxes. At December 31, 2011, our portfolio consisted primarily of short-term U.S. Government mortgage-backed securities, which provide a source of liquidity and intermediate-term, tax-exempt state and municipal obligations, which mitigate our tax burden.
Our investment portfolio is subject to various risk elements that may negatively impact our liquidity and profitability. The greatest risk element affecting our portfolio is market risk or interest rate risk (“IRR”). Understanding IRR, along with other inherent risks and their potential effects, is essential in effectively managing the investment portfolio.
23
Peoples Financial Services Corp.
Management’s Discussion and Analysis
(Dollars in thousands, except per share data)
Market risk or IRR relates to the inverse relationship between bond prices and market yields. It is defined as the risk that increases in general market interest rates will result in market value depreciation. A marked reduction in the value of the investment portfolio could subject us to liquidity strains and reduced earnings if we are unable or unwilling to sell these investments at a loss. Moreover, the inability to liquidate these assets could require us to seek alternative funding, which may further reduce profitability and expose us to greater risk in the future. In addition, since our entire investment portfolio is designated as available-for-sale and carried at estimated fair value, with net unrealized gains and losses reported as a separate component of stockholders’ equity, market value depreciation could negatively impact our capital position.
As previously mentioned, the FOMC indicated that economic conditions warrant maintaining exceptionally low levels for the federal funds rate for an extended period. Yields on short-term U.S. Treasury securities hovered around the target range for the federal funds rate of 0 to 25 basis points in 2011, as economic data suggested weak employment conditions and relatively low inflation. Although many indicators pointed to an improving economy, albeit at moderate to slow rates, investors sought the relative safety offered by the U.S. Treasury which caused intermediate-and long-term rates to decline throughout 2011. Our investment portfolio consists primarily of fixed-rate bonds. As a result, changes in general market interest rates have a significant influence on the fair value of our portfolio. Specifically, the parts of the yield curve most closely related to our investments include the 2-year and 10-year U.S. Treasury securities. The yield on the 2-year U.S. Treasury note affects the values of our mortgage-backed securities, whereas the 10-year U.S. Treasury note influences the value of tax-exempt state and municipal obligations. The yield on the 2-year U.S. Treasury, which began 2011 at 0.59 percent, declined 34 basis points to close the year at 0.25 percent. In addition, the yield on the 10-year U.S. Treasury experienced a more drastic change declining 140 basis points from 3.29 percent at December 31, 2010, to 1.89 percent at December 31, 2011. Since bond prices move inversely to yields, we experienced an increase in the aggregate fair value of our investment portfolio.
We reported net unrealized holding gains, included as a separate component of stockholders’ equity of $3.6 million, net of income taxes of $1.9 million, at December 31, 2011, and a net unrealized loss of $834, net of income tax benefits of $430, at December 31, 2010. We realize that the market value of our investments and our capital position could be negatively impacted by increases in interest rates. In order to monitor the potential effects an increase in interest rates could have on the value of our investments, we perform stress test modeling on the portfolio. Stress tests conducted on our portfolio at December 31, 2011, indicated that should general market rates instantaneously increase by 100, 200 and 300 basis points, we would anticipate declines of 3.6 percent, 7.6 percent and 12.2 percent in the market value of our portfolio. Our IRR exposure with regard to market value depreciation improved in comparison to the previous year end. At December 31, 2010, we anticipated market value depreciation of 6.4 percent, 12.4 percent and 18.1 percent given the same rate shocks.
In order to independently measure our performance, we monitor and evaluate our investment portfolio with respect to total return in comparison to a national industry benchmark. Total return is a comprehensive industry-wide approach measuring investment portfolio performance. This measure is superior to measuring performance strictly on the basis of yield since it not only considers income earned similar to the yield approach, but also includes the reinvestment income on repayments and capital gains and losses, whether realized or unrealized. The total return of our investment portfolio was 9.8 percent in 2011, compared to 6.2 percent in 2010. The total return on our investment portfolio outperformed the Barclay’s Capital U.S. Aggregate Bond Index, a benchmark used by most investment managers, which scored a total return of 7.8 percent in 2011.
24
Peoples Financial Services Corp.
Management’s Discussion and Analysis
(Dollars in thousands, except per share data)
The carrying values of the major classifications of available-for-sale securities as they relate to the total investment portfolio for the past three years are summarized as follows:
Distribution of investment securities available-for-sale
|
2011
|
2010
|
2009
|
||||||||||||||||||||||
|
December 31
|
Amount
|
%
|
Amount
|
%
|
Amount
|
%
|
||||||||||||||||||
|
U.S. Government-sponsored enterprises
|
$ | 32,776 | 23.43 | % | $ | 38,785 | 31.85 | % | $ | 60,086 | 46.04 | % | ||||||||||||
|
State and municipals:
|
||||||||||||||||||||||||
|
Taxable
|
19,728 | 14.10 | 18,374 | 15.09 | 2,156 | 1.65 | ||||||||||||||||||
|
Tax-exempt
|
39,686 | 28.37 | 50,309 | 41.31 | 51,544 | 39.50 | ||||||||||||||||||
|
Corporate debt securities
|
3,850 | 2.75 | 4,020 | 3.30 | 10,334 | 7.92 | ||||||||||||||||||
|
Mortgage-backed securities:
|
||||||||||||||||||||||||
|
U.S. Government agencies
|
16,912 | 12.09 | 4,476 | 3.68 | 1,427 | 1.09 | ||||||||||||||||||
|
U.S. Government-sponsored enterprises
|
26,263 | 18.77 | 4,527 | 3.72 | 3,792 | 2.91 | ||||||||||||||||||
|
Equity securities:
|
||||||||||||||||||||||||
|
Preferred
|
117 | 0.08 | 54 | 0.04 | 85 | 0.07 | ||||||||||||||||||
|
Common
|
567 | 0.41 | 1,227 | 1.01 | 1,082 | 0.83 | ||||||||||||||||||
|
Total
|
$ | 139,899 | 100.00 | % | $ | 121,772 | 100.00 | % | $ | 130,506 | 100.00 | % | ||||||||||||
Investment securities available-for-sale increased $18.1 million to $139.9 million at December 31, 2011, from $121.8 million at December 31, 2010. Deposit gathering was strong in 2011, as stock market volatility caused investors to seek safer alternatives and landowners in our market area continue to receive proceeds from leasing their properties to natural gas drilling companies. Excess deposited funds not used to fund loans were directed into the investment portfolio. Security purchases totaled $38.1 million in 2011, with the majority of the purchases occurring in the third and fourth quarters of the year. Specifically, all of the 2011 purchases consisted of U.S. Government agency and U.S. Government-sponsored enterprise mortgage-backed securities.
Repayments of investment securities totaled $3.5 million in 2011. We received proceeds of $22.5 million from the sale of investment securities in 2011. During the first quarter of 2011, we developed and began implementing an investment portfolio reconstitution plan aimed primarily at reducing our exposure to interest rate risk by shortening the average life and duration of the investment portfolio. As stated previously, changes in interest rates can have a material adverse effect on the market value of our investment portfolio which in turn may negatively impact our liquidity, capital and earnings. Despite indications from the FOMC that rates will remain at historical lows for some time, there remains a high potential for rates to rise rapidly and materially in the future given their current levels. Accordingly, we evaluated the composition, maturity and interest sensitivity of the investment portfolio and determined that a restructuring of the portfolio was warranted in order to reduce our exposure. As a result of implementing such plan, we have effectively reduced the average life of the investment portfolio from 9.5 years at December 31, 2010, to 4.1 years at December 31, 2011. More importantly, we have reduced our market value exposure by $4.5 million given a gradual interest rate shock of plus 200 basis points over one year comparing year-end 2010 to 2011. A secondary benefit of implementing the plan was the mitigation of the possibility of being subject to alternative minimum tax in the future. In the normal course of business, we generate a substantial amount of tax-exempt income from our investment in state and municipal obligations and loans to local school districts and municipalities. As a result of our recent investment in a limited partnership which affords us significant tax credits in the future, we determined that the sales should include certain long-term tax-exempt investments. Moreover, the determination to sell certain of these state and municipal obligations included an evaluation of the credit risk of the issuers given the recent financial problems of some government entities. Net gains recognized on the sale of investment securities available-for-sale totaled $25 in 2011.
25
Peoples Financial Services Corp.
Management’s Discussion and Analysis
(Dollars in thousands, except per share data)
We recognized other-than-temporary impairments (‘OTTI”) of $87 in 2011 and $164 in 2010 as a result of writing down certain common equity securities. For additional information related to OTTI refer to Note 3 entitled “Investment securities available-for-sale,” in the Notes to Consolidated Financial Statements to this Annual Report. We evaluated the common equity securities portion of the portfolio during the third quarter of 2011 to determine the potential for such investments to recover in value. Based on this evaluation, we sold certain equity positions in order to reduce our exposure to future earning reductions through write-downs on OTTI. As a result of this action, our holdings of common equity securities decreased from $1,227 at December 31, 2010, to $567 at December 31, 2011.
Investment securities averaged $121.6 million and equaled 21.8 percent of average earning assets in 2011, compared to $133.0 million and 25.7 percent in 2010. The tax-equivalent yield on the investment portfolio decreased 32 basis points to 4.24 percent in 2011 from 4.56 percent in 2010.
At December 31, 2011 and 2010, there were no securities of any individual issuer, except for U.S. Government agency mortgage-backed securities, that exceeded 10.0 percent of stockholders’ equity.
The maturity distribution of the amortized cost, fair value and weighted-average, tax-equivalent yield of the available-for-sale portfolio at December 31, 2011, is summarized as follows. The weighted-average yield, based on amortized cost, has been computed for tax-exempt state and municipals on a tax-equivalent basis using the prevailing federal statutory tax rate of 34.0 percent. The distributions are based on contractual maturity with the exception of equity securities. Equity securities with no stated contractual maturities are included in the “After ten years” maturity distribution. Expected maturities may differ from contractual maturities because borrowers have the right to call or prepay obligations with or without call or prepayment penalties.
26
Peoples Financial Services Corp.
Management’s Discussion and Analysis
(Dollars in thousands, except per share data)
Maturity distribution of available-for-sale portfolio
|
Within one year
|
After one but within five years
|
After five but within ten years
|
After ten years
|
Total
|
||||||||||||||||||||||||||||||||||||
|
December 31, 2011
|
Amount
|
Yield
|
Amount
|
Yield
|
Amount
|
Yield
|
Amount
|
Yield
|
Amount
|
Yield
|
||||||||||||||||||||||||||||||
|
Amortized cost:
|
||||||||||||||||||||||||||||||||||||||||
|
U.S. Government-sponsored
enterprises
|
$ | 8,349 | 2.88 | % | $ | 20,289 | 3.62 | % | $ | 1,033 | 4.92 | % | $ | 29,671 | 3.46 | % | ||||||||||||||||||||||||
|
State and municipals:
|
||||||||||||||||||||||||||||||||||||||||
|
Taxable
|
$ | 480 | 2.17 | % | 241 | 2.72 | 3,836 | 4.83 | 13,563 | 5.07 | 18,120 | 4.91 | ||||||||||||||||||||||||||||
|
Tax-exempt
|
251 | 2.66 | 1,571 | 4.22 | 6,366 | 5.61 | 30,029 | 6.31 | 38,217 | 6.09 | ||||||||||||||||||||||||||||||
|
Corporate debt securities
|
1,980 | 6.09 | 2,202 | 5.79 | 280 | 4,462 | 5.56 | |||||||||||||||||||||||||||||||||
|
Mortgage-backed securities:
|
||||||||||||||||||||||||||||||||||||||||
|
U.S. Government agencies
|
4,902 | 1.01 | 8,219 | 1.19 | 3,706 | 3.34 | 16,827 | 1.61 | ||||||||||||||||||||||||||||||||
|
U.S. Government-sponsored
enterprises
|
16,462 | 1.07 | 6,551 | 1.07 | 3,383 | 2.93 | 26,396 | 1.31 | ||||||||||||||||||||||||||||||||
|
Equity securities:
|
||||||||||||||||||||||||||||||||||||||||
|
Preferred
|
54 | 54 | ||||||||||||||||||||||||||||||||||||||
|
Common
|
629 | 4.43 | 629 | 4.43 | ||||||||||||||||||||||||||||||||||||
|
Total
|
$ | 731 | 2.34 | % | $ | 33,505 | 1.97 | % | $ | 47,463 | 3.31 | % | $ | 52,677 | 5.47 | % | $ | 134,376 | 3.82 | % | ||||||||||||||||||||
|
Fair value:
|
||||||||||||||||||||||||||||||||||||||||
|
U.S. Government-sponsored
enterprises
|
$ | 8,971 | $ | 22,564 | $ | 1,241 | $ | 32,776 | ||||||||||||||||||||||||||||||||
|
State and municipals:
|
||||||||||||||||||||||||||||||||||||||||
|
Taxable
|
$ | 481 | 246 | 4,204 | 14,797 | 19,728 | ||||||||||||||||||||||||||||||||||
|
Tax-exempt
|
251 | 1,654 | 6,754 | 31,027 | 39,686 | |||||||||||||||||||||||||||||||||||
|
Corporate debt securities
|
1,410 | 1,928 | 512 | 3,850 | ||||||||||||||||||||||||||||||||||||
|
Mortgage-backed securities:
|
||||||||||||||||||||||||||||||||||||||||
|
U.S. Government agencies
|
4,847 | 8,187 | 3,878 | 16,912 | ||||||||||||||||||||||||||||||||||||
|
U.S. Government-sponsored
enterprises
|
16,292 | 6,528 | 3,443 | 26,263 | ||||||||||||||||||||||||||||||||||||
|
Equity securities:
|
||||||||||||||||||||||||||||||||||||||||
|
Preferred
|
117 | 117 | ||||||||||||||||||||||||||||||||||||||
|
Common
|
567 | 567 | ||||||||||||||||||||||||||||||||||||||
|
Total
|
$ | 732 | $ | 33,420 | $ | 50,165 | $ | 55,582 | $ | 139,899 | ||||||||||||||||||||||||||||||
Loan Portfolio:
Economic factors and how they affect loan demand are of extreme importance to us and the overall banking industry, as lending is a primary business activity. Loans are the most significant component of earning assets and they generate the greatest amount of revenue for us. Similar to the investment portfolio, there are risks inherent in the loan portfolio that must be understood and considered in managing the lending function. These risks include IRR, credit concentrations and fluctuations in demand. Changes in economic conditions and interest rates affect these risks which influence loan demand, the composition of the loan portfolio and profitability of the lending function.
27
Peoples Financial Services Corp.
Management’s Discussion and Analysis
(Dollars in thousands, except per share data)
The composition of the loan portfolio at year-end for the past five years is summarized as follows:
Distribution of loan portfolio
|
2011
|
2010
|
2009
|
2008
|
2007
|
||||||||||||||||||||||||||||||||||||
|
December 31
|
Amount
|
%
|
Amount
|
%
|
Amount
|
%
|
Amount
|
%
|
Amount
|
%
|
||||||||||||||||||||||||||||||
|
Commercial
|
$ | 160,828 | 36.13 | % | $ | 112,526 | 28.80 | % | $ | 82,287 | 24.52 | % | $ | 71,723 | 22.65 | % | $ | 63,536 | 21.84 | % | ||||||||||||||||||||
|
Real estate:
|
||||||||||||||||||||||||||||||||||||||||
|
Commercial
|
145,554 | 32.70 | 136,910 | 35.04 | 116,294 | 34.66 | 107,084 | 33.82 | 92,705 | 31.86 | ||||||||||||||||||||||||||||||
|
Residential
|
118,125 | 26.54 | 119,424 | 30.56 | 116,150 | 34.62 | 120,813 | 38.16 | 116,845 | 40.16 | ||||||||||||||||||||||||||||||
|
Consumer
|
20,596 | 4.63 | 21,912 | 5.60 | 20,802 | 6.20 | 16,988 | 5.37 | 17,889 | 6.14 | ||||||||||||||||||||||||||||||
|
Loans, net
|
445,103 | 100.00 | % | 390,772 | 100.00 | % | 335,533 | 100.00 | % | 316,608 | 100.00 | % | 290,975 | 100.00 | % | |||||||||||||||||||||||||
|
Less: allowance for loan loss
|
5,349 | 4,100 | 3,337 | 3,002 | 2,451 | |||||||||||||||||||||||||||||||||||
|
Net loans
|
$ | 439,754 | $ | 386,672 | $ | 332,196 | $ | 313,606 | $ | 288,524 | ||||||||||||||||||||||||||||||
Loans, net increased $54.3 million or 13.9 percent to $445.1 million at December 31, 2011, from $390.8 million at the end of 2010. Reductions in residential mortgages and consumer loans were more than offset by an increase in business lending. Business loans, including commercial loans and commercial mortgages, increased $56.9 million to $306.4 million at December 31, 2011, from $249.5 million at year-end 2010. As aforementioned, the strength of our loan demand was impacted by asset quality issues and merger related business disruptions of our competitors. Residential mortgage loans decreased $1.3 million to $118.1 million at the close of 2011 from $119.4 million at December 31, 2010. Consumer loans decreased $1.3 million to $20.6 million at December 31, 2011, from $21.9 million at December 31, 2010.
Loans averaged $420.6 million in 2011, an increase of $56.4 million or 15.5 percent compared to $364.2 million in 2010. Taxable loans increased $47.4 million, while tax-exempt loans rose $9.0 million. Due to the increase in loan demand, the loan portfolio played a more prominent role in our earning asset mix. As a percentage of earning assets, average loans equaled 75.5 percent in 2011 compared to 70.4 percent in 2010.
The prime rate was unchanged at 3.25 percent for 2011. The continuation of low interest rates caused the tax-equivalent yield on our loan portfolio to decrease 15 basis points to 5.64 percent in 2011 from 5.79 percent in 2010. The effect of market rates on our loan portfolio’s yield can be further evidenced by evaluating quarterly loan yields, which continued to decline during 2011. After being relatively unchanged in the first and second quarters, the tax-equivalent yield on the loan portfolio fell 10 basis points to 5.61 percent in the third quarter. Loan yields declined again in the fourth quarter, decreasing 8 basis points. With no anticipated date for change in general market rates in the near term, the yield on the loan portfolio may continue to decline as there are adjustable-rate loans in the portfolio that will reprice downward throughout the year. Moreover, increased competition will prompt more aggressive pricing for fixed rate intermediate term loans and lower yields further.
28
Peoples Financial Services Corp.
Management’s Discussion and Analysis
(Dollars in thousands, except per share data)
The maturity distribution and sensitivity information of the loan portfolio by major classification at December 31, 2011, is summarized as follows:
Maturity distribution and interest sensitivity of loan portfolio
|
December 31
|
Within one year
|
After one but within five years
|
After five years
|
Total
|
||||||||||||
|
Maturity schedule:
|
||||||||||||||||
|
Commercial
|
$ | 28,917 | $ | 38,147 | $ | 93,764 | $ | 160,828 | ||||||||
|
Real estate:
|
||||||||||||||||
|
Commercial
|
8,319 | 33,487 | 103,748 | 145,554 | ||||||||||||
|
Residential
|
5,352 | 21,729 | 91,044 | 118,125 | ||||||||||||
|
Consumer
|
4,481 | 9,501 | 6,614 | 20,596 | ||||||||||||
|
Total
|
$ | 47,069 | $ | 102,864 | $ | 295,170 | $ | 445,103 | ||||||||
|
Predetermined interest rates
|
$ | 21,653 | $ | 34,526 | $ | 40,408 | $ | 96,587 | ||||||||
|
Floating or adjustable interest rates
|
25,416 | 68,338 | 254,762 | 348,516 | ||||||||||||
|
Total
|
$ | 47,069 | $ | 102,864 | $ | 295,170 | $ | 445,103 | ||||||||
As previously mentioned, there are numerous risks inherent in the loan portfolio. We manage the portfolio by employing sound credit policies and utilizing various modeling techniques in order to limit the effects of such risks. In addition, we utilize private mortgage insurance (“PMI”) and guaranteed Small Business Administration and Federal Home Loan Bank of Pittsburgh (“FHLB-Pgh”) loan programs to mitigate credit risk in the loan portfolio.
Bank regulators are specifically concerned with certain high-risk loan products offered by the banking industry. Our loan portfolio does not contain option adjustable-rate mortgage products, high loan-to-value ratio mortgages, subprime loans or loans with initial teaser rates.
We continuously monitor our liquidity position so that adequate funds are available to meet loan demand. Based on our asset/liability simulation model, we feel confident that loan demand can be facilitated through payments and prepayments on investments and loans, and increases in core deposits. We expect to receive approximately $81.3 million from repayments on loans and investment securities during 2012. In the event an unforeseen increase in loan demand arises, we could fund the demand by aggressively competing for deposits, by selling available-for-sale securities or by utilizing various credit products available through the FHLB-Pgh.
29
Peoples Financial Services Corp.
Management’s Discussion and Analysis
(Dollars in thousands, except per share data)
In an attempt to limit IRR and liquidity strains, we continually examine the maturity distribution and interest rate sensitivity of the loan portfolio. For 2011, market interest rates remained at historically low levels. Given the potential for rates to rise in the future, we continued to place emphasis on originating short-term, fixed-rate and adjustable-rate loans. Fixed-rate loans represented 21.7 percent of the loan portfolio at December 31, 2011, compared to 27.9 percent at the end of 2010. Fixed-rate loans decreased $12.6 million or 11.5 percent to $96.6 million at December 31, 2011 from $109.2 million at December 31, 2010. Comparatively, floating or adjustable-rate loans increased $66.9 million or 23.8 percent in 2011. Approximately 40.1 percent of the loan portfolio is expected to reprice within the next 12 months.
Additionally, our secondary market mortgage banking program provides us with an additional source of liquidity and a means to limit our exposure to IRR. Through this program, we are able to competitively price conforming one-to-four family residential mortgage loans without taking on IRR which would result from retaining these long-term, low fixed-rate loans on our books. The loans originated are subsequently sold in the secondary market, with the sales price locked in at the time of commitment, thereby greatly reducing our exposure to IRR.
The volume of mortgages originated by us and subsequently sold in the secondary market totaled $7.2 million in 2011, a decrease of $2.8 million from $10.0 million in 2010. Gains realized on the sale of these loans were $230 in 2011 and $289 in 2010. Residential mortgage loans serviced for the Federal National Mortgage Association (“FNMA”) totaled $38.7 million at December 31, 2011, an increase of $4.0 million or 11.5 percent from $34.7 million at the end of 2010. Mortgage loans held for sale totaled $569 at December 31, 2011, and $30 at the end of 2010.
Loan concentrations are considered to exist when the total amount of loans to any one borrower, or a multiple number of borrowers engaged in similar business activities or having similar characteristics, exceeds 10.0 percent of loans outstanding in any one category. We provide deposit and loan products and other financial services to individual and corporate customers in our four-county market area. There are no significant concentrations of credit risk from any individual counterparty or groups of counterparties, except for geographic concentrations.
In addition to the risks inherent in our loan portfolio, in the normal course of business, we are also a party to financial instruments with off-balance sheet risk to meet the financing needs of our customers. These instruments include legally binding commitments to extend credit, unused portions of lines of credit and commercial letters of credit, and may involve, to varying degrees, elements of credit risk and IRR in excess of the amount recognized in the financial statements.
Credit risk is the principal risk associated with these instruments. Our involvement and exposure to credit loss in the event that the instruments are fully drawn upon and the customer defaults is represented by the contractual amounts of these instruments. In order to control credit risk associated with entering into commitments and issuing letters of credit, we employ the same credit quality and collateral policies in making commitments that we use in other lending activities. We evaluate each customer’s creditworthiness on a case-by-case basis, and if deemed necessary, obtain collateral. The amount and nature of the collateral obtained is based on our credit evaluation.
The contractual amounts of off-balance sheet commitments at year-end for the past three years are summarized as follows:
|
December 31
|
2011
|
2010
|
2009
|
|||||||||
|
Commitments to extend credit
|
$ | 7,429 | $ | 5,617 | $ | 5,714 | ||||||
|
Unused portions of lines of credit
|
45,320 | 32,225 | 32,990 | |||||||||
|
Commercial letters of credit
|
17,051 | 18,170 | 15,691 | |||||||||
|
Total
|
$ | 69,800 | $ | 56,012 | $ | 54,395 | ||||||
30
Peoples Financial Services Corp.
Management’s Discussion and Analysis
(Dollars in thousands, except per share data)
We record an allowance for off-balance sheet credit losses, if deemed necessary, separately as a liability. No allowance was deemed necessary at December 31, 2011 and 2010. We do not anticipate that losses, if any, that may occur as a result of funding off-balance sheet commitments, would have a material adverse effect on our operating results or financial position.
Asset Quality:
The banking industry experienced substantial improvement in asset quality in 2011. For all FDIC-insured commercial banks, nonperforming loans and leases decreased 21.9 percent at December 31, 2011, from the end of 2010. The ratio of nonperforming assets to total assets for these institutions decreased to 1.58 percent at December 31, 2011, from 2.08 percent at year-end 2010. In addition, net charge-offs for these institutions decreased 40.3 percent comparing 2011 and 2010. As a result, FDIC-insured commercial banks reduced their loan loss provisions 52.7 percent in 2011. As a percentage of total loans, the allowance for loan losses for FDIC-insured commercial banks equaled 2.73 percent at the end of 2011, down from 3.42 percent at the end of 2010.
We are committed to developing and maintaining sound, quality assets through our credit risk management policies and procedures. Credit risk is the risk to earnings or capital which arises from a borrower’s failure to meet the terms of their loan agreement. We manage credit risk by diversifying the loan portfolio and applying policies and procedures designed to foster sound lending practices. These policies include certain standards that assist lenders in making judgments regarding the character, capacity, capital structure and collateral of the borrower.
With regard to managing our exposure to credit risk in light of general devaluations in real estate values, we have established maximum loan-to-value ratios for commercial mortgage loans not to exceed 75.0 percent of the lower of cost or appraised value. With regard to residential mortgages, customers with loan-to-value ratios between 80.0 percent and 100.0 percent are required to obtain PMI. There are no residential mortgage loans outstanding with loan-to-value ratios in excess of 100.0 percent. The 80.0 percent loan-to-value threshold provides a cushion in the event the property is devalued. PMI is used to protect us from loss in the event loan-to-value ratios exceed 80.0 percent and the customer defaults on the loan. Written appraisals are obtained prior to final approval for all real estate loans. Appraisals are performed by an independent appraiser engaged by us, not the customer, who is either state certified or state licensed depending upon collateral type and loan amount.
With respect to lending procedures, lenders must determine the borrower’s ability to repay the credit based on prevailing and expected market conditions prior to requesting approval for the loan. The Board of Directors establishes and reviews, at least annually, the lending authority for all loan officers and branch managers. Credits beyond the scope of the loan officers and branch managers are forwarded to the Loan Committee. This Committee, comprised of senior management, attempts to assure the quality of the loan portfolio through careful analysis of credit applications, adherence to credit policies and the examination of outstanding loans and delinquencies. These procedures assist in the early detection and timely follow-up of problem loans. Credits having an aggregated relationship of $2.5 million are subject to approval by our Board of Directors.
Credit risk is also minimized by quarterly internal reviews of our loan portfolio by the loan quality committee. These reviews aid us in identifying deteriorating financial conditions of borrowers, allowing us to assist customers in remedying these situations.
Nonperforming assets consist of nonperforming loans and foreclosed assets. Nonperforming loans include nonaccrual loans, restructured loans and accruing loans past due 90 days or more. For a discussion of our policy regarding nonperforming assets and the recognition of interest income on impaired loans, refer to the notes entitled, “Summary of significant accounting policies — Nonperforming assets,” and “Loans, net and allowance for loan losses” in the Notes to Consolidated Financial Statements to this Annual Report.
Information concerning nonperforming assets for the past five years is summarized as follows. The table includes credits classified for regulatory purposes and all material credits that cause us to have serious doubts as to the borrower’s ability to comply with present loan repayment terms.
31
Peoples Financial Services Corp.
Management’s Discussion and Analysis
(Dollars in thousands, except per share data)
Distribution of nonperforming assets
|
December 31
|
2011
|
2010
|
2009
|
2008
|
2007
|
|||||||||||||||
|
Nonaccrual loans:
|
||||||||||||||||||||
|
Commercial
|
$ | 5,871 | $ | 5,490 | $ | 59 | $ | 244 | ||||||||||||
|
Real estate:
|
||||||||||||||||||||
|
Commercial
|
1,170 | 371 | 2,469 | 358 | $ | 395 | ||||||||||||||
|
Residential
|
889 | 630 | 227 | |||||||||||||||||
|
Consumer
|
22 | |||||||||||||||||||
|
Total nonaccrual loans
|
7,930 | 6,513 | 2,528 | 829 | 395 | |||||||||||||||
|
Restructured loans:
|
||||||||||||||||||||
|
Commercial
|
1,667 | 559 | ||||||||||||||||||
|
Real estate:
|
||||||||||||||||||||
|
Commercial
|
4,042 | |||||||||||||||||||
|
Residential
|
||||||||||||||||||||
|
Consumer
|
||||||||||||||||||||
|
Total restructured loans
|
1,667 | 559 | 4,042 | |||||||||||||||||
|
Accruing loans past due 90 days or more:
|
||||||||||||||||||||
|
Commercial
|
12 | 123 | 21 | 177 | ||||||||||||||||
|
Real estate:
|
||||||||||||||||||||
|
Commercial
|
218 | 68 | 91 | |||||||||||||||||
|
Residential
|
337 | |||||||||||||||||||
|
Consumer
|
311 | 269 | ||||||||||||||||||
|
Total accruing loans past due 90 days or more
|
660 | 392 | 239 | 245 | 91 | |||||||||||||||
|
Total nonperforming loans
|
10,257 | 6,905 | 3,326 | 5,116 | 486 | |||||||||||||||
|
Foreclosed assets
|
399 | 3,387 | 5,534 | 5,171 | 4,675 | |||||||||||||||
|
Total nonperforming assets
|
$ | 10,656 | $ | 10,292 | $ | 8,860 | $ | 10,287 | $ | 5,161 | ||||||||||
|
Nonperforming loans as a percentage of loans, net
|
2.30 | % | 1.77 | % | 0.99 | % | 1.63 | % | 0.17 | % | ||||||||||
|
Nonperforming assets as a percentage of loans, net and foreclosed assets
|
2.39 | % | 2.61 | % | 2.60 | % | 3.23 | % | 1.76 | % | ||||||||||
Similar to the banking industry in general, we continued to experience asset quality improvements in 2011. The economic recovery in our market area aided by the impact of natural gas drilling continued to favorably affect our commercial customer base and the market values of the collateral supporting their loans with us. Despite a sizable increase in the overall loan portfolio, the amount of nonperforming assets was relatively unchanged comparing year-end 2011 and 2010. Nonperforming assets decreased to 2.39 percent of loans, net and foreclosed assets at December 31, 2011, from 2.61 percent at the end of 2010. A decrease of $3.0 million in foreclosed assets offset increases of $3.1 million in nonaccrual loans and loans with terms modified under troubled debt restructures.
There were three properties with an aggregate fair value less cost to sell of $3,387 in foreclosed assets at December 31, 2010. During 2011, properties with an aggregate fair value less cost to sell of $595 were transferred to foreclosed assets. Properties with an aggregate carrying value of $3,583 were sold for $2,254 and a $3,000 loan by Peoples Bank to facilitate the sale of other real estate, resulting in a net realized gain of $1,671. At December 31, 2011, there were four properties with an aggregate fair value less cost to sell of $399 in foreclosed assets.
32
Peoples Financial Services Corp.
Management’s Discussion and Analysis
(Dollars in thousands, except per share data)
During 2011, we initiated several preventative measures aimed at assuring that problem assets remain at minimal levels. These steps include:
|
·
|
Hiring an independent loan review company to provide a independent review of existing credits and assist us with our credit risk management practices, including the review of and recommendations for enhancing the allowance for loan loss policy, loan review function and credit related processes such as underwriting, approval and monitoring of loans;
|
|
·
|
Enhancing the oversight and workout of classified assets and adding staff to the workout and loan review functions;
|
|
·
|
Initiating the formation of a problem loan committee for the purpose of monitoring the status of problem assets and devising action plans for the timely workout or liquidation of these assets;
|
|
·
|
Overhauling the appraisal process by requiring new appraisals on all impaired loans subject to evaluation under Financial Accounting Standards Board (“FASB”) Accounting Standards Codification (“ASC”) 310, “Receivables,” and any loan that is delinquent over 60 days; and
|
|
·
|
Tightening underwriting standards to ensure a more rigorous review of potential loans and more conservative lending standards.
|
We maintain the allowance for loan losses at a level we believe adequate to absorb probable credit losses related to individually evaluated loans, as well as probable incurred losses inherent in the remainder of the loan portfolio as of the balance sheet date. The balance in the allowance for loan losses account is based on past events and current economic conditions. We employ the FFIEC Interagency Policy Statement, as amended, and GAAP in assessing the adequacy of the allowance account. Under GAAP, the adequacy of the allowance account is determined based on the provisions of FASB ASC 310 for loans specifically identified to be individually evaluated for impairment and the requirements of FASB ASC 450, for large groups of smaller-balance homogeneous loans to be collectively evaluated for impairment.
We follow our systematic methodology in accordance with procedural discipline by applying it in the same manner regardless of whether the allowance is being determined at a high point or a low point in the economic cycle. Each quarter, our loan review division identifies those loans to be individually evaluated for impairment and those to be collectively evaluated for impairment utilizing a standard criteria. Internal loan review grades are assigned quarterly to loans identified to be individually evaluated. A loan’s grade may differ from period to period based on current conditions and events, however, we consistently utilize the same grading system each quarter. We consistently use loss experience from the latest twelve quarters in determining the historical loss factor for each pool collectively evaluated for impairment. Qualitative factors are evaluated in the same manner each quarter and are adjusted within a relevant range of values based on current conditions to assure directional consistency of the allowance for loan loss account. Regulators, in reviewing the loan portfolio as part of the scope of a regulatory examination, may require the Company to increase its allowance for loan losses.
For a further discussion of our accounting policies for determining the amount of the allowance and a description of the systematic analysis and procedural discipline applied, refer to the note entitled, “Summary of significant accounting policies — Allowance for loan losses,” in the Notes to Consolidated Financial Statements to this Annual Report.
33
Peoples Financial Services Corp.
Management’s Discussion and Analysis
(Dollars in thousands, except per share data)
A reconciliation of the allowance for loan losses and an illustration of charge-offs and recoveries by major loan category for the past five years are summarized as follows:
|
December 31
|
2011
|
2010
|
2009
|
2008
|
2007
|
|||||||||||||||
|
Allowance for loan losses at beginning of period
|
$ | 4,100 | $ | 3,337 | $ | 3,002 | $ | 2,451 | $ | 1,792 | ||||||||||
|
Loans charged-off:
|
||||||||||||||||||||
|
Commercial
|
374 | 1,360 | 419 | 49 | ||||||||||||||||
|
Real estate:
|
||||||||||||||||||||
|
Commercial
|
77 | 948 | 93 | |||||||||||||||||
|
Residential
|
9 | 25 | 46 | 4 | 3 | |||||||||||||||
|
Consumer
|
139 | 104 | 134 | 100 | 71 | |||||||||||||||
|
Total
|
599 | 1,489 | 1,547 | 246 | 74 | |||||||||||||||
|
Loans recovered:
|
||||||||||||||||||||
|
Commercial
|
1 | 19 | 48 | 11 | 422 | |||||||||||||||
|
Real estate:
|
||||||||||||||||||||
|
Commercial
|
2 | 50 | ||||||||||||||||||
|
Residential
|
1 | 3 | 34 | 4 | ||||||||||||||||
|
Consumer
|
50 | 31 | 46 | 39 | 27 | |||||||||||||||
|
Total
|
54 | 50 | 147 | 84 | 453 | |||||||||||||||
|
Net loans charged-off (recovered)
|
545 | 1,439 | 1,400 | 162 | (379 | ) | ||||||||||||||
|
Provision for loan losses
|
1,794 | 2,202 | 1,735 | 713 | 280 | |||||||||||||||
|
Allowance for loan losses at end of period
|
$ | 5,349 | $ | 4,100 | $ | 3,337 | $ | 3,002 | $ | 2,451 | ||||||||||
|
Ratios:
|
||||||||||||||||||||
|
Net loans charged-off as a percentage of average loans outstanding
|
0.13 | % | 0.40 | % | 0.43 | % | 0.05 | % | (0.14 | )% | ||||||||||
|
Allowance for loan losses as a percentage of period end loans
|
1.20 | % | 1.05 | % | 0.99 | % | 0.95 | % | 0.84 | % | ||||||||||
The allowance for loan losses increased $1,249 to $5,349 at December 31, 2011, from $4,100 at the end of 2010. The increase resulted from a provision for loan losses of $1,794 exceeding net loans charged-off of $545. The allowance for loan losses, as a percentage of loans, net of unearned income, was 1.20 percent at the end of 2011, compared to 1.05 percent at the end of 2010.
Past due loans not satisfied through repossession, foreclosure or related actions are evaluated individually to determine if all or part of the outstanding balance should be charged against the allowance for loan losses account. Any subsequent recoveries are credited to the allowance account. Net loans charged-off decreased $894 or 62.1 percent to $545 in 2011 from $1,439 in 2010. Net charge-offs, as a percentage of average loans outstanding, equaled 0.13 percent in 2011 and 0.40 percent in 2010.
34
Peoples Financial Services Corp.
Management’s Discussion and Analysis
(Dollars in thousands, except per share data)
The allocation of the allowance for loan losses for the past five years is summarized as follows:
|
2011
|
2010
|
2009
|
2008
|
2007
|
||||||||||||||||||||||||||||||||||||
|
December 31
|
Amount
|
%
|
Amount
|
%
|
Amount
|
%
|
Amount
|
%
|
Amount
|
%
|
||||||||||||||||||||||||||||||
|
Allocated allowance:
|
||||||||||||||||||||||||||||||||||||||||
|
Specific:
|
||||||||||||||||||||||||||||||||||||||||
|
Commercial
|
$ | 698 | 1.89 | % | $ | 663 | 1.51 | % | $ | 108 | 2.58 | % | $ | 243 | 0.38 | % | ||||||||||||||||||||||||
|
Real Estate:
|
||||||||||||||||||||||||||||||||||||||||
|
Commercial
|
40 | 1.76 | 122 | 2.28 | 578 | 0.31 | 331 | 1.39 | ||||||||||||||||||||||||||||||||
|
Residential
|
71 | 0.28 | 9 | 0.17 | 18 | 0.11 | 30 | 0.05 | $ | 5 | 0.03 | % | ||||||||||||||||||||||||||||
|
Consumer
|
1 | 31 | 0.01 | 17 | 0.01 | |||||||||||||||||||||||||||||||||||
|
Total specific
|
810 | 3.93 | 825 | 3.97 | 721 | 3.01 | 604 | 1.82 | 5 | 0.03 | ||||||||||||||||||||||||||||||
|
Formula:
|
||||||||||||||||||||||||||||||||||||||||
|
Commercial
|
1,349 | 34.24 | 1,033 | 27.28 | 178 | 21.94 | 152 | 22.27 | % | 187 | 21.84 | |||||||||||||||||||||||||||||
|
Real Estate:
|
||||||||||||||||||||||||||||||||||||||||
|
Commercial
|
1,475 | 30.94 | 1,262 | 32.75 | 1,434 | 34.35 | 1,233 | 32.43 | 1,511 | 31.86 | ||||||||||||||||||||||||||||||
|
Residential
|
690 | 26.26 | 717 | 30.39 | 728 | 34.51 | 608 | 38.11 | 603 | 40.13 | ||||||||||||||||||||||||||||||
|
Consumer
|
197 | 4.63 | 212 | 5.61 | 199 | 6.19 | 151 | 5.37 | 145 | 6.14 | ||||||||||||||||||||||||||||||
|
Total formula
|
3,711 | 96.07 | 3,224 | 96.03 | 2,539 | 96.99 | 2,144 | 98.18 | 2,446 | 99.97 | ||||||||||||||||||||||||||||||
|
Total allocated allowance
|
4,521 | 100.00 | % | 4,049 | 100.00 | % | 3,260 | 100.00 | % | 2,748 | 100.00 | % | 2,451 | 100.00 | % | |||||||||||||||||||||||||
|
Unallocated allowance
|
828 | 51 | 77 | 254 | ||||||||||||||||||||||||||||||||||||
|
Total
|
$ | 5,349 | $ | 4,100 | $ | 3,337 | $ | 3,002 | $ | 2,451 | ||||||||||||||||||||||||||||||
The allocated element of the allowance for loan losses account increased $472 to $4,521 at December 31, 2011, compared to $4,049 at December 31, 2010. The specific allowance for loan losses decreased while the formula portion of the allowance for loan losses increased from the end of 2010. The specific portion of the allowance for impairment of loans individually evaluated under FASB ASC 310, declined $15 to $810 at December 31, 2011, from $825 at year-end 2010 due primarily to a decrease in the amount of loans individually evaluated with a corresponding allowance recorded. The amount of impaired loans having sufficient collateral coverage increased to $9.3 million for December 31, 2011 from $7.0 million at the end of 2010. No allowance is considered necessary to absorb potential losses on these loans as the collateral, based on appraised values, should meet or exceed any shortfall in case of default. In addition, the formula portion of the allowance for loans collectively evaluated for impairment under FASB ASC 450, increased $472 to $4,521 at December 31, 2011, from $4,049 at December 31, 2010. The total loss factor for collectively evaluated loans increased from year-end 2010 due to a higher amount of average net charge-offs for the past twelve quarters and an increase in the qualitative factors.
The unallocated element equaled $828 representing 15.5 percent of the total allowance for loan losses at December 31, 2011, compared to $51 or 1.2 percent at December 31, 2010. We believe the increase in the unallocated element was appropriate given the significant growth in the loan portfolio and the higher amount of commercial loan originations, which have a greater degree of complexity as compared to other loan types. Moreover, the increase is directionally consistent in accordance with supervisory guidance on the allowance for loan losses.
35
Peoples Financial Services Corp.
Management’s Discussion and Analysis
(Dollars in thousands, except per share data)
As is inherent with all estimates, the allowance for loan losses methodology is subject to a certain level of imprecision as it provides reasonable, but not absolute, assurance that the allowance will be able to absorb probable losses, in their entirety, as of the financial statement date. Factors, among others, including judgments made in identifying those loans considered impaired, appraisals of collateral values and measurements of certain qualitative factors, all cause this imprecision and support the establishment of the unallocated element. We believe the unallocated element is sufficient to cover any inherent losses in the loan portfolio that have not been identified as part of the allocated element at December 31, 2011.
The coverage ratio, the allowance for loan losses account, as a percentage of nonperforming loans, is an industry ratio used to test the ability of the allowance account to absorb potential losses arising from nonperforming loans. The coverage ratio was 52.1 percent at December 31, 2011, compared to 59.4 percent at December 31, 2010. We believe that our allowance account was adequate to absorb probable credit losses at December 31, 2011.
Deposits:
Our deposit base is the primary source of funds to support our operations. We offer a variety of deposit products to meet the needs of our individual and commercial customers. Similar to the banking industry, we also experienced strong demand for our deposit products for the second consecutive year. Total deposits grew $55.5 million or 12.7 percent to $494.3 million at December 31, 2011, from $438.8 million at the end of 2010. In comparison, total deposits increased $28.7 million or 7.0 percent in 2010. For 2011, interest-bearing accounts increased $36.2 million or 9.9 percent. Our success in acquiring deposits was impacted by the acquisition of a primary competitor in the market by a large regional financial institution. Being the only community bank in our market area, we have the distinct competitive advantage of being able to offer customers direct access to senior management with the autonomy to make prompt decisions regarding customer accounts. The impact of this advantage was particularly evident as we were able to acquire a number of local municipal and school district customers in 2011. As previously mentioned, our deposit gathering was also significantly affected by the influx of deposits from natural gas drilling activities within our market area. As a result, we experienced an aggregate increase in interest-bearing transaction accounts, which include money market, NOW and savings accounts, of $20.1 million. Noninterest-bearing accounts rose $19.3 million or 26.2 percent, partially due to the increase in commercial relationships.
36
Peoples Financial Services Corp.
Management’s Discussion and Analysis
(Dollars in thousands, except per share data)
The average amount of, and the rate paid on, the major classifications of deposits for the past three years are summarized as follows:
Deposit distribution
|
2011
|
2010
|
2009
|
||||||||||||||||||||||
|
Year Ended December 31
|
Average Balance
|
Average Rate
|
Average Balance
|
Average Rate
|
Average Balance
|
Average Rate
|
||||||||||||||||||
|
Interest-bearing:
|
||||||||||||||||||||||||
|
Money market accounts
|
$ | 39,927 | 0.63 | % | $ | 36,829 | 0.75 | % | $ | 32,771 | 1.05 | % | ||||||||||||
|
NOW accounts
|
49,299 | 0.58 | 42,992 | 0.70 | 35,697 | 0.91 | ||||||||||||||||||
|
Savings accounts
|
194,523 | 0.80 | 187,007 | 1.08 | 130,652 | 1.30 | ||||||||||||||||||
|
Time deposits less than $100
|
75,216 | 2.31 | 70,269 | 2.44 | 84,233 | 2.83 | ||||||||||||||||||
|
Time deposits $100 or more
|
28,729 | 2.06 | 20,253 | 1.90 | 22,120 | 2.61 | ||||||||||||||||||
|
Total interest-bearing
|
387,694 | 1.14 | % | 357,350 | 1.31 | % | 305,473 | 1.74 | % | |||||||||||||||
|
Noninterest-bearing
|
81,224 | 72,846 | 62,325 | |||||||||||||||||||||
|
Total deposits
|
$ | 468,918 | $ | 430,196 | $ | 367,798 | ||||||||||||||||||
Total deposits averaged $468.9 million in 2011, an increase of $38.7 million or 9.0 percent, compared to $430.2 million in 2010. Average noninterest-bearing deposits increased $8.4 million or 11.5 percent, while average interest-bearing accounts grew $30.3 million or 8.5 percent. With regard to average interest-bearing deposits, average total time deposits increased $13.4 million. We continued to experience strong growth in large denomination certificates of deposit, as customers continued to receive lease payments and royalties from gas companies for drilling rights to their properties. We also experienced growth in all interest-bearing transaction accounts, as average money market, NOW and savings accounts grew $3.1 million, $6.3 million and $7.5 million.
We regularly monitor interest rates of local competitors and prevailing market rates when setting interest rates on our deposit products. Price competition for deposits in our market area was, for the most part, subdued during 2011. As previously mentioned, the FOMC held short-term interest rates steady over the course of the year. In addition, short-term U.S. Treasury rates remained low by historical standards. For community banks in our market area, the average rate paid for a 6-month certificate fell 9 basis points during the first half of the year, from 0.42 percent at January 1, 2011, to 0.33 percent at June 30, 2011. Similarly, the average rate paid for the 24-month certificate decreased 14 basis points to 0.74 percent mid-year, from 0.88 percent at the beginning of 2011. In addition, the rate paid for a longer-term, 60-month certificate decreased 8 basis points to 1.79 percent at the close of the second quarter from 1.87 percent at the beginning of 2011. Later in the year, short-term and long-term certificate of deposit rates decreased further as the supply of funds outweighed bank demand. The average rate paid for the 6-month and 24-month certificates decreased 14 basis points and 21 basis points to 0.19 percent and 0.53 percent at December 31, 2011, while the average rate on a 60-month certificate declined 36 basis points to 1.43 percent.
37
Peoples Financial Services Corp.
Management’s Discussion and Analysis
(Dollars in thousands, except per share data)
As a result of a strong liquidity position, we did not have to aggressively compete for deposits in 2011. In an effort to mitigate stress placed on our tax-equivalent net interest margin from reduction in the repricing yields on earning assets, we aggressively lowered our deposit rates. At January 1, 2011, our 6-month certificate of deposit rate was 0.50 percent, 8 basis points higher than the average for our competitors. Similarly, the rate paid for our 24-month certificate of deposit at the beginning of 2011 was 1.00 percent, 12 basis points higher than the average for the other community banks in our market area. Our rate offerings for these certificates were lowered during the remainder of 2011. Our competitors also began to gradually lower their rates throughout the year and by the end of 2011, the spread between us and our competition decreased slightly at the 6-month maturity and remained steady at 12 basis points at the 24-month maturity. Being a community bank, we still wanted to retain our current customer base and protect our market share despite realizing the need to lower operating expenses. For 2011, we introduced promotional rates on a long-term certificate of deposit with a 72-month maturity term, in order to entice depositors to lock in for a longer term at comparatively lower interest rates than historically offered. At its inception, the rate offered on this certificate of deposit was 2.97 percent. Similar to short-term certificate rates, the rate was decreased to 2.50 percent by the end of 2011. We took similar actions in reducing the rates paid on our interest-bearing transaction accounts, including money market, NOW and savings accounts. As a result of the actions taken, with respect to pricing, our cost of deposits fell 17 basis points to 1.14 percent in 2011, from 1.31 percent in 2010. In anticipation of market rates remaining at current levels, we expect our cost of deposits to be favorable. However, no assurance can be given that interest rates will remain low. In addition, should competition increase in our market areas, we may need to compete more aggressively for deposits to support our liquidity position, thereby adversely affecting our deposit costs.
Volatile deposits, time deposits $100 or more, increased $9.4 million to $36.7 million at December 31, 2011, from $27.3 million at the end of 2010. Large denomination time deposits averaged $28.7 million in 2011, an increase of $8.5 million or 42.1 percent from $20.2 million in 2010. Our average cost of these funds increased 16 basis points to 2.06 percent in 2011, from 1.90 percent in 2010. This type of funding is susceptible to withdrawal by the depositor as they are particularly price sensitive and are therefore not considered to be a strong source of liquidity. Despite the increase in time deposits, we continued to be less reliant on this type of funding as compared to our peer group.
Maturities of time deposits $100 or more for the past three years are summarized as follows:
|
December 31
|
2011
|
2010
|
2009
|
|||||||||
|
Within three months
|
$ | 6,984 | $ | 7,492 | $ | 4,912 | ||||||
|
After three months but within six months
|
2,212 | 1,574 | 2,916 | |||||||||
|
After six months but within twelve months
|
3,552 | 2,223 | 3,480 | |||||||||
|
After twelve months
|
23,987 | 15,997 | 9,121 | |||||||||
|
Total
|
$ | 36,735 | $ | 27,286 | $ | 20,429 | ||||||
In addition to deposit gathering, we have in place a secondary source of liquidity to fund operations through exercising existing credit arrangements with the FHLB-Pgh. We had only minimal reliance on this type of funding in 2011 and 2010. For a further discussion of our borrowings and their terms, refer to the note entitled, “Short-term borrowings,” in the Notes to Consolidated Financial Statements to this Annual Report.
38
Peoples Financial Services Corp.
Management’s Discussion and Analysis
(Dollars in thousands, except per share data)
Market Risk Sensitivity:
Market risk is the risk to our earnings and/or financial position resulting from adverse changes in market rates or prices, such as interest rates, foreign exchange rates or equity prices. Our exposure to market risk is primarily IRR associated with our lending, investing and deposit gathering activities. During the normal course of business, we are not exposed to foreign exchange risk or commodity price risk. Our exposure to IRR can be explained as the potential for change in our reported earnings and/or the market value of our net worth. Variations in interest rates affect the underlying economic value of our assets, liabilities and off-balance sheet items. These changes arise because the present value of future cash flows, and often the cash flows themselves, change with interest rates. The effects of the changes in these present values reflect the change in our underlying economic value, and provide a basis for the expected change in future earnings related to interest rates. Interest rate changes affect earnings by changing net interest income and the level of other interest-sensitive income and operating expenses. IRR is inherent in the role of banks as financial intermediaries. However, a bank with a high degree of IRR may experience lower earnings, impaired liquidity and capital positions, and most likely, a greater risk of insolvency. Therefore, banks must carefully evaluate IRR to promote safety and soundness in their activities.
The FOMC has maintained the target range for the federal funds rate at 0 to 25 basis points and has indicated that economic conditions are likely to continue to warrant these exceptionally low interest rate levels for some time. Given these conditions, IRR and the ability to effectively manage it, are extremely critical to both bank management and regulators. The FFIEC recently issued an advisory reiterating the importance of effective corporate governance, policies and procedures, risk measuring and monitoring systems, stress testing and internal controls related to the IRR exposure of depository institutions. According to the advisory, the bank regulators believe that the current financial market and economic conditions present significant risk management challenges to all financial institutions. In addition, increased loan losses and sharp declines in the values of some investment portfolios are placing downward pressure on capital and earnings. Although the bank regulators recognize that some degree of IRR is inherent in banking, they expect institutions to have sound risk management practices in place to measure, monitor and control IRR exposure. The advisory states that the adequacy and effectiveness of an institution’s IRR management process and the level of IRR exposure are critical factors in the bank regulators’ evaluation of an institution’s sensitivity to changes in interest rates and capital adequacy. Material weaknesses in risk management processes or high levels of IRR exposure relative to capital will require corrective action. We believe our risk management practices with regard to IRR were sound, suitable and adequate given the level of IRR exposure at December 31, 2011.
The Asset/Liability Committee (“ALCO”), comprised of members of our Board of Directors, senior management and other appropriate officers, oversees our IRR management program. Specifically, ALCO analyzes economic data and market interest rate trends, as well as competitive pressures, and utilizes several computerized modeling techniques to reveal potential exposure to IRR. This allows us to monitor and attempt to control the influence these factors may have on our rate sensitive assets (“RSA”), rate sensitive liabilities (“RSL”) and overall operating results and financial position.
39
Peoples Financial Services Corp.
Management’s Discussion and Analysis
(Dollars in thousands, except per share data)
With respect to evaluating our exposure to IRR on earnings, we utilize a gap analysis model that considers repricing frequencies of RSA and RSL. Gap analysis attempts to measure our interest rate exposure by calculating the net amount of RSA and RSL that reprice within specific time intervals. A positive gap occurs when the amount of RSA repricing in a specific period is greater than the amount of RSL repricing within that same time frame and is indicated by a RSA/RSL ratio greater than 1.0. A negative gap occurs when the amount of RSL repricing is greater than the amount of RSA and is indicated by a RSA/RSL ratio less than 1.0. A positive gap implies that earnings will be impacted favorably if interest rates rise and adversely if interest rates fall during the period. A negative gap tends to indicate that earnings will be affected inversely to interest rate changes.
Our interest rate sensitivity gap position, illustrating RSA and RSL at their related carrying values, is summarized as follows. The distributions in the table are based on a combination of maturities, call provisions, repricing frequencies and prepayment patterns. Adjustable-rate assets and liabilities are distributed based on the repricing frequency of the instrument. Mortgage instruments are distributed in accordance with estimated cash flows, assuming there is no change in the current interest rate environment.
Interest rate sensitivity
|
December 31, 2011
|
Due within three months
|
Due after three months but within twelve months
|
Due after one year but within five years
|
Due after five years
|
Total
|
|||||||||||||||
|
Rate-sensitive assets:
|
||||||||||||||||||||
|
Interest-bearing deposits in other banks
|
$ | 71 | $ | 1,000 | $ | 1,071 | ||||||||||||||
|
Investment securities available-for-sale
|
11,000 | $ | 17,296 | 42,249 | $ | 69,354 | 139,899 | |||||||||||||
|
Loans held for sale
|
569 | 569 | ||||||||||||||||||
|
Loans, net
|
108,237 | 70,029 | 192,458 | 74,379 | 445,103 | |||||||||||||||
|
Total rate-sensitive assets
|
$ | 119,877 | $ | 87,325 | $ | 235,707 | $ | 143,733 | $ | 586,642 | ||||||||||
|
Rate-sensitive liabilities:
|
||||||||||||||||||||
|
Money market accounts
|
$ | 17,830 | $ | 20,094 | $ | 37,924 | ||||||||||||||
|
NOW accounts
|
28,615 | $ | 25,741 | 54,356 | ||||||||||||||||
|
Savings accounts
|
153,615 | 46,804 | 200,419 | |||||||||||||||||
|
Time deposits less than $100
|
15,966 | 15,608 | 35,015 | $ | 5,275 | 71,864 | ||||||||||||||
|
Time deposits $100 or more
|
6,984 | 5,764 | 21,968 | 2,019 | 36,735 | |||||||||||||||
|
Short-term borrowings
|
43,791 | 43,791 | ||||||||||||||||||
|
Long-term debt
|
196 | 5,601 | 13,061 | 69 | 18,927 | |||||||||||||||
|
Total rate-sensitive liabilities
|
$ | 266,997 | $ | 52,714 | $ | 136,942 | $ | 7,363 | $ | 464,016 | ||||||||||
|
Rate-sensitivity gap:
|
||||||||||||||||||||
|
Period
|
$ | (147,120 | ) | $ | 34,611 | $ | 98,765 | $ | 136,370 | |||||||||||
|
Cumulative
|
$ | (147,120 | ) | $ | (112,509 | ) | $ | (13,744 | ) | $ | 122,626 | |||||||||
|
RSA/RSL ratio:
|
||||||||||||||||||||
|
Period
|
0.45 | 1.66 | 1.72 | 19.52 | ||||||||||||||||
|
Cumulative
|
0.45 | 0.65 | 0.97 | 1.26 | 1.26 | |||||||||||||||
40
Peoples Financial Services Corp.
Management’s Discussion and Analysis
(Dollars in thousands, except per share data)
At December 31, 2011, we were in a negative gap position with a cumulative one-year RSA/RSL ratio of 0.65. Similarly, at December 31, 2010, our cumulative one-year RSA/RSL ratio was 0.42. Given the economic conditions which included an exceptionally low short-term interest rate environment, the focus of ALCO during 2011 was to reduce the negative gap position in order to provide equilibrium between RSA and RSL. Specifically throughout 2011, we attempted to increase the volume of loans with short repricing terms in order to restore a balanced IRR position. In addition, we discontinued our short-term certificate of deposit promotions and began offering preferential rates on longer-term certificates of deposit, including 63- and 72-month maturities. ALCO will reemphasize these strategies in 2012 in an attempt to restore equilibrium between RSA and RSL. However, these forward-looking statements are qualified in the aforementioned section entitled “Forward-Looking Discussion” in this Management’s Discussion and Analysis.
Specifically, the change in our RSA/RSL ratio from the previous year-end resulted primarily from a $55.7 million or 36.8 percent increase in RSA maturing or repricing within one year, coupled with a $36.1 million or 10.2 percent decrease in RSL maturing or repricing within one year. The increase in RSA resulted primarily from a $42.5 million increase in loans, net maturing or repricing within the next 12 months. In addition to the increase in loans, a $11.0 million decrease in federal funds sold, more than offset increases of $23.7 million in investment securities and $0.5 million in loans held for sale. With regard to RSL, a decrease in interest-bearing transaction accounts of $46.8 million partially offset by increases in total time deposits of $3.2 million, short-term borrowings of $5.1 million and long-term debt of $2.4 explains the total change in RSL maturing or repricing within one year.
Static gap analysis, although a credible measuring tool, does not fully illustrate the impact of interest rate changes on future earnings. First, market rate changes normally do not equally or simultaneously affect all categories of assets and liabilities. Second, assets and liabilities that can contractually reprice within the same period may not do so at the same time or to the same magnitude. Third, the interest rate sensitivity table presents a one-day position and variations occur daily as we adjust our rate sensitivity throughout the year. Finally, assumptions must be made in constructing such a table. For example, the conservative nature of our Asset/Liability Management Policy assigns personal NOW accounts to the “Due after three months but within twelve months” repricing interval and personal money market accounts to the “Due after one year but within five years” repricing interval. In reality, these accounts may reprice less frequently and in different magnitudes than changes in general market interest rate levels.
We utilize a simulation model to address the failure of the static gap model to address the dynamic changes in the balance sheet composition or prevailing interest rates and to enhance our asset/liability management. This model creates pro forma net interest income scenarios under various interest rate shocks. Given instantaneous and parallel shifts in general market rates of plus 100 basis points, our projected net interest income for the 12 months ending December 31, 2012, would increase 0.3 percent from model results using current interest rates. Model results under a minus 100 basis point scenario were not meaningful, as the majority of short-term general market rates are already near zero.
We will continue to monitor our IRR position in 2012 and employ deposit and loan pricing strategies and direct the reinvestment of loan and investment payments and prepayments in order to maintain a favorable IRR position.
Financial institutions are affected differently by inflation than commercial and industrial companies that have significant investments in fixed assets and inventories. Most of our assets are monetary in nature and change correspondingly with variations in the inflation rate. It is difficult to precisely measure the impact inflation has on us, however, we believe that our exposure to inflation can be mitigated through our asset/liability management program.
41
Peoples Financial Services Corp.
Management’s Discussion and Analysis
(Dollars in thousands, except per share data)
Liquidity:
Liquidity management is essential to our continuing operations as it gives us the ability to meet our financial obligations as they come due, as well as to take advantage of new business opportunities as they arise. Our financial obligations include, but are not limited to, the following:
|
·
|
Funding new and existing loan commitments;
|
|
·
|
Payment of deposits on demand or at their contractual maturity;
|
|
·
|
Repayment of borrowings as they mature;
|
|
·
|
Payment of lease obligations; and
|
|
·
|
Payment of operating expenses.
|
Our liquidity position is impacted by several factors which include, among others, loan origination volumes, loan and investment maturity structure and cash flows, demand for core deposits and certificate of deposit maturity structure and retention. We manage these liquidity risks daily, thus enabling us to effectively monitor fluctuations in our position and to adapt our position according to market influence and balance sheet trends. We also forecast future liquidity needs and develop strategies to ensure adequate liquidity at all times.
Historically, core deposits have been our primary source of liquidity because of their stability and lower cost, in general, than other types of funding. Providing additional sources of funds are loan and investment payments and prepayments and the ability to sell both available-for-sale securities and mortgage loans held for sale. We believe our liquidity is adequate to meet both present and future financial obligations and commitments on a timely basis.
We maintain a Contingency Funding Plan to address liquidity in the event of a funding crisis. Examples of some of the causes of a liquidity crisis include, among others, natural disasters, war, events causing reputational harm and severe and prolonged asset quality problems. The Plan recognizes the need to provide alternative funding sources in times of crisis that go beyond our core deposit base. As a result, we have created a funding program that ensures the availability of various alternative wholesale funding sources that can be used whenever appropriate. Identified alternative funding sources include:
|
·
|
FHLB-Pgh liquidity contingency line of credit;
|
|
·
|
Federal Reserve Bank discount window;
|
|
·
|
Internet certificates of deposit;
|
|
·
|
Brokered deposits;
|
|
·
|
Institutional Deposit Corporation deposits;
|
|
·
|
Repurchase agreements; and
|
|
·
|
Federal funds purchased.
|
Based on our liquidity position at December 31, 2011, we do not anticipate the need to utilize any of these sources in the near term.
42
Peoples Financial Services Corp.
Management’s Discussion and Analysis
(Dollars in thousands, except per share data)
We employ a number of analytical techniques in assessing the adequacy of our liquidity position. One such technique is the use of ratio analysis to illustrate our reliance on noncore funds to fund our investments and loans maturing after 2012. At December 31, 2011, our noncore funds consisted of time deposits in denominations of $100 or more, repurchase agreements, short-term borrowings and long-term debt. Large denomination time deposits are particularly not considered to be a strong source of liquidity since they are very interest rate sensitive and are considered to be highly volatile. At December 31, 2011, our net noncore funding dependence ratio, the difference between noncore funds and short-term investments to long-term assets, was 13.0 percent. Our net short-term noncore funding dependence ratio, noncore funds maturing within one year, less short-term investments to long-term assets equaled -1.7 percent. Comparatively, our ratios equaled 1.8 percent and -1.0 percent at the end of 2010, which indicated an increase in our reliance on noncore funds. The increase in noncore funding reliance resulted primarily from an increase in short-term borrowings and time deposits $100 or more. Although we have some reliance on noncore funds, our reliance was significantly less than that of our peer group. According to the December 31, 2011, Bank Holding Company Performance Report for our Federal Reserve District, these ratios for our peer group were 18.4 percent and 5.9 percent. We believe that by supplying adequate volumes of short-term investments and implementing competitive pricing strategies on deposits, we can ensure adequate liquidity to support future growth.
The Consolidated Statements of Cash Flows present the change in cash and cash equivalents from operating, investing and financing activities. Cash and cash equivalents consist of cash on hand, cash items in the process of collection, noninterest-bearing and interest-bearing deposits with other banks and federal funds sold. Cash and cash equivalents decreased $7.3 million for the year ended December 31, 2011. Similarly, for the year ended December 31, 2010, cash and cash equivalents decreased $1.1 million. During 2011, cash provided by operating and financing activities was more than offset by cash used in investing activities.
Operating activities provided net cash of $8.6 million in 2011 and $11.2 million in 2010. Net income, adjusted for the effects of noncash expenses such as depreciation and the provision for loan losses is the primary source of funds from operations.
Net cash provided by financing activities equaled $49.0 million in 2011 and $33.2 million in 2010. Deposit gathering, which is our predominant financing activity, increased significantly in both 2011 and 2010. Deposit gathering provided a net cash inflow in 2011 of $55.6 million and $28.7 million in 2010. Partially offsetting the cash provided by deposit gathering in 2011 was $0.8 million in funds used for the repurchase of common shares, $2.5 million for the payment of dividends to stockholders and $8.4 million for repayment of long-term debt.
Our primary investing activities involve transactions related to our investment and loan portfolios. Net cash used in investing activities totaled $64.9 million in 2011, an increase of $19.4 million from $45.5 million in 2010. The demand for loans increased due to a loss of a major competitor along with other competitors experiencing asset quality problems. Net cash used in lending activities was $52.7 million and $57.1 million in 2011 and 2010. Activities related to our investment portfolio used net cash of $12.2 million in 2011 and provided net cash of $10.8 million in 2010. Repayments, coupled with sales, of investment securities amounted to $26.0 million in 2011, were more than offset by purchases of investment securities of $38.1 million. Conversely, in 2010, repayments of $84.0 million were more than the $73.2 million in purchases of investment securities.
We anticipate our liquidity position to be stable in 2012. Although we are expecting loan demand to continue to be strong, we expect to fund such demand through deposit gathering and payments and prepayments on loans and investments. As the infrastructure for natural gas drilling grows, deposit receipts from royalties are anticipated to ramp up. Moreover, continued weakness in economic conditions and equity markets may result in increased interest in bank deposits, as consumers continue to save rather than spend. However, we cannot predict the economic climate or the savings habits of consumers. Should economic conditions improve, deposit gathering may be negatively impacted as depositors seek alternative investments in the market. Regardless of economic conditions and stock market fluctuations, we believe that through constant monitoring and adherence to our liquidity plan, we will have the means to provide adequate cash to fund our normal operations in 2012.
43
Peoples Financial Services Corp.
Management’s Discussion and Analysis
(Dollars in thousands, except per share data)
Capital Adequacy:
We believe a strong capital position is essential to our continued growth and profitability. We strive to maintain a relatively high level of capital to provide our depositors and stockholders with a margin of safety. In addition, a strong capital base allows us to take advantage of profitable opportunities, support future growth and provide protection against any unforeseen losses.
In light of the recent bank failures and crisis within the financial industry, maintaining a high level of capital is of extreme importance to regulators as well as our management and Board of Directors. Our ALCO continually reviews our capital position. As part of its review, the ALCO considers:
|
·
|
The current and expected capital requirements, including the maintenance of capital ratios in excess of minimum regulatory guidelines;
|
|
·
|
The market value of our securities and the resulting effect on capital;
|
|
·
|
Nonperforming asset levels and the effect deterioration in asset quality will have on capital;
|
|
·
|
Any planned asset growth;
|
|
·
|
The anticipated level of net earnings and capital position, taking into account the projected asset/liability position and exposure to changes in interest rates; and
|
|
·
|
The source and timing of additional funds to fulfill future capital requirements.
|
Bank regulatory agencies consider capital to be a significant factor in ensuring the safety of a depositor’s accounts. These agencies have adopted minimum capital adequacy requirements that include mandatory and discretionary supervisory actions for noncompliance. Our and Peoples Bank’s risk-based capital ratios are strong and have consistently exceeded the minimum regulatory capital ratios of 4.0 percent and 8.0 percent required for adequately capitalized institutions. Our ratio of Tier I capital to risk-weighted assets and off-balance sheet items was 11.6 percent at December 31, 2011, and 11.7 percent at December 31, 2010. Our Total capital ratio was 12.7 percent at the close of both 2011 and 2010. Similarly, our Leverage ratio, which equaled 9.4 percent at December 31, 2011, and 9.2 percent at December 31, 2010, exceeded the minimum of 4.0 percent for capital adequacy purposes. Peoples Bank reported Tier I capital, Total capital and Leverage ratios of 11.0 percent, 12.1 percent and 8.9 percent at December 31, 2011, and 10.9 percent, 11.9 percent and 8.5 percent at December 31, 2010. Based on the most recent notification from the FDIC, Peoples Bank was categorized as well capitalized at December 31, 2011 and 2010. There are no conditions or events since this notification that we believe have changed Peoples Bank’s category. For a further discussion of these risk-based capital standards and supervisory actions for noncompliance, refer to the note entitled, “Regulatory matters,” in the Notes to Consolidated Financial Statements to this Annual Report.
Stockholders’ equity increased 9.1 million to $59.6 million or $19.11 per share at December 31, 2011, from $50.5 million or $16.07 per share at December 31, 2010. Net income of $7.8 million, was offset by net cash dividends declared of $2.5 million and, common shares repurchases of $0.8 million. Other comprehensive income related to an increase in the market value of investment securities available-for-sale increased capital by $4.6 million.
We declared dividends of $0.80 per share in 2011, compared to $0.79 per share in 2010. The dividend payout ratio, dividends declared as a percent of net income, equaled 32.3 percent in 2011 and 38.2 percent in 2010. Our Board of Directors intends to continue paying cash dividends in the future. However, our ability to declare and pay dividends in the future is based on our operating results, financial and economic conditions, capital and growth objectives, appropriate dividend restrictions and other relevant factors. We rely on dividends received from our subsidiary, Peoples Bank, for payment of dividends to stockholders. Peoples Bank’s ability to pay dividends is subject to federal and state regulations. For a further discussion on our ability to declare and pay dividends in the future and dividend restrictions, refer to the note entitled, “Regulatory matters,” in the Notes to Consolidated Financial Statements to this Annual Report.
44
Peoples Financial Services Corp.
Management’s Discussion and Analysis
(Dollars in thousands, except per share data)
Stockholders may automatically reinvest their dividends in shares of our common stock through our dividend reinvestment plan (“DRP”). The DRP not only provides stockholders with a convenient means to invest in our common stock without brokerage commissions, but also furnishes us with additional funds for general corporate purposes.
We have in the past periodically purchased shares of our common stock under a Board-approved stock repurchase program. Under this program, we repurchased 30,300 shares for $835 in 2011. No shares were repurchased in 2010.
Review of Financial Performance:
We experienced a successful year in 2011, as evidenced by a $1,332 or 20.5 percent increase in earnings to $7,817 or $2.49 per share from $6,485 or $2.07 per share in 2010. Strong net interest income growth was the major factor leading to the record earnings. Greater operating efficiency and a higher amount of noninterest income also contributed to the favorable earnings growth. Return on average assets (“ROAA”) and return on average equity (“ROAE”) improved significantly in comparison to the previous year. ROAA was 1.33 percent for the year ended December 31, 2011, compared to 1.18 percent for the year ended December 31, 2010. ROAE was 14.80 percent in 2011 compared to 13.87 percent in 2010. Net income increased $1,436 or 28.4 percent in 2010 from $5,049 in 2009.
Tax-equivalent net interest income rose $2,570 or 12.4 percent in 2011. Growth in earning assets exceeding the growth in interest-bearing liabilities was the primary factor leading to the increase in net interest income. Also contributing to the increase was an improvement in the net interest spread between the tax-equivalent yield on earning assets and our cost of funds. Our net interest margin equaled 4.18 percent in 2011, an 18 basis point improvement compared to 4.00 percent in 2010. In comparison, the net interest margin for FDIC-insured commercial banks increased slightly for banks with total assets between $100.0 million and $1.0 billion, up 2 basis points comparing 3.89 percent in 2011 and 3.87 percent in 2010. Our tax-equivalent net interest income rose $2,096 or 11.3 percent in 2010 from 2009.
With regard to noninterest income, revenue generated by our Wealth Management Division experienced a marked improvement in 2011. With the downturn in the housing market, net income generated in our secondary mortgage department decreased 17.0 percent. Service charges, fees, commissions and other decreased 14.2 percent. We also realized gains on the sale of foreclosed assets of $1,671, and a net gain of $25 on the sale of investment securities available for sale. Noninterest income increased $1,208 or 39.2 percent in 2010 compared to 2009.
Noninterest expense increased $2,065 or 15.6 percent to $15,310 in 2011 from $13,245 in 2010. Salaries and employee benefits expenses increased $937 or 17.0 percent as a result of additional staffing and normal merit increases. In addition, we experienced a $378 or 15.1 percent increase in occupancy and equipment expense due to system upgrades and additions, as well as, increases in utility, building repair and real estate tax costs. Other expenses increased $750 or 14.3% comparing 2011 and 2010. Our productivity improved as evidenced by the change in the operating efficiency ratio. The operating efficiency ratio, defined as noninterest expense divided by the total of net interest income and noninterest income, is an industry ratio used to measure productivity. Our operating efficiency ratio improved to 56.1 percent in 2011 compared to 56.7 percent in 2010. Our productivity also exceeded that of FDIC-insured commercial banks, which also improved in comparison to the previous year. The operating efficiency ratio for all FDIC-insured commercial banks was 61.2 percent in 2011 compared to 79.9 percent in 2010. Noninterest expense increased $855 or 6.9 percent in 2010 from 2009.
Net Interest Income
:
Net interest income is the fundamental source of earnings for commercial banks. Moreover, fluctuations in the level of noninterest income can have the greatest impact on net profits. Net interest income is defined as the difference between interest revenue, interest and fees earned on interest-earning assets, and interest expense, the cost of interest-bearing liabilities supporting those assets. The primary sources of earning assets are loans and investment securities, while interest-bearing deposits and borrowings comprise interest-bearing liabilities. Net interest income is impacted by:
45
Peoples Financial Services Corp.
Management’s Discussion and Analysis
(Dollars in thousands, except per share data)
|
·
|
Variations in the volume, rate and composition of earning assets and interest-bearing liabilities;
|
|
·
|
Changes in general market interest rates; and
|
|
·
|
The level of nonperforming assets.
|
Changes in net interest income are measured by the net interest spread and net interest margin. Net interest spread, the difference between the average yield earned on earning assets and the average rate incurred on interest-bearing liabilities, illustrates the effects changing interest rates have on profitability. Net interest margin, net interest income as a percentage of average earning assets, is a more comprehensive ratio, as it reflects not only the spread, but also the change in the composition of interest-earning assets and interest-bearing liabilities. Tax-exempt loans and investments carry pretax yields lower than their taxable counterparts. Therefore, in order to make the analysis of net interest income more comparable, tax-exempt income and yields are reported in this analysis on a tax-equivalent basis using the prevailing federal statutory tax rate of 34.0 percent.
Similar to all banks, we consider the maintenance of an adequate net interest margin to be of primary concern. The current economic environment has been very challenging for the banking industry. In addition to market rates and competition, nonperforming asset levels are of particular concern for the banking industry and may place additional pressure on net interest margins. Nonperforming assets may increase given the state of the economy and soft labor markets. No assurance can be given as to how general market conditions will change or how such changes will affect net interest income. Therefore, we believe through prudent deposit and loan pricing practices, careful investing, and constant monitoring of nonperforming assets, our net interest margin will remain strong.
We analyze interest income and interest expense by segregating rate and volume components of earning assets and interest-bearing liabilities. The impact changes in the interest rates earned and paid on assets and liabilities, along with changes in the volumes of earning assets and interest-bearing liabilities, have on net interest income are summarized as follows. The net change or mix component, attributable to the combined impact of rate and volume changes within earning assets and interest-bearing liabilities’ categories, has been allocated proportionately to the change due to rate and the change due to volume.
|
2011 vs 2010
Increase (decrease)
attributable to
|
2010 vs 2009
Increase (decrease)
attributable to
|
|||||||||||||||||||||||
|
Total
|
Rate
|
Volume
|
Total
|
Rate
|
Volume
|
|||||||||||||||||||
|
Interest income:
|
||||||||||||||||||||||||
|
Loans:
|
||||||||||||||||||||||||
|
Taxable
|
$ | 2,222 | $ | (443 | ) | $ | 2,665 | $ | 933 | $ | (1,229 | ) | $ | 2,162 | ||||||||||
|
Tax-exempt
|
373 | (105 | ) | 478 | 233 | (36 | ) | 269 | ||||||||||||||||
|
Investments:
|
||||||||||||||||||||||||
|
Taxable
|
(344 | ) | (227 | ) | (117 | ) | 312 | (731 | ) | 1,043 | ||||||||||||||
|
Tax-exempt
|
(556 | ) | (41 | ) | (515 | ) | (138 | ) | 5 | (143 | ) | |||||||||||||
|
Interest-bearing deposits
|
8 | 3 | 5 | (13 | ) | (9 | ) | (4 | ) | |||||||||||||||
|
Federal funds sold
|
8 | 23 | (15 | ) | 9 | (3 | ) | 12 | ||||||||||||||||
|
Total interest income
|
1,711 | (790 | ) | 2,501 | 1,336 | (2,003 | ) | 3,339 | ||||||||||||||||
|
Interest expense:
|
||||||||||||||||||||||||
|
Money market accounts
|
(27 | ) | (49 | ) | 22 | (66 | ) | (96 | ) | 30 | ||||||||||||||
|
NOW accounts
|
(16 | ) | (56 | ) | 40 | (23 | ) | (73 | ) | 50 | ||||||||||||||
|
Savings accounts
|
(460 | ) | (538 | ) | 78 | 321 | (286 | ) | 607 | |||||||||||||||
|
Time deposits less than $100
|
24 | (93 | ) | 117 | (671 | ) | (397 | ) | (274 | ) | ||||||||||||||
|
Time deposits $100 or more
|
206 | 34 | 172 | (193 | ) | (99 | ) | (94 | ) | |||||||||||||||
|
Short-term borrowings
|
(79 | ) | (137 | ) | 58 | 74 | (233 | ) | 307 | |||||||||||||||
|
Long-term debt
|
(507 | ) | (80 | ) | (427 | ) | (202 | ) | (117 | ) | (85 | ) | ||||||||||||
|
Total interest expense
|
(859 | ) | (919 | ) | 60 | (760 | ) | (1,301 | ) | 541 | ||||||||||||||
|
Net interest income
|
$ | 2,570 | $ | 129 | $ | 2,441 | $ | 2,096 | $ | (702 | ) | $ | 2,798 | |||||||||||
46
Peoples Financial Services Corp.
Management’s Discussion and Analysis
(Dollars in thousands, except per share data)
For the year ended December 31, 2011, tax-equivalent net interest income increased $2,570 to $23,268 from $20,698 in 2010. A positive volume and rate variance led to the improvement. Tax-equivalent net interest income increased $2,096 in 2010 from $18,602 in 2009.
Changes in the volumes of earning assets and interest-bearing liabilities contributed to an increase of $2,441 in net interest income. Average earning assets grew $40.1 million to $557.2 million in 2011 from $517.1 million in 2010 and accounted for a $2,501 increase in interest income. Average loans, net increased $56.4 million or 15.5 percent, which caused interest income to increase $3,143. Conversely, average investments declined $11.4 million or 8.6 percent comparing 2011 and 2010, which resulted in reduced interest income of $632. Average earning assets, average loans, net, and average investments rose $77.7 million, $42.2 million and $26.7 million in 2010 from 2009 and accounted for increased interest income of $3,339, $2,431 and $900.
Average interest-bearing liabilities rose $24.7 million or 5.8 percent to $449.5 million in 2011 from $424.8 million in 2010. The growth resulted in a net increase in interest expense of $60. Having the greatest impact was a $8.5 million increase in large denomination time deposits, which caused interest expense to increase $172. An increase of $4.9 million in average time deposits less than $100 added $117 to interest expense. In addition, interest-bearing transaction accounts, including money market, NOW and savings accounts grew $16.9 million, which in aggregate caused a $140 increase in interest expense. Short-term borrowings averaged $5.5 million more and added $58 to interest expense while long-term debt averaged $11.1 million less and reduced interest expense by $427 comparing 2011 and 2010. Comparing average balances from 2009 to 2010, interest-bearing transaction accounts and short-term borrowings increased $67.7 million and $12.7 million and accounted for interest expense increases of $687 and $307. Conversely, time deposits less than $100 decreased $14.0 million, large denomination time deposits decreased $1.9 million and long-term debt decreased $4.3 million. These volume variances lowered interest expense by $274, $94 and $85.
A favorable rate variance occurred as the decrease in the tax-equivalent yield on earning assets was less than the reduction in the cost of funds. As a result, tax-equivalent net interest income increased $129. The tax-equivalent yield on earning assets decreased 7 basis points to 5.19 percent in 2011 from 5.26 percent in 2010, resulting in a reduction in interest income of $790. Specifically, the tax-equivalent yield on the loan portfolio decreased 15 basis points to 5.64 percent in 2011 from 5.79 percent in 2010. The decline in the tax-equivalent yield on the loan portfolio was a reflection of the condition of general market rates. Loan yield reductions caused interest income to decrease $548, representing 69.4 percent of the entire reduction in interest income due to changes in rates. Comparing 2009 and 2010, we experienced a reduction in the yield on earning assets of 63 basis points, which caused a $2,003 decrease in interest income.
The reduction in interest income was mitigated by a decrease of $919 in interest expense, which resulted from a 28 basis point decrease in the cost of funds to 1.25 percent in 2011 from 1.53 percent in 2010. We experienced significant reductions in the rates paid on all major deposit categories with the exception of time deposits of $100 or more. Specifically, the cost of money market, NOW and savings accounts decreased 12 basis points, 12 basis points and 28 basis points comparing 2011 and 2010. These decreases resulted in reductions in interest expense of $49, $56 and $538. With regard to time deposits, the average rate paid for time deposits less than $100 decreased 13 basis points while time deposits $100 or more increased 16 basis points, which together resulted in a $59 decrease in interest expense. The average rate paid on short-term borrowings declined 38 basis points, resulting in a $137 reduction in interest expense. The cost of funds decreased to 1.53 percent in 2010 from 1.99 percent in 2009 and resulted in a favorable rate variance of $1,301.
The average balances of assets and liabilities, corresponding interest income and expense and resulting average yields or rates paid are summarized as follows. Averages for earning assets include nonaccrual loans. Investment averages include available-for-sale securities at amortized cost. Income on investment securities and loans is adjusted to a tax-equivalent basis using the prevailing federal statutory tax rate of 34.0 percent.
47
Peoples Financial Services Corp.
Management’s Discussion and Analysis
(Dollars in thousands, except per share data)
Summary of net interest income
|
2011
|
2010
|
|||||||||||||||||||||||
|
Average Balance
|
Interest Income/ Expense
|
Average Interest Rate
|
Average Balance
|
Interest Income/ Expense
|
Average Interest Rate
|
|||||||||||||||||||
|
Assets:
|
||||||||||||||||||||||||
|
Earning assets:
|
||||||||||||||||||||||||
|
Loans:
|
||||||||||||||||||||||||
|
Taxable
|
$ | 384,839 | $ | 21,639 | 5.62 | % | $ | 337,511 | $ | 19,417 | 5.75 | % | ||||||||||||
|
Tax-exempt
|
35,790 | 2,064 | 5.77 | 26,757 | 1,691 | 6.32 | ||||||||||||||||||
|
Investments:
|
||||||||||||||||||||||||
|
Taxable
|
79,797 | 2,643 | 3.31 | 82,923 | 2,987 | 3.60 | ||||||||||||||||||
|
Tax-exempt
|
41,781 | 2,515 | 6.02 | 50,033 | 3,071 | 6.14 | ||||||||||||||||||
|
Interest-bearing deposits
|
1,177 | 12 | 1.02 | 654 | 4 | 0.61 | ||||||||||||||||||
|
Federal funds sold
|
13,832 | 34 | 0.25 | 19,181 | 26 | 0.14 | ||||||||||||||||||
|
Total earning assets
|
557,216 | 28,907 | 5.19 | % | 517,059 | 27,196 | 5.26 | % | ||||||||||||||||
|
Less: allowance for loan losses
|
4,757 | 3,882 | ||||||||||||||||||||||
|
Other assets
|
35,143 | 35,306 | ||||||||||||||||||||||
|
Total assets
|
$ | 587,602 | $ | 548,483 | ||||||||||||||||||||
|
Liabilities and Stockholders’ Equity:
|
||||||||||||||||||||||||
|
Interest-bearing liabilities:
|
||||||||||||||||||||||||
|
Money market accounts
|
$ | 39,927 | 250 | 0.63 | % | $ | 36,829 | 277 | 0.75 | % | ||||||||||||||
|
NOW accounts
|
49,299 | 285 | 0.58 | 42,992 | 301 | 0.70 | ||||||||||||||||||
|
Savings accounts
|
194,523 | 1,557 | 0.80 | 187,007 | 2,017 | 1.08 | ||||||||||||||||||
|
Time deposits less than $100
|
75,216 | 1,740 | 2.31 | 70,269 | 1,716 | 2.44 | ||||||||||||||||||
|
Time deposits $100 or more
|
28,729 | 591 | 2.06 | 20,253 | 385 | 1.90 | ||||||||||||||||||
|
Short-term borrowings
|
38,115 | 310 | 0.81 | 32,615 | 389 | 1.19 | ||||||||||||||||||
|
Long-term debt
|
23,735 | 906 | 3.82 | 34,866 | 1,413 | 4.05 | ||||||||||||||||||
|
Total interest-bearing liabilities
|
449,544 | 5,639 | 1.25 | % | 424,831 | 6,498 | 1.53 | % | ||||||||||||||||
|
Noninterest-bearing deposits
|
81,224 | 72,846 | ||||||||||||||||||||||
|
Other liabilities
|
3,997 | 4,037 | ||||||||||||||||||||||
|
Stockholders’ equity
|
52,837 | 46,769 | ||||||||||||||||||||||
|
Total liabilities and stockholders’ equity
|
$ | 587,602 | $ | 548,483 | ||||||||||||||||||||
|
Net interest income/spread
|
$ | 23,268 | 3.94 | % | $ | 20,698 | 3.73 | % | ||||||||||||||||
|
Net interest margin
|
4.18 | % | 4.00 | % | ||||||||||||||||||||
|
Tax-equivalent adjustments:
|
||||||||||||||||||||||||
|
Loans
|
$ | 702 | $ | 575 | ||||||||||||||||||||
|
Investments
|
855 | 1,044 | ||||||||||||||||||||||
|
Total adjustments
|
$ | 1,557 | $ | 1,619 | ||||||||||||||||||||
Note: Average balances were calculated using average daily balances. Interest income on loans includes fees of $222 in 2011, $364 in 2010 and $261 in 2009. Available-for-sale securities, included in investment securities, are stated at amortized cost with the related average unrealized holding gains (losses) of $5,523 in 2011, $(1,264) in 2010 and $(3,421) in 2009 included in other assets. Tax-equivalent adjustments were calculated using the prevailing federal statutory tax rate of 34.0 percent.
48
Peoples Financial Services Corp.
Management’s Discussion and Analysis
(Dollars in thousands, except per share data)
Summary of net interest income (continued)
|
2009
|
||||||||||||
|
Average Balance
|
Interest Income/ Expense
|
Average Interest Rate
|
||||||||||
|
Assets:
|
||||||||||||
|
Earning assets:
|
||||||||||||
|
Loans:
|
||||||||||||
|
Taxable
|
$ | 299,566 | $ | 18,484 | 6.17 | % | ||||||
|
Tax-exempt
|
22,516 | 1,458 | 6.48 | |||||||||
|
Investments:
|
||||||||||||
|
Taxable
|
53,945 | 2,675 | 4.95 | |||||||||
|
Tax-exempt
|
52,326 | 3,209 | 6.13 | |||||||||
|
Interest-bearing deposits
|
1,408 | 17 | 1.21 | |||||||||
|
Federal funds sold
|
9,617 | 17 | 0.18 | |||||||||
|
Total earning assets
|
439,378 | 25,860 | 5.89 | % | ||||||||
|
Less: allowance for loan losses
|
2,969 | |||||||||||
|
Other assets
|
34,451 | |||||||||||
|
Total assets
|
$ | 470,860 | ||||||||||
|
Liabilities and Stockholders’ Equity:
|
||||||||||||
|
Interest-bearing liabilities:
|
||||||||||||
|
Money market accounts
|
$ | 32,771 | 343 | 1.05 | % | |||||||
|
NOW accounts
|
35,697 | 324 | 0.91 | |||||||||
|
Savings accounts
|
130,652 | 1,696 | 1.30 | |||||||||
|
Time deposits less than $100
|
84,233 | 2,387 | 2.83 | |||||||||
|
Time deposits $100 or more
|
22,120 | 578 | 2.61 | |||||||||
|
Short-term borrowings
|
19,940 | 315 | 1.58 | |||||||||
|
Long-term debt
|
39,201 | 1,615 | 4.12 | |||||||||
|
Total interest-bearing liabilities
|
364,614 | 7,258 | 1.99 | % | ||||||||
|
Noninterest-bearing deposits
|
63,325 | |||||||||||
|
Other liabilities
|
2,916 | |||||||||||
|
Stockholders’ equity
|
40,005 | |||||||||||
|
Total liabilities and stockholders’ equity
|
$ | 470,860 | ||||||||||
|
Net interest income/spread
|
$ | 18,602 | 3.90 | % | ||||||||
|
Net interest margin
|
4.23 | % | ||||||||||
|
Tax-equivalent adjustments:
|
||||||||||||
|
Loans
|
$ | 496 | ||||||||||
|
Investments
|
1,091 | |||||||||||
|
Total adjustments
|
$ | 1,587 | ||||||||||
49
Peoples Financial Services Corp.
Management’s Discussion and Analysis
(Dollars in thousands, except per share data)
Provision for Loan Losses:
As previously mentioned, asset quality in the banking industry continued to improve in 2011. Nonperforming assets for all FDIC-insured commercial banks decreased 24.0 percent in 2011 after decreasing 52.4 percent in 2010. Net charge-off levels also increased dramatically for these institutions. The ratio of net charge-offs, as a percentage of loans, fell to 1.61 percent in 2011 from 2.76 percent in 2010. As a result of this turn around, banks decreased their provisions for loan losses by $77.4 billion or 52.7 percent in 2011 and $84.6 billion or 36.5 percent in 2010.
We evaluate the adequacy of the allowance for loan losses account on a quarterly basis utilizing our systematic analysis in accordance with procedural discipline. We take into consideration certain factors such as composition of the loan portfolio, volumes of nonperforming loans, volumes of net charge-offs, prevailing economic conditions and other relevant factors when determining the adequacy of the allowance for loan losses account. We make monthly provisions to the allowance for loan losses account in order to maintain the allowance at an appropriate level. The provision for loan losses equaled $1,794 in 2011, $2,202 in 2010 and $1,735 in 2009. Based on our most recent evaluation at December 31, 2011, we believe that the allowance was adequate to absorb any known or potential losses in our portfolio.
Noninterest Income:
The banking industry experienced a slight 1.7 percent decrease in noninterest income in 2011. This reduction follows a 10.7 percent decrease in 2010. FDIC-insured banks with total assets between $100.0 million and $1.0 billion reported an increase in the ratio of noninterest income to earning assets of 0.97 percent in 2011 from 0.98 percent in 2010.
Our noninterest income increased $1,277 or 29.8 percent to $5,567 in 2011 from $4,290 in 2010. Revenue received from our Wealth Management Division increased $352 or 115.4 percent as a result of acquiring an existing investment advisory business in the fourth quarter of 2010. Included in noninterest revenue in 2011 was a $1,671 gain on the sale of a commercial property held as other real estate. Service charges, fees, commissions and others declined $487, while continued weakness in the housing market contributed to a $71 reduction in mortgage banking income. Noninterest income increased 39.2 percent to $4,290 in 2010 from $3,082 in 2009.
Noninterest Expense:
FDIC-insured commercial banks experienced an increase in noninterest expense of $17.9 billion or 5.0 percent in 2011 after decreasing $16.5 billion or 4.4 percent in 2010. FDIC-insured banks with total assets between $100.0 million and $1.0 billion reported a decrease in noninterest expense of $1.0 billion or 3.0 percent in 2011 from 2010. Bank productivity improved slightly in comparison to the prior year, as evidenced by the change in the efficiency ratio for these same banks, down to 70.1 percent in 2011 from 71.1 percent in 2010. The efficiency ratio for these banks was 72.7 percent in 2009.
In general, our noninterest expense is categorized into three main groups, including employee-related expense, occupancy and equipment expense and other expenses. Employee-related expenses are costs associated with providing salaries, including payroll taxes and benefits to our employees. Occupancy and equipment expenses, the costs related to the maintenance of facilities and equipment, include depreciation, general maintenance and repairs, real estate taxes, rental expense offset by any rental income and utility costs. Other expenses include general operating expenses such as marketing, other taxes, stationery and supplies, contractual services, insurance, including FDIC assessment and loan collection costs. Several of these costs and expenses are variable while the remainder is fixed. We utilize budgets and other related strategies in an effort to control the variable expenses.
50
Peoples Financial Services Corp.
Management’s Discussion and Analysis
(Dollars in thousands, except per share data)
Our noninterest expense increased $2,065 or 15.6 percent to $15,310 in 2011 from $13,245 in 2010. Increases were evident in all three of the major components of noninterest expense. Noninterest expense increased $855 or 6.9 percent in 2010 from 2009.
The major components of noninterest expense for the past three years are summarized as follows:
Noninterest expense
|
Year Ended December 31
|
2011
|
2010
|
2009
|
|||||||||
|
Salaries and employee benefits expense:
|
||||||||||||
|
Salaries and payroll taxes
|
$ | 5,350 | $ | 4,744 | $ | 4,522 | ||||||
|
Employee benefits
|
1,085 | 754 | 1,010 | |||||||||
|
Salaries and employee benefits expense
|
6,435 | 5,498 | 5,532 | |||||||||
|
Occupancy and equipment expenses:
|
||||||||||||
|
Occupancy expense
|
907 | 858 | 814 | |||||||||
|
Equipment expense
|
1,972 | 1,643 | 1,599 | |||||||||
|
Occupancy and equipment expenses
|
2,879 | 2,501 | 2,413 | |||||||||
|
Other expenses:
|
||||||||||||
|
FDIC insurance and assessments
|
755 | 787 | 900 | |||||||||
|
Professional fees and outside services
|
879 | 640 | 588 | |||||||||
|
Other taxes
|
431 | 389 | 346 | |||||||||
|
Stationery and supplies
|
416 | 379 | 357 | |||||||||
|
Advertising
|
495 | 403 | 297 | |||||||||
|
Penalty assessed on prepayment of long-term debt
|
509 | 718 | ||||||||||
|
Other
|
2,511 | 1,930 | 1,957 | |||||||||
|
Other expenses
|
5,996 | 5,246 | 4,445 | |||||||||
|
Total noniterest expense
|
$ | 15,310 | $ | 13,245 | $ | 12,390 | ||||||
Salaries and employee benefits expense increased $937 or 17.0 percent to $6,435 in 2011 from $5,498 in 2010. Salaries and payroll taxes increased $606 or 12.8 percent, while employee benefits expense increased $331 or 43.9 percent. The increase in the salaries and payroll taxes component was directly related to the hiring of business development personnel, additional staffing in the Wealth Management Division and annual merit increases. The increase in employee benefits expense resulted primarily from an increases in contributions to the deferred compensation plan and profit sharing as a result of the increase in earnings. Salaries and employee benefits decreased $34 or 0.6 percent in 2010 as compared to 2009.
For 2011, occupancy and equipment expense increased $378 or 15.1 percent to $2,879 from $2,501 in 2010. Specifically, building-related costs increased $49 or 5.7 percent while equipment-related costs increased $329 or 20.0 percent. The increase in equipment expense resulted from additional costs, including maintenance and depreciation, associated with upgrades and additions to information systems. Higher utility costs, building repairs and real estate taxes were the primary factors causing the increase in occupancy expense. Net occupancy and equipment expense increased $88 or 3.6 percent in 2010 as compared to 2009.
Other expenses increased $750 or 14.3 percent to $5,996 in 2011 from $5,246 in 2010. The increase was due largely to incurring $404 of expenses from damages to four of our community banking offices caused by a flood in the third quarter of 2011. In addition, fees associated with our accounts receivable financing product increased $162 for 2011. Balances carried in this product grew significantly in 2011, ending the year at $5,053 from $564 at the end of 2010. Other expenses increased $801 or 18.0 percent in 2010 as compared to 2009.
51
Peoples Financial Services Corp.
Management’s Discussion and Analysis
(Dollars in thousands, except per share data)
Income Taxes:
Our income tax expense increased $920 to $2,357 in 2011, from $1,437 in 2010. The increase resulted from higher net income before income taxes, coupled with a lower amount of tax-exempt interest revenue as a percentage of total interest revenue. We utilize loans and investments of tax-exempt organizations to mitigate our tax burden, as interest revenue from these sources is not taxable by the federal government. Tax-exempt interest revenue, as a percentage of total interest revenue, declined to 11.0 percent in 2011 from 12.3 percent in 2010. Our effective tax rate increased to 23.2 percent in 2011, compared to 18.1 percent in 2010 and 15.5 percent in 2009. Our effective tax rate continued to be more advantageous than that of FDIC-insured commercial banks of 30.4 percent in 2011 and 32.4 percent in 2010.
Recently, we executed a subscription agreement to become a limited partner in an elderly housing project that will afford us approximately $4.0 million of investment tax credits over a 10-year period beginning in 2012. We anticipate investment tax credits from this housing project of $758 in 2012.
The difference between the amount of income tax currently payable and the provision for income tax expense reflected in the income statements arises from temporary differences. Temporary differences are differences between the tax bases of assets and liabilities and their reported amounts in the financial statements, which result in deferred tax assets or liabilities. We perform quarterly reviews on the tax criteria related to the recognition of deferred tax assets. We decided not to establish a valuation reserve for the deferred tax assets since it is likely that these assets will be realized through carry-back to taxable income in prior years and by future reversals of existing taxable temporary differences or, to a lesser extent, through future taxable income.
As previously stated in this Annual Report, the Federal Reserve Bank continued to hold interest rates at historically low levels. The Company continues to benefit from lower costs on short-term funding coupled with an increase in interest income from loan growth. Management monitors the Company’s interest rate sensitivity quarterly. At December 31, 2011, the results from the model indicated a possible increase in net interest income of 0.6%, or $123 given a plus 200 basis point rate shock scenario over a one-year period. A decrease of 8.7% or $1.9 million is expected based on model results given a minus 200 basis point rate shock. Management will continue to monitor this rate sensitivity going forward. At December 31, 2011, equity value at risk results indicated that the Company was within policy guidelines.
52
Peoples Financial Services Corp.
REPORT OF INDEPENDENT REGISTERED PUBLIC ACCOUNTING FIRM
Board of Directors and Stockholders
Peoples Financial Services Corp.
Hallstead, Pennsylvania
We have audited the accompanying consolidated balance sheets of Peoples Financial Services Corp. and subsidiaries' (the “Company”) as of December 31, 2011 and 2010, and the related consolidated statements of income and comprehensive income, changes in stockholders’ equity and cash flows for each of the years in the three-year period ended December 31, 2011. The Company’s management is responsible for these consolidated financial statements. Our responsibility is to express an opinion on these consolidated financial statements based on our audits.
We conducted our audits in accordance with the standards of the Public Company Accounting Oversight Board (United States). Those standards require that we plan and perform the audits to obtain reasonable assurance about whether the financial statements are free of material misstatement. An audit includes examining, on a test basis, evidence supporting the amounts and disclosures in the financial statements. An audit also includes assessing the accounting principles used and significant estimates made by management, as well as evaluating the overall financial statement presentation. We believe that our audits provide a reasonable basis for our opinion.
In our opinion, the consolidated financial statements referred to above present fairly, in all material respects, the financial position of the Company as of December 31, 2011 and 2010, and the results of their operations and their cash flows for each of the years in the three-year period ended December 31, 2011 in conformity with accounting principles generally accepted in the United States of America.
We also have audited, in accordance with the standards of the Public Company Accounting Oversight Board (United States), the Company’s internal control over financial reporting as of December 31, 2011, based on criteria established in Internal Control-Integrated Framework issued by the Committee of Sponsoring Organizations of the Treadway Commission, and our report dated March 15, 2012, expressed an unqualified opinion on the effectiveness of the Company’s internal control over financial reporting.
/s/ ParenteBeard LLC
Allentown, Pennsylvania
March 15, 2012
53
Peoples Financial Services Corp.
(Dollars in thousands, except per share data)
|
Year Ended December 31
|
2011
|
2010
|
||||||
|
Assets:
|
||||||||
|
Cash and due from banks
|
$ | 9,488 | $ | 6,731 | ||||
|
Interest-bearing deposits in other banks
|
1,071 | 107 | ||||||
|
Federal funds sold
|
11,003 | |||||||
|
Investment securities available-for-sale
|
139,899 | 121,772 | ||||||
|
Loans held for sale
|
569 | 30 | ||||||
|
Loans, net
|
445,103 | 390,772 | ||||||
|
Less: allowance for loan losses
|
5,349 | 4,100 | ||||||
|
Net loans
|
439,754 | 386,672 | ||||||
|
Premises and equipment, net
|
7,916 | 8,238 | ||||||
|
Accrued interest receivable
|
3,448 | 3,003 | ||||||
|
Other assets
|
19,259 | 21,031 | ||||||
|
Total assets
|
$ | 621,404 | $ | 558,587 | ||||
|
Liabilities:
|
||||||||
|
Deposits:
|
||||||||
|
Non interest-bearing
|
$ | 92,985 | $ | 73,663 | ||||
|
Interest-bearing
|
401,298 | 365,071 | ||||||
|
Total deposits
|
494,283 | 438,734 | ||||||
|
Short-term borrowings
|
43,791 | 38,724 | ||||||
|
Long-term debt
|
18,927 | 27,336 | ||||||
|
Accrued interest payable
|
284 | 311 | ||||||
|
Other liabilities
|
4,506 | 2,966 | ||||||
|
Total liabilities
|
561,791 | 508,071 | ||||||
|
Stockholders’ equity:
|
||||||||
|
Common stock, par value $2.00; authorized 12,500,000 shares; issued 3,341,251 shares
|
6,683 | 6,683 | ||||||
|
Capital surplus
|
3,141 | 3,118 | ||||||
|
Retained earnings
|
51,342 | 46,048 | ||||||
|
Accumulated other comprehensive income (loss)
|
3,645 | (834 | ) | |||||
|
Less: treasury stock, at cost: 2011, 222,395 shares; 2010, 199,520 shares
|
5,198 | 4,499 | ||||||
|
Total stockholders’ equity
|
59,613 | 50,516 | ||||||
|
Total liabilities and stockholders’ equity
|
$ | 621,404 | $ | 558,587 | ||||
See notes to consolidated financial statements
54
Peoples Financial Services Corp.
(Dollars in thousands, except per share data)
|
Year Ended December 31
|
2011
|
2010
|
2009
|
|||||||||
|
Interest income:
|
||||||||||||
|
Interest and fees on loans:
|
||||||||||||
|
Taxable
|
$ | 21,639 | $ | 19,417 | $ | 18,484 | ||||||
|
Tax-exempt
|
1,362 | 1,116 | 962 | |||||||||
|
Interest and dividends on investment securities available-for-sale
|
||||||||||||
|
Taxable
|
2,610 | 2,943 | 2,611 | |||||||||
|
Tax-exempt
|
1,660 | 2,027 | 2,118 | |||||||||
|
Dividends
|
33 | 44 | 64 | |||||||||
|
Interest on interest-bearing deposits in other banks
|
12 | 4 | 17 | |||||||||
|
Interest on federal funds sold
|
34 | 26 | 17 | |||||||||
|
Total interest income
|
27,350 | 25,577 | 24,273 | |||||||||
|
Interest expense:
|
||||||||||||
|
Interest on deposits
|
4,423 | 4,696 | 5,328 | |||||||||
|
Interest on short-term borrowings
|
310 | 389 | 315 | |||||||||
|
Interest on long-term debt
|
906 | 1,413 | 1,615 | |||||||||
|
Total interest expense
|
5,639 | 6,498 | 7,258 | |||||||||
|
Net interest income
|
21,711 | 19,079 | 17,015 | |||||||||
|
Provision for loan losses
|
1,794 | 2,202 | 1,735 | |||||||||
|
Net interest income after provision for loan losses
|
19,917 | 16,877 | 15,280 | |||||||||
|
Noninterest income:
|
||||||||||||
|
Service charges, fees, commissions and other
|
2,955 | 3,442 | 3,014 | |||||||||
|
Wealth management income
|
657 | 305 | 341 | |||||||||
|
Mortgage banking income
|
346 | 417 | 438 | |||||||||
|
Net gain (loss) on sale of investment securities available-for-sale
|
25 | 346 | (492 | ) | ||||||||
|
Other-than-temporary impairment of investment equity securities
|
(87 | ) | (164 | ) | (206 | ) | ||||||
|
Net gain (loss) on sale of other real estate
|
1,671 | (56 | ) | (13 | ) | |||||||
|
Total noninterest income
|
5,567 | 4,290 | 3,082 | |||||||||
|
Noninterest expense:
|
||||||||||||
|
Salaries and employee benefits expense
|
6,435 | 5,498 | 5,532 | |||||||||
|
Net occupancy and equipment expense
|
2,879 | 2,501 | 2,413 | |||||||||
|
Other expenses
|
5,996 | 5,246 | 4,445 | |||||||||
|
Total noninterest expense
|
15,310 | 13,245 | 12,390 | |||||||||
|
Income before income taxes
|
10,174 | 7,922 | 5,972 | |||||||||
|
Provision for income taxes
|
2,357 | 1,437 | 923 | |||||||||
|
Net income
|
7,817 | 6,485 | 5,049 | |||||||||
|
Other comprehensive income:
|
||||||||||||
|
Unrealized gain on investment securities available-for-sale
|
6,725 | 2,339 | 3,084 | |||||||||
|
Reclassification adjustment for (gain) loss on sales included in net income
|
(25 | ) | (346 | ) | 492 | |||||||
|
Reclassification adjustment for other-than-temporary impairment
|
87 | 164 | 206 | |||||||||
|
Income taxes related to other comprehensive income
|
2,308 | 733 | 1,285 | |||||||||
|
Other comprehensive income, net of income taxes
|
4,479 | 1,424 | 2,497 | |||||||||
|
Comprehensive income
|
$ | 12,296 | $ | 7,909 | $ | 7,546 | ||||||
|
Per share data:
|
||||||||||||
|
Net income:
|
||||||||||||
|
Basic
|
$ | 2.49 | $ | 2.07 | $ | 1.61 | ||||||
|
Diluted
|
$ | 2.49 | $ | 2.06 | $ | 1.61 | ||||||
|
Average common shares outstanding:
|
||||||||||||
|
Basic
|
3,136,663 | 3,139,606 | 3,133,518 | |||||||||
|
Diluted
|
3,138,167 | 3,141,468 | 3,133,764 | |||||||||
|
Dividends declared
|
$ | 0.80 | $ | 0.79 | $ | 0.76 | ||||||
See notes to consolidated financial statements
55
Peoples Financial Services Corp.
CONSOLIDATED STATEMENTS OF CHANGES IN STOCKHOLDERS’ EQUITY
(Dollars in thousands, except per share data)
|
For the Three Years Ended December 31, 2011
|
Common Stock
|
Capital Surplus
|
Retained Earnings
|
Accumulated Other Comprehensive Income (Loss)
|
Treasury Stock
|
Total
|
||||||||||||||||||
|
Balance, January 1, 2009
|
$ | 6,683 | $ | 3,100 | $ | 39,375 | $ | (4,755 | ) | $ | (4,683 | ) | $ | 39,720 | ||||||||||
|
Net income
|
5,049 | 5,049 | ||||||||||||||||||||||
|
Other comprehensive income, net of income taxes
|
2,497 | 2,497 | ||||||||||||||||||||||
|
Dividends declared: $0.76 per share
|
(2,381 | ) | (2,381 | ) | ||||||||||||||||||||
|
Reissuance under option plan: 4,975 shares
|
(2 | ) | 87 | 85 | ||||||||||||||||||||
|
Balance, December 31, 2009
|
6,683 | 3,098 | 42,043 | (2,258 | ) | (4,596 | ) | 44,970 | ||||||||||||||||
|
Net income
|
6,485 | 6,485 | ||||||||||||||||||||||
|
Other comprehensive income, net of income taxes
|
1,424 | 1,424 | ||||||||||||||||||||||
|
Dividends declared: $0.79 per share
|
(2,480 | ) | (2,480 | ) | ||||||||||||||||||||
|
Reissuance under option plan : 5,575 shares
|
20 | 97 | 117 | |||||||||||||||||||||
|
Balance, December 31, 2010
|
6,683 | 3,118 | 46,048 | (834 | ) | (4,499 | ) | 50,516 | ||||||||||||||||
|
Net income
|
7,817 | 7,817 | ||||||||||||||||||||||
|
Other comprehensive income, net of income taxes
|
4,479 | 4,479 | ||||||||||||||||||||||
|
Dividends declared: $0.80 per share
|
(2,523 | ) | (2,523 | ) | ||||||||||||||||||||
|
Reissuance under option plan: 7,425 shares
|
23 | 136 | 159 | |||||||||||||||||||||
|
Repurchase and held: 30,300 shares
|
(835 | ) | (835 | ) | ||||||||||||||||||||
|
Balance, December 31, 2011
|
$ | 6,683 | $ | 3,141 | $ | 51,342 | $ | 3,645 | $ | (5,198 | ) | $ | 59,613 | |||||||||||
See notes to consolidated financial statements
56
Peoples Financial Services Corp.
(Dollars in thousands, except per share data)
|
Year Ended December 31,
|
2011
|
2010
|
2009
|
|||||||||
|
Cash flows from operating activities:
|
||||||||||||
|
Net income
|
$ | 7,817 | $ | 6,485 | $ | 5,049 | ||||||
|
Adjustments to reconcile net income to net cash provided by operating activities:
|
||||||||||||
|
Depreciation and amortization of premises and equipment
|
837 | 719 | 696 | |||||||||
|
Amortization of intangibles
|
366 | 258 | 258 | |||||||||
|
Provision for loan losses
|
1,794 | 2,202 | 1,735 | |||||||||
|
(Gain) loss on sale of other real estate
|
(1,671 | ) | 56 | 13 | ||||||||
|
(Gain) loss on disposal of equipment
|
88 | (5 | ) | |||||||||
|
Net amortization of investment securities available-for-sale
|
761 | 290 | 227 | |||||||||
|
Amortization of deferred loan costs
|
222 | 261 | 261 | |||||||||
|
Net loss (gain) on sale of investment securities available-for-sale
|
(25 | ) | (346 | ) | 492 | |||||||
|
Other-than-temporary impairment of investment equity securities
|
87 | 164 | 206 | |||||||||
|
Net income from investment in life insurance
|
(378 | ) | (322 | ) | (342 | ) | ||||||
|
Life insurance proceeds
|
(320 | ) | ||||||||||
|
Deferred income tax expense (benefit)
|
(183 | ) | (188 | ) | 1,514 | |||||||
|
Net change in:
|
||||||||||||
|
Loans held for sale
|
(539 | ) | 740 | (1,338 | ) | |||||||
|
Accrued interest receivable
|
(445 | ) | (423 | ) | (54 | ) | ||||||
|
Other assets
|
(1,597 | ) | 641 | (3,568 | ) | |||||||
|
Accrued interest payable
|
(27 | ) | (135 | ) | (1,203 | ) | ||||||
|
Other liabilities
|
1,540 | 1,126 | 224 | |||||||||
|
Net cash provided by operating activities
|
8,647 | 11,208 | 4,165 | |||||||||
|
Cash flows from investing activities:
|
||||||||||||
|
Proceeds from sale of investment securities available-for-sale
|
22,497 | 64,439 | 62,172 | |||||||||
|
Proceeds from repayment on investment securities available-for-sale
|
3,459 | 19,605 | 8,274 | |||||||||
|
Purchases of investment securities available-for-sale
|
(38,119 | ) | (73,261 | ) | (90,505 | ) | ||||||
|
Net (increase) decrease in restricted stock
|
268 | 228 | (212 | ) | ||||||||
|
Net increase in loans
|
(52,693 | ) | (57,118 | ) | (20,510 | ) | ||||||
|
Purchases of premises and equipment
|
(603 | ) | (1,448 | ) | (658 | ) | ||||||
|
Proceeds from investment in life insurance
|
549 | |||||||||||
|
Purchases of investment in life insurance
|
(2,000 | ) | ||||||||||
|
Proceeds from sale of other real estate
|
2,254 | 2,270 | 116 | |||||||||
|
Purchase premium on investment advisory service
|
(750 | ) | ||||||||||
|
Net cash used in investing activities
|
(64,937 | ) | (45,486 | ) | (41,323 | ) | ||||||
|
Cash flows from financing activities:
|
||||||||||||
|
Net increase in deposits
|
55,549 | 28,696 | 38,770 | |||||||||
|
Repayment of long-term debt
|
(8,409 | ) | (11,414 | ) | (941 | ) | ||||||
|
Net increase in short-term borrowings
|
5,067 | 18,285 | 2,007 | |||||||||
|
Repurchase of common shares
|
(835 | ) | ||||||||||
|
Reissuance of common shares
|
159 | 117 | 85 | |||||||||
|
Cash dividends paid
|
(2,523 | ) | (2,480 | ) | (2,381 | ) | ||||||
|
Net cash provided by financing activities
|
49,008 | 33,204 | 37,540 | |||||||||
|
Net increase (decrease) in cash and cash equivalents
|
(7,282 | ) | (1,074 | ) | 382 | |||||||
|
Cash and cash equivalents at beginning of year
|
17,841 | 18,915 | 18,533 | |||||||||
|
Cash and cash equivalents at end of year
|
$ | 10,559 | $ | 17,841 | $ | 18,915 | ||||||
|
Supplemental disclosures:
|
||||||||||||
|
Cash paid during the period for:
|
||||||||||||
|
Interest
|
$ | 5,666 | $ | 6,633 | $ | 8,461 | ||||||
|
Income taxes
|
$ | 2,575 | $ | 354 | $ | 815 | ||||||
|
Noncash items:
|
||||||||||||
|
Transfers of loans to other real estate
|
$ | 595 | $ | 179 | $ | 492 | ||||||
|
Loans to facilitate sale of other real estate
|
$ | 3,000 | ||||||||||
See notes to consolidated financial statements
57
Peoples Financial Services Corp.
NOTES TO CONSOLIDATED FINANCIAL STATEMENTS
(Dollars in thousands, except per share data)
1. Summary of significant accounting policies:
Nature of operations:
Peoples Financial Services Corp., a bank holding company incorporated under the laws of Pennsylvania, provides a full range of financial services through its wholly-owned subsidiaries: Peoples Neighborhood Bank (“Peoples Bank”), including its subsidiaries, Peoples Advisors, LLC, Peoples Financial Leasing, LLC and Peoples Investment Holdings, LLC; and Peoples Financial Capital Corporation (collectively, the “Company”). The Company services its retail and commercial customers through eleven full-service community banking offices located within the Lackawanna, Susquehanna and Wyoming counties of Northern Pennsylvania and Broome county of Southern New York.
On December 13, 2010, Peoples Bank converted its charter to a state non-member bank under the jurisdiction of the Pennsylvania Department of Banking and the Federal Deposit Insurance Corporation. Peoples Bank’s primary product is loans to small- and medium-sized businesses. Other lending products include one-to-four family residential mortgages and consumer loans. Peoples Bank primarily funds its loans by offering open time deposits to commercial enterprises and individuals. Other deposit product offerings include certificates of deposits and various demand deposit accounts.
Peoples Advisors, LLC, a member managed limited liability company, provides investment advisory services to individuals and small businesses. Peoples Financial Leasing, LLC, provides employee leasing services to Peoples Bank. Peoples Investment Holdings, LLC, incorporated under the laws of Delaware, maintains and manages the collection and distribution of income from certain investments of Peoples Bank.
Peoples Financial Capital Corporation, incorporated under the laws of Delaware, maintains and manages the collection and distribution of income from certain investments of the Company.
Peoples Advisors, LLC; Peoples Financial Leasing, LLC; Peoples Investment Holdings, LLC; and Peoples Financial Capital Corporation did not meet the quantitative thresholds for required segment disclosure in conformity with accounting principles generally accepted in the United States of America (“GAAP”). Peoples Bank’s eleven community banking offices, all similar with respect to economic characteristics, share a majority of the following aggregation criteria: (i) products and services; (ii) operating processes; (iii) customer bases; (iv) delivery systems; and (v) regulatory oversight. Accordingly, they were aggregated into a single operating segment.
The Company faces competition primarily from commercial banks, thrift institutions and credit unions within the Northeastern Pennsylvania market, many of which are substantially larger in terms of assets and capital. In addition, mutual funds and security brokers compete for various types of deposits, and consumer, mortgage, leasing and insurance companies compete for various types of loans and leases. Principal methods of competing for banking and permitted nonbanking services include price, nature of product, quality of service and convenience of location.
The Company is subject to regulations of certain federal and state regulatory agencies and undergoes periodic examinations.
58
Peoples Financial Services Corp.
NOTES TO CONSOLIDATED FINANCIAL STATEMENTS
(Dollars in thousands, except per share data)
1. Summary of significant accounting policies (continued):
Basis of presentation:
The consolidated financial statements of the Company have been prepared in conformity with GAAP, Regulation S-X and reporting practices applied in the banking industry. All significant intercompany balances and transactions have been eliminated in consolidation. The Company also presents herein condensed parent company only financial information regarding Peoples Financial Services Corp. (“Parent Company”). Prior period amounts are reclassified when necessary to conform with the current year’s presentation. Such reclassifications had no effect on net income.
The Company has evaluated events and transactions occurring subsequent to the balance sheet date of December 31, 2011, for items that should potentially be recognized or disclosed in these financial statements. The evaluation was conducted through the date these financial statements were issued.
Estimates:
The preparation of financial statements in conformity with GAAP requires management to make estimates and assumptions that affect the reported amounts of assets and liabilities and disclosure of contingent assets and liabilities at the date of the financial statements and the reported amounts of revenues and expenses during the reporting period. Significant estimates that are particularly susceptible to material change in the near term relate to the determination of the allowance for loan losses, fair value of financial instruments, the valuation of real estate acquired in connection with foreclosures or in satisfaction of loans, the valuation of deferred tax assets, and determination of other-than-temporary impairment losses on securities. Actual results could differ from those estimates.
Investment securities available-for-sale:
All of the Company’s investment securities are classified as available-for-sale and are intended to be held for an indefinite period of time, but not necessarily to maturity. The Company may sell these securities for the purpose of implementing asset/liability strategies or in response to changes in interest rates, prepayments, liquidity needs, capital requirements or other circumstances identified by management. Available-for-sale securities are carried at estimated fair value. Unrealized gains and losses, net of their related income tax effect, are included in other comprehensive income, which is reported as a separate component of stockholders’ equity. Realized gains and losses are computed using the specific identification method and are included in noninterest income. Premiums are amortized and discounts are accreted over the contractual lives of investment securities using the interest method.
59
Peoples Financial Services Corp.
NOTES TO CONSOLIDATED FINANCIAL STATEMENTS
(Dollars in thousands, except per share data)
1. Summary of significant accounting policies (continued):
Investment securities available-for-sale (continued):
Declines in the fair value of available-for-sale securities below their amortized cost that are deemed to be other-than-temporary are reflected in earnings as realized losses. Management evaluates each investment security for other-than-temporary impairment (“OTTI”) at least quarterly, and more frequently when economic or market concerns warrant an evaluation. Factors considered in determining whether an OTTI was incurred include: (i) the length of time and the extent to which the fair value has been less than amortized cost, (ii) the financial condition and near-term prospects of the issuer, (iii) whether the market decline was affected by macroeconomic conditions, and (iv) whether the Company has the intent to sell the debt security or more likely than not will be required to sell the debt security before its anticipated recovery. The assessment of whether an OTTI decline exists involves a high degree of subjectivity and judgment and is based on information available to management at a point in time. An OTTI is deemed to have occurred if there has been an adverse change in the remaining expected cash flows such that the Company will not recover the amortized cost of the investment.
Loans held for sale:
Loans held for sale consist of one-to-four family residential mortgages originated and intended for sale in the secondary market. The loans are carried in aggregate at the lower of cost or estimated market value, based upon current delivery prices in the secondary mortgage market. Net unrealized losses are recognized through a valuation allowance by corresponding charges to income. Gains or losses on the sale of these loans are recognized in other income at the time of sale using the specific identification method. Loan origination fees, net of certain direct loan origination costs, are included in net gains or losses upon the sale of the related mortgage loan. All loans are sold without recourse. The aggregate cost of these loans was lower than their estimated market value at December 31, 2011 and 2010, accordingly, no valuation allowance was deemed necessary.
Loans, net:
Loans that management has the intent and ability to hold for the foreseeable future or until maturity or payoff are stated at their outstanding unpaid principal balances, net of deferred fees or costs. Interest income is accrued on the principal amount outstanding. Loan origination fees, net of certain direct origination costs, are deferred and recognized over the contractual life of the related loan as an adjustment to yield using the effective interest method. Premiums and discounts on purchased loans are amortized as adjustments to interest income using the effective interest method. Delinquency fees are recognized in income when chargeable, assuming collectability is reasonable assured.
Transfers of financial assets, which include loan participation sales, are accounted for as sales, when control over the assets has been surrendered. Control over transferred assets is deemed to be surrendered when: (i) the assets have been isolated from the Company; (ii) the transferee obtains the right, free of conditions that constrain it from taking advantage of that right, to pledge or exchange the transferred assets and (iii) the Company does not maintain effective control over the transferred assets through an agreement to repurchase them before their maturity.
60
Peoples Financial Services Corp.
NOTES TO CONSOLIDATED FINANCIAL STATEMENTS
(Dollars in thousands, except per share data)
1. Summary of significant accounting policies (continued):
Off-balance sheet financial instruments:
In the ordinary course of business, the Company has entered into off-balance sheet financial instruments consisting of commitments to extend credit, unused portions of lines of credit and standby letters of credit. These financial instruments are recorded in the financial statements when they are funded. Fees on commercial letters of credit and on unused available lines of credit are recorded as service charges, fees and commissions and are included in noninterest income when earned. The Company records an allowance for off-balance sheet credit losses, if deemed necessary, separately as a liability. No allowance was deemed necessary at December 31, 2011 and 2010.
Nonperforming assets:
Nonperforming assets consist of nonperforming loans and other real estate owned. Nonperforming loans include nonaccrual loans, restructured loans and accruing loans past due 90 days or more. Past due status is based on contractual terms of the loan. Generally, a loan is classified as nonaccrual when it is determined that the collection of all or a portion of interest or principal is doubtful or when a default of interest or principal has existed for 90 days or more, unless the loan is well secured and in the process of collection. When a loan is placed on nonaccrual, interest accruals discontinue and uncollected accrued interest is reversed against income in the current period. Interest collections after a loan has been placed on nonaccrual status are credited to a suspense account until either the loan is returned to performing status or charged-off. The interest accumulated in the suspense account is credited to income if the nonaccrual loan is returned to performing status. However, if the nonaccrual loan is charged-off, the accumulated interest is applied as a reduction to principal at the time the loan is charged-off. A nonaccrual loan is returned to performing status when the loan is current as to principal and interest and has performed according to the contractual terms for a minimum of six months.
The Company adopted the amendments in Accounting Standards Update (“ASU”) No. 2011-02, “A Creditor’s Determination of Whether a Restructuring is a Troubled Debt Restructuring”, on July 1, 2011. As required, the Company reassessed all restructurings that occurred on or after January 1, 2011, for identification as troubled debt restructurings. As a result of this reassessment, there were no additional restructurings identified.
Restructured loans are loans with original terms, interest rate, or both, that have been modified as a result of a deterioration in the borrower’s financial condition. Interest income on restructured loans is recognized when earned, using the interest method.
The Company offers a variety of modifications to borrowers. The modification categories offered can generally fall within the following categories
|
·
|
Rate Modification - A modification in which the interest rate is changed to a below market rate.
|
|
·
|
Term Modification - A modification in which the maturity date, timing of payments or frequency of payments is changed.
|
|
·
|
Interest Only Modification - A modification in which the loan is converted to interest only payments for a period of time.
|
|
·
|
Payment Modification - A modification in which the dollar amount of the payment is changed, other than an interest only modification described above.
|
|
·
|
Combination Modification - Any other type of modification, including the use of multiple categories above.
|
61
Peoples Financial Services Corp.
NOTES TO CONSOLIDATED FINANCIAL STATEMENTS
(Dollars in thousands, except per share data)
1. Summary of significant accounting policies (continued):
Nonperforming assets (continued):
Other real estate owned is comprised of properties acquired through foreclosure proceedings or acceptance of a deed-in-lieu of foreclosure and loans classified as in-substance foreclosures. A loan is classified as in-substance foreclosure when the Company has taken possession of the collateral regardless of whether formal foreclosure proceedings take place. Other real estate owned is included in other assets and recorded at fair value less cost to sell at the time of acquisition establishing a new cost basis. Any excess of the loan balance over the recorded value is charged to the allowance for loan losses. Subsequent declines in the recorded values of the properties prior to their disposal and costs to maintain the assets are included in other expenses. No allowance has been established subsequent to the acquisition of other real estate owned during 2011 or 2010. Any gain or loss realized upon disposal of other real estate owned is included in noninterest income or noninterest expense.
The Company segments loans into risk categories based on relevant information about the ability of borrowers to service their debt such as current financial information, historical payment experience, credit documentation, public information, and current economic trends, among other factors. Loans are individually analyzed for credit risk by classifying them within the Company’s internal risk rating system. The Company’s risk rating classifications are defined as follows:
|
·
|
Pass- A loan to borrowers with acceptable credit quality and risk that is not adversely classified as Substandard, Doubtful, Loss nor designated as Special Mention.
|
|
·
|
Special Mention- A loan that has potential weaknesses that deserves management's close attention. If left uncorrected, these potential weaknesses may result in deterioration of the repayment prospects for the loan or in the institution's credit position at some future date. Special Mention loans are not adversely classified and do not expose an institution to sufficient risk to warrant adverse classification.
|
|
·
|
Substandard- A loan that is inadequately protected by the current sound worth and paying capacity of the obligor or of the collateral pledged, if any. Loans so classified must have a well-defined weakness or weaknesses that jeopardize the liquidation of the debt. They are characterized by the distinct possibility that the bank will sustain some loss if the deficiencies are not corrected.
|
|
·
|
Doubtful – A loan classified as Doubtful has all the weakness inherent in one classified Substandard with the added characteristic that the weaknesses make the collection or liquidation in full, on the basis of currently existing facts, conditions, and values, highly questionable and improbable.
|
|
·
|
Loss-A loan classified as Loss is considered uncollectible and of such little value that their continuance as bankable loans is not warranted. This classification does not mean that the loan has absolutely no recovery or salvage value, but rather it is not practical or desirable to defer writing off this basically worthless asset even though partial recovery may be effected in the future.
|
The allowance for loan losses represents management’s estimate of losses inherent in the loan portfolio as of the balance sheet date. The allowance for loan losses account is maintained through a provision for loan losses charged to earnings. Loans, or portions of loans, determined to be confirmed losses are charged against the allowance account and subsequent recoveries, if any, are credited to the account. A loss is considered confirmed when information available at the financial statement date indicates the loan, or a portion thereof, is uncollectible. Nonaccrual, restructured and large delinquent commercial and real estate loans are reviewed monthly to determine if carrying value reductions are warranted or if these classifications should be changed. Consumer loans are considered losses when they are 120 days past due, except those expected to be recovered through insurance or collateral disposition proceeds.
Management evaluates the adequacy of the allowance for loan losses account quarterly. This assessment is based on past charge-off experience, known and inherent risks in the portfolio, adverse situations that may affect the borrower’s ability to repay, the estimated value of underlying collateral, composition of the loan portfolio, current economic conditions and other relevant factors. This evaluation is inherently subjective as it requires material estimates that may be susceptible to significant revision as more information becomes available. Regulators, in reviewing the loan portfolio as part of the scope of a regulatory examination, may require the Company to increase its allowance for loan losses.
62
Peoples Financial Services Corp.
NOTES TO CONSOLIDATED FINANCIAL STATEMENTS
(Dollars in thousands, except per share data)
1. Summary of significant accounting policies (continued):
Allowance for loan losses (continued):
The allowance for loan losses is maintained at a level believed to be adequate to absorb probable credit losses related to specifically identified loans, as well as probable incurred losses inherent in the remainder of the loan portfolio as of the balance sheet date. The allowance for loan losses consists of an allocated element and an unallocated element. The allocated element consists of a specific allowance for impaired loans individually evaluated under Financial Accounting Standards Board (“FASB”) Accounting Standards Codification (“ASC”) 310, “Receivables,” and a formula portion for loss contingencies on those loans collectively evaluated under FASB ASC 450, “Contingencies.”
A loan is considered impaired when, based on current information and events, it is probable that the Company will be unable to collect all amounts due according to the contractual terms of the loan agreement. All amounts due according to the contractual terms means that both the contractual interest and principal payments of a loan will be collected as scheduled in the loan agreement. Factors considered by management in determining impairment include payment status, ability to pay and the probability of collecting scheduled principal and interest payments when due. Loans that experience insignificant payment delays and payment shortfalls generally are not classified as impaired. Management determines the significance of payment delays and payment shortfalls on a case-by-case basis, taking into consideration all of the circumstances surrounding the loan and the borrower, including the length of the delay, the reasons for the delay, the borrower’s prior payment record, and the amount of the shortfall in relation to the principal and interest owed. The Company recognizes interest income on impaired loans, including the recording of cash receipts, for nonaccrual, restructured loans or accruing loans depending on the status of the impaired loan. Loans considered impaired under FASB ASC 310 are measured for impairment based on the present value of expected future cash flows discounted at the loan’s effective interest rate or the fair value of the collateral if the loan is collateral dependent. If the present value of expected future cash flows discounted at the loan’s effective interest rate or the fair value of the collateral, if the loan is collateral dependent, is less than the recorded investment in the loan, including accrued interest and net deferred loan fees or costs, the Company will recognize the impairment by adjusting the allowance for loan losses account through charges to earnings as a provision for loan losses. For commercial and industrial loans secured by collateral, such as accounts receivable, inventory and equipment, estimated fair values are determined based on the borrower’s financial statements, inventory reports, accounts receivable aging or equipment appraisals or invoices. Indications of value from these sources are generally discounted based on the age of the financial information or the quality of the assets.
The formula portion of the allowance for loan losses relates to large pools of smaller-balance homogeneous loans and those identified loans considered not impaired having similar characteristics as these loan pools. Loss contingencies for each of the major loan pools are determined by applying a total loss factor to the current balance outstanding for each individual pool. The total loss factor is comprised of a historical loss factor using a loss migration method plus a qualitative factor, which adjusts the historical loss factor for changes in trends, conditions and other relevant factors that may affect repayment of the loans in these pools as of the evaluation date. Loss migration involves determining the percentage of each pool that is expected to ultimately result in loss based on historical loss experience. Historical loss factors are based on the ratio of net loans charged-off to loans, net, for each of the major groups of loans evaluated and measured for impairment under FASB ASC 450. The historical loss factor for each pool is a weighted average of the Company’s historical net charge-off ratio for the most recent rolling twelve quarters. Management adjusts these historical loss factors by a qualitative factor that represents a number of environmental risks that may cause estimated credit losses associated with the current portfolio to differ from historical loss experience. These environmental risks include: (i) changes in lending policies and procedures including underwriting standards and collection, charge-off and recovery practices; (ii) changes in the composition and volume of the portfolio; (iii) changes in national, local and industry conditions, including the effects of such changes on the value of underlying collateral for collateral-dependent loans; (iv) changes in the volume and severity of classified loans, including past due, nonaccrual, troubled debt restructures and other loan modifications; (v) changes in the levels of, and trends in, charge-offs and recoveries; (vi) the existence and effect of any concentrations of credit and changes in the level of such concentrations; (vii) changes in the experience, ability and depth of lending management and other relevant staff; (viii) changes in the quality of the loan review system and the degree of oversight by the board of directors; and (ix) the effect of external factors such as competition and legal and regulatory requirements on the level of estimated credit losses in the current loan portfolio. Each environmental risk factor is assigned a value to reflect improving, stable or declining conditions based on management’s best judgment using relevant information available at the time of the evaluation. Adjustments to the factors are supported through documentation of changes in conditions in a narrative accompanying the allowance for loan loss calculation.
63
Peoples Financial Services Corp.
NOTES TO CONSOLIDATED FINANCIAL STATEMENTS
(Dollars in thousands, except per share data)
1. Summary of significant accounting policies (continued):
Allowance for loan losses (continued):
The unallocated element is used to cover inherent losses that exist as of the evaluation date, but which have not been identified as part of the allocated allowance using the above impairment evaluation methodology due to limitations in the process. One such limitation is the imprecision of accurately estimating the impact current economic conditions will have on historical loss rates. Variations in the magnitude of impact may cause estimated credit losses associated with the current portfolio to differ from historical loss experience, resulting in an allowance that is higher or lower than the anticipated level. Management establishes the unallocated element of the allowance by considering a number of environmental risks similar to the ones used for determining the qualitative factors. Management continually monitors trends in historical and qualitative factors, including trends in the volume, composition and credit quality of the portfolio. The reasonableness of the unallocated element is evaluated through monitoring trends in its level to determine if changes from period to period are directionally consistent with changes in the loan portfolio. Management believes the level of the allowance for loan losses was adequate to absorb probable credit losses as of December 31, 2011.
Peoples Bank provides a full range of consumer and commercial lending products designed to meet the borrowing needs of consumers and small and medium sized businesses in its market areas. A significant amount of Peoples Bank’s loans are to customers located within the defined market area. Peoples Bank has no foreign loans or highly leveraged transaction loans, as defined. Although Peoples Bank participates in loans originated by other banks, the majority of loans in the portfolio have been originated by itself.
Consumer lending products include the following types of loans, among others:
|
·
|
residential real estate;
|
|
·
|
automobiles;
|
|
·
|
manufactured housing;
|
|
·
|
personal;
|
|
·
|
student;
|
|
·
|
home equity; and
|
|
·
|
credit card.
|
Commercial lending products include the following types of loans, among others:
|
·
|
commercial real estate;
|
|
·
|
working capital;
|
|
·
|
equipment and other commercial needs;
|
|
·
|
construction;
|
|
·
|
Small Business Administration; and
|
|
·
|
agricultural and mineral rights.
|
The terms offered on a loan vary depending primarily on the type of loan and credit-worthiness of the borrower.
Payment risk is a function of the economic climate in which Peoples Bank’s lending activities are conducted. Economic downturns in the economy generally or in a particular sector could cause cash flow problems for customers and make loan payments more difficult. Peoples Bank attempts to minimize this risk by not being exposed to loan concentrations of a single customer or a group of customers, the loss of any one or more of whom would have a materially adverse effect on its financial condition. Finally, collateral risk can occur if Peoples Bank’s position in collateral taken as security for loan repayment is not adequate. Peoples Bank minimizes collateral risk by avoiding loan concentrations to particular borrowers, by perfecting liens on collateral and by obtaining appraisals on property prior to extending loans. Peoples Bank attempts to mitigate its exposure to these and other types of risks by stratifying authorization requirements by loan size and complexity.
64
Peoples Financial Services Corp.
NOTES TO CONSOLIDATED FINANCIAL STATEMENTS
(Dollars in thousands, except per share data)
1. Summary of significant accounting policies (continued):
Premises and equipment, net:
Land is stated at cost. Premises, equipment and leasehold improvements are stated at cost less accumulated depreciation and amortization. The cost of routine maintenance and repairs is expensed as incurred. The cost of major replacements, renewals and betterments is capitalized. When assets are retired or otherwise disposed of, the cost and related accumulated depreciation and amortization are eliminated and any resulting gain or loss is reflected in noninterest income. Depreciation and amortization are computed principally using the straight-line method based on the following estimated useful lives of the related assets, or in the case of leasehold improvements, to the expected terms of the leases, if shorter:
|
Premises and leasehold improvements
|
7 – 40 years
|
|
Furniture, fixtures and equipment
|
3 – 10 years
|
Intangible assets:
Core deposit premiums from the acquisition of two branch offices in 1997 are being amortized over an estimated useful life of fifteen years using the straight line method. In addition, the purchase premium for Sterling Wealth Management recorded in 2010, is being amortized over a estimated useful life of eight years using the straight line method. Intangible assets were $686 and $1,052, net of accumulated amortization of $3,951 and $3,585 at December 31, 2011 and 2010, respectively. Amortization expense was $366 in 2011 and $258 in 2010 and 2009. Amortization expense for intangible assets will decrease to $150 in 2012 as the core deposit premiums will be fully amortized in the first quarter. Amortization expense will total $107 each of the subsequent five years ending 2017.
Intangible assets are tested for impairment annually or when circumstances arise indicating impairment has occurred. Any impairment losses arising from such testing would be reported in the Consolidated Statements of Income and Comprehensive Income as a separate line item within operations. There were no impairment losses recognized as a result of periodic impairment testing in 2011, 2010 and 2009.
65
Peoples Financial Services Corp.
NOTES TO CONSOLIDATED FINANCIAL STATEMENTS
(Dollars in thousands, except per share data)
1. Summary of significant accounting policies (continued):
Restricted equity securities:
As a member of the Federal Home Loan Bank of Pittsburgh (“FHLB”), the Company is required to purchase and hold stock in the FHLB to satisfy membership and borrowing requirements. This stock is restricted in that it can only be redeemed by the FHLB or to another member institution, and all redemptions of FHLB stock must be at par. As a result of these restrictions, FHLB stock is unlike other investment securities as there is no trading market for FHLB stock and the transfer price is determined by FHLB membership rules and not by market participants. The carrying value of restricted stock is included in other assets. At December 31, 2011 and December 31, 2010, the majority of the Company’s investments in restricted stock consisted of FHLB stock totaling $2,364 and $2,632 respectively.
Bank owned life insurance:
The Company invests in bank owned life insurance (“BOLI”) as a source of funding for employee benefit expenses. BOLI involves the purchasing of life insurance by Peoples Bank on certain of its employees. The Company is the owner and beneficiary of the policies. This life insurance investment is carried at the cash surrender value of the underlying policies. Income from increases in cash surrender value of the policies is included in noninterest income.
Statements of Cash Flows:
The Consolidated Statements of Cash Flows are presented using the indirect method. For purposes of cash flow, cash and cash equivalents include cash on hand, cash items in the process of collection, non interest-bearing and interest-bearing deposits in other banks and federal funds sold.
Fair value of financial instruments:
The Company uses fair value measurements to record fair value adjustments to certain assets and liabilities and to determine fair value disclosure under GAAP. Fair value estimates are calculated without attempting to estimate the value of anticipated future business and the value of certain assets and liabilities that are not considered financial. Accordingly, such assets and liabilities are excluded from disclosure requirements.
In accordance with FASB ASC 820, “Fair Value Measurements and Disclosures,” fair value is the price that would be received to sell an asset or transfer a liability in an orderly transaction between market participants at the measurement date. Fair value is best determined based upon quoted market prices. In cases where quoted market prices are not available, fair values are based on estimates using present value or other valuation techniques. Those techniques are significantly affected by the assumptions used, including the discount rate and estimates of future cash flows. In that regard, the derived fair value estimates cannot be substantiated by comparison to independent markets. In many cases, these values cannot be realized in immediate settlement of the instrument.
66
Peoples Financial Services Corp.
NOTES TO CONSOLIDATED FINANCIAL STATEMENTS
(Dollars in thousands, except per share data)
1. Summary of significant accounting policies (continued):
Fair value of financial instruments (continued)
Current fair value guidance provides a consistent definition of fair value, which focuses on exit price in an orderly transaction that is not a forced liquidation or distressed sale between participants at the measurement date under current market conditions. If there has been a significant decrease in the volume and level of activity for the asset or liability, a change in valuation technique or the use of multiple valuation techniques may be appropriate. In such instances, determining the price at which willing market participants would transact at the measurement date under current market conditions depends on the facts and circumstances and requires the use of significant judgment. The fair value is a reasonable point within the range that is most representative of fair value under current market conditions.
In accordance with GAAP, the Company groups its assets and liabilities generally measured at fair value into three levels based on market information or other fair value estimates in which the assets and liabilities are traded or valued and the reliability of the assumptions used to determine fair value. These levels include:
|
·
|
Level 1: Unadjusted quoted prices of identical assets or liabilities in active markets that the entity has the ability to access as of the measurement date.
|
|
·
|
Level 2: Significant other observable inputs other than Level 1 prices such as quoted prices for similar assets or liabilities; quoted prices in markets that are not active; or other inputs that are observable or can be corroborated by observable market data.
|
|
·
|
Level 3: Significant unobservable inputs that reflect a reporting entity’s own assumptions about the assumptions that market participants would use in pricing an asset or liability.
|
The following methods and assumptions were used by the Company to construct the following table containing the fair values and related carrying amounts of financial instruments:
Cash and cash equivalents:
The carrying values of cash and cash equivalents as reported on the balance sheet approximate fair value.
Investment securities available-for-sale:
The fair values of marketable equity securities are based on quoted market prices from active exchange markets. The fair values of debt securities are based on pricing from a matrix pricing model.
Loans held for sale:
The fair values of loans held for sale are based upon current delivery prices in the secondary mortgage market.
Net loans:
For adjustable-rate loans that reprice frequently and with no significant credit risk, fair values are based on carrying values. The fair values of other nonimpaired loans are estimated using discounted cash flow analysis, using interest rates currently offered in the market for loans with similar terms to borrowers of similar credit risk. Fair values for impaired loans are estimated using discounted cash flow analysis determined by the loan review function or underlying collateral values, where applicable.
Accrued interest receivable:
The carrying value of accrued interest receivable as reported on the balance sheet approximates fair value.
Restricted equity securities:
The carrying values of restricted equity securities approximate fair value.
67
Peoples Financial Services Corp.
NOTES TO CONSOLIDATED FINANCIAL STATEMENTS
(Dollars in thousands, except per share data)
1. Summary of significant accounting policies (continued):
Deposits:
The fair values of noninterest-bearing deposits and savings, NOW and money market accounts are the amounts payable on demand at the reporting date. The fair value estimates do not include the benefit that results from such low-cost funding provided by the deposit liabilities compared to the cost of borrowing funds in the market. The carrying values of adjustable-rate, fixed-term time deposits approximate their fair values at the reporting date. For fixed-rate time deposits, the present value of future cash flows is used to estimate fair values. The discount rates used are the current rates offered for time deposits with similar maturities.
Accrued interest payable:
The carrying value of accrued interest payable as reported on the balance sheet approximates fair value.
Off-balance sheet financial instruments:
The majority of commitments to extend credit, unused portions of lines of credit and standby letters of credit carry current market interest rates if converted to loans. Because such commitments are generally unassignable of either the Company or the borrower, they only have value to the Company and the borrower. None of the commitments are subject to undue credit risk. The estimated fair values of off-balance sheet financial instruments are based on fees currently charged to enter into similar agreements, taking into account the remaining terms of the agreements and the counterparties’ credit standing. The fair value of off-balance sheet financial instruments was not material at December 31, 2011 and December 31, 2010.
Advertising:
The Company follows the policy of charging marketing and advertising costs to expense as incurred. Advertising expense for the years ended December 31, 2011, 2010, and 2009 was $495, $403 and $297, respectively.
68
Peoples Financial Services Corp.
NOTES TO CONSOLIDATED FINANCIAL STATEMENTS
(Dollars in thousands, except per share data)
1. Summary of significant accounting policies (continued):
Income taxes:
The Company accounts for income taxes in accordance with the income tax accounting guidance set forth in FASB ASC Topic 740, “Income Taxes”. ASC Topic 740 sets out a consistent framework to determine the appropriate level of tax reserves to maintain for uncertain tax positions.
Deferred income taxes are provided on the balance sheet method whereby deferred tax assets are recognized for deductible temporary differences and deferred tax liabilities are recognized for taxable temporary differences. Temporary differences are the differences between the reported amounts of assets and liabilities and their tax basis. Deferred tax assets are reduced by a valuation allowance when, in the opinion of management, it is more likely than not that some portion of the deferred tax assets will not be realized. Deferred tax assets and liabilities are adjusted for the effects of changes in tax laws and rates on the effective date. A tax position is recognized as a benefit only if it is “more likely than not” that the tax position would be sustained in a tax examination, with a tax examination being presumed to occur. The amount recognized is the largest amount of tax benefit that has a likelihood of being realized on examination of more than 50 percent. For tax positions not meeting the “more likely than not” threshold, no tax benefit is recorded. Under the “more-likely-than-not” threshold guidelines, the Company believes no significant uncertain tax positions exist, either individually or in the aggregate, that would give rise to the non-recognition of an existing tax benefit. The Company had no material unrecognized tax benefits or accrued interest and penalties for any year in the three-year period ended December 31, 2011.
As applicable, the Company recognizes accrued interest and penalties assessed as a result of a taxing authority examination through income tax expense. The Company files consolidated income tax returns in the United States of America and various states’ jurisdictions. The Company is no longer subject to federal and state income tax examinations by taxing authorities for years before 2008.
Other comprehensive income:
The components of other comprehensive income and their related tax effects are reported in the Consolidated Statements of Income and Comprehensive Income. The accumulated other comprehensive income (loss) included in the Consolidated Balance Sheets relates entirely to net unrealized gains and losses on investment securities available-for-sale.
Earnings per share:
Basic earnings per share represent income available to common stockholders divided by the weighted-average number of common shares outstanding during the period. Diluted earnings per share reflect additional common shares that would have been outstanding if dilutive potential common shares had been issued, as well as any adjustment to income that would result from the assumed issuance. Potential common shares that may be issued by the Company relate solely to outstanding stock options, and are determined using the treasury stock method.
Stock options for 6,200, 9,779, and 22,179 shares of common stock were not considered in computing diluted earnings per share for the years ended December 31, 2011, 2010, and 2009, respectively because they were anti-dilutive.
69
Peoples Financial Services Corp.
NOTES TO CONSOLIDATED FINANCIAL STATEMENTS
(Dollars in thousands, except per share data)
1. Summary of significant accounting policies (continued):
Stock-based compensation:
As of December 31, 2011 and 2010, all stock options were fully vested and there are no unrecognized compensation costs related to stock options. The Company has not granted stock options after 2005.
Recent accounting standards:
On December 14, 2011, the FASB issued ASU 2011-10, “Derecognition of in Substance Real Estate – a Scope Clarification”. This ASU clarifies previous guidance for situations in which a reporting entity would relinquish control of the assets of a subsidiary in order to satisfy the nonrecourse debt of the subsidiary. The ASU concludes that if control of the assets has been transferred to the lender, but not legal ownership of the assets; then the reporting entity must continue to include the assets of the subsidiary in its consolidated financial statements. The amendments in this ASU are effective for public entities for annual and interim periods beginning on or after June 15, 2012. For nonpublic entities, the amendments are effective for fiscal years ending after December 15, 2013. Early adoption is permitted. The adoption of ASU 2011-10 on April 1, 2012, is not expected to have a material effect on the operating results or financial position of the Company.
On December 16, 2011, the FASB issued ASU 2011-11, “Disclosures about Offsetting Assets and Liabilities”, in an effort to improve comparability between U.S. GAAP and IFRS financial statements with regard to the presentation of offsetting assets and liabilities on the statement of financial position arising from financial and derivative instruments, and repurchase agreements. The ASU establishes additional disclosures presenting the gross amounts of recognized assets and liabilities, offsetting amounts, and the net balance reflected in the statement of financial position. Descriptive information regarding the nature and rights of the offset must also be disclosed. The amendments in this ASU are effective for annual and interim periods beginning on or after January 1, 2013. The adoption of ASU 2011-11 on January 1, 2013, is not expected to have a material effect on the operating results or financial position of the Company.
On December 23, 2011, the FASB issued ASU 2011-12, “Deferral of the Effective Date to the Presentation of Reclassifications of Items out of Accumulated Other Comprehensive Income in Accounting Standards Update 2011-05”. In response to stakeholder concerns regarding the operational ramifications of the presentation of these reclassifications for current and previous years, the FASB has deferred the implementation date of this provision to allow time for further consideration. The requirement in ASU 2011-05, Presentation of Comprehensive Income, for the presentation of a combined statement of comprehensive income or separate, but consecutive, statements of net income and other comprehensive income is still effective for fiscal years and interim periods beginning after December 15, 2011, for public companies, and fiscal years ending after December 15, 2011, for nonpublic companies. The adoption of ASU 2011-12 will not have a material effect on the operating results or financial position of the Company.
2. Cash and due from banks:
The Federal Reserve Act, as amended, imposes reserve requirements on all depository institutions. The Company’s required reserve balances, which were satisfied through the restriction of vault cash, were $1,224 and $840 at December 31, 2011 and 2010, respectively.
70
Peoples Financial Services Corp.
NOTES TO CONSOLIDATED FINANCIAL STATEMENTS
(Dollars in thousands, except per share data)
3. Investment securities available-for-sale:
The amortized cost and fair value of investment securities available-for-sale aggregated by investment category at December 31, 2011 and December 31, 2010, are summarized as follows:
|
December
31, 2011
|
Amortized Cost
|
Gross Unrealized Gains
|
Gross Unrealized Losses
|
Fair
Value
|
||||||||||||
|
U.S. Government-sponsored enterprises
|
$ | 29,671 | $ | 3,105 | $ | 32,776 | ||||||||||
|
State and municipals:
|
||||||||||||||||
|
Taxable
|
18,120 | 1,608 | 19,728 | |||||||||||||
|
Tax-exempt
|
38,217 | 1,693 | $ | 224 | 39,686 | |||||||||||
|
Corporate debt securities
|
4,462 | 330 | 942 | 3,850 | ||||||||||||
|
Mortgage-backed securities:
|
||||||||||||||||
|
U.S. Government agencies
|
16,827 | 185 | 100 | 16,912 | ||||||||||||
|
U.S. Government-sponsored enterprises
|
26,396 | 66 | 199 | 26,263 | ||||||||||||
|
Equity securities:
|
||||||||||||||||
|
Preferred
|
54 | 63 | 117 | |||||||||||||
|
Common
|
629 | 22 | 84 | 567 | ||||||||||||
|
Total
|
$ | 134,376 | $ | 7,072 | $ | 1,549 | $ | 139,899 | ||||||||
|
December
31, 2010
|
Amortized Cost
|
Gross Unrealized Gains
|
Gross Unrealized Losses
|
Fair
Value
|
||||||||||||
|
U.S. Government-sponsored enterprises
|
$ | 37,828 | $ | 1,066 | $ | 109 | $ | 38,785 | ||||||||
|
State and municipals:
|
||||||||||||||||
|
Taxable
|
18,634 | 127 | 387 | 18,374 | ||||||||||||
|
Tax-exempt
|
51,789 | 146 | 1,626 | 50,309 | ||||||||||||
|
Corporate debt securities
|
4,467 | 208 | 655 | 4,020 | ||||||||||||
|
Mortgage-backed securities:
|
||||||||||||||||
|
U.S. Government agencies
|
4,389 | 87 | 4,476 | |||||||||||||
|
U.S. Government-sponsored enterprises
|
4,598 | 26 | 97 | 4,527 | ||||||||||||
|
Equity securities:
|
||||||||||||||||
|
Preferred
|
54 | 54 | ||||||||||||||
|
Common
|
1,277 | 114 | 164 | 1,227 | ||||||||||||
|
Total
|
$ | 123,036 | $ | 1,774 | $ | 3,038 | $ | 121,772 | ||||||||
Net unrealized gains and losses on investment securities available-for-sale securities are included as a separate component of stockholders’ equity. The Company had a net unrealized gain of $3,645, net of deferred income taxes of $1,878, at December 31, 2011 and a net unrealized loss of $834, net of deferred income taxes of $430, at December 31, 2010. Proceeds from the sale of investment securities available-for-sale amounted to $22,497 in 2011, $64,439 in 2010 and $62,172 in 2009. Gross gains of $341, $784 and $879 were realized on the sale of securities in 2011, 2010 and 2009, respectively. Gross losses realized on the sale of securities were $316 in 2011, $438 in 2010 and $1,371 in 2009. The income tax provision applicable to net realized gains amounted to $9 and $118 in 2011 and 2010, respectively. The income tax benefit attributed to the net realized loss was $167 in 2009.
71
Peoples Financial Services Corp.
NOTES TO CONSOLIDATED FINANCIAL STATEMENTS
(Dollars in thousands, except per share data)
3. Investment securities available-for-sale (continued):
The maturity distribution of the fair value, which is the net carrying amount, of the debt securities classified as available-for-sale at December 31, 2011, is summarized in the table that follows.
|
December 31, 2011
|
Fair Value
|
|||
|
Within one year
|
$ | 732 | ||
|
After one but within five years
|
12,281 | |||
|
After five but within ten years
|
35,450 | |||
|
After ten years
|
47,577 | |||
| 96,040 | ||||
|
Mortgage-backed securities
|
43,175 | |||
|
Total
|
$ | 139,215 | ||
Securities with a carrying value of $105,135 and $84,281 at December 31, 2011 and December 31, 2010, respectively, were pledged to secure public deposits and repurchase agreements as required or permitted by law.
At December 31, 2011 and 2010, there were no securities of any individual issuer, except for U.S. Government agencies and sponsored enterprises, that exceeded 10.0 percent of stockholders’ equity.
The fair value and gross unrealized losses of investment securities available-for-sale with unrealized losses for which an other-than-temporary impairment has not been recognized at December 31, 2011 and December 31, 2010, aggregated by investment category and length of time that the individual securities have been in a continuous unrealized loss position, are summarized as follows:
|
Less Than 12 Months
|
12 Months or More
|
Total
|
||||||||||||||||||||||
|
December 31, 2011
|
Fair Value
|
Unrealized Losses
|
Fair Value
|
Unrealized Losses
|
Fair Value
|
Unrealized Losses
|
||||||||||||||||||
|
U.S. Government-sponsored enterprises
|
||||||||||||||||||||||||
|
State and municipals:
|
||||||||||||||||||||||||
|
Taxable
|
||||||||||||||||||||||||
|
Tax-exempt
|
$ | 1,142 | $ | 39 | $ | 2,859 | $ | 185 | $ | 4,001 | $ | 224 | ||||||||||||
|
Corporate debt securities
|
970 | 61 | 2,130 | 881 | 3,100 | 942 | ||||||||||||||||||
|
Mortgage-backed securities:
|
||||||||||||||||||||||||
|
U.S. Government agencies
|
10,785 | 100 | 10,785 | 100 | ||||||||||||||||||||
|
U.S. Government-sponsored enterprises
|
21,825 | 199 | 21,825 | 199 | ||||||||||||||||||||
|
Equity securities:
|
||||||||||||||||||||||||
|
Preferred
|
||||||||||||||||||||||||
|
Common
|
195 | 84 | 195 | 84 | ||||||||||||||||||||
|
Total
|
$ | 34,722 | $ | 399 | $ | 5,184 | $ | 1,150 | $ | 39,906 | $ | 1,549 | ||||||||||||
72
Peoples Financial Services Corp.
NOTES TO CONSOLIDATED FINANCIAL STATEMENTS
(Dollars in thousands, except per share data)
3. Investment securities available-for-sale (continued):
|
Less Than 12 Months
|
12 Months or More
|
Total
|
||||||||||||||||||||||
|
December 31, 2010
|
Fair Value
|
Unrealized Losses
|
Fair Value
|
Unrealized Losses
|
Fair Value
|
Unrealized Losses
|
||||||||||||||||||
|
U.S. Government-sponsored enterprises
|
$ | 4,414 | $ | 109 | $ | 4,414 | $ | 109 | ||||||||||||||||
|
State and municipals:
|
||||||||||||||||||||||||
|
Taxable
|
12,576 | 324 | $ | 430 | $ | 63 | 13,006 | 387 | ||||||||||||||||
|
Tax-exempt
|
33,643 | 977 | 2,645 | 649 | 36,288 | 1,626 | ||||||||||||||||||
|
Corporate debt securities
|
2,358 | 655 | 2,358 | 655 | ||||||||||||||||||||
|
Mortgage-backed securities:
|
||||||||||||||||||||||||
|
U.S. Government agencies
|
||||||||||||||||||||||||
|
U.S. Government-sponsored enterprises
|
3,562 | 97 | 3,562 | 97 | ||||||||||||||||||||
|
Equity securities:
|
||||||||||||||||||||||||
|
Preferred
|
||||||||||||||||||||||||
|
Common
|
374 | 164 | 374 | 164 | ||||||||||||||||||||
|
Total
|
$ | 54,195 | $ | 1,507 | $ | 5,807 | $ | 1,531 | $ | 60,002 | $ | 3,038 | ||||||||||||
The Company had 31 investment securities, consisting of six tax-exempt state and municipal obligations, three corporate debt securities, 18 mortgage-backed securities and four common equity securities, that were in unrealized loss positions at December 31, 2011. Of these securities, four state and municipal obligations, two corporate debt securities and each of the common equity securities were in continuous unrealized loss positions for 12 months or more. The unrealized losses on the common equity securities were a direct reflection of reductions in stock values in the financial industry sector, as a whole, and was not a result of credit or other issues that would cause the Company to realize an OTTI charge. Management does not consider the unrealized losses on the debt securities, as a result of changes in interest rates, to be OTTI based on historical evidence that indicates the cost of these securities is recoverable within a reasonable period of time in relation to normal cyclical changes in the market rates of interest. Moreover, because there has been no material change in the credit quality of the issuers or other events or circumstances that may cause a significant adverse impact on the fair value of these securities, and management does not intend to sell these securities and it is unlikely that the Company will be required to sell these securities before recovery of their amortized cost basis, which may be maturity, the Company does not consider the unrealized losses to be OTTI at December 31, 2011.
OTTI of $87 was recognized for the year ended December 31, 2011. The impairment was the result of writing down two common equity securities based on quoted market prices. In reaching the determination to record the impairment, management reviewed the facts and circumstances available surrounding the securities, including the duration and amount of the unrealized loss, the financial condition of the issuers and the prospects for a change in market value within a reasonable period of time. Based on its assessment, management determined that the impairments were other-than-temporary and that a charge to operating results was appropriate for the securities. The charges were recognized based entirely on the assessment of the credit quality deterioration of the underlying companies. The Company recognized $164 and $206 of OTTI on certain common equity securities in 2010 and 2009, respectively.
73
Peoples Financial Services Corp.
NOTES TO CONSOLIDATED FINANCIAL STATEMENTS
(Dollars in thousands, except per share data)
3. Investment securities available-for-sale (continued):
The Company had 106 investment securities, consisting of four U.S. Government-sponsored enterprises, 90 state and municipal obligations, four mortgage-backed securities, two corporate debt securities and six common equity securities, that were in unrealized loss positions at December 31, 2010. Of these securities, eight state and municipal obligations and each of the corporate debt and common equity securities were in continuous unrealized loss positions for 12 months or more.
None of the corporate debt securities are private label trust preferred issuances. This sector of the portfolio contains corporate bond issuances of large, national financial institutions.
4. Loans, net and allowance for loan losses:
The major classifications of loans outstanding, net of deferred loan origination fees and costs at December 31, 2011 and December 31, 2010 are summarized as follows. Net deferred loan costs were $563 at December 31, 2011, and $523 at December 31, 2010.
|
December 31
|
2011
|
2010
|
||||||
|
Commercial
|
$ | 160,828 | $ | 112,526 | ||||
|
Real estate:
|
||||||||
|
Commercial
|
145,554 | 136,910 | ||||||
|
Residential
|
118,125 | 119,424 | ||||||
|
Consumer
|
20,596 | 21,912 | ||||||
|
Total
|
$ | 445,103 | $ | 390,772 | ||||
Fixed-rate loans totaled $96,587 and $109,212, while loans with adjustable interest rates were $348,516 and $281,560, respectively, at December 31, 2011 and 2010. Loans outstanding to directors, executive officers, principal stockholders or to their affiliates totaled $2,568 and $2,251 at December 31, 2011 and 2010, respectively. Advances and repayments during 2011 totaled $1,468 and $1,151 respectively. These loans are made during the ordinary course of business at the Company’s normal credit terms. There were no related party loans that were classified as nonaccrual, past due, or restructured or were considered a potential credit risk at December 31, 2011 and 2010.
At December 31, 2011, the majority of the Company’s loans were at least partially secured by real estate in Northeastern Pennsylvania. Therefore, a primary concentration of credit risk is directly related to the real estate market in this area. Changes in the general economy, local economy or in the real estate market could affect the ultimate collectability of this portion of the loan portfolio. Management does not believe there are any other significant concentrations of credit risk that could affect the loan portfolio.
The analysis of changes affecting the allowance for loan losses for each of the years in the three-year period ended December 31, 2011, is summarized as follows:
|
2011
|
2010
|
2009
|
||||||||||
|
Beginning balance, January 1
|
$ | 4,100 | $ | 3,337 | $ | 3,002 | ||||||
|
Charge-offs
|
(599 | ) | (1,489 | ) | (1,547 | ) | ||||||
|
Recoveries
|
54 | 50 | 147 | |||||||||
|
Provisions
|
1,794 | 2,202 | 1,735 | |||||||||
|
Ending balance, December 31
|
$ | 5,349 | $ | 4,100 | $ | 3,337 | ||||||
74
Peoples Financial Services Corp.
NOTES TO CONSOLIDATED FINANCIAL STATEMENTS
(Dollars in thousands, except per share data)
4. Loans, net and allowance for loan losses (continued):
The changes in the allowance for loan losses account by major category of loan for the year ended December 31, 2011, were as follows:
|
Real estate
|
||||||||||||||||||||||||
|
December 31, 2011
|
Commercial
|
Commercial
|
Residential
|
Consumer
|
Unallocated
|
Total
|
||||||||||||||||||
|
Allowance for loan losses:
|
||||||||||||||||||||||||
|
Beginning balance, January 1. 2011
|
$ | 1,696 | $ | 1,384 | $ | 726 | $ | 243 | $ | 51 | $ | 4,100 | ||||||||||||
|
Charge-offs
|
(374 | ) | (77 | ) | (9 | ) | (139 | ) | (599 | ) | ||||||||||||||
|
Recoveries
|
1 | 2 | 1 | 50 | 54 | |||||||||||||||||||
|
Provisions
|
724 | 206 | 43 | 44 | 777 | 1,794 | ||||||||||||||||||
|
Ending balance
|
$ | 2,047 | $ | 1,515 | $ | 761 | $ | 198 | $ | 828 | $ | 5,349 | ||||||||||||
|
Ending balance: individually evaluated for impairment
|
698 | 40 | 71 | 1 | 810 | |||||||||||||||||||
|
Ending balance: collectively evaluated for impairment
|
$ | 1,349 | $ | 1,475 | $ | 690 | $ | 197 | $ | 828 | $ | 4,539 | ||||||||||||
|
Loans receivable:
|
||||||||||||||||||||||||
|
Ending balance
|
$ | 160,828 | $ | 145,554 | $ | 118,125 | $ | 20,596 | $ | 445,103 | ||||||||||||||
|
Ending balance: individually evaluated for impairment
|
8,433 | 7,832 | 1,226 | 1 | 17,492 | |||||||||||||||||||
|
Ending balance: collectively evaluated for impairment
|
$ | 152,395 | $ | 137,722 | $ | 116,899 | $ | 20,595 | $ | 427,611 | ||||||||||||||
|
The allowance for loan losses account by major category of loan at December 31, 2010, is summarized as follows:
|
||||||||||||||||||||||||
|
Real estate
|
||||||||||||||||||||||||
|
December 31, 2010
|
Commercial
|
Commercial
|
Residential
|
Consumer
|
Unallocated
|
Total
|
||||||||||||||||||
|
Allowance for loan losses:
|
||||||||||||||||||||||||
|
Ending balance
|
$ | 1,696 | $ | 1,384 | $ | 726 | $ | 243 | $ | 51 | $ | 4,100 | ||||||||||||
|
Ending balance: individually evaluated for impairment
|
663 | 122 | 9 | 31 | 825 | |||||||||||||||||||
|
Ending balance: collectively evaluated for impairment
|
$ | 1,033 | $ | 1,262 | $ | 717 | $ | 212 | $ | 51 | $ | 3,275 | ||||||||||||
|
Loans receivable:
|
||||||||||||||||||||||||
|
Ending balance
|
$ | 112,526 | $ | 136,910 | $ | 119,424 | $ | 21,912 | $ | 390,772 | ||||||||||||||
|
Ending balance: individually evaluated for impairment
|
5,916 | 8,923 | 674 | 47 | 15,560 | |||||||||||||||||||
|
Ending balance: collectively evaluated for impairment
|
$ | 106,610 | $ | 127,987 | $ | 118,750 | $ | 21,865 | $ | 375,212 | ||||||||||||||
75
Peoples Financial Services Corp.
NOTES TO CONSOLIDATED FINANCIAL STATEMENTS
(Dollars in thousands, except per share data)
4. Loans, net and allowance for loan losses (continued):
The following tables present the major categories of the loan portfolio summarized by the aggregate pass rating and the classified ratings of special mention, substandard and doubtful within the Company’s internal risk rating system at December 31, 2011 and 2010:
|
December 31, 2011:
|
Pass
|
Special Mention
|
Substandard
|
Doubtful
|
Total
|
|||||||||||||||
|
Commercial
|
$ | 145,145 | $ | 7,262 | $ | 2,550 | $ | 5,871 | $ | 160,828 | ||||||||||
|
Real estate:
|
||||||||||||||||||||
|
Commercial
|
136,166 | 3,223 | 4,995 | 1,170 | 145,554 | |||||||||||||||
|
Residential
|
117,236 | 889 | 118,125 | |||||||||||||||||
|
Consumer
|
20,587 | 9 | 20,596 | |||||||||||||||||
|
Total
|
$ | 419,134 | $ | 10,494 | $ | 7,545 | $ | 7,930 | $ | 445,103 | ||||||||||
|
December 31, 2010:
|
Pass
|
Special Mention
|
Substandard
|
Doubtful
|
Total
|
|||||||||||||||
|
Commercial
|
$ | 105,869 | $ | 986 | $ | 181 | $ | 5,490 | $ | 112,526 | ||||||||||
|
Real estate:
|
||||||||||||||||||||
|
Commercial
|
118,972 | 8,836 | 8,731 | 371 | 136,910 | |||||||||||||||
|
Residential
|
118,794 | 630 | 119,424 | |||||||||||||||||
|
Consumer
|
21,890 | 22 | 21,912 | |||||||||||||||||
|
Total
|
$ | 365,525 | $ | 9,822 | $ | 8,912 | $ | 6,513 | $ | 390,772 | ||||||||||
Information concerning nonaccrual loans by major loan category at December 31, 2011 and 2010, is summarized as follows:
|
December 31,
|
2011
|
2010
|
||||||
|
Commercial
|
$ | 5,871 | $ | 5,490 | ||||
|
Real estate:
|
||||||||
|
Commercial
|
1,170 | 371 | ||||||
|
Residential
|
889 | 630 | ||||||
|
Consumer
|
22 | |||||||
|
Total
|
$ | 7,930 | $ | 6,513 | ||||
76
Peoples Financial Services Corp.
NOTES TO CONSOLIDATED FINANCIAL STATEMENTS
(Dollars in thousands, except per share data)
4. Loans, net and allowance for loan losses (continued):
The major categories of the loan portfolio by past due status are summarized as follows:
|
December 31, 2011
|
30-59 Days
Past Due
|
60-89 Days
Past Due
|
Greater than
90 Days
|
Total Past Due
|
Current
|
Total Loans
|
Loans > 90 Days and Accruing
|
|||||||||||||||||||||
|
Commercial
|
$ | 408 | $ | 324 | $ | 12 | $ | 744 | $ | 160,084 | $ | 160,828 | $ | 12 | ||||||||||||||
|
Real estate:
|
||||||||||||||||||||||||||||
|
Commercial
|
2,177 | 2,177 | 143,377 | 145,554 | ||||||||||||||||||||||||
|
Residential
|
976 | 217 | 362 | 1,555 | 116,570 | 118,125 | 337 | |||||||||||||||||||||
|
Consumer
|
335 | 98 | 311 | 744 | 19,852 | 20,596 | 311 | |||||||||||||||||||||
|
Total
|
$ | 3,896 | $ | 639 | $ | 685 | $ | 5,220 | $ | 439,883 | $ | 445,103 | $ | 660 | ||||||||||||||
|
December 31, 2010
|
30-59 Days
Past Due
|
60-89 Days
Past Due
|
Greater than
90 Days
|
Total Past Due
|
Current
|
Total Loans
|
Loans > 90 Days and Accruing
|
|||||||||||||||||||||
|
Commercial
|
$ | 192 | $ | 81 | $ | 754 | $ | 1,027 | $ | 111,499 | $ | 112,526 | $ | 123 | ||||||||||||||
|
Real estate:
|
||||||||||||||||||||||||||||
|
Commercial
|
1,431 | 1,049 | 2,480 | 134,430 | 136,910 | |||||||||||||||||||||||
|
Residential
|
1,260 | 358 | 626 | 2,244 | 117,180 | 119,424 | ||||||||||||||||||||||
|
Consumer
|
293 | 133 | 291 | 717 | 21,195 | 21,912 | 269 | |||||||||||||||||||||
|
Total
|
$ | 3,176 | $ | 572 | $ | 2,720 | $ | 6,468 | $ | 384,304 | $ | 390,772 | $ | 392 | ||||||||||||||
77
Peoples Financial Services Corp.
NOTES TO CONSOLIDATED FINANCIAL STATEMENTS
(Dollars in thousands, except per share data)
4. Loans, net and allowance for loan losses (continued):
The following tables summarize information in regards to impaired loans at December 31, 2011 and 2010 by loan portfolio class:
|
For the Year Ended
|
||||||||||||||||||||
|
December 31, 2011
|
Recorded Investment
|
Unpaid Principal Balance
|
Related Allowance
|
Average Recorded Investment
|
Interest Income Recognized
|
|||||||||||||||
|
With no related allowance:
|
||||||||||||||||||||
|
Commercial
|
$ | 4,316 | $ | 4,316 | $ | 5,759 | $ | 198 | ||||||||||||
|
Real estate:
|
||||||||||||||||||||
|
Commercial
|
4,136 | 4,136 | 4,123 | 187 | ||||||||||||||||
|
Residential
|
889 | 889 | 948 | |||||||||||||||||
|
Consumer
|
10 | 1 | ||||||||||||||||||
|
Total
|
9,341 | 9,341 | 10,840 | 386 | ||||||||||||||||
|
With an allowance recorded:
|
||||||||||||||||||||
|
Commercial
|
4,117 | 4,117 | $ | 698 | 3,504 | 46 | ||||||||||||||
|
Real estate:
|
||||||||||||||||||||
|
Commercial
|
3,696 | 3,696 | 40 | 2,940 | 233 | |||||||||||||||
|
Residential
|
337 | 337 | 71 | 108 | 11 | |||||||||||||||
|
Consumer
|
1 | 1 | 1 | 8 | ||||||||||||||||
|
Total
|
8,151 | 8,151 | 810 | 6,560 | 290 | |||||||||||||||
|
Commercial
|
8,433 | 8,433 | 698 | 9,263 | 244 | |||||||||||||||
|
Real estate:
|
||||||||||||||||||||
|
Commercial
|
7,832 | 7,832 | 40 | 7,063 | 420 | |||||||||||||||
|
Residential
|
1,226 | 1,226 | 71 | 1,056 | 11 | |||||||||||||||
|
Consumer
|
1 | 1 | 1 | 18 | 1 | |||||||||||||||
|
Total
|
$ | 17,492 | $ | 17,492 | $ | 810 | $ | 17,400 | $ | 676 | ||||||||||
78
Peoples Financial Services Corp.
NOTES TO CONSOLIDATED FINANCIAL STATEMENTS
(Dollars in thousands, except per share data)
4. Loans, net and allowance for loan losses (continued):
|
For the Year Ended
|
||||||||||||||||||||
|
December 31, 2010
|
Recorded Investment
|
Unpaid Principal Balance
|
Related Allowance
|
Average Recorded Investment
|
Interest Income Recognized
|
|||||||||||||||
|
With no related allowance:
|
||||||||||||||||||||
|
Commercial
|
$ | 304 | $ | 304 | $ | 264 | $ | 12 | ||||||||||||
|
Real estate:
|
||||||||||||||||||||
|
Commercial
|
6,263 | 6,263 | 6,394 | 392 | ||||||||||||||||
|
Residential
|
383 | 383 | 384 | 2 | ||||||||||||||||
|
Consumer
|
16 | 16 | 20 | 2 | ||||||||||||||||
|
Total
|
6,966 | 6,966 | 7,062 | 408 | ||||||||||||||||
|
With an allowance recorded:
|
||||||||||||||||||||
|
Commercial
|
5,612 | 5,612 | $ | 663 | 5,629 | 165 | ||||||||||||||
|
Real estate:
|
||||||||||||||||||||
|
Commercial
|
2,660 | 2,660 | 122 | 2,714 | 166 | |||||||||||||||
|
Residential
|
291 | 291 | 9 | 292 | 5 | |||||||||||||||
|
Consumer
|
31 | 31 | 31 | 31 | ||||||||||||||||
|
Total
|
8,594 | 8,594 | 825 | 8,666 | 336 | |||||||||||||||
|
Commercial
|
5,916 | 5,916 | 663 | 5,893 | 177 | |||||||||||||||
|
Real estate:
|
||||||||||||||||||||
|
Commercial
|
8,923 | 8,923 | 122 | 9,108 | 558 | |||||||||||||||
|
Residential
|
674 | 674 | 9 | 676 | 7 | |||||||||||||||
|
Consumer
|
47 | 47 | 31 | 51 | 2 | |||||||||||||||
|
Total
|
$ | 15,560 | $ | 15,560 | $ | 825 | $ | 15,728 | $ | 744 | ||||||||||
Included in the commercial loan and commerical real estate categories are troubled debt restructurings that were classified as impaired. Trouble debt restructurings totaled $3,961 at December 31, 2011, and $4,185 at December 31, 2010.
Information concerning troubled debt restructurings by major loan category at December 31, 2011 is summarized as follows:
|
December 31, 2011
|
Number of Contracts
|
Accrual Status
|
Nonaccrual Status
|
Total Modifications
|
||||||||||||
|
Commercial
|
2 | $ | 2,294 | $ | 2,294 | |||||||||||
|
Real estate:
|
||||||||||||||||
|
Commercial
|
1 | $ | 1,667 | 1,667 | ||||||||||||
|
Residential
|
||||||||||||||||
|
Consumer
|
||||||||||||||||
|
Total
|
3 | $ | 1,667 | $ | 2,294 | $ | 3,961 | |||||||||
There were no defaults of loans considered troubled debt restructurings for the period ended December 31, 2011. There were no charge-offs as a result of the troubled debt restructurings and the impact on interest income was minimal.
79
Peoples Financial Services Corp.
NOTES TO CONSOLIDATED FINANCIAL STATEMENTS
(Dollars in thousands, except per share data)
4. Loans, net and allowance for loan losses (continued):
The following table summarizes loans modified as troubled debt restructurings by major loan category for the year ended December 31, 2011. The commercial loan disclosed in the table was modified with respect to its interest rate.
|
December 31, 2011
|
Number of Loans
|
Pre-Modification Outstanding Recorded Investment
|
Post-Modification Outstanding Recorded Investment
|
||||||||
|
Commercial
|
|||||||||||
|
Real estate:
|
|||||||||||
|
Commercial
|
1 | $ | 1,682 | $ | 1,682 | ||||||
|
Residential
|
|||||||||||
|
Consumer
|
|||||||||||
|
Total
|
1 | $ | 1,682 | $ | 1,682 | ||||||
5. Off-balance sheet financial instruments:
The Company is a party to financial instruments with off-balance sheet risk in the normal course of business to meet the financing needs of its customers. These financial instruments include commitments to extend credit, unused portions of lines of credit and letters of credit. Those instruments involve, to varying degrees, elements of credit risk in excess of the amount recognized in the consolidated balance sheets.
The Company’s exposure to credit loss in the event of nonperformance by the other party to the financial instrument for commitments to extend credit, unused portions of lines of credit and letters of credit is represented by the contractual amounts of those instruments. The Company follows the same credit policies in making commitments and conditional obligations as it does for on-balance sheet instruments.
The contractual amounts of off-balance sheet commitments at December 31, 2011 and 2010, are summarized as follows:
|
December 31
|
2011
|
2010
|
||||||
|
Commitments to extend credit
|
$ | 7,429 | $ | 5,617 | ||||
|
Unused portions of lines of credit
|
45,320 | 32,225 | ||||||
|
Standby letters of credit
|
17,051 | 18,170 | ||||||
| $ | 69,800 | $ | 56,012 | |||||
Commitments to extend credit are agreements to lend to a customer as long as there is no violation of any condition established in the contract. Since many of the commitments are expected to expire without being drawn upon, the total commitment amounts do not necessarily represent future cash requirements. Commitments generally have fixed expiration dates or other termination clauses and may require payment of a fee. The Company evaluates each customer’s credit worthiness on a case-by-case basis. The amount of collateral obtained, if deemed necessary by the Company upon extension of credit, is based on management’s credit evaluation. Collateral held varies but may include personal or commercial real estate, accounts receivable, inventory and equipment.
80
Peoples Financial Services Corp.
NOTES TO CONSOLIDATED FINANCIAL STATEMENTS
(Dollars in thousands, except per share data)
5. Off-balance sheet financial instruments (continued):
Unused portions of lines of credit, including home equity and overdraft protection agreements, are commitments for possible future extensions of credit to existing customers. Unused portions of home equity lines are collateralized and generally have fixed expiration dates. Overdraft protection agreements are uncollateralized and usually do not carry specific maturity dates. Unused portions of lines of credit ultimately may not be drawn upon to the total extent to which the Company is committed.
Standby letters of credit written are conditional commitments issued by the Company to guarantee the performance of a customer to a third party. Essentially, all standby letters of credit expire within twelve months. The credit risk involved in issuing letters of credit is essentially the same as that involved in extending other loan commitments. The Company requires collateral supporting these letters of credit as deemed necessary. Collateral supporting letters of credit amounted to $16,176 at December 31, 2011, and $15,541 at December 31, 2010. The carrying value of the liability for the Company’s obligations under guarantees for letters of credit was not material at December 31, 2011 and 2010.
6. Premises and equipment, net:
Premises and equipment at December 31, 2011 and 2010 are summarized as follows:
|
December 31
|
2011
|
2010
|
|||||
|
Land
|
$ | 900 | $ | 900 | |||
|
Premises and leasehold improvements
|
8,691 | 8,649 | |||||
|
Furniture, fixtures and equipment
|
7,761 | 7,480 | |||||
| 17,352 | 17,029 | ||||||
|
Less: accumulated depreciation
|
9,436 | 8,791 | |||||
| $ | 7,916 | $ | 8,238 | ||||
Depreciation expense was $837, $719, and $696 for the years ended December 31, 2011, 2010 and 2009, respectively.
Pursuant to the terms of non-cancelable lease agreements in effect at December 31, 2011, pertaining to banking premises and equipment, future minimum annual rent commitments under various operating leases are summarized as follows:
|
2012
|
$ | 107 | ||
|
2013
|
81 | |||
|
2014
|
73 | |||
|
2015
|
66 | |||
|
2016
|
34 | |||
|
Thereafter
|
370 | |||
| $ | 731 |
The leases contain options to extend for periods from one to ten years. The cost of such rentals is not included in the annual rentals. Rent expense for the years ended December 31, 2011, 2010, and 2009 amounted to $112, $95, and $107, respectively.
81
Peoples Financial Services Corp.
NOTES TO CONSOLIDATED FINANCIAL STATEMENTS
(Dollars in thousands, except per share data)
7. Deposits
The major components of interest-bearing and noninterest-bearing deposits at December 31, 2011 and 2010, are summarized as follows:
|
December 31
|
2011
|
2010
|
||||||
|
Interest-bearing deposits:
|
||||||||
|
Money market accounts
|
$ | 37,924 | $ | 36,032 | ||||
|
Now accounts
|
54,356 | 41,471 | ||||||
|
Savings accounts
|
200,419 | 195,121 | ||||||
|
Time deposits less than $100
|
71,864 | 65,161 | ||||||
|
Time deposits $100 or more
|
36,735 | 27,286 | ||||||
|
Total interest-bearing deposits
|
401,298 | 365,071 | ||||||
|
Noninterest-bearing deposits
|
92,985 | 73,663 | ||||||
|
Total deposits
|
$ | 494,283 | $ | 438,734 | ||||
The aggregate amounts of maturities for all time deposits at December 31, 2011, are summarized as follows:
|
2012
|
$ | 44,322 | ||
|
2013
|
12,875 | |||
|
2014
|
19,724 | |||
|
2015
|
14,676 | |||
|
2016
|
9,708 | |||
|
Thereafter
|
7,294 | |||
| $ | 108,599 |
The aggregate amount of deposits reclassified as loans was $82 at December 31, 2011, and 2010. Management evaluates transaction accounts that are overdrawn for collectability as part of its evaluation for credit losses. During 2011 and 2010, no deposits were received on terms other than those available in the normal course of business.
82
Peoples Financial Services Corp.
NOTES TO CONSOLIDATED FINANCIAL STATEMENTS
(Dollars in thousands, except per share data)
8. Other assets:
The major components of other assets at December 31, 2011 and 2010 are summarized as follows:
|
December 31
|
2011
|
2010
|
||||||
|
Intangible assets
|
$ | 686 | $ | 1,052 | ||||
|
Deferred income taxes
|
2,101 | |||||||
|
Other real estate owned
|
399 | 3,387 | ||||||
|
Prepaid deposit insurance
|
929 | 1,605 | ||||||
|
Investment in residential housing program
|
707 | |||||||
|
Bank owned life insurance
|
10,724 | 8,346 | ||||||
|
Restricted equity securities
|
2,374 | 2,642 | ||||||
|
Other assets
|
3,440 | 1,898 | ||||||
|
Total
|
$ | 19,259 | $ | 21,031 | ||||
The Company originates one-to-four family residential mortgage loans for sale in the secondary market with servicing rights retained. Mortgage loans serviced for other are not included in the accompanying Consolidated Balance Sheets. The unpaid principal balances of mortgage loans serviced for others were $43,498 at December 31, 2011, and $40,578 at December 31, 2010.
The value of mortgage servicing rights were not considered material at December 31, 2011 and 2010.
83
Peoples Financial Services Corp.
NOTES TO CONSOLIDATED FINANCIAL STATEMENTS
(Dollars in thousands, except per share data)
9. Short-term borrowings:
Securities sold under agreements to repurchase and Federal Home Loan Bank (“FHLB”) advances generally represent overnight or less than 30-day borrowings. Short-term borrowings consisted of the following at December 31, 2011 and 2010:
|
At and for the year ended December 31, 2011
|
||||||||||||||||||||
|
Ending Balance
|
Average Balance
|
Maximum Month-End Balance
|
Weighted Average Rate for the Year
|
Weighted Average Rate at End of the Year
|
||||||||||||||||
|
Repurchase agreements
|
$ | 38,316 | $ | 37,210 | $ | 42,551 | 0.82 | % | 0.80 | % | ||||||||||
|
FHLB advances
|
5,475 | 790 | 5,475 | 0.37 | % | 0.05 | % | |||||||||||||
| $ | 43,791 | $ | 38,000 | $ | 48,026 | 0.81 | % | 0.71 | % | |||||||||||
|
At and for the year ended December 31, 2010
|
||||||||||||||||||||
|
Ending Balance
|
Average Balance
|
Maximum Month-End Balance
|
Weighted Average Rate for the Year
|
Weighted Average Rate at End of the Year
|
||||||||||||||||
|
Repurchase agreements
|
$ | 37,912 | $ | 32,077 | $ | 41,678 | 1.22 | % | 1.02 | % | ||||||||||
|
FHLB advances
|
34 | 0.73 | % | |||||||||||||||||
|
U.S. Treasury tax and loan
|
812 | 503 | 1,018 | |||||||||||||||||
|
|
$ | 38,724 | $ | 32,614 | $ | 42,696 | 1.20 | % | 1.00 | % | ||||||||||
Peoples Bank has an agreement with the FHLB which allows for borrowings up to a percentage of qualifying collateral assets. At December 31, 2011, Peoples Bank had a maximum borrowing capacity for short- and long-term advances, with the FHLB, of approximately $159,299 of which $24,402 was outstanding in short- and long-term borrowings. Advances with the FHLB are secured under terms of a blanket collateral agreement by a pledge of FHLB stock and certain other qualifying collateral, such as investments and mortgage-backed securities and mortgage loans. Interest accrues daily on the FHLB advances based on rates of the FHLB discount notes. This rate resets each day.
Securities sold under repurchase agreements are retained under Peoples Bank’s control at its safekeeping agent. The Bank may be required to provide additional collateral based on the fair value of the underlying securities.
84
Peoples Financial Services Corp.
NOTES TO CONSOLIDATED FINANCIAL STATEMENTS
(Dollars in thousands, except per share data)
10. Long-term debt:
Long-term debt consisting of advances from the FHLB under various notes at December 31, 2011 and 2010 are as follows:
|
Due
|
Convertible
|
Strike Rate
|
Current Interest Rate
|
2011
|
2010
|
|||||||||||||||
|
September 2011
|
N/A | N/A | 5.05 | % | $ | 150 | ||||||||||||||
|
October 2011
|
N/A | N/A | 4.47 | % | 2,500 | |||||||||||||||
|
September 2012
|
March 2012
|
8.0 | % | 3.69 | % | $ | 5,000 | 5,000 | ||||||||||||
|
January 2013
|
January 2012
|
N/A | 2.67 | % | 5,000 | 5,000 | ||||||||||||||
|
February 2013
|
February 2012
|
8.0 | % | 3.59 | % | 5,000 | 5,000 | |||||||||||||
|
January 2015
|
N/A | 8.0 | % | 4.31 | % | 5,000 | ||||||||||||||
|
November 2015
|
N/A | N/A | 4.67 | % | 985 | 1,209 | ||||||||||||||
|
February 2016
|
N/A | N/A | 4.86 | % | 524 | 634 | ||||||||||||||
|
February 2016
|
N/A | N/A | 4.86 | % | 524 | 635 | ||||||||||||||
|
February 2017
|
N/A | N/A | 4.99 | % | 1,894 | 2,208 | ||||||||||||||
| $ | 18,927 | $ | 27,336 | |||||||||||||||||
The FHLB has the option to convert convertible rate notes at rates ranging from the three-month LIBOR plus .15% to plus .22% on a quarterly basis, if greater than the applicable strike rate, commencing on the conversion date. If converted, Peoples Bank has the option to repay these advances at each of the option dates without penalty.
Maturities of long-term debt, by contractual maturity, in years subsequent to December 31, 2011 are as follows:
|
2012
|
$ | 5,797 | ||
|
2013
|
10,836 | |||
|
2014
|
878 | |||
|
2015
|
899 | |||
|
2016
|
448 | |||
|
Thereafter
|
69 | |||
| $ | 18,927 |
85
Peoples Financial Services Corp.
NOTES TO CONSOLIDATED FINANCIAL STATEMENTS
(Dollars in thousands, except per share data)
11. Fair value of financial instruments:
Assets and liabilities measured at fair value on a recurring basis at December 31, 2011 and 2010, are summarized as follows:
|
Fair Value Measurement Using
|
|||||||||||||
|
December 31, 2011
|
Amount
|
Quoted Prices in Active Markets for Identical Assets
(Level 1)
|
Significant Other Observable Inputs
(Level 2)
|
Significant Unobservable Inputs
(Level 3)
|
|||||||||
|
U.S. Government-sponsored enterprises
|
$ | 32,776 | $ | 32,776 | |||||||||
|
State and Municipals:
|
|||||||||||||
|
Taxable
|
19,728 | 19,728 | |||||||||||
|
Tax-exempt
|
39,686 | 39,686 | |||||||||||
|
Corporate debt securities
|
3,850 | 3,850 | |||||||||||
|
Mortgage-backed securities:
|
|||||||||||||
|
U.S. Government agencies
|
16,912 | 16,912 | |||||||||||
|
U.S. Government-sponsored enterprises
|
26,263 | 26,263 | |||||||||||
|
Equity securities:
|
|||||||||||||
|
Preferred
|
117 | 117 | |||||||||||
|
Common
|
567 | $ | 567 | ||||||||||
|
Total
|
$ | 139,899 | $ | 567 | $ | 139,332 | |||||||
|
Fair Value Measurement Using
|
|||||||||||||
|
December 31, 2010
|
Amount
|
Quoted Prices in Active Markets for Identical Assets
(Level 1)
|
Significant Other Observable Inputs
(Level 2)
|
Significant Unobservable Inputs
(Level 3)
|
|||||||||
|
U.S. Government-sponsored enterprises
|
$ | 38,785 | $ | 38,785 | |||||||||
|
State and Municipals:
|
|||||||||||||
|
Taxable
|
18,374 | 18,374 | |||||||||||
|
Tax-exempt
|
50,309 | 50,309 | |||||||||||
|
Corporate debt securities
|
4,020 | 4,020 | |||||||||||
|
Mortgage-backed securities:
|
|||||||||||||
|
U.S. Government agencies
|
4,476 | 4,476 | |||||||||||
|
U.S. Government-sponsored enterprises
|
4,527 | 4,527 | |||||||||||
|
Equity securities:
|
|||||||||||||
|
Preferred
|
54 | 54 | |||||||||||
|
Common
|
1,227 | $ | 1,227 | ||||||||||
|
Total
|
$ | 121,772 | $ | 1,227 | $ | 120,545 | |||||||
86
Peoples Financial Services Corp.
NOTES TO CONSOLIDATED FINANCIAL STATEMENTS
(Dollars in thousands, except per share data)
11. Fair value of financial instruments (continued):
Assets and liabilities measured at fair value on a non-recurring basis at December 31, 2011 and 2010, are summarized as follows:
|
Fair Value Measurement Using
|
|||||||||||
|
December 31, 2011
|
Amount
|
Quoted Prices in Active Markets for Identical Assets (Level 1)
|
Significant
Other Observable Inputs
(Level 2)
|
Significant Unobservable
Inputs
(Level 3)
|
|||||||
|
Impaired loans
|
$ | 7,341 | $ | 7,341 | |||||||
|
Fair Value Measurement Using
|
|||||||||||
|
December 31, 2010
|
Amount
|
Quoted Prices in Active Markets for Identical Assets (Level 1)
|
Significant
Other Observable
Inputs
(Level 2)
|
Significant Unobservable
Inputs
(Level 3)
|
|||||||
|
Impaired loans
|
$ | 7,769 | $ | 7,769 | |||||||
Fair values of impaired loans are based on the present value of expected future cash flows discounted at the loan’s effective interest rate or the fair value of the collateral if the loan is collateral dependent.
The estimated fair value of financial instruments at December 31, 2011 and December 31, 2010, is as follows:
|
2011
|
2010
|
|||||||||||||||
|
December 31
|
Carrying Value
|
Fair
Value
|
Carrying Value
|
Fair
Value
|
||||||||||||
|
Financial assets:
|
||||||||||||||||
|
Cash and cash equivalents
|
$ | 10,559 | $ | 10,559 | $ | 17,841 | $ | 17,841 | ||||||||
|
Investment securities available-for-sale
|
139,899 | 139,899 | 121,772 | 121,772 | ||||||||||||
|
Loans held for sale
|
569 | 569 | 30 | 30 | ||||||||||||
|
Net loans
|
439,754 | 447,717 | 386,672 | 393,033 | ||||||||||||
|
Accrued interest receivable
|
3,448 | 3,448 | 3,003 | 3,003 | ||||||||||||
|
Restricted equity securities
|
2,374 | 2,374 | 2,642 | 2,642 | ||||||||||||
|
Total
|
$ | 596,603 | $ | 604,566 | $ | 531,960 | $ | 538,321 | ||||||||
|
Financial liabilities:
|
||||||||||||||||
|
Deposits
|
$ | 494,283 | $ | 497,680 | $ | 438,734 | $ | 440,529 | ||||||||
|
Short-term borrowings
|
43,791 | 43,791 | 38,724 | 38,724 | ||||||||||||
|
Long-term debt
|
18,927 | 19,300 | 27,336 | 27,872 | ||||||||||||
|
Accrued interest payable
|
284 | 284 | 311 | 311 | ||||||||||||
|
Total
|
$ | 557,285 | $ | 561,055 | $ | 505,105 | $ | 507,436 | ||||||||
87
Peoples Financial Services Corp.
NOTES TO CONSOLIDATED FINANCIAL STATEMENTS
(Dollars in thousands, except per share data)
12. Stock plans:
The Company has a stock option plan covering non-employee directors and a stock incentive plan for certain officers and key employees. The Plan is administered by a committee of the Board of Directors. Under the Plan, 187,500 shares of common stock are reserved for possible issuance. The number of shares available is subject to future adjustment in the event of specified changes in the Company’s capital structure. Under the Plan, the exercise price cannot be less than 100% of the fair market value on the date of grant. The vesting period of options granted is at the discretion of the Board of Directors. There were 35,451 shares available for grant under this stock option plan as of December 31, 2011.
The activity under the plans for each of the years in the three-year period ended December 31, 2011, is summarized as follows:
|
2011
|
2010
|
2009
|
||||||||||||||||||||||
|
December 31
|
Options
|
Weighted Average Price
|
Options
|
Weighted Average Price
|
Options
|
Weighted Average Price
|
||||||||||||||||||
|
Outstanding, beginning of year
|
21,574 | 23.34 | 27,449 | $ | 22.43 | 33,549 | $ | 21.78 | ||||||||||||||||
|
Granted
|
||||||||||||||||||||||||
|
Exercised
|
(7,425 | ) | 16.71 | (5,575 | ) | 18.50 | (4,975 | ) | 17.10 | |||||||||||||||
|
Forfeited
|
(750 | ) | 30.78 | (300 | ) | 30.78 | (1,125 | ) | 26.63 | |||||||||||||||
|
Outstanding, end of year
|
13,399 | 26.59 | 21,574 | $ | 23.34 | 27,449 | $ | 22.43 | ||||||||||||||||
|
Exercisable, end of year
|
13,399 | 26.59 | 21,574 | $ | 23.34 | 27,449 | $ | 22.43 | ||||||||||||||||
The weighted-average remaining contractual life of the options outstanding was approximately two years at December 31, 2011. The weighted-average remaining contractual life of options exercisable at December 31, 2011 was approximately two years. Stock options outstanding at December 31, 2011 are exercisable at prices ranging from $18.00 to $34.10 per share. The aggregate intrinsic value of options outstanding and exercisable was $22 at December 31, 2011 and $70 at December 31, 2010. The aggregate intrinsic value of options exercised was $86, $45, and $2 for the years ended December 31, 2011, 2010, and 2009.
The Company offers its shareholders a Dividend Reinvestment and Stock Purchase Plan. Under the Plan, the Company registered 100,000 shares of its common stock to be sold pursuant to this Plan. The Plan provides shareholders with a simple and convenient method of purchasing additional common shares without payment of any brokerage commission or other service fees. The Plan may purchase shares on the open market if available or they may be issued from treasury shares. A participant in the Plan may elect to reinvest dividends on all or part of their shares to acquire additional common stock. The Plan also permits shareholders to purchase additional shares of common stock through voluntary cash payments. A participant may withdraw from the Plan at any time. At December 31, 2011, there are 35,451 remaining shares available for acquisition under the Plan.
88
Peoples Financial Services Corp.
NOTES TO CONSOLIDATED FINANCIAL STATEMENTS
(Dollars in thousands, except per share data)
13. Employee benefit plans:
The Company has an employee stock ownership and profit-sharing plan with 401(k) provisions. The Plan is for the benefit of all employees who meet the eligibility requirements set forth in the Plan. The amount of the Company’s contributions to the Plan, including 401(k) matching contributions, is at the discretion of the Board of Directors. Company contributions to the employee stock ownership plan are allocated to participant accounts based on their percentage of total compensation for the Plan year. During 2011, 2010 and 2009, employee stock ownership plan contributions were $222, $202, and $204 respectively. During 2011, 2010 and 2009, the Company’s 401(k) matching contributions to the Plan were $113, $109, and $99 respectively. At December 31, 2011, 163,512 shares of the Company’s common stock were held in the Plan. In the event a terminated Plan participant desires to sell his or her shares of the Company’s stock, or for certain employees who elect to diversify their account balances, the Company may be required to purchase the shares from the participant at their fair market value.
The Bank has deferred compensation agreements with certain current and former directors and officers that provide fixed retirement benefits. The Bank’s deferred compensation liability at December 31, 2011 and 2010 was $1,012 and $1,014 respectively. Payments to retired directors totaled $90 for each of the years ended December 31, 2011, 2010 and 2009. The cost charged to operations for these deferred compensation plans was $88, $56, and $62 for the years ended December 31, 2011, 2010 and 2009, respectively.
14. Income taxes:
The current and deferred amounts of the provision (benefit) for income taxes expense for each of the years in the three-year period ended December 31, 2011, are as follows:
|
Year Ended December 31
|
2011
|
2010
|
2009
|
|||||||||
|
Current
|
$ | 2,540 | $ | 1,625 | $ | (591 | ) | |||||
|
Deferred
|
(183 | ) | (188 | ) | 1,514 | |||||||
| $ | 2,357 | $ | 1,437 | $ | 923 | |||||||
89
Peoples Financial Services Corp.
NOTES TO CONSOLIDATED FINANCIAL STATEMENTS
(Dollars in thousands, except per share data)
14. Income taxes (continued):
The components of the net deferred tax asset at December 31, 2011 and 2010 are as follows:
|
December 31
|
2011
|
2010
|
||||||
|
Deferred tax asset:
|
||||||||
|
Allowance for loan losses
|
$ | 1,464 | $ | 1,018 | ||||
|
Deferred loan fees
|
2 | 2 | ||||||
|
Deferred compensation
|
344 | 345 | ||||||
|
Other-than-temporary impairment on securities
|
425 | 449 | ||||||
|
Alternative minimum tax
|
387 | 387 | ||||||
|
Impairment charge on other real estate owned
|
195 | |||||||
|
Unrealized loss on investment securities available-for-sale
|
430 | |||||||
|
Other
|
90 | 43 | ||||||
|
Total
|
2,712 | 2,869 | ||||||
|
Deferred tax liabilities:
|
||||||||
|
Depreciation
|
447 | 399 | ||||||
|
Interest on preferred equity securities
|
16 | 16 | ||||||
|
Prepaid expenses
|
121 | 88 | ||||||
|
Deferred loan costs
|
274 | 265 | ||||||
|
Unrealized gains on investment securities available-for-sale
|
1,878 | |||||||
|
Total
|
2,736 | 768 | ||||||
|
Net Deferred Tax Asset (Liability)
|
$ | (24 | ) | $ | 2,101 | |||
Management believes that future taxable income will be sufficient to utilize deferred tax assets. Core earnings of the Company have remained strong and will continue to support the recognition of the deferred tax asset based on future growth projections.
A reconciliation between the amount of the effective income tax expense and the income tax expense that would have been provided at the federal statutory rate of 34.0 percent for each of the years ended December 31, 2011, 2010 and 2009, is summarized as follows:
|
Year Ended December 31
|
2011
|
2010
|
2009
|
|||||||||
|
Federal income tax at statutory rate
|
$ | 3,459 | $ | 2,693 | $ | 2,030 | ||||||
|
Tax exempt interest, net
|
(975 | ) | (1,001 | ) | (957 | ) | ||||||
|
Officers’ life insurance income
|
(129 | ) | (217 | ) | (115 | ) | ||||||
|
Other, net
|
2 | (38 | ) | (35 | ) | |||||||
|
Total
|
$ | 2,357 | $ | 1,437 | $ | 923 | ||||||
90
Peoples Financial Services Corp.
NOTES TO CONSOLIDATED FINANCIAL STATEMENTS
(Dollars in thousands, except per share data)
15. Parent Company financial statements:
CONDENSED BALANCE SHEETS
|
December 31
|
2011
|
2010
|
||||||
|
Assets:
|
||||||||
|
Cash
|
$ | 67 | $ | 617 | ||||
|
Investment in bank subsidiary
|
56,684 | 40,665 | ||||||
|
Investment in non-bank subsidiary
|
5,528 | 5,500 | ||||||
|
Due from subsidiaries
|
2,633 | |||||||
|
Investment securities available-for-sale
|
567 | 1,227 | ||||||
|
Other assets
|
21 | 75 | ||||||
|
Total assets
|
$ | 62,867 | $ | 50,717 | ||||
|
Liabilities and Stockholders’ Equity:
|
||||||||
|
Due to subsidiaries
|
$ | 2,981 | ||||||
|
Other liabilities
|
273 | $ | 201 | |||||
|
Stockholders’ equity:
|
59,613 | 50,516 | ||||||
|
Total liabilities and stockholders’ equity
|
$ | 62,867 | $ | 50,717 | ||||
CONDENSED STATEMENTS OF INCOME
|
Years Ended December 31
|
2011
|
2010
|
2009
|
|||||||||
|
Income:
|
||||||||||||
|
Dividends from subsidiaries
|
$ | 2,523 | $ | 2,480 | $ | 2,381 | ||||||
|
Other income
|
715 | 349 | 663 | |||||||||
|
Total income
|
3,238 | 2,829 | 3,044 | |||||||||
|
Expense:
|
||||||||||||
|
Other expenses
|
539 | 523 | 606 | |||||||||
|
Total expenses
|
539 | 523 | 606 | |||||||||
|
Income before taxes and undistributed income
|
2,699 | 2,306 | 2,438 | |||||||||
|
Income tax expense
|
45 | |||||||||||
|
Income before undistributed income of subsidiaries
|
2,699 | 2,306 | 2,393 | |||||||||
|
Equity in undistributed net income of subsidiaries
|
5,118 | 4,179 | 2,656 | |||||||||
|
Net income
|
$ | 7,817 | $ | 6,485 | $ | 5,049 | ||||||
91
Peoples Financial Services Corp.
NOTES TO CONSOLIDATED FINANCIAL STATEMENTS
(Dollars in thousands, except per share data)
15. Parent Company financial statements (continued):
CONDENSED STATEMENTS OF CASH FLOWS
|
Years Ended December 31
|
2011
|
2010
|
2009
|
|||||||||
|
Cash flows from operating activities:
|
||||||||||||
|
Net income
|
$ | 7,817 | $ | 6,485 | $ | 5,049 | ||||||
|
Adjustments:
|
||||||||||||
|
Net realized losses (gains) on sales of securities
|
(42 | ) | 1 | (263 | ) | |||||||
|
Other than temporary security impairment
|
87 | 140 | 206 | |||||||||
|
Undistributed net income of subsidiaries
|
(5,118 | ) | (4,179 | ) | (2,656 | ) | ||||||
|
Increase in other assets
|
(572 | ) | (24 | ) | ||||||||
|
Decrease in due from subsidiaries
|
(83 | ) | (711 | ) | (716 | ) | ||||||
|
Net cash provided by operating activities
|
2,089 | 1,712 | 1,620 | |||||||||
|
Cash flows from investing activities:
|
||||||||||||
|
Proceeds from sale of available-for-sale securities
|
560 | 24 | 1,043 | |||||||||
|
Purchase of premises and equipment
|
(41 | ) | ||||||||||
|
Net cash provided by (used in) investing activities
|
560 | (17 | ) | 1,043 | ||||||||
|
Cash flows from financing activities:
|
||||||||||||
|
Cash dividends paid
|
(2,523 | ) | (2,480 | ) | (2,381 | ) | ||||||
|
Proceeds from sale of treasury stock
|
159 | 117 | 85 | |||||||||
|
Purchase of treasury stock
|
(835 | ) | ||||||||||
|
Net cash used in financing activities
|
(3,199 | ) | (2,363 | ) | (2,296 | ) | ||||||
|
Increase (decrease) in cash
|
(550 | ) | (668 | ) | 367 | |||||||
|
Cash at beginning of year
|
617 | 1,285 | 918 | |||||||||
|
Cash at end of year
|
$ | 67 | $ | 617 | $ | 1,285 | ||||||
16. Regulatory matters:
Dividends are paid by the Company from its assets, which are mainly provided by dividends from Peoples Bank. Certain restrictions exist regarding the ability of Peoples Bank to transfer funds to the Company in the form of cash dividends, loans or advances. Under such restrictions, Peoples Bank may not, without the prior approval, declare dividends in excess of the sum of its net profit for that year combined with its retained net profits of the preceding two calendar years, less any required transfer to surplus.
The amount of funds available for transfer from Peoples Bank to the Company in the form of loans and other extensions of credit to any one affiliate are limited to 10.0 percent of capital and surplus. The maximum amount available for transfer from Peoples Bank to the Company in the form of loans was $5,286, at December 31, 2011.
92
Peoples Financial Services Corp.
NOTES TO CONSOLIDATED FINANCIAL STATEMENTS
(Dollars in thousands, except per share data)
16. Regulatory matters (continued):
The Company and Peoples Bank are subject to certain regulatory capital requirements administered by the federal banking agencies, which are defined in Section 38 of the Federal Deposit Insurance Corporation Improvement Act of 1991 (“FDICIA”). Failure to meet minimum capital requirements can initiate certain mandatory and possibly additional discretionary actions by regulators that, if undertaken, could have a direct material effect on the Company’s and Peoples Bank’s financial statements. In the event an institution is deemed to be undercapitalized by such standards, FDICIA prescribes an increasing amount of regulatory intervention, including the required institution of a capital restoration plan and restrictions on the growth of assets, branches or lines of business. Further restrictions are applied to the significantly or critically undercapitalized institutions including restrictions on interest payable on accounts, dismissal of management and appointment of a receiver. For well capitalized institutions, FDICIA provides authority for regulatory intervention when the institution is deemed to be engaging in unsafe and unsound practices or receives a less than satisfactory examination report rating. Under capital adequacy guidelines and the regulatory framework for prompt corrective action, the Company and Peoples Bank must meet specific capital guidelines that involve quantitative measures of their assets, liabilities and certain off-balance sheet items as calculated under regulatory accounting practices. The capital amounts and classifications are also subject to qualitative judgments by the regulators about components, risk weightings and other factors. Prompt corrective action provisions are not applicable to bank holding companies.
Peoples Bank was categorized as “well capitalized” under the regulatory framework for prompt corrective action at December 31, 2011 and 2010, based on the most recent notification from the Federal Deposit Insurance Corporation. To be categorized as well capitalized, Peoples Bank must maintain certain minimum Tier I risk-based, total risk-based and Tier I Leverage ratios as set forth in the following tables. The Tier I Leverage ratio is defined as Tier I capital to total average assets less intangible assets. There are no conditions or events since the most recent notification that management believes have changed Peoples Bank’s category.
93
Peoples Financial Services Corp.
NOTES TO CONSOLIDATED
FINANCIAL STATEMENTS
(Dollars in thousands, except per share data)
16. Regulatory matters (continued):
The Company and Peoples Bank’s actual capital ratios at December 31, 2011 and 2010, and the minimum ratios required for capital adequacy purposes and to be well capitalized under the prompt corrective action provisions are as follows:
|
Actual
|
Minimum For Capital Adequacy Purposes
|
Minimum to be Well Capitalized under Prompt Corrective Action Provisions
|
||||||||||||||||||||||
|
December 31, 2011
|
Amount
|
Ratio
|
Amount
|
Ratio
|
Amount
|
Ratio
|
||||||||||||||||||
|
Tier 1 capital to risk-weighted assets:
|
||||||||||||||||||||||||
|
Consolidated
|
$ | 55,282 | 11.57 | % | $ | 19,115 | 4.00 | % | ||||||||||||||||
|
Peoples Bank
|
52,242 | 10.95 | 19,090 | 4.00 | $ | 28,635 | 6.00 | % | ||||||||||||||||
|
Total capital to risk-weighted assets:
|
||||||||||||||||||||||||
|
Consolidated
|
60,659 | 12.69 | 38,231 | 8.00 | ||||||||||||||||||||
|
Peoples Bank
|
57,619 | 12.07 | 38,180 | 8.00 | 47,726 | 10.00 | ||||||||||||||||||
|
Tier 1 capital to average assets:
|
||||||||||||||||||||||||
|
Consolidated
|
55,282 | 9.42 | 23,477 | 4.00 | ||||||||||||||||||||
|
Peoples Bank
|
$ | 52,242 | 8.92 | % | $ | 23,429 | 4.00 | % | $ | 29,286 | 5.00 | % | ||||||||||||
|
Actual
|
Minimum For Capital Adequacy Purposes
|
Minimum to be Well Capitalized under Prompt Corrective Action Provisions
|
||||||||||||||||||||||
|
December 31, 2010
|
Amount
|
Ratio
|
Amount
|
Ratio
|
Amount
|
Ratio
|
||||||||||||||||||
|
Tier 1 capital to risk-weighted assets:
|
||||||||||||||||||||||||
|
Consolidated
|
$ | 50,298 | 11.72 | % | $ | 17,160 | 4.00 | % | ||||||||||||||||
|
Peoples Bank
|
46,617 | 10.90 | 17,107 | 4.00 | $ | 25,660 | 6.00 | % | ||||||||||||||||
|
Total capital to risk-weighted assets:
|
||||||||||||||||||||||||
|
Consolidated
|
54,398 | 12.68 | 34,320 | 8.00 | ||||||||||||||||||||
|
Peoples Bank
|
50,717 | 11.86 | 34,214 | 8.00 | 42,767 | 10.00 | ||||||||||||||||||
|
Tier 1 capital to average assets:
|
||||||||||||||||||||||||
|
Consolidated
|
50,298 | 9.19 | 21,897 | 4.00 | ||||||||||||||||||||
|
Peoples Bank
|
$ | 46,617 | 8.53 | % | $ | 21,860 | 4.00 | % | $ | 27,324 | 5.00 | % | ||||||||||||
17. Contingencies:
The Company is subject to lawsuits and claims arising out of its business. In the opinion of the Company’s management, after review and consultation with counsel, any proceedings that may arise should not result in judgments, which, in the aggregate, would have a material adverse effect on the Company’s consolidated financial statements.
94
Peoples Financial Services Corp.
NOTES TO CONSOLIDATED
FINANCIAL STATEMENTS
(Dollars in thousands, except per share data)
18. Summary of quarterly financial information (unaudited):
|
2011
|
||||||||||||||||
|
Quarter Ended
|
March 31
|
June 30
|
Sept. 30
|
Dec. 31
|
||||||||||||
|
Interest income:
|
||||||||||||||||
|
Interest and fees on loans:
|
||||||||||||||||
|
Taxable
|
$ | 5,136 | $ | 5,413 | $ | 5,505 | $ | 5,585 | ||||||||
|
Tax-exempt
|
357 | 346 | 331 | 328 | ||||||||||||
|
Interest and dividends on investment securities available-for-sale:
|
||||||||||||||||
|
Taxable
|
666 | 633 | 639 | 672 | ||||||||||||
|
Tax-exempt
|
475 | 411 | 397 | 377 | ||||||||||||
|
Dividends
|
9 | 8 | 9 | 7 | ||||||||||||
|
Interest on interest-bearing balances with banks
|
2 | 3 | 3 | 4 | ||||||||||||
|
Interest on federal funds sold
|
2 | 11 | 13 | 8 | ||||||||||||
|
Total interest income
|
6,647 | 6,825 | 6,897 | 6,981 | ||||||||||||
|
Interest expense:
|
||||||||||||||||
|
Interest on deposits
|
1,044 | 1,132 | 1,168 | 1,079 | ||||||||||||
|
Interest on short-term borrowings
|
86 | 76 | 76 | 72 | ||||||||||||
|
Interest on long-term debt
|
257 | 263 | 208 | 178 | ||||||||||||
|
Total interest expense
|
1,387 | 1,471 | 1,452 | 1,329 | ||||||||||||
|
Net interest income
|
5,260 | 5,354 | 5,445 | 5,652 | ||||||||||||
|
Provision for loan losses
|
421 | 804 | 269 | 300 | ||||||||||||
|
Net interest income after provision for loan losses
|
4,839 | 4,550 | 5,176 | 5,352 | ||||||||||||
|
Noninterest income:
|
||||||||||||||||
|
Service charges, fees and commissions
|
709 | 711 | 736 | 799 | ||||||||||||
|
Wealth management income
|
139 | 236 | 142 | 140 | ||||||||||||
|
Mortgage banking income
|
48 | 98 | 32 | 168 | ||||||||||||
|
Net gain (loss) on sale of investment securities available-for-sale
|
10 | 2 | 25 | (12 | ) | |||||||||||
|
Other-than-temporary investment equity securities impairment
|
(84 | ) | (3 | ) | ||||||||||||
|
Net gain (loss) loss on sale of other real estate
|
1,583 | 90 | (2 | ) | ||||||||||||
|
Total noninterest income
|
822 | 2,630 | 1,022 | 1,093 | ||||||||||||
|
Noninterest expense:
|
||||||||||||||||
|
Salaries and employee benefits expense
|
1,446 | 1,628 | 1,648 | 1,713 | ||||||||||||
|
Net occupancy and equipment expense
|
676 | 699 | 738 | 766 | ||||||||||||
|
Other expenses
|
1,273 | 1,743 | 1,371 | 1,609 | ||||||||||||
|
Total noninterest expense
|
3,395 | 4,070 | 3,757 | 4,088 | ||||||||||||
|
Income before income taxes
|
2,266 | 3,110 | 2,441 | 2,357 | ||||||||||||
|
Provision for income tax expense
|
467 | 751 | 582 | 557 | ||||||||||||
|
Net income
|
1,799 | 2,359 | 1,859 | 1,800 | ||||||||||||
|
Other comprehensive income (loss):
|
||||||||||||||||
|
Unrealized gain (loss) on investment securities available-for-sale
|
1,100 | 3,183 | 2,908 | (466 | ) | |||||||||||
|
Reclassification adjustment for (gain) loss included in net income
|
(10 | ) | (2 | ) | (25 | ) | 12 | |||||||||
|
Reclassification adjustment for other-than-temporary impairment charges
|
84 | 3 | ||||||||||||||
|
Income tax expense (benefit) related to other comprehensive income
|
399 | 1,082 | 981 | (154 | ) | |||||||||||
|
Other comprehensive income (loss), net of income taxes
|
775 | 2,099 | 1,905 | (300 | ) | |||||||||||
|
Comprehensive income
|
$ | 2,574 | $ | 4,458 | $ | 3,764 | $ | 1,500 | ||||||||
|
Per share data:
|
||||||||||||||||
|
Net income:
|
||||||||||||||||
|
Basic
|
$ | 0.57 | $ | 0.75 | $ | 0.60 | $ | 0.57 | ||||||||
|
Diluted
|
0.57 | 0.75 | 0.60 | 0.57 | ||||||||||||
|
Dividends declared
|
$ | 0.20 | $ | 0.20 | $ | 0.20 | $ | 0.20 | ||||||||
95
Peoples Financial Services Corp.
NOTES TO CONSOLIDATED
FINANCIAL STATEMENTS
(Dollars in thousands, except per share data)
18. Summary of quarterly financial information (unaudited) (continued):
|
2010
|
||||||||||||||||
|
Quarter Ended
|
March 31
|
June 30
|
Sept. 30
|
Dec. 31
|
||||||||||||
|
Interest income:
|
||||||||||||||||
|
Interest and fees on loans:
|
||||||||||||||||
|
Taxable
|
$ | 4,717 | $ | 4,952 | $ | 4,787 | $ | 4,961 | ||||||||
|
Tax-exempt
|
270 | 274 | 279 | 293 | ||||||||||||
|
Interest and dividends on investment securities available-for-sale:
|
||||||||||||||||
|
Taxable
|
751 | 745 | 731 | 716 | ||||||||||||
|
Tax-exempt
|
494 | 488 | 525 | 520 | ||||||||||||
|
Dividends
|
13 | 13 | 9 | 9 | ||||||||||||
|
Interest on interest-bearing balances with banks
|
1 | 1 | 1 | 1 | ||||||||||||
|
Interest on federal funds sold
|
4 | 8 | 8 | 6 | ||||||||||||
|
Total interest income
|
6,250 | 6,481 | 6,340 | 6,506 | ||||||||||||
|
Interest expense:
|
||||||||||||||||
|
Interest on deposits
|
1,252 | 1,221 | 1,165 | 1,058 | ||||||||||||
|
Interest on short-term borrowings
|
71 | 101 | 115 | 102 | ||||||||||||
|
Interest on long-term debt
|
392 | 393 | 355 | 273 | ||||||||||||
|
Total interest expense
|
1,715 | 1,715 | 1,635 | 1,433 | ||||||||||||
|
Net interest income
|
4,535 | 4,766 | 4,705 | 5,073 | ||||||||||||
|
Provision for loan losses
|
895 | 682 | 445 | 180 | ||||||||||||
|
Net interest income after provision for loan losses
|
3,640 | 4,084 | 4,260 | 4,893 | ||||||||||||
|
Noninterest income:
|
||||||||||||||||
|
Service charges, fees and commissions
|
953 | 1,017 | 782 | 690 | ||||||||||||
|
Wealth management income
|
60 | 99 | 81 | 65 | ||||||||||||
|
Mortgage banking income
|
77 | 63 | 168 | 109 | ||||||||||||
|
Net gain (loss) on sale of investment securities available-for-sale
|
22 | 179 | 22 | 123 | ||||||||||||
|
Other-than-temporary investment equity securities impairment
|
(140 | ) | (24 | ) | ||||||||||||
|
Net gain (loss) on sale of other real estate
|
(47 | ) | 2 | (11 | ) | |||||||||||
|
Total noninterest income
|
1,112 | 1,311 | 915 | 952 | ||||||||||||
|
Noninterest expense:
|
||||||||||||||||
|
Salaries and employee benefits expense
|
1,311 | 1,395 | 1,490 | 1,302 | ||||||||||||
|
Net occupancy and equipment expense
|
622 | 614 | 641 | 624 | ||||||||||||
|
Other expenses
|
1,104 | 1,501 | 1,372 | 1,269 | ||||||||||||
|
Total noninterest expense
|
3,037 | 3,510 | 3,503 | 3,195 | ||||||||||||
|
Income before income taxes
|
1,715 | 1,885 | 1,672 | 2,650 | ||||||||||||
|
Provision for income tax expense
|
197 | 361 | 272 | 607 | ||||||||||||
|
Net income
|
1,518 | 1,524 | 1,400 | 2,043 | ||||||||||||
|
Other comprehensive income (loss):
|
||||||||||||||||
|
Unrealized gain (loss) on investment securities available-for-sale
|
1,172 | 2,418 | 4,525 | (5,776 | ) | |||||||||||
|
Reclassification adjustment for (gain) loss included in net income
|
(22 | ) | (179 | ) | (22 | ) | (123 | ) | ||||||||
|
Reclassification adjustment for other-than-temporary impairment charges
|
140 | 24 | ||||||||||||||
|
Income tax expense (benefit) related to other comprehensive income
|
391 | 761 | 1,579 | (1,998 | ) | |||||||||||
|
Other comprehensive income (loss), net of income taxes
|
759 | 1,478 | 3,064 | (3,877 | ) | |||||||||||
|
Comprehensive income (loss)
|
$ | 2,277 | $ | 3,002 | $ | 4,464 | $ | (1,834 | ) | |||||||
|
Per share data:
|
||||||||||||||||
|
Net income:
|
||||||||||||||||
|
Basic
|
$ | 0.48 | $ | 0.49 | $ | 0.45 | $ | 0.65 | ||||||||
|
Diluted
|
0.48 | 0.48 | 0.45 | 0.65 | ||||||||||||
|
Dividends declared
|
$ | 0.19 | $ | 0.20 | $ | 0.20 | $ | 0.20 | ||||||||
96
|
NONE.
|
Evaluation of Disclosure Controls and Internal Controls
At December 31, 2011, the end of the period covered by this Annual Report on Form 10-K, the Chief Executive Officer (“CEO”) and Chief Financial Officer (“CFO”) evaluated the effectiveness of the Company’s disclosure controls and procedures as defined in Rule 13a-15(e) under the Exchange Act. Based upon that evaluation, the CEO and CFO concluded that the disclosure controls and procedures, at December 31, 2011, were effective to provide reasonable assurance that information required to be disclosed in the Company’s reports filed under the Exchange Act is recorded, processed, summarized and reported within the time periods specified in the SEC’s rules and forms, and to provide reasonable assurance that information required to be disclosed in such reports is accumulated and communicated to the CEO and CFO to allow timely decisions regarding required disclosure.
MANAGEMENT’S REPORT ON INTERNAL CONTROL OVER FINANCIAL REPORTING
We are responsible for the preparation and fair presentation of the accompanying consolidated balance sheets of Peoples Financial Services Corp. and subsidiaries (the “Company”) as of December 31, 2011 and 2010, and the related consolidated statements of income and comprehensive income, changes in stockholders’ equity and cash flows for each of the years in the three-year period ended December 31, 2011, in accordance with accounting principles generally accepted in the United States. This responsibility includes: establishing, implementing and maintaining adequate internal controls relevant to the preparation and fair presentation of financial statements that are free from material misstatement, whether due to fraud or error; selecting and applying appropriate accounting policies; and making accounting estimates that are reasonable under the circumstances. We are also responsible for compliance with the laws and regulations relating to safety and soundness that are designated by the Federal Deposit Insurance Corporation, Board of Governors of the Federal Reserve System and the Pennsylvania Department of Banking.
The Company’s internal controls are designed to provide reasonable assurance that assets are safeguarded and transactions are initiated, executed, recorded and reported in accordance with our intentions and authorizations and to comply with applicable laws and regulations. The internal control system includes an organizational structure that provides appropriate delegation of authority and segregation of duties, established policies and procedures and comprehensive internal audit and loan review programs. To enhance the reliability of internal controls, we recruit and train highly qualified personnel and maintain sound risk management practices. The internal control system is maintained through a monitoring process that includes a program of internal audits.
Under Section 404 of the Sarbanes-Oxley Act of 2002, we are required to assess the effectiveness of the Company’s internal control over financial reporting at the end of each fiscal year and report, based on that assessment, whether the Company’s internal control over financial reporting is effective. Our assessment includes controls over initiating, recording, processing and reconciling account balances, classes of transactions and disclosure and related assertions included in the financial statements. Our assessment also includes controls related to the initiation and processing of non-routine and non-systematic transactions, to the selection and application of appropriate accounting policies and to the prevention, identification and detection of fraud.
There are inherent limitations in any internal control system, including the possibility of human error and the circumvention or overriding of controls. Accordingly, even effective internal controls can provide only reasonable assurance with respect to financial statement preparation.
Furthermore, due to changes in conditions, the effectiveness of internal controls may vary over time. The internal auditor of the Company reviews, evaluates and makes recommendations on policies and procedures, which serves as an integral, but independent, component of our internal control.
ParenteBeard LLC, the independent registered public accounting firm that audited the Company’s consolidated financial statements in accordance with standards of the Public Company Accounting Oversight Board (United States), has issued an attestation report on the effectiveness of the Company’s internal control over financial reporting as of December 31, 2011. The report, which expresses an unqualified opinion on the effectiveness of the Company’s internal control over financial reporting as of December 31, 2011, is included in this Item 9A under the heading “Report of Independent Registered Public Accounting Firm”.
97
The Company’s financial reporting and internal controls are under the general oversight of the Board of Directors, acting through the Audit Committee. The Audit Committee is composed entirely of independent directors. The independent registered public accounting firm and the internal auditor have direct and unrestricted access to the Audit Committee at all times. The Audit Committee meets periodically with us, the internal auditor and the independent registered public accounting firm to determine that each is fulfilling its responsibilities and to support actions to identify, measure and control risks and augment internal controls.
We assessed the effectiveness of the Company’s internal controls over financial reporting and compliance with designated laws and regulations as of December 31, 2011. In making the assessment, we used the criteria established in Internal Control-Integrated Framework issued by the Committee of Sponsoring Organizations of the Treadway Commission. These criteria are in the areas of control environment, risk assessment, control activities, information and communication, and monitoring. Our assessment included extensive documenting, evaluating and testing the design and operating effectiveness of the Company’s internal control over financial reporting.
Based on our assessment, we believe that the Company’s internal control over financial reporting was effective and that the Company was compliant with all designated laws and regulations as of December 31, 2011.
|
/s/Alan W. Dakey
|
|
|
Alan W. Dakey
|
|
|
President and Chief Executive Officer
|
|
|
(Principal Executive Officer)
|
|
|
/s/Scott A. Seasock
|
|
|
Senior Vice President and
|
|
|
Chief Financial Officer
|
|
|
(Principal Financial Officer)
|
|
March 15, 2012
98
|
REPORT OF INDEPENDENT REGISTERED PUBLIC ACCOUNTING FIRM
To the Board of Directors and Stockholders
Peoples Financial Services Corp.
Hallstead, Pennsylvania
We have audited Peoples Financial Services Corp. and subsidiaries' (the “Company”) internal control over financial reporting as of December 31, 2011, based on criteria established in
Internal Control—Integrated Framework
issued by the Committee of Sponsoring Organizations of the Treadway Commission (COSO). The Company’s management is responsible for maintaining effective internal control over financial reporting and for its assessment of the effectiveness of internal control over financial reporting included in the accompanying Management’s Report on Internal Control over Financial Reporting. Our responsibility is to express an opinion on the Company’s internal control over financial reporting based on our audit.
We conducted our audit in accordance with the standards of the Public Company Accounting Oversight Board (United States). Those standards require that we plan and perform the audit to obtain reasonable assurance about whether effective internal control over financial reporting was maintained in all material respects. Our audit of internal control over financial reporting included obtaining an understanding of internal control over financial reporting, assessing the risk that a material weakness exists, and testing and evaluating the design and operating effectiveness of internal control based on the assessed risk. Our audit also included performing such other procedures as we considered necessary in the circumstances. We believe that our audit provides a reasonable basis for our opinion.
A company’s internal control over financial reporting is a process designed to provide reasonable assurance regarding the reliability of financial reporting and the preparation of financial statements for external purposes in accordance with generally accepted accounting principles. A company’s internal control over financial reporting includes those policies and procedures that (1) pertain to the maintenance of records that, in reasonable detail, accurately and fairly reflect the transactions and dispositions of the assets of the company; (2) provide reasonable assurance that transactions are recorded as necessary to permit preparation of financial statements in accordance with generally accepted accounting principles, and that receipts and expenditures of the company are being made only in accordance with authorizations of management and directors of the company; and (3) provide reasonable assurance regarding prevention or timely detection of unauthorized acquisition, use, or disposition of the company’s assets that could have a material effect on the financial statements.
Because of its inherent limitations, internal control over financial reporting may not prevent or detect misstatements. Also, projections of any evaluation of effectiveness to future periods are subject to the risk that controls may become inadequate because of changes in conditions, or that the degree of compliance with the policies or procedures may deteriorate.
In our opinion, the Company maintained, in all material respects, effective internal control over financial reporting as of December 31, 2011, based on criteria established in Internal Control—Integrated Framework issued by the Committee of Sponsoring Organizations of the Treadway Commission (COSO).
We have also audited, in accordance with the standards of the Public Company Accounting Oversight Board (United States), the consolidated balance sheets of Peoples Financial Services Corp. and subsidiaries as of December 31, 2011 and 2010 and the related consolidated statements of income and comprehensive income, stockholders’ equity, and cash flows for each of the years in the three year period ended December 31, 2011, and our report dated March 15, 2012, expressed an unqualified opinion.
/s/ PARENTEBEARD LLC
ParenteBeard LLC
Allentown, Pennsylvania
March 15, 2012
|
99
Changes in Internal Control Over Financial Reporting
In the ordinary course of business, the Company may routinely modify, upgrade and enhance its internal control and procedures for financial reporting. However, there were no changes in the internal control over financial reporting as defined in Rule 13a-15(f) under the Exchange Act that occurred during the fourth quarter of the fiscal year ended December 31, 2011, that materially affected, or are reasonably likely to materially affect, the Company’s internal control over financial reporting.
|
NONE.
|
|
The information required by this Item 10 is incorporated herein by reference to the section entitled “Governance of the Company” in the Company’s 2012 Proxy Statement.
|
|
The information required by this Item 11 is incorporated herein by reference to the section entitled “Compensation Discussion and Analysis” in the Company’s 2012 Proxy Statement.
|
|
The information required by this Item 12 is incorporated herein by reference to the section entitled “Beneficial Ownership of Peoples Financial Services Corp. Held by Principal Shareholders and Management” in the Company’s 2012 Proxy statement.
|
|
The information required by this Item 13 is incorporated herein by reference to the section entitled “Compensation Discussion and Analysis” in the Company’s 2012 Proxy Statement.
|
|
The information required by this Item 14 is incorporated herein by reference to the section entitled “Report of the Audit Committee” in the Company’s 2012 Proxy Statement.
|
100
All financial statements and financial statement schedules required to be filed by this Form or by Regulation S-X, which are applicable to the Registrant, have been presented in the financial statements and notes thereto in Item 8, Item 7 or elsewhere in the filing, where appropriate. The listing of exhibits follows:
|
Incorporated by Reference*
|
|||||
|
Exhibit Number
|
Exhibit Description
|
Filed Herewith
|
Form
|
Exhibit
|
Filing Date
|
|
3.1
|
Articles of Incorporation
|
10-25G
|
3.1
|
03/04/1998
|
|
|
3.2
|
Bylaws, as amended
|
10-Q
|
3.2
|
11/08/2004
|
|
|
10.4
|
Termination Agreement with Debra E. Dissinger
|
10-25G
|
10.4
|
03/04/1998
|
|
|
10.6
|
Supplemental Executive Retirement Plan with Debra E. Dissinger
|
10-K
|
10.6
|
03/15/2005
|
|
|
10.7
|
Supplemental Director Retirement Plan for all Non-employee Directors
|
10-K
|
10.7
|
03/15/2005
|
|
|
10.9
|
Amendment to Supplemental Executive Retirement Plan with Debra E. Dissinger
|
10-K
|
10.9
|
03/15/2006
|
|
|
10.10
|
Amendment to Supplemental Director Retirement Plan for all Non-employee Directors
|
10-K
|
10.10
|
03/15/2006
|
|
|
10.11
|
Termination Agreement with Stephen N. Lawrenson
|
10-Q
|
10.11
|
05/10/2007
|
|
|
10.14
|
Termination Agreement with Frederick J. Malloy
|
8-K
|
10.14
|
10/27/1009
|
|
|
10.15
|
Employment Agreement with Alan W. Dakey
|
8-K
|
10.15
|
11/17/2009
|
|
|
10.16
|
Employment Agreement with Scott A. Seasock
|
8-K
|
10.16
|
01/18/2011
|
|
|
10.18
|
Supplemental Executive Retirement Plan with Alan W. Dakey
|
8-K
|
10.18
|
05/12/2011
|
|
|
10.19
|
Supplemental Executive Retirement Plan with Joseph M. Ferretti
|
8-K
|
10.19
|
05/12/2011
|
|
|
10.20
|
Employment Agreement with Joseph M. Ferretti
|
8-K
|
10.20
|
05/12/2011
|
|
|
10.21
|
Life Insurance Plan for all Non-employee Directors
|
X
|
|||
|
14
|
Code of Ethics, as amended
|
10-Q
|
14
|
08/11/2008
|
|
|
21
|
Subsidiaries
|
X
|
|||
|
23
|
Consent of Independent Registered Public Accounting Firm
|
X
|
|||
|
31.1
|
Certification of Chief Executive Officers Pursuant to Rule 13a-14(a)/15d-14(a)
|
X
|
|||
|
31.2
|
Certification of Chief Financial Officer Pursuant to Rule 13a-14(a)/15d-14(a)
|
X
|
|||
|
32.1**
|
Certification of Chief Executive Officer Pursuant to Section 1350
|
X
|
|||
|
32.2**
|
Certification of Chief Financial Officer Pursuant to Section 1350
|
X
|
|||
|
101***
|
Interactive Data File
|
X
|
|||
|
*The SEC reference number for all exhibits incorporated by reference is 0-23863
|
|||||
|
**Furnished, not filed
|
|||||
|
***As provided in Rule 406T of Regulation S-T, this information is furnished and not filed for purposes of Section 11 and 12 of the Securities Act of 1933 and Section 18 of the Securities Exchange Act of 1934.
|
|||||
101
SIGNATURES
Pursuant to the requirements of the Securities Exchange Act of 1934, the Registrant has duly caused this report to be signed on its behalf by the undersigned, thereunto duly authorized.
PEOPLES FINANCIAL SERVICES CORP.
|
BY:
|
/s/Alan W. Dakey
Alan W. Dakey, President/CEO
(Principal Executive Officer)
|
March 15, 2012
|
|
Pursuant to the requirements of the Exchange Act, this report has been signed below by the following persons on behalf of the Registrant and in the capacities and on the dates indicated.
|
||
|
/s/William E. Aubrey II
William E Aubrey II
Chairman, Board of Directors
|
March 15, 2012
|
|
|
/s/Alan W. Dakey
Alan W. Dakey, President/CEO
Member, Board of Directors
(Principal Executive Officer)
|
March 15, 2012
|
|
|
/s/Debra E. Dissinger
Debra E. Dissinger
Executive Vice President
|
March 15, 2012
|
|
|
/s/Ronald G. Kukuchka
Ronald G. Kukuchka
Member, Board of Directors
|
March 15, 2012
|
|
|
/s/Richard S. Lochen, Jr.
Richard S. Lochen, Jr.
Member, Board of Directors
|
March 15, 2012
|
|
|
/s/Frederick J. Malloy
Frederick J. Malloy
VP/Controller
(Principal Accounting Officer)
|
March 15, 2012
|
|
|
/s/Scott A. Seasock
Scott A. Seasock
Senior Vice President
(Principal Financial Officer)
|
March 15, 2012
|
|
|
/s/George H. Stover, Jr.
George H. Stover, Jr.
Member, Board of Directors
|
March 15, 2012
|
|
|
/s/Earle A. Wootton
Earle A. Wootton
Member, Board of Directors
|
March 15, 2012
|
|
|
/s/Joseph T. Wright, Jr.
Joseph T. Wright, Jr.
Member, Board of Directors
|
March 15, 2012
|
|
102
TABLE OF CONTENTS
Part IItem 1. BusinessItem 1A. Risk FactorsItem 1B. Unresolved Staff CommentsItem 2. PropertiesItem 3. Legal ProceedingsItem 4. Mine Safety DisclosuresPart IIItem 5. Market For The Registrant S Common Equity, Related Stockholder Matters and Issuer Purchases Of Equity SecuritiesItem 6. Consolidated Selected Financial DataItem 7. Management S Discussion and AnalysisItem 7A. Quantitative and Qualitative Disclosures About Market RiskItem 8. Financial Statements and Supplementary DataItem 9. Changes in and Disagreements with Accountants on Accounting and Financial DisclosureItem 9A. Controls and ProceduresItem 9B. Other InformationPart IIIItem 10. Directors, Executive Officers and Corporate GovernanceItem 11. Executive CompensationItem 12. Security Ownership Of Certain Beneficial Owners and Management and Related Stockholder MattersItem 13. Certain Relationships and Related Transactions and Director IndependenceItem 14. Principal Accounting Fees and ServicesPart IVItem 15. Exhibits and Financial Statement Schedules