PROCTER & GAMBLE CO
10-Ks and 10-Qs
|
|
|
|
|
|
|
|
|
|
|
|
|
|
|
|
|
|
|
|
|
|
|
|
|
|
|
|
|
|
|
|
|
|
|
|
|
|
|
|
|
|
|
|
|
|
|
|
|
|
|
|
|
|
|
|
|
UNITED STATES SECURITIES AND EXCHANGE COMMISSION
|
|
Washington, D.C. 20549
|
|
Form 10-K
|
(Mark one)
|
[x]
|
ANNUAL REPORT PURSUANT TO SECTION 13 OR 15(d) OF THE SECURITIES EXCHANGE ACT OF 1934
|
For the Fiscal Year Ended June 30, 2018
OR
|
[ ]
|
TRANSITION REPORT PURSUANT TO SECTION 13 OR 15(d) OF THE SECURITIES EXCHANGE ACT OF 1934
|
For the transition period from
to
Commission File No. 1-434
|
THE PROCTER & GAMBLE COMPANY
|
|
One Procter & Gamble Plaza, Cincinnati, Ohio 45202
|
|
Telephone (513) 983-1100
|
|
IRS Employer Identification No. 31-0411980
|
|
State of Incorporation: Ohio
|
Securities registered pursuant to Section 12(b) of the Act:
|
Title of each class
|
Name of each exchange on which registered
|
|
|
Common Stock, without Par Value
|
New York Stock Exchange, NYSE Euronext-Paris
|
|
Indicate by check mark if the registrant is a well-known seasoned issuer, as defined in Rule 405 of the Securities Act. Yes
þ
No
o
Indicate by check mark if the registrant is not required to file reports pursuant to Section 13 or 15(d) of the Act. Yes
o
No
þ
Indicate by check mark whether the registrant (1) has filed all reports required to be filed by Section 13 or 15(d) of the Securities Exchange Act of 1934 during the preceding 12 months (or for such shorter period that the registrant was required to file such reports), and (2) has been subject to such filing requirements for the past 90 days. Yes
þ
No
o
Indicate by check mark whether the registrant has submitted electronically and posted on its corporate website, if any, every Interactive Data File required to be submitted and posted pursuant to Rule 405 of Regulation S-T (§232.405 of this chapter) during the preceding 12 months (or for such shorter period that the registrant was required to submit and post such files). Yes
þ
No
o
Indicate by check mark if disclosure of delinquent filers pursuant to Item 405 of Regulation S-K is not contained herein, and will not be contained, to the best of registrant's knowledge, in definitive proxy or information statements incorporated by reference in Part III of this Form 10-K or any amendment to this Form 10-K.
þ
Indicate by check mark whether the registrant is a large accelerated filer, an accelerated filer, a non-accelerated filer, smaller reporting company, or an emerging growth company. See the definitions of "large accelerated filed," "accelerated filer," "smaller reporting company," and "emerging growth company" in Rule 12b-2 of the Exchange Act.
|
Large accelerated filer
|
þ
|
Accelerated filer
|
¨
|
|||||
|
Non-accelerated filer
|
¨
|
(Do not check if smaller reporting company)
|
||||||
|
Smaller reporting company
|
¨
|
|||||||
|
Emerging growth company
|
¨
|
|||||||
If an emerging growth company, indicate by check mark if the registrant has elected not to use the extended transition period for complying with any new or revised financial accounting standards provided pursuant to Section 13(a) of the Exchange Act.
¨
Indicate by check mark whether the registrant is a shell company (as defined in Rule 12b-2 of the Exchange Act). Yes
o
No
þ
The aggregate market value of the voting stock held by non-affiliates amounted to
$231 billion
on December 31, 2017.
There were
2,488,011,390
shares of Common Stock outstanding as of July 31, 2018.
Documents Incorporated by Reference
Portions of the Proxy Statement for the
2018
Annual Meeting of Shareholders, which will be filed within one hundred and twenty days of the fiscal year ended June 30, 2018 (
2018
Proxy Statement), are incorporated by reference into Part III of this report to the extent described herein.
|
FORM 10-K TABLE OF CONTENTS
|
Page
|
|||
|
PART I
|
Item 1.
|
1
|
||
|
Item 1A.
|
2
|
|||
|
Item 1B.
|
6
|
|||
|
Item 2.
|
7
|
|||
|
Item 3.
|
7
|
|||
|
Item 4.
|
7
|
|||
|
8
|
||||
|
PART II
|
Item 5.
|
9
|
||
|
Item 6.
|
11
|
|||
|
Item 7.
|
12
|
|||
|
Item 7A.
|
33
|
|||
|
Item 8.
|
34
|
|||
|
34
|
||||
|
37
|
||||
|
38
|
||||
|
39
|
||||
|
40
|
||||
|
41
|
||||
|
42
|
||||
|
42
|
||||
|
44
|
||||
|
46
|
||||
|
48
|
||||
|
49
|
||||
|
51
|
||||
|
52
|
||||
|
53
|
||||
|
58
|
||||
|
62
|
||||
|
63
|
||||
|
63
|
||||
|
64
|
||||
|
66
|
||||
|
Item 9.
|
66
|
|||
|
Item 9A.
|
66
|
|||
|
Item 9B.
|
66
|
|||
|
PART III
|
Item 10.
|
67
|
||
|
Item 11.
|
67
|
|||
|
Item 12.
|
67
|
|||
|
Item 13.
|
68
|
|||
|
Item 14.
|
68
|
|||
|
PART IV
|
Item 15.
|
68
|
||
|
Item 16.
|
70
|
|||
|
72
|
||||
|
73
|
||||
The Procter & Gamble Company
1
Item 1.
Business.
Additional information required by this item is incorporated herein by reference to Management's Discussion and Analysis (MD&A); and Notes 1 and 2 to our Consolidated Financial Statements. Unless the context indicates otherwise, the terms the "Company," "P&G," "we," "our" or "us" as used herein refer to The Procter & Gamble Company (the registrant) and its subsidiaries.
The Procter & Gamble Company is focused on providing branded consumer packaged goods of superior quality and value to improve the lives of the world's consumers. The Company was incorporated in Ohio in 1905, having been built from a business founded in 1837 by William Procter and James Gamble. Today, our products are sold in more than
180
countries and territories.
Throughout this Form 10-K, we incorporate by reference information from other documents filed with the Securities and Exchange Commission (SEC).
The Company's Annual Report on Form 10-K, quarterly reports on Form 10-Q and current reports on Form 8-K, and amendments thereto, are filed electronically with the SEC. The SEC maintains an internet site that contains these reports at: www.sec.gov. You can also access these reports through links from our website at: www.pginvestor.com.
Copies of these reports are also available, without charge, by contacting EQ Shareowner Services, 1100 Centre Pointe Curve, Suite 101, Mendota, MN 55120-4100.
Financial Information about Segments
As of
June 30, 2018
, the Company has five reportable segments under U.S. GAAP:
Beauty
;
Grooming
;
Health Care
;
Fabric & Home Care
and
Baby, Feminine & Family Care
. Many of the factors necessary for understanding these businesses are similar. Operating margins of the individual businesses vary due to the nature of materials and processes used to manufacture the products, the capital intensity of the businesses and differences in selling, general and administrative expenses as a percentage of net sales. Net sales growth by business is also expected to vary slightly due to the underlying growth of the markets and product categories in which they operate. While none of our reportable segments are highly seasonal, components within certain reportable segments, such as Appliances (Grooming) and Personal Health Care (Health), are seasonal.
Additional information about our reportable segments can be found in the MD&A and Note 2 to our Consolidated Financial Statements.
Narrative Description of Business
Business Model
. Our business model relies on the continued growth and success of existing brands and products, as well as the creation of new innovative products. The markets and industry segments in which we offer our products are highly competitive. Our products are sold in more than
180
countries and territories primarily through mass merchandisers, e-
commerce, grocery stores, membership club stores, drug stores, department stores, distributors, wholesalers, baby stores, specialty beauty stores, high-frequency stores and pharmacies. Our growth strategy is to deliver meaningful and noticeable superiority in all elements of our consumer proposition - product, packaging, brand communication, retail execution and value equation. We use our research and development and consumer insights to provide superior products and packaging. We utilize our marketing and online presence to deliver superior brand messaging to our consumers. We work collaboratively with our customers to deliver superior retail execution, both in-store and online. In conjunction with the above elements, we provide superior value to consumers and our retail customers, in each price tier where we compete.
Key Product Categories
. Information on key product categories can be found in Note 2 to our Consolidated Financial Statements.
Key Customers
. Our customers include mass merchandisers, e-commerce, grocery stores, membership club stores, drug stores, department stores, distributors, wholesalers, baby stores, specialty beauty stores, high-frequency stores and pharmacies. Sales to Walmart Inc. and its affiliates represent approximately 15% of our total sales in
2018
, 16% in
2017
and 15% in
2016
. No other customer represents more than 10% of our total sales. Our top ten customers accounted for approximately 36% of our total sales in
2018
and 35% in both
2017
and
2016
. The nature of our business results in no material backlog orders or contracts with the government. We believe our practices related to working capital items for customers and suppliers are consistent with the industry segments in which we compete.
Sources and Availability of Materials
. Almost all of the raw and packaging materials used by the Company are purchased from others, some of whom are single-source suppliers. We produce certain raw materials, primarily chemicals, for further use in the manufacturing process. In addition, fuel, natural gas and derivative products are important commodities consumed in our manufacturing process and in the transportation of input materials and finished products to customers. The prices we pay for materials and other commodities are subject to fluctuation. When prices for these items change, we may or may not pass the change to our customers. The Company purchases a substantial variety of other raw and packaging materials, none of which is material to our business taken as a whole.
Trademarks and Patents
. We own or have licenses under patents and registered trademarks, which are used in connection with our activity in all businesses. Some of these patents or licenses cover significant product formulation and processes used to manufacture our products. The trademarks are important to the overall marketing and branding of our products. All major trademarks in each business are registered. In part, our success can be attributed to the existence and continued protection of these trademarks, patents and licenses.
2
The Procter & Gamble Company
Competitive Condition
. The markets in which our products are sold are highly competitive. Our products compete against similar products of many large and small companies, including well-known global competitors. In many of the markets and industry segments in which we sell our products we compete against other branded products as well as retailers' private-label brands. We are well positioned in the industry segments and markets in which we operate, often holding a leadership or significant market share position. We support our products with advertising, promotions and other marketing vehicles to build awareness and trial of our brands and products in conjunction with our sales force. We believe this combination provides the most efficient method of marketing for these types of products. Product quality, performance, value and packaging are also important differentiating factors.
Research and Development Expenditures
. Research and development (R&D) expenditures enable us to develop technologies and obtain patents across all categories in order to meet the needs and improve the lives of our consumers. Research and development expenses were $1.9 billion in
2018
,
2017
and
2016
(reported in Net earnings from continuing operations).
Expenditures for Environmental Compliance
.
Expenditures for compliance with federal, state and local environmental laws and regulations are fairly consistent from year to year and are not material to the Company. No material change is expected in fiscal year
2019
.
Employees
. Total number of employees is an estimate of total Company employees excluding interns, co-ops, contractors and employees of joint ventures as of the years ended June 30. The number of employees includes manufacturing and non-manufacturing employees. The number of employees is not restated to exclude employees of discontinued operations.
|
Total Number of Employees
|
|
|
2018
|
92,000
|
|
2017
|
95,000
|
|
2016
|
105,000
|
|
2015
|
110,000
|
|
2014
|
118,000
|
|
2013
|
121,000
|
Financial Information about Foreign and Domestic Operations.
Net sales in the United States account for 41% of total net sales. No other individual country exceeds 10% of total net sales. Operations outside the United States are generally characterized by the same conditions discussed in the description of the business above and may be affected by additional factors including changing currency values, different rates of inflation, economic growth and political and economic uncertainties and disruptions.
Our sales by geography for the fiscal years ended June 30 were as follows:
|
2018
|
2017
|
2016
|
|||
|
North America
(1)
|
44%
|
45%
|
44%
|
||
|
Europe
|
24%
|
23%
|
23%
|
||
|
Asia Pacific
|
9%
|
9%
|
9%
|
||
|
Greater China
|
9%
|
8%
|
8%
|
||
|
Latin America
|
7%
|
8%
|
8%
|
||
|
IMEA
(2)
|
7%
|
7%
|
8%
|
||
|
(1)
|
North America includes results for the United States, Canada and Puerto Rico only.
|
|
(2)
|
IMEA includes India, Middle East and Africa.
|
Net sales and total assets in the United States and internationally were as follows (in billions):
|
Net Sales (years ended June 30)
|
United States
|
International
|
|
|
2018
|
$27.3
|
$39.5
|
|
|
2017
|
$27.3
|
$37.8
|
|
|
2016
|
$27.0
|
$38.3
|
|
|
Total Assets (years ended June 30)
|
|||
|
2018
|
$63.4
|
$54.9
|
|
|
2017
|
$59.8
|
$60.6
|
|
|
2016
|
$64.4
|
$62.7
|
|
Item 1A.
Risk Factors.
We discuss our expectations regarding future performance, events and outcomes, such as our business outlook and objectives in this Form 10-K, quarterly and annual reports, press releases and other written and oral communications. All statements, except for historical and present factual information, are “forward-looking statements” and are based on financial data and business plans available only as of the time the statements are made, which may become outdated or incomplete. We assume no obligation to update any forward-looking statements as a result of new information, future events or other factors. Forward-looking statements are inherently uncertain, and investors must recognize that events could significantly differ from our expectations.
The following discussion of “risk factors” identifies significant factors that may adversely affect our business, operations, financial position or future financial performance. This information should be read in conjunction with the MD&A and the Consolidated Financial Statements and related Notes incorporated in this report. The following discussion of risks is not all inclusive, but is designed to highlight what we believe are important factors to consider when evaluating our expectations. These and other factors could cause our future results to differ from those in the forward-looking statements and from historical trends.
The Procter & Gamble Company
3
Our business is subject to numerous risks as a result of our having significant operations and sales in international markets, including foreign currency fluctuations, currency exchange or pricing controls and localized volatility.
We are a global company, with operations in approximately
70
countries and products sold in more than
180
countries and territories around the world. We hold assets, incur liabilities, earn revenues and pay expenses in a variety of currencies other than the U.S. dollar, and our operations outside the U.S. generate a significant portion of our net revenue. Fluctuations in exchange rates for foreign currencies may reduce the U.S. dollar value of revenues, profits and cash flows we receive from non-U.S. markets, increase our supply costs (as measured in U.S. dollars) in those markets, negatively impact our competitiveness in those markets or otherwise adversely impact our business results or financial condition. Moreover, discriminatory or conflicting fiscal or trade policies in different countries, including potential changes to tariffs and existing trade policies and agreements, could adversely affect our results. See also the Results of Operations and Cash Flow, Financial Condition and Liquidity sections of the MD&A and Note 9 to our Consolidated Financial Statements.
We also have businesses and maintain local currency cash balances in a number of countries with currency exchange, import authorization, pricing or other controls or restrictions, such as Nigeria, Algeria and Egypt. Our results of operations and financial condition could be adversely impacted if we are unable to successfully manage such controls and restrictions, continue existing business operations and repatriate earnings from overseas, or if new or increased tariffs, quotas, exchange or price controls, trade barriers or similar restrictions are imposed on our business.
Additionally, our business, operations or employees may be adversely affected by political volatility, labor market disruptions or other crises or vulnerabilities in individual countries or regions, including political instability or upheaval, broad economic instability or sovereign risk related to a default by or deterioration in the credit worthiness of local governments, particularly in emerging markets.
Uncertain global economic conditions may adversely impact demand for our products or cause our customers and other business partners to suffer financial hardship, which could adversely impact our business.
Our business could be negatively impacted by reduced demand for our products related to one or more significant local, regional or global economic disruptions, such as: a slow-down in the general economy; reduced market growth rates; tighter credit markets for our suppliers, vendors or customers; a significant shift in government policies; or the inability to conduct day-to-day transactions through our financial intermediaries to pay funds to or collect funds from our customers, vendors and suppliers. Additionally, economic conditions may cause our suppliers, distributors, contractors or other third-party partners to suffer financial difficulties that they cannot overcome, resulting in their inability to provide us with the materials and services we need, in which case our business and results of operations could be adversely affected.
Customers may also suffer financial hardships due to economic conditions such that their accounts become uncollectible or are subject to longer collection cycles. In addition, if we are unable to generate sufficient income and cash flow, it could affect the Company’s ability to achieve expected share repurchase and dividend payments.
Disruptions in credit markets or changes to our credit ratings may reduce our access to credit.
A disruption in the credit markets or a downgrade of our current credit rating could increase our future borrowing costs and impair our ability to access capital and credit markets on terms commercially acceptable to us, which could adversely affect our liquidity and capital resources or significantly increase our cost of capital.
Disruption in our global supply chain may negatively impact our business results.
Our ability to meet our customers’ needs and achieve cost targets depends on our ability to maintain key manufacturing and supply arrangements, including execution of supply chain optimizations and certain sole supplier or sole manufacturing plant arrangements. The loss or disruption of such manufacturing and supply arrangements, including for issues such as labor disputes, loss or impairment of key manufacturing sites, discontinuity in our internal information and data systems, inability to procure sufficient raw or input materials, significant changes in trade policy, natural disasters, increasing severity or frequency of extreme weather events due to climate change or otherwise, acts of war or terrorism or other external factors over which we have no control, could interrupt product supply and, if not effectively managed and remedied, have an adverse impact on our business, financial condition or results of operations.
Our businesses face cost fluctuations and pressures that could affect our business results.
Our costs are subject to fluctuations, particularly due to changes in the prices of commodities and raw materials and the costs of labor, transportation, energy, pension and healthcare. Therefore, our business results are dependent, in part, on our continued ability to manage these fluctuations through pricing actions, cost saving projects and sourcing decisions, while maintaining and improving margins and market share. Failure to manage these fluctuations could adversely impact our financial results.
Our ability to meet our growth targets depends on successful product, marketing and operations innovation and successful responses to competitive innovation and changing consumer habits
.
We are a consumer products company that relies on continued global demand for our brands and products. Achieving our business results depends, in part, on successfully developing, introducing and marketing new products and on making significant improvements to our equipment and manufacturing processes. The success of such innovation depends on our ability to correctly anticipate customer and consumer acceptance and trends, to obtain, maintain and enforce necessary intellectual property protections and to avoid infringing upon the intellectual property rights of others. We
4
The Procter & Gamble Company
must also successfully respond to technological advances made by, and intellectual property rights granted to, competitors. Failure to continually innovate, improve and respond to competitive moves and changing consumer habits could compromise our competitive position and adversely impact our results.
The ability to achieve our business objectives is dependent on how well we can compete with our local and global competitors in new and existing markets and channels.
The consumer products industry is highly competitive. Across all of our categories, we compete against a wide variety of global and local competitors. As a result, we experience ongoing competitive pressures in the environments in which we operate, which may result in challenges in maintaining profit margins. To address these challenges, we must be able to successfully respond to competitive factors and emerging retail trends, including pricing, promotional incentives, product delivery windows and trade terms. In addition, evolving sales channels and business models may affect customer and consumer preferences as well as market dynamics, which, for example, may be seen in the growing consumer preference for shopping online and growth in hard discounter channels. Failure to successfully respond to competitive factors and emerging retail trends, and effectively compete in growing sales channels and business models, particularly e-commerce and mobile commerce applications, could negatively impact our results.
A significant change in customer relationships or in customer demand for our products could have a significant impact on our business.
We sell most of our products via retail customers, which include mass merchandisers, e-commerce, grocery stores, membership club stores, drug stores, department stores, distributors, wholesalers, baby stores, specialty beauty stores, high-frequency stores and pharmacies. Our success is dependent on our ability to successfully manage relationships with our retail trade customers, which includes our ability to offer trade terms that are mutually acceptable and are aligned with our pricing and profitability targets. Continued concentration among our retail customers could create significant cost and margin pressure on our business, and our business performance could suffer if we cannot reach agreement with a key customer on trade terms and principles. Our business could also be negatively impacted if a key customer were to significantly reduce the inventory level or shelf space of our products as a result of increased offerings of private label brands and generic non-branded products or for other reasons, significantly tighten product delivery windows or experience a significant business disruption.
If the reputation of the Company or one or more of our brands erodes significantly, it could have a material impact on our financial results.
The Company's reputation, and the reputation of our brands, form the foundation of our relationships with key stakeholders and other constituencies, including consumers, customers and suppliers. The quality and safety of our products are critical to our business. Many of our brands have worldwide
recognition and our financial success is directly dependent on the success of our brands. The success of our brands can suffer if our marketing plans or product initiatives do not have the desired impact on a brand's image or its ability to attract consumers. Our results could also be negatively impacted if one of our brands suffers substantial harm to its reputation due to a significant product recall, product-related litigation, defects or impurities in our products, product misuse, changing consumer perceptions of certain ingredients or environmental impacts, allegations of product tampering or the distribution and sale of counterfeit products. Additionally, negative or inaccurate postings or comments on social media or networking websites about the Company or one of its brands could generate adverse publicity that could damage the reputation of our brands or the Company. If we are unable to effectively manage real or perceived issues, including concerns about safety, quality, ingredients, efficacy, environmental impacts or similar matters, sentiments toward the Company or our products could be negatively impacted and our financial results could suffer. Our Company also devotes time and resources to citizenship efforts that are consistent with our corporate values and are designed to strengthen our business and protect and preserve our reputation, including programs driving ethics and corporate responsibility, strong communities, diversity and inclusion, gender equality and environmental sustainability. If these programs are not executed as planned or suffer negative publicity, the Company's reputation and financial results could be adversely impacted.
We rely on third parties in many aspects of our business, which creates additional risk.
Due to the scale and scope of our business, we must rely on relationships with third parties, including our suppliers, distributors, contractors, commercial banks, joint venture partners and external business partners, for certain functions. If we are unable to effectively manage our third-party relationships and the agreements under which our third-party partners operate, our financial results could suffer. Additionally, while we have policies and procedures for managing these relationships, they inherently involve a lesser degree of control over business operations, governance and compliance, thereby potentially increasing our financial, legal, reputational and operational risk.
An information security or operational technology incident, including a cybersecurity breach, or the failure of one or more key information or operations technology systems, networks, hardware, processes, and/or associated sites owned or operated by the Company or one of its service providers could have a material adverse impact on our business or reputation.
As part of the Company’s regular review of potential risks, we maintain an information and operational technology (“IT/OT”) risk management program that is primarily supervised by information technology management and reviewed by internal cross-functional stakeholders. As part of this program, analyses of emerging cybersecurity threats as well as the Company’s plans and strategies to address them are regularly prepared and presented to senior management, the Audit
The Procter & Gamble Company
5
Committee and the Board of Directors. Despite our policies, procedures and programs, including this IT/OT risk management program, we may not be effective in identifying and mitigating every risk to which we are exposed.
We rely extensively on IT/OT systems, networks and services, including internet and intranet sites, data hosting and processing facilities and technologies, physical security systems and other hardware, software and technical applications and platforms, many of which are managed, hosted, provided and/or used by third parties or their vendors, to assist in conducting our business. The various uses of these IT/OT systems, networks and services include, but are not limited to:
|
•
|
ordering and managing materials from suppliers;
|
|
•
|
converting materials to finished products;
|
|
•
|
shipping products to customers;
|
|
•
|
marketing and selling products to consumers;
|
|
•
|
collecting, transferring, storing and/or processing customer, consumer, employee, vendor, investor, and other stakeholder information and personal data, including such data from citizens of the European Union who are covered by the General Data Protection Regulation (“GDPR”);
|
|
•
|
summarizing and reporting results of operations, including financial reporting;
|
|
•
|
managing our banking and other cash liquidity systems and platforms;
|
|
•
|
hosting, processing and sharing, as appropriate, confidential and proprietary research, business plans and financial information;
|
|
•
|
collaborating via an online and efficient means of global business communications;
|
|
•
|
complying with regulatory, legal and tax requirements;
|
|
•
|
providing data security; and
|
|
•
|
handling other processes necessary to manage our business.
|
Numerous and evolving information security threats, including advanced persistent cybersecurity threats, pose a risk to the security of our services, systems, networks and supply chain, as well as to the confidentiality, availability and integrity of our data and of our critical business operations. As cybersecurity threats rapidly evolve in sophistication and become more prevalent across the industry globally, the Company is continually increasing its attention to these threats. We assess potential threats and vulnerabilities and make investments seeking to address them, including ongoing monitoring and updating of networks and systems, increasing specialized information security skills, deploying employee security training, and updating security policies for the Company and its third-party providers. However, because the techniques, tools and tactics used in cyber attacks frequently change and may be difficult to detect for periods of time, we may face difficulties in anticipating and implementing adequate preventative measures or fully mitigating harms after such an attack.
Our IT/OT databases and systems and our third-party providers’ databases and systems have been, and will likely continue to be, subject to advanced computer viruses or other
malicious codes, ransomware, unauthorized access attempts, denial of service attacks, phishing, social engineering, hacking and other cyber-attacks. Such attacks may originate from nation states or attempts by outside parties, hackers, criminal organizations or other threat actors. To date, we have seen no material impact on our business or operations from these attacks; however, we cannot guarantee that our security efforts or the security efforts of our third-party providers will prevent material breaches, operational incidents or other breakdowns to our or our third-party providers’ IT/OT databases or systems.
Periodically, we also need to upgrade our IT/OT systems or adopt new technologies. If such a new system or technology does not function properly or otherwise exposes us to increased cybersecurity breaches and failures, it could affect our ability to order materials, make and ship orders, and process payments in addition to other operational and information integrity and loss issues. Further, if the IT/OT systems, networks or service providers we rely upon fail to function properly or cause operational outages or aberrations, or if we or one of our third-party providers suffer significant unavailability of key operations, or inadvertent disclosure of, lack of integrity of, or loss of our sensitive business or stakeholder information, due to any number of causes, ranging from catastrophic events or power outages to improper data handling, security incidents or employee error or malfeasance, and our business continuity plans do not effectively address these failures on a timely basis, we may be exposed to reputational, competitive, operational, financial and business harm as well as litigation and regulatory action. The costs and operational consequences of responding to the above items and implementing remediation measures could be significant and could adversely impact our results.
Changing political conditions could adversely impact our business and financial results.
Changes in the political conditions in markets in which we manufacture, sell or distribute our products may be difficult to predict and may adversely affect our business and financial results. For example, the United Kingdom’s decision to leave the European Union has created uncertainty regarding, among other things, the U.K.'s future legal and economic framework and how the U.K. will interact with other countries, including with respect to the free movement of goods, services, capital and people. In addition, results of elections, referendums or other political processes in certain markets in which our products are manufactured, sold or distributed could create uncertainty regarding how existing governmental policies, laws and regulations may change, including with respect to sanctions, taxes, the movement of goods, services, capital and people between countries and other matters. The potential implications of such uncertainty, which include, among others, exchange rate fluctuations, trade barriers and market contraction, could adversely affect the Company’s business and financial results.
We must successfully manage compliance with laws and regulations, as well as manage new and pending legal and regulatory matters in the U.S. and abroad.
Our business is subject to a wide variety of laws and regulations across all of the countries in which we do business, including
6
The Procter & Gamble Company
those laws and regulations involving intellectual property, product liability, marketing, antitrust, data protection, environmental (including climate, water, waste), employment, anti-bribery, anti-corruption, tax, accounting and financial reporting or other matters. Rapidly changing laws, regulations and related interpretations, as well as increased enforcement actions, create challenges for the Company, including our compliance and ethics programs, and may alter the environment in which we do business, which could adversely impact our financial results. If we are unable to continue to meet these challenges and comply with all laws, regulations and related interpretations, it could negatively impact our reputation and our business results. Failure to successfully manage regulatory and legal matters and resolve such matters without significant liability or damage to our reputation may materially adversely impact our results of operations and financial position. Furthermore, if pending legal or regulatory matters result in fines or costs in excess of the amounts accrued to date, that may also materially impact our results of operations and financial position.
Changes in applicable tax regulations and resolutions of tax disputes could negatively affect our financial results.
The Company is subject to taxation in the U.S. and numerous foreign jurisdictions. Changes in the various tax laws can and do occur. For example, on December 22, 2017, the U.S. government enacted comprehensive tax legislation commonly referred to as the Tax Cuts and Jobs Act (the “U.S. Tax Act”). The changes included in the U.S. Tax Act are broad and complex. The final transition impacts of the U.S. Tax Act may differ from the estimates provided elsewhere in this report, possibly materially, due to, among other things, changes in interpretations of the U.S. Tax Act, any regulatory guidance or legislative action to address questions that arise because of the U.S. Tax Act or any updates or changes to estimates the Company has utilized to calculate the transition impacts, including impacts from changes to current year earnings estimates.
Additionally, longstanding international tax norms that determine each country’s jurisdiction to tax cross-border international trade are evolving
as a result of the Base Erosion and Profit Shifting reporting requirements (“BEPS") recommended by the G8, G20 and Organization for Economic Cooperation and Development ("OECD"). As these and other tax laws and related regulations change, our financial results could be materially impacted. Given the unpredictability of these possible changes and their potential interdependency, it is very difficult to assess whether the overall effect of such potential tax changes would be cumulatively positive or negative for our earnings and cash flow, but such changes could adversely impact our financial results.
Furthermore, we are subject to regular review and audit by both foreign and domestic tax authorities. While we believe our tax positions will be sustained, the final outcome of tax audits and related litigation, including maintaining our intended tax treatment of divestiture transactions such as the fiscal 2017 Beauty Brands transaction with Coty, may differ materially from the tax amounts recorded in our Consolidated Financial
Statements, which could adversely impact our cash flows and financial results.
We must successfully manage ongoing acquisition, joint venture and divestiture activities.
As a company that manages a portfolio of consumer brands, our ongoing business model includes a certain level of acquisition, joint venture and divestiture activities. We must be able to successfully manage the impacts of these activities, while at the same time delivering against our business objectives. Specifically, our financial results could be adversely impacted by the dilutive impacts from the loss of earnings associated with divested brands or dissolution of joint ventures such as the termination of the PGT Healthcare partnership between the Company and Teva Pharmaceutical Industries. Our financial results could also be impacted by acquisitions or joint venture activities, such as the planned acquisition of Merck KGaA's Consumer Health business, if: 1) changes in the cash flows or other market-based assumptions cause the value of acquired assets to fall below book value, or 2) we are not able to deliver the expected cost and growth synergies associated with such acquisitions and joint ventures, including as a result of integration and collaboration challenges, which could also have an impact on goodwill and intangible assets.
Our business results depend on our ability to successfully manage productivity improvements and ongoing organizational change.
Our financial projections assume certain ongoing productivity improvements and cost savings, including staffing adjustments as well as employee departures. Failure to deliver these planned productivity improvements and cost savings, while continuing to invest in business growth, could adversely impact our financial results. Additionally, successfully executing organizational change, including management transitions at leadership levels of the Company and motivation and retention of key employees, is critical to our business success. Factors that may affect our ability to attract and retain sufficient numbers of qualified employees include employee morale, our reputation, competition from other employers and availability of qualified personnel. Our success is dependent on identifying, developing and retaining key employees to provide uninterrupted leadership and direction for our business. This includes developing and retaining organizational capabilities in key growth markets where the depth of skilled or experienced employees may be limited and competition for these resources is intense, as well as continuing the development and execution of robust leadership succession plans.
Item 1B.
Unresolved Staff Comments.
None.
The Procter & Gamble Company
7
Item 2.
Properties.
In the U.S., we own and operate 25 manufacturing sites located in 19 different states. In addition, we own and operate 85 manufacturing sites in 37 other countries. Many of the domestic and international sites manufacture products for multiple businesses.
Beauty
products are manufactured at 24 of these locations;
Grooming
products at 20;
Health Care
products at 18;
Fabric & Home Care
products at 41; and
Baby, Feminine & Family Care
at 39. We own our Corporate headquarters in Cincinnati, Ohio. We own or lease our principal regional general offices in Switzerland, Panama, Singapore and China. We own or lease our principal regional shared service centers in Costa Rica, the United Kingdom and the Philippines. Management believes that the Company's sites are adequate to support the business and that the properties and equipment have been well maintained.
Item 3.
Legal Proceedings.
The Company is subject, from time to time, to certain legal proceedings and claims arising out of our business, which cover a wide range of matters, including antitrust and trade regulation, product liability, advertising, contracts, environmental issues, patent and trademark matters, labor and employment matters and tax. See Note 12 to our Consolidated Financial Statements for information on certain legal proceedings for which there are contingencies.
This item should be read in conjunction with the Company's Risk Factors in Part I, Item 1A for additional information.
Item 4.
Mine Safety Disclosure.
Not applicable.
8
The Procter & Gamble Company
EXECUTIVE OFFICERS OF THE REGISTRANT
The names, ages and positions held by the Executive Officers of the Company on
August 7, 2018
, are:
|
Name
|
Position
|
Age
|
First Elected to
Officer Position
|
|||
|
David S. Taylor
|
Chairman of the Board, President and Chief Executive Officer
|
60
|
2013
|
|||
|
Jon R. Moeller
|
Vice Chairman and Chief Financial Officer
|
54
|
2009
|
|||
|
Steven D. Bishop
|
Group President - Global Health Care
|
54
|
2016
|
|||
|
Mary Lynn Ferguson-McHugh
|
Group President - Global Family Care and P&G Ventures
|
58
|
2016
|
|||
|
Carolyn M. Tastad
|
Group President - North America Selling and Market Operations
|
57
|
2014
|
|||
|
Gary A. Coombe
|
President - Global Grooming
|
54
|
2014
|
|||
|
Kathleen B. Fish
|
Chief Research, Development and Innovation Officer
|
61
|
2014
|
|||
|
Fama Francisco
|
President - Global Baby Care and Baby and Feminine Care Sector
|
50
|
2018
|
|||
|
M. Tracey Grabowski
|
Chief Human Resources Officer
|
50
|
2018
|
|||
|
Shailesh Jejurikar
|
President - Global Fabric Care and Fabric & Home Care Sector
|
51
|
2018
|
|||
|
R. Alexandra Keith
|
President - Global Hair Care and Beauty Sector
|
50
|
2017
|
|||
|
Deborah P. Majoras
|
Chief Legal Officer and Secretary
|
54
|
2010
|
|||
|
Juan Fernando Posada
|
President - Latin America Selling and Market Operations
|
56
|
2015
|
|||
|
Matthew Price
|
President - Greater China Selling and Market Operations
|
52
|
2015
|
|||
|
Marc S. Pritchard
|
Chief Brand Officer
|
58
|
2008
|
|||
|
Loïc Tassel
|
President - Europe Selling and Market Operations
|
51
|
2018
|
|||
|
Jeffrey K. Schomburger
|
Global Sales Officer
|
56
|
2015
|
|||
|
Valarie L. Sheppard
|
Senior Vice President, Comptroller and Treasurer
|
54
|
2005
|
|||
|
Yannis Skoufalos
|
Global Product Supply Officer
|
61
|
2011
|
|||
|
Magesvaran Suranjan
|
President - Asia Pacific Selling and Market Operations and India, Middle East and Africa (IMEA) Selling and Market Operations
|
48
|
2015
|
|||
All the Executive Officers named above have been employed by the Company for more than the past five years.
The Procter & Gamble Company
9
Item 5.
Market for Registrant's Common Equity, Related Stockholder Matters and Issuer Purchases of Equity Securities.
ISSUER PURCHASES OF EQUITY SECURITIES
|
Period
|
Total Number of
Shares Purchased
(1
)
|
Average Price
Paid per Share
(2)
|
Total Number of
Shares Purchased as
Part of Publicly
Announced Plans or
Programs
(3)
|
Approximate Dollar Value of Shares that May Yet Be Purchased Under Our Share Repurchase Program
|
||||
|
4/1/2018 - 4/30/2018
|
6,119,071
|
$76.82
|
6,119,071
|
(3)
|
||||
|
5/1/2018 - 5/31/2018
|
6,160,881
|
73.04
|
6,160,881
|
(3)
|
||||
|
6/1/2018 - 6/30/2018
|
5,914,776
|
76.08
|
5,914,776
|
(3)
|
||||
|
Total
|
18,194,728
|
$75.30
|
18,194,728
|
(3)
|
||||
|
(1)
|
All transactions were made in the open market with large financial institutions. This table excludes shares withheld from employees to satisfy minimum tax withholding requirements on option exercises and other equity-based transactions. The Company administers cashless exercises through an independent third party and does not repurchase stock in connection with cashless exercises.
|
|
(2)
|
Average price paid per share is calculated on a settlement basis and excludes commission.
|
|
(3)
|
On April 19, 2018, the Company stated that in fiscal year 2018 the Company expected to reduce outstanding shares through direct share repurchases at a value of approximately $6 to $8 billion, notwithstanding any purchases under the Company's compensation and benefit plans. The share repurchases were authorized pursuant to a resolution issued by the Company's Board of Directors and were financed through a combination of operating cash flows and issuance of long-term and short-term debt. The total value of the shares purchased under the share repurchase plan was $7.0 billion. The share repurchase plan ended on
June 30, 2018
.
|
Additional information required by this item can be found in Part III, Item 12 of this Form 10-K.
SHAREHOLDER RETURN PERFORMANCE GRAPHS
SHAREHOLDER RETURN PERFORMANCE GRAPHS
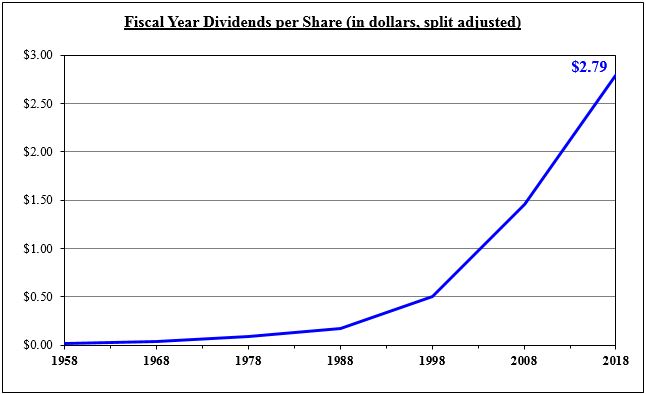
Market and Dividend Information
P&G has been paying a dividend for 128 consecutive years since its original incorporation in 1890 and has increased its dividend for 62 consecutive years. Over the past five years, the dividend has increased at an annual compound average rate of 4%. Nevertheless, as in the past, further dividends will be considered after reviewing dividend yields, profitability expectations and financing needs and will be declared at the discretion of the Company's Board of Directors.
|
(in dollars; split-adjusted)
|
1958
|
1968
|
1978
|
1988
|
1998
|
2008
|
2018
|
|||||||
|
Dividends per share
|
$
|
0.02
|
$
|
0.04
|
$
|
0.08
|
$
|
0.17
|
$
|
0.51
|
$
|
1.45
|
$
|
2.79
|
10
The Procter & Gamble Company
Quarterly Dividends
|
Quarter ended
|
2017 - 2018
|
2016 - 2017
|
|||||
|
September 30
|
$
|
0.6896
|
|
$
|
0.6695
|
|
|
|
December 31
|
0.6896
|
|
0.6695
|
|
|||
|
March 31
|
0.6896
|
|
0.6695
|
|
|||
|
June 30
|
0.7172
|
|
0.6896
|
|
|||
Common Stock Price Range
|
Quarter ended
|
2017 - 2018
|
2016 - 2017
|
|||||||||||||
|
High
|
Low
|
High
|
Low
|
||||||||||||
|
September 30
|
$
|
94.67
|
|
$
|
86.31
|
|
$
|
90.22
|
|
$
|
84.32
|
|
|||
|
December 31
|
93.51
|
|
85.43
|
|
90.32
|
|
81.18
|
|
|||||||
|
March 31
|
91.92
|
|
75.81
|
|
92.00
|
|
83.24
|
|
|||||||
|
June 30
|
79.51
|
|
70.74
|
|
91.13
|
|
85.52
|
|
|||||||
P&G trades on the New York Stock Exchange and NYSE Euronext-Paris under the stock symbol PG. There were approximately 3.2
million
common stock shareowners, including shareowners of record, participants in the P&G Direct Stock Purchase Plan, participants in P&G stock ownership plans and beneficial owners with accounts at banks and brokerage firms, as of
June 30, 2018
.
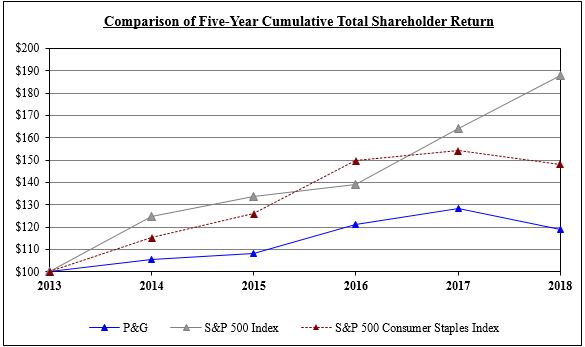
Shareholder Return
The following graph compares the cumulative total return of P&G’s common stock for the five-year period ended
June 30, 2018
, against the cumulative total return of the S&P 500 Stock Index (broad market comparison) and the S&P 500 Consumer Staples Index (line of business comparison). The graph and table assume $100 was invested on June 30, 2013, and that all dividends were reinvested.
|
Cumulative Value of $100 Investment, through June 30
|
||||||||||||||||||
|
Company Name/Index
|
2013
|
2014
|
2015
|
2016
|
2017
|
2018
|
||||||||||||
|
P&G
|
$
|
100
|
|
$
|
105
|
|
$
|
108
|
|
$
|
121
|
|
$
|
128
|
|
$
|
119
|
|
|
S&P 500 Index
|
100
|
|
125
|
|
134
|
|
139
|
|
164
|
|
188
|
|
||||||
|
S&P 500 Consumer Staples Index
|
100
|
|
115
|
|
126
|
|
150
|
|
154
|
|
148
|
|
||||||
The Procter & Gamble Company
11
Item 6.
Selected Financial Data.
The information required by this item is incorporated by reference to Note 1 and Note 2 to our Consolidated Financial Statements. For further details behind the business drivers for recent results presented below, see the Management's Discussion and Analysis.
Financial Summary (Unaudited)
|
Amounts in millions, except per share amounts
|
2018
|
2017
|
2016
|
2015
|
2014
|
2013
|
|||||||||||||||||
|
Net sales
|
$
|
66,832
|
|
$
|
65,058
|
|
$
|
65,299
|
|
$
|
70,749
|
|
$
|
74,401
|
|
$
|
73,910
|
|
|||||
|
Gross profit
|
32,564
|
|
32,523
|
|
32,390
|
|
33,693
|
|
35,371
|
|
35,858
|
|
|||||||||||
|
Operating income
|
13,711
|
|
13,955
|
|
13,441
|
|
11,049
|
|
13,910
|
|
13,051
|
|
|||||||||||
|
Net earnings from continuing operations
|
9,861
|
|
10,194
|
|
10,027
|
|
8,287
|
|
10,658
|
|
10,346
|
|
|||||||||||
|
Net earnings/(loss) from discontinued operations
|
—
|
|
5,217
|
|
577
|
|
(1,143
|
)
|
1,127
|
|
1,056
|
|
|||||||||||
|
Net earnings attributable to Procter & Gamble
|
9,750
|
|
15,326
|
|
10,508
|
|
7,036
|
|
11,643
|
|
11,312
|
|
|||||||||||
|
Net earnings margin from continuing operations
|
14.8
|
%
|
15.7
|
%
|
15.4
|
%
|
11.7
|
%
|
14.3
|
%
|
14.0
|
%
|
|||||||||||
|
Basic net earnings per common share:
(1)
|
|||||||||||||||||||||||
|
Earnings from continuing operations
|
$
|
3.75
|
|
$
|
3.79
|
|
$
|
3.59
|
|
$
|
2.92
|
|
$
|
3.78
|
|
$
|
3.65
|
|
|||||
|
Earnings/(loss) from discontinued operations
|
—
|
|
2.01
|
|
0.21
|
|
(0.42
|
)
|
0.41
|
|
0.39
|
|
|||||||||||
|
Basic net earnings per common share
|
$
|
3.75
|
|
$
|
5.80
|
|
$
|
3.80
|
|
$
|
2.50
|
|
$
|
4.19
|
|
$
|
4.04
|
|
|||||
|
Diluted net earnings per common share:
(1)
|
|||||||||||||||||||||||
|
Earnings from continuing operations
|
$
|
3.67
|
|
$
|
3.69
|
|
$
|
3.49
|
|
$
|
2.84
|
|
$
|
3.63
|
|
$
|
3.50
|
|
|||||
|
Earnings/(loss) from discontinued operations
|
—
|
|
1.90
|
|
0.20
|
|
(0.40
|
)
|
0.38
|
|
0.36
|
|
|||||||||||
|
Diluted net earnings per common share
|
$
|
3.67
|
|
$
|
5.59
|
|
$
|
3.69
|
|
$
|
2.44
|
|
$
|
4.01
|
|
$
|
3.86
|
|
|||||
|
Dividends per common share
|
$
|
2.79
|
|
$
|
2.70
|
|
$
|
2.66
|
|
$
|
2.59
|
|
$
|
2.45
|
|
$
|
2.29
|
|
|||||
|
Research and development expense
|
$
|
1,908
|
|
$
|
1,874
|
|
$
|
1,879
|
|
$
|
1,991
|
|
$
|
1,910
|
|
$
|
1,867
|
|
|||||
|
Advertising expense
|
7,103
|
|
7,118
|
|
7,243
|
|
7,180
|
|
7,867
|
|
8,188
|
|
|||||||||||
|
Total assets
|
118,310
|
|
120,406
|
|
127,136
|
|
129,495
|
|
144,266
|
|
139,263
|
|
|||||||||||
|
Capital expenditures
|
3,717
|
|
3,384
|
|
3,314
|
|
3,736
|
|
3,848
|
|
4,008
|
|
|||||||||||
|
Long-term debt
|
20,863
|
|
18,038
|
|
18,945
|
|
18,327
|
|
19,807
|
|
19,111
|
|
|||||||||||
|
Shareholders' equity
|
$
|
52,883
|
|
$
|
55,778
|
|
$
|
57,983
|
|
$
|
63,050
|
|
$
|
69,976
|
|
$
|
68,709
|
|
|||||
|
(1)
|
Basic net earnings per common share and Diluted net earnings per common share are calculated based on Net earnings attributable to Procter & Gamble.
|
12
The Procter & Gamble Company
Item 7.
Management's Discussion and Analysis of Financial Condition and Results of Operations.
Management's Discussion and Analysis
Forward-Looking Statements
Certain statements in this report, other than purely historical information, including estimates, projections, statements relating to our business plans, objectives, and expected operating results, and the assumptions upon which those statements are based, are “forward-looking statements” within the meaning of the Private Securities Litigation Reform Act of 1995, Section 27A of the Securities Act of 1933 and Section 21E of the Securities Exchange Act of 1934. Forward-looking statements may appear throughout this report, including without limitation, the following sections: “Management's Discussion and Analysis” and “Risk Factors.” These forward-looking statements generally are identified by the words “believe,” “project,” “expect,” “anticipate,” “estimate,” “intend,” “strategy,” “future,” “opportunity,” “plan,” “may,” “should,” “will,” “would,” “will be,” “will continue,” “will likely result,” and similar expressions. Forward-looking statements are based on current expectations and assumptions, which are subject to risks and uncertainties that may cause results to differ materially from those expressed or implied in the forward-looking statements. A detailed discussion of risks and uncertainties that could cause actual results and events to differ materially from those projected herein is included, without limitation, in the section titled "Economic Conditions and Uncertainties" and the section titled “Risk Factors” (Part I, Item 1A of this Form 10-K). We undertake no obligation to update or revise publicly any forward-looking statements, whether because of new information, future events or otherwise.
The purpose of Management's Discussion and Analysis (MD&A) is to provide an understanding of Procter & Gamble's financial condition, results of operations and cash flows by focusing on changes in certain key measures from year to year. The MD&A is provided as a supplement to, and should be read in conjunction with, our Consolidated Financial Statements and accompanying notes. The MD&A is organized in the following sections:
|
•
|
Overview
|
|
•
|
Summary of
2018
Results
|
|
•
|
Economic Conditions and Uncertainties
|
|
•
|
Results of Operations
|
|
•
|
Segment Results
|
|
•
|
Cash Flow, Financial Condition and Liquidity
|
|
•
|
Significant Accounting Policies and Estimates
|
|
•
|
Other Information
|
Throughout the MD&A we refer to measures used by management to evaluate performance, including unit volume growth, net sales and net earnings. We also refer to a number of financial measures that are not defined under accounting principles generally accepted in the United States of America (U.S. GAAP), including organic sales growth, core earnings per share (Core EPS), adjusted free cash flow and adjusted free cash flow productivity. Organic sales growth is net sales
growth excluding the impacts of acquisitions, divestitures, foreign exchange and India Goods and Services tax changes from year-over-year comparisons. Core EPS is diluted net earnings per share from continuing operations excluding certain items that are not judged to be part of the Company's sustainable results or trends. Adjusted free cash flow is operating cash flow less capital spending and certain divestiture impacts. Adjusted free cash flow productivity is the ratio of adjusted free cash flow to net earnings excluding certain one-time items. We believe these measures provide our investors with additional information about our underlying results and trends, as well as insight to some of the metrics used to evaluate management. The explanation at the end of the MD&A provides more details on the use and the derivation of these measures.
Management also uses certain market share and market consumption estimates to evaluate performance relative to competition despite some limitations on the availability and comparability of share and consumption information. References to market share and consumption in the MD&A are based on a combination of vendor purchased traditional brick-and-mortar and online data in key markets as well as internal estimates. All market share references represent the percentage of sales in dollar terms on a constant currency basis of our products, relative to all product sales in the category. The Company measures fiscal-year-to-date market shares through the most recent period for which market share data is available, which typically reflects a lag time of one or two months.
OVERVIEW
P&G is a global leader in the fast-moving consumer goods industry, focused on providing branded consumer packaged goods of superior quality and value to our consumers around the world. Our products are sold in more than
180
countries and territories primarily through mass merchandisers, e-commerce, grocery stores, membership club stores, drug stores, department stores, distributors, baby stores, specialty beauty stores, high-frequency stores and pharmacies. We have on-the-ground operations in approximately
70
countries.
Our market environment is highly competitive with global, regional and local competitors. In many of the markets and industry segments in which we sell our products, we compete against other branded products, as well as retailers' private-label brands. Additionally, many of the product segments in which we compete are differentiated by price tiers (referred to as super-premium, premium, mid-tier and value-tier products). We are well positioned in the industry segments and markets in which we operate, often holding a leadership or significant market share position.
The Procter & Gamble Company
13
ORGANIZATIONAL STRUCTURE
Our organizational structure is comprised of Global Business Units (GBUs), Selling and Market Operations (SMOs), Global Business Services (GBS) and Corporate Functions (CF).
Global Business Units
Our GBUs are organized into ten product categories. Under U.S. GAAP, the GBUs underlying the ten product categories are aggregated into five reportable segments:
Beauty
;
Grooming
;
Health Care
;
Fabric & Home Care
; and
Baby, Feminine & Family Care
. The GBUs are responsible for developing overall brand strategy, new product upgrades and innovations and marketing plans. The following provides additional detail on our reportable segments and the ten product categories and brand composition within each segment.
|
Reportable Segments
|
% of
Net Sales
(1)
|
% of Net
Earnings
(1)
|
Product Categories (Sub-Categories)
|
Major Brands
|
|
Beauty
|
19%
|
23%
|
Hair Care (
Conditioner, Shampoo, Styling Aids, Treatments
)
|
Head & Shoulders, Pantene, Rejoice
|
|
Skin and Personal Care (
Antiperspirant and Deodorant, Personal Cleansing, Skin Care
)
|
Olay, Old Spice, Safeguard, SK-II
|
|||
|
Grooming
|
10%
|
14%
|
Grooming
(2)
(Shave Care -
Female Blades & Razors, Male Blades & Razors, Pre- and Post-Shave Products, Other Shave Care;
Appliances)
|
Braun, Fusion, Gillette, Mach3, Prestobarba, Venus
|
|
Health Care
|
12%
|
13%
|
Oral Care (
Toothbrushes, Toothpaste, Other Oral Care
)
|
Crest, Oral-B
|
|
Personal Health Care (
Gastrointestinal, Rapid Diagnostics, Respiratory, Vitamins/Minerals/Supplements, Other Personal Health Care
)
|
Metamucil, Prilosec, Vicks
|
|||
|
Fabric & Home Care
|
32%
|
27%
|
Fabric Care (
Fabric Enhancers, Laundry Additives, Laundry Detergents
)
|
Ariel, Downy, Gain, Tide
|
|
Home Care (
Air Care, Dish Care, P&G Professional, Surface Care
)
|
Cascade, Dawn, Febreze, Mr. Clean, Swiffer
|
|||
|
Baby, Feminine & Family Care
|
27%
|
23%
|
Baby Care (
Baby Wipes, Diapers and Pants
)
|
Luvs, Pampers
|
|
Feminine Care (
Adult Incontinence, Feminine Care
)
|
Always, Tampax
|
|||
|
Family Care (
Paper Towels, Tissues, Toilet Paper
)
|
Bounty, Charmin, Puffs
|
|||
|
(1)
|
Percent of Net sales and Net earnings from continuing operations for the year ended
June 30, 2018
(excluding results held in Corporate).
|
|
(2)
|
The Grooming product category is comprised of the Shave Care and Appliances GBUs.
|
Recent Developments:
During fiscal 2018, the Company entered into an agreement to acquire the over the counter (OTC) healthcare business of Merck KGaA for €3.375 billion ($3.9 billion based on current exchange rates). This business primarily sells OTC consumer healthcare products, mainly in Europe, Latin America and Asia markets. Total sales for the business during its most recent fiscal year were approximately $1 billion. We anticipate the transaction to close during fiscal 2019, with the timing subject to regulatory clearance and customary closing conditions. The Company also reached an agreement during fiscal 2018 to dissolve our PGT Healthcare partnership, a venture between the Company and Teva Pharmaceutical Industries, Ltd (Teva) in the OTC consumer healthcare business. Pursuant to the agreement, PGT product assets will return to the original respective parent companies to reestablish independent OTC businesses. This transaction was completed in July 2018 and will be accounted for as a sale of the Teva portion of the PGT business. The Company expects to record an after-tax gain on the sale of approximately $285 million.
During fiscal 2017, the Company completed the divestiture of four product categories, which included 43 of the Company's beauty brands ("Beauty Brands"), including the global salon professional hair care and color, retail hair color, cosmetics and the fine fragrance businesses, along with select hair styling brands. The Beauty Brands had historically been part of the Company’s Beauty reportable segment. The results of the Beauty Brands are presented as discontinued operations and, as such, are excluded from both continuing operations and segment results for all periods presented.
During fiscal 2016, the Company completed the divestiture of its Batteries business. The Batteries business had historically been part of the Company’s Fabric & Home Care reportable segment. The results of the Batteries business are presented as discontinued operations and, as such, are excluded from both continuing operations and segment results for all periods presented.
As a result of these divestitures, the Company's portfolio is comprised of 10 category-based businesses where P&G has
14
The Procter & Gamble Company
leading market positions, strong brands and consumer meaningful product technologies.
Refer to Note 13 to our Consolidated Financial Statements for more details on each of these divestiture transactions.
Beauty
:
We are a global market leader in the beauty category. Most of the beauty markets in which we compete are highly fragmented with a large number of global and local competitors. We compete in skin and personal care and in hair care. In skin and personal care, we offer a wide variety of products, ranging from deodorants to personal cleansing to skin care, such as our Olay brand, which is one of the top facial skin care brands in the world with nearly 6% global market share. We are the global market leader in the retail hair care market with over 20% global market share primarily behind our Pantene and Head & Shoulders brands.
Grooming
:
We compete in shave care and appliances. In Shave Care, we are the global market leader in the blades and razors market. Our global blades and razors market share is nearly 65%, primarily behind the Gillette franchise, including our Fusion, Mach3, Prestobarba and Venus brands. Our appliances, such as electric shavers and epilators, are sold under the Braun brand in a number of markets around the world where we compete against both global and regional competitors. We hold nearly 25% of the male shavers market and over 50% of the female epilators market.
Health Care
:
We compete in oral care and personal health care. In oral care, there are several global competitors in the market and we have the number two market share position with nearly 20% global market share behind our Oral-B and Crest brands. In personal health care, we are a top ten competitor in a large, highly fragmented industry, primarily behind respiratory treatments (Vicks brand), non-prescription heartburn medications (Prilosec OTC brand) and digestive wellness products (Metamucil, Pepto Bismol and Align brands). Nearly all of our sales outside the U.S. in personal health care are generated through the PGT Healthcare partnership with Teva Pharmaceuticals Ltd. In April 2018, we reached an agreement to dissolve the PGT Healthcare partnership and to acquire the OTC healthcare business of Merck KGaA as discussed above.
Fabric & Home Care
:
This segment is comprised of a variety of fabric care products, including laundry detergents, additives and fabric enhancers; and home care products, including dishwashing liquids and detergents, surface cleaners and air fresheners. In fabric care, we generally have the number one or number two market share position in the markets in which we compete and are the global market leader with over 25% global market share, primarily behind our Tide, Ariel and Downy brands. Our global home care market share is over 20% across the categories in which we compete.
Baby, Feminine & Family Care
:
In baby care, we are the global market leader and compete mainly in diapers, pants and baby wipes with over 25% global market share. We have the number one or number two market share position in most of the key markets in which we compete, primarily behind Pampers, the Company's largest brand, with annual net sales of more than $8 billion. We are the global market leader in the
feminine care category with over 25% global market share, primarily behind Always. We also compete in the adult incontinence category in certain markets, achieving over 10% market share in most of the markets where we compete. Our family care business is predominantly a North American business comprised largely of the Bounty paper towel and Charmin toilet paper brands. U.S. market shares are over 40% for Bounty and over 25% for Charmin.
Selling and Market Operations
Our SMOs are responsible for developing and executing go-to-market plans at the local level. The SMOs include dedicated retail customer, trade channel and country-specific teams. Our SMOs are organized under six regions, comprised of North America, Europe, Latin America, Asia Pacific, Greater China and India, Middle East and Africa (IMEA). Throughout the MD&A, we reference business results in developed markets, which are comprised of North America, Western Europe and Japan, and developing markets, which are all other markets not included in developed.
Corporate Functions
CF provides company-level strategy and portfolio analysis, corporate accounting, treasury, tax, external relations, governance, human resources and legal, as well as other centralized functional support.
Global Business Services
GBS provides technology, processes and standard data tools to enable the GBUs, the SMOs and Corporate Functions to better understand the business and better serve consumers and customers. The GBS organization is responsible for providing world-class solutions at a low cost and with minimal capital investment.
STRATEGIC FOCUS
P&G aspires to serve the world’s consumers better than our best competitors in every category and in every country in which we compete, and, as a result, deliver total shareholder return in the top one-third of our peer group. Delivering and sustaining leadership levels of shareholder value creation requires balanced top-line growth, bottom-line growth and strong cash generation.
Our strategic choices are focused on winning with consumers. The consumers who purchase and use our products are at the center of everything we do. We win with consumers by delivering superiority across the five key elements of product, packaging, brand communication, retail execution and value equation.
Winning with consumers around the world and against our best competitors requires innovation. Innovation has always been, and continues to be, P&G’s lifeblood. Innovation requires consumer insights and technology advancements that lead to product improvements, improved marketing and merchandising programs and game-changing inventions that create new brands and categories.
Productivity improvement is critical to delivering our balanced top-line growth, bottom-line growth and value creation objectives. Productivity improvement and sales growth reinforce and fuel each other. We are driving productivity
The Procter & Gamble Company
15
improvement across all elements of cost, including cost of goods sold, marketing and promotional expenses and non-manufacturing overhead. Productivity improvements and cost savings are being reinvested in product and packaging improvements, brand awareness-building advertising and trial-building sampling programs, increased sales coverage and R&D programs.
We are improving operational effectiveness and organizational culture through enhanced clarity of roles and responsibilities, accountability and incentive compensation programs.
The Company has undertaken an effort to focus and strengthen its business portfolio to compete in categories and with brands that are structurally attractive and that play to P&G's strengths. The ongoing portfolio of businesses consists of 10 product categories. These are categories where P&G has leading market positions, strong brands and consumer-meaningful product technologies.
We believe these strategies are right for the long-term health of the Company and our objective of delivering total shareholder return in the top one-third of our peer group.
The Company expects the delivery of the following long-term annual financial targets will result in total shareholder returns in the top third of the competitive peer group:
|
•
|
Organic sales growth above market growth rates in the categories and geographies in which we compete;
|
|
•
|
Core EPS growth of mid-to-high single digits; and
|
|
•
|
Adjusted free cash flow productivity of 90% or greater.
|
In periods with significant macroeconomic pressures, we intend to maintain a disciplined approach to investing so as not to sacrifice the long-term health of our businesses to meet short-term objectives in any given year.
SUMMARY OF 2018 RESULTS
|
Amounts in millions, except per share amounts
|
2018
|
Change vs. Prior Year
|
2017
|
Change vs. Prior Year
|
2016
|
||||||||||||
|
Net sales
|
$
|
66,832
|
|
3
|
%
|
$
|
65,058
|
|
—
|
%
|
$
|
65,299
|
|
||||
|
Operating income
|
13,711
|
|
(2
|
)%
|
13,955
|
|
4
|
%
|
13,441
|
|
|||||||
|
Net earnings from continuing operations
|
9,861
|
|
(3
|
)%
|
10,194
|
|
2
|
%
|
10,027
|
|
|||||||
|
Net earnings from discontinued operations
|
—
|
|
N/A
|
|
5,217
|
|
N/A
|
|
577
|
|
|||||||
|
Net earnings attributable to Procter & Gamble
|
9,750
|
|
(36
|
)%
|
15,326
|
|
46
|
%
|
10,508
|
|
|||||||
|
Diluted net earnings per common share
|
3.67
|
|
(34
|
)%
|
5.59
|
|
51
|
%
|
3.69
|
|
|||||||
|
Diluted net earnings per share from continuing operations
|
3.67
|
|
(1
|
)%
|
3.69
|
|
6
|
%
|
3.49
|
|
|||||||
|
Core earnings per share
|
4.22
|
|
8
|
%
|
3.92
|
|
7
|
%
|
3.67
|
|
|||||||
|
Cash flow from operating activities
|
14,867
|
|
17
|
%
|
12,753
|
|
(17
|
)%
|
15,435
|
|
|||||||
|
•
|
Net sales increased
3%
to
$66.8 billion
including a positive
2%
impact from foreign exchange.
|
|
◦
|
Organic sales increased
1%
on a
2%
increase in organic volume.
|
|
◦
|
Unit volume increased
1%
. Volume increased low single digits in Beauty, Health Care and Fabric & Home Care and was unchanged in Grooming. Volume decreased low single digits in Baby, Feminine & Family Care. Excluding the impact of minor brand divestitures, organic volume increased mid-single digits in Fabric & Home Care.
|
|
•
|
Net earnings from continuing operations decreased
$333 million
or
3%
in fiscal 2018, due primarily to the transitional impacts of the U.S. Tax Cuts and Jobs Act (U.S. Tax Act). Please refer to Note 5 to our Consolidated Financial Statements for further discussion on tax impacts. Operating income decreased 2% due to reduced margins, partially offset by net sales growth. This was largely offset by an increase in Other non-operating income/(expense), net, due to higher costs of early extinguishment of debt in the base period. Favorable foreign exchange impacts increased net earnings from continuing operations by approximately $125 million or 1%.
|
|
•
|
Net earnings from discontinued operations were zero in fiscal 2018 compared to
$5.2 billion
in fiscal 2017
|
primarily due to the net impact of a gain on the sale of our Beauty Brands business.
|
•
|
Net earnings attributable to Procter & Gamble were
$9.8 billion
, a decrease of
$5.6 billion
or
36%
versus the prior year primarily due to the aforementioned reduction in net earnings from discontinued operations.
|
|
•
|
Diluted net earnings per share decreased
34%
to
$3.67
.
|
|
◦
|
Diluted net earnings per share from continuing operations decreased 1% to
$3.67
.
|
|
◦
|
Core EPS increased
8%
to
$4.22
.
|
|
•
|
Cash flow from operating activities was
$14.9 billion
.
|
|
◦
|
Adjusted free cash flow was
$11.2 billion
.
|
|
◦
|
Adjusted free cash flow productivity was
104%
.
|
16
The Procter & Gamble Company
ECONOMIC CONDITIONS AND UNCERTAINTIES
We discuss expectations regarding future performance, events and outcomes, such as our business outlook and objectives, in annual and quarterly reports, press releases and other written and oral communications. All such statements, except for historical and present factual information, are "forward-looking statements" and are based on financial data and our business plans available only as of the time the statements are made, which may become out-of-date or incomplete. We assume no obligation to update any forward-looking statements as a result of new information, future events or other factors. Forward-looking statements are inherently uncertain and investors must recognize that events could be significantly different from our expectations. For more information on risks that could impact our results, refer to Item 1A Risk Factors in this Form 10-K.
Global Economic Conditions.
Current macroeconomic factors remain dynamic, and any causes of market size contraction, such as reduced GDP in commodity-dependent economies, greater political unrest in the Middle East, Central & Eastern Europe and the Korean peninsula, economic uncertainty related to the execution of the United Kingdom's exit from the European Union, political instability in certain Latin American markets and overall economic slowdowns, could reduce our sales or erode our operating margin, in either case reducing our earnings.
Changes in Costs.
Our costs are subject to fluctuations, particularly due to changes in commodity prices, transportation costs and our own productivity efforts. We have significant exposures to certain commodities, in particular certain oil-derived materials like resins and paper-based materials like pulp, and volatility in the market price of these commodity input materials has a direct impact on our costs. If we are unable to manage commodity and other cost fluctuations through pricing actions, cost savings projects and sourcing decisions, as well as through consistent productivity improvements, it may adversely impact our gross margin, operating margin and net earnings. Sales could also be adversely impacted following pricing actions if there is a negative impact on consumption of our products. We strive to implement, achieve and sustain cost improvement plans, including outsourcing projects, supply chain optimization and general overhead and workforce optimization. As discussed later in this MD&A, we initiated certain non-manufacturing overhead reduction projects along with manufacturing and other supply chain cost improvement projects in 2012. In fiscal 2017, we communicated specific elements of an additional multi-year cost reduction program which is resulting in enrollment reductions and other savings. If we are not successful in executing and sustaining these changes, there could be a negative impact on our operating margin and net earnings.
Foreign Exchange.
We have both translation and transaction exposure to the fluctuation of exchange rates. Translation exposures relate to exchange rate impacts of measuring income statements of foreign subsidiaries that do not use the U.S. dollar as their functional currency. Transaction exposures relate to 1) the impact from input costs that are denominated in a
currency other than the local reporting currency and 2) the revaluation of transaction-related working capital balances denominated in currencies other than the functional currency. Over previous fiscal years, the U.S. dollar has strengthened versus a number of foreign currencies leading to lower sales and earnings from these foreign exchange impacts. Certain countries experiencing significant exchange rate fluctuations, like Argentina, Egypt, Russia, Turkey and the United Kingdom have previously had, and could in the future have, a significant impact on our sales, costs and earnings. Increased pricing in response to certain fluctuations in foreign currency exchange rates may offset portions of the currency impacts but could also have a negative impact on consumption of our products, which would affect our sales and profits.
Government Policies.
Our net earnings could be affected by changes in U.S. or foreign government tax policies, for example, the U.S. Tax Act enacted in December 2017, the implications and uncertainties of which are disclosed elsewhere in this report. Additionally, we attempt to carefully manage our debt, currency and other exposures in certain countries with currency exchange, import authorization and pricing controls, such as Nigeria, Algeria and Egypt. Further, our earnings and sales could be affected by changes to international trade agreements in North America and elsewhere, including potential increases of import tariffs. Changes in government policies in these areas might cause an increase or decrease in our sales, operating margin and net earnings.
For information on risk factors that could impact our results, please refer to “Risk Factors” in Part I, Item 1A of this Form 10-K.
RESULTS OF OPERATIONS
The key metrics included in our discussion of our consolidated results of operations include net sales, gross margin, selling, general and administrative costs (SG&A), other non-operating items and income taxes. The primary factors driving year-over-year changes in net sales include overall market growth in the categories in which we compete, product initiatives, competitive activities (the level of initiatives and other activities by competitors), marketing spending and acquisition and divestiture activity, all of which drive changes in our underlying unit volume, as well as pricing actions (which can also indirectly impact volume), changes in product and geographic mix and foreign currency impacts on sales outside the U.S.
Most of our cost of products sold and SG&A are to some extent variable in nature. Accordingly, our discussion of these operating costs focuses primarily on relative margins rather than the absolute year-over-year changes in total costs. The primary drivers of changes in gross margin are input costs (energy and other commodities), pricing impacts, geographic mix (for example, gross margins in developed markets are generally higher than in developing markets for similar products), product mix (for example, the Beauty segment has higher gross margins than the Company average), foreign exchange rate fluctuations (in situations where certain input costs may be tied to a different functional currency than the
The Procter & Gamble Company
17
underlying sales), the impacts of manufacturing savings projects and reinvestments (for example, product or package improvements) and to a lesser extent scale impacts (for costs that are fixed or less variable in nature). The primary components of SG&A are marketing-related costs and non-manufacturing overhead costs. Marketing-related costs are primarily variable in nature, although we may achieve some level of scale benefit over time due to overall growth and other marketing efficiencies. Overhead costs are also variable in nature, but on a relative basis, less so than marketing costs due to our ability to leverage our organization and systems infrastructures to support business growth. Accordingly, we generally experience more scale-related impacts for these costs.
The Company is in the midst of a productivity and cost savings plan to reduce costs in the areas of supply chain, certain marketing activities and overhead expenses. The plan is designed to accelerate cost reductions by streamlining management decision making, manufacturing and other work processes to fund the Company's growth strategy.
Net Sales
Fiscal year 2018 compared with fiscal year 2017
Net sales increased
3%
to
$66.8 billion
in
2018
on a
1%
increase in unit volume versus the prior year. Volume increased low single digits in Beauty, Health Care and Fabric & Home Care and was unchanged in Grooming. Volume decreased low single
digits in Baby, Feminine and Family Care. Excluding the impact of minor brand divestitures, Fabric & Home Care organic volume increased mid-single digits.
Volume increased low single digits in developed and developing regions. Favorable foreign exchange increased net sales by 2%. Pricing had a negative 1% impact on net sales. Product mix had a positive 1% impact on net sales primarily due to a disproportionate growth in super-premium brands. Organic sales grew
1%
driven by a
2%
increase in organic volume.
Fiscal year 2017 compared with fiscal year 2016
Net sales were unchanged at $65.1 billion in 2017 on a 1% increase in unit volume versus the prior year period. Volume increased low single digits in Grooming, Health Care, Fabric & Home Care and Baby, Feminine & Family Care. Volume decreased low single digits in Beauty. Volume increased low single digits in developed regions and was unchanged in developing regions. Organic volume increased low single digits in both developed and developing markets. Unfavorable foreign exchange reduced net sales by 2%. Neither pricing nor mix had any net impact on net sales for the year. Organic sales grew 2% driven by a 2% increase in organic volume.
Operating Costs
|
Comparisons as a percentage of net sales; Years ended June 30
|
2018
|
Basis Point Change
|
2017
|
Basis Point Change
|
2016
|
|||||||||
|
Gross margin
|
48.7
|
%
|
(130
|
)
|
50.0
|
%
|
40
|
|
49.6
|
%
|
||||
|
Selling, general and administrative expense
|
28.2
|
%
|
(30
|
)
|
28.5
|
%
|
(50
|
)
|
29.0
|
%
|
||||
|
Operating margin
|
20.5
|
%
|
(100
|
)
|
21.5
|
%
|
90
|
|
20.6
|
%
|
||||
|
Earnings from continuing operations before income taxes
|
19.9
|
%
|
(50
|
)
|
20.4
|
%
|
(10
|
)
|
20.5
|
%
|
||||
|
Net earnings from continuing operations
|
14.8
|
%
|
(90
|
)
|
15.7
|
%
|
30
|
|
15.4
|
%
|
||||
|
Net earnings attributable to Procter & Gamble
|
14.6
|
%
|
(900
|
)
|
23.6
|
%
|
750
|
|
16.1
|
%
|
||||
Fiscal year 2018 compared with fiscal year 2017
Gross margin decreased
130
basis points to
48.7%
of net sales in
2018
. Gross margin benefited 200 basis points from total manufacturing cost savings (170 basis points net of product and packaging reinvestments). This was more than offset by:
|
•
|
a 90 basis-point negative impact due to higher commodity costs,
|
|
•
|
a 50 basis-point decline due to reduced pricing,
|
|
•
|
a 100 basis-point decline from unfavorable product mix (within segments due to the disproportionate growth of lower margin product forms, large sizes and club channels and between segments caused by the disproportionate volume growth in Fabric & Home Care, which has lower than company-average gross margins),
|
|
•
|
a 30 basis-point negative impact from higher restructuring charges and
|
|
•
|
a 30 basis-point negative impact from unfavorable foreign exchange.
|
Total SG&A increased
2%
to
$18.9 billion
driven by increased overhead and marketing spending, as well as an increase in other net operating expenses, primarily due to higher gains on real estate sales in the base period. SG&A as a percentage of net sales decreased 30 basis points to
28.2%
. Reductions in marketing and overhead spending as a percentage of net sales were partially offset by an increase in other net operating expenses.
|
•
|
Marketing spending as a percentage of net sales decreased 30 basis points, primarily driven by reductions in agency compensation and production costs.
|
|
•
|
Overhead costs as a percentage of net sales decreased 30 basis points, primarily driven by productivity savings and sales growth leverage, partially offset by higher restructuring costs versus the base year.
|
|
•
|
Other operating expenses as a percentage of net sales increased 30 basis points primarily due to gains on the sale of real estate in the base year.
|
18
The Procter & Gamble Company
Fiscal year 2017 compared with fiscal year 2016
Gross margin increased 40 basis points (bps) to 50.0% of net sales in
2017
. Gross margin increased primarily due to:
|
•
|
a 230 basis-point positive impact from total manufacturing cost savings (210 basis points net of product and packaging reinvestments),
|
|
•
|
a 20 basis-point benefit from lower restructuring charges and
|
|
•
|
a 10 basis-point benefit from positive scale impacts due to higher volume.
|
These impacts were partially offset by:
|
•
|
a 90 basis-point decrease from unfavorable product mix between segments (caused primarily by the lower relative proportion of sales in Grooming, which has higher than company-average gross margins) and within segments (due to disproportionate growth of lower margin products, forms and package sizes in certain businesses),
|
|
•
|
a 40 basis-point negative impact from unfavorable foreign exchange and
|
|
•
|
a combined 70 basis-point impact due to higher commodities and other costs.
|
Total SG&A decreased 2% to $18.6 billion as increased overhead and advertising spending were more than offset by a reduction in other operating expenses, primarily due to a reduction in net foreign exchange transactional costs and gains on real estate sales. SG&A as a percentage of net sales decreased 50 basis points to 28.5% as a result of the decline in other operating expenses.
|
•
|
Marketing spending as a percentage of net sales increased 10 basis points due to an increase in marketing activities, partially offset by productivity savings.
|
|
•
|
Overhead costs as a percentage of net sales increased 20 basis points, primarily driven by wage inflation and increased sales personnel in certain businesses, partially offset by 20 basis points of productivity savings.
|
|
•
|
Other operating expenses as a percent of net sales declined 80 basis points. Lower foreign exchange transactional charges reduced SG&A as a percentage of net sales by
|
approximately 20 basis points. The balance of the reduction is primarily driven by gains on sales of real estate.
Non-Operating Items
Fiscal year 2018 compared with fiscal year 2017
|
•
|
Interest expense was
$506 million
in
2018
, an increase of
$41 million
versus the prior year due to an increase in average long term debt balances and an increase in U.S. interest rates.
|
|
•
|
Interest income was
$247 million
in
2018
, an increase of
$76 million
versus the prior year primarily due to an increase in average balances of interest bearing cash and cash equivalents and investment securities balances and an increase in U.S. interest rates.
|
|
•
|
Other non-operating income/(expense), which consists primarily of divestiture gains, investment income and other non-operating items was a net expense of $126 million in 2018, an improvement of
$278 million
versus
|
the prior year primarily due to lower charges for the early extinguishment of debt (which totaled $346 million in the current year and $543 million in the base year) and an increase in minor brand divestiture gains. In the current year we had approximately $190 million in minor brand divestiture gains, including Swisse, Bold and other minor brands. In 2017, we had approximately $110 million in minor brand divestiture gains, including Hipoglos and other minor brands.
Fiscal year 2017 compared with fiscal year 2016
|
•
|
Interest expense was $465 million in
2017
, a decrease of $114 million versus the prior year due to a decrease in weighted average interest rates.
|
|
•
|
Interest income was $171 million in
2017
, comparable to 2016.
|
|
•
|
Other non-operating income/(expense), which consists primarily of divestiture gains, investment income and other non-operating items, was a net expense of $404 million in 2017 versus a net income of $325 million in 2016, a $729 million year-over-year decrease. This change is due to a $543 million current-year charge related to early extinguishment of long-term debt and a reduction in gains on minor brand divestitures. In
2017
, we had approximately $110 million in minor brand divestiture gains, including Hipoglos (a baby care brand sold primarily in Brazil) and other minor brands. The prior year divestiture activities included approximately $300 million in minor brand divestiture gains, including Escudo and certain hair care brands in Europe and IMEA.
|
Income Taxes
Fiscal year 2018 compared with fiscal year 2017
The effective tax rate on continuing operations increased
290
basis points to
26.0%
in 2018. A net transitional charge of
$602 million
resulting from the enactment of the U.S. Tax Act caused a 450 basis-point increase in the current period rate (see Note 5 to the Consolidated Financial Statements for further discussion). The remaining net decrease of 160 basis points in the effective rate was driven by:
|
•
|
a 280 basis-point year over year reduction from the ongoing impacts of the U.S. Tax Act, as the impact of the lower blended U.S. federal rate on current year earnings versus prior year rate was partially offset by reduced foreign tax credits versus prior year due to the inability to fully credit foreign taxes under the U.S. Tax Act,
|
|
•
|
a 170 basis-point reduction from favorable geographic mix of earnings, primarily due to a greater proportion of income in lower tax foreign jurisdictions,
|
|
•
|
a 180 basis-point increase from reduced favorable discrete impacts related to uncertain income tax positions (which netted to approximately 25 basis points in the current year versus 205 basis points in the prior year),
|
|
•
|
a 70 basis-point increase from reduced excess tax benefits from share-based compensation (60 basis points in the current year versus 130 basis points in the prior year) and
|
|
•
|
a 40 basis-point unfavorable impact due to reduced benefits from the tax impacts of early extinguishment of long-term debt (10 basis-point benefit in current year versus 50 basis-point benefit in the prior year).
|
The Procter & Gamble Company
19
Fiscal year 2017 compared with fiscal year 2016
The effective tax rate on continuing operations decreased 190 basis points to 23.1%. The rate declined due to:
|
•
|
a 130 basis-point impact from excess tax benefits associated with share-based payments due to the adoption of FASB Accounting Standards Update (ASU) 2016-09 Improvements to Employee Share-based Payment Accounting in 2017,
|
|
•
|
a 150 basis-point benefit from discrete impacts related to uncertain income tax positions (which netted to approximately 205 basis points in the current year versus 55 basis points in the prior year),
|
|
•
|
a 50 basis-point benefit from the tax impact of the early extinguishment of long-term debt and
|
|
•
|
a 130 basis-point benefit from the prior year establishment of a valuation allowance on deferred tax assets related to net operating loss carryforwards.
|
These benefits were partially offset by a 230 basis-point increase from unfavorable geographic mix, primarily due to a greater proportion of total income taxed in the U.S. and a 40 basis-point increase due to the impact of minor brand divestitures.
Net Earnings
Fiscal year 2018 compared with fiscal year 2017
Net earnings from continuing operations decreased 3% to
$9.9 billion
. Operating income decreased
$244 million
, or 2%, as the increase in net sales and decrease in SG&A as a percentage of net sales were more than offset by the reduction in gross margin. The increase in net non-operating income/(expense) discussed above benefited net earnings. Net earnings from continuing operations before taxes increased 1%. Increased income tax expense negatively impacted net earnings from continuing operations by approximately 4% due largely to the net charge for the transitional impact of the U.S. Tax Act in 2018. Foreign exchange had a positive impact of $125 million on net earnings in
2018
due to strengthening of certain currencies against the U.S. dollar, including those in the United Kingdom, China, Canada and Russia. This impact includes both transactional charges and translational impacts from converting earnings from foreign subsidiaries to U.S. dollars.
Net earnings from discontinued operations were zero in 2018. Net earnings from discontinued operations were
$5.2 billion
in 2017, primarily due to the gain on the sale of the Beauty Brands which closed on October 1, 2016 (see Note 13 to the Consolidated Financial Statements).
Net earnings attributable to Procter & Gamble decreased
$5.6 billion
, or
36%
, to
$9.8 billion
. The decrease was primarily due to the reduction in net earnings from discontinued operations.
Diluted net earnings per share from continuing operations declined
$0.02
, or
1%
, to
$3.67
due primarily to the reduction in net earnings from continuing operations, partially offset by a reduction in the number of weighted average shares outstanding.
Diluted net earnings per share from discontinued operations were zero in 2018, and were
$1.90
per share in the prior year due to the gain on the sale of the Beauty Brands in 2017. Diluted net earnings per share decreased
$1.92
, or
34%
, to
$3.67
.
Core EPS increased
8%
to
$4.22
. Core EPS represents diluted net earnings per share from continuing operations, excluding the current year net charge for the transitional impact of the U.S. Tax Act and the charges in both periods for early extinguishment of debt and incremental restructuring charges related to our productivity and cost savings plans. The increase was driven by increased sales, the lower effective tax rate on core earnings (excluding the transitional net tax charge from the U.S. Tax Act) and the reduction in the number of weighted average shares outstanding discussed above.
Fiscal year 2017 compared with fiscal year 2016
Net earnings from continuing operations increased $167 million, or 2%, to $10.2 billion. Operating income improved $514 million, or 4%, due to improved gross margin and reduced SG&A costs. Net earnings also benefitted from a lower tax rate in 2017. These benefits were partially offset by the increase in net non-operating expenses, discussed above. Foreign exchange impacts reduced net earnings by approximately $420 million in
2017
due to weakening of certain currencies against the U.S. dollar, including those in Argentina, Nigeria, Egypt and the United Kingdom. This impact includes both transactional charges as discussed above in Operating Costs and translational impacts from converting earnings from foreign subsidiaries to U.S. dollars.
Net earnings from discontinued operations increased $4.6 billion in
2017
to $5.2 billion. This change was driven by the $5.3 billion gain on the sale of the Beauty Brands in the current year, partially offset by the impact of the base period results, which included the net earnings of the Batteries and Beauty Brands businesses prior to divestiture, a gain on the sale of the Batteries business and impairment charges on the Batteries business prior to divestiture (see Note 13 to the Consolidated Financial Statements).
Net earnings attributable to Procter & Gamble increased $4.8 billion, or 46%, to $15.3 billion.
Diluted net earnings per share from continuing operations increased $0.20, or 6%, to $3.69 due to the increase in net earnings from continuing operations and a reduction in the number of weighted average shares outstanding following the shares tendered in the sale of the Beauty Brands to Coty (see Note 13 to the Consolidated Financial Statements), along with ongoing share repurchases.
Diluted net earnings per share from discontinued operations were $1.90. This was an increase of $1.70 per share versus the prior year primarily resulting from the gain on the sale of the Beauty Brands. Diluted net earnings per share increased $1.90, or 51%, to $5.59.
Core EPS increased 7% to $3.92. Core EPS in fiscal year 2017 represents diluted net earnings per share from continuing operations excluding the charge related to early extinguishment of long-term debt and incremental restructuring charges related to our productivity and cost savings plan. The increase was driven by operating margin expansion, lower effective tax rate and the reduction in the number of weighted average shares outstanding discussed above.
20
The Procter & Gamble Company
SEGMENT RESULTS
Segment results reflect information on the same basis we use for internal management reporting and performance evaluation. The results of these reportable segments do not include certain non-business unit specific costs such as interest expense, investing activities and certain restructuring and asset impairment costs. These costs are reported in our Corporate segment and are included as part of our Corporate segment discussion. Additionally, as described in Note 2 to the Consolidated Financial Statements, we apply blended statutory tax rates in the segments. Eliminations to adjust segment results to arrive at our consolidated effective tax rate, including the impacts of the U.S. Tax Act in fiscal 2018, are included in Corporate. All references to net earnings throughout the discussion of segment results refer to net earnings from continuing operations.
|
|
Net Sales Change Drivers 2018 vs. 2017
(1)
|
|||||||||||||||||||
|
Volume with Acquisitions & Divestitures
|
Volume Excluding Acquisitions & Divestitures
|
Foreign Exchange
|
Price
|
Mix
|
Other
(2)
|
Net Sales Growth
|
||||||||||||||
|
Beauty
|
2
|
%
|
2
|
%
|
2
|
%
|
—
|
%
|
5
|
%
|
—
|
%
|
9
|
%
|
||||||
|
Grooming
|
—
|
%
|
—
|
%
|
3
|
%
|
(3
|
)%
|
(1
|
)%
|
—
|
%
|
(1
|
)%
|
||||||
|
Health Care
|
3
|
%
|
3
|
%
|
3
|
%
|
(1
|
)%
|
—
|
%
|
—
|
%
|
5
|
%
|
||||||
|
Fabric & Home Care
|
3
|
%
|
4
|
%
|
1
|
%
|
(1
|
)%
|
—
|
%
|
—
|
%
|
3
|
%
|
||||||
|
Baby, Feminine & Family Care
|
(1
|
)%
|
(1
|
)%
|
1
|
%
|
(1
|
)%
|
—
|
%
|
—
|
%
|
(1
|
)%
|
||||||
|
TOTAL COMPANY
|
1
|
%
|
2
|
%
|
2
|
%
|
(1
|
)%
|
1
|
%
|
—
|
%
|
3
|
%
|
||||||
|
Net Sales Change Drivers 2017 vs. 2016
(1)
|
||||||||||||||||||||
|
Volume with Acquisitions & Divestitures
|
Volume Excluding Acquisitions & Divestitures
|
Foreign Exchange
|
Price
|
Mix
|
Other
(2)
|
Net Sales Growth
|
||||||||||||||
|
Beauty
|
(2
|
)%
|
1
|
%
|
(2
|
)%
|
1
|
%
|
2
|
%
|
1
|
%
|
—
|
%
|
||||||
|
Grooming
|
2
|
%
|
3
|
%
|
(2
|
)%
|
(1
|
)%
|
(2
|
)%
|
—
|
%
|
(3
|
)%
|
||||||
|
Health Care
|
3
|
%
|
4
|
%
|
(2
|
)%
|
—
|
%
|
1
|
%
|
—
|
%
|
2
|
%
|
||||||
|
Fabric & Home Care
|
1
|
%
|
2
|
%
|
(2
|
)%
|
—
|
%
|
1
|
%
|
—
|
%
|
—
|
%
|
||||||
|
Baby, Feminine & Family Care
|
2
|
%
|
2
|
%
|
(2
|
)%
|
(1
|
)%
|
—
|
%
|
—
|
%
|
(1
|
)%
|
||||||
|
TOTAL COMPANY
|
1
|
%
|
2
|
%
|
(2
|
)%
|
—
|
%
|
—
|
%
|
1
|
%
|
—
|
%
|
||||||
(1)
Net sales percentage changes are approximations based on quantitative formulas that are consistently applied.
(2)
Other includes the sales mix impact from acquisitions and divestitures, the impact from India Goods and Services Tax implementation and rounding impacts necessary to reconcile volume to net sales.
BEAUTY
|
($ millions)
|
2018
|
Change vs. 2017
|
2017
|
Change vs. 2016
|
|||
|
Volume
|
N/A
|
2%
|
N/A
|
(2)%
|
|||
|
Net sales
|
$12,406
|
9%
|
$11,429
|
—%
|
|||
|
Net earnings
|
$2,320
|
21%
|
$1,914
|
(3)%
|
|||
|
% of net sales
|
18.7%
|
200 bps
|
16.7%
|
(50) bps
|
|||
Fiscal year 2018 compared with fiscal year 2017
Beauty net sales
increased 9% to
$12.4 billion
in 2018 on
a 2% increase in unit volume
. Favorable foreign exchange impacts increased net sales by 2%. Favorable product mix added 5% to net sales, primarily due to the disproportionate growth of the super-premium SK-II and premium Olay Skin brands. Organic sales
increased 7%
on a 2% increase in organic volume. Global market share of the Beauty segment
decreased 0.2 points
. Volume
was unchanged
in developed regions and
increased low single digits
in developing regions.
|
•
|
Volume in Hair Care
increased low single digits
. Volume
|
in developed regions
decreased low single digits
mainly due to competitive activity. Developing regions volume
increased low single digits
due to market growth, product innovation and improved in-store executions. Global market share of the hair care category
decreased less than half a point
.
|
•
|
Volume in Skin and Personal Care
increased low single digits
. Developed market volume
increased low single digits
driven by product innovation. Volume
increased mid-single digits
in developing regions behind innovation and increased marketing. Global market share of the skin and personal care category
was unchanged
.
|
Net earnings
increased 21% to
$2.3 billion
in 2018 due to the increase in net sales and a 200 basis-point increase in net earnings margin driven primarily by a reduction in SG&A as a percentage of net sales. Gross margin increased slightly driven by manufacturing cost savings. SG&A as a percentage of sales decreased primarily due to positive scale impacts of the net sales increase on both marketing spending and overheads.
The Procter & Gamble Company
21
Fiscal year 2017 compared with fiscal year 2016
Beauty net sales were unchanged at $11.4 billion in 2017 on a 2% decrease in unit volume. Unfavorable foreign exchange reduced net sales by 2%. Price increases had a 1% positive impact on net sales. Favorable product mix added 2% to net sales, primarily due to growth of the super-premium SK-II brand, which has higher than segment average selling prices. Organic sales increased 3% on organic volume that increased 1%. Global market share of the Beauty segment decreased 0.6 points. Volume decreased low single digits in developed regions. Volume decreased low single digits in developing regions. Excluding minor brand divestitures, organic volume in developing regions increased low single digits.
|
•
|
Volume in Hair Care decreased low single digits due to minor brand divestitures. Organic volume increased low single digits. Developed regions decreased low single digits mainly due to competitive activity. Developing regions decreased low single digits due to minor brand divestitures. Organic volume increased low single digits in developing regions behind product innovation and market growth. Global market share of the hair care category decreased more than half a point.
|
|
•
|
Volume in Skin and Personal Care was unchanged including the impact of minor brand divestitures. Organic volume increased low single digits. Developed market volume decreased low single digits following increased pricing and due to competitive activity. Volume increased low single digits in developing regions behind innovation and market growth. Global market share of the skin and personal care category decreased half a point.
|
Net earnings decreased 3% to $1.9 billion in 2017 due to a 50 basis point decrease in net earnings margin, behind an increase in SG&A as a percentage of net sales. SG&A as a percentage of net sales increased due to increased overhead spending including investments in sales resources and incremental marketing activity. Gross margin decreased slightly as the benefits from productivity savings and higher pricing were more than offset by higher commodity costs and unfavorable mix impacts (driven by Hair Care from an increase in the proportion of lower margin forms and categories, and unfavorable geographic mix, which more than offset benefit from Skin and Personal Care, driven by the growth of SK-II).
GROOMING
|
($ millions)
|
2018
|
Change vs. 2017
|
2017
|
Change vs. 2016
|
|||
|
Volume
|
N/A
|
—%
|
N/A
|
2%
|
|||
|
Net sales
|
$6,551
|
(1)%
|
$6,642
|
(3)%
|
|||
|
Net earnings
|
$1,432
|
(7)%
|
$1,537
|
(1)%
|
|||
|
% of net sales
|
21.9%
|
(120) bps
|
23.1%
|
40 bps
|
|||
Fiscal year 2018 compared with fiscal year 2017
Grooming net sales
decreased 1% to
$6.6 billion
in 2018 on unit volume that was unchanged. Favorable foreign exchange increased net sales by 3%. Price reductions in Shave Care reduced net sales by 3%. Unfavorable mix reduced net sales
by 1% driven by disproportionate growth of lower tier shave care products. Organic sales
decreased 3%
while organic volume was unchanged. Global market share of the Grooming segment
decreased 0.8 points
. Volume
was unchanged
in both developed and developing regions.
|
•
|
Shave Care volume
was unchanged
. Volume
was unchanged
in developed regions as increased competitiveness of our products in the U.S. following price reductions was offset by competitive activity in other markets. Volume in developing regions
was unchanged
. Global market share of the shave care category
decreased slightly
.
|
|
•
|
Appliances volume
increased high single digits
in developed and developing regions due to product innovation. Global market share of the appliances category
increased more than half a point
.
|
Net earnings
decreased 7% to
$1.4 billion
in 2018 due to the net sales decrease and a reduction in net earnings margin. Net earnings margin decreased 120 basis points due to a decrease in gross margin and an increase in SG&A as a percentage of net sales. Gross margin decreased due to the negative impact of reduced pricing and the above mentioned unfavorable product mix, partially offset by manufacturing cost savings. SG&A as a percentage of net sales increased due to overhead spending increases and a base period gain on the sale of real estate, partially offset by a reduction in current year marketing spending.
Fiscal year 2017 compared with fiscal year 2016
Grooming net sales decreased 3% to $6.6 billion in 2017 on a 2% increase in unit volume. Unfavorable foreign exchange reduced net sales by 2%. Unfavorable mix reduced net sales by 2% driven by disproportionate growth in emerging markets, where average selling prices are lower than in developed regions, in part due to a higher relative proportion of disposable razors in those markets. Price reductions in the U.S. during the second half of the year taken to address consumer price-competitiveness drove a 1% reduction in net sales. Organic sales were unchanged on organic volume that increased 3%. Global market share of the Grooming segment decreased 0.7 points. Volume increased low single digits in developed and developing regions.
|
•
|
Shave Care volume increased low single digits. Shave Care volume decreased low single digits in developed regions due to competitive activity and increased low single digits in developing regions behind product innovation. Global market share of the shave care category decreased half a point.
|
|
•
|
Volume in Appliances increased double digits. Volume increased double digits in developed regions and increased low single digits in developing regions due to product innovation. Global market share of the appliances category increased nearly half a point.
|
Net earnings decreased 1% to $1.5 billion in 2017 due to the reduction in net sales, partially offset by an increase in net earnings margin. Net earnings margin increased 40 basis points due to a decrease in SG&A as a percent of net sales and improved gross margin. SG&A as a percent of net sales
22
The Procter & Gamble Company
decreased due to a gain on the sale of real estate, partially offset by increased overhead spending. Gross margin increased as the benefits of productivity efforts were only partially offset by unfavorable foreign exchange impacts, reduced pricing and negative mix driven by growth in emerging markets, where average selling prices are lower than in developed regions, in part due to a higher relative proportion of disposable razors in those markets.
HEALTH CARE
|
($ millions)
|
2018
|
Change vs. 2017
|
2017
|
Change vs. 2016
|
|||
|
Volume
|
N/A
|
3%
|
N/A
|
3%
|
|||
|
Net sales
|
$7,857
|
5%
|
$7,513
|
2%
|
|||
|
Net earnings
|
$1,283
|
—%
|
$1,280
|
2%
|
|||
|
% of net sales
|
16.3%
|
(70) bps
|
17.0%
|
— bps
|
|||
Fiscal year 2018 compared with fiscal year 2017
Health Care net sales
increased 5% to
$7.9 billion
in 2018 on
a 3% increase in unit volume
. Favorable foreign exchange impacts increased net sales by 3%. Lower pricing reduced net sales by 1%. Organic sales
increased 2%
on a 3% increase in organic volume. Global market share of the Health Care segment
decreased 0.1 points
. Volume
increased low single digits
in both developed and developing regions.
|
•
|
Oral Care volume
increased low single digits
. Volume
increased low single digits
in developed regions driven by product innovation and marketing investments in the premium power brush segment. Volume
increased low single digits
in developing regions due to product innovation and reduced pricing in the form of increased promotional spending. Global market share of the oral care category
decreased less than half a point
.
|
|
•
|
Volume in Personal Health Care
increased mid-single digits
. Volume
increased low single digits
in developed regions and
increased high single digits
in developing regions due to product innovation and increased consumption from a strong cough/cold season. Global market share of the personal health care category
increased less than half a point
.
|
Net earnings
were unchanged at
$1.3 billion
in 2018 as the increase in net sales was offset by a 70 basis-point decrease in net earnings margin. Net earnings margin decreased due to a reduction in gross margin and the impact of a base period gain from minor brand divestitures, partially offset by a reduction in SG&A as a percentage of net sales. Gross margin decreased due to unfavorable mix impact (from the disproportionate growth of larger sizes and club channel which have lower than segment-average margins) and reduced selling prices, partially offset by manufacturing cost savings. SG&A as a percentage of net sales decreased primarily due to the positive scale impacts of the net sales increase.
Fiscal year 2017 compared with fiscal year 2016
Health Care net sales increased 2% to $7.5 billion in 2017 on a 3% increase in unit volume. Unfavorable foreign exchange reduced net sales by 2%. Favorable product mix contributed
1% to net sales due primarily to an increase in power toothbrushes in Oral Care, which have higher than segment-average selling prices. Organic sales increased 5% on organic volume that increased 4%. Global market share of the Health Care segment decreased 0.2 points. Volume increased low single digits in developed regions and increased mid-single digits in developing regions.
|
•
|
Oral Care volume increased mid-single digits. Volume increased low single digits in developed regions and increased mid-single digits in developing regions driven by market growth and product innovation. Global market share of the oral care category decreased slightly.
|
|
•
|
Volume in Personal Health Care increased low single digits. Volume increased low single digits in both developed and developing regions behind a stronger cough/cold season relative to prior year, product innovation and expanded distribution. Global market share of the personal health care category was unchanged.
|
Net earnings increased 2% to $1.3 billion in 2017 due to the increase in net sales. Operating margin was unchanged as a higher gross margin was offset by increased SG&A as a percentage of net sales. Gross margin increased due to productivity cost savings, partially offset by unfavorable geographic mix driven by the disproportionate growth of developing regions, which have lower than segment-average margins. SG&A increased as a percentage of net sales due to increased overhead spending, partially offset by reduced marketing spending.
FABRIC & HOME CARE
|
($ millions)
|
2018
|
Change vs. 2017
|
2017
|
Change vs. 2016
|
|||
|
Volume
|
N/A
|
3%
|
N/A
|
1%
|
|||
|
Net sales
|
$21,441
|
3%
|
$20,717
|
—%
|
|||
|
Net earnings
|
$2,708
|
—%
|
$2,713
|
(2)%
|
|||
|
% of net sales
|
12.6%
|
(50) bps
|
13.1%
|
(30) bps
|
|||
Fiscal year 2018 compared with fiscal year 2017
Fabric & Home Care net sales
increased 3% to
$21.4 billion
in 2018 on
a 3% increase in unit volume
. Favorable foreign exchange increased net sales by 1%. Lower pricing reduced net sales by 1%. Organic sales
increased 3%
on a 4% increase in organic volume. Global market share of the Fabric & Home Care segment
increased 0.1 points
. Volume
increased mid-single digits
in developed regions and increased low single digits in developing regions. Excluding minor brand divestitures, organic volume
increased mid-single digits
in developing regions.
|
•
|
Fabric Care volume
increased low single digits
. Excluding the impact of minor brand divestitures, organic volume
increased mid-single digits
. Volume in developed regions
increased mid-single digits
, due to product innovation and behind lower pricing in the form of increased promotional spending. Volume in developing regions
increased low single digits
due to product innovation and category growth. Global market share of the Fabric Care category
was unchanged
.
|
The Procter & Gamble Company
23
|
•
|
Home Care volume
increased low single digits
. Volume in developed regions
increased low single digits
driven by product innovation. Volume in developing regions
increased mid-single digits
driven by product innovation and category growth. Global market share of the Home Care category
was unchanged
.
|
Net earnings
were unchanged at
$2.7 billion
in 2018 as the increase in net sales was offset by a 50 basis-point decrease in net earnings margin. Net earnings margin decreased due to a reduction in Gross margin partially offset by a decrease in SG&A as a percentage of net sales. Gross margin decreased due to unfavorable product mix (due to an increase in the proportion of larger package sizes with lower than segment-average margins and newer product forms that have not yet been cost optimized), increased commodity costs and reduced selling prices, partially offset by manufacturing cost savings. SG&A as a percentage of net sales decreased primarily due to the positive scale impacts of the net sales increase. Net earnings also benefited from a gain on a minor brand divestiture in 2018.
Fiscal year 2017 compared with fiscal year 2016
Fabric & Home Care net sales were unchanged in 2017 at $20.7 billion on a 1% increase in unit volume. Unfavorable foreign exchange reduced net sales by 2%. Favorable geographic mix increased net sales 1%, primarily driven by increased volume in developed regions, which have higher than segment-average selling prices. Organic sales increased 3% on organic volume that increased 2%. Global market share of the Fabric & Home Care segment decreased 0.1 points. Volume increased low single digits in developed regions and decreased low single digits in developing regions. Excluding minor brand divestitures, organic volume increased mid-single digits in developed regions and decreased low single digits in developing regions.
|
•
|
Fabric Care volume increased low single digits as a mid-single digit volume increase in developed regions, due primarily to product innovation, was partially offset by a low single-digit decrease in developing regions, driven by competitive activity and reduced distribution of less profitable brands. Global market share of the fabric care category was unchanged.
|
|
•
|
Home Care volume increased low single digits driven by a low single-digit increase in both developed and developing regions due to market growth and product innovation. Global market share of the home care category was unchanged.
|
Net earnings decreased 2% to $2.7 billion in 2017 due to a 30 basis-point decrease in net earnings margin. Net earnings margin decreased due to an increase in the effective tax rate driven by the geographic mix of earnings. Gross margin expanded slightly, driven by manufacturing cost savings, partially offset by unfavorable foreign exchange impacts and increased commodity costs. SG&A as a percentage of net sales increased slightly due to increased overhead spending.
BABY, FEMININE & FAMILY CARE
|
($ millions)
|
2018
|
Change vs. 2017
|
2017
|
Change vs. 2016
|
|||
|
Volume
|
N/A
|
(1)%
|
N/A
|
2%
|
|||
|
Net sales
|
$18,080
|
(1)%
|
$18,252
|
(1)%
|
|||
|
Net earnings
|
$2,251
|
(10)%
|
$2,503
|
(6)%
|
|||
|
% of net sales
|
12.5%
|
(120) bps
|
13.7%
|
(60) bps
|
|||
Fiscal year 2018 compared with fiscal year 2017
Baby, Feminine & Family Care net sales in 2018
decreased 1% to
$18.1 billion
on
a 1% decrease in unit volume
. Favorable foreign exchange increased net sales by 1%. Lower pricing had a negative 1% impact on net sales. Organic sales
decreased 2%
on a 1% decrease in organic volume. Global market share of the Baby, Feminine & Family Care segment
decreased 0.7 points
. Volume
was unchanged
in developed regions and
decreased mid-single digits
in developing regions. Excluding minor brand divestitures, organic volume in developed regions increased low single digits.
|
•
|
Baby Care volume
decreased mid-single digits
. Volume in developed regions
decreased low single digits
due to competitive activity and trade inventory reductions. Volume in developing regions
decreased high single digits
due to competitive activity, market contraction and a reduction in trade inventories. Global market share of the baby care category
decreased more than a point
.
|
|
•
|
Feminine Care volume
decreased low single digits
. Excluding the impact of minor brand divestitures, organic volume
increased low single digits
. Organic volume in developed regions
increased low single digits
due to product innovation. Volume in developing regions
increased low single digits
due to product innovation. Global market share of the feminine care category
was unchanged
.
|
|
•
|
Volume in Family Care, which is predominantly a North American business,
increased mid-single digits
driven by product innovation and distribution gains. In the U.S., all-outlet share of the family care category
increased slightly
.
|
Net earnings in 2018
decreased 10% to
$2.3 billion
primarily due to a 120 basis-point decrease in net earnings margin. Net earnings margin decreased primarily due to a decrease in gross margin driven by an increase in commodity costs, unfavorable product mix (driven by a higher relative mix of larger pack sizes with lower than segment-average margins and newer product forms that have not yet been cost optimized) and reduced selling prices, partially offset by manufacturing cost savings. SG&A as a percentage of net sales decreased marginally due to reduced marketing spending, partially offset by an increase in overhead costs.
Fiscal year 2017 compared with fiscal year 2016
Baby, Feminine & Family Care net sales decreased 1% to $18.3 billion in 2017 on a 2% increase in unit volume. Unfavorable foreign exchange reduced net sales by 2%. Lower pricing had a negative 1% impact on net sales. Organic sales increased 1% on organic volume that increased 2%. Global market share
24
The Procter & Gamble Company
of the Baby, Feminine & Family Care segment decreased 0.1 points. Volume increased low single digits in developed regions and was unchanged in developing regions.
|
•
|
Volume in Baby Care was unchanged. Volume in developed regions decreased low single digits, primarily due to competitive activity, and volume in developing regions increased low single digits, due to market growth and product innovation. Global market share of the baby care category decreased more than half a point.
|
|
•
|
Volume in Feminine Care increased low single digits. Volume in developed regions increased low single digits, driven by product innovation, and volume in developing regions decreased low single digits due to competitive activity and reduced exports to our Venezuelan subsidiaries. Global market share of the feminine care category was unchanged.
|
|
•
|
Volume in Family Care, which is predominantly a North American business, increased mid-single digits driven by product innovation and increased merchandising. In the U.S., all-outlet share of the family care category increased less than a point.
|
Net earnings decreased 6% to $2.5 billion in 2017 due to the reduction in net sales and a 60 basis point decrease in net earnings margin. Net earnings margin decreased as increased SG&A as a percent of net sales was only partially offset by an increase in gross margin. SG&A as a percentage of net sales increased due to increased marketing and overhead spending. Gross margin increased driven by manufacturing cost savings partially offset by unfavorable foreign exchange impacts, lower pricing and unfavorable product mix across business units due to increased net sales in product forms and larger package sizes with lower than segment-average margins.
CORPORATE
|
($ millions)
|
2018
|
Change vs. 2017
|
2017
|
Change vs. 2016
|
|||
|
Net sales
|
$497
|
(2)%
|
$505
|
20%
|
|||
|
Net earnings/(loss)
|
$(133)
|
N/A
|
$247
|
N/A
|
|||
Corporate includes certain operating and non-operating activities not allocated to specific business segments. These include: the incidental businesses managed at the corporate level; financing and investing activities; certain employee benefit costs; other general corporate items; gains and losses related to certain divested brands and categories; and certain restructuring-type activities to maintain a competitive cost structure, including manufacturing and workforce optimization. Corporate also includes reconciling items to adjust the accounting policies used in the segments to U.S. GAAP. The most significant reconciling item is income taxes, to adjust from blended statutory rates that are reflected in the segments to the overall Company effective tax rate. For 2018, the tax impact also includes the impacts of the U.S. Tax Act, which were included in the corporate segment.
Fiscal year 2018 compared with fiscal year 2017
Corporate net sales decreased 2% to $497 million in 2018 due to a decrease in the incidental businesses managed at the
corporate level. Corporate net earnings/(loss) from continuing operations decreased by $380 million in 2018, primarily due to:
|
•
|
an increase in income tax expense in 2018 caused by the aforementioned $602 million net charge for the transitional impacts of the U.S. Tax Act and
|
|
•
|
an increase in after-tax restructuring charges of approximately $331 million.
|
These costs were partially offset by lower charges related to the early extinguishment of long-term debt in 2018 versus 2017, the lower tax rate on current year earnings as a result of the U.S. Tax Act and an increase in the proportion of corporate overhead spending allocated to the segments.
Fiscal year 2017 compared with fiscal year 2016
Corporate net sales increased 20%, or $83 million, to $505 million in 2017 primarily due to an increase in the incidental businesses managed at the corporate level. Corporate net earnings from continuing operations improved by approximately $421 million in 2017, primarily due to:
|
•
|
lower restructuring charges in 2017 compared to the prior year,
|
|
•
|
a gain on the sale of real estate in the current fiscal year,
|
|
•
|
lower foreign exchange transactional charges,
|
|
•
|
a reduction in the proportion of corporate overhead spending not allocated to the segments, consisting in part of reduced stranded overheads following divestitures, and
|
|
•
|
current year tax benefits resulting from the adoption of a new accounting standard on the tax impacts of share-based payments to employees (see Note 1 to the Consolidated Financial Statements).
|
These benefits were partially offset by a $345 million after-tax charge on the early extinguishment of long-term debt in fiscal 2017 and lower gains from minor brand divestitures compared to 2016.
Restructuring Program to deliver Productivity and Cost Savings
In 2012, the Company initiated a productivity and cost savings plan to reduce costs and better leverage scale in the areas of supply chain, research and development, marketing and overheads. The plan was designed to accelerate cost reductions by streamlining management decision making, manufacturing and other work processes to fund the Company's growth strategy. In 2017, the Company communicated specific elements of an additional multi-year productivity and cost savings program.
The current productivity and cost savings plan will further reduce costs in the areas of supply chain, certain marketing activities and overhead expenses. As part of this plan, the Company incurred approximately $1.1 billion in total before- tax restructuring costs in fiscal 2018, with an additional amount of approximately $0.8 billion expected in fiscal 2019. This program is expected to result in additional enrollment reductions, along with further optimization of the supply chain and other manufacturing processes. Savings generated from restructuring costs are difficult to estimate, given the nature of the activities, the timing of the execution and the degree of
The Procter & Gamble Company
25
reinvestment. However, we estimate that through 2018, the underlying restructuring costs and other non-manufacturing enrollment reductions since 2012 have delivered approximately $3.3 billion in annual before-tax gross savings.
Restructuring accruals of
$513 million
as of
June 30, 2018
are classified as current liabilities. Approximately
65%
of the restructuring charges incurred in fiscal 2018 either have been or will be settled with cash. Consistent with our historical policies for ongoing restructuring-type activities, the resulting charges are funded by and included within Corporate for segment reporting.
In addition to our restructuring programs, we have additional ongoing savings efforts in our supply chain, marketing and overhead areas that yield additional benefits to our operating margins.
Refer to Note 3 to the Consolidated Financial Statements for more details on the restructuring program and to the Operating Costs section of the MD&A for more information about the total benefit to operating margins from our total savings efforts.
CASH FLOW, FINANCIAL CONDITION AND LIQUIDITY
We believe our financial condition continues to be of high quality, as evidenced by our ability to generate substantial cash from operations and to readily access capital markets at competitive rates.
Operating cash flow provides the primary source of cash to fund operating needs and capital expenditures. Excess operating cash is used first to fund shareholder dividends. Other discretionary uses include share repurchases and acquisitions to complement our portfolio of businesses, brands and geographies. As necessary, we may supplement operating cash flow with debt to fund these activities. The overall cash position of the Company reflects our strong business results and a global cash management strategy that takes into account liquidity management, economic factors and tax considerations.
Operating Cash Flow
Fiscal year 2018 compared with fiscal year 2017
Operating cash flow was $
14.9 billion
in
2018
, a
17%
increase from the prior year. Net earnings, adjusted for non-cash items (depreciation and amortization, loss on extinguishment of debt, share-based compensation, deferred income taxes and gain on sale of assets) generated
$11.4 billion
of operating cash flow. Working capital and other impacts generated
$3.5 billion
of operating cash flow as summarized below.
|
•
|
An increase in accounts receivable used
$177 million
of cash due to increased sales and the timing of the year-end (which fell on a weekend, resulting in fewer days collection). The number of days sales outstanding remained flat versus prior year.
|
|
•
|
Higher inventory used
$188 million
of cash mainly due to inventory increases to support initiatives and business growth across all segments. Inventory days on hand decreased approximately 1 day primarily due to foreign exchange impacts.
|
|
•
|
Accounts payable, accrued and other liabilities increased, generating
$1.4 billion
of cash. This was primarily driven by extended payment terms with our suppliers and an increase in fourth quarter marketing activity versus the prior year. These factors, along with offsetting impacts of foreign exchange, drove a 2 day increase in days payable outstanding. Although difficult to project due to market and other dynamics, we anticipate incremental cash flow benefits from the extended payment terms with suppliers could decline slightly over the next fiscal year.
|
|
•
|
Other operating assets and liabilities generated
$2.0 billion
of cash, primarily driven by the long-term portion of the payable related to the U.S. Tax Act repatriation charge.
|
Fiscal year 2017 compared with fiscal year 2016
Operating cash flow was
$12.8 billion
in
2017
, a 17% decrease from the prior year. Net earnings, adjusted for non-cash items (depreciation and amortization, share-based compensation, deferred income taxes, loss/(gain) on sale of assets and impairment charges) and the loss on early extinguishment of debt generated
$13.0 billion
of operating cash flow. Working capital and other impacts used
$281 million
of operating cash flow.
|
•
|
An increase in accounts receivable used
$322 million
of cash due to higher relative sales late in the period as compared to the prior period, partially offset by collection of approximately $150 million of retained receivables from the Beauty Brands business. In addition, the number of days sales outstanding increased 1 day due in part to foreign exchange impacts.
|
|
•
|
Lower inventory generated
$71 million
of cash mainly due to supply chain optimizations, partially offset by increases to support business growth and increased commodity costs. Inventory days on hand decreased approximately 1 day primarily due to supply chain optimizations.
|
|
•
|
Accounts payable, accrued and other liabilities decreased, using
$149 million
in operating cash flow. This was caused by reduced accruals from lower fourth quarter marketing and overhead activities as compared to the base period, as well as the payment of approximately $595 million of accounts payable and accrued liabilities related to the divestiture of the Beauty Brands business, including liabilities retained by the Company pursuant to the terms of the agreement. These impacts were partially offset by approximately $700 million related to extended payment terms with our suppliers. These factors, along with the impact of foreign exchange, drove a 4 day increase in days payable outstanding.
|
|
•
|
Other operating assets and liabilities used
$43 million
of cash.
|
Adjusted Free Cash Flow.
We view adjusted free cash flow as an important measure because it is a factor impacting the amount of cash available for dividends, share repurchases, acquisitions and other discretionary investment. It is defined as operating cash flow less capital expenditures and excluding tax payments related to certain divestitures and is one of the measures used to evaluate senior management and determine their at-risk compensation.
26
The Procter & Gamble Company
Fiscal year 2018 compared with fiscal year 2017
Adjusted free cash flow was
$11.2 billion
in
2018
, an increase of 14% versus the prior year. The increase was primarily driven by the increase in operating cash flows as discussed above. Adjusted free cash flow productivity, defined as the ratio of adjusted free cash flow to net earnings, excluding the transitional impact of the U.S. Tax Act and the loss on early extinguishment of debt, was
104%
in
2018
.
Fiscal year 2017 compared with fiscal year 2016
Adjusted free cash flow was
$9.8 billion
in
2017
, a decrease of 19% versus the prior year. The decrease was primarily driven by the decrease in operating cash flows. Adjusted free cash flow productivity, defined as the ratio of adjusted free cash flow to net earnings, excluding the loss on debt extinguishment and impacts of the sale of the Beauty Brands, was 94% in
2017
.
Investing Cash Flow
Fiscal year 2018 compared with fiscal year 2017
Net investing activities consumed
$3.5 billion
in cash in
2018
mainly due to capital spending and purchases of short-term investments, partially offset by proceeds from asset sales and sales and maturities of short-term investments.
Fiscal year 2017 compared with fiscal year 2016
Net investing activities consumed
$5.7 billion
in cash in
2017
mainly due to capital spending and purchases of short-term investments, partially offset by proceeds from asset sales, transactions related to the close of the Beauty Brands divestiture and sales and maturities of short-term investments.
Capital Spending.
Capital expenditures, primarily to support capacity expansion, innovation and cost efficiencies, were
$3.7 billion
in
2018
and
$3.4 billion
in
2017
. Capital spending as a percentage of net sales increased
40 basis points to 5.6% in
2018
. Capital spending as a percentage of net sales was 5.2% in
2017
.
Acquisitions.
Acquisition activity used cash of
$109 million
in
2018
, primarily related to acquisitions in the Beauty segment. Acquisition activity was not material in
2017
.
Proceeds from Divestitures and Other Asset Sales.
Proceeds from asset sales in
2018
contributed
$269 million
in cash, primarily from minor brand divestitures. Proceeds from asset sales contributed
$571 million
in cash in
2017
primarily from real estate sales and other minor brand divestitures. In fiscal 2017, the Company invested an additional $874 million of cash, received from the issuance of debt, in restricted cash. At the closing of the Beauty Brands transaction, $1.9 billion of restricted cash (including the $874 million invested in 2017) was released and returned to cash and cash equivalents and $475 million of cash was transferred to the discontinued Beauty Brands business.
Financing Cash Flow
Dividend Payments.
Our first discretionary use of cash is dividend payments. Dividends per common share increased 3.3% to $2.79 per share in
2018
. Total dividend payments to common and preferred shareholders were
$7.3 billion
in
2018
and
$7.2 billion
in
2017
. In April 2018, the Board of Directors
declared an increase in our quarterly dividend from $0.6896 to $0.7172 per share on Common Stock and Series A and B ESOP Convertible Class A Preferred Stock. This represents a 4% increase compared to the prior quarterly dividend and is the 62nd consecutive year that our dividend has increased. We have paid a dividend for 128 years, every year since our incorporation in 1890.
Long-Term and Short-Term Debt.
We maintain debt levels we consider appropriate after evaluating a number of factors, including cash flow expectations, cash requirements for ongoing operations, investment and financing plans (including acquisitions and share repurchase activities) and the overall cost of capital. Total debt was $31.3 billion as of
June 30, 2018
and $31.6 billion as of
June 30, 2017
.
Treasury Purchases.
Total share repurchases were
$7.0 billion
in
2018
and
$5.2 billion
in
2017
.
Liquidity
At
June 30, 2018
, our current liabilities exceeded current assets by $4.9 billion, largely due to short-term borrowings under our commercial paper program. We anticipate being able to support our short-term liquidity and operating needs largely through cash generated from operations. The Company regularly assesses its cash needs and the available sources to fund these needs. As of
June 30, 2018
, $11.4 billion of the Company’s cash, cash equivalents and marketable securities was held off-shore by foreign subsidiaries. This balance has declined versus the prior year primarily due to cash repatriations following the enactment of the U.S. Tax Act. Under current law, we do not expect restrictions or taxes on repatriation of cash held outside of the U.S. to have a material effect on our overall liquidity, financial condition or the results of operations for the foreseeable future. Of the
June 30, 2018
balance of off-shore cash, cash equivalents and marketable securities, the majority relates to various Western European countries. As of
June 30, 2018
, we did not have material cash, cash equivalents and marketable securities balances in any country subject to exchange controls that significantly restrict our ability to access or repatriate the funds.
We utilize short- and long-term debt to fund discretionary items, such as acquisitions and share repurchases. We have strong short- and long-term debt ratings, which have enabled, and should continue to enable, us to refinance our debt as it becomes due at favorable rates in commercial paper and bond markets. In addition, we have agreements with a diverse group of financial institutions that, if needed, should provide sufficient credit funding to meet short-term financing requirements.
On
June 30, 2018
, our short-term credit ratings were P-1 (Moody's) and A-1+ (Standard & Poor's), while our long-term credit ratings were Aa3 (Moody's) and AA- (Standard & Poor's), all with a stable outlook.
We maintain bank credit facilities to support our ongoing commercial paper program. The current facility is an $8.0 billion facility split between a $3.2 billion five-year facility and a $4.8 billion 364-day facility, which expire in November 2022 and November 2018, respectively. Both facilities can be extended for certain periods of time as specified in the terms
The Procter & Gamble Company
27
of the credit agreement. These facilities are currently undrawn and we anticipate that they will remain undrawn. These credit facilities do not have cross-default or ratings triggers, nor do they have material adverse events clauses, except at the time of signing. In addition to these credit facilities, we have an automatically effective registration statement on Form S-3 filed with the SEC that is available for registered offerings of short- or long-term debt securities. For additional details on debt see Note 10 to the Consolidated Financial Statements.
Guarantees and Other Off-Balance Sheet Arrangements
We do not have guarantees or other off-balance sheet financing arrangements, including variable interest entities, which we believe could have a material impact on our financial condition or liquidity.
Contractual Commitments
The following table provides information on the amount and payable date of our contractual commitments as of
June 30, 2018
.
|
Amounts in millions
|
Total
|
Less Than 1 Year
|
1-3 Years
|
3-5 Years
|
After 5 Years
|
||||||||||||||
|
RECORDED LIABILITIES
|
|||||||||||||||||||
|
Total debt
|
$
|
31,217
|
|
$
|
10,407
|
|
$
|
4,630
|
|
$
|
5,224
|
|
$
|
10,956
|
|
||||
|
Capital leases
|
107
|
|
22
|
|
35
|
|
23
|
|
27
|
|
|||||||||
|
U.S. Tax Act transitional charge
(1)
|
2,884
|
|
231
|
|
462
|
|
462
|
|
1,730
|
|
|||||||||
|
Uncertain tax positions
(2)
|
—
|
|
—
|
|
—
|
|
—
|
|
—
|
|
|||||||||
|
OTHER
|
|||||||||||||||||||
|
Interest payments relating to long-term debt
|
4,944
|
|
574
|
|
1,033
|
|
811
|
|
2,526
|
|
|||||||||
|
Operating leases
(3)
|
1,338
|
|
275
|
|
442
|
|
325
|
|
296
|
|
|||||||||
|
Minimum pension funding
(4)
|
402
|
|
131
|
|
271
|
|
—
|
|
—
|
|
|||||||||
|
Purchase obligations
(5)
|
1,129
|
|
778
|
|
167
|
|
47
|
|
137
|
|
|||||||||
|
TOTAL CONTRACTUAL COMMITMENTS
|
$
|
42,021
|
|
$
|
12,418
|
|
$
|
7,039
|
|
$
|
6,891
|
|
$
|
15,673
|
|
||||
|
(1)
|
Represents the U.S. federal tax liability associated with the repatriation provisions of the U.S. Tax Act. Does not include any provisions made for foreign withholding taxes on expected repatriations as the timing of those payments is uncertain.
|
|
(2)
|
As of
June 30, 2018
, the Company's Consolidated Balance Sheet reflects a liability for uncertain tax positions of $584 million, including $114 million of interest and penalties. Due to the high degree of uncertainty regarding the timing of future cash outflows of liabilities for uncertain tax positions beyond one year, a reasonable estimate of the period of cash settlement beyond twelve months from the balance sheet date of
June 30, 2018
, cannot be made.
|
|
(3)
|
Operating lease obligations are shown net of guaranteed sublease income.
|
|
(4)
|
Represents future pension payments to comply with local funding requirements. These future pension payments assume the Company continues to meet its future statutory funding requirements. Considering the current economic environment in which the Company operates, the Company believes its cash flows are adequate to meet the future statutory funding requirements. The projected payments beyond fiscal year 2020 are not currently determinable.
|
|
(5)
|
Primarily reflects future contractual payments under various take-or-pay arrangements entered into as part of the normal course of business. Commitments made under take-or-pay obligations represent minimum commitments under take-or-pay agreements with suppliers and are in line with expected usage. This includes service contracts for information technology, human resources management and facilities management activities that have been outsourced. Such amounts also include arrangements with suppliers that qualify as embedded operating leases. While the amounts listed represent contractual obligations, we do not believe it is likely that the full contractual amount would be paid if the underlying contracts were canceled prior to maturity. In such cases, we generally are able to negotiate new contracts or cancellation penalties, resulting in a reduced payment. The amounts do not include other contractual purchase obligations that are not take-or-pay arrangements. Such contractual purchase obligations are primarily purchase orders at fair value that are part of normal operations and are reflected in historical operating cash flow trends. We do not believe such purchase obligations will adversely affect our liquidity position.
|
SIGNIFICANT ACCOUNTING POLICIES AND ESTIMATES
In preparing our financial statements in accordance with U.S. GAAP, there are certain accounting policies that may require a choice between acceptable accounting methods or may require substantial judgment or estimation in their application. These include revenue recognition, income taxes, certain employee benefits and goodwill and intangible assets. We believe these accounting policies, and others set forth in Note 1 to the Consolidated Financial Statements, should be reviewed
as they are integral to understanding the results of operations and financial condition of the Company.
The Company has discussed the selection of significant accounting policies and the effect of estimates with the Audit Committee of the Company's Board of Directors.
Revenue Recognition
Sales are recognized when revenue is realized or realizable and has been earned. For us, this generally means revenue is recognized when title to the product, ownership and risk of loss transfer to the customer, which can be on the date of shipment or the date of receipt by the customer. Trade promotions,
28
The Procter & Gamble Company
consisting primarily of customer pricing allowances, in-store merchandising funds, advertising and other promotional activities, and consumer coupons, are offered through various programs to customers and consumers. Sales are recorded net of trade promotion spending, which is recognized as incurred, generally at the time of the sale. Amounts accrued for trade promotions at the end of a period require estimation, based on contractual terms, customer performance, sales volumes and historical utilization and redemption rates. The actual amounts paid may be different from such estimates. These differences, which have historically not been significant, are recognized as a change in management estimate in a subsequent period. The Company will adopt ASU 2014-09, “Revenue from Contracts with Customers” on July 1, 2018. Adoption of this standard will result in a change in the timing of recognition of certain trade promotional spending. See Note 1 to our Consolidated Financial Statements.
Income Taxes
Our annual tax rate is determined based on our income, statutory tax rates and the tax impacts of items treated differently for tax purposes than for financial reporting purposes. Also inherent in determining our annual tax rate are judgments and assumptions regarding the recoverability of certain deferred tax balances, primarily net operating loss and other carryforwards, and our ability to uphold certain tax positions.
Realization of net operating losses and other carryforwards is dependent upon generating sufficient taxable income in the appropriate jurisdiction prior to the expiration of the carryforward periods, which involves business plans, planning opportunities and expectations about future outcomes. Although realization is not assured, management believes it is more likely than not that our deferred tax assets, net of valuation allowances, will be realized.
We operate in multiple jurisdictions with complex tax policy and regulatory environments. In certain of these jurisdictions, we may take tax positions that management believes are supportable, but are potentially subject to successful challenge by the applicable taxing authority. These interpretational differences with the respective governmental taxing authorities can be impacted by the local economic and fiscal environment.
A core operating principle is that our tax structure is based on our business operating model, such that profits are earned in line with the business substance and functions of the various legal entities. However, because of the complexity of transfer pricing concepts, we may have income tax uncertainty related to the determination of intercompany transfer prices for our various cross-border transactions. We have obtained and continue to prioritize the strategy of seeking advance rulings with tax authorities to reduce this uncertainty. We estimate that our current portfolio of advance rulings reduces this uncertainty with respect to over 70% of our global earnings. We evaluate our tax positions and establish liabilities in accordance with the applicable accounting guidance on uncertainty in income taxes. We review these tax uncertainties in light of changing facts and circumstances, such as the progress of tax audits, and adjust them accordingly. We have
a number of audits in process in various jurisdictions. Although the resolution of these tax positions is uncertain, based on currently available information, we believe that the ultimate outcomes will not have a material adverse effect on our financial position, results of operations or cash flows.
Because there are a number of estimates and assumptions inherent in calculating the various components of our tax provision, certain changes or future events such as changes in tax legislation, geographic mix of earnings, completion of tax audits or earnings repatriation plans could have an impact on those estimates and our effective tax rate. For additional details on the Company's income taxes, see Note 5 to the Consolidated Financial Statements.
Employee Benefits
We sponsor various post-employment benefits throughout the world. These include pension plans, both defined contribution plans and defined benefit plans, and other post-employment benefit (OPEB) plans, consisting primarily of health care and life insurance for retirees. For accounting purposes, the defined benefit pension and OPEB plans require assumptions to estimate the projected and accumulated benefit obligations, including the following variables: discount rate; expected salary increases; certain employee-related factors, such as turnover, retirement age and mortality; expected return on assets; and health care cost trend rates. These and other assumptions affect the annual expense and obligations recognized for the underlying plans. Our assumptions reflect our historical experiences and management's best judgment regarding future expectations. As permitted by U.S. GAAP, the net amount by which actual results differ from our assumptions is deferred. If this net deferred amount exceeds 10% of the greater of plan assets or liabilities, a portion of the deferred amount is included in expense for the following year. The cost or benefit of plan changes, such as increasing or decreasing benefits for prior employee service (prior service cost), is deferred and included in expense on a straight-line basis over the average remaining service period of the employees expected to receive benefits.
The expected return on plan assets assumption impacts our defined benefit expense since many of our defined benefit pension plans and our primary OPEB plan are partially funded. The process for setting the expected rates of return is described in Note 8 to the Consolidated Financial Statements. For
2018
, the average return on assets assumptions for pension plan assets and OPEB assets was 6.8% and 8.3%, respectively. A change in the rate of return of 100 basis points for both pension and OPEB assets would impact annual after-tax benefit expense by approximately $115 million.
Since pension and OPEB liabilities are measured on a discounted basis, the discount rate impacts our plan obligations and expenses. Discount rates used for our U.S. defined benefit pension and OPEB plans are based on a yield curve constructed from a portfolio of high quality bonds for which the timing and amount of cash outflows approximate the estimated payouts of the plan. For our international plans, the discount rates are set by benchmarking against investment grade corporate bonds rated AA or better. The average discount rate on the defined
The Procter & Gamble Company
29
benefit pension plans of 2.5% represents a weighted average of local rates in countries where such plans exist. A 100 basis point change in the discount rate would impact annual after-tax benefit expense by approximately $190 million. The average discount rate on the OPEB plan of 4.2% reflects the higher interest rates generally applicable in the U.S., which is where a majority of the plan participants receive benefits. A 100 basis point change in the discount rate would impact annual after-tax OPEB expense by approximately $65 million. For additional details on our defined benefit pension and OPEB plans, see Note 8 to the Consolidated Financial Statements.
Goodwill and Intangible Assets
Significant judgment is required to estimate the fair value of our goodwill reporting units and intangible assets. Accordingly, we typically obtain the assistance of third-party valuation specialists for significant goodwill reporting units and intangible assets. The fair value estimates are based on available historical information and on future expectations. We typically estimate the fair value of these assets using the income method, which is based on the present value of estimated future cash flows attributable to the respective assets. The valuations used to test goodwill and intangible assets for impairment are dependent on a number of significant estimates and assumptions, including macroeconomic conditions, overall category growth rates, competitive activities, cost containment and margin progression, Company business plans and the discount rate applied to cash flows.
Indefinite lived intangible assets and goodwill are not amortized, but are tested separately at least annually for impairment. Assumptions used in our impairment evaluations, such as forecasted growth rates and cost of capital, are consistent with internal projections and operating plans. We believe these estimates and assumptions are reasonable and comparable to those that would be used by other marketplace participants. Unanticipated market or macroeconomic events and circumstances may occur, which could affect the accuracy or validity of the estimates and assumptions. For example, future changes in the judgments, assumptions and estimates that are used in our impairment testing for goodwill and indefinite lived intangible assets, including discount and tax rates or future cash flow projections, could result in significantly different estimates of the fair values. In addition, changes to, or a failure to achieve business plans or deterioration of macroeconomic conditions could result in reduced cash flows or higher discount rates, leading to a lower valuation that would trigger an impairment of the goodwill and intangible assets of these businesses.
We test individual indefinite lived intangible assets by comparing the book value of each asset to the estimated fair value. Our impairment testing for goodwill is performed separately from our impairment testing of indefinite lived intangible assets. The test to evaluate goodwill for impairment is a two step process. In the first step, we compare the fair value of the reporting unit to its carrying value. If the fair value of the reporting unit is less than its carrying value, we perform a second step to determine the implied fair value of the reporting unit's goodwill. The second step of the impairment analysis requires a valuation of a reporting unit's tangible and
intangible assets and liabilities in a manner similar to the allocation of purchase price in a business combination. If the resulting implied fair value of the reporting unit's goodwill is less than its carrying value, that difference represents an impairment.
Determining the useful life of an intangible asset also requires judgment. Certain brand intangible assets are expected to have indefinite lives based on their history and our plans to continue to support and build the acquired brands. Other acquired intangible assets (e.g., certain brands, all customer relationships, patents and technologies) are expected to have determinable useful lives. Our assessment as to brands that have an indefinite life and those that have a determinable life is based on a number of factors including competitive environment, market share, brand history, underlying product life cycles, operating plans and the macroeconomic environment of the countries in which the brands are sold. Determinable-lived intangible assets are amortized to expense over their estimated lives. An impairment assessment for determinable-lived intangibles is only required when an event or change in circumstances indicates that the carrying amount of the asset may not be recoverable.
Most of our goodwill reporting units are comprised of a combination of legacy and acquired businesses and as a result have fair value cushions that, at a minimum, exceed two times their underlying carrying values. Certain of our goodwill reporting units, in particular Shave Care and Appliances, are comprised entirely of acquired businesses and as a result have fair value cushions that are not as high. Both of these wholly-acquired reporting units have fair value cushions (the fair values currently exceed the underlying carrying values). However, the overall Shave Care cushion, as well as the related Gillette indefinite-lived intangible asset cushion, have both been reduced to below
10%
, both due in large part to an increased competitive market environment, a deceleration of category growth caused by changing grooming habits and significant currency devaluations in a number of countries relative to the U.S. dollar that have occurred in recent years, and which has contributed to reduced cash flow projections. As a result, this reporting unit and indefinite-lived intangible asset are more susceptible to impairment risk.
The most significant assumptions utilized in the determination of the estimated fair values of Shave Care reporting unit and the Gillette indefinite-lived intangible asset are the residual net sales and earnings growth rates and discount rate. The residual growth rate represents the expected rate at which the reporting unit and Gillette brand are expected to grow beyond the 10-year time horizon. The residual growth rate utilized in our fair value estimates is consistent with the reporting unit and brand operating plans, and approximates expected long term category market growth rates. The residual growth rate is dependent on overall market growth rates, the competitive environment, inflation, relative currency exchange rates and business activities that impact market share. As a result, the residual growth rate could be adversely impacted by a sustained deceleration in category growth, grooming habit changes, devaluation of currencies against the U.S. dollar or an increased competitive environment. The discount rate, which is
30
The Procter & Gamble Company
consistent with a weighted average cost of capital that is likely to be expected by a market participant, is based upon industry required rates of return, including consideration of both debt and equity components of the capital structure. Our discount rate may be impacted by adverse changes in the macroeconomic environment, volatility in the equity and debt markets or other country specific factors, such as further devaluation of currencies against the U.S. dollar and changes in expected rates of inflation. While management can and has implemented strategies to address these events, significant changes in operating plans or adverse changes in the future could reduce the underlying cash flows used to estimate fair values and could result in a decline in fair value that could trigger future impairment charges of the business unit's goodwill and indefinite-lived intangibles. As of
June 30, 2018
, the carrying values of Shave Care goodwill and the Gillette indefinite-lived intangible asset are
$19.5 billion
and
$15.7 billion
, respectively.
The table below provides a sensitivity analysis for the Shave Care reporting unit and the Gillette indefinite lived intangible asset, utilizing reasonably possible changes in the assumptions for the residual net sales growth rate and the discount rate, to demonstrate the potential impacts to the estimated fair values. The table below provides, in isolation, the estimated fair value impacts related to a 50 basis point decrease to our residual net sales growth rate or a 50 basis point increase to our discount rate. Given the size of the fair value cushions, changes in the assumptions of this magnitude would result in an impairment of the underlying goodwill and could result in an impairment of the indefinite lived intangible asset.
|
Approximate Percent Change in Estimated Fair Value
|
|||
|
+50 bps Discount Rate
|
-50 bps
Residual Growth
|
||
|
Shave Care goodwill reporting unit
|
(10)%
|
(7)%
|
|
|
Gillette indefinite-lived intangible asset
|
(10)%
|
(7)%
|
|
See Note 4 to the Consolidated Financial Statements for additional discussion on goodwill and intangible asset impairment testing results.
New Accounting Pronouncements
Refer to Note 1 to the Consolidated Financial Statements for recently adopted accounting pronouncements and recently issued accounting pronouncements not yet adopted as of
June 30, 2018
.
OTHER INFORMATION
Hedging and Derivative Financial Instruments
As a multinational company with diverse product offerings, we are exposed to market risks, such as changes in interest rates, currency exchange rates and commodity prices. We evaluate exposures on a centralized basis to take advantage of natural exposure correlation and netting. Except within financing operations, we leverage the Company's diversified portfolio of exposures as a natural hedge and prioritize
operational hedging activities over financial market instruments. To the extent we choose to further manage volatility associated with the net exposures, we enter into various financial transactions which we account for using the applicable accounting guidance for derivative instruments and hedging activities. These financial transactions are governed by our policies covering acceptable counterparty exposure, instrument types and other hedging practices. See Note 9 to the Consolidated Financial Statements for a discussion of our accounting policies for derivative instruments.
Derivative positions are monitored using techniques including market valuation, sensitivity analysis and value-at-risk modeling. The tests for interest rate, currency rate and commodity derivative positions discussed below are based on the RiskManager™ value-at-risk model using a one-year horizon and a 95% confidence level. The model incorporates the impact of correlation (the degree to which exposures move together over time) and diversification (from holding multiple currency, commodity and interest rate instruments) and assumes that financial returns are normally distributed. Estimates of volatility and correlations of market factors are drawn from the RiskMetrics™ dataset as of
June 30, 2018
. In cases where data is unavailable in RiskMetrics™, a reasonable proxy is included.
Our market risk exposures relative to interest rates, currency rates and commodity prices, as discussed below, have not changed materially versus the previous reporting period. In addition, we are not aware of any facts or circumstances that would significantly impact such exposures in the near term.
Interest Rate Exposure on Financial Instruments.
Interest rate swaps are used to hedge exposures to interest rate movement on underlying debt obligations. Certain interest rate swaps denominated in foreign currencies are designated to hedge exposures to currency exchange rate movements on our investments in foreign operations. These currency interest rate swaps are designated as hedges of the Company's foreign net investments.
Based on our interest rate exposure as of and during the year ended
June 30, 2018
, including derivative and other instruments sensitive to interest rates, we believe a near-term change in interest rates, at a 95% confidence level based on historical interest rate movements, would not materially affect our financial statements.
Currency Rate Exposure on Financial Instruments.
Because we manufacture and sell products and finance operations in a number of countries throughout the world, we are exposed to the impact on revenue and expenses of movements in currency exchange rates. Corporate policy prescribes the range of allowable hedging activity. To manage the exchange rate risk associated with the financing of our operations, we primarily use forward contracts and currency swaps with maturities of less than 18 months. In addition, we have entered into certain currency swaps with maturities of up to five years to hedge our exposure to exchange rate movements on intercompany financing transactions.
Based on our currency rate exposure on derivative and other instruments as of and during the year ended
June 30, 2018
, we
The Procter & Gamble Company
31
believe, at a 95% confidence level based on historical currency rate movements, the impact on such instruments of a near-term change in currency rates would not materially affect our financial statements.
Commodity Price Exposure on Financial Instruments.
We use raw materials that are subject to price volatility caused by weather, supply conditions, political and economic variables and other unpredictable factors. We may use futures, options and swap contracts to manage the volatility related to the above exposures.
As of and during the years ended
June 30, 2018
and
June 30, 2017
, we did not have any commodity hedging activity.
Measures Not Defined By U.S. GAAP
In accordance with the SEC's Regulation G, the following provides definitions of the non-GAAP measures and the reconciliation to the most closely related GAAP measures. We believe that these measures provide useful perspective of underlying business trends (i.e. trends excluding non-recurring or unusual items) and results and provide a supplemental measure of year-on-year results. The non-GAAP measures described below are used by management in making operating decisions, allocating financial resources and for business strategy purposes. These measures may be useful to investors as they provide supplemental information about business performance and provide investors a view of our business results through the eyes of management. These measures are also used to evaluate senior management and are a factor in determining their at-risk compensation. These non-GAAP measures are not intended to be considered by the user in place of the related GAAP measure, but rather as supplemental information to our business results. These non-GAAP measures may not be the same as similar measures used by other companies due to possible differences in method and in the items or events being adjusted. These measures include:
Organic Sales Growth.
Organic sales growth is a non-GAAP measure of sales growth excluding the impacts of the India Goods & Services Tax changes, the impact of the Venezuela deconsolidation, acquisitions, divestitures and foreign exchange from year-over-year comparisons. We believe this measure provides investors with a supplemental understanding of underlying sales trends by providing sales growth on a consistent basis, and this measure is used in assessing achievement of management goals for at-risk compensation.
The following tables provide a numerical reconciliation of organic sales growth to reported net sales growth:
|
Year ended June 30, 2018
|
Net Sales Growth
|
Foreign Exchange Impact
|
Acquisition & Divestiture Impact/Other
(1)
|
Organic Sales Growth
|
||||
|
Beauty
|
9
|
%
|
(2
|
)%
|
—
|
%
|
7
|
%
|
|
Grooming
|
(1
|
)%
|
(3
|
)%
|
1
|
%
|
(3
|
)%
|
|
Health Care
|
5
|
%
|
(3
|
)%
|
—
|
%
|
2
|
%
|
|
Fabric & Home Care
|
3
|
%
|
(1
|
)%
|
1
|
%
|
3
|
%
|
|
Baby, Feminine & Family Care
|
(1
|
)%
|
(1
|
)%
|
—
|
%
|
(2
|
)%
|
|
TOTAL COMPANY
|
3
|
%
|
(2
|
)%
|
—
|
%
|
1
|
%
|
|
Year ended June 30, 2017
|
Net Sales Growth
|
Foreign Exchange Impact
|
Acquisition & Divestiture Impact/Other
(2)
|
Organic Sales Growth
|
||||
|
Beauty
|
—
|
%
|
2
|
%
|
1
|
%
|
3
|
%
|
|
Grooming
|
(3
|
)%
|
2
|
%
|
1
|
%
|
—
|
%
|
|
Health Care
|
2
|
%
|
2
|
%
|
1
|
%
|
5
|
%
|
|
Fabric & Home Care
|
—
|
%
|
2
|
%
|
1
|
%
|
3
|
%
|
|
Baby, Feminine & Family Care
|
(1
|
)%
|
2
|
%
|
—
|
%
|
1
|
%
|
|
TOTAL COMPANY
|
—
|
%
|
2
|
%
|
—
|
%
|
2
|
%
|
|
(1)
|
Acquisition & Divestiture Impact/Other includes the volume and mix impact of acquisitions and divestitures, the impact of the India Goods and Services Tax implementation and rounding impacts necessary to reconcile net sales to organic sales.
|
|
(2)
|
Acquisition & Divestiture Impact/Other includes the volume and mix impact of acquisitions and divestitures, the impact of the Venezuela deconsolidation and rounding impacts necessary to reconcile net sales to organic sales.
|
Adjusted Free Cash Flow.
Adjusted free cash flow is defined as operating cash flow less capital spending and excluding certain divestiture impacts (tax payments related to certain divestitures). Adjusted free cash flow represents the cash that the Company is able to generate after taking into account planned maintenance and asset expansion. We view adjusted free cash flow as an important measure because it is one factor used in determining the amount of cash available for dividends, share repurchases, acquisitions and other discretionary investment.
The following table provides a numerical reconciliation of adjusted free cash flow ($ millions):
|
Operating
Cash Flow
|
Capital
Spending
|
Divestiture impacts
(1)
|
Adjusted Free
Cash Flow
|
|||||||||
|
2018
|
$
|
14,867
|
|
$
|
(3,717
|
)
|
$
|
—
|
|
$
|
11,150
|
|
|
2017
|
12,753
|
|
(3,384
|
)
|
418
|
|
9,787
|
|
||||
|
2016
|
15,435
|
|
(3,314
|
)
|
—
|
|
12,121
|
|
||||
|
(1)
|
Divestiture impacts relate to tax payments for the Beauty Brands divestiture in fiscal 2017.
|
32
The Procter & Gamble Company
Adjusted Free Cash Flow Productivity.
Adjusted free cash flow productivity is defined as the ratio of adjusted free cash flow to net earnings excluding the transitional impact of the U.S. Tax Act, the losses on early debt extinguishment, the gain on the sale of the Batteries and Beauty Brands businesses and Batteries impairments. We view adjusted free cash flow productivity as a useful measure to help investors understand P&G’s ability to generate cash. Adjusted free cash flow productivity is used by management in making operating decisions, in allocating financial resources and for budget planning purposes. This measure is used in assessing the achievement of management goals for at-risk compensation. The Company's long-term target is to generate annual adjusted free cash flow productivity at or above 90 percent.
The following table provides a numerical reconciliation of adjusted free cash flow productivity ($ millions):
|
Net
Earnings
|
Adjustments to Net Earnings
(1)
|
Net Earnings Excluding Adjustments
|
Adjusted Free Cash Flow
|
Adjusted Free
Cash Flow
Productivity
|
||||||||||
|
2018
|
$
|
9,861
|
|
$
|
845
|
|
$
|
10,706
|
|
$
|
11,150
|
|
104
|
%
|
|
2017
|
15,411
|
|
(4,990
|
)
|
10,421
|
|
9,787
|
|
94
|
%
|
||||
|
2016
|
10,604
|
|
(72
|
)
|
10,532
|
|
12,121
|
|
115
|
%
|
||||
|
(1)
|
Adjustments to Net Earnings relate to the transitional impact of the U.S. Tax Act in fiscal 2018, the losses on early debt extinguishment in fiscal 2018 and 2017, the gain on the sale of the Beauty Brands business in 2017, and the gain on the sale of the Batteries business and the Batteries impairment in fiscal 2016.
|
Core EPS.
Core EPS is a measure of the Company's diluted net earnings per share from continuing operations adjusted as indicated. Management views this non-GAAP measure as a useful supplemental measure of Company performance over time. The table below provides a reconciliation of diluted net earnings per share to Core EPS, including the following reconciling items:
|
•
|
Incremental Restructuring
: The Company has had and continues to have an ongoing level of restructuring activities. Such activities have resulted in ongoing annual restructuring related charges of approximately $250 - $500 million before tax. In 2012, the Company began a $10 billion strategic productivity and cost savings initiative that includes incremental restructuring activities. In 2017, we communicated details of an additional multi-year productivity and cost savings plan. This results in incremental restructuring charges to accelerate productivity efforts and cost savings. The adjustment to Core earnings includes only the restructuring costs above what we believe are the normal recurring level of restructuring costs.
|
|
•
|
Transitional Impacts of the U.S. Tax Act
: As discussed in Note 5 to the Consolidated Financial Statements, the U.S. government enacted comprehensive tax legislation commonly referred to as the Tax Cuts and Jobs Act (the “U.S. Tax Act”) in December 2017. This resulted in a net charge of $602 million for the fiscal year 2018. The adjustment to core earnings only includes this transitional impact. It does not include the ongoing impacts of the lower U.S. statutory rate on current year earnings.
|
|
•
|
Early debt extinguishment charges
: In fiscal 2018 and 2017, the Company recorded after-tax charges of $243 million and $345 million, respectively, due to the early extinguishment of certain long-term debt. These charges represent the difference between the reacquisition price and the par value of the debt extinguished.
|
|
•
|
Charges for certain European legal matters
: Several countries in Europe issued separate complaints alleging that the Company, along with several other companies, engaged in violations of competition laws in prior periods. In 2016, the Company incurred after-tax charges of $11 million to adjust legal reserves related to these matters.
|
We do not view the above items to be indicative of underlying business results and their exclusion from Core earnings measures provides a more comparable measure of year-on-year results. These items are also excluded when evaluating senior management in determining their at-risk compensation.
The Procter & Gamble Company
33
|
THE PROCTER & GAMBLE COMPANY AND SUBSIDIARIES
(Amounts in Millions Except Per Share Amounts) Reconciliation of Non-GAAP Measures |
|||||||||||||||||||||||
|
Twelve Months Ended June 30, 2018
|
|||||||||||||||||||||||
|
AS REPORTED (GAAP)
|
INCREMENTAL RESTRUCTURING
|
TRANSITIONAL IMPACTS OF THE U.S. TAX ACT
|
EARLY DEBT EXTINGUISHMENT
|
ROUNDING
|
NON-GAAP (CORE)
|
||||||||||||||||||
|
COST OF PRODUCTS SOLD
|
$
|
34,268
|
|
$
|
(724
|
)
|
$
|
—
|
|
$
|
(1
|
)
|
$
|
33,543
|
|
||||||||
|
SELLING, GENERAL, AND ADMINISTRATIVE EXPENSE
|
18,853
|
|
(15
|
)
|
—
|
|
1
|
|
18,839
|
|
|||||||||||||
|
OPERATING INCOME
|
13,711
|
|
739
|
|
—
|
|
—
|
|
14,450
|
|
|||||||||||||
|
INCOME TAX ON CONTINUING OPERATIONS
|
3,465
|
|
129
|
|
(602
|
)
|
103
|
|
—
|
|
3,095
|
|
|||||||||||
|
NET EARNINGS ATTRIBUTABLE TO P&G
|
9,750
|
|
610
|
|
602
|
|
243
|
|
(1
|
)
|
11,204
|
|
|||||||||||
|
Core EPS
|
|
||||||||||||||||||||||
|
DILUTED NET EARNINGS PER COMMON SHARE*
|
$
|
3.67
|
|
$
|
0.23
|
|
$
|
0.23
|
|
$
|
0.09
|
|
$
|
—
|
|
$
|
4.22
|
|
|||||
* Diluted net earnings per share are calculated on Net earnings attributable to Procter & Gamble.
|
CHANGE VERSUS YEAR AGO
|
||||
|
CORE EPS
|
8
|
%
|
||
|
THE PROCTER & GAMBLE COMPANY AND SUBSIDIARIES
(Amounts in Millions Except Per Share Amounts) Reconciliation of Non-GAAP Measures |
|||||||||||||||||||||||
|
Twelve Months Ended June 30, 2017
|
|||||||||||||||||||||||
|
AS REPORTED (GAAP)
|
DISCONTINUED OPERATIONS
|
INCREMENTAL RESTRUCTURING
|
EARLY DEBT EXTINGUISHMENT
|
ROUNDING
|
NON-GAAP (CORE)
|
||||||||||||||||||
|
COST OF PRODUCTS SOLD
|
$
|
32,535
|
|
$
|
—
|
|
$
|
(498
|
)
|
$
|
—
|
|
$
|
—
|
|
$
|
32,037
|
|
|||||
|
SELLING, GENERAL, AND ADMINISTRATIVE EXPENSE
|
18,568
|
|
—
|
|
99
|
|
—
|
|
—
|
|
18,667
|
|
|||||||||||
|
OPERATING INCOME
|
13,955
|
|
—
|
|
399
|
|
—
|
|
—
|
|
14,354
|
|
|||||||||||
|
INCOME TAX ON CONTINUING OPERATIONS
|
3,063
|
|
—
|
|
120
|
|
198
|
|
—
|
|
3,381
|
|
|||||||||||
|
NET EARNINGS ATTRIBUTABLE TO P&G
|
15,326
|
|
(5,217
|
)
|
279
|
|
345
|
|
(1
|
)
|
10,732
|
|
|||||||||||
|
Core EPS
|
|||||||||||||||||||||||
|
DILUTED NET EARNINGS PER COMMON SHARE*
|
$
|
5.59
|
|
$
|
(1.90
|
)
|
$
|
0.10
|
|
$
|
0.13
|
|
$
|
—
|
|
$
|
3.92
|
|
|||||
* Diluted net earnings per share are calculated on Net earnings attributable to Procter & Gamble.
|
CHANGE VERSUS YEAR AGO
|
||||
|
CORE EPS
|
7
|
%
|
||
|
THE PROCTER & GAMBLE COMPANY AND SUBSIDIARIES
(Amounts in Millions Except Per Share Amounts) Reconciliation of Non-GAAP Measures |
|||||||||||||||||||||||
|
Twelve Months Ended June 30, 2016
|
|||||||||||||||||||||||
|
AS REPORTED (GAAP)
|
DISCONTINUED OPERATIONS
|
INCREMENTAL RESTRUCTURING
|
CHARGES FOR EUROPEAN LEGAL MATTERS
|
ROUNDING
|
NON-GAAP (CORE)
|
||||||||||||||||||
|
COST OF PRODUCTS SOLD
|
$
|
32,909
|
|
$
|
—
|
|
$
|
(624
|
)
|
$
|
—
|
|
$
|
—
|
|
$
|
32,285
|
|
|||||
|
SELLING, GENERAL, AND ADMINISTRATIVE EXPENSE
|
18,949
|
|
—
|
|
31
|
|
(13
|
)
|
—
|
|
18,967
|
|
|||||||||||
|
OPERATING INCOME
|
13,441
|
|
—
|
|
593
|
|
13
|
|
—
|
|
14,047
|
|
|||||||||||
|
INCOME TAX ON CONTINUING OPERATIONS
|
3,342
|
|
—
|
|
94
|
|
2
|
|
(1
|
)
|
3,437
|
|
|||||||||||
|
NET EARNINGS ATTRIBUTABLE TO P&G
|
10,508
|
|
(577
|
)
|
499
|
|
11
|
|
—
|
|
10,441
|
|
|||||||||||
|
Core EPS
|
|||||||||||||||||||||||
|
DILUTED NET EARNINGS PER COMMON SHARE*
|
$
|
3.69
|
|
$
|
(0.20
|
)
|
$
|
0.18
|
|
$
|
—
|
|
$
|
—
|
|
$
|
3.67
|
|
|||||
* Diluted net earnings per share are calculated on Net earnings attributable to Procter & Gamble.
Item 7A.
Quantitative and Qualitative Disclosures About Market Risk.
The information required by this item is incorporated by reference to the section entitled Other Information under Management's Disclosure and Analysis, and Note 9 to the Consolidated Financial Statements.
34
The Procter & Gamble Company
Item 8.
Financial Statements and Supplementary Data.
MANAGEMENT'S REPORT ON INTERNAL CONTROL OVER FINANCIAL REPORTING
Management is responsible for establishing and maintaining adequate internal control over financial reporting of The Procter & Gamble Company (as defined in Rule 13a-15(f) under the Securities Exchange Act of 1934, as amended). Our internal control over financial reporting is designed to provide reasonable assurance regarding the reliability of financial reporting and the preparation of financial statements for external purposes in accordance with generally accepted accounting principles in the United States of America.
Strong internal controls is an objective that is reinforced through our
Worldwide Business Conduct Manual
, which sets forth our commitment to conduct business with integrity, and within both the letter and the spirit of the law. Our people are deeply committed to our Purpose, Values, and Principles, which unite us in doing what’s right. Our system of internal controls includes written policies and procedures, segregation of duties, and the careful selection and development of employees. Additional key elements of our internal control structure include our Global Leadership Council, which is actively involved in oversight of the business strategies, initiatives, results and controls, our Disclosure Committee, which is responsible for evaluating disclosure implications of significant business activities and events, our Board of Directors, which provides strong and effective corporate governance, and our Audit Committee, which reviews significant accounting policies, financial reporting and internal control matters.
The Company's internal control over financial reporting includes a Control Self-Assessment Program that is conducted annually for critical financial reporting areas of the Company and is audited by our Global Internal Audit organization. Management takes the appropriate action to correct any identified control deficiencies. Global Internal Audit also performs financial and compliance audits around the world, provides training, and continuously improves our internal control processes.
Because of its inherent limitations, any system of internal control over financial reporting, no matter how well designed, may not prevent or detect misstatements due to the possibility that a control can be circumvented or overridden or that misstatements due to error or fraud may occur that are not detected. Also, because of changes in conditions, internal control effectiveness may vary over time.
Management assessed the effectiveness of the Company's internal control over financial reporting as of
June 30, 2018
, using criteria established in
Internal Control - Integrated Framework (2013)
issued by the Committee of Sponsoring Organizations of the Treadway Commission (COSO) and concluded that the Company maintained effective internal control over financial reporting as of
June 30, 2018
, based on these criteria.
Deloitte & Touche LLP, an independent registered public accounting firm, has audited the effectiveness of the Company's internal control over financial reporting as of
June 30, 2018
, as stated in their report which is included herein.
|
/s/ David S. Taylor
|
|
David S. Taylor
|
|
Chairman of the Board, President and Chief Executive Officer
|
|
/s/ Jon R. Moeller
|
|
Jon R. Moeller
|
|
Vice Chairman and Chief Financial Officer
|
|
August 7, 2018
|
The Procter & Gamble Company
35
REPORT OF INDEPENDENT REGISTERED PUBLIC ACCOUNTING FIRM
To the shareholders and the Board of Directors of The Procter & Gamble Company
Opinion on the Financial Statements
We have audited the accompanying Consolidated Balance Sheets of The Procter & Gamble Company and subsidiaries (the "Company") as of June 30, 2018 and 2017, the related Consolidated Statements of Earnings, Comprehensive Income, Shareholders’ Equity and Cash Flows for each of the three years in the period ended June 30, 2018 and the related notes (collectively referred to as the "financial statements"). In our opinion, the financial statements present fairly, in all material respects, the financial position of the Company at June 30, 2018 and 2017, and the results of its operations and its cash flows for each of the three years in the period ended June 30, 2018, in conformity with accounting principles generally accepted in the United States of America.
We have also audited, in accordance with the standards of the Public Company Accounting Oversight Board (United States) (PCAOB), the Company's internal control over financial reporting as of June 30, 2018, based on criteria established in
Internal Control - Integrated Framework (2013)
issued by the Committee of Sponsoring Organizations of the Treadway Commission and our report dated August 7, 2018 expressed an unqualified opinion on the Company's internal control over financial reporting.
Basis for Opinion
These financial statements are the responsibility of the Company's management. Our responsibility is to express an opinion on the Company's financial statements based on our audits. We are a public accounting firm registered with the PCAOB and are required to be independent with respect to the Company in accordance with the U.S. federal securities laws and the applicable rules and regulations of the Securities and Exchange Commission and the PCAOB.
We conducted our audits in accordance with the standards of the PCAOB. Those standards require that we plan and perform the audit to obtain reasonable assurance about whether the financial statements are free of material misstatement, whether due to error or fraud. Our audits included performing procedures to assess the risks of material misstatement of the financial statements, whether due to error or fraud, and performing procedures that respond to those risks. Such procedures included examining, on a test basis, evidence regarding the amounts and disclosures in the financial statements. Our audits also included evaluating the accounting principles used and significant estimates made by management, as well as evaluating the overall presentation of the financial statements. We believe that our audits provide a reasonable basis for our opinion.
|
/s/ Deloitte & Touche LLP
|
|
Cincinnati, Ohio
|
|
August 7, 2018
|
|
We have served as the Company’s auditor since 1890.
|
36
The Procter & Gamble Company
REPORT OF INDEPENDENT REGISTERED PUBLIC ACCOUNTING FIRM
To the shareholders and the Board of Directors of The Procter & Gamble Company
Opinion on Internal Control over Financial Reporting
We have audited the internal control over financial reporting of The Procter & Gamble Company and subsidiaries (the "Company") as of June 30, 2018, based on criteria established in
Internal Control - Integrated Framework (2013)
issued by the Committee of Sponsoring Organizations of the Treadway Commission(COSO). In our opinion, the Company maintained, in all material respects, effective internal control over financial reporting as of June 30, 2018, based on criteria established in
Internal Control - Integrated Framework (2013)
issued by COSO.
We have also audited, in accordance with the standards of the Public Company Accounting Oversight Board (United States) (PCAOB), the consolidated financial statements as of and for the year ended June 30, 2018, of the Company and our report dated August 7, 2018, expressed an unqualified opinion on those financial statements.
Basis for Opinion
The Company's management is responsible for maintaining effective internal control over financial reporting and for its assessment of the effectiveness of internal control over financial reporting, included in the accompanying Management’s Report on Internal Control over Financial Reporting. Our responsibility is to express an opinion on the Company’s internal control over financial reporting based on our audit. We are a public accounting firm registered with the PCAOB and are required to be independent with respect to the Company in accordance with the U.S. federal securities laws and the applicable rules and regulations of the Securities and Exchange Commission and the PCAOB.
We conducted our audit in accordance with the standards of the PCAOB. Those standards require that we plan and perform the audit to obtain reasonable assurance about whether effective internal control over financial reporting was maintained in all material respects. Our audit included obtaining an understanding of internal control over financial reporting, assessing the risk that a material weakness exists, testing and evaluating the design and operating effectiveness of internal control based on the assessed risk, and performing such other procedures as we considered necessary in the circumstances. We believe that our audit provides a reasonable basis for our opinion.
Definition and Limitations of Internal Control over Financial Reporting
A company’s internal control over financial reporting is a process designed to provide reasonable assurance regarding the reliability of financial reporting and the preparation of financial statements for external purposes in accordance with generally accepted accounting principles. A company’s internal control over financial reporting includes those policies and procedures that (1) pertain to the maintenance of records that, in reasonable detail, accurately and fairly reflect the transactions and dispositions of the assets of the company; (2) provide reasonable assurance that transactions are recorded as necessary to permit preparation of financial statements in accordance with generally accepted accounting principles, and that receipts and expenditures of the company are being made only in accordance with authorizations of management and directors of the company; and (3) provide reasonable assurance regarding prevention or timely detection of unauthorized acquisition, use, or disposition of the company’s assets that could have a material effect on the financial statements.
Because of its inherent limitations, internal control over financial reporting may not prevent or detect misstatements. Also, projections of any evaluation of effectiveness to future periods are subject to the risk that controls may become inadequate because of changes in conditions, or that the degree of compliance with the policies or procedures may deteriorate.
|
/s/ Deloitte & Touche LLP
|
|
Cincinnati, Ohio
|
|
August 7, 2018
|
The Procter & Gamble Company
37
|
Amounts in millions except per share amounts; Years ended June 30
|
2018
|
2017
|
2016
|
||||||||
|
NET SALES
|
$
|
|
|
$
|
|
|
$
|
|
|
||
|
Cost of products sold
|
|
|
|
|
|
|
|||||
|
Selling, general and administrative expense
|
|
|
|
|
|
|
|||||
|
OPERATING INCOME
|
|
|
|
|
|
|
|||||
|
Interest expense
|
|
|
|
|
|
|
|||||
|
Interest income
|
|
|
|
|
|
|
|||||
|
Other non-operating income/(expense), net
|
(
|
)
|
(
|
)
|
|
|
|||||
|
EARNINGS FROM CONTINUING OPERATIONS BEFORE INCOME TAXES
|
|
|
|
|
|
|
|||||
|
Income taxes on continuing operations
|
|
|
|
|
|
|
|||||
|
NET EARNINGS FROM CONTINUING OPERATIONS
|
|
|
|
|
|
|
|||||
|
NET EARNINGS FROM DISCONTINUED OPERATIONS
|
|
|
|
|
|
|
|||||
|
NET EARNINGS
|
|
|
|
|
|
|
|||||
|
Less: Net earnings attributable to noncontrolling interests
|
|
|
|
|
|
|
|||||
|
NET EARNINGS ATTRIBUTABLE TO PROCTER & GAMBLE
|
$
|
|
|
$
|
|
|
$
|
|
|
||
|
BASIC NET EARNINGS PER COMMON SHARE:
(1)
|
|||||||||||
|
Earnings from continuing operations
|
$
|
|
|
$
|
|
|
$
|
|
|
||
|
Earnings from discontinued operations
|
|
|
|
|
|
|
|||||
|
BASIC NET EARNINGS PER COMMON SHARE
|
$
|
|
|
$
|
|
|
$
|
|
|
||
|
DILUTED NET EARNINGS PER COMMON SHARE:
(1)
|
|||||||||||
|
Earnings from continuing operations
|
$
|
|
|
$
|
|
|
$
|
|
|
||
|
Earnings from discontinued operations
|
|
|
|
|
|
|
|||||
|
DILUTED NET EARNINGS PER COMMON SHARE
|
$
|
|
|
$
|
|
|
$
|
|
|
||
|
DIVIDENDS PER COMMON SHARE
|
$
|
|
|
$
|
|
|
$
|
|
|
||
|
(1)
|
|
See accompanying Notes to Consolidated Financial Statements.
38
The Procter & Gamble Company
Consolidated Statements of Comprehensive Income
|
Amounts in millions; Years ended June 30
|
2018
|
2017
|
2016
|
||||||||
|
NET EARNINGS
|
$
|
|
|
$
|
|
|
$
|
|
|
||
|
OTHER COMPREHENSIVE INCOME/(LOSS), NET OF TAX
|
|||||||||||
|
Financial statement foreign currency translation
|
(
|
)
|
|
|
(
|
)
|
|||||
|
Unrealized gains/(losses) on hedges (net of
$(279)
, $(186) and $5 tax, respectively)
|
(
|
)
|
(
|
)
|
|
|
|||||
|
Unrealized gains/(losses) on investment securities (net of
$0
, $(6) and $7 tax, respectively)
|
(
|
)
|
(
|
)
|
|
|
|||||
|
Unrealized gains/(losses) on defined benefit retirement plans (net of
$68
, $551 and $(621) tax, respectively)
|
|
|
|
|
(
|
)
|
|||||
|
TOTAL OTHER COMPREHENSIVE INCOME/(LOSS), NET OF TAX
|
(
|
)
|
|
|
(
|
)
|
|||||
|
TOTAL COMPREHENSIVE INCOME
|
|
|
|
|
|
|
|||||
|
Less: Total comprehensive income attributable to noncontrolling interests
|
|
|
|
|
|
|
|||||
|
TOTAL COMPREHENSIVE INCOME ATTRIBUTABLE TO PROCTER & GAMBLE
|
$
|
|
|
$
|
|
|
$
|
|
|
||
See accompanying Notes to Consolidated Financial Statements.
The Procter & Gamble Company
39
|
Amounts in millions; As of June 30
|
2018
|
2017
|
|||||
|
Assets
|
|||||||
|
CURRENT ASSETS
|
|||||||
|
Cash and cash equivalents
|
$
|
|
|
$
|
|
|
|
|
Available-for-sale investment securities
|
|
|
|
|
|||
|
Accounts receivable
|
|
|
|
|
|||
|
INVENTORIES
|
|||||||
|
Materials and supplies
|
|
|
|
|
|||
|
Work in process
|
|
|
|
|
|||
|
Finished goods
|
|
|
|
|
|||
|
Total inventories
|
|
|
|
|
|||
|
Prepaid expenses and other current assets
|
|
|
|
|
|||
|
TOTAL CURRENT ASSETS
|
|
|
|
|
|||
|
PROPERTY, PLANT AND EQUIPMENT, NET
|
|
|
|
|
|||
|
GOODWILL
|
|
|
|
|
|||
|
TRADEMARKS AND OTHER INTANGIBLE ASSETS, NET
|
|
|
|
|
|||
|
OTHER NONCURRENT ASSETS
|
|
|
|
|
|||
|
TOTAL ASSETS
|
$
|
|
|
$
|
|
|
|
|
Liabilities and Shareholders' Equity
|
|||||||
|
CURRENT LIABILITIES
|
|||||||
|
Accounts payable
|
$
|
|
|
$
|
|
|
|
|
Accrued and other liabilities
|
|
|
|
|
|||
|
Debt due within one year
|
|
|
|
|
|||
|
TOTAL CURRENT LIABILITIES
|
|
|
|
|
|||
|
LONG-TERM DEBT
|
|
|
|
|
|||
|
DEFERRED INCOME TAXES
|
|
|
|
|
|||
|
OTHER NONCURRENT LIABILITIES
|
|
|
|
|
|||
|
TOTAL LIABILITIES
|
|
|
|
|
|||
|
SHAREHOLDERS' EQUITY
|
|||||||
|
Convertible Class A preferred stock, stated value $1 per share (600 shares authorized)
|
|
|
|
|
|||
|
Non-Voting Class B preferred stock, stated value $1 per share (200 shares authorized)
|
|
|
|
|
|||
|
Common stock, stated value $1 per share (10,000 shares authorized; shares issued: 2018 - 4,009.2, 2017 - 4,009.2)
|
|
|
|
|
|||
|
Additional paid-in capital
|
|
|
|
|
|||
|
Reserve for ESOP debt retirement
|
(
|
)
|
(
|
)
|
|||
|
Accumulated other comprehensive income/(loss)
|
(
|
)
|
(
|
)
|
|||
|
Treasury stock, at cost (shares held: 2018 -1,511.2, 2017 - 1,455.9)
|
(
|
)
|
|
(
|
)
|
||
|
Retained earnings
|
|
|
|
|
|||
|
Noncontrolling interest
|
|
|
|
|
|||
|
TOTAL SHAREHOLDERS' EQUITY
|
|
|
|
|
|||
|
TOTAL LIABILITIES AND SHAREHOLDERS' EQUITY
|
$
|
|
|
$
|
|
|
|
See accompanying Notes to Consolidated Financial Statements.
40
The Procter & Gamble Company
Consolidated Statements of Shareholders' Equity
|
Dollars in millions; shares in thousands
|
Common Stock
|
Preferred Stock
|
Add-itional Paid-In Capital
|
Reserve for ESOP Debt Retirement
|
Accumu-lated
Other Comp-rehensive Income/(Loss) |
Treasury Stock
|
Retained Earnings
|
Non-controlling Interest
|
Total Share-holders' Equity
|
||||||||||||||||||||
|
Shares
|
Amount
|
||||||||||||||||||||||||||||
|
BALANCE JUNE 30, 2015
|
|
|
|
$
|
|
|
$
|
|
|
$
|
|
|
($
|
)
|
|
($
|
)
|
|
($
|
)
|
|
$
|
|
|
$
|
|
|
$
|
|
|
Net earnings
|
|
|
|
|
|
|
|||||||||||||||||||||||
|
Other comprehensive loss
|
(
|
)
|
(
|
)
|
|||||||||||||||||||||||||
|
Dividends and dividend equivalents:
|
|||||||||||||||||||||||||||||
|
Common
|
(
|
)
|
(
|
)
|
|||||||||||||||||||||||||
|
Preferred, net of tax benefits
|
(
|
)
|
(
|
)
|
|||||||||||||||||||||||||
|
Treasury stock purchases
(1)
|
(
|
)
|
(
|
)
|
(
|
)
|
|||||||||||||||||||||||
|
Employee stock plans
|
|
|
(
|
)
|
|
|
|
|
|||||||||||||||||||||
|
Preferred stock conversions
|
|
|
(
|
)
|
|
|
|
|
|
|
|||||||||||||||||||
|
ESOP debt impacts
|
|
|
|
|
|
|
|||||||||||||||||||||||
|
Noncontrolling interest, net
|
(
|
)
|
(
|
)
|
|||||||||||||||||||||||||
|
BALANCE JUNE 30, 2016
|
|
|
|
$
|
|
|
$
|
|
|
$
|
|
|
($
|
)
|
|
($
|
)
|
|
($
|
)
|
|
$
|
|
|
$
|
|
|
$
|
|
|
Net earnings
|
|
|
|
|
|
|
|||||||||||||||||||||||
|
Other comprehensive loss
|
|
|
|
|
|||||||||||||||||||||||||
|
Dividends and dividend equivalents:
|
|||||||||||||||||||||||||||||
|
Common
|
(
|
)
|
(
|
)
|
|||||||||||||||||||||||||
|
Preferred, net of tax benefits
|
(
|
)
|
(
|
)
|
|||||||||||||||||||||||||
|
Treasury stock purchases
(2)
|
(
|
)
|
(
|
)
|
(
|
)
|
|||||||||||||||||||||||
|
Employee stock plans
|
|
|
(
|
)
|
|
|
|
|
|||||||||||||||||||||
|
Preferred stock conversions
|
|
|
(
|
)
|
|
|
|
|
|
|
|||||||||||||||||||
|
ESOP debt impacts
|
|
|
|
|
|
|
|||||||||||||||||||||||
|
Noncontrolling interest, net
|
(
|
)
|
(
|
)
|
|||||||||||||||||||||||||
|
BALANCE JUNE 30, 2017
|
|
|
|
$
|
|
|
$
|
|
|
$
|
|
|
($
|
)
|
|
($
|
)
|
|
($
|
)
|
|
$
|
|
|
$
|
|
|
$
|
|
|
Net earnings
|
|
|
|
|
|
|
|||||||||||||||||||||||
|
Other comprehensive loss
|
(
|
)
|
(
|
)
|
(
|
)
|
|||||||||||||||||||||||
|
Dividends and dividend equivalents:
|
|||||||||||||||||||||||||||||
|
Common
|
(
|
)
|
(
|
)
|
|||||||||||||||||||||||||
|
Preferred, net of tax benefits
|
(
|
)
|
(
|
)
|
|||||||||||||||||||||||||
|
Treasury stock purchases
|
(
|
)
|
(
|
)
|
(
|
)
|
|||||||||||||||||||||||
|
Employee stock plans
|
|
|
|
|
|
|
|
|
|||||||||||||||||||||
|
Preferred stock conversions
|
|
|
(
|
)
|
|
|
|
|
|
|
|||||||||||||||||||
|
ESOP debt impacts
|
|
|
|
|
|
|
|||||||||||||||||||||||
|
Noncontrolling interest, net
|
(
|
)
|
(
|
)
|
|||||||||||||||||||||||||
|
BALANCE JUNE 30, 2018
|
|
|
|
$
|
|
|
$
|
|
|
$
|
|
|
($
|
)
|
|
($
|
)
|
|
($
|
)
|
|
$
|
|
|
$
|
|
|
$
|
|
|
(1)
|
|
|
(2)
|
|
See accompanying Notes to Consolidated Financial Statements.
The Procter & Gamble Company
41
|
Amounts in millions; Years ended June 30
|
2018
|
2017
|
2016
|
||||||||
|
CASH AND CASH EQUIVALENTS, BEGINNING OF YEAR
|
$
|
|
|
$
|
|
|
$
|
|
|
||
|
OPERATING ACTIVITIES
|
|||||||||||
|
Net earnings
|
|
|
|
|
|
|
|||||
|
Depreciation and amortization
|
|
|
|
|
|
|
|||||
|
Loss on early extinguishment of debt
|
|
|
|
|
|
|
|||||
|
Share-based compensation expense
|
|
|
|
|
|
|
|||||
|
Deferred income taxes
|
(
|
)
|
(
|
)
|
(
|
)
|
|||||
|
Gain on sale of assets
|
(
|
)
|
(
|
)
|
(
|
)
|
|||||
|
Goodwill and intangible asset impairment charges
|
|
|
|
|
|
|
|||||
|
Change in accounts receivable
|
(
|
)
|
(
|
)
|
|
|
|||||
|
Change in inventories
|
(
|
)
|
|
|
|
|
|||||
|
Change in accounts payable, accrued and other liabilities
|
|
|
(
|
)
|
|
|
|||||
|
Change in other operating assets and liabilities
|
|
|
(
|
)
|
|
|
|||||
|
Other
|
|
|
|
|
|
|
|||||
|
TOTAL OPERATING ACTIVITIES
|
|
|
|
|
|
|
|||||
|
INVESTING ACTIVITIES
|
|||||||||||
|
Capital expenditures
|
(
|
)
|
(
|
)
|
(
|
)
|
|||||
|
Proceeds from asset sales
|
|
|
|
|
|
|
|||||
|
Acquisitions, net of cash acquired
|
(
|
)
|
(
|
)
|
(
|
)
|
|||||
|
Purchases of short-term investments
|
(
|
)
|
(
|
)
|
(
|
)
|
|||||
|
Proceeds from sales and maturities of short-term investments
|
|
|
|
|
|
|
|||||
|
Pre-divestiture addition of restricted cash related to the Beauty Brands divestiture
|
|
|
(
|
)
|
(
|
)
|
|||||
|
Cash transferred at closing related to the Beauty Brands divestiture
|
|
|
(
|
)
|
|
|
|||||
|
Release of restricted cash upon closing of the Beauty Brands divestiture
|
|
|
|
|
|
|
|||||
|
Cash transferred in Batteries divestiture
|
|
|
|
|
(
|
)
|
|||||
|
Change in other investments
|
|
|
(
|
)
|
|
|
|||||
|
TOTAL INVESTING ACTIVITIES
|
(
|
)
|
(
|
)
|
(
|
)
|
|||||
|
FINANCING ACTIVITIES
|
|||||||||||
|
Dividends to shareholders
|
(
|
)
|
(
|
)
|
(
|
)
|
|||||
|
Change in short-term debt
|
(
|
)
|
|
|
(
|
)
|
|||||
|
Additions to long-term debt
|
|
|
|
|
|
|
|||||
|
Reductions of long-term debt
(1)
|
(
|
)
|
(
|
)
|
(
|
)
|
|||||
|
Treasury stock purchases
|
(
|
)
|
(
|
)
|
(
|
)
|
|||||
|
Treasury stock from cash infused in Batteries divestiture
|
|
|
|
|
(
|
)
|
|||||
|
Impact of stock options and other
|
|
|
|
|
|
|
|||||
|
TOTAL FINANCING ACTIVITIES
|
(
|
)
|
(
|
)
|
(
|
)
|
|||||
|
EFFECT OF EXCHANGE RATE CHANGES ON CASH AND CASH EQUIVALENTS
|
|
|
(
|
)
|
(
|
)
|
|||||
|
CHANGE IN CASH AND CASH EQUIVALENTS
|
(
|
)
|
(
|
)
|
|
|
|||||
|
CASH AND CASH EQUIVALENTS, END OF YEAR
|
$
|
|
|
$
|
|
|
$
|
|
|
||
|
SUPPLEMENTAL DISCLOSURE
|
|||||||||||
|
Cash payments for interest
|
$
|
|
|
$
|
|
|
$
|
|
|
||
|
Cash payment for income taxes
|
|
|
|
|
|
|
|||||
|
Divestiture of Batteries business in exchange for shares of P&G stock
(2)
|
—
|
|
—
|
|
4,213
|
|
|||||
|
Divestiture of Beauty business in exchange for shares of P&G stock and assumption of debt
|
—
|
|
11,360
|
|
—
|
|
|||||
|
Assets acquired through non-cash capital leases are immaterial for all periods.
|
|||||||||||
|
(
1)
|
|
|
(2)
|
Includes $1,730 from cash infused into the Batteries business pursuant to the divestiture agreement (see Note 13).
|
See accompanying Notes to Consolidated Financial Statements.
42
The Procter & Gamble Company
Notes to Consolidated Financial Statements
NOTE 1
The Consolidated Financial Statements include the Company and its controlled subsidiaries. Intercompany transactions are eliminated.
Sales are recognized when revenue is realized or realizable and has been earned. Revenue transactions represent sales of inventory. The revenue recorded is presented net of sales and other taxes we collect on behalf of governmental authorities.
The revenue includes shipping and handling costs, which generally are included in the list price to the customer. Our policy is to recognize revenue when title to the product, ownership and risk of loss transfer to the customer, which can be on the date of shipment or the date of receipt by the customer. A provision for payment discounts and product return allowances is recorded as a reduction of sales in the same period the revenue is recognized.
Financial statements of operating subsidiaries outside the U.S. generally are measured using the local currency as the functional currency. Adjustments to translate those statements into U.S. dollars are recorded in Other comprehensive income (OCI). For subsidiaries operating in highly inflationary economies, the U.S. dollar is the functional currency. Re-
Amounts in millions of dollars except per share amounts or as otherwise specified.
The Procter & Gamble Company
43
Investment securities consist of readily marketable debt and equity securities. Unrealized gains or losses from investments classified as trading, if any, are charged to earnings. Unrealized gains or losses on securities classified as available-for-sale are generally recorded in OCI. If an available-for-sale security is other than temporarily impaired, the loss is charged to either earnings or OCI depending on our intent and ability to retain the security until we recover the full cost basis and the extent of the loss attributable to the creditworthiness of the issuer. Investment securities are included as Available-for-sale investment securities and Other noncurrent assets in the Consolidated Balance Sheets.
Property, plant and equipment is recorded at cost reduced by accumulated depreciation. Depreciation expense is recognized over the assets' estimated useful lives using the straight-line method. Machinery and equipment includes office furniture and fixtures (
15
-year life), computer equipment and capitalized software (
3
- to
5
-year lives) and manufacturing equipment (
3
-
Goodwill and indefinite-lived intangible assets are not amortized, but are evaluated for impairment annually or more often if indicators of a potential impairment are present. Our annual impairment testing of goodwill is performed separately from our impairment testing of indefinite-lived intangible assets.
We have acquired brands that have been determined to have indefinite lives. Those assets are evaluated annually for impairment. We evaluate a number of factors to determine whether an indefinite life is appropriate, including the competitive environment, market share, brand history, underlying product life cycles, operating plans and the macroeconomic environment of the countries in which the brands are sold. In addition, when certain events or changes in operating conditions occur, an additional impairment assessment is performed and indefinite-lived assets may be adjusted to a determinable life.
The cost of intangible assets with determinable useful lives is amortized to reflect the pattern of economic benefits consumed, either on a straight-line or accelerated basis over the estimated periods benefited. Patents, technology and other intangible assets with contractual terms are generally amortized over their respective legal or contractual lives. Customer relationships, brands and other non-contractual intangible assets with determinable lives are amortized over periods generally ranging from
5
to
30
years. When certain events or changes in operating conditions occur, an impairment assessment is performed and remaining lives of intangible assets with determinable lives may be adjusted.
In May 2014, the FASB issued ASU 2014-09, “Revenue from Contracts with Customers (Topic 606)." This guidance outlines a single, comprehensive model of accounting for revenue from contracts with customers. We will adopt the standard on July 1, 2018, using the modified retrospective transition method. Our revenue is primarily generated from the sale of finished
Amounts in millions of dollars except per share amounts or as otherwise specified.
44
The Procter & Gamble Company
product to customers. Those sales predominantly contain a single delivery element and revenue is recognized at a single point in time when ownership, risks and rewards transfer. Accordingly, the timing of revenue recognition is not materially impacted by the new standard. The adoption of the new standard will impact the accrual timing for certain portions of our customer and consumer promotional spending, which will result in a cumulative adjustment to retained earnings of up to
$
350
, net of tax, on the date of adoption. The provisions of the new standard will also impact the classification of certain payments to customers, moving an immaterial amount of such payments (approximately
$
300
) from expense to a deduction from net sales. This new guidance will not have any other material impacts on our Consolidated Financial Statements, including financial disclosures.
In February 2016, the FASB issued ASU 2016-02, "Leases (Topic 842)." The standard requires lessees to recognize lease assets and lease liabilities on the balance sheet and requires expanded disclosures about leasing arrangements. We plan to adopt the standard on July 1, 2019. We are currently assessing the impact that the new standard will have on our Consolidated Financial Statements, which will consist primarily of a balance sheet gross up of our operating leases to show equal and offsetting lease assets and lease liabilities. For additional details on operating leases, see Note 12.
In January 2017, the FASB issued ASU 2017-04, “Intangibles-Goodwill and Other (Topic 350): Simplifying the Test for Goodwill Impairment.” The standard simplifies the accounting for goodwill impairment by requiring a goodwill impairment to be measured using a single step impairment model, whereby the impairment equals the difference between the carrying amount and the fair value of the specified reporting units in their entirety. This eliminates the second step of the current impairment model that requires companies to first estimate the fair value of all assets in a reporting unit, and then measure impairments based on those fair values and a residual measurement approach. It also specifies that any loss recognized should not exceed the total amount of goodwill allocated to that reporting unit. We will adopt the standard no later than July 1, 2020. The impact of the new standard will be dependent on the specific facts and circumstances of future individual impairments, if any.
In March 2017, the FASB issued ASU 2017-07, "Compensation-Retirement Benefits: Improving the Presentation of Net Periodic Pension Cost and Net Periodic Postretirement Benefit Cost (Topic 715).” This guidance requires an entity to disaggregate the current service cost component from the other components of net benefit costs in the face of the income statement. It requires the service cost component to be presented with other current compensation costs for the related employees in the operating section of the income statement. Other components of net benefit cost are required to be presented outside of income from operations. We will adopt the standard retrospectively on July 1, 2018. The adoption of ASU 2017-07 is not expected to have a material impact on our Consolidated Financial Statements. We currently classify all net periodic pension costs within operating costs (as part of Cost of products sold and Selling,
general and administrative expense). Had this standard been effective and adopted during fiscal
2018
, Cost of products sold and Selling, general and administrative costs would have increased approximately
$
164
and
$
184
, respectively, for the year ended
June 30, 2018
with an offsetting change in Other non-operating income/(expense), net.
In August 2017, the FASB issued ASU 2017-12, “Derivatives and Hedging (Topic 815): Targeted Improvements to Accounting for Hedging Activities." This standard enables entities to better portray the economics of their risk management activities in the financial statements and enhances the transparency and understandability of hedge results through improved disclosures. The new standard is effective for us beginning July 1, 2019, with early adoption permitted. We elected to early adopt the new guidance in the first quarter of fiscal year 2018. The amended presentation and disclosure guidance was applied on a prospective basis. The primary impact of adoption is the required disclosure changes. The adoption of the new standard did not have a material impact on our Consolidated Financial Statements, including the cumulative-effect adjustment required upon adoption.
NOTE 2
During fiscal 2017, the Company completed the divestiture of
four
product categories, comprised of
43
of its beauty brands. The transactions included the global salon professional hair care and color, retail hair color, cosmetics and the fragrance businesses, along with select hair styling brands. In fiscal 2016, the Company completed the divestiture of its Batteries business to Berkshire Hathaway. Each of these businesses are reported as discontinued operations for all periods presented (see Note 13).
Under U.S. GAAP, our Global Business Units (GBUs) are aggregated into
five
reportable segments: 1)
Beauty
, 2)
Grooming
, 3)
Health Care
, 4)
Fabric & Home Care
and 5)
Baby, Feminine & Family Care
. Our
five
reportable segments are comprised of:
|
•
|
Beauty
: Hair Care (Conditioner, Shampoo, Styling Aids, Treatments); Skin and Personal Care (Antiperspirant and Deodorant, Personal Cleansing, Skin Care);
|
|
•
|
Grooming
: Shave Care (Female Blades & Razors, Male Blades & Razors, Pre- and Post-Shave Products, Other Shave Care); Appliances
|
|
•
|
Health Care
: Oral Care (Toothbrushes, Toothpaste, Other Oral Care); Personal Health Care (Gastrointestinal, Rapid Diagnostics, Respiratory, Vitamins/Minerals/Supplements, Other Personal Health Care);
|
|
•
|
Fabric & Home Care
: Fabric Care (Fabric Enhancers, Laundry Additives, Laundry Detergents); Home Care (Air Care, Dish Care, P&G Professional, Surface Care ); and
|
|
•
|
Baby, Feminine & Family Care
: Baby Care (Baby Wipes, Diapers and Pants); Feminine Care (Adult Incontinence, Feminine Care); Family Care (Paper Towels, Tissues, Toilet Paper).
|
Amounts in millions of dollars except per share amounts or as otherwise specified.
The Procter & Gamble Company
45
The accounting policies of the segments are generally the same as those described in Note 1. Differences between these policies and U.S. GAAP primarily reflect income taxes, which are reflected in the segments using applicable blended statutory rates. Adjustments to arrive at our effective tax rate are included in Corporate, including the impacts from the U.S. Tax Act in fiscal 2018 (see Note 5).
Corporate includes certain operating and non-operating activities that are not reflected in the operating results used internally to measure and evaluate the businesses, as well as items to adjust management reporting principles to U.S. GAAP. Operating activities in Corporate include the results of incidental businesses managed at the corporate level. Operating elements also include certain employee benefit costs, the costs of certain restructuring-type activities to maintain a competitive cost structure, including manufacturing and workforce optimization, certain significant asset impairment charges and other general Corporate items. The non-operating elements in Corporate primarily include interest expense, certain acquisition and divestiture gains, interest and investing income and other financing costs.
Total assets for the reportable segments include those assets managed by the reportable segment, primarily inventory, fixed assets and intangible assets. Other assets, primarily cash, accounts receivable, investment securities and goodwill, are included in Corporate.
Our business units are comprised of similar product categories.
Nine
business units individually accounted for 5% or more of consolidated net sales as follows:
|
% of Sales by Business Unit
(1)
|
|||||
|
Years ended June 30
|
2018
|
2017
|
2016
|
||
|
Fabric Care
|
|
|
|
||
|
Baby Care
|
|
|
|
||
|
Hair Care
|
|
|
|
||
|
Home Care
|
|
|
|
||
|
Skin and Personal Care
|
|
|
|
||
|
Shave Care
|
|
|
|
||
|
Family Care
|
|
|
|
||
|
Oral Care
|
|
|
|
||
|
Feminine Care
|
|
|
|
||
|
All Other
|
|
|
|
||
|
TOTAL
|
|
|
|
||
|
(1)
|
|
The Company had net sales in the U.S. of
$
27.3
billion
,
$
27.3
billion
and
$
27.0
billion
for the years ended
June 30, 2018
,
2017
and
2016
, respectively. Long-lived assets in the U.S. totaled
$
9.7
billion
and
$
8.8
billion
as of
June 30, 2018
and
2017
, respectively. Long-lived assets consists of property, plant and equipment. No other country's net sales or long-lived assets exceed 10% of the Company totals.
Amounts in millions of dollars except per share amounts or as otherwise specified.
46
The Procter & Gamble Company
|
Global Segment Results
|
Net Sales
|
Earnings/(Loss)
from
Continuing
Operations
Before
Income Taxes
|
Net Earnings/(Loss) from Continuing Operations
|
Depreciation
and
Amortization
|
Total
Assets
|
Capital
Expenditures
|
|||||||||||||||||||
|
BEAUTY
|
2018
|
$
|
|
|
$
|
|
|
$
|
|
|
$
|
|
|
$
|
|
|
$
|
|
|
||||||
|
2017
|
|
|
|
|
|
|
|
|
|
|
|
|
|||||||||||||
|
2016
|
|
|
|
|
|
|
|
|
|
|
|
|
|||||||||||||
|
GROOMING
|
2018
|
|
|
|
|
|
|
|
|
|
|
|
|
||||||||||||
|
2017
|
|
|
|
|
|
|
|
|
|
|
|
|
|||||||||||||
|
2016
|
|
|
|
|
|
|
|
|
|
|
|
|
|||||||||||||
|
HEALTH CARE
|
2018
|
|
|
|
|
|
|
|
|
|
|
|
|
||||||||||||
|
2017
|
|
|
|
|
|
|
|
|
|
|
|
|
|||||||||||||
|
2016
|
|
|
|
|
|
|
|
|
|
|
|
|
|||||||||||||
|
FABRIC & HOME CARE
|
2018
|
|
|
|
|
|
|
|
|
|
|
|
|
||||||||||||
|
2017
|
|
|
|
|
|
|
|
|
|
|
|
|
|||||||||||||
|
2016
|
|
|
|
|
|
|
|
|
|
|
|
|
|||||||||||||
|
BABY, FEMININE & FAMILY CARE
|
2018
|
|
|
|
|
|
|
|
|
|
|
|
|
||||||||||||
|
2017
|
|
|
|
|
|
|
|
|
|
|
|
|
|||||||||||||
|
2016
|
|
|
|
|
|
|
|
|
|
|
|
|
|||||||||||||
|
CORPORATE
(1)
|
2018
|
|
|
(
|
)
|
(
|
)
|
|
|
|
|
|
|
||||||||||||
|
2017
|
|
|
(
|
)
|
|
|
|
|
|
|
|
|
|||||||||||||
|
2016
|
|
|
(
|
)
|
(
|
)
|
|
|
|
|
|
|
|||||||||||||
|
TOTAL COMPANY
|
2018
|
$
|
|
|
$
|
|
|
$
|
|
|
$
|
|
|
$
|
|
|
$
|
|
|
||||||
|
2017
|
|
|
|
|
|
|
|
|
|
|
|
|
|||||||||||||
|
2016
|
|
|
|
|
|
|
|
|
|
|
|
|
|||||||||||||
|
(1)
|
|
NOTE 3
|
As of June 30
|
2018
|
2017
|
|||||
|
PROPERTY, PLANT AND EQUIPMENT
|
|||||||
|
Buildings
|
$
|
|
|
$
|
|
|
|
|
Machinery and equipment
|
|
|
|
|
|||
|
Land
|
|
|
|
|
|||
|
Construction in progress
|
|
|
|
|
|||
|
TOTAL PROPERTY, PLANT AND EQUIPMENT
|
|
|
|
|
|||
|
Accumulated depreciation
|
(
|
)
|
(
|
)
|
|||
|
PROPERTY, PLANT AND EQUIPMENT, NET
|
$
|
|
|
$
|
|
|
|
|
As of June 30
|
2018
|
2017
|
|||||
|
ACCRUED AND OTHER LIABILITIES - CURRENT
|
|||||||
|
Marketing and promotion
|
$
|
|
|
$
|
|
|
|
|
Compensation expenses
|
|
|
|
|
|||
|
Restructuring reserves
|
|
|
|
|
|||
|
Taxes payable
|
|
|
|
|
|||
|
Legal and environmental
|
|
|
|
|
|||
|
Other
|
|
|
|
|
|||
|
TOTAL
|
$
|
|
|
$
|
|
|
|
|
OTHER NONCURRENT LIABILITIES
|
|||||||
|
Pension benefits
|
$
|
|
|
$
|
|
|
|
|
Other postretirement benefits
|
|
|
|
|
|||
|
Uncertain tax positions
|
|
|
|
|
|||
|
U.S. Tax Act transitional tax payable
|
|
|
|
|
|||
|
Other
|
|
|
|
|
|||
|
TOTAL
|
$
|
|
|
$
|
|
|
|
Amounts in millions of dollars except per share amounts or as otherwise specified.
The Procter & Gamble Company
47
RESTRUCTURING PROGRAM
The Company has historically incurred an ongoing annual level of restructuring-type activities to maintain a competitive cost structure, including manufacturing and workforce optimization. Before-tax costs incurred under the ongoing program have generally ranged from
$
250
to
$
500
annually. In fiscal 2012, the Company initiated an incremental restructuring program (covering fiscal 2012 through 2017) as part of a productivity and cost savings plan to reduce costs in the areas of supply chain, research and development, marketing activities and overhead expenses. The productivity and cost savings plan was designed to accelerate cost reductions by streamlining management decision making, manufacturing and other work processes in order to help fund the Company's growth strategy. Total restructuring costs incurred under the plan through fiscal 2017 was
$
5.6
billion
,
before tax.
In fiscal 2017 the Company announced specific elements of another incremental multi-year productivity and cost savings plan to further reduce costs in the areas of supply chain, certain marketing activities and overhead expenses. This program is expected to result in incremental enrollment reductions, along with further optimization of the supply chain and other manufacturing processes.
Restructuring costs incurred consist primarily of costs to separate employees, asset-related costs to exit facilities and other costs. The Company incurred total restructuring charges of
$
1,070
and
$
754
for the years ended
June 30, 2018
and
2017
, respectively. An additional amount of approximately
$
800
is expected to be incurred in fiscal 2019. Of the charges incurred,
$
251
and
$
137
were recorded in SG&A for the years ended
June 30, 2018
and
2017
, respectively and
$
819
and
$
593
were recorded in Cost of products sold for the years ended
June 30, 2018
and
2017
, respectively. The remainder of the charges for fiscal 2017 were included in Net earnings from discontinued operations.
The following table presents restructuring activity for the years ended
June 30, 2018
and
2017
:
|
Amounts in millions
|
Separations
|
Asset-Related Costs
|
Other
|
Total
|
||||||||
|
RESERVE JUNE 30, 2016
|
$
|
|
|
$
|
|
|
$
|
|
|
$
|
|
|
|
Charges
|
|
|
|
|
|
|
|
|
||||
|
Cash spent
(1)
|
(
|
)
|
|
|
(
|
)
|
(
|
)
|
||||
|
Charges against assets
|
|
|
(
|
)
|
|
|
(
|
)
|
||||
|
RESERVE JUNE 30, 2017
|
|
|
|
|
|
|
|
|
||||
|
Charges
|
|
|
|
|
|
|
|
|
||||
|
Cash spent
|
(
|
)
|
|
|
(
|
)
|
(
|
)
|
||||
|
Charges against assets
|
|
|
(
|
)
|
|
|
(
|
)
|
||||
|
RESERVE JUNE 30, 2018
|
$
|
|
|
$
|
|
|
$
|
|
|
$
|
|
|
|
(1)
|
|
Separation Costs
Employee separation charges for the years ended
June 30, 2018
and
2017
relate to severance packages for approximately
2,720
and
2,120
employees, respectively. The packages were primarily voluntary and the amounts were calculated based on salary levels and past service periods. Severance costs related to voluntary separations are generally charged to earnings when the employee accepts the offer.
Asset-Related Costs
Asset-related costs consist of both asset write-downs and accelerated depreciation. Asset write-downs relate to the establishment of a new fair value basis for assets held-for-sale or disposal. These assets were written down to the lower of their current carrying basis or amounts expected to be realized upon disposal, less minor disposal costs. Charges for accelerated depreciation relate to long-lived assets that will be taken out of service prior to the end of their normal service period. These assets relate primarily to manufacturing consolidations and technology standardizations. The asset-related charges will not have a significant impact on future depreciation charges.
Other Costs
Other restructuring-type charges are incurred as a direct result of the restructuring program. Such charges primarily include asset removal and termination of contracts related to supply chain optimization.
Consistent with our historical policies for ongoing restructuring-type activities, the restructuring program charges are funded by and included within Corporate for both management and segment reporting. Accordingly, all of the charges under the program are included within the Corporate reportable segment.
|
Years ended June 30
|
2018
|
2017
|
2016
|
||||||
|
Beauty
|
$
|
|
|
$
|
|
|
$
|
|
|
|
Grooming
|
|
|
|
|
|
|
|||
|
Health Care
|
|
|
|
|
|
|
|||
|
Fabric & Home Care
|
|
|
|
|
|
|
|||
|
Baby, Feminine & Family Care
|
|
|
|
|
|
|
|||
|
Corporate
(1)
|
|
|
|
|
|
|
|||
|
Total Company
|
$
|
|
|
$
|
|
|
$
|
|
|
|
(1)
|
|
Amounts in millions of dollars except per share amounts or as otherwise specified.
48
The Procter & Gamble Company
NOTE 4
|
Beauty
|
Grooming
|
Health Care
|
Fabric & Home Care
|
Baby, Feminine & Family Care
|
Corporate
|
Total Company
|
|||||||||||||||
|
Balance at June 30, 2016 - Net
(1)
|
$
|
|
|
$
|
|
|
$
|
|
|
$
|
|
|
$
|
|
|
$
|
|
|
$
|
|
|
|
Acquisitions and divestitures
|
|
|
|
|
(
|
)
|
(
|
)
|
(
|
)
|
|
|
(
|
)
|
|||||||
|
Translation and other
|
|
|
|
|
|
|
|
|
|
|
|
|
|
|
|||||||
|
Balance at June 30, 2017 - Net
(1)
|
|
|
|
|
|
|
|
|
|
|
|
|
|
|
|||||||
|
Acquisitions and divestitures
|
|
|
|
|
|
|
|
|
|
|
|
|
|
|
|||||||
|
Translation and other
|
|
|
|
|
|
|
|
|
|
|
|
|
|
|
|||||||
|
Balance at June 30, 2018 - Net
(1)
|
$
|
|
|
$
|
|
|
$
|
|
|
$
|
|
|
$
|
|
|
$
|
|
|
$
|
|
|
|
(1)
|
|
The change in goodwill during fiscal
2018
was primarily due to acquisitions of two brands within the Beauty reportable segment and currency translation across all reportable segments. The change in goodwill during fiscal
2017
was primarily due to minor brand divestitures and currency translation across all reportable segments.
The goodwill and intangible asset valuations that are utilized to test these assets for impairment are dependent on a number of significant estimates and assumptions, including macroeconomic conditions, overall category growth rates, competitive activities, cost containment and margin expansion, Company business plans and the discount rate applied to cash flows. We believe these estimates and assumptions are reasonable and are comparable to those that would be used by other marketplace participants. However, actual events and results could differ substantially from those used in our valuations. To the extent such factors result in a failure to achieve the level of projected cash flows initially used to estimate fair value for purposes of establishing the carrying amount of goodwill and related intangible assets, we may need to record non-cash impairment charges in the future.
|
2018
|
2017
|
||||||||||||
|
As of June 30
|
Gross
Carrying
Amount
|
Accumulated
Amortization
|
Gross
Carrying
Amount
|
Accumulated
Amortization
|
|||||||||
|
INTANGIBLE ASSETS WITH DETERMINABLE LIVES
|
|||||||||||||
|
Brands
|
$
|
|
|
$
|
(
|
)
|
$
|
|
|
$
|
(
|
)
|
|
|
Patents and technology
|
|
|
(
|
)
|
|
|
(
|
)
|
|||||
|
Customer relationships
|
|
|
(
|
)
|
|
|
(
|
)
|
|||||
|
Other
|
|
|
(
|
)
|
|
|
(
|
)
|
|||||
|
TOTAL
|
$
|
|
|
$
|
(
|
)
|
$
|
|
|
$
|
(
|
)
|
|
|
INTANGIBLE ASSETS WITH INDEFINITE LIVES
|
|||||||||||||
|
Brands
|
|
|
—
|
|
|
|
—
|
|
|||||
|
TOTAL
|
$
|
|
|
$
|
(
|
)
|
$
|
|
|
$
|
(
|
)
|
|
|
Years ended June 30
|
2018
|
2017
|
2016
|
||||||||
|
Intangible asset amortization
|
$
|
|
|
$
|
|
|
$
|
|
|
||
|
Years ending June 30
|
2019
|
2020
|
2021
|
2022
|
2023
|
||||||||||
|
Estimated amortization expense
|
$
|
|
|
$
|
|
|
$
|
|
|
$
|
|
|
$
|
|
|
Amounts in millions of dollars except per share amounts or as otherwise specified.
The Procter & Gamble Company
49
NOTE 5
Income taxes are recognized for the amount of taxes payable for the current year and for the impact of deferred tax assets and liabilities, which represent future tax consequences of events that have been recognized differently in the financial statements than for tax purposes. Deferred tax assets and liabilities are established using the enacted statutory tax rates and are adjusted for any changes in such rates in the period of change.
On December 22, 2017, the U.S. government enacted comprehensive tax legislation commonly referred to as the Tax Cuts and Jobs Act (the "U.S. Tax Act"). The U.S. Tax Act significantly revises the future ongoing U.S. corporate income tax by, among other things, lowering the U.S. corporate income tax rates and implementing a hybrid territorial tax system. As the Company has a June 30 fiscal year-end, the lower corporate income tax rate was phased in, resulting in a U.S. statutory federal rate of approximately
28
%
for our fiscal year ended
June 30, 2018
, and
21
%
for subsequent fiscal years. However, the U.S. Tax Act eliminates the domestic manufacturing deduction and moves to a hybrid territorial system, which also largely eliminates the ability to credit certain foreign taxes that existed prior to enactment of the U.S. Tax Act.
There are also certain transitional impacts of the U.S. Tax Act. As part of the transition to the new hybrid territorial tax system, the U.S. Tax Act imposed a one-time repatriation tax on deemed repatriation of historical earnings of foreign subsidiaries. In addition, the reduction of the U.S. corporate tax rate caused us to adjust our U.S. deferred tax assets and liabilities to the lower federal base rate of
21
%
. These transitional impacts resulted in a provisional net charge of
$
602
for the fiscal year ended June 30, 2018, comprised of an estimated repatriation tax charge of
$
3.8
billion
(comprised of U.S. repatriation taxes and foreign withholding taxes) and an estimated net deferred tax benefit of
$
3.2
billion
.
The changes included in the U.S. Tax Act are broad and complex. The final transitional impacts of the U.S. Tax Act may differ from the above estimate, possibly materially, due to, among other things, changes in interpretations of the U.S. Tax Act, any legislative action to address questions that arise because of the U.S. Tax Act, or any updates or changes to estimates the Company has utilized to calculate the transitional impacts, which we expect to finalize when we complete our tax return for fiscal 2018. The SEC has issued rules that would allow for a measurement period of up to one year after the enactment date of the U.S. Tax Act to finalize the recording of the related tax impacts. We currently anticipate finalizing and recording any resulting adjustments within the one-year time period provided by the SEC.
|
Years ended June 30
|
2018
|
2017
|
2016
|
||||||||
|
United States
|
$
|
|
|
$
|
|
|
$
|
|
|
||
|
International
|
|
|
|
|
|
|
|||||
|
TOTAL
|
$
|
|
|
$
|
|
|
$
|
|
|
||
|
Years ended June 30
|
2018
|
2017
|
2016
|
||||||||
|
CURRENT TAX EXPENSE
|
|||||||||||
|
U.S. federal
|
$
|
|
|
$
|
|
|
$
|
|
|
||
|
International
|
|
|
|
|
|
|
|||||
|
U.S. state and local
|
|
|
|
|
|
|
|||||
|
|
|
|
|
|
|
||||||
|
DEFERRED TAX EXPENSE
|
|||||||||||
|
U.S. federal
|
(
|
)
|
|
|
|
|
|||||
|
International and other
|
|
|
|
|
(
|
)
|
|||||
|
(
|
)
|
|
|
(
|
)
|
||||||
|
TOTAL TAX EXPENSE
|
$
|
|
|
$
|
|
|
$
|
|
|
||
|
Years ended June 30
|
2018
|
2017
|
2016
|
|||||
|
U.S. federal statutory income tax rate
|
|
%
|
|
%
|
|
%
|
||
|
Country mix impacts of foreign operations
|
(
|
)%
|
(
|
)%
|
(
|
)%
|
||
|
Changes in uncertain tax positions
|
(
|
)%
|
(
|
)%
|
(
|
)%
|
||
|
Excess tax benefits from the exercise of stock options
|
(
|
)%
|
(
|
)%
|
|
%
|
||
|
Net transitional impact of U.S. Tax Act
|
|
%
|
|
%
|
|
%
|
||
|
Other
|
(
|
)%
|
(
|
)%
|
(
|
)%
|
||
|
EFFECTIVE INCOME TAX RATE
|
|
%
|
|
%
|
|
%
|
||
Country mix impacts of foreign operations includes the effects of foreign subsidiaries' earnings taxed at rates other than the U.S. statutory rate, the U.S. tax impacts of non-U.S. earnings repatriation and any net impacts of intercompany transactions. Changes in uncertain tax positions represent changes in our net liability related to prior year tax positions. Excess tax benefits from the exercise of stock options reflect the impact of adopting ASU 2016-09, "Stock Compensation (Topic 718): Improvements to Employee-Share-Based Payment Accounting)."
Tax benefits charged to shareholders' equity totaled
$
342
for the year ended
June 30, 2018
. This primarily relates to the tax effects of Net Investment hedges, partially offset by the impact of certain adjustments to pension obligations recorded in stockholders' equity. Tax costs credited to shareholders' equity totaled
$
333
for the year ended
June 30, 2017
. This primarily relates to the impact of certain adjustments to pension obligations recorded in stockholders' equity, partially offset by the tax effects of Net Investment hedges.
Prior to the passage of the U.S. Tax Act, the Company asserted that substantially all of the undistributed earnings of its foreign subsidiaries were considered indefinitely invested and
Amounts in millions of dollars except per share amounts or as otherwise specified.
50
The Procter & Gamble Company
accordingly, no deferred taxes were provided. Pursuant to the provisions of the U.S. Tax Act, these earnings were subjected to a one-time transition tax, for which a provisional charge has been recorded. This charge included provisional taxes for all U.S. income taxes and for the related foreign withholding taxes for the portion of those earnings which are no longer considered indefinitely invested. We have not provided deferred foreign withholding taxes on approximately
$
33
billion
of earnings that are considered permanently reinvested.
|
Years ended June 30
|
2018
|
2017
|
2016
|
||||||||
|
BEGINNING OF YEAR
|
$
|
|
|
$
|
|
|
$
|
|
|
||
|
Increases in tax positions for prior years
|
|
|
|
|
|
|
|||||
|
Decreases in tax positions for prior years
|
(
|
)
|
(
|
)
|
(
|
)
|
|||||
|
Increases in tax positions for current year
|
|
|
|
|
|
|
|||||
|
Settlements with taxing authorities
|
(
|
)
|
(
|
)
|
(
|
)
|
|||||
|
Lapse in statute of limitations
|
(
|
)
|
(
|
)
|
(
|
)
|
|||||
|
Currency translation
|
(
|
)
|
(
|
)
|
(
|
)
|
|||||
|
END OF YEAR
|
$
|
|
|
$
|
|
|
$
|
|
|
||
Included in the total liability for uncertain tax positions at
June 30, 2018
, is
$
251
that, depending on the ultimate resolution, could impact the effective tax rate in future periods.
The Company is present in approximately
70
countries and over
150
taxable jurisdictions and, at any point in time, has
40
-
50
jurisdictional audits underway at various stages of completion. We evaluate our tax positions and establish liabilities for uncertain tax positions that may be challenged by local authorities and may not be fully sustained, despite our belief that the underlying tax positions are fully supportable. Uncertain tax positions are reviewed on an ongoing basis and are adjusted in light of changing facts and circumstances, including progress of tax audits, developments in case law and the closing of statutes of limitation. Such adjustments are reflected in the tax provision as appropriate. We have tax years open ranging from
2008
and forward. We are generally not able to reliably estimate the ultimate settlement amounts until the close of the audit. While we do not expect material changes, it is possible that the amount of unrecognized benefit with respect to our uncertain tax positions could increase or decrease within the next 12 months. At this time, we are not able to make a reasonable estimate of the range of impact on the balance of uncertain tax positions or the impact on the effective tax rate related to any such changes.
We recognize the additional accrual of any possible related interest and penalties relating to the underlying uncertain tax position in income tax expense. As of
June 30, 2018
,
2017
and
2016
, we had accrued interest of
$
99
,
$
100
and
$
323
and accrued penalties of
$
15
,
$
20
and
$
20
, respectively, which are not included in the above table. During the fiscal years ended
June 30, 2018
,
2017
and
2016
, we recognized
$(
22
)
,
$
62
and
$
2
in interest benefit/(expense) and
$(
5
)
,
$
0
and
$(
2
)
in penalties benefit/(expense), respectively. The net benefits recognized resulted primarily from the favorable resolution of tax positions for prior years.
|
As of June 30
|
2018
|
2017
|
|||||
|
DEFERRED TAX ASSETS
|
|||||||
|
Pension and postretirement benefits
|
$
|
|
|
$
|
|
|
|
|
Loss and other carryforwards
|
|
|
|
|
|||
|
Stock-based compensation
|
|
|
|
|
|||
|
Fixed assets
|
|
|
|
|
|||
|
Accrued marketing and promotion
|
|
|
|
|
|||
|
Unrealized loss on financial and foreign exchange transactions
|
|
|
|
|
|||
|
Inventory
|
|
|
|
|
|||
|
Accrued interest and taxes
|
|
|
|
|
|||
|
Advance payments
|
|
|
|
|
|||
|
Other
|
|
|
|
|
|||
|
Valuation allowances
|
(
|
)
|
(
|
)
|
|||
|
TOTAL
|
$
|
|
|
$
|
|
|
|
|
DEFERRED TAX LIABILITIES
|
|||||||
|
Goodwill and intangible assets
|
$
|
|
|
$
|
|
|
|
|
Fixed assets
|
|
|
|
|
|||
|
Foreign withholding tax on earnings to be repatriated
|
|
|
|
|
|||
|
Unrealized gain on financial and foreign exchange transactions
|
|
|
|
|
|||
|
Other
|
|
|
|
|
|||
|
TOTAL
|
$
|
|
|
$
|
|
|
|
Amounts in millions of dollars except per share amounts or as otherwise specified.
The Procter & Gamble Company
51
NOTE 6
Basic net earnings per common share are calculated by dividing Net earnings attributable to Procter & Gamble less preferred dividends (net of related tax benefits) by the weighted average number of common shares outstanding during the year. Diluted net earnings per common share are calculated using the treasury stock method on the basis of the weighted average number of common shares outstanding plus the dilutive effect of stock options and other stock-based awards (see Note 7) and the assumed conversion of preferred stock (see Note 8).
|
Years ended June 30
|
2018
|
2017
|
2016
|
||||||||||||||||||||
|
CONSOLIDATED AMOUNTS
|
Total
|
Continuing Operations
|
Discontinued Operations
|
Total
|
Continuing Operations
|
Discontinued Operations
|
Total
|
||||||||||||||||
|
Net earnings
|
$
|
|
|
$
|
|
|
$
|
|
|
$
|
|
|
$
|
|
|
$
|
|
|
$
|
|
|
||
|
Less: Net earnings attributable to noncontrolling interests
|
|
|
|
|
|
|
|
|
|
|
|
|
|
|
|||||||||
|
Net earnings attributable to P&G (Diluted)
|
|
|
|
|
|
|
|
|
|
|
|
|
|
|
|||||||||
|
Preferred dividends, net of tax
|
(
|
)
|
(
|
)
|
|
|
(
|
)
|
(
|
)
|
|
|
(
|
)
|
|||||||||
|
Net earnings attributable to P&G available to common shareholders (Basic)
|
$
|
|
|
$
|
|
|
$
|
|
|
$
|
|
|
$
|
|
|
$
|
|
|
$
|
|
|
||
|
SHARES IN MILLIONS
|
|||||||||||||||||||||||
|
Basic weighted average common shares outstanding
|
|
|
|
|
|
|
|
|
|
|
|
|
|
|
|||||||||
|
Add: Effect of dilutive securities
|
|||||||||||||||||||||||
|
Conversion of preferred shares
(1)
|
|
|
|
|
|
|
|
|
|
|
|
|
|
|
|||||||||
|
Impact of stock options and other unvested equity awards
(2)
|
|
|
|
|
|
|
|
|
|
|
|
|
|
|
|||||||||
|
Diluted weighted average common shares outstanding
|
|
|
|
|
|
|
|
|
|
|
|
|
|
|
|||||||||
|
NET EARNINGS PER SHARE
(3)
|
|||||||||||||||||||||||
|
Basic
|
$
|
|
|
$
|
|
|
$
|
|
|
$
|
|
|
$
|
|
|
$
|
|
|
$
|
|
|
||
|
Diluted
|
$
|
|
|
$
|
|
|
$
|
|
|
$
|
|
|
$
|
|
|
$
|
|
|
$
|
|
|
||
|
(1)
|
|
|
(2)
|
|
|
(3)
|
|
Amounts in millions of dollars except per share amounts or as otherwise specified.
52
The Procter & Gamble Company
NOTE 7
We have two primary stock-based compensation programs under which we annually grant stock option, restricted stock unit (RSU) and performance stock unit (PSU) awards to key managers and directors.
In our main long-term incentive program, key managers can elect to receive options or RSUs. All options vest after three years and have a
10
-year life. Exercise prices on options are set equal to the market price of the underlying shares on the date of the grant. Effective in fiscal year 2017, RSUs vest and settle in shares of common stock three years from the grant date. RSUs granted prior to fiscal years 2017 vest and settle in shares of common stock five years from the grant date.
Senior-level executives participate in an additional long-term incentive program that awards PSUs, which are paid in shares after the end of a three-year performance period. Under this program, the number of PSUs that will vest is based on the Company's performance relative to pre-established performance goals during that three year period.
In addition to these long-term incentive programs, we award RSUs to the Company's non-employee directors and make other minor stock option and RSU grants to employees for which the terms are not substantially different from our long-term incentive awards.
A total of
185
million
shares of common stock were authorized for issuance under the stock-based compensation plan approved by shareholders in 2014, of which
65
million
shares remain available for grant.
The Company recognizes stock-based compensation expense based on the fair value of the awards at the date of grant. The fair value is amortized on a straight-line basis over the requisite service period. Awards to employees eligible for retirement prior to the award becoming fully vested are recognized as compensation expense from the grant date through the date the employee first becomes eligible to retire and is no longer required to provide services to earn the award. Stock-based compensation expense is included as part of Cost of products sold and SG&A in the Consolidated Statement of Earnings and includes an estimate of forfeitures, which is based on historical data.
Total expense and related tax benefit were as follows:
|
Years ended June 30
|
2018
|
2017
(1)
|
2016
(1)
|
||||||||
|
Stock options
|
$
|
|
|
$
|
|
|
$
|
|
|
||
|
RSUs and PSUs
|
|
|
|
|
|
|
|||||
|
Total stock-based expense
|
$
|
|
|
$
|
|
|
$
|
|
|
||
|
Income tax benefit
|
$
|
|
|
$
|
|
|
$
|
|
|
||
|
(1)
|
|
We utilize an industry standard lattice-based valuation model to calculate the fair value for stock options granted.
Assumptions utilized in the model, which are evaluated and revised to reflect market conditions and experience, were as follows:
|
Years ended June 30
|
2018
|
2017
|
2016
|
|||||||||||
|
Interest rate
|
|
-
|
|
%
|
|
-
|
|
%
|
|
-
|
|
%
|
||
|
Weighted average interest rate
|
|
%
|
|
%
|
|
%
|
||||||||
|
Dividend yield
|
|
%
|
|
%
|
|
%
|
||||||||
|
Expected volatility
|
|
%
|
|
%
|
|
%
|
||||||||
|
Expected life in years
|
|
|
|
|||||||||||
Lattice-based option valuation models incorporate ranges of assumptions for inputs and those ranges are disclosed in the preceding table. Expected volatilities are based on a combination of historical volatility of our stock and implied volatilities of call options on our stock. We use historical data to estimate option exercise and employee termination patterns within the valuation model. The expected life of options granted is derived from the output of the option valuation model and represents the average period of time that options granted are expected to be outstanding. The interest rate for periods within the contractual life of the options is based on the U.S. Treasury yield curve in effect at the time of grant.
|
Options
|
Options (in thousands)
|
Weighted Average Exercise Price
|
Weighted Average Contract-ual Life in Years
|
Aggregate Intrinsic Value
|
|||||
|
Outstanding, beginning of year
|
|
|
$
|
|
|
||||
|
Granted
|
|
|
|
|
|||||
|
Exercised
|
(
|
)
|
|
|
|||||
|
Canceled
|
(
|
)
|
|
|
|||||
|
OUTSTANDING, END OF YEAR
|
|
|
$
|
|
|
|
$
|
|
|
|
EXERCISABLE
|
|
|
$
|
|
|
|
$
|
|
|
|
Years ended June 30
|
2018
|
2017
|
2016
|
||||||||
|
Weighted average grant-date fair value of options granted
|
$
|
|
|
$
|
|
|
$
|
|
|
||
|
Intrinsic value of options exercised
|
|
|
|
|
|
|
|||||
|
Grant-date fair value of options that vested
|
|
|
|
|
|
|
|||||
|
Cash received from options exercised
|
|
|
|
|
|
|
|||||
|
Actual tax benefit from options exercised
|
|
|
|
|
|
|
|||||
Amounts in millions of dollars except per share amounts or as otherwise specified.
The Procter & Gamble Company
53
At
June 30, 2018
, there was
$
203
of compensation cost that has not yet been recognized related to stock option grants. That cost is expected to be recognized over a remaining weighted average period of
2.0
years.
|
RSUs
|
PSUs
|
||||||||||
|
RSU and PSU awards
|
Units (in thousands)
|
Weighted Average Grant Date Fair Value
|
Units (in thousands)
|
Weighted Average Grant Date Fair Value
|
|||||||
|
Non-vested at July 1, 2017
|
|
|
$
|
|
|
|
|
$
|
|
|
|
|
Granted
|
|
|
|
|
|
|
|
|
|||
|
Vested
|
(
|
)
|
|
|
(
|
)
|
|
|
|||
|
Forfeited
|
(
|
)
|
|
|
(
|
)
|
|
|
|||
|
Non-vested at June 30, 2018
|
|
|
$
|
|
|
|
|
$
|
|
|
|
At
June 30, 2018
, there was
$
255
of compensation cost that has not yet been recognized related to RSUs and PSUs. That cost is expected to be recognized over a remaining weighted average period of
2.1
years. The total grant date fair value of shares vested was
$
175
,
$
163
and
$
97
in
2018
,
2017
and
2016
, respectively.
NOTE 8
We offer various postretirement benefits to our employees.
Defined Contribution Retirement Plans
We have defined contribution plans, which cover the majority of our U.S. employees, as well as employees in certain other countries. These plans are fully funded. We generally make contributions to participants' accounts based on individual base salaries and years of service. Total global defined contribution expense was
$
292
,
$
270
and
$
292
in
2018
,
2017
and
2016
, respectively.
The primary U.S. defined contribution plan (the U.S. DC plan) comprises the majority of the expense for the Company's defined contribution plans. For the U.S. DC plan, the contribution rate is set annually. Total contributions for this plan approximated
14
%
of total participants' annual wages and salaries in
2018
,
2017
and
2016
.
We maintain The Procter & Gamble Profit Sharing Trust (Trust) and Employee Stock Ownership Plan (ESOP) to provide a portion of the funding for the U.S. DC plan and other retiree benefits (described below). Operating details of the ESOP are provided at the end of this Note. The fair value of the ESOP Series A shares allocated to participants reduces our cash contribution required to fund the U.S. DC plan.
Defined Benefit Retirement Plans and Other Retiree Benefits
We offer defined benefit retirement pension plans to certain employees. These benefits relate primarily to local plans outside the U.S. and, to a lesser extent, plans assumed in previous acquisitions covering U.S. employees.
Amounts in millions of dollars except per share amounts or as otherwise specified.
54
The Procter & Gamble Company
|
Pension Benefits
(1)
|
Other Retiree Benefits
(2)
|
||||||||||||||
|
Years ended June 30
|
2018
|
2017
|
2018
|
2017
|
|||||||||||
|
CHANGE IN BENEFIT OBLIGATION
|
|||||||||||||||
|
Benefit obligation at beginning of year
(3)
|
$
|
|
|
|
$
|
|
|
|
$
|
|
|
|
$
|
|
|
|
Service cost
|
|
|
|
|
|
|
|
|
|||||||
|
Interest cost
|
|
|
|
|
|
|
|
|
|||||||
|
Participants' contributions
|
|
|
|
|
|
|
|
|
|||||||
|
Amendments
|
|
|
|
|
(
|
)
|
|
|
|||||||
|
Net actuarial loss/(gain)
|
(
|
)
|
(
|
)
|
(
|
)
|
(
|
)
|
|||||||
|
Acquisitions/(divestitures)
(4)
|
|
|
(
|
)
|
|
|
(
|
)
|
|||||||
|
Curtailments
|
|
|
|
(
|
)
|
|
|
|
|
(
|
)
|
||||
|
Special termination benefits
|
|
|
|
|
|
|
|
|
|||||||
|
Currency translation and other
|
|
|
|
|
|
|
|
|
|||||||
|
Benefit payments
|
(
|
)
|
(
|
)
|
(
|
)
|
(
|
)
|
|||||||
|
BENEFIT OBLIGATION AT END OF YEAR
(3)
|
$
|
|
|
$
|
|
|
$
|
|
|
$
|
|
|
|||
|
CHANGE IN PLAN ASSETS
|
|||||||||||||||
|
Fair value of plan assets at beginning of year
|
$
|
|
|
$
|
|
|
$
|
|
|
$
|
|
|
|||
|
Actual return on plan assets
|
|
|
|
|
(
|
)
|
|
|
|||||||
|
Acquisitions/(divestitures)
(4)
|
|
|
(
|
)
|
|
|
|
|
|||||||
|
Employer contributions
|
|
|
|
|
|
|
|
|
|||||||
|
Participants' contributions
|
|
|
|
|
|
|
|
|
|||||||
|
Currency translation and other
|
|
|
(
|
)
|
(
|
)
|
(
|
)
|
|||||||
|
ESOP debt impacts
(5)
|
|
|
|
|
|
|
|
|
|||||||
|
Benefit payments
|
(
|
)
|
(
|
)
|
(
|
)
|
(
|
)
|
|||||||
|
FAIR VALUE OF PLAN ASSETS AT END OF YEAR
|
$
|
|
|
$
|
|
|
$
|
|
|
$
|
|
|
|||
|
FUNDED STATUS
|
$
|
(
|
)
|
$
|
(
|
)
|
$
|
(
|
)
|
$
|
(
|
)
|
|||
|
(1)
|
|
|
(2)
|
|
|
(3)
|
|
|
(4)
|
|
|
(5)
|
|
|
Pension Benefits
|
Other Retiree Benefits
|
||||||||||||||
|
As of June 30
|
2018
|
2017
|
2018
|
2017
|
|||||||||||
|
CLASSIFICATION OF NET AMOUNT RECOGNIZED
|
|||||||||||||||
|
Noncurrent assets
|
$
|
|
|
$
|
|
|
$
|
|
|
$
|
|
|
|||
|
Current liabilities
|
(
|
)
|
(
|
)
|
(
|
)
|
(
|
)
|
|||||||
|
Noncurrent liabilities
|
(
|
)
|
(
|
)
|
(
|
)
|
(
|
)
|
|||||||
|
NET AMOUNT RECOGNIZED
|
$
|
(
|
)
|
$
|
(
|
)
|
$
|
(
|
)
|
$
|
(
|
)
|
|||
|
AMOUNTS RECOGNIZED IN ACCUMULATED OTHER COMPREHENSIVE INCOME (AOCI)
|
|||||||||||||||
|
Net actuarial loss
|
$
|
|
|
$
|
|
|
$
|
|
|
$
|
|
|
|||
|
Prior service cost/(credit)
|
|
|
|
|
(
|
)
|
(
|
)
|
|||||||
|
NET AMOUNTS RECOGNIZED IN AOCI
|
$
|
|
|
$
|
|
|
$
|
|
|
$
|
|
|
|||
Amounts in millions of dollars except per share amounts or as otherwise specified.
The Procter & Gamble Company
55
The accumulated benefit obligation for all defined benefit pension plans was
$
14,370
and
$
14,512
as of
June 30, 2018
and
2017
, respectively.
Pension plans with accumulated benefit obligations in excess of plan assets and plans with projected benefit obligations in excess of plan assets consisted of the following:
|
Accumulated Benefit Obligation Exceeds the Fair Value of Plan Assets
|
Projected Benefit Obligation Exceeds the Fair Value of Plan Assets
|
||||||||||||||
|
As of June 30
|
2018
|
2017
|
2018
|
2017
|
|||||||||||
|
Projected benefit obligation
|
$
|
|
|
$
|
|
|
$
|
|
|
$
|
|
|
|||
|
Accumulated benefit obligation
|
|
|
|
|
|
|
|
|
|||||||
|
Fair value of plan assets
|
|
|
|
|
|
|
|
|
|||||||
Net Periodic Benefit Cost
.
Components of the net periodic benefit cost were as follows:
|
Pension Benefits
|
Other Retiree Benefits
|
|||||||||||||||||||||||
|
Years ended June 30
|
2018
|
2017
|
2016
|
2018
|
2017
|
2016
|
||||||||||||||||||
|
AMOUNTS RECOGNIZED IN NET PERIODIC BENEFIT COST
|
||||||||||||||||||||||||
|
Service cost
|
$
|
|
|
$
|
|
|
(1)
|
$
|
|
|
(1)
|
$
|
|
|
$
|
|
|
(1)
|
$
|
|
|
(1)
|
||
|
Interest cost
|
|
|
|
|
|
|
|
|
|
|
|
|
||||||||||||
|
Expected return on plan assets
|
(
|
)
|
(
|
)
|
(
|
)
|
(
|
)
|
(
|
)
|
(
|
)
|
||||||||||||
|
Amortization of net actuarial loss
|
|
|
|
|
|
|
|
|
|
|
|
|
||||||||||||
|
Amortization of prior service cost/(credit)
|
|
|
|
|
|
|
(
|
)
|
(
|
)
|
(
|
)
|
||||||||||||
|
Amortization of net actuarial loss/ prior service cost due to settlements and curtailments
|
|
|
|
|
(2)
|
|
|
|
|
|
|
|
(2)
|
|
|
|||||||||
|
Special termination benefits
|
|
|
|
|
|
|
|
|
|
|
(2)
|
|
|
|||||||||||
|
GROSS BENEFIT COST/(CREDIT)
|
|
|
|
|
|
|
(
|
)
|
(
|
)
|
(
|
)
|
||||||||||||
|
Dividends on ESOP preferred stock
|
|
|
|
|
|
|
(
|
)
|
(
|
)
|
(
|
)
|
||||||||||||
|
NET PERIODIC BENEFIT COST/(CREDIT)
|
$
|
|
|
$
|
|
|
$
|
|
|
$
|
(
|
)
|
$
|
(
|
)
|
$
|
(
|
)
|
||||||
|
CHANGE IN PLAN ASSETS AND BENEFIT OBLIGATIONS RECOGNIZED IN AOCI
|
||||||||||||||||||||||||
|
Net actuarial loss/(gain) - current year
|
$
|
(
|
)
|
$
|
(
|
)
|
$
|
|
|
$
|
(
|
)
|
||||||||||||
|
Prior service cost/(credit) - current year
|
|
|
|
|
(
|
)
|
|
|
||||||||||||||||
|
Amortization of net actuarial loss
|
(
|
)
|
(
|
)
|
(
|
)
|
(
|
)
|
||||||||||||||||
|
Amortization of prior service (cost)/credit
|
(
|
)
|
(
|
)
|
|
|
|
|
||||||||||||||||
|
Amortization of net actuarial loss/prior service costs due to settlements and curtailments
|
|
|
(
|
)
|
|
|
(
|
)
|
||||||||||||||||
|
Reduction in net actuarial losses resulting from curtailment
|
|
|
|
(
|
)
|
|
|
|
|
(
|
)
|
|||||||||||||
|
Currency translation and other
|
|
|
|
|
(
|
)
|
|
|
||||||||||||||||
|
TOTAL CHANGE IN AOCI
|
(
|
)
|
(
|
)
|
|
|
(
|
)
|
||||||||||||||||
|
NET AMOUNTS RECOGNIZED IN PERIODIC BENEFIT COST AND AOCI
|
$
|
(
|
)
|
$
|
(
|
)
|
$
|
|
|
$
|
(
|
)
|
||||||||||||
|
(1)
|
|
|
(2)
|
|
|
Pension Benefits
|
Other Retiree Benefits
|
||||||
|
Net actuarial loss
|
$
|
|
|
$
|
|
|
|
|
Prior service cost/(credit)
|
|
|
(
|
)
|
|||
Amounts in millions of dollars except per share amounts or as otherwise specified.
56
The Procter & Gamble Company
Assumptions
.
We determine our actuarial assumptions on an annual basis. These assumptions are weighted to reflect each country that may have an impact on the cost of providing retirement benefits.
The weighted average assumptions used to determine benefit obligations recorded on the Consolidated Balance Sheets as of June 30, were as follows:
(1)
|
Pension Benefits
|
Other Retiree Benefits
|
||||||||||
|
As of June 30
|
2018
|
2017
|
2018
|
2017
|
|||||||
|
Discount rate
|
|
%
|
|
|
%
|
|
|
%
|
|
|
%
|
|
Rate of compensation increase
|
|
%
|
|
%
|
N/A
|
|
N/A
|
|
|||
|
Health care cost trend rates assumed for next year
|
N/A
|
|
N/A
|
|
|
%
|
|
%
|
|||
|
Rate to which the health care cost trend rate is assumed to decline (ultimate trend rate)
|
N/A
|
|
N/A
|
|
|
%
|
|
%
|
|||
|
Year that the rate reaches the ultimate trend rate
|
N/A
|
|
N/A
|
|
|
|
|
|
|||
|
(1)
|
|
The weighted average assumptions used to determine net benefit cost recorded on the Consolidated Statement of Earnings for the years ended June 30, were as follows:
(1)
|
Pension Benefits
|
Other Retiree Benefits
|
||||||||||||||||
|
Years ended June 30
|
2018
|
2017
|
2016
|
2018
|
2017
|
2016
|
|||||||||||
|
Discount rate
|
|
%
|
|
%
|
|
%
|
|
%
|
|
%
|
|
%
|
|||||
|
Expected return on plan assets
|
|
%
|
|
%
|
|
%
|
|
%
|
|
%
|
|
%
|
|||||
|
Rate of compensation increase
|
|
%
|
|
%
|
|
%
|
N/A
|
|
N/A
|
|
N/A
|
|
|||||
|
(1)
|
|
For plans that make up the majority of our obligation, the Company calculates the benefit obligation and the related impacts on service and interest costs using specific spot rates along the corporate bond yield curve. For the remaining plans, the Company determines these amounts utilizing a single weighted-average discount rate derived from the corporate bond yield curve used to measure the plan obligations.
Several factors are considered in developing the estimate for the long-term expected rate of return on plan assets. For the defined benefit retirement plans, these factors include historical rates of return of broad equity and bond indices and projected long-term rates of return obtained from pension investment consultants. The expected long-term rates of return for plan assets are
8
-
9
%
for equities and
5
-
6
%
for bonds. For other retiree benefit plans, the expected long-term rate of return reflects that the assets are comprised primarily of Company stock. The expected rate of return on Company stock is based on the long-term projected return of
8.5
%
and reflects the historical pattern of returns.
Assumed health care cost trend rates could have a significant effect on the amounts reported for the other retiree benefit plans.
A one percentage point change in assumed health care cost trend rates would have the following effects:
|
One-Percentage
Point Increase
|
One-Percentage
Point Decrease
|
||||||
|
Effect on the total service and interest cost components
|
$
|
|
|
$
|
(
|
)
|
|
|
Effect on the accumulated postretirement benefit obligation
|
|
|
(
|
)
|
|||
Amounts in millions of dollars except per share amounts or as otherwise specified.
The Procter & Gamble Company
57
|
Target Asset Allocation
|
Actual Asset Allocation at June 30
|
||||||||||||||||
|
Pension Benefits
|
Other Retiree
Benefits
|
Pension Benefits
|
Other Retiree Benefits
|
||||||||||||||
|
Asset Category
|
2018
|
2017
|
2018
|
2017
|
|||||||||||||
|
Cash
|
|
%
|
|
%
|
|
%
|
|
%
|
|
%
|
|
%
|
|||||
|
Debt securities
|
|
%
|
|
%
|
|
%
|
|
%
|
|
%
|
|
%
|
|||||
|
Equity securities
|
|
%
|
|
%
|
|
%
|
|
%
|
|
%
|
|
%
|
|||||
|
TOTAL
|
|
%
|
|
%
|
|
%
|
|
%
|
|
%
|
|
%
|
|||||
The following tables set forth the fair value of the Company's plan assets as of
June 30, 2018
and
2017
segregated by level within the fair value hierarchy (refer to Note 9 for further discussion on the fair value hierarchy and fair value principles). Company stock listed as Level 2 in the hierarchy represents preferred shares which are valued based on the value of Company common stock. The majority of our Level 3 pension assets are insurance contracts. Their fair values are based on their cash equivalent or models that project future cash flows and discount the future amounts to a present value using market-based observable inputs, including credit risk and interest rate curves. There was no significant activity within the Level 3 pension and other retiree benefits plan assets during the years presented. Investments valued using net asset value as a practical expedient are primarily equity and fixed income collective funds.
These assets are not valued using the fair value hierarchy, but rather valued using the net asset value reported by the managers of the funds and as supported by the unit prices of actual purchase and sale transactions.
|
Pension Benefits
|
Other Retiree Benefits
|
||||||||||||||||||
|
As of June 30
|
Fair Value Hierarchy Level
|
2018
|
2017
|
Fair Value Hierarchy Level
|
2018
|
2017
|
|||||||||||||
|
ASSETS AT FAIR VALUE
|
|||||||||||||||||||
|
Cash and cash equivalents
|
1
|
$
|
|
|
$
|
|
|
1
|
$
|
|
|
$
|
|
|
|||||
|
Company stock
(1)
|
|
|
|
|
2
|
|
|
|
|
||||||||||
|
Other
(2)
|
1, 2 & 3
|
|
|
|
|
1
|
|
|
|
|
|
||||||||
|
TOTAL ASSETS IN THE FAIR VALUE HEIRARCHY
|
|
|
|
|
|
|
|
|
|||||||||||
|
Investments valued at net asset value
|
|
|
|
|
|
|
|
|
|
|
|||||||||
|
TOTAL ASSETS AT FAIR VALUE
|
$
|
|
|
|
|
$
|
|
|
|
|
|
||||||||
|
(1)
|
|
|
(2)
|
|
Cash Flows
.
Management's best estimate of cash requirements and discretionary contributions for the defined benefit retirement plans and other retiree benefit plans for the year ending
June 30, 2019
, is
$
134
and
$
39
, respectively. For the defined benefit retirement plans, this is comprised of
$
82
in expected benefit payments from the Company directly to participants of unfunded plans and
$
52
of expected contributions to funded plans. For other retiree benefit plans, this is comprised of
$
24
in expected benefit payments from the Company directly to participants of unfunded plans and
$
15
of expected contributions to funded plans. Expected contributions are dependent on many variables, including the variability of the market value of the plan assets as compared to the benefit obligation and other market or regulatory conditions. In addition, we take into consideration our business investment opportunities and resulting cash requirements. Accordingly, actual funding may differ significantly from current estimates.
|
Years ending June 30
|
Pension
Benefits
|
Other Retiree
Benefits
|
|||||
|
EXPECTED BENEFIT PAYMENTS
|
|||||||
|
2019
|
$
|
|
|
$
|
|
|
|
|
2020
|
|
|
|
|
|||
|
2021
|
|
|
|
|
|||
|
2022
|
|
|
|
|
|||
|
2023
|
|
|
|
|
|||
|
2024 - 2028
|
|
|
|
|
|||
Amounts in millions of dollars except per share amounts or as otherwise specified.
58
The Procter & Gamble Company
Employee Stock Ownership Plan
We maintain the ESOP to provide funding for certain employee benefits discussed in the preceding paragraphs.
The ESOP borrowed
$
1.0
billion
in 1989 and the proceeds were used to purchase Series A ESOP Convertible Class A Preferred Stock to fund a portion of the U.S. DC plan. Principal and interest requirements of the borrowing were paid by the Trust from dividends on the preferred shares and from advances provided by the Company. The original borrowing of
$
1.0
billion
has been repaid in full, and advances from the Company of
$
52
remain outstanding at
June 30, 2018
. Each share is convertible at the option of the holder into one share of the Company's common stock. The dividend for the current year was equal to the common stock dividend of
$
2.79
per share. The liquidation value is
$
6.82
per share.
In 1991, the ESOP borrowed an additional
$
1.0
billion
. The proceeds were used to purchase Series B ESOP Convertible Class A Preferred Stock to fund a portion of retiree health care benefits. These shares, net of the ESOP's debt, are considered plan assets of the other retiree benefits plan discussed above. Debt service requirements are funded by preferred stock dividends, cash contributions and advances provided by the Company, of which
$
825
are outstanding at
June 30, 2018
. Each share is convertible at the option of the holder into one share of the Company's common stock. The dividend for the current year was equal to the common stock dividend of
$
2.79
per share. The liquidation value is
$
12.96
per share.
Our ESOP accounting practices are consistent with current ESOP accounting guidance, including the permissible continuation of certain provisions from prior accounting guidance. ESOP debt, which is guaranteed by the Company, is recorded as debt (see Note 10) with an offset to the Reserve for ESOP debt retirement, which is presented within Shareholders' equity. Advances to the ESOP by the Company are recorded as an increase in the Reserve for ESOP debt retirement. Interest incurred on the ESOP debt is recorded as Interest expense. Dividends on all preferred shares, net of related tax benefits, are charged to Retained earnings.
The series A and B preferred shares of the ESOP are allocated to employees based on debt service requirements.
The number of preferred shares outstanding at June 30 was as follows:
|
Shares in thousands
|
2018
|
2017
|
2016
|
|||||
|
Allocated
|
|
|
|
|
|
|
||
|
Unallocated
|
|
|
|
|
|
|
||
|
TOTAL SERIES A
|
|
|
|
|
|
|
||
|
Allocated
|
|
|
|
|
|
|
||
|
Unallocated
|
|
|
|
|
|
|
||
|
TOTAL SERIES B
|
|
|
|
|
|
|
||
NOTE 9
As a multinational company with diverse product offerings, we are exposed to market risks, such as changes in interest rates, currency exchange rates and commodity prices. We evaluate exposures on a centralized basis to take advantage of natural exposure correlation and netting. To the extent we choose to manage volatility associated with the net exposures, we enter into various financial transactions that we account for using the applicable accounting guidance for derivative instruments and hedging activities. These financial transactions are governed by our policies covering acceptable counterparty exposure, instrument types and other hedging practices.
If the Company elects to do so and if the instrument meets certain specified accounting criteria, management designates derivative instruments as cash flow hedges, fair value hedges or net investment hedges. We record derivative instruments at fair value and the accounting for changes in the fair value depends on the intended use of the derivative, the resulting designation and the effectiveness of the instrument in offsetting the risk exposure it is designed to hedge. We generally have a high degree of effectiveness between the exposure being hedged and the hedging instrument.
Credit Risk Management
We have counterparty credit guidelines and normally enter into transactions with investment grade financial institutions, to the extent commercially viable. Counterparty exposures are monitored daily and downgrades in counterparty credit ratings are reviewed on a timely basis. We have not incurred, and do not expect to incur, material credit losses on our risk management or other financial instruments.
Substantially all of the Company's financial instruments used in hedging transactions are governed by industry standard netting and collateral agreements with counterparties. If the Company's credit rating were to fall below the levels stipulated in the agreements, the counterparties could demand either collateralization or termination of the arrangements. The aggregate fair value of the instruments covered by these contractual features that are in a net liability position as of
June 30, 2018
, was not material. The Company has not been required to post collateral as a result of these contractual features.
Interest Rate Risk Management
Our policy is to manage interest cost using a mixture of fixed-rate and variable-rate debt. To manage this risk in a cost-efficient manner, we enter into interest rate swaps whereby we agree to exchange with the counterparty, at specified intervals, the difference between fixed and variable interest amounts calculated by reference to a notional amount.
We designate certain interest rate swaps that meet specific accounting criteria as fair value hedges. For fair value hedges, the changes in the fair value of both the hedging instruments and the underlying debt obligations are immediately recognized in earnings. Historically, we had interest rate swaps
Amounts in millions of dollars except per share amounts or as otherwise specified.
The Procter & Gamble Company
59
designated as cash flow hedges. For the years ended June 30, 2018 and 2017, we did not have any contracts outstanding.
Foreign Currency Risk Management
We manufacture and sell our products and finance our operations in a number of countries throughout the world. As a result, we are exposed to movements in foreign currency exchange rates. We leverage the Company’s diversified portfolio of exposures as a natural hedge. In certain cases, we enter into non-qualifying foreign currency contracts to hedge certain balance sheet items subject to revaluation. The change in fair value of these instruments and the underlying exposure are both immediately recognized in earnings.
To manage exchange rate risk related to our intercompany financing, we primarily use forward contracts and currency swaps. The change in fair value of these non-qualifying instruments is immediately recognized in earnings, substantially offsetting the foreign currency mark-to-market impact of the related exposure.
Historically, we had certain foreign currency swaps with original maturities up to
five years
, which were intended to offset the effect of exchange rate fluctuations on intercompany loans denominated in foreign currencies; these swaps were accounted for as cash flow hedges. Those swaps were terminated during the year ended June 30, 2017 and as a result, there was an immaterial gain reclassified from AOCI into earnings for the year ended June 30, 2017 in the following tables but there were no outstanding contracts as of June 30, 2018 and 2017.
Net Investment Hedging
We hedge certain net investment positions in foreign subsidiaries. To accomplish this, we either borrow directly in foreign currencies and designate all or a portion of the foreign currency debt as a hedge of the applicable net investment position or we enter into foreign currency swaps that are designated as hedges of net investments. Changes in the fair value of these instruments are recognized in OCI and offset the change in the value of the net investment being hedged. Upon adoption of ASU 2017-12, the time value component of the net investment hedge currency swaps is excluded from the assessment of hedge effectiveness and reported in income on a systematic basis. Changes in the fair value of the swap, including changes in the fair value of the excluded time value component, are recognized in OCI and offset the value of the underlying net assets.
Commodity Risk Management
Certain raw materials used in our products or production processes are subject to price volatility caused by weather, supply conditions, political and economic variables and other unpredictable factors. To manage the volatility related to anticipated purchases of certain of these materials, we have historically, on a limited basis, used futures and options with maturities generally less than
one year
and swap contracts with maturities up to
five years
. As of and during the years ended
June 30, 2018
and
2017
, we did not have any commodity hedging activity.
Insurance
We self-insure for most insurable risks. However, we purchase insurance for Directors and Officers Liability and certain other coverage where it is required by law or by contract.
Fair Value Hierarchy
Accounting guidance on fair value measurements for certain financial assets and liabilities requires that financial assets and liabilities carried at fair value be classified and disclosed in one of the following categories:
|
•
|
Level 1: Quoted market prices in active markets for identical assets or liabilities.
|
|
•
|
Level 2: Observable market-based inputs or unobservable inputs that are corroborated by market data.
|
|
•
|
Level 3: Unobservable inputs reflecting the reporting entity's own assumptions or external inputs from inactive markets.
|
When applying fair value principles in the valuation of assets and liabilities, we are required to maximize the use of quoted market prices and minimize the use of unobservable inputs. The Company has not changed its valuation techniques used in measuring the fair value of any financial assets or liabilities during the year. Our fair value estimates take into consideration the credit risk of both the Company and our counterparties.
T
he following table sets forth the Company's financial assets as of
June 30, 2018
and
2017
that were measured at fair value on a recurring basis during the period:
|
Fair Value Asset
|
|||||||
|
As of June 30
|
2018
|
2017
|
|||||
|
Investments:
|
|||||||
|
U.S. government securities
|
$
|
|
|
$
|
|
|
|
|
Corporate bond securities
|
|
|
|
|
|||
|
Other investments
|
|
|
|
|
|||
|
TOTAL
|
$
|
|
|
$
|
|
|
|
Investment securities are presented in Available-for-sale investment securities and Other noncurrent assets. The amortized cost of the U.S. government securities with maturities less than one year was
$
2,003
and
$
2,494
as of
June 30, 2018
and
2017
, respectively. The amortized cost of the U.S. government securities with maturities between one and five years was
$
3,659
and
$
3,824
as of
June 30, 2018
and
2017
, respectively. The amortized cost of corporate bond securities with maturities of less than a year was
$
1,291
and
$
730
as of
June 30, 2018
and
2017
, respectively. The
Amounts in millions of dollars except per share amounts or as otherwise specified.
60
The Procter & Gamble Company
amortized cost of corporate bond securities with maturities between one and five years was
$
2,503
and
$
2,547
as of
June 30, 2018
and
2017
, respectively. The Company's investments measured at fair value are generally classified as Level 2 within the fair value hierarchy. There are no material investment balances classified as Level 1 or Level 3 within the fair value hierarchy, or using net asset value as a practical expedient. Fair values are generally estimated based upon quoted market prices for similar instruments.
The fair value of long-term debt was
$
23,402
and
$
21,396
as of
June 30, 2018
and
2017
, respectively. This includes the
|
Notional Amount
|
Fair Value Asset
|
Fair Value (Liability)
|
|||||||||||||||||||||
|
As of June 30
|
2018
|
2017
|
2018
|
2017
|
2018
|
2017
|
|||||||||||||||||
|
DERIVATIVES IN FAIR VALUE HEDGING RELATIONSHIPS
|
|||||||||||||||||||||||
|
Interest rate contracts
|
$
|
|
|
$
|
|
|
$
|
|
|
$
|
|
|
$
|
(
|
)
|
$
|
(
|
)
|
|||||
|
DERIVATIVES IN NET INVESTMENT HEDGING RELATIONSHIPS
|
|||||||||||||||||||||||
|
Foreign currency interest rate contracts
|
$
|
|
|
$
|
|
|
$
|
|
|
$
|
|
|
$
|
(
|
)
|
$
|
(
|
)
|
|||||
|
TOTAL DERIVATIVES DESIGNATED AS HEDGING INSTRUMENTS
|
$
|
|
|
$
|
|
|
$
|
|
|
$
|
|
|
$
|
(
|
)
|
$
|
(
|
)
|
|||||
|
DERIVATIVES NOT DESIGNATED AS HEDGING INSTRUMENTS
|
|||||||||||||||||||||||
|
Foreign currency contracts
|
$
|
|
|
$
|
|
|
$
|
|
|
$
|
|
|
$
|
(
|
)
|
$
|
(
|
)
|
|||||
|
TOTAL DERIVATIVES AT FAIR VALUE
|
$
|
|
|
$
|
|
|
$
|
|
|
$
|
|
|
$
|
(
|
)
|
$
|
(
|
)
|
|||||
The fair value of the interest rate derivative asset/liability directly offsets the cumulative amount of the fair value hedging adjustment included in the carrying amount of the underlying debt obligation. The carrying amount of the underlying debt obligation, which includes the unamortized discount or premium and the fair value adjustment, was
$
4,639
and
$
4,705
as of
June 30, 2018
and
2017
, respectively. In addition to the foreign currency derivative contracts designated as net investment hedges, certain of our foreign currency denominated debt instruments are designated as net investment hedges. The carrying value of those debt instruments designated as net investment hedges, which includes the adjustment for the foreign currency transaction gain or loss on those instruments, was
$
15,012
and
$
19,030
as of
June 30, 2018
and
2017
, respectively. The decrease in the notional balance of the net investment hedges, including the debt instruments designated as net investment hedges, is primarily driven by the reduction in net foreign currency hedgeable assets as a result of US tax reform. The increase in the notional balance of foreign currency contracts not designated as hedging instruments reflects changes in the level of intercompany financing activity during the period.
All of the Company's derivative assets and liabilities measured at fair value are classified as Level 2 within the fair value hierarchy. The Company recognizes transfers between levels within the fair value hierarchy, if any, at the end of each quarter. There were no transfers between levels during the periods presented. In addition, there was no significant activity within the Level 3 assets and liabilities during the periods presented. There were no significant assets or liabilities that were re-measured at fair value on a non-recurring basis during the years ended
June 30, 2018
and
2017
.
Amounts in millions of dollars except per share amounts or as otherwise specified.
The Procter & Gamble Company
61
|
Amount of Gain/(Loss) Recognized in AOCI on Derivatives
|
|||||||
|
As of June 30
|
2018
|
2017
|
|||||
|
DERIVATIVES IN NET INVESTMENT HEDGING RELATIONSHIPS
(1) (2)
|
|||||||
|
Foreign currency interest rate contracts
|
$
|
(
|
)
|
$
|
(
|
)
|
|
|
Amount of Gain/(Loss) Reclassified from AOCI into Earnings
|
|||||||
|
Years ended June 30
|
2018
|
2017
|
|||||
|
DERIVATIVES IN CASH FLOW HEDGING RELATIONSHIPS
|
|||||||
|
Foreign currency contracts
|
$
|
|
|
$
|
|
|
|
|
Amount of Gain/(Loss) Recognized in Earnings
|
|||||||
|
Years ended June 30
|
2018
|
2017
|
|||||
|
DERIVATIVES IN FAIR VALUE HEDGING RELATIONSHIPS
|
|||||||
|
Interest rate contracts
|
$
|
(
|
)
|
$
|
(
|
)
|
|
|
DERIVATIVES NOT DESIGNATED AS HEDGING INSTRUMENTS
|
|||||||
|
Foreign currency contracts
|
$
|
(
|
)
|
$
|
|
|
|
|
(1)
|
|
|
(2)
|
|
Amounts in millions of dollars except per share amounts or as otherwise specified.
62
The Procter & Gamble Company
NOTE 10
|
As of June 30
|
2018
|
2017
|
|||||
|
DEBT DUE WITHIN ONE YEAR
|
|||||||
|
Current portion of long-term debt
|
$
|
|
|
$
|
|
|
|
|
Commercial paper
|
|
|
|
|
|||
|
Loan due August 2018
|
|
|
|
|
|||
|
Other
|
|
|
|
|
|||
|
TOTAL
|
$
|
|
|
$
|
|
|
|
|
Short-term weighted average interest rates
(1)
|
|
%
|
|
%
|
|||
|
(1)
|
|
|
As of June 30
|
2018
|
2017
|
|||
|
LONG-TERM DEBT
|
|||||
|
1.60% USD note due November 2018
|
|
|
|
|
|
|
1.75% USD note due October 2019
|
|
|
|
|
|
|
1.90% USD note due November 2019
|
|
|
|
|
|
|
0.28% JPY note due May 2020
|
|
|
|
|
|
|
1.90% USD note due October 2020
|
|
|
|
|
|
|
4.13% EUR note due December 2020
|
|
|
|
|
|
|
9.36% ESOP debentures due 2018-2021
(1)
|
|
|
|
|
|
|
1.85% USD note due February 2021
|
|
|
|
|
|
|
1.70% USD note due November 2021
|
|
|
|
|
|
|
2.00% EUR note due November 2021
|
|
|
|
|
|
|
2.30% USD note due February 2022
|
|
|
|
|
|
|
2.15% USD note due August 2022
|
|
|
|
|
|
|
2.00% EUR note due August 2022
|
|
|
|
|
|
|
3.10% USD note due August 2023
|
|
|
|
|
|
|
1.13% EUR note due November 2023
|
|
|
|
|
|
|
0.50% EUR note due October 2024
|
|
|
|
|
|
|
2.70% USD note due February 2026
|
|
|
|
|
|
|
2.45% USD note due November 2026
|
|
|
|
|
|
|
4.88% EUR note due May 2027
|
|
|
|
|
|
|
2.85% USD note due August 2027
|
|
|
|
|
|
|
1.25% EUR note due October 2029
|
|
|
|
|
|
|
5.55% USD note due March 2037
|
|
|
|
|
|
|
3.50% USD note due October 2047
|
|
|
|
|
|
|
Capital lease obligations
|
|
|
|
|
|
|
All other long-term debt
|
|
|
|
|
|
|
Current portion of long-term debt
|
(
|
)
|
(
|
)
|
|
|
TOTAL
|
$
|
$
|
|||
|
Long-term weighted average interest rates
(2)
|
|
%
|
|
%
|
|
|
(1)
|
|
|
(2)
|
|
|
Years ending June 30
|
2019
|
2020
|
2021
|
2022
|
2023
|
|
Debt maturities
|
$
|
$
|
$
|
$
|
$
|
Amounts in millions of dollars except per share amounts or as otherwise specified.
The Procter & Gamble Company
63
NOTE 11
|
Changes in Accumulated Other Comprehensive Income/(Loss) by Component
|
|||||||||||||||||||
|
Hedges
|
Investment Securities
|
Pension and Other Retiree Benefits
|
Financial Statement Translation
|
Total AOCI
|
|||||||||||||||
|
BALANCE at JUNE 30, 2016
|
$
|
(
|
)
|
$
|
|
|
$
|
(
|
)
|
$
|
(
|
)
|
$
|
(
|
)
|
||||
|
OCI before reclassifications
(1)
|
(
|
)
|
(
|
)
|
|
|
|
|
|
|
|||||||||
|
Amounts reclassified from AOCI
(2)
|
(
|
)
|
(
|
)
|
|
|
(
|
)
|
|
|
|||||||||
|
Net current period OCI
|
(
|
)
|
(
|
)
|
|
|
|
|
|
|
|||||||||
|
BALANCE at JUNE 30, 2017
|
(
|
)
|
(
|
)
|
(
|
)
|
(
|
)
|
(
|
)
|
|||||||||
|
OCI before reclassifications
(3)
|
(
|
)
|
(
|
)
|
|
|
(
|
)
|
(
|
)
|
|||||||||
|
Amounts reclassified from AOCI
(4)
|
|
|
(
|
)
|
|
|
|
|
|
|
|||||||||
|
Net current period OCI
|
(
|
)
|
(
|
)
|
|
|
(
|
)
|
(
|
)
|
|||||||||
|
Less: Other comprehensive income/(loss) attributable to non-controlling interests
|
|
|
|
|
(
|
)
|
|
|
(
|
)
|
|||||||||
|
BALANCE at JUNE 30, 2018
|
$
|
(
|
)
|
$
|
(
|
)
|
$
|
(
|
)
|
$
|
(
|
)
|
$
|
(
|
)
|
||||
|
(1)
|
|
|
(2)
|
|
|
(3)
|
|
|
(4)
|
|
The below provides additional details on amounts reclassified from AOCI into the Consolidated Statement of Earnings:
|
•
|
Hedges: see Note 9 for classification of gains and losses from hedges in the Consolidated Statements of Earnings.
|
|
•
|
Investment securities: amounts reclassified from AOCI into Other non-operating income, net.
|
|
•
|
Pension and other retiree benefits: amounts reclassified from AOCI into Cost of product sold, SG&A, and Net earnings from discontinued operations and included in the computation of net periodic pension cost (see Note 8 for additional details).
|
|
•
|
|
NOTE 12
Guarantees
In conjunction with certain transactions, primarily divestitures, we may provide routine indemnifications (e.g., indemnification for representations and warranties and retention of previously existing environmental, tax and employee liabilities) for which terms range in duration and, in some circumstances, are not explicitly defined. The maximum obligation under some indemnifications is also not explicitly stated and, as a result, the overall amount of these obligations cannot be reasonably estimated. Other than obligations recorded as liabilities at the time of divestiture, we have not made significant payments for these indemnifications. We believe that if we were to incur a loss on any of these matters, the loss would not have a material effect on our financial position, results of operations or cash flows.
In certain situations, we guarantee loans for suppliers and customers. The total amount of guarantees issued under such arrangements is not material.
Off-Balance Sheet Arrangements
We do not have off-balance sheet financing arrangements, including variable interest entities, that have a material impact on our financial statements.
Purchase Commitments and Operating Leases
We have purchase commitments for materials, supplies, services and property, plant and equipment as part of the normal course of business.
Commitments made under take-or-pay obligations are as follows:
|
Years ending June 30
|
2019
|
2020
|
2021
|
2022
|
2023
|
There-after
|
||||||||||||
|
Purchase obligations
|
$
|
|
|
$
|
|
|
$
|
|
|
$
|
|
|
$
|
|
|
$
|
|
|
Such amounts represent minimum commitments under take-or-pay agreements with suppliers and are in line with expected
Amounts in millions of dollars except per share amounts or as otherwise specified.
64
The Procter & Gamble Company
usage. These amounts include purchase commitments related to service contracts for information technology, human resources management and facilities management activities that have been outsourced to third-party suppliers. Such amounts also include arrangements with suppliers that qualify as embedded operating leases. Due to the proprietary nature of many of our materials and processes, certain supply contracts contain penalty provisions for early termination. We do not expect to incur penalty payments under these provisions that would materially affect our financial position, results of operations or cash flows.
We also lease certain property and equipment for varying periods.
Future minimum rental commitments under non-cancelable operating leases, net of guaranteed sublease income, are as follows:
|
Years ending June 30
|
2019
|
2020
|
2021
|
2022
|
2023
|
There-after
|
||||||||||||
|
Operating leases
|
$
|
|
|
$
|
|
|
$
|
|
|
$
|
|
|
$
|
|
|
$
|
|
|
Litigation
We are subject, from time to time, to certain legal proceedings and claims arising out of our business, which cover a wide range of matters, including antitrust and trade regulation, product liability, advertising, contracts, environmental, patent and trademark matters, labor and employment matters and tax.
While considerable uncertainty exists, in the opinion of management and our counsel, the ultimate resolution of the various lawsuits and claims will not materially affect our financial position, results of operations or cash flows.
NOTE 13
On October 1, 2016, the Company completed the divestiture of
four
product categories to Coty, Inc. (“Coty”). The divestiture included
41
of the Company's beauty brands (“Beauty Brands”), including the global salon professional hair care and color, retail hair color, cosmetics and a majority of the fine fragrance businesses, along with select hair styling brands. The form of the divestiture transaction was a Reverse Morris Trust split-off, in which P&G shareholders were given the election to exchange their P&G shares for shares of a new corporation that held the Beauty Brands (Galleria Co.), and then immediately exchange those shares for Coty shares. The value P&G received in the transaction was
$
11.4
billion
. The value was comprised of
105
million
shares of common stock of the Company, which were tendered by shareholders of the Company and exchanged for the Galleria Co. shares, valued at approximately
$
9.4
billion
, and the assumption of
$
1.9
billion
of debt by Galleria Co. The shares tendered in the
transaction were reflected as an addition to treasury stock and the cash received related to the debt assumed by Coty was reflected as an investing activity in the Consolidated Statement of Cash Flows. The Company recorded an after-tax gain on the final transaction of
$
5.3
billion
, net of transaction and related costs.
In February 2016, the Company completed the divestiture of its Batteries business to Berkshire Hathaway (BH) via a split transaction, in which the Company exchanged the Duracell Company, which the Company had infused with additional cash, to repurchase all
52.5
million
shares of P&G stock owned by BH. During the fiscal year ended
June 30, 2016
, the Company recorded non-cash, before-tax goodwill and indefinite-lived asset impairment charges of
$
402
(
$
350
after tax), to reduce the Batteries carrying value to the total estimated proceeds based on the value of BH’s shares in P&G stock at the time of the impairment charges (see Note 4). The Company recorded an after-tax gain on the final transaction of
$
422
to reflect a subsequent increase in the final value of the BH’s shares in P&G stock. The total value of the transaction was
$
4.2
billion
representing the value of the Duracell business and the cash infusion. The cash infusion of
$
1.7
billion
was reflected as a purchase of treasury stock.
Amounts in millions of dollars except per share amounts or as otherwise specified.
The Procter & Gamble Company
65
|
Years ended June 30
|
2017
|
2016
|
|||||
|
Beauty Brands
|
$
|
|
|
$
|
|
|
|
|
Batteries
|
|
|
|
|
|||
|
Net earnings from discontinued operations
|
$
|
|
|
$
|
|
|
|
|
Beauty Brands
|
|||||||
|
Years ended June 30
|
2017
|
2016
|
|||||
|
Net sales
|
$
|
|
|
$
|
|
|
|
|
Cost of products sold
|
|
|
|
|
|||
|
Selling, general and administrative expense
|
|
|
|
|
|||
|
Intangible asset impairment charges
|
|
|
|
|
|||
|
Interest expense
|
|
|
|
|
|||
|
Interest income
|
|
|
|
|
|||
|
Other non-operating income/(expense), net
|
|
|
|
|
|||
|
Earnings/(loss) from discontinued operations before income taxes
|
$
|
(
|
)
|
$
|
|
|
|
|
Income taxes on discontinued operations
|
|
|
|
|
|||
|
Gain on sale of business before income taxes
|
$
|
|
|
$
|
|
|
|
|
Income tax expense/(benefit) on sale of business
|
(
|
)
|
(1)
|
|
|
||
|
Net earnings from discontinued operations
|
$
|
|
|
$
|
|
|
|
|
(1)
|
|
|
Beauty Brands
|
|||||||
|
Years ended June 30
|
2017
|
2016
|
|||||
|
NON-CASH OPERATING ITEMS
|
|||||||
|
Depreciation and amortization
|
$
|
|
|
$
|
|
|
|
|
Deferred income tax benefit
|
(
|
)
|
|
|
|||
|
Gain on sale of businesses
|
|
|
|
|
|||
|
Goodwill and intangible asset impairment charges
|
|
|
|
|
|||
|
Net increase in accrued taxes
|
|
|
|
|
|||
|
CASH FLOWS FROM OPERATING ACTIVITIES
|
|||||||
|
Cash taxes paid
|
$
|
|
|
$
|
|
|
|
|
CASH FLOWS FROM INVESTING ACTIVITIES
|
|||||||
|
Capital expenditures
|
$
|
|
|
$
|
|
|
|
Amounts in millions of dollars except per share amounts or as otherwise specified.
66
The Procter & Gamble Company
|
Net Sales
|
Earnings Before Impairment Charges and Income Taxes
|
Impairment Charges
|
Income Tax (Expense)/ Benefit
|
Loss on Sale Before Income Taxes
|
Income Tax (Expense)/ Benefit on Sale
|
Net Earnings from Discontinued Operations
|
|||||||||||||||
|
Batteries
|
2016
|
|
|
|
|
(
|
)
|
(
|
)
|
(
|
)
|
|
|
(1)
|
|
|
|||||
|
(1)
|
|
NOTE 14
|
Quarters Ended
|
Sep 30
|
Dec 31
|
Mar 31
|
Jun 30
|
Total Year
|
||||||||||||||||
|
NET SALES
|
2017-2018
|
$
|
|
|
$
|
|
|
$
|
|
|
$
|
|
|
$
|
|
|
|||||
|
2016-2017
|
|
|
|
|
|
|
|
|
|
|
|||||||||||
|
OPERATING INCOME
|
2017-2018
|
|
|
|
|
|
|
|
|
|
|
||||||||||
|
2016-2017
|
|
|
|
|
|
|
|
|
|
|
|||||||||||
|
GROSS MARGIN
|
2017-2018
|
|
%
|
|
%
|
|
%
|
|
%
|
|
%
|
||||||||||
|
2016-2017
|
|
%
|
|
%
|
|
%
|
|
%
|
|
%
|
|||||||||||
|
NET EARNINGS:
|
|||||||||||||||||||||
|
Net earnings from continuing operations
|
2017-2018
|
$
|
|
|
$
|
|
|
$
|
|
|
$
|
|
|
$
|
|
|
|||||
|
2016-2017
|
|
|
|
|
|
|
|
|
|
|
|||||||||||
|
Net earnings/(loss) from discontinued operations
|
2017-2018
|
|
|
|
|
|
|
|
|
|
|
||||||||||
|
2016-2017
|
(
|
)
|
|
|
|
|
|
|
|
|
|||||||||||
|
Net earnings attributable to Procter & Gamble
|
2017-2018
|
|
|
|
|
|
|
|
|
|
|
||||||||||
|
2016-2017
|
|
|
|
|
|
|
|
|
|
|
|||||||||||
|
DILUTED NET EARNINGS PER COMMON SHARE:
(1)
|
|||||||||||||||||||||
|
Earnings from continuing operations
|
2017-2018
|
$
|
|
|
$
|
|
|
$
|
|
|
$
|
|
|
$
|
|
|
|||||
|
2016-2017
|
|
|
|
|
|
|
|
|
|
|
|||||||||||
|
Earnings/(loss) from discontinued operations
|
2017-2018
|
|
|
|
|
|
|
|
|
|
|
||||||||||
|
2016-2017
|
(
|
)
|
|
|
|
|
|
|
|
|
|||||||||||
|
Net earnings
|
2017-2018
|
|
|
|
|
|
|
|
|
|
|
||||||||||
|
2016-2017
|
|
|
|
|
|
|
|
|
|
|
|||||||||||
|
(1)
|
|
Item 9.
Changes in and Disagreements with Accountants on Accounting and Financial Disclosure.
Not applicable.
Item 9A.
Controls and Procedures.
Evaluation of Disclosure Controls and Procedures.
The Company's President and Chief Executive Officer, David S. Taylor, and the Company's Chief Financial Officer, Jon R. Moeller, performed an evaluation of the Company's disclosure controls and procedures (as defined in Rules 13a-15(e) and 15d-15(e) of the Securities Exchange Act of 1934 (Exchange Act)) as of the end of the period covered by this Annual Report on Form 10-K.
Messrs. Taylor and Moeller have concluded that the Company's disclosure controls and procedures were effective to ensure that information required to be disclosed in reports we file or
submit under the Exchange Act is (1) recorded, processed, summarized and reported within the time periods specified in Securities and Exchange Commission rules and forms, and (2) accumulated and communicated to our management, including Messrs. Taylor and Moeller, to allow their timely decisions regarding required disclosure.
Changes in Internal Control over Financial Reporting.
There were no changes in our internal control over financial reporting that occurred during the Company's fourth fiscal quarter that have materially affected, or are reasonably likely to materially affect, the Company's internal control over financial reporting.
Item 9B.
Other Information.
Not applicable.
Amounts in millions of dollars except per share amounts or as otherwise specified.
The Procter & Gamble Company
67
Item 10.
Directors, Executive Officers and Corporate Governance.
The Board of Directors has determined that the following members of the Audit Committee are independent and are Audit Committee financial experts as defined by SEC rules: Ms. Patricia A. Woertz (Chair) and Mr. Kenneth I. Chenault.
The information required by this item is incorporated by reference to the following sections of the
2018
Proxy Statement filed pursuant to Regulation 14A: the section entitled Election of Directors; the subsection of the Corporate Governance section entitled Board Meetings and Committees of the Board; the subsection of the Corporate Governance section entitled Code of Ethics; the subsections of the Other Matters section entitled Director Nominations for Inclusion in the 2019 Proxy Statement and entitled Shareholder Recommendations of Board Nominees and Committee Process for Recommending Board Nominees; and the section entitled Section 16(a) Beneficial Ownership Reporting Compliance. Pursuant to Instruction 3 of Item 401(b) of Regulation S-K, Executive Officers of the Registrant are reported in Part I of this report.
Item 11.
Executive Compensation.
The information required by this item is incorporated by reference to the following sections of the
2018
Proxy Statement filed pursuant to Regulation 14A: the subsections of the Corporate Governance section entitled Board Meetings and Committees of the Board and entitled Compensation Committee Interlocks and Insider Participation; and the portion beginning with the section entitled Director Compensation up to but not including the section entitled Security Ownership of Management and Certain Beneficial Owners.
Item 12.
Security Ownership of Certain Beneficial Owners and Management and Related Stockholder Matters.
The following table gives information about the Company's common stock that may be issued upon the exercise of options, warrants and rights under all of the Company's equity compensation plans as of
June 30, 2018
. The table includes the following plans: The Procter & Gamble 1992 Stock Plan; The Procter & Gamble 2001 Stock and Incentive Compensation Plan; The Procter & Gamble 2003 Non-Employee Directors' Stock Plan; The Gillette Company 2004 Long-Term Incentive Plan; The Procter & Gamble 2009 Stock and Incentive Compensation Plan; and The Procter & Gamble 2014 Stock and Incentive Compensation Plan.
|
Plan Category
|
(a)
Number of securities to be issued upon exercise of outstanding options,
warrants and rights
|
(b)
Weighted-average exercise
price of outstanding
options, warrants and
rights
|
(c)
Number of securities
remaining available for
future issuance under
equity compensation plans
(excluding securities
reflected in column (a))
|
|||||
|
Equity compensation plans approved by security holders
(1)
|
||||||||
|
Options
|
204,890,213
|
|
|
$74.3190
|
|
(2)
|
||
|
Restricted Stock Units (RSUs)/Performance Stock Units (PSUs)
|
11,449,954
|
|
N/A
|
|
(2)
|
|||
|
Equity compensation plans not approved by security holders
(3)
|
||||||||
|
Options
|
876,818
|
|
48.1700
|
|
(3)
|
|||
|
GRAND TOTAL
|
217,216,985
|
|
|
$74.2076
|
|
(4)
|
||
|
(1)
|
Includes The Procter & Gamble 1992 Plan; The Procter & Gamble 2001 Stock and Incentive Compensation Plan; The Procter & Gamble 2003 Non-Employee Directors' Stock Plan; The Procter & Gamble 2009 Stock and Incentive Compensation Plan; and The Procter & Gamble 2014 Stock and Incentive Compensation Plan.
|
|
(2)
|
Of the plans listed in (1), only The Procter & Gamble 2014 Stock and Incentive Compensation Plan allow for future grants of securities. The maximum number of shares that may be granted under this plan is 185 million shares. Stock options and stock appreciation rights are counted on a one for one basis while full value awards (such as RSUs and PSUs) will be counted as 5 shares for each share awarded. Total shares available for future issuance under this plan is 65 million.
|
|
(3)
|
Includes The Gillette Company 2004 Long-Term Incentive Plan. This plan does not allow for future grants of securities.
|
|
(4)
|
Weighted average exercise price of outstanding options only.
|
68
The Procter & Gamble Company
The Gillette Company 2004 Long-Term Incentive Plan
Shareholders of The Gillette Company approved The Gillette Company 2004 Long-Term Incentive Plan on May 20, 2004, and the plan was assumed by the Company upon the merger between The Procter & Gamble Company and The Gillette Company. All options became immediately vested and exercisable on October 1, 2005 as a result of the merger. After the merger, all outstanding options became options to purchase shares of The Procter & Gamble Company subject to an exchange ratio of .975 shares of P&G stock per share of Gillette stock. Only employees previously employed by The Gillette Company prior to October 1, 2005 are eligible to receive grants under this plan. The last grant of equity under this plan was on February 27, 2009.
The plan was designed to attract, retain and motivate employees of The Gillette Company and, until the effective date of the merger between The Gillette Company and The Procter & Gamble Company, non-employee members of the Gillette Board of Directors. Under the plan, eligible participants are: (i) granted or offered the right to purchase stock options, (ii) granted stock appreciation rights and/or (iii) granted shares of the Company's common stock or restricted stock units (and dividend equivalents). Subject to adjustment for changes in the Company's capitalization and the addition of any shares authorized but not issued or redeemed under The Gillette Company 1971 Stock Option Plan, the number of shares to be granted under the plan is not to exceed 19 million shares.
Except in the case of death of the recipient, all stock options and stock appreciation rights must expire no later than ten years from the date of grant. The exercise price for all stock options granted under the plan must be equal to or greater than the fair market value of the Company's stock on the date of grant. Any common stock awarded under the plan may be subject to restrictions on sale or transfer while the recipient is employed, as the committee administering the plan may determine.
If a recipient of a grant leaves the Company while holding an unexercised option or right: (1) any unexercisable portions immediately become void, except in the case of death, retirement, special separation (as those terms are defined in the
plan) or any grants as to which the Compensation Committee of the Board of Directors has waived the termination provisions; and (2) any exercisable portions immediately become void, except in the case of death, retirement, special separation, voluntary resignation that is not for Good Reason (as those terms are defined in the plan) or any grants as to which the Compensation Committee of the Board of Directors has waived the termination provisions.
Additional information required by this item is incorporated by reference to the
2018
Proxy Statement filed pursuant to Regulation 14A, beginning with the subsection of the Beneficial Ownership section entitled Security Ownership of Management and Certain Beneficial Owners and up to but not including the subsection entitled Section 16(a) Beneficial Ownership Reporting Compliance.
Item 13.
Certain Relationships and Related Transactions and Director Independence.
The information required by this item is incorporated by reference to the following sections of the
2018
Proxy Statement filed pursuant to Regulation 14A: the subsections of the Corporate Governance section entitled Director Independence and Review and Approval of Transactions with Related Persons.
Item 14.
Principal Accountant Fees and Services.
The information required by this item is incorporated by reference to the following section of the
2018
Proxy Statement filed pursuant to Regulation 14A: Report of the Audit Committee, which ends with the subsection entitled Services Provided by Deloitte.
Item 15.
Exhibits and Financial Statement Schedules.
|
1.
|
Financial Statements:
|
The following Consolidated Financial Statements of The Procter & Gamble Company and subsidiaries, management's report and the reports of the independent registered public accounting firm are incorporated by reference in Part II, Item 8 of this Form 10-K.
|
•
|
Management's Report on Internal Control over Financial Reporting
|
|
•
|
Report of Independent Registered Public Accounting Firm on Internal Control over Financial Reporting
|
|
•
|
Report of Independent Registered Public Accounting Firm on Consolidated Financial Statements
|
|
•
|
Consolidated Statements of Earnings - for years ended
June 30, 2018
,
2017
and
2016
|
|
•
|
Consolidated Statements of Other Comprehensive Income - for years ended
June 30, 2018
,
2017
and
2016
|
|
•
|
Consolidated Balance Sheets - as of
June 30, 2018
and
2017
|
|
•
|
Consolidated Statements of Shareholders' Equity - for years ended
June 30, 2018
,
2017
and
2016
|
|
•
|
Consolidated Statements of Cash Flows - for years ended
June 30, 2018
,
2017
and
2016
|
|
•
|
Notes to Consolidated Financial Statements
|
|
2.
|
Financial Statement Schedules:
|
These schedules are omitted because of the absence of the conditions under which they are required or because the information is set forth in the Consolidated Financial Statements or Notes thereto.
The Procter & Gamble Company
69
EXHIBITS
|
Exhibit (3-1) -
|
|
Amended Articles of Incorporation (as amended by shareholders at the annual meeting on October 11, 2011 and consolidated by the Board of Directors on April 8, 2016) (Incorporated by reference to Exhibit (3-1) of the Company's Annual Report on Form 10-K for the year ended June 30, 2016).
|
|
|
(3-2) -
|
|
Regulations (as approved by the Board of Directors on April 8, 2016, pursuant to authority granted by shareholders at the annual meeting on October 13, 2009) (Incorporated by reference to Exhibit (3-2) of the Company's Annual Report on Form 10-K for the year ended June 30, 2016).
|
|
|
Exhibit (4-1) -
|
|
Indenture, dated as of September 3, 2009, between the Company and Deutsche Bank Trust Company Americas, as Trustee (Incorporated by reference to Exhibit (4-1) of the Company's Annual Report on Form 10-K for the year ended June 30, 2015).
|
|
|
Exhibit (10-1) -
|
|
The Procter & Gamble 2001 Stock and Incentive Compensation Plan (as amended), which was originally adopted by shareholders at the annual meeting on October 9, 2001 +; and related correspondence and terms and conditions (Incorporated by reference to Exhibit (10-1) of the Company's Form 10-Q for the quarter ended December 31, 2013). *
|
|
|
(10-2) -
|
|
The Procter & Gamble 1992 Stock Plan (as amended December 11, 2001), which was originally adopted by the shareholders at the annual meeting on October 12, 1992 +. *
|
|
|
(10-3) -
|
|
The Procter & Gamble Executive Group Life Insurance Policy +. *
|
|
|
(10-4) -
|
|
Summary of the Company’s Retirement Plan Restoration Program (Incorporated by reference to Exhibit (10-27) of the Company's Annual Report on Form 10-K for the year ended June 30, 2016); and related correspondence and terms and conditions (Incorporated by reference to Exhibit (10-8) of the Company's Form 10-Q for the quarter ended September 30, 2015). *
|
|
|
(10-5) -
|
|
The Procter & Gamble 1993 Non-Employee Directors' Stock Plan (as amended September 10, 2002), which was originally adopted by the shareholders at the annual meeting on October 11, 1994 +. *
|
|
|
(10-6) -
|
|
Summary of the Company’s Long-Term Incentive Program (Incorporated by reference to Exhibit (10-6) of the Company's Annual Report on Form 10-K for the year ended June 30, 2016); related correspondence and terms and conditions (Incorporated by reference to Exhibit (10-6) of the Company's Annual Report on Form 10-K for the year ended June 30, 2017). *
|
|
|
(10-7) -
|
|
The Procter & Gamble Future Shares Plan (as adjusted for the stock split effective May 21, 2004), which was originally adopted by the Board of Directors on October 14, 1997 (Incorporated by reference to Exhibit (10-7) of the Company's Annual Report on Form 10-K for the year ended June 30, 2015). *
|
|
|
(10-8) -
|
|
The Procter & Gamble 2003 Non-Employee Directors' Stock Plan (as amended), which was originally adopted by the shareholders at the annual meeting on October 14, 2003, and related correspondence and terms and conditions +. *
|
|
|
(10-9) -
|
|
The Procter & Gamble Company Executive Deferred Compensation Plan (Incorporated by reference to Exhibit (10-4) of the Company's Form 10-Q for the quarter ended December 31, 2013). *
|
|
|
(10-10) -
|
|
Summary of the Company's Short Term Achievement Reward Program +; related correspondence and terms and conditions (Incorporated by reference to Exhibit (10-2) of the Company's Form 10-Q for the quarter ended September 30, 2015). *
|
|
|
(10-11) -
|
|
Company's Forms of Separation Agreement & Release (Incorporated by reference to Exhibit (10-1) of the Company's Form 10-Q for the quarter ended March 31, 2018); Company's Form of Separation Letter and Release (Incorporated by reference to Exhibit (10-2)) of the Company's Form 10-Q for the quarter ended March 31, 2018). *
|
|
|
(10-12) -
|
|
Summary of personal benefits available to certain officers and non-employee directors (Incorporated by reference to Exhibit (10-1) of the Company's Form 10-Q for the quarter ended September 30, 2013). *
|
|
|
(10-13) -
|
|
The Gillette Company 2004 Long-Term Incentive Plan (as amended on August 14, 2007) +. *
|
|
|
(10-14) -
|
|
The Gillette Company Executive Life Insurance Program (Incorporated by reference to Exhibit (10-14) of the Company’s Annual Report on Form 10-K for the year ended June 30, 2017). *
|
|
|
(10-15) -
|
|
The Gillette Company Personal Financial Planning Reimbursement Program (Incorporated by reference to Exhibit (10-15) of the Company’s Annual Report on Form 10-K for the year ended June 30, 2017). *
|
|
|
(10-16) -
|
|
The Gillette Company Senior Executive Financial Planning Program (Incorporated by reference to Exhibit (10-16) of the Company’s Annual Report on Form 10-K for the year ended June 30, 2017). *
|
|
|
(10-17) -
|
|
The Gillette Company Estate Preservation (Incorporated by reference to Exhibit (10-17) of the Company’s Annual Report on Form 10-K for the year ended June 30, 2017). *
|
|
70
The Procter & Gamble Company
|
(10-18) -
|
|
The Gillette Company Deferred Compensation Plan (Incorporated by reference to Exhibit (10-18) of the Company’s Annual Report on Form 10-K for the year ended June 30, 2017). *
|
|
|
(10-19) -
|
|
Senior Executive Recoupment Policy +. *
|
|
|
(10-20) -
|
|
The Gillette Company Deferred Compensation Plan (for salary deferrals prior to January 1, 2005) as amended through August 21, 2006 (Incorporated by reference to Exhibit (10-20) of the Company's Annual Report on Form 10-K for the year ended June 30, 2017). *
|
|
|
(10-21) -
|
|
The Procter & Gamble 2009 Stock and Incentive Compensation Plan, which was originally adopted by shareholders at the annual meeting on October 13, 2009 (Incorporated by reference to Exhibit (10-21) of the Company's Annual Report on Form 10-K for the year ended June 30, 2017), and the Regulations of the Compensation and Leadership Development Committee for The Procter & Gamble 2009 Stock and Incentive Compensation Plan, The Procter & Gamble 2001 Stock and Incentive Compensation Plan, The Procter & Gamble 1992 Stock Plan, The Procter & Gamble 1992 Stock Plan (Belgium Version), The Gillette Company 2004 Long-Term Incentive Plan and the Gillette Company 1971 Stock Option Plan +. *
|
|
|
(10-22) -
|
|
The Procter & Gamble 2009 Stock and Incentive Compensation Plan - Additional terms and conditions and related correspondence (Incorporated by reference to Exhibit (10-2) of the Company Form 10-Q for the quarter ended December 31, 2013). *
|
|
|
(10-23) -
|
|
The Procter & Gamble Performance Stock Program Summary (Incorporated by reference to Exhibit (10-1) of the Company's Form 10-Q for the quarter ended September 30, 2017); related correspondence and terms and conditions (Incorporated by reference to Exhibit (10-2) of the Company's Form 10-Q for the quarter ended September 30, 2017). *
|
|
|
(10-24) -
|
|
The Procter & Gamble 2013 Non-Employee Directors' Stock Plan (Incorporated by reference to Exhibit (10-3) of the Company's Form 10-Q for the quarter ended December 31, 2013). *
|
|
|
(10-25) -
|
|
The Procter & Gamble 2014 Stock and Incentive Compensation Plan, which was originally adopted by shareholders at the annual meeting on October 14, 2014 (Incorporated by reference to Exhibit (10-25) of the Company's Annual Report on Form 10-K for the year ended June 30, 2016); and the Regulations of the Compensation and Leadership Development Committee for The Procter & Gamble 2014 Stock and Incentive Compensation Plan (Incorporated by reference to Exhibit (10-1) of the Company's Form 10-Q for the quarter ended December 31, 2017). *
|
|
|
(10-26) -
|
|
The Procter & Gamble 2014 Stock and Incentive Compensation Plan - Additional terms and conditions (Incorporated by reference to Exhibit (10-26) of the Company's Annual Report on Form 10-K for the year ended June 30, 2017), and The Procter & Gamble 2014 Stock and Incentive Compensation Plan - Related correspondence (Incorporated by reference to Exhibit (10-1) of the Company's Form 10-Q for the quarter ended December 31, 2016). *
|
|
|
Exhibit (12) -
|
|
Computation of Ratio of Earnings to Fixed Charges. +
|
|
|
Exhibit (21) -
|
|
Subsidiaries of the Registrant. +
|
|
|
Exhibit (23) -
|
|
Consent of Independent Registered Public Accounting Firm. +
|
|
|
Exhibit (31) -
|
|
Rule 13a-14(a)/15d-14(a) Certifications. +
|
|
|
Exhibit (32) -
|
|
Section 1350 Certifications. +
|
|
|
Exhibit (99-1) -
|
|
Summary of Directors and Officers Insurance Program. +
|
|
|
101.INS (1)
|
|
XBRL Instance Document
|
|
|
101.SCH (1)
|
|
|
XBRL Taxonomy Extension Schema Document
|
|
101.CAL (1)
|
|
|
XBRL Taxonomy Extension Calculation Linkbase Document
|
|
101.DEF (1)
|
|
|
XBRL Taxonomy Definition Linkbase Document
|
|
101.LAB (1)
|
|
|
XBRL Taxonomy Extension Label Linkbase Document
|
|
101.PRE (1)
|
|
|
XBRL Taxonomy Extension Presentation Linkbase Document
|
|
(1
|
)
|
Pursuant to Rule 406T of Regulation S-T, these interactive data files are deemed not filed or part of a registration statement or prospectus for purposes of Sections 11 or 12 of the Securities Act of 1933 or Section 18 of the Securities Exchange Act of 1934 and otherwise are not subject to liability.
|
|
|
*
|
|
Compensatory plan or arrangement.
|
|
|
+
|
|
Filed herewith.
|
|
Item 16.
Form 10-K Summary.
Not applicable.
The Procter & Gamble Company
71
SIGNATURES
Pursuant to the requirements of Section 13 or 15(d) of the Securities Exchange Act of 1934, the registrant has duly caused this report to be signed on its behalf by the undersigned, thereunto duly authorized in the city of Cincinnati, State of Ohio.
|
THE PROCTER & GAMBLE COMPANY
|
||
|
By
|
/s/ DAVID S. TAYLOR
|
|
|
(David S. Taylor)
Chairman of the Board, President and Chief Executive Officer
|
||
|
August 7, 2018
|
||
Pursuant to the requirements of the Securities Exchange Act of 1934, this report has been signed below by the following persons in the capacities and on the dates indicated.
|
Signature
|
Title
|
Date
|
||
|
/s/ DAVID S. TAYLOR
(David S. Taylor)
|
Chairman of the Board, President and Chief Executive Officer (Principal Executive Officer)
|
August 7, 2018
|
||
|
/s/ JON R. MOELLER
(Jon R. Moeller)
|
Vice Chairman and Chief Financial Officer
(Principal Financial Officer)
|
August 7, 2018
|
||
|
/s/ VALARIE L. SHEPPARD
(Valarie L. Sheppard)
|
Senior Vice President, Comptroller & Treasurer (Principal Accounting Officer)
|
August 7, 2018
|
||
|
/s/ FRANCIS S. BLAKE
(Francis S. Blake)
|
Director
|
August 7, 2018
|
||
|
/s/ ANGELA F. BRALY
(Angela F. Braly)
|
Director
|
August 7, 2018
|
||
|
/s/ AMY L. CHANG
(Amy L. Chang)
|
Director
|
August 7, 2018
|
||
|
/s/ KENNETH I. CHENAULT
(Kenneth I. Chenault)
|
Director
|
August 7, 2018
|
||
|
/s/ SCOTT D. COOK
(Scott D. Cook)
|
Director
|
August 7, 2018
|
||
|
/s/ JOSEPH JIMENEZ
(Joseph Jimenez)
|
Director
|
August 7, 2018
|
||
|
/s/ TERRY J. LUNDGREN
(Terry J. Lundgren)
|
Director
|
August 7, 2018
|
||
|
/s/ W. JAMES MCNERNEY, JR.
(W. James McNerney, Jr.)
|
Director
|
August 7, 2018
|
||
|
/s/ NELSON PELTZ
(Nelson Peltz)
|
Director
|
August 7, 2018
|
||
|
/s/ MARGARET C. WHITMAN
(Margaret C. Whitman)
|
Director
|
August 7, 2018
|
||
|
/s/ PATRICIA A. WOERTZ
(Patricia A. Woertz)
|
Director
|
August 7, 2018
|
||
|
/s/ ERNESTO ZEDILLO
(Ernesto Zedillo)
|
Director
|
August 7, 2018
|
||
72
The Procter & Gamble Company
EXHIBIT INDEX
The Procter & Gamble Company
73
|
(10-18)
-
|
|
||
|
(10-19)
-
|
|
||
|
(10-20)
-
|
|
||
|
(10-21)
-
|
|
||
|
(10-22)
-
|
|
||
|
(10-23)
-
|
|
||
|
(10-24)
-
|
|
||
|
(10-25)
-
|
|
||
|
(10-26)
-
|
|
||
|
|
|||
|
|
|||
|
|
|||
|
|
|||
|
|
|||
|
|
|||
|
101.INS (1)
|
|
XBRL Instance Document
|
|
|
101.SCH (1)
|
|
|
XBRL Taxonomy Extension Schema Document
|
|
101.CAL (1)
|
|
|
XBRL Taxonomy Extension Calculation Linkbase Document
|
|
101.DEF (1)
|
|
|
XBRL Taxonomy Definition Linkbase Document
|
|
101.LAB (1)
|
|
|
XBRL Taxonomy Extension Label Linkbase Document
|
|
101.PRE (1)
|
|
|
XBRL Taxonomy Extension Presentation Linkbase Document
|
|
(1
|
)
|
Pursuant to Rule 406T of Regulation S-T, these interactive data files are deemed not filed or part of a registration statement or prospectus for purposes of Sections 11 or 12 of the Securities Act of 1933 or Section 18 of the Securities Exchange Act of 1934 and otherwise are not subject to liability.
|
|
|
+
|
|
Filed herewith.
|
|
TABLE OF CONTENTS
Part IItem 1. BusinessItem 1A. Risk FactorsItem 1B. Unresolved Staff CommentsItem 2. PropertiesItem 3. Legal ProceedingsItem 4. Mine Safety DisclosurePart IIItem 5. Market For Registrant's Common Equity, Related Stockholder Matters and Issuer Purchases Of Equity SecuritiesItem 6. Selected Financial DataItem 7. Management's Discussion and Analysis Of Financial Condition and Results Of OperationsItem 7A. Quantitative and Qualitative Disclosures About Market RiskItem 8. Financial Statements and Supplementary DataItem 9. Changes in and Disagreements with Accountants on Accounting and Financial DisclosureItem 9A. Controls and ProceduresItem 9B. Other InformationPart IIIItem 10. Directors, Executive Officers and Corporate GovernanceItem 11. Executive CompensationItem 12. Security Ownership Of Certain Beneficial Owners and Management and Related Stockholder MattersItem 13. Certain Relationships and Related Transactions and Director IndependenceItem 14. Principal Accountant Fees and ServicesPart IVItem 15. Exhibits and Financial Statement SchedulesItem 16. Form 10-k Summary